AUTOLIV TECHNICAL CENTERS AND CRASH TEST TRACKS Country / Company
| | Location
| | | Product(s) Supported
| | | | | | | Country/Company | | Location | | Product(s) supported | China | | | | | | Autoliv (Shanghai) Vehicle Safety System Technical Center Co., Ltd. | | Shanghai | | | Airbags and seatbelts customer applications and platform development with full-scale test laboratory
| France
| | | | | | Autoliv France SNC
| | Gournay-en-Bray
| | | Airbags and seatbelts customer applications and platform development with full-scale test laboratory
| Livbag SAS
| | Pont-de-Buis
| | | Inflator and pyrotechnic development
| | | | | | | Germany
| | | | | | Autoliv B.V. & Co. KG
| | Dachau
| | | Customer applications and platform development, airbags with full-scale test laboratory
| | | Elmshorn
| | | Seatbelts with full-scale test laboratory
| | | | | | | India
| | | | | | Autoliv India Private Ltd.
| | Bangalore
| | | Airbags and seatbelts with sled testing
| Japan
| | | | | | Autoliv Japan Ltd.
| | Tsukuba
| | | Airbags and seatbelts customer applications and platform development with sled test laboratory
| | | | | | | Poland
| | | | | | Autoliv Poland Sp.z.o.o.
| | Olawa
| | | Airbags and seatbelts customer applications and platform development with full-scale test laboratory | | | | | | France | | | | | Autoliv France SNC | | Gournay-en-Bray | | Airbags and seatbelts customer applications and platform development with full-scale test laboratory | Livbag SAS | | Pont-de-Buis | | Inflator and pyrotechnic development | | | | | | Germany | | | | | Autoliv B.V. & Co. KG | | Dachau | | Customer applications and platform development, airbags with full-scale test laboratory | | | Elmshorn | | Seatbelts with full-scale test laboratory | | | | | | India | | | | | Autoliv India Private Ltd. | | Bangalore | | Airbags and seatbelts with sled testing | | | | | | Japan | | | | | Autoliv Japan Ltd. | | Tsukuba | | Airbags and seatbelts customer applications and platform development with sled test laboratory | | | | | | Poland | | | | | Autoliv Poland Sp. zo.o. | | Olawa | | Airbags applications and platform development | | | | | | Romania | | | | | Autoliv Romania S.R.L. | | Brasov | | Seatbelts with sled test laboratory | | | | | | South Korea | | | | | Autoliv Corporation | | Seoul | | Airbags and seatbelts customer applications and platform development with sled test laboratory | | | | | | Sweden | | | | | Autoliv Development AB | | Vårgårda | | Research center | Autoliv Sverige AB | | Vårgårda | | Airbags customer applications and platform development with full-scale test laboratory and Inflator development | | | | | | USA | | | | | Autoliv ASP, Inc. | | Auburn Hills | | Airbags, steering wheels, and seatbelts customer applications and platform development with full-scale test laboratory | | | Ogden | | Airbags, inflators and pyrotechnics customer applications and platform development | | | | | | | Romania
| | | | | | Autoliv Romania S.R.L.
| | Brasov
| | | Seatbelts with sled test laboratory
| | | | | | | South Korea
| | | | | | Autoliv Corporation
| | Seoul
| | | Airbags and seatbelts customer applications and platform development with sled test laboratory
| Sweden
| | | | | | Autoliv Development AB
| | Vårgårda
| | | Research center
| Autoliv Sverige AB
| | Vårgårda
| | | Airbags customer applications and platform development with full-scale test laboratory
| USA
| | | | | | Autoliv ASP Inc.
| | Auburn Hills
| | | Airbags, steering wheels, and seatbelts customer applications and platform development with full-scale test laboratory
| | | Ogden
| | | Airbags, inflators and pyrotechnics customer applications and platform development
|
Item 3. Legal Proceedings
In the ordinary course of our business, we are subject to legal proceedings brought by or against us and our subsidiaries.
See Note 18 to the Consolidated Financial Statements in this Annual Report for a summary of certain ongoing legal proceedings. Such information is incorporated into this Part I, Item 3 – “Legal Proceedings” by reference.
Item 4. Mine Safety Disclosures
Not applicable.
Item 3. Legal Proceedings In the ordinary course of our business, we are subject to legal proceedings brought by or against us and our subsidiaries. See Note 18 to the Consolidated Financial Statements in this Annual Report for a summary of certain ongoing legal proceedings. Such information is incorporated into this Part I, Item 3 – “Legal Proceedings” by reference. Item 4. Mine Safety Disclosures Not applicable.
PARTII Item5.MarketforRegistrant’sCommonEquity,RelatedStockholderMattersandIssuerPurchasesofEquitySecurities Shareholder information The primary exchange market for Autoliv’s securities is the New York Stock Exchange (NYSE) where Autoliv’s common stock trades under the symbol “ALV”. Autoliv’s Swedish Depositary Receipts (SDRs) are traded on NASDAQ Stockholm’s list for large market cap companies under the symbol “ALIV SDB”. Options in SDRs trade on Nasdaq Stockholm under the name “Autoliv SDB”. Options in Autoliv shares are traded on NASDAQ OMX PHLX and on NYSE Amex Options under the symbol “ALV”. Share price information* 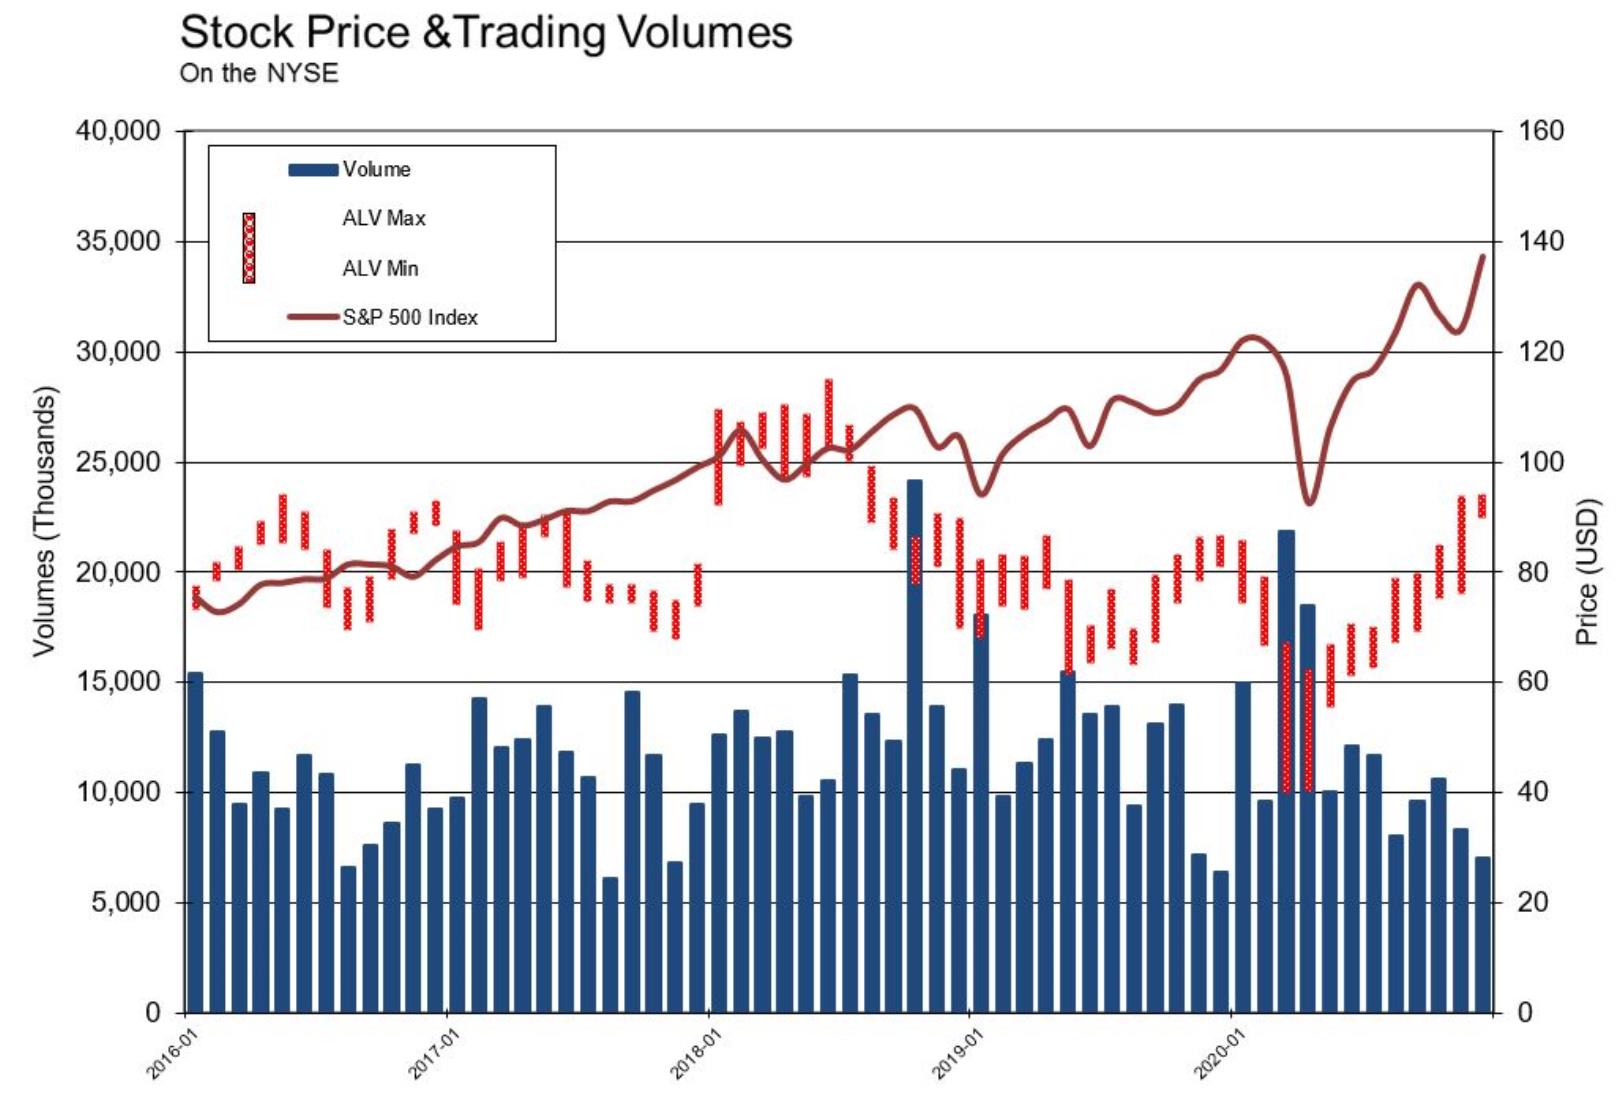

PARTII
Item 5. Market for Registrant’s Common Equity, Related Stockholder Matters and Issuer Purchases of Equity Securities
Shareholder Information
The primary exchange market for Autoliv’s securities is the New York Stock Exchange (NYSE) where Autoliv’s common stock trades under the symbol “ALV”. Autoliv’s Swedish Depositary Receipts (SDRs) are traded on NASDAQ Stockholm’s list for large market cap companies under the symbol “ALIV SDB”. Options in SDRs trade on Nasdaq Stockholm under the name “Autoliv SDB”. Options in Autoliv shares are traded on NASDAQ OMX PHLX and on NYSE Amex Options under the symbol “ALV”.
Share price performance*


* For all periods before the distribution date of Veoneer on June 29, 2018, the Autoliv share prices are adjusted by a factor of 72.04%. Number of shares During 2020, the weighted average number of shares outstanding (excluding dilution and treasury shares) increased to 87.3 million from 87.2 million in 2019. The weighted average number of shares outstanding for the full year 2020, assuming dilution, increased to 87.5 from 87.4 million in 2019. Stock options (if exercised) and granted Restricted Stock Units (RSUs) and Performance Shares (PSs) could increase the number of shares outstanding by 0.5 million shares in the aggregate. Combined, this would add 0.6% to the number of shares outstanding. On December 31, 2020, 3.0 million shares were available for repurchase pursuant to the stock repurchase program authorized by the Board of Directors in 2014. On December 31, 2020, the Company had 15.4 million treasury shares. Shareholders As of the end of 2020 around 20% of Autoliv’s securities were held by U.S.-based shareholders and close to 57% by Sweden-based shareholders. Most of the remaining Autoliv securities were held in the U.K., Switzerland, Norway, France and Denmark. Dividends If declared by the Board of Directors, quarterly dividends are usually paid on the first Thursday in the last month of each quarter. Declared dividends are announced in press releases and published on Autoliv’s corporate website. Autoliv has a history of paying quarterly cash dividends; however, on April 2, 2020, our Board of Directors suspended our quarterly dividend after determining that a suspension was necessary in light of the evolving global COVID-19 pandemic, decline in global LVP, the uncertainty surrounding the recession at that time and the inherent risk of customer defaults. The Board revisits dividends on a quarterly basis. There can be no assurance that our Board of Directors will declare dividends in the future. See Autoliv’s corporate website for additional details regarding historical dividends. Stock incentive plan Autoliv employees participate in the Autoliv, Inc. 1997 Stock Incentive Plan, as amended (the “Stock Incentive Plan”) and receive Autoliv stock-based awards from time to time. In connection with the spin-off, each outstanding Autoliv stock-based award as of June 29, 2018 was converted to stock awards that have underlying shares of both Autoliv and Veoneer common stock (see Note 17 to the Consolidated Financial Statements in this Annual Report). Additional information regarding the securities authorized for issuance under the Stock Incentive Plan is included in Item 12 of this Annual Report. Autoliv has adopted a Stock Ownership Policy for Executives requiring the Company’s Chief Executive Officer (CEO) to accumulate and hold the number of Autoliv shares having a value of twice his annual base salary. For other executives, the minimum requirement is, over time, a holding equal to each executive’s annual base salary. Stockrepurchaseprogram Autoliv initiated its repurchase program in 2000 with 10 million shares and has subsequently increased the total authorization four times between 2000 and 2014 to 47.5 million shares.Such purchases may be made from time to time on the open market or otherwise at the discretion of management. There is no expiration date for the share repurchase authorization to provide management flexibility in the Company’s repurchases. In total, Autoliv repurchased 44.5 million shares between May 2000 and December 31, 2017 for cash of $2,498 million, including commissions. No repurchases were made during 2019 or 2020. Autoliv has made no share repurchases since June 30, 2017. The maximum number of shares that may still be purchased under the stock repurchase program amounted to 2,986,288 shares at December 31, 2020. Of the total number of repurchased shares, 23.6 million shares were utilized for the equity units offering during 2009-2012. In addition, approximately 5.5 million shares have been utilized by the Stock Incentive Plan. At December 31, 2020, 15.4 million of the repurchased shares remain in treasury stock.
Item 6. Selected Financial Data Selected financial data for the last five fiscal years ended December 31 for the Continuing Operations, unless noted, is summarized in the table below. (DOLLARS IN MILLIONS, EXCEPT PER SHARE DATA) | | 2020 | | | 2019 | | | 2018 | | | 2017 | | | 2016 | | Sales and Income | | | | | | | | | | | | | | | | | | | | | Net sales | | $ | 7,447 | | | $ | 8,548 | | | $ | 8,678 | | | $ | 8,137 | | | $ | 7,922 | | Operating income4) | | | 382 | | | | 726 | | | | 686 | | | | 860 | | | | 831 | | Income before income taxes4) | | | 291 | | | | 648 | | | | 612 | | | | 792 | | | | 784 | | Net income attributable to controlling interest4) | | | 187 | | | | 462 | | | | 376 | | | | 586 | | | | 558 | | Financial Position | | | | | | | | | | | | | | | | | | | | | Current assets excluding cash | | | 3,091 | | | | 2,557 | | | | 2,670 | | | | 2,598 | | | | 2,269 | | Property, plant and equipment, net | | | 1,869 | | | | 1,816 | | | | 1,690 | | | | 1,609 | | | | 1,329 | | Intangible assets (primarily goodwill) | | | 1,412 | | | | 1,410 | | | | 1,423 | | | | 1,440 | | | | 1,430 | | Non-interest bearing liabilities | | | 3,182 | | | | 2,397 | | | | 2,595 | | | | 2,418 | | | | 2,154 | | Capital employed5) | | | 3,637 | | | | 3,772 | | | | 3,516 | | | | 4,538 | | | | 4,225 | | Net debt6, 8) | | | 1,214 | | | | 1,650 | | | | 1,619 | | | | 368 | | | | 299 | | Total equity5) | | | 2,423 | | | | 2,122 | | | | 1,897 | | | | 4,169 | | | | 3,926 | | Total assets | | | 8,157 | | | | 6,771 | | | | 6,722 | | | | 6,947 | | | | 6,565 | | Long-term debt6) | | | 2,110 | | | | 1,726 | | | | 1,609 | | | | 1,311 | | | | 1,313 | | Share data | | | | | | | | | | | | | | | | | | | | | Earnings per share (US$) – basic4) | | | 2.14 | | | | 5.29 | | | | 4.32 | | | | 6.70 | | | | 6.33 | | Earnings per share (US$) – assuming dilution4) | | | 2.14 | | | | 5.29 | | | | 4.31 | | | | 6.68 | | | | 6.32 | | Total parent shareholders’ equity per share (US$)5) | | | 27.56 | | | | 24.19 | | | | 21.63 | | | | 46.38 | | | | 41.69 | | Cash dividends paid per share (US$) | | | 0.62 | | | | 2.48 | | | | 2.46 | | | | 2.38 | | | | 2.30 | | Cash dividends declared per share (US$) | | | — | | | | 2.48 | | | | 2.48 | | | | 2.40 | | | | 2.32 | | Share repurchases | | | — | | | | — | | | | — | | | | 157 | | | | — | | Number of shares outstanding (million)2) | | | 87.4 | | | | 87.2 | | | | 87.1 | | | | 87.0 | | | | 88.2 | | Ratios | | | | | | | | | | | | | | | | | | | | | Gross margin (%) | | | 16.7 | | | | 18.5 | | | | 19.7 | | | | 20.6 | | | | 20.6 | | Operating margin (%)4) | | | 5.1 | | | | 8.5 | | | | 7.9 | | | | 10.6 | | | | 10.5 | | Pretax margin (%)4) | | | 3.9 | | | | 7.6 | | | | 7.1 | | | | 9.7 | | | | 9.9 | | Return on capital employed (%)7) | | | 10 | | | | 20 | | | | 17 | | | n/a | | | n/a | | Return on total equity (%)4, 7) | | | 9 | | | | 23 | | | | 13 | | | n/a | | | n/a | | Total equity ratio (%)5) | | | 30 | | | | 31 | | | | 28 | | | | 49 | | | | 48 | | Days receivables outstanding | | | 86 | | | | 70 | | | | 71 | | | | 76 | | | | 70 | | Days inventory outstanding | | | 42 | | | | 35 | | | | 35 | | | | 35 | | | | 32 | | Other data | | | | | | | | | | | | | | | | | | | | | Airbag sales3) | | | 4,824 | | | | 5,676 | | | | 5,699 | | | | 5,342 | | | | 5,256 | | Seatbelt sales | | | 2,623 | | | | 2,872 | | | | 2,980 | | | | 2,794 | | | | 2,665 | | Capital expenditures, net | | | 340 | | | | 476 | | | | 486 | | | | 464 | | | | 398 | | Net cash provided by operating activities1) | | | 849 | | | | 641 | | | | 591 | | | | 936 | | | | 868 | | Net cash used in investing activities1) | | | (340 | ) | | | (476 | ) | | | (628 | ) | | | (697 | ) | | | (726 | ) | Net cash (used in) provided by financing activities1) | | | 160 | | | | (338 | ) | | | (245 | ) | | | (566 | ) | | | (200 | ) | Number of employees, December 31 | | | 61,000 | | | | 58,900 | | | | 57,700 | | | | 56,700 | | | | 55,800 | |
1) | Including Discontinued Operations for comparable years 2016-2018. |
2) | At year end, excluding dilution and net of treasury shares. |
3) | Including steering wheels, inflators and initiators. |
4) | Including antitrust provision expense of $210 million in 2018. |
5) | Impacted by the distribution of Veoneer on June 29, 2018 the Autoliv share prices are adjustedof approximately $2 billion recorded as a reduction of equity. |
6) | The increase in debt in 2018 is primarily driven by a factorour capitalization of 72.04%.
NumberVeoneer of shares
During 2018, the number of shares outstanding increased by 0.1 million to 87.1 million (excluding dilution and treasury shares). The weighted average number of shares outstanding for the full year 2018, assuming dilution, was reduced to 87.3 from 87.7 million in 2017.
Stock options (if exercised) and granted Restricted Stock Units (RSUs) could increase the number of shares outstanding by 0.4 million shares in total. Combined, this would add 0.5%approximately $1 billion prior to the Autoliv shares outstanding. On December 31, 2018, 3.0 million shares were available for repurchase underdistribution to the current Board authorization from 2014. On December 31, 2018,shareholders.
|
7) | The Company has decided not to recalculate prior periods since the Companydistribution of Veoneer had 15.7 million treasury shares. Number of shareholders
Autoliv estimates that there were approximately 70,000 beneficial Autoliv owners as of December 31, 2018. Close to 21% of Autoliv’s securities were held by U.S.-based shareholdersa significant impact on total equity and around 60% by Sweden-based shareholders. Most ofcapital employed making the remaining Autoliv securities were held in the U.K., other Nordic countries, Central Europe, Japan and Canada.comparison less meaningful.
|
8) | Dividends
If declared by the Board of Directors, quarterly dividends are usually paid on the first Thursday in the last month of each quarter. Declared dividends are announced in press releases and published on Autoliv’s corporate website. Autoliv has a history of paying quarterly cash dividends and intends to pay similar dividends in the future but may not because of certain factors as set forth in Risk Factors – “You should not anticipate or expect the payment of cash dividends on our common stock”See section Non-U.S. GAAP Performance Measures in Item 1A of this Annual Report.7.
See Autoliv’s corporate website for additional details regarding historical dividends.
Stock incentive plan
Autoliv employees participate in the Autoliv, Inc. 1997 Stock Incentive Plan (the “Stock Incentive Plan”) and receive Autoliv stock-based awards from time to time. In connection with the spin-off, each outstanding Autoliv stock-based award as of June 29, 2018 was converted to stock awards that have underlying shares of both Autoliv and Veoneer common shares (see Note 17 to the Consolidated Financial Statements in this Annual Report). Additional information regarding the securities authorized for issuance under the Stock Incentive Plan is included in Item 12 of this Annual Report.
Autoliv has adopted a Stock Ownership Policy for Executives requiring the Company’s CEO to accumulate and hold the number of Autoliv shares having a value of twice his annual base salary. For other executives, the minimum requirement is, over time, a holding equal to each executive’s annual base salary.
Stock repurchase program
Autoliv initiated its repurchase program in 2000 with 10 million shares and has subsequently increased the total authorization four times between 2000 and 2014 to 47.5 million shares.
Such purchases may be made from time to time on the open market or otherwise at the discretion of management. There is no expiration date for the share repurchase authorization to provide management flexibility in the Company’s repurchases.
In total, Autoliv repurchased 44.5 million shares between May 2000 and December 31, 2017 for cash of $2,498 million, including commissions. No repurchases were made during 2018. Autoliv has made no share repurchases since June 30, 2017. The maximum number of shares that may yet be purchased under the stock repurchase program amounted to 2,986,288 shares at December 31, 2018.
Of the total number of repurchased shares, 23.6 million shares were utilized for the equity units offering during 2009-2012. In addition, approximately 5.3 million shares have been utilized by the Stock Incentive Plan. At December 31, 2018, 15.7 million of the repurchased shares remain in treasury stock.
Item 6. Selected Financial Data
Selected financial data for the last five fiscal years ended December 31 for the Continuing Operations, unless noted, is summarized in the table below.
(DOLLARS IN MILLIONS, EXCEPT PER SHARE DATA) | | 2018 | | | 2017 | | | 2016 | | | 2015 | | | 20141) | | | Sales and Income | | | | | | | | | | | | | | | | | | | | | | Net sales | | $ | 8,678 | | | $ | 8,137 | | | $ | 7,922 | | | $ | 7,636 | | | $ | 9,240 | | | Operating income4) | | | 686 | | | | 860 | | | | 831 | | | | 708 | | | | 723 | | | Income before income taxes4) | | | 612 | | | | 792 | | | | 784 | | | | 655 | | | | 667 | | | Net income attributable to controlling interest4) | | | 376 | | | | 586 | | | | 558 | | | | 443 | | | | 468 | | | Financial Position | | | | | | | | | | | | | | | | | | | | | | Current assets excluding cash | | | 2,670 | | | | 2,598 | | | | 2,269 | | | | 2,259 | | | | 2,607 | | | Property, plant and equipment, net | | | 1,690 | | | | 1,609 | | | | 1,329 | | | | 1,265 | | | | 1,390 | | | Intangible assets (primarily goodwill) | | | 1,423 | | | | 1,440 | | | | 1,430 | | | | 1,445 | | | | 1,661 | | | Non-interest bearing liabilities | | | 2,595 | | | | 2,418 | | | | 2,154 | | | | 2,049 | | | | 2,400 | | | Capital employed5) | | | 3,516 | | | | 4,538 | | | | 4,225 | | | | 3,670 | | | | 3,504 | | | Net debt6, 8) | | | 1,619 | | | | 368 | | | | 299 | | | | 202 | | | | 62 | | | Total equity5) | | | 1,897 | | | | 4,169 | | | | 3,926 | | | | 3,468 | | | | 3,442 | | | Total assets | | | 6,722 | | | | 6,947 | | | | 6,565 | | | | 6,518 | | | | 7,443 | | | Long-term debt6) | | | 1,609 | | | | 1,311 | | | | 1,313 | | | | 1,499 | | | | 1,521 | | | Share data | | | | | | | | | | | | | | | | | | | | | | Earnings per share (US$) – basic4) | | | 4.32 | | | | 6.70 | | | | 6.33 | | | | 5.03 | | | | 5.08 | | | Earnings per share (US$) – assuming dilution4) | | | 4.31 | | | | 6.68 | | | | 6.32 | | | | 5.02 | | | | 5.06 | | | Total parent shareholders’ equity per share (US$)5) | | | 21.63 | | | | 46.38 | | | | 41.69 | | | | 39.22 | | | | 38.64 | | | Cash dividends paid per share (US$) | | | 2.46 | | | | 2.38 | | | | 2.30 | | | | 2.22 | | | | 2.12 | | | Cash dividends declared per share (US$) | | | 2.48 | | | | 2.40 | | | | 2.32 | | | | 2.24 | | | | 2.14 | | | Share repurchases | | | — | | | | 157 | | | | — | | | | 104 | | | | 616 | | | Number of shares outstanding (million)2) | | | 87.1 | | | | 87.0 | | | | 88.2 | | | | 88.1 | | | | 88.7 | | | Ratios | | | | | | | | | | | | | | | | | | | | | | Gross margin (%) | | | 19.7 | | | | 20.6 | | | | 20.6 | | | | 20.5 | | | | 19.5 | | | Operating margin (%)4) | | | 7.9 | | | | 10.6 | | | | 10.5 | | | | 9.3 | | | | 7.8 | | | Pretax margin (%)4) | | | 7.1 | | | | 9.7 | | | | 9.9 | | | | 8.6 | | | | 7.2 | | | Return on capital employed (%)7) | | | 17 | | | n/a | | | n/a | | | n/a | | | | 21 | | | Return on total equity (%)4, 7) | | | 13 | | | n/a | | | n/a | | | n/a | | | | 12 | | | Total equity ratio (%)5) | | | 28 | | | | 49 | | | | 48 | | | | 46 | | | | 46 | | | Net debt to capitalization (%)5, 6) | | | 46 | | | | 8 | | | | 7 | | | | 6 | | | | 2 | | | Days receivables outstanding | | | 71 | | | | 76 | | | | 70 | | | | 71 | | | | 71 | | | Days inventory outstanding | | | 35 | | | | 35 | | | | 32 | | | | 31 | | | | 32 | | | Other data | | | | | | | | | | | | | | | | | | | | | | Airbag sales3) | | | 5,699 | | | | 5,342 | | | | 5,256 | | | | 5,036 | | | | 5,019 | | | Seatbelt sales | | | 2,980 | | | | 2,794 | | | | 2,665 | | | | 2,599 | | | | 2,800 | | | Capital expenditures, net | | | 486 | | | | 464 | | | | 398 | | | | 397 | | | | 453 | | | Net cash provided by operating activities1) | | | 591 | | | | 936 | | | | 868 | | | | 751 | | | | 713 | | | Net cash used in investing activities1) | | | (628 | ) | | | (697 | ) | | | (726 | ) | | | (591 | ) | | | (453 | ) | | Net cash (used in) provided by financing activities1) | | | (245 | ) | | | (566 | ) | | | (200 | ) | | | (319 | ) | | | 226 | | | Number of employees, December 31 | | | 57,700 | | | | 56,700 | | | | 55,800 | | | | 51,300 | | | | 50,800 | | |
|
1)
Item 7. Management’s Discussion and Analysis of Financial Condition and Results of Operations | Including Discontinued Operations. This period has not been restated to reflect just continuing operations because it was not practicable to do so.
|
2)
| At year end, excluding dilution and net of treasury shares.
|
3)
| Including steering wheels, inflators and initiators.
|
4)
| Including antitrust provision expense of $210 million.
|
5)
| Impacted by the distribution of Veoneer on June 29, 2018 of approximately $2 billion recorded as a reduction of equity.
|
6)
| The increase in debt is primarily driven by our capitalization of Veoneer of approximately $1 billion prior to the distribution to the shareholders.
|
7)
| The Company has decided not to recalculate prior periods since the distribution of Veoneer had a significant impact on total equity and capital employed making the comparison less meaningful.
|
8)
| See section Non-U.S. GAAP Performance Measures in item 7.
|
Item 7. Management’s Discussion and Analysis of Financial Condition and Results of Operations
Important Trends The discussions and analysis in this section isare focused on our continuing operations. For more information on our discontinuedthe Company’s results of operations see Note 3for the year ended December 31, 2020 compared to the Consolidatedyear ended December 31, 2019. Discussions of our results of operations for the year ended December 31, 2019 compared to the year ended December 31, 2018 can be found in Part II, Item 7. Management's Discussion and Analysis of Financial StatementsCondition and Results of Operations in this Annual Report.our Form 10-K for the year ended December 31, 2019, which was filed with the United States Securities and Exchange Commission on February 21, 2020. Autoliv, Inc. (the “Company”) provides automotive safety systems to the automotive industry with a broad range of product offerings, primarily passive safety systems. In the three-yeartwo-year period ended December 31, 2018,2020, a number of factors have influenced the Company’s results of operations. The most notable factors have been: Growth in light vehicle production and safety content per vehicle
| • | Substantial decline in global light vehicle production |
Continued strong order intake
| • | Growth of safety content per vehicle |
Continued focus on operational excellence and quality
| • | High order intake share maintained |
Changes in competitive environment
| • | Continued focus on operational excellence and quality |
| 20181) | | | 20171) | | | | 20161) | | 20201) | | | 20191) | | | YEARS ENDED DEC. 31 (DOLLARS IN MILLIONS, EXCEPT EPS) | Reported | | | change | | | Reported | | | change | | | | Reported | | | change | | Reported | | | change | | | Reported | | | change | | | Global light vehicle production (in thousands) | | 91,344 | | | | (1 | ) | % | | 92,128 | | | | 2 | | % | | | 90,056 | | | 5 | % | | 71,573 | | | | (17 | ) | % | | 85,862 | | | | (6 | ) | % | Consolidated net sales | $ | 8,678 | | | | 7 | | % | $ | 8,137 | | | | 3 | | % | | $ | 7,922 | | | 4 | % | $ | 7,447 | | | | (13 | ) | % | $ | 8,548 | | | | (1 | ) | % | Operating income3) | | 686 | | | | (20 | ) | % | | 860 | | | | 3 | | % | | | 831 | | | 17 | % | | 382 | | | | (47 | ) | % | | 726 | | | | 6 | | % | Operating margin, %3) | | 7.9 | | | | (2.7 | ) | pp | | 10.6 | | | | 0.1 | | pp | | | 10.5 | | | 1.2 | pp | | 5.1 | | | | (3.4 | ) | pp | | 8.5 | | | | 0.6 | | pp | Net income attributable to controlling interest from Continuing Operations3) | | 376 | | | | (36 | ) | % | | 586 | | | | 5 | | % | | | 558 | | | 26 | % | | Earnings per share Continuing Operations2, 3) | | 4.31 | | | | (35 | ) | % | | 6.68 | | | | 6 | | % | | | 6.32 | | | 26 | % | | Net cash provided by operating activities4) | | 591 | | | | (37 | ) | % | | 936 | | | | 8 | | % | | | 868 | | | 16 | % | | Return on capital employed, %5) | | 16.8 | | | n/a | | pp | n/a | | | n/a | | pp | | n/a | | | n/a | pp | | Net income attributable to controlling interest3) | | | 187 | | | | (60 | ) | % | | 462 | | | | 23 | | % | Earnings per share2) | | | 2.14 | | | | (60 | ) | % | | 5.29 | | | | 23 | | % | Net cash provided by operating activities3) | | | 849 | | | | 32 | | % | | 641 | | | | 8 | | % | Return on capital employed, % | | | 10.4 | | | | (9.3 | ) | pp | | 19.7 | | | | 2.9 | | pp |
1) | Reported figures impacted by costs for capacity alignments, and antitrust related matters in 2016-2018, and for 2019 by separation costs in 2018.costs. See section Items affecting comparability and Notes 3, 12 and 18 to the Consolidated Financial Statements included herein. |
2) | Assuming dilution and net of treasury shares. |
3) | Including EC antitrust provision expensepayment of $210 million. |
4)
| Including Discontinued Operations
|
5)
| The Company has decided not to recalculate prior periods since the distribution of Veoneer had a significant impact on capital employed making the comparison less meaningful.$203 million in 2019.
|
COVID-19 PANDEMIC The COVID-19 pandemic had a substantial impact on our operations in the first half year of 2020. In the first quarter the impact was focused on China, where most of our customers’ plants were closed for several weeks in February and operated at low levels in March. In Europe and North America, sales declined substantially in the second half of March as the pandemic led to customer plant closures. A large number of customer plants were closed in April and parts of May, followed by a ramp-up in June. The decline in global LVP and the slow and volatile restart and ramp-up had a significant impact on our sales and profitability in the first six months of 2020. In the second half of the year, we managed to achieve improvements in sales, profitability and cash flow as our cost reduction initiatives and positive sales development more than offset the 0.4% global LVP year over year decline in the second half of the year. According to IHS Markit, global light vehicle production declined by 17% in 2020 vs. 2019. There were a number of liquidity and management actions undertaken to manage this challenging period. During the first six months of 2020, Autoliv undertook a number of actions to support employee health and safety, corporate liquidity, cash flow, and profitability. Actions included introducing a Smart Start Playbook for safe re-start and ramp-up, investing in employee safety equipment, and re-designing production lines and work places as necessary. Other initiatives included drawing on our Revolving Credit Facility (which is now fully repaid), withdrawing full year guidance (now provided again), extensive use of furloughing, reducing headcount, sharply reducing capital expenditures, close monitoring of working capital, reducing or suspending discretionary spending, and accelerating cost savings initiatives, cancelling the dividend and suspending future dividends, although the Board of Directors will review such suspension on a quarterly basis. Direct COVID-19 related costs, such as personal protective equipment, temporary supplier support, and premium freight was around $10 million in the second quarter, around $5 million in the third quarter and around $5 million in the fourth quarter. Support from governments in connection with furloughing, short-term work weeks, and other similar activities was around $25 million in the second quarter, around $10 million in the third quarter, and around $2 million in the fourth quarter. In all regions, the automotive industry, including Autoliv, is in different stages of ramp-up of operations. Visibility and predictability of customer demand has improved but is still limited, particularly regarding the sustainability of current demand levels, including the effects on LVP of inventory build-ups, government vehicle subsidies, and the risks of another wave of COVID-19 infections in one or more of the regions where we operate or have customers or suppliers. Although we are not directly affected by current semiconductor supply issues highlighted in December 2020 and January and early February 2021 by several OEMs, it could potentially have a negative impact on LVP in the first half of 2021. We believe some of the production that might be lost in the first half of the year could be recovered in the second
half of the year. While we continue to focus on health and safety and cost optimization, we are adjusting our production in coordination with our customers and suppliers. GROWTH INIMPACTED BY LIGHT VEHICLE PRODUCTION, AND SAFETY CONTENT PER VEHICLE AND HIGH ORDER INTAKE The most important driver for Autoliv’s sales is the light vehicle production (LVP). During 2018the past ten years LVP has shown year-over-year growth with the exception of the past three years. During 2020 we experienced deterioration of market conditions as a consequence of the COVID-19 pandemic, resulting in declines of LVP in all regions. The most significant changesdecline in LVP, especiallycame in Americas and Europe impacted by the new emission testing WLTP and in China due to lower consumer demand for vehicles. As a result, full-year 2018declining more than 20% with Asia declining more than 10%. Full-year 2020 global LVP declined by 1%around 17%. This came after eight straight years of LVP growth. In 2017, the LVP grew by 2% anda 6% decline in 2016, the year-over-year growth in LVP was 5%.2019. Light Vehicle Production | | | | | | | | | | | | | | | | | | | | | | | | | | | | | | | | 2018 | | | 2017 | | | 2016 | | | Change '18 vs ´16 | | | | (000´) units | | | % global | | | (000´) units | | | % global | | | (000´) units | | | % global | | | (000´) units | | | % | | Americas | | | 19,124 | | | | 21 | % | | | 19,185 | | | | 21 | % | | | 19,421 | | | | 22 | % | | | (296 | ) | | | (2 | )% | | North America | | 15,751 | | | | 17 | % | | | 15,920 | | | | 17 | % | | | 16,678 | | | | 19 | % | | | (927 | ) | | | (6 | )% | | South America | | 3,373 | | | | 4 | % | | | 3,265 | | | | 4 | % | | | 2,743 | | | | 3 | % | | | 630 | | | | 23 | % | Europe | | | 21,887 | | | | 24 | % | | | 22,180 | | | | 24 | % | | | 21,458 | | | | 24 | % | | | 429 | | | | 2 | % | Asia | | | 47,811 | | | | 52 | % | | | 48,233 | | | | 52 | % | | | 46,890 | | | | 52 | % | | | 921 | | | | 2 | % | | China | | 25,696 | | | | 28 | % | | | 26,575 | | | | 29 | % | | | 25,952 | | | | 29 | % | | | (256 | ) | | | (1 | )% | | Japan | | 9,052 | | | | 10 | % | | | 9,021 | | | | 10 | % | | | 8,517 | | | | 9 | % | | | 535 | | | | 6 | % | | South Korea | | 3,951 | | | | 4 | % | | | 4,023 | | | | 4 | % | | | 4,143 | | | | 5 | % | | | (192 | ) | | | (5 | )% | | India | | 4,712 | | | | 5 | % | | | 4,420 | | | | 5 | % | | | 4,136 | | | | 5 | % | | | 577 | | | | 14 | % | | Other Asia | | 4,400 | | | | 5 | % | | | 4,194 | | | | 5 | % | | | 4,142 | | | | 5 | % | | | 258 | | | | 6 | % | Other | | | 2,522 | | | | 3 | % | | | 2,530 | | | | 3 | % | | | 2,287 | | | | 3 | % | | | 235 | | | | 10 | % | Global Total | | | 91,344 | | | | 100 | % | | | 92,128 | | | | 100 | % | | | 90,056 | | | | 100 | % | | | 1,288 | | | | 1 | % | | | | | | | | | | | | | | | | | | | | | | | | | | | | | | | | | |
Light Vehicle Production1) | | | | | | | | | | | | | | | | | | | | | | | | 2020 | | | 2019 | | | Change '20 vs ´19 | | | | (000´) units | | | % global | | | (000´) units | | | % global | | | (000´) units | | | % | | Americas | | | 14,184 | | | | 20 | % | | | 18,343 | | | | 21 | % | | | (4,159 | ) | | | (23 | )% | | North America | | 11,955 | | | | 17 | % | | | 15,085 | | | | 18 | % | | | (3,130 | ) | | | (21 | )% | | South America | | 2,229 | | | | 3 | % | | | 3,258 | | | | 4 | % | | | (1,029 | ) | | | (32 | )% | Europe | | | 16,461 | | | | 23 | % | | | 20,994 | | | | 24 | % | | | (4,533 | ) | | | (22 | )% | Asia | | | 39,257 | | | | 55 | % | | | 44,550 | | | | 52 | % | | | (5,293 | ) | | | (12 | )% | | China | | 22,130 | | | | 31 | % | | | 23,292 | | | | 27 | % | | | (1,162 | ) | | | (5 | )% | | Japan | | 7,593 | | | | 11 | % | | | 9,024 | | | | 11 | % | | | (1,431 | ) | | | (16 | )% | | South Korea | | 3,476 | | | | 5 | % | | | 3,879 | | | | 5 | % | | | (403 | ) | | | (10 | )% | | India | | 3,199 | | | | 4 | % | | | 4,168 | | | | 5 | % | | | (969 | ) | | | (23 | )% | | Other Asia | | 2,859 | | | | 4 | % | | | 4,187 | | | | 5 | % | | | (1,328 | ) | | | (32 | )% | Other | | | 1,671 | | | | 2 | % | | | 1,975 | | | | 2 | % | | | (304 | ) | | | (15 | )% | Global Total | | 71,573 | | | | | | | | 85,862 | | | | | | | | (14,289 | ) | | | (17 | )% | 1) Source: IHS Markit | |
The main markets contributing to the global LVP growth during 2016 to 2018 were South America and India. Affected by political factors and microeconomics in the second half of 2018, Chinese LVP, the world’s largest automotive market, declined by 1%1.2 million units or by 5% from 20162019 to 2018.2020. In Europe, which is an important market for automotive safety systems, LVP increaseddecreased by 2%22% or by approximately 0.44.5 million light vehicles during the same three-year period. In North America, LVP declined by 6%21% or 0.93.1 million light vehicles. Thanks to strong domestic demand and growing export to other countries, LVP in India increased by 14% during the three-year period to 4.7 million light vehicles in 2018.
Europe’s share of global LVP has remaineddeclined to 23% from 24% and Americas share declined to 20% from 21%, while China’s share increased from 27% to 31%. Japan’s share was unchanged at 24%, while North America has declined from 19% to 17% and China from 29% to 28% during the same three-year period.11%. Thanks
Due to more stringent crash ratings, by institutes such as EuroNCAP;Euro NCAP; and increasing consumer demand for more safety in emerging markets, we see vehicle manufacturers installing more airbags and more advanced seatbelt systems in their vehicles. This generally happenstakes place when new models are introduced. The safety standards of vehicles are increasing in China, India and other growth markets such as Brazil, partially due to new regulations and crash test rating programs. For example, the Indian government has decided on a new traffic regulation that mandates more rigid crash test standards offor light vehicles. This should eventually lead to a higher installation rate of airbags and more advanced seatbelts. Thanks to these positive worldwide trends, as well as currency translationseatbelts, impacting CPV positively, partly offset by negative effects the average global safety content (airbags, seatbelts and steering wheels) per light vehicle (CPV) has increased from around $220 to around $225 during the period 2017-2018. This increase comes despite the fact that growth in global LVP is mostly in markets with lower average safety CPV such as South America and India, where the CPV is only approximately $170 and $80, respectively. In addition, there is a negative effect from continued pricing pressure from vehicle manufacturers. The trend of increasing CPV was negatively impacted in 2020 by the unfavorable regional CPV mix development, as the decline in LVP was more pronounced in markets with high average safety content per vehicle (CPV) such as North America and Western Europe, where the CPV is approximately $350 and $270, respectively. In 2020, currency translation effects impacted global CPV positively. The average global safety CPV (airbags, pedestrian safety, seatbelts and steering wheels) amounted to $245 in 2020. These trends
The more stringent crash ratings and consumer demand for more safety should enable the global automotive safety market to grow faster than the global LVP during the next three years. The past five years’ high order intake share have resulted in our sales development outperforming the underlying light vehicle production significantly in the past three years. In 2020, our organic sales development outpaced global LVP by around 5 percentage points, due to increased safety content per vehicle and as an effect of recent years high order intake share. WELL BALANCED GLOBAL FOOTPRINT Autoliv’s regional sales mix continues to be balanced with 32%28% of sales in Europe, 31% in the Americas and 37%41% in Asia in 2018,2020, compared to 32%29%, 32%34% and 36%37%, respectively, in 2017.2019. In Asia, our sales in the important Chinese market represents 18%increased to 21% of total sales in 2018, despite2020, partly a reflection of the first drop in LVP in the country in decades. Regardless of the short-term weakness in the Chinese market we remain well positioned in this market, which isbeing less effected by the world’s largest automotive producing market.pandemic. The balanced regional sales mix has been achieved through timely investments and strengthening of technical and support capabilities in growth markets and early introduction and execution of our restructuring and capacity alignment activities. To further improve our competitiveness, we have also made substantial investments to increase manufacturing capacity for vertical integration in China and Thailand.markets. For Asia as a whole, the effect of the higher sales in China, Japan and India was partly offset by declining sales in South Korea.
A fast-growing customer from 2016 to 2018 has been Honda. Their share ofWe estimate that our sales has increased from close to 7% to 8% during the three-year period. The largest customer based in Asia is Hyundai/Kia, accounting for 8% of Autoliv sales. The local Chinese OEMs as a groupElectric Vehicles (EV) and Plug-in Hybrid Electric Vehicles (PHEV) accounted for around 4% of our sales in 2018, with Great Wall representing 2%.
Our sales to premium brand OEMs accounted for around 18% of total sales, while their share of global LVP is approximately 11%. Our strong position with premium OEMs reflects the higher safety content in their vehicles along with our position as a technology leader in the automotive safety market. Of the European OEMs, Daimler stands out, accounting for 6% of Autoliv’s total sales, representing more than two times their global LVP market share. This is a result of our strong position within advanced safety solutions in their vehicles.
The Detroit Three automobile manufacturers, Ford, Fiat Chrysler and GM, account for 8%, 8% and 4%10% of our total sales respectively. Because Autoliv was on a new business hold with GM during 2011-2012 and PSA’s acquisition of GM’s European brand Opel, GM’s share of Autoliv total sales declined from 8% in 2016 to 4% in 2018. This has affected most regions not only Europe and North America.2020.
CONTINUED STRONG ORDER INTAKE SHARE Building on a strong base, including supplying our delivering products to approximately 1,300around 1,200 vehicle models and around 100 car brands, Autoliv recorded its highesta high order intake evershare during the past six-year period, 2016-2018, winning around 50%45% or more of available orders. Our share of order intake in the past threeprior years is significantly above our sales market share in 2020 of around 40% in 2018. Part of the high order intake is the consequence of major recalls by another airbag manufacturer. The most substantial increase in order intake was in 2015, where it increased by 80% compared to 2014, to $11.9 billion. Since 2016, order intake has continued to increase and reached in 2018 $15.5 billion in estimated life-time sales, an increase of 26% compared to 2016. Due to the lead time from order to start of production, 2017 was the first year the increased level of order intake began to impact our sales. The sales growth has substantially accelerated during 2018, outgrowing LVP with close to 10% in the fourth quarter. During 2018, growth was positively affected through recent launches of several new models, including e.g. Dodge Ram 1500, Tesla Model 3 and Honda Accord.42%. The lead time from order intake to start of production is typically 18-36 months. During this period the products are engineered into the vehicle to provide the expected protection for occupants in case of a crash and to meet legal and regulatory requirements, as well as other requirements from the vehicle manufacturer. This investment in new products is the main reason for the increase inhigh level of RD&E expenses, net, between 2016 and 2018.net. Additionally, we have to build up production capacity, in the form of new lines, and buildings, to meet future product launches.
Our order intake share for 2020 continued on a high level. We estimate that we booked around 45% of available order value in 2020, making 2020 the sixth consecutive year of order intake share which is higher than our sales market share. The estimated life-time sales for all orders booked in 2020 is around $10 billion, compared to $11 billion in 2019. New order intake is defined as the sales value of awards for future business, received within that year. The life time value is calculated using detailed assumptions of price and volumes over the years of production and the exchange rates prevailing at the time of receiving the order. Due to the lead time from order to start of production, 2017 was the first year that the increased level of order intake began to impact our sales. Over the last two years, sales have substantially outperformed the change in global LVP. In 2020 and 2019 the outperformance was around 5 pp and 7 pp, respectively. During 2020, growth was positively affected through recent launches of several new models, including Honda Fit, Toyota Yaris, Buick Encore and Chevrolet Trailblazer, Peugeot 208 and 2008, Genesis G80 and Opel Corsa. OPERATIONALSTRATEGIC INITIATIVES
OverAs market weakness has continued in 2020, we stepped up the years we have seen an uneven capacity utilization in severalcost improvement actions and launched a second Structural Efficiency Program, including targeting a reduction of our plants, mainlyindirect workforce by approximately 850 more workers. The cost for Structural Efficiency Program 1 and 2 are estimated to be approximately $52 million and $65 million respectively. The first program was fully implemented in Europe. 2020 and the second program is expected to be fully implemented by early 2021. Annualized savings is estimated to be around $65 million each for the two programs.
In addition to the Structural Efficiency Programs, we made a provision of around $35 million in 2020 for footprint optimization in Europe, involving planned plant closures in Germany and Sweden. The costs for restructuring activities in 20182020 amounted to $9$99 million compared to $23$54 million in 2017 and to $21 million in 20162019. The current restructuring activitiesStructural Efficiency Programs are expected to have a payback period of around 3 years, or more,1 year, after cash-out. The cash payments in 2018 were $14 million compared to $23 million in 2017 and $71 million in 2016. As of December 31, 2018,2020, we have $33$126 million reserved in our balance sheet related to restructuring (see Note 12 to the Consolidated Financial Statements included herein). Capital expenditures, netWith more than 200 improvement projects being evaluated, we have set a high pace in the planning and implementation of $486 million in 2018, was $22 millionstrategic initiatives and $88 million higher than in 2017structural improvements. These initiatives are key drivers to our medium-term target and 2016, respectively. In relationbuilding the foundation to sales Capital expenditures, net was 5.6% in 2018 and 5.7% in 2017 and 5.0% in 2016. The level of Capital expenditures, net, supports our growth strategy and reflects the high order intake for the period 2016continue to 2018.
create shareholder value. IMPROVED EFFICIENCIES THROUGH OPERATIONAL EXCELLENCE Pricing pressure is an inherent part of the automotive supplier business. Price reductions are generally higher on newer products with strong volume growth compared to older products, where both the possibilities to re-design the product to reduce costs and market growth are less. Price reductions can also depend on the business cycle. For the period 2016-2018,2019-2020, we estimate the average reduction of our market prices to have been in the range of 2-4% annually. As described below, to meet these price reductions, we have implemented several programs and taken actions to address every item in our cost structure. Additionally, during the period 2016-2018, we have experienced raw material commodity costs increase of around $30 million. Our productivity improvement target is to achieve at least 5% savings per year. To meet this target, Autoliv has developed a set of strategies to reduce costs in manufacturing: Autoliv production system (APS) is based on lean manufacturing methodology which aims to continuously increase output with less resources. APS provides the target conditions and tools to achieve the delivery of goods and services at the right time, in the right amount, at the required quality and at the lowest cost possible to all our customers.
| • | Autoliv production system (APS) is based on lean manufacturing methodology which aims to continuously increase output with less resources. APS provides the target conditions and tools to achieve the delivery of goods and services at the right time, in the right amount, at the required quality and at the lowest cost possible to all our customers. |
| • | Our One Product One Process (1P1P) strategy focuses on product and process standardization and reducing cost and complexity. The 1P1P strategy, combined with initiatives to reduce costs for components from external suppliers, ensures that we continuously optimize our supply base footprint, consolidate purchase volumes to fewer suppliers, improve productivity in our supply chain, standardize components and redesign our products. |
| • | Strategic Initiatives including Automation, Digitalization, Supply Chain Management Effectiveness and RD&E Effectiveness. |
Our One Product One Process (1P1P) strategy focuses on product and process standardization and reducing cost and complexity. The 1P1P strategy, combined with initiatives to reduce costs for components from external suppliers, ensures that we continuously optimize our supply base footprint, consolidate purchase volumes to fewer suppliers, improve productivity in our supply chain, standardize components and redesign our products. Thesecontinuous improvement strategies have enabled productivity improvementsimprovement at or above our target of 5% over the last years, except 2018 and 2020. 2018 due to a sharp increase in Autoliv’s manufacturinglaunch activities. Excluding impact from Force Majeure situation in our plant in Mexico, we came back to around historical performance during 2019. This was achieved despite the increased launch activities also impacted us during 2019. In 2020, the sharp deterioration of over 5% for four out oflight vehicle production in the five past years. It was onlyfirst half year and the sharp recovery in 2018 that the target was not achieved because of elevated launch related costs.
To reduce labor costs while offsetting the price erosion on our products, we continuously implementsecond half year limited productivity improvement programs, expand production in Best Cost Countries (BCCs) and institute restructuring and capacity alignment activities. The number of employees in the BCCs in relation to total headcount has increased slightly from 78% in 2016 to over 80% in 2018.
These initiatives, in combination with our restructuring activities, investment in vertical integration and several other actions, are in place to offset the market price erosion.opportunities.
We foresee opportunities for further productivity on gains from increasing use of automation in our assembly for lean manufacturing processes. Additionally, automated cells typically perform the manufacturing process with reduced variability. This results in greater control and consistency of product quality.
Reducing labor costs to offset the price erosion on our products is achieved through continuously implementing productivity improvement programs, optimizing our production footprint and instituting restructuring and capacity alignment activities. These initiatives, in combination with our restructuring activities, investment in vertical integration and several other actions, are in place to offset the market price erosion. FOCUS ON QUALITY INCREASING The number of vehicle recalls in the automotive industry has risen sharply over the last fewin recent years. InStarting in 2015, and 2016, Takata’s airbag inflators recall generated a record number of recalls in the automotive industry. We expect overall recall numbers to remain high for years to come and, although we strive for the highest quality in our processes, it cannot be ruled out that we may also be adversely impacted by a future recall. Quality has been and always will be our number one priority, and we continue to sharpen our focus in this area. We now commandhold a market share of 40%around 42% in passive safety. At the same time,while we have been involved in less than 2% of passive safety recalls in the industry in the past ten years;since 2010; an important indicator that we are delivering on our quality strategy. For more information see product warranty and recalls in Note 13 to the Consolidated Financial Statements in this Annual Report. CHANGES IN COMPETITIVE LANDSCAPE During the period 2016 to 2018,past six years, we experienced significant changes in our competitive landscape. In 2015, TRW, a key competitor in passive safety, was acquired by German group ZF Friedrichshafen. Combined, the new company is the third-largestsecond largest passive safety supplier globally. In 2016, Key Safety Systems (“KSS”) was acquired by Ningbo Joyson Electronic Corp. Beginning in 2014, Takata, our largest competitor at the time, experienced severe issues and recalls related to malfunctioning airbag inflators, leading the company to file for bankruptcy protection in the U.S. and Japan. In 2018, Joyson substantially acquired all of Takata's global assets and operations and combined it with KSS, forming the new company JSS.
Combined, the new company is the third largest passive safety supplier globally. European Commission AntitruSt Investigation
Since 2011, Autoliv has been subject to an investigation of anti-competitive behavior among suppliers of occupant safety systems by the European Commission (EC). We now have reason to believe that the EC will seek to impose a fine of approximately 185 million Euros in connection with the remaining portion of the EC investigation. Therefore, the Company accrued $210 million in the fourth quarter of 2018. The Company believes that a fine could be issued during the first half of 2019, although this may be delayed.
CAPITAL STRUCTURE The Company’s net debt wasstood at $1,619$1,214 million on December 31, 2018.2020. This was an increase by $1,250a decrease of $436 million compared to December 31, 2017. The increase was mainly driven by the $972 million capitalization of Veoneer prior to the spin-off.2019. Total interest bearing debt at December 31, 20182020 amounted to $2,230$2,411 million, an increase by $899of $317 million compared to December 31, 2017.2019. Cash flow from operations including discontinued operations, was $591$849 million in 20182020 and $936$641 million in 2017.2019. Capital expenditures, net amounted to $555$340 million in 20182020 and $570$476 million in 2017.2019. During the two-year period 2017-20182019-2020, the Company paid dividends of $423$271 million. In 2020, the Company paid dividends of $54 million in the first quarter and repurchased shares for $157 million. Afterthen suspended the latest declared dividend of 62 cents per share,dividends due to the annualized run rate is $216 million, based on number of shares outstanding at December 31, 2018.COVID-19 pandemic It is the Company’s policy to maintain a financial leverage commensurate with a “strong investment grade credit rating” and our. The long-term target is to have a leverage ratio (see section Non-U.S. GAAP Performance Measures) of around 1.0 times and to be within the range of 0.5 times to 1.5 times. We monitor our1.5. At December 31, 2020, the current leverage ratio is 1.8. The Company monitors its capital structure and the financial markets closely and intendintends to maintain a high level of financial flexibility while being shareholder friendly. As part of the adjustment of the capital structure, the Company historically has repurchased shares of its common stock. During 2018,2020 and 2019, the Company did not repurchase any shares, during 2017, the Company repurchased 1.4 million shares for approximately $157 million, including commissions.shares. At December 31, 2018,2020, the remaining number of shares authorized by the board of directors for repurchase is approximately 3.0 million shares. CURRENCY IMPACTS The Company is exposed to around 50 currency pairs, with exposures in excess of $1 million each. We are monitoring our currency exposure but do not hedge currency flows. Rather we strive to have sales and costs in the same currency to reduce the transaction exposure risk. The total net transaction exposure in 20182020 was approximately $2.4$2.2 billion or 28%25% of sales. The 5 largest exposures in 2020 were USD/MXN (sell USD), USD/CAD (sell USD), EUR/RON (sell EUR), USD/KRW (buy USD) and EUR/CNY (buy EUR) which combined amounted to a net transaction exposure of around $1.2 billion. Approximately three quarters of our sales are denominated in currencies other currencies than U.S. dollars, which is leading to currency translation effects.
Outlook for 20192021 MainlyOur outlook indications for 2021 reflect continuing uncertainty in the automotive markets and are mainly based on our customer call-offs and a light vehicle production outlook that is slightly below theLVP according to IHS estimate, the indication for organic sales growth for the full year 2019 is around 5%. Currency translations are expected to have a combined negative effect of around 1%, resulting in a consolidated sales increase of around 4%. The indication for adjusted operating margin for the full year 2019 is around 10.5%.Markit.
The projected tax rate, excluding unusual items, for the full year 2019, is expected to be around 28%, and is subject to change due to nonrecurring events that may occur.
Financial measure | | Full year indication | Net sales growth | | Around 25% | Organic sales growth | | Around 20% | Adjusted operating margin 1) | | Around 10% | R,D&E, net % of sales | | Around 4.5 | Tax rate 2) | | Around 30% | Operating cash flow3) | | Similar level as 2020 | Capital expenditures, net % of sales | | Below 6% | Leverage ratio at year end | | Within target range |
The projected operating cash flow for the full year 2019, excluding any unusual items, is expected to be higher than for Continuing Operations full year 2018 of around $810 million. The projected capital expenditures as percent of sales, net, for the full year 2019 is expected to be lower than for Continuing Operations full year 2018 of around 5.6%.
The projected R,D&E, net, as percent of sales, for the full year 2019 is expected to be lower than for Continuing Operations full year 2018 of around 4.8%. The projected leverage ratio is expected to be well within our target range of 0.5x to 1.5x at the end of 2019.
1) | Excluding costs for capacity alignments and anti-trust related matters. |
2) | Excluding unusual tax items. |
3) | Excluding unusual items. |
The forward-looking non-U.S. GAAP financial measures above are provided on a non-U.S. GAAP basis. Autoliv has not provided a U.S. GAAP reconciliation of these measures because items that impact these measures, such as costs related to capacity alignments and antitrust matters cannot be reasonably predicted or determined. As a result, such reconciliation is not available without unreasonable efforts and Autoliv is unable to determine the probable significance of the unavailable information. Significant Legal Matters The Company is subject to ongoing antitrust investigations by governmental authorities in several jurisdictions as well as related civil litigation. For further discussion of these antitrust matters and other legal proceedings seeSee Item 3. Legal Proceedings and Note 18 Contingent Liabilities to the Consolidated Financial Statements in this Annual Report.
Year Ended December 31, 20182020 Versus 20172019 Sales by Product | | | | | | | | | | | | | | Components Of Change In Net Sales | | | | | | | | | | | | | | | Components of Change in Net Sales | | | | 2018 Sales (MUSD) | | | 2017 Sales (MUSD) | | | Reported change | | | Currency effects1) | | | Organic | | | 2020 (MUSD) | | | 2019 (MUSD) | | | Reported change | | | Currency effects1) | | | Organic | | Airbags products and Other2) | | $ | 5,698 | | | $ | 5,343 | | | | 6.7 | % | | | 1.8 | % | | | 4.9 | % | | $ | 4,824 | | | $ | 5,676 | | | | (15.0 | )% | | | (0.8 | )% | | | (14.2 | )% | Seatbelt products2) | | | 2,980 | | | | 2,794 | | | | 6.7 | % | | | 2.2 | % | | | 4.5 | % | | | 2,623 | | | | 2,872 | | | | (8.6 | )% | | | (0.9 | )% | | | (7.7 | )% | Total | | $ | 8,678 | | | $ | 8,137 | | | | 6.7 | % | | | 1.9 | % | | | 4.8 | % | | $ | 7,447 | | | $ | 8,548 | | | | (12.9 | )% | | | (0.9 | )% | | | (12.0 | )% |
1) | Effects from currency translations. |
2) | Including Corporate and Other sales. |
Consolidated net sales increaseddecreased by 6.7%12.9% compared to full year 2017 with an2019. Excluding negative currency translation effects of 0.9%, the organic growthsales decrease (see section Non-U.S. GAAP Performance Measures) was 12.0%. Sales of 4.8% and positive currency translation effects of 1.9%. Airbag sales grewall our airbag products except textiles declined organically (see section Non-U.S. GAAP Performance Measures) by 4.9%between 11% and 53% (depending on the region) for the full year, reflecting the 16.8% decline in LVP. Textiles increased by 66%, mainly drivenreflecting new sales of textiles for manufacturing of personal protection equipment. Sales of replacement inflators decreased by steering wheels in North America, Europe and China and from inflatable curtains in North America, partly offset by organic sales decline of inflatable curtains in Europe.around $85 million to $57 million.
Seatbelt sales grewdeclined organically (see section Non-U.S. GAAP Performance Measures) by 4.5%, mainly driven by7.7%. Japan showed a slight organic seatbelt sales growth, while all other regions showed organic sales declines between 1% and 21%. Sales of more advanced and higher value-added seatbelts declined significantly less than total seatbelts sales did and grew strongly in North America, IndiaChina and China, partly offset by declines in Europe.Japan. Sales by Region | | | | | | | | | | | | | | Components Of Change In Net Sales | | | | | | | | | | | | | | | Components of Change in Net Sales | | | | 2018 Sales (MUSD) | | | 2017 Sales (MUSD) | | | Reported change | | | Currency effects1) | | | Organic | | | 2020 (MUSD) | | | 2019 (MUSD) | | | Reported change | | | Currency effects1) | | | Organic | | Asia | | $ | 3,195 | | | $ | 2,998 | | | | 6.6 | % | | | 1.9 | % | | | 4.7 | % | | $ | 3,043 | | | $ | 3,177 | | | | (4.2 | )% | | | (0.0 | )% | | | (4.2 | )% | Whereof: China | | | 1,522 | | | | 1,421 | | | | 7.1 | % | | | 2.2 | % | | | 4.9 | % | | | 1,541 | | | | 1,525 | | | | 1.0 | % | | | 0.0 | % | | | 1.0 | % | Japan | | | 828 | | | | 787 | | | | 5.2 | % | | | 1.6 | % | | | 3.6 | % | | | 733 | | | | 811 | | | | (9.6 | )% | | | 1.9 | % | | | (11.5 | )% | Rest of Asia | | | 845 | | | | 790 | | | | 6.9 | % | | | 1.3 | % | | | 5.6 | % | | | 769 | | | | 841 | | | | (8.5 | )% | | | (2.0 | )% | | | (6.5 | )% | Americas | | | 2,735 | | | | 2,435 | | | | 12.3 | % | | | (1.0 | )% | | | 13.3 | % | | | 2,337 | | | | 2,907 | | | | (19.6 | )% | | | (3.3 | )% | | | (16.3 | )% | Europe | | | 2,748 | | | | 2,704 | | | | 1.7 | % | | | 4.5 | % | | | (2.8 | )% | | | 2,067 | | | | 2,464 | | | | (16.1 | )% | | | 0.9 | % | | | (17.0 | )% | Global | | $ | 8,678 | | | $ | 8,137 | | | | 6.7 | % | | | 1.9 | % | | | 4.8 | % | | $ | 7,447 | | | $ | 8,548 | | | | (12.9 | )% | | | (0.9 | )% | | | (12.0 | )% |
1) | Effects from currency translations. |
For the full year 2018,2020, Autoliv’s sales grewdecreased organically (see section Non-U.S. GAAP Performance Measures) by 4.8%12.0% compared to full year 2017, almost 6pp more2019, around 5pp better than LVP growth according(according to IHS. The largest contributors to theIHS Markit). Sales declined organically in all regions except China. Our organic growth were North America,sales development outperformed LVP in all regions - by around 7pp in Americas, 6pp in China, and India, partly offset by Europe and South Korea. The organic sales increase (see section Non-U.S. GAAP Performance Measures) from Autoliv’s companies5pp in China of 4.9% was driven by both domestic and global OEMs. Sales growth to domestic OEMs was mainly with Geely, including Lynk & Co, and Great Wall while growth with the global OEMs was mainly with VW, Honda and Nissan.
Organic sales growth (see section Non-U.S. GAAP Performance Measures) of 3.6% from Autoliv’s companies in Japan was mainly derived from sales to Subaru and Mitsubishi as well as inflator replacement sales.
Organic sales growth (see section Non-U.S. GAAP Performance Measures) from Autoliv’s companies in the Rest of Asia of 5.6% was driven by strong sales development in India, which grew organically by 26%, mainly from sales to Suzuki, Honda, Tata and Hyundai/Kia. Sales in South Korea decreased, driven mainly by lower sales to Hyundai/Kia.
The organic growth (see section Non-U.S. GAAP Performance Measures) from Autoliv’s companies in Americas was 13.3%. North America grew organically by 13.1% mainly due to new model launches with FCA, Honda, Nissan, Tesla and VW, partly offset by lower sales to Daimler, GM and Ford. Overall growth was driven by all main product groups. Sales in South America grew organically by 18.2%, mainly due to increased sales to FCA and VW.
The 2.8% organic sales decline (see section Non-U.S. GAAP Performance Measures) from Autoliv’s companies in Europe was mainly driven by Renault, FCA, BMW, JLR, PSA and Ford, partly offset by strong performance with premium brands such as Daimler and Volvo. Europe.
| Years ended December 31 | | | | | | (Dollars in millions, except per share data) | 2018 | | | 2017 | | | Change | | Net Sales | $ | 8,678 | | | $ | 8,137 | | | | 6.7 | % | Gross profit | | 1,711 | | | | 1,680 | | | | 1.9 | % | % of sales | | 19.7 | % | | | 20.6 | % | | | (0.9 | )pp | S,G&A | | (390 | ) | | | (407 | ) | | | (4.0 | )% | % of sales | | (4.5 | )% | | | (5.0 | )% | | | (0.5 | )pp | R,D&E net | | (413 | ) | | | (371 | ) | | | 11.3 | % | % of sales | | (4.8 | )% | | | (4.6 | )% | | | 0.2 | pp | Other income (expense), net | | (211 | ) | | | (32 | ) | | | 565.9 | % | % of sales | | (2.4 | )% | | | (0.4 | )% | | | 2.0 | pp | Operating income | | 686 | | | | 860 | | | | (20.2 | )% | % of sales | | 7.9 | % | | | 10.6 | % | | | (2.7 | )pp | Interest expense, net | | (59 | ) | | | (54 | ) | | | 9.3 | % | Income before taxes | | 612 | | | | 792 | | | | (22.7 | )% | Tax rate | | 38.4 | % | | | 25.8 | % | | | 12.6 | pp | Income attributable to controlling interest from Continuing Operations | | 376 | | | | 586 | | | | (35.9 | )% | Earnings per share Continuing Operations, diluted1, 2) | | 4.31 | | | | 6.68 | | | | (35.5 | )% |
2020 Organic growth1) | | Americas | | | Europe | | | China | | | Japan | | | Rest of Asia | | | Global | | Autoliv | | | (16.3 | )% | | | (17.0 | )% | | | 1.0 | % | | | (11.5 | )% | | | (6.5 | )% | | | (12.0 | )% | Main growth drivers | | Tesla, Mazda | | | Toyota, PSA | | | GM, Ford, Toyota | | | Honda, Suzuki, Toyota | | | GM, Renault, Nissan | | | Tesla, GM, Suzuki | | Main decline drivers | | FCA, Honda, Nissan | | | Daimler, Renault, VW | | | Nissan, Geely, Daimler | | | Mitsubishi, Nissan, Mazda | | | Mitsubishi, Toyota, Suzuki | | | Nissan, FCA, Daimler | | 1) Non-U.S. GAAP Measure | | | | | | | | | | | | | | | | | | | | | | | | |
| Years ended December 31 | | | | | | (Dollars in millions, except per share data) | 2020 | | | 2019 | | | Change | | Net Sales | $ | 7,447.4 | | | $ | 8,547.6 | | | | (12.9 | )% | Gross profit | | 1,246.9 | | | | 1,584.4 | | | | (21.3 | )% | % of sales | | 16.7 | % | | | 18.5 | % | | | (1.8 | )pp | S,G&A | | (389.2 | ) | | | (398.9 | ) | | | (2.4 | )% | % of sales | | (5.2 | )% | | | (4.7 | )% | | | 0.5 | pp | R,D&E net | | (375.5 | ) | | | (405.5 | ) | | | (7.4 | )% | % of sales | | (5.0 | )% | | | (4.7 | )% | | | 0.3 | pp | Other income (expense), net | | (90.1 | ) | | | (42.7 | ) | | | 111.0 | % | Operating income | | 382.1 | | | 725.8 | | | | (47.4 | )% | % of sales | | 5.1 | % | | | 8.5 | % | | | (3.4 | )pp | Adjusted operating income | | 481.6 | | | 774.4 | | | | (37.8 | )% | % of sales | | 6.5 | % | | | 9.1 | % | | | (2.6 | )pp | Financial and non-operating items, net | | (90.9 | ) | | | (77.4 | ) | | | 17.4 | % | Income before taxes | | 291.2 | | | | 648.4 | | | | (55.1 | )% | Tax rate | | 35.3 | % | | | 28.6 | % | | | 6.7 | pp | Net income | | 188.3 | | | | 462.8 | | | | (59.3 | )% | Earnings per share, diluted1, 2) | 2.14 | | | 5.29 | | | | (59.5 | )% | Adjusted earnings per share, diluted1, 2) | 3.15 | | | 5.72 | | | | (44.9 | )% |
1) | Assuming dilution and net of treasury shares. |
2) | Participating share awards with right to receive dividend equivalents are (under the two classtwo-class method) excluded from the EPS calculation. |
GROSS PROFIT The grossGross profit fordeclined by $338 million and the full year 2018 increased by $32 million, compared to the prior year, as a result of higher sales partly offset by a lower gross margin. The gross margin decreaseddeclined by 0.9pp1.8pp compared to full year 2017, mainly due to adverse impact2019. The gross margin decline was primarily driven by lower sales and lower utilization of our assets from launch relatedthe decline in LVP. The sharp sales decline followed by a volatile restart and ramp-up with limited visibility and predictability had a significant effect on our gross margin, despite significant reductions in costs rawfor material costs and currency changes which more than offset the operating leverage on the increased sales.labor.
OPERATING INCOME Operating income decreased by $174$344 million, to $686 million. The reported operating margin was 7.9%mainly as a consequence of sales, compared to 10.6% of salesthe declines in the prior year. The decrease of 2.7pp of sales was mainly due togross profit and higher costs for antitrust related matters, compared to, reported as Otherin other income (expense), net, partially offset by lower gross margincosts for S,G&A and higher R,D&E, net costs. net. Selling, General and Administrative (S,G&A) expenses decreased by $16$10 million, or 0.5pp of sales driven by transition service agreement income,2.4%, mainly due to lower bonus accruals and lower legalpersonnel costs. Research, Development & Engineering (R,D&E) expenses, net as percent of sales was 4.8% compareddeclined by $30 million, or by 7.4%, mainly due to 4.6% in the same period the priorpositive year mainly as a result of the significant increase in product launches during the first half of 2018 and continued strong order intake. INTEREST EXPENSE, NET
Interestover year effects from lower personnel costs partially offset by lower engineering income. Other income (expense), net expense net in full year 2018 was $59 million. The increase of $5increased by $47 million compared to $54 million in fullthe previous year, 2017 is related to interest expenses after issuing the 500 million Eurobond in June 2018 partly offset by less USPP debt. Interest income was close to $7 million in full year 2018, $0.5 million lower compared to full year 2017mainly due to lower cash balances.higher costs for capacity alignments.
FINANCIAL AND NON-OPERATING ITEMS, NET Financial and non-operating items, net, costs were $14 million higher than the previous year, mainly due to unfavorable effects of exchange rate changes and higher pension related expenses. INCOME TAXES The effective tax
Tax rate in 2018 was 38.4%35.3%, compared to 25.8%28.6% in 2017. The tax rate for 2018 excluding discrete tax items was 29.1% compared to 24.8% in 2017. The tax rate for 2018 was2019, impacted by several items, including additionalunfavorable country mix and losses without tax cost recorded related to the U.S. transition tax and the impact of the antitrust accrual, which is not deductible for tax purposes. The tax rate for 2017 was impacted by the reversal of the valuation allowance for certain deferred tax assets and the estimate of the negative impact of the U.S. tax reform (specifically the deemed repatriation of non-U.S. earnings and the revaluation of U.S. deferred tax assets to the new lower U.S. tax rate). See Note 6 to the Consolidated Financial Statements included herein.benefit.
NET INCOME AND EARNINGS PER SHARE Net income attributabledecreased by $275 million compared to controlling interest from Continuing Operations decreased year on year2019 primarily driven by the antitrust accruallower gross profit and operating income as noted above. Earnings per share, (EPS) from Continuing Operations assuming dilutiondiluted, decreased by 35.5% to $4.31 compared to $6.68$3.15 where the main drivers were $2.36 from lower adjusted operating income, $0.58 from mainly higher accruals for the same period one year ago. The mainrestructuring activities, $0.11 from financial items affecting EPS negatively were 208 centsand $0.10 from higher costs primarily relating to antitrust related matters and 42 cents from higher underlying tax rate. The main offsetting effects were 15 cents from discrete tax items.taxes.(see section Non-U.S. GAAP Performance Measures). The weighted average number of shares outstanding assuming dilution in 2020 was 87.387.5 million compared to 87.7 million for full year of 2017.
Year Ended December 31, 2017 Versus 2016
Sales by Product
| | | | | | | | | | | | | | Components Of Change In Net Sales | | | | 2017 (Sales MUSD) | | | 2016 (Sales MUSD) | | | Reported change | | | Currency effects1) | | | Organic | | Airbags products and Other2) | | $ | 5,343 | | | $ | 5,257 | | | | 1.6 | % | | | 0.3 | % | | | 1.3 | % | Seatbelt products2) | | | 2,794 | | | | 2,665 | | | | 4.8 | % | | | 0.8 | % | | | 4.0 | % | Total | | $ | 8,137 | | | $ | 7,922 | | | | 2.7 | % | | | 0.5 | % | | | 2.2 | % |
1)
| Effects from currency translations.
|
2)
| Including Corporate and Other sales.
|
Consolidated sales increased by 2.7% to $8,137 million. Excluding positive currency translation effects, the organic sales growth (see section Non-U.S. GAAP Performance Measures) was 2.2%, in line with global light vehicle production despite negative impact from lower inflator sales.
Airbag sales had solid organic growth (see section Non-U.S. GAAP Performance Measures) for the full year in Asia, especially in India, Japan and China. South America grew strongly while Europe and South Korea showed more modest organic growth. North American sales declined organically.
Seatbelt sales grew organically (see section Non-U.S. GAAP Performance Measures) for the full year in all regions except in North America and South Korea, with Europe and Japan as the largest growth drivers.
Inflator replacement sales affected the segment’s organic sales growth (see section Non-U.S. GAAP Performance Measures) for the full year negatively by around 0.4pp.
Sales by Region
| | | | | | | | | | | | | | Components Of Change In Net Sales | | | | 2017 Sales (MUSD) | | | 2016 Sales (MUSD) | | | Reported change | | | Currency effects1) | | | Organic | | Asia | | $ | 2,998 | | | $ | 2,831 | | | | 5.9 | % | | | (0.9 | )% | | | 6.8 | % | Whereof: China | | | 1,421 | | | | 1,385 | | | | 2.6 | % | | | (1.6 | )% | | | 4.2 | % | Japan | | | 787 | | | | 719 | | | | 9.5 | % | | | (3.3 | )% | | | 12.8 | % | Rest of Asia | | | 790 | | | | 727 | | | | 8.8 | % | | | 3.0 | % | | | 5.8 | % | Americas | | | 2,435 | | | | 2,547 | | | | (4.4 | )% | | | 0.1 | % | | | (4.5 | )% | Europe | | | 2,704 | | | | 2,544 | | | | 6.3 | % | | | 2.5 | % | | | 3.8 | % | Global | | $ | 8,137 | | | $ | 7,922 | | | | 2.7 | % | | | 0.5 | % | | | 2.2 | % |
1)
| Effects from currency translations.
|
For the full year 2017, Autoliv’ sales grew organically (see section Non-U.S. GAAP Performance Measures) by 2.2% compared to full year 2016, in line with global LVP growth according to IHS. The largest contributors to the organic growth were Europe, Japan, and China, partly offset by North America and South Korea.
The organic sales increase (see section Non-U.S. GAAP Performance Measures) from Autoliv’s companies in China was mainly driven by the global OEMs, primarily Renault/Nissan and Daimler, partly offset by Hyundai/Kia. Organic sales to the domestic OEMs also increased, with increases to models from Geely and Great Wall, partly offset by decreases to models from Haima. Inflator replacement sales contributed positively to organic sales growth.
Organic sales growth (see section Non-U.S. GAAP Performance Measures) from Autoliv’s companies in Japan was driven by Toyota, Renault/Nissan and Mitsubishi. Offsetting effects are mainly from decreasing inflator replacement sales.
Organic sales growth (see section Non-U.S. GAAP Performance Measures) from Autoliv’s companies in the Rest of Asia was driven by strong sales development in India, mainly to Suzuki and Hyundai/Kia. Sales in South Korea decreased, driven by Ssangyong and GM.
Sales from Autoliv’s companies in Americas declined organically (see section Non-U.S. GAAP Performance Measures) by 4.5%. North America declined by 6.0% organically, driven primarily by GM due to unfavorable platform shifts and declining LVP. Inflator replacement sales had a 0.7pp negative impact on organic growth in North America. South America grew organically by about 45%.
The 3.8% organic sales growth (see section Non-U.S. GAAP Performance Measures) from Autoliv’s companies in Europe was mainly driven by Volvo, Toyota and VW. Offsetting effects were mainly from Opel.
| Years ended December 31 | | | | | | (Dollars in millions, except per share data) | 2017 | | | 2016 | | | Change | | Net Sales | $ | 8,137 | | | $ | 7,922 | | | | 2.7 | % | Gross profit | | 1,680 | | | | 1,628 | | | | 3.2 | % | % of sales | | 20.6 | % | | | 20.6 | % | | | 0.0 | pp | S,G&A | | (407 | ) | | | (394 | ) | | | 3.3 | % | % of sales | | (5.0 | )% | | | (5.0 | )% | | | 0.0 | pp | R,D&E net | | (371 | ) | | | (357 | ) | | | 3.9 | % | % of sales | | (4.6 | )% | | | (4.5 | )% | | | 0.1 | pp | Other income (expense), net | | (32 | ) | | | (35 | ) | | | (8.6 | )% | % of sales | | (0.4 | )% | | | (0.4 | )% | | | (0.0 | )pp | Operating income | | 860 | | | | 831 | | | | 3.5 | % | % of sales | | 10.6 | % | | | 10.5 | % | | | 0.1 | % | Interest expense, net | | (54 | ) | | | (58 | ) | | | (6.9 | )% | Income before taxes | | 792 | | | | 784 | | | | 1.0 | % | Tax rate | | 25.8 | % | | | 28.6 | % | | | (2.8 | )pp | Net income attributable to controlling interest from Continuing Operations | | 586 | | | | 558 | | | | 5.0 | % | Earnings per share Continuing Operations, diluted1, 2) | | 6.68 | | | | 6.32 | | | | 5.7 | % |
1)
| Assuming dilution and net of treasury shares.
|
2)
| Participating share awards with right to receive dividend equivalents are (under the two class method) excluded from the EPS calculation.
|
GROSS PROFIT
The gross profit for the full year 2017 increased by $52 million, compared to the prior year, as a result of higher sales. The gross margin was basically unchanged compared to 2016, as improved operational performance and higher organic sales (see section Non-U.S. GAAP Performance Measures), were offset by costs related to investments for capacity and growth, as well as negative impact from raw material prices.
OPERATING INCOME
Operating income increased by around $29 million to $860 million and the operating margin increased slightly by 0.1pp to 10.6% compared to prior year. In 2017, the operating margin was negatively affected by the ongoing capacity alignments ($22 million), settlements of antitrust related matters ($18 million), higher RD&E, net, ($14 million) to support growth.
Selling, General and Administrative (S,G&A) expenses increased by $13 million compared to the prior year, but remained flat as a percentage of net sales. Research, Development & Engineering (R,D&E) expenses, net increased by $14 million compared to the prior year to support growth from prior year’s order intake.
INTEREST EXPENSE, NET
Interest expense, net decreased by $4 million to $54 million compared to 2016. The decrease relates to maturity of $105 million USPP in November 2017, and higher interest income on centrally held USD cash in 2017 compared to 2016.
INCOME TAXES
The effective tax rate in 2017 was 25.8% compared to 28.6% in 2016. The tax rate for 2017 excluding discrete tax items was 24.8% compared to 28.0% in 2016. The tax rate for 2017 was impacted by several items including, reversal of the valuation allowance for certain deferred tax assets, reasonable estimate of the negative impact of U.S. tax reform (specifically the deemed repatriation of non-US earnings and the revaluation of U.S. deferred tax assets to the new lower U.S. tax rate) compared to the 2016 tax rate.
NET INCOME AND EARNINGS PER SHARE
Net income from continuing operations attributable to controlling interest was $586 million, an increase of $28 million from 2016. Earnings per share (EPS) assuming dilution increased by 36 cents, or by 6%, to $6.68 compared to prior year. The main positive items affecting EPS were lower number of shares, lower tax and higher operating income.
The weighted average number of shares outstanding assuming dilution declined to 87.7 million compared to 88.487.4 million in the full year 2016, mainly due to share repurchases.2019.
Non-U.S. GAAP Performance Measures In this annual report we sometimes refer to non-U.S. GAAP measures that we and securities analysts use in measuring Autoliv’s performance. We believe that these measures assist investors and management in analyzing trends in the Company’s business for the reasons given below. Investors should not consider these non-U.S. GAAP measures as substitutes for, but rather as additions to, financial reporting measures prepared in accordance with U.S. GAAP. These non-U.S. GAAP measures have been identified, as applicable, in each section of this annual report with tabular presentations provided below, reconciling them to U.S. GAAP. It should be noted that these measures, as defined, may not be comparable to similarly titled measures used by other companies. ORGANIC SALES We analyze the Company’s sales trends and performance as changes in “organic sales growth” or “organic sales decline”, because the Company currently generates approximately three quarters of net sales in currencies other than the reporting currency (i.e. U.S. dollars) and currency rates have proven to be rather volatile. We also use organic sales to reflect the fact that historically the Company has made several acquisitions and divestitures. Organic sales present the increase or decrease in the overall U.S. dollar net sales on a comparable basis, allowing separate discussions of the impact of acquisitions/divestitures and exchange rates. The following tabular reconciliation presents changes in “organic sales growth” as reconciled to the change in total U.S. GAAP net sales. COMPONENTS IN SALES INCREASE/DECREASE (DOLLARS IN MILLIONS) | | China | | | Japan | | | RoA1) | | | Americas | | | Europe | | | Total | | | China | | | Japan | | | RoA1) | | | Americas | | | Europe | | | Total | | 2018 VS. 2017 | | % | | | $ | | | % | | | $ | | | % | | | $ | | | % | | | $ | | | % | | | $ | | | % | | | $ | | | 2020 VS. 2019 | | | % | | | $ | | | % | | | $ | | | % | | | $ | | | % | | | $ | | | % | | | $ | | | % | | | $ | | Reported change | | | 7.1 | | | $ | 101.0 | | | | 5.2 | | | $ | 40.9 | | | | 6.9 | | | $ | 54.9 | | | | 12.3 | | | $ | 299.9 | | | | 1.7 | | | $ | 44.7 | | | | 6.7 | | | $ | 541.4 | | | | 1.0 | | | $ | 15.6 | | | | (9.6 | ) | | $ | (77.4 | ) | | | (8.5 | ) | | $ | (71.8 | ) | | | (19.6 | ) | | $ | (570.1 | ) | | | (16.1 | ) | | $ | (396.5 | ) | | | (12.9 | ) | | $ | (1,100.2 | ) | Currency effects2) | | | 2.2 | | | | 30.9 | | | | 1.6 | | | | 12.8 | | | | 1.3 | | | | 10.9 | | | | (1.0 | ) | | | (24.2 | ) | | | 4.5 | | | | 119.9 | | | | 1.9 | | | | 150.3 | | | | 0.0 | | | | 1.0 | | | | 1.9 | | | | 16.1 | | | | (2.0 | ) | | | (17.2 | ) | | | (3.3 | ) | | | (97.5 | ) | | | 0.9 | | | | 23.1 | | | | (0.9 | ) | | | (74.5 | ) | Organic change | | | 4.9 | | | | 70.1 | | | | 3.6 | | | | 28.1 | | | | 5.6 | | | | 44.0 | | | | 13.3 | | | | 324.1 | | | | (2.8 | ) | | | (75.2 | ) | | | 4.8 | | | | 391.1 | | | | 1.0 | | | | 14.6 | | | | (11.5 | ) | | | (93.5 | ) | | | (6.5 | ) | | | (54.6 | ) | | | (16.3 | ) | | | (472.6 | ) | | | (17.0 | ) | | | (419.6 | ) | | | (12.0 | ) | | | (1,025.7 | ) |
| | China | | | Japan | | | RoA1) | | | Americas | | | Europe | | | Total | | 2017 VS. 2016 | | % | | | $ | | | % | | | $ | | | % | | | $ | | | % | | | $ | | | % | | | $ | | | % | | | $ | | Reported change | | | 2.6 | | | $ | 35.8 | | | | 9.5 | | | $ | 68.4 | | | | 8.8 | | | $ | 63.7 | | | | (4.4 | ) | | $ | (112.8 | ) | | | 6.3 | | | $ | 160.1 | | | | 2.7 | | | $ | 215.2 | | Currency effects2) | | | (1.6 | ) | | | (22.1 | ) | | | (3.3 | ) | | | (23.9 | ) | | | 3.0 | | | | 21.6 | | | | 0.1 | | | | 1.3 | | | | 2.5 | | | | 63.4 | | | | 0.5 | | | | 40.3 | | Organic change | | | 4.2 | | | | 57.9 | | | | 12.8 | | | | 92.3 | | | | 5.8 | | | | 42.1 | | | | (4.5 | ) | | | (114.1 | ) | | | 3.8 | | | | 96.7 | | | | 2.2 | | | | 174.9 | |
2) | Effects from currency translations. |
RECONCILIATION OF U.S. GAAP MEASURE TO “OPERATING WORKING CAPITAL” (DOLLARS IN MILLIONS) DECEMBER 31 | | 2018 | | | 2017 | | | 2020 | | | 2019 | | Total current assets Continuing Operations | | $ | 3,285.4 | | | $ | 3,557.5 | | | Total current liabilities Continuing Operations | | | (2,865.5 | ) | | | (2,086.4 | ) | | Total current assets | | | $ | 4,269.0 | | | $ | 3,002.1 | | Total current liabilities | | | | (3,146.9 | ) | | | (2,410.2 | ) | Working capital | | | 419.9 | | | | 1,471.1 | | | | 1,122.1 | | | | 591.9 | | Cash and cash equivalents | | | (615.8 | ) | | | (959.5 | ) | | | (1,178.2 | ) | | | (444.7 | ) | Short-term debt | | | 620.7 | | | | 19.7 | | | | 301.8 | | | | 368.1 | | Derivative (asset) and liability, current | | | (0.8 | ) | | | (2.1 | ) | | | (22.6 | ) | | | (4.2 | ) | Dividends payable | | | 54.0 | | | | 52.2 | | | | — | | | | 54.1 | | Operating working capital | | $ | 478.0 | | | $ | 581.4 | | | $ | 223.1 | | | $ | 565.2 | |
RECONCILIATION OF U.S. GAAP MEASURE TO “NET DEBT” (DOLLARS IN MILLIONS) DECEMBER 31 | | 2018 | | | 2017 | | | 2020 | | | 2019 | | | 2018 | | | 2017 | | | 2016 | | Short-term debt | | $ | 620.7 | | | $ | 19.7 | | | $ | 301.8 | | | $ | 368.1 | | | $ | 620.7 | | | $ | 19.7 | | | $ | 216.3 | | Long-term debt | | | 1,609.0 | | | | 1,310.7 | | | | 2,109.6 | | | | 1,726.1 | | | | 1,609.0 | | | | 1,310.7 | | | | 1,312.5 | | Total debt | | | 2,229.7 | | | | 1,330.4 | | | | 2,411.4 | | | | 2,094.2 | | | | 2,229.7 | | | | 1,330.4 | | | | 1,528.8 | | Cash and cash equivalents | | | (615.8 | ) | | | (959.5 | ) | | | (1,178.2 | ) | | | (444.7 | ) | | | (615.8 | ) | | | (959.5 | ) | | | (1,226.7 | ) | Debt issuance cost/Debt-related derivatives, net | | | 4.9 | | | | (2.5 | ) | | | (19.0 | ) | | | 0.3 | | | | 4.9 | | | | (2.5 | ) | | | (3.4 | ) | Net debt | | $ | 1,618.8 | | | $ | 368.4 | | | $ | 1,214.2 | | | $ | 1,649.8 | | | $ | 1,618.8 | | | $ | 368.4 | | | $ | 298.7 | |
OPERATING WORKING CAPITAL Due to the need to optimize cash generation to create value for our shareholders, management focuses on operationally derived working capital as defined in the table above. The reconciling items used to derive this measure are, by contrast, managed as part of our overall management of cash and debt, but they are not part of the responsibilities of day-to-day operations’operations management. NET DEBT As part of efficiently managing the Company’s overall cost of funds, we routinely enter into “debt-related derivatives” (DRD) as part of our debt management. Creditors and credit rating agencies use net debt adjusted for DRD in their analyses of the Company’s debt and therefore we provide this non-U.S. GAAP measure. DRD are fair value adjustments to the carrying value of the underlying debt. Also included in the DRD is the unamortized fair value adjustment related to discontinued fair value hedges, which will be amortized over the remaining life of the debt. By adjusting for DRD, the total financial liability of net debt is disclosed without grossing debt up with currency or interest fair values.
ADJUSTED OPERATING INCOME AND OPERATING MARGIN AND ADJUSTED EPS Adjusted operating margin and adjusted EPS are non-GAAP measures our management uses to evaluate our business, because we believe they assist investors and analysts in comparing our performance across reporting periods on a consistent basis by excluding items that are non-operational or non-recurring in nature (such as costs related to capacity alignments, costs related to antitrust matters, separation costs impairment charges and for EPS unusual tax items) and that we do not believe are indicative of our core operating performance and underlying business trends. Adjusted operating margin and adjusted EPS should be considered in addition to, but not as a substitute for, other measures of financial performance reported in accordance with U.S. GAAP, including operating margin and EPS. ITEMS AFFECTING COMPARABILITY | | | | | | | | | | | | | | | | | | | | | | | | | | | | | | | | | | | | | | | | | | | | | | | | | | | | | | | | | | | | | | | 2018 | | | 2017 | | | 2016 | | | 2020 | | | 2019 | | (DOLLARS IN MILLIONS, EXCEPT EPS) | | Reported (U.S. GAAP) | | | Adjust- ments1) | | | Non- U.S. GAAP | | | Reported (U.S. GAAP) | | | Adjust- ments1) | | | Non- U.S. GAAP | | | Reported (U.S. GAAP) | | | Adjust- ments1) | | | Non- U.S. GAAP | | | Reported | | | Adjust- ments1) | | | Non- U.S. GAAP | | | Reported | | | Adjust- ments1) | | | Non- U.S. GAAP | | Operating income | | $ | 686 | | | $ | 222 | | | $ | 908 | | | $ | 860 | | | $ | 40 | | | $ | 900 | | | $ | 831 | | | $ | 35 | | | $ | 866 | | | $ | 382 | | | $ | 100 | | | $ | 482 | | | $ | 726 | | | $ | 49 | | | $ | 775 | | Operating margin, % | | | 7.9 | | | | 2.6 | | | | 10.5 | | | | 10.6 | | | | 0.5 | | | | 11.1 | | | | 10.5 | | | | 0.4 | | | | 10.9 | | | | 5.1 | | | | 1.4 | | | | 6.5 | | | | 8.5 | | | | 0.6 | | | | 9.1 | | Income before taxes from Continuing Operations | | $ | 612 | | | $ | 222 | | | $ | 834 | | | $ | 792 | | | $ | 40 | | | $ | 832 | | | $ | 784 | | | $ | 35 | | | $ | 819 | | | Net income attributable to controlling interest from Continuing Operations | | $ | 376 | | | $ | 220 | | | $ | 596 | | | $ | 586 | | | $ | 39 | | | $ | 625 | | | $ | 558 | | | $ | 27 | | | $ | 585 | | | Income before taxes from | | | $ | 291 | | | $ | 100 | | | $ | 391 | | | $ | 648 | | | $ | 49 | | | $ | 697 | | Net income attributable to controlling interest | | | $ | 187 | | | $ | 88 | | | $ | 275 | | | $ | 462 | | | $ | 38 | | | $ | 500 | | Capital employed | | $ | 3,516 | | | $ | 220 | | | $ | 3,736 | | | $ | 4,538 | | | $ | 39 | | | $ | 4,577 | | | $ | 4,225 | | | $ | 27 | | | $ | 4,252 | | | $ | 3,637 | | | $ | 88 | | | $ | 3,725 | | | $ | 3,772 | | | $ | 38 | | | $ | 3,810 | | Return on capital employed, % 2, 6) | | | 16.8 | | | | 5.2 | | | | 22.0 | | | n/a | | | n/a | | | n/a | | | n/a | | | n/a | | | n/a | | | Return on total equity, % 3, 6) | | | 13.0 | | | | 7.3 | | | | 20.3 | | | n/a | | | n/a | | | n/a | | | n/a | | | n/a | | | n/a | | | Earnings per share Continuing Operations, diluted 4, 5) | | $ | 4.31 | | | $ | 2.52 | | | $ | 6.83 | | | $ | 6.68 | | | $ | 0.44 | | | $ | 7.12 | | | $ | 6.32 | | | $ | 0.31 | | | $ | 6.63 | | | Return on capital employed, % 2) | | | | 10.4 | | | | 2.5 | | | | 12.9 | | | | 19.7 | | | | 1.2 | | | | 20.9 | | Return on total equity, % 3) | | | | 8.8 | | | | 3.9 | | | | 12.7 | | | | 23.1 | | | | 1.7 | | | | 24.8 | | Earnings per share, diluted 4, 5) | | | $ | 2.14 | | | $ | 1.01 | | | $ | 3.15 | | | $ | 5.29 | | | $ | 0.43 | | | $ | 5.72 | | Total parent shareholders' equity per share | | $ | 21.63 | | | $ | 2.52 | | | $ | 24.15 | | | $ | 46.38 | | | $ | 0.44 | | | $ | 46.82 | | | $ | 41.69 | | | $ | 0.31 | | | $ | 42.00 | | | $ | 27.56 | | | $ | 1.01 | | | $ | 28.57 | | | $ | 24.19 | | | $ | 0.43 | | | $ | 24.62 | |
1) | AdjustmentsIncluding costs for capacity alignments, antitrust related matters and antitrust matters during 2016-2018 andin 2019 separation of our business segments during 2018.segments. See table below for a disaggregation of these costs.
|
2) | Operating income and income from equity method investments, Continuing Operations, relative to average capital employed. |
3) | Net Income from Continuing Operations relative to average total equity. |
4) | Assuming dilution and net of treasury shares. |
5) | Participating share awards with right to receive dividend equivalents are (under the two-class method) excluded from the EPS calculation. |
6)
| The Company has decided not to recalculate prior periods since the distribution of Veoneer had a significant impact on capital employed making the comparison less meaningful.
|
Items included in Non-GAAP adjustments | | | | | | | | | | | | | | | | | | | | | | | | | Full Year 2018 | | | Full Year 2017 | | | Full Year 2016 | | | Adjustment Millions | | | Adjustment Per share | | | Adjustment Millions | | | Adjustment Per share | | | Adjustment Millions | | | Adjustment Per share | | Capacity alignment | $ | 5 | | | $ | 0.05 | | | $ | 22 | | | $ | 0.24 | | | $ | 21 | | | $ | 0.24 | | Antitrust related matters | | 212 | | | | 2.43 | | | | 18 | | | | 0.21 | | | | 14 | | | | 0.16 | | Separation costs | | 5 | | | | 0.06 | | | | - | | | | - | | | | - | | | | - | | Total adjustments to operating income | $ | 222 | | | $ | 2.54 | | | $ | 40 | | | $ | 0.45 | | | $ | 35 | | | $ | 0.40 | | Tax on non-U.S. GAAP adjustments1) | | (2 | ) | | | (0.02 | ) | | | (1 | ) | | | (0.01 | ) | | | (8 | ) | | | (0.09 | ) | Total adjustments to Income from Continuing operations | $ | 220 | | | $ | 2.52 | | | $ | 39 | | | $ | 0.44 | | | $ | 27 | | | $ | 0.31 | | | | | | | | | | | | | | | | | | | | | | | | | | Weighted average number of shares outstanding - diluted | | | | | | 87.3 | | | | | | | | 87.7 | | | | | | | | 88.4 | | Return on capital employed2, 3, 6) | $ | 222 | | | | | | | n/a | | | | | | | n/a | | | | | | Adjustment Return on Capital employed, % | | 5.2 | % | | | | | | n/a | | | | | | | n/a | | | | | | | | | | | | | | | | | | | | | | | | | | | | | | Return on total equity4, 5, 6) | $ | 220 | | | | | | | n/a | | | | | | | n/a | | | | | | Adjustment Return on Total equity, % | | 7.3 | % | | | | | | n/a | | | | | | | n/a | | | | | |
Items included in Non-GAAP adjustments | | | | | | | | | | | | | | | | | | | Full Year 2020 | | | Full Year 2019 | | | | Adjustment Millions | | | Adjustment Per share | | | Adjustment Millions | | | Adjustment Per share | | Capacity alignment | | $ | 98.8 | | | $ | 1.13 | | | $ | 53.6 | | | $ | 0.61 | | Antitrust related matters | | $ | 0.7 | | | | 0.01 | | | $ | (6.2 | ) | | | (0.07 | ) | Separation costs | | | — | | | | — | | | $ | 1.2 | | | | 0.01 | | Total adjustments to Operating income | | $ | 99.5 | | | $ | 1.14 | | | $ | 48.6 | | | $ | 0.55 | | Tax on Non-U.S. GAAP adjustments1) | | $ | (11.1 | ) | | | (0.13 | ) | | $ | (10.6 | ) | | | (0.12 | ) | Total adjustments to Net Income | | $ | 88.4 | | | $ | 1.01 | | | $ | 38.0 | | | $ | 0.43 | | | | | | | | | | | | | | | | | | | Weighted average number of shares outstanding - diluted2) | | | | | | | 87.5 | | | | | | | | 87.4 | | Adjustment Return on capital employed | | $ | 99.5 | | | | | | | $ | 48.6 | | | | | | Adjustment Return on capital employed, % | | | 2.5 | | | | | | | | 1.2 | | | | | | | | | | | | | | | | | | | | | | | Adjustment Return on total equity | | $ | 88.4 | | | | | | | $ | 38.0 | | | | | | Adjustment Return on total equity, % | | | 3.9 | | | | | | | | 1.7 | | | | | |
1) | The tax is calculated based on the tax laws in the respective jurisdiction(s) of the adjustment(s). |
2) | After adjustment for annualized non-U.S. GAAP EBIT adjustment.
|
3)
| Operating income and income from equity method investments Continuing Operations, relative toAnnualized average capital employed.
|
4)
| Income from Continuing Operations relative to average total equity.
|
5)
| After adjustment for annualized non-U.S. GAAP Net income adjustment.
|
6)
| The Company has decided not to recalculate prior periods since the distributionnumber of Veoneer had significant impact on capital employed making the comparison less meaningful.outstanding shares.
|
QUARTERLY 2018 RECONCILIATION OF ADJUSTED “OPERATING MARGIN” AND ADJUSTED “EPS”
| | First quarter 2018 | | | Second quarter 2018 | | | Third quarter 2018 | | | Fourth quarter 2018 | | | | Reported U.S. GAAP | | | Adjust- ments1) | | | Non- U.S. GAAP | | | Reported U.S. GAAP | | | Adjust- ments1) | | | Non- U.S. GAAP | | | Reported U.S. GAAP | | | Adjust- ments1) | | | Non- U.S. GAAP | | | Reported U.S. GAAP | | | Adjust- ments1) | | | Non- U.S. GAAP | | Operating margin, % | | | 10.9 | | | | 0.0 | | | | 10.9 | | | | 10.4 | | | | 0.0 | | | | 10.4 | | | | 9.5 | | | | 0.0 | | | | 9.5 | | | | 1.0 | | | | 9.9 | | | | 10.9 | | EPS Continuing operations, diluted2,3) | | $ | 1.82 | | | $ | 0.01 | | | $ | 1.83 | | | $ | 2.20 | | | $ | 0.02 | | | $ | 2.22 | | | $ | 1.34 | | | $ | 0.01 | | | $ | 1.35 | | | $ | (1.06 | ) | | $ | 2.48 | | | $ | 1.42 | |
1)
| Adjustments for capacity alignments and antitrust matters and separation of our business segments.
|
2)
| Assuming dilution and net of treasury shares.
|
3)
| Participating share awards with right to receive dividend equivalents are (under the two class method) excluded from the EPS calculation.
|
Liquidity, Capital Resources and Financial Position | | Years ended December 31 | | | Years ended December 31 | | (DOLLARS IN MILLIONS) | | 2018 | | | 2017 | | | 2016 | | | 2020 | | | 2019 | | Net cash provided by operating activities | | $ | 591 | | | $ | 936 | | | $ | 868 | | | $ | 849 | | | $ | 641 | | Net cash used in investing activities | | | (628 | ) | | | (697 | ) | | | (726 | ) | | | (340 | ) | | | (476 | ) | Net cash used in financing activities | | | (245 | ) | | | (566 | ) | | | (200 | ) | | Net cash provided by (used in) financing activities | | | | 160 | | | | (338 | ) | Effect of exchange rate changes on cash and cash equivalents | | | (62 | ) | | | 60 | | | | (49 | ) | | | 64 | | | | 2 | | Decrease in cash and cash equivalents | | | (344 | ) | | | (267 | ) | | | (107 | ) | | Increase (decrease) in cash and cash equivalents | | | | 733 | | | | (171 | ) | Cash and cash equivalents at beginning of year | | | 960 | | | | 1,227 | | | | 1,334 | | | | 445 | | | | 616 | | Cash and cash equivalents at end of year | | $ | 616 | | | $ | 960 | | | $ | 1,227 | | | $ | 1,178 | | | $ | 445 | |
NET CASH PROVIDED BY OPERATING ACTIVITIES Cash flow from operations, together with available financial resources and credit facilities, are expected to be sufficient to fund Autoliv’sthe Company’s anticipated working capital requirements, capital expenditures and future dividend payments. Cash flow items are presented on a consolidated basis including both Continuing and Discontinued Operations.
Cash provided by operating activities was $591$849 million in 20182020 compared to $936$641 million in 2017 and $868 million in 2016.2019. The decreasenet increase compared to previous year was primarily related to costs relateddue to the separationeffects of our business segmentsCOVID-19 resulting in increases to Accounts Payable and changesAccrued Expenses offset by the year over year increase in operating assetsReceivables and liabilities due to increased sales. We estimate that for 2018 $806 millions of the $591 million was attributable to Continuing Operations compared to $870 million of the $936 million for 2017 and $822 million of the $868 million in 2016.other assets. While management of cash and debt is important to the overall business, it is not part of the operational management’s day-to-day responsibilities. We therefore focus on operationally derived working capital (see section Non-U.S. GAAP Performance Measures) and have set a policy that the operating working capital should not exceed 10% of the last 12-month net sales. At December 31, 2018,2020, operating working capital for Continuing Operations (see section Non-U.S. GAAP Performance Measures) amounted to $478$223 million corresponding to 5.5%3.0% of net sales compared to $581$565 million and 7.1%6.6%, respectively, at December 31, 2017, and compared to $488 million and 6.2%, respectively, at December 31, 2016.2019. Days receivables outstanding (see Glossary and Definitions for definition) were 71 86at December 31, 2018,2020, compared to 76 in 2017 and 70 in 2016.2019. Factoring agreements did not have any material effect on days receivables outstanding for 2018, 20172020 or 2016.2019. Days inventory outstanding (see Glossary and Definitions for definition) were 35 42at December 31, 2018,2020, compared to 35 in 2017 and 32 in 2016.2019. NET CASH USED IN INVESTING ACTIVITIES In 2018, 20172020 and 20162019 cash used in investing activities in both Continuing and Discontinued operations amounted to $628 million, $697 $340million and $726$476 million, respectively. For 2018 $486 million of the $628 million was attributable to Continuing Operations compared to $465 million of the $697 million in 2017 and $399 million of the $726 million in 2016. Our investing activities primarily consists of investments in property, plant and equipment, and acquisition of businesses, net of cash. For further information, see Note 3 to the Consolidated Financial Statements included herein.
CAPITAL EXPENDITURES Cash generated by operating activities continued to sufficiently cover capital expenditures for property, plant and equipment. Capital expenditures, gross from in Continuing Operationsnet was $488$340 million in 2018, $4702020 and $476 million in 2017 and $404 million in 2016, corresponding2019. The reduction of close to 5.6%, 5.8%, and 5.1%30% was a result of suspended or delayed investments. In relation to net sales, respectively.capital expenditures, net was 4.6% in 2020 and 5.6% in 2019. Depreciation and amortization in Continuing Operations totaled $342$371 million in 20182020 compared to $307$351 million in 2017 and $280 million in 2016. The projected capital expenditures as percent of sales, net, for the full year 2019 is expected to be lower than for full year 2018 of 5.6%.2019.
During the years 2016 through 2018,2020 and 2019, a majority of our investments inwere for production capacity to support further growthnew product launches and vertical integration continued.automation projects for improved efficiency. Major investments were mainly made in Europe, North America, China and China.Japan. In 2018, expansion of facilities2020, investments in Europe was commenced for manufacturing of seatbeltswere mainly related to new product launches and airbags to meet increased demand.capacity increases. In North America, the higher investments were mainly related to production equipment and buildings to increase capacity forexpansions, as well as a new program launches.technical center. In addition, in China, large investments were made to support revenue growth and to expand capacity and capabilities of textile production. In addition, we made large investments in Asia to increase manufacturing capacity for airbag and seatbelt products.to support new product launches, as well as a new facility in India to increase capacity to support demand. NET CASH USED INPROVIDED BY (USED IN) FINANCING ACTIVITIES Cash used inprovided by (used in) financing activities amounted to $245 million, $566$160 million and $200$(338) million for the years 2018, 20172020 and 2016,2019, respectively. In 20182020 and 2019, the net issuance of debt amounted to $938 million, in 2017 net repayment of debt amounted to $209$215 million and in 2016 net repayment of debt amounted to $3 million. $(121) million, respectively. In 2018,2020, the Company paid dividends of $214 million, compared with dividends paid of $209$54 million in 2017the first quarter and then suspended the dividends due to the COVID-19 pandemic for the remaining quarters. In 2019, the Company paid dividends of $217 million and made a $203 million in 2016. In 2017payment relating to the Company repurchased common shares amounting to $157 million. In 2018, the Company capitalized Veoneer with $972 million prior to spin-off.EC antitrust investigation. INCOME TAXES The Company has reserves for taxes that may become payable in future periods as a result of tax audits. At any given time, the Company is undergoing tax audits covering multiple years in several tax jurisdictions. Ultimate outcomes are uncertain but could, in future periods,
have a significant impact on the Company’s cash flows. See discussions of income taxes under Significant Accounting Policies in this section, Note 2 and Note 6 to the Consolidated Financial Statements included herein.
PENSION ARRANGEMENTS The Company has defined benefit pension plans covering nearly half of the U.S. employees. In a prior year, the Company froze participation in the U.S. plans to exclude employees hired after December 31, 2003. Many of the Company’s non-U.S. employees are also covered by pension arrangements. At December 31, 2018,2020, the Company’s pension liability (i.e. the actual funded status) for its U.S. and non-U.S. plans was $198$248 million compared to $207$240 million one year earlier. The plans had a net unamortized actuarial loss of $82$107 million recorded in Accumulated Other Comprehensive (Loss) Income in the Consolidated Statement of Equity at December 31, 2018,2020, compared to $92$115 million at December 31, 2017.2019. The decrease in the actuarial loss was mainly due to increasea decrease in the discount rate for the U.S. plans. The amortization of this loss is expected to be $2$4 million in 2019.2021. The liability decreaseincrease in 20182020 of $9$8 million was mainly due to the increasedecrease in discount rates, partly offset by lower than expected plan assets return. settlement in US.The liability decreaseincrease in 20172019 of $12$42 million was mainly due to the curtailment impact of the plan freeze in the U.S., partly offset by a decrease in the discount rate for many of the plans and foreign currency translation effects of the non-U.S. plans.rates. Pension expense associated with the defined benefit plans was $20$33 million in 2018, $292020 and $27 million in 2017 and $24 million in 20162019, and is expected to be $26$20 million in 2019.2021. The decrease$6 million increase in 2020 pension expense in 2018 of $9 million was mainly due to lower amortization of the unrecognized losses resulting from the amendment of the U.S. defined benefit plan.plan settlement in US. The increase in pension expense in 20172019 of $5$7 million was mainly due to a prior year decrease in discount rates. The Company contributed $16$26 million to its defined benefit plans in 2018, $132020 and $17 million in 2017 and $13 million in 2016.2019. The Company expects to contribute $14$21 million to these plans in 20192021 and is currently projecting a yearly funding at approximately the same level in the subsequent years. For further information about retirement plans see Note 2019 to the Consolidated Financial Statements included herein. SHAREHOLDER RETURNS Total cash dividends paid were $214$54 million in 2018, $2092020 and $217 million in 2017 and $203 million in 2016.2019. The Company has raisedcancelled its dividends from the dividend from 54 cents per share in 2015second quarter 2020 due to 62 cents per share in 2018 (see following table).the COVID-19 pandemic. The Board of Directors has declared ano dividend of 62 cents per share for both the first quarter and 62 cents per share for the second quarter of 2019. The annualized dividend amount of $216 million, is based on 62 cents per share and the number of shares outstanding at December 31, 2018. The Company did not repurchase any shares during 2018. During the second quarter of 2017, the Company repurchased 1.4 million shares for cash of $157 million, including commissions. There were no share repurchases in 2016. In total, Autoliv has repurchased 44.5 million shares between May 2000 and December 2018 for cash of $2,498 million, including commissions. The maximum number of shares that are available to be purchased under the stock repurchase program at December 31, 2018 is 3.0 million. There is no expiration date for the share repurchase authorization in order to provide management flexibility in the Company’s share repurchases. For further information see Note 15 to the Consolidated Financial Statements included herein.
DIVIDENDS PAID | | 2015 | | | 2016 | | | 2017 | | | 2018 | | | 2019 | | | 1st Quarter | | $ | 0.54 | | | $ | 0.56 | | | $ | 0.58 | | | $ | 0.60 | | | $ | 0.62 | | 1) | 2nd Quarter | | | 0.56 | | | | 0.58 | | | | 0.60 | | | | 0.62 | | | | 0.62 | | 1) | 3rd Quarter | | | 0.56 | | | | 0.58 | | | | 0.60 | | | | 0.62 | | | | | | | 4th Quarter | | | 0.56 | | | | 0.58 | | | | 0.60 | | | | 0.62 | | | | | | |
2021. EQUITY During 2018,2020, total equity decreasedincreased by 54.5% or $2,273$301 million to $1,897$2,423 million. This was mainly due to $2,123 million related to the spin-off of Venoeer, $217$188 million in dividendsnet income and $150 million currency translation effects. The decrease was partly offset by $184$97 million from net income.positive foreign exchange effects. During 2017,2019, total equity increased by 6.2% or $243$226 million to $4,169$2,122 million. This was mainly due to a net income of $303$463 million, positive foreign currency translation adjustments of $272 million, $24 million due to changes in pension liabilities and a $19 million increase from stock based compensation. These effects were partly offset by $210$217 million for dividends and share repurchases of $157 million.to shareholders. IMPACT OF INFLATION AND RAW MATERIAL PRICES Inflation has generallygenerally not had a significant impact on the Company’s financial position or results of operations. In many growth markets, inflation is relatively high, especially labor inflation. We have managed to offset this negative effect mainly by labor productivity improvements. However,We are continuously looking at efficiency improvements, however no assurance can be given that this will continue to be possible going forward. The Company has experienced headwind intailwind from raw material prices since 2017.
in 2020. COVID-19 caused raw material market prices to decrease in first half of 2020, followed by a surge in prices in the second half of 2020. This surge was connected to the ramp-up in the automotive industry during the second half of 2020. Due to the nature of Autoliv’s raw material contracts with certain suppliers, this results in a time lag for raw material price impacts for certain raw materials. Therefore, Autoliv has not yet experienced the full impact of the raw material price increases that began in the second half of 2020. PERSONNEL During the past three years, totalTotal headcount (permanent employees and temporary personnel) has risen by 11%4.6% from the beginning of 20162019 to 66,76468,200 at the end of 2018.2020. This reflects the reboundstrong order intake we have recognized in the cyclical automotive business as well as the combined effect of long-term growth of global LVP, strong demand for safer vehicles, technology development and Autoliv’s market share gains,past years, which all drive the need for additional manufacturing and R,D&E personnel.manufacturing.
During 2018,2020, headcount increased by 2,2143,000 people, compared to 1,035the 1,500 decrease during 2019. During 2020, indirect headcount decreased by 800 people during 2017. During 2016, headcount increased by 3,507 people. No acquisitions duringor 4.5%, mostly related to the periods have affected the number of employees.structural efficiency programs. At the end of 2018, 80%2020, 82% of total headcount was in BCCBest Cost Country compared to 78%81% at the beginningend of 2017.2019. Furthermore, 71%74% of total headcount at December 31, 20182020 was direct workers in manufacturing compared to 75%71% at the beginningend of 2016,2019, while 14%11% of total headcount at December 31, 20182020 were temporary employees, compared to 15%10% at the beginningend of 2016.2019.
Compensation to directors and executive officers is reported, as is customary for U.S. public companies, in Autoliv’s proxy statement, which will be available to shareholders in March 2019.2021. Treasury Activities CREDIT ARRANGEMENTS In December 2020, the Company repaid the €100 million of 18-month floating rate notes under its EMTN program. It was originally issued in June 2019 and carried a coupon of 3M Euribor +0.50%. In June 2020, the Company repaid its 3-year loan from Swedish Export Credit Corporation of SEK 1,200 million in advance which carried a floating interest rate of 3M STIBOR +0.54%. At the same time, the Company utilized its new SEK 6,000 million facility with Swedish Export Credit Corporation which was signed in May 2020. The SEK 6,000 million facility was utilized in two different loans. One SEK 3,000 million loan maturing in 2022 carrying a floating interest rate of 3M STIBOR +1,35% and one SEK 3,000 million loan maturing in 2025 carrying a floating interest rate of 3M STIBOR +1,85%. In June 2018, the Company priced and issued 5-year notes for a total of €500 million in the Eurobond market. The notes carry a coupon of 0.75%. In July 2016, the Company refinanced its existing revolving credit facility (RCF) of $1,100 million. The facility, syndicated among 14 banks, originally maturing in July 2021 with two extension options, each for an additional year. The extension options have been used by the Company and the maturity date for the facility has been extended to July 2023. The Company pays a commitment fee on the undrawn amount of 0.08%0.1%, representing 35% of the applicable margin, which is 0.225%0.375% (given the Company’s rating of “A-”“BBB” from S&P Global Ratings at December 31, 2018))May 28, 2020).Borrowings under the facility are unsecured and bear interest based on the relevant LIBOR or IBOR rate. At December 31, 2018,2020, the Company’s unutilized long-term credit facilities were $1.1 billion,$1,100 million, represented by the RCF. This facility is not subject to any financial covenants nor is any other substantial financing of Autoliv. The Company had a net debt position (see section Non-U.S. GAAP Performance Measures) at year end 2018December 31, 2020 and 20172019 of $1,619$1,214 million and $368$1,650 million, respectively. In 2014, the Company issued and sold $1.25 billion of long-term debt securities in a U.S. Private Placement pursuant to a Note Purchase and Guaranty Agreement dated April 23, 2014, by and among Autoliv ASP Inc., the Company and the purchasers listed therein. As of December 31, 2020, $1,042 million remains outstanding from the 2014 issuance. See Note 12 to the Consolidated Financial Statements included herein for additional information. During 20182020 and 2017,2019, the Company sold receivables and discounted notes related to selected customers. These factoring arrangements increase cash while reducing accounts receivable and customer risks. At December 31, 2018,2020, the Company had received $193$161 million for sold receivables without recourse and discounted notes with a discount cost of $6$3 million during the year, compared to $134$163 million at year end 2017December 31, 2019 with a discount cost of $3 million recorded in Other non-operating items, net. Autoliv has aIn May 2020,Autoliv’s long-term credit rating was downgraded from Standard and Poor’s of A- which is in lineBBB+ to BBB by S&P Global Ratings with stable outlook on the Company’s objective of maintainingrating. The company aims to maintain a strong investment grade credit rating.
NUMBER OF SHARES At December 31, 2018, 87.12020, 87.4 million shares were outstanding (net of 15.715.4 million treasury shares), a 0.2% increase from 87.087.2 million one year earlier. The number of shares outstanding is expected to increase by 0.40.5 million when all Restricted Stock Units (RSU) and Performance Shares (PSs) vest and if all stock options (SOs) to key employees are exercised, see Note 17 to the Consolidated Financial Statements included herein. In total, Autoliv has repurchased 44.5 million shares under its stock repurchase program between May 2000 and December 20172020 for cash of $2,498 million, including commissions. The average cost per share for all repurchased shares to date is $56.13. Purchases can be made from time to time as market and business conditions warrant in open market, negotiated or block transactions. There is no expiration date for the repurchase program in order to provide management flexibility in the Company’s share repurchases. No stock repurchases were made in 2018.
2020. Contractual Obligations and Commitments AGGREGATE CONTRACTUAL OBLIGATIONS1) | | Payments due by Period | | | Payments due by Period | | (DOLLARS IN MILLIONS) | | Total | | | Less than 1 year | | | 1-3 years | | | 3-5 years | | | More than 5 years | | | Total | | | Less than 1 year | | | 1-3 years | | | 3-5 years | | | More than 5 years | | Debt obligations | | $ | 2,235 | | | $ | 621 | | | $ | 275 | | | $ | 573 | | | $ | 767 | | | $ | 2,387 | | | $ | 275 | | | $ | 979 | | | $ | 663 | | | $ | 470 | | Fixed-interest obligations | | | 285 | | | | 50 | | | | 87 | | | | 72 | | | | 75 | | | | 212 | | | | 48 | | | | 80 | | | | 50 | | | | 34 | | Operating lease obligations | | | 186 | | | | 42 | | | | 65 | | | | 46 | | | | 33 | | | | 150 | | | | 38 | | | | 53 | | | | 29 | | | | 30 | | Pension contribution requirements2) | | | 14 | | | | 14 | | | | - | | | | - | | | | - | | | | 21 | | | | 21 | | | | — | | | | — | | | | — | | Other non-current liabilities reflected on the balance sheet | | | 8 | | | | - | | | | - | | | | - | | | | 8 | | | | 11 | | | | — | | | | 2 | | | | 1 | | | | 8 | | Total | | $ | 2,728 | | | $ | 727 | | | $ | 427 | | | $ | 691 | | | $ | 883 | | | $ | 2,781 | | | $ | 382 | | | $ | 1,114 | | | $ | 743 | | | $ | 542 | |
1) | Excludes contingent liabilities arising from litigation, arbitration, regulatory actions or income taxes. |
2) | Expected contributions for funded and unfunded defined benefit plans exclude payments beyond 2019.2020. |
Contractual obligations include debt, lease and purchase obligations that are enforceable and legally binding on the Company. Non-controlling interest and restructuring obligations are not included in this table. The major employee obligations as a result of restructuring are disclosed in Note 12 to Consolidated Financial Statements included herein. Debt obligations: For material contractual provisions, see Note 14 to the Consolidated Financial Statements included herein. Fixed-interest obligations: These obligations include interest on debt and credit agreements relating to periods after December 31, 2018,2020, excluding fees on the revolving credit facility and interest on debts with no defined amortization plan. Operating lease obligations: These obligations represent the payment obligations (undiscounted cash flows) under leases classified as operating leases. The Company leases certain offices, manufacturing and research buildings, machinery, automobiles, and data processing and other equipment. Such operating leases, some of which are non-cancelable and include renewals, expire on various dates. Capital lease obligations are not material. See Note 194 to the Consolidated Financial Statements included herein. Unconditional purchase obligations: There are no unconditional purchase obligations other than short-term obligations related to inventory, services, tooling, and property, plant and equipment purchased in the ordinary course of business. Purchase agreements with suppliers entered into in the ordinary course of business do not generally include fixed quantities. Quantities and delivery dates are established in “call off plans” accessible electronically for all customers and suppliers involved. Communicated “call off plans” for production material from suppliers are normally reflected in equivalent commitments from Autoliv customers. Pension contribution requirements: The Company sponsors defined benefit plans that cover a significant portion of our U.S. employees and certain non-U.S. employees. The pension plans in the U.S. are funded in conformity with the minimum funding requirements of the Pension Protection Act of 2006. Funding for our pension plans in other countries is based upon plan provisions, actuarial recommendations and/or statutory requirements. In 2019,2021, the expected contribution to all plans, including direct payments to retirees, is $14$21 million, of which the major contribution is $7$13 million for our U.S. pension plans. Due to volatility associated with future changes in interest rates and plan asset returns, the Company cannot predict with reasonable reliability the timing and amounts of future funding requirements, and therefore the above excludes payments beyond 2019.2021. We may elect to make contributions in excess of the minimum funding requirements for the U.S. plans in response to investment performance and changes in interest rates, or when we believe that it is financially advantageous to do so and based on other capital requirements. Excluded from the above are expected contributions of $0.4 million due in 2019 with respect to our other post-employment benefit (OPEB) plans, which represent the expected benefit payments to participants as costs are incurred. See Note 2019 to the Consolidated Financial Statements included herein.
Other non-current liabilities reflected on the balance sheet: These consist mainly of local governmental liabilities. OFF-BALANCE SHEET ARRANGEMENTS The Company does not have any off-balance sheet arrangements that have, or are reasonably likely to have, a material current or future effect on its financial position, results of operations or cash flows. Risks and Risk Management The Company is exposed to several categories of risks. They can broadly be categorized as operational risks, strategic risks and financial risks. Some of the major risks in each category are described below. There are also other risks that could have a material effect on the Company’s results and financial position, and the description below is not complete but should be read in conjunction with the discussion of risks described in Item 1A above, which contains a description of our material risks.
As described below, the Company has taken several mitigating actions, applied numerous strategies, adopted policies, and introduced control and reporting systems to reduce and mitigate these risks. In addition, the Company from time to time identifies and evaluates emerging or changing risks to the Company in order to ensure that identified risks and related risk management are updated in this fast movingfast-moving environment. Operational Risks LIGHT VEHICLE PRODUCTION Around 30% of Autoliv’s costs are fixed; therefore, short-term earnings are dependent on sales volumes and highly dependent on capacity utilization in the Company’s plants.
Global LVP is an indicator of the Company’s sales development. Ultimately, however, sales are determined by the production levels for the individual vehicle models for which Autoliv is a supplier (see Dependence on Customers). The Company’s sales are split over several hundred contracts covering approximately 1,300almost 1,200 vehicle models, thismodels. This moderates the effect of changes in vehicle demand of individual countries and regions as well as production issues. The risk of fluctuating sales has also been mitigated by Autoliv’s rapid expansion in Asia and other growth markets, which has reduced the Company’s former high dependence on sales in Europe to a diversified mix with Europe, the Americas and Asia each accounting for roughly 30% to 40% of our 20182020 total sales. It is the Company’s strategy to reduce the risk of fluctuating LVP by using a high number of temporary employees instead of permanent employees in direct production. During 2018, 20172020 and 2016,2019, the level of temporary employees in relation to total headcount in direct production was 17%, 15%13% and 15%11%, respectively. To reduce the potential impact of unusual fluctuations in the production of vehicle models supplied by the Company such as during the financial crisis of 2008 and 2009 and the Covid-19 pandemic in 2020– it is also necessary for the Company to be prepared to quickly adapt the level of permanent employees as well as fixed cost production capacity.
PRICING PRESSURE Pricing pressure from customers is an inherent part of the automotive components business. The extent of price reductions varies from year to year and takes the form of one time give backs, reductions in direct sales prices or discounted reimbursements for engineering work. In response, Autoliv is continuously engaged in efforts to reduce costs and to provide customers added value by developing new products. Generally, the speed by which these cost-reduction programs generate results will, to a large extent, determine the future profitability of the Company. The various cost-reduction programs are, to a considerable extent, interrelated. This interrelationship makes it difficult to isolate the impact of costs on any single program, therefore, we monitor key measures such as costs in relation to sales and productivity. COMPONENT COSTS Changes in component costs and raw material prices could have a major impact on our margins, since theThe cost of direct materials was approximately 50%50% of sales in 2018.2020.
The main raw materials the Company requiresbeing used as input material for itsAutoliv operations are steel, textiles, plastic steel and non-ferrous metals. Worsening headwinds on raw materials in 2018 were primarily caused by additionalmetals. We still see effects coming from the import tariffs imposed by the United States and other countries, on steel and aluminum products, otherproducts. These import tariffs and escalating trade conflictsare impacting the raw material marketsmarket and creating uncertainty.pricing and availability uncertainties. We take several actions to mitigate higher raw material prices,price increases, such as competitive sourcing and looking forexploring alternative materials. However, should these actions not be sufficient to offset component price increases, our earnings could be materially impacted. LEGAL The Company is involved from time to time in regulatory, commercial and contractual legal proceedings that may be significant, and the Company’s business may suffer as a result of adverse outcomes of current or future legal proceedings. These claims may include, without limitation, commercial or contractual disputes, including disputes with the Company’s suppliers and customers, intellectual property matters, alleged violations of laws, rules or regulations, governmental investigations, personal injury claims, product liability claims, environmental issues, tax and customs matters, and employment matters. The Company is currently subject to an ongoing antitrust investigation by the European Commission, as well as civil litigation alleging anti-competitive conduct related to antitrust investigations concluded in various other jurisdictions. Regulatory actions and government investigations, such as these antitrust matters, may seek to impose significant fines and or limit the Company’s operations. It is difficult for the Company to predict the possibility that such proceedings are initiated, and their ultimate outcome and duration. The EC previously concluded a discrete portion of its investigation in November 2017 and imposed a fine on the Company. In December 2018, we accrued $210 million based on our belief that the EC will seek to impose a fine in connection with the remaining portion of the EC’s investigation.
A substantial legal liability or adverse regulatory outcome and the substantial cost to defend the litigation or regulatory proceedings may have an adverse effect on the Company’s business, operating results, financial condition, cash flows and reputation.
No assurances can be given that such proceedings and claims will not have a material adverse impact on the Company’s profitability and consolidated financial position, or that reserves or insurance will mitigate such impact. See Note 18 to the Consolidated Financial Statements included herein and Item 3 – Legal Proceedings.
PRODUCT WARRANTY AND RECALLS If our products are alleged to fail to perform as expected or are defective, the Company may be exposed to various claims for damages and compensation. Such claims may result in costs and other losses to the Company even where the relevant product is eventually found to have functioned properly. If a product (actually or allegedly) fails to perform as expected or is defective, we may face warranty and recall claims. If such actual or alleged failure or defect results, or is alleged to result, in bodily injury and/or property damage, we may also face product liability and other claims. The Company may experience material warranty, recall, product or other liability claims or losses in the future, and the Company may incur significant cost to defend against such claims. The Company may be required to participate in a recall involving its products. Each vehicle manufacturer has its own practices regarding product recalls and other product liability actions relating to its suppliers. Government safety regulators also have policies and practices with respect to recalls. As suppliers become more integrally involved in the vehicle design process and assume more of the vehicle assembly functions, vehicle manufacturers are increasingly looking to their suppliers for contribution when faced with recalls and product liability claims. In addition, with global platforms and procedures, vehicle manufacturers are increasingly evaluating our quality performance on a global basis. Any one or more quality, warranty or other recall issue(s), including the ones affecting few units and/or having a small financial impact, may cause a vehicle manufacturer to implement measures which may have a severe impact on the Company’s operations, such as a temporary or prolonged suspension of new orders or the Company’s ability to bid for new business. In addition, over time, there is a risk that the number of vehicles affected by a failure or defect will increase significantly (as would the Company’s costs), since our products often use global designs and are increasingly based on or utilize the same or similar parts, components or solutions. Although quality has always been a central focus in the automotive industry, especially for safety products, our customers and regulators have become increasingly attentive to quality with even less tolerance for any deviations, which has resulted in an increase in the number of automotive recalls. This trend is likely to continue as automobile manufacturers introduce even stricter quality requirements and regulating agencies and other authorities increase the level of scrutiny given to vehicle safety issues. A warranty recall or a product liability claim brought against the Company in excess of the Company’s insurance may have a material adverse effect on its business and/or financial results. Vehicle manufacturers are also increasingly requiring their external suppliers to guarantee or warrant their products and bear the costs of repair and replacement of such products under new vehicle warranties. A vehicle manufacturer may attempt to hold the Company responsible for some or all of the repair or replacement costs of defective products under new vehicle warranties when the product supplied did not perform as represented. Additionally, a customer may not allow us to bid for expiring or new business until certain remedial steps have been taken. Accordingly, the future costs of warranty claims by the Company’s customers may be material. The Company’s warranty reserves are based upon management’s best estimates of amounts necessary to settle future and existing claims. Management regularly evaluates the appropriateness of these reserves and adjusts them when we believe it is appropriate to do so. However, the final amounts determined to be due could differ materially from the Company’s recorded estimates. We believe our established reserves are adequate to cover potential warranty settlements typically seen in our business. The Company’s strategy is to follow a stringent procedure when developing new products and technologies and to apply a proactive “zero-defect” quality policy (see section Quality Management). In addition, the Company carriesmaintains a program of insurance, which may include commercial insurance, self-insurance, or a combination of both approaches, for potential recall and product liability claims at coverage levelsin amounts and on terms that managementit believes are generally sufficient to cover the risksreasonable and prudent based on the Company’sour prior claims experience. However, such insurance may not be sufficient to cover every possible claim that can arise in the Company’s businesses, now or in the future, or may not always will be available should the Company, now or in the future, wish to extend, renew, increase or otherwise adjust such insurance. In recent years, the cost of recall and product liability insurance as well as the Company’s level of self-insurance and deductibles has increased. Management’s decision regarding what insurance to procure is also impacted by the cost for such insurance. As a result, the Company may face material losses in excess of the insurance coverage procured. A substantial recall or liability in excess of coverage levels could therefore have a material adverse effect on the Company. ENVIRONMENTAL Most of the Company’s manufacturing processes consist of the assembly of components. As a result, the environmental impact from the Company’s plants is generally modest. While the Company’s businesses from time to time are subject to environmental investigations, there are no material environmental-related cases pending against the Company. Therefore, Autoliv does not incur (or expect to incur) any material costs or capital expenditures associated with maintaining facilities compliant with U.S. or non-U.S. environmental requirements. To reduce environmental risk, the Company has implemented an environmental management system in all plants globally and has adopted an environmental policy (see corporate website www.autoliv.com). Autoliv is subject to a number of environmental and occupational health and safety laws and regulations. Such requirements are complex and are generally becoming more stringent over time. There can be no assurance that these requirements will not change in the future, or that we will at all times be in compliance with all such requirements and regulations, despite our intention to be. The Company may also find itself subject, possibly due to changes in legislation or other regulation, to environmental liabilities based on the activities of its predecessor entities or of businesses acquired. Such liability could be based on activities which are not related to the Company’s current activities. TRADE
TRADE Autoliv is subject to various international trade regulations and regimes and changes in these regimes could lead to increased compliance costs and costs of raw materials and other components. In addition, political conditions leading to trade conflicts and the imposition of tariffs or other trade barriers between countries in which we do business could increase our costs of doing business. Strategic Risks REGULATIONS In addition to vehicle production, the Company’s market is driven by the safety content per vehicle, which is affected by new regulations and new vehicle rating programs, in addition to consumer demand for new safety technologies. The most important regulations are the seatbelt installation laws that exist in all vehicle-producing countries. Many countries also have strict enforcement laws on the wearing of seatbelts. Another significant vehicle safety regulation is the U.S. federal law that, since 1997, requires frontal airbags for both the driver and the front-seat passenger in all new vehicles sold in the U.S. In 2007, the U.S. adopted new regulations for side-impacthead impact and enhanced thorax protection in side impact crashes, which now have been fully phased-in. China introduced a vehicle rating program in 2006, and Latin America introduced a similar program in 2010 followed by ASEAN NCAP in Southeast Asia in 2011.2011, and Global NCAP that is rating vehicles sold in emerging markets (like India). The United States upgraded its vehicle rating program in 2010 and Europe upgraded the Euro NCAP rating system during 2018. Euro NCAP has already initiated the next upgrade, which will be fully implemented by 2025. Japan and South Korea are continuously upgrading their respective vehicle rating programs, JCAPJNCAP and KNCAP respectively. India requires frontal airbags for the driver from July 2019, and will require passenger airbags from 2021 for all new passenger vehicles (M1). Vehicles with automated driving systems (ADS) are expected to provide additional opportunities through integration of protective safety systems with ADAS technologies, as well as new vehicle interior layouts and seating configurations. There are also other plans for improved automotive safety, both in these countries and many other countriesothers that could affect the Company’s market. However, there can be no assurance that changes in regulations will not adversely affect the demand for the Company’s products or, at least, result in a slower increase in the demand for them. DEPENDENCE ON CUSTOMERS In 2018,2020, the five largest vehicle manufacturers accounted for 49%around 51% of global LVP and the ten largest manufacturers for 74%around 75%. As a result of this highly consolidated market, the Company is dependent on a relatively small number of customers with strong purchasing power. In 2018,2020, the Company’s five largest customers accounted for 50%around 53% of revenues and the ten largest customers for 79%around 81% of revenues. For a list of the largest customers, see Note 2221 Segment Information to the Consolidated Financial Statements included herein. Our largest customer contract accounted for around 2% of sales in 2018.2020. Although business with every major customer is split into at least several contracts (usually one contract per vehicle platform) and although the customer base has become more balanced and diversified as a result of Autoliv’s significant expansion in China and other rapidly-growing markets, the loss of all business from a major customer (whether by a cancellation of existing contracts or not awarding Autoliv new business), the consolidation of one or more major customers or a bankruptcy of a major customer could have a material adverse effect on the Company. In addition, a quality issue, shortcomings in our service to a customer or uncompetitive prices or products could result in the customer not awarding us new business, which will gradually have a negative impact on our sales when current contracts start to expire. CUSTOMER PAYMENT RISK Another risk related to our customers is the risk that one or more of our customers will be unable to pay their invoices that become due. We seek to limit this customer payment risk by invoicing our major customers through their local subsidiaries in each country, even for global contracts. By invoicing this way, we attempt to avoid having the receivables with a multinational customer group exposed to the risk that a bankruptcy or similar event in one country would put all receivables with such customer group at risk. In each country, we also monitor invoices becoming overdue. Even so, if a major customer is unable to fulfill its payment obligations, it is likely that we would be forced to record a substantial loss on such receivables.
DEPENDENCE ON SUPPLIERS Autoliv at each stage of production, relies on internal and/or external suppliers in order to meet its delivery commitments.commitments to the customers. In some cases, suppliers are dictated by the customers based on very specific qualification requirements. In other situations, the Company is dependent on a single supplier for a specific component. Supply chain management works to review and mitigate these risks in the supply base. There is a natural risk that disruptions in theAutoliv supply chain could lead to the Company not being able to meet its delivery commitmentsorganization is reviewing sourcing risks and as a consequence, could lead to additional costs. The Company’s strategyactively working on mitigating related supply chain risks.
Autoliv’s ambition is to reduce these supplier risks by seeking to maintain an optimal number of suppliers in all significant component technologies, by standardization and by developing alternative suppliers around the world. However, for various reasons including costs involved in maintaining alternative suppliers, this is not always possible.
technologies. NEW COMPETITION Increased competition may result in price reductions, reduced margins and our inability to gain or hold market share. OEMs rigorously evaluate suppliers on the basis of product quality, price, reliability and delivery as well as engineering capabilities, technical expertise, product innovation, financial viability, application of lean principles, operational flexibility, customer service and overall management. To maintain our competitiveness and position as a market leader, it is important to focus on all of these aspects of supplier evaluation and selection. Although the market for occupant restraint systems has undergone a significant consolidation during the past ten years, the passive safety market remains very competitive. It cannot be excluded that additional competitors, both global and local, will seek to enter the market or grow beyond their current Keiretsu group or traditional customer base. Particularly in China, South Korea and Japan there are numerous small domestic competitors often supplying just one OEM group.group PATENTS AND PROPRIETARY TECHNOLOGY The Company’s strategy is to protect its innovations with patents, and to vigorously protect and defend its patents, trademarks and know-how against infringement and unauthorized use. At the end of 2018,2020, the Company held close to 6,050 patents.more than 6,300 patents and patents applications. These patents expire on various dates during the period from 20192021 to 2038.2040. The expiration of any single patent is not expected to have a material adverse effect on the Company’s financial results. Although the Company believes that its products and technology do not infringe upon the proprietary rights of others, there can be no assurance that third parties will not assert infringement claims against the Company in the future. Also, there can be no assurance that any patent now owned by the Company will afford protection against competitors that develop similar technology. As the Company continues to expand its products and expand into new businesses, it will increase its exposure to intellectual property claims. Financial Risks The Company is exposed to financial risks through its operations. To reduce the financial risks and to take advantage of economies of scale, the Company has a central treasury department supporting operations and management. The treasury department handles external financial transactions and functions as the Company’s in-house bank for its subsidiaries. The Board of Directors monitors compliance with the financial risk policy on an on-going basis. For information about specific financial risks, see Item 7A – Quantitative and Qualitative Disclosures about Market Risk. Significant Accounting Policies and Critical Accounting Estimates NEW ACCOUNTING STANDARDS The Company has considered all applicable recently issued accounting standards. The Company has summarized in Note 2 to the Consolidated Financial Statements each of the recently issued accounting standards and stated the impact or whether management is continuing to assess the impact. See Note 2 to The Company adopted the Consolidated Financial Statements included hereinnew standard for additional information.measurement of credit losses (Topic 326) on January 1, 2020. The adoption did not have a material impact on the consolidated financial statements. APPLICATION OF CRITICAL ACCOUNTING POLICIES The Company’s significant accounting policies are disclosed in Note 2 to the Consolidated Financial Statements included herein. Senior management has discussed the development and selection of critical accounting estimates and disclosures with the Audit Committee of the Board of Directors. The application of accounting policies necessarily requires judgments and the use of estimates by a Company’s management. Actual results could differ from these estimates. By their nature, these judgments are subject to an inherent degree of uncertainty. These judgments are based on our historical experience, terms of existing contracts, and management’s evaluation of trends in the industry, information provided by our customers and information available from other outside sources, as appropriate. The Company considers an accounting estimate to be critical if: | • | It requires management to make assumptions about matters that were uncertain at the time of the estimate, and |
It requires management to make assumptions about matters that were uncertain at the time of the estimate, and
| • | Changes in the estimate or different estimates that could have been selected would have had a material impact on our financial condition or results of operations. The accounting estimates that require management’s most significant judgments |
Changes in the estimate or different estimates that could have been selected would have had a material impact on our financial condition or results of operations. The accounting estimates that require management’s most significant judgments include the estimation of retroactive price adjustments, estimations associated with purchase price allocations regarding business combinations, assessment of recoverability of goodwill and intangible assets, estimation of pension benefit obligations based on actuarial assumptions, estimation of accruals for warranty and product liabilities, restructuring charges, uncertain tax positions, valuation allowances and legal proceedings.
| | include the estimation of variable considerations, estimations associated with purchase price allocations regarding business combinations, assessment of recoverability of goodwill and intangible assets, estimation of pension benefit obligations based on actuarial assumptions, estimation of accruals for warranty and recalls , restructuring charges, uncertain tax positions, valuation allowances and legal proceedings. |
The Company has summarized its critical accounting policies requiring judgment below. These might change over time based on the current facts and circumstances.
REVENUE RECOGNITION In accordance with ASC 606, Revenue from Contracts with Customers, revenue is measured based on consideration specified in a contract with a customer, adjusted for any variable consideration (i.e. price concessions or annual price adjustments)concessions) and estimated at contract inception. The estimated amount of variable consideration that will be received by the Company are based on historical experience and trends, management´s understanding of the status of negotiations with customers and anticipated future pricing strategies. The Company recognizes revenue when it satisfies a performance obligation by transferring control over a product to a customer. In addition, from time to time, Autolivthe Company may make payments to customers in connection with ongoing and future business. These payments to customers are generally recognized as a reduction to revenue at the time of the commitment to make these payments unless the payment concession can be clearly linked to the future business award. If the payments are capitalized, the amounts are amortized to revenue as the related goods are transferred. INVENTORY RESERVES Inventories are evaluated based on individual or, in some cases, groups of inventory items. Reserves are established to reduce the value of inventories to the lower of cost andor net realizable value. Net realizable value is the estimated selling prices in the ordinary course of business, less reasonably predictable costs of completion, disposal and transportation. Excess inventories are quantities of items that exceed anticipated sales or usage for a reasonable period. The Company has guidelines for calculating provisions for excess inventories based on the number of months of inventories on hand compared to anticipated sales or usage. Management uses its judgment to forecast sales or usage and to determine what constitutes a reasonable period. There can be no assurance that the amount ultimately realized for inventories will not be materially different than that assumed in the calculation of the reserves. GOODWILL The Company performs an annual impairment reviewtest of goodwill in the fourth quarter of each year following the Company’s annual forecasting process. Management used a qualitative assessment approach for 2018 goodwill impairment testing purposes. When evaluating whether it is more likely than not thatIn October 2020 the Company compared the fair value of a reporting unit is less thanits goodwill to its carrying amount, an entity shall assess relevant eventsvalue and circumstances. Examples of such events and circumstances include macroeconomic conditions, industry and market considerations, cost factors, overall financial performance etc. Management has used the following approach: | 1.
| Determine the starting point
|
| 2.
| Identify the most relevant drivers of fair value
|
| 3.
| Identify events and circumstances
|
| 4.
| Weight the identified factors
|
The Company had significant head room from its latest fair value assessment performed in 2017, which determined the starting point. The most relevant drivers of fair value for the Company is the expected future cash flows and the discount rate used. Considering the nature of the Company’s business with long production cycles and our strong credit rating as well as industry factors, management concluded that goodwill was not impaired.there were no impairments.
RECALL PROVISIONS AND WARRANTY OBLIGATIONS The Company records liabilities for product recalls when probable claims are identified and when it is possible to reasonably estimate costs. Recall costs are costs incurred when the customer decides to formally recall a product due to a known or suspected safety concern. Product recall costs typically includeare estimated based on the expected cost of replacing the product and the customer´s cost of carrying out the recall, which is affected by the number of vehicles subject to recall and the cost of the product being replaced as well as the customer’s cost of the recall, including labor and materials to remove and replace the defective part.product. In some cases, portions of the product recall costs are reimbursed by an insurance company. Actual costs incurred could differ from the amounts estimated, requiring adjustments to these reserves in future periods. It is possible that changes in our assumptions or future product recall issues could materially affect our financial position, results of operations or cash flows. Estimating warranty obligations requires the Company to forecast the resolution of existing claims and expected future claims on products sold. The Company bases the estimate on historical trends of units sold and payment amounts, combined with our current understanding of the status of existing claims and discussions with our customers. These estimates are re-evaluated on an ongoing basis. Actual warranty obligations could differ from the amounts estimated requiring adjustments to existing reserves in future periods. Due to the uncertainty and potential volatility of the factors contributing to developing these estimates, changes in our assumptions could materially affect our results of operations. RESTRUCTURING PROVISIONS The Company defines restructuring expense to include costs directly associated with capacity alignment programs, plus exit or disposal activities. Estimates of restructuring charges are based on information available at the time such charges are recorded. In general, management anticipates that restructuring activities will be completed within a time frame such that significant changes to the exit plan are not likely.
Due to inherent uncertainty involved in estimating restructuring expenses, actual amounts paid for such activities may differ from amounts initially estimated.
DEFINED BENEFIT PENSION PLANS The Company has defined benefit pension plans in eleven countries. The most significant plans exist in the U.S. These plans represent approximately 60% of the Company’s total pension benefit obligation. See Note 2019 to the Consolidated Financial Statements included herein. The Company, in consultation with its actuarial advisors, determines certain key assumptions to be used in calculating the projected benefit obligation and annual pension expense. For the U.S. plans, the assumptions used for calculating the 20182020 pension expense were a discount rate of 3.55%3.25%, expected rate of increase in compensation levels of 2.65%, and an expected long-term rate of return on plan assets of 7.08%5.05%. The assumptions used in calculating the U.S. benefit obligations disclosed as of December 31, 20182020 were a discount rate of 4.35%2.35% and an expected age-based rate of increase in compensation levels of 2.65%. The discount rate for the U.S. plans has been set based on the rates of return of high-quality fixed-income investments currently available at the measurement date and are expected to be available during the period the benefits will be paid. The expected rate of increase in compensation levels and long-term return on plan assets are determined based on a number of factors and must take into account long-term expectations and reflect the financial environment in the respective local markets. At December 31, 2018, 38%2020, 42% of the U.S. plan assets were invested in equities, which is in linein-line with the target of 40%. The table below illustrates the sensitivity of the U.S. net periodic benefit cost and projected U.S. benefit obligation to a 1pp change in the discount rate, decrease in return on plan assets and increase in compensation levels for the U.S. plans (in millions). The use of actuarial assumptions is an area of management’s estimate. | | | | 2018 net | | | 2018 projected | | | | | | | periodic benefit | | | benefit obligation | | | Assumption | | | | cost increase | | | increase | | | (in millions) | | Change | | (decrease) | | | (decrease) | | | Assumption (in millions) | | | Change | | 2020 net periodic benefit cost increase (decrease) | | | 2020 projected benefit obligation increase (decrease) | | Discount rate | | 1pp increase | | $ | (3 | ) | | $ | (51 | ) | | 1pp increase | | $ | (0 | ) | | $ | (40 | ) | Discount rate | | 1pp decrease | | $ | 7 | | | $ | 65 | | | 1pp decrease | | | 6 | | | | 49 | | Compensation levels | | 1pp increase | | $ | 0 | | | $ | 3 | | | 1pp increase | | | 0 | | | | 1 | | Return on plan assets | | 1pp decrease | | $ | 3 | | | n/a | | | 1pp decrease | | | 3 | | | n/a | |
INCOME TAXES Significant judgment is required in determining the worldwide provision for income taxes. In the ordinary course of a global business, there are many transactions for which the ultimate tax outcome is uncertain. Many of these uncertainties arise as a consequence of intercompany transactions. Although the Company believes that its tax return positions are supportable, no assurance can be given that the final outcome of these matters will not be materially different than that which is reflected in the historical income tax provisions and accruals. Such differences could have a material effect on the income tax provisions or benefits in the periods in which such determinations are made. The Tax Cuts and Jobs Act (the “Tax Act”) was enacted on December 22, 2017. The Tax Act makes broad and complex changes to the U.S. tax code, including reducing the U.S. federal corporate income tax rate from 35% to 21% for years beginning after December 31, 2017, requiring companies to pay a one-time transition tax on earnings of certain foreign subsidiaries that were previously deferred and created new taxes on certain foreign sourced earnings. See also the discussion of the Tax Actreserves for uncertain tax positions, and the determinations of valuation allowances on our deferred tax assets in Note 6, Income Taxes.
CONTINGENT LIABILITIES Various claims, lawsuits and proceedings are pending or threatened against the Company or its subsidiaries, covering a range of matters that arise in the ordinary course of its business activities with respect to commercial, product liability or other matters. The Company diligently defends itself in such matters and, in addition, carries insurance coverage to the extent reasonably available against insurable risks. The Company records liabilities for claims, lawsuits and proceedings when they are probable and it is possible to reasonably estimate the cost of such liabilities. Legal costs expected to be incurred in connection with a loss contingency are expensed as such costs are incurred. A loss contingency is accrued by a charge to income if it is probable that an asset has been impaired or a liability has been incurred and the amount of the loss can be reasonably estimated. In determining whether a loss should be accrued management evaluates, among other factors, the degree of probability of an unfavorable outcome and the ability to make a reasonable estimate of the amount of loss. Changes in these factors could materially impact our consolidated financial statements.
Item 7A. Quantitative and QualitativeQualitative Disclosures about Market Risk See also Note 2 to the Consolidated Financial Statements of this Annual Report included with this Form 10-K for information about how these risks are quantified. CURRENCY RISKS 1. Transaction Exposure and Revaluation effects Transaction exposure arises because the cost of a product originates in one currency and the product is sold in another currency. Revaluation effects come from valuation of assets denominated in other currencies than the reporting currency of each unit. The Company’s grossnet transaction exposure for 20182020 was approximately $2.9 billion. A part of the currency flows had counter-flows in the same currency pair, which reduced the net exposure to approximately $2.4$2.2 billion. The four largest net exposures are U.S. dollars (sell) against the Mexican Peso, Romanian Lei (buy) against the Euro, U.S. dollars (buy) against Korean Won, Turkish Lira (buy)USD (sell) against the Euro.Canadian dollar. Together these currencies accounted for approximately 39%50% of the Company’s net currency transaction exposure. Since the Company can only effectively hedge these currency flows in the short term, periodic hedging would only reduce the impact of fluctuations temporarily. Over time, periodic hedging would postpone but not reduce the impact of fluctuations. In addition, the net exposure is limited to only around one quarter of net sales and is made up of around 50 different currency pairs with exposures of more than of $1 million each. Autoliv generally does not hedge these flows. 2. Translation Exposure in the Income Statement and Balance Sheet Another effect of exchange rate fluctuations arises when the income statements of non-U.S. subsidiaries are translated into U.S. dollars. Outside the U.S., the Company’s most significant currency is the Euro. We estimate that 29% of the Company’s net sales will be denominated in Euro or other European currencies during 2018,2021, while approximately a quarter22% of net sales is estimated to be denominated in U.S. dollars. The Company estimates that a 1% increase in the value of the U.S. dollar versus European currencies will decrease reported U.S. dollar annual net sales in 20192021 by $27$25 million or by 0.3% while operating income for 20192021 will decline by approximately 0.3% or by about $3 million, assuming reported corporate average margin. The Company’s policy is not to hedge this type of translation exposure since there is no cash flow effect to hedge.exposure. A translation exposure also arises when the balance sheets of non-U.S. subsidiaries are translated into U.S. dollars. The policy of the Company is to finance major subsidiaries in the country’s local currency and to minimize the amounts held by subsidiaries in foreign currency accounts. Consequently, changes in currency rates relating to funding and foreign currency accounts normally have a small impact on the Company’s income. In 2020 and 2019, the impact from the Company’s currency exposure were not material. INTEREST RATE RISK Interest rate risk refers to the risk that interest rate changes will affect the Company’s borrowing costs. Autoliv’s interest rate risk policy states that the average interest rate fixing period should be minimum 1 year and maximum 5 years. At December 31, 2018,2020, the average interest rate fixing period for the Company’s outstanding debt was 4.02.4 years, and at December 31, 2019, the average interest rate fixing period for the Company’s outstanding debt was 3.4 years. Given the Company’s current capital structure, we estimate that a one-percentage point interest rate increase would reducedecrease net interest expense by approximately $3$4.2 million, both in 20192021 and 2020.2022. This is based on the capital structure at the end of 20182020 when the gross fixed-rate debt was $1,883$1,651 million while the Company had a net debt position of $1,619$1,214 million (see section Non-U.S. GAAP Performance Measures). Thus, a change in the interest rate environment would not have a notable impact on the Company’s interest expense. As of December 31, 2018,2020, the Company had $616$1,178 million in cash and cash equivalents of which the majority were subject to a floating interest rate. Taking the cash and cash equivalents of $616$1,178 million (which is primarily subject to floating interest rates) minus the portion of debt carrying floating interest rates, we estimated that a one-percentage point interest rate increase would decrease net interest expense by approximately $4.2 million, both in 2021 and 2022. Fixed interest rate debt is achieved both by issuing fixed rate notes and through interest rate swaps. The most notable debt carrying fixed interest rates is the $1.0 billion U.S. private placement notes issued in 2014 and in June 2018, the Company issued €500 million of 5-year notes in the Eurobond market, see Note 14 to the Consolidated Financial Statements included herein. Given the Company’s capital structure at December 31, 2019, we estimated that a one-percentage point interest rate increase would increase net interest expense by approximately $0.5 million. This was based on the capital structure at the end of 2019 when the gross fixed-rate debt was $1,598 million while the Company had a net debt position of $1,650 million. As of December 31, 2019, the Company had $445 million in cash and cash equivalents of which the majority were subject to a floating interest rate. Taking the cash and cash equivalents of $445 million (which is primarily subject to floating interest rates) minus the portion of debt carrying floating interest rates, we estimated that a one-percentage point interest rate increase would increase interest income and thereby reduce net interest expense by approximately $3 million, both in 2019 and 2020. Fixed interest rate debt is achieved both by issuing fixed rate notes and through interest rate swaps. The most notable debt carrying fixed interest rates is the $1.3 billion U.S. private placement notes issued in 2014 and in June 2018, the Company issued EUR 500 million of 5-year notes in the Eurobond market, see Note 14 to the Consolidated Financial Statements included herein.$0.5 million.
As the Company had more cash and cash equivalents at the end of 2020 of which the majority were subject to a floating interest rate, we estimated that a one-percentage point interest rate increase would decrease net interest expense. FINANCING RISK Financing risk refers to the risk that it will be difficult and/or expensive to finance new or existing debt to meet the financing needs of the Autoliv Group. The management of the financing risk ensures access to funding in a cost-efficient way by diversification of funding sources and debt maturities. Autoliv has diversified its long-term funding sources by issuing notes in the USPP and Eurobond markets, and by signing a long-term credit agreement with 14 banks. The Company also has a lending facility with the Swedish Export Credit Corporation. The Company also has established programs for short-term issuance of commercial paperspaper in the Swedish and US markets and short-term credit agreements, e.g. bank overdrafts and money market loans. To ensure diversification of debt maturities, no more than 20% of the Autoliv Group’s total debt may mature the next 12 months, unless such maturities (in excess of 20%) are covered by unutilized committed credit facilities with maturity in excess of 12 months. Per December 31, 2018, 28%2020, 13% corresponding to $621 million$302million of the Autoliv Group’s total debt had maturity less than 12 months. This amount was fully covered by unutilized committed credit facilities with maturity in excess of 12 months. CAPITAL STRUCTURE AND CREDIT RATING The overall objective relating to Autoliv’s target capital structure and credit rating is to provide the Company with sufficient flexibility to manage the inherent risks and cyclicality in Autoliv’s business and allow the Company to realize strategic opportunities and fund growth initiatives while creating shareholder value. Autoliv is committed to maintain a “strong investment grade credit rating”. As of December 31, 20182020, the Company had a long-term credit rating from S&P Global Ratings (“S&P”) of A-.BBB. The amount of interest-bearing debt held impacts the future financial flexibility as well as the credit rating. Management uses the non-U.S. GAAP measure “Leverage Ratio” to analyze the amount of debt the Company can incur under its debt policy. Management believes that this policy also provides guidance to credit and equity investors regarding the extent to which the Company would be prepared to leverage its operations. Autoliv’s long-term target for the leverage ratio (sum of net debt plus pension liabilities divided by EBITDA) is 1.0x with the aim to operate within the range of 0.5x to 1.5x. At December 31, 2018,2020, the leverage ratio (non-U.S. GAAP measure, see calculation table below) was 1.5x.1.8. For details and calculation of leverage ratio, refer to the table below. CALCULATION OF LEVERAGE RATIO (DOLLARS IN MILLIONS) | | December 31 2018 | | | December 31 2017 | | | December 31, 2020 | | | December 31, 2019 | | Net debt1) | | $ | 1,618.8 | | | $ | 368.4 | | | $ | 1,214.2 | | | $ | 1,649.8 | | Pension liabilities | | | 198.2 | | | | 206.8 | | | | 248.2 | | | | 240.2 | | Debt per the Policy | | | 1,817.0 | | | | 575.2 | | | | 1,462.4 | | | | 1,890.0 | | | | | | | | | | | | | | | | | | | Net income2) | | | 183.7 | | | | 303.0 | | | | 188.3 | | | | 462.8 | | Less; Net Loss, Discontinued Operations2) | | | 193.8 | | | | 285.0 | | | Net income, Continuing Operations2) | | | 377.5 | | | | 588.0 | | | Income taxes2) | | | 234.9 | | | | 204.4 | | | | 102.9 | | | | 185.6 | | Interest expense, net2, 3) | | | 59.2 | | | | 53.7 | | | Interest expense, net2,3) | | | | 68.4 | | | | 65.9 | | Depreciation and amortization of intangibles2) | | | 342.0 | | | | 307.0 | | | | 370.9 | | | | 350.6 | | Antitrust related matters2) | | | 212.0 | | | | 18.0 | | | EBITDA per the Policy | | $ | 1,225.6 | | | $ | 1,171.1 | | | Antitrust related matters and capacity alignments and separation costs2) | | | | 99.5 | | | | 48.6 | | EBITDA per the Policy (Adjusted EBITDA) | | | $ | 830.0 | | | $ | 1,113.5 | | Leverage ratio | | | 1.5 | | | | 0.5 | | | | 1.8 | | | | 1.7 | |
1) | Net debt is short- and long-term debt and debt-related derivatives less cash and cash equivalents (non-U.S. GAAP measure). |
3) | Interest expense, net is interest expense including cost for extinguishment of debt, if any, less interest income. |
CREDIT RISK IN FINANCIAL MARKETS Credit risk refers to the risk of a financial counterparty being unable to fulfill an agreed-upon obligation. In the Company’s financial operations, thiscredit risk arises when cash is deposited with banks and when entering into forward exchange agreements, swap contracts or other financial instruments. The policy of the Company is to work with banks that have a high credit rating and that participate in Autoliv’s financing.
To further reduce credit risk, deposits and financial instruments can only be entered into with core banks up to a calculated risk amount of $150 million per bank for banks rated A- or above and up to $50 million for banks rated BBB+. In addition, deposits can be made in U.S. and Swedish government short- termshort-term notes and certain AAA rated money market funds, as approved by the Company’s Board of Directors. At year-end 2018,2020, the Company held $1$392 million in AAA rated money market funds. IMPAIRMENT RISK Impairment risk refers to the risk that the Company will write down a material amount of its goodwill of close to $1.4 billion as of December 31, 2018.2020. This risk is assessed at least annually in the fourth quarter each year when the Company performs its impairment testing. In 2018,2020 the company performed a qualitative method has been used for determining whether therequantitative impairment testing by calculating the fair value of its goodwill. The estimated fair market value of goodwill is any impairment risk. Both historical datadetermined by the discounted cash flow method. The Company discounts projected operating cash flows using its weighted average cost of capital. Estimating the fair value requires the Company to make judgments about appropriate discount rates, growth rates, relevant comparable company earnings multiples and forecasts have been used to assess the impairment risk.amount and timing of expected future cash flows. It has been concluded that presently the Company is not “at risk” of failing the goodwill impairment test. However, there can be no assurance that goodwill will not be impaired due to future significant declines in LVP, due to our technologies or products becoming obsolete or for any other reason. We could also acquire companies where goodwill could turn out to be less resilient to deteriorations in external conditions. See also discussion under Goodwill and Intangible Assets in Note 2 and Note 11 to the Consolidated Financial Statements included herein. Item 8. Financial Statements and Supplementary Data The Consolidated Balance Sheets of Autoliv as of December 31, 20182020 and 20172019 and the Consolidated Statements of Net Income, Comprehensive Income, Cash Flows and Total Equity for each of the three years in the period ended December 31, 2018,2020, the Notes to the Consolidated Financial Statements, and the Reports of the Independent Registered Public Accounting Firm are included below. All of the schedules specified under Regulation S-X to be provided by Autoliv have been omitted either because they are not applicable, are not required or the information required is included in the financial statements or notes thereto.
Report of Independent Registered Public Accounting Firm To the Shareholders and the Board of Directors of Autoliv, Inc. Opinion on the Financial Statements We have audited the accompanying consolidated balance sheets of Autoliv, Inc. (the Company) as of December 31, 20182020 and 2017, and2019, the related consolidated statements of net income, comprehensive income, total equity and cash flows for each of the three years in the period ended December 31, 2018,2020, and the related notes (collectively referred to as the “consolidated financial statements”). In our opinion, the consolidated financial statements present fairly, in all material respects, the financial position of the Company at December 31, 20182020 and 2017,2019, and the results of its operations and its cash flows for each of the three years in the period ended December 31, 2018,2020, in conformity with U.S. generally accepted accounting principles. We also have audited, in accordance with the standards of the Public Company Accounting Oversight Board (United States) (PCAOB), the Company's internal control over financial reporting as of December 31, 2018,2020, based on criteria established in Internal Control-Integrated Framework issued by the Committee of Sponsoring Organizations of the Treadway Commission (2013 framework) and our report dated February 21, 201919, 2021 expressed an unqualified opinion thereon.thereon. Basis for Opinion These financial statements are the responsibility of the Company's management. Our responsibility is to express an opinion on the Company’s financial statements based on our audits. We are a public accounting firm registered with the PCAOB and are required to be independent with respect to the Company in accordance with the U.S. federal securities laws and the applicable rules and regulations of the Securities and Exchange Commission and the PCAOB. We conducted our audits in accordance with the standards of the PCAOB. Those standards require that we plan and perform the audit to obtain reasonable assurance about whether the financial statements are free of material misstatement, whether due to error or fraud. Our audits included performing procedures to assess the risks of material misstatement of the financial statements, whether due to error or fraud, and performing procedures that respond to those risks. Such procedures included examining, on a test basis, evidence regarding the amounts and disclosures in the financial statements. Our audits also included evaluating the accounting principles used and significant estimates made by management, as well as evaluating the overall presentation of the financial statements. We believe that our audits provide a reasonable basis for our opinion. Critical Audit Matters The critical audit matters communicated below are matters arising from the current period audit of the financial statements that were communicated or required to be communicated to the audit committee and that: (1) relate to accounts or disclosures that are material to the financial statements and (2) involved especially challenging, subjective, or complex judgments. The communication of critical audit matters does not alter in any way our opinion on the financial statements, taken as a whole, and we are not, by communicating the critical audit matters below, providing separate opinions on the critical audit matters or on the accounts or disclosures to which they relate. | | | | | Revenue recognition – Variable consideration | Description of the
Matter | | As discussed in Note 2 to the consolidated financial statements, the Company measures revenue based on consideration specified in a contract with a customer, adjusted for any variable consideration. Variability in consideration typically results from price concessions. The estimated amount of variable consideration that will be received by the Company is based on assumptions that include historical experience and trends, management’s assessment of the probable outcome of its negotiations with customers and anticipated future pricing strategies. Estimating variable consideration to be received requires significant judgments by management that affect the amount of revenue recorded in the financial statements. Auditing the amount of variable consideration expected to be received was complex because of the uncertainty inherent in the factors discussed above that management uses in its calculations. | How We
Addressed the
Matter in Our Audit | | We obtained an understanding, evaluated the design, and tested the operating effectiveness of internal controls related to variable consideration, including controls related to management’s review of ongoing negotiations with customers. To test the estimated amount of variable consideration expected to be received, our audit procedures included, among others, evaluating the Company’s estimation methodology and testing the significant factors used in the calculations, as discussed above. These procedures included obtaining information from management and sales department representatives who were responsible for negotiations with customers to assess the reasonableness of assumptions related to variable considerations relative to current negotiations. We evaluated the Company’s ability to estimate by comparing actual results to previous estimates and judgments made by management. We also performed journal entry testing focused on unusual and manual entries affecting revenue and on entries that could be indicative of price concessions that may not have been considered in the Company’s assumptions and calculations. |
| | | | | Product recalls | Description of the
Matter | | As discussed in Notes 2 and 13 to the consolidated financial statements, the Company is exposed to product liability claims in the event its products fail to perform as represented and such failure results, or is alleged to result, in bodily injury, and/or property damage or other loss. The Company records liabilities for product recalls when probable claims are identified and when it is possible to reasonably estimate costs. Actual costs incurred could differ from the amounts estimated, requiring adjustments to these reserves in future periods. Provisions for product recalls are estimated based on the expected cost of replacing the product and the customer’s cost of carrying out the recall, which is affected by the number of vehicles subject to recall and the cost of labor and materials to remove and replace the defective product. Auditing the product recall liabilities was complex due to the uncertainty inherent in the assumptions and estimates management uses to calculate these liability balances. These significant assumptions and estimates include the nature, likelihood, timing, and anticipated cost of known and potential claims. | How We
Addressed the
Matter in Our Audit | | We obtained an understanding, evaluated the design, and tested the operating effectiveness of internal controls over the Company’s product recall process, including controls related to management’s review of the estimation calculations and significant assumptions discussed above. To test product recall liabilities, our audit procedures included, among others, evaluating the Company’s estimation methodology and testing the significant assumptions discussed above. We obtained information from Company personnel who are responsible for monitoring the status of product recalls with customers to assess the reasonableness of assumptions used. We evaluated the Company’s ability to estimate by comparing actual results to previous estimates and judgments made by management. We also obtained letters from the Company’s external legal counsel addressing material claims against the Company, if any, and examined relevant third-party automotive safety regulatory information to identify potential unrecorded product recall liabilities. |
/ s /s/ Ernst & Young AB | We have served as the Company´s auditor since 1984. Stockholm, Sweden | February 21, 201919, 2021 |
Report of Independent Registered Public Accounting Firm To the Shareholders and the Board of Directors of Autoliv, Inc. Opinion on Internal Control over Financial Reporting We have audited Autoliv, Inc.’s internal control over financial reporting as of December 31, 2018,2020, based on criteria established in Internal Control—Integrated Framework issued by the Committee of Sponsoring Organizations of the Treadway Commission (2013 framework) (the COSO criteria). In our opinion, Autoliv, Inc. (the Company) maintained, in all material respects, effective internal control over financial reporting as of December 31, 2018,2020, based on the COSO criteria. We also have audited, in accordance with the standards of the Public Company Accounting Oversight Board (United States) (PCAOB), the consolidated balance sheets of Autoliv, Inc.the Company as of December 31, 20182020 and 2017,2019, the related consolidated statements of net income, comprehensive income, total equity and cash flows for each of the three years in the period ended December 31, 2018,2020, and the related notes and our report dated February 21, 201919, 2021 expressed an unqualified opinion thereon. Basis for Opinion The Company’s management is responsible for maintaining effective internal control over financial reporting and for its assessment of the effectiveness of internal control over financial reporting included in the accompanying Management’s Report on Internal Control over Financial Reporting. Our responsibility is to express an opinion on the Company’s internal control over financial reporting based on our audit. We are a public accounting firm registered with the PCAOB and are required to be independent with respect to the Company in accordance with the U.S. federal securities laws and the applicable rules and regulations of the Securities and Exchange Commission and the PCAOB. We conducted our audit in accordance with the standards of the PCAOB. Those standards require that we plan and perform the audit to obtain reasonable assurance about whether effective internal control over financial reporting was maintained in all material respects. Our audit included obtaining an understanding of internal control over financial reporting, assessing the risk that a material weakness exists, testing and evaluating the design and operating effectiveness of internal control based on the assessed risk, and performing such other procedures as we considered necessary in the circumstances. We believe that our audit provides a reasonable basis for our opinion. Definition and Limitations of Internal Control Over Financial Reporting A company’s internal control over financial reporting is a process designed to provide reasonable assurance regarding the reliability of financial reporting and the preparation of financial statements for external purposes in accordance with generally accepted accounting principles. A company’s internal control over financial reporting includes those policies and procedures that (1) pertain to the maintenance of records that, in reasonable detail, accurately and fairly reflect the transactions and dispositions of the assets of the company; (2) provide reasonable assurance that transactions are recorded as necessary to permit preparation of financial statements in accordance with generally accepted accounting principles, and that receipts and expenditures of the company are being made only in accordance with authorizations of management and directors of the company; and (3) provide reasonable assurance regarding prevention or timely detection of unauthorized acquisition, use, or disposition of the company’s assets that could have a material effect on the financial statements. Because of its inherent limitations, internal control over financial reporting may not prevent or detect misstatements. Also, projections of any evaluation of effectiveness to future periods are subject to the risk that controls may become inadequate because of changes in conditions, or that the degree of compliance with the policies or procedures may deteriorate. / s /s/ Ernst & Young AB Stockholm, Sweden | | | February 21, 201919, 2021 | | |
Consolidated StatementsStatements of Net Income | | | | Years ended December 31 | | | | | Years ended December 31 | | (DOLLARS AND SHARES IN MILLIONS, EXCEPT PER SHARE DATA) | | | | 2018 | | | 2017 | | | 2016 | | | | | 2020 | | | 2019 | | | 2018 | | Net sales | | Note 22 | | $ | 8,678.2 | | | $ | 8,136.8 | | | $ | 7,921.6 | | | Note 21 | | $ | 7,447.4 | | | $ | 8,547.6 | | | $ | 8,678.2 | | Cost of sales | | | | | (6,966.9 | ) | | | (6,457.1 | ) | | | (6,293.6 | ) | | | | | (6,200.5 | ) | | | (6,963.2 | ) | | | (6,966.9 | ) | Gross profit | | | | | 1,711.3 | | | | 1,679.7 | | | | 1,628.0 | | | | | | 1,246.9 | | | | 1,584.4 | | | | 1,711.3 | | Selling, general and administrative expenses | | | | | (390.3 | ) | | | (406.6 | ) | | | (394.4 | ) | | | | | (389.2 | ) | | | (398.9 | ) | | | (390.3 | ) | Research, development and engineering expenses, net | | | | | (412.6 | ) | | | (370.6 | ) | | | (357.3 | ) | | | | | (375.5 | ) | | | (405.5 | ) | | | (412.6 | ) | Amortization of intangibles | | Note 11 | | | (11.3 | ) | | | (11.2 | ) | | | (10.5 | ) | | Note 11 | | | (10.0 | ) | | | (11.5 | ) | | | (11.3 | ) | Other income (expense), net | | Notes 12, 18 | | | (211.1 | ) | | | (31.7 | ) | | | (34.8 | ) | | Notes 12, 18 | | | (90.1 | ) | | | (42.7 | ) | | | (211.1 | ) | Operating income | | | | | 686.0 | | | | 859.6 | | | | 831.0 | | | | | | 382.1 | | | | 725.8 | | | | 686.0 | | Income from equity method investments | | Note 9 | | | 3.6 | | | | 1.7 | | | | 2.6 | | | Income from equity method investment | | | Note 9 | | | 2.3 | | | | 2.0 | | | | 3.6 | | Interest income | | | | | 6.9 | | | | 7.4 | | | | 4.5 | | | | | | 4.6 | | | | 3.6 | | | | 6.9 | | Interest expense | | Note 14 | | | (66.1 | ) | | | (61.1 | ) | | | (62.2 | ) | | Note 14 | | | (73.0 | ) | | | (69.5 | ) | | | (66.1 | ) | Other non-operating items, net | | | | | (18.0 | ) | | | (15.2 | ) | | | 8.3 | | | | | | (24.8 | ) | | | (13.5 | ) | | | (18.0 | ) | Income from continuing operations before income taxes | | | | | 612.4 | | | | 792.4 | | | | 784.2 | | | | | | 291.2 | | | | 648.4 | | | | 612.4 | | Income tax expense | | Note 6 | | | (234.9 | ) | | | (204.4 | ) | | | (224.3 | ) | | Note 6 | | | (102.9 | ) | | | (185.6 | ) | | | (234.9 | ) | Income from continuing operations | | | | | 377.5 | | | | 588.0 | | | | 559.9 | | | | | | 188.3 | | | | 462.8 | | | | 377.5 | | (Loss) income from discontinued operations, net of income taxes | | Note 3 | | | (193.8 | ) | | | (285.0 | ) | | | 1.7 | | | Loss from discontinued operations, net of income taxes | | | Note 3 | | | — | | | | — | | | | (193.8 | ) | Net income | | | | | 183.7 | | | | 303.0 | | | | 561.6 | | | | | | 188.3 | | | | 462.8 | | | | 183.7 | | Less: Net income from continuing operations attributable to non-controlling interest | | | | | 1.6 | | | | 2.0 | | | | 1.5 | | | | | | 1.4 | | | | 1.3 | | | | 1.6 | | Less: Net loss from discontinued operations attributable to non-controlling interest | | | | | (8.3 | ) | | | (126.1 | ) | | | (7.0 | ) | | | | | — | | | | — | | | | (8.3 | ) | Net income attributable to controlling interest | | | | $ | 190.4 | | | $ | 427.1 | | | $ | 567.1 | | | | | $ | 186.9 | | | $ | 461.5 | | | $ | 190.4 | | | | | | | | | | | | | | | | | | | | | | | | | | | | | | | Amounts attributable to controlling interest: | | | | | | | | | | | | | | | | | | | | | | | | | | | | | Net income from continuing operations | | | | $ | 375.9 | | | $ | 586.0 | | | $ | 558.4 | | | | | $ | 186.9 | | | $ | 461.5 | | | $ | 375.9 | | Net (Loss) income from discontinued operations | | | | | (185.5 | ) | | | (158.9 | ) | | | 8.7 | | | Net loss from discontinued operations | | | | | | — | | | | — | | | | (185.5 | ) | Net income attributable to controlling interest | | | | $ | 190.4 | | | $ | 427.1 | | | $ | 567.1 | | | | | $ | 186.9 | | | $ | 461.5 | | | $ | 190.4 | | | | | | | | | | | | | | | | | | | | | | | | | | | | | | | Earnings per share continuing operations - basic1) | | | | $ | 4.32 | | | $ | 6.70 | | | $ | 6.33 | | | | | $ | 2.14 | | | $ | 5.29 | | | $ | 4.32 | | (Loss) earnings per share discontinuing operations - basic1) | | | | | (2.13 | ) | | | (1.82 | ) | | | 0.10 | | | Loss per share discontinuing operations - basic1) | | | | | | — | | | | — | | | | (2.13 | ) | Basic earnings per share | | | | $ | 2.19 | | | $ | 4.88 | | | $ | 6.43 | | | | | $ | 2.14 | | | $ | 5.29 | | | $ | 2.19 | | | | | | | | | | | | | | | | | | | | | | | | | | | | | | | Earnings per share continuing operations - diluted 1) | | | | $ | 4.31 | | | $ | 6.68 | | | $ | 6.32 | | | | | $ | 2.14 | | | $ | 5.29 | | | $ | 4.31 | | (Loss) earnings per share discontinuing operations - diluted 1) | | | | $ | (2.13 | ) | | $ | (1.81 | ) | | $ | 0.10 | | | Loss per share discontinuing operations - diluted 1) | | | | | | — | | | | — | | | | (2.13 | ) | Diluted earnings per share | | | | $ | 2.18 | | | $ | 4.87 | | | $ | 6.42 | | | | | $ | 2.14 | | | $ | 5.29 | | | $ | 2.18 | | | | | | | | | | | | | | | | | | | | | | | | | | | | | | | Weighted average number of shares outstanding, net of treasury shares (in millions) | | | | | 87.1 | | | | 87.5 | | | | 88.2 | | | | | | 87.3 | | | | 87.2 | | | | 87.1 | | Weighted average number of shares outstanding, assuming dilution and net of treasury shares (in millions) | | | | | 87.3 | | | | 87.7 | | | | 88.4 | | | | | | 87.5 | | | | 87.4 | | | | 87.3 | | | | | | | | | | | | | | | | | | | | | | | | | | | | | | | Cash dividend per share - declared | | | | $ | 2.48 | | | $ | 2.40 | | | $ | 2.32 | | | | | $ | — | | | $ | 2.48 | | | $ | 2.48 | | Cash dividend per share - paid | | | | $ | 2.46 | | | $ | 2.38 | | | $ | 2.30 | | | | | $ | 0.62 | | | $ | 2.48 | | | $ | 2.46 | |
See Notes to the Consolidated Financial Statements.
| Participating share awards with the right to receive dividend equivalents are (under the two class method) excluded from the earnings per share calculation (see Note 2322 in this Annual Report). |
Consolidated Statements of Comprehensive Income | | Years ended December 31 | | | Years ended December 31 | | (DOLLARS IN MILLIONS) | | 2018 | | | 2017 | | | 2016 | | | 2020 | | | 2019 | | | 2018 | | Net income | | $ | 183.7 | | | $ | 303.0 | | | $ | 561.6 | | | $ | 188.3 | | | $ | 462.8 | | | $ | 183.7 | | Other comprehensive (loss) income before tax: | | | | | | | | | | | | | | Other comprehensive income (loss) before tax: | | | | | | | | | | | | | | Change in cumulative translation adjustments | | | (150.2 | ) | | | 272.1 | | | | (156.3 | ) | | | 96.9 | | | | 2.0 | | | | (150.2 | ) | Net change in cash flow hedges | | | 0.9 | | | | (8.9 | ) | | | 7.9 | | | | — | | | | — | | | | 0.9 | | Net change in unrealized components of defined benefit plans | | | 14.2 | | | | 31.9 | | | | (24.6 | ) | | | 7.5 | | | | (34.6 | ) | | | 14.2 | | Other comprehensive (loss) income, before tax | | | (135.1 | ) | | | 295.1 | | | | (173.0 | ) | | Tax effect allocated to other comprehensive (loss) income | | | (4.1 | ) | | | (7.8 | ) | | | 7.6 | | | Other comprehensive (loss) income, net of tax | | | (139.2 | ) | | | 287.3 | | | | (165.4 | ) | | Other comprehensive income (loss), before tax | | | | 104.4 | | | | (32.6 | ) | | | (135.1 | ) | Tax effect allocated to other comprehensive income (loss) | | | | (1.5 | ) | | | 6.8 | | | | (4.1 | ) | Other comprehensive income (loss), net of tax | | | | 102.9 | | | | (25.8 | ) | | | (139.2 | ) | Comprehensive income | | | 44.5 | | | | 590.3 | | | | 396.2 | | | | 291.2 | | | | 437.0 | | | | 44.5 | | Less: Comprehensive loss attributable to non-controlling interest | | | (7.4 | ) | | | (114.8 | ) | | | (13.9 | ) | | Less: Comprehensive income (loss) attributable to non-controlling interest | | | | 2.3 | | | | 1.2 | | | | (7.4 | ) | Comprehensive income attributable to controlling interest | | $ | 51.9 | | | $ | 705.1 | | | $ | 410.1 | | | $ | 288.9 | | | $ | 435.8 | | | $ | 51.9 | |
See Notes to the Consolidated Financial Statements.
Consolidated BalanceBalance Sheets | | | | At December 31 | | | | | At December 31 | | (DOLLARS AND SHARES IN MILLIONS) | | | | 2018 | | | 2017 | | | | | 2020 | | | 2019 | | Assets | | | | | | | | | | | | | | | | | | | | | Cash and cash equivalents | | | | $ | 615.8 | | | $ | 959.5 | | | | | $ | 1,178.2 | | | $ | 444.7 | | Receivables, net | | Note 7 | | | 1,652.1 | | | | 1,696.7 | | | Note 7 | | | 1,819.6 | | | | 1,623.9 | | Inventories, net | | Note 8 | | | 757.9 | | | | 704.3 | | | Note 8 | | | 798.3 | | | | 740.9 | | Income tax receivables | | | | | 34.1 | | | | 41.2 | | | Income tax receivable | | | | | | 44.2 | | | | 26.8 | | Prepaid expenses | | | | | 208.6 | | | | 153.0 | | | | | | 163.6 | | | | 134.6 | | Related party receivable | | | Note 20 | | | 2.0 | | | | 2.8 | | Other current assets | | | | | 1.9 | | | | 2.8 | | | Note 13, 18 | | | 263.1 | | | | 28.4 | | Related party receivables | | Note 21 | | | 15.0 | | | | — | | | Current assets, discontinued operations | | Note 3 | | | — | | | | 647.2 | | | Total current assets | | | | | 3,285.4 | | | | 4,204.7 | | | | | | 4,269.0 | | | | 3,002.1 | | Property, plant and equipment, net | | Note 10 | | | 1,690.1 | | | | 1,608.9 | | | Note 10 | | | 1,869.1 | | | | 1,815.7 | | Investments and other non-current assets | | Note 9 | | | 323.5 | | | | 341.0 | | | Operating lease right-of-use assets | | | Note 4 | | | 140.8 | | | | 156.8 | | Goodwill | | Note 11 | | | 1,389.9 | | | | 1,397.0 | | | Note 11 | | | 1,398.1 | | | | 1,387.9 | | Intangible assets, net | | Note 11 | | | 32.7 | | | | 42.6 | | | Note 11 | | | 13.6 | | | | 22.3 | | Non-current assets, discontinued operations | | Note 3 | | | — | | | | 955.7 | | | Other non-current assets | | | Note 9, 18 | | | 466.2 | | | | 386.4 | | Total assets | | | | $ | 6,721.6 | | | $ | 8,549.9 | | | | | $ | 8,156.8 | | | $ | 6,771.2 | | Liabilities and equity | | | | | | | | | | | | | | | | | | | | | Short-term debt | | Note 14 | | $ | 620.7 | | | $ | 19.7 | | | Note 14 | | $ | 301.8 | | | $ | 368.1 | | Accounts payable | | | | | 978.3 | | | | 957.3 | | | | | | 1,226.7 | | | | 941.0 | | Accrued expenses | | Notes 12, 13 | | | 935.4 | | | | 829.5 | | | Notes 12, 13 | | | 1,259.7 | | | | 816.9 | | Related party liabilities | | | Note 20 | | | 37.5 | | | | 17.4 | | Income tax payable | | | | | 64.9 | | | | 81.9 | | | | | | 97.3 | | | | 38.8 | | Operating lease liabilities, current | | | Note 4 | | | 37.3 | | | | 37.8 | | Other current liabilities | | | | | 202.5 | | | | 198.0 | | | | | | 186.6 | | | | 190.2 | | Related party liabilities | | Note 21 | | | 63.7 | | | | — | | | Current liabilities, discontinued operations | | Note 3 | | | — | | | | 568.2 | | | Total current liabilities | | | | | 2,865.5 | | | | 2,654.6 | | | | | | 3,146.9 | | | | 2,410.2 | | Long-term debt | | Note 14 | | | 1,609.0 | | | | 1,310.7 | | | Note 14 | | | 2,109.6 | | | | 1,726.1 | | Pension liability | | Note 20 | | | 198.2 | | | | 206.8 | | | Note 19 | | | 248.2 | | | | 240.2 | | Operating lease liabilities, non-current | | | Note 4 | | | 103.3 | | | | 119.4 | | Other non-current liabilities | | | | | 152.1 | | | | 144.3 | | | | | | 125.7 | | | | 152.9 | | Non-current liabilities, discontinued operations | | Note 3 | | | — | | | | 64.1 | | | Total non-current liabilities | | | | | 1,959.3 | | | | 1,725.9 | | | | | | 2,586.8 | | | | 2,238.6 | | Commitments and contingencies | | Notes 18, 19 | | | | | | | | | | Note 18 | | | | | | | | | Common stock1) | | | | | 102.8 | | | | 102.8 | | | | | | 102.8 | | | | 102.8 | | Additional paid-in capital | | | | | 1,329.3 | | | | 1,329.3 | | | | | | 1,329.3 | | | | 1,329.3 | | Retained earnings | | | | | 2,041.8 | | | | 4,079.2 | | | | | | 2,471.1 | | | | 2,283.5 | | Accumulated other comprehensive loss | | Note 15 | | | (423.2 | ) | | | (287.5 | ) | | Note 15 | | | (346.9 | ) | | | (448.9 | ) | Treasury stock (15.7 and 15.8 shares, respectively) | | | | | (1,167.0 | ) | | | (1,188.7 | ) | | Treasury stock (15.4 and 15.6 shares, respectively) | | | | | | (1,147.4 | ) | | | (1,157.5 | ) | Total controlling interest’s equity | | | | | 1,883.7 | | | | 4,035.1 | | | | | | 2,408.9 | | | | 2,109.2 | | Non-controlling interest | | | | | 13.1 | | | | 134.3 | | | | | | 14.2 | | | | 13.2 | | Total equity | | | | | 1,896.8 | | | | 4,169.4 | | | | | | 2,423.1 | | | | 2,122.4 | | Total liabilities and equity | | | | $ | 6,721.6 | | | $ | 8,549.9 | | | | | $ | 8,156.8 | | | $ | 6,771.2 | |
1) | Numberofshares:350 millionauthorized,102.8 millionissuedforbothyears,and 87.187.4 and 87.087.2 millionoutstanding,netoftreasuryshares,for 20182020 and 2017, 2019, respectively. |
See Notesto the ConsolidatedFinancialStatements.
Consolidated StatementsStatements of Cash Flows | | | | Years ended December 31 | | | Years ended December 31 | | (DOLLARS IN MILLIONS) | | | | 2018 | | | 2017 | | | 2016 | | | 2020 | | | 2019 | | | 2018 | | Operating activities | | | | | | | | | | | | | | | | | | | | | | | | | | | Net income continuing operations | | | | $ | 377.5 | | | $ | 588.0 | | | $ | 559.9 | | | Net income discontinued operations | | | | | (193.8 | ) | | | (285.0 | ) | | 1.7 | | | Adjustments to reconcile net income to net cash provided by operating activities: | | | | | | | | | | | | | | | | Net income from continuing operations | | | $ | 188.3 | | | $ | 462.8 | | | $ | 377.5 | | Net loss from discontinued operations | | | | — | | | | — | | | | (193.8 | ) | Adjustments (non-cash items) to reconcile net income to cash provided by operating activities: | | | | | | | | | | | | | | Depreciation and amortization | | | | | 397.1 | | | | 425.8 | | | | 383.0 | | | | 370.9 | | | | 350.6 | | | | 397.1 | | Legal provision | | | | | 210.0 | | | | — | | | | — | | | Goodwill, impairment charge | | | | | — | | | | 234.2 | | | | — | | | EC antitrust non-cash provision | | | | — | | | | — | | | | 210.0 | | Deferred income taxes | | | | | 3.0 | | | | (47.2 | ) | | | (24.8 | ) | | | (23.9 | ) | | | (16.0 | ) | | | 3.0 | | Loss from equity method investments, net of dividends | | | | | 31.9 | | | | 38.1 | | | | 1.0 | | | | 0.0 | | | | 4.0 | | | | 31.9 | | Net change in: | | | | | | | | | | | | | | | | Net change in operating capital: | | | | | | | | | | | | | | EC antitrust payment | | | | — | | | | (203.0 | ) | | | — | | Receivables and other assets, gross | | | | | (48.4 | ) | | | (102.2 | ) | | | (292.3 | ) | | | (414.7 | ) | | | 25.4 | | | | (48.4 | ) | Inventories, gross | | | | | (123.9 | ) | | | (21.0 | ) | | | (72.6 | ) | | | (34.0 | ) | | | 15.4 | | | | (123.9 | ) | Accounts payable and accrued expenses | | | | | (37.8 | ) | | | 112.3 | | | | 271.2 | | | | 671.7 | | | | 35.7 | | | | (37.8 | ) | Income taxes | | | | | (19.2 | ) | | | 10.6 | | | | 15.9 | | | | 53.5 | | | | (29.3 | ) | | | (19.2 | ) | Other, net | | | | | (5.8 | ) | | | (17.7 | ) | | | 25.4 | | | | 37.1 | | | | (4.9 | ) | | | (5.8 | ) | Net cash provided by operating activities | | | | | 590.6 | | | | 935.9 | | | | 868.4 | | | | 848.9 | | | | 640.7 | | | | 590.6 | | Investing activities | | | | | | | | | | | | | | | | | | | | | | | | | | | Expenditures for property, plant and equipment | | | | | (560.0 | ) | | | (580.1 | ) | | | (506.8 | ) | | | (343.5 | ) | | | (483.4 | ) | | | (560.0 | ) | Proceeds from sale of property, plant and equipment | | | | | 5.2 | | | | 10.5 | | | | 8.2 | | | | 3.9 | | | | 7.3 | | | | 5.2 | | Acquisition of intangible assets | | | | | — | | | | — | | | | (1.1 | ) | | Acquisition of businesses and interest in affiliates, net of cash acquired | | | | | (72.0 | ) | | | (125.3 | ) | | | (226.3 | ) | | | — | | | | — | | | | (72.0 | ) | Net proceeds from divestitures | | | | | — | | | | 1.4 | | | | — | | | Other | | | | | (0.9 | ) | | | (3.8 | ) | | | — | | | | — | | | | — | | | | (0.9 | ) | Net cash used in investing activities | | | | | (627.7 | ) | | | (697.3 | ) | | | (726.0 | ) | | | (339.6 | ) | | | (476.1 | ) | | | (627.7 | ) | Financing activities | | | | | | | | | | | | | | | | | | | | | | | | | | | Net decrease in short-term debt | | | | | 355.4 | | | | (208.6 | ) | | | (2.7 | ) | | Issuance of long-term debt, net of discount | | | | | 582.2 | | | | — | | | | — | | | Net (decrease) increase in short-term debt | | | | (239.9 | ) | | | (364.1 | ) | | | 355.4 | | Increase in long-term debt | | | | 1,177.1 | | | | 243.5 | | | | 582.2 | | Repayment of long-term debt | | | | (722.5 | ) | | | — | | | | — | | Debt issuance costs | | | | | (2.6 | ) | | | — | | | | — | | | | — | | | | (0.3 | ) | | | (2.6 | ) | Dividends paid to non-controlling interest | | | | | (2.1 | ) | | | (0.1 | ) | | | (1.7 | ) | | | (1.3 | ) | | | (1.1 | ) | | | (2.1 | ) | Dividends paid | | | | | (214.3 | ) | | | (208.7 | ) | | | (202.8 | ) | | | (54.1 | ) | | | (217.0 | ) | | | (214.3 | ) | Shares repurchased | | | | | — | | | | (157.0 | ) | | | — | | | Common stock options exercised | | Note 17 | | | 8.2 | | | | 7.9 | | | | 5.9 | | | | 0.8 | | | | 0.9 | | | | 8.2 | | Capital contribution to Veoneer | | | | | (971.8 | ) | | | — | | | | — | | | | — | | | | — | | | | (971.8 | ) | Other, net | | | | | — | | | | 0.3 | | | | 1.1 | | | Net cash used in financing activities | | | | | (245.0 | ) | | | (566.2 | ) | | | (200.2 | ) | | Net cash provided by (used in) financing activities | | | | 160.1 | | | | (338.1 | ) | | | (245.0 | ) | Effect of exchange rate changes on cash and cash equivalents | | | | | (61.6 | ) | | | 60.4 | | | | (49.0 | ) | | | 64.1 | | | | 2.4 | | | | (61.6 | ) | Decrease in cash and cash equivalents | | | | | (343.7 | ) | | | (267.2 | ) | | | (106.8 | ) | | Increase (decrease) in cash and cash equivalents | | | | 733.5 | | | | (171.1 | ) | | | (343.7 | ) | Cash and cash equivalents at beginning of year | | | | | 959.5 | | | | 1,226.7 | | | | 1,333.5 | | | | 444.7 | | | | 615.8 | | | | 959.5 | | Cash and cash equivalents at end of year | | | | $ | 615.8 | | | $ | 959.5 | | | $ | 1,226.7 | | | $ | 1,178.2 | | | $ | 444.7 | | | $ | 615.8 | |
See Notesto the ConsolidatedFinancialStatements.
Consolidated StatementsStatements of Total Equity | | | | | | | | | | | | | | | | | | Accumulated | | | | | | | | | | | | | | | | | | | | | | | | | | | | | | | | | | | Accumulated | | | | | | | | | | | | | | | | | | | | | | | | | | | | Additional | | | | | | | other com- | | | | | | | Total parent | | | Non- | | | | | | | | | | | | | | | Additional | | | | | | | other com- | | | | | | | Total parent | | | Non- | | | | | | (DOLLARS AND SHARES | | Number of | | | Common | | | paid in | | | Retained | | | prehensive | | | Treasury | | | shareholders’ | | | controlling | | | Total | | | Number of | | | Common | | | paid in | | | Retained | | | prehensive | | | Treasury | | | shareholders’ | | | controlling | | | Total | | IN MILLIONS) | | shares | | | stock | | | capital | | | earnings | | | (loss) income | | | stock | | | equity | | | interest | | | equity1) | | | shares | | | stock | | | capital | | | earnings | | | (loss) income | | | stock | | | equity | | | interest | | | equity1) | | Balance at December 31, 2015 | | | 102.8 | | | $ | 102.8 | | | $ | 1,329.3 | | | $ | 3,499.4 | | | $ | (408.5 | ) | | $ | (1,067.4 | ) | | $ | 3,455.6 | | | $ | 12.5 | | | $ | 3,468.1 | | | Comprehensive Income: | | | | | | | | | | | | | | | | | | | | | | | | | | | | | | | | | | | | | | Comprehensive Income | | | | | | | | | | | | | | | | | | | | | | | | | | | | | | | | | | | | | | Net income | | | | | | | | | | | | | | 567.1 | | | | | | | | | | | | 567.1 | | | | (5.5 | ) | | | 561.6 | | | Net change in cash flow hedges | | | | | | | | | | | | | | | | | | | 7.9 | | | | | | | | 7.9 | | | | | | | | 7.9 | | | Foreign currency translation | | | | | | | | | | | | | | | | | | | (147.7 | ) | | | | | | | (147.7 | ) | | | (8.6 | ) | | | (156.3 | ) | | Pension liability | | | | | | | | | | | | | | | | | | | (17.2 | ) | | | | | | | (17.2 | ) | | | 0.2 | | | | (17.0 | ) | | Total Comprehensive Income | | | | | | | | | | | | | | | | | | | | | | | | | | | 410.1 | | | | (13.9 | ) | | | 396.2 | | | Stock-based compensation | | | | | | | | | | | | | | | | | | | | | | 16.2 | | | | 16.2 | | | | | | | | 16.2 | | | Cash dividends declared | | | | | | | | | | | | | | | (204.7 | ) | | | | | | | | | | | (204.7 | ) | | | | | | | (204.7 | ) | | Dividends paid to non-controlling interest on subsidiary shares | | | | | | | | | | | | | | | | | | | | | | | | | | | | | | | (1.7 | ) | | | (1.7 | ) | | Investment in subsidiary by non-controlling interest | | | | | | | | | | | | | | | | | | | | | | | | | | | | | | | 252.3 | | | | 252.3 | | | Balance at December 31, 2016 | | | 102.8 | | | $ | 102.8 | | | $ | 1,329.3 | | | $ | 3,861.8 | | | $ | (565.5 | ) | | $ | (1,051.2 | ) | | $ | 3,677.2 | | | $ | 249.2 | | | $ | 3,926.4 | | | Comprehensive Income: | | | | | | | | | | | | | | | | | | | | | | | | | | | | | | | | | | | | | | Net income | | | | | | | | | | | | | | | 427.1 | | | | | | | | | | | | 427.1 | | | | (124.1 | ) | | | 303.0 | | | Net change in cash flow hedges | | | | | | | | | | | | | | | | | | | (8.9 | ) | | | | | | | (8.9 | ) | | | | | | | (8.9 | ) | | Foreign currency translation | | | | | | | | | | | | | | | | | | | 263.0 | | | | | | | | 263.0 | | | | 9.1 | | | | 272.1 | | | Pension liability | | | | | | | | | | | | | | | | | | | 23.9 | | | | | | | | 23.9 | | | | 0.2 | | | | 24.1 | | | Total Comprehensive Income | | | | | | | | | | | | | | | | | | | | | | | | | | | 705.1 | | | | (114.8 | ) | | | 590.3 | | | Stock-based compensation | | | | | | | | | | | | | | | | | | | | | | | 19.5 | | | | 19.5 | | | | | | | | 19.5 | | | Cash dividends declared | | | | | | | | | | | | | | | (209.7 | ) | | | | | | | | | | | (209.7 | ) | | | | | | | (209.7 | ) | | Dividends paid to non-controlling interest on subsidiary shares | | | | | | | | | | | | | | | | | | | | | | | | | | | | | | | (0.1 | ) | | | (0.1 | ) | | Repurchased shares | | | | | | | | | | | | | | | | | | | | | | | (157.0 | ) | | | (157.0 | ) | | | | | | | (157.0 | ) | | Balance at December 31, 2017 | | | 102.8 | | | $ | 102.8 | | | $ | 1,329.3 | | | $ | 4,079.2 | | | $ | (287.5 | ) | | $ | (1,188.7 | ) | | $ | 4,035.1 | | | $ | 134.3 | | | $ | 4,169.4 | | | | 102.8 | | | $ | 102.8 | | | $ | 1,329.3 | | | $ | 4,079.2 | | | $ | (287.5 | ) | | $ | (1,188.7 | ) | | $ | 4,035.1 | | | $ | 134.3 | | | $ | 4,169.4 | | Comprehensive Income: | | | | | | | | | | | | | | | | | | | | | | | | | | | | | | | | | | | | | | | | | | | | | | | | | | | | | | | | | | | | | | | | | | | | | | | | | Net income | | | | | | | | | | | | | | | 190.4 | | | | | | | | | | | | 190.4 | | | | (6.7 | ) | | | 183.7 | | | | | | | | | | | | | | | | 190.4 | | | | | | | | | | | | 190.4 | | | | (6.7 | ) | | | 183.7 | | Net change in cash flow hedges | | | | | | | | | | | | | | | | | | | 0.9 | | | | | | | | 0.9 | | | | | | | | 0.9 | | | | | | | | | | | | | | | | | | | | 0.9 | | | | | | | | 0.9 | | | | | | | | 0.9 | | Foreign currency translation | | | | | | | | | | | | | | | | | | | (149.5 | ) | | | | | | | (149.5 | ) | | | (0.7 | ) | | | (150.2 | ) | | | | | | | | | | | | | | | | | | | (149.5 | ) | | | | | | | (149.5 | ) | | | (0.7 | ) | | | (150.2 | ) | Pension liability | | | | | | | | | | | | | | | | | | | 10.1 | | | | | | | | 10.1 | | | | | | | | 10.1 | | | | | | | | | | | | | | | | | | | | 10.1 | | | | | | | | 10.1 | | | | | | | | 10.1 | | Adjustment due to adoption of ASU 2018-02 | | | | | | | | | | | | | | | 10.2 | | | | (10.2 | ) | | | | | | | 0.0 | | | | | | | | 0.0 | | | | | | | | | | | | | | | | 10.2 | | | | (10.2 | ) | | | | | | | — | | | | | | | | — | | Total Comprehensive Income | | | | | | | | | | | | | | | | | | | | | | | | | | | 51.9 | | | | (7.4 | ) | | | 44.5 | | | | | | | | | | | | | | | | | | | | | | | | | | | | 51.9 | | | | (7.4 | ) | | | 44.5 | | Stock-based compensation | | | | | | | | | | | | | | | | | | | | | | | 21.7 | | | | 21.7 | | | | | | | | 21.7 | | | | | | | | | | | | | | | | | | | | | | | | 21.7 | | | | 21.7 | | | | | | | | 21.7 | | Cash dividends declared | | | | | | | | | | | | | | | (216.7 | ) | | | | | | | | | | | (216.7 | ) | | | | | | | (216.7 | ) | | | | | | | | | | | | | | | (216.7 | ) | | | | | | | | | | | (216.7 | ) | | | | | | | (216.7 | ) | Dividends paid to non-controlling interest on subsidiary shares | | | | | | | | | | | | | | | | | | | | | | | | | | | | | | | (2.2 | ) | | | (2.2 | ) | | | | | | | | | | | | | | | | | | | | | | | | | | | | | | | (2.2 | ) | | | (2.2 | ) | Adjustment due to adoption of ASU 2014-09 | | | | | | | | | | | | | | | 3.3 | | | | | | | | | | | | 3.3 | | | | | | | | 3.3 | | | | | | | | | | | | | | | | 3.3 | | | | | | | | | | | | 3.3 | | | | | | | | 3.3 | | Distribution of Veoneer | | | | | | | | | | | | | | | (2,024.3 | ) | | | 13.0 | | | | | | | | (2,011.3 | ) | | | (111.6 | ) | | | (2,122.9 | ) | | | | | | | | | | | | | | | (2,024.3 | ) | | | 13.0 | | | | | | | | (2,011.3 | ) | | | (111.6 | ) | | | (2,122.9 | ) | Other | | | | | | | | | | | | | | | (0.3 | ) | | | | | | | | | | | (0.3 | ) | | | | | | | (0.3 | ) | | | | | | | | | | | | | | | (0.3 | ) | | | | | | | | | | | (0.3 | ) | | | | | | | (0.3 | ) | Balance at December 31, 2018 | | | 102.8 | | | $ | 102.8 | | | $ | 1,329.3 | | | $ | 2,041.8 | | | $ | (423.2 | ) | | $ | (1,167.0 | ) | | $ | 1,883.7 | | | $ | 13.1 | | | $ | 1,896.8 | | | | 102.8 | | | $ | 102.8 | | | $ | 1,329.3 | | | $ | 2,041.8 | | | $ | (423.2 | ) | | $ | (1,167.0 | ) | | $ | 1,883.7 | | | $ | 13.1 | | | $ | 1,896.8 | | Comprehensive Income: | | | | | | | | | | | | | | | | | | | | | | | | | | | | | | | | | | | | | | Net income | | | | | | | | | | | | | | | | 461.5 | | | | | | | | | | | | 461.5 | | | | 1.3 | | | | 462.8 | | Foreign currency translation | | | | | | | | �� | | | | | | | | | | | | 2.1 | | | | | | | | 2.1 | | | | (0.1 | ) | | | 2.0 | | Pension liability | | | | | | | | | | | | | | | | | | | | (27.8 | ) | | | | | | | (27.8 | ) | | | | | | | (27.8 | ) | Total Comprehensive Income | | | | | | | | | | | | | | | | | | | | | | | | | | | | 435.8 | | | | 1.2 | | | | 437.0 | | Stock-based compensation | | | | | | | | | | | | | | | | | | | | | | | | 9.5 | | | | 9.5 | | | | | | | | 9.5 | | Cash dividends declared | | | | | | | | | | | | | | | | (217.1 | ) | | | | | | | | | | | (217.1 | ) | | | | | | | (217.1 | ) | Dividends paid to non-controlling interest on subsidiary shares | | | | | | | | | | | | | | | | | | | | | | | | | | | | | | | | (1.1 | ) | | | (1.1 | ) | Distribution of Veoneer | | | | | | | | | | | | | | | | (2.7 | ) | | | | | | | | | | | (2.7 | ) | | | | | | | (2.7 | ) | Balance at December 31, 2019 | | | | 102.8 | | | $ | 102.8 | | | $ | 1,329.3 | | | $ | 2,283.5 | | | $ | (448.9 | ) | | $ | (1,157.5 | ) | | $ | 2,109.2 | | | $ | 13.2 | | | $ | 2,122.4 | | Comprehensive Income: | | | | | | | | | | | | | | | | | | | | | | | | | | | | | | | | | | | | | | Net income | | | | | | | | | | | | | | | | 186.9 | | | | | | | | | | | | 186.9 | | | | 1.4 | | | | 188.3 | | Foreign currency translation | | | | | | | | | | | | | | | | | | | | 96.0 | | | | | | | | 96.0 | | | | 0.9 | | | | 96.9 | | Pension liability | | | | | | | | | | | | | | | | | | | | 6.0 | | | | | | | | 6.0 | | | | | | | | 6.0 | | Total Comprehensive Income | | | | | | | | | | | | | | | | | | | | | | | | | | | | 288.9 | | | | 2.3 | | | | 291.2 | | Stock-based compensation | | | | | | | | | | | | | | | | 0.7 | | | | | | | | 10.1 | | | | 10.8 | | | | | | | | 10.8 | | Cash dividends declared | | | | | | | | | | | | | | | | | | | | | | | | | | | | — | | | | | | | | — | | Dividends paid to non-controlling interest on subsidiary shares | | | | | | | | | | | | | | | | | | | | | | | | | | | | | | | | (1.3 | ) | | | (1.3 | ) | Balance at December 31, 2020 | | | | 102.8 | | | $ | 102.8 | | | $ | 1,329.3 | | | $ | 2,471.1 | | | $ | (346.9 | ) | | $ | (1,147.4 | ) | | $ | 2,408.9 | | | $ | 14.2 | | | $ | 2,423.1 | |
1) | See Note 15 for further details – includes tax effects where applicable. |
See Notes to the Consolidated Financial Statements.
Notes to the Consolidated Financial Statements (DOLLARS IN MILLIONS, EXCEPT PER SHARE DATA) 1. Basis of Presentation NATURE OF OPERATIONS Through its operating subsidiaries, Autoliv is a leading developer, manufacturer and supplier of automotive safety systems withto the automotive industry. The Company has a broad range of product offerings, primarily passive safety systems, including modules and components for passenger and driver airbags, side airbags, curtain airbags, seatbelts and steering wheels. AutolivThe Company is also a supplier of anti-whiplash systems and pedestrian protection systems and child seats.systems. PRINCIPLES OF CONSOLIDATION The consolidated financial statements have been prepared in accordance with United States (U.S.) Generally Accepted Accounting Principles (GAAP) and include Autoliv, Inc. and all companies over which Autoliv, Inc. directly or indirectly exercises control, which as a general rule means that the Company owns more than 50% of the voting rights. Consolidation is also required when the Company has both the power to direct the activities of a variable interest entity (VIE) and the obligation to absorb losses or the right to receive benefits from the VIE that could be significant to the VIE. All intercompany accounts and transactions within the Company have been eliminated from the consolidated financial statements. Investments in affiliated companies in which the Company exercises significant influence over the operations and financial policies, but does not control, are reported using the equity method of accounting. Generally, the Company owns between 20 and 50 percent20-50% of such investments. DISCONTINUED OPERATIONS On June 29, 2018 (the “Distribution Date”), Autoliv completed the spin-off of its former Electronics segment (the “spin-off”) through the distribution of all of the issued and outstanding stock of Veoneer, Inc. (“Veoneer”). To effect the spin-off, Autoliv distributed to each Autoliv stockholder one share of Veoneer common stock, par value $1.00 per share, for every one share of Autoliv common stock, par value $1.00 per share, held by such person on the common stock record date, and each Autoliv Swedish Depository Receipt (SDR) holder received one Veoneer SDR for each Autoliv SDR held by such person on the applicable SDR record date. On July 2, 2018, Veoneer’s common stock began regular-way trading on the New York Stock Exchange under the symbol “VNE” and its SDRs began trading on Nasdaq Stockholm under the symbol “VNE SDB.” The Company did not retain any equity interest in Veoneer. In accordance with U.S. GAAP, the financial position and results of operations of the Electronics business are presented as discontinued operations and, as such, have been excluded from continuing operations for all periods presented. The sum of the individual earnings per share amounts from continuing operations and discontinued operations may not equal the total company earnings per share amounts due to rounding. The cash flows and comprehensive income related to the Electronics business have not been segregated and are included in the Condensed Consolidated Statements of Cash Flows and Comprehensive Income, respectively, for all comparison periods presented. With the exception of Note 3, the Notes to the Consolidated Financial Statements reflect the continuing operations of Autoliv. See Note 3, - Discontinued Operations, below for additional information regarding discontinued operations. On April 1, 2018, in preparation for the spin-off, pursuant to the terms of a master transfer agreement entered into between Autoliv and Veoneer, assets related to the Electronics business were transferred to, and liabilities related to the Electronics business were retained or assumed by Veoneer, however, responsibilityResponsibility for certain product, warranty and recall liabilities for Electronics products manufactured prior to April 1, 2018 was retained by Autoliv as provided in the Distribution Agreement between Autoliv and Veoneer.
Certain amounts in prior year’s consolidated financial statements and related footnotes thereto have been reclassified, unless otherwise noted, to conform with the current year presentation as a result of the spin-off of Veoneer. SEGMENT REPORTING UponPrior to the spin-off, Autoliv had 2 reportable operating segments: Passive Safety and Electronics. After completion of the spin-off, at June 30, 2018,Autoliv’s remaining business is comprised of passive safety products - principally airbags (including steering wheels and inflators) and seatbelts. In addition, as of August 1, 2019, Autoliv concluded that itimplemented a new organizational structure which has onebeen considered when evaluating the operating and reportable segment,segments in the Company after the spin-off.
In accordance with ASC 280, Segment Reporting, the operating segments are determined based on the wayinformation provided to the Chief Operating Decision Maker (CODM) on a regular basis and used for the purpose of assessing performance and allocating resources within the Company. The CEO is deemed to be the CODM of Autoliv since he is the person who makes all major decisions on how to allocate the resources and assess the performance of the Company currently evaluatesfor both strategic and operational initiatives. ASC 280 indicates that a component is an operating segment if it meets the following criteria: | • | It engages in business activities from which it may earn revenues and incur expenses. |
| • | Its operating results are regularly reviewed by the CODM to make decisions about resources to be allocated to the segment and assess its performance. |
| • | Its discrete financial information is available. |
The Company as a whole has met the definition of an operating segment as it engages in business activities from which it may earn revenues and incur expenses, the consolidated operating results are regularly reviewed by the CEO/CODM to allocate resources and assess performance, and discrete financial information is available. Additionally, as Autoliv supplies customers on a global basis it also manages its operations. Thethe business on a global basis. Therefore, based on the above analysis, we have concluded that the Company will re-evaluateis the onesingle operating and reportable segment as the operating model evolves, including the management structure. Prior to the completion of the spin-off, the Company had two reportable segments, Electronics and Passive Safety. The Company’s Passive Safety reportable segment includes the Company’s airbag and seatbelt products and components. under ASC 280, Segment Reporting. For more information on our segment, see Note 22.
21. 2. Summary of Significant Accounting Policies BUSINESS COMBINATIONS Transactions in which the Company obtains control of a business are accounted for according to the acquisition method as described in Financial Accounting Standards Board (FASB) Accounting Standards Codification (ASC)ASC 805, Business Combinations.Combinations. The assets acquired and liabilities assumed are recognized and measured at their fair values as of the date control is obtained. Acquisition related costs in connection with a business combination are expensed as incurred. Contingent consideration is recognized and measured at fair value at the acquisition date and until paid is re-measured on a recurring basis. It isbasis and classified as a liability based on appropriate GAAP.liability. EQUITY METHOD INVESTMENTSINVESTMENT Investments accounted for under the equity method, means that a proportional share of the equity method investment’s net income increases the investment, and a proportional share of losses and payment of dividends decreases it. In the Consolidated Statements of Net Income, the proportional share of the net income (loss) is reported as Income from equity method investments.investment. USE OF ESTIMATES The preparation of consolidated financial statements in conformity with U.S. GAAP requires management to make estimates and assumptions that affect the reported amounts of assets and liabilities, disclosures of contingent assets and liabilities at the date of the consolidated financial statements, and the reported amounts of net sales and expenses during the reporting period. The accounting estimates that require management’s most significant judgments include the estimation of variable consideration for our contracts with customers, valuation of stock based payments, assessment of recoverability of goodwill and intangible assets, estimation of pension benefit obligations based on actuarial assumptions, estimation of accruals for warranty and product liabilities,recalls, restructuring charges, uncertain tax positions, valuation allowances and legal proceedings. Actual results could differ from those estimates. REVENUE RECOGNITION In accordance with ASC 606, Revenue from Contracts with Customers, revenue is measured based on consideration specified in a contract with a customer, adjusted for any variable consideration (i.e. price concessions or annual price adjustments)concessions) and estimated at contract inception. The estimated amount of variable consideration that will be received by the Company is based on historical experience and trends, management´s understanding of the status of negotiations with customers and anticipated future pricing strategies. The Company recognizes revenue when it satisfies a performance obligation by transferring control over a product to a customer. In addition, from time to time, Autolivthe Company may make payments to customers in connection with ongoing and future business. These payments to customers are generally recognized as a reduction to revenue at the time of the commitment to make these payments unless the payment concession can be clearly linked to the future business. If the payments are capitalized, the amounts are amortized to revenue as the related goods are transferred. Taxes assessed by a governmental authority that are both imposed on and concurrent with a specific revenue-producing transaction that areand collected by the Company from a customer, are excluded from revenue. Shipping and handling costs associated with outbound freight afterbefore control of a product has transferred to a customer are accounted for as a fulfillment cost and are included in cost of sales. Nature of goods and services The following is a description of principal activities from which the Company generates its revenue. The Company has after the spin-off of its Electronics business currently one operating segment, Passive safety systems, which includes airbag and seatbelt products and components. The Company generates revenue from the sale of production parts, which includes airbag and seatbelt products and components, to original equipment manufacturers (“OEMs”).
The Company accounts for individual products separately if they are distinct (i.e., if a product is separately identifiable from other items and if a customer can benefit from it on its own or with other resources that are readily available to the customer). The consideration for each of the products, including any price concessions, or annual price adjustments, is based on their stand-alone selling prices for each of the products.prices. The stand-alone selling prices are determined based on the cost-plus margin approach. The Company recognizes revenue for production parts primarily at a point in time. For production parts with revenue recognized at a point in time, the Company recognizes revenue upon shipment to the customers and transfer of title and risk of loss under standard commercial terms (typically FOB shipping point). There are certain contracts where the criteria to recognize revenue over time have been met (e.g., there is no alternative use to the Company and the Company has an enforceable right to payment). In such cases, at period end, the Company recognizes revenue and a related asset and associated cost of goods sold and inventory. However, the financial impact of these contracts is immaterial considering the very short production cycles and limited inventory days on hand, which is typical for the automotive industry.hand. The contract balances with customers, included in other current assets, amounted to $19.5 million as of December 31, 2020.
The amount of revenue recognized is based on the purchase order price and adjusted for variable consideration (i.e. price concessions or annual price adjustments)concessions). Customers typically pay for the production parts based on customary business practices.
GOVERNMENT GRANTS Generally, the Company receives grants related to assets or grants related to income. The Company account for government grants as follows depending on which category the grants fall into. Government grants connected to Capital Expenditure are offset against the capitalized costs of the asset in the balance sheet when: a) all performance obligations connected to the government grant have been fulfilled; and b) the cash has been received. Other government grants including those reimbursing expenses are recognized in the profit and loss when: a) all performance obligations connected to the government grant have been fulfilled; and b) the cash has been received. When the cash has been received but there are outstanding performance obligations connected to the government grants received, the cash received is recognized as other payables and offset against the capitalized costs when the outstanding performance obligations are fulfilled. RESEARCH, DEVELOPMENT AND ENGINEERING, NET (R,D&E) Research and development and most engineering expenses are expensed as incurred. These expenses are reported net of expense reimbursements from contracts to perform engineering design and product development fulfillment activities related to the production of parts.For the years 2020, 2019 and 2018 total reimbursements from customers were $181 million, $199 million and $192 million, respectively. Certain engineering expenses related to long-term supply arrangements are capitalized when defined criteria, such as the existence of a contractual guarantee for reimbursement, are met. The aggregate amount of such assets is not significant in any period presented. Tooling is generally agreed upon as a separate contract or a separate component of an engineering contract, as a pre-production project. Capitalization of tooling costs is made only when the specific criteria for capitalization of customer funded tooling is met or the criteria for capitalization as Property, Plant & Equipment (P,P&E) for tools owned by the Company are fulfilled. Depreciation on the Company’s own tooling is recognized in the Consolidated Statements of Net Income as Cost of sales. STOCK BASED COMPENSATION The compensation costs for all of the Company’s stock-based compensation awards are determined based on the fair value method as defined in ASC 718, Compensation - Stock Compensation.Compensation. The Company records the compensation expense for awards under the Stock Incentive Plan, including Restricted Stock Units (RSUs), Performance Shares (PSs) and stock options (SOs), over the respective vesting period. For further details, see Note 17. INCOME TAXES Current tax liabilities and assets are recognized for the estimated taxes payable or refundable on the tax returns for the current year. In certain circumstances, payments or refunds may extend beyond twelve months, in such cases amounts would be classified as non-current taxes payable or refundable.receivable. Deferred tax liabilities or assets are recognized for the estimated future tax effects attributable to temporary differences and carryforwards that result from events that have been recognized in either the financial statements or the tax returns, but not both. The measurement of current and deferred tax liabilities and assets is based on provisions of enacted tax laws. Deferred tax assets are reduced by the amount of any tax benefits that are not expected to be realized. A valuation allowance is recognized if, based on the weight of all available evidence, it is more likely than not that some portion, or all, of the deferred tax asset will not be realized. Evaluation of the realizability of deferred tax assets is subject to significant judgment requiring careful consideration of all facts and circumstances. The Company classifies deferred tax assets and liabilities as non-current in the Consolidated Balance Sheet. Tax assets and liabilities are not offset unless attributable to the same tax jurisdiction and netting is possible according to law and, as it relates to payables and receivables, expected to take place in the same period. Tax benefits associated with tax positions taken in the Company’s income tax returns are initially recognized and measured in the financial statements when it is more likely than not that those tax positions will be sustained upon examination by the relevant taxing authorities. The Company’s evaluation of its tax benefits is based on the probability of the tax position being upheld if challenged by the taxing authorities (including through negotiation, appeals, settlement and litigation). Whenever a tax position does not meet the initial recognition criteria, the tax benefit is subsequently recognized and measured if there is a substantive change in the facts and circumstances that cause a change in judgment concerning the sustainability of the tax position upon examination by the relevant taxing authorities. In cases where tax benefits meet the initial recognition criterion, the Company continues, in subsequent periods, to assess its ability to sustain those positions. A previously recognized tax benefit is derecognized when it is no longer more likely than not that the tax position would be sustained upon examination. Liabilities for unrecognized tax benefits are classified as non-current unless the payment of the liability is expected to be made within the next 12 months.
EARNINGS PER SHARERESTRUCTURING PROVISIONS
The Company calculates basic earnings per share (EPS) by dividing net income attributabledefines restructuring expense to controlling interest by the weighted-average numberinclude costs directly associated with capacity alignment programs, plus exit or disposal activities. Estimates of shares of common stock outstanding for the period (net of treasury shares). The Company’s unvested RSUs, of which some include the right to receive non-forfeitable dividend equivalents,restructuring charges are considered participating securities. The diluted EPS reflects the potential dilution that could occur if common stock were issued for awards under the Company’s Stock Incentive Plan and is calculated using the more dilutive method of either the two-class method or the treasury stock method. The treasury stock method assumes that the Company uses the proceeds from the exercise of stock option awards to repurchase ordinary sharesbased on information available at the average market price duringtime such charges are recorded. In general, management anticipates that restructuring activities will be completed within a time frame such that significant changes to the period. For unvested restricted stock, assumed proceeds under the treasury stock method will include unamortized compensation cost and windfall tax benefits or shortfalls. Post spin-off assumed proceeds under the treasury stock method relatedexit plan are not likely. Due to RSUs will only include unamortized compensation cost related to Autoliv employees holding Autoliv RSUs. Calculations of EPS under the two-class method excludeinherent uncertainty involved in estimating restructuring expenses, actual amounts paid for such activities may differ from the numerator any dividends paid or owed on participating securities and any undistributed earnings considered to be attributable to participating securities. The related participating securities are similarly excluded from the denominator. For further details, see Notes 17 and 23.amounts initially estimated.
CASH EQUIVALENTS
The Company considers all highly liquid investment instruments purchased with an original maturity of three months or less to be cash equivalents.
RECEIVABLESDEFINED BENEFIT PENSION PLANS
The Company has guidelinesdefined benefit pension plans in eleven countries. The most significant plans exist in the U.S. These plans represent approximately 60% of the Company’s total pension benefit obligation. See Note 19 to the Consolidated Financial Statements included herein. The Company, in consultation with its actuarial advisors, determines certain key assumptions to be used in calculating the projected benefit obligation and annual pension expense. For the U.S. plans, the assumptions used for calculating the allowance2020 pension expense were a discount rate of 3.25%, expected rate of increase in compensation levels of 2.65%, and an expected long-term rate of return on plan assets of 5.05%. The assumptions used in calculating the U.S. benefit obligations disclosed as of December 31, 2020 were a discount rate of 2.35% and an expected age-based rate of increase in compensation levels of 2.65%. The discount rate for bad debts. Inthe U.S. plans has been set based on the rates of return of high-quality fixed-income investments currently available at the measurement date and are expected to be available during the period the benefits will be paid. The expected rate of increase in compensation levels and long-term return on plan assets are determined based on a number of factors and must take into account long-term expectations and reflect the financial environment in the respective local markets. At December 31, 2020, 42% of the U.S. plan assets were invested in equities, which is in-line with the target of 40%. The table below illustrates the sensitivity of the U.S. net periodic benefit cost and projected U.S. benefit obligation to a 1pp change in the discount rate, decrease in return on plan assets and increase in compensation levels for the U.S. plans (in millions). The use of actuarial assumptions is an area of management’s estimate. Assumption (in millions) | | Change | | 2020 net periodic benefit cost increase (decrease) | | | 2020 projected benefit obligation increase (decrease) | | Discount rate | | 1pp increase | | $ | (0 | ) | | $ | (40 | ) | Discount rate | | 1pp decrease | | | 6 | | | | 49 | | Compensation levels | | 1pp increase | | | 0 | | | | 1 | | Return on plan assets | | 1pp decrease | | | 3 | | | n/a | |
INCOME TAXES Significant judgment is required in determining the amountworldwide provision for income taxes. In the ordinary course of a bad debt allowance, management usesglobal business, there are many transactions for which the ultimate tax outcome is uncertain. Many of these uncertainties arise as a consequence of intercompany transactions. Although the Company believes that its judgment to consider factors such as the age of the receivables, the Company’s prior experience with the customer, the experience of other enterprises in the same industry, the customer’s ability to pay, and/or an appraisal of current economic conditions. Collateral is typically not required. Theretax return positions are supportable, no assurance can be no assurancegiven that the amount ultimately realized for receivablesfinal outcome of these matters will not be materially different than that assumedwhich is reflected in the calculationhistorical income tax provisions and accruals. Such differences could have a material effect on the income tax provisions or benefits in the periods in which such determinations are made. See also the discussion of reserves for uncertain tax positions, and the allowance.determinations of valuation allowances on our deferred tax assets in Note 6, Income Taxes. DERIVATIVE INSTRUMENTS AND HEDGING ACTIVITIESCONTINGENT LIABILITIES
Various claims, lawsuits and proceedings are pending or threatened against the Company or its subsidiaries, covering a range of matters that arise in the ordinary course of its business activities with respect to commercial, product liability or other matters. The Company uses derivative financial instruments, primarily forwards, optionsdiligently defends itself in such matters and, swapsin addition, carries insurance coverage to reduce the effectsextent reasonably available against insurable risks. The Company records liabilities for claims, lawsuits and proceedings when they are probable and it is possible to reasonably estimate the cost of fluctuationssuch liabilities. Legal costs expected to be incurred in foreign exchange rates, interest ratesconnection with a loss contingency are expensed as such costs are incurred. A loss contingency is accrued by a charge to income if it is probable that an asset has been impaired or a liability has been incurred and the resulting variabilityamount of the loss can be reasonably estimated. In determining whether a loss should be accrued management evaluates, among other factors, the degree of probability of an unfavorable outcome and the ability to make a reasonable estimate of the amount of loss. Changes in these factors could materially impact our consolidated financial statements.
Item 7A. Quantitative and Qualitative Disclosures about Market Risk See also Note 2 to the Consolidated Financial Statements of this Annual Report included with this Form 10-K for information about how these risks are quantified. CURRENCY RISKS 1. Transaction Exposure and Revaluation effects Transaction exposure arises because the cost of a product originates in one currency and the product is sold in another currency. Revaluation effects come from valuation of assets denominated in other currencies than the reporting currency of each unit. The Company’s net transaction exposure for 2020 was approximately $2.2 billion. The four largest net exposures are U.S. dollars (sell) against the Mexican Peso, Romanian Lei (buy) against the Euro, U.S. dollars (buy) against Korean Won, USD (sell) against Canadian dollar. Together these currencies accounted for approximately 50% of the Company’s operating results. Onnet currency transaction exposure. Since the dateCompany can only effectively hedge these currency flows in the short term, periodic hedging would only reduce the impact of fluctuations temporarily. Over time, periodic hedging would postpone but not reduce the impact of fluctuations. In addition, the net exposure is limited to only around one quarter of net sales and is made up of around 50 different currency pairs with exposures of more than $1 million each. Autoliv generally does not hedge these flows. 2. Translation Exposure in the Income Statement and Balance Sheet Another effect of exchange rate fluctuations arises when the income statements of non-U.S. subsidiaries are translated into U.S. dollars. Outside the U.S., the Company’s most significant currency is the Euro. We estimate that 29% of the Company’s net sales will be denominated in Euro or other European currencies during 2021, while 22% of net sales is estimated to be denominated in U.S. dollars. The Company estimates that a derivative contract1% increase in the value of the U.S. dollar versus European currencies will decrease reported U.S. dollar annual net sales in 2021 by $25 million or by 0.3% while operating income for 2021 will decline by approximately 0.3% or by about $3 million, assuming reported corporate average margin. The Company’s policy is not to hedge this type of translation exposure. A translation exposure also arises when the balance sheets of non-U.S. subsidiaries are translated into U.S. dollars. The policy of the Company is to finance major subsidiaries in the country’s local currency and to minimize the amounts held by subsidiaries in foreign currency accounts. Consequently, changes in currency rates relating to funding and foreign currency accounts normally have a small impact on the Company’s income. In 2020 and 2019, the impact from the Company’s currency exposure were not material. INTEREST RATE RISK Interest rate risk refers to the risk that interest rate changes will affect the Company’s borrowing costs. Autoliv’s interest rate risk policy states that the average interest rate fixing period should be minimum 1 year and maximum 5 years. At December 31, 2020, the average interest rate fixing period for the Company’s outstanding debt was 2.4 years, and at December 31, 2019, the average interest rate fixing period for the Company’s outstanding debt was 3.4 years. Given the Company’s current capital structure, we estimate that a one-percentage point interest rate increase would decrease net interest expense by approximately $4.2 million, both in 2021 and 2022. This is based on the capital structure at the end of 2020 when the gross fixed-rate debt was $1,651 million while the Company had a net debt position of $1,214 million (see section Non-U.S. GAAP Performance Measures). Thus, a change in the interest rate environment would not have a notable impact on the Company’s interest expense. As of December 31, 2020, the Company had $1,178 million in cash and cash equivalents of which the majority were subject to a floating interest rate. Taking the cash and cash equivalents of $1,178 million (which is primarily subject to floating interest rates) minus the portion of debt carrying floating interest rates, we estimated that a one-percentage point interest rate increase would decrease net interest expense by approximately $4.2 million, both in 2021 and 2022. Fixed interest rate debt is achieved both by issuing fixed rate notes and through interest rate swaps. The most notable debt carrying fixed interest rates is the $1.0 billion U.S. private placement notes issued in 2014 and in June 2018, the Company issued €500 million of 5-year notes in the Eurobond market, see Note 14 to the Consolidated Financial Statements included herein. Given the Company’s capital structure at December 31, 2019, we estimated that a one-percentage point interest rate increase would increase net interest expense by approximately $0.5 million. This was based on the capital structure at the end of 2019 when the gross fixed-rate debt was $1,598 million while the Company had a net debt position of $1,650 million. As of December 31, 2019, the Company had $445 million in cash and cash equivalents of which the majority were subject to a floating interest rate. Taking the cash and cash equivalents of $445 million (which is primarily subject to floating interest rates) minus the portion of debt carrying floating interest rates, we estimated that a one-percentage point interest rate increase would increase net interest expense by approximately $0.5 million.
As the Company had more cash and cash equivalents at the end of 2020 of which the majority were subject to a floating interest rate, we estimated that a one-percentage point interest rate increase would decrease net interest expense. FINANCING RISK Financing risk refers to the risk that it will be difficult and/or expensive to finance new or existing debt to meet the financing needs of the Autoliv Group. The management of the financing risk ensures access to funding in a cost-efficient way by diversification of funding sources and debt maturities. Autoliv has diversified its long-term funding sources by issuing notes in the USPP and Eurobond markets, and by signing a long-term credit agreement with 14 banks. The Company also has a lending facility with the Swedish Export Credit Corporation. The Company also has established programs for short-term issuance of commercial paper in the Swedish and US markets and short-term credit agreements, e.g. bank overdrafts and money market loans. To ensure diversification of debt maturities, no more than 20% of the Autoliv Group’s total debt may mature the next 12 months, unless such maturities (in excess of 20%) are covered by unutilized committed credit facilities with maturity in excess of 12 months. Per December 31, 2020, 13% corresponding to $302million of the Autoliv Group’s total debt had maturity less than 12 months. This amount was fully covered by unutilized committed credit facilities with maturity in excess of 12 months. CAPITAL STRUCTURE AND CREDIT RATING The overall objective relating to Autoliv’s target capital structure and credit rating is to provide the Company with sufficient flexibility to manage the inherent risks and cyclicality in Autoliv’s business and allow the Company to realize strategic opportunities and fund growth initiatives while creating shareholder value. Autoliv is committed to maintain a “strong investment grade credit rating”. As of December 31, 2020, the Company had a long-term credit rating from S&P Global Ratings (“S&P”) of BBB. The amount of interest-bearing debt held impacts the future financial flexibility as well as the credit rating. Management uses the non-U.S. GAAP measure “Leverage Ratio” to analyze the amount of debt the Company can incur under its debt policy. Management believes that this policy also provides guidance to credit and equity investors regarding the extent to which the Company would be prepared to leverage its operations. Autoliv’s long-term target for the leverage ratio (sum of net debt plus pension liabilities divided by EBITDA) is 1.0x with the aim to operate within the range of 0.5x to 1.5x. At December 31, 2020, the leverage ratio (non-U.S. GAAP measure, see calculation table below) was 1.8. For details and calculation of leverage ratio, refer to the table below. CALCULATION OF LEVERAGE RATIO (DOLLARS IN MILLIONS) | | December 31, 2020 | | | December 31, 2019 | | Net debt1) | | $ | 1,214.2 | | | $ | 1,649.8 | | Pension liabilities | | | 248.2 | | | | 240.2 | | Debt per the Policy | | | 1,462.4 | | | | 1,890.0 | | | | | | | | | | | Net income2) | | | 188.3 | | | | 462.8 | | Income taxes2) | | | 102.9 | | | | 185.6 | | Interest expense, net2,3) | | | 68.4 | | | | 65.9 | | Depreciation and amortization of intangibles2) | | | 370.9 | | | | 350.6 | | Antitrust related matters and capacity alignments and separation costs2) | | | 99.5 | | | | 48.6 | | EBITDA per the Policy (Adjusted EBITDA) | | $ | 830.0 | | | $ | 1,113.5 | | Leverage ratio | | | 1.8 | | | | 1.7 | |
1) | Net debt is short- and long-term debt and debt-related derivatives less cash and cash equivalents (non-U.S. GAAP measure). |
3) | Interest expense, net is interest expense including cost for extinguishment of debt, if any, less interest income. |
CREDIT RISK IN FINANCIAL MARKETS Credit risk refers to the risk of a financial counterparty being unable to fulfill an agreed-upon obligation. In the Company’s financial operations, credit risk arises when cash is deposited with banks and when entering into forward exchange agreements, swap contracts or other financial instruments. The policy of the Company is to work with banks that have a high credit rating and that participate in Autoliv’s financing.
To further reduce credit risk, deposits and financial instruments can only be entered into with core banks up to a calculated risk amount of $150 million per bank for banks rated A- or above and up to $50 million for banks rated BBB+. In addition, deposits can be made in U.S. and Swedish government short-term notes and certain AAA rated money market funds, as approved by the Company’s Board of Directors. At year-end 2020, the Company designatesheld $392 million in AAA rated money market funds. IMPAIRMENT RISK Impairment risk refers to the derivativerisk that the Company will write down a material amount of its goodwill of close to $1.4 billion as either (1)of December 31, 2020. This risk is assessed at least annually in the fourth quarter each year when the Company performs its impairment testing. In 2020 the company performed a hedge of the exposure to changes inquantitative impairment testing by calculating the fair value of its goodwill. The estimated fair market value of goodwill is determined by the discounted cash flow method. The Company discounts projected operating cash flows using its weighted average cost of capital. Estimating the fair value requires the Company to make judgments about appropriate discount rates, growth rates, relevant comparable company earnings multiples and the amount and timing of expected future cash flows. It has been concluded that presently the Company is not “at risk” of failing the goodwill impairment test. However, there can be no assurance that goodwill will not be impaired due to future significant declines in LVP, due to our technologies or products becoming obsolete or for any other reason. We could also acquire companies where goodwill could turn out to be less resilient to deteriorations in external conditions. See also discussion under Goodwill and Intangible Assets in Note 2 and Note 11 to the Consolidated Financial Statements included herein. Item 8. Financial Statements and Supplementary Data The Consolidated Balance Sheets of Autoliv as of December 31, 2020 and 2019 and the Consolidated Statements of Income, Comprehensive Income, Cash Flows and Total Equity for each of the three years in the period ended December 31, 2020, the Notes to the Consolidated Financial Statements, and the Reports of the Independent Registered Public Accounting Firm are included below. All of the schedules specified under Regulation S-X to be provided by Autoliv have been omitted either because they are not applicable, are not required or the information required is included in the financial statements or notes thereto.
Report of Independent Registered Public Accounting Firm To the Shareholders and the Board of Directors of Autoliv, Inc. Opinion on the Financial Statements We have audited the accompanying consolidated balance sheets of Autoliv, Inc. (the Company) as of December 31, 2020 and 2019, the related consolidated statements of income, comprehensive income, total equity and cash flows for each of the three years in the period ended December 31, 2020, and the related notes (collectively referred to as the “consolidated financial statements”). In our opinion, the consolidated financial statements present fairly, in all material respects, the financial position of the Company at December 31, 2020 and 2019, and the results of its operations and its cash flows for each of the three years in the period ended December 31, 2020, in conformity with U.S. generally accepted accounting principles. We also have audited, in accordance with the standards of the Public Company Accounting Oversight Board (United States) (PCAOB), the Company's internal control over financial reporting as of December 31, 2020, based on criteria established in Internal Control-Integrated Framework issued by the Committee of Sponsoring Organizations of the Treadway Commission (2013 framework) and our report dated February 19, 2021 expressed an unqualified opinion thereon. Basis for Opinion These financial statements are the responsibility of the Company's management. Our responsibility is to express an opinion on the Company’s financial statements based on our audits. We are a recognized assetpublic accounting firm registered with the PCAOB and are required to be independent with respect to the Company in accordance with the U.S. federal securities laws and the applicable rules and regulations of the Securities and Exchange Commission and the PCAOB. We conducted our audits in accordance with the standards of the PCAOB. Those standards require that we plan and perform the audit to obtain reasonable assurance about whether the financial statements are free of material misstatement, whether due to error or liabilityfraud. Our audits included performing procedures to assess the risks of material misstatement of the financial statements, whether due to error or fraud, and performing procedures that respond to those risks. Such procedures included examining, on a test basis, evidence regarding the amounts and disclosures in the financial statements. Our audits also included evaluating the accounting principles used and significant estimates made by management, as well as evaluating the overall presentation of the financial statements. We believe that our audits provide a reasonable basis for our opinion. Critical Audit Matters The critical audit matters communicated below are matters arising from the current period audit of the financial statements that were communicated or required to be communicated to the audit committee and that: (1) relate to accounts or disclosures that are material to the financial statements and (2) involved especially challenging, subjective, or complex judgments. The communication of critical audit matters does not alter in any way our opinion on the financial statements, taken as a whole, and we are not, by communicating the critical audit matters below, providing separate opinions on the critical audit matters or on the accounts or disclosures to which they relate. | | | | | Revenue recognition – Variable consideration | Description of the
Matter | | As discussed in Note 2 to the consolidated financial statements, the Company measures revenue based on consideration specified in a contract with a customer, adjusted for any variable consideration. Variability in consideration typically results from price concessions. The estimated amount of variable consideration that will be received by the Company is based on assumptions that include historical experience and trends, management’s assessment of the probable outcome of its negotiations with customers and anticipated future pricing strategies. Estimating variable consideration to be received requires significant judgments by management that affect the amount of revenue recorded in the financial statements. Auditing the amount of variable consideration expected to be received was complex because of the uncertainty inherent in the factors discussed above that management uses in its calculations. | How We
Addressed the
Matter in Our Audit | | We obtained an understanding, evaluated the design, and tested the operating effectiveness of internal controls related to variable consideration, including controls related to management’s review of ongoing negotiations with customers. To test the estimated amount of variable consideration expected to be received, our audit procedures included, among others, evaluating the Company’s estimation methodology and testing the significant factors used in the calculations, as discussed above. These procedures included obtaining information from management and sales department representatives who were responsible for negotiations with customers to assess the reasonableness of assumptions related to variable considerations relative to current negotiations. We evaluated the Company’s ability to estimate by comparing actual results to previous estimates and judgments made by management. We also performed journal entry testing focused on unusual and manual entries affecting revenue and on entries that could be indicative of price concessions that may not have been considered in the Company’s assumptions and calculations. |
| | | | | Product recalls | Description of the
Matter | | As discussed in Notes 2 and 13 to the consolidated financial statements, the Company is exposed to product liability claims in the event its products fail to perform as represented and such failure results, or is alleged to result, in bodily injury, and/or property damage or other loss. The Company records liabilities for product recalls when probable claims are identified and when it is possible to reasonably estimate costs. Actual costs incurred could differ from the amounts estimated, requiring adjustments to these reserves in future periods. Provisions for product recalls are estimated based on the expected cost of replacing the product and the customer’s cost of carrying out the recall, which is affected by the number of vehicles subject to recall and the cost of labor and materials to remove and replace the defective product. Auditing the product recall liabilities was complex due to the uncertainty inherent in the assumptions and estimates management uses to calculate these liability balances. These significant assumptions and estimates include the nature, likelihood, timing, and anticipated cost of known and potential claims. | How We
Addressed the
Matter in Our Audit | | We obtained an understanding, evaluated the design, and tested the operating effectiveness of internal controls over the Company’s product recall process, including controls related to management’s review of the estimation calculations and significant assumptions discussed above. To test product recall liabilities, our audit procedures included, among others, evaluating the Company’s estimation methodology and testing the significant assumptions discussed above. We obtained information from Company personnel who are responsible for monitoring the status of product recalls with customers to assess the reasonableness of assumptions used. We evaluated the Company’s ability to estimate by comparing actual results to previous estimates and judgments made by management. We also obtained letters from the Company’s external legal counsel addressing material claims against the Company, if any, and examined relevant third-party automotive safety regulatory information to identify potential unrecorded product recall liabilities. |
/s/ Ernst & Young AB | We have served as the Company´s auditor since 1984. Stockholm, Sweden | February 19, 2021 |
Report of Independent Registered Public Accounting Firm To the Shareholders and the Board of Directors of Autoliv, Inc. Opinion on Internal Control over Financial Reporting We have audited Autoliv, Inc.’s internal control over financial reporting as of December 31, 2020, based on criteria established in Internal Control—Integrated Framework issued by the Committee of Sponsoring Organizations of the Treadway Commission (2013 framework) (the COSO criteria). In our opinion, Autoliv, Inc. (the Company) maintained, in all material respects, effective internal control over financial reporting as of December 31, 2020, based on the COSO criteria. We also have audited, in accordance with the standards of the Public Company Accounting Oversight Board (United States) (PCAOB), the consolidated balance sheets of the Company as of December 31, 2020 and 2019, the related consolidated statements of income, comprehensive income, total equity and cash flows for each of the three years in the period ended December 31, 2020, and the related notes and our report dated February 19, 2021 expressed an unqualified opinion thereon. Basis for Opinion The Company’s management is responsible for maintaining effective internal control over financial reporting and for its assessment of the effectiveness of internal control over financial reporting included in the accompanying Management’s Report on Internal Control over Financial Reporting. Our responsibility is to express an opinion on the Company’s internal control over financial reporting based on our audit. We are a public accounting firm registered with the PCAOB and are required to be independent with respect to the Company in accordance with the U.S. federal securities laws and the applicable rules and regulations of the Securities and Exchange Commission and the PCAOB. We conducted our audit in accordance with the standards of the PCAOB. Those standards require that we plan and perform the audit to obtain reasonable assurance about whether effective internal control over financial reporting was maintained in all material respects. Our audit included obtaining an understanding of internal control over financial reporting, assessing the risk that a material weakness exists, testing and evaluating the design and operating effectiveness of internal control based on the assessed risk, and performing such other procedures as we considered necessary in the circumstances. We believe that our audit provides a reasonable basis for our opinion. Definition and Limitations of Internal Control Over Financial Reporting A company’s internal control over financial reporting is a process designed to provide reasonable assurance regarding the reliability of financial reporting and the preparation of financial statements for external purposes in accordance with generally accepted accounting principles. A company’s internal control over financial reporting includes those policies and procedures that (1) pertain to the maintenance of records that, in reasonable detail, accurately and fairly reflect the transactions and dispositions of the assets of the company; (2) provide reasonable assurance that transactions are recorded as necessary to permit preparation of financial statements in accordance with generally accepted accounting principles, and that receipts and expenditures of the company are being made only in accordance with authorizations of management and directors of the company; and (3) provide reasonable assurance regarding prevention or timely detection of unauthorized acquisition, use, or disposition of the company’s assets that could have a material effect on the financial statements. Because of its inherent limitations, internal control over financial reporting may not prevent or detect misstatements. Also, projections of any evaluation of effectiveness to future periods are subject to the risk that controls may become inadequate because of changes in conditions, or that the degree of compliance with the policies or procedures may deteriorate. /s/ Ernst & Young AB Stockholm, Sweden | | | February 19, 2021 | | |
Consolidated Statements of Income | | | | Years ended December 31 | | (DOLLARS AND SHARES IN MILLIONS, EXCEPT PER SHARE DATA) | | | | 2020 | | | 2019 | | | 2018 | | Net sales | | Note 21 | | $ | 7,447.4 | | | $ | 8,547.6 | | | $ | 8,678.2 | | Cost of sales | | | | | (6,200.5 | ) | | | (6,963.2 | ) | | | (6,966.9 | ) | Gross profit | | | | | 1,246.9 | | | | 1,584.4 | | | | 1,711.3 | | Selling, general and administrative expenses | | | | | (389.2 | ) | | | (398.9 | ) | | | (390.3 | ) | Research, development and engineering expenses, net | | | | | (375.5 | ) | | | (405.5 | ) | | | (412.6 | ) | Amortization of intangibles | | Note 11 | | | (10.0 | ) | | | (11.5 | ) | | | (11.3 | ) | Other income (expense), net | | Notes 12, 18 | | | (90.1 | ) | | | (42.7 | ) | | | (211.1 | ) | Operating income | | | | | 382.1 | | | | 725.8 | | | | 686.0 | | Income from equity method investment | | Note 9 | | | 2.3 | | | | 2.0 | | | | 3.6 | | Interest income | | | | | 4.6 | | | | 3.6 | | | | 6.9 | | Interest expense | | Note 14 | | | (73.0 | ) | | | (69.5 | ) | | | (66.1 | ) | Other non-operating items, net | | | | | (24.8 | ) | | | (13.5 | ) | | | (18.0 | ) | Income from continuing operations before income taxes | | | | | 291.2 | | | | 648.4 | | | | 612.4 | | Income tax expense | | Note 6 | | | (102.9 | ) | | | (185.6 | ) | | | (234.9 | ) | Income from continuing operations | | | | | 188.3 | | | | 462.8 | | | | 377.5 | | Loss from discontinued operations, net of income taxes | | Note 3 | | | — | | | | — | | | | (193.8 | ) | Net income | | | | | 188.3 | | | | 462.8 | | | | 183.7 | | Less: Net income from continuing operations attributable to non-controlling interest | | | | | 1.4 | | | | 1.3 | | | | 1.6 | | Less: Net loss from discontinued operations attributable to non-controlling interest | | | | | — | | | | — | | | | (8.3 | ) | Net income attributable to controlling interest | | | | $ | 186.9 | | | $ | 461.5 | | | $ | 190.4 | | | | | | | | | | | | | | | | | Amounts attributable to controlling interest: | | | | | | | | | | | | | | | Net income from continuing operations | | | | $ | 186.9 | | | $ | 461.5 | | | $ | 375.9 | | Net loss from discontinued operations | | | | | — | | | | — | | | | (185.5 | ) | Net income attributable to controlling interest | | | | $ | 186.9 | | | $ | 461.5 | | | $ | 190.4 | | | | | | | | | | | | | | | | | Earnings per share continuing operations - basic1) | | | | $ | 2.14 | | | $ | 5.29 | | | $ | 4.32 | | Loss per share discontinuing operations - basic1) | | | | | — | | | | — | | | | (2.13 | ) | Basic earnings per share | | | | $ | 2.14 | | | $ | 5.29 | | | $ | 2.19 | | | | | | | | | | | | | | | | | Earnings per share continuing operations - diluted 1) | | | | $ | 2.14 | | | $ | 5.29 | | | $ | 4.31 | | Loss per share discontinuing operations - diluted 1) | | | | | — | | | | — | | | | (2.13 | ) | Diluted earnings per share | | | | $ | 2.14 | | | $ | 5.29 | | | $ | 2.18 | | | | | | | | | | | | | | | | | Weighted average number of shares outstanding, net of treasury shares (in millions) | | | | | 87.3 | | | | 87.2 | | | | 87.1 | | Weighted average number of shares outstanding, assuming dilution and net of treasury shares (in millions) | | | | | 87.5 | | | | 87.4 | | | | 87.3 | | | | | | | | | | | | | | | | | Cash dividend per share - declared | | | | $ | — | | | $ | 2.48 | | | $ | 2.48 | | Cash dividend per share - paid | | | | $ | 0.62 | | | $ | 2.48 | | | $ | 2.46 | |
See Notes to the Consolidated Financial Statements.
| Participating share awards with the right to receive dividend equivalents are (under the two class method) excluded from the earnings per share calculation (see Note 22 in this Annual Report). |
Consolidated Statements of Comprehensive Income | | Years ended December 31 | | (DOLLARS IN MILLIONS) | | 2020 | | | 2019 | | | 2018 | | Net income | | $ | 188.3 | | | $ | 462.8 | | | $ | 183.7 | | Other comprehensive income (loss) before tax: | | | | | | | | | | | | | Change in cumulative translation adjustments | | | 96.9 | | | | 2.0 | | | | (150.2 | ) | Net change in cash flow hedges | | | — | | | | — | | | | 0.9 | | Net change in unrealized components of defined benefit plans | | | 7.5 | | | | (34.6 | ) | | | 14.2 | | Other comprehensive income (loss), before tax | | | 104.4 | | | | (32.6 | ) | | | (135.1 | ) | Tax effect allocated to other comprehensive income (loss) | | | (1.5 | ) | | | 6.8 | | | | (4.1 | ) | Other comprehensive income (loss), net of tax | | | 102.9 | | | | (25.8 | ) | | | (139.2 | ) | Comprehensive income | | | 291.2 | | | | 437.0 | | | | 44.5 | | Less: Comprehensive income (loss) attributable to non-controlling interest | | | 2.3 | | | | 1.2 | | | | (7.4 | ) | Comprehensive income attributable to controlling interest | | $ | 288.9 | | | $ | 435.8 | | | $ | 51.9 | |
See Notes to the Consolidated Financial Statements.
Consolidated Balance Sheets | | | | At December 31 | | (DOLLARS AND SHARES IN MILLIONS) | | | | 2020 | | | 2019 | | Assets | | | | | | | | | | | Cash and cash equivalents | | | | $ | 1,178.2 | | | $ | 444.7 | | Receivables, net | | Note 7 | | | 1,819.6 | | | | 1,623.9 | | Inventories, net | | Note 8 | | | 798.3 | | | | 740.9 | | Income tax receivable | | | | | 44.2 | | | | 26.8 | | Prepaid expenses | | | | | 163.6 | | | | 134.6 | | Related party receivable | | Note 20 | | | 2.0 | | | | 2.8 | | Other current assets | | Note 13, 18 | | | 263.1 | | | | 28.4 | | Total current assets | | | | | 4,269.0 | | | | 3,002.1 | | Property, plant and equipment, net | | Note 10 | | | 1,869.1 | | | | 1,815.7 | | Operating lease right-of-use assets | | Note 4 | | | 140.8 | | | | 156.8 | | Goodwill | | Note 11 | | | 1,398.1 | | | | 1,387.9 | | Intangible assets, net | | Note 11 | | | 13.6 | | | | 22.3 | | Other non-current assets | | Note 9, 18 | | | 466.2 | | | | 386.4 | | Total assets | | | | $ | 8,156.8 | | | $ | 6,771.2 | | Liabilities and equity | | | | | | | | | | | Short-term debt | | Note 14 | | $ | 301.8 | | | $ | 368.1 | | Accounts payable | | | | | 1,226.7 | | | | 941.0 | | Accrued expenses | | Notes 12, 13 | | | 1,259.7 | | | | 816.9 | | Related party liabilities | | Note 20 | | | 37.5 | | | | 17.4 | | Income tax payable | | | | | 97.3 | | | | 38.8 | | Operating lease liabilities, current | | Note 4 | | | 37.3 | | | | 37.8 | | Other current liabilities | | | | | 186.6 | | | | 190.2 | | Total current liabilities | | | | | 3,146.9 | | | | 2,410.2 | | Long-term debt | | Note 14 | | | 2,109.6 | | | | 1,726.1 | | Pension liability | | Note 19 | | | 248.2 | | | | 240.2 | | Operating lease liabilities, non-current | | Note 4 | | | 103.3 | | | | 119.4 | | Other non-current liabilities | | | | | 125.7 | | | | 152.9 | | Total non-current liabilities | | | | | 2,586.8 | | | | 2,238.6 | | Commitments and contingencies | | Note 18 | | | | | | | | | Common stock1) | | | | | 102.8 | | | | 102.8 | | Additional paid-in capital | | | | | 1,329.3 | | | | 1,329.3 | | Retained earnings | | | | | 2,471.1 | | | | 2,283.5 | | Accumulated other comprehensive loss | | Note 15 | | | (346.9 | ) | | | (448.9 | ) | Treasury stock (15.4 and 15.6 shares, respectively) | | | | | (1,147.4 | ) | | | (1,157.5 | ) | Total controlling interest’s equity | | | | | 2,408.9 | | | | 2,109.2 | | Non-controlling interest | | | | | 14.2 | | | | 13.2 | | Total equity | | | | | 2,423.1 | | | | 2,122.4 | | Total liabilities and equity | | | | $ | 8,156.8 | | | $ | 6,771.2 | |
1) | Numberofshares:350 millionauthorized,102.8 millionissuedforbothyears,and87.4 and87.2 millionoutstanding,netoftreasuryshares,for2020 and2019, respectively. |
See Notesto the ConsolidatedFinancialStatements.
Consolidated Statements of Cash Flows | | Years ended December 31 | | (DOLLARS IN MILLIONS) | | 2020 | | | 2019 | | | 2018 | | Operating activities | | | | | | | | | | | | | Net income from continuing operations | | $ | 188.3 | | | $ | 462.8 | | | $ | 377.5 | | Net loss from discontinued operations | | | — | | | | — | | | | (193.8 | ) | Adjustments (non-cash items) to reconcile net income to cash provided by operating activities: | | | | | | | | | | | | | Depreciation and amortization | | | 370.9 | | | | 350.6 | | | | 397.1 | | EC antitrust non-cash provision | | | — | | | | — | | | | 210.0 | | Deferred income taxes | | | (23.9 | ) | | | (16.0 | ) | | | 3.0 | | Loss from equity method investments, net of dividends | | | 0.0 | | | | 4.0 | | | | 31.9 | | Net change in operating capital: | | | | | | | | | | | | | EC antitrust payment | | | — | | | | (203.0 | ) | | | — | | Receivables and other assets, gross | | | (414.7 | ) | | | 25.4 | | | | (48.4 | ) | Inventories, gross | | | (34.0 | ) | | | 15.4 | | | | (123.9 | ) | Accounts payable and accrued expenses | | | 671.7 | | | | 35.7 | | | | (37.8 | ) | Income taxes | | | 53.5 | | | | (29.3 | ) | | | (19.2 | ) | Other, net | | | 37.1 | | | | (4.9 | ) | | | (5.8 | ) | Net cash provided by operating activities | | | 848.9 | | | | 640.7 | | | | 590.6 | | Investing activities | | | | | | | | | | | | | Expenditures for property, plant and equipment | | | (343.5 | ) | | | (483.4 | ) | | | (560.0 | ) | Proceeds from sale of property, plant and equipment | | | 3.9 | | | | 7.3 | | | | 5.2 | | Acquisition of businesses and interest in affiliates, net of cash acquired | | | — | | | | — | | | | (72.0 | ) | Other | | | — | | | | — | | | | (0.9 | ) | Net cash used in investing activities | | | (339.6 | ) | | | (476.1 | ) | | | (627.7 | ) | Financing activities | | | | | | | | | | | | | Net (decrease) increase in short-term debt | | | (239.9 | ) | | | (364.1 | ) | | | 355.4 | | Increase in long-term debt | | | 1,177.1 | | | | 243.5 | | | | 582.2 | | Repayment of long-term debt | | | (722.5 | ) | | | — | | | | — | | Debt issuance costs | | | — | | | | (0.3 | ) | | | (2.6 | ) | Dividends paid to non-controlling interest | | | (1.3 | ) | | | (1.1 | ) | | | (2.1 | ) | Dividends paid | | | (54.1 | ) | | | (217.0 | ) | | | (214.3 | ) | Common stock options exercised | | | 0.8 | | | | 0.9 | | | | 8.2 | | Capital contribution to Veoneer | | | — | | | | — | | | | (971.8 | ) | Net cash provided by (used in) financing activities | | | 160.1 | | | | (338.1 | ) | | | (245.0 | ) | Effect of exchange rate changes on cash and cash equivalents | | | 64.1 | | | | 2.4 | | | | (61.6 | ) | Increase (decrease) in cash and cash equivalents | | | 733.5 | | | | (171.1 | ) | | | (343.7 | ) | Cash and cash equivalents at beginning of year | | | 444.7 | | | | 615.8 | | | | 959.5 | | Cash and cash equivalents at end of year | | $ | 1,178.2 | | | $ | 444.7 | | | $ | 615.8 | |
See Notesto the ConsolidatedFinancialStatements.
Consolidated Statements of Total Equity | | | | | | | | | | | | | | | | | | Accumulated | | | | | | | | | | | | | | | | | | | | | | | | | | | | Additional | | | | | | | other com- | | | | | | | Total parent | | | Non- | | | | | | (DOLLARS AND SHARES | | Number of | | | Common | | | paid in | | | Retained | | | prehensive | | | Treasury | | | shareholders’ | | | controlling | | | Total | | IN MILLIONS) | | shares | | | stock | | | capital | | | earnings | | | (loss) income | | | stock | | | equity | | | interest | | | equity1) | | Balance at December 31, 2017 | | | 102.8 | | | $ | 102.8 | | | $ | 1,329.3 | | | $ | 4,079.2 | | | $ | (287.5 | ) | | $ | (1,188.7 | ) | | $ | 4,035.1 | | | $ | 134.3 | | | $ | 4,169.4 | | Comprehensive Income: | | | | | | | | | | | | | | | | | | | | | | | | | | | | | | | | | | | | | Net income | | | | | | | | | | | | | | | 190.4 | | | | | | | | | | | | 190.4 | | | | (6.7 | ) | | | 183.7 | | Net change in cash flow hedges | | | | | | | | | | | | | | | | | | | 0.9 | | | | | | | | 0.9 | | | | | | | | 0.9 | | Foreign currency translation | | | | | | | | | | | | | | | | | | | (149.5 | ) | | | | | | | (149.5 | ) | | | (0.7 | ) | | | (150.2 | ) | Pension liability | | | | | | | | | | | | | | | | | | | 10.1 | | | | | | | | 10.1 | | | | | | | | 10.1 | | Adjustment due to adoption of ASU 2018-02 | | | | | | | | | | | | | | | 10.2 | | | | (10.2 | ) | | | | | | | — | | | | | | | | — | | Total Comprehensive Income | | | | | | | | | | | | | | | | | | | | | | | | | | | 51.9 | | | | (7.4 | ) | | | 44.5 | | Stock-based compensation | | | | | | | | | | | | | | | | | | | | | | | 21.7 | | | | 21.7 | | | | | | | | 21.7 | | Cash dividends declared | | | | | | | | | | | | | | | (216.7 | ) | | | | | | | | | | | (216.7 | ) | | | | | | | (216.7 | ) | Dividends paid to non-controlling interest on subsidiary shares | | | | | | | | | | | | | | | | | | | | | | | | | | | | | | | (2.2 | ) | | | (2.2 | ) | Adjustment due to adoption of ASU 2014-09 | | | | | | | | | | | | | | | 3.3 | | | | | | | | | | | | 3.3 | | | | | | | | 3.3 | | Distribution of Veoneer | | | | | | | | | | | | | | | (2,024.3 | ) | | | 13.0 | | | | | | | | (2,011.3 | ) | | | (111.6 | ) | | | (2,122.9 | ) | Other | | | | | | | | | | | | | | | (0.3 | ) | | | | | | | | | | | (0.3 | ) | | | | | | | (0.3 | ) | Balance at December 31, 2018 | | | 102.8 | | | $ | 102.8 | | | $ | 1,329.3 | | | $ | 2,041.8 | | | $ | (423.2 | ) | | $ | (1,167.0 | ) | | $ | 1,883.7 | | | $ | 13.1 | | | $ | 1,896.8 | | Comprehensive Income: | | | | | | | | | | | | | | | | | | | | | | | | | | | | | | | | | | | | | Net income | | | | | | | | | | | | | | | 461.5 | | | | | | | | | | | | 461.5 | | | | 1.3 | | | | 462.8 | | Foreign currency translation | | | | | | | �� | | | | | | | | | | | | 2.1 | | | | | | | | 2.1 | | | | (0.1 | ) | | | 2.0 | | Pension liability | | | | | | | | | | | | | | | | | | | (27.8 | ) | | | | | | | (27.8 | ) | | | | | | | (27.8 | ) | Total Comprehensive Income | | | | | | | | | | | | | | | | | | | | | | | | | | | 435.8 | | | | 1.2 | | | | 437.0 | | Stock-based compensation | | | | | | | | | | | | | | | | | | | | | | | 9.5 | | | | 9.5 | | | | | | | | 9.5 | | Cash dividends declared | | | | | | | | | | | | | | | (217.1 | ) | | | | | | | | | | | (217.1 | ) | | | | | | | (217.1 | ) | Dividends paid to non-controlling interest on subsidiary shares | | | | | | | | | | | | | | | | | | | | | | | | | | | | | | | (1.1 | ) | | | (1.1 | ) | Distribution of Veoneer | | | | | | | | | | | | | | | (2.7 | ) | | | | | | | | | | | (2.7 | ) | | | | | | | (2.7 | ) | Balance at December 31, 2019 | | | 102.8 | | | $ | 102.8 | | | $ | 1,329.3 | | | $ | 2,283.5 | | | $ | (448.9 | ) | | $ | (1,157.5 | ) | | $ | 2,109.2 | | | $ | 13.2 | | | $ | 2,122.4 | | Comprehensive Income: | | | | | | | | | | | | | | | | | | | | | | | | | | | | | | | | | | | | | Net income | | | | | | | | | | | | | | | 186.9 | | | | | | | | | | | | 186.9 | | | | 1.4 | | | | 188.3 | | Foreign currency translation | | | | | | | | | | | | | | | | | | | 96.0 | | | | | | | | 96.0 | | | | 0.9 | | | | 96.9 | | Pension liability | | | | | | | | | | | | | | | | | | | 6.0 | | | | | | | | 6.0 | | | | | | | | 6.0 | | Total Comprehensive Income | | | | | | | | | | | | | | | | | | | | | | | | | | | 288.9 | | | | 2.3 | | | | 291.2 | | Stock-based compensation | | | | | | | | | | | | | | | 0.7 | | | | | | | | 10.1 | | | | 10.8 | | | | | | | | 10.8 | | Cash dividends declared | | | | | | | | | | | | | | | | | | | | | | | | | | | — | | | | | | | | — | | Dividends paid to non-controlling interest on subsidiary shares | | | | | | | | | | | | | | | | | | | | | | | | | | | | | | | (1.3 | ) | | | (1.3 | ) | Balance at December 31, 2020 | | | 102.8 | | | $ | 102.8 | | | $ | 1,329.3 | | | $ | 2,471.1 | | | $ | (346.9 | ) | | $ | (1,147.4 | ) | | $ | 2,408.9 | | | $ | 14.2 | | | $ | 2,423.1 | |
1) | See Note 15 for further details – includes tax effects where applicable. |
See Notes to the Consolidated Financial Statements.
Notes to the Consolidated Financial Statements (DOLLARS IN MILLIONS, EXCEPT PER SHARE DATA) 1. Basis of Presentation NATURE OF OPERATIONS Through its operating subsidiaries, Autoliv is a leading developer, manufacturer and supplier of safety systems to the automotive industry. The Company has a broad range of product offerings, primarily passive safety systems, including modules and components for passenger and driver airbags, side airbags, curtain airbags, seatbelts and steering wheels. The Company is also a supplier of anti-whiplash systems and pedestrian protection systems. PRINCIPLES OF CONSOLIDATION The consolidated financial statements have been prepared in accordance with United States (U.S.) Generally Accepted Accounting Principles (GAAP) and include Autoliv, Inc. and all companies over which Autoliv, Inc. directly or indirectly exercises control, which as a general rule means that the Company owns more than 50% of the voting rights. Consolidation is also required when the Company has both the power to direct the activities of a variable interest entity (VIE) and the obligation to absorb losses or the right to receive benefits from the VIE that could be significant to the VIE. All intercompany accounts and transactions within the Company have been eliminated from the consolidated financial statements. Investments in affiliated companies in which the Company exercises significant influence over the operations and financial policies, but does not control, are reported using the equity method of accounting. Generally, the Company owns between 20-50% of such investments. DISCONTINUED OPERATIONS On June 29, 2018 (the “Distribution Date”), Autoliv completed the spin-off of its former Electronics segment (the “spin-off”) through the distribution of all of the issued and outstanding stock of Veoneer, Inc. (“Veoneer”). In accordance with U.S. GAAP, the financial position and results of operations of the Electronics business are presented as discontinued operations and, as such, have been excluded from continuing operations for all periods presented. The sum of the individual earnings per share amounts from continuing operations and discontinued operations may not equal the total company earnings per share amounts due to rounding. The cash flows and comprehensive income related to the Electronics business have not been segregated and are included in the Consolidated Statements of Cash Flows and Comprehensive Income, respectively, for all comparison periods presented. With the exception of Note 3, the Notes to the Consolidated Financial Statements reflect the continuing operations of Autoliv. See Note 3, Discontinued Operations, below for additional information regarding discontinued operations. Responsibility for certain product, warranty and recall liabilities for Electronics products manufactured prior to April 1, 2018 was retained by Autoliv as provided in the Distribution Agreement between Autoliv and Veoneer. Certain amounts in prior year’s consolidated financial statements and related footnotes thereto have been reclassified, unless otherwise noted, to conform with the current year presentation as a result of the spin-off of Veoneer. SEGMENT REPORTING Prior to the spin-off, Autoliv had 2 reportable operating segments: Passive Safety and Electronics. After completion of the spin-off, Autoliv’s remaining business is comprised of passive safety products - principally airbags (including steering wheels and inflators) and seatbelts. In addition, as of August 1, 2019, Autoliv implemented a new organizational structure which has been considered when evaluating the operating and reportable segments in the Company after the spin-off. In accordance with ASC 280, Segment Reporting, the operating segments are determined based on the information provided to the Chief Operating Decision Maker (CODM) on a regular basis and used for the purpose of assessing performance and allocating resources within the Company. The CEO is deemed to be the CODM of Autoliv since he is the person who makes all major decisions on how to allocate the resources and assess the performance of the Company for both strategic and operational initiatives. ASC 280 indicates that a component is an operating segment if it meets the following criteria: | • | It engages in business activities from which it may earn revenues and incur expenses. |
| • | Its operating results are regularly reviewed by the CODM to make decisions about resources to be allocated to the segment and assess its performance. |
| • | Its discrete financial information is available. |
The Company as a whole has met the definition of an unrecognized firm commitment (aoperating segment as it engages in business activities from which it may earn revenues and incur expenses, the consolidated operating results are regularly reviewed by the CEO/CODM to allocate resources and assess performance, and discrete financial information is available. Additionally, as Autoliv supplies customers on a global basis it also manages the business on a global basis. Therefore, based on the above analysis, we have concluded that the Company is the single operating and reportable segment under ASC 280, Segment Reporting. For more information on our segment, see Note 21. 2. Summary of Significant Accounting Policies BUSINESS COMBINATIONS Transactions in which the Company obtains control of a business are accounted for according to the acquisition method as described in ASC 805, Business Combinations. The assets acquired and liabilities assumed are recognized and measured at their fair values as of the date control is obtained. Acquisition related costs in connection with a business combination are expensed as incurred. Contingent consideration is recognized and measured at fair value hedge), (2)at the acquisition date and until paid is re-measured on a hedge of the exposure of a forecasted transaction or of the variability in the cash flows of a recognized asset or liability (a cash flow hedge) or (3) an economic hedge not applying special hedge accounting pursuant to ASC 815. When a hedge isrecurring basis and classified as a fair value hedge,liability.
EQUITY METHOD INVESTMENT Investments accounted for under the changeequity method, means that a proportional share of the equity method investment’s net income increases the investment, and a proportional share of losses and payment of dividends decreases it. In the Consolidated Statements of Net Income, the proportional share of the net income (loss) is reported as Income from equity method investment. USE OF ESTIMATES The preparation of consolidated financial statements in conformity with U.S. GAAP requires management to make estimates and assumptions that affect the reported amounts of assets and liabilities, disclosures of contingent assets and liabilities at the date of the consolidated financial statements, and the reported amounts of net sales and expenses during the reporting period. The accounting estimates that require management’s most significant judgments include the estimation of variable consideration for our contracts with customers, valuation of stock based payments, assessment of recoverability of goodwill and intangible assets, estimation of pension benefit obligations based on actuarial assumptions, estimation of accruals for warranty and recalls, restructuring charges, uncertain tax positions, valuation allowances and legal proceedings. Actual results could differ from those estimates. REVENUE RECOGNITION In accordance with ASC 606, Revenue from Contracts with Customers, revenue is measured based on consideration specified in a contract with a customer, adjusted for any variable consideration (i.e. price concessions) and estimated at contract inception. The estimated amount of variable consideration that will be received by the Company is based on historical experience and trends, management´s understanding of the status of negotiations with customers and anticipated future pricing strategies. The Company recognizes revenue when it satisfies a performance obligation by transferring control over a product to a customer. In addition, from time to time, the Company may make payments to customers in connection with ongoing and future business. These payments to customers are generally recognized as a reduction to revenue at the time of the commitment to make these payments unless the payment can be clearly linked to the future business. If the payments are capitalized, the amounts are amortized to revenue as the related goods are transferred. Taxes assessed by a governmental authority that are both imposed on and concurrent with a specific revenue-producing transaction and collected by the Company from a customer, are excluded from revenue. Shipping and handling costs associated with outbound freight before control of a product has transferred to a customer are accounted for as a fulfillment cost and are included in cost of sales. Nature of goods and services The Company generates revenue from the sale of parts, which includes airbag and seatbelt products and components, to original equipment manufacturers (“OEMs”). The Company accounts for individual products separately if they are distinct (i.e., if a product is separately identifiable from other items and if a customer can benefit from it on its own or with other resources that are readily available to the customer). The consideration for each of the products, including any price concessions, is based on their stand-alone selling prices. The stand-alone selling prices are determined based on the cost-plus margin approach. The Company recognizes revenue for parts primarily at a point in time. For parts with revenue recognized at a point in time, the Company recognizes revenue upon shipment to the customers and transfer of title and risk of loss under standard commercial terms (typically FOB shipping point). There are certain contracts where the criteria to recognize revenue over time have been met (e.g., there is no alternative use to the Company and the Company has an enforceable right to payment). In such cases, at period end, the Company recognizes revenue and a related asset and associated cost of goods sold and inventory. However, the financial impact of these contracts is immaterial considering the very short production cycles and limited inventory days on hand. The contract balances with customers, included in other current assets, amounted to $19.5 million as of December 31, 2020.
The amount of revenue recognized is based on the purchase order price and adjusted for variable consideration (i.e. price concessions). Customers typically pay for the parts based on customary business practices. GOVERNMENT GRANTS Generally, the Company receives grants related to assets or grants related to income. The Company account for government grants as follows depending on which category the grants fall into. Government grants connected to Capital Expenditure are offset against the capitalized costs of the asset in the fair valuebalance sheet when: a) all performance obligations connected to the government grant have been fulfilled; and b) the cash has been received. Other government grants including those reimbursing expenses are recognized in the profit and loss when: a) all performance obligations connected to the government grant have been fulfilled; and b) the cash has been received. When the cash has been received but there are outstanding performance obligations connected to the government grants received, the cash received is recognized as other payables and offset against the capitalized costs when the outstanding performance obligations are fulfilled. RESEARCH, DEVELOPMENT AND ENGINEERING, NET (R,D&E) Research and development and most engineering expenses are expensed as incurred. These expenses are reported net of expense reimbursements from contracts to perform engineering design and product development fulfillment activities related to the hedgeproduction of parts.For the years 2020, 2019 and 2018 total reimbursements from customers were $181 million, $199 million and $192 million, respectively. Certain engineering expenses related to long-term supply arrangements are capitalized when defined criteria, such as the existence of a contractual guarantee for reimbursement, are met. The aggregate amount of such assets is not significant in any period presented. Tooling is generally agreed upon as a separate contract or a separate component of an engineering contract, as a pre-production project. Capitalization of tooling costs is made only when the specific criteria for capitalization of customer funded tooling is met or the criteria for capitalization as Property, Plant & Equipment (P,P&E) for tools owned by the Company are fulfilled. Depreciation on the Company’s own tooling is recognized in the Consolidated Statements of Net Income along withas Cost of sales. STOCK BASED COMPENSATION The compensation costs for all of the offsetting change inCompany’s stock-based compensation awards are determined based on the fair value method as defined in ASC 718, Compensation - Stock Compensation. The Company records the compensation expense for awards under the Stock Incentive Plan, including Restricted Stock Units (RSUs), Performance Shares (PSs) and stock options (SOs), over the respective vesting period. For further details, see Note 17. INCOME TAXES Current tax liabilities and assets are recognized for the estimated taxes payable or refundable on the tax returns for the current year. In certain circumstances, payments or refunds may extend beyond twelve months, in such cases amounts would be classified as non-current taxes payable or receivable. Deferred tax liabilities or assets are recognized for the estimated future tax effects attributable to temporary differences and carryforwards that result from events that have been recognized in either the financial statements or the tax returns, but not both. The measurement of current and deferred tax liabilities and assets is based on provisions of enacted tax laws. Deferred tax assets are reduced by the amount of any tax benefits that are not expected to be realized. A valuation allowance is recognized if, based on the weight of all available evidence, it is more likely than not that some portion, or all, of the hedged item. When a hedgedeferred tax asset will not be realized. Evaluation of the realizability of deferred tax assets is classifiedsubject to significant judgment requiring careful consideration of all facts and circumstances. The Company classifies deferred tax assets and liabilities as a cash flow hedge, any changenon-current in the fair valueConsolidated Balance Sheet. Tax assets and liabilities are not offset unless attributable to the same tax jurisdiction and netting is possible according to law and, as it relates to payables and receivables, expected to take place in the same period. Tax benefits associated with tax positions taken in the Company’s income tax returns are initially recognized when it is more likely than not that those tax positions will be sustained upon examination by the relevant taxing authorities. The Company’s evaluation of its tax benefits is based on the probability of the hedge is initially recorded in equity astax position being upheld if challenged by the taxing authorities (including through negotiation, appeals, settlement and litigation). Whenever a component of Other Comprehensive Income (OCI) and reclassified into the Consolidated Statements of Net Income when the hedge transaction affects net earnings. The Company uses the forward rate with respect to the measurement of changes in fair value of cash flow hedges when revaluing foreign exchange forward contracts. All derivatives are recognized in the consolidated financial statements at fair value. For certain other derivatives, hedge accounting is not applied either because non-hedge accounting treatment creates the same accounting result or the hedgetax position does not meet the hedge accounting requirements, although entered into applyinginitial recognition criteria, the same rationale concerning mitigating market risk that occurs from changes in interest and foreign exchange rates.
For further details on the Company’s financial instruments, see Notes 5 and 14.
INVENTORIES
The cost of inventoriestax benefit is computed according to the first-in first-out method (FIFO). Cost includes the cost of materials, direct labor and the applicable share of manufacturing overhead. Inventories are evaluated based on individual or, in some cases, groups of inventory items. Reserves are established to reduce the value of inventories to the lower of cost and net realizable value. Net realizable valuesubsequently recognized if there is the estimated selling pricesa substantive change in the ordinary course of business, less reasonably predictable costs of completion, disposalfacts and transportation. Excess inventories are quantities of itemscircumstances that exceed anticipated sales or usage forcause a reasonable period. The Company has guidelines for calculating provisions for excess inventories based onchange in judgment concerning the number of months of inventories on hand compared to anticipated sales or usage. Management uses its judgment to forecast sales or usage and to determine what constitutes a reasonable period. There can be no assurance that the amount ultimately realized for inventories will not be materially different than that assumed in the calculationsustainability of the reserves.
PROPERTY, PLANT AND EQUIPMENT
Property, Plant and Equipment are recorded at historical cost. Constructiontax position upon examination by the relevant taxing authorities. In cases where tax benefits meet the initial recognition criterion, the Company continues, in progress generally involves short-term projects for which capitalized interestsubsequent periods, to assess its ability to sustain those positions. A previously recognized tax benefit is not significant. The Company provides for depreciation of property, plant and equipment computed under the straight-line method over the assets’ estimated useful lives, or in the case of leasehold improvements over the shorter of the useful life or the lease term. Amortization on capital leases is recognized with depreciation expense in the Consolidated Statements of Net Income over the shorter of the assets’ expected life or the lease contract term. Repairs and maintenance are expensed as incurred.
LONG-LIVED ASSET IMPAIRMENT
The Company evaluates the carrying value and useful lives of long-lived assets other than goodwillderecognized when indications of impairment are evident or it is likely that the useful lives have decreased, in which case the Company depreciates the assets over the remaining useful lives. Impairment testing is primarily done by using the cash flow method based on undiscounted future cash flows. Estimated undiscounted cash flows for a long-lived asset being evaluated for recoverability are compared with the respective carrying amount of that asset. If the estimated undiscounted cash flows exceed the carrying amount of the assets, the carrying amounts of the long-lived asset are considered recoverable and an impairment cannot be recorded. However, if the carrying amount of a group of assets exceeds the undiscounted cash flows, an entity must then measure the long-lived assets’ fair value to determine whether an impairment loss should be recognized, generally using a discounted cash flow model. Generally, the lowest level of cash flows for impairment assessment is customer platform level.
GOODWILL AND INTANGIBLE ASSETS
Goodwill represents the excess of the fair value of consideration transferred over the fair value of net assets of businesses acquired. Goodwill is not amortized, but is subject to at least an annual review for impairment. Other intangible assets, principally related to acquired technology, are amortized over their useful lives which range from 3 to 25 years.
The Company performs its annual impairment testing in the fourth quarter of each year. Impairment testing is required more often than annually if an event or circumstance indicates that an impairment, or decline in value, may have occurred. For 2018 the Company has opted to use a qualitative assessment for impairment testing. The qualitative assessment permits the Company to assess whether it is more than likely than not (i.e. a likelihood of greater than 50%) that an indefinite-lived intangible asset is impaired. If the Company concludes based on the qualitative assessment that it is notno longer more likely than not that the fair valuetax position would be sustained upon examination. Liabilities for unrecognized tax benefits are classified as non-current unless the payment of an indefinite-lived intangible assetsthe liability is less than its carrying amount, it would not haveexpected to quantitatively determinebe made within the asset’s fair value.next 12 months.
In conducting its qualitative impairment testing, the Company has used the most recent fair value calculation for its indefinite-lived intangible assets as the starting point for the qualitative assessment. The Company has also considered external factors that could affect the significant inputs used to determine fair value.
There were no impairments of goodwill related to the Company’s continuing operations from 2016 through 2018.
WARRANTIES AND RECALLS
The Company records liabilities for product recalls when probable claims are identified and when it is possible to reasonably estimate costs. Recall costs are costs incurred when the customer decides to formally recall a product due to a known or suspected safety concern. Product recall costs typically include the cost of the product being replaced as well as the customer’s cost of the recall, including labor to remove and replace the defective part. Insurance receivables, related to recall issues covered by the insurance, are included within other current assets in the Consolidated Balance Sheets.
Provisions for warranty claims are estimated based on prior experience, likely changes in performance of newer products and the mix and volume of products sold. The provisions are recorded on an accrual basis.
RESTRUCTURING PROVISIONS The Company defines restructuring expense to include costs directly associated with capacity alignment programs, plus exit or disposal activities. Estimates of restructuring charges are based on information available at the time such charges are recorded. In general, management anticipates that restructuring activities will be completed within a time frame such that significant changes to the exit plan are not likely. Due to inherent uncertainty involved in estimating restructuring expenses, actual amounts paid for such activities may differ from amounts initially estimated.
DEFINED BENEFIT PENSION PLANS The Company has defined benefit pension plans in eleven countries. The most significant plans exist in the U.S. These plans represent approximately 60% of the Company’s total pension benefit obligation. See Note 19 to the Consolidated Financial Statements included herein. The Company, in consultation with its actuarial advisors, determines certain key assumptions to be used in calculating the projected benefit obligation and annual pension expense. For the U.S. plans, the assumptions used for calculating the 2020 pension expense were a discount rate of 3.25%, expected rate of increase in compensation levels of 2.65%, and an expected long-term rate of return on plan assets of 5.05%. The assumptions used in calculating the U.S. benefit obligations disclosed as of December 31, 2020 were a discount rate of 2.35% and an expected age-based rate of increase in compensation levels of 2.65%. The discount rate for the U.S. plans has been set based on the rates of return of high-quality fixed-income investments currently available at the measurement date and are expected to be available during the period the benefits will be paid. The expected rate of increase in compensation levels and long-term return on plan assets are determined based on a number of factors and must take into account long-term expectations and reflect the financial environment in the respective local markets. At December 31, 2020, 42% of the U.S. plan assets were invested in equities, which is in-line with the target of 40%. The table below illustrates the sensitivity of the U.S. net periodic benefit cost and projected U.S. benefit obligation to a 1pp change in the discount rate, decrease in return on plan assets and increase in compensation levels for the U.S. plans (in millions). The use of actuarial assumptions is an area of management’s estimate. Assumption (in millions) | | Change | | 2020 net periodic benefit cost increase (decrease) | | | 2020 projected benefit obligation increase (decrease) | | Discount rate | | 1pp increase | | $ | (0 | ) | | $ | (40 | ) | Discount rate | | 1pp decrease | | | 6 | | | | 49 | | Compensation levels | | 1pp increase | | | 0 | | | | 1 | | Return on plan assets | | 1pp decrease | | | 3 | | | n/a | |
INCOME TAXES Significant judgment is required in determining the worldwide provision for income taxes. In the ordinary course of a global business, there are many transactions for which the ultimate tax outcome is uncertain. Many of these uncertainties arise as a consequence of intercompany transactions. Although the Company believes that its tax return positions are supportable, no assurance can be given that the final outcome of these matters will not be materially different than that which is reflected in the historical income tax provisions and accruals. Such differences could have a material effect on the income tax provisions or benefits in the periods in which such determinations are made. See also the discussion of reserves for uncertain tax positions, and the determinations of valuation allowances on our deferred tax assets in Note 6, Income Taxes. CONTINGENT LIABILITIES Various claims, lawsuits and proceedings are pending or threatened against the Company or its subsidiaries, covering a range of matters that arise in the ordinary course of its business activities with respect to commercial, product liability or other matters. The Company diligently defends itself in such matters and, in addition, carries insurance coverage to the extent reasonably available against insurable risks. The Company records liabilities for claims, lawsuits and proceedings when they are probable and it is possible to reasonably estimate the cost of such liabilities. Legal costs expected to be incurred in connection with a loss contingency are expensed as such costs are incurred. A loss contingency is accrued by a charge to income if it is probable that an asset has been impaired or a liability has been incurred and the amount of the loss can be reasonably estimated. In determining whether a loss should be accrued management evaluates, among other factors, the degree of probability of an unfavorable outcome and the ability to make a reasonable estimate of the amount of loss. Changes in these factors could materially impact our consolidated financial statements.
Item 7A. Quantitative and Qualitative Disclosures about Market Risk See also Note 2 to the Consolidated Financial Statements of this Annual Report included with this Form 10-K for information about how these risks are quantified. CURRENCY RISKS 1. Transaction Exposure and Revaluation effects Transaction exposure arises because the cost of a product originates in one currency and the product is sold in another currency. Revaluation effects come from valuation of assets denominated in other currencies than the reporting currency of each unit. The Company’s net transaction exposure for 2020 was approximately $2.2 billion. The four largest net exposures are U.S. dollars (sell) against the Mexican Peso, Romanian Lei (buy) against the Euro, U.S. dollars (buy) against Korean Won, USD (sell) against Canadian dollar. Together these currencies accounted for approximately 50% of the Company’s net currency transaction exposure. Since the Company can only effectively hedge these currency flows in the short term, periodic hedging would only reduce the impact of fluctuations temporarily. Over time, periodic hedging would postpone but not reduce the impact of fluctuations. In addition, the net exposure is limited to only around one quarter of net sales and is made up of around 50 different currency pairs with exposures of more than $1 million each. Autoliv generally does not hedge these flows. 2. Translation Exposure in the Income Statement and Balance Sheet Another effect of exchange rate fluctuations arises when the income statements of non-U.S. subsidiaries are translated into U.S. dollars. Outside the U.S., the Company’s most significant currency is the Euro. We estimate that 29% of the Company’s net sales will be denominated in Euro or other European currencies during 2021, while 22% of net sales is estimated to be denominated in U.S. dollars. The Company estimates that a 1% increase in the value of the U.S. dollar versus European currencies will decrease reported U.S. dollar annual net sales in 2021 by $25 million or by 0.3% while operating income for 2021 will decline by approximately 0.3% or by about $3 million, assuming reported corporate average margin. The Company’s policy is not to hedge this type of translation exposure. A translation exposure also arises when the balance sheets of non-U.S. subsidiaries are translated into U.S. dollars. The policy of the Company is to finance major subsidiaries in the country’s local currency and to minimize the amounts held by subsidiaries in foreign currency accounts. Consequently, changes in currency rates relating to funding and foreign currency accounts normally have a small impact on the Company’s income. In 2020 and 2019, the impact from the Company’s currency exposure were not material. INTEREST RATE RISK Interest rate risk refers to the risk that interest rate changes will affect the Company’s borrowing costs. Autoliv’s interest rate risk policy states that the average interest rate fixing period should be minimum 1 year and maximum 5 years. At December 31, 2020, the average interest rate fixing period for the Company’s outstanding debt was 2.4 years, and at December 31, 2019, the average interest rate fixing period for the Company’s outstanding debt was 3.4 years. Given the Company’s current capital structure, we estimate that a one-percentage point interest rate increase would decrease net interest expense by approximately $4.2 million, both in 2021 and 2022. This is based on the capital structure at the end of 2020 when the gross fixed-rate debt was $1,651 million while the Company had a net debt position of $1,214 million (see section Non-U.S. GAAP Performance Measures). Thus, a change in the interest rate environment would not have a notable impact on the Company’s interest expense. As of December 31, 2020, the Company had $1,178 million in cash and cash equivalents of which the majority were subject to a floating interest rate. Taking the cash and cash equivalents of $1,178 million (which is primarily subject to floating interest rates) minus the portion of debt carrying floating interest rates, we estimated that a one-percentage point interest rate increase would decrease net interest expense by approximately $4.2 million, both in 2021 and 2022. Fixed interest rate debt is achieved both by issuing fixed rate notes and through interest rate swaps. The most notable debt carrying fixed interest rates is the $1.0 billion U.S. private placement notes issued in 2014 and in June 2018, the Company issued €500 million of 5-year notes in the Eurobond market, see Note 14 to the Consolidated Financial Statements included herein. Given the Company’s capital structure at December 31, 2019, we estimated that a one-percentage point interest rate increase would increase net interest expense by approximately $0.5 million. This was based on the capital structure at the end of 2019 when the gross fixed-rate debt was $1,598 million while the Company had a net debt position of $1,650 million. As of December 31, 2019, the Company had $445 million in cash and cash equivalents of which the majority were subject to a floating interest rate. Taking the cash and cash equivalents of $445 million (which is primarily subject to floating interest rates) minus the portion of debt carrying floating interest rates, we estimated that a one-percentage point interest rate increase would increase net interest expense by approximately $0.5 million.
As the Company had more cash and cash equivalents at the end of 2020 of which the majority were subject to a floating interest rate, we estimated that a one-percentage point interest rate increase would decrease net interest expense. FINANCING RISK Financing risk refers to the risk that it will be difficult and/or expensive to finance new or existing debt to meet the financing needs of the Autoliv Group. The management of the financing risk ensures access to funding in a cost-efficient way by diversification of funding sources and debt maturities. Autoliv has diversified its long-term funding sources by issuing notes in the USPP and Eurobond markets, and by signing a long-term credit agreement with 14 banks. The Company also has a lending facility with the Swedish Export Credit Corporation. The Company also has established programs for short-term issuance of commercial paper in the Swedish and US markets and short-term credit agreements, e.g. bank overdrafts and money market loans. To ensure diversification of debt maturities, no more than 20% of the Autoliv Group’s total debt may mature the next 12 months, unless such maturities (in excess of 20%) are covered by unutilized committed credit facilities with maturity in excess of 12 months. Per December 31, 2020, 13% corresponding to $302million of the Autoliv Group’s total debt had maturity less than 12 months. This amount was fully covered by unutilized committed credit facilities with maturity in excess of 12 months. CAPITAL STRUCTURE AND CREDIT RATING The overall objective relating to Autoliv’s target capital structure and credit rating is to provide the Company with sufficient flexibility to manage the inherent risks and cyclicality in Autoliv’s business and allow the Company to realize strategic opportunities and fund growth initiatives while creating shareholder value. Autoliv is committed to maintain a “strong investment grade credit rating”. As of December 31, 2020, the Company had a long-term credit rating from S&P Global Ratings (“S&P”) of BBB. The amount of interest-bearing debt held impacts the future financial flexibility as well as the credit rating. Management uses the non-U.S. GAAP measure “Leverage Ratio” to analyze the amount of debt the Company can incur under its debt policy. Management believes that this policy also provides guidance to credit and equity investors regarding the extent to which the Company would be prepared to leverage its operations. Autoliv’s long-term target for the leverage ratio (sum of net debt plus pension liabilities divided by EBITDA) is 1.0x with the aim to operate within the range of 0.5x to 1.5x. At December 31, 2020, the leverage ratio (non-U.S. GAAP measure, see calculation table below) was 1.8. For details and calculation of leverage ratio, refer to the table below. CALCULATION OF LEVERAGE RATIO (DOLLARS IN MILLIONS) | | December 31, 2020 | | | December 31, 2019 | | Net debt1) | | $ | 1,214.2 | | | $ | 1,649.8 | | Pension liabilities | | | 248.2 | | | | 240.2 | | Debt per the Policy | | | 1,462.4 | | | | 1,890.0 | | | | | | | | | | | Net income2) | | | 188.3 | | | | 462.8 | | Income taxes2) | | | 102.9 | | | | 185.6 | | Interest expense, net2,3) | | | 68.4 | | | | 65.9 | | Depreciation and amortization of intangibles2) | | | 370.9 | | | | 350.6 | | Antitrust related matters and capacity alignments and separation costs2) | | | 99.5 | | | | 48.6 | | EBITDA per the Policy (Adjusted EBITDA) | | $ | 830.0 | | | $ | 1,113.5 | | Leverage ratio | | | 1.8 | | | | 1.7 | |
1) | Net debt is short- and long-term debt and debt-related derivatives less cash and cash equivalents (non-U.S. GAAP measure). |
3) | Interest expense, net is interest expense including cost for extinguishment of debt, if any, less interest income. |
CREDIT RISK IN FINANCIAL MARKETS Credit risk refers to the risk of a financial counterparty being unable to fulfill an agreed-upon obligation. In the Company’s financial operations, credit risk arises when cash is deposited with banks and when entering into forward exchange agreements, swap contracts or other financial instruments. The policy of the Company is to work with banks that have a high credit rating and that participate in Autoliv’s financing.
To further reduce credit risk, deposits and financial instruments can only be entered into with core banks up to a calculated risk amount of $150 million per bank for banks rated A- or above and up to $50 million for banks rated BBB+. In addition, deposits can be made in U.S. and Swedish government short-term notes and certain AAA rated money market funds, as approved by the Company’s Board of Directors. At year-end 2020, the Company held $392 million in AAA rated money market funds. IMPAIRMENT RISK Impairment risk refers to the risk that the Company will write down a material amount of its goodwill of close to $1.4 billion as of December 31, 2020. This risk is assessed at least annually in the fourth quarter each year when the Company performs its impairment testing. In 2020 the company performed a quantitative impairment testing by calculating the fair value of its goodwill. The estimated fair market value of goodwill is determined by the discounted cash flow method. The Company discounts projected operating cash flows using its weighted average cost of capital. Estimating the fair value requires the Company to make judgments about appropriate discount rates, growth rates, relevant comparable company earnings multiples and the amount and timing of expected future cash flows. It has been concluded that presently the Company is not “at risk” of failing the goodwill impairment test. However, there can be no assurance that goodwill will not be impaired due to future significant declines in LVP, due to our technologies or products becoming obsolete or for any other reason. We could also acquire companies where goodwill could turn out to be less resilient to deteriorations in external conditions. See also discussion under Goodwill and Intangible Assets in Note 2 and Note 11 to the Consolidated Financial Statements included herein. Item 8. Financial Statements and Supplementary Data The Consolidated Balance Sheets of Autoliv as of December 31, 2020 and 2019 and the Consolidated Statements of Income, Comprehensive Income, Cash Flows and Total Equity for each of the three years in the period ended December 31, 2020, the Notes to the Consolidated Financial Statements, and the Reports of the Independent Registered Public Accounting Firm are included below. All of the schedules specified under Regulation S-X to be provided by Autoliv have been omitted either because they are not applicable, are not required or the information required is included in the financial statements or notes thereto.
Report of Independent Registered Public Accounting Firm To the Shareholders and the Board of Directors of Autoliv, Inc. Opinion on the Financial Statements We have audited the accompanying consolidated balance sheets of Autoliv, Inc. (the Company) as of December 31, 2020 and 2019, the related consolidated statements of income, comprehensive income, total equity and cash flows for each of the three years in the period ended December 31, 2020, and the related notes (collectively referred to as the “consolidated financial statements”). In our opinion, the consolidated financial statements present fairly, in all material respects, the financial position of the Company at December 31, 2020 and 2019, and the results of its operations and its cash flows for each of the three years in the period ended December 31, 2020, in conformity with U.S. generally accepted accounting principles. We also have audited, in accordance with the standards of the Public Company Accounting Oversight Board (United States) (PCAOB), the Company's internal control over financial reporting as of December 31, 2020, based on criteria established in Internal Control-Integrated Framework issued by the Committee of Sponsoring Organizations of the Treadway Commission (2013 framework) and our report dated February 19, 2021 expressed an unqualified opinion thereon. Basis for Opinion These financial statements are the responsibility of the Company's management. Our responsibility is to express an opinion on the Company’s financial statements based on our audits. We are a public accounting firm registered with the PCAOB and are required to be independent with respect to the Company in accordance with the U.S. federal securities laws and the applicable rules and regulations of the Securities and Exchange Commission and the PCAOB. We conducted our audits in accordance with the standards of the PCAOB. Those standards require that we plan and perform the audit to obtain reasonable assurance about whether the financial statements are free of material misstatement, whether due to error or fraud. Our audits included performing procedures to assess the risks of material misstatement of the financial statements, whether due to error or fraud, and performing procedures that respond to those risks. Such procedures included examining, on a test basis, evidence regarding the amounts and disclosures in the financial statements. Our audits also included evaluating the accounting principles used and significant estimates made by management, as well as evaluating the overall presentation of the financial statements. We believe that our audits provide a reasonable basis for our opinion. Critical Audit Matters The critical audit matters communicated below are matters arising from the current period audit of the financial statements that were communicated or required to be communicated to the audit committee and that: (1) relate to accounts or disclosures that are material to the financial statements and (2) involved especially challenging, subjective, or complex judgments. The communication of critical audit matters does not alter in any way our opinion on the financial statements, taken as a whole, and we are not, by communicating the critical audit matters below, providing separate opinions on the critical audit matters or on the accounts or disclosures to which they relate. | | | | | Revenue recognition – Variable consideration | Description of the
Matter | | As discussed in Note 2 to the consolidated financial statements, the Company measures revenue based on consideration specified in a contract with a customer, adjusted for any variable consideration. Variability in consideration typically results from price concessions. The estimated amount of variable consideration that will be received by the Company is based on assumptions that include historical experience and trends, management’s assessment of the probable outcome of its negotiations with customers and anticipated future pricing strategies. Estimating variable consideration to be received requires significant judgments by management that affect the amount of revenue recorded in the financial statements. Auditing the amount of variable consideration expected to be received was complex because of the uncertainty inherent in the factors discussed above that management uses in its calculations. | How We
Addressed the
Matter in Our Audit | | We obtained an understanding, evaluated the design, and tested the operating effectiveness of internal controls related to variable consideration, including controls related to management’s review of ongoing negotiations with customers. To test the estimated amount of variable consideration expected to be received, our audit procedures included, among others, evaluating the Company’s estimation methodology and testing the significant factors used in the calculations, as discussed above. These procedures included obtaining information from management and sales department representatives who were responsible for negotiations with customers to assess the reasonableness of assumptions related to variable considerations relative to current negotiations. We evaluated the Company’s ability to estimate by comparing actual results to previous estimates and judgments made by management. We also performed journal entry testing focused on unusual and manual entries affecting revenue and on entries that could be indicative of price concessions that may not have been considered in the Company’s assumptions and calculations. |
| | | | | Product recalls | Description of the
Matter | | As discussed in Notes 2 and 13 to the consolidated financial statements, the Company is exposed to product liability claims in the event its products fail to perform as represented and such failure results, or is alleged to result, in bodily injury, and/or property damage or other loss. The Company records liabilities for product recalls when probable claims are identified and when it is possible to reasonably estimate costs. Actual costs incurred could differ from the amounts estimated, requiring adjustments to these reserves in future periods. Provisions for product recalls are estimated based on the expected cost of replacing the product and the customer’s cost of carrying out the recall, which is affected by the number of vehicles subject to recall and the cost of labor and materials to remove and replace the defective product. Auditing the product recall liabilities was complex due to the uncertainty inherent in the assumptions and estimates management uses to calculate these liability balances. These significant assumptions and estimates include the nature, likelihood, timing, and anticipated cost of known and potential claims. | How We
Addressed the
Matter in Our Audit | | We obtained an understanding, evaluated the design, and tested the operating effectiveness of internal controls over the Company’s product recall process, including controls related to management’s review of the estimation calculations and significant assumptions discussed above. To test product recall liabilities, our audit procedures included, among others, evaluating the Company’s estimation methodology and testing the significant assumptions discussed above. We obtained information from Company personnel who are responsible for monitoring the status of product recalls with customers to assess the reasonableness of assumptions used. We evaluated the Company’s ability to estimate by comparing actual results to previous estimates and judgments made by management. We also obtained letters from the Company’s external legal counsel addressing material claims against the Company, if any, and examined relevant third-party automotive safety regulatory information to identify potential unrecorded product recall liabilities. |
/s/ Ernst & Young AB | We have served as the Company´s auditor since 1984. Stockholm, Sweden | February 19, 2021 |
Report of Independent Registered Public Accounting Firm To the Shareholders and the Board of Directors of Autoliv, Inc. Opinion on Internal Control over Financial Reporting We have audited Autoliv, Inc.’s internal control over financial reporting as of December 31, 2020, based on criteria established in Internal Control—Integrated Framework issued by the Committee of Sponsoring Organizations of the Treadway Commission (2013 framework) (the COSO criteria). In our opinion, Autoliv, Inc. (the Company) maintained, in all material respects, effective internal control over financial reporting as of December 31, 2020, based on the COSO criteria. We also have audited, in accordance with the standards of the Public Company Accounting Oversight Board (United States) (PCAOB), the consolidated balance sheets of the Company as of December 31, 2020 and 2019, the related consolidated statements of income, comprehensive income, total equity and cash flows for each of the three years in the period ended December 31, 2020, and the related notes and our report dated February 19, 2021 expressed an unqualified opinion thereon. Basis for Opinion The Company’s management is responsible for maintaining effective internal control over financial reporting and for its assessment of the effectiveness of internal control over financial reporting included in the accompanying Management’s Report on Internal Control over Financial Reporting. Our responsibility is to express an opinion on the Company’s internal control over financial reporting based on our audit. We are a public accounting firm registered with the PCAOB and are required to be independent with respect to the Company in accordance with the U.S. federal securities laws and the applicable rules and regulations of the Securities and Exchange Commission and the PCAOB. We conducted our audit in accordance with the standards of the PCAOB. Those standards require that we plan and perform the audit to obtain reasonable assurance about whether effective internal control over financial reporting was maintained in all material respects. Our audit included obtaining an understanding of internal control over financial reporting, assessing the risk that a material weakness exists, testing and evaluating the design and operating effectiveness of internal control based on the assessed risk, and performing such other procedures as we considered necessary in the circumstances. We believe that our audit provides a reasonable basis for our opinion. Definition and Limitations of Internal Control Over Financial Reporting A company’s internal control over financial reporting is a process designed to provide reasonable assurance regarding the reliability of financial reporting and the preparation of financial statements for external purposes in accordance with generally accepted accounting principles. A company’s internal control over financial reporting includes those policies and procedures that (1) pertain to the maintenance of records that, in reasonable detail, accurately and fairly reflect the transactions and dispositions of the assets of the company; (2) provide reasonable assurance that transactions are recorded as necessary to permit preparation of financial statements in accordance with generally accepted accounting principles, and that receipts and expenditures of the company are being made only in accordance with authorizations of management and directors of the company; and (3) provide reasonable assurance regarding prevention or timely detection of unauthorized acquisition, use, or disposition of the company’s assets that could have a material effect on the financial statements. Because of its inherent limitations, internal control over financial reporting may not prevent or detect misstatements. Also, projections of any evaluation of effectiveness to future periods are subject to the risk that controls may become inadequate because of changes in conditions, or that the degree of compliance with the policies or procedures may deteriorate. /s/ Ernst & Young AB Stockholm, Sweden | | | February 19, 2021 | | |
Consolidated Statements of Income | | | | Years ended December 31 | | (DOLLARS AND SHARES IN MILLIONS, EXCEPT PER SHARE DATA) | | | | 2020 | | | 2019 | | | 2018 | | Net sales | | Note 21 | | $ | 7,447.4 | | | $ | 8,547.6 | | | $ | 8,678.2 | | Cost of sales | | | | | (6,200.5 | ) | | | (6,963.2 | ) | | | (6,966.9 | ) | Gross profit | | | | | 1,246.9 | | | | 1,584.4 | | | | 1,711.3 | | Selling, general and administrative expenses | | | | | (389.2 | ) | | | (398.9 | ) | | | (390.3 | ) | Research, development and engineering expenses, net | | | | | (375.5 | ) | | | (405.5 | ) | | | (412.6 | ) | Amortization of intangibles | | Note 11 | | | (10.0 | ) | | | (11.5 | ) | | | (11.3 | ) | Other income (expense), net | | Notes 12, 18 | | | (90.1 | ) | | | (42.7 | ) | | | (211.1 | ) | Operating income | | | | | 382.1 | | | | 725.8 | | | | 686.0 | | Income from equity method investment | | Note 9 | | | 2.3 | | | | 2.0 | | | | 3.6 | | Interest income | | | | | 4.6 | | | | 3.6 | | | | 6.9 | | Interest expense | | Note 14 | | | (73.0 | ) | | | (69.5 | ) | | | (66.1 | ) | Other non-operating items, net | | | | | (24.8 | ) | | | (13.5 | ) | | | (18.0 | ) | Income from continuing operations before income taxes | | | | | 291.2 | | | | 648.4 | | | | 612.4 | | Income tax expense | | Note 6 | | | (102.9 | ) | | | (185.6 | ) | | | (234.9 | ) | Income from continuing operations | | | | | 188.3 | | | | 462.8 | | | | 377.5 | | Loss from discontinued operations, net of income taxes | | Note 3 | | | — | | | | — | | | | (193.8 | ) | Net income | | | | | 188.3 | | | | 462.8 | | | | 183.7 | | Less: Net income from continuing operations attributable to non-controlling interest | | | | | 1.4 | | | | 1.3 | | | | 1.6 | | Less: Net loss from discontinued operations attributable to non-controlling interest | | | | | — | | | | — | | | | (8.3 | ) | Net income attributable to controlling interest | | | | $ | 186.9 | | | $ | 461.5 | | | $ | 190.4 | | | | | | | | | | | | | | | | | Amounts attributable to controlling interest: | | | | | | | | | | | | | | | Net income from continuing operations | | | | $ | 186.9 | | | $ | 461.5 | | | $ | 375.9 | | Net loss from discontinued operations | | | | | — | | | | — | | | | (185.5 | ) | Net income attributable to controlling interest | | | | $ | 186.9 | | | $ | 461.5 | | | $ | 190.4 | | | | | | | | | | | | | | | | | Earnings per share continuing operations - basic1) | | | | $ | 2.14 | | | $ | 5.29 | | | $ | 4.32 | | Loss per share discontinuing operations - basic1) | | | | | — | | | | — | | | | (2.13 | ) | Basic earnings per share | | | | $ | 2.14 | | | $ | 5.29 | | | $ | 2.19 | | | | | | | | | | | | | | | | | Earnings per share continuing operations - diluted 1) | | | | $ | 2.14 | | | $ | 5.29 | | | $ | 4.31 | | Loss per share discontinuing operations - diluted 1) | | | | | — | | | | — | | | | (2.13 | ) | Diluted earnings per share | | | | $ | 2.14 | | | $ | 5.29 | | | $ | 2.18 | | | | | | | | | | | | | | | | | Weighted average number of shares outstanding, net of treasury shares (in millions) | | | | | 87.3 | | | | 87.2 | | | | 87.1 | | Weighted average number of shares outstanding, assuming dilution and net of treasury shares (in millions) | | | | | 87.5 | | | | 87.4 | | | | 87.3 | | | | | | | | | | | | | | | | | Cash dividend per share - declared | | | | $ | — | | | $ | 2.48 | | | $ | 2.48 | | Cash dividend per share - paid | | | | $ | 0.62 | | | $ | 2.48 | | | $ | 2.46 | |
See Notes to the Consolidated Financial Statements.
| Participating share awards with the right to receive dividend equivalents are (under the two class method) excluded from the earnings per share calculation (see Note 22 in this Annual Report). |
Consolidated Statements of Comprehensive Income | | Years ended December 31 | | (DOLLARS IN MILLIONS) | | 2020 | | | 2019 | | | 2018 | | Net income | | $ | 188.3 | | | $ | 462.8 | | | $ | 183.7 | | Other comprehensive income (loss) before tax: | | | | | | | | | | | | | Change in cumulative translation adjustments | | | 96.9 | | | | 2.0 | | | | (150.2 | ) | Net change in cash flow hedges | | | — | | | | — | | | | 0.9 | | Net change in unrealized components of defined benefit plans | | | 7.5 | | | | (34.6 | ) | | | 14.2 | | Other comprehensive income (loss), before tax | | | 104.4 | | | | (32.6 | ) | | | (135.1 | ) | Tax effect allocated to other comprehensive income (loss) | | | (1.5 | ) | | | 6.8 | | | | (4.1 | ) | Other comprehensive income (loss), net of tax | | | 102.9 | | | | (25.8 | ) | | | (139.2 | ) | Comprehensive income | | | 291.2 | | | | 437.0 | | | | 44.5 | | Less: Comprehensive income (loss) attributable to non-controlling interest | | | 2.3 | | | | 1.2 | | | | (7.4 | ) | Comprehensive income attributable to controlling interest | | $ | 288.9 | | | $ | 435.8 | | | $ | 51.9 | |
See Notes to the Consolidated Financial Statements.
Consolidated Balance Sheets | | | | At December 31 | | (DOLLARS AND SHARES IN MILLIONS) | | | | 2020 | | | 2019 | | Assets | | | | | | | | | | | Cash and cash equivalents | | | | $ | 1,178.2 | | | $ | 444.7 | | Receivables, net | | Note 7 | | | 1,819.6 | | | | 1,623.9 | | Inventories, net | | Note 8 | | | 798.3 | | | | 740.9 | | Income tax receivable | | | | | 44.2 | | | | 26.8 | | Prepaid expenses | | | | | 163.6 | | | | 134.6 | | Related party receivable | | Note 20 | | | 2.0 | | | | 2.8 | | Other current assets | | Note 13, 18 | | | 263.1 | | | | 28.4 | | Total current assets | | | | | 4,269.0 | | | | 3,002.1 | | Property, plant and equipment, net | | Note 10 | | | 1,869.1 | | | | 1,815.7 | | Operating lease right-of-use assets | | Note 4 | | | 140.8 | | | | 156.8 | | Goodwill | | Note 11 | | | 1,398.1 | | | | 1,387.9 | | Intangible assets, net | | Note 11 | | | 13.6 | | | | 22.3 | | Other non-current assets | | Note 9, 18 | | | 466.2 | | | | 386.4 | | Total assets | | | | $ | 8,156.8 | | | $ | 6,771.2 | | Liabilities and equity | | | | | | | | | | | Short-term debt | | Note 14 | | $ | 301.8 | | | $ | 368.1 | | Accounts payable | | | | | 1,226.7 | | | | 941.0 | | Accrued expenses | | Notes 12, 13 | | | 1,259.7 | | | | 816.9 | | Related party liabilities | | Note 20 | | | 37.5 | | | | 17.4 | | Income tax payable | | | | | 97.3 | | | | 38.8 | | Operating lease liabilities, current | | Note 4 | | | 37.3 | | | | 37.8 | | Other current liabilities | | | | | 186.6 | | | | 190.2 | | Total current liabilities | | | | | 3,146.9 | | | | 2,410.2 | | Long-term debt | | Note 14 | | | 2,109.6 | | | | 1,726.1 | | Pension liability | | Note 19 | | | 248.2 | | | | 240.2 | | Operating lease liabilities, non-current | | Note 4 | | | 103.3 | | | | 119.4 | | Other non-current liabilities | | | | | 125.7 | | | | 152.9 | | Total non-current liabilities | | | | | 2,586.8 | | | | 2,238.6 | | Commitments and contingencies | | Note 18 | | | | | | | | | Common stock1) | | | | | 102.8 | | | | 102.8 | | Additional paid-in capital | | | | | 1,329.3 | | | | 1,329.3 | | Retained earnings | | | | | 2,471.1 | | | | 2,283.5 | | Accumulated other comprehensive loss | | Note 15 | | | (346.9 | ) | | | (448.9 | ) | Treasury stock (15.4 and 15.6 shares, respectively) | | | | | (1,147.4 | ) | | | (1,157.5 | ) | Total controlling interest’s equity | | | | | 2,408.9 | | | | 2,109.2 | | Non-controlling interest | | | | | 14.2 | | | | 13.2 | | Total equity | | | | | 2,423.1 | | | | 2,122.4 | | Total liabilities and equity | | | | $ | 8,156.8 | | | $ | 6,771.2 | |
1) | Numberofshares:350 millionauthorized,102.8 millionissuedforbothyears,and87.4 and87.2 millionoutstanding,netoftreasuryshares,for2020 and2019, respectively. |
See Notesto the ConsolidatedFinancialStatements.
Consolidated Statements of Cash Flows | | Years ended December 31 | | (DOLLARS IN MILLIONS) | | 2020 | | | 2019 | | | 2018 | | Operating activities | | | | | | | | | | | | | Net income from continuing operations | | $ | 188.3 | | | $ | 462.8 | | | $ | 377.5 | | Net loss from discontinued operations | | | — | | | | — | | | | (193.8 | ) | Adjustments (non-cash items) to reconcile net income to cash provided by operating activities: | | | | | | | | | | | | | Depreciation and amortization | | | 370.9 | | | | 350.6 | | | | 397.1 | | EC antitrust non-cash provision | | | — | | | | — | | | | 210.0 | | Deferred income taxes | | | (23.9 | ) | | | (16.0 | ) | | | 3.0 | | Loss from equity method investments, net of dividends | | | 0.0 | | | | 4.0 | | | | 31.9 | | Net change in operating capital: | | | | | | | | | | | | | EC antitrust payment | | | — | | | | (203.0 | ) | | | — | | Receivables and other assets, gross | | | (414.7 | ) | | | 25.4 | | | | (48.4 | ) | Inventories, gross | | | (34.0 | ) | | | 15.4 | | | | (123.9 | ) | Accounts payable and accrued expenses | | | 671.7 | | | | 35.7 | | | | (37.8 | ) | Income taxes | | | 53.5 | | | | (29.3 | ) | | | (19.2 | ) | Other, net | | | 37.1 | | | | (4.9 | ) | | | (5.8 | ) | Net cash provided by operating activities | | | 848.9 | | | | 640.7 | | | | 590.6 | | Investing activities | | | | | | | | | | | | | Expenditures for property, plant and equipment | | | (343.5 | ) | | | (483.4 | ) | | | (560.0 | ) | Proceeds from sale of property, plant and equipment | | | 3.9 | | | | 7.3 | | | | 5.2 | | Acquisition of businesses and interest in affiliates, net of cash acquired | | | — | | | | — | | | | (72.0 | ) | Other | | | — | | | | — | | | | (0.9 | ) | Net cash used in investing activities | | | (339.6 | ) | | | (476.1 | ) | | | (627.7 | ) | Financing activities | | | | | | | | | | | | | Net (decrease) increase in short-term debt | | | (239.9 | ) | | | (364.1 | ) | | | 355.4 | | Increase in long-term debt | | | 1,177.1 | | | | 243.5 | | | | 582.2 | | Repayment of long-term debt | | | (722.5 | ) | | | — | | | | — | | Debt issuance costs | | | — | | | | (0.3 | ) | | | (2.6 | ) | Dividends paid to non-controlling interest | | | (1.3 | ) | | | (1.1 | ) | | | (2.1 | ) | Dividends paid | | | (54.1 | ) | | | (217.0 | ) | | | (214.3 | ) | Common stock options exercised | | | 0.8 | | | | 0.9 | | | | 8.2 | | Capital contribution to Veoneer | | | — | | | | — | | | | (971.8 | ) | Net cash provided by (used in) financing activities | | | 160.1 | | | | (338.1 | ) | | | (245.0 | ) | Effect of exchange rate changes on cash and cash equivalents | | | 64.1 | | | | 2.4 | | | | (61.6 | ) | Increase (decrease) in cash and cash equivalents | | | 733.5 | | | | (171.1 | ) | | | (343.7 | ) | Cash and cash equivalents at beginning of year | | | 444.7 | | | | 615.8 | | | | 959.5 | | Cash and cash equivalents at end of year | | $ | 1,178.2 | | | $ | 444.7 | | | $ | 615.8 | |
See Notesto the ConsolidatedFinancialStatements.
Consolidated Statements of Total Equity | | | | | | | | | | | | | | | | | | Accumulated | | | | | | | | | | | | | | | | | | | | | | | | | | | | Additional | | | | | | | other com- | | | | | | | Total parent | | | Non- | | | | | | (DOLLARS AND SHARES | | Number of | | | Common | | | paid in | | | Retained | | | prehensive | | | Treasury | | | shareholders’ | | | controlling | | | Total | | IN MILLIONS) | | shares | | | stock | | | capital | | | earnings | | | (loss) income | | | stock | | | equity | | | interest | | | equity1) | | Balance at December 31, 2017 | | | 102.8 | | | $ | 102.8 | | | $ | 1,329.3 | | | $ | 4,079.2 | | | $ | (287.5 | ) | | $ | (1,188.7 | ) | | $ | 4,035.1 | | | $ | 134.3 | | | $ | 4,169.4 | | Comprehensive Income: | | | | | | | | | | | | | | | | | | | | | | | | | | | | | | | | | | | | | Net income | | | | | | | | | | | | | | | 190.4 | | | | | | | | | | | | 190.4 | | | | (6.7 | ) | | | 183.7 | | Net change in cash flow hedges | | | | | | | | | | | | | | | | | | | 0.9 | | | | | | | | 0.9 | | | | | | | | 0.9 | | Foreign currency translation | | | | | | | | | | | | | | | | | | | (149.5 | ) | | | | | | | (149.5 | ) | | | (0.7 | ) | | | (150.2 | ) | Pension liability | | | | | | | | | | | | | | | | | | | 10.1 | | | | | | | | 10.1 | | | | | | | | 10.1 | | Adjustment due to adoption of ASU 2018-02 | | | | | | | | | | | | | | | 10.2 | | | | (10.2 | ) | | | | | | | — | | | | | | | | — | | Total Comprehensive Income | | | | | | | | | | | | | | | | | | | | | | | | | | | 51.9 | | | | (7.4 | ) | | | 44.5 | | Stock-based compensation | | | | | | | | | | | | | | | | | | | | | | | 21.7 | | | | 21.7 | | | | | | | | 21.7 | | Cash dividends declared | | | | | | | | | | | | | | | (216.7 | ) | | | | | | | | | | | (216.7 | ) | | | | | | | (216.7 | ) | Dividends paid to non-controlling interest on subsidiary shares | | | | | | | | | | | | | | | | | | | | | | | | | | | | | | | (2.2 | ) | | | (2.2 | ) | Adjustment due to adoption of ASU 2014-09 | | | | | | | | | | | | | | | 3.3 | | | | | | | | | | | | 3.3 | | | | | | | | 3.3 | | Distribution of Veoneer | | | | | | | | | | | | | | | (2,024.3 | ) | | | 13.0 | | | | | | | | (2,011.3 | ) | | | (111.6 | ) | | | (2,122.9 | ) | Other | | | | | | | | | | | | | | | (0.3 | ) | | | | | | | | | | | (0.3 | ) | | | | | | | (0.3 | ) | Balance at December 31, 2018 | | | 102.8 | | | $ | 102.8 | | | $ | 1,329.3 | | | $ | 2,041.8 | | | $ | (423.2 | ) | | $ | (1,167.0 | ) | | $ | 1,883.7 | | | $ | 13.1 | | | $ | 1,896.8 | | Comprehensive Income: | | | | | | | | | | | | | | | | | | | | | | | | | | | | | | | | | | | | | Net income | | | | | | | | | | | | | | | 461.5 | | | | | | | | | | | | 461.5 | | | | 1.3 | | | | 462.8 | | Foreign currency translation | | | | | | | �� | | | | | | | | | | | | 2.1 | | | | | | | | 2.1 | | | | (0.1 | ) | | | 2.0 | | Pension liability | | | | | | | | | | | | | | | | | | | (27.8 | ) | | | | | | | (27.8 | ) | | | | | | | (27.8 | ) | Total Comprehensive Income | | | | | | | | | | | | | | | | | | | | | | | | | | | 435.8 | | | | 1.2 | | | | 437.0 | | Stock-based compensation | | | | | | | | | | | | | | | | | | | | | | | 9.5 | | | | 9.5 | | | | | | | | 9.5 | | Cash dividends declared | | | | | | | | | | | | | | | (217.1 | ) | | | | | | | | | | | (217.1 | ) | | | | | | | (217.1 | ) | Dividends paid to non-controlling interest on subsidiary shares | | | | | | | | | | | | | | | | | | | | | | | | | | | | | | | (1.1 | ) | | | (1.1 | ) | Distribution of Veoneer | | | | | | | | | | | | | | | (2.7 | ) | | | | | | | | | | | (2.7 | ) | | | | | | | (2.7 | ) | Balance at December 31, 2019 | | | 102.8 | | | $ | 102.8 | | | $ | 1,329.3 | | | $ | 2,283.5 | | | $ | (448.9 | ) | | $ | (1,157.5 | ) | | $ | 2,109.2 | | | $ | 13.2 | | | $ | 2,122.4 | | Comprehensive Income: | | | | | | | | | | | | | | | | | | | | | | | | | | | | | | | | | | | | | Net income | | | | | | | | | | | | | | | 186.9 | | | | | | | | | | | | 186.9 | | | | 1.4 | | | | 188.3 | | Foreign currency translation | | | | | | | | | | | | | | | | | | | 96.0 | | | | | | | | 96.0 | | | | 0.9 | | | | 96.9 | | Pension liability | | | | | | | | | | | | | | | | | | | 6.0 | | | | | | | | 6.0 | | | | | | | | 6.0 | | Total Comprehensive Income | | | | | | | | | | | | | | | | | | | | | | | | | | | 288.9 | | | | 2.3 | | | | 291.2 | | Stock-based compensation | | | | | | | | | | | | | | | 0.7 | | | | | | | | 10.1 | | | | 10.8 | | | | | | | | 10.8 | | Cash dividends declared | | | | | | | | | | | | | | | | | | | | | | | | | | | — | | | | | | | | — | | Dividends paid to non-controlling interest on subsidiary shares | | | | | | | | | | | | | | | | | | | | | | | | | | | | | | | (1.3 | ) | | | (1.3 | ) | Balance at December 31, 2020 | | | 102.8 | | | $ | 102.8 | | | $ | 1,329.3 | | | $ | 2,471.1 | | | $ | (346.9 | ) | | $ | (1,147.4 | ) | | $ | 2,408.9 | | | $ | 14.2 | | | $ | 2,423.1 | |
1) | See Note 15 for further details – includes tax effects where applicable. |
See Notes to the Consolidated Financial Statements.
Notes to the Consolidated Financial Statements (DOLLARS IN MILLIONS, EXCEPT PER SHARE DATA) 1. Basis of Presentation NATURE OF OPERATIONS Through its operating subsidiaries, Autoliv is a leading developer, manufacturer and supplier of safety systems to the automotive industry. The Company has a broad range of product offerings, primarily passive safety systems, including modules and components for passenger and driver airbags, side airbags, curtain airbags, seatbelts and steering wheels. The Company is also a supplier of anti-whiplash systems and pedestrian protection systems. PRINCIPLES OF CONSOLIDATION The consolidated financial statements have been prepared in accordance with United States (U.S.) Generally Accepted Accounting Principles (GAAP) and include Autoliv, Inc. and all companies over which Autoliv, Inc. directly or indirectly exercises control, which as a general rule means that the Company owns more than 50% of the voting rights. Consolidation is also required when the Company has both the power to direct the activities of a variable interest entity (VIE) and the obligation to absorb losses or the right to receive benefits from the VIE that could be significant to the VIE. All intercompany accounts and transactions within the Company have been eliminated from the consolidated financial statements. Investments in affiliated companies in which the Company exercises significant influence over the operations and financial policies, but does not control, are reported using the equity method of accounting. Generally, the Company owns between 20-50% of such investments. DISCONTINUED OPERATIONS On June 29, 2018 (the “Distribution Date”), Autoliv completed the spin-off of its former Electronics segment (the “spin-off”) through the distribution of all of the issued and outstanding stock of Veoneer, Inc. (“Veoneer”). In accordance with U.S. GAAP, the financial position and results of operations of the Electronics business are presented as discontinued operations and, as such, have been excluded from continuing operations for all periods presented. The sum of the individual earnings per share amounts from continuing operations and discontinued operations may not equal the total company earnings per share amounts due to rounding. The cash flows and comprehensive income related to the Electronics business have not been segregated and are included in the Consolidated Statements of Cash Flows and Comprehensive Income, respectively, for all comparison periods presented. With the exception of Note 3, the Notes to the Consolidated Financial Statements reflect the continuing operations of Autoliv. See Note 3, Discontinued Operations, below for additional information regarding discontinued operations. Responsibility for certain product, warranty and recall liabilities for Electronics products manufactured prior to April 1, 2018 was retained by Autoliv as provided in the Distribution Agreement between Autoliv and Veoneer. Certain amounts in prior year’s consolidated financial statements and related footnotes thereto have been reclassified, unless otherwise noted, to conform with the current year presentation as a result of the spin-off of Veoneer. SEGMENT REPORTING Prior to the spin-off, Autoliv had 2 reportable operating segments: Passive Safety and Electronics. After completion of the spin-off, Autoliv’s remaining business is comprised of passive safety products - principally airbags (including steering wheels and inflators) and seatbelts. In addition, as of August 1, 2019, Autoliv implemented a new organizational structure which has been considered when evaluating the operating and reportable segments in the Company after the spin-off. In accordance with ASC 280, Segment Reporting, the operating segments are determined based on the information provided to the Chief Operating Decision Maker (CODM) on a regular basis and used for the purpose of assessing performance and allocating resources within the Company. The CEO is deemed to be the CODM of Autoliv since he is the person who makes all major decisions on how to allocate the resources and assess the performance of the Company for both strategic and operational initiatives. ASC 280 indicates that a component is an operating segment if it meets the following criteria: | • | It engages in business activities from which it may earn revenues and incur expenses. |
| • | Its operating results are regularly reviewed by the CODM to make decisions about resources to be allocated to the segment and assess its performance. |
| • | Its discrete financial information is available. |
The Company as a whole has met the definition of an operating segment as it engages in business activities from which it may earn revenues and incur expenses, the consolidated operating results are regularly reviewed by the CEO/CODM to allocate resources and assess performance, and discrete financial information is available. Additionally, as Autoliv supplies customers on a global basis it also manages the business on a global basis. Therefore, based on the above analysis, we have concluded that the Company is the single operating and reportable segment under ASC 280, Segment Reporting. For more information on our segment, see Note 21. 2. Summary of Significant Accounting Policies BUSINESS COMBINATIONS Transactions in which the Company obtains control of a business are accounted for according to the acquisition method as described in ASC 805, Business Combinations. The assets acquired and liabilities assumed are recognized and measured at their fair values as of the date control is obtained. Acquisition related costs in connection with a business combination are expensed as incurred. Contingent consideration is recognized and measured at fair value at the acquisition date and until paid is re-measured on a recurring basis and classified as a liability. EQUITY METHOD INVESTMENT Investments accounted for under the equity method, means that a proportional share of the equity method investment’s net income increases the investment, and a proportional share of losses and payment of dividends decreases it. In the Consolidated Statements of Net Income, the proportional share of the net income (loss) is reported as Income from equity method investment. USE OF ESTIMATES The preparation of consolidated financial statements in conformity with U.S. GAAP requires management to make estimates and assumptions that affect the reported amounts of assets and liabilities, disclosures of contingent assets and liabilities at the date of the consolidated financial statements, and the reported amounts of net sales and expenses during the reporting period. The accounting estimates that require management’s most significant judgments include the estimation of variable consideration for our contracts with customers, valuation of stock based payments, assessment of recoverability of goodwill and intangible assets, estimation of pension benefit obligations based on actuarial assumptions, estimation of accruals for warranty and recalls, restructuring charges, uncertain tax positions, valuation allowances and legal proceedings. Actual results could differ from those estimates. REVENUE RECOGNITION In accordance with ASC 606, Revenue from Contracts with Customers, revenue is measured based on consideration specified in a contract with a customer, adjusted for any variable consideration (i.e. price concessions) and estimated at contract inception. The estimated amount of variable consideration that will be received by the Company is based on historical experience and trends, management´s understanding of the status of negotiations with customers and anticipated future pricing strategies. The Company recognizes revenue when it satisfies a performance obligation by transferring control over a product to a customer. In addition, from time to time, the Company may make payments to customers in connection with ongoing and future business. These payments to customers are generally recognized as a reduction to revenue at the time of the commitment to make these payments unless the payment can be clearly linked to the future business. If the payments are capitalized, the amounts are amortized to revenue as the related goods are transferred. Taxes assessed by a governmental authority that are both imposed on and concurrent with a specific revenue-producing transaction and collected by the Company from a customer, are excluded from revenue. Shipping and handling costs associated with outbound freight before control of a product has transferred to a customer are accounted for as a fulfillment cost and are included in cost of sales. Nature of goods and services The Company generates revenue from the sale of parts, which includes airbag and seatbelt products and components, to original equipment manufacturers (“OEMs”). The Company accounts for individual products separately if they are distinct (i.e., if a product is separately identifiable from other items and if a customer can benefit from it on its own or with other resources that are readily available to the customer). The consideration for each of the products, including any price concessions, is based on their stand-alone selling prices. The stand-alone selling prices are determined based on the cost-plus margin approach. The Company recognizes revenue for parts primarily at a point in time. For parts with revenue recognized at a point in time, the Company recognizes revenue upon shipment to the customers and transfer of title and risk of loss under standard commercial terms (typically FOB shipping point). There are certain contracts where the criteria to recognize revenue over time have been met (e.g., there is no alternative use to the Company and the Company has an enforceable right to payment). In such cases, at period end, the Company recognizes revenue and a related asset and associated cost of goods sold and inventory. However, the financial impact of these contracts is immaterial considering the very short production cycles and limited inventory days on hand. The contract balances with customers, included in other current assets, amounted to $19.5 million as of December 31, 2020.
The amount of revenue recognized is based on the purchase order price and adjusted for variable consideration (i.e. price concessions). Customers typically pay for the parts based on customary business practices. GOVERNMENT GRANTS Generally, the Company receives grants related to assets or grants related to income. The Company account for government grants as follows depending on which category the grants fall into. Government grants connected to Capital Expenditure are offset against the capitalized costs of the asset in the balance sheet when: a) all performance obligations connected to the government grant have been fulfilled; and b) the cash has been received. Other government grants including those reimbursing expenses are recognized in the profit and loss when: a) all performance obligations connected to the government grant have been fulfilled; and b) the cash has been received. When the cash has been received but there are outstanding performance obligations connected to the government grants received, the cash received is recognized as other payables and offset against the capitalized costs when the outstanding performance obligations are fulfilled. RESEARCH, DEVELOPMENT AND ENGINEERING, NET (R,D&E) Research and development and most engineering expenses are expensed as incurred. These expenses are reported net of expense reimbursements from contracts to perform engineering design and product development fulfillment activities related to the production of parts.For the years 2020, 2019 and 2018 total reimbursements from customers were $181 million, $199 million and $192 million, respectively. Certain engineering expenses related to long-term supply arrangements are capitalized when defined criteria, such as the existence of a contractual guarantee for reimbursement, are met. The aggregate amount of such assets is not significant in any period presented. Tooling is generally agreed upon as a separate contract or a separate component of an engineering contract, as a pre-production project. Capitalization of tooling costs is made only when the specific criteria for capitalization of customer funded tooling is met or the criteria for capitalization as Property, Plant & Equipment (P,P&E) for tools owned by the Company are fulfilled. Depreciation on the Company’s own tooling is recognized in the Consolidated Statements of Income as Cost of sales. STOCK BASED COMPENSATION The compensation costs for all of the Company’s stock-based compensation awards are determined based on the fair value method as defined in ASC 718, Compensation - Stock Compensation. The Company records the compensation expense for awards under the Stock Incentive Plan, including Restricted Stock Units (RSUs), Performance Shares (PSs) and stock options (SOs), over the respective vesting period. For further details, see Note 17. INCOME TAXES Current tax liabilities and assets are recognized for the estimated taxes payable or refundable on the tax returns for the current year. In certain circumstances, payments or refunds may extend beyond twelve months, in such cases amounts would be classified as non-current taxes payable or receivable. Deferred tax liabilities or assets are recognized for the estimated future tax effects attributable to temporary differences and carryforwards that result from events that have been recognized in either the financial statements or the tax returns, but not both. The measurement of current and deferred tax liabilities and assets is based on provisions of enacted tax laws. Deferred tax assets are reduced by the amount of any tax benefits that are not expected to be realized. A valuation allowance is recognized if, based on the weight of all available evidence, it is more likely than not that some portion, or all, of the deferred tax asset will not be realized. Evaluation of the realizability of deferred tax assets is subject to significant judgment requiring careful consideration of all facts and circumstances. The Company classifies deferred tax assets and liabilities as non-current in the Consolidated Balance Sheet. Tax assets and liabilities are not offset unless attributable to the same tax jurisdiction and netting is possible according to law and, as it relates to payables and receivables, expected to take place in the same period. Tax benefits associated with tax positions taken in the Company’s income tax returns are initially recognized when it is more likely than not that those tax positions will be sustained upon examination by the relevant taxing authorities. The Company’s evaluation of its tax benefits is based on the probability of the tax position being upheld if challenged by the taxing authorities (including through negotiation, appeals, settlement and litigation). Whenever a tax position does not meet the initial recognition criteria, the tax benefit is subsequently recognized if there is a substantive change in the facts and circumstances that cause a change in judgment concerning the sustainability of the tax position upon examination by the relevant taxing authorities. In cases where tax benefits meet the initial recognition criterion, the Company continues, in subsequent periods, to assess its ability to sustain those positions. A previously recognized tax benefit is derecognized when it is no longer more likely than not that the tax position would be sustained upon examination. Liabilities for unrecognized tax benefits are classified as non-current unless the payment of the liability is expected to be made within the next 12 months.
EARNINGS PER SHARE The Company calculates basic earnings per share (EPS) by dividing net income attributable to controlling interest by the weighted-average number of shares of common stock outstanding for the period (net of treasury shares). The Company’s unvested RSUs and PSs, of which some include the right to receive non-forfeitable dividend equivalents, are considered participating securities. The diluted EPS reflects the potential dilution that could occur if common stock was issued for awards under the Stock Incentive Plan and is calculated using the more dilutive method of either the two-class method or the treasury stock method. The treasury stock method assumes that the Company uses the proceeds from the exercise of stock option awards to repurchase ordinary shares at the average market price during the period. For unvested restricted stock, assumed proceeds under the treasury stock method will include unamortized compensation cost and windfall tax benefits or shortfalls. Post spin-off assumed proceeds under the treasury stock method related to RSUs will only include unamortized compensation cost related to Autoliv employees holding Autoliv RSUs. Calculations of EPS under the two-class method exclude from the numerator any dividends paid or owed on participating securities and any undistributed earnings considered to be attributable to participating securities. The related participating securities are similarly excluded from the denominator. For further details, see Notes 17 and 22. CASH EQUIVALENTS The Company considers all highly liquid investment instruments purchased with a maturity of three months or less to be cash equivalents. RECEIVABLES AND ALLOWANCE FOR EXPECTED CREDIT LOSSES In addition to continuing to individually assess overdue customer balances for expected credit losses, the Company has as of January 1, 2020 implemented a new methodology that reflects the expected credit losses on receivables considering both historical experience as well as forward looking assumptions. The method calculates the expected credit loss for a group of customers by using the customer groups’ average short-term default rates based on officially published credit ratings and the Company’s historical experience. These default rates are considered the Company’s best estimate of the customer’s ability to pay. The Company regularly reassess the customer group’s and the applied customer group’s default rates by using its best judgement when considering changes in customer’s credit ratings, customer’s historical payments and loss experience, current market and economic conditions and the Company’s expectations of future market and economic conditions. There can be no assurance that the amount ultimately realized for receivables will not be materially different than that assumed in the calculation of the allowance for expected credit losses. DERIVATIVE INSTRUMENTS AND HEDGING ACTIVITIES All derivatives are recognized at fair value. Hedge accounting is not applied either because non-hedge accounting treatment creates the same accounting result or the hedge does not meet the hedge accounting requirements, although entered into applying the same rationale concerning mitigating market risk that occurs from changes in interest and foreign exchange rates. For further details on the Company’s financial instruments, see Notes 5 and 14. INVENTORIES The cost of inventories is computed according to the first-in first-out method (FIFO). Cost includes the cost of materials, direct labor and the applicable share of manufacturing overhead. Inventories are evaluated based on individual or, in some cases, groups of inventory items. Reserves are established to reduce the value of inventories to the lower of cost or net realizable value. Net realizable value is the estimated selling prices in the ordinary course of business, less reasonably predictable costs of completion, disposal and transportation. Excess inventories are quantities of items that exceed anticipated sales or usage for a reasonable period. The Company calculates provisions for excess inventories based on the number of months of inventories on hand compared to anticipated sales or usage. Management uses its judgment to forecast sales or usage and to determine what constitutes a reasonable period. There can be no assurance that the amount ultimately realized for inventories will not be materially different than that assumed in the calculation of the reserves. PROPERTY, PLANT AND EQUIPMENT Property, Plant and Equipment is recorded at historical cost. Construction in progress generally involves short-term projects for which capitalized interest is not significant. The Company provides for depreciation of property, plant and equipment computed under the straight-line method over the assets’ estimated useful lives, or in the case of leasehold improvements over the shorter of the useful life or the lease term. Amortization on capital leases is recognized with depreciation expense in the Consolidated Statements of Income over the shorter of the assets’ expected life or the lease contract term. Repairs and maintenance are expensed as incurred.
LEASES In accordance with ASC 842, Leases, the Company recognizes contracts that is, or contains, a lease when the contract conveys the right to control the use of a physically identified asset for a period of time in exchange for consideration in the balance sheet as a right-of-use asset and lease liability. The Company recognizes a right-of-use asset and a lease liability at lease commencement. The lease liability for both finance and operating leases is measured at the present value of the remaining lease payments, discounted at the Company's incremental borrowing rate (if the implicit interest rate in the lease contract is not readily determinable). The right-of-use asset (ROU) for finance and operating leases is initially measured at the sum of the Initial lease liability plus initial direct costs plus prepaid lease payments minus lease incentives received. Lease payments include undiscounted fixed payments plus optional payments that are reasonably certain to be owed. Lease payments do not include variable lease payments other than those that depend on an index or rate. Variable lease payments that depend on an index or a rate are included in the calculation of lease payments and in the measurement of the lease liability. If the rate implicit in the lease is not readily determinable, the Company uses its incremental borrowing rate as the discount rate. The Company uses its best judgement when determining the incremental borrowing rate, which is the rate of interest that the Company would have to pay to borrow on a collateralized basis over a similar term to the lease payments in a similar currency. The Company has elected the practical expedient of not separating lease components from non-lease components for all its classes of underlying assets. The Company has also elected to recognize the lease payments for short-term leases in its consolidated statement of income on a straight-line basis over the lease term and recognize the variable lease payments in the period in which the obligation for those payments is incurred. For further details on the Company’s leases, see Note 4. LONG-LIVED ASSET IMPAIRMENT The Company evaluates the carrying value and useful lives of long-lived assets, other than goodwill and intangible assets, when indications of impairment are evident or it is likely that the useful lives have decreased, in which case the Company depreciates the assets over the remaining useful lives. Impairment testing is primarily done by using the cash flow method based on undiscounted future cash flows. Estimated undiscounted cash flows for a long-lived asset being evaluated for recoverability are compared with the respective carrying amount of that asset. If the estimated undiscounted cash flows exceed the carrying amount of the assets, the carrying amounts of the long-lived asset are considered recoverable and an impairment cannot be recorded. However, if the carrying amount of a group of assets exceeds the undiscounted cash flows, an entity must then measure the long-lived assets’ fair value to determine whether an impairment loss should be recognized, generally using a discounted cash flow model.Generally, the lowest level of cash flows for impairment assessment is customer platform level. GOODWILL AND INTANGIBLE ASSETS Goodwill represents the excess of the fair value of consideration transferred over the fair value of net assets of businesses acquired. Goodwill is not amortized but subject to at least an annual review for impairment. Other intangible assets, principally related to acquired technology, are amortized over their useful lives which range from 3 to 25 years. The Company performs its annual impairment testing in the fourth quarter of each year. Impairment testing is required more often than annually if an event or circumstance indicates that an impairment, or decline in value, may have occurred. In 2018 and 2019, the Company opted to use a qualitative assessment for impairment testing. The qualitative assessment permits the Company to assess whether it is more than likely than not (i.e. a likelihood of greater than 50%) that goodwill or an indefinite-lived intangible asset is impaired. If the Company concludes based on the qualitative assessment that it is not more likely than not that the fair value of goodwill or an indefinite-lived intangible asset is less than its carrying amount, it would not have to quantitatively determine the asset’s fair value. In conducting its qualitative impairment testings in 2018 and 2019, the Company used the fair value calculation performed in 2017 for its goodwill as the starting point. The Company also considered external factors that could affect the significant inputs used to determine fair value. In 2020 the company performed a quantitative impairment testing by calculating the fair value of its goodwill. The estimated fair market value of goodwill is determined by the discounted cash flow method. The Company discounts projected operating cash flows using its weighted average cost of capital. Estimating the fair value requires the Company to make judgments about appropriate discount rates, growth rates, relevant comparable company earnings multiples and the amount and timing of expected future cash flows. If the estimated fair value of a reporting unit exceeds its carrying value, goodwill is considered not to be impaired. If the carrying value of a reporting unit exceeds its estimated fair value, an impairment loss is recognized for the excess of carrying amount over the fair value of the respective reporting unit. To supplement this analysis, the Company compares the market value of its equity, calculated by reference to the quoted market prices of its shares, with the book value of its equity. There were 0 impairments of goodwill from 2018 through 2020. WARRANTIES AND RECALLS The Company records liabilities for product recalls when probable claims are identified and when it is possible to reasonably estimate costs. Recall costs are costs incurred when the customer decides to formally recall a product due to a known or suspected safety concern. Product recall costs are estimated based on the expected cost of replacing the product and the customer´s cost of carrying out
the recall, which is affected by the number of vehicles subject to recall and the cost of labor and materials to remove and replace the defective product. Insurance receivables, related to recall issues covered by the insurance, are included within other current and non-current assets in the Consolidated Balance Sheets. Provisions for warranty claims are estimated based on prior experience, likely changes in performance of newer products and the mix and volume of products sold. The provisions are recorded on an accrual basis. RESTRUCTURING PROVISIONS The Company defines restructuring expense to include costs directly associated with rightsizing, exit or disposal activities. Estimates of restructuring charges are based on information available at the time such charges are recorded. In general, management anticipates that restructuring activities will be completed within a timeframe such that significant changes to the exit plan are not likely. Due to inherent uncertainty involved in estimating restructuring expenses, actual amounts paid for such activities may differ from amounts initially estimated. PENSION OBLIGATIONS The Company provides for both defined contribution plans and defined benefit plans. A defined contribution plan generally specifies the periodic amount that the employer must contribute to the plan and how that amount will be allocated to the eligible employees who perform services during the same period. A defined benefit pension plan is one that contains pension benefit formulas, which generally determine the amount of pension benefits that each employee will receive for services performed during a specified period of employment. The amount recognized as a defined benefit liability is the net total of projected benefit obligation (PBO) minus the fair value of plan assets (if any) (see Note 20). The plan assets are measured at fair value. The inputs to the fair value measurement of the plan assets are mainly level 2 inputs (see Note 5)19). CONTINGENT LIABILITIES Various claims, lawsuits and proceedings are pending or threatened against the Company or its subsidiaries, covering a range of matters that arise in the ordinary course of its business activities with respect to commercial, product liability or other matters (see Note 18). The Company diligently defends itself in such matters and, in addition, carries insurance coverage to the extent reasonably available against insurable risks. The Company records liabilities for claims, lawsuits and proceedings when they are probable and it is possible to reasonably estimate the cost of such liabilities. Legal costs expected to be incurred in connection with a loss contingency are expensed as such costs are incurred. The Company believes, based on currently available information, that the resolution of outstanding matters, other than theany antitrust related matters described in Note 18, after taking into account recorded liabilities and available insurance coverage, should not have a material effect on the Company’s financial position or results of operations.
However, due to the inherent uncertainty associated with such matters, there can be no assurance that the final outcomes of these matters will not be materially different than currently estimated. TRANSLATION OF NON-U.S. SUBSIDIARIES The balance sheets of subsidiaries with functional currency other than U.S. dollars are translated into U.S. dollars using year-end exchange rates. The statementsStatements of operationsIncome of these subsidiaries is translated into U.S. dollars using the average exchange rates for the year. Translation differences are reflected in equity as a component of OCI. RECEIVABLES AND LIABILITIES IN NON-FUNCTIONAL CURRENCIES Receivables and liabilities not denominated in functional currencies are converted at year-end exchange rates. Net transaction gains/(losses),losses, reflected in the Consolidated Statements of Net Income amounted to $(23.9) million in 2020, $(15.3) million in 2019 and $(22.1) million in 2018, $(27.0) million in 2017 and $(4.3) million in 2016, and are recorded in operating income if they relate to operational receivables and liabilities or are recorded in other non-operating items, net if they relate to financial receivables and liabilities.
NEW ACCOUNTING STANDARDS Changes to U.S. GAAP are established by the Financial Accounting Standards Board (“FASB”) in the form of accounting standards updates (“ASUs”) to the FASB’s Accounting Standards Codification (ASC). The Company considers the applicability and impact of all ASUs. ASUs not listed below were assessed and determined to be either not applicable or are expected to have an immaterial impact on the Company’s consolidated financial statements. Adoption of New Accounting Standards In February 2018, the Financial Accounting Standards Board (FASB) issued Accounting Standards Update (ASU) 2018-02, Income Statement – Reporting Comprehensive Income (Topic 220) – Reclassification of Certain Tax Effects from Accumulated Other Comprehensive Income (AOCI), which allows a reclassification from AOCI to retained earnings for stranded tax effects resulting from the Tax Cuts and Jobs Act (the “Tax Act”). Consequently, the amendments in ASU 2018-02 eliminate the stranded tax effects resulting from the Tax Act. The amendments in ASU 2018-02 are effective for all entities for annual periods beginning after December 15, 2018, including interim periods within those annual periods. Early adoption is permitted as of the beginning of an annual period for which financial statements (interim or annual) have not been issued or made available for issuance. The amendments in ASU 2018-02 should be applied either in the period of adoption or retrospectively to each period (or periods) in which the effect of the change in the U.S. federal corporate income tax rate in the Tax Act is recognized. The Company early adopted ASU 2018-02 as of January 1, 2018 and made a reclassification from AOCI to Retained earnings of approximately $10 million.
In January 2018, the FASB released guidance on the accounting for tax on the global intangible low-taxed income (“GILTI”) provisions of the Tax Act. The GILTI provisions impose a tax on foreign income in excess of a deemed return on tangible assets of foreign corporations. In the first quarter of 2018, the Company elected to treat any potential GILTI inclusions as a period cost.
In March 2017, the FASB issued ASU 2017-07, Compensation-Retirement Benefits (Topic 715) - Improving the Presentation of Net Periodic Pension Cost and Net Periodic Postretirement Benefit Cost, which requires the service cost component to be reported in the same line item or items as other compensation costs arising from services rendered by the pertinent employees during the period. The other components of net benefit cost are required to be presented in the consolidated statements of income separately from the service cost component and outside operating income. The amendments in ASU 2017-07 are effective for public business entities for annual periods beginning after December 15, 2017, including interim periods within those annual periods. Early adoption is permitted as of the beginning of an annual period for which financial statements (interim or annual) have not been issued or made available for issuance. The amendments in ASU 2017-07 should be applied retrospectively for the presentation of the service cost component and the other components of net periodic pension cost and net periodic postretirement benefit cost in the consolidated statements of income. The Company adopted ASU 2017-07 in the first quarter of 2018. Prior comparative periods have not been adjusted since the impact of ASU 2017-07 is not material for any consolidated financial statements periods presented.
In October 2016, the FASB issued ASU 2016-16, Income Taxes (Topic 740) – Intra-Entity Transfers of Assets Other Than Inventory, which requires an entity to recognize the income tax consequences of an intra-entity transfer of an asset other than inventory when the transfer occurs. Current GAAP prohibits the recognition of current and deferred income taxes for an intra-entity asset transfer until the asset has been sold to an outside party. Consequently, the amendments in this ASU 2016-16 eliminate the exception for an intra-entity transfer of an asset other than inventory. Two common examples of assets included in the scope of ASU 2016-16 are intellectual property and property, plant, and equipment. The amendments in ASU 2016-16 are effective for public business entities for annual periods beginning after December 15, 2017, including interim periods within those annual periods. Early adoption is permitted as of the beginning of an annual reporting period for which financial statements (interim or annual) have not been issued or made available for issuance. The amendments in ASU 2016-16 should be applied on a modified retrospective basis through a cumulative-effect adjustment directly to retained earnings as of the beginning of the period of adoption. The adoption of ASU 2016-16 effective January 1, 2018 did not have a material impact on the consolidated financial statements for any periods presented.
In May 2014, the FASB issued ASU 2014-09, Revenue from Contracts with Customers (Topic 606), which outlines a single, comprehensive model for entities to use in accounting for revenue arising from contracts with customers and supersedes most current revenue recognition guidance issued by the FASB, including industry specific guidance. In 2016, the FASB issued accounting standard updates to address implementation issues and to clarify guidance in certain areas. The core principle of the guidance is that an entity should recognize revenue when it transfers promised goods or services to customers in an amount that reflects the consideration to which the Company expects to receive in exchange for those goods or services. In addition, ASU 2014-09 requires certain additional disclosure around the nature, amount, timing, and uncertainty of revenue and cash flows arising from contracts with customers. The Company adopted ASU 2014-09 effective January 1, 2018 and utilized the modified retrospective (cumulative effect) transition method to all contracts not completed at the date of initial application. The Company applied the modified retrospective transition method through a cumulative adjustment to retained earnings. The adoption of the new revenue standard did not have a material impact on net sales, net income, or balance sheet.
Balance Sheet (Dollars in millions) | | Balance at December 31, 2017 | | | Adjustments due to ASU 2014-09 | | | Balance at January 1, 2018 | | Assets | | | | | | | | | | | | | Inventories, net1) | | $ | 859.1 | | | $ | (17.3 | ) | | $ | 841.8 | | Other current assets1) | | | 228.9 | | | | 22.0 | | | | 250.9 | | | | | | | | | | | | | | | Equity | | | | | | | | | | | | | Retained Earnings1) | | | 4,079.2 | | | | 3.3 | | | | 4,082.5 | |
1)
| Impact at adoption which included both continuing and discontinued operations.
|
| | Year ended December 31, 2018 | | Income Statement (Dollars in millions) | | As Reported | | | Balances without adoption of ASU 2014-09 | | | Effect of Changes | | Net sales | | $ | 8,678.2 | | | $ | 8,673.7 | | | $ | 4.5 | | Cost of sales | | | (6,966.9 | ) | | | (6,963.1 | ) | | | (3.8 | ) | Operating income | | | 686.0 | | | | 685.3 | | | | 0.7 | |
| | As of December 31, 2018 | | Balance Sheet (Dollars in millions) | | As Reported | | | Balances without adoption of ASU 2014-09 | | | Effect of Changes | | Assets | | | | | | | | | | | | | Inventories, net | | $ | 757.9 | | | $ | 773.6 | | | $ | (15.7 | ) | Other current assets | | | 244.6 | | | | 225.1 | | | | 19.5 | | | | | | | | | | | | | | | Equity | | | | | | | | | | | | | Retained Earnings | | | 2,041.8 | | | | 2,039.1 | | | | 2.7 | |
Accounting Standards Issued But Not Yet Adopted
In August 2018, the FASB issued ASU 2018-14, Compensation-Retirement Benefits-Defined Benefit Plans-General (Subtopic 715-20), Changes to the Disclosure Requirements for Defined Benefit Plans, which modifies the disclosure requirements for employers that sponsor defined benefit pension or other postretirement plans. The amendments in ASU 2018-14 remove disclosures that no longer are considered cost beneficial, clarify the specific requirements of disclosures, and add disclosure requirements identified as relevant. The amendments in ASU 2018-14 are effective for public business entities for annual periods ending after December 15, 2020. Early adoption is permitted. An entity should apply the amendments in ASU 2018-14 on a retrospective basis to all periods presented. The Company is currently evaluating the impact of its pending adoption of ASU 2018-14 on the consolidated financial statements.
In August 2018, the FASB issued ASU 2018-13, Fair Value Measurement (Topic 820), Disclosure Framework – Changes to the Disclosure Requirements for Fair Value Measurement, which modifies the disclosure requirements on fair value measurements in Topic 820. The amendments in ASU 2018-13 are effective for all entities for annual periods beginning after December 15, 2019, including interim periods within these annual periods. The amendments on changes in unrealized gains and losses, the range and weighted average of significant unobservable inputs used to develop Level 3 fair value measurements, and the narrative description of measurement uncertainty should be applied prospectively for only the most recent interim or annual period presented in the initial annual year of adoption. All other amendments should be applied retrospectively to all periods presented upon their effective date. An entity is permitted to early adopt either the entire standard or only the provisions that eliminate or modify disclosures upon issuance of ASU 2018-13. The Company believes that the pending adoption of ASU 2018-13 will not have a material impact on the consolidated financial statements.
In August 2017, the FASB issued ASU 2017-12, Derivative and Hedging (Topic 815), Targeted improvements to accounting for hedging activities. The amendments in ASU 2017-12 better align an entity’s risk management activities and financial reporting for hedging relationships through changes to both the designation and measurement guidance for qualifying hedging relationships and the presentation of hedge results. The amendments in ASU 2017-12 also include certain targeted improvements to ease the application of current guidance related to the assessment of hedge effectiveness. The amendments in ASU 2017-12 modify disclosures required in current GAAP. Those modifications include a tabular disclosure related to the effect on the income statement of fair value and cash flow hedges and eliminate the requirement to disclose the ineffective portion of the change in fair value of hedging instruments. The amendments also require new tabular disclosures related to cumulative basis adjustments for fair value hedges. The amendments in ASU 2017-12 are effective for public business entities for annual period beginning after December 15, 2018, and interim periods within those fiscal years, with early adoption permitted. For cash flow and net investment hedges existing at the date of adoption, an entity should apply a cumulative-effect adjustment related to eliminating the separate measurement of ineffectiveness to accumulated other comprehensive income with a corresponding adjustment to the opening balance of retained earnings as of the beginning of the annual period that an entity adopts the amendments in ASU 2017-12. The Company believes that the pending adoption of ASU 2017-12 will not have a material impact on the consolidated financial statements since the Company terminated its existing cash flow hedges in the first quarter of 2018.
In June 2016, the FASB issued ASU 2016-13, Financial Instruments – Credit Losses (Topic 326), Measurement of Credit Losses on Financial Instruments, which requires the measurement and recognition of expected credit losses for financial assets held and requires enhanced disclosures regarding significant estimates and judgments useddisclosures. The Company’s financial assets in estimating credit losses.the scope of ASU 2016-13 mainly consists of short-term trade receivables. Historically, the Company’s actual credit losses have not been material. In addition to continuing to individually assess overdue customer balances for expected credit losses, the Company has implemented a new methodology that reflects the expected credit losses on receivables considering both historical experience as well as forward looking assumptions. The method calculates the expected credit loss for a group of customers by using the customer groups’ average short-term default rates based on officially published credit ratings and the Company’s historical experience. These default rates are considered the Company’s best estimate of the customer’s ability to pay. The Company will regularly reassess the customer group’s and the applied customer group’s default rates by using its best judgement when considering changes in customer’s credit ratings, customer’s historical payments and loss experience, current market and economic conditions and the Company’s expectations of future market and economic conditions. ASU 2016-13 was adopted prospectively by the Company on January 1, 2020. The adoption of ASU 2016-13 did not have a material impact on the consolidated financial statements. In August 2018, the FASB issued ASU 2018-15, Intangibles-Goodwill and Other-Internal Use Software (Subtopic 350-40), Customer’s accounting for implementation costs incurred in a cloud computing arrangement that is a service contract, which align the requirements for capitalizing implementation costs incurred in a hosting arrangement that is a service contract with the requirements for capitalizing implementation costs incurred to develop or obtain internal-use software (and hosting arrangements that include an internal-use software license). The accounting for the service element of a hosting arrangement that is a service contract is not affected by the amendments in ASU 2018-15. The amendments in ASU 2018-15 are effective for public business entities for annual periods beginning after December 15, 2019, and earlyinterim periods within those annual years. The Company adopted ASU 2018-15 prospectively as of January 1, 2020 and the impact on the consolidated financial statements has not been material during 2020. The future impact of ASU 2018-15 will depend on the nature of the Company’s future cloud computing arrangements. In March 2020, the FASB issued ASU 2020-04, Reference Rate Reform (Topic 848) – Facilitation of the Effects of Reference Rate Reform on Financial Reporting, which provides optional expedients and exceptions for applying U.S. GAAP to contracts, hedging relationships, and other transactions affected by the reference rate reform if certain criteria are met. The amendments in ASU 2020-04 apply only to contracts, hedging relationships, and other transactions that reference LIBOR or another reference rate expected to be discontinued because of reference rate reform. The amendments in ASU 2020-04 are effective for all entities as of March 12, 2020 through December 31, 2022. The adoption of ASU 2020-04 did not have a material impact on the Company’s consolidated financial statements. Accounting Standards Issued But Not Yet Adopted In December 2019, the FASB issued ASU 2019-12, Income Taxes (Topic 740), Simplifying the Accounting for Income Taxes, which simplifies the accounting for income taxes. ASU 2019-12 is permittedeffective for public business entities for annual periods beginning after December 15, 2018. The Company is currently evaluating the impact of its pending adoption of ASU 2016-13 on the consolidated financial statements. In February 2016, the FASB issued ASU 2016-02, Leases (Topic 842), to increase transparency2020, and comparability among organizations by recognizing lease liabilities on the balance sheet and disclosing key information about leasing arrangements. ASU 2016-02 affects any entity that enters into a lease, with some specified scope exceptions. For public business entities, the amendments in ASU 2016-02 are effective for annual periods beginning after December 15, 2018, and interim periods within those annual periods. Earlyearly adoption is permitted. The Company intendsamendments related to adopt ASU 2016-02changes in the annual period beginning January 1, 2019. The Company intends to apply theownership of foreign equity method investments or foreign subsidiaries should be applied on a modified retrospective transition method and elect the transition optionbasis through a cumulative-effect adjustment to use the effective date January 1, 2019, as the date of initial application. The Company will not adjust its comparative period financial statements for effects of the ASU 2016-02, or make the new required lease disclosures for periods before the effective date. The Company will recognize its cumulative effect transition adjustmentretained earnings as of the effective date. In addition, the Company intends to elect the package of practical expedients permitted under the transition guidance within the new standard, which among other things, will allow the Company to carry forward the historical lease classification.
During the fourth quarter, the Company continued its process to identify leasing arrangements and to compare its accounting policies and practices to the requirementsbeginning of the new standard. Specifically, the Company is continuing to assess whether there are any “embedded leases” in arrangements with its suppliers and customers that may result in right to use assets or in the Company being a lessor for tools they own that are dedicated to a specific customer. In addition, thefiscal year of adoption. The Company has implemented a new system to assist with lease accounting. The Company regularly enters into operating leases, for which current GAAP does not require recognition onfinalized its evaluation of the balance sheet. The Company anticipatesimpact of adopting ASU 2019-12 and concluded that the adoption of ASU 2016-02 will primarily result innot have a material impact on the recognition of most operating leases on its balance sheet resulting in an increase in reported right-of-use assets and leasing liabilities.Company’s consolidated financial statements. The Company will continue to assess the impact from the new standard, including consideration of control and process changes to capture lease data necessary to applyadopted ASU 2016-02. The Company anticipates that the adoption of the new standard will result in recording lease assets and lease liabilities in the range of $165 million and $180 million2019-12 as of January 1, 2019. In addition, the Company does not anticipate a material impact to the financial statements where they are deemed to be the lessor in an “embedded lease” arrangement. 2021.
RECLASSIFICATIONS Certain prior-year amounts have been reclassified to conform to current year presentation (see Note 1 regarding discontinued operations).presentation.
3. Discontinued Operations As discussed in Note 1.1, Basis of Presentation, above, on June 29, 2018, the Company completed the spin-off of Veoneer and the requirements for the presentation of Veoneer as a discontinued operation were met on that date. Accordingly, Veoneer’s historical financial results are reflected in the Company’s Consolidated Financial Statements as discontinued operations. The Company did not allocate any general corporate overhead or interest expense to discontinued operations. The financial results of Veoneer are presented as loss from discontinued operations, net of income taxes in the Consolidated Statements of Income. The following table presents the financial results of Veoneer for the year 2018 (dollars in millions). 2018 includes six months of discontinued operations. | | Years ended December 31 | | | Years ended | | | | 2018 | | | 2017 | | | 2016 | | | December 31, 2018 | | Net sales | | $ | 1,122.9 | | | $ | 2,245.8 | | | $ | 2,152.0 | | | $ | 1,122.9 | | Cost of sales | | | (896.4 | ) | | | (1,776.5 | ) | | | (1,723.0 | ) | | | (896.4 | ) | Gross profit | | | 226.5 | | | | 469.3 | | | | 429.0 | | | | 226.5 | | Selling, general and administrative expenses | | | (59.7 | ) | | | (83.1 | ) | | | (81.7 | ) | | | (59.7 | ) | Research, development and engineering expenses, net | | | (224.0 | ) | | | (370.3 | ) | | | (293.7 | ) | | | (224.0 | ) | Goodwill, Impairment charge | | | — | | | | (234.2 | ) | | | — | | | | — | | Amortization of intangibles | | | (10.5 | ) | | | (35.8 | ) | | | (33.2 | ) | | | (10.5 | ) | Other income (expense), net | | | (53.4 | ) | | | (0.2 | ) | | | (3.7 | ) | | | (53.4 | ) | Operating loss | | | (121.1 | ) | | | (254.3 | ) | | | 16.7 | | | | (121.1 | ) | Loss from equity method investments | | | (29.9 | ) | | | (30.7 | ) | | | — | | | | (29.9 | ) | Interest income | | | 0.7 | | | | — | | | | — | | | | 0.7 | | Interest expense | | | (0.4 | ) | | | (0.1 | ) | | | (0.2 | ) | | | (0.4 | ) | Other non-operating items, net | | | 0.5 | | | | (0.8 | ) | | | 3.1 | | | | 0.5 | | Loss before income taxes | | | (150.2 | ) | | | (285.9 | ) | | | 19.6 | | | | (150.2 | ) | Income tax (expense) benefit | | | (43.6 | ) | | | 0.9 | | | | (17.9 | ) | | | (43.6 | ) | Loss from discontinued operations, net of income taxes | | | (193.8 | ) | | | (285.0 | ) | | | 1.7 | | | | (193.8 | ) | Less: Net loss attributable to non-controlling interest | | | (8.3 | ) | | | (126.1 | ) | | | (7.0 | ) | | | (8.3 | ) | Net loss from discontinued operations | | $ | (185.5 | ) | | $ | (158.9 | ) | | $ | 8.7 | | | $ | (185.5 | ) |
The Company has incurred $84.8$76.3 million in separation costs related to the spin-off of Veoneer of which $76.3 million has been incurredfor 2018 year to date and iswas reported in Other income (expense), net. These costs are primarily related to professional fees associated with planning the spin-off, as well as spin-off activities within finance, tax, legal and information system functions and certain investment banking fees incurred upon the completion of the spin-off.
The following table summarizes the carrying value of major classes of assets and liabilities of Veoneer, reclassified as assets and liabilities of discontinued operations at December 31, 2017 (dollars in millions).
| | At December 31, 2017 | | ASSETS | | | | | Receivables, net | | $ | 460.5 | | Inventories, net | | | 154.8 | | Other current assets | | | 31.9 | | Total current assets, discontinued operations | | | 647.2 | | | | | | | Property, plant and equipment, net | | | 364.2 | | Investments and other non-current assets | | | 177.5 | | Goodwill | | | 291.8 | | Intangible assets, net | | | 122.2 | | Total non-current assets, discontinued operations | | $ | 955.7 | | | | | | | LIABILITIES | | | | | Accounts payable | | $ | 323.5 | | Accrued expenses | | | 199.1 | | Other current liabilities | | | 45.6 | | Total current liabilities, discontinued operations | | | 568.2 | | | | | | | Long-term debt | | | 11.0 | | Pension liability | | | 19.1 | | Other non-current liabilities | | | 34.0 | | Total non-current liabilities, discontinued operations | | $ | 64.1 | |
In connection with the spin-off, Autoliv entered into definitive agreements with Veoneer that, among other matters, set forth the terms and conditions of the spin-off and provide a framework for Autoliv’s relationship with Veoneer after the spin-off, including the following (collectively, the “Spin-off Agreements”):
Distribution Agreement
The Distribution Agreement sets forth the principal transactions taken by Veoneer and by Autoliv in connection with the spin-off and the terms to govern certain aspects of the parties’ relationship following the spin-off. The Distribution Agreement also provides for cross-indemnities that, except as otherwise provided in the Distribution Agreement, are principally designed to place financial responsibility for the obligations and liabilities of Veoneer’s business with Veoneer and financial responsibility for the obligations and liabilities of Autoliv’s business with Autoliv. However, Autoliv has agreed to indemnify Veoneer for certain warranty, recall and product liabilities for Electronics products manufactured prior to April 1, 2018, and has retained an indemnification liability.
Amended and Restated Transition Services Agreement
Pursuant to the Amended and Restated Transition Services Agreement, Autoliv or one of its subsidiaries will provide various services to Veoneer and its subsidiaries and Veoneer or one of its subsidiaries agreed to provide various services to Autoliv and subsidiaries of Autoliv for a limited time to help ensure an orderly transition following the spin-off. The services will terminate no later than March 31, 2020.
Employee Matters Agreement
The Employee Matters Agreement governs Autoliv’s and Veoneer’s compensation and employee benefit obligations with respect to the employees and non-employee directors of each company.
Pursuant to the Agreement, the Company transferred to Veoneer pension benefits and postretirement benefits other than pension related to Veoneer employees. The transfer of assets and obligations to Veoneer resulted in a net decrease in the underfunded status of the sponsored pension and postretirement benefits other than pension of $22.8 million and the transfer of unrecognized losses in accumulated other comprehensive income of $6.3 million on the Distribution Date.
Tax Matters Agreement
Pursuant to the Tax Matters Agreement, Autoliv and Veoneer allocated the liability for taxes and certain tax assets between the two companies. The Tax Matters Agreement also governs the parties’ respective rights, responsibilities, and obligations with respect to U.S. federal, state, local and foreign taxes (including taxes arising in the ordinary course of business and taxes, if any, incurred as a result of any failure of the spin-off and certain related transactions to qualify as tax-free for U.S. federal income tax purposes), tax attributes, the preparation and filing of tax returns, the control of audits and other tax proceedings, and assistance and cooperation in respect of tax matters.
Pursuant to the Tax Matters Agreement, Autoliv is the primary obligor on all taxes which relate to any period prior to April 1, 2018. Consequently, the Company is liable for any transition taxes under the Tax Cuts and Jobs Act of 2017.
Reseller Agreements
Reseller agreements are primarily comprised of arrangements between Veoneer and Autoliv business units in Japan, the U. S., India and Sweden to address situations in which customers have not yet been able to update their systems to reflect Veoneer as the supplier. Under the terms of these agreements and based on the substance of the relationships with the customers, Veoneer has the responsibility to provide the products to the customers although orders may be placed with Autoliv and Autoliv may collect the cash for the associated invoices which is then remitted to Veoneer.
Veoneer Capital Contribution In connection with the spin-off, Autoliv capitalized Veoneer with approximately $1 billion of cash. Net assets of $2,129 million including approximately $1 billion of cash, were transferred to Veoneer on or prior to the Distribution Date, including $13 million of accumulated other comprehensive loss (primarily related to pension and cumulative translation adjustment) and the non-controlling interest of $112 million. This resulted in a $2,030 million reduction to retained earnings.In the second half of 2018, an adjustment to the cash contribution amount of $5 million was made reducing the net assets contributed to Veoneer to $2,123 million. In the second quarter of 2019, an adjustment of $0.2 million was made to true-up the $2.5 million contribution made to Veoneer as an adjustment of deferred tax assets related to Veoneer. The following table presents depreciation, amortization, capital expenditures, acquisition of businesses and significant non-cash items of the discontinued operations related to Veoneer for the year 2018 (dollars in millions). 2018 includes six months of discontinued operations. | | Years ended December 31 | | | | | 2018 | | | 2017 | | | 2016 | | | Years ended December 31, 2018 | | Depreciation | | $ | 44.8 | | | $ | 82.9 | | | $ | 69.7 | | | $ | 44.8 | | Amortization of intangible assets | | | 10.5 | | | | 35.8 | | | | 33.2 | | | | 10.5 | | Capital expenditures | | | 71.1 | | | | 109.6 | | | | 100.9 | | | | 71.1 | | Acquisition in affiliate, net | | | 71.0 | | | | 123.9 | | | | 227.4 | | | | 71.0 | | M/A-COM earn-out adjustment | | | (14.0 | ) | | | (12.7 | ) | | | — | | | | (14.0 | ) | Undistributed loss from equity method investment | | | 29.9 | | | | 30.7 | | | | — | | | | 29.9 | |
4. Revenue
Disaggregation of revenue
In the following tables, revenue from the Company’s continuing operations is disaggregated by primary regions and products.
Net Sales by Region | | | | | | | | | | | | | (Dollars in millions) | | Years ended December 31 | | | | 2018 | | | 2017 | | | 2016 | | China | | $ | 1,522.2 | | | $ | 1,421.2 | | | $ | 1,385.4 | | Japan | | | 827.9 | | | | 787.0 | | | | 718.6 | | Rest of Asia | | | 844.8 | | | | 789.9 | | | | 726.2 | | Americas | | | 2,735.1 | | | | 2,435.2 | | | | 2,548.0 | | Europe | | | 2,748.2 | | | | 2,703.5 | | | | 2,543.4 | | Total net sales | | $ | 8,678.2 | | | $ | 8,136.8 | | | $ | 7,921.6 | |
Net Sales by Products | | | | | | | | | | | | | (Dollars in millions) | | Years ended December 31 | | | | 2018 | | | 2017 | | | 2016 | | Airbag Products and Other1) | | $ | 5,698.6 | | | $ | 5,343.2 | | | $ | 5,256.4 | | Seatbelt Products1) | | | 2,979.6 | | | | 2,793.6 | | | | 2,665.2 | | Total net sales | | $ | 8,678.2 | | | $ | 8,136.8 | | | $ | 7,921.6 | | 1) Including Corporate and other sales. | | | | | | | | | | | | |
Contract balances
The contract assets relate to the Company's rights to consideration for work completed but not billed (generally in conjunction with contracts for which revenue is recognized over time) at the reporting date on production parts. The contract assets are reclassified into the receivables balance when the rights to receive payments become unconditional. There have been no impairment losses recognized related to contract assets arising from the Company’s contracts with customers. Certain contracts have resulted in consideration in advance of fulfilling the performance obligations and the amounts received have been classified as contract liabilities.
4. Leases The Company has operating leases for offices, manufacturing and research buildings, machinery, automobiles, data processing and other equipment. The Company’s leases have remaining lease terms of 1-46 years, some of which include options to extend the leases for up to 25 years, and some of which include options to terminate the leases within 1 year. Finance lease right-of-use assets are presented together with other property, plant and equipment assets and finance lease liabilities are presented together with other short-term and long-term liabilities in the Consolidated Balance Sheets. The Company has not identified any material finance leases as of December 31, 2020. As of December 31, 2020, the Company has no additional material operating leases that have not yet commenced. The following tables providesprovide information about receivables, contract assets, and contract liabilities from contracts with customers.the Company’s leases. Since finance leases are not material the finance lease cost components have not been disclosed in the tables below. Contract Balances with Customers | | | | | | | | | (Dollars in millions) | | At December 31 | | | | 2018 | | | 2017 | | Receivables, net | | $ | 1,652.1 | | | $ | 1,696.7 | | Contract assets 1) | | | 19.5 | | | | — | | Contract liabilities 2) | | | 29.4 | | | | 33.0 | | 1) Included in other current assets. | | | | | | | | | 2) Included in other current and other non-current liabilities. | | | | | | | | |
Lease cost | | | | | | | | | (in millions) | | Year ended December 31 | | | | 2020 | | | 2019 | | Operating lease cost | | $ | 45.9 | | | $ | 48.5 | | Short-term lease cost | | | 8.2 | | | | 6.8 | | Variable lease cost | | | 2.3 | | | | 3.6 | | Sublease income | | | (1.6 | ) | | | (2.4 | ) | Total lease cost | | $ | 54.8 | | | $ | 56.5 | |
Receivables, net of allowance | | | | | | | | | (Dollars in millions) | | At December 31 | | | | 2018 | | | 2017 | | Receivables | | $ | 1,659.4 | | | $ | 1,703.0 | | Allowance at beginning of period | | | (6.3 | ) | | | (4.2 | ) | Net decrease/(increase) of allowance | | | (1.3 | ) | | | (1.8 | ) | Translation difference | | | 0.3 | | | | (0.3 | ) | Allowance at end of period | | | (7.3 | ) | | | (6.3 | ) | Receivables, net of allowance | | $ | 1,652.1 | | | $ | 1,696.7 | |
Other information | | | | | | | | | (in millions) | | Year ended or as of December 31, | | | | 2020 | | | 2019 | | Cash paid for amounts included in the measurement of operating lease liabilities | | $ | 46.3 | | | $ | 47.6 | | Right-of-use assets obtained in exchange for new operating lease liabilities | | | 48.0 | | | | 55.9 | | Weighted-average remaining lease term - operating leases | | 6 years | | | 7 years | | Weighted-average discount rate - operating leases | | | 1.9 | % | | | 2.3 | % |
Maturities of operating lease liabilities (undiscounted cash flows) are as follows: | | | | | (in millions) | | | | | | | Maturities | | 2021 | | $ | 37.8 | | 2022 | | | 30.6 | | 2023 | | | 22.6 | | 2024 | | | 16.3 | | 2025 | | | 12.7 | | Thereafter | | | 30.0 | | Total operating lease payments | | | 150.0 | | Less imputed interest | | | (9.4 | ) | Total operating lease liabilities | | $ | 140.6 | |
Changes in the contract assets and the contract liabilities balances during the period are as follows:
Change in Contract Balances with Customers | | | | | | | | | (Dollars in millions) | | | | | | | | | | | At December 31, 2018 | | | | Contract assets | | | Contract liabilities | | Beginning balance | | $ | — | | | $ | 33.0 | | Increases/(decreases) due to cumulative catch up adjustment | | | 15.0 | | | | — | | Increases/(decreases) due to revenue recognized | | | 75.6 | | | | (7.4 | ) | Increases/(decreases) due to cash received | | | — | | | | — | | Increases/(decreases) due to transfer to receivables | | | (71.1 | ) | | | — | | Translation difference | | | — | | | | 3.8 | | Ending balance | | $ | 19.5 | | | $ | 29.4 | |
The increases/(decreases) in the table above related to contracts assets reflect the total adjustments needed to align revenue recognition for work completed but not billed at year end.
5. Fair Value Measurements ASSETS AND LIABILITIES MEASURED AT FAIR VALUE ON A RECURRING BASIS The carrying value of cash and cash equivalents, accounts receivable, accounts payable, other current liabilities and short-term debt approximate their fair value because of the short-term maturity of these instruments. The Company uses derivative financial instruments, “derivatives”, as part of its debt management to mitigate the market risk that occurs from its exposure to changes in interest and foreign exchange rates. The Company does not enter into derivatives for trading or other speculative purposes. The Company’s use of derivatives is in accordance with the strategies contained in the Company’s overall financial policy. All derivatives are recognized in the consolidated financial statements at fair value. Certain derivatives are from time to time designated either as fair value hedges or cash flow hedges in line with the hedge accounting criteria. For certain other derivatives hedge accounting is not applied either because non-hedge accounting treatment creates the same accounting result or the hedge does not meet the hedge accounting requirements, although entered into applying the same rationale concerning mitigating market risk that occurs from changes in interest and foreign exchange rates.
The degree of judgment utilized in measuring the fair value of the instruments generally correlates to the level of pricing observability. Pricing observability is impacted by a number ofseveral factors, including the type of asset or liability, whether the asset or liability has an established market and the characteristics specific to the transaction. Instruments with readily active quoted prices or for which fair value can be measured from actively quoted prices generally will have a higher degree of pricing observability and a lesser degree of judgment utilized in measuring fair value. Conversely, assets rarely traded or not quoted will generally have less, or no, pricing observability and a higher degree of judgment utilized in measuring fair value.
Under existingU.S. GAAP, there is a disclosure framework hierarchy associated with the level of pricing observability utilized in measuring assets and liabilities at fair value. The three broad levels defined by the hierarchy are as follows: Level 1 - Quoted prices are available in active markets for identical assets or liabilities as of the reported date. Level 2 - Pricing inputs are other than quoted prices in active markets, which are either directly or indirectly observable as of the reported date. The nature of these assets and liabilities include items for which quoted prices are available but traded less frequently, and items that are fair valued using other financial instruments, the parameters of which can be directly observed. Level 3 - Assets and liabilities that have little to no pricing observability as of the reported date. These items do not have two-way markets and are measured using management’s best estimate of fair value, where the inputs into the determination of fair value require significant management judgment or estimation. The Company’s derivatives are all classified as Level 2 of the fair value hierarchy and there were no transfers between the levels during this or comparable periods.hierarchy. The tables below present information about the Company’s financial assets and liabilities measured at fair value on a recurring basis for the continuing operations as of December 31, 20182020 and December 31, 2017.2019. The carrying value is the same as the fair value as these instruments are recognized in the consolidated financial statements at fair value. Although the Company is party to close-out netting agreements (ISDA agreements) with all derivative counterparties, the fair values in the tables below and in the Consolidated Balance Sheets at December 31, 20182020 and December 31, 20172019 have been presented on a gross basis. According to the close-out netting agreements, transaction amounts payable to a counterparty on the same date and in the same currency can be netted. The amounts subject to netting agreements that the Company choose not to offset are presented below. DERIVATIVES DESIGNATED AS HEDGING INSTRUMENTS There were no0 derivatives designated as hedging instruments as of December 31, 20182020 and December 31, 20172019 related to the continuing operations. DERIVATIVES NOT DESIGNATED AS HEDGING INSTRUMENTS Derivatives not designated as hedging instruments, relate to economic hedges and are marked to market with all amounts recognized in the Consolidated Statements of Net Income. The derivatives not designated as hedging instruments outstanding at December 31, 20182020 and December 31, 20172019 were foreign exchange swaps. For 2018,2020, the gains and losses recognized in other non-operating items, net are a lossgain of $1.5$18.5 million for derivative instruments not designated as hedging instruments. For 2017,2019, the Company recognized a gain of $1.2 million in other non-operating items, net for derivative instruments not designated as hedging instruments. For 2016, the Company recognized a gain of $1.3$3.5 million in other non-operating items, net for derivative instruments not designated as hedging instruments. For 2018, 2017the Company recognized a loss of $1.5 million in other non-operating items, net for derivative instruments not designated as hedging instruments.For 2020, 2019 and 2016,2018, the gains and losses recognized as interest expense were immaterial. | | DECEMBER 31, 2018 | | | DECEMBER 31, 2017 | | | | DECEMBER 31, 2020 | | | DECEMBER 31, 2019 | | | | | | | | | Fair Value Measurements | | | | | | | Fair Value Measurements | | | | | | | | Fair Value Measurements | | | | | | | Fair Value Measurements | | | | | | | | | Derivative asset | | | Derivative liability | | | | | | | Derivative asset | | | Derivative liability | | | | | | | | Derivative asset | | | Derivative liability | | | | | | | Derivative asset | | | Derivative liability | | | | | Nominal | | | (Other current | | | (Other current | | | Nominal | | | (Other current | | | (Other current | | | | Nominal | | | (Other current | | | (Other current | | | Nominal | | | (Other current | | | (Other current | | | Description | | volume | | | assets) | | | liabilities) | | | volume | | | assets) | | | liabilities) | | | | volume | | | assets) | | | liabilities) | | | volume | | | assets) | | | liabilities) | | | DERIVATIVES NOT DESIGNATED AS HEDGING INSTRUMENTS | | | | | | | | | | | | | | | | | | | | | | | | | | | | | | | | | | | | | | | | | | | | | | | | | | | Foreign exchange swaps, less than 6 months | | | 659.1 | | 1) | | 1.9 | | 2) | | 1.1 | | 3) | | 468.2 | | 4) | | 2.4 | | 5) | | 0.3 | | 6) | | $ | 1,462.7 | | 1) | $ | 25.2 | | 2) | $ | 2.7 | | 3) | $ | 934.2 | | 4) | $ | 6.0 | | 5) | $ | 1.8 | | 6) | TOTAL DERIVATIVES NOT DESIGNATED AS HEDGING INSTRUMENTS | | $ | 659.1 | | | $ | 1.9 | | | $ | 1.1 | | | $ | 468.2 | | | $ | 2.4 | | | $ | 0.3 | | | | $ | 1,462.7 | | | $ | 25.2 | | | $ | 2.7 | | | $ | 934.2 | | | $ | 6.0 | | | $ | 1.8 | | |
1) | Net nominal amount after deducting for offsetting swaps under ISDA agreements is $659.1$1,462.7 million. |
2) | Net amount after deducting for offsetting swaps under ISDA agreements is $1.9$25.2 million. |
3) | Net amount after deducting for offsetting swaps under ISDA agreements is $1.1$2.7 million. |
4) | Net nominal amount after deducting for offsetting swaps under ISDA agreements is $468.2$860.6 million. |
5) | Net amount after deducting for offsetting swaps under ISDA agreements is $2.4$5.8 million. |
6) | Net amount after deducting for offsetting swaps under ISDA agreements is $0.3$1.6 million. |
FAIR VALUE OF DEBT The fair value of long-term debt is determined either from quoted market prices as provided by participants in the secondary market or for long-term debt without quoted market prices, estimated using a discounted cash flow method based on the Company’s current borrowing rates for similar types of financing. The fair value and carrying value of debt is summarized in the table below. The Company has determined that each of these fair value measurements of debt reside within Level 2 of the fair value hierarchy. On June 18, 2018, Autoliv announced that it priced a 5-year bond offering of EUR 500 million in the Eurobond market (the “Notes”). The Notes were issued on June 26, 2018, at an issue price of 99.527%, and carry a coupon of 0.75% (paid annually in arrears), which implies a per annum yield of 0.847%.
The fair value and carrying value of debt for the continuing operations are summarized in the table below (dollars in millions). | | DECEMBER 31, 2018 | | | DECEMBER 31, 2018 | | | DECEMBER 31, 2017 | | | DECEMBER 31, 2017 | | | DECEMBER 31, 2020 | | | DECEMBER 31, 2019 | | | | CARRYING VALUE1) | | | FAIR VALUE | | | CARRYING VALUE1) | | | FAIR VALUE | | | CARRYING VALUE1) | | | FAIR VALUE | | | CARRYING VALUE1) | | | FAIR VALUE | | LONG-TERM DEBT | | | | | | | | | | | | | | | | | | | | | | | | | | | | | | | | | U.S. Private placement | | $ | 1,041.0 | | | $ | 1,061.1 | | | $ | 1,310.5 | | | $ | 1,379.9 | | | Eurobond | | | 568.0 | | | | 567.8 | | | | — | | | | — | | | Bonds | | | $ | 1,376.5 | | | $ | 1,483.4 | | | $ | 1,597.5 | | | $ | 1,671.1 | | Loans | | | | 732.5 | | | | 752.9 | | | | 128.6 | | | | 128.6 | | Other long-term debt | | | — | | | | — | | | | 0.2 | | | | 0.2 | | | | 0.6 | | | | 0.6 | | | | — | | | | — | | TOTAL | | $ | 1,609.0 | | | $ | 1,628.9 | | | $ | 1,310.7 | | | $ | 1,380.1 | | | $ | 2,109.6 | | | $ | 2,236.9 | | | $ | 1,726.1 | | | $ | 1,799.7 | | | | | | | | | | | | | | | | | | | | | | | | | | | | | | | | | | | SHORT-TERM DEBT | | | | | | | | | | | | | | | | | | | | | | | | | | | | | | | | | Commercial paper | | $ | 342.6 | | | $ | 342.6 | | | $ | — | | | $ | — | | | $ | — | | | $ | — | | | $ | 230.7 | | | $ | 230.7 | | Short-term portion of long-term debt | | | 268.1 | | | | 270.4 | | | | 0.2 | | | | 0.2 | | | | 275.0 | | | | 278.5 | | | | 112.0 | | | | 112.1 | | Overdrafts and other short-term debt | | | 10.0 | | | | 10.0 | | | | 19.5 | | | | 19.5 | | | | 26.8 | | | | 26.8 | | | | 25.4 | | | | 25.3 | | TOTAL | | $ | 620.7 | | | $ | 623.0 | | | $ | 19.7 | | | $ | 19.7 | | | $ | 301.8 | | | $ | 305.3 | | | $ | 368.1 | | | $ | 368.1 | |
1) | Debt as reported in balance sheet. |
ASSETS AND LIABILITIES MEASURED AT FAIR VALUE ON A NON-RECURRING BASIS In addition to assets and liabilities that are measured at fair value on a recurring basis, the Company also has assets and liabilities in its balance sheet that are measured at fair value on a nonrecurring basis including certain long-lived assets, including equity method investments, goodwill and other intangible assets, typically as it relates to impairment. The Company has determined that the fair value measurements included in each of these assets and liabilities rely primarily on Company-specific inputs and the Company’s assumptions about the use of the assets and settlements of liabilities, as observable inputs are not available. The Company has determined that each of these fair value measurements reside within Level 3 of the fair value hierarchy. To determine the fair value of long-lived assets as of the reporting date, the Company utilizes the projected cash flows expected to be generated by the long-lived assets, then discounts the future cash flows over the expected life of the long-lived assets. For 2018-2016,the period 2018-2020, the Company did not0t record any material impairment charges on its long-lived assets for its continuing operations. 6. Income Taxes INCOME BEFORE INCOME TAXES | | 2018 | | | 2017 | | | 2016 | | | 2020 | | | 2019 | | | 2018 | | U.S. | | $ | 47.0 | | | $ | 89.0 | | | $ | 172.0 | | | $ | (101.5 | ) | | $ | 66.5 | | | $ | 47.0 | | Non-U.S. | | | 565.4 | | | | 703.4 | | | | 612.2 | | | | 392.7 | | | | 581.9 | | | | 565.4 | | Total | | $ | 612.4 | | | $ | 792.4 | | | $ | 784.2 | | | $ | 291.2 | | | $ | 648.4 | | | $ | 612.4 | |
PROVISION FOR INCOME TAXES | | 2018 | | | 2017 | | | 2016 | | | 2020 | | | 2019 | | | 2018 | | Current | | | | | | | | | | | | | | | | | | | | | | | | | U.S. federal | | $ | 31.6 | | | $ | 53.4 | | | $ | 79.2 | | | $ | (40.6 | ) | | $ | 18.6 | | | $ | 31.6 | | Non-U.S. | | | 192.7 | | | | 162.8 | | | | 167.6 | | | | 168.8 | | | | 178.2 | | | | 192.7 | | U.S. state and local | | | 10.1 | | | | 9.9 | | | | 3.5 | | | | (1.5 | ) | | | 4.8 | | | | 10.1 | | | | | | | | | | | | | | | | | | | | | | | | | | | Deferred | | | | | | | | | | | | | | | | | | | | | | | | | U.S. federal | | | 0.8 | | | | 21.8 | | | | (15.8 | ) | | | (5.5 | ) | | | (2.8 | ) | | | 0.8 | | Non-U.S. | | | (0.2 | ) | | | (44.4 | ) | | | (9.7 | ) | | | (16.5 | ) | | | (12.6 | ) | | | (0.2 | ) | U.S. state and local | | | (0.1 | ) | | | 0.9 | | | | (0.5 | ) | | | (1.8 | ) | | | (0.6 | ) | | | (0.1 | ) | Total income tax expense | | $ | 234.9 | | | $ | 204.4 | | | $ | 224.3 | | | $ | 102.9 | | | $ | 185.6 | | | $ | 234.9 | |
EFFECTIVE INCOME TAX RATE | | 2018 | | | 2017 | | | 2016 | | | | 2020 | | | 2019 | | | 2018 | | | U.S. federal income tax rate | | | 21.0 | | % | | 35.0 | | % | | 35.0 | | % | | | 21.0 | | % | | 21.0 | | % | | 21.0 | | % | Non-Deductible Expenses | | | | 3.0 | | | | 0.3 | | | | 1.4 | | | Foreign tax rate variances | | | 5.5 | | | | (7.4 | ) | | | (6.4 | ) | | | | 8.4 | | | | 4.1 | | | | 5.5 | | | Tax credits | | | (3.9 | ) | | | (3.3 | ) | | | (2.8 | ) | | | | (3.2 | ) | | | (1.7 | ) | | | (3.9 | ) | | Change in Valuation Allowances | | | (3.2 | ) | | | (4.8 | ) | | | 1.3 | | | | | — | | | | — | | | | (3.2 | ) | | Current year losses with no benefit | | | 0.5 | | | | 0.3 | | | | 1.2 | | | | | 7.1 | | | | 0.2 | | | | 0.5 | | | Net operating loss carry-forwards | | | (0.1 | ) | | | (3.7 | ) | | | (3.4 | ) | | | | — | | | | (0.1 | ) | | | (0.1 | ) | | Changes in tax reserves | | | 3.4 | | | | 0.8 | | | | 0.5 | | | | | 1.7 | | | | 1.7 | | | | 3.4 | | | U.S. Expense Allocation | | | 0.0 | | | | 2.0 | | | | 2.0 | | | | Provision to Return | | | | (8.8 | ) | | | (2.3 | ) | | | (0.3 | ) | | Earnings of equity investments | | | (0.1 | ) | | | (0.1 | ) | | | (0.1 | ) | | | | (0.2 | ) | | | (0.1 | ) | | | (0.1 | ) | | Withholding taxes | | | 3.5 | | | | 2.1 | | | | 2.5 | | | | | 8.5 | | | | 2.4 | | | | 3.5 | | | State taxes, net of federal benefit | | | 1.1 | | | | 0.3 | | | | 0.2 | | | | | (0.7 | ) | | | 0.4 | | | | 1.1 | | | Antitrust settlement | | | 9.9 | | | | — | | | | — | | | | | — | | | | — | | | | 9.9 | | | U.S. GILTI Tax | | | 1.7 | | | | — | | | | — | | | | Change in U.S. tax rate | | | — | | | | 3.0 | | | | — | | | | Deemed mandatory repatriation | | | — | | | | 3.1 | | | | — | | | | U.S. FDII Deduction | | | | — | | | | (0.5 | ) | | | — | | | U.S. GILI Tax | | | | — | | | | 1.8 | | | | 1.7 | | | Other, net | | | (0.9 | ) | | | (1.5 | ) | | | (1.4 | ) | | | | (1.5 | ) | | | 1.4 | | | | (2.0 | ) | | Effective income tax rate | | | 38.4 | | % | | 25.8 | | % | | 28.6 | | % | | | 35.3 | | % | | 28.6 | | % | | 38.4 | | % |
The Tax Cuts and Jobs Act (the “Tax Act”) was enacted on December 22, 2017. The Tax Act makes broad and complex changes to the U.S. tax code, including reducing the U.S. federal corporate income tax rate from 35% to 21% for years beginning after December 31, 2017, requiring companies to pay a one-time transition tax on earnings of certain foreign subsidiaries that were previously deferred and created new taxes on certain foreign sourced earnings. The SEC issued Staff Accounting Bulletin No. 118 (“SAB 118”) on December 22, 2017. SAB 118 was issued to address the application of U.S. GAAP in situations when a registrant did not have the necessary information available, prepared, or analyzed (including computations) in reasonable detail to complete the accounting for certain income tax effects of the Tax Act. In 2017, we made a reasonable estimate of the effects on our existing deferred tax balances and the one-time transition tax and recorded provisional amounts. In the fourth quarter of 2018, the Company filed its 2017 Federal and State tax returns and finalized calculations related to transition tax and deferred tax assets and liabilities previously recorded in the year ended December 31, 2017.
Final Impacts from the Tax Act
Deferred tax assets and liabilities: In December 2017, we remeasured certain deferred tax assets and liabilities based on the rates at which they were expected to reverse in the future, which is generally 21%. There was not a material difference between the provisional amounts recorded for deferred tax assets and liabilities in December 2017 and the final amounts updated in the fourth quarter 2018 after the completion of the 2017 tax returns.
Foreign tax effects: The one-time transition tax is based on our total post-1986 earnings and profits (E&P) that we previously deferred from U.S. income taxes. In December 2017, we recorded a provisional amount of income tax expense for the one-time transition tax. The final amount reported on the 2017 tax returns was not materially different from the amount previously recorded. However, due to the uncertainties inherent in the calculations of the transition tax and the determination of more than twenty years of E&P history, in the fourth quarter of 2018, we have recorded a tax reserve of $24 million related to the transition tax. No additional income taxes have been provided for any remaining undistributed foreign earnings not subject to the transition tax, or any additional outside basis difference inherent in these entities, as these amounts continue to be indefinitely reinvested in foreign operations. Determining the amount of unrecognized deferred tax liability relating to any remaining outside basis difference in these entities (i.e., basis difference in excess of that subject to the one-time transition tax) is not practical.
Global Intangible Low Taxed Income (“GILTI”): The Tax Act created a new requirement that certain income (i.e., GILTI) earned by foreign subsidiaries must be included currently in the gross income of the U.S. shareholder. Under U.S. GAAP, we are permitted to make an accounting policy election to either treat taxes due on future inclusions in U.S. taxable income related to GILTI as a current-period expense when incurred or to factor such amounts into our measurement of our deferred taxes. We have elected to treat the impact of GILTI as a current-period expense when incurred. In 2018, the negative impact of GILTI on our effective tax rate is approximately 1.7% due to the cost of expenses allocated against GILTI that limit the foreign tax credits available for offset against the U.S. tax cost on the GILTI inclusion.
Deferred income taxes reflect the net tax effects of temporary differences between the carrying amounts of assets and liabilities for financial reporting purposes and the amounts used for income tax purposes. On December 31, 2018,2020, the Company had net operating loss carryforwards (NOL’s) of approximately $283$328 million, of which approximately $266$321 million have no expiration date. The remaining losses expire on various dates through 2029.2025. The Company also has $9$25 million of U.S. Foreign Tax Credit carry forwards, which begin to expire in 2026 and $7 million of U.S. capital loss carryforwards which begin to expire in 2022.
2026. Valuation allowances have been established which partially offset the related deferred assets. Such allowances are primarily provided against NOL’s of companies that have perennially incurred losses, as well as the NOL’s of companies that are start-up operations and have not established a pattern of profitability. The Company assesses all available evidence, both positive and negative, to determine the amount of any required valuation allowance. In 2018, the Company recognized a tax benefit of $37 million due to the reversal of valuation allowances. This consisted primarily of the reversal of valuation allowances on deferred tax assets, net operating loss carryforwards, and foreign tax credits in Sweden and the reversal of valuation allowances against foreign tax credit carryforwards in the U.S. that were utilized in the final calculation of the transition tax. The foreign tax rate variance reflects the fact that approximately two-thirds of the Company’s non-U.S. pre-tax income is generated by business operations located in tax jurisdictions where the tax rate is between 20-30%. The tax rate from quarter to quarter and from year to year is also impacted by the mix of earnings and tax rates in various jurisdictions compared to the same periods or prior years. The Company has reserves for income taxes that may become payable in future periods as a result of tax audits. These reserves represent the Company’s best estimate of the potential liability for tax exposures. Inherent uncertainties exist in estimates of tax exposures due to changes in tax law, both legislated and concluded through the various jurisdictions’ court systems. The Company files income tax returns in the United States federal jurisdiction, and various states and non-U.S. jurisdictions. At any given time, the Company is undergoing tax audits in several tax jurisdictions, covering multiple years. The Company is no longer subject to income tax examination by the U.S. Federal tax authorities for years prior to 2015. With few exceptions, the Company is no longer subject to income tax examination by U.S. state or local tax authorities or by non-U.S. tax authorities for years before 2010. The Company is undergoing tax audits in several non-U.S. jurisdictions and several U.S. state jurisdictions, covering multiple years. As of December 31, 2018,2020, as a result of those tax examinations, the Company is not aware of any proposed income tax adjustments that would have a material impact on the Company’s financial statements, however, other audits could result in additional increases or decreases to the unrecognized tax benefits in some future period or periods. The Company recognizes interest and potential penalties accrued related to unrecognized tax benefits in tax expense. As of December 31, 2017,2019, the Company had recorded $34.6$65.4 million for unrecognized tax benefits related to prior years, including $6.3$8.2 million of accrued interest and penalties. During 2018,2020, the Company recorded a net increase of $24.0$0.5 million to income tax reserves for unrecognized tax benefits related to the transition tax reported on the 2017positions taken in prior years and reclassified $24.0 million to contra-deferred tax return dueasset to uncertainty surrounding the calculations.offset excess foreign tax credit carryforwards.. Also during 2018,2020, the Company recorded a net decreaseincrease of $4.2 million to income tax reserves for other unrecognized tax benefits based on tax positions related totaken in the current and prior years. year.
The Company had $6.6$10.2 million accrued for the payment of interest and penalties as of December 31, 2018.2020. Of the total unrecognized tax benefits of $54.4$46.1 million recorded at December 31, 2018, $4.02020, $3.1 million is classified as current income tax payable, and $50.4$43.0 million is classified as non-current tax payable included in Other Non-Current Liabilities on the Consolidated Balance Sheets. Substantially all of these reserves would impact the effective tax rate if released into income. The following table summarizes the activity related to the Company’s unrecognized tax benefits: UNRECOGNIZED TAX BENEFITS | | 2018 | | | 2017 | | | 2016 | | | 2020 | | | 2019 | | | 2018 | | Unrecognized tax benefits at beginning of year | | $ | 29.6 | | | $ | 27.2 | | | $ | 25.2 | | | $ | 59.0 | | | $ | 49.6 | | | $ | 29.6 | | Increases as a result of tax positions taken during a prior period | | | 24.0 | | | | 2.0 | | | | 4.5 | | | | 0.7 | | | | 3.8 | | | | 24.0 | | Decreases as a result of tax positions taken during a prior period | | | — | | | | — | | | | (0.2 | ) | | Increases as a result of tax positions taken during the current period | | | 4.7 | | | | 6.8 | | | | 5.8 | | | | 4.2 | | | | 6.1 | | | | 4.7 | | Decreases as a result of tax positions taken during the current period | | | (3.1 | ) | | | — | | | | (1.7 | ) | | | — | | | | — | | | | (3.1 | ) | Decreases relating to settlements with taxing authorities | | | (3.2 | ) | | | (7.1 | ) | | | (1.3 | ) | | | — | | | | — | | | | (3.2 | ) | Decreases resulting from the lapse of the applicable statute of limitations | | | (1.5 | ) | | | (0.3 | ) | | | (3.5 | ) | | | (1.0 | ) | | | (0.6 | ) | | | (1.5 | ) | Translation Difference | | | (0.9 | ) | | | 1.0 | | | | (1.6 | ) | | | (0.4 | ) | | | 0.1 | | | | (0.9 | ) | Total unrecognized tax benefits at end of year | | $ | 49.6 | | | $ | 29.6 | | | $ | 27.2 | | | $ | 62.5 | | | $ | 59.0 | | | $ | 49.6 | |
The tax effect of temporary differences and carryforwards that comprise significant portions of deferred tax assets and liabilities were as follows. DEFERRED TAXES | | | | | | | | | | | | | | | | | | | | | | | | | DECEMBER 31 | | 2018 | | | 2017 | | | 2016 | | | 2020 | | | 2019 | | | 2018 | | Assets | | | | | | | | | | | | | | | | | | | | | | | | | Provisions | | $ | 104.9 | | | $ | 107.3 | | | $ | 101.5 | | | $ | 141.2 | | | $ | 105.2 | | | $ | 104.9 | | Costs capitalized for tax | | | 18.2 | | | | 18.6 | | | | 16.8 | | | | 21.3 | | | | 25.5 | | | | 18.2 | | Property, plant and equipment | | | 13.0 | | | | 14.2 | | | | 18.2 | | | | 4.7 | | | | 9.8 | | | | 13.0 | | Retirement Plans | | | 50.1 | | | | 50.0 | | | | 65.5 | | | | 58.7 | | | | 60.6 | | | | 50.1 | | Tax receivables, principally NOL’s | | | 113.9 | | | | 150.2 | | | | 211.7 | | | | 109.7 | | | | 93.8 | | | | 113.9 | | Deferred tax assets before allowances | | $ | 300.1 | | | $ | 340.3 | | | $ | 413.7 | | | $ | 335.6 | | | $ | 294.9 | | | $ | 300.1 | | Valuation allowances | | | (71.0 | ) | | | (110.6 | ) | | | (199.6 | ) | | | (67.9 | ) | | | (60.7 | ) | | | (71.0 | ) | Total | | $ | 229.1 | | | $ | 229.7 | | | $ | 214.1 | | | $ | 267.7 | | | $ | 234.2 | | | $ | 229.1 | | | | | | | | | | | | | | | | | | | | | | | | | | | Liabilities | | | | | | | | | | | | | | | | | | | | | | | | | Acquired intangibles | | $ | (6.1 | ) | | $ | (6.6 | ) | | $ | (12.3 | ) | | $ | (1.9 | ) | | $ | (3.8 | ) | | $ | (6.1 | ) | Statutory tax allowances | | | (0.5 | ) | | | — | | | | — | | | | (0.2 | ) | | | (0.2 | ) | | | (0.5 | ) | Distribution taxes | | | (22.9 | ) | | | (22.8 | ) | | | (16.0 | ) | | | (14.5 | ) | | | (15.4 | ) | | | (22.9 | ) | Other | | | (10.1 | ) | | | (3.9 | ) | | | (4.9 | ) | | | (4.3 | ) | | | (6.5 | ) | | | (10.1 | ) | Total | | $ | (39.6 | ) | | $ | (33.3 | ) | | $ | (33.2 | ) | | $ | (20.9 | ) | | $ | (25.9 | ) | | $ | (39.6 | ) | Net deferred tax asset | | $ | 189.5 | | | $ | 196.4 | | | $ | 180.9 | | | $ | 246.8 | | | $ | 208.3 | | | $ | 189.5 | |
The following table summarizes the activity related to the Company’s valuation allowances: VALUATION ALLOWANCES AGAINST DEFERRED TAX ASSETS DECEMBER 31 | | 2018 | | | 2017 | | | 2016 | | Allowances at beginning of year | | $ | 110.6 | | | $ | 199.6 | | | $ | 177.7 | | Benefits reserved current year | | | 6.4 | | | | 22.9 | | | | 32.3 | | Benefits recognized current year | | | (36.9 | ) | | | (117.0 | ) | | | (13.8 | ) | Write-offs and other changes | | | — | | | | (0.1 | ) | | | (0.5 | ) | Translation difference | | | (9.1 | ) | | | 5.2 | | | | 3.9 | | Allowances at end of year | | $ | 71.0 | | | $ | 110.6 | | | $ | 199.6 | |
7. Receivables
DECEMBER 31 | | 2018 | | | 2017 | | | 2016 | | Receivables | | $ | 1,659.4 | | | $ | 1,703.0 | | | $ | 1,519.3 | | Allowance at beginning of year | | $ | (6.3 | ) | | $ | (4.2 | ) | | $ | (3.9 | ) | Reversal of allowance | | | 0.9 | | | | 0.9 | | | | 0.5 | | Addition to allowance | | | (3.8 | ) | | | (3.9 | ) | | | (1.5 | ) | Write-off against allowance | | | 1.6 | | | | 1.2 | | | | 0.5 | | Translation difference | | | 0.3 | | | | (0.3 | ) | | | 0.2 | | Allowance at end of year | | $ | (7.3 | ) | | $ | (6.3 | ) | | $ | (4.2 | ) | Total receivables, net of allowance | | $ | 1,652.1 | | | $ | 1,696.7 | | | $ | 1,515.1 | |
8. Inventories
DECEMBER 31 | | 2018 | | | 2017 | | | 2016 | | Raw material | | $ | 370.9 | | | $ | 333.2 | | | $ | 286.4 | | Work in progress | | | 277.4 | | | | 263.8 | | | | 233.1 | | Finished products | | | 194.7 | | | | 187.9 | | | | 166.2 | | Inventories | | $ | 843.0 | | | $ | 784.9 | | | $ | 685.7 | | Inventory reserve at beginning of year | | $ | (80.6 | ) | | $ | (76.7 | ) | | $ | (68.2 | ) | Reversal of reserve | | | 1.4 | | | | 4.8 | | | | 2.9 | | Addition to reserve | | | (13.9 | ) | | | (7.3 | ) | | | (16.2 | ) | Write-off against reserve | | | 5.3 | | | | 5.2 | | | | 3.0 | | Translation difference | | | 2.7 | | | | (6.6 | ) | | | 1.8 | | Inventory reserve at end of year | | $ | (85.1 | ) | | $ | (80.6 | ) | | $ | (76.7 | ) | Total inventories, net of reserve | | $ | 757.9 | | | $ | 704.3 | | | $ | 609.0 | |
VALUATION ALLOWANCES AGAINST DEFERRED TAX ASSETS DECEMBER 31 | | 2020 | | | 2019 | | | 2018 | | Allowances at beginning of year | | $ | 60.7 | | | $ | 71.0 | | | $ | 110.6 | | Benefits reserved current year | | | 13.9 | | | | 3.9 | | | | 6.4 | | Benefits recognized current year | | | (1.1 | ) | | | (10.5 | ) | | | (36.9 | ) | Write-offs and other changes | | | — | | | | — | | | | — | | Translation difference | | | (5.6 | ) | | | (3.7 | ) | | | (9.1 | ) | Allowances at end of year | | $ | 67.9 | | | $ | 60.7 | | | $ | 71.0 | |
7. Receivables DECEMBER 31 | | 2020 | | | 2019 | | | 2018 | | Receivables | | $ | 1,831.4 | | | $ | 1,632.4 | | | $ | 1,659.4 | | Allowance at beginning of year | | $ | (8.5 | ) | | $ | (7.3 | ) | | $ | (6.3 | ) | Reversal of allowance | | | 6.7 | | | | 1.6 | | | | 0.9 | | Addition to allowance | | | (10.5 | ) | | | (5.1 | ) | | | (3.8 | ) | Write-off against allowance | | | 1.0 | | | | 2.3 | | | | 1.6 | | Translation difference | | | (0.5 | ) | | | 0.0 | | | | 0.3 | | Allowance at end of year | | $ | (11.8 | ) | | $ | (8.5 | ) | | $ | (7.3 | ) | Total receivables, net of allowance | | $ | 1,819.6 | | | $ | 1,623.9 | | | $ | 1,652.1 | |
8. Inventories DECEMBER 31 | | 2020 | | | 2019 | | | 2018 | | Raw material | | $ | 378.8 | | | $ | 366.3 | | | $ | 370.9 | | Work in progress | | | 292.3 | | | | 257.4 | | | | 277.4 | | Finished products | | | 220.1 | | | | 200.4 | | | | 194.7 | | Inventories | | $ | 891.2 | | | $ | 824.1 | | | $ | 843.0 | | Inventory reserve at beginning of year | | $ | (83.2 | ) | | $ | (85.1 | ) | | $ | (80.6 | ) | Reversal of reserve | | | 5.0 | | | | 11.3 | | | | 1.4 | | Addition to reserve | | | (16.2 | ) | | | (13.2 | ) | | | (13.9 | ) | Write-off against reserve | | | 7.8 | | | | 8.3 | | | | 5.3 | | Translation difference | | | (6.3 | ) | | | (4.5 | ) | | | 2.7 | | Inventory reserve at end of year | | $ | (92.9 | ) | | $ | (83.2 | ) | | $ | (85.1 | ) | Total inventories, net of reserve | | $ | 798.3 | | | $ | 740.9 | | | $ | 757.9 | |
9. Investments and Other Non-Current Assets DECEMBER 31 | | 2018 | | | 2017 | | | 2020 | | | 2019 | | Equity method investments | | $ | 12.5 | | | $ | 12.9 | | | $ | 8.7 | | | $ | 8.6 | | Deferred tax assets | | | 235.6 | | | | 248.9 | | | | 281.1 | | | | 244.6 | | Income tax receivables | | | 33.6 | | | | 30.4 | | | | 28.2 | | | | 25.2 | | Insurance receivables | | | | 104.7 | | | | 68.4 | | Other non-current assets | | | 41.8 | | | | 48.8 | | | | 43.5 | | | | 39.6 | | Investments and other non-current assets | | $ | 323.5 | | | $ | 341.0 | | | Total other non-current assets | | | $ | 466.2 | | | $ | 386.4 | |
As of December 31, 2018,2020 and 2019, the Company had one1 equity method investment. The Company has ownership of 49% in Autoliv-Hirotako Safety Sdn, Bhd (parent and subsidiaries) in Malaysia which it currently does not control, but in which it exercises significant influence over operations and financial position. 10. Property, Plant and Equipment DECEMBER 31 | | 2018 | | | 2017 | | | Estimated life | | 2020 | | | 2019 | | | Estimated life | Land and land improvements | | $ | 114.7 | | | $ | 113.4 | | | n/a to 15 | | $ | 120.6 | | | $ | 114.3 | | | n/a to 15 | Buildings | | | | 962.0 | | | | 888.2 | | | 20-40 | Machinery and equipment | | | 3,496.8 | | | | 3,276.1 | | | 3-8 | | | 4,208.3 | | | | 3,810.5 | | | 3-12 | Buildings | | | 822.9 | | | | 816.2 | | | 20-40 | | Construction in progress | | | 374.3 | | | | 370.6 | | | n/a | | | 313.9 | | | | 329.0 | | | n/a | Property, plant and equipment | | $ | 4,808.7 | | | $ | 4,576.3 | | | | | $ | 5,604.8 | | | $ | 5,142.0 | | | | Less accumulated depreciation | | | (3,118.6 | ) | | | (2,967.4 | ) | | | | | (3,735.7 | ) | | | (3,326.3 | ) | | | Net of depreciation | | $ | 1,690.1 | | | $ | 1,608.9 | | | | | $ | 1,869.1 | | | $ | 1,815.7 | | | |
DEPRECIATION INCLUDED IN | | 2018 | | | 2017 | | | 2016 | | | 2020 | | | 2019 | | | 2018 | | Cost of sales | | $ | 300.9 | | | $ | 268.9 | | | $ | 248.3 | | | $ | 327.1 | | | $ | 307.0 | | | $ | 300.9 | | Selling, general and administrative expenses | | | 13.9 | | | | 12.5 | | | | 8.6 | | | | 12.9 | | | | 13.4 | | | | 13.9 | | Research, development and engineering expenses, net | | | 15.9 | | | | 14.5 | | | | 12.7 | | | | 20.8 | | | | 18.7 | | | | 15.9 | | Total | | $ | 330.7 | | | $ | 295.9 | | | $ | 269.6 | | | $ | 360.8 | | | $ | 339.1 | | | $ | 330.7 | |
NoNaN significant fixed asset impairments related to the Company’s continuing operations were recognized during 2018, 20172020, 2019 or 2016.2018.
The net book value of machinery and equipment and buildings and land under capitalfinance lease contracts recorded at December 31, 20182020 and December 31, 20172019 were immaterial. The amortization expense related to capitalfinance leases is included with depreciation expenses disclosed in the table above. 11. Goodwill and Intangible Assets GOODWILL | 2018 | | | 2017 | | | 2020 | | | 2019 | | Carrying amount at beginning of year | $ | 1,397.0 | | | $ | 1,380.6 | | | $ | 1,387.9 | | | $ | 1,389.9 | | Translation differences | | (7.1 | ) | | | 16.4 | | | | 10.2 | | | | (2.0 | ) | Carrying amount at end of year | $ | 1,389.9 | | | $ | 1,397.0 | | | $ | 1,398.1 | | | $ | 1,387.9 | |
Approximately $1.2 billion of the Company’s goodwill is associated with the 1997 merger of Autoliv AB and the Automotive Safety Products Division of Morton International, Inc. NoNaN goodwill impairment charges were recognized in continuing operations during 2018, 20172020, 2019 or 2016.2018. AMORTIZABLE INTANGIBLES | | 2018 | | | 2017 | | | 2020 | | | 2019 | | Gross carrying amount | | $ | 391.6 | | | $ | 355.0 | | | $ | 406.8 | | | $ | 398.9 | | Accumulated amortization | | | (358.9 | ) | | | (312.4 | ) | | | (393.2 | ) | | | (376.6 | ) | Carrying value | | $ | 32.7 | | | $ | 42.6 | | | $ | 13.6 | | | $ | 22.3 | |
At December 31, 2018,2020, intangible assets subject to amortization mainly relate to acquired technology. No significant impairments of intangible assets were recognized during 2018, 20172020, 2019 or 2016.2018. Amortization expense related to intangible assets was $10.0 million, $11.5 million and $11.3 million $11.2 millionin 2020, 2019 and $10.5 million in 2018, 2017 and 2016, respectively. Estimated future amortization expense is (in millions): 2019: $11.6; 2020: $10.2; 2021: $9.1;$9.9; 2022: $1.2$3.5; 2023: $0.1; 2024: $0.1 and 2023: $0.6.2025: $0.0. 12. Restructuring Restructuring provisions are made on a case-by-case basis and primarily include severance costs incurred in connection with headcount reductions and plant consolidations. The Company expects to finance restructuring programs over the next several years through cash
generated from its ongoing operations or through cash available under its existing credit facilities. The Company does not expect that the execution of these programs will have an adverse impact on its liquidity position. The changes in the employee-related reserves have been charged against Other income (expense), net in the Consolidated Statements of Net Income. The restructuring reserve balance is included within Accrued expenses in the Consolidated Balance Sheet. 2020 The majorityCompany recorded restructuring charges in 2020, mainly related to the structural efficiency program initiated in the second quarter of 2020 in the Americas and Europe and footprint optimization activities in Europe initiated in the third quarter of 2020. Cash payments mainly related to the structural efficiency program initiated in 2019. As of December 31, 2020, approximately $57 million out of the $125.9 million in total reserve balance can be attributed to the structural efficiency program initiated in the second quarter of 2020. This program is expected to be concluded in 2021. Approximately $36 million of the balance can be attributed to footprint optimization activities in Europe initiated in the third quarter of 2020. This program is expected to be concluded in 2023. | | December 31 | | | Provision/ | | | Provision/ | | | Cash | | | Translation | | | December 31 | | | | 2019 | | | Charge | | | Reversal | | | payments | | | difference | | | 2020 | | Restructuring employee-related | | $ | 55.9 | | | $ | 108.5 | | | $ | (10.1 | ) | | $ | (38.4 | ) | | $ | 9.5 | | | $ | 125.4 | | Other | | | 0.2 | | | | 0.3 | | | | — | | | | — | | | | 0.0 | | | | 0.5 | | Total reserve | | $ | 56.1 | | | $ | 108.8 | | | $ | (10.1 | ) | | $ | (38.4 | ) | | $ | 9.5 | | | $ | 125.9 | |
2019 The provision recorded in 2019 of $56.9 million mainly related to the Structural efficiency program initiated in the second quarter of 2019. The total cost of the Structural efficiency program was expected to be $52.0 million, and as of December 31, 2018 pertains to restructuring activities initiated in Western Europe in the past few years. The Company anticipates that its restructuring initiatives in Western Europe for a number of plants, none of which are individually or in the aggregate material as of December 31, 2018, will continue through dates ranging from 2019, through 2021. The total amount of costs expected to be incurred in connection with these restructuring activities ranges from approximately $11 million to $31 million for each individual activity. In the aggregate, the cost for these Western European restructuring initiatives is approximately $109 million and the remaining restructuring liability as of December 31, 2018 is approximately $27$23 million out of the $33$56.1 million total reserve balance.balance could be attributed to these activities. The remaining balance related to older restructuring programs, primarily in Western Europe. Cash payments in 2019 mainly related to the Structural efficiency program initiated in 2019. The table below summarizes the change in the balance sheet position of the restructuring reserves from December 31, 2018 to December 31, 2019 (dollars in millions). | | December 31 | | | Provision/ | | | Provision/ | | | Cash | | | Translation | | | December 31 | | | | 2018 | | | Charge | | | Reversal | | | payments | | | difference | | | 2019 | | Restructuring employee-related | | $ | 33.2 | | | $ | 56.9 | | | $ | (3.0 | ) | | $ | (30.3 | ) | | $ | (0.9 | ) | | $ | 55.9 | | Other | | | 0.2 | | | | — | | | | — | | | | — | | | | 0.0 | | | | 0.2 | | Total reserve | | $ | 33.4 | | | $ | 56.9 | | | $ | (3.0 | ) | | $ | (30.3 | ) | | $ | (0.9 | ) | | $ | 56.1 | |
2018 In 2018, the employee-related restructuring provisions made on a case-by-case basis,and cash payments related mainly to headcount reductions in high-cost countries in Western Europe. Cash payments related mainly to high-cost countries in Western Europe. The table below summarizes the change in the balance sheet position of the restructuring reserves from December 31, 2017 to December 31, 2018 related to the continuing operations.(dollars in millions). | | December 31 | | | Provision/ | | | Provision/ | | | Cash | | | Translation | | | December 31 | | | | 2017 | | | Charge | | | Reversal | | | payments | | | difference | | | 2018 | | Restructuring employee-related | | $ | 39.4 | | | $ | 9.0 | | | $ | (0.1 | ) | | $ | (13.6 | ) | | $ | (1.5 | ) | | $ | 33.2 | | Other | | | 0.2 | | | | 0.2 | | | | — | | | | — | | | | (0.2 | ) | | | 0.2 | | Total reserve | | $ | 39.6 | | | $ | 9.2 | | | $ | (0.1 | ) | | $ | (13.6 | ) | | $ | (1.7 | ) | | $ | 33.4 | |
2017
In 2017, the employee-related restructuring provisions, made on a case-by-case basis, and cash payments related mainly to headcount reductions in high-cost countries in Western Europe and Japan. The table below summarizes the change in the balance sheet position of the restructuring reserves from December 31, 2016 to December 31, 2017 related to the continuing operations.
| | December 31 | | | Provision/ | | | Provision/ | | | Cash | | | Translation | | | December 31 | | | | 2016 | | | Charge | | | Reversal | | | payments | | | difference | | | 2017 | | Restructuring employee-related | | $ | 35.7 | | | $ | 29.3 | | | $ | (6.9 | ) | | $ | (23.3 | ) | | $ | 4.6 | | | $ | 39.4 | | Other | | | 0.1 | | | | 0.2 | | | | — | | | | — | | | | (0.1 | ) | | | 0.2 | | Total reserve | | $ | 35.8 | | | $ | 29.5 | | | $ | (6.9 | ) | | $ | (23.3 | ) | | $ | 4.5 | | | $ | 39.6 | |
2016
In 2015, the employee-related restructuring provisions, made on a case-by-case basis, and cash payments related mainly to headcount reductions in high-cost countries in Western Europe and Korea. The table below summarizes the change in the balance sheet position of the restructuring reserves from December 31, 2015 to December 31, 2016 related to the continuing operations.
| | December 31 | | | Provision/ | | | Provision/ | | | Cash | | | Translation | | | December 31 | | | | 2015 | | | Charge | | | Reversal | | | payments | | | difference | | | 2016 | | Restructuring employee-related | | $ | 86.9 | | | $ | 23.6 | | | $ | (2.6 | ) | | $ | (71.3 | ) | | $ | (0.9 | ) | | $ | 35.7 | | Other | | | 0.2 | | | | 0.1 | | | | — | | | | — | | | | (0.2 | ) | | | 0.1 | | Total reserve | | $ | 87.1 | | | $ | 23.7 | | | $ | (2.6 | ) | | $ | (71.3 | ) | | $ | (1.1 | ) | | $ | 35.8 | |
13. Product Related Liabilities Autoliv is exposed to product liability and warranty claims in the event that the Company’s products fail to perform as represented and such failure results, or is alleged to result, in bodily injury, and/or property damage or other loss. The Company has reserves for product risks. Such reserves are related to product performance issues including recall, product liability and warranty issues. For further information, see Note 18. The Company records liabilities for product related risks when probable claims are identified and when it is possible to reasonably estimate costs. ProvisionsChanges in reserve for warranty claims are estimated based on prior experience, likely changes in performance of newer products, and the mix and volume of the products sold. The provisionschanges in reserve are recorded on an accrual basis.
Pursuant to the Spin-off Agreements, Autoliv is also required to indemnify Veoneer for recalls related to certain qualified Electronics products. At December 31, 2018,2020, the reserves for indemnification liabilities arewere approximately $12$10 million and were included within accrued expenses on the Consolidated Balance Sheet. Insurance receivables are included within Other current assets In 2020, the change in reserve for product related liabilities mainly related to recall related issues, whereof the “Toyota Recall” represented the major recall issue (for further information, see Note 18). In 2018 and 2019, changes in the Condensedreserve mainly related to other recall and warranty related issues.In 2018, 2019 and 2020, cash payments primarily relate to recall and warranty related issues. The reserve for product related liabilities is included in accrued expenses on the Consolidated Balance Sheet. The decrease in reserves in 2018 was mainly due to a lower recalls and higher cash payments. A majority of the Company’s recall related issues as of December 31, 20182020 are covered by insurance. Insurance receivables are included within other current and non-current assets inon the Consolidated Balance Sheet. The decrease in reserves in 2017 was mainly due to a decrease in recallAs of December 31, 2020, the Company had total insurance receivables related issues and payments, while the increase in reserves in 2016 was mainly due to recall related issues. Cash payments in 2018 were mainly recall related. Cash payments in 2017 were mainly recall related, while 2016 were mainly warranty related.issues of $343 million. The total product liability reserve currently is less than the product liability insurance receivable because the timing of insurance recoveries does not match the timing of our product liability.
The table below summarizes the change in the balance sheet position of the product related liabilities.liabilities (dollars in millions). | | 2018 | | | 2017 | | | 2016 | | | 2020 | | | 2019 | | | 2018 | | Reserve at beginning of the year | | $ | 95.6 | | | $ | 90.6 | | | $ | 39.0 | | | $ | 72.1 | | | $ | 62.2 | | | $ | 95.6 | | Change in reserve | | | 20.6 | | | | 32.2 | | | | 68.1 | | | | 303.5 | | | | 39.3 | | | | 20.6 | | Cash payments | | | (54.3 | ) | | | (29.4 | ) | | | (15.6 | ) | | | (36.0 | ) | | | (29.1 | ) | | | (54.3 | ) | Translation difference | | | 0.3 | | | | 2.2 | | | | (0.9 | ) | | | 1.4 | | | | (0.3 | ) | | | 0.3 | | Reserve at end of the year | | $ | 62.2 | | | $ | 95.6 | | | $ | 90.6 | | | $ | 341.0 | | | $ | 72.1 | | | $ | 62.2 | |
14. Debt and Credit Agreements SHORT-TERM DEBT As of December 31, 2018,2020, total short-term debt was $621 million.$302 million (2019: $368 million). Short-term debt consisted mainly of $208$275 million U.S. Private Placement loan maturingUSPP Bond with maturity in April 2019, $602021 and $27 million U.S. Private Placement loan maturing in November 2019, and $343 million commercial paper loans with maturities in Q1 and Q2 2019.local debt. The Company’s subsidiaries have credit agreements, principally in the form of overdraft facilities with several local banks. Total available short-term facilities as of December 31, 2018,2020, excluding commercial paper facilities as described below, amounted to $381$487 million, of which approximately $10$27 million was utilized. The weighted average interest rate on total short-term debt outstanding at December 31, 20182020 and 2017,2019, excluding the short-term portion of long-term debt, was 1.4%3% and 2.0%3%, respectively. LONG-TERM DEBT As of December 31, 2018,2020, total long-term debt was $1,609$2,110 million. In December 2020, the Company repaid the €100 million of 18-month floating rate notes under its EMTN program. It was originally issued in June 2019 and carried a coupon of 3M Euribor +0.50%. In June 2020, the Company repaid its 3-year loan from Swedish Export Credit Corporation of SEK 1,200 million in advance which carried a floating interest rate of 3M STIBOR +0.54%. At the same time, the Company utilized its new SEK 6,000 million facility with Swedish
Export Credit Corporation which was signed in May 2020. The SEK 6,000 million facility was utilized in two different loans. One SEK 3,000 million loan maturing in 2022 carrying a floating interest rate of 3M STIBOR +1.35% and one SEK 3,000 million loan maturing in 2025 carrying a floating interest rate of 3M STIBOR +1.85%. In June 2018, the Company also issued EUR 500€500 million of 5-year notes in the Eurobond market. The notes carry a coupon of 0.75%. In 2014, the Company issuedlong-term debt securities in a U.S. Private Placement. The current long-term debt outstanding from the 2014 issuance consist of;of: $275 million aggregate principal amount of 7-year senior notes with an interest rate of 3.51%; $297 million aggregate principal amount of 10-year senior notes with an interest rate of 4.09%; $285 million aggregate principal amount of 12-year senior notes with an interest rate of 4.24%; and $185 million aggregate principal amount of 15-year senior notes with an interest rate of 4.44%. CREDIT FACILITIES In July 2016, the Company signed a $1,100 million senior unsecured revolving credit facility with 14 banks. The term of the facility was 5 years with two2 one-year extension options. The Company has utilized these extension options and extended the maturity to July 2023.2023. The Company pays a commitment fee on the undrawn amount. The commitment fee is 35% of the applicable margin. The applicable margin is related to the Company’s credit rating. Given the Company’s current credit rating of A-BBB from S&P Global Ratings, the applicable margin is 0.225%0.375%. As of December 31, 2018,2020, and December 31, 2017,2019, the facility was unutilized.not utilized. The Company has two commercial paper programs: one SEK 7 billion (approx. $780$855 million) Swedish program and onea $1.0 billion U.S. program. At December 31, 20182020 a total of $343$0 million had been issued under these programs. Both programs were unutilized at December 31, 2017. The Company is not subject to any financial covenants, i.e. performance related restrictions, in any of its significant long-term borrowings or commitments.
CREDIT RISK In the Company’s financial operations, credit risk arises in connection with cash deposits with banks and when entering into forward exchange agreements, swap contracts or other financial instruments. In order to reduce this risk, deposits and financial instruments are only entered with a limited number of banks up to a calculated risk amount of $150 million per bank for banks rated A- or above and up to $50 million for banks rated BBB+. The policy of the Company is to work with banks that have a strong credit rating and that participate in the Company’s financing. In addition to this, deposits of up to an aggregate amount of $2 billion can be placed in U.S. and Swedish government paper and in certain AAA rated money market funds. As of December 31, 2018,2020, the Company had placed $1$392 million in money market funds. The table below shows debt maturity as cash flow. For a description of hedging instruments used as part of debt management, see the Financial Instruments section of Note 2 and Note 5. DEBT PROFILE | | | | | | | | | | | | | | | | | | | | | | | | | | Total | | | | | | | | | | | | | | | | | | | | | | | | | | | | | | | | Total | | | | | | | PRINCIPAL AMOUNT BY EXPECTED MATURITY | | 2019 | | | 2020 | | | 2021 | | | 2022 | | | 2023 | | | Thereafter | | | long- term | | | Total | | | | Eurobond | | $ | — | | | $ | — | | | $ | — | | | $ | — | | | $ | 572.7 | | | $ | — | | | $ | 572.7 | | | $ | 572.7 | | | | U.S. private placement notes | | $ | 268.0 | | | $ | — | | | $ | 275.0 | | | $ | — | | | $ | — | | | $ | 767.0 | | | $ | 1,042.0 | | | $ | 1,310.0 | | | | PRINCIPAL AMOUNT BY EXPECTED MATURITY (dollars in millions) | | | 2021 | | | 2022 | | | 2023 | | | 2024 | | | 2025 | | | Thereafter | | | long- term | | | Total | | | Bonds | | | $ | 275 | | | $ | — | | | $ | 613 | | | $ | 297 | | | $ | — | | | $ | 470 | | | $ | 1,380 | | | $ | 1,655 | | | Loans | | | | — | | | | 366 | | | | — | | | | — | | | | 366 | | | | — | | | | 732 | | | | 732 | | | Commercial papers | | $ | 342.6 | | | $ | — | | | $ | — | | | $ | — | | | $ | — | | | $ | — | | | | — | | | $ | 342.6 | | | | | — | | | | — | | | | — | | | | — | | | | — | | | | — | | | | — | | | | — | | | Other short-term debt | | $ | 10.1 | | | $ | — | | | $ | — | | | $ | — | | | $ | — | | | $ | — | | | $ | — | | | $ | 10.1 | | | | | 27 | | | | — | | | | — | | | | — | | | | — | | | | — | | | | — | | | | 27 | | | Total principal amount | | $ | 620.7 | | | $ | — | | | $ | 275.0 | | | $ | — | | | $ | 572.7 | | | $ | 767.0 | | | $ | 1,614.7 | | | $ | 2,235.4 | | 1) | | $ | 302 | | | $ | 366 | | | $ | 613 | | | $ | 297 | | | $ | 366 | | | $ | 470 | | | $ | 2,112 | | | $ | 2,414 | | 1) |
1) | The difference between reported total debt and total principal amount is mainly related to capitalized debt issuance costs. |
15. Shareholders’ Equity The number of shares outstanding as of December 31, 20182020 was 87,144,520.87,353,432. DIVIDENDS | | 2018 | | | 2017 | | | 2016 | | | 2020 | | | 2019 | | | 2018 | | Cash dividend paid per share | | $ | 2.46 | | | $ | 2.38 | | | $ | 2.30 | | | $ | 0.62 | | | $ | 2.48 | | | $ | 2.46 | | Cash dividend declared per share | | $ | 2.48 | | | $ | 2.40 | | | $ | 2.32 | | | Cash dividend declared per share1) | | | $ | — | | | $ | 2.48 | | | $ | 2.48 | | 1) On February 20, 2020, the Company declared a dividend of $0.62 per share for the second quarter of 2020. On April 2, 2020, the Company canceled its declared dividend for the second quarter of 2020. | | 1) On February 20, 2020, the Company declared a dividend of $0.62 per share for the second quarter of 2020. On April 2, 2020, the Company canceled its declared dividend for the second quarter of 2020. | |
OTHER COMPREHENSIVE INCOME (LOSS)/ ENDING BALANCE1) | | 2018 | | | 2017 | | | 2016 | | | OTHER COMPREHENSIVE LOSS / ENDING BALANCE1) | | | 2020 | | | 2019 | | | 2018 | | Cumulative translation adjustments | | $ | (381.2 | ) | | $ | (230.5 | ) | | $ | (493.5 | ) | | $ | (268.8 | ) | | $ | (364.9 | ) | | $ | (381.2 | ) | Net (loss) gain of cash flow hedge derivatives | | | — | | | | (0.8 | ) | | | 8.1 | | | Net pension liability | | | (55.0 | ) | | | (56.2 | ) | | | (80.1 | ) | | | (78.1 | ) | | | (84.0 | ) | | | (55.0 | ) | Distribution to Veoneer | | | 13.0 | | | | — | | | | — | | | | — | | | | — | | | | 13.0 | | Total (ending balance) | | $ | (423.2 | ) | | $ | (287.5 | ) | | $ | (565.5 | ) | | $ | (346.9 | ) | | $ | (448.9 | ) | | $ | (423.2 | ) | Deferred taxes on the pension liability | | $ | 15.4 | | | $ | 16.5 | | | $ | 35.3 | | | $ | 22.8 | | | $ | 24.6 | | | $ | 15.4 | |
1) | The components of Other Comprehensive Income (Loss)Loss are net of any related income tax effects. |
SHARE REPURCHASE PROGRAM The Company’s Board of Directors approved a share repurchase program in 2000 authorizing the repurchase of 10 million shares and subsequently expanded the authorization four times between 2000 and 2014 to 47.5 million shares. There were no share repurchases made during 2018. The Company made 0 share repurchases during the second quarter of 2017.2018-2020. There is no expiration date for the share repurchase program. The Company is authorized to repurchase an additional 2,986,288 shares under the program at December 31, 2018. SHARES | | 2018 | | | 2017 | | | 2016 | | Shares repurchased (shares in millions) | | | — | | | | 1.4 | | | | — | | Cash paid for shares | | $ | — | | | $ | 157.0 | | | $ | — | |
In total, Autoliv has repurchased 44.5 million shares between May 2000 and December 2018 for cash of $2,498 million, including commissions. Of the total amount of repurchased shares, 23.6 million shares were utilized for the equity unit offering during 2009-2012. In addition, 5.3 million shares have been utilized by the Stock Incentive Plan whereof 0.2 million, 0.2 million and 0.1 million were utilized during 2018, 2017 and 2016, respectively. At December 31, 2018, 15.7 million of the repurchased shares remain in treasury stock.
2020. 16. Supplemental Cash Flow Information Payments for interest and income taxes were as follows: | | 2018 | | | 2017 | | | 2016 | | | 2020 | | | 2019 | | | 2018 | | Interest | | $ | 66 | | | $ | 64 | | | $ | 64 | | | $ | 73 | | | $ | 72 | | | $ | 66 | | Income taxes | | $ | 214 | | | $ | 204 | | | $ | 247 | | | | 104 | | | | 192 | | | | 214 | |
17. Stock Incentive Plan Eligible employees and non-employee directors of Autoliv participate in the Autoliv, Inc.1997Inc. 1997 Stock Incentive Plan, (the Plan)as amended and received Autoliv stock-based awards which include stock options (SOs), restricted stock units (RSUs) and performance shares (PSs). In connection with the Veoneer spin-off, each outstanding Autoliv stock-based award as of June 29, 2018 (the Distribution Date) was converted to a stock award that has underlying shares of both Autoliv and Veoneer common shares. The conversion that occurred on the Distribution Date was based on the following: SOs - A number of SOs comprising 50% of the value of the outstanding SOs calculated immediately prior to the spin-off continued to be applicable to Autoliv common stock. A number of SOs comprising the remaining 50% percent of the pre spin-off value were replaced with options to acquire shares of Veoneer common stock.
RSUs - A number of RSUs comprising 50% of the value of the outstanding RSUs calculated immediately prior to the spin-off continued to be applicable to Autoliv common stock. A number of RSUs comprising the remaining 50% of the pre spin-off value were replaced with RSUs with underlying Veoneer common stock.
PSs - Outstanding PSs pre spin-off were converted to time-based RSUs and were divided between Autoliv and Veoneer common stock in the same manner as other outstanding RSUs (as described above) on the Distribution Date. The number of outstanding PSs pre spin-off to be converted was determined based on pro-ration of the performance period such as:
| • | SOs - A number of SOs comprising 50% of the value of the outstanding SOs calculated immediately prior to the spin-off continued to be applicable to Autoliv common stock. A number of SOs comprising the remaining 50% percent of the pre-spin-off value were replaced with options to acquire shares of Veoneer common stock. |
1)
| • | RSUs - A number of RSUs comprising 50% of the value of the outstanding RSUs calculated immediately prior to the spin-off continued to be applicable to Autoliv common stock. A number of RSUs comprising the remaining 50% of the pre-spin-off value were replaced with RSUs with underlying Veoneer common stock. |
| • | PSs - Outstanding PSs pre-spin-off were converted to time-based RSUs and were divided between Autoliv and Veoneer common stock in the same manner as other outstanding RSUs (as described above) on the Distribution Date. The number of outstanding PSs pre-spin-off to be converted was determined based on pro-ration of the performance period such as: |
| 1) | The level of actual achievement of performance goals for each outstanding PS for the period between the first day of the performance period and December 31, 2017 (the “Performance Measurement Date”), referred to as “Level of Performance-to-Date”; and |
2)
| 2) | The greater of the Level of Performance-to-Date and the target performance level for the period between the Performance Measurement Date and the last day of the performance period. |
In each case above, the conversion was intended to generally preserve the intrinsic value of the original award determined as of the Distribution Date. The number of converted RSUs and SOs for Autoliv and Veoneer was based on the average of Autoliv closing stock prices for the last 5 trading days prior to the spin-off and the average of closing stock prices of Autoliv and Veoneer, respectively, for the first 5 trading days after the spin-off. Accordingly, 50% of the outstanding awards as of the Distribution Date, and the related exercise price, were converted to Adjusted Autoliv Awards using a conversion factor of 1.41.
As a result of the spin-off and the related conversion, it was determined that the stock based awards were modified in accordance with ASC 718, Compensation – Stock Compensation.Compensation. The fair value of the RSUs and SOs immediately before and after the modification was assessed in order to determine if the modification resulted in any incremental compensation cost related to the awards, including consideration of the impact of conversion using the 5 trading day average. Based on the valuation performed, it was determined that the conversion did not result in any incremental compensation cost for any of the outstanding awards. The post spin-off stock-based compensation expense will be based on the original grant date fair value related to only Autoliv employees. With certain limited exceptions, including the freezing of the Performance Measurement Date to December 31, 2017 as noted above, the adjusted SOs and RSUs outstanding after the spin-off are subject to the same terms and conditions (including with respect to vesting and expiration) that were applicable to such Autoliv stock-based awards immediately prior to the conversion and as described below. The fair value of the RSUs and PSs is calculated as the grant date fair value of the shares expected to be issued. The RSUs granted in 20182020, 2019 and 20172018 entitle the grantee to receive dividend equivalents in the form of additional RSUs subject to the same vesting conditions as the underlying RSUs. The RSUsThis also applies for the PSs granted prior to 2017 do not have dividend equivalent rights.in 2019 and 2020. For the grants made during 20182020, 2019 and 2017,2018, the fair value of a PS and a RSU was calculated by using the closing stock price on the grant date. For the grants made during 2016 and earlier, the fair value of a RSU and a PS was estimated using the Black Scholes valuation model to account for the difference in the value of the awards resulting from such awards not having dividend equivalent rights. The grant date fair value during 2020 was $6.6 million for the RSUs on February 13, 2018 was $16.6and $5.7 million (pre-spin grant date fair value). The amount of this cost attributable to Autoliv employees afterfor the spin-off will be amortized straight line overPSs. Under the vesting period.
Pursuant to the Company’s directornew compensation policy approved in 2020, the Company’s non-employee directors receive RSUs as payment of 50%equivalent to approximately 54% of their annual base retainer whichexcept for the Chairman of the Board of Directors who also receives 50% of his Non-Executive Chairman supplemental retainer in RSUs. All RSUs vest in one installment on the earlier of the date of the next AGM or the first anniversary of the grant date, in each case subject to the grantee’s continued service as a non-employee director on the vesting date with certainlimited exceptions. The RSUs granted to the Company’s non-employee directors entitle the grantee to receive dividend equivalents in the form of additional RSUs subject to the same vesting conditions as the underlying RSUs. The grant date fair value for the RSUs granted in 20182020 to the Company’s non-employee directors was $1.4$1.5 million.
The source of the shares issued upon vesting of awards is generally from treasury shares. The Stock Incentive Plan provides for the issuance of up to 9,585,055 common shares for awards. At December 31, 2018, 6,394,3922020, 6,674,658 of these shares have been issued for awards which includes 37,10377,925 shares of common stock issued to non-executivenon-employee directors in satisfaction of all or a portion of his or her annual base retainer for service on the Board. Included within the RSUs granted in 20182020 are 7,86925,301 RSUs issued to non employeenon-employee directors in satisfaction of all or a portion of his or her annual base retainer for service on the Board. DuringIn 2015 and earlier, stock awards were granted in the form of SOs and RSUs. All SOs were granted for 10-year terms, had an exercise price equal to the fair value of the share at the date of grant, and became exercisable after one year of continued employment following the grant date. The average grant date fair values of SOs were calculated using the Black-Scholes valuation model. The Company used historical exercise data for determining the expected life assumption. Expected volatility was based on historical and implied volatility.
The Company recorded $9.1$11.7 million, $6.1$8.4 million and $8.4$9.1 million stock-based compensation expense in continuing operations related to RSUs and PSs for 2018, 20172020, 2019 and 2016,2018, respectively. The total compensation cost related to non-vested awards not yet recognized is $10.3$16 million for RSUs and PSs and the weighted average period over which this cost is expected to be recognized is approximately 1.71.5 years. There are no0 remaining unrecognized compensation costs associated with stock options.SOs. Information on the number of RSUs, PSs and SOs related to the Stock Incentive Plan during the period of 20162018 to 20182020 is as follows. RSUs | | 2018 | | | 2017 | | | 2016 | | | 2020 | | | 2019 | | | 2018 | | Weighted average fair value at grant date 1) | | $ | 131.51 | | | $ | 105.64 | | | $ | 100.77 | | | $ | 69.58 | | | $ | 76.85 | | | $ | 131.51 | | | | | | | | | | | | | | | | | | | | | | | | | | | Outstanding at beginning of year | | | 188,410 | | | | 188,494 | | | | 204,552 | | | | 255,195 | | | | 262,074 | | | | 188,410 | | Granted | | | 131,246 | | | | 84,771 | | | | 71,870 | | | | 115,500 | | | | 109,653 | | | | 131,246 | | Shares issued | | | (84,425 | ) | | | (70,795 | ) | | | (66,651 | ) | | | (105,750 | ) | | | (86,086 | ) | | | (84,425 | ) | Cancelled/Forfeited/Expired | | | (6,485 | ) | | | (14,060 | ) | | | (21,277 | ) | | | (20,044 | ) | | | (30,446 | ) | | | (6,485 | ) | Spin conversion 2) | | | 33,328 | | | | — | | | | — | | | | — | | | | — | | | | 33,328 | | Outstanding at end of year3) | | | 262,074 | | | | 188,410 | | | | 188,494 | | | | 244,901 | | | | 255,195 | | | | 262,074 | |
1) | Weighted average fair value at grant date pre-spin.pre spin-off in 2018. |
2)2)
| Reflects the impact of the cancellation of PS awards outstanding as of the Distribution Date, and the conversion to RSUs in accordance with the conversion factor described above. |
3)3)
| Outstanding at the end of 2018 reflects the RSUs held by employees of Autoliv and Veoneer, in accordance with the conversion factor described above. Outstanding at the end of 2017 and 2016, respectively reflects RSUs held by employees of Autoliv. The corresponding weighted average grant date fair value after applying the conversion factor is $100.74 as of December 31, 2018. |
The aggregate intrinsic value for RSUs outstanding at December 31, 20182020 was $18.4$22.6 million. PSs | | 2018 | | | 2017 | | | 2016 | | | 2020 | | | 2019 | | | 2018 | | Weighted average fair value at grant date 1) | | $ | 105.87 | | | $ | 105.87 | | | $ | 98.57 | | | $ | 69.86 | | | $ | 77.00 | | | $ | 105.87 | | | | | | | | | | | | | | | | | | | | | | | | | | | Outstanding at beginning of year | | | 139,891 | | | | 138,548 | | | | — | | | | 76,321 | | | | — | | | | 139,891 | | Change in performance conditions | | | — | | | | (69,274 | ) | | | — | | | | 23,998 | | | | 12,530 | | | | — | | Granted 2) | | | 588 | | | | 75,379 | | | | 143,740 | | | | 75,940 | | | | 66,542 | | | | 588 | | Shares issued | | | — | | | | — | | | | — | | | Cancelled/Forfeited/Expired | | | (3,076 | ) | | | (4,762 | ) | | | (5,192 | ) | | | (18,131 | ) | | | (2,751 | ) | | | (3,076 | ) | Spin conversion 3) | | | (137,403 | ) | | | — | | | | — | | | | — | | | | — | | | | (137,403 | ) | Outstanding at end of year 4) | | | — | | | | 139,891 | | | | 138,548 | | | Outstanding at end of year | | | | 158,128 | | | | 76,321 | | | | — | |
1) | Weighted average fair value at grant date pre-spin.pre spin-off in 2018. |
2)2)
| 2018 grants reflect awards issued pre-spinpre-spin-off as a result of dividend equivalent rights. |
3) | Reflects the replacement of awards due to the spin-off. Outstanding PS awards were converted to RSU awards in accordance with the conversion factor described above. |
4)
| Outstanding at the end of 2017 and 2016, respectively reflects PSs held by employees of Autoliv.
|
The PSs granted include assumptions regarding the ultimate number of shares that will be issued based on the probability of achievement of the performance conditions. Changes in those assumptions result in changes in the estimated shares to be issued which is reflected in the “Change in performance conditions” line above. SOs | | Number of options | | | Weighted average exercise price | | | Number of options | | | Weighted average exercise price | | Outstanding at Dec 31, 2015 | | | 473,051 | | | $ | 87.88 | | | Exercised | | | (51,084 | ) | | | 88.10 | | | Cancelled/Forfeited/Expired | | | (10,858 | ) | | | 102.31 | | | Outstanding at Dec 31, 2016 | | | 411,109 | | | $ | 87.47 | | | Exercised | | | (100,184 | ) | | | 79.58 | | | Cancelled/Forfeited/Expired | | | (10,976 | ) | | | 112.20 | | | Outstanding at Dec 31, 2017 | | | 299,949 | | | $ | 89.20 | | | | 299,949 | | | $ | 89.20 | | Exercised | | | (92,485 | ) | | | 86.59 | | | | (92,485 | ) | | | 86.59 | | Cancelled/Forfeited/Expired | | | — | | | | — | | | | (65,390 | ) | | | 88.75 | | Outstanding at Dec 31, 2018 | | | | 142,074 | | | | 63.43 | | Exercised | | | | (20,928 | ) | | | 42.11 | | Spin conversion 1) | | | (65,390 | ) | | | 88.75 | | | | (5,271 | ) | | | 80.40 | | Outstanding at Dec 31, 2018 2) | | | 142,074 | | | $ | 63.43 | | | Outstanding at Dec 31, 2019 2) | | | | 115,875 | | | | 66.70 | | Exercised | | | | (14,238 | ) | | | 55.55 | | Cancelled/Forfeited/Expired | | | | (11,462 | ) | | | 69.25 | | Outstanding at Dec 31, 2020 | | | | 90,175 | | | $ | 68.13 | | | | | | | | | | | | | | | | | | | OPTIONS EXERCISABLE | | | | | | | | | | | | | | | | | At December 31, 2016 | | | 254,842 | | | $ | 71.48 | | | At December 31, 2017 | | | 299,949 | | | $ | 89.20 | | | At December 31, 2018 | | | 142,074 | | | $ | 63.43 | | | | 142,074 | | | $ | 63.43 | | At December 31, 2019 | | | | 115,875 | | | | 66.70 | | At December 31, 2020 | | | | 90,175 | | | | 68.13 | |
1) | Reflects the cancellation of SOs outstanding as of the Distribution Date, and the conversion to new awards in accordance with the conversion factor described above. The weighted average exercise price reflects the exercise price of the shares cancelled due to the spin-off. |
2) | Reflects outstanding SOs held by employees of Autoliv and Veoneer at the end of the year and the weighted average exercise price in accordance withafter applying the conversion factor described above. |
The following summarizes information about SOs outstanding and exercisable at December 31, 2018:2020: RANGE OF EXERCISE PRICES | | Number outstanding & exercisable | | | Remaining contract life (in years) | | | Weighted average exercise price | | | Number outstanding & exercisable | | | Remaining contract life (in years) | | | Weighted average exercise price | | $11.57 | | | 5,885 | | | | 0.14 | | | $ | 11.57 | | | $31.71 | | | 7,047 | | | | 1.13 | | | | 31.71 | | | $47.52– $49.07 | | | 27,553 | | | | 3.64 | | | | 48.30 | | | $47.52 | | | | 6,607 | | | | 1.14 | | | | 47.52 | | $49.07 | | | | 13,612 | | | | 2.14 | | | | 49.07 | | $51.74 | | | 10,120 | | | | 2.15 | | | | 51.74 | | | | 3,799 | | | | 0.14 | | | | 51.74 | | $67.29 | | | 37,768 | | | | 5.14 | | | | 67.29 | | | | 26,965 | | | | 3.14 | | | | 67.29 | | $80.40 | | | 53,701 | | | | 6.13 | | | | 80.40 | | | | 39,192 | | | | 4.13 | | | | 80.40 | | | | | 142,074 | | | | 4.64 | | | $ | 63.43 | | | | 90,175 | | | | 3.14 | | | | 68.13 | |
The total aggregate intrinsic value, which is the difference between the exercise price and $70.23$92.10 (closing price per share at December 31, 2018)2020), for all “in the money” SOs, both outstanding and exercisable as of December 31, 2018,2020, was $10.0$2.2 million.
18. Contingent Liabilities LEGAL PROCEEDINGS Various claims, lawsuits and proceedings are pending or threatened against the Company or its subsidiaries, covering a range of matters that arise in the ordinary course of its business activities with respect to commercial, product liability and other matters. Litigation is subject to many uncertainties, and the outcome of any litigation cannot be assured. After discussions with counsel, and with the exception of losses resulting from the antitrust proceedings described below, it is the opinion of management that the various legal proceedings and investigations to which the Company currently is a party will not have a material adverse impact on the consolidated financial position of Autoliv, but the Company cannot provide assurance that Autoliv will not experience material litigation, product liability or other losses in the future. In October 2014, one of the Company’s Brazilian subsidiaries received a notice of deficiency from the state tax authorities from the state of São Paulo, Brazil which, primarily, alleged violations of ICMS (VAT) payments and improper warehousing documentation. The aggregate assessment for all alleged violations was R$81 million (approximately $21 million), inclusive of fines, penalties and interest. The Company believed that a loss was probable with respect to at least a portion of the assessed amount and accrued an amount in 2015 that was not material to the Company’s results of operations. During the first quarter of 2018, the Brazilian authorities offered an amnesty period which would allow taxpayers to reduce the penalties associated with eligible tax matters by up to 85%. During the second quarter of 2018, the Company applied to participate in such tax amnesty program which was accepted by the Brazilian authorities. The Company paid an immaterial amount during the period ended June 30, 2018 to resolve this matter.
ANTITRUST MATTERS Authorities in several jurisdictions are currently or have been conductingconducted broad, and in some cases, long-running investigations of suspected anti-competitive behavior among parts suppliers in the global automotive vehicle industry. These investigations include,included, but are not limited to, the products that the Company sells. In addition to concluded and pending matters, authorities of other countries with significant light vehicle manufacturing or sales may initiate similar investigations. It is the Company’s policy to cooperate with governmental investigations. European Commission (“EC”) Investigations: On June 7-9, 2011, representatives of the European Commission (“EC”), the European antitrust authority, visited two2 facilities of a Company subsidiary in Germany to gather information for an investigation of anti-competitive behavior among suppliers of occupant safety systems. On November 22, 2017, the EC concluded a discrete portion of its investigation and imposed a fine on the Company of EUR 8.1€8.1 million (approximately $9.7 million) with respect to this portion of the EC’s overall investigation while it continues the more significant portion of its investigation. The, and the Company paid this amount during the first quarter of 2018, and had previously accrued EUR 8.3 million (approximately $9.9 million) in 2017 with respect to this discrete portion of the investigation. Management does not believe the outcome of this discrete portion of the EC’s investigation as noted above provides an indication of the total probable loss associated with2018. On March 5, 2019, the EC investigation as a whole. The Company believes that the EC will seek to impose a fine in connection withcompleted the remaining portion of the EC investigation. According to management’s best estimationinvestigation and basedimposed a fine on advice of our legal counsel, the Company accrued EUR 184of €179 million (approximately $210$203 million) during the fourth quarter of 2018, which was recorded in Accrued expenses, and Other income (expense), net. The Company believes that a fine could be issued during the first half of 2019, although this may be delayed. The fine would be payable within 90 days after the investigation is ultimately resolved and would be denominated in euros.
South Africa Investigation:
In August 2014, the Competition Commission of South Africa (the “CCSA”) contacted the Company regarding an investigation into the Company’s sales of occupant safety systems in South Africa. In September 2017, the Company entered into a settlement agreement with the CCSA in which the Company agreed to pay an administrative penalty of R150 million (approximately $11 million), which the Competition Tribunal in South Africa confirmed on November 22, 2017. The Company had previously accrued a total of approximately $6 million in 2016 forpaid this matter, and accrued an additional $5 million in 2017 with respect to the proposed settlement, and final payment of the settlement amount was made in February 2018.
Brazil Investigation:
On July 6, 2015, the Company learned that the General Superintendence of the Administrative Council for Economic Defense (“CADE”) in Brazil had initiated an investigation of an alleged cartel involving sales in Brazil of seatbelts, airbags, and steering wheels by the Company’s Brazilian subsidiary and the Brazilian subsidiary of a competitor. In November 2016, the Company and the CADE entered into a settlement agreement with respect to this matter for an amount that is not material to the Company’s results of operations. Settlement amounts were accrued for this matter during the periods ended December 31, 2015 and December 31, 2016, and final payment of the accrued amounts was made in 2017.
Civil Litigation:
The Company is subject to civil litigation alleging anti-competitive conduct in the U.S. and Canada. Specifically, the Company, several of its subsidiaries and its competitors were named as defendants in a total of nineteen purported antitrust class action lawsuits filed between June 2012 and June 2015. Fifteen of these lawsuits were filed in the U.S. and were consolidated in the Occupant Safety Systems (OSS) segment of the Automobile Parts Antitrust Litigation, a Multi-District Litigation (MDL) proceeding in the United States District Court for the Eastern District of Michigan. Plaintiffs in the U.S. cases sought to represent four purported classes - direct purchasers, auto dealers, end-payors, and, as of the filing of the last class action in June 2015, truck and equipment dealers - who purchased occupant safety systems or components directly from a defendant, indirectly through purchases or leases of new vehicles containing such systems, or through purchases of replacement parts.
In May 2014, the Company, without admitting any liability, entered into separate settlement agreements with the direct purchasers, auto dealers, end-payors plaintiff classes, which were granted final approval by the MDL court in 2015 and 2016. The total settlement amount of $65 million (later reduced to approximately $60.5 million as a result of opt-outs from the direct purchaser settlement) was expensed in 2014. In April 2016, the Company entered into a settlement agreement with the truck and equipment dealers’ class, which was granted final approval by the MDL court in 2016, for an amount that is immaterial to the Company’s results of operations. The class settlements do not resolve any claims of settlement class members who opt-out of the settlements or the unasserted claims of any purchasers of occupant safety systems who are not otherwise included in a settlement class, such as states and municipalities. Two direct purchasers opted out of the Company’s direct purchaser class settlement and several individuals and one insurer (and its affiliated entities) opted-out of the end-payor class settlements, including the Company’s settlement.
In September 2016, the insurer (and its affiliated entities) that opted out of the end-payor class settlement filed an antitrust lawsuit in the United States District Court for the Eastern District of Michigan, the venue for the MDL, against the Company and the other settling defendants in the end-payor class settlements. The defendants’ motion to dismiss the complaint on various grounds was granted in part and denied in part in August 2018. Since this decision, various amended pleadings and motions have been made by insurer. To date, no decision has been rendered by the Court. The Company cannot predict or estimate the duration or ultimate outcome of this matter.
In March 2015, the Company, without admitting any liability, reached agreements regarding additional settlements to resolve certain direct purchasers’ global (including U.S.) or non-U.S. antitrust claims that were not covered by the direct purchaser class settlement described above. The total amount of these additional settlements was $81 million. Autoliv expensed during the first quarter of 2015 approximately $77 million as a result of these additional settlements, net of existing amounts that had been accrued in 2014.
The remaining four antitrust class action lawsuits were filed in Canada (Sheridan Chevrolet Cadillac Ltd. et al. v. Autoliv, Inc. et al., filed in the Ontario Superior Court of Justice on January 18, 2013; M. Serge Asselin v. Autoliv, Inc. et al., filed in the Superior Court of Quebec on March 14, 2013; Ewert v. Autoliv, Inc. et al., filed in the Supreme Court of British Columbia on July 18, 2013; and Cindy Retallick and Jagjeet Singh Rajput v. Autoliv ASP, Inc. et al., filed in the Queen’s Bench of the Judicial Center of Regina in the province of Saskatchewan on May 14, 2014) asserting claims on behalf of putative classes of both direct and indirect purchasers of occupant safety systems. In February 2017, the Company entered into, and the courts subsequently approved, a settlement agreement with plaintiffs in three of the four class actions to settle on a nationwide class basis for an amount that is not material to the Company’s results of operations. Settlement amounts were accrued for this matter during the period ended December 31, 2016 and final payment of the accrued amounts was made in 2017. This national settlement includes the claims of the putative members of the fourth class action.2019.
PRODUCT WARRANTY, RECALLS AND INTELLECTUAL PROPERTY Autoliv is exposed to various claims for damages and compensation if its products fail to perform as expected. Such claims can be made, and result in costs and other losses to the Company, even where the product is eventually found to have functioned properly. Where a product (actually or allegedly) fails to perform as expected or is defective, the Company may face warranty and recall claims. Where such (actual or alleged) failure or defect results, or is alleged to result, in bodily injury and/or property damage, the Company may also face product liability and other claims. There can be no assurance that the Company will not experience material warranty, recall or product (or other) liability claims or losses in the future, or that the Company will not incur significant costs to defend against such claims. The Company may be required to participate in a recall involving its products. Each vehicle manufacturer has its own practices regarding product recalls and other product liability actions relating to its suppliers. As suppliers become more integrally involved in the vehicle design process and assume more of the vehicle assembly functions, vehicle manufacturers are increasingly looking to their suppliers for contribution when faced with recalls and product liability claims. Government safety regulators may also play a role in warranty and recall practices. Recall decisions regarding the Company’s products may require a significant amount of judgment by us, our customers and safety regulators and are influenced by a variety of factors. Once a recall has been made, the cost of a recall is also subject to a significant amount of judgment and discussions between the Company and its customers. A warranty, recall or product-liability claim brought against the Company in excess of its insurance may have a material adverse effect on the Company’s business. Vehicle manufacturers are also increasingly requiring their outside suppliers to guarantee or warrant their products and bear the costs of repair and replacement of such products under new vehicle warranties. A vehicle manufacturer may attempt to hold the Company responsible for some, or all, of the repair or replacement costs of products when the product supplied did not perform as represented by us or expected by the customer.customer in either a warranty or a recall situation. Accordingly, the future costs of warranty or recall claims by the customers may be material. However, the Company believes its established reserves are adequate. Autoliv’s warranty reserves are based upon the Company’s best estimates of amounts necessary to settle future and existing claims. The Company regularly evaluates the adequacy of these reserves, and adjusts them when appropriate. However, the final amounts actually due related to these matters could differ materially from the Company’s recorded estimates. In addition, as vehicle manufacturers increasingly use global platforms and procedures, quality performance evaluations are also conducted on a global basis. Any one or more quality, warranty or other recall issue(s) (including those affecting few units and/or having a small financial impact) may cause a vehicle manufacturer to implement measures such as a temporary or prolonged suspension of new orders, which may have a material impact on the Company’s results of operations. The Company carriesmaintains a program of insurance, which may include commercial insurance, self-insurance, or a combination of both approaches, for potential recall and product liability claims at coverage levelsin amounts and on terms that it believes are reasonable and prudent based on our prior claims experience. The Company’s insurance policies generally include coverage of the costs of a recall, although costs related to replacement parts are generally not covered. In addition, a number of the agreements entered into by the Company, including the Spin-off Agreements, require Autoliv to indemnify the other parties for certain claims. Autoliv cannot assure that the level of coverage will be sufficient to cover every possible claim that can arise in our businesses or with respect to other obligations, now or in the future, or that such coverage always will be available should we, now or in the future, wish to extend, increase or otherwise adjust our insurance. As noted in Note 13 above, as of December 31, 2020, the Company has accrued $341 million for total product related liabilities. The majority of the total product liability accrual as of December 31, 2020, relates to recalls, which are mostly covered by insurance. Insurance receivables for such recall related liabilities total $343 million as of December 31, 2020.The total product liability accrual currently is less
Toyota Recall:than the product liability insurance receivable because the timing of insurance recoveries does not match the timing of the recording of our product liability.
Specific Recalls: On June 29, 2016, the Company announced that it is cooperating with Toyota Motor Corp. in its recall of approximately 1.4 million vehicles equipped with a certain model of the Company’s side curtain airbag (the “Toyota Recall”). ToyotaThe Company has informed the Company that there have been eight reported incidents where a side curtain airbag has partially inflated without a deployment signal from the airbag control unit. The incidents have all occurred in parked, unoccupied vehicles and no personal injuries have been reported. The root cause analysis of the issue is ongoing. However, at this point in time the Company believes that a compromised manufacturing process at a sub-supplier may be a contributing factor and, as no incidents have been reported in vehicles produced by other OEMs with the same inflator produced during the same period as those recalled by Toyota, that vehicle-specific characteristics may also contribute to the issue. The sub-supplier’s manufacturing process was changed in January 2012, and the vehicles now recalled by Toyota represent more than half of all inflators of the relevant type manufactured before the sub-supplier process was changed. As previously disclosed in the Company’s Annual Report on Form 10-K for the year ended December 31, 2017, the Company determined pursuant to ASC 450 that a loss with respect to this issue is reasonably possible. If the Company is obligated to indemnify Toyota for the costs associated with the Toyota Recall is probable and has accrued an amount that is included in the total product liability accrual in the fourth quarter of 2020. The amount by which the product liability accrual exceeds the product liability insurance receivable with respect to the Toyota Recall is $25 million and includes deductibles and replacement parts. The ultimate loss to the Company expects that its insurance will generally cover such costs and liabilities and estimates that the Company’s loss, net of expected insurance recoveries, would be less than $20 million. However, the ultimate costs of the Toyota Recall could be materially different. The main variables affectingdifferent from the ultimate cost foramount the Company are:has accrued. The Company expects this matter to be resolved in 2021.
Additionally, in the determinationfourth quarter of proportionate responsibility (if any) among Toyota,2020, the Company was made aware of a potential recall by one of its customers (the “Unannounced Recall”). The Company continues to evaluate this matter with its customer. The Company has determined pursuant to ASC 450 that a loss with respect to the Unannounced Recall is probable and any relevant sub-suppliers;has accrued an amount that is reflected in the total product liability accrual in the fourth quarter of 2020. The amount by which the product liability accrual exceeds the product liability insurance receivable with respect to the Unannounced Recall is $26 million and includes self-insurance retention costs and deductibles. The ultimate number of vehicles repaired;loss to the cost of repair per vehicle; and the actual recoveries from sub-suppliers and insurers. The Company’s insurance policies generally include coverageCompany of the costs of a recall, although costs related to replacement parts are generally not covered.Unannounced Recall could be materially different from the amount the Company has accrued. Intellectual property In its products, the Company utilizes technologies which may be subject to intellectual property rights of third parties. While the Company does seek to procure the necessary rights to utilize intellectual property rights associated with its products, it may fail to do so. Where the Company so fails, the Company may be exposed to material claims from the owners of such rights. Where the Company has sold products which infringe upon such rights, its customers may be entitled to be indemnified by the Company for the claims they suffer as a result thereof. Such claims could be material. The table in Note 13 Product Related Liabilities above summarizes the change in the balance sheet position of the product related liabilities for the fiscal year ended December 31, 2018.2020. 19. Lease Commitments OPERATING LEASES
The Company leases certain offices, manufacturing and research buildings, machinery, automobiles, data processing and other equipment under operating lease contracts. The operating leases, some of which are non-cancellable and include renewals, expire at various dates through 2045. The Company pays most maintenance, insurance and tax expenses relating to leased assets. Rental expense for operating leases was $47 million, $46 million and $41 million for 2018, 2017 and 2016, respectively.
At December 31, 2018, future minimum lease payments for non-cancellable operating leases totaled $186 million and are payable as follows (in millions): 2019: $42; 2020: $36; 2021: $29; 2022: $26; 2023: $20; 2024 and thereafter: $33.
CAPITAL LEASES
At December 31, 2018, future minimum lease payments for non-cancellable capital leases were not material.
20. Retirement Plans
DEFINED CONTRIBUTION PLANS Many of the Company’s employees are covered by government sponsored pension and welfare programs. Under the terms of these programs, the Company makes periodic payments to various government agencies. In addition, in some countries the Company sponsors or participates in certain non-governmental defined contribution plans. Contributions to defined contribution plans for the years ended December 31, 2020, 2019 and 2018 2017 and 2016 were $19.2$14.7 million, $21.7$15.7 million and $21.3$19.2 million, respectively. MULTIEMPLOYER PLANS The Company participates in a multiemployer plan in Sweden, which is deemed insignificant. The SwedishSweden. This ITP-2 pension plan is funded through Alecta. ForAlecta and covers employees born before 1979, the planfor whom it provides a final pay pension benefit based on all service with participating employers. The Company must pay for wage increases in excess of inflation on service earned with previous employers. The plan also provides disability and family benefits. The planbenefits and is more than 100% funded. The CompanyCompany´s contributions to thethis multiemployer plan in Sweden for the years ended December 31, 2020, 2019 and 2018 2017were $4.0 million, $3.9 million and 2016 were $6.1 million, $9.7 million and $4.4 million, respectively.
DEFINED BENEFIT PLANS The Company has a number of defined benefit pension plans, both contributory and non-contributory, in the U.S., France, Germany, France,India, Japan, Mexico, Philippines, Sweden, South Korea, India,Thailand, Turkey Thailand, Philippines and the United Kingdom. There are funded as well as unfunded plan arrangements which provide retirement benefits to both U.S. and non-U.S. participants. The main plan is the U.S. plan for which the benefits are based on an average of the employee’s earnings in the years preceding retirement and on credited service. In a prior year, the Company closed participation in the Autoliv ASP, Inc. Pension Plan to exclude those employees hired after December 31, 2003. Within the U.S. there is also a non-qualified restoration plan that provides benefits to employees whose benefits in the primary U.S. plan are restricted by limitations on the compensation that can be considered in calculating their benefits. During December 2017 the Company decided to amendamended the U.S. defined benefit pension plan, communicating a benefits freeze that will begin on December 31, 2021. There were no curtailment expenses due to U.S. plan freeze. The curtailment caused a decrease in the projected benefit obligation (PBO) of $62 million as of December 31, 2017, with the offset recorded to OCI. For the Company’s non-U.S. defined benefit plans the most significant individual plan residesis in the U.K. The Company has closed participation in the U.K. defined benefit plan to exclude all employees hired after April 30, 2003 with few members currently accruing benefits.
CHANGES IN BENEFIT OBLIGATIONS AND PLAN ASSETS RELATED TO CONTINUING OPERATIONS FOR THE PERIODS ENDED DECEMBER 31 | | U.S. | | | Non-U.S. | | | U.S. | | | Non-U.S. | | | | 2018 | | | 2017 | | | 2018 | | | 2017 | | | 2020 | | | 2019 | | | 2020 | | | 2019 | | Benefit obligation at beginning of year | | $ | 368.6 | | | $ | 361.2 | | | $ | 220.9 | | | $ | 190.6 | | | $ | 400.1 | | | $ | 332.1 | | | $ | 252.6 | | | $ | 216.9 | | Service cost | | | 8.7 | | | | 9.0 | | | | 10.8 | | | | 10.4 | | | | 7.5 | | | | 6.9 | | | | 12.2 | | | | 10.7 | | Interest cost | | | 12.8 | | | | 14.8 | | | | 5.7 | | | | 5.5 | | | | 12.2 | | | | 14.2 | | | | 5.8 | | | | 6.4 | | Actuarial (gain) loss due to: | | | | | | | | | | | | | | | | | | | | | | | | | | | | | | | | | Change in discount rate | | | (44.6 | ) | | | 53.4 | | | | (12.1 | ) | | | 5.9 | | | | 46.4 | | | | 67.8 | | | | 12.9 | | | | 27.7 | | Experience | | | 0.8 | | | | (2.0 | ) | | | 4.7 | | | | (4.3 | ) | | | (5.0 | ) | | | 3.0 | | | | 0.1 | | | | (1.2 | ) | Other assumption changes | | | 3.5 | | | | 4.2 | | | | 4.8 | | | | 1.4 | | | | 3.2 | | | | (0.4 | ) | | | (11.2 | ) | | | (1.0 | ) | Plan amendments | | | — | | | | — | | | | (0.1 | ) | | | (0.5 | ) | | Benefits paid | | | (17.7 | ) | | | (9.8 | ) | | | (7.9 | ) | | | (7.9 | ) | | | (3.8 | ) | | | (23.5 | ) | | | (9.0 | ) | | | (8.4 | ) | Plan settlements | | | — | | | | — | | | | (0.8 | ) | | | (0.1 | ) | | | (34.4 | ) | | | — | | | | (0.4 | ) | | | (1.2 | ) | Curtailments | | | — | | | | (62.2 | ) | | | — | | | | — | | | Special termination benefits | | | — | | | | — | | | | 0.5 | | | | 0.3 | | | | — | | | | — | | | | 0.0 | | | | 0.5 | | Other | | | | — | | | | — | | | | 1.5 | | | | 1.6 | | Translation difference | | | — | | | | — | | | | (9.6 | ) | | | 19.6 | | | | — | | | | — | | | | 14.9 | | | | 0.6 | | Benefit obligation at end of year | | $ | 332.1 | | | $ | 368.6 | | | $ | 216.9 | | | $ | 220.9 | | | $ | 426.2 | | | $ | 400.1 | | | $ | 279.4 | | | $ | 252.6 | | | | | | | | | | | | | | | | | | | | | | | | | | | | | | | | | | | Fair value of plan assets at beginning of year | | $ | 297.9 | | | $ | 256.5 | | | $ | 84.8 | | | $ | 76.5 | | | $ | 323.8 | | | $ | 273.0 | | | $ | 88.7 | | | $ | 77.8 | | Actual return on plan assets | | | (13.9 | ) | | | 44.5 | | | | (1.9 | ) | | | 2.3 | | | | 52.5 | | | | 67.0 | | | | 8.8 | | | | 8.9 | | Company contributions | | | 6.7 | | | | 6.7 | | | | 9.0 | | | | 6.3 | | | | 16.5 | | | | 7.3 | | | | 9.7 | | | | 9.5 | | Benefits paid | | | (17.7 | ) | | | (9.8 | ) | | | (7.9 | ) | | | (7.9 | ) | | | (3.8 | ) | | | (23.5 | ) | | | (9.0 | ) | | | (8.4 | ) | Plan settlements | | | — | | | | — | | | | (0.8 | ) | | | (0.1 | ) | | | (34.4 | ) | | | — | | | | (0.4 | ) | | | (1.2 | ) | Translation difference | | | — | | | | — | | | | (5.4 | ) | | | 7.7 | | | | — | | | | — | | | | 5.0 | | | | 2.1 | | Fair value of plan assets at end of year | | $ | 273.0 | | | $ | 297.9 | | | $ | 77.8 | | | $ | 84.8 | | | $ | 354.6 | | | $ | 323.8 | | | $ | 102.8 | | | $ | 88.7 | | Funded status recognized in the balance sheet | | $ | (59.1 | ) | | $ | (70.7 | ) | | $ | (139.1 | ) | | $ | (136.1 | ) | | $ | (71.6 | ) | | $ | (76.3 | ) | | $ | (176.6 | ) | | $ | (163.9 | ) |
The U.S. plan provides that benefits may be paid in the form of a lump sum if so elected by the participant. In order to more accurately reflect a market-derived pension obligation, Autoliv adjusts the assumed lump sum interest rate to reflect market conditions as of each December 31. This methodology is consistent with the approach required under the Pension Protection Act of 2006, which provides the rules for determining minimum funding requirements in the U.S. COMPONENTS OF NET PERIODIC BENEFIT COST FROM CONTINUING OPERATIONS ASSOCIATED WITH THE DEFINED BENEFIT RETIREMENT PLANS | | U.S. | | | U.S. | | | | 2018 | | | 2017 | | | 2016 | | | (Dollars in millions) | | | 2020 | | | 2019 | | | 2018 | | Service cost | | $ | 8.7 | | | $ | 9.0 | | | $ | 8.3 | | | $ | 7.5 | | | $ | 6.9 | | | $ | 8.7 | | Interest cost | | | 12.8 | | | | 14.8 | | | | 14.6 | | | | 12.2 | | | | 14.2 | | | | 12.8 | | Expected return on plan assets | | | (20.4 | ) | | | (17.6 | ) | | | (16.6 | ) | | | (16.3 | ) | | | (13.5 | ) | | | (20.4 | ) | Amortization of prior service credit | | | 0.1 | | | | 0.0 | | | | (0.9 | ) | | | 0.0 | | | | 0.0 | | | | 0.1 | | Amortization of actuarial loss | | | 2.2 | | | | 6.0 | | | | 4.8 | | | | 2.8 | | | | 1.9 | | | | 2.2 | | Curtailment loss | | | — | | | | 0.2 | | | | — | | | Settlement loss | | | | 7.2 | | | | — | | | | — | | Net periodic benefit cost | | $ | 3.4 | | | $ | 12.4 | | | $ | 10.2 | | | $ | 13.4 | | | $ | 9.5 | | | $ | 3.4 | |
| | Non-U.S. | | | Non-U.S. | | | | 2018 | | | 2017 | | | 2016 | | | (Dollars in millions) | | | 2020 | | | 2019 | | | 2018 | | Service cost | | $ | 10.8 | | | $ | 10.4 | | | $ | 10.8 | | | $ | 12.2 | | | $ | 10.7 | | | $ | 10.8 | | Interest cost | | | 5.7 | | | | 5.5 | | | | 5.8 | | | | 5.8 | | | | 6.4 | | | | 5.7 | | Expected return on plan assets | | | (2.0 | ) | | | (1.9 | ) | | | (2.2 | ) | | | (1.7 | ) | | | (1.9 | ) | | | (2.0 | ) | Amortization of prior service costs | | | 0.3 | | | | 0.2 | | | | 0.2 | | | | 0.4 | | | | 0.3 | | | | 0.3 | | Amortization of actuarial loss | | | 1.4 | | | | 1.9 | | | | 1.4 | | | | 2.3 | | | | 0.9 | | | | 1.4 | | Settlement loss (gain) | | | 0.2 | | | | 0.1 | | | | (2.4 | ) | | Settlement loss | | | | 0.1 | | | | 0.6 | | | | 0.2 | | Special termination benefits | | | 0.5 | | | | 0.3 | | | | 0.1 | | | | 0.0 | | | | 0.5 | | | | 0.5 | | Net periodic benefit cost | | $ | 16.9 | | | $ | 16.5 | | | $ | 13.7 | | | $ | 19.1 | | | $ | 17.5 | | | $ | 16.9 | |
The service cost and amortization of prior service cost components from continuing operations are reported among other employee compensation costs in the Consolidated Statements of Income. The remaining components, interest cost, expected returns on plan assets and amortization of actuarial loss, are reported as Other non-operating items, net in the Consolidated Statements of Income.
The estimated prior service credit for the U.S. defined benefit pension plans that will be amortized from other comprehensive income into net benefit cost over the next fiscal year is immaterial.
Amortization of net actuarial losses is expected to be $1.6 million in 2019. Net periodic benefit cost associated with these U.S. plans was $3.4 million in 2018 and is expected to be approximately $9.6 million in 2019. The estimated prior service cost and net actuarial loss for the non-U.S. defined benefit pension plans that will be amortized from other comprehensive income into net benefit cost over the next fiscal year are $0.3 million and $0.9 million, respectively. Net periodic benefit cost associated with these non-U.S. plans was $16.9 million in 2018 and is expected to be around $16.9 million in 2019. The amortization of the net actuarial loss from accumulated other comprehensive income is made over the estimated remaining service lives of the plan participants, 109 years for U.S. and 7-33from 4 to 31 years for non-U.S. participants, varying between the different countries depending on the age of the work force. COMPONENTS OF ACCUMULATED OTHER COMPREHENSIVE INCOME BEFORE TAX RELATED TO CONTINUING OPERATIONS AS OF DECEMBER 31 | | U.S. | | | Non-U.S. | | | U.S. | | | Non-U.S. | | | | 2018 | | | 2017 | | | 2018 | | | 2017 | | | (Dollars in millions) | | | 2020 | | | 2019 | | | 2020 | | | 2019 | | Net actuarial loss | | $ | 48.0 | | | $ | 56.2 | | | $ | 30.8 | | | $ | 32.6 | | | $ | 61.5 | | | $ | 63.1 | | | $ | 41.9 | | | $ | 47.6 | | Prior service cost | | | 0.1 | | | | 0.1 | | | | 3.1 | | | | 2.9 | | | | 0.0 | | | | 0.1 | | | | 3.5 | | | | 3.7 | | Total accumulated other comprehensive income recognized in the balance sheet | | $ | 48.1 | | | $ | 56.3 | | | $ | 33.9 | | | $ | 35.5 | | | $ | 61.5 | | | $ | 63.2 | | | $ | 45.4 | | | $ | 51.3 | |
CHANGES IN ACCUMULATED OTHER COMPREHENSIVE INCOME BEFORE TAX FROM CONTINUING OPERATIONS FOR THE PERIODS ENDED DECEMBER 31 | | U.S. | | | Non-U.S. | | | U.S. | | | Non-U.S. | | | | 2018 | | | 2017 | | | 2018 | | | 2017 | | | (Dollars in millions) | | | 2020 | | | 2019 | | | 2020 | | | 2019 | | Total retirement benefit recognized in accumulated other comprehensive income at beginning of year | | $ | 56.3 | | | $ | 95.9 | | | $ | 35.5 | | | $ | 32.2 | | | $ | 63.2 | | | $ | 48.1 | | | $ | 51.3 | | | $ | 33.9 | | Net actuarial (gain) loss | | | (6.0 | ) | | | (33.4 | ) | | | 1.6 | | | | 2.4 | | | | 8.3 | | | | 16.9 | | | | (5.2 | ) | | | 19.1 | | Amortization of prior service credit (cost) | | | 0.0 | | | | (0.2 | ) | | | (0.3 | ) | | | (0.2 | ) | | | 0.0 | | | | 0.0 | | | | (0.4 | ) | | | (0.3 | ) | Amortization of actuarial loss | | | (2.2 | ) | | | (6.0 | ) | | | (1.5 | ) | | | (2.0 | ) | | | (10.0 | ) | | | (1.8 | ) | | | (2.3 | ) | | | (1.5 | ) | Translation difference | | | — | | | | — | | | | (1.4 | ) | | | 3.1 | | | | — | | | | — | | | | 2.0 | | | | 0.1 | | Total retirement benefit recognized in accumulated other comprehensive income at end of year | | $ | 48.1 | | | $ | 56.3 | | | $ | 33.9 | | | $ | 35.5 | | | $ | 61.5 | | | $ | 63.2 | | | $ | 45.4 | | | $ | 51.3 | |
The accumulated benefit obligation for the U.S. non-contributory defined benefit pension plans was $314.8$419.1 million and $336.9$384.4 million at December 31, 20182020 and 2017,2019, respectively. The accumulated benefit obligation for the non-U.S. defined benefit pension plans was $167.8$236.9 million and $173.5$194.5 million at December 31, 20182020 and 2017,2019, respectively. Pension plans for which the accumulated benefit obligation (ABO) is notably in excess of the plan assets reside in the following countries: U.S., Mexico, France, Germany, Japan, South Korea and Sweden.
PENSION PLANS FOR WHICH ABO EXCEEDS THE FAIR VALUE OF PLAN ASSETS RELATED TO CONTINUING OPERATIONS AS OF DECEMBER 31 | | U.S. | | | Non-U.S. | | | U.S. | | | Non-U.S. | | | | 2018 | | | 2017 | | | 2018 | | | 2017 | | | (Dollars in millions) | | | 2020 | | | 2019 | | | 2020 | | | 2019 | | Projected Benefit Obligation (PBO) | | $ | 332.1 | | | $ | 368.6 | | | $ | 143.3 | | | $ | 143.6 | | | $ | 426.2 | | | $ | 400.1 | | | $ | 179.2 | | | $ | 169.3 | | Accumulated Benefit Obligation (ABO) | | | 314.8 | | | | 336.9 | | | | 110.8 | | | | 112.5 | | | | 419.1 | | | | 384.3 | | | | 142.7 | | | | 127.2 | | Fair value of plan assets | | | 272.9 | | | | 297.9 | | | | 3.9 | | | | 4.1 | | | | 354.6 | | | | 323.8 | | | | 4.0 | | | | 3.8 | |
The Company, in consultation with its actuarial advisors, determines certain key assumptions to be used in calculating the projected benefit obligation and annual net periodic benefit cost. ASSUMPTIONS USED TO DETERMINE THE BENEFIT OBLIGATIONS AS OF DECEMBER 31 | | U.S. | | | Non-U.S.1) | | U.S. | | | Non-U.S.1) | % WEIGHTED AVERAGE | | 2018 | | | 2017 | | | 2018 | | 2017 | | 2020 | | | 2019 | | | 2020 | | 2019 | Discount rate | | | 4.35 | | | | 3.55 | | | 0.50-3.25 | | 0.25-3.25 | | | 2.35 | | | | 3.25 | | | 0.25-2.70 | | 0.25-2.70 | Rate of increases in compensation level | | | 2.65 | | | | 2.65 | | | 2.00-5.00 | | 2.00-5.00 | | | 2.65 | | | | 2.65 | | | 1.80-4.00 | | 2.00-5.00 |
ASSUMPTIONS USED TO DETERMINE THE NET PERIODIC BENEFIT COST FOR YEARS ENDED DECEMBER 31 | | U.S. | | | U.S. | | % WEIGHTED AVERAGE | | 2018 | | | 2017 | | | 2016 | | | 2020 | | | 2019 | | | 2018 | | Discount rate | | | 3.55 | | | | 4.15 | | | | 4.50 | | | | 3.25 | | | | 4.35 | | | | 3.55 | | Rate of increases in compensation level | | | 2.65 | | | | 2.65 | | | | 2.65 | | | | 2.65 | | | | 2.65 | | | | 2.65 | | Expected long-term rate of return on assets | | | 7.08 | | | | 7.08 | | | | 7.08 | | | | 5.05 | | | | 5.05 | | | | 7.08 | |
| | Non-U.S.1) | % WEIGHTED AVERAGE | | 2020 | | 2019 | | 2018 | Discount rate | | 0.25-2.70 | | 0.50-3.25 | | 0.25-3.25 | Rate of increases in compensation level | | 2.00-5.00 | | 2.00-5.00 | | 2.00-5.00 | Expected long-term rate of return on assets | | 1.50-2.25 | | 2.25-2.50 | | 2.25-2.50 |
| | Non-U.S.1) | % WEIGHTED AVERAGE | | 2018 | | 2017 | | 2016 | Discount rate | | 0.25-3.25 | | 0.50-3.25 | | 0.50-3.60 | Rate of increases in compensation level | | 2.00-5.00 | | 2.00-5.00 | | 2.25-5.00 | Expected long-term rate of return on assets | | 2.25-2.50 | | 1.50-2.50 | | 1.50-3.60 |
1)The Non-U.S. weighted average plan ranges in the tables above have been prepared using significant plans only, which in total represent around 86%
1) | The Non-U.S. weighted average plan ranges in the tables above have been prepared using significant plans only, which in total represent around 83% of the total Non-U.S. projected benefit obligation. |
The discount rate for the U.S. plans has been set based on the rates of return on high-quality fixed-income investments currently available at the measurement date and expected to be available during the period the benefits will be paid. The expected timing of cash flows from the plan has also been considered in selecting the discount rate. In particular, the yields on bonds rated AA or better on the measurement date have been used to set the discount rate. The discount rate for the U.K. plan has been set based on the weighted average yields on long-term high-grade corporate bonds and is determined by reference to financial markets on the measurement date. The expected rate of increase in compensation levels and long-term rate of return on plan assets are determined based on a number of factors and must take into account long-term expectations and reflect the financial environment in the respective local market. The expected return on assets for the U.S. and U.K. plans are based on the fair value of the assets as of December 31. The level of equity exposure is currently targeted at approximately 40% for the primary U.S. plan. The investment objective is to provide an attractive risk-adjusted return that will ensure the payment of benefits while protecting against the risk of substantial investment losses. Correlations among the asset classes are used to identify an asset mix that Autoliv believes will provide the most attractive returns. Long-term return forecasts for each asset class using historical data and other qualitative considerations to adjust for projected economic forecasts are used to set the expected rate of return for the entire portfolio. The Company has assumed a long-term rate of return on the U.S. plan assets of 7.08%5.05% for calculating the 20182020 expense and 5.05% for calculating the 20192021 expense. The Company has assumed a long-term rate of return on the non-U.S. plan assets in a range of 2.25-2.50%1.50-2.25% for 2018.2020. The closed U.K. plan which has a targeted and actual allocation of almost 100% debt instruments accounts for approximately 79%80% of the total non-U.S. plan assets.
Autoliv made contributions to the U.S. plan during 20182020 and 20172019 amounting to $6.7$16.5 million and $6.7$7.3 million, respectively. Contributions to the U.K. plan during 20182020 and 20172019 amounted to $1.3$1.9 million and $1.2 million, respectively. The Company expects to contribute $7$12.6 million to its U.S. pension plan in 20192021 and is currently projecting a yearly funding at approximately the same level in the years thereafter. For the UK pension plan, which is the most significant non-U.S. pension plan, the Company expects to contribute $1.2$2.0 million in 20192021 and in the years thereafter. FAIR VALUE OF TOTAL PLAN ASSETS RELATED TO CONTINUING OPERATIONS FOR YEARS ENDED DECEMBER 31 | | U.S. | | | U.S. | | | Non-U.S. | | | U.S. | | | U.S. | | | Non-U.S. | | ASSETS CATEGORY IN % WEIGHTED AVERAGE | | Target allocation | | | 2018 | | | 2017 | | | 2018 | | | 2017 | | | Target allocation | | | 2020 | | | 2019 | | | 2020 | | | 2019 | | Equity securities | | | 40 | | | | 38 | | | | 56 | | | | 0 | | | | 0 | | | | 40 | | | | 42 | | | | 40 | | | | 0 | | | | 0 | | Debt instruments | | | 60 | | | | 62 | | | | 43 | | | | 79 | | | | 79 | | | | 60 | | | | 57 | | | | 60 | | | | 77 | | | | 79 | | Other assets | | | — | | | | 0 | | | | 1 | | | | 21 | | | | 21 | | | | — | | | | 1 | | | | 0 | | | | 23 | | | | 21 | | Total | | | 100 | | | | 100 | | | | 100 | | | | 100 | | | | 100 | | | | 100 | | | | 100 | | | | 100 | | | | 100 | | | | 100 | |
The following table summarizes the fair value of the Company’s U.S. and non-U.S. defined benefit pension plan assets:assets (dollars in millions): | | Fair value measurement at December 31, 2018 | | | Fair value measurement at December 31, 2017 | | | (Dollars in millions) | | | Fair value measurement at December 31, 2020 | | | Fair value measurement at December 31, 2019 | | Assets | | | | | | | | | | | | | | | | | Non-U.S. Bonds | | | | | | | | | | | | | | | | | Corporate | | | 61.4 | | | | 66.9 | | | $ | 79.6 | | | $ | 70.4 | | Insurance Contracts | | | 12.6 | | | | 13.8 | | | | 17.5 | | | | 14.7 | | Other Investments | | | 4.5 | | | | 7.4 | | | | 9.6 | | | | 6.2 | | Assets at fair value Level 2 | | | 78.5 | | | | 88.1 | | | | 106.7 | | | | 91.3 | | Investments measured at net asset value (NAV): | | | | | | | | | | | | | | | | | Common collective trusts | | | 272.3 | | | | 294.6 | | | | 350.7 | | | | 321.2 | | Total | | $ | 350.8 | | | $ | 382.7 | | | $ | 457.4 | | | $ | 412.5 | |
The fair value measurement level within the fair value hierarchy is based on the lowest level of any input that is significant to the fair value measurement. Certain assets that are measured at fair value using the NAV per share (or its equivalent) practical expedient have not been classified in the fair value hierarchy. Plan assets not measured using the NAV are classified as Level 2 in the table above. Plan assets measured using the NAV mainly relate to the U.S. defined benefit pension plans and are separately disclosed as Common collective trusts below the levelLevel 2 assets in the table above. The estimated future benefit payments for the pension benefits reflect expected future service, as appropriate. The amount of benefit payments in a given year may vary from the projected amount, especially for the U.S. plan since historically this plan pays the majority of benefits as a lump sum, where the lump sum amounts vary with market interest rates. PENSION BENEFITS EXPECTED PAYMENTS | | U.S. | | | Non-U.S. | | 2019 | | $ | 13 | | | $ | 8 | | 2020 | | $ | 14 | | | $ | 8 | | 2021 | | $ | 17 | | | $ | 9 | | 2022 | | $ | 19 | | | $ | 9 | | 2023 | | $ | 20 | | | $ | 10 | | Years 2024-2028 | | $ | 123 | | | $ | 63 | |
PENSION BENEFITS EXPECTED PAYMENTS (dollars in millions) | | U.S. | | | Non-U.S. | | 2021 | | | 21 | | | | 9 | | 2022 | | | 22 | | | | 11 | | 2023 | | | 23 | | | | 11 | | 2024 | | | 29 | | | | 12 | | 2025 | | | 26 | | | | 13 | | Years 2026-2030 | | | 131 | | | | 76 | |
POSTRETIREMENT BENEFITS OTHER THAN PENSIONS RELATED TO CONTINUING OPERATIONS The Company currently provides postretirement health care and life insurance benefits to most of its U.S. retirees.
In general, the terms of the plans provide that U.S. employees who retire after attaining age 55, with 15 years of service (5 years before December 31, 2006), are reimbursed for qualified medical expenses up to a maximum annual amount. Spouses for certain retirees are also eligible for reimbursement under the plan. Life insurance coverage is available for those who elect coverage under the retiree health plan. During 2014, the plan was amended to move from a self-insured model where employees were charged an estimated premium based on anticipated plan expenses for continued coverage, to a plan where retirees are provided a fixed contribution to a Health Retirement Account (HRA). Retirees can use the HRA funds to purchase insurance through a private exchange. Employees hired on or after January 1, 2004 are not eligible to participate in the plan. The Company has reviewed the impact of the Medicare Prescription Drug, Improvement and Modernization Act of 2003 (Medicare Part D) on its financial statements. Although the Plan may currently qualify for a subsidy from Medicare, the amount of the subsidy is so small that the expenses incurred to file for the subsidy may exceed the subsidy itself. Therefore, the impact of any subsidy is ignored in the calculations as Autoliv will not be filing for any reimbursement from Medicare.
CHANGES IN BENEFIT OBLIGATION FOR POSTRETIREMENT BENEFIT PLANS OTHER THAN PENSIONS RELATED TO CONTINUING OPERATIONS AS OF DECEMBER 31 | | 2018 | | | 2017 | | | (Dollars in millions) | | | 2020 | | | 2019 | | Benefit obligation at beginning of year | | $ | 17.8 | | | $ | 15.8 | | | $ | 18.4 | | | $ | 15.5 | | Service cost | | | 0.3 | | | | 0.3 | | | | 0.2 | | | | 0.2 | | Interest cost | | | 0.6 | | | | 0.6 | | | | 0.6 | | | | 0.6 | | Actuarial (gains) losses | | | (1.2 | ) | | | 0.7 | | | Actuarial loss (gain) | | | | 2.1 | | | | 2.2 | | Benefits paid | | | (0.3 | ) | | | (0.2 | ) | | | (0.4 | ) | | | (0.3 | ) | Other | | | (1.7 | ) | | | 0.6 | | | | 0.3 | | | | 0.2 | | Benefit obligation at end of year | | $ | 15.5 | | | $ | 17.8 | | | $ | 21.2 | | | $ | 18.4 | |
The liability for postretirement benefits other than pensions is classified as other non-current liabilities in the balance sheet. COMPONENTS OF NET PERIODIC BENEFIT COST FROM CONTINUING OPERATIONS ASSOCIATED WITH THE POST RETIREMENT BENEFIT PLANS OTHER THAN PENSIONS PERIOD ENDED DECEMBER 31 | | 2018 | | | 2017 | | | 2016 | | | PERIOD ENDED DECEMBER 31 (Dollars in millions) | | | 2020 | | | 2019 | | | 2018 | | Service cost | | $ | 0.3 | | | $ | 0.3 | | | $ | 0.3 | | | $ | 0.2 | | | $ | 0.2 | | | $ | 0.3 | | Interest cost | | | 0.6 | | | | 0.6 | | | | 0.7 | | | | 0.6 | | | | 0.6 | | | | 0.6 | | Amortization of prior service cost | | | (2.2 | ) | | | (2.2 | ) | | | (2.2 | ) | | | (2.1 | ) | | | (2.2 | ) | | | (2.2 | ) | Amortization of actuarial loss | | | (0.3 | ) | | | (0.5 | ) | | | — | | | | (0.0 | ) | | | (0.3 | ) | | | (0.3 | ) | Net periodic benefit (credit) cost | | $ | (1.6 | ) | | $ | (1.8 | ) | | $ | (1.2 | ) | | Net periodic benefit (credit) | | | $ | (1.3 | ) | | $ | (1.7 | ) | | $ | (1.6 | ) |
COMPONENTS OF ACCUMULATED OTHER COMPREHENSIVE INCOME BEFORE TAX ASSOCIATED WITH POSTRETIREMENT BENEFIT PLANS OTHER THAN PENSIONS RELATED TO CONTINUING OPERATIONS AS OF DECEMBER 31 | | U.S. | | | U.S. | | | | 2018 | | | 2017 | | | (Dollars in millions) | | | 2020 | | | 2019 | | Net actuarial loss (gain) | | $ | (4.6 | ) | | $ | (3.7 | ) | | $ | (0.1 | ) | | $ | 2.0 | | Prior service cost (credit) | | | (8.2 | ) | | | (10.6 | ) | | | 4.0 | | | | 6.1 | | Total accumulated other comprehensive income recognized in the balance sheet | | $ | (12.8 | ) | | $ | (14.3 | ) | | Total accumulated other comprehensive loss (income) recognized in the balance sheet | | | $ | 3.9 | | | $ | 8.1 | |
For measuring end-of-year obligations at December 31, 2016, health care trends are not needed due to the fixed-cost nature of the benefits provided in 2014 and beyond. After 2014, all retirees receive a fixed dollar subsidy toward the cost of their health benefits. This individual retiree subsidy will not increase in future years.
The weighted average discount rate used to determine the U.S. postretirement benefit obligation was 4.45%2.6% in 20182020 and 3.75%3.5% in 2017.2019. The average discount rate used in determining the postretirement benefit cost was 3.5% in 2020, 4.45% in 2019 and 3.75% in 2018, 4.40% in 2017 and 4.65% in 2016. A one percentage point increase or decrease in the annual health care cost trend rates would have had no impact on the Company’s net benefit cost for the current period or on the accumulated postretirement benefit obligation at December 31, 2017. This is due to the fixed-dollar nature of the benefits provided under the postretirement benefit plan.
The estimated net gain and prior service credit for the postretirement benefit plans that will be amortized from other comprehensive income into net benefit cost over the next fiscal year are approximately $(2.5) million combined.2018.
The estimated future benefit payments for the postretirement benefits set forth below reflect expected future service as appropriate.appropriate (dollars in millions). POSTRETIREMENT BENEFITS | EXPECTED PAYMENTS | | 2019 | $ | 0.4 | | 2020 | $ | 0.4 | | 2021 | $ | 0.5 | | 2022 | $ | 0.5 | | 2023 | $ | 0.6 | | Years 2024–2028 | $ | 3.5 | |
POSTRETIREMENT BENEFITS (Dollars in millions) | | EXPECTED PAYMENTS | | 2021 | | | 0.5 | | 2022 | | | 0.6 | | 2023 | | | 0.6 | | 2024 | | | 0.7 | | 2025 | | | 0.7 | | Years 2026–2030 | | | 3.9 | |
21.20. Related Party Transactions
Throughout the periods covered by consolidated financial statements, Autoliv purchased finished goods from Veoneer. Related party purchases from Veoneer amounted to approximately $78$70 million and $76$73 million for the full year 20182020 and 2017,2019, respectively. Autoliv also subleases certain office space to Veoneer. However, related party sublease income from Veoneer is not material for 2020 and 2019. Amounts due to and due from related parties as of December 31, 20182020 and December 31, 20172019 are summarized in the below table: | | As of | | Related party (Dollars in millions) | | December 31, 2018 | | | December 31, 2017 | | Related party receivables | | $ | 15.0 | | | $ | — | | Related party payables | | | 50.7 | | | | | | Related party accrued expenses | | | 13.0 | | | | — | |
| | As of | | (Dollars in millions) | | December 31, 2020 | | | December 31, 2019 | | Related party receivables | | $ | 2.0 | | | $ | 2.8 | | Related party payables1) | | | 27.2 | | | | 9.7 | | Related party accrued expenses1) | | | 10.3 | | | | 7.7 | |
1) | Included in Related party liabilities in the Consolidated Balance Sheet. |
Related party receivables primarily relate to an agreement between Autoliv and Veoneer. The related party payables are mainly driven by Reseller Agreements put in placeentered into in connection with the spin-off. The Reseller Agreements are between Autoliv and Veoneer to facilitate the temporary arrangement of the sale of Veoneer products in the interim period post spin-off. For further information, see Note 3. Discontinued Operations above. The related party accrued expenses consists of indemnification liabilities where Autoliv is required to indemnify Veoneer for certain warranty and recall related claims in connection with the Spin-off.
22.21. Segment Information
The Company has one1 operating segment Passive Safety, which includes Autoliv’s airbag and seatbelt products and components. The operating results of the operating segment are regularly reviewed by the Company’s chief operating decision maker to assess the performance of the individual operating segment and make decisions about resources to be allocated to the operating segment. The Company’s customers consist of all major European, U.S. and Asian automobile manufacturers. Sales to individual customers representing 10% or more of net sales were: In 2020: Renault 13% (including Nissan and Mitsubishi), VW 11%, Stellantis 11% and Honda 10%. In 2019: Renault 16% (including Nissan and Mitsubishi) and VW 10% and Honda 10%. In 2018: Renault 15% (including Nissan and Mitsubishi) and VW 10%. In 2017: Renault 15% (including Nissan and Mitsubishi) and Ford 10%.
In 2016: Renault 12% (including Nissan), Ford 10% and Hyundai 10%.
NET SALES BY REGION | | 2018 | | | 2017 | | | 2016 | | | 2020 | | | 2019 | | | 2018 | | Asia | | $ | 3,194.9 | | | $ | 2,998.1 | | | $ | 2,830.2 | | | $ | 3,043.0 | | | $ | 3,176.6 | | | $ | 3,194.9 | | Whereof: China | | | 1,522.2 | | | | 1,421.2 | | | | 1,385.4 | | | | 1,540.8 | | | | 1,525.3 | | | | 1,522.2 | | Japan | | | 827.9 | | | | 787.0 | | | | 718.6 | | | | 732.9 | | | | 810.3 | | | | 827.9 | | Rest of Asia | | | 844.8 | | | | 789.9 | | | | 726.2 | | | | 769.3 | | | | 841.0 | | | | 844.8 | | Americas | | | 2,735.1 | | | | 2,435.2 | | | | 2,548.0 | | | | 2,337.1 | | | | 2,907.2 | | | | 2,735.1 | | Europe | | | 2,748.2 | | | | 2,703.5 | | | | 2,543.4 | | | | 2,067.3 | | | | 2,463.8 | | | | 2,748.2 | | Total | | $ | 8,678.2 | | | $ | 8,136.8 | | | $ | 7,921.6 | | | $ | 7,447.4 | | | $ | 8,547.6 | | | $ | 8,678.2 | |
The Company has attributed net sales to the geographic area based on the location of the entity selling the final product. External sales in the U.S. amounted to $1,647 million, $2,090 million and $1,943 million $1,689 millionin 2020, 2019 and $1,862 million in 2018, 2017 and 2016, respectively. Of the external sales, exports from the U.S. to other regions amounted to approximately $348 million, $463 million and $384 million $362 millionin 2020, 2019 and $423 million in 2018, 2017 and 2016, respectively. NET SALES BY PRODUCT | | 2018 | | | 2017 | | | 2016 | | | 2020 | | | 2019 | | | 2018 | | Airbag Products1) | | $ | 5,698.6 | | | $ | 5,343.2 | | | $ | 5,256.4 | | | $ | 4,824.2 | | | $ | 5,676.3 | | | $ | 5,698.6 | | Seatbelt Products1) | | | 2,979.6 | | | | 2,793.6 | | | | 2,665.2 | | | | 2,623.2 | | | | 2,871.3 | | | | 2,979.6 | | Total net sales | | $ | 8,678.2 | | | $ | 8,136.8 | | | $ | 7,921.6 | | | $ | 7,447.4 | | | $ | 8,547.6 | | | $ | 8,678.2 | |
1) | Including Corporate and other sales.sales. |
LONG-LIVED ASSETS | | 2018 | | | 2017 | | | 2020 | | | 2019 | | Asia | | $ | 881 | | | $ | 975 | | | $ | 984 | | | $ | 948 | | Whereof: China | | $ | 500 | | | $ | 548 | | | | 508 | | | | 495 | | Japan | | $ | 135 | | | $ | 196 | | | | 184 | | | | 170 | | Rest of Asia | | $ | 246 | | | $ | 231 | | | | 292 | | | | 283 | | Americas | | $ | 1,708 | | | $ | 1,572 | | | | 1,874 | | | | 1,862 | | Europe | | $ | 847 | | | $ | 843 | | | | 1,030 | | | | 959 | | Total | | $ | 3,436 | | | $ | 3,390 | | | $ | 3,888 | | | $ | 3,769 | |
Long-lived assets in the U.S. amounted to $1,527$1,653 million and $1,601$1,633 million for 20182020 and 2017,2019, respectively. For 2018, $1,2502020, $1,235 million (2017, $1,263(2019, $1,242 million) of the long-lived assets in the U.S. refers to intangible assets, principally from acquisition goodwill.
23.22. Earnings Per Share
The computation of basic and diluted EPS under the two-class method were as follows (dollars and shares in millions): | | 2018 | | | 2017 | | | 2016 | | | 2020 | | | 2019 | | | 2018 | | Numerator: | | | | | | | | | | | | | | | | | | | | | | | | | Basic and diluted: | | | | | | | | | | | | | | | | | | | | | | | | | Net income from continuing operations | | $ | 375.9 | | | $ | 586.0 | | | $ | 558.4 | | | $ | 186.9 | | | $ | 461.5 | | | $ | 375.9 | | Net (loss) income from discontinued operations | | | (185.5 | ) | | | (158.9 | ) | | | 8.7 | | | Net loss from discontinued operations | | | | — | | | | — | | | | (185.5 | ) | Net income attributable to controlling interest | | | 190.4 | | | | 427.1 | | | | 567.1 | | | | 186.9 | | | | 461.5 | | | | 190.4 | | Participating share awards with dividend equivalent rights | | | 0.0 | | | | 0.0 | | | | — | | | | 0.0 | | | | 0.0 | | | | 0.0 | | Net income available to common shareholders | | | 190.4 | | | | 427.1 | | | | 567.1 | | | | 186.9 | | | | 461.5 | | | | 190.4 | | Earnings allocated to participating share awards 1) | | | 0.0 | | | | 0.0 | | | | — | | | | 0.0 | | | | 0.0 | | | | 0.0 | | Net income attributable to common shareholders | | $ | 190.4 | | | $ | 427.1 | | | $ | 567.1 | | | $ | 186.9 | | | $ | 461.5 | | | $ | 190.4 | | Denominator: 1) | | | | | | | | | | | | | | | | | | | | | | | | | Basic: Weighted average common stock | | | 87.1 | | | | 87.5 | | | | 88.2 | | | | 87.3 | | | | 87.2 | | | | 87.1 | | Add: Weighted average stock options/share awards | | | 0.2 | | | | 0.2 | | | | 0.2 | | | | 0.2 | | | | 0.2 | | | | 0.2 | | Diluted: | | | 87.3 | | | | 87.7 | | | | 88.4 | | | | 87.5 | | | | 87.4 | | | | 87.3 | | | | | | | | | | | | | | | | | | | | | | | | | | | Basic EPS: | | | | | | | | | | | | | | | | | | | | | | | | | Continuing operations | | $ | 4.32 | | | $ | 6.70 | | | $ | 6.33 | | | $ | 2.14 | | | $ | 5.29 | | | $ | 4.32 | | Discontinued operations | | | (2.13 | ) | | | (1.82 | ) | | | 0.10 | | | | — | | | | — | | | | (2.13 | ) | Basic EPS | | $ | 2.19 | | | $ | 4.88 | | | $ | 6.43 | | | $ | 2.14 | | | $ | 5.29 | | | $ | 2.19 | | | | | | | | | | | | | | | | | | | | | | | | | | | Diluted EPS: | | | | | | | | | | | | | | | | | | | | | | | | | Continuing operations | | $ | 4.31 | | | $ | 6.68 | | | $ | 6.32 | | | $ | 2.14 | | | $ | 5.29 | | | $ | 4.31 | | Discontinued operations | | | (2.13 | ) | | | (1.81 | ) | | | 0.10 | | | | — | | | | — | | | | (2.13 | ) | Diluted EPS | | $ | 2.18 | | | $ | 4.87 | | | $ | 6.42 | | | $ | 2.14 | | | $ | 5.29 | | | $ | 2.18 | |
1) | The Company’s unvested RSUs and PSs, of which some included the right to receive non-forfeitable dividend equivalents, are considered participating securities. Calculations of EPS under the two-class method exclude from the numerator any dividends paid or owed on participating securities and any undistributed earnings considered to be attributable to participating securities. The related participating securities are similarly excluded from the denominator. |
There were no antidilutiveAnti-dilutive shares outstanding for the yearyears ended December 31, 2020, 2019 and 2018 approximately 0.1 million antidilutive shares outstanding for the year ended December 31, 2017 and 0.2 million antidilutive shares outstanding for the year ended December 31, 2016.were immaterial.
24.23. Subsequent Events
There were no reportable events subsequent to December 31, 2018.2020.
25.24. Quarterly Financial Data (unaudited)
2018 | Q1 | | | Q2 | | | Q3 | | | Q4 | | | 2020 | | Q1 | | | Q2 | | | Q3 | | | Q4 | | Net sales | $ | 2,240.9 | | | $ | 2,211.5 | | | $ | 2,033.0 | | | $ | 2,192.8 | | $ | 1,845.8 | | | $ | 1,047.6 | | | $ | 2,037.2 | | | $ | 2,516.8 | | Gross profit | | 460.3 | | | | 439.7 | | | | 386.1 | | | | 425.2 | | | 331.0 | | | | 14.4 | | | | 399.7 | | | | 501.8 | | Income from Continuing Operations before income taxes | | 228.9 | | | | 210.1 | | | | 171.3 | | | | 2.1 | | | Income from Continuing Operations | | 159.1 | | | | 193.2 | | | | 118.0 | | | | (92.8 | ) | | Net income attributable to controlling interest from Continuing Operations | | 158.7 | | | | 192.7 | | | | 117.5 | | | | (93.0 | ) | | Earnings per share Continuing Operations | | | | | | | | | | | | | | | | | Income (loss) before income taxes | | | 111.3 | | | | (246.6 | ) | | | 148.5 | | | | 277.9 | | Net Income (loss) | | | 74.9 | | | | (174.3 | ) | | | 98.8 | | | | 188.9 | | Net income (loss) attributable to controlling interest | | | 74.8 | | | | (174.7 | ) | | | 98.3 | | | | 188.5 | | Earnings (loss) per share | | | | | | | | | | | | | | | | | – basic | | 1.82 | | | | 2.21 | | | | 1.35 | | | | (1.07 | ) | | 0.86 | | | | (2.00 | ) | | | 1.13 | | | | 2.16 | | – diluted | | 1.82 | | | | 2.20 | | | | 1.34 | | | | (1.06 | ) | | 0.86 | | | | (2.00 | ) | | | 1.12 | | | | 2.15 | | Dividends paid | | 0.60 | | | | 0.62 | | | | 0.62 | | | | 0.62 | | | 0.62 | | | | — | | | | — | | | | — | |
2017 | Q1 | | | Q2 | | | Q3 | | | Q4 | | | 2019 | | Q1 | | | Q2 | | | Q3 | | | Q4 | | Net sales | $ | 2,041.6 | | | $ | 1,983.9 | | | $ | 1,952.6 | | | $ | 2,158.7 | | $ | 2,174.0 | | | $ | 2,154.7 | | | $ | 2,027.7 | | | $ | 2,191.2 | | Gross profit | | 428.7 | | | | 415.3 | | | | 394.9 | | | | 440.8 | | | 378.8 | | | | 399.7 | | | | 379.1 | | | | 426.8 | | Income from Continuing Operations before income taxes | | 199.7 | | | | 201.2 | | | | 150.7 | | | | 240.8 | | | Income from Continuing Operations | | 148.3 | | | | 136.1 | | | | 106.2 | | | | 197.4 | | | Net income attributable to controlling interest from Continuing Operations | | 147.9 | | | | 135.7 | | | | 105.7 | | | | 196.7 | | | Earnings per share Continuing Operations | | | | | | | | | | | | | | | | | Income before income taxes | | | 153.6 | | | | 150.8 | | | | 134.4 | | | | 209.7 | | Net Income | | | 111.5 | | | | 109.4 | | | | 86.0 | | | | 155.9 | | Net income attributable to controlling interest | | | 111.4 | | | | 109.1 | | | | 85.4 | | | | 155.6 | | Earnings per share | | | | | | | | | | | | | | | | | – basic | | 1.67 | | | | 1.54 | | | | 1.22 | | | | 2.26 | | | 1.28 | | | | 1.25 | | | | 0.98 | | | | 1.78 | | – diluted | | 1.67 | | | | 1.54 | | | | 1.21 | | | | 2.26 | | | 1.27 | | | | 1.25 | | | | 0.98 | | | | 1.78 | | Dividends paid | | 0.58 | | | | 0.60 | | | | 0.60 | | | | 0.60 | | | 0.62 | | | | 0.62 | | | | 0.62 | | | | 0.62 | |
Quarterly movements In the fourthsecond quarter of 2018, income from Continuing Operations before taxes was2020, COVID-19 negatively impacted Net Income due to several plant closures as customers’ plants were also closed for several weeks and operated at low levels during Q2. A large number of customer plants were closed in April and parts of May, followed by a ramp-up in June. According to IHS, global light vehicle production (LVP) declined by 45% in Q2 2020 compared to Q2 2019. In addition to the Company recognizing an accrualdecline in global LVP, the slow and volatile restart and ramp-up of $210 million in connection with the remaining portion of the European Commission’s investigation of anti-competitive behavior among suppliers of occupant safety systemsproduction had a significant impact on our sales and profitability in the European Union.first half of 2020. EXCHANGE RATES FOR KEY CURRENCIES VS. U.S. | | 2018 | | | 2018 | | | 2017 | | | 2017 | | | 2016 | | | 2016 | | | 2015 | | | 2015 | | | 2014 | | | 2014 | | | 2020 | | | 2020 | | | 2019 | | | 2019 | | | 2018 | | | 2018 | | | 2017 | | | 2017 | | | 2016 | | | 2016 | | | | Average | | | Year end | | | Average | | | Year end | | | Average | | | Year end | | | Average | | | Year end | | | Average | | | Year end | | | Average | | | Year end | | | Average | | | Year end | | | Average | | | Year end | | | Average | | | Year end | | | Average | | | Year end | | EUR | | | 1.182 | | | | 1.145 | | | | 1.129 | | | | 1.196 | | | | 1.106 | | | | 1.052 | | | | 1.110 | | | | 1.094 | | | | 1.327 | | | | 1.218 | | | | 1.139 | | | | 1.226 | | | | 1.119 | | | | 1.120 | | | | 1.182 | | | | 1.145 | | | | 1.129 | | | | 1.196 | | | | 1.106 | | | | 1.052 | | CNY | | | 0.151 | | | | 0.146 | | | | 0.148 | | | | 0.154 | | | | 0.150 | | | | 0.144 | | | | 0.159 | | | | 0.154 | | | | 0.162 | | | | 0.161 | | | | 0.145 | | | | 0.153 | | | | 0.145 | | | | 0.143 | | | | 0.151 | | | | 0.146 | | | | 0.148 | | | | 0.154 | | | | 0.150 | | | | 0.144 | | JPY/1000 | | | 9.061 | | | | 9.051 | | | | 8.916 | | | | 8.878 | | | | 9.222 | | | | 8.544 | | | | 8.261 | | | | 8.303 | | | | 9.452 | | | | 8.367 | | | | 9.361 | | | | 9.678 | | | | 9.178 | | | | 9.157 | | | | 9.061 | | | | 9.051 | | | | 8.916 | | | | 8.878 | | | | 9.222 | | | | 8.544 | | KRW/1000 | | | 0.909 | | | | 0.896 | | | | 0.885 | | | | 0.937 | | | | 0.863 | | | | 0.832 | | | | 0.885 | | | | 0.854 | | | | 0.950 | | | | 0.913 | | | | 0.847 | | | | 0.921 | | | | 0.857 | | | | 0.870 | | | | 0.909 | | | | 0.896 | | | | 0.885 | | | | 0.937 | | | | 0.863 | | | | 0.832 | | MXN | | | 0.052 | | | | 0.051 | | | | 0.053 | | | | 0.051 | | | | 0.053 | | | | 0.048 | | | | 0.063 | | | | 0.058 | | | | 0.075 | | | | 0.068 | | | | 0.047 | | | | 0.050 | | | | 0.052 | | | | 0.053 | | | | 0.052 | | | | 0.051 | | | | 0.053 | | | | 0.051 | | | | 0.053 | | | | 0.048 | | SEK | | | 0.115 | | | | 0.111 | | | | 0.117 | | | | 0.121 | | | | 0.117 | | | | 0.110 | | | | 0.119 | | | | 0.120 | | | | 0.146 | | | | 0.128 | | | | 0.109 | | | | 0.122 | | | | 0.106 | | | | 0.107 | | | | 0.115 | | | | 0.111 | | | | 0.117 | | | | 0.121 | | | | 0.117 | | | | 0.110 | | BRL | | | 0.276 | | | | 0.258 | | | | 0.313 | | | | 0.302 | | | | 0.289 | | | | 0.307 | | | | 0.306 | | | | 0.259 | | | | 0.426 | | | | 0.370 | | | | 0.197 | | | | 0.192 | | | | 0.253 | | | | 0.247 | | | | 0.276 | | | | 0.258 | | | | 0.313 | | | | 0.302 | | | | 0.289 | | | | 0.307 | |
Item 9. Changes in and Disagreements with AccountantsAccountants on Accounting and Financial Disclosure There have been no changes to and no disagreements with our independent auditors regarding accounting or financial disclosure matters in our two most recent fiscal years. Item 9A. Controls and Procedures Evaluation of Disclosure Controls and Procedures An evaluation has been carried out by the Company’s management, under the supervision and with the participation of the Company’s Chief Executive Officer and Chief Financial Officer, of the effectiveness of the design and operation of our disclosure controls and procedures (as such term is defined in Rules 13a-15(e) and 15d-15(e) under the Securities Exchange Act of 1934, as amended (the “Exchange Act”)) as of the end of the period covered by this report. Based on such evaluation, the Company’s Chief Executive Officer and Chief Financial Officer have concluded that, as of the end of such period, the Company’s disclosure controls and procedures are effective. Internal Control over Financial Reporting (a) Management’s Annual Report on Internal Control Over Financial Reporting Management of the Company is responsible for establishing and maintaining adequate internal control over financial reporting. Internal control over financial reporting is defined in Rules 13a-15(f) and 15d-15(f) under the Exchange Act as a process designed by, or under the supervision of, the Company’s principal executive and principal financial officers and effected by the Company’s board of directors, management and other personnel to provide reasonable assurance regarding the reliability of financial reporting and the preparation of financial statements for external purposes in accordance with generally accepted accounting principles and includes those policies and procedures that: pertain to the maintenance of records that in reasonable detail accurately and fairly reflect the transactions and dispositions of the assets of the Company;
| • | pertain to the maintenance of records that in reasonable detail accurately and fairly reflect the transactions and dispositions of the assets of the Company; |
provide reasonable assurance that transactions are recorded as necessary to permit preparation of financial statements in accordance with generally accepted accounting principles, and that receipts and expenditures of the Company are being made only in accordance with authorizations of management and directors of the Company; and
| • | provide reasonable assurance that transactions are recorded as necessary to permit preparation of financial statements in accordance with generally accepted accounting principles, and that receipts and expenditures of the Company are being made only in accordance with authorizations of management and directors of the Company; and |
provide reasonable assurance regarding prevention or timely detection of unauthorized acquisition, use or disposition of the Company’s assets that could have a material effect on the financial statements.
| • | provide reasonable assurance regarding prevention or timely detection of unauthorized acquisition, use or disposition of the Company’s assets that could have a material effect on the financial statements. |
Because of its inherent limitations, internal control over financial reporting may not prevent or detect misstatements. Projections of any evaluation of effectiveness to future periods are subject to the risks that controls may become inadequate because of changes in conditions, or that the degree of compliance with the policies or procedures may deteriorate. Management assessed the effectiveness of Autoliv’s internal control over financial reporting as of December 31, 2018.2020. In making this assessment, we used the criteria set forth by the Committee of Sponsoring Organizations of the Treadway Commission (COSO) in Internal Control – Integrated Framework (2013 framework). Based on our assessment, we believe that, as of December 31, 2018,2020, the Company’s internal control over financial reporting is effective. (b) Attestation Report of the Registered Public Accounting Firm Ernst & Young AB has issued an attestation report on the Company’s internal control over financial reporting, which is included herein as the Report of Independent Registered Public Accounting Firm under Item 8. Financial Statements and Supplementary Data for the year ended December 31, 2018.2020. (c) Changes in Internal Control over Financial Reporting There have not been any changes in the Company’s internal control over financial reporting (as such term is defined in Rules 13a-15 13a-15-(f) and 15d-15(f) under the Exchange Act) during the quarter ended December 31, 20182020 that have materially affected, or are reasonably likely to materially affect, the Company’s internal control over financial reporting. The Company’s ability to maintain an effective internal control environment has not been impacted by the COVID-19 pandemic. The Company is continually monitoring and assessing the COVID-19 pandemic’s effect on its internal controls to minimize the impact on their design and operating effectiveness. Item 9B. Other Information None.
PART III Item 10. Directors, Executive OfficersOfficers and Corporate Governance The information required by Item 10. regarding executive officers, directors and nominees for election as directors of Autoliv, Autoliv’s Audit Committee, Autoliv’s code of ethics, and compliance with Section 16(A) of the Securities Exchange Act is incorporated herein by reference from the information under the captions “Executive Officers of the Company” and “Item“Proposal 1: Election of Directors”, “Committees of the Board” and “Audit Committee Report”, “Corporate Governance Guidelines and Codes of Conduct and Ethics”, and “Section 16(a) Beneficial Ownership Reporting Compliance”, respectively, in the Company’s 20192021 Proxy Statement. Information on Board meeting attendance is provided under the caption “Board Meetings” in the 20192021 Proxy Statement and incorporated herein by reference. Item 11. Executive Compensation The information required by Item 11. regarding executive compensation for the year ended December 31, 20182020 is included under the captionscaption “Compensation Discussion and Analysis” and “Executive Compensation” in the 20192021 Proxy Statement and is incorporated herein by reference. The information required by the same item regarding Leadership Development and Compensation Committee is included in the sections “Compensation“Leadership Development and Compensation Committee Interlocks and Insider Participation” and “Leadership Development and Compensation Committee Report” in the 20192021 Proxy Statement and is incorporated herein by reference. Item 12. Security Ownership of Certain Beneficial Owners and Management and Related Stockholder Matters The information required by Item 12. regarding beneficial ownership of Autoliv’s common stock is included under the caption “Security Ownership of Certain Beneficial Owners and Management” in the 20192021 Proxy Statement and is incorporated herein by reference. Shares Previously Authorized for Issuance Under the 1997 Stock Incentive Plan The following table provides information as of December 31, 2018,2020, about the common stock that may be issued under the Autoliv, Inc. Stock Incentive Plan. The Company does not have any equity compensation plans that have not been approved by its stockholders. Plan Category | | (a) Number of Securities to be issued upon exercise of outstanding options, warrants and rights | | | (b) Weighted- average exercise price of outstanding options, warrants and rights(2) | | | (c) Number of securities remaining available for future issuance under equity compensation plans (excluding securities reflected in column (a))(3) | | | (a) Number of Securities to be issued upon exercise of outstanding options, warrants and rights | | | (b) Weighted- average exercise price of outstanding options, warrants and rights(2) | | | (c) Number of securities remaining available for future issuance under equity compensation plans (excluding securities reflected in column (a))(3) | | Equity compensation plans approved by security holders (1) | | | 404,148 | | | $ | 63.43 | | | | 3,190,663 | | | | 493,204 | | | $ | 68.13 | | | | 2,910,397 | | Equity compensation plans not approved by security holders | | | — | | | | — | | | | — | | | | — | | | | — | | | | — | | Total | | | 404,148 | | | $ | 63.43 | | | | 3,190,663 | | | | 493,204 | | | $ | 68.13 | | | | 2,910,397 | |
(1) | Autoliv, Inc. Stock Incentive Plan, as amended and restated on May 6, 2009, as amended by Amendment No. 1 dated December 17, 2010 and Amendment No. 2 dated May 8, 2012. |
(2) | Excludes restricted stock units and performance shares which convert to shares of common stock for no consideration. |
(3) | All such shares are available for issuance pursuant to grants of full-value stock awards. |
Item 13. Certain Relationships and Related Transactions, and Director Independence Information regarding the Company’s policy and procedures concerning related party transactions is included under the caption “Related Person Transactions” in the 20192021 Proxy Statement and is incorporated herein by reference. Information regarding director independence can be found under the caption “Board Independence” in the 20192021 Proxy Statement and is incorporated herein by reference. Item 14. Principal Accounting Fees and Services The information required by Item 9(e) of Schedule 14A regarding principal accounting fees and the information required by Item 14 regarding the pre-approval process of accounting services provided to Autoliv is included under the caption “Ratification“Proposal 3. Ratification of Appointment of Independent Auditors”Registered Public Accounting Firm Appointment” in the 20192021 Proxy Statement and is incorporated herein by reference.
PART IV Item 15. Exhibits and FinancialFinancial Statement Schedules (a) | Documents Filed as Part of this Report |
| (i) | Consolidated Statements of Net Income – Years ended December 31, 2018, 20172020, 2019 and 2016;2018; |
| (ii) | Consolidated Statements of Comprehensive Income – Years ended December 31, 2018, 20172020, 2019 and 2016;2018; |
| (iii) | Consolidated Balance Sheets – as of December 31, 20182020 and 2017;2019; |
| (iv) | Consolidated Statements of Cash Flows – Years ended December 31, 2018, 20172020, 2019 and 2016;2018; |
| (v) | Consolidated Statements of Total Equity – as of December 31, 2018, 20172020, 2019 and 2016;2018; |
| (vi) | Notes to Consolidated Financial Statements; and |
| (vii) | Reports of Independent Registered Public Accounting Firm. |
(2) | Financial Statement Schedules |
All of the schedules specified under Regulation S-X to be provided by Autoliv have been omitted either because they are not applicable, they are not required, or the information required is included in the financial statements or notes thereto. | | | Exhibit No. | | Description | | | | 2.1 | | Stock Purchase Agreement, dated as of July 16, 2015, by and among Autoliv ASP Inc., M/A-COM Technology Solutions Inc., M/A-COM Auto Solutions Inc. and, for the limited purposes specified therein, M/A-COM Technology Solutions Holdings, Inc., incorporated herein by reference to Exhibit 2.1 to the Current Report on Form 8-K (File No. 001-12933, filing date July 17, 2015).
| | | | 2.2
| | Distribution Agreement, dated June 28, 2018, between Veoneer, Inc. and Autoliv, Inc., incorporated herein by reference to Exhibit 2.1 to the Current Report on Form 8-K (File No. 001-12933, filing date July 2, 2018). | | | | 3.1 | | Autoliv’s Restated Certificate of Incorporation, as amended, incorporated herein by reference to Exhibit 3.1 to the Quarterly Report on Form 10-Q (File No. 001-12933, filing date April 22, 2015). | | | | 3.2 | | Autoliv’s Third Restated By-Laws, incorporated herein by reference to Exhibit 3.1 to the Current Report on Form 8-K (File No. 001-12933, filing date December 18, 2015). | | | | 4.1 | | Indenture, dated March 30, 2009, between Autoliv, Inc. and U.S. Bank National Association, as trustee, incorporated herein by reference to Exhibit 4.1 to Autoliv’s Registration Statement on Form 8-A (File No. 001-12933, filing date March 30, 2009). | | | | 4.2 | | Second Supplemental Indenture (including Form of Global Note), dated March 15, 2012, between Autoliv, Inc. and U.S. Bank National Association, as trustee, incorporated herein by reference to Exhibit 4.1 to the Current Report on Form 8-K (File No. 001-12933, filing date March 15, 2012). | | | | 4.3 | | Form of Note Purchase and Guaranty Agreement dated April 23, 2014, among Autoliv ASP, Inc., Autoliv, Inc. and the purchasers named therein, incorporated herein by reference to Exhibit 4.6 to the Quarterly Report on Form 10-Q (File No. 001-12933, filing date April 25, 2014). | | | | 4.4 | | Amendment and Waiver 2014 Note Purchase and Guaranty Agreement, dated May 24, 2018 among Autoliv, Inc., Autoliv ASP, Inc. and the noteholders named therein, incorporated herein by reference to Exhibit 4.4 to the Quarterly Report on Form 10-Q (File No. 001-12933, filing date July 27, 2018). | | | | 4.5 | | General Terms and Conditions for Swedish Depository Receipts in Autoliv, Inc., representing common shares in Autoliv, Inc., effective as of May 30, 2018 with Skandinaviska Enskilda Banken AB (publ) serving as a custodian, incorporated herein by reference to Exhibit 4.5 to the Quarterly Report on Form 10-Q (File No. 001-12933, filing date July 27, 2018). | | | | 4.6 | | Agency Agreement dated June 26, 2018 among Autoliv, Inc., Autoliv ASP Inc. and HSBC Bank PLC, incorporated herein by reference to Exhibit 4.6 to the Quarterly Report on Form 10-Q (File No. 001-12933, filing date July 27, 2018). | | | | 10.1+ 4.7
| | Form of EmploymentBase listing particulars Agreement, betweendated April 11, 2019, among Autoliv, Inc., Autoliv ASP, Inc. and certain of its executive officers,the dealers named therein, incorporated herein by reference to Exhibit 10.44.7 to the AnnualQuarterly Report on Form 10-K/A10-Q (File No. 001-12933, filing date July 2, 2002)April 26, 2019).
| | | | 10.2+ 4.8
| | Form of SupplementaryProgramme Agreement, to the Employment Agreement betweendated April 11, 2019, among Autoliv, Inc., Autoliv ASP, Inc. and certain of its executive officers,the dealers named therein, incorporated herein by reference to Exhibit 10.54.8 to the AnnualQuarterly Report on Form 10-K/A10-Q (File No. 001-12933, filing date July 2, 2002)April 26, 2019).
| | | | 10.3+ 4.9
| | Form of SeveranceAgency Agreement, betweendated April 11, 2019, among Autoliv, Inc., Autoliv ASP, Inc. and certain of its executive officers,the dealers named therein, incorporated herein by reference to Exhibit 10.74.9 to the AnnualQuarterly Report on Form 10-K/A10-Q (File No. 001-12933, filing date July 2, 2002)April 26, 2019).
| | | | 10.4+ 4.10
| | Form of Amendment to EmploymentBase Listing Particulars Agreement, betweendated February 21, 2020, among Autoliv, Inc., Autoliv ASP, Inc. and certain of its executive officers – notice,the dealers named therein, incorporated herein by reference to Exhibit 10.94.10 to the AnnualQuarterly Report on Form 10-K10-Q (File No. 001-12933, filing date March 14, 2003)April 24, 2020).
|
| | | Exhibit No. | | Description | | | | | | | 4.11 | | Amended and Restated Programme Agreement, dated February 21, 2020, among Autoliv, Inc., Autoliv ASP, Inc. and the dealers named therein incorporated by reference to Exhibit 4.11 to the Quarterly Report on Form 10-Q (File No. 001-12933, filing date April 24, 2020). | 4.12 | | Amended and Restated Agency Agreement, dated February 21, 2020, among Autoliv, Inc., Autoliv ASP, Inc. and the dealers named therein. incorporated by reference to Exhibit 4.12 to the Quarterly Report on Form 10-Q (File No. 001-12933, filing date April 24, 2020). | | | | 4.13* | | Description of Registrant´s Securities. | | | | 10.1+ | | Form of Employment Agreement between Autoliv, Inc. and certain of its executive officers, incorporated herein by reference to Exhibit 10.4 to the Annual Report on Form 10-K/A (File No. 001-12933, filing date July 2, 2002). | | | | 10.2+ | | Form of Supplementary Agreement to the Employment Agreement between Autoliv, Inc. and certain of its executive officers, incorporated herein by reference to Exhibit 10.5 to the Annual Report on Form 10-K/A (File No. 001-12933, filing date July 2, 2002). | | | | 10.3+ | | Form of Severance Agreement between Autoliv, Inc. and certain of its executive officers, incorporated herein by reference to Exhibit 10.7 to the Annual Report on Form 10-K/A (File No. 001-12933, filing date July 2, 2002). | | | | 10.4+ | | Form of Amendment to Employment Agreement between Autoliv, Inc. and certain of its executive officers – notice, incorporated herein by reference to Exhibit 10.9 to the Annual Report on Form 10-K (File No. 001-12933, filing date March 14, 2003). | | | | 10.5+ | | Form of Supplementary Agreement to Employment Agreement between Autoliv, Inc. and certain of its executive officers – pension, incorporated herein by reference to Exhibit 10.10 to the Annual Report on Form 10-K (File No. 001-12933, filing date March 14, 2003). | | | | 10.6+ | | Form of Pension Agreement between Autoliv, Inc. and certain of its executive officers – additional pension, incorporated herein by reference to Exhibit 10.11 to the Annual Report on Form 10-K (File No. 001-12933, filing date March 14, 2003). | | | | 10.7+ | | Employment Agreement, dated March 31, 2007, between Autoliv, Inc. and Mr. Jan Carlson, incorporated herein by reference to Exhibit 10.13 to the Quarterly Report on Form 10-Q (File No. 001-12933, filing date October 25, 2007).
| | | | 10.8+
| | Retirement Benefits Agreement, dated August 14, 2007, between Autoliv AB and Mr. Jan Carlson, incorporated herein by reference to Exhibit 10.14 to the Quarterly Report on Form 10-Q (File No. 001-12933, filing date October 25, 2007).
| | | | 10.9+
| | Autoliv, Inc. 1997 Stock Incentive Plan, as amended and restated on May 6, 2009, incorporated herein by reference to Appendix A of the Definitive Proxy Statement of Autoliv, Inc. on Schedule 14A (filing date March 23, 2009). | | | | 10.1010.8
| | Revolving Credit Facility Agreement, dated June 21, 2010, between Autoliv AB, Autoliv, Inc., and Nordea Bank AB (publ), incorporated herein by reference to Exhibit 10.21 to the Quarterly Report on Form 10-Q (File No. 001-12933, filing date July 23, 2010). | | | | 10.1110.9
| | Facility Agreement, dated June 21, 2010, among Autoliv, Inc., Autoliv AB, Swedish Export Credit Corporation, National Export Credits Guarantee Board and Skandinaviska Enskilda Banken AB (publ), incorporated herein by reference to Exhibit 10.22 to the Quarterly Report on Form 10-Q (File No. 001-12933, filing date July 23, 2010). | | | | 10.12+10.10+
| | Amendment No. 1 to the Autoliv, Inc. 1997 Stock Incentive Plan as amended and restated on May 6, 2009, dated December 17, 2010, incorporated herein by reference to Exhibit 10.24 to the Annual Report on Form 10-K (File No. 001-12933, filing date February 23, 2011). | | | | 10.13+10.11+
| | Form of Amendment to Employment Agreement between Autoliv, Inc. and certain of its executive officers – pension, incorporated herein by reference to Exhibit 10.26 to the Annual Report on Form 10-K (File No. 001-12933, filing date February 23, 2012). | | | | 10.14+10.12+
| | Form of Amendment to Employment Agreement between Autoliv, Inc. and certain of its executive officers – non-equity incentive award, incorporated herein by reference to Exhibit 10.27 to the Annual Report on Form 10-K (File No. 001-12933, filing date February 23, 2012). | | | | 10.15+10.13
| | Amendment, dated December 19, 2011, to Employment Agreement, dated March 31, 2007, between Autoliv, Inc. and Mr. Jan Carlson (pension), incorporated herein by reference to Exhibit 10.28 to the Annual Report on Form 10-K (File No. 001-12933, filing date February 23, 2012).
| | | | 10.16
| | Remarketing Agreement, dated as of February 9, 2012, incorporated herein by reference to Exhibit 1.1 to the Current Report on Form 8-K (File No. 001-12933, filing date March 15, 2012). | | | | 10.17+10.14+
| | Amendment No. 2 to the Autoliv, Inc. 1997 Stock Incentive Plan, as amended and restated on May 6, 2009, dated May 8, 2012, incorporated herein by reference to Exhibit 10.29 to the Quarterly Report on Form 10-Q (File No. 001-12933, filing date July 20, 2012). | | | | 10.18+10.15+
| | Amendment, dated January 18, 2013 to Employment Agreement, dated March 31, 2007, between Autoliv, Inc. and Mr. Jan Carlson – additional pension, dated January 18, 2013, incorporated herein by reference to Exhibit 10.33 to the Annual Report on Form 10-K (File No. 001-12933, filing date February 22, 2013).
| | | | 10.19+
| | Form of Employment Agreement between Autoliv, Inc. and certain of its executive officers (with Change-in-Control Severance Agreement), incorporated herein by reference to Exhibit 10.34 to the Annual Report on Form 10-K (File No. 001-12933, filing date February 22, 2013). | | | | 10.20+10.16+
| | Form of Employment Agreement between Autoliv, Inc. and certain of its executive officers (without Change-in-Control Severance Agreement), incorporated herein by reference to Exhibit 10.35 to the Annual Report on Form 10-K (File No. 001-12933, filing date February 22, 2013). | | | | 10.21+10.17+
| | Form of Change-in-Control Severance Agreement between Autoliv, Inc. and certain of its executive officers, incorporated herein by reference to Exhibit 10.36 to the Annual Report on Form 10-K (File No. 001-12933, filing date February 22, 2013). | | | | 10.22
| | Form of Indemnification Agreement between Autoliv, Inc. and its directors and certain of its executive officers, incorporated herein by reference to Exhibit 99.i to the Annual Report on Form 10-K (File No. 001-12933, filing date February 24, 2009).
| | | | 10.23†
| | Finance Contract, dated July 16, 2013, among European Investment Bank, Autoliv AB (publ) and Autoliv, Inc., incorporated herein by reference to Exhibit 10.1 to the Quarterly Report on Form 10-Q (File No. 001-12933, filing date October 24, 2013).
| | | | 10.24
| | Guarantee Agreement, dated July 16, 2013, between European Investment Bank and Autoliv, Inc., incorporated herein by reference to Exhibit 10.12 to the Quarterly Report on Form 10-Q (File No. 001-12933, filing date October 24, 2013).
| | | |
| | | Exhibit No. | | Description | | | | 10.2510.18
| | Form of Indemnification Agreement between Autoliv, Inc. and its directors and certain of its executive officers, incorporated herein by reference to Exhibit 99.i to the Annual Report on Form 10-K (File No. 001-12933, filing date February 24, 2009). | | | | 10.19† | | Finance Contract, dated July 16, 2013, among European Investment Bank, Autoliv AB (publ) and Autoliv, Inc., incorporated herein by reference to Exhibit 10.1 to the Quarterly Report on Form 10-Q (File No. 001-12933, filing date October 24, 2013). | | | | 10.20 | | Guarantee Agreement, dated July 16, 2013, between European Investment Bank and Autoliv, Inc., incorporated herein by reference to Exhibit 10.12 to the Quarterly Report on Form 10-Q (File No. 001-12933, filing date October 24, 2013). | | | | 10.21 | | Form of Note Purchase and Guaranty Agreement, dated April 23, 2014, among Autoliv ASP, Inc., Autoliv, Inc. and the purchasers named therein, incorporated herein by reference to Exhibit 4.6 to the Quarterly Report on Form 10-Q (File No. 001-12933, filing date April 25, 2014). | | | | 10.26+10.22+
| | Form of Supplement to Employment Agreement between Autoliv, Inc. and certain of its executive officers, dated August 13, 2014 and effective as of September 1, 2014, incorporated herein by reference to Exhibit 10.1 to the Quarterly Report on Form 10-Q (File No. 001-12933, filing date October 23, 2014). | | | | 10.2710.23
| | Amendment, dated January 27, 2015, to the Finance Contract, dated July 16, 2013, among European Investment Bank, Autoliv AB (publ) and Autoliv, Inc., incorporated herein by reference to Exhibit 10.36 to the Annual Report on Form 10- K (File No. 001-12933, filing date February 19, 2015). | | | | 10.2810.24
| | Consulting Agreement, dated as of July 16, 2015, by and between Autoliv ASP Inc. and M/A-COM Technology Solutions Inc., incorporated herein by reference to Exhibit 10.1 to the Current Report on Form 8-K (File No. 001-12933, filing date July 17, 2015).
| | | | 10.29+
| | International Assignment Agreement, dated as of August 27, 2015, by and among Autoliv ASP, Inc., Autoliv AB and Steven Fredin, incorporated herein by reference to Exhibit 10.1 to the Current Report on Form 8-K (File No. 001-12933, filing date August 28, 2015).
| | | | 10.30+
| | Employment Agreement, dated August 20, 2015, between Autoliv, Inc. and Lars Sjöbring, incorporated herein by reference to Exhibit 10.38 to the Annual Report on Form 10-K (File No. 001-12933, filing date February 19, 2016).
| | | | 10.31+
| | Separation Agreement, dated November 20, 2015, between Autoliv, Inc. and Mats Wallin, incorporated herein by reference to Exhibit 10.39 to the Annual Report on Form 10-K (File No. 001-12933, filing date February 19, 2016).
| | | | 10.32
| | General Terms and Conditions for Swedish Depository Receipts in Autoliv, Inc. representing common shares in Autoliv, Inc., effective as of May 30, 2018, with Skandinaviska Enskilda Banken AB (publ) serving as custodian, incorporated herein by reference to Exhibit 4.5 to the Quarterly Report on Form 10-Q (File No. 001-12933, filing date July 27, 2018). | | | | 10.33+10.25
| | Form of performance shares award agreement to be used under the Autoliv, Inc. 1997 Stock Incentive Plan, as amended and restated, incorporated herein by reference to Exhibit 10.1 to the Quarterly Report on Form 10-Q (File No. 001-12933, filing date April 29, 2016).
| | | | 10.34+
| | Form of restricted stock units award agreement to be used under the Autoliv, Inc. 1997 Stock Incentive Plan, as amended and restated, incorporated herein by reference to Exhibit 10.2 to the Quarterly Report on Form 10-Q (File No. 001-12933, filing date April 29, 2016).
| | | | 10.35+
| | Employment Agreement, dated November 20, 2015, between Autoliv, Inc. and Mats Backman, incorporated herein by reference to Exhibit 10.1 to the Quarterly Report on Form 10-Q (File No. 001-12933, filing date July 22, 2016).
| | | | 10.36+
| | Employment Agreement, dated December 15, 2015, between Autoliv, Inc. and Mikael Bratt, incorporated herein by reference to Exhibit 10.2 to the Quarterly Report on Form 10-Q (File No. 001-12933, filing date July 22, 2016).
| | | | 10.37
| | Facilities Agreement of $1,100,000,000, dated July 14, 2016, among Autoliv, Inc., Autoliv ASP, Inc., Autoliv AB, HSBC Bank PLC, Mizuho Bank, Ltd. and Investment Banking, Skandinaviska Enskilda Banken AB (publ), and the other parties and lenders named therein, incorporated herein by reference to Exhibit 10.1 to the Quarterly Report on Form 10-Q (File No. 001-12933, filing date October 27, 2016). | | | | 10.38+10.26+
| | Mutual Separation Agreement, dated May 31, 2016 and effective as of May 18, 2016, between Autoliv, Inc. and Jonas Nilsson, incorporated herein by reference to Exhibit 10.2 to the Quarterly Report on Form 10-Q (File No. 001-12933, filing date October 27, 2016).
| | | | 10.39+
| | Mutual Separation Agreement, dated September 30, 2016 and effective as of October 1, 2016, between Autoliv, Inc. and Frank Melzer, incorporated herein by reference to Exhibit 10.3 to the Quarterly Report on Form 10-Q (File No. 001-12933, filing date October 27, 2016).
| | | | 10.40+
| | Supplement to Employment Agreement, dated October 3, 2016, between Autoliv, Inc. and Johan Löfvenholm, incorporated herein by reference to Exhibit 10.47 to the Annual Report on Form 10-K (File No. 001-12933, filing date February 23, 2017).
| | | | 10.41+
| | Supplement to Employment Agreement, dated October 3, 2016, between Autoliv, Inc. and Steve Fredin, incorporated herein by reference to Exhibit 10.48 to the Annual Report on Form 10-K (File No. 001-12933, filing date February 23, 2017).
| | | | 10.42+
| | Autoliv, Inc. Non-employee Director Compensation Policy, effective January 1, 2017, incorporated herein by reference to Exhibit 10.1 to the Quarterly Report on Form 10-Q (File No. 001-12933, filing date April 28, 2017). | | | | 10.43+10.27+
| | Amendment No. 3 to the Autoliv, Inc. 1997 Stock Incentive Plan, as amended and restated, dated April 24, 2017, incorporated herein by reference to Exhibit 10.2 to the Quarterly Report on Form 10-Q (File No. 001-12933, filing date April 28, 2017). | | | | 10.44+10.28+
| | Form of Non-Employee Director restricted stock unit award agreement to be used under the Autoliv, Inc. 1997 Stock Incentive Plan, as amended and restated, incorporated herein by reference to Exhibit 10.3 to the Quarterly Report on Form 10-Q (File No. 001-12933, filing date April 28, 2017). |
| | | Exhibit
No.
| | Description
| | | | | | | 10.45+10.29+
| | Form of Employee restricted stock unit award agreement (2017) to be used under the Autoliv, Inc. 1997 Stock Incentive Plan, as amended and restated, incorporated herein by reference to Exhibit 10.4 to the Quarterly Report on Form 10-Q (File No. 001-12933, filing date April 28, 2017). | | | | 10.46+10.30+
| | Form of performance share award agreement (2017) to be used under the Autoliv, Inc. 1997 Stock Incentive Plan, as amended and restated, incorporated herein by reference to Exhibit 10.5 to the Quarterly Report on Form 10-Q (File No. 001-12933, filing date April 28, 2017). | | | | 10.47+*10.31
| | Mutual Separation Agreement, dated March 23, 2018 and effective as of December 31, 2018, between Autoliv, Inc. and Karin Eliasson.
| | | | 10.48
| | Employee Matters Agreement, dated June 28, 2018, between Veoneer, Inc. and Autoliv, Inc., incorporated herein by reference to Exhibit 10.1 to the Current Report on Form 8-K (File No. 001-12933, filing date July 2, 2018). | | | | 10.4910.32
| | Tax Matters Agreement, dated June 28, 2018, between Veoneer, Inc. and Autoliv, Inc., incorporated herein by reference to Exhibit 10.2 to the Current Report on Form 8-K (File No. 001-12933, filing date July 2, 2018). | | | | 10.5010.33
| | Amended and Restated Transition Services Agreement, dated June 28, 2018, between Veoneer, Inc. and Autoliv, Inc., incorporated herein by reference to Exhibit 10.3 to the Current Report on Form 8-K (File No. 001-12933, filing date July 2, 2018). | | | | 10.5110.34
| | Facilities Agreement, dated May 24, 2018, among Autoliv, Inc., Autoliv ASP, J.P. Morgan Securities PLC and Skandinaviska Enskilda Banken AB (publ), incorporated herein by reference to Exhibit 10.4 to the Quarterly Report on Form 10-Q (File No. 001-12933, filing date July 27, 2018). | | | | 10.5210.35
| | SeparationEmployment Agreement, effective as of September 1, 2018, by anddated November 20, 2015, between Autoliv, Inc. and Steve Fredin,Mats Backman, incorporated herein by reference to Exhibit 10.510.1 to the Quarterly Report on Form 10-Q (File No. 001-12933, filing date July 27, 2018)22, 2016).
| | | | 10.5310.36
| | Interim Employment Agreement, effective as of April 1, 2018, by and between Veoneer, Inc. and Jan Carlson, incorporated herein by reference to Exhibit 10.6 to the Quarterly Report on Form 10-Q (File No. 001-12933, filing date July 27, 2018).
| | | | 10.54
| | Supplement to Employment Agreement, effective as of April 1, 2018, by and between Autoliv, Inc. and Jan Carlson, incorporated herein by reference to Exhibit 10.7 to the Quarterly Report on Form 10-Q (File No. 001-12933, filing date July 27, 2018).
| | | | 10.55
| | Employment Agreement, effective as of June 29, 2018, by and between Autoliv, Inc. and Mikael Bratt, incorporated herein by reference to Exhibit 10.8 to the Quarterly Report on Form 10-Q (File No. 001-12933, filing date July 27, 2018). | | | | 10.5610.37
| | Employment Agreement, effective as of June 29, 2018, by and between Autoliv, Inc. and Jennifer Cheng, incorporated herein by reference to Exhibit 10.9 to the Quarterly Report on Form 10-Q (File No. 001-12933, filing date July 27, 2018). | | | | 10.57
| | Employment Agreement, effective as of June 29, 2018, by and between Autoliv, Inc. and Daniel Garceau, incorporated herein by reference to Exhibit 10.10 to the Quarterly Report on Form 10-Q (File No. 001-12933, filing date July 27, 2018).
| | | | 10.58
| | Employment Agreement, effective as of June 29, 2018, by and between Autoliv, Inc. and Michael A. Hague, incorporated herein by reference to Exhibit 10.11 to the Quarterly Report on Form 10-Q (File No. 001-12933, filing date July 27, 2018).
| | | | 10.59
| | Employment Agreement, effective as of June 29, 2018, by and between Autoliv, Inc. and Jordi Lombarte incorporated herein by reference to Exhibit 10.12 to the Quarterly Report on Form 10-Q (File No. 001-12933, filing date July 27, 2018).
| | | | 10.60
| | Employment Agreement, effective as of June 29, 2018, by and between Autoliv, Inc. and Bradley J. Murray, incorporated herein by reference to Exhibit 10.13 to the Quarterly Report on Form 10-Q (File No. 001-12933, filing date July 27, 2018).
| | | | 10.61
| | Employment Agreement, effective as of June 29, 2018, by and between Autoliv, Inc. and Anthony J. Nellis, incorporated herein by reference to Exhibit 10.14 to the Quarterly Report on Form 10-Q (File No. 001-12933, filing date July 27, 2018).
| | | | 10.62
| | Employment Agreement, effective as of June 29, 2018, by and between Autoliv, Inc. and Sherry Vasa, incorporated herein by reference to Exhibit 10.15 to the Quarterly Report on Form 10-Q (File No. 001-12933, filing date July 27, 2018).
|
| | | 21*
| | Autoliv’s List of Subsidiaries.
| | | | 23*
| | Consent of Independent Registered Public Accounting Firm.
| | | | 31.1*
| | Certification of Chief Executive Officer, pursuant to Rule 13a-14(a) promulgated under the Securities Exchange Act of 1934, as amended.
| | | | 31.2*
| | Certification of Chief Financial Officer, pursuant to Rule 13a-14(a) promulgated under the Securities Exchange Act of 1934, as amended.
| | | |
| | | Exhibit No. | | Description | | | | 10.38 | | Employment Agreement, effective as of June 29, 2018, by and between Autoliv, Inc. and Daniel Garceau, incorporated herein by reference to Exhibit 10.10 to the Quarterly Report on Form 10-Q (File No. 001-12933, filing date July 27, 2018). | | | | 10.39 | | Employment Agreement, effective as of June 29, 2018, by and between Autoliv, Inc. and Michael A. Hague, incorporated herein by reference to Exhibit 10.11 to the Quarterly Report on Form 10-Q (File No. 001-12933, filing date July 27, 2018). | | | | 10.40 | | Employment Agreement, effective as of June 29, 2018, by and between Autoliv, Inc. and Jordi Lombarte incorporated herein by reference to Exhibit 10.12 to the Quarterly Report on Form 10-Q (File No. 001-12933, filing date July 27, 2018). | | | | 10.41 | | Employment Agreement, effective as of June 29, 2018, by and between Autoliv, Inc. and Bradley J. Murray, incorporated herein by reference to Exhibit 10.13 to the Quarterly Report on Form 10-Q (File No. 001-12933, filing date July 27, 2018). | | | | 10.42 | | Employment Agreement, effective as of June 29, 2018, by and between Autoliv, Inc. and Anthony J. Nellis, incorporated herein by reference to Exhibit 10.14 to the Quarterly Report on Form 10-Q (File No. 001-12933, filing date July 27, 2018). | | | | 10.43 | | Employment Agreement, effective as of June 29, 2018, by and between Autoliv, Inc. and Sherry Vasa, incorporated herein by reference to Exhibit 10.15 to the Quarterly Report on Form 10-Q (File No. 001-12933, filing date July 27, 2018). | | | | 10.44 | | Cooperation Agreement, dated March 1, 2019, between Autoliv, Inc. and Cevian Capital II GP Limited, incorporated herein by reference to Exhibit 10.1 to the Current Report on Form 8-K (File No. 001-12933, filing date March 1, 2019). | | | | 10.45+ | | Form of Employee restricted stock unit grant agreement (2019) to be used under the Autoliv, Inc 1997 Stock Incentive Plan, as amended and restated, incorporated herein by reference to Exhibit 10.2 to the Quarterly Report on Form 10-Q (File No. 001-12933, filing date April 26, 2019). | | | | 10.46+ | | Form of Employee performance share grant agreement (2019) to be used under the Autoliv, Inc 1997 Stock Incentive Plan, as amended and restated, incorporated herein by reference to Exhibit 10.3 to the Quarterly Report on Form 10-Q (File No. 001-12933, filing date April 26, 2019). | | | | 10.47+ | | Addendum, dated April 24, 2019, to the International Assignment Agreement, dated March 21, 2018, between Autoliv, Inc. and Brad Murray, incorporated herein by reference to Exhibit 10.1 to the Quarterly Report on Form 10-Q (File No. 001-12933, filing date July 19, 2019). | | | | 10.48 | | SEK Facility Agreement dated June 24, 2019 between Autoliv, Inc., Autoliv ASP, Inc. and AB Svensk Exportkredit (Publ),incorporated herein by reference to Exhibit 10.2 to the Quarterly Report on Form 10-Q (File No. 001-12933, filing date July 19, 2019). | | | | 10.49+ | | Supplement to Employment Agreement, dated June 20, 2019, between Autoliv, Inc. and Daniel Garceau, incorporated herein by reference to Exhibit 10.3 to the Quarterly Report on Form 10-Q (File No. 001-12933, filing date July 19, 2019). | | | | 10.50+ | | Mutual Separation Agreement, dated July 1, 2019, between Autoliv, Inc. and Mike Hague, incorporated herein by reference to Exhibit 10.4 to the Quarterly Report on Form 10-Q (File No. 001-12933, filing date July 19, 2019). | | | | 10.51+ | | Employment Agreement, dated July 14, 2016, between Autoliv, Inc. and Christian Hanke, incorporated herein by reference to Exhibit 10.2 to the Quarterly Report on Form 10-Q (File No. 001-12933, filing date October 25, 2019). | | | | 10.52+ | | Employment Agreement, dated April 23, 2019, between Autoliv, Inc. and Frithjof Oldorff, incorporated herein by reference to Exhibit 10.3 to the Quarterly Report on Form 10-Q (File No. 001-12933, filing date October 25, 2019). | | | | 10.53+ | | Employment Agreement, dated March 18, 2019, between Autoliv, Inc. and Christian Swahn, incorporated herein by reference to Exhibit 10.4 to the Quarterly Report on Form 10-Q (File No. 001-12933, filing date October 25, 2019). | | | | 10.54+ | | Employment Agreement, dated February 15, 2019, between Autoliv, Inc. and Magnus Jarlegren, incorporated herein by reference to Exhibit 10.5 to the Quarterly Report on Form 10-Q (File No. 001-12933, filing date October 25, 2019). | 10.55 | | Form of Indemnification Agreement between Autoliv, Inc. and its directors and certain of its executive officers, incorporated herein by reference to Exhibit 10.6 to the Quarterly Report on Form 10-Q (File No. 001-12933, filing date October 25, 2019). | | | | 10.56+ | | Employment Agreement, dated November 26, 2019 and effective as of March 1, 2020, between Autoliv, Inc. and Fredrik Westin, incorporated herein by reference to Exhibit 10.56 to the Annual Report on Form 10-K (File No. 001-12933, filing date February 21, 2020). | | | | 10.57+ | | Employment Agreement, dated January 23, 2020, between Autoliv, Inc. and Bradley Murray, incorporated herein by reference to Exhibit 10.57 to the Annual Report on Form 10-K (File No. 001-12933, filing date February 21, 2020). | | | | 10.58+ | | Employment Agreement, dated January 23, 2020, between Autoliv, Inc. and Svante Mogefors, incorporated herein by reference to Exhibit 10.58 to the Annual Report on Form 10-K (File No. 001-12933, filing date February 21, 2020). | | | | 10.59+ | | Form of Employee 2020 restricted stock units grant agreement promised under the Autoliv, Inc 1997 Stock Incentive Plan, as amended and restated, incorporated herein by reference to Exhibit 10.4 to the Quarterly Report on Form 10-Q (File No. 001-12933, filing date April 24, 2020). | | | |
| | | Exhibit No. | | Description | | | | 10.60+ | | Form of Employee 2020 performance share units grant agreement promised under the Autoliv, Inc 1997 Stock Incentive Plan, as amended and restated, incorporated herein by reference to Exhibit 10.5 to the Quarterly Report on Form 10-Q (File No. 001-12933, filing date April 24, 2020). | | | | 10.61 | | Facility Agreement, dated May 28, 2020, by and among Autoliv AB, as borrower, Autoliv, Inc. and Autoliv ASP, as guarantors, and AB Svensk Exportkredit, as lender, incorporated herein by reference to Exhibit 10.1 to the Quarterly Report on Form 10-Q (File No. 001-12933, filing date July 17, 2020). | | | | 10.62+ | | Form of Non-Employee Directors 2020 restricted stock units grant agreement under the Autoliv, Inc 1997 Stock Incentive Plan, as amended and restated, incorporated herein by reference to Exhibit 10.2 to the Quarterly Report on Form 10-Q (File No. 001-12933, filing date July 17, 2020). | | | | 10.63+ | | Employment Agreement, dated May 20, 2020 and effective as of July 1, 2020, between Autoliv, Inc. and Per Ericson, incorporated herein by reference to Exhibit 10.3 to the Quarterly Report on Form 10-Q (File No. 001-12933, filing date July 17, 2020). | | | | 10.64+ | | Employment Agreement, dated June 8, 2020 and effective as of June 15, 2020, between Autoliv, Inc. and Kevin Fox, incorporated herein by reference to Exhibit 10.4 to the Quarterly Report on Form 10-Q (File No. 001-12933, filing date July 17, 2020). | | | | 10.65+ | | Amendment, effective November 1, 2020, to Employment Agreement, effective as of June 29, 2018, by and between Autoliv, Inc. and Bradley J. Murray, incorporated herein by reference to Exhibit 10.1 to the Quarterly Report on Form 10-Q (File No. 001-12933, filing date October 23, 2020). | | | | 10.66+ | | Employment Agreement, effective as of August 17, 2020, by and between Autoliv AB and Mikael Hagström incorporated herein by reference to Exhibit 10.2 to the Quarterly Report on Form 10-Q (File No. 001-12933, filing date October 23, 2020). | | | | 21* | | Autoliv’s List of Subsidiaries. | | | | 23* | | Consent of Independent Registered Public Accounting Firm. | | | | 31.1* | | Certification of Chief Executive Officer, pursuant to Rule 13a-14(a) promulgated under the Securities Exchange Act of 1934, as amended. | | | | 31.2* | | Certification of Chief Financial Officer, pursuant to Rule 13a-14(a) promulgated under the Securities Exchange Act of 1934, as amended. | | | | 32.1* | | Certification of Chief Executive Officer, pursuant to 18 U.S.C. Section 1350, as adopted pursuant to section 906 of the Sarbanes-Oxley Act of 2002. | | | | 32.2* | | Certification of Chief Financial Officer, pursuant to 18 U.S.C. Section 1350, as adopted pursuant to section 906 of the Sarbanes-Oxley Act of 2002. | | | | 101*101.INS*
| | Inline XBRL Instance Document – The following financial information frominstance document does not appear in the Annual Report on Form 10-K forInteractive Date File because its XBRL tags are embedded within the fiscal year ended December 31, 2018, formatted ininline XBRL (Extensible Business Reporting Language) and filed electronically herewith: (i)document. | | | | 101.SCH* | | Inline XBRL Taxonomy Extension Schema Document. | | | | 101.CAL* | | Inline XBRL Taxonomy Extension Calculation Linkbase Document. | | | | 101.DEF* | | Inline XBRL Taxonomy Extension Definition Linkbase Document. | | | | 101.LAB* | | Inline XBRL Taxonomy Extension Label Linkbase Document. | | | | 101.PRE* | | Inline XBRL Taxonomy Extension Presentation Linkbase Document. | | | | 104* | | Cover Page Interactive Data File (embedded within the Consolidated Statements of Net Income; (ii) the Consolidated Statements of Comprehensive Income; (iii) the Consolidated Balance Sheets; (iv) the Consolidated Statements of Cash Flows; (v) the Consolidated Statements of Total Equity; and (vi) the Notes to the Consolidated Financial Statements.inline XBRL document). |
+ | Management contract or compensatory plan. |
† | Confidential treatment requested as to portions of the exhibit. Confidential materials omitted and filed separately with the Securities and Exchange Commission. |
SIGNATURES
SIGNATURES PursuanttotherequirementsofSection13or15(d)oftheSecuritiesExchangeActof1934,theregistranthasdulycausedthisreport tobesignedonitsbehalfbytheundersigned,thereuntodulyauthorized,asofFebruary 21, 2019.19,2021. | | AUTOLIV,INC. | (Registrant) | | By | /s/Mats BackmanFredrik Westin | Mats Backman
| Fredrik Westin | | ChiefFinancialOfficer |
PursuanttotherequirementsoftheSecuritiesExchangeActof1934,thisreporthasbeensignedbelowbythefollowingpersonson behalfoftheregistrantandinthecapacitiesindicated,asofFebruary 21, 2019.19,2021. Title | | Name | | | | ChairmanoftheBoardofDirectors | | /s/ Jan Carlson | | | Jan Carlson | | | | | Chief Executive Officer and President (Principal Executive Officer) | | /s/Mikael Bratt | and Director | | Mikael Bratt | | | | | ChiefFinancialOfficer | | /s/ Mats BackmanFredrik Westin | (PrincipalFinancialandPrincipalAccountingOfficer) | Mats Backman
| Fredrik Westin | | | | | | | Director | | /s/ Laurie Brlas | | | Laurie Brlas | | | | | | | Director | | /s/ Hasse Johansson | | | Hasse Johansson | | | | Director | | /s/LeifJohansson | | | LeifJohansson | | | | Director | | /s/DavidE.Kepler | | | DavidE.Kepler | | | | Director | | /s/Franz-JosefKortüm | | | Franz-JosefKortüm | | | | Director | | /s/ Franz-Josef KortümFrédéric Lissalde | | Franz-Josef Kortüm
| Frédéric Lissalde | | | | Director | /s/ Xiaozhi Liu
| | Xiaozhi/s/ Min Liu
| | | Min Liu | | | | Director | | /s/XiaozhiLiu | | | XiaozhiLiu | | | | Director | | /s/JamesM.Ringler | | | JamesM.Ringler | | | | Director | | /s/Thaddeus Senko | | | Thaddeus Senko | | | | | | |
Glossary and Definitions In this report, the following company or industry specific terms and abbreviations are used: BCC Best Cost Country CAPITAL EMPLOYED Total equity and net debt (net cash). CAPITAL EXPENDITURES Investments in property, plant and equipment. CAPITAL TURN-OVER RATE Annual sales in relation to average capital employed. CPV Content Per Vehicle, i.e. value of the safety products in a vehicle. DAYS INVENTORY OUTSTANDING Outstanding inventory relative to average daily sales. DAYS RECEIVABLES OUTSTANDING Outstanding receivables relative to average daily sales. DEVELOPED MARKETS Includes North America, Western Europe, Japan and South Korea EARNINGS PER SHARE Net income attributable to controlling interest relative to weighted average number of shares (net of treasury shares) assuming dilution and basic, respectively. EBIT Earnings before interest and taxes. EBITDA Earnings before interest, taxes, depreciation, and amortization FREE CASH FLOW, NET Cash flows from operating activities less capital expenditures, net. GROSS MARGIN Gross profit relative to sales. GROWTH MARKETS Includes all markets except North America, Western Europe, Japan and South Korea HCC High Cost Country
HEADCOUNT Employees plus temporary hourly personnel.
LEVERAGE RATIO Debt per the Policy in relation to EBITDA per the Policy (Earnings Before Interest, Taxes, Depreciation and Amortization), see Non-U.S. GAAP Performance Measures in Item 7 for calculation of this non-U.S. GAAP measure. LMPU Labor minutes per produced unit. LVP Light vehicle production of light motor vehicles with a gross weight of up to 3.5 metric tons. NET DEBT (CASH) Short and long-term debt including debt-related derivatives less cash and cash equivalents, see Non-U.S. GAAP Performance Measures in Item 7 for reconciliation of this non-U.S. GAAP measure. NET DEBT TO CAPITALIZATION Net debt in relation to total equity (including non-controlling interest) and net debt. NUMBER OF EMPLOYEES Employees with a continuous employment agreement, recalculated to full time equivalent heads. OEM Original Equipment Manufacturer referring to customers assembling new vehicles. OPERATING MARGIN Operating income relative to sales. OPERATING WORKING CAPITAL Current assets excluding cash and cash equivalents less current liabilities excluding short-term debt. Any current derivatives reported in current assets and current liabilities related to net debt are excluded from operating working capital. See Non-U.S. GAAP Performance Measures in Item 7 for reconciliation of this non-U.S. GAAP measure. OUR MARKET Our products include seatbelts, airbags and steering wheels. PRETAX MARGIN Income before taxes relative to sales. RETURN ON CAPITAL EMPLOYED Operating income and equity in earnings of affiliates, relative to average capital employed. RETURN ON TOTAL EQUITY Net income relative to average total equity. ROA Rest of Asia includes all Asian countries except China and Japan. TOTAL EQUITY RATIO Total equity relative to total assets. 10598
|