
UNITED STATES
SECURITIES AND EXCHANGE COMMISSION
Washington, D.C. 20549
FORM 10-K
(Mark One)
|
|
☒ANNUAL REPORT PURSUANT TO SECTION 13 OR 15(d) OF THE SECURITIES EXCHANGE ACT OF 1934
For the fiscal year ended December 31 2018, 2023
OR
|
|
☐TRANSITION REPORT PURSUANT TO SECTION 13 OR 15(d) OF THE SECURITIES EXCHANGE ACT OF 1934 FOR THE TRANSITION PERIOD FROM TO
Commission File Number 001-38467
Ceridian HCM Holding
Dayforce, Inc.
(Exact name of Registrant as specified in its Charter)
Delaware | 46-3231686 |
(State or other jurisdiction of incorporation or organization) | (I.R.S. Employer |
3311 East Old Shakopee Road
Minneapolis, Minnesota55425
(952) (952) 853-8100
(Address, Including Zip Code, and Telephone Number, Including Area Code, of Registrant’s Principal Executive Offices)
Securities registered pursuant to Section 12(b) of the Act:
|
| |||
|
| Trading Symbol(s) | Name of each exchange on which registered | |
Common Stock, $.01 par value | DAY | New York Stock Exchange |
Securities registered pursuant to Section 12(g) of the Act: None
None
(Title of class)
Indicate by check mark if the Registrant is a well-known seasoned issuer, as defined in Rule 405 of the Securities Act. YES Yes☒No☐ NO ☒
Indicate by check mark if the Registrant is not required to file reports pursuant to Section 13 or 15(d) of the Act. YES Yes☐ NO No☒
Indicate by check mark whether the Registrant: (1) has filed all reports required to be filed by Section 13 or 15(d) of the Securities Exchange Act of 1934 during the preceding 12 months (or for such shorter period that the Registrant was required to file such reports), and (2) has been subject to such filing requirements for the past 90 days. YES Yes☒ NO No☐
Indicate by check mark whether the registrant has submitted electronically every Interactive Data File required to be submitted pursuant to Rule 405 of Regulation S-T (§232.405 of this chapter) during the preceding 12 months (or for such shorter period that the registrant was required to submit such files). YES Yes☒ NO No☐
Indicate by check mark if disclosure of delinquent filers pursuant to Item 405 of Regulation S-K (§229.405) is not contained herein, and will not be contained, to the best of Registrant’s knowledge, in definitive proxy or information statements incorporated by reference in Part III of this Form 10-K or any amendment to this Form 10-K. ☒
Indicate by check mark whether the registrant is a large accelerated filer, an accelerated filer, a non-accelerated filer, smaller reporting company, or an emerging growth company. See the definitions of “large accelerated filer,” “accelerated filer,” “smaller reporting company,” and “emerging growth company” in Rule 12b-2 of the Exchange Act.
Large accelerated filer |
| Accelerated filer | ☐ | |||
Non-accelerated filer |
| Small reporting company | ☐ | |||
Emerging growth company |
|
If an emerging growth company, indicate by check mark if the registrant has elected not to use the extended transition period for complying with any new or revised financial accounting standards provided pursuant to Section 13(a) of the Exchange Act. ☐
Indicate by check mark whether the registrant has filed a report on and attestation to its management’s assessment of the effectiveness of its internal control over financial reporting under Section 404(b) of the Sarbanes-Oxley Act (15 U.S.C. 7262(b)) by the registered public accounting firm that prepared or issued its audit report. ☒
If securities are registered pursuant to Section 12(b) of the Act, indicate by check mark whether the financial statements of the registrant included in the filing reflect the correction of an error to previously issued financial statements. ☒
Indicate by check mark whether any of those error corrections are restatements that required a recovery analysis of incentive-based compensation received by any of the registrant’s executive officers during the relevant recovery period pursuant to §240.10D-1(b). ☒
Indicate by check mark whether the Registrant is a shell company (as defined in Rule 12b-2 of the Exchange Act). YES Yes☐ NO No☒
The aggregate market value of the voting and non-voting common equity held by non-affiliates of the Registrant, based on the $33.19$66.97 closing price of the shares of common stock on the New York Stock Exchange on June 30, 2018,2023, was $938.7 million.$10.2 billion.
The number of shares of Registrant’s Common Stock outstanding as of February 25, 201923, 2024 was 140,514,889.156.6 million.
DOCUMENTS INCORPORATED BY REFERENCE
Portions of the Registrant’s Definitive Proxy Statement relating to the 20192024 Annual Meeting of Stockholders scheduled to be held on May 1, 2019, are incorporated by reference into Part III of this Annual Report on Form 10-K. Such Definitive Proxy Statement will be filed with the Securities and Exchange Commission within 120 days of the Registrant’s fiscal year ended December 31, 2023.
1 |  2023 Form 10-K
Table of Contents
Page | ||
PART I | ||
Item 1. |
| |
Item 1A. |
| |
Item 1B. |
| |
Item |
| |
Item |
| |
Item |
| |
Item 4. | 27 | |
| ||
PART II | ||
Item 5. |
| |
Item 6. |
| |
Item 7. | Management’s Discussion and Analysis of Financial Condition and Results of Operations |
|
Item 7A. |
| |
Item 8. |
| |
Item 9. | Changes in and Disagreements With Accountants on Accounting and Financial Disclosure |
|
Item 9A. |
| |
Item 9B. |
| |
Item 9C. | Disclosure Regarding Foreign Jurisdictions that Prevent Inspections | 96 |
| ||
PART III | ||
Item 10. |
| |
Item 11. |
| |
Item 12. | Security Ownership of Certain Beneficial Owners and Management and Related Stockholder Matters |
|
Item 13. | Certain Relationships and Related Transactions, and Director Independence |
|
Item 14. |
| |
PART IV | ||
Item 15. |
|
2 | 2023 Form 10-K
i
Unless the context requires otherwise, references in this Annual Report on Form 10-K for the fiscal year ended December 31, 2018 of Ceridian HCM Holding Inc. and subsidiaries (“Form 10-K”) to “our company,” the “Company,” “we,” “us,” “our,” and “Ceridian”“our” refer to Ceridian HCM HoldingDayforce, Inc. and its direct and indirect subsidiaries on a consolidated basis. References to Dayforce reflect the Dayforce people platform. Effective January 31, 2024, Ceridian HCM Holding Inc. changed its corporate name to Dayforce, Inc. We ceased trading under the ticker symbol "CDAY" and began trading under our new ticker symbol, "DAY," on the New York Stock Exchange ("NYSE"), and Toronto Stock Exchange ("TSX") effective on February 1, 2024.
We and our subsidiaries own or have the rights to various trademarks, trade names and service marks, including the following: CeridianDayforce®, DayforceCeridian®, Makes Work Life Better™, Powerpay® and various logos used in association with these terms. Solely for convenience, the trademarks, trade names and service marks and copyrights referred to herein are listed without the ©, ®, and ™, symbols, but such references are not intended to indicate, in any way, that Ceridian,Dayforce, Inc., or the applicable owner, will not assert, to the fullest extent under applicable law, Ceridian’sour or their, as applicable, rights to these trademarks, trade names, and service marks. Other trademarks, service marks, or trade names appearing in this Form 10-K are the property of their respective owners.
CAUTIONARY NOTE REGARDING FORWARD-LOOKING STATEMENTS
This Form 10-K contains, or incorporates by reference, not only historical information, but also forward-looking statements within the meaning of Section 27A of the Securities Act of 1933, as amended (“Securities Act”), and Section 21E of the Securities Exchange Act of 1934, as amended (“Exchange Act”) and that are subject to the safe harbor created by those sections. All statements other than statements of historical fact or relating to present facts or current conditions included in this Form 10-K are forward-looking statements. Forward-looking statements including, without limitation, statements concerning the conditions of the human capital management solutions industrygive our current expectations and our operations, performance, and financial condition, including, in particular, statementsprojections relating to our business, growth strategies, product development efforts,financial condition, results of operations, plans, objectives, future performance and future expenses. Forward-lookingbusiness. You can identify forward-looking statements can be identified by the fact that they do not relate strictly to historical or current facts. These statements may include words such as “anticipates,“anticipate,” “intends,“estimate,” “plans,“expect,” “seeks,"assume", “project,” “believes,“seek,” “estimates,“plan,” “expects,“intend,” “assumes,“believe,” “projects,“will,” “may,” “could,” “may,“continue,” “will,“likely,” “should,” and other words and terms of similar references tomeaning in connection with any discussion of the timing or nature of future periods,operating or by the inclusion of forecastsfinancial performance or projections.other events but not all forward-looking statements contain these identifying words.
Forward-looking statements are based on our current expectations and assumptions regarding our business, the economy, and other future conditions. Because forward-looking statements relate to the future, by their nature, they are subject to inherent uncertainties, risks, and changes in circumstances that are difficult to predict. As a result, our actual results may differ materially from those contemplated by the forward-looking statements. Important factors that could cause actual results to differ materially from those in the forward-looking statements include regional, national, or global political, economic, business, competitive, market, and regulatory conditions and those risks described in Part I, Item IA, “Risk Factors” of this Form 10-K. Although we have attempted to identify important risk factors, there may be other risk factors not presently known to us or that we presently believe are not material that could cause actual results and developments to differ materially from those made in or suggested by the forward-looking statements contained in this Form 10-K. If any of these risks materialize, or if any of the above assumptions underlying forward-looking statements prove incorrect, actual results and developments may differ materially from those made in or suggested by the forward-looking statements contained in this Form 10-K. For the reasons described above, we caution you against relying on any forward-looking statements. Any forward-looking statement made by us in this Form 10-K speaks only as of the date on which we make it. Factors or events that could cause our actual results to differ may emerge from time to time, and it is not possible for us to predict all of them. We undertake no obligation to publicly update or to revise any forward-looking statement, whether as a result of new information, future developments, or otherwise, except as may be required by law. Comparisons of results for current and any prior periods are not intended to express any future trends or indications of future performance, unless specifically expressed as such, and should be viewed as historical data.
3 | 2023 Form 10-K
Overview
Dayforce, Inc., formerly known as Ceridian HCM Holding Inc. was incorporated in Delaware on July 3, 2013. On April 30, 2018, we completed our initial public offering (“IPO”), in which we issued and sold 24,150,000 shares of common stock at a public offering price of $22.00 per share. Concurrently with our IPO, we issued an additional 4,545,455 shares of our common stock in a private placement at $22.00 per share. Contemporaneously with our IPO, we distributed our controlling financial interest in LifeWorks Corporation Ltd (“LifeWorks”) to our stockholders of record prior to the IPO on a pro rata basis in accordance with their pro rata interests in us.
Following our IPO, we remain a controlled company by our financial sponsors: affiliates and co-investors of Thomas H. Lee Partners, L.P. (“THL”) and Cannae Holdings, Inc. (“Cannae”). Collectively, THL and Cannae are referred to as our “Sponsors.”
Overview
Ceridian is a global human capital management (“HCM”) software company. Dayforce, our flagship cloudCloud HCM platform, provides a full suite of HCM functionality, including global human resources (“HR”), payroll benefits,and tax, workforce management, benefits, and talent managementintelligence functionality. In addition to Dayforce, we sell Powerpay, a cloudCloud HR and payroll solution for the Canadian small business market, through both direct sales and established partner channels. We also continue to support customers using our Bureaulegacy North America solutions which we generally stopped actively selling to newand customers using our acquired solutions in 2012, following the acquisition of Dayforce.Asia Pacific Japan ("APJ") region. We invest in maintenance and necessary updates with the legacy technology to support our Bureau customers and continue to migrate them to Dayforce. Revenue from our recurring solutions includes investment income generated from holding customer funds, also referred to as float revenue or float.
The following five strategic growth levers drive our long-term perspectives, near-term decision making, and stockholder alignment:
Products and ServicesSolutions
Dayforce
Dayforce our principle cloud HCM platform, is a single application that provides continuous real-time calculations across all modules to enable, for example, payroll administrators access to data through the entire pay period, and managers access to real-time data to optimize work schedules. Dayforce offers a comprehensive range of functionality, including global HR, payroll, benefits, workforce management, and talent management on web and native iOS and Android platforms. Our Dayforce mobile app enables employees not only to request and to trade schedules, but also to see the real-time impact of schedule changes on their pay. Our Dayforce platform is used by organizations, regardless of industry or size, to optimize management of the entire employee lifecycle, including attracting, hiring, engaging, paying, deploying, and developing their people. Key functionality ofIn 2023, we received several accolades for our Dayforce platform includessolution, including being named as a Leader in the 2023 Gartner® Magic Quadrant™ for Cloud HCM Suites for 1,000+ Employee Enterprises for the fourth consecutive year; Leader in compliance, payroll administration, and overall product satisfaction in the Gartner Critical Capabilities for Cloud HCM suites for 1000+ Employee Enterprises; Top 5 solution in the 2023 Constellation Shortlist™ for both Global HCM Suites and Workforce Management Suites; Leader in the Sapient Insights Group HR payrollSystems Survey for Time Management Systems and tax, benefits, workforce management,in the Sapient Insights HR Survey - HRMS Voice of the Customer User Experience and talent management.Vendor Satisfaction.
Human Resources
Dayforce Human Resources functionality provides customers withHR professionals, managers, and employees a single, complete record for all employees.of their HR information. Our HR functionality is centered on a comprehensive, flexible workflow engine that streamlines and automates administrative tasks. The component maintains a record of critical forms for the employee, such as signed workplace policy agreements, Occupational Safety and Health Administration regulations, and direct deposit information.
In addition to its primary record-keeping functionality, Dayforce HR comes with an organizational management system that allows managers to view the profiles of their team members, which includes contact and time off details, as well as pay, benefits, and performance data. It is also accessible to employees, who can view the organizational chart, appropriate information about other employees in the organization, and their own pay and time details. There are several self-service options available in the product as well, such as change of address or adding a dependent, making it easy for employees to keep their profiles up to date.
4 | 2023 Form 10-K
Payroll and Tax
Our payroll capabilities provide customers with the tools neededDayforce empowers employers to accurately and compliantly manage their global payroll processes.needs within a single system. Through our Dayforce platform, users in the United States, Canada, and the United Kingdompayroll administrators with localized payroll functionality are able to make updates to time and pay in real-time. InDayforce supports payroll in over 200 countries where we do not currently offer localizedand territories around the world, whilst providing employers with a centralized global view of their payroll Dayforce ConnectedPay providesdata. This global payroll aggregation featuresmodel is powered by a combination of company-owned and partner unified payroll engines with an automated data exchange that allow an organizationaffords employees and administrators to have a centralized viewconsistent, intuitive single user experience. Native payroll is available in certain countries across North America, APJ, and Europe, the Middle East, and Africa ("EMEA"), where Dayforce’s continuous calculation engine offers flexibility, accuracy, and efficiency in the payroll process. In these native markets, we also manage the movement and remittance of their global payroll. ConnectedPay automatestaxes to tax authorities on behalf of our customers. With a flexible rules-based configuration and regional partnerships, Dayforce helps organizations with regulation and compliance concerns regardless of where employees work or live. We are continuing to innovate and expand payroll functionality into new markets to enhance the data exchange with in-country payroll providers and provides a consistent self-servicecustomer experience for employeeslarge enterprises operating globally.
In addition to view earnings statements and associatedcustomers who use our payroll documentation.services, certain customers use our tax filing services on a stand-alone basis. We recently modernized the technology platforms used to provide stand-alone tax services. Beginning in 2023, with the technology migration complete, we classified recurring revenues from stand-alone tax customers as Dayforce calculates, withholds, and files payroll related taxes in the United States and Canada as part of our localized payroll offering.
Dayforce Benefits assists users from benefits enrollment to ongoing benefits administration, including eligibility, open enrollment and Affordable Care Act (“ACA”) management.
Workforce Management
Dayforce Workforce Management provides functionality to helphelps organizations equitably manage their workforces, improve operational efficiency, and enhance compliance by configuring the system to meet complex laboremployment and employmentworking time rules and policies. Through Dayforce usersWorkforce Management, customers are offered absence management, time and attendance, schedule,absence management, scheduling, task management, and labor planning. A variety of options are available for organizations to capture time and attendance data such as physical clocks and the mobile application.
Dayforce Wallet
Dayforce Wallet is a digital payment solution that gives employeesinstant access to their net earnings through on-demand pay requests. With Dayforce Wallet, employees’ funds are loaded onto a paycard, which generates interchange fee revenue when used. As of December 31, 2023, we had more than 1,860 customers signed onto Dayforce Wallet with over 1,150 customers live on the product and the average registration rate was above 60% of all eligible employees.
Benefits
Dayforce Benefits assists benefits administrators from enrollment to ongoing benefits administration, including eligibility, open enrollment and Affordable Care Act ("ACA") management. Our proprietary Benefits Decision Support scoring system guides employees through a self-service experience, giving information about each of the available benefit plans and the impact of plan options, to help them choose the best option for their specific needs.
The system integrates with hundreds of benefits carriers, contains a library of qualifiers to help define eligibility rules, and leverages real-time connections to payroll and HR to inform eligibility and calculate employee deductions. In addition, we offer Benefits Intelligence, which leverages enrollment data to get visibility into elections at the plan and option levels to help administrators analyze their program.
Talent ManagementIntelligence
Dayforce Talent Management enablesIntelligence, a suite of next generation talent acquisition and talent management solutions powered by Artificial Intelligence (“AI”) and driven by data, helps organizations to attract, to engage, torecruit, hire, retain, and develop and to motivate their workforce. UsersDayforce Talent Intelligence transforms talent management and recruitment strategies by using AI in conjunction with talent data from across the employee lifecycle to provide organizations insights that enable them to make more efficient, accurate, and fair talent decisions. Talent Intelligence can also objectively measure workforce demographics while identifying inequity in everything from payroll to promotion opportunities to help employers create actionable policy changes. Customers can leverage Talent Intelligence tools for recruiting, onboarding, engagement, performance management, succession planning, compensation management, and employee learning. career planning and skills development.
Powerpay5 | 2023 Form 10-K
Powerpay
Powerpay is a Cloud platform that provides scalable and straightforward payroll and HR solutions. We offer Powerpay for Canadian organizations with fewer than 100 employees. Powerpay is a cloud platform that provides scalable and straightforward payroll and HR solutions. Specifically designed for small businesses, Powerpay enables clients to pay their employees accurately and on-time. As of December 31, 2018, Powerpay had over 38,000 customer accounts.
BureauOther
Our Bureau solutionsWe also offer payroll and payroll-related services using legacy technology.technology and on-premise technology from our acquired businesses in APJ, which we formerly referred to as Bureau. We invest in maintenance and necessary updates to support our Bureau customers. WeHowever, we generally stopped selling our Bureaulegacy North America payroll solutions to new customers in the United States in 2012("U.S.") and in Canada, in 2015, and we intend to stop actively selling our acquired on-premise payroll solutions to new customers on a stand-alone basis. In addition to customers who use our legacy payroll services, prior to modernizing the technology platforms utilized for stand-alone tax services, certain customers used our legacy tax filing services on a stand-alone basis through 2022.
Services and Support
We offer a broad portfolio of services to enable customer success. We believe it is important to work closely with our customers to understand their needs and deliver technology solutions and support that address them. We continue to convert Bureau customers toincrease our Dayforce platform.
Revenue by Productglobal reach in supporting and Service
For a quantitative discussionserving our customers. As part of our revenueinternational strategy, we work with partners to perform services in certain geographies where we do not currently have international operations or the particular service required by our customers.
Implementation and Professional Services
Our internal implementation team leverages proprietary onboarding technology for new customer activation and professional services work. Our internal team is supplemented by third party services partners and system integration partners (“SI”). Our implementation services include solution please referconfiguration and activation for new customers. Professional services include add-on implementation services for existing customers, ongoing product configuration changes when the customer does not have the resources to Part II, Item do it themselves, product usage consulting and a variety of additional services, such as report writing, usage audits, and process improvement.
Customer Support
Our global customer support organization provides 24/7 “Management’s Discussionapplication support from locations across North America, APJ, and AnalysisEMEA. Our support function is organized into teams of Financial Conditionrepresentatives with deep product and Resultsdomain expertise across our platform. These teams are aligned to groups of Operations”customers based on geography and product type to provide a combination of this Form 10-K. deep product and industry knowledge, consistent relationships, and high availability.
Customers
Dayforce is designed to serve organizations with 100 to over 100,000 employees. The Dayforce customer base has increased from 482 as of December 31, 2012 to 3,718 customers live6,393 customers* on the platform as of December 31, 2018. In addition, we had over 450 net new Dayforce customers contracted, but not yet live on Dayforce as of December 31, 2018. We expect the majority of these Dayforce customers to be taken live in 2019. For 2018, our 3,718 live Dayforce customers represented over 3.12023 representing approximately 6.84 million active users.global employees*. We define a customer as a single organization, such as a company, a non-profit association, an educational institution, or government entity. We also have overapproximately 38,000 Powerpay customer accounts. No single customer accounted for more than 1%2% of our revenues during the year ended December 31, 2018.2023.
SalesSelling and Marketing
We sell our Cloud solutions through a direct sales force and a variety of third partythird-party channels, organized by customer size and geography. We market Dayforce to organizations with more than 100 employees. We market Powerpay to organizations with fewer than 100 employees in Canada. The majority of our revenue growth comes from new customers, but we also have a small, dedicated account management team focused on servingCloud customers.
* Excluding the needs2021 acquisitions of our Bureau customersAscender HCM Pty Limited ("Ascender") and helping them to migrate to ourATI ROW, LLC and Dayforce platform.Mexico S. de R.L. de C.V. (formerly known as ADAM HCM MEXICO, S. de R.L. de C.V.) (collectively, "ADAM HCM")
6 | 2023 Form 10-K
Implementation and Professional Services
Our internal implementation team leverages proprietary onboarding technology for new customer activation and professional services work. Our internal team is supplemented by a small number of third party services partners. Our implementation services include solution configuration and activation for new customers. Professional services include add-on implementation services for existing customer, ongoing product configuration changes when the customer does not have the resources to do it themselves, product usage consulting and a variety of additional services, such as report writing, usage audits, and process improvement.
Customer Support
Our global customer support organization provides 24/7 application support from offices across North America and in the United Kingdom, Mauritius, and Australia. Our support function is organized into specialized pods of approximately 18 representatives with deep domain expertise across our platform. These pods are grouped by customer and product type to provide a combination of deep product knowledge, consistent relationships, and high availability.
Technology, Hosting, and Research and Development (“R&D”)
Technology and innovation are at the core of Ceridian.Dayforce, Inc. Our innovation and development process is customer-driven. We work directly with customers to understand their needs and to deliver solutions that address their challenges, through the lens oftaking into consideration the entire user experience, without being constrained by individual modules or applications. We are committed to protecting the information of our customers, our employees, and our contractors, along with other business data.
Our R&D team is responsible for the design, development, and testing of our applications. We believe that our modern cloudCloud technology stack, agile design and development methodology, and efficient software deployment process enable us to innovate quickly in response to industry trends. We host Dayforce and PowerpayCloud-based applications and serve allthe majority of our customers from data centers operated by third party providers, primarily NaviSite, in Boston, Massachusetts; Redhill, England; Santa Clara, California; Toronto, Canada; Vancouver, Canada; and Woking, England. We also host Dayforce Australia in Microsoft Azure, in Melbourne, AustraliaAWS, VMWare Cloud on AWS, and Sydney, Australia.Navisite. While we control and have access to our servers and all of the components of our network that are located in our external data centers, we do not control the operation of these facilities. Additionally, we host our internal systems through data centers that we operate and lease or own in Atlanta, Georgia; Fountain Valley, California; Louisville, Kentucky; St. Petersburg, Florida; and Winnipeg, Canada.
Competition
The market for HCM technology solutions is rapidly changing, with legacy service bureau and on-premise software providers facing increased competition from emerging cloud players. We currently compete with firms that provide both integrated and point solutions for HCM. Legacy payroll service providers, such as Automatic Data Processing (“ADP”), provide HCM solutions primarily through service bureau models. These vendors often have more in-house resources, greater name recognition, and longer operating histories than Dayforce and may seek to expand their cloud offerings through acquisition or organic product development. We also compete with cloud-enabled client-server HCM providers, such as The Ultimate Software Group, Inc. (“Ultimate Software”). These companies, whose products were developed over 20 years ago as on-premise solutions, have modified and redeployed their platforms as hybrid software as a service (“SaaS”) offerings. This has allowed them to transition their business model to offer hosted and cloud solutions, resulting in significantly larger customer bases. More recently, we face competition from modern HCM providers, such as Workday, Inc. (“Workday”), whose solutions have been specifically built as single application platforms in the cloud. In addition, we also face competition from large, long-established enterprise application software vendors, suchU.S. and APJ.
Dayforce National Trust Bank
The Office of Comptroller of the Currency (the "OCC") authorized the Ceridian National Trust Bank (the "CNTB") to open on January 3, 2023. Effective on this date, the CNTB commenced banking operations, acting as Oracle Corporation (“Oracle”) and SAP SE (“SAP”). These companies are seeking to expand their cloud offerings through both acquisition and internal development efforts. We also compete with point solutions, such as Kronos Incorporated (“Kronos”)trustee for workforce management and Cornerstone OnDemand Inc. (“Cornerstone OnDemand”) for talent management.
We believe the principal competitive factors in our market include the following:
|
|
|
|
|
|
|
|
|
|
|
|
|
|
|
|
|
|
|
|
|
|
|
|
Employees and Culture
As of December 31, 2018, we had 4,444 active employees, including 3,759 in North America, Europe, and Australia, and 685 in Mauritius. We also engage temporary employees and consultants when needed to enhance our workforce. NoneU.S. payroll trust. Historically, certain aspects of our U.S. client money movement activity were subject to regulation at both the federal and individual state levels with resulting inherent complexity across multiple jurisdictions. With the establishment of the CNTB, U.S. regulatory oversight will now be under the OCC, a single federal government agency. Our payroll trust structure will continue to benefit our customers by providing bankruptcy-remoteness protection for client funds pending remittance to employees are represented by a labor union,of our clients, tax authorities, and we have never experienced any work stoppages.other payees. On January 31, 2024, the CNTB became the Dayforce National Trust Bank (the "DNTB").
Ceridian believes in diversity and equality for all people and fosters a culture that engages and celebrates our employees. In 2018, we were recognized with over 20 awards related to our company culture and workplace experiences, including Glassdoor Employees’ Choice Awards for 2018 Best Places to Work (Canada and United States), Best Workplaces certification (Canada and United States), Brandon Hall’s Excellence in Talent Management Award for Best Advance in High Potential Development, and 2018 Working Mother 100 Best Companies.
Intellectual Property
Our success depends, in part, on our ability to protect our proprietary technology and intellectual property. We rely on a combination of patents, copyrights, trade secrets, trade names, and trademarks, as well as confidentiality and nondisclosure agreements and other contractual protections, to establish and to safeguard our intellectual property rights.
BacklogCompetition
The market for HCM technology solutions is highly competitive and Seasonalitysubject to changing technology and shifting client needs. We compete with firms that provide both integrated and point solutions for HCM, as well as with local providers in each jurisdiction that we operate. Globally, we compete with legacy payroll service providers, as well as Cloud-enabled client-server HCM providers. We also face competition from modern HCM providers, whose solutions have been specifically built as single application platforms in the Cloud. In addition, we face competition from large, long-established enterprise application software vendors.
For a discussionCompetition in the global HCM market is primarily based on product and service quality, including ease of backloguse and accessibility of technology, breadth of offerings, reputation, and price. We believe that we are competitive in each of these areas and that our single application always-on technology and product innovations, combined with our commitment to service and our geographic reach, distinguishes us from our competitors.
Seasonality
We have in the past and expect in the future to experience seasonal fluctuations in our revenues and new customer contracts with the fourth quarter historically being our strongest quarter for new customer contracts, renewals, and customer go-lives. Although the growth of our Cloud solutions and the ratable nature of our fees makes this seasonality please referless apparent in our overall results of operations, we expect our revenue to Part II, Item 7. “Management’s Discussionfluctuate quarterly and Analysisto be higher in the fourth and first quarters of Financial Conditioneach year. Fourth quarter revenue is driven by year-end processing fees and ResultsDayforce customer go-lives; and first quarter revenue is driven by revenue earned for printing of Operations” of this Form 10-K. year-end tax packages.
Available InformationEnvironmental, Social, and Governance ("ESG") and Human Capital
We believe that transparency and accountability are essential to any company’s success. Our annual reports onapproach to ESG and Human Capital is guided by five pillars: Governance and Trust; Our People; Tech for Good; Our Communities; and the Environment.
7 | 2023 Form 10-K quarterly reports
Governance and Trust
We safeguard the trust given to us by our partners, our customers, and their employees. This means upholding high standards of corporate governance and ethics, ensuring customer data is protected, and developing products that are reliable and effective.
Our People
As of December 31, 2023, we had 9,084 employees, including 4,563 employees in North America, 2,906 in APJ, and 1,615 in EMEA. We provide a wide range of compensation and benefits to our employees that enhance the workplace experience. In addition to salaries, these benefits (which vary by country and region) include annual bonuses, equity awards, a global employee stock purchase program, retirement savings plans, healthcare and insurance benefits, fertility and family building benefits, health savings and flexible savings spending accounts, unlimited time away from work, parental leave, flexible and remote work options, employee assistance programs, and tuition reimbursement.
Promoting diversity, equity, and inclusion within our workforce is also a priority for us. We have a company-wide employee Global Diversity Advisory Council, and our nine employee resource groups foster inclusion, connection, and career development opportunities for their members. Our Achieving Corporate Equity program helps to empower high-potential diverse talent and improve the internal mobility of employees from underrepresented and underserved communities.
As of December 31, 2023, women represented approximately 50% of our global workforce, including approximately 44% of employees in manager-level roles and above, and approximately 36% in vice president-level roles and above. In the U.S., approximately 12% of our workforce was Asian, 11% was Black or African American, 6% was Hispanic or Latino, 3% was multiracial, less than 1% was Native Hawaiian or Pacific Islander, American Indian or Alaska Native, and approximately 65% was White. In the U.S., people of color represented approximately 24% of employees in manager-level roles and above, and approximately 27% of employees in vice president-level roles and above.
The health, safety, and wellbeing of our employees is of high importance to us. We host an annual global Mental Health Summit, and we offer two paid wellness days to all employees. In addition, our global emergency threat monitoring and mass communications system helps to ensure connectivity and support for our employees both during and after natural disasters and other dangerous events.
We are committed to providing meaningful professional development opportunities to our workforce. We maintain a culture of continuous learning and empowerment through programs that include professional skills training, leadership development, and job shadowing and job rotation opportunities.
Our ability to attract and retain top talent remains critical to our continued success as a business, and our employee Net Promoter Score in 2023 was 50.
Tech for Good
We believe that Tech for Good and responsible innovation can have a positive impact on Form 10-Q, current reports on Form 8-K, proxy and information statements, and amendmentsall stakeholders. Our Dayforce Wallet product provides individuals with on-demand access to reports andtheir earned pay, which enables them to better cover both everyday expenses as well as any registration statements filedurgent or furnished pursuant to Sections 13(a), 14 and 15(d)unplanned costs. Our AI Governance Framework closely evaluates the potential use of AI from idea through all key stages of the Exchange Actproduct development lifecycle. Our Dayforce Engagement product helps our customers build a culture of inclusion and respect within their workforce, and it gives them the ability to measure employee sentiment on equity and belonging. Our Career Explorer product provides our customers’ employees access to data-driven career pathing, gives them information about open internal roles that match their interests and abilities, and provides actionable steps to help them reach their career goals.
Our Communities
We are electronically filedcommitted to giving back to the communities in which we live and work. Through our employee-led charity Dayforce Cares, formerly Ceridian Cares, we provide financial support to individuals and families struggling with basic needs and quality of life across the SecuritiesU.S. and Exchange Commission (“SEC”). The SEC maintainsCanada. Since its inception, the foundation has given over $6.5 million in grants to over 4,500 people in need. In addition, 50% of our employees globally participated in our giving and volunteering program in 2023.
8 | 2023 Form 10-K
Environment
We are committed to doing our part to help address the climate crisis. This includes actively working to decrease our carbon footprint by pursuing two near-term reduction targets that cover Scope 1, 2, and 3 emissions. Our decarbonization strategy includes consolidating our physical footprint globally, expanding our cloud strategy to sustainably deliver our data and technology solutions, and significantly reducing our in-house print operations. Each year, we source 100% renewable electricity across our global operations through the purchase of high-quality Energy Attribute Certificates. In 2023, we launched a website that contains reports, proxynew Responsible Sourcing Initiative to enhance the sustainability of our supply chain. We also developed a company-wide Environmental Sustainability Policy and added new provisions to our Vendor Code of Conduct to further embed sustainable practices into our direct operations and procurement processes.
We encourage you to review our ESG Report for more detailed information statements, and other information regarding issuers that file electronically with the SEC. These materials maywhich can be obtained electronically by accessing the SEC’s website at http://www.sec.gov.
We make available, free of chargefound on our website at http:https://investors.ceridian.com, our annual reports on Form 10-K, quarterly reports on Form 10-Q, current reports on Form 8-K, proxy and information statements, Section 16 reports, amendments to those reports, and other documents filed or furnished pursuant to Section 13(a) or 15(d) of the Exchange Act as soon as reasonably practicable after we electronically file such material with, or furnish it to, the SEC.www.dayforce.com/who-we-are/corporate-responsibility. In addition, the following governance materials are availablepast ESG reports, our Task Force on our website at https://investors.ceridian.com/corporate-governance/governance-documents: (i) our current charterClimate-related Financial Disclosures Index, SASB Index, consolidated EEO-1 report, and bylaws; (ii) charters of our Audit, Corporate GovernanceESG-related policies and Nominating Committees of our Board of Directors (our “Board”); (iii) our Corporate Governance Guidelines; and (iv) our Code of Conduct, as well as any waivers from and amendments to our Code of Conduct. Our corporate website address is http://www.ceridian.com.principles can be found here. Our website and the information contained on, or that can be accessed through, the website is not deemed to be incorporated by reference into, and shouldis not be considered part of, this Form 10-K.
Available Information
Our annual reports on Form 10-K, quarterly reports on Form 10-Q, current reports on Form 8-K, proxy and information statements, Section 16 reports, and amendments to reports and any registration statements filed or furnished pursuant to Sections 13(a), 14 and 15(d) of the Exchange Act are available, free of charge at http://investors.dayforce.com as soon as reasonably practicable after we file such material with, or furnish it to, the Securities and Exchange Commission (“SEC”), and are also available on the SEC’s website at http://www.sec.gov.
Our restated certificate of incorporation, our fourth amended and restated bylaws, charters of our Acquisition and Finance, Audit, Compensation, and Corporate Governance and Nominating Committees of our Board of Directors (the “Board”), our Corporate Governance Guidelines, and our Code of Conduct, as well as any waivers from and amendments to our Code of Conduct are available on our website at https://investors.dayforce.com/corporate-governance/governance-documents. Our website and the information contained on, or that can be accessed through, the website is not deemed to be incorporated by reference into, and is not considered part of, this Form 10-K.
Information about Our Executive Officers
The following table sets forth the names and ages,Our executive officers as of February 15, 2019, and titles of the individuals who serve28, 2024 are as our executive officers. Certain biographical information with respect to those executive officers follows the table.follows:
Name | Age | Position | ||
David D. Ossip |
|
| ||
|
| Executive Vice President and Chief Revenue Officer | ||
|
| Executive Vice President and Chief Operating Officer | ||
|
| President, Customer and Revenue Operations | ||
Jeffrey S. Jacobs | 48 | Head of Accounting and Financial Reporting | ||
Jeremy R. Johnson | 40 | Executive Vice President and Chief Financial Officer | ||
|
| Executive Vice President, Chief Product and | ||
|
| Executive Vice President, General Counsel and | ||
|
|
| ||
|
|
|
David D. Ossip
Mr. Ossip is our ChairmanChair of the Board and Chief Executive Officer, positions heOfficer. Mr. Ossip has held the position of Chair since August 2015 and sole Chief Executive Officer since November 2023. Previously, Mr. Ossip served as our Co-Chief Executive Officer from February 2022 until November 2023, and our Chief Executive Officer from July 2013 respectively.until February 2022. Mr. Ossip joined the Company following the Company’s acquisition of Dayforce Corporation in 2012, where he held the position of chief executive officer.Chief Executive Officer. Mr. Ossip is currentlypreviously served as a director for Ossip Consulting Inc.Dragoneer Growth Opportunities Corp., a NYSE listed company, Dragoneer Growth Opportunities Corp. II, a Nasdaq listed company, and OSDACDragoneer Growth Opportunities Corp. III, a Nasdaq listed company.
Leagh E. Turner9 | 2023 Form 10-K
Ms. Turner
Samer Alkharrat
Mr. Alkharrat is our Executive Vice President and Chief Revenue Officer, positions he has served as our Presidentheld since August 2018.June 2023. Prior to joining the Company, Ms. TurnerMr. Alkharrat served as Chief Partner Officer at Workday, Inc., a provider of enterprise cloud applications, from March 2022 to February 2023. Previously, he held the position of global chief operating officer, strategic customer programPresident and Chief Revenue Officer at C3 AI, an artificial intelligence software provider, from June 2021 to February 2022. Prior to that, he served as the Senior Vice President of SAPWorldwide Sales at VMware LLC, a cloud service provider, from October 2016November 2019 to 2021. From August 2018. In addition, Ms. Turner2010 to November 2019, Mr. Alkharrat held the positionsposition of acting chief operating officer ofChief Operating Officer at SAP Europe, Middle East, and Africa region from March 2017 to August 2017, acting president of SAP Canada Inc. from August 2015 to January 2016, chief operating officer of SAP Canada Inc. from February 2014 to October 2016, and vice president, sales central region of SAP Canada Inc. from July 2010 to February 2014.SE, an enterprise application software provider.
Paul D. ElliottChristopher R. Armstrong
Mr. ElliottArmstrong is our Executive Vice President, Chief Operating Officer, a position he has held since April 2016. Additionally,February 2022. Mr. Elliott served as ourArmstrong joined the Company in 2004, and since then has held several commercial and operational leadership roles, including Executive Vice President, Chief Customer Officer from February 2020 until February 2022, Executive Vice President, Chief Operating Officer from May 2019 until February 2020, Executive Vice President, Operations from March 2018 until May 2019, and Executive Vice President, Customer Support from April 2016 until AugustMarch 2018.
Stephen H. Holdridge
Mr. Holdridge is our President, Customer and Revenue Operations, a position he has held since February 2023. Mr. Holdridge joined the Company in January 2020, serving as Global Head of Services until February 2022 and Executive Vice President, Chief Customer Officer from February 2022 until February 2023. Prior to that,joining the Company, Mr. ElliottHoldridge held the position of chief operatingSenior Executive Vice President, Worldwide Services at MicroStrategy, Inc., an analytics and business intelligence company, from November 2017 until July 2019.
Jeffrey S. Jacobs
Mr. Jacobs is our Head of Accounting and Financial Reporting and serves as the principal accounting officer, at two ofpositions he has held since May 2020. Mr. Jacobs served as our affiliate companies, first at Ceridian Canada whereVice President, Finance from December 2016 until May 2020. Mr. Elliott held the position from August 2009 to February 2013, and then at Ceridian HCM, Inc., where Jacobs is a certified public accountant (inactive).
Jeremy R. Johnson
Mr. Elliott held the position from March 2013 to March 2016.
Arthur Gitajn
Mr. GitajnJohnson is our Executive Vice President, and Chief Financial Officer, positionsa position he has held since October 2016.January 2024. Prior to joining us,the Company, Mr. GitajnJohnson held the position of chief financial officerChief Financial Officer at SmartRecruiters, Inc., a talent acquisition software platform, from September 2021 until December 2023. In addition to his role as Chief Financial Officer, for SAP Canadathe period August 2022 to April 2023, Mr. Johnson also served as interim Chief Executive Officer for SmartRecruiters, Inc. from July 2007Prior to January 2012 and from January 2015 to September 2016, andthat, Mr. Johnson held the position of chief financial officerSenior Vice President, Financial Planning and Analysis and Investor Relations at the Company from December 2020 to August 2021, and a variety of SAP’s Europe, Middle East, and Africa regionother roles within Finance at the Company from FebruaryJanuary 2012 to December 2014.
Ozzie J. Goldschmied2020. Mr. Johnson is a certified public accountant.
Joseph B. Korngiebel
Mr. GoldschmiedKorngiebel is our Executive Vice President, Chief Product and Chief Technology Officer, positions he has held since October 2014. Mr. Goldschmied previously served as our senior vice president of research and development from February 2012July 2020. Prior to September 2014. Mr. Goldschmied joinedjoining the Company, following the Company’s acquisitionMr. Korngiebel held various positions at Workday, Inc., a provider of Dayforce Corporation in 2012, where he held the position of senior vice president of engineering.enterprise cloud applications, since March 2006, including Chief Technology Officer from May 2017 until July 2020.
Scott A. KitchingWilliam E. McDonald
Mr. KitchingMcDonald is our Executive Vice President and General Counsel, positions he has held since July 2021, and Corporate Secretary, a position he has held since February 2016, and2016. Mr. McDonald served as Senior Vice President, Deputy General Counsel and Assistant Secretary, positions he has held since December 2013. Prior to that time, Mr. Kitching heldof the position of executive vice president and general counsel at our affiliate subsidiary Ceridian Canada from May 2003 to December 2013.
Lisa M. Sterling
Ms. Sterling is our Executive Vice President and Chief People and Culture Officer, positions she has held since March 2016. Ms. Sterling previously served as our vice president of product strategy from June 2015 to March 2016. Prior to joining us, Ms. Sterling was a partner and talent technology solutions leader at Mercer LLC from March 2013 to May 2015. Prior to that, Ms. Sterling served as the head of people engagement for Ultimate SoftwareCompany from February 2010 to March 2013.2016 until July 2021.
Erik J. Zimmer10 | 2023 Form 10-K
Mr. Zimmer is our Executive Vice President and Chief Strategy Officer, positions he has held since August 2018. Mr. Zimmer previously served as a managing director of Thomas H. Lee Partners, L.P. from February 2011 to August 2018.
Our business ordinarily encounters and addresses risks, some of which can cause our future results to be different than we currently anticipate. The risk factors described below represent our current view of some of the most important risks facing our business and are important to its understanding. The following information includes a number of forward-looking statements and should be read in conjunction with information contained in this Annual Report on Form 10-K, including the Management’s Discussion and Analysis of Financial Condition and Results of Operations, the Quantitative and Qualitative Disclosures About Market Risk and the consolidated financial statements and related notes.
Risks Related to Our Business and Industry
We have a history of losses and negative cash flows from operating activities, and we may not be able to attain or to maintain profitability or positive cash flows from operating activities in the future.
We have incurred net losses and negative cash flows from operating activities over the last few years as we made substantial investments in developing, launching, and selling our Cloud solutions. In addition, our highly leveraged capital structure has had a negative effect on our profitability. As a result, we have incurred net losses of $92.9 million in the year ended December 31, 2016, $9.2 million in the year ended December 31, 2017, and $63.4 million in the year ended December 31, 2018. As of December 31, 2018, we had an accumulated deficit of $419.3 million. We incurred negative cash flows from operating activities of $75.5 million in the year ended December 31, 2016, $39.8 million in the year ended December 31, 2017 and positive cash flows from operating activities of $9.5 million in the year ended December 31, 2018. To the extent we are successful in increasing our Cloud customer base, we may also incur increased net losses and negative cash flows from operating activities because costs associated with acquiring and implementing new Cloud customers are generally incurred up front, while subscription revenues are generally recognized ratably over the terms of the agreements. Our recent growth in revenues may not be indicative of our future performance.
We also expect our expenses to increase in the future due to anticipated increases in sales, general, and administrative expenses, including expenses associated with being a public company, and product development and management expenses, which could impact our ability to achieve or to sustain profitability or positive cash flows from operating activities in the future. Additionally, while the majority of our revenue comes from fees charged for use of the software, we are developing new products and services, which may initially have a lower profit margin than our existing Cloud solutions, which could have a material adverse effect on our business, financial condition, and results of operations. Although we believe we will be able to reach profitability and attain positive cash flows from operating activities in the next few years, we cannot provide any assurance that we will able to do so in the future.
The markets in which we participate are highly competitive, and if we do not compete effectively, it could have a material adverse effect on our business, financial condition, and results of operations.
The markets in which we participate are highly competitive, and competition could intensify in the future. We believe the principal competitive factors in our market include breadth and depth of product functionality, scalability and reliability of applications, robust workforce management, comprehensive tax services, modern and innovative cloud technology platforms combined with an intuitive user experience, multi-country and jurisdiction domain expertise in payroll and HCM, quality of implementation and customer service, integration with a wide variety of third party applications and systems, total cost of ownership and ROI, brand awareness, and reputation, pricing and distribution. We face a variety of competitors, some of which are long-established providers of HCM solutions. Many of our current and potential competitors are larger, have greater name recognition, longer operating histories, larger marketing budgets, and significantly greater resources than we do, and are able to devote greater resources to the development, promotion, and sale of their products and services. Some of our competitors could offer HCM solutions bundled as part of a larger product offering. Furthermore, our current or potential competitors may be acquired by third parties with greater available resources and the ability to initiate or to withstand substantial price competition. In addition, many of our competitors have established marketing relationships, access to larger customer bases, and major distribution agreements with consultants, system integrators, and resellers. Our competitors may also establish cooperative relationships among themselves or with third parties that may further enhance their product offerings or resources.
In order to capitalize on customer demand for cloud applications, legacy vendors are modernizing and expanding their applications through cloud acquisitions and organic development. Legacy vendors may also seek to partner with other leading cloud HCM providers. We also face competition from vendors selling custom software and point solutions, some of which offer cloud solutions. Our competitors include, without limitation: ADP, Ultimate Software, and Workday for HCM; Kronos for workforce management; and Cornerstone OnDemand for talent management. In addition, other companies, such as NetSuite and Microsoft, that provide cloud applications in different target markets, may develop applications or acquire companies that operate in our target markets, and some potential customers may elect to develop their own internal applications. Some large businesses may be hesitant to adopt cloud applications such as ours and prefer to upgrade the more familiar applications offered by these vendors that are deployed on-premise, such as Oracle and SAP. Our competitors could offer HCM solutions on a standalone basis at a low price or bundled as part of a larger product sale. With the introduction of new technologies and market entrants, competition could intensify in the future.
If our competitors’ products, services, or technologies become more accepted than our applications, if they are successful in bringing their products or services to market earlier than ours, or if their products or services are more technologically capable than ours, it could have a material adverse effect on our business, financial condition, and results of operations. In addition, some of our competitors may offer their products and services at a lower price. If we are unable to achieve our target pricing levels or if we experience significant pricing pressures, it could have a material adverse effect on our business, financial condition, and results of operations.
Our growth strategy has focused on developing our Cloud solutions, which have experienced rapid revenue growth in recent periods that has been offset by revenue declines in our Bureau solutions. If we fail to manage our growth effectively or if our strategy is not successful, we may be unable to execute our business plan, to maintain high levels of service, or to adequately address competitive challenges.
We have recently experienced a period of rapid growth in our operations related to our Cloud solutions. In particular, our recurring services revenue for our Cloud solutions has continued to increase while our recurring services revenue for our Bureau solutions has continued to decline. As we implement our growth strategy for our Cloud solutions, we will continue to migrate employees and resources from our Bureau solutions to our Cloud solutions. Additionally, we are continuing to invest in the infrastructure shared by our Bureau and Cloud solutions, although we are no longer marketing our Bureau solutions to new customers. The growth of our Cloud solutions has placed, and future growth will place, a significant strain on our management, administrative, operational, and financial infrastructure. In order to manage this growth effectively, we will need to continue to improve our operational, financial, and management controls, and our reporting systems and procedures. Failure to effectively manage growth and failure to achieve our growth strategy could result in difficulty or delays in implementing customers, declines in quality or customer satisfaction, increases in costs, difficulties in introducing new features, or other operational difficulties; and any of these difficulties could have a material adverse effect on our business, financial condition, and results of operations.
Our Bureau solutions, which comprise a significant portion of our revenue, may decline at a rate faster than we anticipate, and we may not be able to successfully migrate our Bureau customers to our Cloud solutions or to offset the decline in Bureau revenue with Cloud revenue.
Our growth strategy is focused on the growth and expansion of our Cloud solutions; however, a portion of our revenue continues to be derived from our Bureau customers. We generally ceased marketing our Bureau solutions to new customers in the United States in 2012, and since that time have maintained the Bureau applications for existing customers while migrating customers to our Cloud solutions. Maintenance of our Bureau business requires investment, specifically with respect to compliance updates and security controls. If our investments are not sufficient to adequately update our Bureau solutions, such solutions may lose market acceptance and we may face security vulnerabilities.
In addition, we have marketed our Cloud solutions to our Bureau customers, and some of our Bureau customers have migrated to our Cloud solutions, but there is no guarantee that our remaining Bureau customers will migrate to our Cloud solutions. If such Bureau customers do not migrate, we may lose them in the future or we may be required to make ongoing investments to serve a smaller pool of customers. If our revenue from our Bureau solutions declines at a rate faster than anticipated, we are required to make significant investments in infrastructure shared by our Bureau and Cloud solutions that are not offset by increased revenue, we are not able to successfully convert the remaining Bureau customers to our Cloud solutions, or our Cloud solutions revenue does not grow fast enough to offset the decline in our Bureau solutions revenue, it could have a material adverse effect on our business, financial condition, and results of operations.
If the market for enterprise cloud computing develops slower than we expect or declines, it could have a material adverse effect on our business, financial condition, and results of operations.
The enterprise cloud computing market is not as mature as the market for on-premise enterprise software, and it is uncertain whether cloud computing will achieve and sustain high levels of customer demand and market acceptance. Our success will depend to a substantial extent on the widespread adoption of cloud computing in general, and of HCM solutions in particular. Many enterprises have invested substantial personnel and financial resources to integrate traditional enterprise software into their businesses and therefore may be reluctant or unwilling to migrate to cloud computing. It is difficult to predict customer adoption rates and demand for our applications, the future growth rate and size of the cloud computing market, or the entry of competitive applications. The expansion of the cloud computing market depends on a number of factors, including the cost, performance, and perceived value associated with cloud computing, as well as the ability of cloud computing companies to address security and privacy concerns. If we or other cloud computing providers experience security incidents, loss of customer data, disruptions in delivery, or other problems, the market for cloud computing applications as a whole, including our applications, may be negatively affected. If cloud computing does not achieve widespread adoption or there is a reduction in demand for cloud computing caused by a lack of customer acceptance, technological challenges, weakening economic conditions, security or privacy concerns, competing technologies and products, reductions in corporate spending, or otherwise, it could have a material adverse effect on our business, financial condition, and results of operations.
Our revenuesRevenues from our Cloud solutions have grown substantially over the last few years.years, and we believe a significant portion of our market capitalization is based upon maintaining our high Cloud solutions growth rate. Our efforts to increasecontinue increasing use of our Cloud solutions and our other applications may not succeed and may reduce our revenue growth rate.
Our ability to continue to grow the revenues from our Cloud solutions have grown substantially overthrough execution against our growth levers depends on the last few years. Our total Cloud revenues grew from $297.8 million in 2016quality of our platform and solutions, and our ability to $404.3 million in 2017 and $534.3 million in 2018, a growth rate of 35.8% and 32.2%, respectively. Any factor adversely affecting sales ofdesign our Cloud solutions including application release cycles, delays, or failures in new product functionality, market acceptance, product competition, performanceto meet consumer demand; and reliability, reputation, price competition, and economic and market conditions, could have a material adverse effectour ability to increase sales from existing customers depends on our business, financial condition,customers’ satisfaction with our product and results of operations.need for additional solutions. Our participation in new markets for native payroll, sales to our existing base of customers, and application expansion in succession management, learning management,various modules and compensation management,features, including the Dayforce Wallet, is relatively new, and it is uncertain whether these areas will ever result in significant revenues for us. Further, the entry into new markets, sales to our existing base of customers, or the introduction of new features, functionality, or applications beyond our current markets and functionality may not be successful.
Our quarterly results of operations may fluctuate significantly and may not fully reflect the underlying performanceThe success of our business.
Our quarterly results of operations, including the levels of our revenues, gross margin, profitability, cash flow, and deferred revenue, may vary significantly in the future, and period-to-period comparisons of our results of operations may not be meaningful. Accordingly, the results of any one quarter should not be relied upon as an indication of future performance. Our quarterly financial results may fluctuate as a result of a variety of factors, many of which are outside of our control, and as a result, may not fully reflect the underlying performance of our business. Fluctuation in quarterly results may negatively impact the value of our common stock. Factors that may cause fluctuations in our quarterly financial results include, without limitation:
our ability to attract new Cloud customers;
our ability to replace declining Bureau revenue with Cloud revenue;
the addition or loss of large Cloud customers, including through acquisitions or consolidations;
the addition or loss of employees by our Cloud customers;
the timing and number of paydays in a period;
the timing of recognition of revenues;
the tenure of our Cloud customers during that period;
the amount and timing of operating expenses related to the maintenance and expansion of our business, operations, and infrastructure;
network outages or security breaches;
general economic, industry, and market conditions;
customer renewal rates;
increases or decreases in the number of elements of our services or pricing changes upon any renewals of customer agreements;
changes in our pricing policies or those of our competitors;
seasonal variations in sales of our applications, which has historically been highest in the fourth quarter of a calendar year;
fluctuation in market interest rates, which impacts debt interest expense as well as float revenue;
the timing and success of new application and service introductions by us or our competitors or any other change in the competitive dynamics of our industry, including consolidation among competitors, customers, or strategic partners; and
the impact of new accounting rules.
If we are not able to provide new or enhanced functionality and features or keep pace with rapid technological changes and evolving industry standards, we will not be able to remain competitive and the demand for our services will likely decline, which could have a material adverse effect on our business, financial condition, and results of operations.
The markets in which we operate are characterized by changes due to rapid technological advances, additional qualification requirements related to technological challenges, and evolving industry standards and changes in the regulatory and legislative environment. Our future successgrowth strategies will depend upon our ability to anticipate and to adapt to changes in technology and industry standards, and to effectively develop, to introduce, to market, and to gain broad acceptance of new product and service offerings and enhancements incorporating the latest technological advancements. Our success is also subject to the risk of future disruptive technologies, such as large language models, AI, and machine learning. The failure to develop enhancements to our applications for, or that incorporate, technologies such as AI, machine learning, and large language models may impact our ability to increase the efficiency of and reduce costs associated with our customers’ operations. We may not be able to successfully provide new or enhanced functionality and features for our existing solutions, including those that may involve AI or machine learning or be created using AI or machine learning, that achieve market acceptance or that keep pace with rapid technological developments. For example,
We believe a significant portion of our market capitalization is based upon our high Cloud revenue growth rate, and if we are focusedunable to sell our Cloud solutions, including the Dayforce Wallet, into new markets or to further penetrate existing markets, or to increase sales from existing customers, or we have failures in new product functionalities, our revenue may not grow as expected, which could have a material adverse effect on enhancingour market capitalization, and our business, financial condition, and results of operations.
If the features and functionalitymovement of funds to initiate payroll-related transactions on behalf of our HCM solutions to enhance their utility for larger customers with complex, dynamic, and global operations. The success of new or enhanced functionality and features depends on several factors, including their overall effectiveness and the timely completion, introduction, and market acceptance of the enhancements, new features, or applications. Failure in this regardis disrupted, we may significantly impair our revenue growth. In addition, because our solutions are designed to operate on a variety of systems, we will need to continuously modify and enhance our solutions to keep pace with changes in internet-related hardware, iOS, and other software, and communication, browser, and database technologies. We may not be successful in developing these new or enhanced functionality and features, or in bringing them to market in a timely fashion. If we do not continue to innovate and to deliver high-quality, technologically advanced products and services, we will not remain competitive,suffer significant losses which could have a material adverse effect on our business, financial condition, and results of operations. Furthermore, uncertainties about
Our payroll and tax processing services involve the timingmovement of significant funds from the account of a customer to its employees and nature of new functionality, or new functionality to existing platforms or technologies, could increase our research and development expenses. Any failurerelevant taxing authorities. Typically, we rely upon third party vendors to initiate payments on behalf of our applicationscustomers. These payments are made in a large number of jurisdictions, in great volume and in short time windows, all of which raise the possibility of an error that disrupts the movement of funds. Further, these types of transactions are subject to operate effectivelyan increasingly complex series of regulations and laws that we, and/or our third-party vendors must comply with. Failure to comply with future network platformsthese regulations and technologieslaws could reduce the demand for our applications, result in consequences up to and including a regulator enjoining us and/or our third-party vendors from engaging in the movement of funds. In addition, as described elsewhere, the systems on which these payroll-related transactions are based are in some cases antiquated or manual or may be subject to processing and/or technological errors in communicating with third-party technology systems. Any disruption or delay to data flow in these critical time periods could lead to the disruption of fund movement. Any disruption of fund movement could have significant consequences, including defaults under our customer dissatisfaction,agreements and exposure to monetary damages, in addition to reputational harm, that could have a material adverse effect on our business, financial condition and results of operations.
Our aging software infrastructure, technology, and sophistication of these systems, and our migration to new platforms, has and will continue to lead to increased costs, vulnerability to cyber-attack, or disruptions in operations that could have a material adverse effect on our business, market brand, financial condition, and results of operations.
11 | 2023 Form 10-K
Our business continues to demand the use of sophisticated systems and technology, including technology infrastructure assets. These systems and technologies must be refined, updated and/or replaced with more advanced systems on a regular basis in order for us to meet both our customers’ and employees’ demands and expectations. Some of the crucial platforms on which we host our back office and legacy systems are aged and need to be replaced or are in the process of being replaced. Some of our customer instances have, and in the future will be, migrated to public Cloud environments. These technological changes are expensive and have and will continue to impact our profitability and demand attention from our senior leadership. If we are unable to replace our aged, crucial platforms, if some or all these platforms fail to operate due to a software error or infrastructure failure, if we fail to continue to refine and update our systems and technologies on a timely basis or within reasonable cost parameters, if we do not appropriately and timely train our employees to operate any of these new systems, if we fail to migrate to new systems in a manner free from disruption, if the new systems fail to perform as desired, or if we are unable to appropriately protect any of these systems, we could suffer the loss of data, vulnerabilities to cyber-attack, system outages or other performance problems, which could have a material adverse effect on our business, financial condition, and results of operations.
An information security breach of our systems or the loss of, or unauthorized access to, customer information or sensitive company information; the failure to comply with the U.S. Federal Trade Commission’s (“FTC”) ongoing consent order regarding data protection,protection; or a system disruption could have a material adverse effect on our business, market brand, financial condition, and results of operations.
Our business is dependent on our payroll, transaction, financial, accounting, and other data processing systems. We rely on these systems, which are maintained both internally and externally at third parties, to process, on a daily and time sensitive basis, a large number of complicated transactions. We, both through our internal systems and systems maintained by third parties, electronically receive, process, store, and transmit data and personally identifiablepersonal information (“PII”) about our customers and their employees, as well as our vendors and other business partners, including names, social security numbers, and checking account numbers.partners. We keep this information confidential. However, both our internal and third-party partners’ websites, networks, applications and technologies, and other information systems have been, and may in the future be targeted by malevolent parties for sabotage, disruption, ransom, or data misappropriation. Further, as we grow by acquisition, these risks become acute in the period following the acquisition, as we set about integrating the acquisition target’s systems into ours. Additionally, as we retire our legacy products like our bureau payroll services or sunset certain acquired products, we are decreasing investments in maintaining those systems which creates the potential for a security breach of one of those systems. The uninterrupted operation of our information systems and our ability to maintain the confidentiality and integrity of PIIpersonal information and other customer and individual and company information that resides on our systems are critical to the successful operation of our business. While we have information securityWe, and our third party providers, maintain systems and processes designed to protect this data and maintain business continuity, programs, these plans may not be sufficient to ensurebut notwithstanding such protective measures, there is a risk of intrusion, cyber-attacks or tampering that could compromise the uninterrupted operationintegrity and privacy of our systems or to prevent unauthorized access to the systems by unauthorized third parties. Because techniques used to obtain unauthorized access or to sabotage systems change frequently and may not be recognized until launched against a target, we may be unable to anticipate these techniques or to implement adequate preventative measures. These concerns about information security are increased with the mounting sophistication of social engineering. Our network security hardening may be bypassed by phishing and other social engineering techniques that seek to use end user behaviors to distribute computer viruses and malware into our systems, which might disrupt our delivery of services and make them unavailable, and might also result in the disclosure or misappropriation of PII or other confidential or sensitive information. In addition, a significant cyber security breach could prevent or delay our ability to process payment transactions.
this data. Any information security breach in our business processes or of our processing systems (whether they are maintained internally or externally at third parties) has the potential to impact our customer information and sensitive company information, including our financial reporting capabilities, which could result in the potential loss of business and our ability to accurately report financial results. If any of these systems fail to operate properly or become disabled even for a brief period of time, we could potentially miss a critical filing period, resulting in potential fees and penalties, or lose control of customer data, all of which could result in financial loss, a disruption of our businesses,business, liability to customers, regulatory intervention, or damage to our reputation. The continued occurrenceFurther, our employees, service providers, and third parties frequently work on a remote or hybrid model, which may involve relying on less secure systems and may increase the risk of high-profile data breaches provides evidence of an externalcybersecurity-related incidents. We cannot guarantee these private work environments and electronic connections to our work environment increasingly hostile to information security. If ourhave the same security measures are breached as adeployed in our physical offices.
Additionally, security breaches of customer and user information which occur outside of our systems may nevertheless result of third party action, employee or subcontractor error, malfeasance or otherwise,in increased business costs, lost revenues, damage to reputation, and as a result, someone obtains unauthorizedexposure to litigation. In most instances, our customers administer access to customerthe data our reputationof their employees and service providers. While we encourage customers to implement certain security controls, they may be damaged, our business may suffer, and we could incur significant liability. We may also experience security breaches that may remain undetected for an extended period of time. Techniquesnot implement appropriate controls to protect the identities used to obtain unauthorized access or to sabotage systems change frequently and are growing increasingly sophisticated.our products. As a result, wecustomers may be unablesuffer a cybersecurity attack on their own systems, unrelated to anticipate these techniquesour own, and allow a malicious actor access to the customer’s information held on our platform. Even if such a breach is unrelated to our security programs or practices, such breach could cause us reputational harm and require us to incur significant economic and operational consequences in order to adequately assess and respond to the breach, including further protecting our customers from their own vulnerabilities, and to implement adequate preventative measures.appropriate safeguards to protect against future breaches.
This environment demandsWe are subject to a twenty-year consent order with the FTC that we continuously improve our design and coordination of security controls throughout the company. Despite these efforts, it is possible that our security controls over data, training, and other practices we follow may not prevent the improper disclosure of PII or other confidential information. Any issue of data privacy as it relates to unauthorized access to or loss of customer and/or employee information could resultbecame final in the potential loss of business, damage to our market reputation, litigation, and regulatory investigation and penalties. For example, inJune 2011 stemming from a December 2009 a criminal hackedhack into our discontinued U.S. payroll application. Following receipt of an “access letter” in May 2010 from the FTC for a non-public review of the matter, we worked with the FTC and entered into a twenty-year consent order which became final in June 2011. We conceded no wrongdoing in the order and we were not subject to any monetary fines or penalties. However, in connection with the order, we are required to, among other things, maintain a comprehensive information security program that is reasonable and appropriate for our size and complexity, and for the type of PIIpersonal information we collect. We are also required to have portions of our security
12 | 2023 Form 10-K
program, which apply to certain segments of our U.S. business, reviewed by an independent third party on a biennial basis. Maintaining, updating, monitoring, and revising an information security program in an effort to ensure that it remains reasonable and appropriate in light of changes in security threats, changes in technology, and security vulnerabilities that arise from legacy systems is time-consuming and complex, and is an ongoing effort.
There may be other such security vulnerabilities that come to our attention. The independent third party that reviews our security program pursuant to the FTC consent order may determine that the existence of vulnerabilities in our security controls or the failure to remedy them in a timeframe they deem appropriate means that our security program does not provide a reasonable level of assurance that the security, confidentiality, and integrity of PII is protected by Ceridian (or that there was a failure to protect at some point in the reporting period). While we have taken and continue to take steps to ensure compliance with the consent order, if we are determined not to be in compliance with the consent order, or if any new breaches of security occur, the FTC may take enforcement actions or other parties may initiate a lawsuit. Any such resulting fines and penalties could have a material adverse effect on our liquidity and financial results, and any reputational damage therefrom could adversely affect our relationships with our existing customers and our ability to attain new customers. Our continued investment in the security of our technology systems, continued efforts to improve the controls within our technology systems, business processes improvements and the enhancements to our culture of information security may not successfully prevent attempts to breach our security or unauthorized access to PII or other confidential, sensitive or proprietary information. In addition, in the event of a catastrophic occurrence, either natural or man-made, our ability to protect our infrastructure, including PII and other customer data, and to maintain ongoing operations could be significantly impaired. Our business continuity and disaster recovery plans and strategies may not be successful in mitigating the effects of a catastrophic occurrence. Insurance may be inadequate or may not be available in the future on acceptable terms, or at all. In addition, our insurance policies may not cover all claims made against us, and defending a suit,lawsuit, regardless of its merit, could be costly, and divert management’s attention. Ifattention, or damage our security is breached, if PII or other confidential information is accessed, if we fail to comply with the consent order or if we experience a catastrophic occurrence, it could have a material adverse effect on our business, financial condition, and results of operations.reputation.
Our services present the potential for identity theft, embezzlement, or other similar illegal behavior by our employees with respect to third parties.
The services offered by us generally require or involve collecting PII of our customers and / or their employees, such as their full names, birth dates, addresses, employer records, tax information, social security numbers, and bank account information. This information can be used by criminals to commit identity theft, to impersonate third parties, or to otherwise gain access to the data or funds of an individual. If any of our employees take, convert, or misuse such PII, funds or other documents or data, we could be liable for damages, and our business reputation could be damaged or destroyed. Moreover, if we fail to adequately prevent third parties from accessing PII and/or business information and using that information to commit identity theft, we might face legal liabilities and other losses that could have a material adverse effect on our business, financial condition, and results of operations.
Our solutions and our business are subject to a variety of U.S. and international laws and regulations, including those regarding privacy, data protection, and information security. Any failure by us or our third party service providers, as well as the failure of our platform or services, to comply with applicablethese laws and regulations could have a material adverse effect on our business, financial condition, and results of operations.
We are subjectFailure to a variety of U.S.comply with privacy, data protection, and internationalinformation security laws and regulations including regulation by various federal government agencies, including the FTC, and state and local agencies. The United States and various state and foreign governments have adopted or proposed limitations on, or requirements regarding, the collection, distribution, use, security, and storage of PII of individuals; and the FTC and many state attorneys general are applying federal and state consumer protection laws to impose standards on the online collection, use and dissemination of data. Self-regulatory obligations, other industry standards, policies, and other legal obligations may apply to our collection, distribution, use, security, or storage of PII or other data relating to individuals. In addition, most states and some foreign governments have enacted laws requiring companies to notify individuals of data security breaches involving certain types of PII. These obligations may be interpreted and applied in an inconsistent manner from one jurisdiction to another and may conflict with one another, other regulatory requirements, or our internal practices. Any failure or perceived failure by us to comply with U.S., E.U., or other foreign privacy or security laws, regulations, policies, industry standards, or legal obligations, or any security incident that results in the unauthorized access to, or acquisition, release, or transfer of, PII may result in governmental enforcement actions, litigation, fines and penalties, or adverse publicity and could cause our customers to lose trust in us, which could harm our reputation and have a material adverse effect on our business, results of operations or financial condition, or have other adverse consequences. These laws, which are not uniform, govern the collection, storage, hosting, transfer (including in some cases, the transfer outside the country of collection), use, disclosure, security, retention, and resultsdestruction of operations.personal information; they require us to give notice to individuals of privacy practices; give individuals certain access and correction rights with respect to their personal information; and regulate the use or disclosure of personal information for secondary purposes such as marketing. Under certain circumstances, some of these laws require us to provide notification to affected individuals, clients, data protection authorities and/or other regulators in the event of a data breach. In many cases, these laws apply not only to third-party transactions, but also to transfers of information among the Company and its subsidiaries. The European Union (the “EU”) General Data Protection Regulation (the “GDPR”), the California Consumer Protection Act (the “CCPA”) and its successor, the California Privacy Rights Act (“CPRA”), are among the most comprehensive of these laws. The number of related laws and regulations we are subject to continue to increase as we enter new markets in Europe, Asia Pacific, and Latin America, and as we continue our entry into the consumer space through our Dayforce Wallet product. Restrictions on transfers of personal information from one geography to another continue to evolve. Complying with these laws and requirements, has resulted in significant costs to our business and may continue to require us to amend certain of our business practices. Further, enforcement actions and investigations by regulatory authorities related to data security incidents and privacy violations continue to increase. The future enactment of more restrictive laws, rules, or regulations and/or future enforcement actions or investigations could have a material adverse impact on us through increased costs or restrictions on our businesses and noncompliance could result in significant regulatory penalties and legal liability and damage our reputation. Restrictions on cross border data flows and data residency requirements may negatively impact our clients’ and our own ability to transfer personal information to the U.S. and other countries as part of our provision of services, and in support of our own operations, potentially impacting revenues. In addition, data security events and concerns about privacy abuses by other companies are changing consumer and social expectations for enhanced privacy and data protection. As a result, even the perception of noncompliance, whether or not valid, may damage our reputation. Finally, our ability to produce data-driven insights for our customers as we continue to leverage AI in our HCM technology may be constrained by current and future privacy, social and ethics regulatory requirements and considerations, thereby restricting our ability to use data in innovative ways. These regulatory requirements and considerations may also impose burdensome and costly requirements on our ability to leverage data, and potentially result in brand or reputational harm.
Our business plan is focused on an aggressive growth strategy. If we fail to manage our growth effectively or if our strategy is not successful, we may be unable to execute our business plan, to maintain high levels of service, or to adequately address competitive challenges.
We expect that therehave experienced, and we believe we will continue to experience, a period of rapid growth in our operations and Cloud solutions. The growth of our operations and Cloud solutions has and may continue to place a strain on our management, administrative, operational, technological, and financial infrastructure. In order to manage our growth effectively, we will need to continuously improve our management, administrative, operational, technological, and financial systems, and our internal controls, reporting systems, and procedures to scaled global capabilities which may require investment as we grow and could result in disruption as we transform. Our attempts to develop new or enhanced functionality to our services, whether as part of our anticipated development road map or in response to enhancement requests we have committed to our customers, has been, and will continue to be new proposed laws, regulations,expensive and industry standards concerning privacy, data protection and information security in the United States, Canada, the European Union, and other jurisdictions, and we cannot yet determine the impact such future laws, regulations, and standards may have on our business. For example, in May 2018, the General Data Protection Regulation came into force, bringing with it a complete overhaul of E.U. data protection laws: the new rules supersede E.U. data protection legislation, impose more stringent E.U. data protection requirements, and provide for greater penalties for non-compliance. Changing definitions of what constitutes PII may also limit or inhibit our abilityprofitability. Failure to operateeffectively manage growth or to expand our business, including limiting strategic partnerships that may involve the sharing of data. Also, some jurisdictions require that certain types of data be retained on servers within these jurisdictions. Our failure to comply with applicable laws, directives, and regulations mayachieve a profitable growth strategy could result in enforcement action against us, including finesproblems or delays in implementing customers, declines in quality or customer satisfaction, decreased profitability on new customer deals, increases in costs, complications or delays in
13 | 2023 Form 10-K
introducing new features or fixing or updating our existing technology and imprisonment,infrastructure, or other operational challenges; and damage to our reputation, any of which may have an adverse effect on our business and operating results. Further, in October 2015, the European Court of Justice issued a ruling invalidating the U.S.-E.U. Safe Harbor Framework, which facilitated transfers of PII to the United States in compliance with applicable E.U. data protection laws. In July 2016, the E.U. and the U.S. political authorities adopted the E.U.-U.S. Privacy Shield, replacing the Safe Harbor Framework and providing a new mechanism for companies to transfer E.U. PII to the United States. U.S. organizations wishing to self-certify under the Privacy Shield must pledge their compliance with its seven core and sixteen supplemental principles, which are based on European Data Protection Law.
If our service is perceived to cause, or is otherwise unfavorably associated with, violations of privacy or data security requirements, it may subject us or our customers to public criticism and potential legal liability. Public concerns regarding PII processing, privacy and security may cause some of our customers’ end users to be less likely to visit their websites or otherwise interact with them. If enough end users choose not to visit our customers’ websites or otherwise interact with them, our customers could stop using our platform. This, in turn, may reduce the value of our services and slow or eliminate the growth of our business. Existing and potential privacy laws and regulations concerning privacy and data security and increasing sensitivity of consumers to unauthorized processing of PII may create negative public reactions to technologies, products, and services such as ours.
Evolving and changing definitions of what constitutes PII and / or “Personal Data” within the United States, Canada, the European Union, and elsewhere, especially relating to the classification of internet protocol, or IP addresses, machine or device identification numbers, location data and other information, may limit or inhibit our ability to operate or to expand our business. Future laws, regulations, standards and other obligations could impair our ability to collect or to use information that we utilize to provide email delivery and marketing services to our customers, thereby impairing our ability to maintain and to grow our customer base and to increase revenue. Future restrictions on the collection, use, sharing, or disclosure of our customers’ data or additional requirements for express or implied consent of customers for the use and disclosure of such information may limit our ability to develop new services and features.
Privacy concerns and laws or other domestic or foreign data protection regulations may reduce the effectiveness of our applications, whichthese difficulties could have a material adverse effect on our business, financial condition, and results of operations.
Our customers can use our applications to collect, to use,The markets in which we participate are highly competitive, and to store PII regarding their employees, independent contractors, and job applicants. Federal, state, and foreign government bodies and agencies have adopted, are considering adopting, or may adopt laws and regulations regarding the collection, use, storage and disclosure of PII obtained from individuals. The costs of compliance with, and other burdens imposed by, such laws and regulations that are applicable to the businesses of our customers, or to our business directly, may limit the use and adoption of our applications and reduce overall demand, or lead to significant fines, penalties, or liabilities for any non-compliance with such privacy laws. Furthermore, privacy concerns may cause our customers’ workers to resist providing PII necessary to allow our customers to use our applications effectively. Even the perception of privacy concerns, whether orif we do not valid, may inhibit market adoption of our applications in certain industries.
All of these domestic and international legislative and regulatory initiatives may adversely affect our customers’ ability to process, to handle, to store, to use, and to transmit demographic information and PII from their employees, independent contractors, job applicants, customers, and suppliers, which could reduce demand for our applications. The European Union and many countries in Europe have stringent privacy laws and regulations, which may impact our ability to profitably operate in certain European countries.
Further, international data protection regulations trending toward increased localized data residency rules make transfers from outside the regulation’s jurisdiction increasingly complex and may impact our ability to deliver solutions that meet all customers’ needs. If the processing of PII were to be further curtailed in this manner, our solutions could be less effective, which may reduce demand for our applications, whichcompete effectively, it could have a material adverse effect on our business, financial condition, and results of operations.
The markets in which we participate are highly competitive, and competition could intensify in the future. We believe the principal competitive factors in our market include: breadth and depth of product functionality, scalability and reliability of applications, robust workforce management, comprehensive tax services, modern and innovative Cloud technology platforms combined with an intuitive user experience, rapid technological change such as the rise of large language models, multi-country and jurisdiction domain expertise in payroll and HCM, quality of implementation and customer service, integration with a wide variety of third party applications and systems, total cost of ownership and return on investment, brand awareness, and reputation, pricing and distribution.
We face a variety of competitors, some of which are long-established providers of HCM solutions. Many of our current and potential competitors are larger, have greater name recognition, longer operating histories, larger marketing budgets, and significantly greater resources than we do, and are able to devote greater resources to the development, promotion, and sale of their products and services. Some of our competitors do or could offer HCM solutions bundled as part of a larger product offering. Furthermore, our current or potential competitors may be acquired by third parties with greater available resources and the ability to initiate or to withstand substantial price competition. In addition, many of our competitors have established marketing relationships, access to government activity, privacy advocacy groupslarger customer bases, and the technologymajor distribution agreements with consultants, system integrators, and other industries are considering various new, additional,resellers. Our competitors have and may continue to establish cooperative relationships among themselves or different self-regulatory standardswith third parties that may placefurther enhance their product offerings or resources. Although we have a global partnership strategy, additional burdens on us. investment and efforts will be necessary to fully implement and scale such a strategy.
If the processing of PII were to be curtailed in this manner, our solutions would be less effective, which may reduce demand forcompetitors’ products, services, or technologies become more accepted than our applications whichare today, if they are successful in bringing their products or services to market earlier than ours, or if their products or services are more technologically capable than ours, it could have a material adverse effect on our business, financial condition, and results of operations.
We rely on third party service providers for many aspects In addition, some of our business, including, but not limited to, the operation of data centers; the execution of Automated Clearing House, or ACH,competitors may offer their products and wire transfers to support our customer payroll and tax services; the monitoring of applicable laws; and the printing and delivery of checks. If any third party service providers on which we rely experienceservices at a disruption, go out of business, experience a decline in quality, or terminate their relationship with us, we could experience a material adverse effect on our business, financial condition, and results of operation.
We rely on third party service providers for many integral aspects of our business. A failure on the part of any of our third party service providers to fulfill their contracts with us could result in a material adverse effect on our business, financial condition, and results of operation. We depend on our third parties for many services, including, but not limited to:
Upkeep of data centers
We host Dayforce and Powerpay applications and serve all of our customers from data centers operated by third party providers, primarily NaviSite, in Boston, Massachusetts; Redhill, England; Santa Clara, California; Toronto, Canada; Vancouver, Canada; and Woking, England. We also host Dayforce Australia in Microsoft Azure in Melbourne, Australia and Sydney, Australia. While we control and have accesslower price compared to our servers and all of the components ofproducts or their current pricing impacting our network that are located inability to achieve our external data centers, we do not control the operation of these facilities. The owners of our data center facilities have no obligation to renew their agreements with us on commercially reasonable terms, or at all. These parties may also seek to cap their maximum contractual liability resulting in us being financially responsible for losses caused by their actions or omissions. Additionally, we host our internal systems through data centers that we operate and lease or own in Atlanta, Georgia; Fountain Valley, California; Louisville, Kentucky; St. Petersburg, Florida; and Winnipeg, Canada.target pricing. If we are unable to renewachieve our agreements with our third party providers or to renew our leases on commercially reasonable terms,target pricing levels or if one of our data center operators is acquired, we may be required to transfer our servers and other infrastructure to new data center facilities, and we may incurexperience significant costs and possible service interruption in connection with any such transfer. Both our third party data centers and data centers that we lease and operate are subject to break-ins, sabotage, intentional acts of vandalism, and other misconduct. Any such acts could result in a breach of the security of our or our customers’ data.
Problems faced by our third party data center locations, with the telecommunications network providers with whom we or they contract, or with the systems by which our telecommunications providers allocate capacity among their customers, including us, could adversely affect the experience of our customers. Our third party data centers operators could decide to close their facilities without adequate notice. In addition, any financial difficulties, such as bankruptcy, faced by our third party data centers operators or any of the service providers with whom we or they contract may have negative effects on our business, the nature and extent of which are difficult to predict. Additionally, if our data centers are unable to keep up with our growing needs for capacity, this could adversely affect the growth of our business. Any changes in third party service levels at our data centers or any security breaches, errors, defects, disruptions, or other performance problems with our applications could adversely affect our reputation, damage our customers’ stored files, result in lengthy interruptions in our services, or otherwise result in damage or losses to our customers for which they may seek compensation from us. Interruptions in our services might reduce our revenues, cause us to issue refunds to customers for prepaid and unused subscription services, subject us to potential liability, or adversely affect our renewal rates.
Processing of electronic funds transfers
We currently have agreements with three banks in the United States, two banks in Canada, and one financial payments company in the United Kingdom to execute electronic funds transfers to support our customer payroll and tax services in the United States, Canada, and the United Kingdom. If one or more of these parties fails to process electronic funds transfers on a timely basis, or at all, then our relationship with our customers could be harmed and we could be subject to claims by a customer with respect to the failed transfers, with little or no recourse to the banks. In addition, these parties have no obligation to renew their agreements with us on commercially reasonable terms, or at all, and transferring to alternative providers could prove time-consuming and costly. If these parties terminate their relationships with us, restrict or fail to increase the dollar amounts of funds that they will process on behalf of our customers, their doing so may impede our ability to process funds andpricing pressures, it could have a material adverse effect on our business, financial condition, and results of operations.
Check printingOur international growth strategy has and deliverywill continue to expose us to risks inherent in international sales and operations.
In Canada, we rely onWe have and will continue to expand our operations and sales into new international markets. Our expanding international operations are subject to risks that could adversely affect those operations or our business as a third party vendor to print payroll checks, and in Canada and the United States we rely on third party couriers, such as Federal Express and Purolator, to ship printed reports, year-end slips, and pay checks to our customers. Relying on third party check printers and couriers puts us at risk from disruptions in their operations, such as employee strikes, inclement weather, and their ability to perform tasks on our behalf. If these vendors fail to perform their tasks, we could incur liability or suffer damages to our reputation, or both. If we are forced to use other third party couriers, transferring to these competitor couriers could prove time-consuming, our costs could increase and we maywhole, including but not be able to meet shipment deadlines. Moreover, we may not be able to obtain terms as favorable as those we currently use, which could further increase our costs.
Monitoring of changes to applicable laws
We and our third party providers must monitor for any changes or updates in laws that are applicablelimited to the solutions that we orcosts of establishing a market presence, localizing product and service offerings for foreign customers, difficulties in managing and staffing international operations, and increased expenses related to introducing corporate policies and controls in our third party providersinternational operations and increased reliance on partners to provide to our customers. In addition, we are reliant on our third party providers to modifyservices in additional geographies. Further, the solutions that they provide to our customers to enable our clients to comply with changes to such laws and regulations. If our third party providers fail to reflect changes or updates in applicable laws in the solutions that they provide to our customers, we could be subject to negative customer experiences, harm to our reputation, loss of customers, claims for any fines, penalties or other damages suffered by our customers, and other financial harm.
A failure on the part of anyexpansion of our third party service providers couldproduct offering into new international markets has and will continue to result in a material adverse effect on our business, financial condition, and results of operations.
If we are unable to develop or to sell our existing Cloud solutions into new markets or to further penetrate existing markets, our revenue may not grow as expected.
Our ability to increase revenue will depend, in large part, on our ability to sell our existing Cloud solutions into new markets around the world, to further penetrate our existing markets, and to increase sales from existing customers who do not utilize the full Dayforce suite. The success of any enhancement or new solution or service depends on several factors, including the timely completion, introduction and market acceptance of enhanced or new solutions, the ability to maintain and to develop relationships with third parties, and the ability to attract, to retain and to effectively train sales and marketing personnel. Any new solutions we develop or acquire may not be introduced in a timely or cost-effective manner and may not achieve the market acceptance necessary to generate significant revenue. Any new markets in which we attempt to sell our
platform and solutions, including new countries or regions, may not be receptive. Additionally, any expansion into new markets will require commensurate ongoingan expansion of our monitoring of local laws and regulations, which increases our costs as well as the risk of the product not incorporating in a timely fashion or at all the necessary changes to enable a customer to be compliant with such laws. Our abilitylaws, or in manual workarounds that are prone to further penetrate our existing markets depends on the qualityerrors.
Moreover, as part of our platforminternational strategy, we work with partners to perform services in certain geographies where we do not currently have international operations or the particular service required by our customers. As a result, we may experience business impact if our partners do not carry out the services as committed, or at a quality level that our customers demand, including potential for reduced margin from additional expense or impact to customer relationships.
Our international growth strategy has and solutions, andmay continue to include growth via acquisition. Our growth following an acquisition may also be dependent on our ability to design our Cloud solutionstransition acquired customers from current and legacy products to meet consumer demand;Dayforce, migrate and our abilityintegrate acquired technologies or to increase sales from existing customers depends on our customers’ satisfactionby addressing broader HCM needs with our product and need for additional solutions. modules of Dayforce.
If we are unable to sellprovide the required services on a multinational basis, or if we are unable to effectively manage our Cloudinternational expansion, we could be subject to negative customer experiences, harm to our reputation or loss of customers, claims for any fines, penalties or other damages suffered by our customer, and other financial harm, including fines, penalties, or other damages suffered by us directly, which would negatively impact revenue and earnings. Although we have a multinational strategy, additional investment and efforts may be necessary to implement such strategy. Some of our business partners also have international operations and are subject to the risks described above.
14 | 2023 Form 10-K
Customers depend on our solutions intoto assist them to comply with applicable laws, which requires us and our third party providers to constantly monitor applicable laws and to make applicable changes to our solutions. If our solutions have not been updated to enable the customer to comply with applicable laws or we fail to update our solutions on a timely basis, it could have a material adverse effect on our business, financial condition, and results of operations.
Customers use our solutions to assist them to comply with payroll, HR, and other applicable laws for which the solutions are intended for use. We and our third party providers must monitor all applicable laws and as such laws expand, evolve, or are amended in any way, and when new marketsregulations or laws are implemented, we may be required to further penetrate existing markets,modify our solutions to assist our customers to comply with such new regulations or laws, which requires an investment of our time and resources. We are also reliant on our third party providers to modify the solutions that they provide to our customers as part of our solutions to comply with changes to such laws and regulations. The number of laws and regulations that we are required to monitor has and will continue to increase sales from existingas we expand both the geographic regions in which the solutions are offered and the types of products we offer to customers. These risks have become exacerbated as we expand by acquisition and are most acute in the period following the acquisition as we integrate the acquired business and its systems. In the event our solutions fail to assist a customer to comply with applicable laws, we are subject to negative customer experiences, harm to our reputation or loss of customers, claims for any fines, penalties or other damages suffered by our revenue may not grow as expected,customer, and other financial harm, including fines, penalties, or other damages suffered by us directly.
If our current or future applications fail to perform properly, our reputation could be adversely affected, our market share could decline, and we could be subject to liability claims, which could have a material adverse effect on our business, financial condition, and results of operations.
Our applications are inherently complex and may contain material defects or errors that we are not yet aware of. Because a growing partof the large amount of data that we collect and manage, it is possible that failures or errors in our systems could result in data loss or corruption or cause the information that we collect to be incomplete or to contain inaccuracies that our customers regard as significant. Any defects in functionality or that cause interruptions in the availability of our applications could result in reputational, competitive, operational, or other business consistsharm as well as financial costs and regulatory action, any of sales of applications to manage complex operating environments for our customers, we may experience longer sales cycles and longer deployments. Some customers demand more configuration and integration services, and require increased compliance and initial support costs, which could have a material adverse effect on our business, financial condition, and results of operations. In addition, the costs incurred in correcting any material defects or errors might be substantial. While we conduct standard due diligence during our acquisition process, these risks are heightened as we grow by acquisition and dedicate resources to integrating the acquisition target’s systems into ours and take on the vulnerabilities that may exist at the acquisition target.
If we fail to manage our technical operations infrastructure, our existing customers may experience service outages, and our new customers may experience delays in a given period.
A growing portion of our customer base requires applications that manage complex operating environments. Our ability to increase revenues and to maintain profitability depends, in large part, on widespread acceptancethe implementation of our applications, by businesses and other organizations. As we target our sales efforts at these customers, we face greater costs, longer sales cycles, and less predictability in completing some of our sales. For some of our customers, the customer’s decision to use our applications may be an enterprise-wide decision and, therefore, these types of sales require us to provide greater levels of education regarding the use and benefits of our applications. Our typical sales cycles for Dayforce range from three to twelve months, and we expect that this lengthy sales cycle may continue or increase as customers adopt our applications. Longer sales cycleswhich could have a material adverse effect on our business, financial condition, and results of operationsoperations.
We have experienced and will continue to experience significant growth in a given period.
It typically takes approximately three to nine months to implement a new customer on Dayforce, depending on the number of users, transactions, and typedata that our operations infrastructure supports, including the acquisition of applications,new systems via strategic transactions. We seek to maintain sufficient capacity in our operations infrastructure to meet the complexity and scale of the customers’ business, the configuration requirements, and other factors, many of which are beyond our control. Although our contracts are generally non-cancellable by the customer, at any given time, a significant percentageneeds of our customers and to facilitate the rapid provision of new customer activations and the expansion of existing customer activations. In addition, we need to continue to properly manage our technological operations infrastructure to support version control, changes in hardware and software parameters, and the evolution of our applications. We have experienced, and may in the future experience, website disruptions, outages, and other performance problems. These problems may be stillcaused by a variety of factors, including infrastructure changes, human or software errors, viruses, security attacks, fraud, increased resource consumption from expansion or modification to our Dayforce code, spikes in customer usage, denial of service issues and Cloud interruptions run by third party service providers and our ability to react. The risks of these problems occurring may be exacerbated by our strategic acquisitions, especially in the processperiod following the acquisition as we integrate the acquisition target’s systems into ours, as well as our aging technology infrastructure which in some cases is supported by older platforms. In some instances, we may not be able to identify the cause or causes of deployingthese performance problems within an acceptable period of time. If we do not accurately predict our infrastructure requirements, our existing customers may experience service outages that may subject them to financial penalties, causing us to incur financial liabilities and customer losses.
Our growth depends in part on the success of our strategic relationships with third parties who provide us with services and license us software for use in or with both our applications particularly during periodsand our internal operations.
In order to maintain and grow our business, we do, and we anticipate that we will continue to, depend on the continuation and expansion of rapid growth. Some customers may optrelationships with third parties who provide us with services. These service provider partners include connected payroll partners, implementation partners, systems integrators, third party sales channel partners, the operators of data centers, and banks and other providers who execute wire transfers and other money movement services to support our customer payroll and tax services. Our agreements with these third party service providers are typically non-exclusive and do not prohibit them from working with our competitors. If any third-party service providers on which we rely to provide
15 | 2023 Form 10-K
us with services experience a disruption, go out of business, are acquired by our competitors, experience a decline in quality, or terminate their relationship with us, we could experience a material adverse effect on our business, financial condition, and results of operation.
In addition, we license software from third parties for phased roll outs, which further lengthensuse in or with both our applications and our internal operations, and the time for usinability to see profits from such contracts.
Some of our customers may demand more configuration and integration services, which increase our upfront investmentmaintain these licenses could result in sales and deployment efforts. Additionally, customers may require increased compliance and initial support costs during the onboarding process. As a result of these factors, we must devote a significant amount of sales support and professional services resources to individual customers, increasing the cost and time required to complete sales. The increased costs, associated with completing sales and the implementation process for these customersor reduced service levels, which could have a material adverse effect on our business, financial condition, and results of operations. To the extent that our applications depend upon the successful operation of third party software in conjunction with our software, any undetected errors or defects in this third party software could prevent the deployment or impair the functionality of our applications, delay new application introductions, and result in a failure of our applications, which could have a material adverse effect on our business, financial condition, and results of operations.
Any failure to offer high-quality technical support services may adversely affect our relationships with our customers and could have a material adverse effect on our business, financial condition, and results of operations.
Once our applications are deployed, our customers depend on our support organization and the support capabilities of our partners to resolve technical issues relating to our applications, as well as our partner’s applications. We have recently engaged in a rebalancing of our global workforce that particularly impacted our support organization, which may result in disruption as we fill existing positions in our APJ geographies. We or our partners may be unable to respond quickly enough to accommodate short-term increases in customer demand for support services, and we may be limited in our ability to resolve the technical issues our customers have with our technology, or our partner’s technology. We or our partners also may be unable to modify the format of our or our partners’ support services to compete with changes in support services provided by our competitors. Increased customer demand for these services, without corresponding revenues, could increase costs and have an adverse effect on our results of operations. Ultimately, a client could elect to terminate their agreement due to dissatisfaction with support, resulting in lost recurring revenue. In addition, our sales process is highly dependent on our applications and business reputation and on positive recommendations from our existing customers. Any failure to maintain high-quality technical support, or a market perception that we do not maintain high-quality support, could adversely affect our reputation and our ability to sell our applications to existing and prospective customers, which could have a material adverse effect on our business, financial condition, and results of operations.
If our customers are not satisfied with the implementation and professional services provided by us or our partners, it could have a material adverse effect on our business, financial condition, and results of operations.
Our business depends on ourthe ability to implement our solutions on a timely, accurate, and cost-efficient basis and to provide professional services at the high level demanded by our customers. Implementation and other professional services may be performed by our own staff, by a third party, or by a combination of the two. Although we perform the majority of our implementations and other professional services with our staff, in some instances we work with third parties to increase the breadth of capability and depth of capacity for delivery of certain services to our customers. In 2017 and 2018, we used third parties to assist us in approximately 20% of our implementation services. If a customer is not satisfied with the timely access or the quality of work performed, by us or a third party or with the implementation or type of professional services or applications delivered, or there are inaccuracies or errors in the work delivered by the third party, then we could incur loss of revenue or additional costs to address the situation, the profitability of that work might be impaired, and the customer’s dissatisfaction with such services could damage our ability to expand the number of applications subscribed to by that customer or we could be liable for loss or damage suffered by the customer as a result, of such third party’s actions or omissions, any of which could have a material adverse effect on our business, financial condition, and results of operations. If a new customer is dissatisfied with professional service, either performed by us or a third party,implementation, the customer could refuse to go-live, which could result in a delay in our collection of revenuefees or could result in a customer seeking repayment of its implementation fees or suing us for damages or could force us to enforce the termination provisions in our customer contracts in order to collect revenue. In addition, negative publicity related to our customer relationships, regardless of its accuracy, may affect our ability to compete for new business with current and prospective customers, which could also have a material adverse effect on our business, financial condition, and results of operations.
The loss of a significant portion of our customers, or a failure to renew our subscription agreements with a significant portion of our customers, could have a material adverse effect on our business, financial condition, and results of operations.
The loss of a significant portion of our customers, or a failure of some of them to renew their contracts with us, could have a significant impact on our revenues, reputation, and our ability to obtain new customers. Our agreements with our Dayforce customers are typically structured as having an initial fixed term of between three and five years, with evergreen renewal thereafter; consequently, our customers may choose to terminate their agreements with us at any time after the expiration of the initial term by providing us with the amount of written notice stipulated in the agreement. Moreover, acquisitions of our customers could lead to cancellation of our contracts with them or by the acquiring companies, thereby reducing the number of our existing and potential customers. Acquisitions of our partners involved in referring or reselling our solutions could also result in a reduction in the number of our current and potential customers, as our partners may no longer facilitate the adoption of our applications. A failure to retain a significant portion of our customers, or a failure to renew our subscription agreements with a significant portion of customers, could have a material adverse effect on our business, financial condition, and results of operations.
Our customers may fail to pay us in accordance with the terms of their agreements, which could have a material adverse effect on our business, financial condition, and results of operations.
Our agreements with our Dayforce customers are typically structured as having an initial fixed term of between three and five years, with evergreen renewal thereafter. If customers fail to pay us under the terms of our agreements with them, we may be unable to collect amounts due and may be required to incur additional costs enforcing the terms of our contracts, including litigation. The risk of such negative effects increases with the term length of our customer arrangements. Furthermore, some of our customers may seek bankruptcy protection or other similar relief and fail to pay amounts due to us, or to pay those amounts more slowly. If our customers fail to pay us in accordance with the terms of their agreements, it could have a material adverse effect on our business, financial condition, and results of operations.
We often provide service level commitments under our customer contracts. If we fail to meet these contractual commitments, we could be considered to have breached our contractual obligations, be obligated to provide credits, or refund prepaid amounts related to unused subscription services or face contract terminations, which could have a material adverse effect on our business, financial condition, and results of operations.
Our customer agreements typically provide service level commitments which are measured on a monthly or other periodic basis. If we are unable to meet the stated service level commitments or suffer extended periods of unavailability for our applications, we may be contractually obligated to provide these customers with service credits or refunds for prepaid amounts related to unused subscription services, or we could face contract claims for damages or terminations, which could have a material adverse effect on our business, financial condition, and results of operations. In addition, our revenues could be significantly affected if we suffer unscheduled downtime that exceeds the allowed downtimes under our agreements with our customers. Any extended service outages could have a material adverse effect on our business, financial condition, and results of operations.
Any failure to offer high-quality technical support services may adversely affect our relationships with our customers and could have a material adverse effect on our business, financial condition, and results of operations.
Once our applications are deployed, our customers depend on our support organization to resolve technical issues relating to our applications. We may be unable to respond quickly enough to accommodate short-term increases in customer demand for support services. We also may be unable to modify the format of our support services to compete with changes in support services provided by our competitors. Increased customer demand for these services, without corresponding revenues, could increase costs and have an adverse effect on our results of operations. In addition, our sales process is highly dependent on our applications and business reputation and on positive recommendations from our existing customers. Any failure to maintain high-quality technical support, or a market perception that we do not maintain high-quality support, could adversely affect our reputation and our ability to sell our applications to existing and prospective customers, which could have a material adverse effect on our business, financial condition, and results of operations.
Regulatory requirements placed on our software and services could impose increased costs on us, delay or prevent our introduction of new products and services, and impair the function or value of our existing products and services.
Our products and services may become subject to increasing regulatory requirements, and as these requirements proliferate, we may be required to change or adapt our products and services to comply. Changing regulatory requirements might render our products and services obsolete or might block us from developing new products and services. This might in turn impose additional costs upon us to comply or to further develop our products and services. It might also make introduction of new products and services more costly or more time-consuming than we currently anticipate and could even prevent introduction by us of new products or services or cause the continuation of our existing products or services to become more costly. Accordingly, such regulatory requirements could have a material adverse effect on our business, financial condition, and results of operations.
Customers depend on our products and services to enable them to comply with applicable laws, which requires us and our third party providers to constantly monitor applicable laws and to make applicable changes to our solutions. If our solutions have not been updated to enable the customer to comply with applicable laws or we fail to update our solutions on a timely basis, it could have a material adverse effect on our business, financial condition, and results of operations.
Customers rely on our solutions to enable them to comply with payroll, HR, and other applicable laws for which the solutions are intended for use. Changes in tax, benefit, and other laws and regulations could require us to make significant modifications to our products or to delay or to cease sales of certain products, which could result in reduced revenues or revenue growth and our incurring substantial expenses and write-offs. There are thousands of jurisdictions and multiple laws in some or all of such jurisdictions, which may be relevant to the solutions that we or our third party providers provide to our customers. Therefore, we and our third party providers must monitor all applicable laws and as such laws expand, evolve, or are amended in any way, and when new regulations or laws are implemented, we may be required to modify our solutions to enable our customers to comply, which requires an investment of our time and resources. Although we believe that our Cloud platform provides us with flexibility to release updates in response to these changes, we cannot be certain that we will be able to make the necessary changes to our solutions and release updates on a timely basis, or at all. In addition, we are reliant on our third party providers to modify the solutions that they provide to our customers as part of our solutions to comply with changes to such laws and regulations. The number of laws and regulations that we are required to monitor will increase as we expand the geographic region in which the solutions are offered. When a law changes, we must then test our solutions to meet the requirements necessary to enable our customers to comply with the new law. If our solutions fail to enable a customer to comply with applicable laws, we could be subject to negative customer experiences, harm to our reputation or loss of customers, claims for any fines, penalties or other damages suffered by our customer, and other financial harm. Additionally, the costs associated with such monitoring implementation of changes are significant. If our solutions do not enable our customers to comply with applicable laws and regulations, it could have a material adverse effect on our business, financial condition, and results of operations.
Additionally, if we fail to make any changes to our products as described herein, which are required as a result of such changes to, or enactment of, any applicable laws in a timely fashion, we could be responsible for fines and penalties implemented by governmental and regulatory bodies. If we fail to provide contracted services, such as processing W-2 tax forms or remitting taxes in accordance with deadlines set by law, our customers could incur fines, penalties, interest, or other damages, which we could be responsible for paying. Our payment of fines, penalties, interest, or other damages as a result of our failure to provide compliance services prior to deadlines may have a material adverse effect on our business, financial condition, and results of operations.
We operate and are subject to tax in multiple jurisdictions. Audits, investigations, and tax proceedings could have a material adverse effect on our business, results of operations, and financial condition.
We are subject to income and non-income taxes in multiple jurisdictions. Income tax accounting often involves complex issues, and judgment is required in determining our worldwide provision for income taxes. We are regularly subject to tax audits in these jurisdictions. We regularly assess the likely outcomes of these audits to determine the appropriateness of our tax reserves as well as our future tax liabilities. In addition, the application of withholding tax, value added tax, goods and services tax, sales tax, and other non-income taxes is not always clear and we may be subject to audits relating to such withholding or non-income taxes. We believe that our tax positions are reasonable and our tax reserves are adequate to cover any potential liability. However, tax authorities in these jurisdictions may challenge our position. If any of these tax authorities successfully challenge our positions, we may be liable for additional tax, penalties, and interest in excess of any reserves established, which may have a significant impact on our results and operations and future cash flow.
Sales to customers outside the United States or with international operations expose us to risks inherent in international sales.
Over 30% of our revenue for each of the years ended December 31, 2018, 2017, and 2016, was obtained from companies headquartered outside of the United States, primarily from Canada, which accounted for 30.1%, 30.3%, 30.2% of our revenue in such periods, respectively. Our Ceridian Canada Ltd. (“Ceridian Canada”) operations provide certain HCM solutions for our Canadian customers. We are continuing to expand our international Cloud solutions into other countries. As such, our international operations are subject to risks that could adversely affect those operations or our business as a whole, including:
costs of localizing products and services for foreign customers;
difficulties in managing and staffing international operations;
difficulties and increased expenses related to introducing corporate policies and controls in our international operations;
difficulties with or inability to engage global partners;
longer sales and payment cycles;
the burdens of complying with a wide variety of foreign laws;
compliance with applicable anti-bribery laws, including the Foreign Corrupt Practices Act;
additional regulatory compliance requirements;
exposure to legal jurisdictions that may not recognize or interpret customer contracts appropriately;
potentially adverse tax consequences, including the complexities of foreign value added tax systems, the tax cost on the repatriation of earnings, and changes in tax rates;
restrictions on transfer of funds, laws and business practices favoring local competitors;
reduced or varied protection for intellectual property and other legal rights as compared to the United States;
practical difficulties in enforcing intellectual property and other rights outside of the United States;
exposure to local economic and political conditions; and
changes in currency exchange rates, and in particular, changes in the currency exchange rate between U.S. dollars and Canadian dollars.
In addition, we anticipate that customers and potential customers may increasingly require and demand that a single vendor provide HCM solutions and services for their employees in a number of countries. If we are unable to provide the required services on a multinational basis, there may be a negative impact on our new orders and customer retention, which would negatively impact revenue and earnings. Although we have a multinational strategy, additional investment and efforts may be necessary to implement such strategy. Some of our business partners also have international operations and are subject to the risks described above. Even if we are able to successfully manage the risks of international operations, our business may be adversely affected if our business partners are not able to successfully manage these risks.
If we fail to manage our technical operations infrastructure, our existing customers may experience service outages, and our new customers may experience delays in the deployment of our applications, which could have a material adverse effect on our business, financial condition, and results of operations.
We have experienced significant growth in the number of users, transactions, and data that our operations infrastructure supports. We seek to maintain sufficient excess capacity in our operations infrastructure to meet the needs of all of our customers. We also seek to maintain excess capacity to facilitate the rapid provision of new customer activations and the expansion of existing customer activations. In addition, we need to properly manage our technological operations infrastructure in order to support version control, changes in hardware and software parameters, and the evolution of our applications. However, the provision of new hosting infrastructure requires significant lead time. We have experienced, and may in the future experience, website disruptions, outages and other performance problems. These problems may be caused by a variety of factors, including infrastructure changes, human or software errors, viruses, security attacks, fraud, increased resource consumption from expansion or modification to our Dayforce code, spikes in customer usage, and denial of service issues. In some instances, we may not be able to identify the cause or causes of these performance problems within an acceptable period of time. If we do not accurately predict our infrastructure requirements, our existing customers may
experience service outages that may subject them to financial penalties, causing us to incur financial liabilities and customer losses, and our operations infrastructure may fail to keep pace with increased sales, causing new customers to experience delays as we seek to obtain additional capacity, which could have a material adverse effect on our business, financial condition, and results of operations.
Aging software infrastructure may lead to increased costs and disruptions in operations that could negatively impact our financial results.
We have risks associated with aging software infrastructure assets. The age of certain of our assets may result in a need for replacement, or higher level of maintenance costs. A higher level of expenses associated with our aging software infrastructure may have a material adverse effect on our business, financial condition, and results of operations.
Our growth depends in part on the success of our strategic relationships with third parties.
In order to grow our business, we anticipate that we will continue to depend on the continuation and expansion of relationships with third parties, such as implementation partners, third party sales channel partners, some of whom have exclusive relationships with us, and technology and content providers. Identifying partners and negotiating and documenting relationships with them requires significant time and resources. In addition, the third parties we partner with may not perform as expected under our agreements, and we may have disagreements or disputes with such third parties, which could negatively affect our brand and reputation.
Additionally, we rely on the expansion of our relationships with our third party partners as we grow our Cloud solutions. Our agreements with third parties are typically non-exclusive and do not prohibit them from working with our competitors. Our competitors may be effective in providing incentives to these same third parties to favor their products or services. In addition, acquisitions of our partners by our competitors could result in a reduction in the number of our current and potential customers, as our partners may no longer facilitate the adoption of our applications by potential customers after an acquisition by any of our competitors.
If we are unsuccessful in establishing or maintaining our relationships with third parties, our ability to compete in the marketplace or to grow our revenues could be impaired, which could have a material adverse effect on our business, financial condition, and results of operations. Even if we are successful, we cannot assure you that these relationships will result in increased customer usage of our applications or increased revenues.
If our current or future applications fail to perform properly, our reputation could be adversely affected, our market share could decline, and we could be subject to liability claims, which could have a material adverse effect on our business, financial condition, and results of operations.
Our applications are inherently complex and may contain material defects or errors. Any defects in functionality or that cause interruptions in the availability of our applications could result in:
loss or delayed market acceptance and sales;
breach of warranty or other contractual claims for damages incurred by customers;
errors in application output and resulting fines or penalties;
sales credits or refunds for prepaid amounts related to unused subscription services;
loss of customers;
diversion of development and customer service resources; and
injury to our reputation;
any of which could have a material adverse effect on our business, financial condition, and results of operations. In addition, the costs incurred in correcting any material defects or errors might be substantial.
Because of the large amount of data that we collect and manage, it is possible that hardware failures or errors in our systems could result in data loss or corruption or cause the information that we collect to be incomplete or contain inaccuracies that our customers regard as significant. Furthermore, the availability or performance of our applications could be adversely affected by a number of factors, including customers’ inability to access the Internet, the failure of our network or software systems, security breaches, or variability in user traffic for our services. We may be required to issue credits or refunds for prepaid amounts related to unused services or otherwise be liable to our customers for damages they may incur resulting from certain of these events. Because of the nature of our business, our reputation could be harmed as a result of factors beyond our control. For example, because our customers access our applications through their Internet service providers, if a service provider fails to provide sufficient capacity to support our applications or otherwise experiences service outages, such failure could interrupt our customers’ access to or experience with our applications, which could adversely affect our reputation or our customers’ perception of our applications’ reliability or otherwise have a material adverse effect on our business, financial condition, and results of operations.
Our insurance intended to cover liability claims may be inadequate or may not be available in the future on acceptable terms, or at all. In addition, our policy may not cover all claims made against us, and defending a suit, regardless of its merit, could be costly and divert management’s attention.
We depend on our senior management team, and the loss of one or more key employees or an inability to attract and to retain highly skilled employees could have a material adverse effect on our business, financial condition, and results of operations.
Our success depends largely upon the continued services of our keysenior management team. Our executive officers. We also rely on our leadership team in the areas of research and development, marketing, sales, services, and general and administrative functions, and on mission-critical individual contributors in all such areas. From time to time, there may be changes in our executiveofficers, senior management team resulting from the hiring or departure of executives, which could disrupt our business. We do not have employment agreements with our executive officers or other key personnel that require themhave limited or no notice period applicable to continue to work for us for any specified period, and, therefore,their employment. Therefore, they could terminate their employment with us at any time. Additionally, we do not maintain key manemployee insurance on any of our executive officers, senior management, or key employees. The loss of one or more of our executive officers, senior management, or key employees could have a material adverse effect on our business, financial condition, and results of operations.
To execute our growth plan, we must attract and retain highly qualified personnel. Competition for personneltalent is intense and has become more intense in recent years, including without limitation for individuals with high levels of experience in designing and developing software and Internet-related services and senior sales executives. We have, from time to time, experienced the need to increase compensation for current and prospective employees to retain and recruit employees of the desired qualifications which impacts our ability to profitably operate our business. In addition, we have and we expect to continue
16 | 2023 Form 10-K
to experience, difficulty in hiring and retaining employees with appropriate qualifications. Manyqualifications, the cumulative loss of which could raise the companies with which we compete for experienced personnel have greater resources than we have. If we hire employees from competitors or other companies, their former employers may attemptrisk of failures to assert that these employees have or that we have breached their legal obligations, resulting in a diversion ofoperate our timebusiness to the quality needed and resources. In addition, job candidates and existing employees often consider the value of the stock awards they receive in connection with their employment. If the perceived value of our stock awards declines, it may adversely affect our ability to recruit and to retain highly skilled employees. If we fail to attract new personnel or fail to retain and to motivate our current personnel, it could have a material adverse effect on our business, financial condition, and results of operations.
We haveIf our vendors or affiliates initiate payroll-related transactions on behalf of our customers and do not receive funds from the customer sufficient to cover the amounts paid on their behalf, we may suffer significant operations in the Republic of Mauritius. Changes in the laws and regulations in Mauritius or our non-compliance with applicable laws and regulations could have a material adverse effect on our business, financial condition, and results of operations.
Our Mauritius operations, which employ 685 employees as of December 31, 2018, are subject to the laws and regulations of the Republic of Mauritius. The continuance of these operations depends upon compliance with applicable Mauritius environmental, health, safety, labor, social security, pension, and other laws and regulations. Failure to comply with such laws and regulations could result in fines, penalties, or lawsuits. In addition, there is no assurance that we will be able to comply fully with applicable laws and regulations should there be any amendment to the existing regulatory regime or implementation of any new laws and regulations. Changes in the laws and regulations in Mauritius or our non-compliance with applicable laws and regulations could have a material adverse effect on our business, financial condition, and results of operations. Additionally, Mauritius lacks the infrastructure of countries in which we do business, such as the United States, Canada, and the United Kingdom. Any disruption to the electrical grid or catastrophic event in Mauritius could result in a longer response time in our ability to address the issue due to the remote geographic location of Mauritius,losses which could have a material adverse effect on our business, financial condition, and results of operations. Furthermore,
Under certain circumstances, funds may not be received from our businesscustomers to cover the transactions that our affiliates and operationsthird party vendors have initiated on our customers’ behalf. Additionally, there is a risk that an erroneous payment instruction may trigger inaccurate payments. There is, therefore, a risk that the customer’s funds will be insufficient to cover the amounts already paid on its behalf. Should customers default on their payment obligations in Mauritius entail the procurementfuture, should our affiliates or vendors make erroneous payments on behalf of licenses and permitsa customer, should erroneous or defaulted payment recovery be unsuccessful, or should our affiliates or vendors suffer losses from the relevant authorities. Difficultiessimilar issues, we may be required to advance substantial amounts of funds to cover such obligations, or failure in obtaining theto make our partners whole for any losses they suffer. In such an event, we may be required permits, licenses, and certificates could result in our inability to continue our business in Mauritius in a manner consistent with past practice,seek additional sources of short-term liquidity, which may not be available on reasonable terms, which could have a material adverse effect on our business, financial condition, and results of operations. Further, should a customer on whose behalf our affiliate or vendor has initiated a transaction subsequently have financial difficulty or refuse to pay, collection of any funds advanced on its behalf may be difficult and we may suffer losses that could have a material adverse effect on our business, financial condition, and results of operation.
Regulatory requirements placed on our software and services could impose increased costs on us, delay or prevent our introduction of new products and services, and impair the function or value of our existing products and services.
Our products and services are subject to increasing regulatory requirements, and as these requirements proliferate, we are required to change or adapt to comply. Changing regulatory requirements might render our services obsolete or might block us from developing new products and services. This might in turn impose additional costs upon us to comply or to further develop our products and services. Changing regulatory requirements can make introduction of new services more costly or more time-consuming than we currently anticipate and could even prevent introduction by us of new services or cause the continuation of our existing services to become more costly.
Federal, state, or foreign government bodies or agencies have in the past adopted, and may in the future adopt, laws or regulations affecting the use of the Internet as a commercial medium. Future changes in these laws or regulations could require us to modify our applications in order to comply with these changes. In addition, government agencies or private organizations may begin to impose taxes, fees, or other charges for accessing the Internet or commerce conducted via the Internet. These laws or charges could limit the growth of Internet-related commerce or communications generally, resulting in reductions in the demand for Internet-based applications such as ours, any of which could have a material adverse effect on our business, financial condition, and results of operations.
For our Dayforce Wallet product, we advance earned net wages and associated tax amounts on behalf of customers in connection with the “on-demand pay” payroll feature of the service in order to provide their employees access to earned wages in advance of their standard payroll cycles. A customer may fail to satisfy its obligation to repay us for those advanced monies which could have a material adverse effect on our business, financial condition, and results of operations.
In the case of our “on-demand pay” service (a service that is offered as part of the Dayforce Wallet), credit is provided to our customers and funds are advanced on the customers’ behalf in order to fund the customers’ employees’ interim earned net wage payroll demands (including associated source and other deductions) with the requirement that the customers will repay the advance on the date of their next ordinary payroll run. These advances may or may not have priority over other creditors of our customers, and our other credit protection measures, if implemented, may be inadequate to make us whole. There is, therefore, a risk that our customers do not pay back the amounts we have already paid on their behalf, and in that event, we may possess limited legal recourse to recoup those funds from our customers. In the event of a customer’s failure to repay us, we may be required to seek additional sources of short-term liquidity, which may not be available on reasonable terms, or suffer credit losses, which could have a material adverse effect on our business, financial condition, and results of operations.
Customer funds and wage funds of their employees that our trustees and third-party financial institution partners hold are subject to market, interest rate, credit, and liquidity risks. The loss of these funds could have a material adverse effect on our business, financial condition, and results of operations.
17 | 2023 Form 10-K
Our trustees (in the case of customer funds held in our U.S. Employer Funds Trust and our Canada Payroll Trust) and our third party financial institution partners (in the case of employee wage funds held on their behalf as part of the U.S. Dayforce Wallet program and certain of our non-U.S. operations) may invest funds in one or more high-quality bank deposits, money market mutual funds, commercial paper, collateralized short-term investments, government securities, as well as highly rated asset-backed, mortgage-backed, municipal, corporate, and bank securities. These assets are subject to varying degrees of general market, interest rate, credit, and liquidity risks. These risks may be exacerbated, individually or in unison, during periods of unusual financial market volatility. We are required to fund the payroll and wage funds of our customers and their employees regardless of any loss realized on those investments affecting the principal funds held. In the event of a global financial crisis, such as that experienced in 2008, we could be faced with a severe constriction of the availability of liquidity, which could impact our ability to fund payrolls. Any loss of principal, or inability to access customer funds could have an adverse impact on our cash position and results of operations and could require us to obtain additional sources of liquidity, and could have a material adverse effect on our business, financial condition, and results of operations.
We may acquire other companies or technologies, which could divert our management’s attention, result in additional indebtedness or dilution to our stockholders, and otherwise disrupt our operations, which could have a material adverse effect on our business, financial condition, and results of operations.
We have, and we may in the future seek to acquire or to invest in businesses, applications, or technologies that we believe could complement or expand our applications, enhance our technical capabilities, or otherwise offer growth opportunities. The pursuit of potential acquisitions may divert the attention of management and cause us to incur various expenses in identifying, investigating, and pursuing suitable acquisitions, whether or not they are consummated.
In addition, we have limited experience in acquiring other businesses. If we acquire additional businesses, we may incur significant costs to integrate such businesses. Further, we may not be able to integrate the acquired personnel, operations, and technologies successfully or profitably, or to effectively manage the combined business following the acquisition. We also may not achieve the anticipated benefits from the acquired business due to a number of factors, including the inability to integrate or to benefit from acquired technologies or services in a profitable manner, unanticipated costs or liabilities associated with the acquisition, difficulties and additional expenses associated with supporting legacy products and hosting infrastructure of the acquired business, difficulty converting the customers of the acquired business onto our applications and contract terms, and adverse effects to our existing business relationships with business partners and customer as a result of the acquisition.
If an acquired business fails to meet our expectations, it could have a material adverse effect on our business, financial condition, and results of operations. Acquisitions could also result inIn order to fund acquisitions, we may issue dilutive issuances of equity securities or the incurrence ofincur additional debt, which couldresulting in an increase in our interest payments.
In addition, aA significant portion of the purchase price of companies we acquire may be allocated to acquired goodwill and other intangible assets, which must be assessed for impairment at least annually. In the event that the book value of goodwill or other intangible assets is impaired, any such impairment would be charged to earnings in the period of impairment. In the future, if our acquisitions do not yield expected returns, we may be required to record charges based on this impairment assessment, process, which could have a material adverse effect on our financial condition and results of operations.
AdverseFailure to comply with anti-corruption laws and regulations, economic conditionsand trade sanctions, anti-money laundering laws and regulations, and similar laws could have a materially adverse effect on our reputation, results of operations or financial condition, or have other adverse consequences.
Regulators worldwide are exercising heightened scrutiny with respect to anti-corruption, economic and trade sanctions, and anti-money laundering laws and regulations. Such heightened scrutiny has resulted in more aggressive investigations and enforcement of such laws and more burdensome regulations, any of which could have a material adverse impact on our business. We are growing our business throughout the world, including in numerous developing economies where companies and government officials are more likely to engage in business practices that are prohibited by domestic and foreign laws and regulations, including the U.S. Foreign Corrupt Practices Act. Such laws generally prohibit improper payments or offers of payments to foreign government officials and leaders of political parties, and in some cases, to other persons, for the purpose of obtaining or retaining business. We are also subject to economic and trade sanctions programs, including those administered by the U.S. Treasury Department’s Office of Foreign Assets Control, which prohibit or restrict transactions or dealings with specified countries, their governments and, in certain circumstances, their nationals, and with individuals and entities that are specially designated, including narcotics traffickers and terrorists or terrorist organizations, among others. In addition, some of our businesses and entities in the U.S. and a number of other countries in which we operate are and will continue to be subject to anti-money laundering laws and regulations. These laws require us to develop and implement risk-based anti-money laundering programs, report large cash transactions and suspicious activity, and maintain transaction records. These laws and regulations include the Bank Secrecy Act of 1970 as amended by the USA PATRIOT Act of 2000 (the “BSA”), that requires banks and money services businesses, among others, to develop and implement risk-based anti-money laundering programs, report large cash transactions and suspicious activity, and maintain transaction records.
We have implemented policies and procedures to monitor and address compliance with applicable anti-corruption, economic and trade sanctions and anti-money laundering laws and regulations, and we are continuously in the process of reviewing, upgrading, and enhancing certain of our policies and procedures. However, there can be no assurance that our employees, consultants, or agents will not take actions in violation of our policies for which we may be ultimately responsible, or that our policies and procedures will be adequate or will be determined to be adequate by regulators. Any violations of
18 | 2023 Form 10-K
applicable anti-corruption, economic and trade sanctions or anti-money laundering laws or regulations could limit certain of our business activities until they are satisfactorily remediated and could result in civil and criminal penalties, including fines, which could damage our reputation and have a material adverse effect on our results of operation or financial condition. Further, bank regulators, including the OCC, which now regulates the DNTB, continue to impose additional and stricter requirements on banks to ensure they are meeting their BSA obligations, and banks are increasingly viewing money services businesses, as a class, to be higher risk customers for money laundering. As a result, our banking partners that assist in processing our money movement transactions may limit the scope of services they provide to us or may impose additional material requirements on us. Further, bank regulators, including the OCC, may increase regulatory investigations or governmental oversight to ensure we are meeting our BSA obligations. These regulatory restrictions on banks and changes to banks’ internal risk-based policies and procedures may result in a decrease in the number of banks that may do business with us, may require us to materially change the manner in which we conduct some aspects of our business, may decrease our revenues and earnings and could have a material adverse effect on our results or financial condition.
We may not be able to utilize a significant portion of our net operating loss, which could have a material adverse effect on our financial condition and results of operations.
Our business dependsAs of December 31, 2023, we had federal and state net operating loss carryforwards due to prior period losses, which, if not utilized, will begin to expire in 2031 and 2024 for federal and state purposes, respectively. These net operating loss carryforwards could expire unused and be unavailable to offset future income tax liabilities, which could have a material adverse effect on the overall demand for HCM solutionsour financial condition and on the economic healthresults of our current and prospective customers. Past financial recessions have resulted in a significant weakeningoperations.
In addition, under Section 382 of the economyInternal Revenue Code of 1986, as amended (the “Code”), our ability to utilize net operating loss carryforwards or other tax attributes in North America and globally, the reduction in employment levels, the reduction in prevailing interest rates, moreany taxable year may be limited availability of credit, a reduction in business confidence and activity, and other difficulties that may affectif we experience an “ownership change.” A Section 382 “ownership change” generally occurs if one or more stockholders or groups of stockholders who own at least 5% of our stock increase their ownership by more than 50 percentage points over their lowest ownership percentage within a rolling three-year period. Similar rules may apply under state tax laws. Future issuances of our stock could cause an “ownership change.” It is possible that an ownership change could have a material effect on our ability to utilize our net operating loss carryforwards, which could have a material adverse effect on our financial condition and results of operations.
Litigation and regulatory investigations aimed at us or resulting from actions of our predecessor may result in significant financial losses and harm to our reputation.
We face risk of litigation, regulatory investigations, and similar actions in the industriesordinary course of our business, including the risk of lawsuits and other legal actions relating to breaches of contractual obligations, tortious claims, employment and labor law matters, securities law claims, or claims related to erroneous transactions or breach of other laws or regulations from customers, stockholders, vendors, employees or other third parties which could result in fines, penalties, interest, loss of revenue, increased expense, or other damages. In particular, our clients have sought to pursue indemnification claims against us where they have been subject to wage compliance, payroll fraud, and data privacy claims. Litigation might result in substantial costs and may divert management’s attention and resources, which might materially harm our business, overall financial condition, and operating results. We may also be subject to various regulatory inquiries, such as information requests, subpoenas, and book and records examinations, from regulators and other authorities in the geographic markets in which we selloperate. A substantial liability arising from a lawsuit judgment or settlement or a significant regulatory action against us or a disruption in our applications. In addition, there has been pressure to reduce government spendingbusiness arising from adverse adjudications in the United States, and any tax increases and spending cuts at the federal level might reduce demand forproceedings against our applications from organizations that receive funding from the U.S. government and could negatively affect the U.S. economy, which could further reduce demand for our applications. Any of these eventsdirectors, officers, or employees could have a material adverse effect on our business, financial condition, and results or operations. Further, insurance might not cover such claims, might not provide sufficient payments to cover all the costs to resolve one or more such claims and might not continue to be available on terms acceptable to us. A claim brought against us that is uninsured or underinsured could result in unanticipated costs, thereby harming our operating results and leading analysts or potential investors to lower their expectations of operations. In addition, there can be no assurance that spending levelsour performance, which could reduce the trading price of our stock or potentially result in a lawsuit related to the reduced trading price of our stock.
Additionally, we are subject to claims and investigations as a result of our predecessor, Control Data Corporation (“CDC”), Ceridian Corporation, and other former entities for HCM solutions will increase following any recovery.
Catastrophic events may disrupt our business.
Our data centerswhom we are located in Atlanta, Georgia; Fountain Valley, California; Louisville, Kentucky; St. Petersburg, Florida; and Winnipeg, Canada. Additionally, our data centers hosted by third parties and our corporate offices are located in Boston, Massachusetts; Melbourne, Australia; Minneapolis, Minnesota; Redhill, England; Santa Clara, California; Sydney, Australia; Toronto, Canada; Vancouver, Canada; and Woking, England. Any location in any part of the world is susceptiblesuccessor-in-interest with respect to natural disasters or other risks beyond our control and its third party contractors that could impact operations.assumed liabilities. For example, in September 1989, CDC became party to an environmental matters agreement with Seagate Technology plc (“Seagate”) related to groundwater contamination on a parcel of real estate in Omaha, Nebraska sold by CDC to Seagate. In February 1988, CDC entered into an arrangement with Northern Engraving Corporation and the west coast of the United States contains active earthquake zones, the Midwest isMinnesota Pollution Control Agency in relation to groundwater contamination at a site in Spring Grove, Minnesota. We have also been subject to periodic tornadoes,asbestos related claims for former CDC employees. Although we are fully reserved for these groundwater contamination liabilities, and partially insured for the east coast is subjectasbestos claims, we cannot be certain if additional claims, investigations, or liabilities related to seasonal hurricanes and snowstorms. Additionally, we employ a substantial numbersuch predecessor companies will surface.
19 | 2023 Form 10-K
Any failure to protect our intellectual property rights could impair our ability to protect our proprietary technology and our brand.
Our success and ability to compete depend in part upon our intellectual property. We primarily rely on copyright, trade secret, and trademark laws; trade secret protection; and confidentiality or license agreements with our employees, customers, partners, and others to protect our intellectual property rights. However, the steps we take to protect our intellectual property rights may be ineffective or inadequate. In addition, use of AI tools may result in the release of confidential or proprietary information which could limit our ability to protect, or prevent us from protecting, our intellectual property rights.
In order to protect our intellectual property rights, we mayhave and will likely be required to continue to spend significant resources to monitor and to protect these rights. Litigation brought to protect and to enforce our intellectual property rights could be costly, time-consuming, and distracting to management, with no guarantee of success, and could result in the impairment or loss of portions of our intellectual property. Furthermore, our efforts to enforce our intellectual property rights may be met with defenses, counterclaims, and countersuits attacking the validity and enforceability of our intellectual property rights. Our failure to secure, to protect, and to enforce our intellectual property rights could have a material adverse effect on our business, financial condition, and results of operations.
Litigation and regulatory investigations aimed at us or resulting from actions of our predecessor may result in significant financial losses and harm to our reputation.
We face risk of litigation, regulatory investigations, and similar actions in the ordinary course of our business, including the risk of lawsuits and other legal actions relating to breaches of contractual obligations or tortious claims from customers or other third parties, fines, penalties, interest, or other damages as a result of erroneous transactions, breach of data privacy laws, or lawsuits and legal actions related to our predecessors. Any such action may include claims for substantial or unspecified compensatory damages, as well as civil, regulatory, or criminal proceedings against our directors, officers, or employees; and the probability and amount of liability, if any, may remain unknown for significant periods of time. We may be also subject to various regulatory inquiries, such as information requests, and book and records examinations, from regulators and other authorities in the geographical markets in which we operate. A substantial liability arising from a lawsuit judgment or settlement or a significant regulatory action against us or a disruption in our business arising from adverse adjudications in proceedings against our directors, officers, or employees could have a material adverse effect on our business, financial condition, and results or operations.
Additionally, we are subject to claims and investigations as a result of our predecessor, Control Data Corporation (“CDC”), Ceridian Corporation, and other former entities for whom we are successor-in-interest with respect to assumed liabilities. For example, in September 1989, CDC became party to an environmental matters agreement with Seagate Technology plc (“Seagate”) related to groundwater contamination on a parcel of real estate in Omaha, Nebraska sold by CDC to Seagate. In February 1988, CDC entered into an arrangement with Northern Engraving Corporation and the Minnesota Pollution Control Agency in relation to groundwater contamination at a site in Spring Grove, Minnesota. In August 2017, we received notice of a mesothelioma claim related to CDC. Although we are fully reserved for the groundwater contamination liabilities, we cannot at this time accurately assess the merits of these claims, and we cannot be certain if additional liabilities related to such predecessor companies will surface. Moreover, even if we ultimately prevail in or settle any litigation, regulatory action, or investigation, we could suffer significant harm to our reputation, which could materially affect our ability to attract new customers, to retain current customers, and to recruit and to retain employees, which could have a material adverse effect on our business, financial condition, and results of operations.
We may be sued by third parties for alleged infringement of their proprietary rights.rights which could have a material adverse effect on our business.
There is considerable patent and other intellectual property development activity in our industry. Our success depends uponThird parties, including our not infringing upon the intellectual property rights of others. Our competitors, as well as a number of other entities and individuals, including parties commonly referred to as “patent trolls,” may own or claim to own intellectual property relating to our industry. From time to time, third partiesservice offerings and may claim that we are infringing upon their intellectual property rights. Additionally, as we expand our use of AI, there is uncertainty regarding intellectual property ownership and license rights of AI algorithms and content generated by AI, and we may become subject to similar claims of infringement. We may be found to be infringing upon such rights. In the future, others may claim that our applications and underlying technology infringe or violaterights, even if we are unaware of their intellectual property rights. However, we may be unaware of the intellectual property rights that others may claim cover some or all of our technology or services. Any claims or litigation could cause us to incur significant expenses and, if successfully asserted against us or if we decide to settle, could require that we pay substantial damages or ongoing royalty payments, obtain licenses, modify applications, prevent us from offering our services, or require that we comply with other unfavorable terms. We contractually agree to indemnify our customers with respect to claims of intellectual property infringement relating to our products, and may also be obligated to indemnify our customers, vendors, or business partners or to pay substantial settlement costs, including royalty payments, in connection with any such claim or litigation, and to obtain licenses, to modify applications, or to refund fees, which could be costly.litigation. Even if we were to prevail in such a dispute, any litigation regarding our intellectual property could be costly and time-consuming and divert the attentiontime consuming.
The use of our management and key personnel from our business operations. Any such events could have a material adverse effect on our business, financial condition, and results of operations.
Some of our applications utilize open source software in our applications may expose us to additional risks and any failure to comply with the terms of one or more of these open source licenses could have a material adverse effect onharm our business, financial condition, and results of operations.intellectual property rights.
Some of our applications include software covered by open source licenses, which may include, by waylicenses. From time to time, there have been claims challenging the ownership of example, GNU General Public License and the Apache License.open source software against companies that incorporate such software into their products or applications. The terms of various open source licenses have not been interpreted by U.S. courts, and there is a risk that such licenses could be construed in a manner that imposes unanticipated conditions or restrictions on our ability to market our applications. By the terms of certain open source licenses, we could be required to release the source code of our proprietary software and to make our proprietary software available under open source licenses if we combine our proprietary software with open source software in a certain manner. In the event that portions of our proprietary software are determined to be subject to an open source license, we could be required to publicly release the affected portions of our source code, to re-engineer all or a portion of our technologies, or otherwise to be limited in the licensing of our technologies, each of which could reduce or eliminate the value of our technologies and services. Some open source software may include AI capabilities or other software that incorporates or relies on AI, or may have been created, in whole or in part, by AI. The use of such software may expose us to risks as the intellectual property ownership and license rights, including copyright, of AI software and tools, has not been fully interpreted by courts or been fully addressed by regulation. In addition to risks related to license requirements, usage of open source software can lead to greater risks than use of third party commercial software, as open source licensors generally do not provide warranties or controls on the origin of the software. Many of the risks associated with usage of open source software cannot be eliminated and could have a material adverse effect on our business, financial condition, and results of operations.
We employ third party software for use inThe implementation of new accounting systems or with both our applications and our internal operations, and the inability to maintain these licenses or errors in the software we license could result in increased costs, or reduced service levels, which could have a material adverse effect oninterfere with our business financial condition, and resultsoperations.
The implementation of operations.
Our applications, including Dayforce, incorporate certain third party software obtained under licenses from other companies. Additionally, we are reliant on third party software licenses for our internal operational applications. We anticipate that we will continue to rely on such third party softwarenew systems and development tools from third parties in the future. Although we believe that there are commercially reasonable alternatives to the third party software we currently license, this may not always be the case, or itenhancements may be difficultdisruptive to our business and can be time-consuming and divert management’s attention. Any disruptions relating to our systems or costly to replace, and our failure to migrate off end of life software may significantly impact our customer’s ability to operate. In addition, integration of the software used in our applications and inany problems with implementation, particularly any disruptions impacting our operations with new third party software may require significant work and require substantial investment of our time and resources. Also, our use of additional or alternative third party software would require us to enter into license agreements with third parties.
Additionally, if the quality of our third party software declines, the overall quality of our products may be negatively impacted. To the extent that our applications depend upon the successful operation of third party software in conjunction with our software, any undetected errors or defects in this third party software could prevent the deployment or impair the functionality of our applications, delay new application introductions, and result in a failure of our applications, which could have a material adverse effect on our business, financial condition, and results of operations.
Changes in laws and regulations related to the Internet or changes in the Internet infrastructure itself may diminish the demand for our applications, and could have a material adverse effect on our business, financial condition, and results of operations.
The future success of our business depends upon the continued use of the Internet as a primary medium for commerce, communication, and business applications. Federal, state or foreign government bodies or agencies have in the past adopted, and may in the future adopt, laws or regulations affecting the use of the Internet as a commercial medium. Changes in these laws or regulations could require us to modify our applications in order to comply with these changes. In addition, government agencies or private organizations may begin to impose taxes, fees, or other charges for accessing the Internet or commerce conducted via the Internet. These laws or charges could limit the growth of Internet-related commerce or communications generally, resulting in reductions in the demand for Internet-based applications such as ours, any of which could have a material adverse effect on our business, financial condition, and results of operations.
In addition, the use of the Internet as a business tool could be adversely affected due to delays in the development or adoption of new standards and protocols to handle increased demands of Internet activity, security, reliability, cost, ease of use, accessibility, and quality of service. The performance of the Internet and its acceptance as a business tool has been adversely affected by “viruses,” “worms,” and similar malicious programs, and the Internet has experienced a variety of outages and other delays as a result of damage to portions of its infrastructure. If the use of the Internet is adversely affected by these issues, demand for our applications could suffer, which could have a material adverse effect on our business, financial condition, and results of operations.
We may pay employees and taxing authorities amounts due for a payroll period before a customer’s electronic funds transfers are settled with finality to our trust account, or make erroneous payments to employees, taxing authorities, or other entities. If customer payments are rejected by banking institutions or otherwise fail to clear into our trust accounts, or erroneous payments are not quickly resolved, we may require additional sources of short-term liquidity which could have a material adverse effect on our business, financial condition, and results of operations.
Our payroll processing business involves the movement of significant funds from the account of a customer to employees and relevant taxing authorities. We debit a customer’s account prior to any disbursement on its behalf. Under certain circumstances, funds previously credited to our trust account could be reversed after our payment of amounts due to employees and taxing and other regulatory authorities. There is, therefore, a risk that the employer’s funds will be insufficient to cover the amounts we have already paid on its behalf. While such funding shortage or erroneous payments and accompanying financial exposure has only occurred in limited instances in the past, should customers default on their payment obligations in the future or erroneous payment recovery be unsuccessful, we might be required to advance substantial amounts of funds to cover such obligations. In such an event, we may be required to seek additional sources of short-term liquidity, which may not be available on reasonable terms, which could have a material adverse effect on our business, financial condition, and results of operations. Further, should a customer whose funds are reversed subsequently have financial difficulty, collection of the funds advanced by us on its behalf may be difficult.
Customer funds that we hold in trust are subject to market, interest rate, credit, and liquidity risks. The loss of these funds could have a material adverse effect on our business, financial condition, and results of operations.
We invest funds held in trust for our customers in liquid, investment-grade marketable securities, money market securities, and other cash equivalents. Nevertheless, our customer fund assets are subject to general market, interest rate, credit, and liquidity risks. These risks may be exacerbated, individually or in unison, during periods of unusual financial market volatility. In the event of a global financial crisis, such as that experienced in 2008, we could be faced with a severe constriction of the availability of liquidity, which could impact our ability to fund payrolls. Any loss of or inability to access customer funds could have an adverse impact on our cash position and results of operations and could require us to obtain additional sources of liquidity, and could have a material adverse effect on our business, financial condition, and results of operations.
If we are required to collect sales and use taxes in additional jurisdictions, we might be subject to liability for past sales, and our future sales may decrease. Adverse tax laws or regulations could be enacted or existing laws could be applied to us or our customers, which could increase the costs of our services and otherwise have a material adverse effect on our business, financial condition, and results of operations.
The application of federal, state, and local tax laws to services provided electronically is evolving. New income, sales, use, or other tax laws, statutes, rules, regulations, or ordinances could be enacted at any time (possibly with retroactive effect), and could be applied solely or disproportionately to services provided over the Internet. These enactments could adversely affect our sales activity due to the inherent cost increase the taxes would represent and ultimately have a material adverse effect on our results of operations and cash flows.
In addition, existing tax laws, statutes, rules, regulations, or ordinances could be interpreted, changed, modified, or applied adversely to us (possibly with retroactive effect), which could require us or our customers to pay additional tax amounts, as well as require us or our customers to pay fines or penalties and interest for past amounts.
For example, we might lose sales or incur significant expenses if states successfully impose broader guidelines on state sales and use taxes. A successful assertion by one or more states requiring us to collect sales or other taxes on the licensing of our software or provision of our services could result in substantial tax liabilities for past transactions and otherwise harm our business. Each state has different rules and regulations governing sales and use taxes, and these rules and regulations are subject to varying interpretations that change over time. We review these rules and regulations periodically and, when we believe we are subject to sales and use taxes in a particular state, we may voluntarily engage state tax authorities in order to determine how to comply with that state’s rules and regulations. There is no guarantee that we will not be subject to sales and use taxes or related penalties for past sales in states where we currently believe no such taxes are required.
Vendors of services, like us, are typically held responsible by taxing authorities for the collection and payment of any applicable sales and similar taxes. If one or more taxing authorities determines that taxes should have, but have not, been paid with respect to our services, we might be liable for past taxes in addition to taxes going forward. Liability for past taxes might also include substantial interest and penalty charges. Our customers are typically wholly responsible for applicable sales and similar taxes. Nevertheless, customers might be reluctant to pay back taxes and might refuse responsibility for interest or penalties associated with those taxes. If we are required to collect and to pay back taxes and the associated interest and penalties, and if our customers fail or refuse to reimburse us for all or a portion of these amounts, we will incur unplanned expenses that may be substantial. Moreover, imposition of such taxes on us going forward will effectively increase the cost of our software and services to our customers and might adversely affect our ability to retain existing customers or to gain new customers in the areas in which such taxes are imposed.
We have underfunded pension plan liabilities. We will require current and future operating cash flow to fund these shortfalls. We have no assurance that we will generate sufficient cash flow to satisfy these obligations.
We maintain defined benefit pension plans covering employees who meet age and service requirements. While our U.S. pension plans have been closed and frozen, our net pension liability and cost is materially affected by the discount rate used to measure pension obligations, the longevity and actuarial profile of our plan participants, the level of plan assets available to fund those obligations, and the actual and expected long-term rate of return on plan assets. Significant changes in investment performance or a change in the portfolio mix of invested assets can result in corresponding increases and decreases in the valuation of plan assets, particularly equity securities, or in a change in the expected rate of return on plan assets. Assets available to fund the pension and other postemployment benefit obligations of our plans, as of December 31, 2018, were approximately $381.6 million, or approximately $162.6 million less than the measured pension and post-retirement benefit obligation on a GAAP basis. In addition, any changes in the discount rate could result in a significant increase or reduction in the valuation of pension obligations, affecting the reported funded status of our pension plans as well as the net periodic pension cost in the following years. Similarly, changes in the expected return on plan assets can result in significant changes in the net periodic pension cost in the following years.
Our failure to maintain effective internal control over financial reporting in accordance with Section 404 of the Sarbanes-Oxley Act could have a material adverse effect on our business, financial condition, and results of operations.
We are required, pursuant to Section 404 of the Sarbanes-Oxley Act of 2002, as amended, to furnish a report by management on, among other things, the effectiveness of our internal control over financial reporting for the first fiscal year beginning after the effective date of our IPO and in each year thereafter. Our auditors will also need to attest to the effectiveness of our internal control over financial reporting in the future to the extent we are no longer an emerging growth company, as defined by the JOBS Act, and are not a smaller reporting company. In 2017, we identified a material weakness related to our assessment of valuation allowance and classification of deferred tax liabilities associated with intangible assets for 2016 and prior periods. We remediated the material weakness and did not have a material weakness in connection with the 2017 audit; however, we cannot guarantee that we will not have additional material weaknesses in the future. If we are unable to maintain adequate internal control over financial reporting or if we identify additional material weaknesses in our internal control over financial reporting, we may be unable toaccurately report our financial information accuratelyperformance on a timely basis, may suffer adverse regulatory consequences or violations of applicable stock exchange listing rules, may breach the covenants under our credit facilities,could materially and incur additional costs. There could also be a negative reaction in the financial markets due to a loss of investor confidence in us and the reliability of our financial statements, which could have a material adverse effect onadversely affect our business financial condition, and results of operations.
We have and will continue to incur increased costs and obligations as a result of being a public company.
As a publicly traded company, we have incurred and will continue to incur additional legal, accounting and other expenses that we were not required to incur in the past, and will incur additional expenses after we cease to be an emerging growth company (to the extent that we take advantage of certain exceptions from reporting requirements that are available under the JOBS Act as an emerging growth company). We are required to file with the SEC annual and quarterly information and other reports that are specified in Section 13 of the Exchange Act. We also are subject to other reporting and corporate governance requirements, including the requirements of the New York Stock Exchange (the “NYSE”), the Toronto Stock Exchange (the “TSX”), and certain provisions of the Sarbanes-Oxley Act, and the regulations promulgated thereunder, which will impose additional compliance obligations upon us. Among other things, as a public company:
we prepare and distribute periodic public reports and other stockholder communications in compliance with our obligations under the federal securities laws and applicable stock exchange rules;
the roles and duties of our Board and committees of the Board are expanded;
we manage enhanced investor relations function; and
we involve and retain to a greater degree outside counsel and accountants in the activities listed above.
These changes require a commitment of additional resources, and many of our competitors already comply with these obligations. We may not be successful in implementing these requirements, and the commitment of resources required for implementing them could have a material adverse effect on our business, financial condition, and results of operations.
The changes necessitated by becoming a public company require a significant commitment of resources and management oversight that has increased and may continue to increase our costs and could place a strain on our systems and resources. As a result, our management’s attention might be diverted from other business concerns. If we are unable to offset these costs through other savings, then it could have a material adverse effect on our business, financial condition, and results of operations.
We are an “emerging growth company” and have elected and may elect to continue to comply with certain of the reduced reporting requirements applicable to emerging growth companies, which could make our common stock less attractive to investors.
We are an emerging growth company, and we may take advantage of certain exemptions from various reporting requirements that are applicable to other public companies that are not emerging growth companies, including, but not limited to: exemption from compliance with the auditor attestation requirements of Section 404 of Sarbanes-Oxley Act, reduced disclosure obligations regarding executive compensation in our periodic reports and proxy statements, and exemptions from the requirements of holding a nonbinding advisory vote on executive compensation, and stockholder approval of any golden parachute payments not previously approved. In addition, even if we comply with the greater obligations of public companies that are not emerging growth companies, we may avail ourselves of the reduced requirements applicable to emerging growth companies from time to time in the future. We cannot predict if investors will find our common stock less attractive if we choose to continue to rely on these exemptions. If some investors find our common stock less attractive as a result, there may be a less active trading market for our common stock and our stock price may be more volatile.
We will remain an emerging growth company until December 31, 2023, or until the earliest of (i) the last day of the first fiscal year in which our annual gross revenue exceeds $1.07 billion, (ii) the date that we become a “large accelerated filer” as defined in Rule 12b-2 under the Exchange Act, which would occur if the market value of our common stock that is held by non-affiliates exceeds $700.0 million as of the last business day of our most recently completed second fiscal quarter, or (iii) the date on which we have issued more than $1.0 billion in non-convertible debt during the preceding three-year period, whether or not issued in a registered offering.
We may not be able to utilize a significant portion of our net operating loss or research tax credit carryforwards, which could have a material adverse effect on our financial condition and results of operations.
As of December 31, 2018, we had federal and state net operating loss carryforwards due to prior period losses, which, if not utilized, will begin to expire in 2031 and 2019 for federal and state purposes, respectively. These net operating loss carryforwards could expire unused and be unavailable to offset future income tax liabilities, which could have a material adverse effect on our financial condition and results of operations.
In addition, under Section 382 of the Internal Revenue Code of 1986, as amended (the “Code”), our ability to utilize net operating loss carryforwards or other tax attributes in any taxable year may be limited if we experience an “ownership change.” A Section 382 “ownership change” generally occurs if one or more stockholders or groups of stockholders who own at least 5% of our stock increase their ownership by more than 50 percentage points over their lowest ownership percentage within a rolling three-year period. Similar rules may apply under state tax laws. Future issuances of our stock could cause an “ownership change.” It is possible that an ownership change, or any future ownership change, could have a material effect on the use of our net operating loss carryforwards or other tax attributes, which could have a material adverse effect on our results of operations and profitability.
Changes in generally accepted accounting principles in the United States could have a material adverse effect on our previously reported results of operations.
Generally accepted accounting principles in the United States are subject to interpretation by the Financial Accounting Standards Board (the “FASB”), the SEC, and various bodies formed to promulgate and to interpret appropriate accounting principles. A change in these principles or interpretations could have a significant effect on our previously reported results of operations and could affect the reporting of transactions completed before the announcement of a change.
In May 2014, the FASB issued new revenue recognition guidance under Accounting Standards Update (“ASU”) No. 2014-09, “Revenue from Contracts with Customers,” which is effective for our interim and annual periods beginning after December 31, 2017. Under this new guidance, revenue is recognized when promised goods or services are transferred to customers in an amount that reflects the consideration that is expected to be received for those goods or services. The new guidance also requires additional disclosure about the nature, amount, timing, and uncertainty of revenue that is recognized. In order to be able to comply with the requirements of ASU 2014-09 beginning in the first quarter of 2019, we need to update and to enhance our internal accounting systems, processes, and our internal controls over financial reporting. This has required, and will continue to require, additional investments by us, and may require incremental resources and system configurations that could increase our operating costs in future periods. If we are not able to properly implement ASU 2014-09 in a timely manner, the revenue that we recognize and the related disclosures that we provide under ASU 2014-09 may not be complete or accurate, and we could fail to meet our financial reporting obligations in a timely manner. We have completed our evaluation and implementation plan for adoption of this new guidance, and will be adopting the new standard effective first quarter of 2019.
Risks Related to Our Indebtedness
We are a holding company and rely on dividends, distributions, and other payments, advances, and transfers20 | 2023 Form 10-K
Table of funds from our subsidiaries to meet our obligations.Contents
We are a holding company that does not conduct any business operations of our own. As a result, we are largely dependent upon cash transfers in the form of intercompany loans and receivables from our subsidiaries to meet our obligations. The deterioration of the earnings from, or other available assets of, our subsidiaries for any reason also could limit or impair their ability to pay dividends or other distributions to us.
Our outstanding indebtedness could have a material adverse effect on our financial condition and our ability to operate our business, and we may not be able to generate sufficient cash flows to meet our debt service obligations.
Our outstanding indebtedness as of December 31, 2018 consisted of (i) aobligations under the Senior Term Loan in the original principal amount of $680.0 million and (ii) a $300.0 million committed Revolving Facility. The SeniorSecured Credit FacilitiesFacility are secured by first priority security interests in substantially by all of our assets. The Senior Term Loan has a maturity date of April 30, 2025,assets and the Revolving Facility has a maturity date of April 30, 2023. As of December 31, 2018, we had $678.3 million outstanding principal under our Senior Term Loandomestic subsidiary guarantors, subject to permitted liens and no principal outstanding under our Revolving Facility.
certain exceptions. Our outstanding indebtedness and any additional indebtedness we incur may have important consequences for us, including, without limitation, that:
we may be required to use a substantial portion of our cash flow to pay the principal of and interest on our indebtedness;
our indebtedness and leverage may increase our vulnerability to adverse changes in general economic and industry conditions, as well as to competitive pressures;
our ability to obtain additional financing for working capital, capital expenditures, acquisitions and for general corporate and other purposes may be limited;
our indebtedness may expose us to the risk of increased interest rates because certain of our borrowings, including and most significantly our borrowings under our Senior Secured Credit Facilities,Facility, are at variable rates of interest;
our indebtedness may prevent us from taking advantage of business opportunities as they arise or successfully carrying out our plans to expand our business; and
our flexibility in planning for, or reacting to, changes in our business and our industry may be limited.
Under the terms of the agreements governing our Senior Credit Facilities,debt facilities, we are required to comply with specified operating covenants and, under certain circumstances, a financial covenant applicable to the Revolving Credit Facility, which may limit our ability to operate our business as we otherwise might operate it. For example, the obligations under the Senior Credit Facilities may be accelerated upon the occurrence of an event of default, including, without limitation, payment defaults, cross-defaults to certain material indebtedness, covenant defaults, material inaccuracy of representations and warranties, bankruptcy events, material judgments, material defects with respect to guarantees and collateral, and change of control. If not cured, an event of default under our Senior Secured Credit Facility could result in any amounts outstanding, including any accrued interest and unpaid fees, becoming immediately due and payable, which would require us, among other things, to seek additional financing in the debt or equity markets, to refinance or restructure all or a portion of our indebtedness, to sell selected assets, and/or to reduce or to delay planned capital or operating expenditures. Such measures might not be sufficient to enable us to service our debt, and any such financing or refinancing might not be available on economically favorable terms or at all. If we are not able to generate sufficient cash flows to meet our debt service obligations or are forced to take additional measures to be able to service our indebtedness, it could have a material adverse effect on our business, financial condition, and results of operations.
Despite our substantial indebtedness, weAspects of the Capped Calls may not operate as planned and may affect the value of the Convertible Senior Notes and our subsidiaries may still be able to incur substantially more debt. This could further exacerbate the risks associated with our substantial leverage.
We may incur substantial additional indebtedness in the future. Although the agreements governing our Senior Credit Facilities contain restrictions on the incurrence of additional indebtedness, these restrictionscommon stock, and we are subject to counterparty credit risk with respect to the Capped Calls.
In connection with the pricing of the Convertible Senior Notes, we entered into the Capped Calls. Please refer to Part II, Item 8, Note 9, "Debt" for additional information. The Capped Calls are expected generally to reduce the potential dilution to our common stock upon any conversion of the Convertible Senior Notes and/or offset any potential cash payments we are required to make in excess of the principal amount of converted Convertible Senior Notes, as the case may be, with such reduction and/or offset subject to a cap. The Capped Calls are complex transactions that are not part of the terms of the Convertible Senior Notes and may not operate as planned. If the Capped Calls do not operate as we intend, it may have an effect on the price of the Convertible Senior Notes or our common stock.
The option counterparties or their respective affiliates may modify their hedge positions by entering into or unwinding various derivatives with respect to our common stock and/or purchasing or selling our common stock or other securities of ours in secondary market transactions following any conversion of the Convertible Senior Notes, any repurchase of the Convertible Senior Notes by us on any fundamental change repurchase date, any redemption date, or any other date on which the Convertible Senior Notes are retired by us, in each case if we exercise our option to terminate the relevant portion of the Capped Calls. This activity could cause or avoid an increase or a decrease in the market price of our common stock or the Convertible Senior Notes, which could affect the ability of a noteholder to convert the Convertible Senior Notes and, to the extent the activity occurs during any observation period related to a conversion of Convertible Senior Notes, could affect the number of qualificationsshares of common stock, if any, and exceptions,value of the consideration that a noteholder will receive upon conversion of the Convertible Senior Notes. If any such Capped Call fails to become effective, the option counterparties or their respective affiliates may unwind their hedge positions with respect to our common stock, which could adversely affect the value of our common stock and the indebtednessvalue of the Convertible Senior Notes. The option counterparties are financial institutions, and we can incur in compliance with these restrictions could be substantial. For example, pursuantare subject to incremental facilitiesthe risk that they might default under the Senior Credit Facilities,Capped Calls. Our exposure to the credit risk of the option counterparties is not secured by any collateral. If an option counterparty becomes subject to insolvency proceedings, we will become an unsecured creditor in those proceedings with a claim equal to our exposure at that time under our transactions with that option counterparty. Our exposure will depend on many factors, but, generally, the increase
21 | 2023 Form 10-K
in our exposure will be correlated with increases in the market price or the volatility of our common stock. In addition, upon a default by an option counterparty, we may incur upsuffer adverse tax consequences and more dilution than we currently anticipate with respect to (i)our common stock. We can provide no assurances as to the financial stability or viability of any option counterparty.
Conversion of our Convertible Senior Notes issued under the Indenture may adversely affect our financial condition and results of operations.
Under certain circumstances, noteholders may convert their Convertible Senior Notes at their option prior to the scheduled maturities. Upon conversion of the Convertible Senior Notes, we will be obligated to make cash payments in an aggregate amount no less than the principal amount being converted, and any excess of the conversion value over the principal amount will be settled, at the Company’s election, in cash or shares of the Company’s common stock. In addition, noteholders will have the right to require us to repurchase their Convertible Senior Notes upon the occurrence of a fundamental change at a repurchase price equal to the greater of (x) $125.0 million and (y) 100% of EBITDAthe principal amount of the Convertible Senior Notes to be repurchased, plus accrued and unpaid interest, if any, to, but not including, the fundamental change repurchase date (as defined in the agreements governingIndenture). There is a risk that we may not have enough available cash or be able to obtain financing at the time we are required to make repurchases of Convertible Senior Credit Facilities)Notes surrendered therefor or Convertible Senior Notes being converted. Our failure to repurchase Convertible Senior Notes when the Indenture requires the repurchase or to pay any cash payable on future conversions of additional securedthe Convertible Senior Notes as required by the Indenture would constitute a default under the Indenture. A default under the Indenture or unsecured debt plus (ii) an unlimited additional amount of secured or unsecured debt, subjectthe fundamental change itself could also lead to compliance with certain leverage-based tests, as described in thea default under agreements governing our Senior Credit Facilities.future indebtedness. If we incur additional debt, the risks associated with our substantial leverage would increase.
Restrictive covenants in the agreements governing our Senior Credit Facilities may restrict our ability to pursue our business strategies.
The agreements governing our Senior Credit Facilities contain a number of restrictive covenants that impose significant operating and financial restrictions on us, and may limit our ability to engage in acts that may be in our long-term best interests. These include covenants restricting, among other things, our (and our subsidiaries’) ability:
to incur additional indebtedness or other contingent obligations;
to grant liens;
to enter into burdensome agreements with negative pledge clauses or restrictions on subsidiary distributions;
to pay dividends or make other distributions in respect of equity;
to make payments in respect of subordinated debt;
to make investments, including acquisitions, loans, and advances;
to consolidate, to merge, to liquidate, or to dissolve;
to sell, to transfer, or to otherwise dispose of assets;
to engage in transactions with affiliates;
to materially alter the business that we conduct; and
to amend or to otherwise change the termsrepayment of the documentation governing certain restricted debt.
The agreements governing Senior Credit Facilities contains a financial covenant applicable onlyrelated indebtedness were to the Revolving Facility, which requires that we maintain a ratio of consolidated first lien debt to EBITDA (with certain adjustments as set forth in the agreements governing our Senior Credit Facilities) below a specified level on a quarterly basis. However, such requirement is applicable at the end of a fiscal quarter only if more than 35% of the Revolving Facility (with an exclusion for certain letters of credit) is drawn at the end of such fiscal quarter. Our ability to meet that financial ratio can be affected by events beyond our control, and we cannot assure you that we will be able to meet that ratio. The covenant did not apply as of December 31, 2018, but there can be no assurance that we will be in compliance with such covenant in the future. A breach of any covenant or restriction contained in the agreements governing our Senior Credit Facilities could result in a default under those agreements. If any such default occurs, a majority of the lenders under the Senior Credit Facilities (or, in the case of the financial covenant described above, a majority of the lenders under the Revolving Facility), may elect (after the expiration ofaccelerated after any applicable notice or grace periods)periods, we may not have sufficient funds to declarerepay the indebtedness and repurchase the Convertible Senior Notes or make cash payments upon conversions thereof. In addition, even if noteholders do not elect to convert their Convertible Senior Notes, we could be required under applicable accounting rules to reclassify all outstanding borrowings, together with accrued and unpaid interest and other amounts payable thereunder, to be immediately due and payable. The lenders under the Senior Term Loan and Revolving Facility also have the right upon an event of default thereunder to terminate any commitments they have to provide further borrowings. Further, following an event of default under the agreements governing our Senior Credit Facilities, the administrative agent, on behalfor a portion of the secured parties underoutstanding principal of the Convertible Senior Credit Facilities, will have the right to proceed against the collateral granted to them to secure that debt. If the debt under the Senior Term Loan or Revolving Facility was to be accelerated, our assets may not be sufficient to repay in full that debt or any other debt that may become dueNotes as a result of that acceleration.
In the future, we may be dependent upon our lenders for financing to execute our business strategy and to meet our liquidity needs. If our lenders are unable to fund borrowings under their credit commitments or we are unable to borrow, it could have a material adverse effect on our business, financial condition, and results of operations.
During periods of volatile credit markets, there is risk that lenders, even those with strong balance sheets and sound lending practices, could fail or refuse to honor their legal commitments and obligations under existing credit commitments, including but not limited to, extending credit up to the maximum amount permitted by the Revolving Facility. If our lenders are unable to fund borrowings under their revolving credit commitments or we are unable to borrow, it could be difficult to obtain sufficient funding to execute our business strategy or to meet our liquidity needs,current, rather than long-term, liability, which could have a material adverse effect on our business, financial condition, and results of operations.
Our debt may be downgraded, which could have a material adverse effect on our business, financial condition, and results of operations.
A reduction in the ratings that rating agencies assign to our short and long-term debt may negatively impact our access to the debt capital markets and increase our cost of borrowing, which could have a material adverse effect on our business, financial condition, and results of operations.
Volatility and weakness in bank and capital markets may adversely affect credit availability and related financing costs for us.
Banking and capital markets can experience periods of volatility and disruption. If the disruption in these markets is prolonged, our ability to refinance, and the related cost of refinancing, some or all of our debt could be adversely affected. Although we currently can access the bank and capital markets, there is no assurance that such markets will continue to be a reliable source of financing for us. These factors, including the tightening of credit markets, could adversely affect our ability to obtain cost-effective financing. Increased volatility and disruptions in the financial markets also could make it more difficult and more expensive for us to refinance outstanding indebtedness and to obtain financing. In addition, the adoption of new statutes and regulations, the implementation of recently enacted laws, or new interpretations or the enforcement of older laws and regulations applicable to the financial markets or the financial services industry couldwould result in a reduction in the amount of available credit or an increase in the cost of credit. Disruptions in the financial markets can also adversely affect our lenders, insurers, customers, and other counterparties. Any of these results could have a material adverse effect on our business, financial condition, and results of operations.
The interest ratesreduction of our term loans are priced using a spread over LIBOR.net working capital.
LIBOR, the London interbank offered rate, is the basic rate of interest used in lending between banks on the London interbank market and is widely used as a reference for setting the interest rate on loans globally. We typically use LIBOR as a reference rate in the term loans and revolving loans made under our credit facilities such that the interest due to our creditors pursuant to a term loan or revolving loan extended to us under our credit facilities is calculated using the LIBOR rate plus an applicable spread above LIBOR.
On July 27, 2017, the United Kingdom’s Financial Conduct Authority, which regulates LIBOR, announced that it intends to phase out LIBOR by the end of 2021. It is unclear whether or not LIBOR will cease to exist at that time or if new methods of calculating LIBOR will be established such that it continues to exist after 2021. If LIBOR ceases to be available, we are entitled to negotiate with the administrative agent under our credit facilities to amend the governing credit agreement to establish a successor benchmark rate that is generally accepted by the syndicated loan market for loans denominated in U.S. Dollars. If lenders holding more than a majority of the loans and commitments under our credit facilities have not objected to the proposed successor benchmark rate within five business days following the date on which the related amendment is posted for review by the lenders, the amendment will be deemed to have been approved by the lenders and may become effective. At this time, due to a lack of consensus as to what rate or rates may become accepted alternatives to LIBOR, it is impossible to predict the effect of any such alternatives on our liquidity, interest expense, or the value of the term loans or revolving loans.
Risks Related to Ownership of Our Common Stock
The price of our common stock may be volatile, and investors may lose all or part of their investment.
Securities markets worldwide have experienced in the past, and are likely to experience in the future, significantThe market price and volume fluctuations. This market volatility, as well as general economic, market, or political conditions could reduce the market price of our common stock regardlesstrading has experienced, and may continue to experience, wide fluctuations and volatility. Factors that may impact our performance and market price include those discussed elsewhere in this “Risk Factors” section of this Annual Report on Form 10-K and others such as: market factors such as economic recession or monetary policy actions by central banking authorities, announcement or filing with the SEC by us or our resultscompetitors of operations. The trading price of our common stock is likely to be highly volatile and could be subject to wide price fluctuations in response to various factors, including, among other things, the risk factors described herein and other factors beyond our control. Factors affecting the trading price of our common stock could include:
market conditions in the broader stock market;
actualacquisitions, business plans or anticipated variationscommercial relationships as well as new services; any major change in our quarterly resultssenior management or board of operations;
developments in our industry in general;
variations in operating results of similar companies;
introduction of new services by us, our competitors, or our customers;
issuance of new, negative, or changed securities analysts’ reports or recommendations or estimates;
investor perceptions of us and the industries in which we or our customers operate;
directors; sales, or anticipated sales, of our stock, including sales by our officers, directors, and significant stockholders;
additions issuance of new, negative, or departures of key personnel;
regulatory or political developments;
the public’s response to press releases or other public announcements by us or third parties, including our filings with the SEC;
announcements, mediachanged securities analysts’ reports or other public forum comments related to litigation, claimsrecommendations or reputational charges against us;
guidance, if any, that we provide to the public, any changes in this guidance, or our failure to meet this guidance;
the development and sustainability of an active trading market for our common stock;
estimates; investor perceptions of us and the investment opportunity associated withindustries in which we or our common stock relative to other investment alternatives;
|
|
changes in accounting principles;
share-based compensation expense under applicable accounting standards;
customers operate; and threatened or actual litigation and governmental investigations; andinvestigations.
changing economic conditions.
These and other factors may cause the market price and demand for shares of our common stock to fluctuate substantially, which may limit or prevent investors from readily selling their shares of common stock and may otherwise negatively affect the liquidity of our common stock. In addition, securities class action litigation has often been instituted against companies following periods of volatility in the past, whenoverall market and in the market price of a stock has been volatile, holders of that stock sometimes have instituted securities class action litigation against the company that issued the stock.company’s securities. Securities litigation against us, regardless of the merits or outcome, could result in substantial costs, damage to our reputation, and divert the time and attention of our management from our business, which could have a material adverse effect on our business, financial condition, and results of operations.
Future salesThe issuance of additional stock, including common stock issued upon conversion of our Convertible Senior Notes, will dilute all other stockholders.
The issuance of additional stock in connection with acquisitions, financings, our equity incentive plans, our Convertible Senior Notes, or otherwise will dilute all other stockholders. Our restated certificate of incorporation authorizes us to issue up to five hundred million shares of common stock and up to ten million shares of preferred stock with such rights and preferences as may be determined by our board of directors. Subject to compliance with applicable rules and regulations, we may issue all of these shares that are not already outstanding without any action or the perceptionapproval by our stockholders. We intend to continue to evaluate strategic acquisitions or opportunities in the public markets that these salesfuture. We may occur, could causepay for such acquisitions or opportunities, in part or in full, through the market price for our common stockissuance of additional equity securities. Further, the conversion of some or all of the Convertible Senior Notes will dilute the ownership interests of existing stockholders to decline.
As of February 25, 2019, there were 140,514,889the extent we deliver shares of our common stock outstanding. Additionally, asupon conversion of December 31, 2018, we also have 28,672,211 registered shares of common stock reserved for issuance under our equity incentive plans of which options to purchase 13,916,146 shares of common stock and 664,073 restricted stock units representing 14,580,219 shares of common stock are outstanding. We cannot predict the effect, if any that market sales of shares of our common stock or the availability of shares of our common stock for sale will have on the market price of our common stock prevailing from time to time. Sales of substantial amounts of shares of our common stock in the public market, or the perception that those sales will occur, could cause the market price of our common stock to decline. Of the 139,453,710 shares of common stock outstanding, 96,441,093 shares are restricted securities within the meaning of Rule 144 under the Securities Act and subject to certain restrictions on resale. Restricted securities may be sold in the public market only if they are registered under the Securities Act, or are sold pursuant to an exemption from registration such as Rule 144 or Rule 701. We have granted customary demand and piggyback registration rights to the Sponsors and certain of our other stockholders party to the registration rights agreement with us. Should the Sponsors or any other stockholders further exercise their registration rights, the shares registered would no longer be restricted securities and would be freely tradable in the open market.
Cannae holds approximately 23.3% of our outstanding common stock as of February 25, 2019. On November 7, 2018, Cannae announced that one of its subsidiaries had entered into a three-year margin loan pursuant to which it could borrow up to $300.0 million. The margin loan is guaranteed by Cannae for a period of up to one year and is further secured by a pledge of 25.0 million shares of our common stock beneficially owned by Cannae. The loan requires that a certain loan to value ratio (based on the value of the sharesConvertible Senior Notes.
22 | 2023 Form 10-K
Claims for indemnification by our directors and officers may reduce our available funds to satisfy successful third party claims against us and may reduce the amount of money available to us.
Our third amended and restated certificate of incorporation and amended and restated bylaws provide that we will indemnify our directors and officers, in each case, to the fullest extent permitted by Delaware law. Pursuant to our charter, our directors will not be liable to the company or any stockholders for monetary damages for any breach of fiduciary duty, except (i) for acts that breach his or her duty of loyalty to the company or its stockholders, (ii) for acts or omissions without good faith or involving intentional misconduct or knowing violation of the law, (iii) pursuant to Section 174 of the Delaware General Corporation Law (the “DGCL”) or (iv) for any transaction from which the director derived an improper personal benefit. The bylaws also require us, if so requested, to advance expenses that such director or officer incurred in defending or investigating a threatened or pending action, suit or proceeding, provided that such person will return any such advance if it is ultimately determined that such person is not entitled to indemnification by us. Any claims for indemnification by our directors and officers may reduce our available funds to satisfy successful third party claims against us and may reduce the amount of money available to us.
We have elected to take advantage of the “controlled company” exemption to the corporate governance rules for publicly-listed companies, which could make our common stock less attractive to some investors or otherwise harm our stock price.
Because we qualify as a “controlled company” under the corporate governance rules for publicly-listed companies, we are not required to have a majority of our Board be independent under the applicable rules of the NYSE, nor are we required to have a compensation committee or a corporate governance and nominating committee comprised entirely of independent directors. In light of our status as a controlled company, our Board has established a compensation committee, and a corporate governance and nominating committee that are not comprised solely of independent members. We do, however, have a majority of independent directors serving on our Board. Should the interests of our Sponsors differ from those of other stockholders, the other stockholders may not have the same protections afforded to stockholders of companies that are subject to all of the corporate governance rules for publicly-listed companies. Our status as a controlled company could make our common stock less attractive to some investors or otherwise harm our stock price.
We are party to a voting agreement with our Sponsors, which provides our Sponsors with rights to nominate a number of designees to our Board.
In connection with the IPO, we entered into a voting agreement with THL and Cannae. Pursuant to the voting agreement, for so long as THL and Cannae collectively hold 50% or more of the then outstanding voting power, then THL and Cannae shall have the power to designate a total of five directors to the Board. After THL and Cannae cease to collectively hold 50% or more of the then outstanding voting power, then each of THL and Cannae will be able to in their own right designate four directors, for so long as it holds at least 40% of the then outstanding voting power; three directors, for so long as it holds at least 30% of the then outstanding voting power; two directors, for so long as it holds at least 20% of the then outstanding voting power; and one director, for so long as it holds at least 10% of the then outstanding voting power. The voting agreement will terminate as to each Sponsor when the Sponsor is no longer entitled to designate a director to the Board, and will terminate upon the time when neither Sponsor is entitled to designate a director to the Board. Additionally, in the event a lender forecloses on any shares of our common stock pledged in connection with any loan, advances or extensions of credit that Cannae may enter into, it could have an effect on THL and Cannae’s ability to designate directors under the voting agreement.
The voting agreement grants the Sponsors the right to determine the total number of directors during the term of the voting agreement. The Sponsors could use this provision to maintain a majority representation even if they collectively hold less than 50% of the outstanding voting power by decreasing the size of the Board. THL and Cannae may have a right to designate a majority of our Board under the present Board composition even if they collectively or individually hold less than 50% of our then outstanding voting power. Finally, pursuant to the voting agreement, for so long as each Sponsor is entitled to designate a director to the Board, the Sponsors will be required to vote all of their shares, and take all other necessary actions, to cause the Board to include the individuals designated as directors by the Sponsors (as applicable). As a result, it is possible that the interests of THL and Cannae may in some circumstances conflict with our interests and the interests of our other stockholders.
Because we do not intend to pay cash dividends in the foreseeable future, investors may not receive any return on investment unless they are able to sell common stock for a price greater than the purchase price.
We have never declared nor paid cash dividends on our capitalcommon stock. We currently intend to retain any future earnings to finance the operation and expansion of our business, and we do not expect to declare or to pay any dividends in the foreseeable future. Consequently, stockholders must rely on sales of their common stock after price appreciation, which may never occur, as the only way to realize any future gains on their investment. We do not intend in the foreseeable future to pay any dividends to holders of our common stock. We currently intend to retain our future earnings, if any, for the foreseeable future to repay indebtedness and to support our general corporate purposes. Therefore, you are not likely to receive any dividends on your common stock for the foreseeable future, and the success of an investment in shares of our common stock will depend upon any future appreciation in their value. There is no guarantee that shares of our common stock will appreciate in value or even maintain the price at which investors have purchased their shares. However, the payment of future dividends will be at the discretion of our Board, subject to applicable law, and will depend on, among other things, our earnings, financial condition, capital requirements, level of indebtedness, statutory and contractual restrictions that apply to the payment of dividends, and other considerations that our Board deems relevant. As a consequence of these limitations and restrictions, we may not be able to make the payment of dividends on our common stock.
Anti-takeover protections in our third amended and restated certificate of incorporation, our fourth amended and restated bylaws, or our contractual obligations may discourage or prevent a takeover of our company, even if an acquisition would be beneficial to our stockholders.
Provisions contained in our third amended and restated certificate of incorporation and fourth amended and restated bylaws, as well as provisions of the DGCLDelaware law, could delay or make it more difficult to remove incumbent directors or could impede a merger, takeover, or other business combination involving us or the replacement of our management, or discourage a potential investor from making a tender offer for our common stock, which, under certain circumstances, could reduce the market value of our common stock, even if it would benefit our stockholders.
In addition, our Board has the authority to cause us to issue, without any further vote or action by the stockholders, up to 10,000,000 shares of preferred stock, par value $0.01 per share, in one or more series, to designate the number of shares constituting any series, and to fix the rights, preferences, privileges, and restrictions thereof, including dividend rights, voting rights, rights and terms of redemption, redemption price, or prices and liquidation preferences of such series. The issuance of shares of preferred stock or the adoption of a stockholder rights plan may have the effect of delaying, deferring or preventing a change in control of our company without further action by the stockholders, even where stockholders are offered a premium for their shares.
In addition, under the agreements governing our Senior Credit Facilities,credit facilities, a change of control would cause us to be in default. Indefault or could trigger dilutive or additional expenses. For example, in the event of a change of control default, the administrative agent under our Senior Credit Facilitiescredit facilities would have the right (or, at the direction of lenders holding a majority of the loans and commitments under our Senior Credit Facilities,credit facilities, the obligation) to accelerate the outstanding loans and to terminate the commitments under our Senior Credit Facilities,credit facilities, and if so accelerated, we would be required to repay all of our outstanding obligations under our credit facilities.
Further, certain provisions in the Convertible Senior Credit Facilities.Notes and the Indenture could increase the cost of acquiring us or otherwise discourage a third party from acquiring us or removing incumbent management, including in a transaction that noteholders or holders of our common stock may view as favorable.
General Risk Factors
We have identified a material weakness in our internal control over financial reporting and may identify material weaknesses in the future or otherwise fail to establish and maintain effective internal control over financial reporting, which could have a material adverse effect on our business, financial condition, and results of operations.
As a public company, we are required to design and maintain proper and effective internal control over financial reporting and to report any material weaknesses in such internal controls. Section 404 of the Sarbanes-Oxley Act of 2002, as amended, requires that we evaluate and determine the effectiveness of our internal control over financial reporting and provide a management report on the internal control over financial reporting, which must be attested to by our independent registered public accounting firm. Our independent registered public accounting firm may need to issue an adverse report if there is a material weakness in our internal control over financial reporting.
A material weakness is a deficiency, or combination of deficiencies, in internal control over financial reporting, such that there is a reasonable possibility that a material misstatement of the annual or interim financial statements will not be prevented or detected on a timely basis. When evaluating our internal control over financial reporting, we may identify material weaknesses that we may not be able to remediate prior to the date of our annual management report.
We recently identified one material weakness in our internal control over financial reporting, the GITC Material Weakness, as described in Part II, Item 9A, Controls and Procedures.
We have commenced measures to remediate the GITC Material Weakness and anticipate that it will be fully remediated before December 31, 2024. Until the GITC Material Weakness is remediated, we will continue to perform additional analyses and other post-closing procedures to ensure that our consolidated financial statements are prepared in accordance with accounting principles generally accepted in the U.S. (“GAAP”). The GITC Material Weakness cannot be considered remediated until the newly designed control activities operate for a sufficient period of time and management has concluded, through testing, that the controls are operating effectively. We can give no assurance that the measures we are taking and plan to take in the future will remediate the GITC Material Weakness identified, or that any additional material weaknesses or restatements of financial results will not arise in the future. In addition, even if we are successful in strengthening our internal control over financial reporting, in the future those controls may not be adequate to prevent or identify irregularities or errors or to facilitate the fair presentation of our consolidated financial statements.
Any failure to maintain effective internal control over financial reporting could adversely impact our ability to report our
23 | 2023 Form 10-K
financial position and results of operations on a timely and accurate basis. If our financial statements are inaccurate, investors may not have a complete understanding of our operations and we could face the risk of stockholder litigation. Likewise, if our financial statements are not filed on a timely basis, we could be subject to sanctions or investigations by the stock exchanges on which our common stock is listed, the SEC or other regulatory authorities. There could also be a negative reaction in the financial markets due to a loss of investor confidence in us and the reliability of our consolidated financial statements, which could have a material adverse effect on our business, financial condition, and results of operations.
Adverse economic and market conditions could affect our business, operating results, or financial condition.
Our business depends on the overall demand for HCM applications and on the economic health of our current and prospective clients. If economic conditions in the U.S., Canada, or in global markets deteriorate, clients may cease their operations, reduce headcount, delay or reduce their spending on HCM and other outsourcing services or attempt to renegotiate their contracts with us. In addition, global and regional macroeconomic developments, such as increased unemployment, decreased income, uncertainty related to future economic activity, reduced access to credit, increased interest rates, inflation, volatility in capital markets, and decreased liquidity, among other possible factors, could negatively affect our ability to conduct business. An economic decline could result in reductions in sales of our applications, decreased revenue, longer sales cycles, slower adoption of new technologies, and increased price competition, any of which could adversely affect our business, operating results, or financial condition. In addition, HCM spending levels may not increase following any recovery.
In recent years, there have been several instances when there has been uncertainty regarding the ability of the U.S. Congress and the U.S. President collectively to reach agreement on federal budgetary and spending matters. A period of failure to reach agreement on these matters, particularly if accompanied by an actual or threatened government shutdown, may have an adverse impact on the U.S. economy. Additionally, because certain of our clients rely on government resources to fund their operations, a prolonged government shutdown may affect such clients’ ability to make timely payments to us, which could adversely affect our operations results or financial condition.
Further, as part of our payroll and tax filing application, we collect and then remit client funds to taxing authorities and accounts designated by our clients. During the interval between receipt and disbursement, we may invest such funds in money market funds, demand deposit accounts, certificates of deposit, U.S. treasury securities and commercial paper. These investments are subject to general market, interest rate, credit and liquidity risks, and such risks may be exacerbated during periods of unusual financial market volatility. Any loss of or inability to access such funds could have an adverse impact on our cash position and results of operations and could require us to obtain additional sources of liquidity, which may not be available on terms that are acceptable to us, if at all.
Our quarterly results of operations have and may continue to fluctuate significantly and may not fully reflect the underlying performance of our business.
Our quarterly results of operations, including the levels of our revenues, gross margin, profitability, cash flow, and deferred revenue, have varied and may vary significantly in the future, and period-to-period comparisons of our results of operations may not be meaningful. Accordingly, the results of any one quarter should not be relied upon as an indication of future performance. Our quarterly financial results may fluctuate as a result of a variety of factors, many of which are outside of our control, and as a result, may not fully reflect the underlying performance of our business. These factors include: our ability to attract and retain new and current Cloud customers, as well as Dayforce Wallet customers; changes to services or pricing impacting our customer contracts; seasonal variations in sales of and revenue from our applications, changes to our operating expenses related to the maintenance and expansion of our business including newly acquired businesses, operations, and infrastructure; and general economic, industry, and market conditions, including the addition or loss of employees by our Cloud customers who generally pay on a per-employee, per-month ("PEPM") basis, interest rates, and accounting rules.
Catastrophic events may disrupt our business and expose us to risks that could adversely affect our business, financial condition, results of operations, and reputation.
Our business, financial condition, results of operations, access to capital markets and borrowing costs may be adversely affected by a major natural disaster or catastrophic event, including civil unrest, economic recession, geopolitical instability, war, terrorist attack, the effects of climate change, or pandemics or other public health emergencies such as the COVID-19 outbreak, and measures taken in response thereto. In the event of a major disaster or event impacting any of our locations or locations where our employees work virtually, we may be unable to continue our operations and may endure system interruptions, reputational harm, delays in our application development, lengthy interruptions in our services, breaches of data security and loss of critical data. These catastrophic events have the potential to disrupt the business of our third-party
24 | 2023 Form 10-K
suppliers, partners, or customers. All the potential impacts could have a material adverse effect on our business, financial condition, and results of operations.
For instance, the COVID-19 pandemic created significant global volatility, uncertainty, and economic disruption. The extent to which it, or other similarly disrupting event, will continue to adversely affect our business, operations, and financial results will depend on numerous evolving factors, including developments which are highly uncertain and cannot be predicted, such as the duration and scope of the event, and that affect our ability to sell and to provide our services to our current and future customers, and the ability of our customers to pay for our services or to make us whole for advances of earned net wages and associated tax amounts made on their behalf by us.
Our disclosures and ambitions related to ESG matters may expose us to risks that could adversely affect our reputation and performance.
We publicly share certain information about our company’s ambitions, programs, and goals on ESG matters. These disclosures, the goals we have set, or a failure to meet these goals may generate increased scrutiny of our business that could harm our brand and our reputation. There has been a recent notable increase in current and proposed regulations at the state and federal level on publicly traded companies related to ESG matters. A failure to fully comply with these new regulatory requirements, or a failure to do so in a timely matter, could have an adverse effect on our business, financial condition, and our perception by key stakeholders.
We operate and are subject to tax in multiple jurisdictions. Audits, investigations, and tax proceedings could have a material adverse effect on our business, results of operations, and financial condition.
We are subject to income and non-income taxes in multiple jurisdictions. Income tax accounting often involves complex issues, and significant judgment is often required in determining our worldwide provision for income taxes. We are regularly subject to tax examinations in these jurisdictions during which the tax authorities may challenge our tax positions. We regularly assess the likely outcomes of these examinations to determine the appropriateness of our tax reserves as well as our future tax liabilities. In addition, the application of withholding tax, value added tax, goods and services tax, sales tax, and other non-income taxes is not always certain, and we may be subject to examinations relating to such withholding or non-income taxes. We believe that our tax positions are reasonable and our tax reserves are adequate to cover any potential liability. However, if any of these tax authorities successfully challenge our positions, we may be liable for additional tax, penalties, and interest in excess of any reserves established, which may have a significant impact on our results and operations and future cash flow.
Changes in generally accepted accounting principles in the U.S. could have a material adverse effect on our previously reported results of operations.
Generally accepted accounting principles in the U.S. are subject to interpretation by the Financial Accounting Standards Board (the “FASB”), the SEC, and various bodies formed to promulgate and to interpret appropriate accounting principles. A change in these principles or interpretations could have a significant effect on our previously reported results of operations and could affect the reporting of transactions completed before the announcement of a change. Please refer to Part II, Item 8, Note 2, “Summary of Significant Accounting Policies”, of this report for our assessment of recently issued and adopted accounting pronouncements.
Our debt may be downgraded, which could have a material adverse effect on our business, financial condition, and results of operations.
A reduction in the ratings that rating agencies assign to our debt may negatively impact our access to the debt capital markets and increase our cost of borrowing, which could have a material adverse effect on our business, financial condition, and results of operations.
Volatility and weakness in bank and capital markets may adversely affect credit availability and related financing costs for us.
Disruptions in the financial markets can also adversely affect our lenders, insurers, customers, and other counterparties. During periods of volatile credit markets, there is risk that lenders, even those with strong balance sheets and sound lending practices, could fail, no longer participate in credit offerings, or refuse to honor their existing legal commitments and obligations to us, including but not limited to, extending credit up to the maximum amount permitted by the Revolving Credit Facility. If our lenders are unable to fund borrowings under their revolving credit commitments or we are unable to borrow or refinance our debt in the financial markets, it could substantially increase our cost of borrowing or be difficult to obtain sufficient funding to execute our business strategy or to meet our liquidity needs, which could have a material adverse effect on our business, financial condition, and results of operations.
25 | 2023 Form 10-K
Item 1B. Unresolved Staff Comments.
None.
Item 1C. Cybersecurity.
As an HCM company, we face a multitude of cybersecurity threats from threat actors seeking to access or leverage the data we possess for malicious ends. Review of our information security program, including our cybersecurity policies, standards, and processes, is integrated into our Enterprise Risk Management ("ERM") program which is based on the COSO Enterprise Risk Management Framework and International Organization for Standardization ("ISO") 31000, the two most widely used global standards for ERM.
Our information security program aligns with recommended practices in security standards issued by ISO, AICPA (SSAE18), National Institute of Standards and Technology ("NIST") and other industry sources. Specifically, we maintain several ISO certifications (ISO 27001, 27701, 27017, 27018, 27036), NIST 800-171 compliance, and SOC 1 and 2 Type 2 reports to comply and adhere to industry standard practices. We have invested in our data security team, information security program, and security environment in order to identify, prevent, and mitigate cybersecurity threats and promptly identify and respond to cybersecurity incidents when they occur. Maintaining, monitoring, and updating our information security program to ensure that it remains reasonable and appropriate to changes in the security threat landscape, available technology, security vulnerabilities, and legal and contractual requirements applicable to us, is a continuous effort.
Risk Management and Strategy
We believe that effective cybersecurity depends upon the successful implementation and maintenance of a comprehensive information security program. Deploying suitable security technology, which encompasses analytics and automation, and leveraging the expertise of highly skilled security and risk professionals, is crucial in our strategy. Additionally, we prioritize data governance and data-centric security as integral components of our approach to ensure compliance, uphold privacy standards, and safeguard customer data.
We continue to work to enhance our capabilities in cloud security and assurance testing, security operations and automation, product security, and enterprise risk management. To combat the evolving cybersecurity risk landscape and the enhanced level of sophistication of cybersecurity threats, management has prioritized five areas of our information security program: global standards and operations, a risk-aware workforce, product security, detection and response, and data governance management. In addition, we maintain cybersecurity insurance; however, the costs related to cybersecurity threats or disruptions may not be fully insured.
We contract with several outside cybersecurity experts to audit and test security controls on a regular basis. Any risks or control gaps identified as a result of such assessments, audits, and reviews are reported to the most senior leadership of all functional areas of the Company, the Audit Committee of the Board (the "Audit Committee"), and the Board as appropriate, and we adjust our cybersecurity policies, standards, and practices as necessary.
We face a number of risks from cybersecurity threats, which may materially affect our business, financial condition, and results of operations, because our business is dependent on the successful operation of our payroll, transaction, financial, accounting, and other data processing systems. Although such risks have not materially affected us, including our business, financial condition, and results of operations to date, we have, from time to time, we may enter into contracts that contain change of control provisions that limit the value of, or even terminate, the contract upon a change of control. These change of control provisions may discourage a takeoverexperienced threats to and breaches of our company, even if andata and systems, and our third-party partners’ data and systems, including malware and computer virus attacks. Businesses we acquire maintain separate cybersecurity programs and processes that may differ in scope and complexity from our overall programs and processes as we set about integrating the acquisition would be beneficialtarget’s systems into ours.
We cannot eliminate all risks from cybersecurity threats or provide assurances that we have not detected a cybersecurity incident.
Please refer to Part I, Item 1A, “Risk Factors” for further discussion of our cybersecurity-related risks.
Governance
Our commitment to cybersecurity begins at the Board and extends to the most senior leadership of all functional areas of the Company. Our Audit Committee oversees our risk management process at the Board level. The Audit Committee’s responsibilities include regular review of policies and practices with respect to risk assessment and risk management, including in the areas of cybersecurity and other information technology risk and privacy.
26 | 2023 Form 10-K
The Company’s cybersecurity program is supervised by our Chief Information Security Officer ("CISO"). The CISO and his team are responsible for leading enterprise-wide cybersecurity, strategy, policy, standards, and processes. The CISO provides quarterly updates related to the cybersecurity program, including any notable incidents at regularly scheduled Audit Committee meetings. The CISO updates include details regarding the magnitude, financial impact, and remediation of cybersecurity incidents. Members of our Board of Directors and senior Company executives participate in annual tabletop exercises that focus on testing response plans to ransomware, cloud security, payroll disruption, and other incidents. In addition, in order to deploy a consistent cybersecurity framework, and to manage the risk of social engineering, software downloads, and phishing, we educate employees globally through ongoing security awareness training.
Our CISO has served in various roles in information technology and information security for over 25 years, with experience in technology risk management, cybersecurity, compliance, network engineering, information systems, and business resiliency. He is a Certified Information Systems Security Professional and is a member of the National Association of Corporate Directors ("NACD"). At the management level, our CISO, who oversees our data security personnel, works closely with our Chief Risk Officer, who oversees our incident response and business continuity management programs, to assess and manage the cybersecurity element of our ERM program. Our Chief Risk Officer has extensive familiarity with our business, having been at Dayforce, Inc. for over 20 years. Our Chief Risk Officer focuses on risk management, business continuity planning, crisis management, audit processes, operations management, and executive and board of directors reporting.
Our CISO and Chief Risk Officer report to our stockholders.
Item 1B. Unresolved Staff Comments.Chief Operating Officer. These officers, along with our Chief Product and Technology Officer and our Chief Information Officer, drive our cybersecurity priorities at the executive level.
None.We have established a documented cybersecurity incident materiality assessment and disclosure program that is jointly managed by our Incident Response, Cybersecurity, and Corporate Legal teams. This program calls for the immediate assessment of potentially material cybersecurity incidents, and the appropriate escalation to our cross-functional Disclosure Committee in order to facilitate the prompt escalation of certain cybersecurity incidents so that decisions regarding the public disclosure and reporting of such incidents can be made by management in a timely manner and elevated to our Audit Committee or Board if needed.
Our corporate headquarters is located in Minneapolis, Minnesota and consists of approximately 195,000 square feet of space.
Wewe also have a major North American offices in: Atlanta, Georgia; Fountain Valley, California; Honolulu, Hawaii; Montreal, Canada; Ottawa, Canada; St. Petersburg, Florida;office location in Toronto, Canada; and Winnipeg, Canada.Ontario, Canada, both in leased facilities. In addition, as of December 31, 2023, we have officeslease office space in Ebene, Mauritius,various other locations across North America, APJ, and in Glasgow, Scotland. We lease all facilities, except for our St. Petersburg, Florida, facility, which we own.EMEA. We believe that our current facilities meet our needs, and we are confident that we will be able to obtain additional space on commercially reasonable terms to accommodate future growth. growth as needed. Refer to Part II, Item 8, Note 6, "Leases," to our consolidated financial statements for additional discussion of our leases.
From time to time, we may become involved in legal proceedings arising in the ordinary course of our business. We are not presently a party to any legal proceedings that, if determined adversely to us, we believe would individually or taken together have a material adverse effect on our business, financial condition or liquidity. Discussion of Legal Matterslegal matters is incorporated by reference from Part II, Item 8, Note 15, “Commitments and Contingencies,” of this Form 10-K and should be considered an integral part of Part I, Item 3, “Legal Proceedings”.
Item 4. Mine Safety Disclosures.
Not applicable.
Item 5. Market for Registrant’s Common Equity, Related Stockholder Matters and Issuer Purchases of Equity Securities.
Market Information for Common Stock
Our common stock hasis traded on the NYSE and the TSXTSX. On February 1, 2024, our common stock began trading under the symbol "DAY". This replaced the symbol “CDAY”, which had been used since April 26, 2018. Prior to that time, there was no2018, the date of our initial public market for our shares. offering.
Dividend Policy
We do not currently intend to pay cash dividends on our common stock in the foreseeable future. However, in the future, subject to factors described below and our future liquidity and capitalization, we may change this policy and choose to pay dividends.
Stockholders
As of December 31, 2018,2023, there were 17554 stockholders of record of our common stock. The actual number of stockholders is considerably greater than this number of record holders, and includes stockholders who are beneficial owners but whose shares are held in street name by brokers and other nominees.
Recent Sales of Unregistered Securities
The following sets forth information regarding all unregistered securities sold by the Registrant in transactions that were exempt from the requirements of the Securities Act during the year ended December 31, 2018:None.
On April 30, 2018, the Registrant sold 4,545,455 shares of common stock in a private placement to THL / Cannae Investors LLC, a price of $22.00 per share for an aggregate purchase price of $100,000,000.
From January 1, 2018 to March 2, 2018, the Registrant granted options to one employee to purchase an aggregate of 175,000 shares of its common stock under the 2013 Ceridian HCM Holding Inc. Stock Incentive Plan (the “2013 Plan”) with an exercise price of $20.96 per share.
From January 1, 2018 to March 30, 2018, the Registrant issued 12,174 shares of its common stock to a total of six employees or former employees upon the exercise of options previously granted under the 2013 Plan at strike prices ranging from $13.46 to $16.80 per share.
From January 1, 2018 to March 9, 2018, the Registrant issued 76,190 shares of its common stock to two employees upon the vesting of restricted stock units granted under the 2013 Plan with a fair market value of $20.96 per share.
The shares of common stock in all of the transactions listed above were issued or will be issued in reliance upon Section 4(a)(2) of the Securities Act or Rule 701 promulgated under Section 3(b) of the Securities Act as the sale of such securities did not or will not involve a public offering. The recipients of the securities in each of these transactions represented their intentions to acquire the securities for investment only and not with a view to or for sale in connection with any distribution thereof, and appropriate legends were placed upon the stock certificates issued in these transactions. All recipients had adequate access, through their relationships with the Registrant, to information about the Registrant.
Issuer Purchases of Equity Securities
None.
The following shall not be deemed "filed" for purposes of Section 18 of the Exchange Act, or incorporated by reference into any of our other filings under the Exchange Act or the Securities Act, except to the extent we specifically incorporate it by reference into such filing.
The following graph compares the cumulative total shareholder returns on our common stock with the cumulative total return on the S&P 500 Index and the S&P 5001500 Application Software Index. The graph assumes $100 was invested in each, based on closing prices from our initial public offering toDecember 31, 2018 through December 31, 2023, utilizing the last trading day of each quarter for the period April 26, 2018 (the date our common stock began trading on the NYSE) through December 31, 2018.respective quarter. Stock price performance shown in the Stock Performance Graph for our common stock is historical and not necessarily indicative of future performance.
 2023 Form 10-K
Prepared by Zacks Investment Research, Inc. Used with permission. All rights reserved. Copyright 1980-2022.
Item 6. Selected Financial Data.[Reserved]
The following tables set forth selected historical consolidated financial data for the periods as of the dates indicated. We derived the consolidated statements of operations data for the years ended December 31, 2018, 2017, and 2016, and the consolidated balance sheet data as of December 31, 2018, 2017, and 2016, from our audited consolidated financial statements included elsewhere in this report.
In the second quarter of 2018, contemporaneously with our IPO and concurrent private placement, we distributed our controlling financial interest in LifeWorks to our stockholders of record prior to the IPO on a pro rata basis in accordance with their pro rata interests in us. As a result, the financial statements in this29 | 2023 Form 10-K have been adjusted to reflect the LifeWorks Disposition and show the former LifeWorks business as discontinued operations for all periods presented.
Our historical results are not necessarily indicative of future results of operations. You should read the information set forth below together with “Management’s
Item 7. Management’s Discussion and Analysis of Financial Condition and Results of Operations,” and our consolidated financial statements and the related notes thereto included elsewhere in this report.Operations.
|
| Year Ended December 31, |
| |||||||||
|
| 2018 |
|
| 2017 |
|
| 2016 |
| |||
|
| (Dollars in millions, except share and per share amounts) |
| |||||||||
Consolidated Statements of Operations Data: |
|
|
|
|
|
|
|
|
|
|
|
|
Total revenue |
| $ | 746.4 |
|
| $ | 670.8 |
|
| $ | 623.4 |
|
Cost of revenue |
|
| 425.8 |
|
|
| 407.5 |
|
|
| 396.4 |
|
Selling, general, and administrative expenses |
|
| 270.7 |
|
|
| 223.0 |
|
|
| 225.3 |
|
Other (income) expense, net |
|
| (2.9 | ) |
|
| 7.3 |
|
|
| 12.9 |
|
Operating profit (loss) |
|
| 52.8 |
|
|
| 33.0 |
|
|
| (11.2 | ) |
Interest expense, net |
|
| 83.2 |
|
|
| 87.1 |
|
|
| 87.4 |
|
Loss from continuing operations before income taxes |
|
| (30.4 | ) |
|
| (54.1 | ) |
|
| (98.6 | ) |
Income tax expense (benefit) |
|
| 7.7 |
|
|
| (49.6 | ) |
|
| 6.7 |
|
Loss from continuing operations |
|
| (38.1 | ) |
|
| (4.5 | ) |
|
| (105.3 | ) |
(Loss) income from discontinued operations |
|
| (25.8 | ) |
|
| (6.0 | ) |
|
| 12.5 |
|
Net loss |
|
| (63.9 | ) |
|
| (10.5 | ) |
|
| (92.8 | ) |
Net (loss) income attributable to noncontrolling interest |
|
| (0.5 | ) |
|
| (1.3 | ) |
|
| 0.1 |
|
Net loss attributable to Ceridian |
| $ | (63.4 | ) |
| $ | (9.2 | ) |
| $ | (92.9 | ) |
Net loss per share attributable to Ceridian: |
|
|
|
|
|
|
|
|
|
|
|
|
Basic |
| $ | (0.62 | ) |
| $ | (0.46 | ) |
| $ | (1.65 | ) |
Diluted |
| $ | (0.62 | ) |
| $ | (0.46 | ) |
| $ | (1.65 | ) |
Weighted average shares outstanding: |
|
|
|
|
|
|
|
|
|
|
|
|
Basic |
|
| 114,049,682 |
|
|
| 65,204,960 |
|
|
| 64,988,338 |
|
Diluted |
|
| 114,049,682 |
|
|
| 65,204,960 |
|
|
| 64,988,338 |
|
|
| As of December 31, |
| |||||||||
|
| 2018 |
|
| 2017 |
|
| 2016 |
| |||
|
| (Dollars in millions) |
| |||||||||
Consolidated Balance Sheet Data: |
|
|
|
|
|
|
|
|
|
|
|
|
Cash and equivalents |
| $ | 217.8 |
|
| $ | 94.2 |
|
| $ | 120.8 |
|
Total assets |
|
| 5,154.4 |
|
|
| 6,729.9 |
|
|
| 6,326.0 |
|
Long-term debt (1) |
|
| 663.5 |
|
|
| 1,119.8 |
|
|
| 1,139.8 |
|
Total liabilities |
|
| 3,622.4 |
|
|
| 5,600.9 |
|
|
| 5,320.1 |
|
Working capital |
|
| 169.9 |
|
|
| 175.2 |
|
|
| 196.0 |
|
Total stockholders’ equity |
| $ | 1,532.0 |
|
| $ | 1,091.2 |
|
| $ | 967.2 |
|
|
|
Item 7. Management’s Discussion and Analysis of Financial Condition and Results of Operations.
The following is a discussion and analysis of our financial condition and results of operations as of, and for, the periods presented. You should read the following discussion and analysis of our financial condition and results of operations together with our consolidated financial statements and the related notes thereto included elsewhere in this report. This discussion and analysis contains forward-looking statements, including statements regarding industry outlook, our expectations for the future of our business, and our liquidity and capital resources as well as other non-historical statements. These statements are based on current expectations and are subject to numerous risks and uncertainties, including but not limited to the risks and uncertainties described in “Risk Factors” and “Forward-Looking“Cautionary Note Regarding Forward-Looking Statements.” Our actual results may differ materially from those contained in or implied by these forward-looking statements.
OverviewThe following discussion and analysis of our financial condition and results of operations covers fiscal 2023 and fiscal 2022 items and year-over-year comparisons between fiscal 2023 and fiscal 2022. Discussions of fiscal 2021 items and year-over-year comparisons between fiscal 2022 and 2021 that are not included in this Form 10-K can be found in “Management’s Discussion and Analysis of Financial Condition and Results of Operations” in Part II, Item 7 of our Annual Report on Form 10-K for the fiscal year ended December 31, 2022, that was filed with the SEC on March 1, 2023.
Overview
Dayforce, Inc., formerly known as Ceridian HCM Holding Inc., is a global HCM software company. We categorize our solutions into twothree categories: Cloud recurring, other recurring (formerly referred to as Bureau), and Bureau solutions.professional services and other. Cloud recurring revenue is primarily generated from HCM solutions that are delivered via two cloudCloud offerings: Dayforce, our flagship cloudCloud HCM platform, and Powerpay, a cloudCloud HR and payroll solution for the Canadian small business market. We also continue to support customers using our Bureaulegacy North America solutions which we generally stopped actively selling to newand customers following the acquisition of Dayforceusing our acquired solutions in 2012.APJ. We invest in maintenance and necessary updates to support our Bureau customers and continue to migrate them to Dayforce. Revenue from our Cloud recurring and other recurring solutions includes investment income generated from holding customer funds, also referred to as float revenue or float.
Dayforce provides global HR, payroll benefits,and tax, workforce management, benefits, and talent managementintelligence functionality. Our platform is used by organizations of all sizes, from small businesses to global organizations, regardless of industry, or size, to optimize management of the entire employee lifecycle, including attracting, hiring, engaging, paying, deploying, and developing their people. Dayforce was built as a single application from the ground up that combines a modern, consumer-grade user experience with proprietary application architecture, including a single employee record and a rules engine spanning all areas of HCM. Dayforce provides continuous real-time calculations across all modules to enable, for example, payroll administrators access to data through the entire pay period, and managers access to real-time data to optimize work schedules. Our platform is designed to make work life betterdrive efficiencies for our customers and their employees by improving HCM decision-making processes, streamlining workflows, exposingrevealing strategic organizational insights, and simplifying legislative compliance. The platform is designed to ease administrative work for both employees and managers, creating opportunities for companies to increase employee engagement. We are a founder-led organization, and our culture combines the agility and innovation of a start-up with a history of deep domain and operational expertise.
We sell Dayforce through our direct sales force and partner ecosystem on a subscription per-employee, per-month (“PEPM”)PEPM basis. Our subscriptions are typically structured with an initial fixed term of between three and five years, with evergreen renewal thereafter. Dayforce can serve customers of all sizes, ranging from 100 to over 100,000 employees. We have rapidly grown the Dayforce platform to more than 3,700 live Dayforce customers, representing approximately 3.1 million active global users as of December 31, 2018. In 2018, we added over 715 net new live Dayforce customers. Our customers vary across industries, and no single customer constituted more than 1% of our revenues for the year ended December 31, 2018. We have experienced significant Cloud revenue growth at scale, particularly from Dayforce, which has grown at a compound annual growth rate (“CAGR”) of more than 55% since 2012. Our annual Cloud revenue retention rate continues to exceed 95% due to our intense focus on solving complex problems and our superior customer experience.
The following table presents Dayforce revenue by quarter from 2012 to 2018.
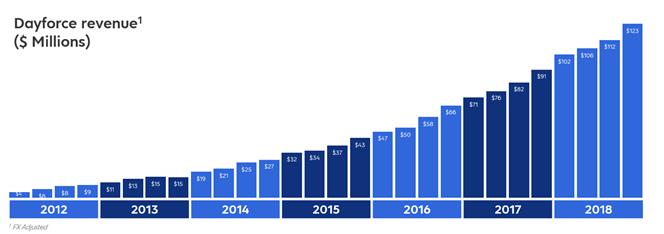
Our business model focuses on supporting the rapid growth of Dayforce and maximizing the lifetime value of our Dayforce customer relationships. Due to our subscription model, where we recognize subscription revenues ratably over the term of the subscription period, and our high customer retention rates, we have a high level of visibility into our future revenues. The profitability of a customer to our business depends, in large part, on how long they have been a customer. Because in our current business model, PEPM subscription fees are not charged until the customer goes live, and because we incur costs in advance of receiving PEPM revenue that are not offset by our implementation fees, weWe estimate that it takes an average of 2.5approximately two years before we are able to recover our implementation, customer acquisition, and other direct costs on a new Dayforce customer contract. As the proportion of Dayforce customers who have been live for two or more years increases, our related profitability increases. The following sets forth the number of live Dayforce customers at the end of each quarter presented:
|
| Three Months Ended |
| |||||||||||||||||||||||||||||||||||||||||||||
|
| December 31, 2018 |
|
| September 30, 2018 |
|
| June 30,2018 |
|
| March 31,2018 |
|
| December 31, 2017 |
|
| September 30, 2017 |
|
| June 30,2017 |
|
| March 31,2017 |
|
| December 31, 2016 |
|
| September 30, 2016 |
|
| June 30,2016 |
|
| March 31,2016 |
| ||||||||||||
Live Dayforce customers |
|
| 3,718 |
|
|
| 3,465 |
|
|
| 3,308 |
|
|
| 3,154 |
|
|
| 3,001 |
|
|
| 2,855 |
|
|
| 2,690 |
|
|
| 2,480 |
|
|
| 2,339 |
|
|
| 2,148 |
|
|
| 2,014 |
|
|
| 1,872 |
|
Dayforce customers live for two or more years |
|
| 2,339 |
|
|
| 2,148 |
|
|
| 2,014 |
|
|
| 1,872 |
|
|
| 1,770 |
|
|
| 1,628 |
|
|
| 1,524 |
|
|
| 1,377 |
|
|
| 1,276 |
|
|
| 1,116 |
|
|
| 997 |
|
|
| 816 |
|
Proportion of Dayforce customers live for two or more years |
|
| 63 | % |
|
| 62 | % |
|
| 61 | % |
|
| 59 | % |
|
| 59 | % |
|
| 57 | % |
|
| 57 | % |
|
| 56 | % |
|
| 55 | % |
|
| 52 | % |
|
| 50 | % |
|
| 44 | % |
Over the lifetime of the customer relationship, we have the opportunity to realize additional PEPM revenue, both as the customer grows or rolls out the Dayforce solution to additional employees, and also by selling additional functionality to existing customers that do not currently utilize our full platform.suite. We also incur costs to manage the account, to retain customers, and to sell additional functionality. These costs, however, are significantly less than the costs initially incurred to acquire and to implement the customer.take customers live.
How We Assess Our Performance30 | 2023 Form 10-K
In assessing our performance, we consider a variety of performance indicators in addition to revenue and net income. Set forth below is a description of our key performance measures.
Revenues
|
| Year Ended December 31, |
| |||||||||
|
| 2018 |
|
| 2017 |
|
| 2016 |
| |||
Live Dayforce customers |
|
| 3,718 |
|
|
| 3,001 |
|
|
| 2,339 |
|
Annual Cloud revenue retention rate (a) |
|
| 96.3 | % |
|
| 97.0 | % |
|
| 95.7 | % |
Cloud annualized recurring revenue (ARR) (a) (Dollars in millions) |
| $ | 506.2 |
|
| $ | 391.0 |
|
| $ | 289.7 |
|
Adjusted EBITDA (b) (Dollars in millions) |
| $ | 157.1 |
|
| $ | 117.8 |
|
| $ | 85.5 |
|
Adjusted EBITDA margin |
|
| 21.0 | % |
|
| 17.6 | % |
|
| 13.7 | % |
|
|
|
|
We use the number of customers live on Dayforce as an indicator of future revenue and the overall performance of the business and to assess the performance of our implementation services. As shown in the following table, the number of customers live on Dayforce has increased from 482 as of December 31, 2012 to 3,718 as of December 31, 2018. In addition, we had over 450 net new Dayforce customers contracted, but not yet live on Dayforce as of December 31, 2018. We expect the majority of these Dayforce customers to be taken live in 2019. For 2018, our 3,718 live Dayforce customers represented over 3.1 million active users. We market Dayforce to customers of all sizes, including small (under 500 employees), mid-sized (501 to 2,500 employees), and enterprise (over 2,500 employees). For 2018, small businesses accounted for 14% of the total number of active customer employees, mid-sized businesses accounted for 32% of the total number of active customer employees, and enterprise businesses accounted for 54% of the total number of active customer employees. As our business and go-to-market strategy continues to evolve, in 2019, we will be modifying our customer segmentation for increased relevance.
From 2017 to 2018, live Dayforce customers increased from 3,001 to 3,718, a net increase of 717. Of the customers taken live during 2018, 77% represented net new customers to Dayforce, and the remainder were migration customers from our Bureau solution. Of the net new customers to Dayforce, small businesses accounted for 9% of the total number of active customer employees, mid-sized businesses accounted for 33% of the total number of active customer employees, and enterprise businesses accounted for 58% of the total number of active customer employees. Of the migration customers, small businesses accounted for 23% of the total number of active customer employees, mid-sized businesses accounted for 41% of the total number of active customer employees, and enterprise businesses accounted for 36% of the total number of active customer employees.
From 2016 to 2017, live Dayforce customers increased from 2,339 to 3,001, a net increase of 662. Of the customers taken live during 2017, 58% represented net new customers to Dayforce and the remainder were migration customers from our Bureau solutions. Of the net new customers to Dayforce, small businesses accounted for 13% of the total number of active customer employees, mid-sized businesses accounted for 33% of the total number of active customer employees, and enterprise businesses accounted for 54% of the total number of active customer employees. Of the migration customers, small businesses accounted for 20% of the total number of active customer employees, mid-sized businesses accounted for 48% of the total number of active customer employees, and enterprise businesses accounted for 32% of the total number of active customer employees.
The following table sets forth the number of live Dayforce customers at the end of the years presented:
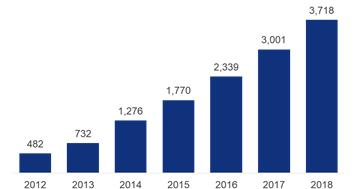
Annual Cloud Revenue Retention Rate
Our annual Cloud revenue retention rate measures the percentage of revenues that we retain from our existing Cloud customers. We use this retention rate as an indicator of customer satisfaction and future revenues. We calculate the annual Cloud revenue retention rate as a percentage, where the numerator is the Cloud annualized recurring revenue for the prior year, less the Cloud annualized recurring revenue from lost Cloud customers during that year; and the denominator is the Cloud annualized recurring revenue for the prior year. Our annual Cloud revenue retention rate has been 95% or above for the years ended December 31, 2018, 2017, and 2016. We set annual targets for Cloud revenue retention rate and monitor progress toward those targets on a quarterly basis by reviewing known and anticipated customer losses. Our Cloud revenue retention rate may fluctuate as a result of a number of factors, including the mix of Cloud solutions used by customers, the level of customer satisfaction, and changes in the number of users live on our Cloud solutions.
Cloud Annualized Recurring Revenue (“ARR”)
We derive the majority of our Cloud revenues from recurring fees, primarily PEPM subscription charges. We also derive recurring revenue from fees related to the rental and maintenance of clocks, charges for once-a-year services, such as year-end tax statements, and investment income on our customer funds held in trust before such funds are remitted to taxing authorities, customer employees, or other third parties. To calculate Cloud ARR, we start with recurring revenue at year end, subtract the once-a-year charges, annualize the revenue for customers live for less than a full year to reflect the revenue that would have been realized if the customer had been live for a full year, and add back the once-a-year charges. We set annual targets for Cloud ARR and monitor progress toward those targets on a quarterly basis.
Adjusted EBITDA and Adjusted EBITDA margin
We believe that Adjusted EBITDA and Adjusted EBITDA margin, non-GAAP financial measures, are useful to management and investors as supplemental measures to evaluate our overall operating performance. Adjusted EBITDA and Adjusted EBITDA margin are components of our management incentive plan and are used by management to assess performance and to compare our operating performance to our competitors. We define Adjusted EBITDA as net income or loss before interest, taxes, depreciation, and amortization, as adjusted to exclude net income or loss from discontinued operations, sponsor management fees, non-cash charges for asset impairments, gains or losses on assets and liabilities held in a foreign currency other than the functional currency of a company subsidiary, share-based compensation expense, severance charges, restructuring consulting fees, transaction costs, and environmental reserve charges. Adjusted EBITDA margin is determined by calculating the percentage Adjusted EBITDA is of Total Revenue. Management believes that Adjusted EBITDA and Adjusted EBITDA margin are helpful in highlighting management performance trends because Adjusted EBITDA and Adjusted EBITDA margin exclude the results of decisions that are outside the normal course of our business operations. For a reconciliation of Adjusted EBITDA to operating profit, please see “Non-GAAP Measures.”
Our History
Ceridian was acquired in 2007 by affiliates and co-investors of the Sponsors. In April 2012, Ceridian acquired Dayforce Corporation, which had built Dayforce, a cloud HCM solution. In the months following the acquisition, Dayforce founder, David D. Ossip, was named Chief Executive Officer of Ceridian HCM, and shortly thereafter, we generally stopped actively selling our Bureau solutions to new customers in the United States to focus our resources on expanding the Dayforce platform and growing Cloud solutions. For each quarter since September 30, 2016, our Cloud revenue has surpassed our Bureau revenue. Cloud revenue grew from 39% of total revenue during the quarter ended December 31, 2015 to 74% of total revenue during the quarter ended December 31, 2018.
As part of our strategy to focus on the growth of our Cloud solutions business, we undertook the following initiatives to simplify our business model:
|
|
|
|
|
|
|
|
|
|
As a result of these transactions, we only actively sell Dayforce and Powerpay, which we believe simplifies our business model and positions us well for continued growth.
Our benefits administration and post-employee compliance business, our United Kingdom and Ireland businesses, our divested Mauritius operations, and our LifeWorks joint venture are presented as discontinued operations in our financial statements. Our consumer-directed benefits services business and our benefits administration and post-employment compliance business are collectively referred to as our “Divested Benefits Businesses.” After the LifeWorks Disposition, management has concluded that we have one operating and reportable segment. This conclusion aligns with how management monitors operating performance, allocates resources, and deploys capital. Please refer to Note 3, “Discontinued Operations,” to our consolidated financial statements for further information regarding these transactions.
On April 30, 2018, we completed our IPO, in which we issued and sold 21,000,000 shares of common stock at a public offering price of $22.00 per share. We granted the underwriters a 30-day option to purchase an additional 3,150,000 shares of common stock at the offering price, which was exercised in full. A total of 24,150,000 shares of common stock were issued on April 30, 2018, with gross proceeds of $531.3 million from the IPO before deducting underwriting discounts, commissions, and other offering expenses. Immediately subsequent to the closing of our IPO on April 30, 2018, THL / Cannae Investors LLC, one of our existing stockholders controlled by our Sponsors, purchased from us in a private placement $100.0 million of our common stock at a price per share equal to the offering price. Based on the offering price of $22.00 per share, 4,545,455 shares were issued in this private placement. Please refer to Note 1, “Organization,” for further discussion of the IPO transaction.
We applied a portion of the net proceeds from the IPO to satisfy and to discharge the indenture governing our outstanding $475.0 million principal amount Senior Notes, and they were redeemed on May 30, 2018. Concurrently, we also refinanced our remaining debt under our (i) $702.0 million (original principal amount) Senior Term Debt and (ii) $130.0 million Revolving Credit Facility, including accrued interest and related costs and expenses, with new senior credit facilities consisting of a $680.0 million term loan debt facility and a $300.0 million revolving credit facility. Please refer to Note 9, “Debt,” for further discussion of the debt transactions.
The IPO, private placement, and debt refinancing had the following impacts to our results of operations and cash during 2018:
|
| Impacts to Statement of Operations |
|
| Impact to Cash |
| ||
Gross proceeds from the IPO and private placement |
|
|
|
|
| $ | 631.3 |
|
Costs capitalized within stockholders' equity |
|
|
|
|
|
| (36.3 | ) |
Redemption of Senior Notes |
|
|
|
|
|
| (475.0 | ) |
Debt refinancing fees, reflected as a reduction to long-term debt |
|
|
|
|
|
| (3.6 | ) |
IPO and debt refinancing related expenses reflected within results of operations: |
|
|
|
|
|
|
|
|
Cost of revenue |
| $ | (2.1 | ) |
|
|
|
|
Selling, general, and administrative |
|
| (23.2 | ) |
|
|
|
|
Impact on operating profit |
| $ | (25.3 | ) |
|
|
|
|
Interest expense |
|
| (25.7 | ) |
|
|
|
|
Impact on net loss |
| $ | (51.0 | ) |
|
| (51.0 | ) |
Non-cash IPO-related share-based compensation expense |
|
|
|
|
|
| 8.1 |
|
Non-cash interest expense adjustments |
|
|
|
|
|
| (4.9 | ) |
Cash to balance sheet from the IPO and private placement |
|
|
|
|
| $ | 68.6 |
|
Proceeds from issuance of the new $680.0 million Senior Term Debt |
|
|
|
|
|
| 680.0 |
|
Repayment of the $702.0 million Senior Term Debt |
|
|
|
|
|
| (657.0 | ) |
Cash to balance sheet from the IPO, private placement, and debt refinancing |
|
|
|
|
| $ | 91.6 |
|
On November 16, 2018, we completed a secondary offering, in which certain of our stockholders (the “Selling Stockholders”) sold 11,000,000 shares of common stock, in an underwritten public offering at $36.00 per share. The Selling Stockholders granted the underwriters a 30-day option to purchase an additional 1,650,000 shares of common stock at the offering price, which was exercised in full. A total of 12,650,000 shares of common stock were sold by the Selling Stockholders on November 16, 2018, with all proceeds going to the Selling Stockholders. We incurred expenses of $1.3 million during the year ended December 31, 2018, related to the secondary offering within selling, general, and administrative expense.
Components of Our Results of Operations
Revenues
We generate recurring revenues primarily from recurring fees charged for the use of our Cloud recurring solutions, Dayforce and Powerpay, as well as from our Bureauother recurring solutions. We also generate professional services and other revenue associated primarily with the work performed to assist customers with the planning, design, implementation, and stagingimplementation of their cloud-basedCloud-based solution. Our solutions are typically provided through long-term customer relationships that result in a high level of recurring revenue. We also generate recurring services revenue from investment income on our Cloud and Bureaurecurring customer funds held in trust before such funds are remitted to taxing authorities, customer employees, or other third parties. We refer to this investment income as float revenue.
For Dayforce, we primarily charge monthly recurring fees on a PEPM basis, generally one-month in advance of service, based on the number and type of solutions provided to the customer and the number of employees and other users at the customer. Our standard Dayforce contracts are generally for a three to five-year period. The average time it takes to implement Dayforce typically ranges from three months for smaller customers to ninetwelve months for larger customers. Once Dayforce is implemented, the customer goes live, and weWe begin to generate recurring revenue.revenue when we provide a production instance to the customer. We also provide outsourced human resourceHR solutions to certain of our Dayforce customers, which are tailored to meet their individual needs, and entail performing the duties of a customer’s human resourcesHR department, including payroll processing, time and labor management, performance management, and recruiting, as needed.
TheWe offer Powerpay offering is our solution designed primarily for small market Canadian customers. The typical Powerpay customer hasorganizations with fewer than 20 employees, and the100 employees. The majority of thePowerpay revenue is generated from recurring fees charged on a per-employee, per-process basis. Typical processes include the customer’s payroll runs, year-end tax packages, and delivery of customers’ remittance advices or checks. Powerpay can typically be implemented on a remote basis within one to three days, at which point we start receiving recurring fees.
For our BureauOther recurring solutions, we typically charge recurring fees on a per-process basis. Typical processes include the customer’s payroll runs, year-end tax packages, and delivery of customers’ remittance advices or checks. In addition to customers who use our payroll services, certain customers use our tax filing services on a stand-alone basis. Our outsourced human resourceHR solutions are tailored to meet the needs of individual customers, and entail our contracting to perform many of the duties of a customer’s human resourcesHR department, including payroll processing, time and labor management, performance management, and recruiting. We also perform individual services for customers, such as check printing, wage attachment and disbursement, and ACA management.
CostHow We Assess Our Performance
In assessing our performance, we consider a variety of Revenueperformance indicators in addition to revenue and net income (loss). Set forth below is a description of our key performance measures.
Cost
|
| Year Ended December 31, |
| |||||
|
| 2023 |
|
| 2022 |
| ||
Live Dayforce customers (a) |
|
| 6,393 |
|
|
| 5,993 |
|
Cloud annualized recurring revenue (ARR) (a,b) (in millions) |
| $ | 1,250.6 |
|
| $ | 1,041.3 |
|
Annual Dayforce revenue retention rate (a,b) |
|
| 97.1 | % |
|
| 97.1 | % |
Dayforce recurring revenue per customer (b,c) |
| $ | 146,771 |
|
| $ | 121,425 |
|
Adjusted EBITDA (b) (in millions) |
| $ | 410.2 |
|
| $ | 250.4 |
|
Adjusted EBITDA margin (b) |
|
| 27.1 | % |
|
| 20.1 | % |
Live Dayforce Customers
We use the number of costslive Dayforce customers as an indicator of future revenue and the overall performance of the business and to deliverassess the performance of our solutions. Mostimplementation services. We market Dayforce to customers of these costsall sizes, including small (under 500 employees), major (500 to 5,999 employees), and enterprise (6,000 or more employees).
31 | 2023 Form 10-K
The following table sets forth the number of live Dayforce customers* at the end of the years presented:

Cloud Annualized Recurring Revenue (“ARR”)
We use Cloud ARR, a non-GAAP financial measure, to measure the size and growth of our recurring Cloud business, which we believe is useful to management and investors. We derive the majority of our Cloud revenues from recurring fees, primarily PEPM subscription charges. We also derive recurring revenue from fees related to the rental and maintenance of clocks, charges for once-a-year services, such as year-end tax statements, and float revenue on our customer funds before such funds are recognizedremitted to taxing authorities, customer employees, or other third parties. We set annual targets for Cloud ARR and monitor progress toward those targets on a quarterly basis.
Annual Dayforce Revenue Retention Rate
We use annual Dayforce revenue retention rate, a non-GAAP financial measure, to measure the percentage of revenues that we retain from our existing Dayforce customers, which we believe is useful to management and investors as incurred. Some costsan indicator of customer satisfaction and future revenues. Our annual Dayforce revenue are recognizedretention rate was above 97% for the years ended December 31, 2023, 2022, and 2021. We set annual targets for Dayforce revenue retention rate and monitor progress toward those targets on a quarterly basis by reviewing known and anticipated customer losses. Our Dayforce revenue retention rate may fluctuate as a result of a number of factors, including the mix of Dayforce solutions used by customers, the level of customer satisfaction, and changes in the period thatnumber of employees live on our Dayforce solutions.
Dayforce Recurring Revenue Per Customer
We use Dayforce recurring revenue per customer, a servicenon-GAAP financial measure, as an indicator of the average size of our Dayforce customer, which we believe is soldalso useful to management and delivered. Other costsinvestors. We calculate and monitor Dayforce recurring revenue per customer on a quarterly basis. Our Dayforce recurring revenue per customer may fluctuate as a result of revenue are recognized overa number of factors, including the periodnumber of use or in proportion to the related revenue.
The costs recognized as incurred consist primarily of customer service staff costs, customer technical support costs, implementation personnel costs, costs of hosting applications, consulting and purchased services, delivery services, and royalties. The costs of revenue recognized over the period of use are depreciation and amortization, rentals of facilities and equipment, and direct and incremental costs associated with deferred implementation service revenue.
Cost of recurring services revenues primarily consists of costs to provide maintenance and technical support to ourlive Dayforce customers and the costsnumber of hostingcustomers purchasing the full HCM suite.
*Excluding the 2021 acquisitions of Ascender and ADAM HCM.
32 | 2023 Form 10-K
Constant Currency Revenue
We present percentage change in revenue on a constant currency basis to assess how our applications. The costunderlying business performed, excluding the effect of recurring services revenues also includes compensation and other employee-related expenses for data center staff, payments to outside service providers, data center expenses, and networking expenses.
Cost of professional services and other revenues primarily consists of costs to provide implementation consulting services and training to our customers, as well as the cost of time clocks. Costs to provide implementation consulting services include compensation and other employee-related expenses for professional services staff, costs of subcontractors, and travel. Implementation consulting services are expected to continue to be primarily associated with the implementation of our Cloud solutions.
Product development and management expense, included in cost of revenue, consists of costs related to software development activities that do not qualify for capitalization, such as development, quality assurance, testing of new technologies, and enhancements to our existing solutions that do not result in additional functionality. Product development and management expense also includes costs related to the management of our solutions.
Depreciation and amortization related to cost of revenue primarily consists of amortization of capitalized software.
Selling, General, and Administrative Expense
Selling expense includes costs related to maintaining a direct marketing infrastructure and sales force and other direct marketing efforts, such as marketing events, advertising, telemarketing, direct mail, and trade shows. Advertising costs are expensed as incurred. Our sales and marketing expenses are expected to continue to be primarily associated with selling and marketing our Cloud solutions.
General and administrative expense includes costs that are not directly related to delivery of services, selling efforts, or product development and management, primarily consisting of corporate-level costs, such as administration, finance, legal, and human resources, as well as management fees payable to affiliates of our Sponsors, FNF and THLM, until termination of the management agreements upon IPO in April 2018. Also included in this category are depreciation, and amortization of other intangible assets not reflected in cost of revenue, the provision for doubtful accounts receivable, and net periodic pension costs.
Other Expense, net
Other expense, net includes the results of transactions that are not appropriately classified in another category. These items include certain foreign currency translation gainsrate fluctuations. We believe this non-GAAP financial measure is useful to management and losses resulting mainly from intercompany receivables and payables denominatedinvestors. We have calculated percentage change in currencies other thanrevenue on a constant currency basis by applying the subsidiary’s functional currency, environmental reserve charges, and charges relatedaverage foreign exchange rate in effect during the comparable prior period. The average U.S. dollar to the impairmentCanadian dollar foreign exchange rate was $1.35, with a daily range of asset values.
Income Tax Provision
Our income tax provision represents federal, state, and international taxes on our income recognized for financial statement purposes and includes the effects of temporary differences between financial statement income and income recognized for tax return purposes. Deferred tax assets and liabilities are recorded for temporary differences between the financial reporting basis and the tax basis of assets and liabilities as adjusted$1.31 to $1.39 for the expected benefitstwelve months ended December 31, 2023, compared to $1.30, with a daily range of utilizing net operating loss carryforwards. We record a valuation allowance$1.25 to reduce our deferred tax assets to reflect$1.39 for the net deferred tax assets that we believe will be realized. In assessing the likelihood that we will be able to recover our deferred tax assets and the need for a valuation allowance, we consider all available evidence, both positive and negative, including historical levels of pre-tax book income, expiration of net operating losses, expectations and risks associated with estimates of future taxable income and ongoing prudent and feasible tax planning strategies, as well as current tax laws.twelve months ended December 31, 2022. As of December 31, 2018, we continue2023, the U.S. dollar to recordCanadian dollar foreign exchange rate was $1.33.
Adjusted Operating Profit, Adjusted EBITDA, Adjusted EBITDA Margin, and Adjusted Cloud Recurring Gross Margin
We believe that Adjusted operating profit, Adjusted EBITDA, Adjusted EBITDA margin, and Adjusted Cloud recurring gross margin, non-GAAP financial measures, are useful to management and investors as supplemental measures to evaluate our overall operating performance. Adjusted EBITDA is a full valuation allowance againstcomponent of our domestic deferred tax assetsmanagement incentive plan and Adjusted Cloud recurring gross margin is a component of certain performance based equity awards for our named executive officers, and these metrics are used by management to assess performance and to compare our operating performance to our competitors. Management believes that Adjusted operating profit, Adjusted EBITDA, Adjusted EBITDA margin, and Adjusted Cloud recurring gross margin are helpful in highlighting management performance trends because these metrics exclude the results of decisions that are not offset byoutside the reversal of deferred tax liabilities. In the future, if it is determined that we no longer have a requirement to record a valuation allowance against all or a portionnormal course of our deferred tax assets,business operations.
Recent Events
Effective January 31, 2024, Ceridian HCM Holding Inc. changed its corporate name to Dayforce, Inc. Effective February 1, 2024, we ceased trading under the releaseticker symbol "CDAY" and began trading under our new ticker symbol, "DAY," on the NYSE and the TSX.
On February 1, 2024 we completed the purchase of 100% of the valuation allowance would haveoutstanding shares of eloomi A/S, a positive impact on our income tax provision.learning experience platform software provider based in Copenhagen, Denmark, and Orlando, Florida.
On December 22, 2017, the Tax Cut and Jobs Act legislation (the “Tax Act”) was enacted. The Tax Act amended the Code to reduce tax rates and to modify policies, credits, and deductions for businesses. For businesses, the Tax Act reduced the corporate federal tax rate from a maximum33 | 2023 Form 10-K
Table of 35% to a flat 21% rate.Contents
Year Ended December 31, 20182023 Compared with Year Ended December 31, 20172022
The following table sets forth our results of operations for the periods presented.presented:
|
| Year Ended December 31, |
|
| Increase/(Decrease) |
|
| Percentage of Revenue |
| |||||||||||||||
|
| 2023 |
|
| 2022 |
|
| Amount |
|
| % |
|
| 2023 |
|
| 2022 |
| ||||||
|
| (In millions) |
|
|
|
|
|
|
|
|
|
|
|
|
| |||||||||
Revenue: |
|
|
|
|
|
|
|
|
|
|
|
|
|
|
|
|
|
| ||||||
Recurring |
|
|
|
|
|
|
|
|
|
|
|
|
|
|
|
|
|
| ||||||
Cloud |
| $ | 1,211.4 |
|
| $ | 908.4 |
|
| $ | 303.0 |
|
|
| 33.4 | % |
|
| 80.0 | % |
|
| 72.9 | % |
Other |
|
| 85.9 |
|
|
| 139.2 |
|
|
| (53.3 | ) |
|
| (38.3 | )% |
|
| 5.7 | % |
|
| 11.2 | % |
Total recurring |
|
| 1,297.3 |
|
|
| 1,047.6 |
|
|
| 249.7 |
|
|
| 23.8 | % |
|
| 85.7 | % |
|
| 84.1 | % |
Professional services and other |
|
| 216.4 |
|
|
| 198.6 |
|
|
| 17.8 |
|
|
| 9.0 | % |
|
| 14.3 | % |
|
| 15.9 | % |
Total revenue |
|
| 1,513.7 |
|
|
| 1,246.2 |
|
|
| 267.5 |
|
|
| 21.5 | % |
|
| 100.0 | % |
|
| 100.0 | % |
Cost of revenue: |
|
|
|
|
|
|
|
|
|
|
|
|
|
|
|
|
|
| ||||||
Recurring |
|
|
|
|
|
|
|
|
|
|
|
|
|
|
|
|
|
| ||||||
Cloud |
|
| 278.5 |
|
|
| 254.4 |
|
|
| 24.1 |
|
|
| 9.5 | % |
|
| 18.4 | % |
|
| 20.4 | % |
Other |
|
| 46.4 |
|
|
| 55.0 |
|
|
| (8.6 | ) |
|
| (15.6 | )% |
|
| 3.1 | % |
|
| 4.4 | % |
Total recurring |
|
| 324.9 |
|
|
| 309.4 |
|
|
| 15.5 |
|
|
| 5.0 | % |
|
| 21.5 | % |
|
| 24.8 | % |
Professional services and other |
|
| 265.6 |
|
|
| 238.7 |
|
|
| 26.9 |
|
|
| 11.3 | % |
|
| 17.5 | % |
|
| 19.2 | % |
Product development and management |
|
| 209.9 |
|
|
| 169.9 |
|
|
| 40.0 |
|
|
| 23.5 | % |
|
| 13.9 | % |
|
| 13.6 | % |
Depreciation and amortization |
|
| 66.8 |
|
|
| 55.0 |
|
|
| 11.8 |
|
|
| 21.5 | % |
|
| 4.4 | % |
|
| 4.4 | % |
Total cost of revenue |
|
| 867.2 |
|
|
| 773.0 |
|
|
| 94.2 |
|
|
| 12.2 | % |
|
| 57.3 | % |
|
| 62.0 | % |
Gross profit |
|
| 646.5 |
|
|
| 473.2 |
|
|
| 173.3 |
|
|
| 36.6 | % |
|
| 42.7 | % |
|
| 38.0 | % |
Selling and marketing |
|
| 250.2 |
|
|
| 251.5 |
|
|
| (1.3 | ) |
|
| (0.5 | )% |
|
| 16.5 | % |
|
| 20.2 | % |
General and administrative |
|
| 263.2 |
|
|
| 247.5 |
|
|
| 15.7 |
|
|
| 6.3 | % |
|
| 17.4 | % |
|
| 19.8 | % |
Operating profit (loss) |
|
| 133.1 |
|
|
| (25.8 | ) |
|
| 158.9 |
|
|
| 615.9 | % |
|
| 8.8 | % |
|
| (2.1 | )% |
Interest expense, net |
|
| 36.1 |
|
|
| 28.6 |
|
|
| 7.5 |
|
|
| 26.2 | % |
|
| 2.4 | % |
|
| 2.3 | % |
Other expense, net |
|
| 1.0 |
|
|
| 8.5 |
|
|
| (7.5 | ) |
|
| (88.2 | )% |
|
| 0.1 | % |
|
| 0.7 | % |
Income (loss) before income taxes |
|
| 96.0 |
|
|
| (62.9 | ) |
|
| 158.9 |
|
|
| 252.6 | % |
|
| 6.3 | % |
|
| (5.0 | )% |
Income tax expense |
|
| 41.2 |
|
|
| 10.5 |
|
|
| 30.7 |
|
|
| 292.4 | % |
|
| 2.7 | % |
|
| 0.8 | % |
Net income (loss) |
| $ | 54.8 |
|
| $ | (73.4 | ) |
| $ | 128.2 |
|
|
| 174.7 | % |
|
| 3.6 | % |
|
| (5.9 | )% |
|
| Year Ended December 31, |
|
| Increase/ (Decrease) |
|
| % of Revenue |
| |||||||||||||||
|
| 2018 |
|
| 2017 |
|
| Amount |
|
| % |
|
| 2018 |
|
| 2017 |
| ||||||
|
| (Dollars in millions) |
|
|
|
|
|
|
|
|
|
|
|
|
| |||||||||
Revenue: |
|
|
|
|
|
|
|
|
|
|
|
|
|
|
|
|
|
|
|
|
|
|
|
|
Recurring services |
|
|
|
|
|
|
|
|
|
|
|
|
|
|
|
|
|
|
|
|
|
|
|
|
Cloud |
| $ | 443.1 |
|
| $ | 336.2 |
|
| $ | 106.9 |
|
|
| 31.8 | % |
|
| 59.4 | % |
|
| 50.1 | % |
Bureau |
|
| 209.4 |
|
|
| 262.3 |
|
|
| (52.9 | ) |
|
| (20.2 | )% |
|
| 28.1 | % |
|
| 39.1 | % |
Total recurring services |
|
| 652.5 |
|
|
| 598.5 |
|
|
| 54.0 |
|
|
| 9.0 | % |
|
| 87.4 | % |
|
| 89.2 | % |
Professional services and other |
|
| 93.9 |
|
|
| 72.3 |
|
|
| 21.6 |
|
|
| 29.9 | % |
|
| 12.6 | % |
|
| 10.8 | % |
Total revenue |
|
| 746.4 |
|
|
| 670.8 |
|
|
| 75.6 |
|
|
| 11.3 | % |
|
| 100.0 | % |
|
| 100.0 | % |
Cost of revenue: |
|
|
|
|
|
|
|
|
|
|
|
|
|
|
|
|
|
|
|
|
|
|
|
|
Recurring services |
|
|
|
|
|
|
|
|
|
|
|
|
|
|
|
|
|
|
|
|
|
|
|
|
Cloud |
|
| 141.1 |
|
|
| 125.1 |
|
|
| 16.0 |
|
|
| 12.8 | % |
|
| 18.9 | % |
|
| 18.6 | % |
Bureau |
|
| 59.2 |
|
|
| 71.7 |
|
|
| (12.5 | ) |
|
| (17.4 | )% |
|
| 7.9 | % |
|
| 10.7 | % |
Total recurring services |
|
| 200.3 |
|
|
| 196.8 |
|
|
| 3.5 |
|
|
| 1.8 | % |
|
| 26.8 | % |
|
| 29.3 | % |
Professional services and other |
|
| 132.2 |
|
|
| 135.8 |
|
|
| (3.6 | ) |
|
| (2.7 | )% |
|
| 17.7 | % |
|
| 20.2 | % |
Product development and management |
|
| 59.0 |
|
|
| 43.6 |
|
|
| 15.4 |
|
|
| 35.3 | % |
|
| 7.9 | % |
|
| 6.5 | % |
Depreciation and amortization |
|
| 34.3 |
|
|
| 31.3 |
|
|
| 3.0 |
|
|
| 9.6 | % |
|
| 4.6 | % |
|
| 4.7 | % |
Total cost of revenue |
|
| 425.8 |
|
|
| 407.5 |
|
|
| 18.3 |
|
|
| 4.5 | % |
|
| 57.0 | % |
|
| 60.7 | % |
Gross profit |
|
| 320.6 |
|
|
| 263.3 |
|
|
| 57.3 |
|
|
| 21.8 | % |
|
| 43.0 | % |
|
| 39.3 | % |
Costs and expenses: |
|
|
|
|
|
|
|
|
|
|
|
|
|
|
|
|
|
|
|
|
|
|
|
|
Selling, general, and administrative |
|
| 270.7 |
|
|
| 223.0 |
| �� |
| 47.7 |
|
|
| 21.4 | % |
|
| 36.3 | % |
|
| 33.2 | % |
Other (income) expense, net |
|
| (2.9 | ) |
|
| 7.3 |
|
|
| (10.2 | ) |
|
| (139.7 | )% |
|
| (0.4 | )% |
|
| 1.1 | % |
Operating profit |
|
| 52.8 |
|
|
| 33.0 |
|
|
| 19.8 |
|
|
| 60.0 | % |
|
| 7.1 | % |
|
| 4.9 | % |
Interest expense, net |
|
| 83.2 |
|
|
| 87.1 |
|
|
| (3.9 | ) |
|
| (4.5 | )% |
|
| 11.1 | % |
|
| 13.0 | % |
Loss from continuing operations before income taxes |
|
| (30.4 | ) |
|
| (54.1 | ) |
|
| 23.7 |
|
|
| 43.8 | % |
|
| (4.1 | )% |
|
| (8.1 | )% |
Income tax expense (benefit) |
|
| 7.7 |
|
|
| (49.6 | ) |
|
| 57.3 |
|
|
| 115.5 | % |
|
| 1.0 | % |
|
| (7.4 | )% |
Loss from continuing operations |
|
| (38.1 | ) |
|
| (4.5 | ) |
|
| (33.6 | ) |
|
| (746.7 | )% |
|
| (5.1 | )% |
|
| (0.7 | )% |
Loss from discontinued operations |
|
| (25.8 | ) |
|
| (6.0 | ) |
|
| (19.8 | ) |
|
| (330.0 | )% |
|
| (3.5 | )% |
|
| (0.9 | )% |
Net loss |
|
| (63.9 | ) |
|
| (10.5 | ) |
|
| (53.4 | ) |
|
| (508.6 | )% |
|
| (8.6 | )% |
|
| (1.6 | )% |
Net loss attributable to noncontrolling interest |
|
| (0.5 | ) |
|
| (1.3 | ) |
|
| 0.8 |
|
|
| 61.5 | % |
|
| (0.1 | )% |
|
| (0.2 | )% |
Net loss attributable to Ceridian |
| $ | (63.4 | ) |
| $ | (9.2 | ) |
| $ | (54.2 | ) |
|
| (589.1 | )% |
|
| (8.5 | )% |
|
| (1.4 | )% |
Adjusted EBITDA (a) |
| $ | 157.1 |
|
| $ | 117.8 |
|
| $ | 39.3 |
|
|
| 33.4 | % |
|
| 21.0 | % |
|
| 17.6 | % |
34 | 2023 Form 10-K
|
|
Revenue. The following table sets forth certain information regarding our consolidated revenues for the yearperiods presented:
|
| Year Ended December 31, |
|
| Percentage change in revenue |
|
| Impact of |
|
| Percentage change in revenue on a constant currency basis (a) |
| ||||||||
|
| 2023 |
|
| 2022 |
|
| 2023 vs. 2022 |
|
|
|
|
| 2023 vs. 2022 |
| |||||
|
| (In millions) |
|
|
|
|
|
|
|
|
|
| ||||||||
Revenue: |
|
|
|
|
|
|
|
|
|
|
|
|
|
|
| |||||
Recurring revenue: |
|
|
|
|
|
|
|
|
|
|
|
|
|
|
| |||||
Dayforce recurring, excluding float |
| $ | 962.9 |
|
| $ | 752.8 |
|
|
| 27.9 | % |
|
| (0.8 | )% |
|
| 28.7 | % |
Dayforce float |
|
| 148.2 |
|
|
| 62.4 |
|
|
| 137.5 | % |
|
| (2.1 | )% |
|
| 139.6 | % |
Total Dayforce recurring |
|
| 1,111.1 |
|
|
| 815.2 |
|
|
| 36.3 | % |
|
| (0.9 | )% |
|
| 37.2 | % |
Powerpay recurring, excluding float |
|
| 81.9 |
|
|
| 80.7 |
|
|
| 1.5 | % |
|
| (3.7 | )% |
|
| 5.2 | % |
Powerpay float |
|
| 18.4 |
|
|
| 12.5 |
|
|
| 47.2 | % |
|
| (5.6 | )% |
|
| 52.8 | % |
Total Powerpay recurring |
|
| 100.3 |
|
|
| 93.2 |
|
|
| 7.6 | % |
|
| (4.0 | )% |
|
| 11.6 | % |
Total Cloud recurring |
|
| 1,211.4 |
|
|
| 908.4 |
|
|
| 33.4 | % |
|
| (1.2 | )% |
|
| 34.6 | % |
Other recurring (b) |
|
| 85.9 |
|
|
| 139.2 |
|
|
| (38.3 | )% |
|
| (2.0 | )% |
|
| (36.3 | )% |
Total recurring revenue |
|
| 1,297.3 |
|
|
| 1,047.6 |
|
|
| 23.8 | % |
|
| (1.4 | )% |
|
| 25.2 | % |
Professional services and other (c) |
|
| 216.4 |
|
|
| 198.6 |
|
|
| 9.0 | % |
|
| (1.1 | )% |
|
| 10.1 | % |
Total revenue |
| $ | 1,513.7 |
|
| $ | 1,246.2 |
|
|
| 21.5 | % |
|
| (1.3 | )% |
|
| 22.8 | % |
|
| Year Ended December 31, |
|
| Growth rate year-over- year |
|
| Impact of changes in foreign currency(a) |
|
| Growth rate on a constant currency basis (a) |
| ||||||||
|
| 2018 |
|
| 2017 |
|
| 2018 vs. 2017 |
|
|
|
|
| 2018 vs. 2017 |
| |||||
|
| (Dollars in millions) |
|
|
|
|
|
|
|
|
|
|
|
|
| |||||
Revenue |
|
|
|
|
|
|
|
|
|
|
|
|
|
|
|
|
|
|
|
|
Cloud |
|
|
|
|
|
|
|
|
|
|
|
|
|
|
|
|
|
|
|
|
Recurring services |
| $ | 443.1 |
|
| $ | 336.2 |
|
|
| 31.8 | % |
|
| (0.2 | )% |
|
| 32.0 | % |
Professional services and other |
|
| 91.2 |
|
|
| 68.1 |
|
|
| 33.9 | % |
|
| 0.5 | % |
|
| 33.4 | % |
Total Cloud revenue |
|
| 534.3 |
|
|
| 404.3 |
|
|
| 32.2 | % |
|
| (0.1 | )% |
|
| 32.3 | % |
Bureau |
|
|
|
|
|
|
|
|
|
|
|
|
|
|
|
|
|
|
|
|
Recurring services |
|
| 209.4 |
|
|
| 262.3 |
|
|
| (20.2 | )% |
|
| 0.1 | % |
|
| (20.3 | )% |
Professional services and other |
|
| 2.7 |
|
|
| 4.2 |
|
|
| (35.7 | )% |
|
| (2.4 | )% |
|
| (33.3 | )% |
Total Bureau revenue |
|
| 212.1 |
|
|
| 266.5 |
|
|
| (20.4 | )% |
|
| 0.1 | % |
|
| (20.5 | )% |
Total revenue |
| $ | 746.4 |
|
| $ | 670.8 |
|
|
| 11.3 | % |
|
| — |
|
|
| 11.3 | % |
|
|
Total revenue increased $75.6$267.5 million, or 11.3%21.5%, to $746.4$1,513.7 million for the year ended December 31, 2018,2023, compared to $670.8$1,246.2 million for the year ended December 31, 2017.2022. This increase was primarily driven by an increase in Cloudlive Dayforce customers, the increase in Dayforce recurring revenue per customer, and the increase in float revenue. The number of $130.0live Dayforce customers increased 6.7% to 6,393 at December 31, 2023 from 5,993 at December 31, 2022, representing approximately 6.84 million or 32.2%global employees*. Additionally for the trailing twelve months ended December 31, 2023, Dayforce recurring revenue per customer grew to $146,771 compared to $121,425 for the comparable period in 2022.
The increase in Dayforce recurring revenue per customer is driven by our growing average customer size, as we have been expanding within the enterprise segment, as well as more customers purchasing the comprehensive suite of Dayforce functionality. At the end of 2023, enterprise businesses, major businesses, and small businesses accounted for 59%, 36% and 5% of the total number of global employees, respectively, as compared to the end of 2022, when enterprise businesses, major businesses, and small businesses accounted for 51%, 41% and 8% of the total number of global employees, respectively.*
Tax migration from $404.3 millionlegacy infrastructure to the same platform as Dayforce contributed approximately 490 basis points of growth for the year ended December 31, 20172023 to $534.3 million for the year ended December 31, 2018. The CloudDayforce recurring revenue, increase was primarily due to an increase of $106.9 million, or 31.8%, in Cloud recurring services revenue, and $23.1 million, or 33.9%, in Cloud professional services and other revenue. excluding float.
The increase in Cloud recurring services revenue of $106.9 million was attributable to increases of $76.0 million from new customers, add-ons, and revenue uplift from migrations of Bureau customers; $22.9 million from the migration of Bureau customers; and $20.0 million from increased float revenue related to Cloud recurring services revenue, partially offset by customer attrition of $12.0 million. The increase in Cloud revenue was partially offset by a decline in Bureau revenue of $54.4 million, or 20.4%. There was an immaterial impact on revenue due to changes in foreign currency rate fluctuations. Please refer to the table above for our revenue growth rates on a constant currency basis.
Of the decline in Bureau revenue, approximately 58% wasis driven by customer attrition and approximately 42% was attributable to customer migrations to Dayforce. Excluding the impact of migrations, our annual Bureau revenue retention rate was 86.9% in 2018 and 89.7% in 2017. For the year ended December 31, 2018, recurring services revenue from payroll Bureau customers accounted for $161.2 million, and tax-only Bureau recurring services revenue accounted for $48.2 million. The payroll Bureau customers consist of approximately 1.5 million active users, of which approximately 1.4 million are customers that we believe could be candidates for migration to Dayforce. Some of our customers are not candidates to migrate to Dayforce due to a variety of factors, including the type of functionality that they require and their system configuration. Of the approximately 1.4 million active users that we believe could be candidates for migration to Dayforce, small businesses accounted for 21% of the total number of active users, mid-sized businesses accounted for 28% of the total number of active users, and enterprise businesses accounted for 51% of the total number of active users.
Cloud revenue by solution. The following table presents our Cloud revenue for both recurring and professional services and other, for both our Dayforce and Powerpay solution for the periods presented.
|
| Year Ended December 31, |
|
| Growth rate year-over- year |
|
| Growth rate on a constant currency basis |
| |||||||
|
| 2018 |
|
| 2017 |
|
| 2018 vs. 2017 |
|
| 2018 vs. 2017 |
| ||||
|
| (Dollars in millions) |
|
|
|
|
|
|
|
|
| |||||
Dayforce |
| $ | 443.0 |
|
| $ | 319.9 |
|
|
| 38.5 | % |
|
| 38.5 | % |
Powerpay |
|
| 91.3 |
|
|
| 84.4 |
|
|
| 8.2 | % |
|
| 8.3 | % |
Total Cloud Revenue |
| $ | 534.3 |
|
| $ | 404.3 |
|
|
| 32.2 | % |
|
| 32.3 | % |
Cloud revenue was $534.3 million for 2018, an increase of 32.2% when compared to 2017. Dayforce revenue grew 38.5%, and Powerpay revenue grew 8.2% in 2018 as compared to 2017. There was an immaterial impact on revenue due to changes in foreign currency rate fluctuations. Please refer to the table above for our revenue growth rates on a constant currency basis. Our new business sales to Dayforce and Powerpay customers comprised 82% of our3.0% increase in Cloud revenue for the year ended December 31, 2018, and the remaining 18% consisted primarily of customer migration to Dayforce from our Bureau solutions. As we migrate our Bureau customers to Dayforce, we typically experience a revenue increase from such customers driven by increased product density on the Dayforce platform. This revenue increase can vary by customer, but has been 22% on average since 2016, as measured at the time of initial migration.
Float revenue. Investment income from invested customer trust funds included in revenue was $67.0 million and $46.5 million for the years ended December 31, 2018 and 2017, respectively. The average float balance for our customer trust funds for the year ended December 31, 2018 was $3,361.5 million,2023, which increased to $4.50 billion, compared to $3,228.2 million$4.37 billion for the year ended December 31, 2017. The2022, in addition to an increase in average yield was 2.00% duringof 192 basis points compared to the year ended December 31, 2018, an increase of 55 basis points compared to the average yield for the year ended December 31, 2017. Based on current investment practices, an increase in market investment rates of 100 basis points would increase float revenue by approximately $17 million over the twelve months following a rate increase. In addition to interest rate risks, we also have exposure to risks associated with changes in laws and regulations that may affect customer fund balances. For example, a change in regulations, either reducing the amount of taxes to be withheld or allowing less time to remit taxes to government authorities, would reduce our average customer trust fund balances and float revenue. There are no incremental costs of revenue associated with increases or declines in float revenue.2022.
Cost of revenue. Total cost of revenue for the year ended December 31, 2018,2023, was $425.8$867.2 million, an increase of $18.3$94.2 million, or 4.5%12.2%, compared to the year ended December 31, 2017. Of2022.
*Excluding the total $18.3 million increase, $2.1 million was attributable to IPO-related share-based compensation expense. Excluding IPO-related items, cost2021 acquisitions of revenue increased $16.2 million. Ascender and ADAM HCM.
35 | 2023 Form 10-K
Recurring services cost of revenue increased by $3.5$15.5 million, or 5.0%, for the year ended December 31, 2018,2023, compared to the year ended December 31, 2017,2022, primarily due to additional labor-related costs incurred to support the growing Dayforce customer base globally, partially offset by reductionsa reduction in severance and restructuring costs related to supportthe integration of acquisitions and re-balancing of resources across our Bureau customers.global footprint during the year ended December 31, 2022.
The reduction inProfessional services and other cost of revenue for professional services and other of $3.6increased $26.9 million, or 11.3%, for the year ended December 31, 2018,2023, compared to the year ended December 31, 2017, was2022, primarily due to productivity improvementsincreased labor-related costs incurred to take new customers live and increased share-based compensation expense.
Product development and management expense increased $40.0 million, or 23.5%, for the year ended December 31, 2023, compared to the year ended December 31, 2022. The increase reflects additional personnel costs, including share-based compensation. For the years ended December 31, 2023, and 2022, our investment in implementing new customers.
In accordance with Accounting Standards Codification (“ASC”) 350, we are required to capitalize certain software development costs.was $198.5 million and $162.2 million, respectively, consisting of $112.0 million and $92.3 million of research and development expense, and $86.5 million and $69.9 million of capitalized software development, respectively. Please refer toPart II, Item 8, Note 2, “Summary of Significant Accounting Policies,” for further discussion of our accounting policy for capitalizing internally developed software costs. Costs related to software development activities that do not qualify for capitalization, such as development, quality assurance, testing of new technologies, enhancements to our existing solutions that do not result in additional functionality, and costs related to the management of our solutions are presented as product development and management expense. The increase in product development and management expense of $15.4 million for the year ended December 31, 2018, compared to the year ended December 31, 2017, reflects increases in Dayforce product development efforts. For the years ended December 31, 2018, and 2017, our investment in software development was $54.9 million and $45.0 million, respectively, consisting of $29.6 million and $19.0 million of research and development expense, which is included within product development and management expense, and $25.3 million and $26.0 million of capitalized software development, respectively.
Depreciation and amortization expense associated with cost of revenue increased by $3.0$11.8 million, or 21.5%, for the year ended December 31, 2018,2023, compared to the year ended December 31, 2017,2022, as we continue to capitalize Dayforce related and other development costs and subsequently amortize those costs.
Gross profit and gross margin. The following table below presents total gross margin and solution gross margins for the periods presented:
|
| Year Ended December 31, |
| |||||||||||||
|
| Year Ended December 31, |
|
| 2023 |
|
| 2022 |
| |||||||
|
| 2018 |
|
| 2017 |
|
|
|
|
|
| |||||
Total gross margin |
|
| 43.0 | % |
|
| 39.3 | % |
|
| 42.7 | % |
|
| 38.0 | % |
Gross margin by solution: |
|
|
|
|
|
|
|
|
|
|
|
|
|
| ||
Cloud recurring services |
|
| 68.2 | % |
|
| 62.8 | % | ||||||||
Bureau recurring services |
|
| 71.7 | % |
|
| 72.7 | % | ||||||||
Cloud recurring |
|
| 77.0 | % |
|
| 72.0 | % | ||||||||
Other recurring |
|
| 46.0 | % |
|
| 60.5 | % | ||||||||
Professional services and other |
|
| (40.8 | )% |
|
| (87.8 | )% |
|
| (22.7 | )% |
|
| (20.2 | )% |
Total gross margin is defined as total gross profit as a percentage of total revenue, which is inclusive of product development and management costs, as well as depreciation and amortization associated with cost of revenue. Gross margin for each solution in the table above is defined as total revenue less cost of revenue for the applicable solution as a percentage of total revenue for that related solution, which is exclusive of any product development and management or depreciation and amortization cost allocations.
The overall 11.3% increase in revenue outpaced the 4.5% increase in cost of revenue, and gross profit increased by $57.3 million, or 21.8%, as we continued to leverage our investment in people and processes to realize economies of scale.
Cloud recurring servicesTotal gross margin was 68.2% for the year ended December 31, 2018,2023 increased 470 basis points compared to 62.8%December 31, 2022, and gross profit increased by $173.3 million, or 36.6%, for the year ended December 31, 2017.2023 compared to the year ended December 31, 2022. The increase in gross margin and gross profit was primarily due to the increase in revenue, including float revenue, which outpaced the increase in cost of revenue.
Cloud recurring gross margin was 77.0% for the year ended December 31, 2023, compared to 72.0% for the year ended December 31, 2022. The increase in Cloud recurring services gross margin reflects anwas primarily due to the increase in float revenue and reduction in severance expense associated with the re-balancing of resources across our global footprint in 2022. The increase is also due to the growth of the proportion of Dayforce customers live for more than two years, which increased from 59%82% as of December 31, 20172022 to 63%85% as of December 31, 2018, and was also attributable to consistent configuration of new customers, which enabled us to realize economies of scale in customer support and hosting costs. 2023.
Professional services and other gross margin was (40.8)(22.7)% for the year ended December 31, 2018, improving2023, declining from (87.8)(20.2)% for the year ended December 31, 2018,2022, reflecting additional costs incurred to take new customers live, expansion of our capabilities to serve international customers, and increased share-based compensation.
Selling and marketing expense. Selling and marketing expense decreased $1.3 million, or 0.5%, for the year ended December 31, 2023, compared to the year ended December 31, 2022. The reduction in selling and marketing expense is primarily driven by a reduction in commission expense due to increasing the expected period of benefit of our deferred sales commissions from five years to ten years, partially offset by an increase in profitable post go-live professional services and productivity improvementsinvestment in implementing new customers.our sales force in order to support our growth initiatives.
Selling, general,36 | 2023 Form 10-K
General and administrative expense. Selling, General and administrative expense increased $15.7 million, or 6.3%, for the year ended December 31, 2023, compared to the year ended December 31, 2022. The increase in general and administrative expense increased $47.7is driven by increases in amortization of acquisition-related intangible assets and employee-related costs, partially offset by a reduction in share-based compensation related to specific individual awards becoming fully vested or forfeited during 2023. In the third quarter of 2023, our Board of Directors approved plans to transition our Company’s name and branding from Ceridian HCM Holding Inc. to Dayforce, Inc. Given the significance of this transition, we assessed the impact on the carrying amount of $167.2 million related to our Ceridian trade name intangible asset. The Ceridian trade name was deemed to have a finite life of two years and began being amortized in the third quarter of 2023, leading to an increase in amortization expense for the year ended December 31, 2023.
Operating profit (loss). Operating profit for the year ended December 31, 2023, was $133.1 million, compared to operating loss of $25.8 million for the year ended December 31, 2018, compared to the year ended December 31, 2017. Of the total $47.72022. The $158.9 million increase, $24.5 million was attributable to transaction expenses associated with our IPO, debt refinancing, and secondary offering, including $11.3 million in sponsor management termination fees, $6.0 million in IPO-related share-based compensation expense, $3.7 million in other IPO transactions costs, and $3.5 million in restructuring consulting expenses. Excluding transaction-related items, selling, general, and administrative expense increased $23.2 million, primarily due to sales and marketing expense, which increased by $13.4 million. We continue to invest in our sales and marketing efforts, as we drive growth in our Cloud solutions, particularly in Dayforce. The increase in selling, general, and administrative expenses also reflected increases in employee related costs and increased costs associated with being a public company.
Other (income) expense, net. For the year ended December 31, 2018, we incurred $2.9 million of other income, net, compared to $7.3 million of other expense, net, for the year ended December 31, 2017. The other (income) expense, net, for the years ended December 31, 2018, and 2017, was primarily related to remeasurement gains and losses an intercompany payable denominated in a foreign currency, which was repaid in the second quarter of 2018.
Operating profit. We realized operating profit of $52.8 million for the year ended December 31, 2018, compared to an operating profit of $33.0 million for the year ended December 31, 2017. Excluding the impact of $24.5 million in transaction costs within selling, general, and administrative expense, and $2.1 million in other increased share-based compensation expense related to the IPO within cost of revenue, operating profit would have been $79.4 million for the year ended December 31, 2018. This $46.4 million increase was primarily due to a $75.6 million increase in revenue and gross margin improvement.
Interest expense, net. Interest expense for the year ended December 31, 2018, was $83.2 million, compared to $87.1 million for the year ended December 31, 2017. This reductionchange was primarily due to the refinancing of our debt, which resultedincrease in arevenue, including float revenue, gross margin expansion, reductions in severance and restructuring expenses, and the reduction in interestcommission expense, of $30.6 million upon the extinguishment of the Senior Notes in April 2018, representing seven fewer months of interest on the Senior Notes as compared to the prior year, partially offset by a loss on extinguishment of debt of $25.7 million. As of December 31, 2018, a 100 point basis increase in the London Inter-bank Offered Rate (“LIBOR”) rates would result in an approximately $7 million increase in our interest expense over the ensuring twelve-month period. Please refer to Note 9, “Debt,” for additional information.
Income tax expense. For the year ended December 31, 2018, we had income tax expense of $7.7 million, compared to income tax benefit of $49.6 million for the year ended December 31, 2017. The $57.3 million increase in tax expense is primarily attributable to the $59.4 million tax benefit recorded during the year ended December 31, 2017, reflecting the revaluation of our deferred tax assets and liabilities upon the initial implementation of the Tax Act.
Loss from discontinued operations. As a result of the LifeWorks Disposition, the financial results of the LifeWorks business have been included within discontinued operations for all periods presented. For the year ended December 31, 2018, we had a loss from discontinued operations of $25.8 million, compared to $6.0 million for the year ended December 31, 2017. The loss from discontinued operations for the year ended December 31, 2018, is primarily related to income tax expense incurred as a result of the LifeWorks Disposition.
Net loss attributable to Ceridian. Net loss attributable to Ceridian was $63.4 for the year ended December 31, 2018, primarily due to $52.3 million of expenses incurred related to our IPO, debt refinancing, and secondary offering transactions, partially offset by an increase in gross profit. Net loss attributable to Ceridian was $9.2 for the year ended December 31, 2017, primarily due to a tax benefit of approximately $59.4 million related to the 2017 tax reform legislation. Please refer to the “Our History” section above for additional information on the financial statement impacts of our IPO, debt refinancing, and secondary offering transactions.amortization expense.
Adjusted EBITDA. Adjusted EBITDA increased by $39.3 million for the year ended December 31, 2018, compared to the year ended December 31, 2017, and Adjusted EBITDA margin increased to 21.0% in 2018 from 17.6% in 2017.
Year Ended December 31, 2017 Compared with Year Ended December 31, 2016
The following table sets forth our results of operations for the periods presented.
|
| Year Ended December 31, |
|
| Increase/ (Decrease) |
|
| % of Revenue |
| |||||||||||||||
|
| 2017 |
|
| 2016 |
|
| Amount |
|
| % |
|
| 2017 |
|
| 2016 |
| ||||||
|
| (Dollars in millions) |
|
|
|
|
|
|
|
|
|
|
|
|
| |||||||||
Revenue: |
|
|
|
|
|
|
|
|
|
|
|
|
|
|
|
|
|
|
|
|
|
|
|
|
Recurring services |
|
|
|
|
|
|
|
|
|
|
|
|
|
|
|
|
|
|
|
|
|
|
|
|
Cloud |
| $ | 336.2 |
|
| $ | 239.5 |
|
| $ | 96.7 |
|
|
| 40.4 | % |
|
| 50.1 | % |
|
| 38.4 | % |
Bureau |
|
| 262.3 |
|
|
| 319.0 |
|
|
| (56.7 | ) |
|
| (17.8 | )% |
|
| 39.1 | % |
|
| 51.2 | % |
Total recurring services |
|
| 598.5 |
|
|
| 558.5 |
|
|
| 40.0 |
|
|
| 7.2 | % |
|
| 89.2 | % |
|
| 89.6 | % |
Professional services and other |
|
| 72.3 |
|
|
| 64.9 |
|
|
| 7.4 |
|
|
| 11.4 | % |
|
| 10.8 | % |
|
| 10.4 | % |
Total revenue |
|
| 670.8 |
|
|
| 623.4 |
|
|
| 47.4 |
|
|
| 7.6 | % |
|
| 100.0 | % |
|
| 100.0 | % |
Cost of revenue: |
|
|
|
|
|
|
|
|
|
|
|
|
|
|
|
|
|
|
|
|
|
|
|
|
Recurring services |
|
|
|
|
|
|
|
|
|
|
|
|
|
|
|
|
|
|
|
|
|
|
|
|
Cloud |
|
| 125.1 |
|
|
| 86.2 |
|
|
| 38.9 |
|
|
| 45.1 | % |
|
| 18.6 | % |
|
| 13.8 | % |
Bureau |
|
| 71.7 |
|
|
| 128.2 |
|
|
| (56.5 | ) |
|
| (44.1 | )% |
|
| 10.7 | % |
|
| 20.6 | % |
Total recurring services |
|
| 196.8 |
|
|
| 214.4 |
|
|
| (17.6 | ) |
|
| (8.2 | )% |
|
| 29.3 | % |
|
| 34.4 | % |
Professional services and other |
|
| 135.8 |
|
|
| 115.6 |
|
|
| 20.2 |
|
|
| 17.5 | % |
|
| 20.2 | % |
|
| 18.5 | % |
Product development and management |
|
| 43.6 |
|
|
| 43.3 |
|
|
| 0.3 |
|
|
| 0.7 | % |
|
| 6.5 | % |
|
| 6.9 | % |
Depreciation and amortization |
|
| 31.3 |
|
|
| 23.1 |
|
|
| 8.2 |
|
|
| 35.5 | % |
|
| 4.7 | % |
|
| 3.7 | % |
Total cost of revenue |
|
| 407.5 |
|
|
| 396.4 |
|
|
| 11.1 |
|
|
| 2.8 | % |
|
| 60.7 | % |
|
| 63.6 | % |
Gross profit |
|
| 263.3 |
|
|
| 227.0 |
|
|
| 36.3 |
|
|
| 16.0 | % |
|
| 39.3 | % |
|
| 36.4 | % |
Costs and expenses: |
|
|
|
|
|
|
|
|
|
|
|
|
|
|
|
|
|
|
|
|
|
|
|
|
Selling, general, and administrative |
|
| 223.0 |
|
|
| 225.3 |
|
|
| (2.3 | ) |
|
| (1.0 | )% |
|
| 33.2 | % |
|
| 36.1 | % |
Other expense, net |
|
| 7.3 |
|
|
| 12.9 |
|
|
| (5.6 | ) |
|
| (43.4 | )% |
|
| 1.1 | % |
|
| 2.1 | % |
Operating profit (loss) |
|
| 33.0 |
|
|
| (11.2 | ) |
|
| 44.2 |
|
|
| 394.6 | % |
|
| 4.9 | % |
|
| (1.8 | )% |
Interest expense, net |
|
| 87.1 |
|
|
| 87.4 |
|
|
| (0.3 | ) |
|
| (0.3 | )% |
|
| 13.0 | % |
|
| 14.0 | % |
Loss from continuing operations before income taxes |
|
| (54.1 | ) |
|
| (98.6 | ) |
|
| 44.5 |
|
|
| 45.1 | % |
|
| (8.1 | )% |
|
| (15.8 | )% |
Income tax (benefit) expense |
|
| (49.6 | ) |
|
| 6.7 |
|
|
| (56.3 | ) |
|
| (840.3 | )% |
|
| (7.4 | )% |
|
| 1.1 | % |
Loss from continuing operations |
|
| (4.5 | ) |
|
| (105.3 | ) |
|
| 100.8 |
|
|
| 95.7 | % |
|
| (0.7 | )% |
|
| (16.9 | )% |
(Loss) income from discontinued operations |
|
| (6.0 | ) |
|
| 12.5 |
|
|
| (18.5 | ) |
|
| (148.0 | )% |
|
| (0.9 | )% |
|
| 2.0 | % |
Net loss |
|
| (10.5 | ) |
|
| (92.8 | ) |
|
| 82.3 |
|
|
| 88.7 | % |
|
| (1.6 | )% |
|
| (14.9 | )% |
Net (loss) income attributable to noncontrolling interest |
|
| (1.3 | ) |
|
| 0.1 |
|
|
| (1.4 | ) |
|
| (1400.0 | )% |
|
| (0.2 | )% |
|
| 0.0 | % |
Net loss attributable to Ceridian |
| $ | (9.2 | ) |
| $ | (92.9 | ) |
| $ | 83.7 |
|
|
| 90.1 | % |
|
| (1.4 | )% |
|
| (14.9 | )% |
Adjusted EBITDA (a) |
| $ | 117.8 |
|
| $ | 85.5 |
|
| $ | 32.3 |
|
|
| 37.8 | % |
|
| 17.6 | % |
|
| 13.7 | % |
|
|
Revenue. The following table sets forth certain information regarding our consolidated revenues for the year ended December 31, 2017, compared with the year ended December 31, 2016.
|
| Year Ended December 31, |
|
| Growth rate year-over- year |
|
| Impact of changes in foreign currency(a) |
|
| Growth rate on a constant currency basis (a) |
| ||||||||
|
| 2017 |
|
| 2016 |
|
| 2017 vs. 2016 |
|
|
|
|
| 2017 vs. 2016 |
| |||||
|
| (Dollars in millions) |
|
|
|
|
|
|
|
|
|
|
|
|
| |||||
Revenue |
|
| �� |
|
|
|
|
|
|
|
|
|
|
|
|
|
|
|
|
|
Cloud |
|
|
|
|
|
|
|
|
|
|
|
|
|
|
|
|
|
|
|
|
Recurring services |
| $ | 336.2 |
|
| $ | 239.5 |
|
|
| 40.4 | % |
|
| 1.4 | % |
|
| 39.0 | % |
Professional services and other |
|
| 68.1 |
|
|
| 58.3 |
|
|
| 16.8 | % |
|
| 0.9 | % |
|
| 15.9 | % |
Total Cloud revenue |
|
| 404.3 |
|
|
| 297.8 |
|
|
| 35.8 | % |
|
| 1.3 | % |
|
| 34.5 | % |
Bureau |
|
|
|
|
|
|
|
|
|
|
|
|
|
|
|
|
|
|
|
|
Recurring services |
|
| 262.3 |
|
|
| 319.0 |
|
|
| (17.8 | )% |
|
| 0.4 | % |
|
| (18.2 | )% |
Professional services and other |
|
| 4.2 |
|
|
| 6.6 |
|
|
| (36.4 | )% |
|
| — |
|
|
| (36.4 | )% |
Total Bureau revenue |
|
| 266.5 |
|
|
| 325.6 |
|
|
| (18.2 | )% |
|
| 0.4 | % |
|
| (18.6 | )% |
Total revenue |
| $ | 670.8 |
|
| $ | 623.4 |
|
|
| 7.6 | % |
|
| 0.8 | % |
|
| 6.8 | % |
|
|
Total revenue increased $47.4 million, or 7.6%, to $670.8 million for the year ended December 31, 2017, compared to $623.4 million for the year ended December 31, 2016. This increase was primarily driven by an increase in Cloud revenue of $106.5 million, or 35.8%, from $297.8 million for the year ended December 31, 2016 to $404.3 million for the year ended December 31, 2017. The Cloud revenue increase was driven by an increase of $96.7 million, or 40.4%, in Cloud recurring services revenue, and $9.8 million, or 16.8%, in Cloud professional services and other revenue. The increase in Cloud recurring services revenue of $96.7 million was due to $68.0 million from new customers, add-ons, and revenue uplift from migrations of Bureau customers; $28.1 million from the migration of Bureau customers; $10.0 million from increased float revenue related to Cloud recurring services revenue; partially offset by customer losses of $9.4 million. The increase in Cloud revenue was partially offset by a decline in Bureau recurring services revenue of $56.7 million, or 17.8%.
On a constant currency basis, total revenue grew 6.8%. This adjusted revenue growth was driven by an increase of 34.5% in Cloud revenue, partially offset by a decline of 18.6% in Bureau revenue. On a constant currency basis, Cloud revenue growth for the year ended December 31, 2017, compared to the year ended December 31, 2016, was driven by Cloud recurring services revenue, which increased by 39.0%, and professional services and other revenue, which increased by 15.9%, as we continued to sign and to activate new customers.
Of the decline in Bureau revenue, approximately 50% was driven by customer attrition and approximately 50% was driven by customer migrations to Dayforce. Excluding the impact of migrations, our annual Bureau revenue retention rate was 89.7% in 2017 and 87.4% in 2016. For the year ended December 31, 2017, recurring services revenue from payroll Bureau customers accounted for $210.2 million and tax-only Bureau recurring services revenue accounted for $52.1 million. The payroll Bureau customers consist of approximately 1.9 million active users, of which approximately 1.7 million of these active users are with customers that we believe could be candidates for migration to Dayforce. Some of our customers are not candidates to migrate to Dayforce due to a variety of factors, including the type of functionality that they require and their system configuration. Of the approximately 1.7 million active users, small businesses accounted for 20% of the total number of active users, mid-sized businesses accounted for 30% of the total number of active users, and enterprise businesses accounted for 50% of the total number of active users.
Cloud revenue by solution. The following table presents our Cloud revenue for both recurring and professional services and other, for both our Dayforce and Powerpay solution for the periods presented.
|
| Year Ended December 31, |
|
| Growth rate year-over- year |
|
| Growth rate on a constant currency basis |
| |||||||
|
| 2017 |
|
| 2016 |
|
| 2017 vs. 2016 |
|
| 2017 vs. 2016 |
| ||||
|
| (Dollars in millions) |
|
|
|
|
|
|
|
|
| |||||
Dayforce |
| $ | 319.9 |
|
| $ | 219.0 |
|
|
| 46.1 | % |
|
| 45.5 | % |
Powerpay |
|
| 84.4 |
|
|
| 78.8 |
|
|
| 7.1 | % |
|
| 4.6 | % |
Total Cloud Revenue |
| $ | 404.3 |
|
| $ | 297.8 |
|
|
| 35.8 | % |
|
| 34.5 | % |
Cloud revenue was $404.3 million during 2017, an increase of 35.8% when compared to 2016. Dayforce revenue grew 46.1%, and Powerpay revenue grew 7.1% during 2017 as compared to 2016. Our new business sales to Dayforce customers comprised 74% of our increase in Cloud revenue for the year ended December 31, 2017, and the remaining 26% consisted primarily of customer migration to Dayforce from our Bureau solutions.
Float revenue. Investment income from invested customer trust funds included in revenue was $46.5 million and $39.1 million for the years ended December 31, 2017 and 2016, respectively. The average float balance for our customer trust funds for the year ended December 31, 2017, was $3,228.2 million, compared to $3,260.4 million for the year ended December 31, 2016. The yield was 1.44% during the year ended December 31, 2017, an increase of 24 basis points compared to the year ended December 31, 2016. In addition to interest rate risks, we also have exposure to risks associated with changes in laws and regulations that may affect customer fund balances. For example, a change in regulations, either reducing the amount of taxes to be withheld or allowing less time to remit taxes to government authorities, would reduce our average customer trust fund balances and float revenue. There are no incremental costs of revenue associated with increases or declines in float revenue.
Cost of revenue. Total cost of revenue for the year ended December 31, 2017, was $407.5 million, an increase of $11.1 million, or 2.8%, compared to the year ended December 31, 2016.
During 2017, we changed the presentation and classification of certain expenses within our statements of operations to better facilitate comparisons with revenue and expenses of similar businesses, to better align our income statement presentation with the way management and reporting of our business has evolved internally, and to enhance our overall disclosure and understanding of the business for external users. We reallocated certain expenses between cost of recurring services revenue, cost of professional services and other revenue, and selling, general, and administrative expense. The net impact of these reallocations was to increase total cost of revenue by $3.4 million and to reduce selling, general, and administrative expense by $3.4 million. These changes in presentation and classification represent a change in estimate and have been accounted for on a prospective basis. Therefore, to facilitate the discussion in this section, the following table presents the actual reported costs and expenses as well as the costs and expenses on a pro forma basis as if the changes to allocation methodologies in 2017 had been in effect in 2016:
|
| Year Ended December 31, |
|
| Pro Forma Increase (Decrease) |
| ||||||||||||||
|
| 2017 |
|
| 2016 |
|
| 2016 Pro Forma |
|
| Amount |
|
| % |
| |||||
|
| (Dollars in millions) |
|
|
|
|
| |||||||||||||
Cost of revenue: |
|
|
|
|
|
|
|
|
|
|
|
|
|
|
|
|
|
|
|
|
Recurring services |
| $ | 196.8 |
|
| $ | 214.4 |
|
| $ | 182.9 |
|
| $ | 13.9 |
|
|
| 7.6 | % |
Professional services and other |
|
| 135.8 |
|
|
| 115.6 |
|
|
| 138.7 |
|
|
| (2.9 | ) |
|
| (2.1 | )% |
Product development and management |
|
| 43.6 |
|
|
| 43.3 |
|
|
| 46.9 |
|
|
| (3.3 | ) |
|
| (7.0 | )% |
Depreciation and amortization |
|
| 31.3 |
|
|
| 23.1 |
|
|
| 31.3 |
|
|
| — |
|
|
| — |
|
Total cost of revenue |
| $ | 407.5 |
|
| $ | 396.4 |
|
| $ | 399.8 |
|
| $ | 7.7 |
|
|
| 1.9 | % |
Selling, general, and administrative |
| $ | 223.0 |
|
| $ | 225.3 |
|
| $ | 221.9 |
|
| $ | 1.1 |
|
|
| 0.5 | % |
The increase in total cost of revenue for year ended December 31, 2017, compared to the year ended December 31, 2016, included a net reallocation of $3.4 million from selling, general, and administrative expense due to a change in estimate of expense allocations. Excluding the effect of these reallocations, total cost of revenue would have increased by $7.7 million, or 1.9%.
Recurring services cost of revenue was reduced by $17.6 million for the year ended December 31, 2017, compared to the year ended December 31, 2016. This reduction included a reallocation of $31.5 million of costs from recurring services cost of revenue, consisting primarily of $13.4 million in technology and facilities expenses, $10.9 million in finance related expenses, and $9.3 million in corporate function expenses. Excluding the effect of these reallocations, recurring services cost of revenue would have increased by $13.9 million due to additional costs incurred to support the growing Dayforce customer base, partially offset by reductions in Bureau costs.
The increase in cost of revenue for professional services and other of $20.2 million for the year ended December 31, 2017, compared to the year ended December 31, 2016, included a net reallocation of $23.1 million of costs to professional services and other cost of revenue, primarily $23.2 million of technology and facilities expenses. Excluding the effect of these reallocations, professional services and other cost of revenue would have been reduced by $2.9 million, as we achieved productivity improvements in implementing new customers.
The increase in product development and management expense of $0.3 million for the year ended December 31, 2017, compared to the year ended December 31, 2016, included the reallocation of $3.6 million of costs to product development and management, primarily $7.9 million in technology and facilities expenses, offset by $2.8 million in corporate function expenses. Excluding the effect of these reallocations, product development and management expense would have been reduced by $3.3 million, due to reductions in product management costs associated with our Bureau solution and technology expenses, partially offset by higher headcount to support the continued development of the Dayforce platform.
Depreciation and amortization expense associated with cost of revenue increased by $8.2 million for the year ended December 31, 2017, compared to the year ended December 31, 2016. Excluding the effect of these reallocations of $8.2 million, depreciation and amortization expense would have been consistent with 2016.
The table below presents total gross margin and solution gross margins for the periods presented, both as presented and on a pro forma basis as if the changes to allocation methodologies of certain costs in 2017 discussed above had been in effect in 2016.
|
| Year Ended December 31, |
| |||||||||
|
| 2017 |
|
| 2016 |
|
| 2016 Pro Forma |
| |||
Total gross margin |
|
| 39.3 | % |
|
| 36.4 | % |
|
| 35.9 | % |
Gross margin by solution: |
|
|
|
|
|
|
|
|
|
|
|
|
Cloud recurring services |
|
| 62.8 | % |
|
| 64.0 | % |
|
| 60.2 | % |
Bureau recurring services |
|
| 72.7 | % |
|
| 59.8 | % |
|
| 72.5 | % |
Professional services and other |
|
| (87.8 | )% |
|
| (78.1 | )% |
|
| (113.7 | )% |
Selling, general, and administrative expense. Selling, general, and administrative expense was reduced by $2.3 million for the year ended December 31, 2017, compared to the year ended December 31, 2016. This reduction included the reallocation of $3.4 million of costs. Excluding the effect of these reallocations, selling, general, and administrative expense would have increased by $1.1 million, reflecting increases in sales and marketing expenses and share-based compensation expense, partially offset by reductions in restructuring consulting fees, severance expense, sponsor management fees and other cost reduction measures related to our declining Bureau solutions.
Other expense, net. For the year ended December 31, 2017, we incurred $7.3 million of other expense, net, compared to $12.9 million, for the year ended December 31, 2016. The other expense, net, for the year ended December 31, 2017, was primarily related to foreign currency remeasurement losses on intercompany receivables or payables denominated in foreign currencies. The other expense, net, for the year ended December 31, 2016, was primarily related to an impairment of $10.2 million to our trade name intangible asset and an increase of $5.9 million to our environmental reserve liability to reflect more stringent remediation requirements, partially offset by foreign currency remeasurement gains on intercompany receivables or payables denominated in foreign currencies. Please refer to Note 12, “Supplementary Data to Statement of Operations,” for further discussion.
Operating profit (loss). We realized operating profit of $33.0 million for the year ended December 31, 2017, compared to an operating loss of $11.2 million for the year ended December 31, 2016. This $44.2 million increase was primarily due to a $47.4 million increase in revenue and gross margin improvement.
Interest expense, net. Interest expense, net for the year ended December 31, 2017,2023, was $87.1$36.1 million, compared to $87.4$28.6 million for the year ended December 31, 2016.2022. The increase was primarily due to an increase in applicable reference rates on our Term Debt, partially offset by an increase in interest income.
Income tax (benefit) expense.Other expense, net. For the yearyears ended December 31, 2017,2023 and 2022, other expense, net of $1.0 million and $8.5 million, respectively, was comprised of foreign currency translation (gains) losses and net periodic pension expense.
Income tax expense. For the years ended December 31, 2023 and 2022, we had an income tax benefit of $49.6 million, compared to income tax expense of $6.7$41.2 million and $10.5 million, respectively. The $30.7 million increase in tax expense was primarily due to increases of $33.4 million attributed to current operations, $11.4 million attributed to valuation allowances, $5.0 million attributed to state taxes, and other tax expense of $6.2 million, offset by decreases of $15.1 million attributed to U.S. Global Intangible Low Tax Income regime, $5.7 million attributed to tax credits, and $4.5 million attributed to share-based compensation. We record a valuation allowance to reduce our deferred tax assets to reflect the net deferred tax assets that we believe will be realized. As of December 31, 2023, we will continue to record a valuation allowance against certain deferred tax assets including state net operating loss carryovers and tax basis intangibles.
Net income (loss). Net income was $54.8 million for the year ended December 31, 2016. Income tax benefit for the year ended December 31, 2017, was primarily related to a tax benefit of approximately $59.4 million related to the 2017 tax reform legislation, of which $26.4 million was attributable to the revaluation of our deferred tax assets and liabilities and $33.0 million was attributable to the reduction in our valuation allowance.
(Loss) income from discontinued operations. For the year ended December 31, 2017, we had a loss from discontinued operations of $6.0 million,2023, compared to income from discontinued operationnet loss of $12.5$73.4 million for the year ended December 31, 2016.2022. The loss from discontinued operations for the year ended December 31, 2017,increase in net income was primarily relateddue to our LifeWorks business. Income from discontinued operations for the year ended December 31, 2016, was primarily attributable to proceedsan increase in revenue, including float revenue, gross margin expansion, and reductions in severance, restructuring and commission expenses, partially offset by increases in amortization expense and income tax expense.
37 | 2023 Form 10-K
Net loss attributable to Ceridian. Net loss attributable to Ceridian improved by $83.7 million to $9.2 million for the year ended December 31, 2017, compared to $92.9 million for the year ended December 31, 2016.
Adjusted EBITDA. Adjusted EBITDA increased by $32.3 million for the year ended December 31, 2017, compared to the year ended December 31, 2016, and Adjusted EBITDA margin increased to 17.6% in 2017 from 13.7% in 2016.
Quarterly Results of Operations
The following table sets forth statements of operations data for each of the quarters presented. We have prepared the quarterly statements of operations data on a basis consistent with the audited consolidated financial statements. In the opinion of management, the financial information reflects all adjustments, consisting of normal recurring adjustments, which we consider necessary for a fair presentation of this data. This information should be read in conjunction with the audited consolidated financial statements and related notes. The results of historical periods are not necessarily indicative of the results for any future period.
|
| Three Months Ended |
| |||||||||||||||||||||||||||||
|
| December 31, 2018 |
|
| September 30, 2018 |
|
| June 30, 2018 |
|
| March 31, 2018 |
|
| December 31, 2017 |
|
| September 30, 2017 |
|
| June 30, 2017 |
|
| March 31, 2017 |
| ||||||||
|
| (Dollars in millions) |
| |||||||||||||||||||||||||||||
Revenue: |
|
|
|
|
|
|
|
|
|
|
|
|
|
|
|
|
|
|
|
|
|
|
|
|
|
|
|
|
|
|
|
|
Recurring services |
| $ | 171.7 |
|
| $ | 157.2 |
|
| $ | 156.6 |
|
| $ | 167.0 |
|
| $ | 160.3 |
|
| $ | 145.6 |
|
| $ | 140.8 |
|
| $ | 151.8 |
|
Professional services and other |
|
| 28.6 |
|
|
| 22.4 |
|
|
| 22.7 |
|
|
| 20.2 |
|
|
| 22.1 |
|
|
| 17.9 |
|
|
| 16.7 |
|
|
| 15.6 |
|
Total revenue |
|
| 200.3 |
|
|
| 179.6 |
|
|
| 179.3 |
|
|
| 187.2 |
|
|
| 182.4 |
|
|
| 163.5 |
|
|
| 157.5 |
|
|
| 167.4 |
|
Cost of revenue: |
|
|
|
|
|
|
|
|
|
|
|
|
|
|
|
|
|
|
|
|
|
|
|
|
|
|
|
|
|
|
|
|
Recurring services |
|
| 51.0 |
|
|
| 49.1 |
|
|
| 49.5 |
|
|
| 50.7 |
|
|
| 51.0 |
|
|
| 48.4 |
|
|
| 48.1 |
|
|
| 49.3 |
|
Professional services and other |
|
| 33.5 |
|
|
| 32.5 |
|
|
| 33.4 |
|
|
| 32.8 |
|
|
| 33.0 |
|
|
| 34.8 |
|
|
| 34.1 |
|
|
| 33.9 |
|
Product development and management |
|
| 15.7 |
|
|
| 14.5 |
|
|
| 15.1 |
|
|
| 13.7 |
|
|
| 11.8 |
|
|
| 11.0 |
|
|
| 10.0 |
|
|
| 10.8 |
|
Depreciation and amortization |
|
| 8.6 |
|
|
| 8.5 |
|
|
| 8.5 |
|
|
| 8.7 |
|
|
| 8.1 |
|
|
| 8.0 |
|
|
| 7.6 |
|
|
| 7.6 |
|
Total cost of revenue |
|
| 108.8 |
|
|
| 104.6 |
|
|
| 106.5 |
|
|
| 105.9 |
|
|
| 103.9 |
|
|
| 102.2 |
|
|
| 99.8 |
|
|
| 101.6 |
|
Gross profit |
|
| 91.5 |
|
|
| 75.0 |
|
|
| 72.8 |
|
|
| 81.3 |
|
|
| 78.5 |
|
|
| 61.3 |
|
|
| 57.7 |
|
|
| 65.8 |
|
Costs and expenses: |
|
|
|
|
|
|
|
|
|
|
|
|
|
|
|
|
|
|
|
|
|
|
|
|
|
|
|
|
|
|
|
|
Selling, general, and administrative |
|
| 70.4 |
|
|
| 59.4 |
|
|
| 84.1 |
|
|
| 56.8 |
|
|
| 62.0 |
|
|
| 52.4 |
|
|
| 54.8 |
|
|
| 53.8 |
|
Other (income) expense, net |
|
| (0.4 | ) |
|
| 0.3 |
|
|
| — |
|
|
| (2.8 | ) |
|
| 0.4 |
|
|
| 3.8 |
|
|
| 2.0 |
|
|
| 1.1 |
|
Operating profit (loss) |
|
| 21.5 |
|
|
| 15.3 |
|
|
| (11.3 | ) |
|
| 27.3 |
|
|
| 16.1 |
|
|
| 5.1 |
|
|
| 0.9 |
|
|
| 10.9 |
|
Interest expense, net |
|
| 8.8 |
|
|
| 8.8 |
|
|
| 43.4 |
|
|
| 22.2 |
|
|
| 21.8 |
|
|
| 21.9 |
|
|
| 22.0 |
|
|
| 21.4 |
|
Income (loss) from continuing operations before income taxes |
|
| 12.7 |
|
|
| 6.5 |
|
|
| (54.7 | ) |
|
| 5.1 |
|
|
| (5.7 | ) |
|
| (16.8 | ) |
|
| (21.1 | ) |
|
| (10.5 | ) |
Income tax expense (benefit) |
|
| 1.9 |
|
|
| (0.9 | ) |
|
| 1.1 |
|
|
| 5.6 |
|
|
| (53.4 | ) |
|
| 0.9 |
|
|
| 1.9 |
|
|
| 1.0 |
|
Income (loss) from continuing operations |
|
| 10.8 |
|
|
| 7.4 |
|
|
| (55.8 | ) |
|
| (0.5 | ) |
|
| 47.7 |
|
|
| (17.7 | ) |
|
| (23.0 | ) |
|
| (11.5 | ) |
(Loss) income from discontinued operations |
|
| (11.0 | ) |
|
| (3.0 | ) |
|
| (9.7 | ) |
|
| (2.1 | ) |
|
| (3.6 | ) |
|
| (2.9 | ) |
|
| 0.2 |
|
|
| 0.3 |
|
Net (loss) income |
|
| (0.2 | ) |
|
| 4.4 |
|
|
| (65.5 | ) |
|
| (2.6 | ) |
|
| 44.1 |
|
|
| (20.6 | ) |
|
| (22.8 | ) |
|
| (11.2 | ) |
Net (loss) income attributable to noncontrolling interest |
|
| — |
|
|
| — |
|
|
| — |
|
|
| (0.5 | ) |
|
| (0.9 | ) |
|
| (0.5 | ) |
|
| 0.1 |
|
|
| — |
|
Net (loss) income attributable to Ceridian |
| $ | (0.2 | ) |
| $ | 4.4 |
|
| $ | (65.5 | ) |
| $ | (2.1 | ) |
| $ | 45.0 |
|
| $ | (20.1 | ) |
| $ | (22.9 | ) |
| $ | (11.2 | ) |
Liquidity and Capital Resources
Our primary sources of liquidity are our existing cash and equivalents, cash provided by operating activities, borrowingsavailability under our credit facilities,Revolving Credit Facility, and proceeds from debt issuance and equity offerings. As of December 31, 2018, we had cash and equivalents of $217.8 million and availability under our revolving credit facility of $300.0 million. No cash amounts were drawn on the revolving credit facility during 2018. Our total indebtedness was $678.3 million as of December 31, 2018. Please refer to Note 9, “Debt,” to our consolidated financial statements, for further information on our debt.
Our primary liquidity needs are related to funding of general business requirements, including the payment of interest and principal on our indebtedness,debt, capital expenditures, pension contributions,fulfilling our contractual commitments, product development, and product development.funding Dayforce Wallet on-demand pay requests on behalf of our customers. From time to time, we have made investments in businesses or acquisitions of companies. As of December 31, 2023, we had cash and equivalents of $570.3 million and our total debt balance was $1,226.6 million. Please refer to Part II, Item 8, Note 9, “Debt,” to our consolidated financial statements and “Our Indebtedness” section below for further information on our debt.
Our customer trust funds are held and invested with the primary objectives being to protect the principal balance and to ensure adequate liquidity to meet cash flow requirements. Accordingly, we maintain on average approximately 46% of customer trust funds in liquidity portfolios with maturities ranging from one to 120 days, consisting of high-quality bank deposits, money market mutual funds, commercial paper, or collateralized short-term investments; and we maintain on average approximately 54% of customer trust funds in fixed income portfolios with maturities ranging from 120 days to 10 years, consisting of U.S. Treasury and agency securities, Canada government and provincial securities, as well as highly rated asset-backed, mortgage-backed, municipal, corporate and bank securities. To maintain sufficient liquidity in the trust to meet payment obligations, we also have financing arrangements and may pledge fixed income securities for short-term financing. The assets held in trust are intended for the specific purpose of satisfying client fund obligations and therefore are not freely available for our general business use.
We believe that our cash flow from operations, availability under our revolving credit facility, and available cash and equivalents, and availability under our Revolving Credit Facility will be sufficient to meet our liquidity needs for the next twelve months and for the foreseeable future. Dayforce Wallet on-demand pay requests are currently funded from our operating cash balances, until it is reimbursed by our customers through their normal payroll funding cycles. We evaluate the creditworthiness of each customer for the Dayforce Wallet feature. We anticipate that to the extent that we require additional liquidity, it will be funded through the issuance of equity, the incurrence of additional indebtedness, or a combination thereof. We cannot assure youprovide assurance that we will be able to obtain this additional liquidity on reasonable terms, or at all. Additionally, our liquidity and our ability to meet our obligations and to fund our capital requirements and Dayforce Wallet on-demand pay requests are also dependent on our future financial performance, which is subject to general economic, financial, and other factors that are beyond our control. Accordingly, we cannot assure youprovide assurance that our business will generate sufficient cash flow from operations or that future borrowings will be available from additional indebtedness or otherwise to meet our liquidity needs. Although we have no specific current plans to do so, ifIf we decide to pursue one or more significant acquisitions, we may incur additional debt or sell additional equity to finance such acquisitions, which would result in additional expenses and/or dilution.
Our customer funds are held and invested with the primary objectives being to protect the principal balance and to ensure adequate liquidity to meet cash flow requirements. The customer assets are held in segregated accounts intended for the specific purpose of satisfying customer funding obligations and therefore are not freely available for our general business use. Please refer to Part II, Item 8, Note 4, "Customer Funds," for further discussion of these funds.
Statements of Cash Flows
Changes in cash flows due to purchases of customer trust fund marketable securities and proceeds from the sale or maturity of customer trust fund marketable securities, and the net increase (decrease) of restricted cash held to satisfy customer trust fund obligations, as well as the carrying value of customer trust fund accounts as of period end dates can vary significantly due to several factors, including the specific day of the week the period ends, which impacts the timing of funds collected from customers and payments made to satisfy customer obligations to employees, taxing authorities, and others. For example, December 31,2018was a Monday, when trust fund balances are generally lower; whereas, the last business day of 2017 was a Friday, when trust fund balances are generally higher. The customer trust funds are fully segregated from our operating cash accounts and are evaluated and tracked separately by management. Therefore, to provide meaningful information toThe table below summarizes the readers,activity within the following discussion is regarding the netconsolidated statements of cash flows excluding customer trust funds.flows:
|
| Year Ended December 31, |
| |||||
|
| 2023 |
|
| 2022 |
| ||
|
| (In millions) |
| |||||
Net cash provided by operating activities |
| $ | 219.5 |
|
| $ | 132.6 |
|
Net cash used in investing activities |
|
| (202.8 | ) |
|
| (342.5 | ) |
Net cash provided by financing activities |
|
| 242.0 |
|
|
| 764.6 |
|
Effect of exchange rate changes on cash, restricted cash, and equivalents |
|
| 11.5 |
|
|
| (46.8 | ) |
Net increase in cash, restricted cash, and equivalents |
|
| 270.2 |
|
|
| 507.9 |
|
Cash, restricted cash, and equivalents at beginning of period |
|
| 3,151.2 |
|
|
| 2,643.3 |
|
Cash, restricted cash, and equivalents at end of period |
|
| 3,421.4 |
|
|
| 3,151.2 |
|
|
|
|
|
|
| |||
Cash and equivalents |
|
| 570.3 |
|
|
| 431.9 |
|
Restricted cash and equivalents |
|
| 2,851.1 |
|
|
| 2,719.3 |
|
Total cash, restricted cash, and equivalents |
| $ | 3,421.4 |
|
| $ | 3,151.2 |
|
38 | 2023 Form 10-K
Operating Activities
Net cash provided by operating activities from continuing operations of $10.7was $219.5 million during the year ended December 31, 2018, was primarily attributable2023, compared to operating profit of $52.8 million, partially offset by a $45.0 million reduction in cash as a result of net changes in working capital. The $45.0 million reduction in net working capital was primarily attributable to a reduction of $22.1 million in liabilities for employee compensation and benefits, primarily due to payments of accrued incentive compensation and pension contributions, and a $15.7 million reduction in liabilities for accrued interest, associated with our debt refinancing. Included within net cash flows provided by operating activities for the year ended December 31, 2018, was $74.5 million in cash interest payments on our long-term debt, $18.5 million in pension payments, and $16.7 million in cash taxes, net of refunds received.
Net cash used in operating activities from continuing operations of $29.4$132.6 million during the year ended December 31, 2017,2022. For both periods, cash inflows from operating activities are primarily generated from the subscriptions of our solutions. Cash outflows from operating activities for both periods are primarily comprised of personnel-related expenditures that are integral to our business operations. The net positive cash inflow in both periods is primarily due to our growing revenue, partially offset by our operating costs, mainly, investment in our sales force to support our growth initiatives and our product development and management costs which are not eligible for capitalization.
Investing Activities
During the year ended December 31, 2023, net cash used in investing activities was $202.8 million, primarily attributable to operating lossesconsisting of $4.5purchases of customer funds marketable securities of $528.1 million, net changes in working capital expenditures of $37.2$114.4 million, and a deferred tax benefitpurchases of $62.3marketable securities of $6.8 million, partially offset by certain non-cash items, primarily $53.8proceeds from the sale and maturity of customer funds marketable securities of $445.5 million, and proceeds from the sale and maturity of depreciationmarketable securities of $2.0 million. Our capital expenditures included $95.4 million for software and amortizationtechnology and $16.1$19.0 million of share-based compensation expense. Net changes in working capital were driven by employee compensationfor property, plant and benefits, primarily pension contributions, accrued taxes, and prepaid expenses.equipment.
NetDuring the year ended December 31, 2022, net cash used in operatinginvesting activities was $342.5 million, consisting of purchases of customer funds marketable securities of $652.8 million and capital expenditures of $94.5 million, partially offset by proceeds from continuing operationsthe sale and maturity of $73.2customer funds marketable securities of $404.8 million. Our capital expenditures included $74.3 million for software and technology and $20.2 million for property, plant and equipment.
Financing Activities
Net cash provided by financing activities was $242.0 million during the year ended December 31, 2016, was primarily attributable to operating losses of $105.3 million with offsetting adjustments for certain non-cash items and net changes in working capital. The adjustments for non-cash items included $53.2 million of depreciation and amortization, $12.5 million of share-based compensation expense, a $10.4 million asset impairment, and a $5.9 million adjustment to our environmental reserve liability, partially offset by $8.3 million of deferred income tax benefit. Net changes in working capital of $49.3 million were primarily driven by pension contributions exceeding pension expense.
Investing Activities
During the year ended December 31, 2018, net cash used in investing activities from continuing operations, excluding customer trust fund activity, was $40.2 million, including $32.2 million in capital expenditures for software and technology and $8.0 million in capital expenditures for property and equipment.
During the year ended December 31, 2017, net cash used in investing activities from continuing operations excluding customer trust fund activity was $51.1 million, primarily related to capital expenditures, partially offset by proceeds from divestitures. Our capital expenditures included $33.1 million for software and technology and $17.5 million for property and equipment.
During the year ended December 31, 2016, net cash provided by investing activities from continuing operations excluding customer trust fund activity was $68.7 million, primarily related to the net proceeds from divestitures of $101.6 million, offset by capital expenditures. Our capital expenditures included $25.5 million for software and technology and $7.4 million for property and equipment.
Financing Activities
Net cash provided by financing activities from continuing operations, excluding the change in customer trust fund obligations, was $163.5 million during the year ended December 31, 2018.2023. This cash inflow iswas primarily attributable to the net proceeds received from our IPO and concurrent private placement of $595.0 million, a net increase in the principalour customer funds obligations of our term loan of $23.0$200.9 million and proceeds from the issuance of common stock upon exerciseunder our share-based compensation plans of stock options of $45.8$49.0 million, partially offset by a $475.0 million payment to redeempayments on our Senior Notes andlong-term debt refinancing costsobligations of $23.3$7.9 million.
Net cash provided by financing activities from continuing operations excluding the change in customer trust fund obligations was $50.7$764.6 million during the year ended December 31, 2017,2022. This cash inflow was primarily relatedattributable to the fundingnet increase in our customer funds obligations of the remaining $75.2$734.6 million and proceeds from the issuance of Senior Preferred Stock, partially offset by a $25.9common stock under our share-based compensation plans of $38.4 million, payment made on our term debt.
Net cash provided by financing activities from continuing operations excluding the change in customer trust fund obligation was $63.2 million during the year ended December 31, 2016, related to proceeds received from the issuance of Senior Preferred Stock, partially offset by payments made on our term debt.long-term debt obligations of $8.4 million.
Cash Flows from Discontinued OperationsBacklog and Seasonality
During the year ended December 31, 2018, net cash used in discontinued operations was $1.2 million. During the year ended December 31, 2017, net cash used in discontinued operations was $10.6 million. During the year ended December 31, 2016, net cash used in discontinued operations was $1.9 million. The cash flows from discontinued operationsBacklog is equivalent to our remaining performance obligations, which represents contracted revenue for all periodsrecurring and fixed price professional services, primarily relate to changes in working capital.
Backlog
We do not believe that any measure of backlog is a meaningful indicator of revenues that can be expected for a particular future period as the amount and timing can be influenced by multiple factors, including the timing of the completion of implementation, the accuracy and success of implementation services, provided by usthat has not yet been recognized, including deferred revenue and by third parties, the timingunbilled amounts that will be recognized as revenue in which new customers go-live, and our ability to meet service level commitments.
We have in the past and expect in the future to experience seasonal fluctuations in our revenues and new customer contracts with the fourth quarter historically being our strongest quarter for new customer contracts, renewals, and customer go-lives. Although the growth of our Cloud solutions and the ratable nature of our fees makes this seasonality less apparent in our overall results of operations, we expect our revenue to fluctuate quarterly and to be higher in the fourth and first quarters of each year. Fourth quarter revenue is driven by year-end processing fees and Dayforce customer go-lives; and first quarter revenue is driven by revenue earned for printing of year-end tax packages.
Off-Balance Sheet Arrangements
periods. As of December 31, 2018,2023, approximately $1.22 billion of revenue is expected to be recognized over the next three years from remaining performance obligations.
For a discussion of seasonality, please refer to Part 1, Item I, “Business” of this Form 10-K.
Our Indebtedness
Our primary liquidity needs are related to funding of general business requirements, including the payment of interest and principal on our debt, capital expenditures, fulfilling our contractual commitments, product development, and funding Dayforce Wallet on-demand pay requests on behalf of our customers. From time to time, we did not have any “off-balance sheet arrangements” (as such term is definedmade investments in Item 303businesses or acquisitions of Regulation S-K).companies, which are also liquidity needs. We believe our current sources of liquidity will be sufficient to meet our liquidity needs for the foreseeable future. We anticipate that to the extent that we require additional liquidity, it will be funded through the issuance of equity, the incurrence of additional indebtedness, or a combination thereof.
Our IndebtednessSenior Secured Credit Facility
On April 30, 2018, Ceridianwe entered into a credit agreement pursuant to which the lenders agreed to provide Senior Secured Credit Facilities,Facility, consisting of the Senior Term LoanDebt in the original principal amount of $680.0 million and a $300.0 million Revolving Credit Facility. The Revolving Credit Facility may, at our option, be made available in United StatesU.S. Dollars, Canadian Dollars, Euros and/or Pounds Sterling; up to $70.0 million may, at our option, be made available for letters of credit and $100.0 million may, at our option, be made available for swingline loans (denominated in Canadian Dollars and/or United StatesU.S. Dollars).
39 | 2023 Form 10-K
The Senior Term LoanDebt and Revolving Credit Facility will mature on April 30, 2025.2025 and January 29, 2025, respectively. We are required to make annual amortization payments in respect of the Senior Term LoanDebt in an amount equal to 1.00% of the original principal amount thereof, payable in equal quarterly installments of 0.25% of the original principal amount of the first lien term loan.debt. On August 1, 2023, we completed the third amendment to our Senior Secured Credit Facility, which replaced LIBOR with Secured Overnight Financing Rate ("SOFR"). As of December 31, 2023, our floating rate on the Term Debt interest was SOFR plus 2.5% and the applicable Term SOFR Adjustment ranged from approximately 0.1% to 0.4%, depending on term. The Revolving Credit Facility matures on April 30, 2023 and does not require amortization payments.
Convertible Senior Notes
In March 2021, we issued $575.0 million in aggregate principal amount of 0.25% Convertible Senior Notes due 2026. The obligationstotal net proceeds from the offering, after deducting initial purchase discounts and issuance costs, were $561.8 million. In connection with the Convertible Senior Notes, we entered into capped call transactions which are expected to reduce the potential dilution of Ceridian under the Senior Credit Facilities are secured by first priority security interests in substantially allour common stock upon any conversion of the assets of Ceridian and the guarantors, subjectConvertible Senior Notes and/or offset any cash payments we could be required to permitted liens and other exceptions. All of our subsidiaries are guarantors under the Senior Credit Facilities, subject to certain exceptions. The Senior Credit Facilities contain financial covenants and certain business covenants, including restrictions on dividend payments, which Ceridian must comply with during the termmake in excess of the agreement. Asprincipal amount of December 31, 2018, Ceridian was in full compliance with the termsconverted Notes. We used an aggregate amount of $45.0 million of the net proceeds of the Convertible Senior Credit Facilities.
Borrowings underNotes to purchase the Senior Credit Facilities bear interest at a rate per annum equal to:
|
|
|
|
|
|
|
|
The applicable margin for the Senior Term Loan is (i) 3.25% per annum, in the case of LIBOR loans and (ii) 2.25% per annum, in the case of base rate loans. Such applicable margin will be reduced by 0.25% per annum if the corporate family rating of Ceridian from Moody’s is B2 or better, each such reduction being effective during the period commencing on the date of such change in rating becomes effective and ending on the date immediately preceding the effective date of next change in rating.
The applicable margin for loans under the Revolving Credit Facility is determined in accordance with the table set forth below:and pay related accrued interest and (ii) for general corporate purposes.
Consolidated First Lien Leverage Ratio |
| Applicable Margin for LIBOR, CDOR, EURIBOR and Sterling LIBOR Rate Loans |
|
| Applicable Margin for Base Rate and Canadian Prime Rate Loans |
| ||
Category 1 |
|
|
|
|
|
|
|
|
Greater than 4.50:1.00 |
|
| 2.75 | % |
|
| 1.75 | % |
Category 2 |
|
|
|
|
|
|
|
|
Less than or equal to 4.50:1.00 and greater than 4.00:1.00 |
|
| 2.50 | % |
|
| 1.50 | % |
Category 3 |
|
|
|
|
|
|
|
|
Less than or equal to 4.00:1.00 |
|
| 2.25 | % |
|
| 1.25 | % |
We are also required to pay a customary annual administration fee to the administrative agent under the Senior Credit Facilities.
For an additional description of the Senior Secured Credit Facilities,Facility and the Senior Convertible Notes, please refer to Part II, Item 8, Note 9, “Debt,” to our consolidated financial statements.
Contractual Obligations
The following table sets forth ourOur future contractual obligations generally consist of long-term debt, leases, retirement plans, and other commercial commitments as of December 31, 2018, whether or not they appear on our consolidated balance sheet. Variable interest payments are projected based on an interest rate forecast in effect at the end of 2018. All amounts in the table may reflect rounding.
|
| Payments due by period |
| |||||||||||||||||
|
| (Dollars in millions) |
| |||||||||||||||||
|
| Less than one year |
|
| 1-3 Years |
|
| 3-5 Years |
|
| More than 5 Years |
|
| Total |
| |||||
Long-term debt |
| $ | 6.8 |
|
| $ | 13.6 |
|
| $ | 13.6 |
|
| $ | 644.3 |
|
| $ | 678.3 |
|
Interest payable on long-term debt |
|
| 40.6 |
|
|
| 79.9 |
|
|
| 78.1 |
|
|
| 51.1 |
|
|
| 249.7 |
|
Operating leases |
|
| 9.1 |
|
|
| 14.7 |
|
|
| 11.6 |
|
|
| 7.6 |
|
|
| 43.0 |
|
Postretirement plan obligations (a) |
|
| 2.3 |
|
|
| 3.9 |
|
|
| 3.5 |
|
|
| 6.3 |
|
|
| 16.0 |
|
Retirement plan obligations (a) |
|
| 7.7 |
|
|
| 54.0 |
|
|
| 37.6 |
|
|
| 33.4 |
|
|
| 132.7 |
|
Total |
| $ | 66.5 |
|
| $ | 166.1 |
|
| $ | 144.4 |
|
| $ | 742.7 |
|
| $ | 1,119.7 |
|
|
|
vendor payments. Our long-term debt obligations are described in Part II, Item 8, Note 9, “Debt,” to our consolidated financial statements.statements, and the “Our Indebtedness” section above.
The lease payments represent scheduled payments under the termsAs of the lease agreements. We conduct substantiallyDecember 31, 2023, all of our operations in leased facilities.facilities are leased. Most of these leases contain renewal options and require payments for taxes, insurance, and maintenance. We also lease equipment for use in our business. We ceased use of certain leased facilities during 2021 and recognized lease abandonment charges within general and administrative on our consolidated statements of operations; however, we are still required to make future payments under the existing lease terms. Refer to Part II, Item 8, Note 6, "Leases," to our consolidated financial statements for additional discussion of our leases.
Payments of retirement plan obligations include employer commitments to fund our defined benefit and postretirement plans and do not include estimated future benefit payments to participants expected to be made from liquidation of the assets in our defined benefit plan trusts. AtAs of December 31, 2018,2023, our defined benefit pension plans had a projected benefit obligation that exceeded the fair value of the plans’ assets by $145.8$21.5 million and our postretirement benefit plan had an accumulateda projected benefit obligation that exceeded the fair value of the plans’ assets by $16.8$8.5 million. We expect to satisfy these remaining obligations through investment income from and appreciation in the fair value of plan assets held in trust and from future employer contributions. Refer to Part II, Item 8, Note 10, "Employee Benefit Plans," to our consolidated financial statements for additional discussion of our employee benefit plans.
The amount of our future contractual obligation to vendors for capital expenditures atas of December 31, 20182023 was not material, and no such amount is included in the table above.material.
Critical Accounting Policies and Estimates
Our discussion and analysis of our financial condition and results of operations is based upon our consolidated financial statements and related notes, which have been prepared in accordance with GAAP. The preparation of these financial statements and related notes requires us to make estimates and judgments that affect the reported amounts of assets, liabilities, revenue, and expenses. Certain of our accounting policies require the application of significant judgment by management in selecting the appropriate assumptions for calculating financial estimates. By their nature, these judgments are subject to an inherent degree of uncertainty. These judgments are based on our historical experience, terms of existing contracts, our evaluation of trends in the industry, information provided by our customers, and information available from other outside sources, as appropriate. We evaluate our estimates and judgments on an on-going basis. Our actual results may differ from these estimates. We believe the following is our critical accounting estimate:
40 | 2023 Form 10-K
Revenue Recognition
Description: We recognize revenue for professional services and Cloud subscription services performance obligations based on an allocation of the total transaction price to each performance obligation using the respective stand-alone selling prices (“SSP”). This can result in revenue being recognized in an amount that exceeds the amount we are contractually allowed to bill our customer as of a certain point in time, resulting in the recognition of a contract asset up until the period at which billings are equal to or exceed revenue recognition. We recognized $202.6 million of Cloud professional services revenue for the year ended December 31, 2023, and the related contract assets were $89.0 million as of December 31, 2023.
Judgments and Uncertainties: The determination of our stand-alone selling price for the performance obligations requires us to make assumptions based on market conditions and observable inputs, as well as an estimate of the total professional service hours expected to be incurred in connection with each customer implementation.
Sensitivity of Estimate to Change: The consideration allocated to professional services performed to activate a new customer is recognized as professional services revenues based on the proportion of total work performed to date compared to an estimation of total work expected to complete the implementation project for that customer account. To the extent this consideration exceeds the customer billings, a contract asset would be recognized, as professional services revenue related to implementation activities is generally recognized at the beginning of the contract.
Please refer toPart II, Item 8, Note 2, “Summary of Significant Accounting Policies,” for a description of our revenue recognition policy and our significant accounting policies. The accounting policies that we believe to be the most critical to an understanding of our financial condition and results of operations and that require the most complex and subjective management judgments are discussed below.
Revenue Recognition
We recognize revenue from the sale of our services, net of applicable sales taxes, when the following criteria are met: (1) persuasive evidence of an arrangement exists; (2) delivery has occurred or services have been rendered; (3) the seller’s price to the buyer is fixed or determinable; and (4) collectability is reasonably assured. We rely on a signed contract with the customer as the persuasive evidence of a sales arrangement.
We enter into revenue arrangements that may consist of multiple deliverables based on the needs of our customers. For example, our services address a broad range of employment process needs, such as payroll, payroll-related tax filing, human resource information, employee self-service capabilities, time and labor management, and recruitment and applicant screening. A customer arrangement may contain any of these elements with different elements delivered across multiple reporting periods.
We have a single unit of accounting for each deliverable in a contract based on the use of estimated selling price (“ESP”) in those cases where vendor-specific objective evidence of selling price (“VSOE”) or third party evidence (“TPE”) cannot be established. Our determination of ESP involves the consideration of several factors based on the specific facts and circumstances of each contract. Specifically, we consider the cost to produce or to provide the deliverable, the anticipated margin on that deliverable, the selling price and profit margin for similar services, the value of any enhancements that have been built into the deliverable, and the characteristics of the varying markets in which the deliverable will be sold.
When we are unable to establish a selling price using VSOE or TPE, we use ESP in the allocation of arrangement consideration. The objective of ESP is to determine the price at which we would transact a sale if the service were sold on a standalone basis.
We regularly review VSOE, TPE, and ESP and maintain internal controls over the establishment and updates of these estimates. There were no material impacts during the period, nor do we currently expect a material impact in the near term from changes in VSOE, TPE, or ESP.
Deferred revenue consists primarily of customer billings in advance of revenues being recognized from our contracts. Deferred revenue also includes certain deferred professional services fees that are accounted for as a single unit of accounting with subscription fees and are recognized as revenues over the same period as the related customer contract. Deferred revenue that is anticipated to be recognized during the succeeding twelve-month period is recorded as current deferred revenue, and the remaining portion is recorded as noncurrent.
Recently Issued Accounting Pronouncements
Please refer toPart II, Item 8, Note 2, “Summary of Significant Accounting Policies,” for a full discussion of recent accounting pronouncements.
Non-GAAP Financial Measures
Adjusted EBITDA and Adjusted EBITDA Margin
We use certain non-GAAP financial measures in this document including:
Non-GAAP Financial Measure | GAAP Financial Measure | |
EBITDA | Net income (loss) | |
Adjusted EBITDA | Net income (loss) | |
Adjusted EBITDA margin | Net profit margin | |
Adjusted Cloud recurring gross margin | Cloud recurring gross margin | |
Adjusted operating profit | Operating profit (loss) | |
Adjusted operating profit margin | Operating profit (loss) margin | |
Adjusted net income | Net income (loss) | |
Adjusted net profit margin | Net profit margin | |
Adjusted diluted net income per share | Diluted net income (loss) per share | |
Percentage change in revenue, including total revenue and revenue by solution, on a constant currency basis | Percentage change in revenue, including total revenue and revenue by solution | |
Cloud ARR | No directly comparable GAAP measure | |
Dayforce revenue retention rate | No directly comparable GAAP measure | |
Dayforce recurring revenue per customer | No directly comparable GAAP measure |
We believe that Adjusted EBITDA and Adjusted EBITDA margin,these non-GAAP financial measures are useful to management and investors as supplemental measures to evaluate our overall operating performance.performance including comparison across periods and with competitors. Our management team uses these non-GAAP financial measures to assess operating performance because these financial measures exclude the results of decisions that are outside the normal course of our business operations, and are used for internal budgeting and forecasting purposes both for short- and long-term operating plans. Additionally, Adjusted EBITDA is a component of our management incentive plan and Adjusted EBITDA and Adjusted EBITDA margin are used by management to assess performance and to compare our operating performance to our competitors. We define Adjusted EBITDA as net income or loss before interest, taxes, depreciation, and amortization, as adjusted to exclude net income or loss from discontinued operations, sponsor management fees, non-cash charges for asset impairments, gains or losses on assets and liabilities held in a foreign currency other than the functional currency of a company subsidiary, share-based compensation expense, severance charges, restructuring consulting fees, transaction costs, and environmental reserve charges. Adjusted EBITDACloud recurring gross margin is determined by calculating the percentage Adjusted EBITDA isa component of total revenue. Management believes that Adjusted EBITDA and Adjusted EBITDA margin are helpful in highlighting managementcertain performance trends because Adjusted EBITDA and Adjusted EBITDA margin exclude the results of decisions that are outside the control of operating management.
Our presentation of Adjusted EBITDA and Adjusted EBITDA margin are intended as supplementalbased equity awards for our named executive officers. These non-GAAP financial measures of our performance that are not required by, defined under, or presented in accordance with, GAAP. Adjusted EBITDAGAAP, and Adjusted EBITDA margin should not be considered as alternatives to operating profit (loss), net income (loss), earnings per share, or any other performance measures derived in accordance withour results as reported under GAAP, orhave important limitations as analytical tools, and our use of these terms may not be comparable to similarly titled measures of operating cash flows or liquidity.other companies in our industry. Our presentation of Adjusted EBITDA and Adjusted EBITDA marginnon-GAAP financial measures should not be construed to imply that our future results will be unaffected by similar items to those eliminated in this presentation. Adjusted
41 | 2023 Form 10-K
We define our non-GAAP financial measures as follows:
Adjusted EBITDAexclude share-based compensation expense and related employer taxes, and certain other items.
Adjusted EBITDA and Adjusted EBITDA margin have important limitations as analytical tools, and you should not consider them in isolation or as substitutes for analysis of our results as reported under GAAP. Some of these limitations are:
Adjusted EBITDA and Adjusted EBITDA margin do not reflect our cash expenditures or future requirements for capital expenditures or contractual commitments;
Adjusted EBITDA and Adjusted EBITDA margin do not reflect changes in, or cash requirements for, our working capital needs;
Adjusted EBITDA and Adjusted EBITDA margin do not reflect any chargesperiods for the assets being depreciatedtrailing twelve months and amortized that may need to be replaced inexcludes float revenue, and Ascender and ADAM HCM revenue. This amount is divided by the future;
42 | 2023 Form 10-K
Adjusted EBITDA and Adjusted EBITDA margin do not reflect the impactTable of share-based compensation upon our results of operations;Contents
Adjusted EBITDA and Adjusted EBITDA margin do not reflect the significant interest expense or the cash requirements necessary to service interest or principal payments on our debt; and
Adjusted EBITDA and Adjusted EBITDA margin do not reflect our income tax expense or the cash requirements to pay our income taxes.
In evaluating Adjusted EBITDA and Adjusted EBITDA margin, you should be aware that in the future we may incur expenses similar to those eliminated in this presentation.
The following table reconciles operating profit to Adjusted EBITDA for the periods presented:
|
| Year Ended December 31, |
| |||||||||
|
| 2018 |
|
| 2017 |
|
| 2016 |
| |||
Operating profit (loss) |
| $ | 52.8 |
|
| $ | 33.0 |
|
| $ | (11.2 | ) |
Depreciation and amortization |
|
| 56.6 |
|
|
| 53.8 |
|
|
| 53.2 |
|
EBITDA from continuing operations (1) |
|
| 109.4 |
|
|
| 86.8 |
|
|
| 42.0 |
|
Sponsorship management fees (2) |
|
| 12.0 |
|
|
| 1.9 |
|
|
| 5.0 |
|
Asset impairments |
|
| — |
|
|
| — |
|
|
| 10.2 |
|
Intercompany foreign exchange (gain) loss |
|
| (2.9 | ) |
|
| 7.4 |
|
|
| (3.4 | ) |
Share-based compensation (3) |
|
| 24.7 |
|
|
| 16.1 |
|
|
| 12.5 |
|
Severance charges (4) |
|
| 5.4 |
|
|
| 5.6 |
|
|
| 8.4 |
|
Restructuring consulting fees (5) |
|
| 4.8 |
|
|
| — |
|
|
| 4.9 |
|
Environmental reserve charges (6) |
|
| — |
|
|
| — |
|
|
| 5.9 |
|
Transaction costs (7) |
|
| 3.7 |
|
|
| — |
|
|
| — |
|
Adjusted EBITDA |
| $ | 157.1 |
|
| $ | 117.8 |
|
| $ | 85.5 |
|
Adjusted EBITDA margin |
|
| 21.0 | % |
|
| 17.6 | % |
|
| 13.7 | % |
|
|
|
|
|
|
|
|
|
|
|
|
|
|
The following tables present a reconciliation ofreconcile our reported results to our non-GAAP financial measures:
|
| Year Ended December 31, 2023 |
| |||||||||||||||||||||||||
|
| As reported |
|
| As reported margins (a) |
|
| Share-based |
|
| Amortization |
|
| Other (b) |
|
| As adjusted (b) |
|
| As adjusted margins (a) |
| |||||||
|
| (Dollars in millions, except per share data) |
| |||||||||||||||||||||||||
Cost of Cloud recurring revenue |
| $ | 278.5 |
|
|
| 77.0 | % |
| $ | 15.4 |
|
| $ | — |
|
| $ | — |
|
| $ | 263.1 |
|
|
| 78.3 | % |
|
|
|
|
|
|
|
|
|
|
|
|
|
|
|
|
|
|
|
|
| ||||||||
Operating profit |
| $ | 133.1 |
|
|
| 8.8 | % |
| $ | 137.1 |
|
| $ | 60.5 |
|
| $ | 9.1 |
|
| $ | 339.8 |
|
|
| 22.4 | % |
|
|
|
|
|
|
|
|
|
|
|
|
|
|
|
|
|
|
|
|
|
| |||||||
Net income |
| $ | 54.8 |
|
|
| 3.6 | % |
| $ | 137.1 |
|
| $ | 60.5 |
|
| $ | (13.7 | ) |
| $ | 238.7 |
|
|
| 15.8 | % |
Interest expense, net |
|
| 36.1 |
|
|
|
|
|
| — |
|
|
| — |
|
|
| — |
|
|
| 36.1 |
|
|
|
| ||
Income tax expense (c) |
|
| 41.2 |
|
|
|
|
|
| — |
|
|
| — |
|
|
| (22.2 | ) |
|
| 63.4 |
|
|
|
| ||
Depreciation and amortization |
|
| 132.5 |
|
|
|
|
|
| — |
|
|
| 60.5 |
|
|
| — |
|
|
| 72.0 |
|
|
|
| ||
EBITDA |
| $ | 264.6 |
|
|
|
|
| $ | 137.1 |
|
| $ | — |
|
| $ | 8.5 |
|
| $ | 410.2 |
|
|
| 27.1 | % | |
|
|
|
|
|
|
|
|
|
|
|
|
|
|
|
|
|
|
|
|
|
| |||||||
Net income per share - diluted (d) |
| $ | 0.35 |
|
|
|
|
| $ | 0.86 |
|
| $ | 0.38 |
|
| $ | (0.09 | ) |
| $ | 1.51 |
|
|
|
| ||
43 | 2023 Form 10-K
|
| Year Ended December 31, 2022 |
| |||||||||||||||||||||||||
|
| As reported |
|
| As reported margins (a) |
|
| Share-based |
|
| Amortization |
|
| Other (b) |
|
| As adjusted (b) |
|
| As adjusted margins (a) |
| |||||||
|
| (Dollars in millions, except per share data) |
| |||||||||||||||||||||||||
Cost of Cloud recurring revenue |
| $ | 254.4 |
|
|
| 72.0 | % |
| $ | 14.2 |
|
| $ | — |
|
| $ | 19.5 |
|
| $ | 220.7 |
|
|
| 75.7 | % |
|
|
|
|
|
|
|
|
|
|
|
|
|
|
|
|
|
|
|
|
| ||||||||
Operating (loss) profit |
| $ | (25.8 | ) |
|
| (2.1 | )% |
| $ | 145.1 |
|
| $ | 30.9 |
|
| $ | 46.0 |
|
| $ | 196.2 |
|
|
| 15.7 | % |
|
|
|
|
|
|
|
|
|
|
|
|
|
|
|
|
|
|
|
|
|
| |||||||
Net (loss) income |
| $ | (73.4 | ) |
|
| (5.9 | )% |
| $ | 145.1 |
|
| $ | 30.9 |
|
| $ | 17.9 |
|
| $ | 120.5 |
|
|
| 9.7 | % |
Interest expense, net |
|
| 28.6 |
|
|
|
|
|
| — |
|
|
| — |
|
|
| — |
|
|
| 28.6 |
|
|
|
| ||
Income tax expense (c) |
|
| 10.5 |
|
|
|
|
|
| — |
|
|
| — |
|
|
| (32.7 | ) |
|
| 43.2 |
|
|
|
| ||
Depreciation and amortization |
|
| 89.0 |
|
|
|
|
|
| — |
|
|
| 30.9 |
|
|
| — |
|
|
| 58.1 |
|
|
|
| ||
EBITDA |
| $ | 54.7 |
|
|
|
|
| $ | 145.1 |
|
| $ | — |
|
| $ | 50.6 |
|
| $ | 250.4 |
|
|
| 20.1 | % | |
|
|
|
|
|
|
|
|
|
|
|
|
|
|
|
|
|
|
|
|
|
| |||||||
Net (loss) income per share - diluted (d) |
| $ | (0.48 | ) |
|
|
|
| $ | 0.93 |
|
| $ | 0.20 |
|
| $ | 0.11 |
|
| $ | 0.77 |
|
|
|
| ||
|
| Year Ended December 31, 2018 |
| |||||||||||||||||
|
| As reported |
|
| Share-based compensation |
|
| Severance charges |
|
| Other operating expenses (1) |
|
| Adjusted |
| |||||
|
| (Dollars in millions) |
| |||||||||||||||||
Cost of revenue: |
|
|
|
|
|
|
|
|
|
|
|
|
|
|
|
|
|
|
|
|
Recurring services |
| $ | 200.3 |
|
| $ | 2.1 |
|
| $ | 1.3 |
|
| $ | — |
|
| $ | 196.9 |
|
Professional services and other |
|
| 132.2 |
|
|
| 1.2 |
|
|
| 1.0 |
|
|
| — |
|
|
| 130.0 |
|
Product development and management |
|
| 59.0 |
|
|
| 1.1 |
|
| 0.1 |
|
|
| — |
|
|
| 57.8 |
| |
Depreciation and amortization |
|
| 34.3 |
|
|
| — |
|
|
| — |
|
|
| — |
|
|
| 34.3 |
|
Total cost of revenue |
|
| 425.8 |
|
|
| 4.4 |
|
|
| 2.4 |
|
|
| — |
|
|
| 419.0 |
|
Sales and marketing |
|
| 131.9 |
|
|
| 4.3 |
|
|
| 1.4 |
|
|
| — |
|
|
| 126.2 |
|
General and administrative |
|
| 138.8 |
|
|
| 16.0 |
|
|
| 1.6 |
|
|
| 20.5 |
|
|
| 100.7 |
|
Other income, net |
|
| (2.9 | ) |
|
| — |
|
|
| — |
|
|
| (2.9 | ) |
|
| — |
|
Operating profit |
|
| 52.8 |
|
|
| 24.7 |
|
|
| 5.4 |
|
|
| 17.6 |
|
|
| 100.5 |
|
Depreciation and amortization |
|
| 56.6 |
|
|
| — |
|
|
| — |
|
|
| — |
|
|
| 56.6 |
|
EBITDA from continuing operations |
| $ | 109.4 |
|
| $ | 24.7 |
|
| $ | 5.4 |
|
| $ | 17.6 |
|
| $ | 157.1 |
|
|
|
44 | 2023 Form 10-K
|
| Year Ended December 31, 2017 |
| |||||||||||||||||
|
| As reported |
|
| Share-based compensation |
|
| Severance charges |
|
| Other operating expenses (1) |
|
| Adjusted |
| |||||
|
| (Dollars in millions) |
| |||||||||||||||||
Cost of revenue: |
|
|
|
|
|
|
|
|
|
|
|
|
|
|
|
|
|
|
|
|
Recurring services |
| $ | 196.8 |
|
| $ | 1.0 |
|
| $ | 2.2 |
|
| $ | — |
|
| $ | 193.6 |
|
Professional services and other |
|
| 135.8 |
|
|
| 1.1 |
|
| 0.9 |
|
|
| — |
|
|
| 133.8 |
| |
Product development and management |
|
| 43.6 |
|
|
| 0.7 |
|
| 0.7 |
|
|
| — |
|
|
| 42.2 |
| |
Depreciation and amortization |
|
| 31.3 |
|
|
| — |
|
|
| — |
|
|
| — |
|
|
| 31.3 |
|
Total cost of revenue |
|
| 407.5 |
|
|
| 2.8 |
|
|
| 3.8 |
|
|
| — |
|
|
| 400.9 |
|
Sales and marketing |
|
| 116.7 |
|
|
| 1.7 |
|
|
| 1.1 |
|
|
| — |
|
|
| 113.9 |
|
General and administrative |
|
| 106.3 |
|
|
| 11.6 |
|
|
| 0.7 |
|
|
| 1.9 |
|
|
| 92.1 |
|
Other expense (income), net |
|
| 7.3 |
|
|
| — |
|
|
| — |
|
|
| 7.4 |
|
|
| (0.1 | ) |
Operating profit |
|
| 33.0 |
|
|
| 16.1 |
|
|
| 5.6 |
|
|
| 9.3 |
|
|
| 64.0 |
|
Depreciation and amortization |
|
| 53.8 |
|
|
| — |
|
|
| — |
|
|
| — |
|
|
| 53.8 |
|
EBITDA from continuing operations |
| $ | 86.8 |
|
| $ | 16.1 |
|
| $ | 5.6 |
|
| $ | 9.3 |
|
| $ | 117.8 |
|
|
|
|
| Year Ended December 31, 2016 |
| |||||||||||||||||
|
| As reported |
|
| Share-based compensation |
|
| Severance charges |
|
| Other operating expenses (1) |
|
| Adjusted |
| |||||
|
| (Dollars in millions) |
| |||||||||||||||||
Cost of revenue: |
|
|
|
|
|
|
|
|
|
|
|
|
|
|
|
|
|
|
|
|
Recurring services |
| $ | 214.4 |
|
| $ | 2.0 |
|
| $ | 1.6 |
|
| $ | — |
|
| $ | 210.8 |
|
Professional services and other |
|
| 115.6 |
|
|
| — |
|
| 1.7 |
|
|
| — |
|
|
| 113.9 |
| |
Product development and management |
|
| 43.3 |
|
|
| 0.8 |
|
| 1.4 |
|
|
| — |
|
|
| 41.1 |
| |
Depreciation and amortization |
|
| 23.1 |
|
|
| — |
|
|
| — |
|
|
| — |
|
|
| 23.1 |
|
Total cost of revenue |
|
| 396.4 |
|
|
| 2.8 |
|
|
| 4.7 |
|
|
| — |
|
|
| 388.9 |
|
Sales and marketing |
|
| 101.5 |
|
|
| 1.2 |
|
|
| 0.7 |
|
|
| — |
|
|
| 99.6 |
|
General and administrative |
|
| 123.8 |
|
|
| 8.5 |
|
|
| 3.0 |
|
|
| 9.9 |
|
|
| 102.4 |
|
Other expense, net |
|
| 12.9 |
|
|
| — |
|
|
| — |
|
|
| 12.7 |
|
|
| 0.2 |
|
Operating (loss) profit |
|
| (11.2 | ) |
|
| 12.5 |
|
|
| 8.4 |
|
|
| 22.6 |
|
|
| 32.3 |
|
Depreciation and amortization |
|
| 53.2 |
|
|
| — |
|
|
| — |
|
|
|
|
|
|
| 53.2 |
|
EBITDA from continuing operations |
| $ | 42.0 |
|
| $ | 12.5 |
|
| $ | 8.4 |
|
| $ | 22.6 |
|
| $ | 85.5 |
|
|
|
Item 7A. Quantitative and QualitativeQualitative Disclosures About Market Risk.
We are exposed to market risks related to foreign currency exchange rates, interest rates, and pension obligations. We seek to minimize or to manage these market risks through normal operating and financing activities. These market risks may be amplified by events and factors surrounding global events. We do not trade or use instruments with the objective of earning financial gains on the market fluctuations, nor do we use instruments where there are not underlying exposures.
Foreign Currency Risk. Our results of operations and cash flows are subject to fluctuations due to changes in foreign currency exchange rates, particularly changes in the Canadian Dollar. Our exposure to foreign currency exchange rates has historically been partially hedged as our foreign currency denominated inflows create a natural hedge against our foreign currency denominated expenses. Accordingly, our results of operations and cash flows were not materially affected by fluctuation in foreign currency exchange rates, and we believe that a hypothetical 10% change in foreign currency exchange rates or an inability to access foreign funds would not materially affect our ability to meet our operational needs or result in a material foreign currency loss in the future. Due to the relative size of our international operations to date, we have not instituted an active hedging program. We expect our international operations to continue to grow in the near term, and we are monitoring the foreign currency exposure to determine if we should begin a hedging program.
Interest Rate Risk. Our operating results and financial condition are subject to fluctuations due to changes in interest rates, primarily in relation to: (1) our customer funds market valuation and float revenue derived therefrom, (2) our debt and the interest paid on such, and (3) our cash and equivalents and the interest income earned on these balances. Collectively, we do not believe that a change in interest rates of 100 basis points would have a material effect on our operating results or financial condition.
In connection with our U.S. and Canadian payroll and tax filing services,certain jurisdictions, we collect funds for payment of payroll and taxes; temporarily hold such funds in trustsegregated accounts until payment is due; remit the funds to the customers’ employees and appropriate taxing authority; file federal, state and local tax returns; and handle related regulatory correspondence and amendments. We investhave exposure to risks associated with changes in laws and regulations that may affect customer fund balances. For example, a change in regulations, either reducing the U.S.amount of taxes to be withheld or allowing less time to remit taxes to government authorities, would reduce our average customer trust funds primarilyfund balances and float revenue.
Based on current market conditions, portfolio composition and investment practices, a 100 basis point decrease in high- quality bank deposits, money market mutual funds,investment rates would result in approximately $25 million decrease in float revenue over the ensuing twelve month period. There are no incremental costs of revenue associated with changes in float revenue.
We pay floating rates of interest on our Term Debt and Revolving Credit Facility. The interest paid on these borrowings will fluctuate up or collateralized short-term investments. We may also invest these fundsdown in U.S. Treasury and agency securities, as well as highly rated asset-backed, mortgage-backed, municipal, and corporate securities. Our Canadian customer trust funds are investedrelation to changes in securities issued bymarket interest rates. A 100 basis point decrease in the government and provinces of Canada, highly rated Canadian banks and corporations, asset-backed trusts, and mortgages.applicable reference rates would result in approximately $6 million decrease in our interest expense over the ensuring twelve-month period. Please refer to Part II, Item 8, Note 9, “Debt,” for additional information.
We do not enter into investments for trading or speculative purposes. Our cash equivalents and our portfolio of marketable securities are subject to market risk due to changes in interest rates. Fixed rate securities may have their market value adversely affected due to a rise in interest rates, while floating rate securities may produce less income than expected if interest rates fall. Due in part to these factors, our future investment income may fall short of expectation due to changes in interest rates or we may suffer losses in principal if we are forced to sell securities that decline in market value due to changes in interest rates.
However, because we classify our securities as “available for sale,” no gains or losses are recognized due to changes in interest rates unless such securities are sold prior to maturity or declines in fair value are determined to be other-than-temporary.
We do not believe that an increase or decrease in interest rates of 100 basis points would have a material effect on our operating results or financial condition.unrecoverable. Fluctuations in the value of our investment securities caused by a change in interest rates (gains or losses on the carrying value) are recorded in other comprehensive income, and are realized only if we sell the underlying securities.
45 | 2023 Form 10-K
Pension Obligation Risk. We provide a pension plan for a numbercertain current and former U.S. employees that closed to new participants on January 2, 1995. In 2007, the U.S. pension plan was amended (1) to exclude from further participation any participant or former participant who was not employed by the company or another participating employer on January 1, 2008, (2) to discontinue participant contributions, and (3) to freeze the accrual of former employees.additional benefits as of December 31, 2007. In applying relevant accounting policies, we have made critical estimates related to actuarial assumptions, including assumptions of expected returns on plan assets, discount rates, and health care cost trends. The cost of pension benefits in future periods will depend on actual returns on plan assets, assumptions for future periods, contributions, and benefit experience. In 2018, we contributed $18.5 millionAs of December 31, 2023, the projected benefit obligation ("PBO") exceeded the fair value of plan assets by $21.5 million. Please refer to our pension plan.Part II, Item 8, Note 10, "Employee Benefit Plans," for additional information.
The effective discount rate used in accounting for pension and other benefit obligations in 20182023 ranged from 3.70%4.52% to 3.92%4.65%. The expected rate of return on plan assets for qualified pension benefits in 20182023 was 6.30%5.20%. The following table reflects the estimated sensitivity associated with a change in certain significant actuarial assumptions (each assumption change is presented mutually exclusive of other assumption changes):
|
|
|
| Impact on 2024 Pension Expense |
| |||||
|
| Change in |
| Pension |
|
| Post |
| ||
|
|
|
| (In millions) |
| |||||
Increase in discount rate |
| 50 basis points |
| $ | 0.1 |
|
| $ | — |
|
Decrease in discount rate |
| 50 basis points |
| $ | (0.1 | ) |
| $ | — |
|
Increase in return on plan asset |
| 50 basis points |
| $ | (1.8 | ) |
| N/A |
| |
Decrease in return on plan asset |
| 50 basis points |
| $ | 1.8 |
|
| N/A |
| |
|
|
|
| Impact on 2018 Pension Expense Increase (Decrease) |
| |||||
|
| Change in Assumption |
| Pension Benefits |
|
| Post Retirement |
| ||
|
|
|
| (Dollars in millions) |
| |||||
Increase in discount rate |
| 50 basis points |
| $ | 0.2 |
|
| $ | — |
|
Decrease in discount rate |
| 50 basis points |
| $ | (0.2 | ) |
| $ | — |
|
Increase in return on plan asset |
| 50 basis points |
| $ | (2.0 | ) |
| $ | — |
|
Decrease in return on plan asset |
| 50 basis points |
| $ | 2.0 |
|
| $ | — |
|
46 | 2023 Form 10-K
Item 8. Financial StatementsStatements and Supplementary Data.
INDEX TO FINANCIAL STATEMENTS
Page | |
CONSOLIDATED FINANCIAL STATEMENTS OF CERIDIAN HCM HOLDING INC. | |
| |
Consolidated Balance Sheets as of December 31, |
|
| |
| |
| |
| |
|
47 |  2023 Form 10-K
Report of Independent RegisteredRegistered Public Accounting Firm
TheTo the Stockholders and Board of Directors
Dayforce, Inc.:
Ceridian HCM Holding Inc.:
Opinion on the Consolidated Financial Statements
We have audited the accompanying consolidated balance sheets of Ceridian HCM Holding Inc. and its subsidiaries (the Company) as of December 31, 20182023 and 2017,2022, the related consolidated statements of operations, comprehensive income (loss), stockholders’ equity, and cash flows for each of the years in the three yearthree-year period ended December 31, 2018,2023, and the related notes (collectively, the consolidated financial statements). In our opinion, the consolidated financial statements present fairly, in all material respects, the financial position of the Company as of December 31, 20182023 and 2017,2022, and the results of its operations and its cash flows for each of the years in the three yearthree-year period ended December 31, 2018,2023, in conformity with U.S. generally accepted accounting principles.
We also have audited, in accordance with the standards of the Public Company Accounting Oversight Board (United States) (PCAOB), the Company’s internal control over financial reporting as of December 31, 2023, based on criteria established in Internal Control – Integrated Framework (2013) issued by the Committee of Sponsoring Organizations of the Treadway Commission, and our report dated February 28, 2024 expressed an adverse opinion on the effectiveness of the Company’s internal control over financial reporting.
Basis for Opinion
These consolidated financial statements are the responsibility of the Company’s management. Our responsibility is to express an opinion on these consolidated financial statements based on our audits. We are a public accounting firm registered with the Public Company Accounting Oversight Board (United States) (PCAOB)PCAOB and are required to be independent with respect to the Company in accordance with the U.S. federal securities laws and the applicable rules and regulations of the Securities and Exchange Commission and the PCAOB.
We conducted our audits in accordance with the standards of the PCAOB. Those standards require that we plan and perform the audit to obtain reasonable assurance about whether the consolidated financial statements are free of material misstatement, whether due to error or fraud. Our audits included performing procedures to assess the risks of material misstatement of the consolidated financial statements, whether due to error or fraud, and performing procedures that respond to those risks. Such procedures included examining, on a test basis, evidence regarding the amounts and disclosures in the consolidated financial statements. Our audits also included evaluating the accounting principles used and significant estimates made by management, as well as evaluating the overall presentation of the consolidated financial statements. We believe that our audits provide a reasonable basis for our opinion.
Critical Audit Matters
The critical audit matters communicated below are matters arising from the current period audit of the consolidated financial statements that were communicated or required to be communicated to the audit committee and that: (1) relate to accounts or disclosures that are material to the consolidated financial statements and (2) involved our especially challenging, subjective, or complex judgments. The communication of critical audit matters does not alter in any way our opinion on the consolidated financial statements, taken as a whole, and we are not, by communicating the critical audit matters below, providing separate opinions on the critical audit matters or on the accounts or disclosures to which they relate.
U.S. Customer funds and U.S. customer funds obligations
As discussed in Note 4 to the consolidated financial statements, in connection with the Company’s payroll and tax services, it (1) collects funds for payment of payroll and taxes, (2) temporarily holds such funds until payment is due, and (3) remits the funds to its customers’ employees and taxing authorities. In the U.S. and Canada, these customer funds are held in trusts. The Company collects and manages large amounts of data and its applications are inherently complex. At December 31, 2023, customer funds and customer funds obligations were $5.0 billion and $5.1 billion, respectively.
We identified the evaluation of the sufficiency of audit evidence over U.S. customer funds and U.S. customer funds obligations as a critical audit matter. Specifically, complex auditor judgment was required to determine that the receipt and expenditure of funds used to develop the U.S. customer funds and U.S. customer funds obligations balances at December 31, 2023, reconciled to customers’ transaction data. This matter required the use of information technology (IT) professionals with specialized skills and knowledge.
48 | 2023 Form 10-K
The following are the primary procedures we performed to address this critical audit matter. We applied auditor judgment to determine the nature and extent of procedures to be performed to determine that the receipt and expenditure of funds used to develop the U.S. customer funds and U.S. customer funds obligations balances at December 31, 2023, reconciled to customers’ transaction data, including the extent of involvement of IT professionals. We evaluated the design and tested the operating effectiveness of certain internal controls related to the U.S. customer funds and U.S. customer funds obligations process. Specifically, we involved IT professionals with specialized skills and knowledge, who assisted in the identification and testing of general IT controls and process level IT risks and controls related to:
We evaluated the U.S. customer funds and U.S. customer funds obligations by obtaining the amounts from the Company’s IT systems used to track U.S. customer funds and U.S. customer funds obligations, and comparing them to the general ledger, third-party bank statements or confirmations, and underlying documentation for reconciling items. We evaluated the sufficiency of audit evidence obtained by assessing the results of procedures performed, including the appropriateness of the nature and extent of such evidence.
Stand-alone selling price (SSP) of cloud Dayforce professional services
As discussed in Note 12 to the consolidated financial statements, the Company recognized $216.4 million of professional services and other revenue, including cloud Dayforce professional services, for the year ended December 31, 2023, and $89.0 million of contract assets as of December 31, 2023. Cloud Dayforce professional services includes implementation services to activate new accounts. The Company’s cloud services arrangements include multiple performance obligations and the transaction price allocation is based on the SSP for the performance obligations. The SSP for cloud Dayforce implementation services is estimated based on market conditions and observable inputs, including rates charged by third parties to perform implementation services, as well as an estimate of the hours expected to be incurred.
We identified the assessment of the Company’s estimated hours expected to be incurred that were used to determine the SSP of cloud Dayforce implementation services as a critical audit matter. Subjective auditor judgment was required to evaluate the professional services hours assumption that involved unobservable market data and was susceptible to manipulation.
The following are the primary procedures we performed to address this critical audit matter. We evaluated the design and tested the operating effectiveness of certain internal controls related to the Company’s estimated hours to be incurred that were used to determine the SSP of cloud Dayforce implementation services. To evaluate the Company’s retrospective review of its estimated implementation services hours, we compared the historical estimated implementation hours to actual implementation hours incurred for a selection of contracts. For a sample of contracts entered into during the year ended December 31, 2023:
/s/ KPMG LLP
We have served as the Company’s auditor since 1958.
Minneapolis, Minnesota
February 28, 20192024
49 | 2023 Form 10-K
Report of Independent Registered Public Accounting Firm
To the Stockholders and Board of Directors
Dayforce, Inc.:
Opinion on Internal Control Over Financial Reporting
We have audited Ceridian HCM Holding Inc. and subsidiaries' (the Company) internal control over financial reporting as of December 31, 2023, based on criteria established in Internal Control – Integrated Framework (2013) issued by the Committee of Sponsoring Organizations of the Treadway Commission. In our opinion, because of the effect of the material weakness, described below, on the achievement of the objectives of the control criteria, the Company has not maintained effective internal control over financial reporting as of December 31, 2023, based on criteria established in Internal Control – Integrated Framework (2013) issued by the Committee of Sponsoring Organizations of the Treadway Commission.
We also have audited, in accordance with the standards of the Public Company Accounting Oversight Board (United States) (PCAOB), the consolidated balance sheets of the Company as of December 31, 2023 and 2022, the related consolidated statements of operations, comprehensive income (loss), stockholders’ equity, and cash flows for each of the years in the three-year period ended December 31, 2023, and the related notes (collectively, the consolidated financial statements), and our report dated February 28, 2024 expressed an unqualified opinion on those consolidated financial statements.
A material weakness is a deficiency, or a combination of deficiencies, in internal control over financial reporting, such that there is a reasonable possibility that a material misstatement of the company’s annual or interim financial statements will not be prevented or detected on a timely basis. A material weakness related to ineffective general information technology controls related to user access and change management over the information technology (IT) systems supporting their Canadian trust and Powerpay revenue processes has been identified and included in management’s assessment. The material weakness was considered in determining the nature, timing, and extent of audit tests applied in our audit of the 2023 consolidated financial statements, and this report does not affect our report on those consolidated financial statements.
Basis for Opinion
The Company’s management is responsible for maintaining effective internal control over financial reporting and for its assessment of the effectiveness of internal control over financial reporting, included in the accompanying Management's Report on Internal Control over financial reporting. Our responsibility is to express an opinion on the Company’s internal control over financial reporting based on our audit. We are a public accounting firm registered with the PCAOB and are required to be independent with respect to the Company in accordance with the U.S. federal securities laws and the applicable rules and regulations of the Securities and Exchange Commission and the PCAOB.
We conducted our audit in accordance with the standards of the PCAOB. Those standards require that we plan and perform the audit to obtain reasonable assurance about whether effective internal control over financial reporting was maintained in all material respects. Our audit of internal control over financial reporting included obtaining an understanding of internal control over financial reporting, assessing the risk that a material weakness exists, and testing and evaluating the design and operating effectiveness of internal control based on the assessed risk. Our audit also included performing such other procedures as we considered necessary in the circumstances. We believe that our audit provides a reasonable basis for our opinion.
Definition and Limitations of Internal Control Over Financial Reporting
A company’s internal control over financial reporting is a process designed to provide reasonable assurance regarding the reliability of financial reporting and the preparation of financial statements for external purposes in accordance with generally accepted accounting principles. A company’s internal control over financial reporting includes those policies and procedures that (1) pertain to the maintenance of records that, in reasonable detail, accurately and fairly reflect the transactions and dispositions of the assets of the company; (2) provide reasonable assurance that transactions are recorded as necessary to permit preparation of financial statements in accordance with generally accepted accounting principles, and that receipts and expenditures of the company are being made only in accordance with authorizations of management and directors of the company; and (3) provide reasonable assurance regarding prevention or timely detection of unauthorized acquisition, use, or disposition of the company’s assets that could have a material effect on the financial statements.
50 | 2023 Form 10-K
Because of its inherent limitations, internal control over financial reporting may not prevent or detect misstatements. Also, projections of any evaluation of effectiveness to future periods are subject to the risk that controls may become inadequate because of changes in conditions, or that the degree of compliance with the policies or procedures may deteriorate.
/s/ KPMG LLP
Minneapolis, Minnesota
February 28, 2024
51 | 2023 Form 10-K
Ceridian HCM Holding Inc.
Consolidated Balance Sheets
(Dollars in millions, except share data)
|
| December 31, |
| |||||
|
| 2023 |
|
| 2022 |
| ||
(In millions, except per share data) |
|
|
|
|
|
| ||
ASSETS |
|
|
|
|
|
| ||
Current assets: |
|
|
|
|
|
| ||
Cash and equivalents |
| $ | 570.3 |
|
| $ | 431.9 |
|
Restricted cash |
|
| 0.8 |
|
|
| 0.8 |
|
Trade and other receivables, net |
|
| 228.8 |
|
|
| 180.1 |
|
Prepaid expenses and other current assets |
|
| 126.7 |
|
|
| 98.0 |
|
Total current assets before customer funds |
|
| 926.6 |
|
|
| 710.8 |
|
Customer funds |
|
| 5,028.6 |
|
|
| 4,729.5 |
|
Total current assets |
|
| 5,955.2 |
|
|
| 5,440.3 |
|
Right of use lease assets, net |
|
| 19.1 |
|
|
| 24.3 |
|
Property, plant, and equipment, net |
|
| 210.1 |
|
|
| 174.9 |
|
Goodwill |
|
| 2,293.9 |
|
|
| 2,280.0 |
|
Other intangible assets, net |
|
| 230.2 |
|
|
| 281.6 |
|
Other assets |
|
| 302.4 |
|
|
| 262.4 |
|
Total assets |
| $ | 9,010.9 |
|
| $ | 8,463.5 |
|
LIABILITIES AND EQUITY |
|
|
|
|
|
| ||
Current liabilities: |
|
|
|
|
|
| ||
Current portion of long-term debt |
| $ | 7.6 |
|
| $ | 7.8 |
|
Current portion of long-term lease liabilities |
|
| 7.0 |
|
|
| 10.0 |
|
Accounts payable |
|
| 66.7 |
|
|
| 54.3 |
|
Deferred revenue |
|
| 40.2 |
|
|
| 41.2 |
|
Employee compensation and benefits |
|
| 92.9 |
|
|
| 97.4 |
|
Other accrued expenses |
|
| 30.4 |
|
|
| 24.0 |
|
Total current liabilities before customer funds obligations |
|
| 244.8 |
|
|
| 234.7 |
|
Customer funds obligations |
|
| 5,090.1 |
|
|
| 4,845.1 |
|
Total current liabilities |
|
| 5,334.9 |
|
|
| 5,079.8 |
|
Long-term debt, less current portion |
|
| 1,210.1 |
|
|
| 1,213.4 |
|
Employee benefit plans |
|
| 27.7 |
|
|
| 17.7 |
|
Long-term lease liabilities, less current portion |
|
| 18.9 |
|
|
| 23.7 |
|
Other liabilities |
|
| 21.1 |
|
|
| 19.5 |
|
Total liabilities |
|
| 6,612.7 |
|
|
| 6,354.1 |
|
Commitments and contingencies (Note 15) |
|
|
|
|
|
| ||
Stockholders’ equity: |
|
|
|
|
|
| ||
Common stock, $0.01 par, 500.0 shares authorized, 156.3 and 153.9 shares issued and outstanding, respectively |
|
| 1.6 |
|
|
| 1.5 |
|
Additional paid in capital |
|
| 3,151.1 |
|
|
| 2,965.5 |
|
Accumulated deficit |
|
| (317.8 | ) |
|
| (372.6 | ) |
Accumulated other comprehensive loss |
|
| (436.7 | ) |
|
| (485.0 | ) |
Total stockholders’ equity |
|
| 2,398.2 |
|
|
| 2,109.4 |
|
Total liabilities and stockholders' equity |
| $ | 9,010.9 |
|
| $ | 8,463.5 |
|
|
| December 31, |
| |||||
|
| 2018 |
|
| 2017 |
| ||
ASSETS |
|
|
|
|
|
|
|
|
Current assets: |
|
|
|
|
|
|
|
|
Cash and equivalents |
| $ | 217.8 |
|
| $ | 94.2 |
|
Trade and other receivables, net |
|
| 69.9 |
|
|
| 66.6 |
|
Prepaid expenses |
|
| 40.3 |
|
|
| 36.4 |
|
Assets of discontinued operations |
|
| — |
|
|
| 156.2 |
|
Other current assets |
|
| 2.0 |
|
|
| 5.3 |
|
Total current assets before customer trust funds |
|
| 330.0 |
|
|
| 358.7 |
|
Customer trust funds |
|
| 2,603.5 |
|
|
| 4,099.7 |
|
Total current assets |
|
| 2,933.5 |
|
|
| 4,458.4 |
|
Property, plant, and equipment, net |
|
| 104.4 |
|
|
| 102.0 |
|
Goodwill |
|
| 1,927.4 |
|
|
| 1,961.0 |
|
Other intangible assets, net |
|
| 187.5 |
|
|
| 206.5 |
|
Other assets |
|
| 1.6 |
|
|
| 2.0 |
|
Total assets |
| $ | 5,154.4 |
|
| $ | 6,729.9 |
|
LIABILITIES AND EQUITY |
|
|
|
|
|
|
|
|
Current liabilities: |
|
|
|
|
|
|
|
|
Current portion of long-term debt |
|
| 6.8 |
|
| $ | — |
|
Accounts payable |
|
| 41.5 |
|
|
| 44.4 |
|
Accrued interest |
|
| 0.1 |
|
|
| 15.9 |
|
Deferred revenue |
|
| 17.2 |
|
|
| 14.0 |
|
Employee compensation and benefits |
|
| 54.5 |
|
|
| 68.8 |
|
Liabilities of discontinued operations |
|
| 0.2 |
|
|
| 19.6 |
|
Other accrued expenses |
|
| 23.6 |
|
|
| 15.0 |
|
Total current liabilities before customer trust funds obligations |
|
| 143.9 |
|
|
| 177.7 |
|
Customer trust funds obligations |
|
| 2,619.7 |
|
|
| 4,105.5 |
|
Total current liabilities |
|
| 2,763.6 |
|
|
| 4,283.2 |
|
Long-term debt, less current portion |
|
| 663.5 |
|
|
| 1,119.8 |
|
Employee benefit plans |
|
| 153.3 |
|
|
| 152.4 |
|
Other liabilities |
|
| 42.0 |
|
|
| 45.5 |
|
Total liabilities |
|
| 3,622.4 |
|
|
| 5,600.9 |
|
Commitments and contingencies (Note 15) |
|
|
|
|
|
|
|
|
Stockholders’ equity: |
|
|
|
|
|
|
|
|
Senior preferred stock, $0.01 par, 70,000,000 shares authorized, 16,802,144 shares issued and outstanding as of December 31, 2017 |
|
| — |
|
|
| 184.8 |
|
Junior preferred stock, $0.01 par, 70,000,000 shares authorized, 58,244,308 shares issued and outstanding as of December 31, 2017 |
|
| — |
|
|
| 0.6 |
|
Common stock, $0.01 par, 500,000,000 shares authorized, 139,453,710 shares issued and outstanding as of December 31, 2018, and 150,000,000 shares authorized, 65,285,962 shares issued and outstanding as of December 31, 2017 |
|
| 1.4 |
|
|
| 0.7 |
|
Additional paid in capital |
|
| 2,325.6 |
|
|
| 1,565.4 |
|
Accumulated deficit |
|
| (419.3 | ) |
|
| (348.2 | ) |
Accumulated other comprehensive loss |
|
| (375.7 | ) |
|
| (312.1 | ) |
Total stockholders’ equity |
|
| 1,532.0 |
|
|
| 1,091.2 |
|
Noncontrolling interest |
|
| — |
|
|
| 37.8 |
|
Total equity |
|
| 1,532.0 |
|
|
| 1,129.0 |
|
Total liabilities and equity |
| $ | 5,154.4 |
|
| $ | 6,729.9 |
|
See accompanying notes to consolidated financial statements.
52 | 2023 Form 10-K
Consolidated Statements of Operations
(Dollars in millions, except share and per share data)
|
| Year Ended December 31, |
| |||||||||
|
| 2023 |
|
| 2022 |
|
| 2021 |
| |||
(In millions, except per share data) |
|
|
|
|
|
|
|
|
| |||
Revenue: |
|
|
|
|
|
|
|
|
| |||
Recurring |
| $ | 1,297.3 |
|
| $ | 1,047.6 |
|
| $ | 850.7 |
|
Professional services and other |
|
| 216.4 |
|
|
| 198.6 |
|
|
| 173.5 |
|
Total revenue |
|
| 1,513.7 |
|
|
| 1,246.2 |
|
|
| 1,024.2 |
|
Cost of revenue: |
|
|
|
|
|
|
|
|
| |||
Recurring |
|
| 324.9 |
|
|
| 309.4 |
|
|
| 262.4 |
|
Professional services and other |
|
| 265.6 |
|
|
| 238.7 |
|
|
| 194.6 |
|
Product development and management |
|
| 209.9 |
|
|
| 169.9 |
|
|
| 134.0 |
|
Depreciation and amortization |
|
| 66.8 |
|
|
| 55.0 |
|
|
| 50.9 |
|
Total cost of revenue |
|
| 867.2 |
|
|
| 773.0 |
|
|
| 641.9 |
|
Gross profit |
|
| 646.5 |
|
|
| 473.2 |
|
|
| 382.3 |
|
Selling and marketing |
|
| 250.2 |
|
|
| 251.5 |
|
|
| 218.5 |
|
General and administrative |
|
| 263.2 |
|
|
| 247.5 |
|
|
| 199.3 |
|
Operating profit (loss) |
|
| 133.1 |
|
|
| (25.8 | ) |
|
| (35.5 | ) |
Interest expense, net |
|
| 36.1 |
|
|
| 28.6 |
|
|
| 35.9 |
|
Other expense, net |
|
| 1.0 |
|
|
| 8.5 |
|
|
| 18.9 |
|
Income (loss) before income taxes |
|
| 96.0 |
|
|
| (62.9 | ) |
|
| (90.3 | ) |
Income tax expense (benefit) |
|
| 41.2 |
|
|
| 10.5 |
|
|
| (14.9 | ) |
Net income (loss) |
| $ | 54.8 |
|
| $ | (73.4 | ) |
| $ | (75.4 | ) |
Net income (loss) per share: |
|
|
|
|
|
|
|
|
| |||
Basic |
| $ | 0.35 |
|
| $ | (0.48 | ) |
| $ | (0.50 | ) |
Diluted |
| $ | 0.35 |
|
| $ | (0.48 | ) |
| $ | (0.50 | ) |
Weighted average shares outstanding: |
|
|
|
|
|
|
|
|
| |||
Basic |
|
| 155.3 |
|
|
| 152.9 |
|
|
| 150.4 |
|
Diluted |
|
| 158.5 |
|
|
| 152.9 |
|
|
| 150.4 |
|
|
| Year Ended December 31, |
| |||||||||
|
| 2018 |
|
| 2017 |
|
| 2016 |
| |||
Revenue: |
|
|
|
|
|
|
|
|
|
|
|
|
Recurring services |
| $ | 652.5 |
|
| $ | 598.5 |
|
| $ | 558.5 |
|
Professional services and other |
|
| 93.9 |
|
|
| 72.3 |
|
|
| 64.9 |
|
Total revenue |
|
| 746.4 |
|
|
| 670.8 |
|
|
| 623.4 |
|
Cost of revenue: |
|
|
|
|
|
|
|
|
|
|
|
|
Recurring services |
|
| 200.3 |
|
|
| 196.8 |
|
|
| 214.4 |
|
Professional services and other |
|
| 132.2 |
|
|
| 135.8 |
|
|
| 115.6 |
|
Product development and management |
|
| 59.0 |
|
|
| 43.6 |
|
|
| 43.3 |
|
Depreciation and amortization |
|
| 34.3 |
|
|
| 31.3 |
|
|
| 23.1 |
|
Total cost of revenue |
|
| 425.8 |
|
|
| 407.5 |
|
|
| 396.4 |
|
Gross profit |
|
| 320.6 |
|
|
| 263.3 |
|
|
| 227.0 |
|
Costs and expenses: |
|
|
|
|
|
|
|
|
|
|
|
|
Selling, general and administrative |
|
| 270.7 |
|
|
| 223.0 |
|
|
| 225.3 |
|
Other (income) expense, net |
|
| (2.9 | ) |
|
| 7.3 |
|
|
| 12.9 |
|
Operating profit (loss) |
|
| 52.8 |
|
|
| 33.0 |
|
|
| (11.2 | ) |
Interest expense, net |
|
| 83.2 |
|
|
| 87.1 |
|
|
| 87.4 |
|
Loss from continuing operations before income taxes |
|
| (30.4 | ) |
|
| (54.1 | ) |
|
| (98.6 | ) |
Income tax expense (benefit) |
|
| 7.7 |
|
|
| (49.6 | ) |
|
| 6.7 |
|
Loss from continuing operations |
|
| (38.1 | ) |
|
| (4.5 | ) |
|
| (105.3 | ) |
(Loss) income from discontinued operations |
|
| (25.8 | ) |
|
| (6.0 | ) |
|
| 12.5 |
|
Net loss |
|
| (63.9 | ) |
|
| (10.5 | ) |
|
| (92.8 | ) |
Net (loss) income attributable to noncontrolling interest |
|
| (0.5 | ) |
|
| (1.3 | ) |
|
| 0.1 |
|
Net loss attributable to Ceridian |
| $ | (63.4 | ) |
| $ | (9.2 | ) |
| $ | (92.9 | ) |
Net loss per share attributable to Ceridian—basic and diluted (Note 19) |
| $ | (0.62 | ) |
| $ | (0.46 | ) |
| $ | (1.65 | ) |
Weighted-average shares used to compute net loss per share attributable to Ceridian—basic and diluted (Note 19) |
|
| 114,049,682 |
|
|
| 65,204,960 |
|
|
| 64,988,338 |
|
See accompanying notes to consolidated financial statements.
53 | 2023 Form 10-K
Consolidated Statements of Comprehensive Income (Loss)
(Dollars
|
| Year Ended December 31, |
| |||||||||
|
| 2023 |
|
| 2022 |
|
| 2021 |
| |||
(In millions) |
|
|
|
|
|
|
|
|
| |||
Net income (loss) |
| $ | 54.8 |
|
| $ | (73.4 | ) |
| $ | (75.4 | ) |
Items of other comprehensive income (loss) before income taxes: |
|
|
|
|
|
|
|
|
| |||
Change in foreign currency translation adjustment |
|
| 16.6 |
|
|
| (56.7 | ) |
|
| (17.6 | ) |
Change in unrealized loss from invested customer funds |
|
| 54.4 |
|
|
| (134.6 | ) |
|
| (48.4 | ) |
Change in pension liability adjustment (a) |
|
| (11.4 | ) |
|
| (5.8 | ) |
|
| 6.0 |
|
Other comprehensive income (loss) before income taxes |
|
| 59.6 |
|
|
| (197.1 | ) |
|
| (60.0 | ) |
Income tax expense (benefit), net |
|
| 11.3 |
|
|
| (36.9 | ) |
|
| (11.2 | ) |
Other comprehensive income (loss) after income taxes |
|
| 48.3 |
|
|
| (160.2 | ) |
|
| (48.8 | ) |
Comprehensive income (loss) |
| $ | 103.1 |
|
| $ | (233.6 | ) |
| $ | (124.2 | ) |
|
| Year Ended December 31, |
| |||||||||
|
| 2018 |
|
| 2017 |
|
| 2016 |
| |||
Net loss |
| $ | (63.9 | ) |
| $ | (10.5 | ) |
| $ | (92.8 | ) |
Items of other comprehensive income (loss) before income taxes: |
|
|
|
|
|
|
|
|
|
|
|
|
Change in foreign currency translation adjustment |
|
| (47.4 | ) |
|
| 39.7 |
|
|
| 24.4 |
|
Change in unrealized gain from invested customer trust funds |
|
| (10.5 | ) |
|
| (17.3 | ) |
|
| (10.2 | ) |
Change in pension liability adjustment (1) |
|
| (7.6 | ) |
|
| 13.8 |
|
|
| 13.6 |
|
Other comprehensive (loss) income before income taxes |
|
| (65.5 | ) |
|
| 36.2 |
|
|
| 27.8 |
|
Income tax (benefit) expense, net |
|
| (1.2 | ) |
|
| (3.6 | ) |
|
| 0.6 |
|
Other comprehensive (loss) income after income taxes |
|
| (64.3 | ) |
|
| 39.8 |
|
|
| 27.2 |
|
Comprehensive (loss) income |
|
| (128.2 | ) |
|
| 29.3 |
|
|
| (65.6 | ) |
Comprehensive loss attributable to noncontrolling interest |
|
| (0.5 | ) |
|
| (0.9 | ) |
|
| (0.5 | ) |
Comprehensive (loss) income attributable to the Ceridian |
| $ | (127.7 | ) |
| $ | 30.2 |
|
| $ | (65.1 | ) |
|
|
See accompanying notes to consolidated financial statements.
54 | 2023 Form 10-K
Consolidated Statements of Stockholders’ Equity
(Dollars in millions, except share data)
|
| Common Stock |
|
| Additional |
|
| Accumulated |
|
| Accumulated |
|
| Total |
| |||||||||
|
| Shares |
|
| $ |
|
| Capital |
|
| Deficit |
|
| Loss |
|
| Equity |
| ||||||
(In millions) |
|
|
|
|
|
|
|
|
|
|
|
|
|
|
|
|
|
| ||||||
Balance as of December 31, 2020 |
|
| 148.6 |
|
| $ | 1.5 |
|
| $ | 2,606.5 |
|
| $ | (233.8 | ) |
| $ | (276.0 | ) |
| $ | 2,098.2 |
|
Net loss |
|
| — |
|
|
| — |
|
|
| — |
|
|
| (75.4 | ) |
|
| — |
|
|
| (75.4 | ) |
Issuance of common stock under share-based compensation plans |
|
| 3.4 |
|
|
| — |
|
|
| 95.4 |
|
|
| — |
|
|
| — |
|
|
| 95.4 |
|
Share-based compensation |
|
| — |
|
|
| — |
|
|
| 113.4 |
|
|
| — |
|
|
| — |
|
|
| 113.4 |
|
Foreign currency translation |
|
| — |
|
|
| — |
|
|
| — |
|
|
| — |
|
|
| (17.6 | ) |
|
| (17.6 | ) |
Change in unrealized loss, net of tax of ($12.8) |
|
| — |
|
|
| — |
|
|
| — |
|
|
| — |
|
|
| (35.6 | ) |
|
| (35.6 | ) |
Change in pension liability adjustment, net of tax of $1.6 |
|
| — |
|
|
| — |
|
|
| — |
|
|
| — |
|
|
| 4.4 |
|
|
| 4.4 |
|
Equity component of convertible senior notes |
|
| — |
|
|
| — |
|
|
| 77.7 |
|
|
| — |
|
|
| — |
|
|
| 77.7 |
|
Purchase of capped calls related to convertible senior notes |
|
| — |
|
|
| — |
|
|
| (33.0 | ) |
|
| — |
|
|
| — |
|
|
| (33.0 | ) |
Balance as of December 31, 2021 |
|
| 152.0 |
|
| $ | 1.5 |
|
| $ | 2,860.0 |
|
| $ | (309.2 | ) |
| $ | (324.8 | ) |
| $ | 2,227.5 |
|
Net loss |
|
| — |
|
|
| — |
|
|
| — |
|
|
| (73.4 | ) |
|
| — |
|
|
| (73.4 | ) |
Cumulative-effect adjustments related to the adoption of ASU 2020-06 |
|
| — |
|
|
| — |
|
|
| (77.7 | ) |
|
| 10.0 |
|
|
| — |
|
|
| (67.7 | ) |
Issuance of common stock under share-based compensation plans |
|
| 1.9 |
|
|
| — |
|
|
| 38.4 |
|
|
| — |
|
|
| — |
|
|
| 38.4 |
|
Share-based compensation |
|
| — |
|
|
| — |
|
|
| 144.8 |
|
|
| — |
|
|
| — |
|
|
| 144.8 |
|
Foreign currency translation |
|
| — |
|
|
| — |
|
|
| — |
|
|
| — |
|
|
| (56.7 | ) |
|
| (56.7 | ) |
Change in unrealized loss, net of tax of ($35.4) |
|
| — |
|
|
| — |
|
|
| — |
|
|
| — |
|
|
| (99.2 | ) |
|
| (99.2 | ) |
Change in pension liability adjustment, net of tax of ($1.5) |
|
| — |
|
|
| — |
|
|
| — |
|
|
| — |
|
|
| (4.3 | ) |
|
| (4.3 | ) |
Balance as of December 31, 2022 |
|
| 153.9 |
|
| $ | 1.5 |
|
| $ | 2,965.5 |
|
| $ | (372.6 | ) |
| $ | (485.0 | ) |
| $ | 2,109.4 |
|
Net income |
|
| — |
|
|
| — |
|
|
| — |
|
|
| 54.8 |
|
|
| — |
|
|
| 54.8 |
|
Issuance of common stock under share-based compensation plans |
|
| 2.4 |
|
|
| 0.1 |
|
|
| 48.9 |
|
|
| — |
|
|
| — |
|
|
| 49.0 |
|
Share-based compensation |
|
| — |
|
|
| — |
|
|
| 136.7 |
|
|
| — |
|
|
| — |
|
|
| 136.7 |
|
Foreign currency translation |
|
| — |
|
|
| — |
|
|
| — |
|
|
| — |
|
|
| 16.6 |
|
|
| 16.6 |
|
Change in unrealized loss, net of tax of $14.3 |
|
| — |
|
|
| — |
|
|
| — |
|
|
| — |
|
|
| 40.1 |
|
|
| 40.1 |
|
Change in pension liability adjustment, net of tax of ($3.0) |
|
| — |
|
|
| — |
|
|
| — |
|
|
| — |
|
|
| (8.4 | ) |
|
| (8.4 | ) |
Balance as of December 31, 2023 |
|
| 156.3 |
|
| $ | 1.6 |
|
| $ | 3,151.1 |
|
| $ | (317.8 | ) |
| $ | (436.7 | ) |
| $ | 2,398.2 |
|
|
| Senior Preferred Stock |
|
| Junior Preferred Stock |
|
| Common Stock |
|
| Additional Paid In |
|
| Accumulated |
|
| Accumulated Other Comprehensive |
|
| Receivable from |
|
| Total Stockholders |
|
| Non-controlling |
|
| Total |
| ||||||||||||||||||||||
|
| Shares |
|
| $ |
|
| Shares |
|
| $ |
|
| Shares |
|
| $ |
|
| Capital |
|
| Deficit |
|
| Loss |
|
| Stockholder |
|
| Equity |
|
| Interest |
|
| Equity |
| |||||||||||||
Balance as of December 31, 2015 |
|
| — |
|
| $ | — |
|
|
| 58,244,308 |
|
| $ | 0.6 |
|
|
| 64,924,845 |
|
| $ | 0.7 |
|
| $ | 1,531.5 |
|
| $ | (211.5 | ) |
| $ | (379.2 | ) |
| $ | — |
|
| $ | 942.1 |
|
| $ | — |
|
| $ | 942.1 |
|
Net (loss) income |
|
| — |
|
|
| — |
|
|
| — |
|
|
| — |
|
|
| — |
|
|
| — |
|
|
| — |
|
|
| (92.9 | ) |
|
| — |
|
|
| — |
|
|
| (92.9 | ) |
|
| 0.1 |
|
|
| (92.8 | ) |
Issuance of Common Stock upon vesting of restricted stock units |
|
| — |
|
|
| — |
|
|
| — |
|
|
| — |
|
|
| 76,192 |
|
|
| — |
|
|
| — |
|
|
| — |
|
|
| — |
|
|
| — |
|
|
| — |
|
|
| — |
|
|
| — |
|
Issuance of Senior Preferred Stock |
|
| 16,802,144 |
|
|
| 150.2 |
|
|
| — |
|
|
| — |
|
|
| — |
|
|
| — |
|
|
| — |
|
|
| — |
|
|
| — |
|
|
| (75.2 | ) |
|
| 75.0 |
|
|
| — |
|
|
| 75.0 |
|
Addition of noncontrolling interest |
|
| — |
|
|
| — |
|
|
| — |
|
|
| — |
|
|
| — |
|
|
| — |
|
|
| — |
|
|
| — |
|
|
| — |
|
|
| — |
|
|
| — |
|
|
| 39.2 |
|
|
| 39.2 |
|
Sale of the UK Business, net of tax $2.5 |
|
| — |
|
|
| — |
|
|
| — |
|
|
| — |
|
|
| — |
|
|
| — |
|
|
| — |
|
|
| — |
|
|
| 25.9 |
|
|
| — |
|
|
| 25.9 |
|
|
| — |
|
|
| 25.9 |
|
Senior preferred dividends declared |
|
| — |
|
|
| 14.1 |
|
|
| — |
|
|
| — |
|
|
| — |
|
|
| — |
|
|
| — |
|
|
| (14.1 | ) |
|
| — |
|
|
| — |
|
|
| — |
|
|
| — |
|
|
| — |
|
Share-based compensation |
|
| — |
|
|
| — |
|
|
| — |
|
|
| — |
|
|
| — |
|
|
| — |
|
|
| 15.3 |
|
|
| — |
|
|
| — |
|
|
| — |
|
|
| 15.3 |
|
|
| — |
|
|
| 15.3 |
|
Foreign currency translation |
|
| — |
|
|
| — |
|
|
| — |
|
|
| — |
|
|
| — |
|
|
| — |
|
|
| — |
|
|
| — |
|
|
| 8.0 |
|
|
| — |
|
|
| 8.0 |
|
|
| (0.6 | ) |
|
| 7.4 |
|
Change in unrealized loss, net of tax of ($2.0) |
|
| — |
|
|
| — |
|
|
| — |
|
|
| — |
|
|
| — |
|
|
| — |
|
|
| — |
|
|
| — |
|
|
| (8.2 | ) |
|
| — |
|
|
| (8.2 | ) |
|
| — |
|
|
| (8.2 | ) |
Change in minimum pension & postretirement liability, net of tax of $0.1 |
|
| — |
|
|
| — |
|
|
| — |
|
|
| — |
|
|
| — |
|
|
| — |
|
|
| — |
|
|
| — |
|
|
| 2.0 |
|
|
| — |
|
|
| 2.0 |
|
|
| — |
|
|
| 2.0 |
|
Balance as of December 31, 2016 |
|
| 16,802,144 |
|
| $ | 164.3 |
|
|
| 58,244,308 |
|
| $ | 0.6 |
|
|
| 65,001,037 |
|
| $ | 0.7 |
|
| $ | 1,546.8 |
|
| $ | (318.5 | ) |
| $ | (351.5 | ) |
| $ | (75.2 | ) |
| $ | 967.2 |
|
| $ | 38.7 |
|
| $ | 1,005.9 |
|
Net loss |
|
| — |
|
|
| — |
|
|
| — |
|
|
| — |
|
|
| — |
|
|
| — |
|
|
| — |
|
|
| (9.2 | ) |
|
| — |
|
|
| — |
|
|
| (9.2 | ) |
|
| (1.3 | ) |
|
| (10.5 | ) |
Issuance of common stock |
|
| — |
|
|
| — |
|
|
| — |
|
|
| — |
|
|
| 183,425 |
|
|
| — |
|
|
| 3.2 |
|
|
| — |
|
|
| — |
|
|
| — |
|
|
| 3.2 |
|
|
| — |
|
|
| 3.2 |
|
Issuance of common stock upon exercise of options |
|
| — |
|
|
| — |
|
|
| — |
|
|
| — |
|
|
| 653,214 |
|
|
| — |
|
|
| — |
|
|
| — |
|
|
| — |
|
|
| — |
|
|
| — |
|
|
| — |
|
|
| — |
|
Issuance of common stock upon vesting of restricted stock units |
|
| — |
|
|
| — |
|
|
| — |
|
|
| — |
|
|
| 76,190 |
|
|
| — |
|
|
| — |
|
|
| — |
|
|
| — |
|
|
| — |
|
|
| — |
|
|
| — |
|
|
| — |
|
Share repurchase |
|
| — |
|
|
| — |
|
|
| — |
|
|
| — |
|
|
| (627,904 | ) |
|
| — |
|
|
| (1.8 | ) |
|
| — |
|
|
| — |
|
|
| — |
|
|
| (1.8 | ) |
|
| — |
|
|
| (1.8 | ) |
Payment for Issuance of Senior Preferred Stock |
|
| — |
|
|
| — |
|
|
| — |
|
|
| — |
|
|
| — |
|
|
| — |
|
|
| — |
|
|
| — |
|
|
| — |
|
|
| 75.2 |
|
|
| 75.2 |
|
|
| — |
|
|
| 75.2 |
|
Senior preferred dividends declared |
|
| — |
|
|
| 20.5 |
|
|
| — |
|
|
| — |
|
|
| — |
|
|
| — |
|
|
| — |
|
|
| (20.5 | ) |
|
| — |
|
|
| — |
|
|
| — |
|
|
| — |
|
|
| — |
|
Share-based compensation |
|
| — |
|
|
| — |
|
|
| — |
|
|
| — |
|
|
| — |
|
|
| — |
|
|
| 17.2 |
|
|
| — |
|
|
| — |
|
|
| — |
|
|
| 17.2 |
|
|
| — |
|
|
| 17.2 |
|
Foreign currency translation |
|
| — |
|
|
| — |
|
|
| — |
|
|
| — |
|
|
| — |
|
|
| — |
|
|
| — |
|
|
| — |
|
|
| 39.3 |
|
|
| — |
|
|
| 39.3 |
|
|
| 0.4 |
|
|
| 39.7 |
|
Change in unrealized loss, net of tax ($3.6) |
|
| — |
|
|
| — |
|
|
| — |
|
|
| — |
|
|
| — |
|
|
| — |
|
|
| — |
|
|
| — |
|
|
| (13.7 | ) |
|
| — |
|
|
| (13.7 | ) |
|
| — |
|
|
| (13.7 | ) |
Change in minimum pension & postretirement liability, net of tax of $0.0 |
|
| — |
|
|
| — |
|
|
| — |
|
|
| — |
|
|
| — |
|
|
| — |
|
|
| — |
|
|
| — |
|
|
| 13.8 |
|
|
| — |
|
|
| 13.8 |
|
|
| — |
|
|
| 13.8 |
|
Balance as of December 31, 2017 |
|
| 16,802,144 |
|
| $ | 184.8 |
|
|
| 58,244,308 |
|
| $ | 0.6 |
|
|
| 65,285,962 |
|
| $ | 0.7 |
|
| $ | 1,565.4 |
|
| $ | (348.2 | ) |
| $ | (312.1 | ) |
| $ | — |
|
| $ | 1,091.2 |
|
| $ | 37.8 |
|
| $ | 1,129.0 |
|
Net loss |
|
| — |
|
|
| — |
|
|
| — |
|
|
| — |
|
|
| — |
|
|
| — |
|
|
| — |
|
|
| (63.4 | ) |
|
| — |
|
|
| — |
|
|
| (63.4 | ) |
|
| (0.5 | ) |
|
| (63.9 | ) |
Issuance of common stock |
|
| — |
|
|
| — |
|
|
| — |
|
|
| — |
|
|
| 28,695,455 |
|
|
| 0.3 |
|
|
| 594.7 |
|
|
| — |
|
|
| — |
|
|
| — |
|
|
| 595.0 |
|
|
| — |
|
|
| 595.0 |
|
Issuance of common stock upon exercise of options |
|
| — |
|
|
| — |
|
|
| — |
|
|
| — |
|
|
| 3,119,653 |
|
|
| — |
|
|
| 45.0 |
|
|
| — |
|
|
| — |
|
|
| — |
|
|
| 45.0 |
|
|
| — |
|
|
| 45.0 |
|
Issuance of common stock upon vesting of restricted stock units |
|
| — |
|
|
| — |
|
|
| — |
|
|
| — |
|
|
| 105,990 |
|
|
| — |
|
|
| — |
|
|
| — |
|
|
| — |
|
|
| — |
|
|
| — |
|
|
| — |
|
|
| — |
|
Senior preferred dividends declared |
|
| — |
|
|
| 7.7 |
|
|
| — |
|
|
| — |
|
|
| — |
|
|
| — |
|
|
| — |
|
|
| (7.7 | ) |
|
| — |
|
|
| — |
|
|
| — |
|
|
| — |
|
|
| — |
|
Conversion of senior and junior preferred shares |
|
| (16,802,144 | ) |
|
| (192.5 | ) |
|
| (58,244,308 | ) |
|
| (0.6 | ) |
|
| 42,246,650 |
|
|
| 0.4 |
|
|
| 192.7 |
|
|
| — |
|
|
| — |
|
|
| — |
|
|
| — |
|
|
| — |
|
|
| — |
|
LifeWorks Disposition |
|
|
|
|
|
|
|
|
|
|
|
|
|
|
|
|
|
|
|
|
|
|
|
|
|
| (95.7 | ) |
|
|
|
|
|
| 0.7 |
|
|
|
|
|
|
| (95.0 | ) |
|
| (37.3 | ) |
|
| (132.3 | ) |
Share-based compensation |
|
| — |
|
|
| — |
|
|
| — |
|
|
| — |
|
|
| — |
|
|
| — |
|
|
| 23.5 |
|
|
| — |
|
|
| — |
|
|
| — |
|
|
| 23.5 |
|
|
| — |
|
|
| 23.5 |
|
Foreign currency translation |
|
| — |
|
|
| — |
|
|
| — |
|
|
| — |
|
|
| — |
|
|
| — |
|
|
| — |
|
|
| — |
|
|
| (47.4 | ) |
|
| — |
|
|
| (47.4 | ) |
|
| — |
|
|
| (47.4 | ) |
Change in unrealized loss, net of tax ($1.2) |
|
| — |
|
|
| — |
|
|
| — |
|
|
| — |
|
|
| — |
|
|
| — |
|
|
| — |
|
|
| — |
|
|
| (9.3 | ) |
|
| — |
|
|
| (9.3 | ) |
|
| — |
|
|
| (9.3 | ) |
Change in minimum pension & postretirement liability, net of tax of $0.0 |
|
| — |
|
|
| — |
|
|
| — |
|
|
| — |
|
|
| — |
|
|
| — |
|
|
| — |
|
|
| — |
|
|
| (7.6 | ) |
|
| — |
|
|
| (7.6 | ) |
|
| — |
|
|
| (7.6 | ) |
Balance as of December 31, 2018 |
|
| — |
|
| $ | — |
|
|
| — |
|
| $ | — |
|
|
| 139,453,710 |
|
| $ | 1.4 |
|
| $ | 2,325.6 |
|
| $ | (419.3 | ) |
| $ | (375.7 | ) |
| $ | — |
|
| $ | 1,532.0 |
|
| $ | — |
|
| $ | 1,532.0 |
|
See accompanying notes to consolidated financial statements.
55 | 2023 Form 10-K
Consolidated Statements of Cash Flows
(Dollars in millions)
|
| Year Ended December 31, |
| |||||||||
|
| 2023 |
|
| 2022 |
|
| 2021 |
| |||
(In millions) |
|
|
|
|
|
|
|
|
| |||
Net income (loss) |
| $ | 54.8 |
|
| $ | (73.4 | ) |
| $ | (75.4 | ) |
Adjustments to reconcile net income (loss) to net cash provided by operating activities: |
|
|
|
|
|
|
|
|
| |||
Deferred income tax expense |
|
| 4.1 |
|
|
| (1.7 | ) |
|
| (38.5 | ) |
Depreciation and amortization |
|
| 132.5 |
|
|
| 89.0 |
|
|
| 77.5 |
|
Amortization of debt issuance costs and debt discount |
|
| 4.4 |
|
|
| 4.6 |
|
|
| 16.9 |
|
Provision for doubtful accounts |
|
| 5.4 |
|
|
| 2.2 |
|
|
| 1.8 |
|
Net periodic pension and postretirement cost |
|
| 1.1 |
|
|
| 4.8 |
|
|
| 8.8 |
|
Share-based compensation expense |
|
| 136.7 |
|
|
| 144.8 |
|
|
| 113.4 |
|
Change in fair value of contingent consideration |
|
| 4.3 |
|
|
| 4.6 |
|
|
| 0.6 |
|
Gain on sale of assets |
|
| — |
|
|
| — |
|
|
| (19.1 | ) |
Lease abandonment costs |
|
| — |
|
|
| — |
|
|
| 2.9 |
|
Other |
|
| 1.0 |
|
|
| (0.2 | ) |
|
| 0.9 |
|
Changes in operating assets and liabilities, excluding effects of acquisitions and divestitures: |
|
|
|
|
|
|
|
|
| |||
Trade and other receivables |
|
| (48.3 | ) |
|
| (39.5 | ) |
|
| (34.8 | ) |
Prepaid expenses and other current assets |
|
| (22.1 | ) |
|
| (11.4 | ) |
|
| (12.3 | ) |
Deferred sales commissions |
|
| (39.5 | ) |
|
| (8.9 | ) |
|
| (11.6 | ) |
Accounts payable and other accrued expenses |
|
| 9.3 |
|
|
| (0.2 | ) |
|
| 9.3 |
|
Deferred revenue |
|
| (1.3 | ) |
|
| (5.6 | ) |
|
| 5.5 |
|
Employee compensation and benefits |
|
| (7.5 | ) |
|
| 21.2 |
|
|
| 2.3 |
|
Accrued taxes |
|
| (4.7 | ) |
|
| 7.5 |
|
|
| 0.4 |
|
Other assets and liabilities |
|
| (10.7 | ) |
|
| (5.2 | ) |
|
| 0.2 |
|
Net cash provided by operating activities |
|
| 219.5 |
|
|
| 132.6 |
|
|
| 48.8 |
|
Cash Flows from Investing Activities |
|
|
|
|
|
|
|
|
| |||
Purchases of customer funds marketable securities |
|
| (528.1 | ) |
|
| (652.8 | ) |
|
| (763.8 | ) |
Proceeds from sale and maturity of customer funds marketable securities |
|
| 445.5 |
|
|
| 404.8 |
|
|
| 488.0 |
|
Purchases of marketable securities |
|
| (6.8 | ) |
|
| — |
|
|
| — |
|
Proceeds from sale and maturity of marketable securities |
|
| 2.0 |
|
|
| — |
|
|
| — |
|
Expenditures for property, plant, and equipment |
|
| (19.0 | ) |
|
| (20.2 | ) |
|
| (11.5 | ) |
Expenditures for software and technology |
|
| (95.4 | ) |
|
| (74.3 | ) |
|
| (52.2 | ) |
Net proceeds from sale of assets |
|
| — |
|
|
| — |
|
|
| 37.9 |
|
Acquisition costs, net of cash and restricted cash acquired |
|
| — |
|
|
| — |
|
|
| (409.5 | ) |
Other |
|
| (1.0 | ) |
|
| — |
|
|
| — |
|
Net cash used in investing activities |
|
| (202.8 | ) |
|
| (342.5 | ) |
|
| (711.1 | ) |
Cash Flows from Financing Activities |
|
|
|
|
|
|
|
|
| |||
Increase (decrease) in customer funds obligations, net |
|
| 200.9 |
|
|
| 734.6 |
|
|
| (111.3 | ) |
Proceeds from issuance of common stock under share-based compensation plans |
|
| 49.0 |
|
|
| 38.4 |
|
|
| 95.4 |
|
Repayment of long-term debt obligations |
|
| (7.9 | ) |
|
| (8.4 | ) |
|
| (7.8 | ) |
Proceeds from revolving credit facility |
|
| — |
|
|
| — |
|
|
| 295.0 |
|
Repayment of revolving credit facility |
|
| — |
|
|
| — |
|
|
| (295.0 | ) |
Proceeds from issuance of convertible senior notes, net of issuance costs |
|
| — |
|
|
| — |
|
|
| 561.8 |
|
Purchases of capped calls related to convertible senior notes |
|
| — |
|
|
| — |
|
|
| (45.0 | ) |
Payment of debt refinancing costs |
|
| — |
|
|
| — |
|
|
| (1.2 | ) |
Net cash provided by financing activities |
|
| 242.0 |
|
|
| 764.6 |
|
|
| 491.9 |
|
Effect of exchange rate changes on cash, restricted cash, and equivalents |
|
| 11.5 |
|
|
| (46.8 | ) |
|
| (21.3 | ) |
Net increase (decrease) in cash, restricted cash, and equivalents |
|
| 270.2 |
|
|
| 507.9 |
|
|
| (191.7 | ) |
Cash, restricted cash, and equivalents at beginning of period |
|
| 3,151.2 |
|
|
| 2,643.3 |
|
|
| 2,835.0 |
|
Cash, restricted cash, and equivalents at end of period |
| $ | 3,421.4 |
|
| $ | 3,151.2 |
|
| $ | 2,643.3 |
|
Reconciliation of cash, restricted cash, and equivalents to the consolidated |
|
|
|
|
|
|
|
|
| |||
Cash and equivalents |
| $ | 570.3 |
|
| $ | 431.9 |
|
| $ | 367.5 |
|
Restricted cash |
|
| 0.8 |
|
|
| 0.8 |
|
|
| 1.9 |
|
Restricted cash and equivalents included in customer funds |
|
| 2,850.3 |
|
|
| 2,718.5 |
|
|
| 2,273.9 |
|
Total cash, restricted cash, and equivalents |
| $ | 3,421.4 |
|
| $ | 3,151.2 |
|
| $ | 2,643.3 |
|
Supplemental Cash Flow Information |
|
|
|
|
|
|
|
|
| |||
Cash paid for interest |
| $ | 52.4 |
|
| $ | 30.1 |
|
| $ | 19.1 |
|
Cash paid for income taxes |
|
| 43.0 |
|
|
| 17.6 |
|
|
| 33.4 |
|
Cash received from income tax refunds |
|
| 0.6 |
|
|
| 8.0 |
|
|
| 3.3 |
|
|
| Year Ended December 31, |
| |||||||||
|
| 2018 |
|
| 2017 |
|
| 2016 |
| |||
Net loss |
| $ | (63.9 | ) |
| $ | (10.5 | ) |
| $ | (92.8 | ) |
Loss (income) from discontinued operations |
|
| 25.8 |
|
|
| 6.0 |
|
|
| (12.5 | ) |
Adjustments to reconcile net loss to net cash provided by (used in) operating activities: |
|
|
|
|
|
|
|
|
|
|
|
|
Deferred income tax benefit |
|
| (16.8 | ) |
|
| (62.3 | ) |
|
| (8.3 | ) |
Depreciation and amortization |
|
| 56.6 |
|
|
| 53.8 |
|
|
| 53.2 |
|
Asset impairment |
|
| — |
|
|
| — |
|
|
| 10.4 |
|
Amortization of debt issuance costs and debt discount |
|
| 2.1 |
|
|
| 3.7 |
|
|
| 3.5 |
|
Loss on debt extinguishment |
|
| 25.7 |
|
|
| — |
|
|
| — |
|
Net periodic pension and postretirement cost |
|
| 2.7 |
|
|
| 1.5 |
|
|
| 3.0 |
|
Share-based compensation |
|
| 23.2 |
|
|
| 16.1 |
|
|
| 12.5 |
|
Environmental reserve |
|
| — |
|
|
| — |
|
|
| 5.9 |
|
Other |
|
| 0.3 |
|
|
| (0.5 | ) |
|
| 1.2 |
|
Changes in operating assets and liabilities excluding effects of acquisitions and divestitures: |
|
|
|
|
|
|
|
|
|
|
|
|
Trade and other receivables |
|
| (5.3 | ) |
|
| 5.3 |
|
|
| (5.8 | ) |
Prepaid expenses and other current assets |
|
| (4.6 | ) |
|
| (6.9 | ) |
|
| 1.1 |
|
Accounts payable and other accrued expenses |
|
| (6.4 | ) |
|
| 0.1 |
|
|
| (4.4 | ) |
Deferred revenue |
|
| 3.5 |
|
|
| 2.6 |
|
|
| (1.8 | ) |
Employee compensation and benefits |
|
| (22.1 | ) |
|
| (26.1 | ) |
|
| (49.1 | ) |
Accrued interest |
|
| (15.7 | ) |
|
| (4.8 | ) |
|
| (0.2 | ) |
Accrued taxes |
|
| 8.4 |
|
|
| (6.7 | ) |
|
| 14.7 |
|
Other assets and liabilities |
|
| (2.8 | ) |
|
| (0.7 | ) |
|
| (3.8 | ) |
Net cash provided by (used in) operating activities—continuing operations |
|
| 10.7 |
|
|
| (29.4 | ) |
|
| (73.2 | ) |
Net cash used in operating activities—discontinued operations |
|
| (1.2 | ) |
|
| (10.4 | ) |
|
| (2.3 | ) |
Net cash provided by (used in) operating activities |
|
| 9.5 |
|
|
| (39.8 | ) |
|
| (75.5 | ) |
Cash Flows from Investing Activities |
|
|
|
|
|
|
|
|
|
|
|
|
Purchase of customer trust funds marketable securities |
|
| (855.2 | ) |
|
| (598.5 | ) |
|
| (699.7 | ) |
Proceeds from sale and maturity of customer trust funds marketable securities |
|
| 844.3 |
|
|
| 610.2 |
|
|
| 677.6 |
|
Net change in restricted cash and other restricted assets held to satisfy customer trust funds obligations |
|
| 1,430.3 |
|
|
| (367.8 | ) |
|
| 677.8 |
|
Expenditures for property, plant, and equipment |
|
| (8.0 | ) |
|
| (17.5 | ) |
|
| (7.4 | ) |
Expenditures for software and technology |
|
| (32.2 | ) |
|
| (33.1 | ) |
|
| (25.5 | ) |
Net proceeds from divestitures |
|
| — |
|
|
| (0.5 | ) |
|
| 101.6 |
|
Net cash provided by (used in) investing activities—continuing operations |
|
| 1,379.2 |
|
|
| (407.2 | ) |
|
| 724.4 |
|
Net cash (used in) provided by investing activities—discontinued operations |
|
| — |
|
|
| (0.2 | ) |
|
| 38.6 |
|
Net cash provided by (used in) investing activities |
|
| 1,379.2 |
|
|
| (407.4 | ) |
|
| 763.0 |
|
Cash Flows from Financing Activities |
|
|
|
|
|
|
|
|
|
|
|
|
(Decrease) increase in customer trust funds obligations, net |
|
| (1,419.4 | ) |
|
| 356.1 |
|
|
| (655.7 | ) |
Net proceeds from issuance of stock |
|
| 595.0 |
|
|
| 78.4 |
|
|
| 75.0 |
|
Proceeds from issuance of common stock upon exercise of stock options |
|
| 45.8 |
|
|
| — |
|
|
| — |
|
Repurchase of stock |
|
| — |
|
|
| (1.8 | ) |
|
| — |
|
Proceeds from debt issuance |
|
| 680.0 |
|
|
| — |
|
|
| — |
|
Repayment of long-term debt obligations |
|
| (1,134.0 | ) |
|
| (25.9 | ) |
|
| (11.8 | ) |
Payment of debt refinancing costs |
|
| (23.3 | ) |
|
| — |
|
|
| — |
|
Net cash (used in) provided by financing activities—continuing operations |
|
| (1,255.9 | ) |
|
| 406.8 |
|
|
| (592.5 | ) |
Net cash used in financing activities—discontinued operations |
|
| — |
|
|
| — |
|
|
| (38.2 | ) |
Net cash (used in) provided by financing activities |
|
| (1,255.9 | ) |
|
| 406.8 |
|
|
| (630.7 | ) |
Effect of Exchange Rate Changes on Cash |
|
| (9.7 | ) |
|
| 8.6 |
|
|
| 1.3 |
|
Net increase (decrease) in cash and equivalents |
|
| 123.1 |
|
|
| (31.8 | ) |
|
| 58.1 |
|
Elimination of cash from discontinued operations |
|
| 0.5 |
|
|
| 5.2 |
|
|
| (0.5 | ) |
Cash and equivalents at beginning of year |
|
| 94.2 |
|
|
| 120.8 |
|
|
| 63.2 |
|
Cash and equivalents at end of year |
| $ | 217.8 |
|
| $ | 94.2 |
|
| $ | 120.8 |
|
Supplemental Cash Flow Information: |
|
|
|
|
|
|
|
|
|
|
|
|
Cash paid for interest |
| $ | 74.5 |
|
| $ | 89.7 |
|
| $ | 84.9 |
|
Cash paid for income taxes |
| $ | 21.1 |
|
| $ | 21.3 |
|
| $ | 14.8 |
|
Cash received from income tax refunds |
| $ | 4.4 |
|
| $ | 1.9 |
|
| $ | 0.2 |
|
See accompanying notes to consolidated financial statements.
56 | 2023 Form 10-K
Notes to Consolidated Financial Statements
(Dollars in millions, except share and per share data)
1. Organization
Ceridian HCM Holding Inc. and its direct and indirect subsidiaries (also referred to in Part II, Item 8, "Financial Statements and Supplementary Data" of this reportForm 10-K as “Ceridian,” “we,” “our,” and “us”) offer a broad range of services and software designed to help employers more effectively manage employment processes, such as payroll, payroll-related tax filing, human resource information systems, employee self-service, time and labor management, and recruitment and applicant screening. Our technology-based services are typically provided through long-term customer relationships that result in a high level of recurring revenue. OurWhile we operate in 18 countries globally, our operations are primarily located in the United States and Canada.
On April 30, 2018, we completed our initial public offering (“IPO”), in which we issued and sold 21,000,000 shares of common stock at a public offering price of $22.00 per share. We granted the underwriters a 30-day option to purchase an additional 3,150,000 shares of common stock at the offering price, which was exercised in full. A total of 24,150,000 shares of common stock were issued in our IPO. Concurrently with our IPO, we issued an additional 4,545,455 shares of our common stock in a private placement at $22.00 per share. We received gross proceeds of $631.3 from the IPO and concurrent private placement before deducting underwriting discounts, commissions, and other offering related expenses.
The use of the proceeds from the IPO were as follows:
Gross proceeds | $ | 631.3 |
|
Less: |
|
|
|
Underwriters' discount and commissions |
| 29.2 |
|
IPO-related expenses |
| 11.8 |
|
Redemption of 11% Senior Notes due 2021 (Note 9) |
| 475.0 |
|
Call premium on redemption of 11% Senior Notes due 2021 |
| 13.1 |
|
Interest on redemption of 11% Senior Notes due 2021 |
| 10.9 |
|
Sponsor management fee |
| 11.3 |
|
Debt refinancing expenses |
| 11.4 |
|
Cash to balance sheet | $ | 68.6 |
|
On November 16, 2018, we completed a secondary offering, in which certain of our stockholders (the “Selling Stockholders”) sold 11,000,000 shares of common stock, in an underwritten public offering at $36.00 per share. The Selling Stockholders granted the underwriters a 30-day option to purchase an additional 1,650,000 shares of common stock at the offering price, which was exercised in full. A total of 12,650,000 shares of common stock were sold by the Selling Stockholders on November 16, 2018, with all proceeds going to the Selling Stockholders. We incurred expenses of $1.3 during the year ended December 31, 2018, related to the secondary offering within selling, general and administrative expense.
Prior to our IPO, Ceridian HCM Holding Inc. was primarily owned by Ceridian LLC (the “Parent”("U.S.") and Ceridian Holding II LLC (“Ceridian Holding II”). The Parent was 100% owned by Foundation Holding LLC, which in turn was 100% owned by Ceridian Holding LLC (“Ceridian Holding”). The owners of Ceridian Holding and Ceridian Holding II included (i) affiliates and co-investors of Thomas H. Lee Partners, L.P. (“THL Partners”) and Cannae Holdings, LLC (“Cannae”) (THL Partners and Cannae are together referred to as the “Sponsors”), who collectively owned approximately 96% of the outstanding interests of both Ceridian Holding and Ceridian Holding II, and (ii) other individuals, who collectively owned approximately 4% of the outstanding interests of each holding company.Canada.
Subsequent to the IPO and concurrent private placement, we completed an internal corporate reorganization, pursuant to which the limited liability companies that held shares in us were merged with and into Ceridian HCM Holding Inc. At the time of these transactions, these limited liability companies had no assets other than equity interests in us or the other limited liability companies. As a result of these transactions, our previous, pre-IPO stockholders now hold shares of our common stock directly, rather than through a series of limited liability companies. These transactions had no impact on our assets, liabilities, or operations.
Ceridian was acquired in 2007 by affiliates and co-investors of the Sponsors (the “2007 Merger”). In April 2012, Ceridian acquired Dayforce Corporation, which had built Dayforce, a cloud HCM solution. In the months following the acquisition, Dayforce founder, David D. Ossip, was named Chief Executive Officer of Ceridian HCM, and shortly thereafter, we generally stopped actively selling our Bureau solutions to new customers in the United States to focus our resources on expanding the Dayforce platform and growing Cloud solutions.
As part of our strategy to focus on the growth of our Cloud solutions business, we undertook the following initiatives to simplify our business model:
(i) sold our consumer-directed benefit services business in 2013,
(ii) merged Comdata, our payment systems business unit, with FleetCor Technologies in 2014,
(iii) sold our benefits administration and post-employment compliance business in 2015,
(iv) sold our United Kingdom and Ireland Bureau businesses and a portion of our operations that supported such businesses in Mauritius in 2016, and
(v) contributed our LifeWorks employee assistance program business to a joint venture, LifeWorks, in 2016, then distributed our ownership in this joint venture to a holding company owned by our stockholders in April 2018.
As a result of these transactions, we only actively sell Dayforce and Powerpay, which we believe simplifies our business model and positions us well for continued growth. Please refer to Note 3, “Discontinued Operations,” for further discussion of these transactions.
2. Summary of Significant Accounting Policies
Basis of Presentation
The accompanying consolidated financial statements have been prepared in accordance with accounting principles generally accepted in the United StatesU.S. (“GAAP”). The accompanying consolidated financial statements include the operations and accounts of Ceridian and all subsidiaries, as well as any variable interest entity (“VIE”) in which we have controlling financial interest. All intercompany balances and transactions have been eliminated from our consolidated financial statements.
We consolidate the grantor trusts that hold funds provided by our payroll and tax filing customers pending remittance to employees of those customers or tax authorities in the United StatesU.S. and Canada, although Ceridian does not own the grantor trusts. Under consolidation accounting, the enterprise with a controlling financial interest consolidates a VIE. A controlling financial interest in an entity is determined through analysis that identifies the primary beneficiary which has (1) the power to direct the activities of a VIE that most significantly impact the entity’s economic performance and (2) the obligation to absorb losses of the entity that could potentially be significant to the VIE or the right to receive benefits from the entity that could potentially be significant to the VIE. In addition, ongoing reassessments must be performed to confirm whether an enterprise is the primary beneficiary of a VIE. The grantor trusts are VIEs, and we are deemed to have a controlling financial interest as the primary beneficiary. Please refer to Part II, Item 8, Note 5,4, “Customer Trust Funds,” for further information on our accounting for these funds.
Reclassifications
Reverse Stock Split
On April 10, 2018, we effected a 1-for-2 reverse stock split of our common stock. All of the common share and per share information referenced throughout the consolidated financial statements and accompanying notes theretoCertain prior year amounts have been retroactively adjustedreclassified to reflect this reverse stock split.conform to the current year presentation. Refer to the following section for additional information. In addition, we now present selling and marketing expenses and general and administrative expenses as separate line items on our consolidated statements of operations.
Immaterial Correction of Prior Period Error
During the year ended December 31, 2023, an error was discovered in the presentation of one Canadian bank account balance within “customer funds” and “customer funds obligations” and related items on our consolidated balance sheet as of December 31, 2022 and in our net cash provided by financing activities within our consolidated statements of cash flows for the years ended December 31, 2022 and 2021. There was an understatement of customer funds within current assets and a corresponding understatement of customer funds obligations within current liabilities on our consolidated balance sheet. As a result, we also erroneously presented certain changes related to customer funds and customer funds obligations on our consolidated statements of cash flows.
57 | 2023 Form 10-K
The line items affected include “customer funds” and “customer funds obligations” on our consolidated balance sheets. The line items affected also include “increase (decrease) in customer funds obligations, net,” effect of exchange rate changes on cash, restricted cash, and equivalents,” “cash, restricted cash, and equivalents,” and “restricted cash and equivalents included in customer funds,” and “effect of exchange rate changes on cash, restricted cash, and equivalents” on our consolidated statements of cash flows. The amounts impacted by the correction are summarized as follows:
Consolidated Balance Sheets |
|
|
|
|
|
|
|
|
| |||
(Selected financial statement line items only) |
|
|
|
|
|
|
|
|
| |||
|
| December 31, 2022 |
| |||||||||
|
| As reported |
|
| As restated |
|
| Change |
| |||
|
| (In millions) |
| |||||||||
Customer funds |
| $ | 4,183.2 |
|
| $ | 4,729.5 |
|
| $ | 546.3 |
|
Customer funds obligations |
|
| 4,298.8 |
|
|
| 4,845.1 |
|
|
| 546.3 |
|
Consolidated Statements of Cash Flows |
|
|
|
|
|
|
|
|
|
|
|
|
|
|
|
|
|
| ||||||
(Selected financial statement line items only) |
| Year Ended December 31, |
| |||||||||||||||||||||
|
| 2022 |
|
| 2021 |
| ||||||||||||||||||
|
| As reported |
|
| As restated |
|
| Change |
|
| As reported |
|
| As restated |
|
| Change |
| ||||||
|
| (In millions) |
| |||||||||||||||||||||
Increase (decrease) in customer funds obligations, net |
| $ | 840.1 |
|
| $ | 734.6 |
|
| $ | (105.5 | ) |
| $ | (195.7 | ) |
| $ | (111.3 | ) |
| $ | 84.4 |
|
Effect of exchange rate changes on cash, restricted cash, and equivalents |
|
| (8.1 | ) |
|
| (46.8 | ) |
|
| (38.7 | ) |
|
| (20.9 | ) |
|
| (21.3 | ) |
|
| (0.4 | ) |
Cash, restricted cash, and equivalents at beginning of period |
|
| 1,952.8 |
|
|
| 2,643.3 |
|
|
| 690.5 |
|
|
| 2,228.5 |
|
|
| 2,835.0 |
|
|
| 606.5 |
|
Cash, restricted cash, and equivalents at end of period |
|
| 2,604.9 |
|
|
| 3,151.2 |
|
|
| 546.3 |
|
|
| 1,952.8 |
|
|
| 2,643.3 |
|
|
| 690.5 |
|
Restricted cash and equivalents included in customer funds |
|
| 2,172.2 |
|
|
| 2,718.5 |
|
|
| 546.3 |
|
|
| 1,583.4 |
|
|
| 2,273.9 |
|
|
| 690.5 |
|
In addition, our condensed consolidated statements of cash flows for certain historical quarterly periods will be restated in future Quarterly Reports on Form 10-Q. The following changes will be reflected in our Quarterly Reports on Form 10-Q for the periods ended March 31, 2024 and June 30, 2024:
Condensed Consolidated Statements of Cash Flows |
|
|
|
|
|
|
|
|
|
|
|
|
|
|
|
|
|
| ||||||
(Selected financial statement line items only, unaudited) |
|
|
|
|
|
|
|
|
|
|
|
|
|
|
|
|
|
| ||||||
|
| Three Months Ended March 31, 2023 |
|
| Six Months Ended June 30, 2023 |
| ||||||||||||||||||
|
| As reported |
|
| As restated |
|
| Change |
|
| As reported |
|
| As restated |
|
| Change |
| ||||||
| (In millions) |
| ||||||||||||||||||||||
Increase in customer funds obligations, net |
| $ | 2,078.1 |
|
| $ | 2,174.4 |
|
| $ | 96.3 |
|
| $ | 45.0 |
|
| $ | 100.4 |
|
| $ | 55.4 |
|
Effect of exchange rate changes on cash, restricted cash, and equivalents |
|
| (7.7 | ) |
|
| (6.8 | ) |
|
| 0.9 |
|
|
| (1.0 | ) |
|
| 63.1 |
|
|
| 64.1 |
|
Cash, restricted cash, and equivalents at beginning of period |
|
| 2,604.9 |
|
|
| 3,151.2 |
|
|
| 546.3 |
|
|
| 2,604.9 |
|
|
| 3,151.2 |
|
|
| 546.3 |
|
Cash, restricted cash, and equivalents at end of period |
|
| 4,697.9 |
|
|
| 5,341.4 |
|
|
| 643.5 |
|
|
| 2,775.9 |
|
|
| 3,441.7 |
|
|
| 665.8 |
|
Restricted cash and equivalents included in customer funds |
|
| 4,268.5 |
|
|
| 4,912.0 |
|
|
| 643.5 |
|
|
| 2,288.5 |
|
|
| 2,954.3 |
|
|
| 665.8 |
|
58 | 2023 Form 10-K
Use of Estimates
The preparation of consolidated financial statements in conformity with GAAP requires us to make estimates and assumptions that affect the reported amounts of assets and liabilities and disclosure of contingent assets and liabilities at the date of our financial statements and our reported amounts of revenues and expenses during the reporting period. Actual results could differ from those estimates. Estimates that could significantly affect our results of operations or financial condition include the assignment of fair values to goodwill and other intangible assets and testing for impairment; the testing of impairment of long-lived assets; the determination of our liability for pensions and postretirement benefits; the determination of fair value of stock optionsequity awards granted; and the resolution of tax matters and legal contingencies. Further discussion on these estimates can be found in related disclosures elsewhere in our notes to the consolidated financial statements.
Cash and Equivalents
As of December 31, 2018,2023 and 2017,2022, cash and equivalents were comprised of cash held in bank accounts and investments with an original maturity of three months or less.
Concentrations
Concentrations
Cash deposits of client and corporate funds are maintained primarily in large credit-worthy financial institutions in the countries in which we operate. These deposits may exceed the amount of any deposit insurance that may be available through government agencies. All deliverable securities are held in custody with large credit-worthy financial institutions, which bear the risk of custodial loss. Non-deliverable securities, primarily money market securities, are held in custody by large, credit-worthy broker-dealers and financial institutions.
Trade and Other Receivables, Net
Trade and other receivables balances are presented on the consolidated balance sheets net of the allowance for doubtful accounts of $1.3 and $1.3 and the reserve for sales adjustments of $3.8 and $4.7 as of December 31, 2018 and 2017, respectively.adjustments. We experience credit losses on accounts receivable and, accordingly, must make estimates related to the ultimate collection of the receivables. Specifically, management analyzes accounts receivable, historical bad debt experience, customer concentrations, customer creditworthiness, and current economic trends when evaluating the adequacy of the allowance for doubtful accounts. We estimate the reserve for sales adjustment based on historical sales adjustment experience. We write off accounts receivable when we determine that the accounts are uncollectible, generally upon customer bankruptcy or the customer’s nonresponse to continued collection efforts.
Property, Plant, and Equipment, Net
Our property, plant, and equipment assets are stated at cost less accumulated depreciation. Depreciation is calculated on a straight-line basis over the shorter of the remaining lease term or estimated useful life of the related assets, which are generally as follows:
|
| |
|
| |
|
| |
|
|
Repairs and maintenance costs are expensed as incurred. We capitalized interest of $0.5$0.7 million and $0.6$0.8 million in property, plant, and equipment, net during the years ended December 31, 20182023 and 2017,2022, respectively. Property, plant, and equipment assets are assessed for impairment as described under the heading “Impairment“Impairment of Long-Lived Assets” below.
Business Combinations
AssignmentIn accordance with Accounting Standards Codification (“ASC”) Topic805, Business Combinations, we use the acquisition method of Fair Values Upon Acquisitionaccounting and allocate the fair value of Goodwill and Other Intangible Assets
Inpurchase consideration to the event of a business combination where we are the acquiring party, we are required to assign fair values to all identifiable assets acquired and liabilities acquired, including intangible assets, such as customer lists, identifiable intangible trademarks, technology and non-compete agreement. We are also required to determine the useful life for definite-lived identifiable intangible assets acquired. These determinations require significant judgments, estimates, and assumptions; and, when material amounts are involved, we generally utilize the assistance of third-party valuation consultants. The remainder of the purchase price of the acquired business not assigned to identifiable assets or liabilities is then recorded as goodwill.
In conjunction with the 2007 Merger, affiliates of the Sponsors completed the acquisition of all outstanding equity of the Ceridian entities. Although Parent continued as the same legal entity after the 2007 Merger, the application of push down accounting representing the termination of the old accounting entity and the creation of a new one resulted in the adjustment of all net assets toassumed based on their respective estimated fair values as of the 2007 Merger. Net assets of the Parent were adjusted to their respective fair values, which included goodwill, trademarks, customer lists, and other intangible assets.
acquisition date. Goodwill and Intangible Assets
Goodwill, which represents the excess of purchase priceconsideration transferred over the estimated fair value of the identifiable net assets acquired in a business combination.
59 | 2023 Form 10-K
Assigning estimated fair values to the net assets acquired requires the use of significant estimates, judgments, inputs, and assumptions regarding the fair value of the assets acquired and liabilities assumed. Estimated fair values of assets acquired and liabilities assumed are generally based on available historical information, independent valuations or appraisals, future expectations, and assumptions determined to be reasonable but are inherently uncertain with respect to future events, including economic conditions, competition, the useful life of the acquired assets, and other factors. The measurement period for assigning fair values to the net assets acquired will end when the information, or the facts and circumstances, becomes available, but will not exceed one year from the date of businesses acquired, isacquisition. The judgments made in determining the estimated fair value assigned to reporting units basedassets acquired and liabilities assumed, as well as the estimated useful life and depreciation or amortization method of each asset, can materially impact the net earnings of the periods subsequent to the acquisition through depreciation and amortization, and in certain instancesthrough impairment charges, if the asset becomes impaired in the future. During the measurement period, any purchase price allocation changes that impact the carrying value of goodwill affects any measurement of goodwill impairment taken during the measurement period, if applicable. If necessary, purchase price allocation revisions that occur outside of the measurement period are recorded within our consolidated statement of operations depending on the benefits derived fromnature of the acquisition. adjustment.
Segment Information
We operate as a single reporting unit, a single operating segment and a single reporting segment. Operating segments are defined as components of an enterprise about which separate financial information is evaluated regularly by the chief operating decision maker in deciding how to allocate resources and assessing performance. Our chief operating decision maker is our chief executive officer ("CEO").
Goodwill and Intangible Assets
Goodwill represents the excess of purchase consideration transferred over the estimated fair value of the identifiable net assets acquired in a business combination. Goodwill and our indefinite-lived intangiblesintangible asset, the Dayforce trade name, are not amortized against earnings, but instead are subject to impairment review on at least an annual basis. We perform our annual assessment of goodwill and indefinite-lived intangible balances as of October 1 of each year. There was no indication of impairment at October 1, 2018.
We assess goodwill impairment risk by first performing a qualitative review of entity-specific, industry, market, and general economic factors for each reporting unit. If significant potential goodwill impairment risk exists for a specific reporting unit, we apply a quantitative test. The quantitative test compares the reporting unit’s estimated fair value with its carrying amount. In estimating fair value of our reporting units, we use a combination of the income approach and the market-based approach. A number of significant assumptions and estimates are involved in determining the current fair value of the reporting units, including operating cash flows, markets and market share, sales volumes and prices, and working capital changes. We consider historical experience and all available information at the time the fair values of our reporting units are estimated. However, fair values that could be realized in an actual transaction may differ from those used to evaluate the goodwill for impairment. The evaluation of impairment involves comparing the current fair value of the reporting unit to the carrying amount. To the extent that the carrying amount of goodwill of the reporting unit exceeds the fair value of the reporting unit, an impairment loss is recognized.
Intangible assets represent amounts assigned to specifically identifiable intangible assets at the time of an acquisition. Definite-lived assets are amortized on a straight-line basis generally over the following periods:
|
| |
|
|
Indefinite-lived intangible assets, which consist of trade names, are tested for impairment on an annual basis, or more frequently if certain events or circumstances occur that could indicate impairment. When evaluating whetherWe perform our annual impairment assessment of goodwill and the Dayforce trade name as of October 1.
We assess goodwill for impairment by performing a qualitative review of the reporting unit. If the qualitative assessment indicates it is more likely than not the fair value of the reporting unit is less than the carrying amount, a quantitative test is applied and, the carrying amount is compared to its estimated fair value. The estimated fair value is based on our market capitalization at the testing date. If the carrying amount of the goodwill exceeds the fair value of the reporting unit, goodwill may be impaired. To the extent that the carrying amount of the reporting unit exceeds the fair value of the reporting unit, an impairment loss is recognized.
We assess our indefinite-lived intangible assets are impaired,asset for impairment by performing a qualitative review. If the qualitative assessment indicates it is more likely than not the fair value of the asset is less than the carrying amount, a quantitative test is applied and, the carrying amount is compared to its estimated fair value. The estimate of fair value is based on a relief from royalty method which calculates the cost savings associated with owning rather than licensing the trademark.trade name. An estimated royalty rate is applied to forecasted revenue and the resulting cash flows are discounted.
Definite-lived assets are assessed for impairment as described under the heading “Impairment“Impairment of Long-Lived Assets” below.
Intangible assets represent amounts assigned to specifically identifiable intangible assets at the time of an acquisition. Definite-lived assets are amortized on a straight-line basis generally over the following periods:
Customer lists and relationships | 4-12 years | |
Trade name | 2-5 years | |
Technology | 3-5 years |
60 | 2023 Form 10-K
Internally Developed Software Costs
In accordance with Accounting Standards Codification (“ASC”)ASC Topic 350, we capitalize costs associated with software developed or obtained for internal use when both the preliminary project stage is completed and our management has authorized further funding for the project, which it deems probable of completion. Capitalized software costs include only: (1) external direct costs of materials and services consumed in developing or obtaining the software; (2) payroll and payroll-related costs for employees who are directly associated with and who devote time to the project; and (3) interest costs incurred while developing the software. Capitalization of these costs ceases no later than the point at which the project is substantially complete and ready for its intended purpose. We do not include general and administrative costs and overhead costs in capitalizable costs. We charge researchResearch and development costs, product management, and other software maintenance costs related to software development to earningsare expensed as incurred.
We had capitalized software costs, net of accumulated amortization, of $61.9$167.0 million and $56.4$133.4 million as of December 31, 20182023, and 2017,2022, respectively, included in property, plant, and equipment, net in the accompanying consolidated balance sheets. We amortize software costs on a straight-line basis over the expected life of the software, generally a range of two to seven years.years. Amortization of software costs totaled $26.2, $23.6,$54.0 million, $43.5 million, and $20.9$37.0 million for the years ended December 31, 2018, 2017,2023, 2022, and 2016,2021, respectively.
Impairment of Long-Lived Assets
Long-lived assets, such as property, plant, and equipment, capitalized software, and definite-lived intangible assets are reviewed for impairment whenever events or changes in circumstances indicate that the carrying amount of an asset group may not be recoverable. Recoverability of asset groups to be held and used is measured by a comparison of the carrying amount of an asset group to the estimated undiscounted future cash flows expected to be generated by the asset group. If the carrying amount of an asset group exceeds its estimated future cash flows, an impairment charge is recognized for the amount by which the carrying amount of the asset group exceeds the fair value of the asset group.
Deferred Costs
Revenue Recognition
We recognize revenue fromDeferred costs primarily consist of deferred sales commissions. Sales commissions paid based on the saleannual contract value of a signed customer contract are considered incremental and recoverable costs of obtaining a contract with a customer. Sales commissions paid based on the annual contract value are deferred and then amortized on a straight-line basis over a period of benefit. As of December 1, 2022, we increased the expected period of benefit of our deferred sales commissions from five years to ten years. This change in accounting estimate and related customer period of benefit is largely attributable to new evidence of longer customer relationships such as increases in the proportion of new customer contracts greater than three years as well as our continued high customer retention rates. The change was made on a prospective basis.
Deferred costs included within Other assets on our consolidated balance sheets were $192.1 million and $151.2 million as of December 31, 2023 and 2022, respectively. Amortization expense for the deferred costs was $21.0 million, $48.9 million, and $46.4 million for the years ended December 31, 2023, 2022, and 2021 respectively.
Revenue Recognition
The core principle of ASC Topic 606 is that revenue is recognized upon transfer of control of promised products or services net of applicable sales taxes, whento customers in an amount that reflects the consideration we expect to receive in exchange for those products or services. In accordance with ASC Topic 606, we perform the following criteria are met: (1) persuasive evidence of an arrangement exists; (2) delivery has occurred or services have been rendered; (3)steps to determine revenue to be recognized:
61 | 2023 Form 10-K
Table of a sales arrangement.Contents
We enter into revenue arrangements that may consist of multiple deliverables based on the needs
The significant majority of our customers. For example, our services address a broad range of employment process needs, such as payroll, payroll-related tax filing, human resource information, employee self-service capabilities, time and labor management, and recruitment and applicant screening. A customer arrangement may contain any of these elements with different elements delivered across multiple reporting periods.
We have a single unit of accounting for each deliverable in a contract based on the use of estimated selling price (“ESP”) in those cases where vendor-specific objective evidence of selling price (“VSOE”) or third party evidence (“TPE”) cannot be established. Our determination of ESP involves the consideration of several factors based on the specific facts and circumstances of each contract. Specifically, we consider the cost to produce or to provide the deliverable, the anticipated margin on that deliverable, the selling price and profit margin for similar services, the value of any enhancements that have been built into the deliverable and the characteristics of the varying markets in which the deliverable will be sold.
When we are unable to establish a selling price using VSOE or TPE, we use ESP in the allocation of arrangement consideration. The objective of ESP is to determine the price at which we would transact a sale if the service were sold on a stand-alone basis.
We regularly review VSOE, TPE, and ESP and maintain internal controls over the establishment and updates of these estimates. There were no material impacts during the period nor do we currently expect a material impact in the near term from changes in VSOE, TPE, or ESP.
Deferredtwo major revenue primarily consists of customer billings in advance of revenues being recognized from our contracts. Deferred revenue also includes certain deferred professional services fees that are accounted for as a single unit of accounting with subscription fees and are recognized as revenues over the same period as the related customer contract. Deferred revenue that is anticipated to be recognized during the succeeding twelve-month period is recorded as current deferred revenue and the remaining portion is recorded as noncurrent.
Recurring Services Revenues
Revenues are presented within the consolidated statements of operations in two categories: recurring services,sources (recurring and professional services and other.other) are derived from contracts with customers. Recurring revenues are primarily related to our Cloud subscription performance obligations. Professional services and other revenues consist of monthly fees that we chargeare primarily related to professional services for our Cloud customers (including implementation services to activate new accounts, as well as post go-live professional services typically billed on a time and Bureau solutions. materials basis) and, to a much lesser extent, fees for other non-recurring services, including sales of time clocks and certain client reimbursable out-of-pocket expenses. Fees charged to Cloud subscription performance obligations are generally priced either on a per-employee, per-month (“PEPM”) basis for a given month or on a per-employee, per-process basis for a given process; and fees charged for professional services are typically priced on a fixed fee basis for activating new accounts and on a time and materials basis for post go-live professional services. There is typically no variable consideration related to our recurring Cloud subscriptions or our activation services, nor do they include a significant financing component, non-cash consideration, or consideration payable to a customer. Our recurring Cloud subscriptions are typically billed one month in advance while our professional services are billed over the implementation period for activation of new accounts and as work is performed for post go-live professional services.
Our Cloud services arrangements include multiple performance obligations, and transaction price allocations are based on the stand-alone selling price ("SSP") for each performance obligation. Our contract renewal rates serve as an observable input to establish SSP for our recurring Cloud subscription performance obligations. The SSP for professional services performance obligations is estimated based on market conditions and observable inputs, including hours incurred and rates charged by third parties to perform implementation services.
For our performance obligations, the consideration allocated to Cloud subscription revenues is recognized as recurring revenues, typically commencing when an instance is provisioned to the customer. The consideration allocated to professional services to activate a new account is recognized as professional services revenues based on the proportion of total work performed, using reasonably dependable estimates (in relation to progression through the implementation phase), by solution.
Recurring Revenues
For our Dayforce solutions, we primarily charge monthly recurring fees on a per employee, per month (“PEPM”)PEPM basis, generally one-month in advance of service, based on the number and type of solutions provided to the customer and the number of employees at the customer. We charge Powerpay customers monthly recurring fees on a per-employee, per-process basis. For our Bureauother recurring solutions, we typically charge monthly recurring fees on a per-process basis. The typical recurring services customer contract has an initial term of between three years. The initial recurring services contracts have general acceptance criteria that consist of the completion of user acceptance testing. and five years. Any credits related to service level commitments are recognized as incurred, as service level failures are not anticipated at contract signing. Should a customer cancel the initial contract, an early termination fee may be applicable, and revenue is recognized upon collection. We also generate recurring services revenue from investment income on our Cloud recurring and Bureauother recurring customer funds held in trust before such funds are remitted to taxing authorities, customer employees, or other third parties. We refer to this investment income as float revenue. Please refer to Part II, Item 8, Note 17, “Financial Data by Segment and Geographic Area,12, “Revenue,” for a full description of our sources of revenue.
Professional Services and Other Revenues
Professional services and other revenues consist primarily of charges relating to the work performed to assist customers with the planning, design, implementation, and stagingimplementation of their solutions. Also included in professional services are any related training services, post-implementation professional services, and shipment of time clocks purchased time clocks.by customers. We also generate professional services and other revenues from custom professional services and consulting services that we provide and for certain third-party services that we arrange for our BureauOther recurring customers. Professional services revenue is primarily recognized as hours are incurred.
Costs and Expenses
Cost of Revenue
Cost of revenue consists of costs to deliver our revenue-producing services. Most of these costs are recognized as incurred, that is, as we become obligated to pay for them. Some costs of revenue are recognized in the period that a service is sold and delivered. Other costs of revenue are recognized over the period of use or in proportion to the related revenue.
62 | 2023 Form 10-K
The costs recognized as incurred consist primarily of customer service staff costs, customer technical support costs, implementation personnel costs, costs of hosting applications, consulting and purchased services, delivery services, and royalties. The costs of revenue recognized over the period of use are depreciation and amortization, rentals of facilities and equipment, and direct and incremental costs associated with deferred implementation service revenue.
Cost of recurring services revenues primarily consists of costs to provide maintenance and technical support to our customers, and the costs of hosting our applications. The cost of recurring services revenues includes compensation and other employee-related expenses for data center staff, payments to outside service providers, data center, and networking expenses.
Cost of professional services and other revenues primarily consists of costs to provide implementation consulting services and training to our customers, as well as the cost of time clocks. Costs to provide implementation consulting services include compensation and other employee-related expenses for professional services staff, costs of subcontractors, and travel.
Product development and management expense includes costs related to software development activities that do not qualify for capitalization, such as development, quality assurance, testing of new technologies, and enhancements to our existing solutions that do not result in additional functionality. Product development and management expense also includes costs related to the management of our service offerings.solutions. Research and development expense which is included within product developmentwas $112.0 million, $92.3 million, and management expense, was $29.6, $19.0, and $13.0$81.1 million for the years ended December 31, 2018, 2017,2023, 2022, and 2016,2021, respectively.
Depreciation and amortization related to cost of revenue primarily consists of amortization of capitalized software.
Selling and Marketing Expense
Selling General, and Administrative Expense
Sellingmarketing expense includes costs related to maintaining a direct marketing infrastructure and sales force and other direct marketing efforts, such as marketing events, advertising, telemarketing, direct mail, and trade shows. Advertising costs are expensed as incurred. Advertising expense was $5.8, $5.6,$14.2 million, $11.3 million, and $5.9$7.5 million for the years ended December 31, 2018, 2017,2023, 2022, and 2016,2021, respectively.
General and Administrative Expense
General and administrative expense includes costs that are not directly related to delivery of services, selling efforts, or product development, primarily consisting of corporate-level costs, such as administration, finance, legal, and human resources. Also included in this category are depreciation, and amortization of other intangible assets not reflected in cost of revenue, and the provision for doubtful accounts receivable, and net periodic pension costs.receivable.
Other Expense (Income), Net
Other (Income) Expense, Net
Otherexpense (income) expense,, net includes the results of transactions that are not appropriately classified in another category. These items are primarily foreign currency translation gains and losses resulting mainly from intercompany receivables and payablestransactions denominated in foreign currencies other than the subsidiary’s functional currency, environmental reserve charges, and charges related to the impairment of asset values.net periodic pension costs.
Income Taxes
Income taxes have been provided for using the asset and liability method. The asset and liability method requires an asset and liability based approach in accounting for income taxes. Deferred tax assets and liabilities are recorded for temporary differences between the financial reporting basis and the tax basis of assets and liabilities as adjusted for the expected benefits of utilizing net operating loss carryforwards. The impact on deferred taxes of changes in tax rates and laws, if any, applied to the years during which temporary differences are expected to be settled, is reflected in the consolidated financial statements in the period of enactment.
We classify interest and penalties related to income taxes as a component of the income tax provision.expense (benefit).
Fair Value of Financial Instruments
The carrying amounts of cash and equivalents, trade and other receivables, net, customer trust funds, customer trust funds obligations, customer advance payments, and accounts payable approximate fair value because of the short-term nature of these items.
63 | 2023 Form 10-K
Share-Based Compensation
Our employees participate in share-based compensation plans. Under the fair value recognition provisionsconsists of share-based compensation accounting, westock options, restricted stock units (“RSU”), and performance-based stock units (“PSU”) and is used to compensate employees and non-employee directors. We also offer a global employee stock purchase plan ("GESPP") to eligible employees.
We measure share-based compensation cost at the grant date based on the fair value of the award and recognize the compensation expense over the requisite service period, which is the period during which an employee is required to provide services in exchange for the award.award, except for retirement-eligible employees with RSUs that have not given their required notice, which accelerates at the time of their retirement eligibility date. We estimate forfeitures at the time of grant based on historical data and record share-based compensation expense for those awards expected to vest.
We useOur GESPP allows participating employees to purchase shares of our common stock at a discount via payroll deductions. The plan is available to employees subject to certain eligibility requirements. Participating employees may purchase common stock, on a voluntary after-tax basis, at a price that is the lower of 85% of the fair market value of a share of common stock on (i) January 1 or (ii) the purchase date. The plan consists of fourthree-month offering periods, beginning on January 1, April 1, July 1, and October 1 of each calendar year.
The fair value of term-based stock options and our GESPP activity is estimated using the Black-Scholes standard option pricing model (“Black-Scholes model”). The fair value for RSUs and PSUs is the closing market value of the underlying stock on the day of grant. For performance-based stock options and PSUs with a market condition, a Monte Carlo simulation model is used to determine the fair valuevalue. The Monte Carlo model utilizes multiple input variables that determine the probability of stock options with term-based vesting conditions. The determination ofsatisfying the market conditions stipulated in the award.
To determine the fair value of the awards on the date of grant using the Black-Scholes model, is affected by the value of our common stock as well as other inputs and assumptions described below. Prior to our IPO, the value of our common stock was determined by the Board of Directors with assistance from a third-party valuation expert.
If factors change and we employ different assumptions for estimating share-based compensation expense in future periods or if we adopt a different valuation model, the future periods may differ significantly from what we have recorded in the current period and could materially affect our operating results.
To determine the fair value of both term- and performance-based stock options, the risk-free interest rate used was based on the implied yield currently available on U.S. Treasury zero coupon issues with remaining term equal to the contractual term of the performance-based options and the expected term of the term-based options. Given our limited history as a public company, theawards. The estimated volatility of our common stock is based on volatility data for selected comparable public companies, including the historical volatility of our stock price, over the expected term of our stock options.awards. Because we do not anticipate paying any cash dividends in the foreseeable future, we use an expected dividend yield of zero. The amount of share-based compensation expense we recognize during a period is based on the portion of the awards that are ultimately expected to vest.
We estimate option forfeitures at the time of grant and revise those estimates in subsequent periods if actual forfeitures differ from those estimates. We analyze historical data to estimate pre-vesting forfeitures and record share-based compensation expense for those For most awards, expected to vest. Wewe recognize term-based stock compensation expense using the straight-line method. For awards based on a market condition, expense is recognized on a straight-line basis over the performance period, regardless of whether the market condition is satisfied as the likelihood of the market condition being met is included in the fair-value measurement of the award.
If factors change and we employ different assumptions for estimating share-based compensation expense in future periods or if we adopt a different valuation model, future periods may differ significantly from what we have recorded in the current period and could materially affect our operating results.
Pension and Other Postretirement Benefits Liability
We present information about our pension and postretirement benefit plans in Part II, Item 8, Note 10, “Employee Benefit Plans” to our consolidated financial statements, “Employee Benefit Plans.”statements. Liabilities and expenses for pensions and other postretirement benefits are determined with the assistance of third-party actuaries, using actuarial methodologies and incorporating significant assumptions, including the rate used to discount the future estimated liability, the long-term rate of return on plan assets, and several assumptions relating to the employee workforce (medical costs, retirement age, and mortality). The discount rate assumption utilizes a full yield curve approach by applying the specific spot rates along the yield curve used in the determination of the benefit obligation to the relevant projected cash flows. The impact of a change in the discount rate of 25 basis points would be approximately $12$6.6 million on the liabilities and $0.1 millionan immaterial impact on pre-tax earnings in the following year. The long-term rate of return is estimated by considering historical returns and expected returns on current and projected asset allocations and is generally applied to a five-year average market value of assets. A change in the assumption for the long-term rate of return on plan assets of 25 basis points would impact pre-tax earnings by approximately $1$0.9 million. At December 31, 2017, we updated our mortality assumptions utilizing an improvement scale issued by the Society
64 | 2023 Form 10-K
Foreign Currency Translation
We have international operations whereby the local currencies serve as functional currencies. We translate foreign currency denominated assets and liabilities at the end-of-period exchange rates and foreign currency denominated statements of operations at the weighted-averageaverage exchange rates for each period. We report the effect of changes in the U.S. dollar carrying values of assets and liabilities of our international subsidiaries that are due to changes in exchange rates between the U.S. dollar and the subsidiaries’ functional currency as foreign currency translation within accumulated other comprehensive income (loss) in the accompanying consolidated statements of stockholders’ equity and comprehensive income (loss). Gains and losses from transactions and translation of assets and liabilities denominated in currencies other than the functional currency of the subsidiaries are recorded in the consolidated statements of operations within other (income) expense (income), net.
Recently Issued and Adopted Accounting Pronouncements
In May 2014, the Financial Accounting Standards Board (“FASB”) issued Accounting Standards Update (“ASU”) No. 2014-09, “Revenue from Contracts with Customers,” which replaced all existing revenue guidance created by ASC Topic 605, including prescriptive industry-specific guidance, and created ASC Topic 606 for revenue and ASC Subtopic 340-40 for incremental costs of obtaining a contract with customers. This standard’s core principle isThere were no recently adopted accounting standards that an entity will recognize revenue when it transfers promised goods or services to customers in an amount that reflects the consideration to which the entity expects to be entitled in exchange for those goods or services. Entities will need to apply more judgment and make more estimates than under the previous guidance. In July 2015 the FASB deferred the effective date for all entities by one year, making the guidance for non-public companies effective for annual reporting periods beginning after December 15, 2018. As an emerging growth company, we have elected to follow the non-public company timeline for adopting this guidance. The standard permits the use of either the retrospective transition method or modified retrospective approach with a cumulative effect recognized at the date of initial application. Management has decided to adopt the new standard effective in the first quarter of 2019, using the retrospective transition method for adoption.
In preparation for this adoption, we have evaluated the impact of the new standard to our financial statements and accompanying disclosures in the notes to our consolidated financial statements. Our assessment of the impact included an evaluation of the five-step process set forth in the new standard along with the enhancement of disclosures that will be required. We executed a plan for implementing the standard, which included identifying customer contracts within the scope of the new standard, identifying performance obligations within those customer contracts, and evaluating the impact of incremental variable consideration paid to obtain those customer contracts. We also undertook a comprehensive review of all contracts that fall under the scope of the new standard; and, as of the date of this report, we have completed our review of in-scope contracts.
Based on our analysis, the adoption of the new standard will result in changes to the classification and timing of our revenue recognition. Specifically, revenue classified as professional services and other revenue will increase and revenue classified as recurring services revenue will be reduced under the new standard, compared to current GAAP. Further, the new standard will result in changes to the timing of our revenue recognition compared to current GAAP. In compliance with the new standard, a contract asset will be reflected on the consolidated balance sheets and will be amortized over the contract period, which is generally three years. We also will have changes to the timing of certain selling, general, and administrative expenses, as the new standard requires capitalizing and amortizing certain selling expenses, such as commissions and bonuses paid to the sales force. These sales expenses will be amortized over the period of benefit, generally five years. Additionally, the adoption of the new standard will have an immaterial impact on cost of revenue for the year ended December 31, 2017, as a small number of customer contracts had previously been recognized under revenue guidance prior to ASC Topic 605.
In periods of revenue growth, the changes above will result in higher overall earnings before income taxes and net income when compared to current GAAP.
The following tables present the impacts that the adoption of ASC 606 would have on the years ended December 31, 2018 and 2017:
|
| Year Ended December 31, 2018 |
| |||||||||
|
| As Reported |
|
| Under ASC 606 |
|
| Impact |
| |||
Revenue: |
|
|
|
|
|
|
|
|
|
|
|
|
Recurring services |
| $ | 652.5 |
|
| $ | 625.0 |
|
| $ | (27.5 | ) |
Professional services and other |
|
| 93.9 |
|
|
| 115.7 |
|
|
| 21.8 |
|
Total revenue |
| $ | 746.4 |
|
| $ | 740.7 |
|
| $ | (5.7 | ) |
Operating profit |
| $ | 52.8 |
|
| $ | 56.3 |
|
| $ | 3.5 |
|
|
| Year Ended December 31, 2017 |
| |||||||||
|
| As Reported |
|
| Under ASC 606 |
|
| Impact |
| |||
Revenue: |
|
|
|
|
|
|
|
|
|
|
|
|
Recurring services |
| $ | 598.5 |
|
| $ | 573.9 |
|
| $ | (24.6 | ) |
Professional services and other |
|
| 72.3 |
|
|
| 102.3 |
|
|
| 30.0 |
|
Total revenue |
| $ | 670.8 |
|
| $ | 676.2 |
|
| $ | 5.4 |
|
Operating profit |
| $ | 33.0 |
|
| $ | 46.6 |
|
| $ | 13.6 |
|
In February 2016, the FASB issued ASU No. 2016-02, “Leases,” which created ASC Topic 842 and is intended to increase transparency and comparability among organizations by recognizing lease assets and lease liabilities on the balance sheet and by disclosing key information about leasing arrangements. This standard requires balance sheet recognition for both finance leases and operating leases. This guidance is effective for public companies for fiscal years beginning after December 15, 2018, including interim periods within those fiscal years. An entity will, in effect, continue to account for leases that commence before the effective date in accordance with previous GAAP unless the lease is modified, except that lessees are required to recognize a right-of-use asset and a lease liability for all operating leases at each reporting date based on the present value of the remaining minimum rental payments that were tracked and disclosed under previous GAAP. Management will adopt this guidance beginning in the first quarter of 2019, and has chosen to take advantage of the additional transition method in ASU No. 2018-11 discussed below, in which a cumulative-effect adjustment will be made to the opening balance of retained earnings in the period of adoption. Currently, based on management’s implementation efforts, we will recognize a right-of-use asset and a lease liability on the consolidated balance sheets as of January 1, 2019, in the range of $35.0 to $45.0.
In August 2016, the FASB issued ASU No. 2016-15, “Statement of Cash Flows—Classification of Certain Cash Receipts and Cash Payments,” which addresses eight specific cash flow issues with the objective of reducing the existing diversity in practice of certain cash receipts and cash payments. This guidance is effective for non-public companies for fiscal years beginning after December 15, 2018, and interim periods within fiscal years beginning after December 15, 2019. We have chosen to early adopt this guidance as of January 1, 2018, and have applied this guidance to the presentation of our debt refinancing transactions that occurred during 2018.
In February 2018, the FASB issued ASU No. 2018-02, “Income Statement—Reporting Comprehensive Income,” which is in response to a narrow-scope financial reporting issue that arose because of the Tax Cuts and Jobs Act. The amendment in this update allows a reclassification from accumulated other comprehensive income to retained earnings for stranded tax effects resulting from the Tax Cuts and Jobs Act. This amendment is intended to improve the usefulness of information reported to financial statement users by requiring certain disclosures about stranded tax effects. The amendment in this update is effective for all entities for fiscal years beginning after December 15, 2018, and interim periods within those fiscal years. Management will adopt this guidance beginning in the first quarter of 2019. We anticipate the adoption of this guidance will not have a significant impact on our consolidated balance sheets.
In July 2018, the FASB issued ASU No. 2018-10, “Codification Improvements to Topic 842, Leases” and 2018-11, “Leases (Topic 842): Targeted Improvements.” The amendments in ASU No. 2018-10 affect narrow aspects of the guidance issued in ASU No. 2016-02. For non-early adopters, this amendment is effective under the same timelines as ASU No. 2016-02. The amendments in ASU No. 2018-11 provide entities with an additional (and optional) transition method to adopt the new lease requirements. Under the additional transition method, entities may initially apply the requirements by recognizing a cumulative-effect adjustment to the opening balance of retained earnings in the period of adoption. The amendments in this update also provide lessors with a practical alternative to separate non-lease components from the associated lease component. Under this alternative, lessors may account for those components as a single component if the non-lease components otherwise would be accounted for under the new revenue guidance (Topic 606) and certain other criteria are met. For entities that have not adopted Topic 842 before the issuance of this update, the effective date and transition requirements are the same as the effective date and transition requirements in ASU No. 2016-02. As discussed above, management has chosen to take advantage of the additional transition method created by this guidance and will record a cumulative-effect adjustment to the opening balance of retained earnings in the period of adoption, which will be the first quarter of 2019.
3. Discontinued Operations
Life Works Disposition
On March 1, 2016, we entered into a strategic joint venture with WorkAngel Technology Limited (“WorkAngel”) in which we contributed our existing LifeWorks employee assistance program business to WorkAngel Organisation Limited, a newly formed English limited company. On January 20, 2017, WorkAngel Organisation Limited changed its name to LifeWorks Corporation Ltd (“LifeWorks”). We had a controlling interest in LifeWorks, including certain preferential distribution rights; therefore, LifeWorks was consolidated within our financial statements, and the other joint venture ownership interest component was presented as a noncontrolling interest. During the years ended December 31, 2018, and 2017, there were losses attributable to the noncontrolling interest of $0.5 and $1.3, respectively. During the year ended December 31, 2016, there was income attributable to the noncontrolling interest of $0.1.
In the second quarter of 2018, contemporaneously with our IPO and concurrent private placement, we distributed our controlling financial interest in LifeWorks to our stockholders of record prior to the IPOmaterial effect on a pro rata basis in accordance with their pro rata interest in us (the “LifeWorks Disposition”).
The LifeWorks Disposition represented a strategic shift in our overall business and had a significant impact on the financial statement results. Therefore, the LifeWorks business has been presented as discontinued operations in our consolidated financial statements and accompanying notes for all periods presented. Ceridian’s net book value relateddisclosures, and no recently issued accounting standards that are expected to LifeWorks of $95.7 was recorded ashave a distribution through additional paid in capital within our consolidated balance sheet during the second quarter of 2018.
The amounts in the table below reflect the operating results of LifeWorks reported as discontinued operations, as well as supplemental disclosures of the discontinued operations:
|
| Year Ended December 31, |
| |||||||||
|
| 2018 |
|
| 2017 |
|
| 2016 |
| |||
Net revenues |
| $ | 28.3 |
|
| $ | 79.9 |
|
| $ | 80.8 |
|
(Loss) income from operations before income taxes |
|
| (0.9 | ) |
|
| (0.4 | ) |
|
| 7.1 |
|
Income tax expense |
|
| (24.9 | ) |
|
| (4.9 | ) |
|
| (11.1 | ) |
Loss from discontinued operations, net of income taxes |
| $ | (25.8 | ) |
| $ | (5.3 | ) |
| $ | (4.0 | ) |
Depreciation and amortization |
| $ | 1.4 |
|
| $ | 4.1 |
|
| $ | 4.1 |
|
Capital expenditures |
| $ | — |
|
| $ | 0.2 |
|
| $ | 0.3 |
|
The amounts in the table below reflect the assets and liabilities reported as discontinued operations for LifeWorks:
|
| December 31, |
| |
|
| 2017 |
| |
Assets: |
|
|
|
|
Cash and equivalents |
| $ | 5.4 |
|
Trade and other receivables, net |
|
| 13.3 |
|
Prepaid expenses |
|
| 1.5 |
|
Property, plant, and equipment, net |
|
| 1.8 |
|
Other intangible assets, net |
|
| 5.9 |
|
Goodwill |
|
| 126.3 |
|
Other assets |
|
| 2.0 |
|
Assets of discontinued operations |
| $ | 156.2 |
|
Liabilities: |
|
|
|
|
Accounts payable |
| $ | 4.4 |
|
Deferred revenue |
|
| 2.8 |
|
Employee compensation and benefits |
|
| 1.2 |
|
Other liabilities |
|
| 10.9 |
|
Liabilities of discontinued operations |
| $ | 19.3 |
|
Sale of UK Business
On June 15, 2016, we completed the stock sale of our United Kingdom and Ireland businesses, along with the portion of our Mauritius operations that supported these businesses (the “UK Business”). We received $93.2 in connection with this transaction. Concurrent with this transaction, we entered into a strategic partnership with the acquirer, SD Worx, a leading European provider of payroll and HCM services, to deliver cloud human capital management (“HCM”) services across Europe.
This transaction represented a strategic shift in our overall business and had a significantmaterial impact on our financial statement results. Therefore, the UK Business has been presented as discontinued operations in the consolidated financial statements and accompanying notes for all periods presented. The sale of the UK Business, which made up the International reporting unit, was considered a sale of a business, and as such, the entire goodwill balance assigned to the International reporting unit of $23.8 was included in the carrying amount used in determining the gain on sale of the UK Business. During the year ended December 31, 2017, there was a settlement payment made to SD Worx.disclosures.
The amounts in the table below reflect the operating results of the UK Business reported as discontinued operations, as well as supplemental disclosures of the discontinued operations:
|
| Year Ended December 31, |
| |||||
|
| 2017 |
|
| 2016 |
| ||
Net revenues |
| $ | — |
|
| $ | 37.0 |
|
Income from operations before income taxes |
|
| — |
|
|
| 0.5 |
|
(Loss) gain on sale of businesses |
|
| (1.0 | ) |
|
| 5.9 |
|
Income tax benefit |
|
| — |
|
|
| 0.2 |
|
(Loss) income from discontinued operations, net of income taxes |
| $ | (1.0 | ) |
| $ | 6.6 |
|
Depreciation and amortization |
| $ | — |
|
| $ | 1.3 |
|
Capital expenditures |
| $ | — |
|
| $ | 0.7 |
|
Sale of Divested Benefits Continuation Businesses
In the third quarter of 2013, we entered into an agreement for the sale of certain of our customer contracts for consumer-directed benefit services, including flexible spending accounts, health reimbursement accounts, health savings accounts, commuter (parking or transit) premium-only plans, and tuition reimbursement plans (collectively, the “Consumer-Directed Benefit Services”). During the third quarter of 2015, we completed two separate transactions that resulted in the sale of our benefits administration and post-employment health insurance portability compliance businesses (the “Divested Benefits Continuation Businesses”).
These three transactions represented a strategic shift in our overall business and had a significant impact on our financial statement results. Accordingly, the Divested Benefits Continuation Businesses, as well as the Consumer-Directed Benefit Services, have been presented as discontinued operations in the consolidated financial statements and accompanying notes for all periods presented. The amounts in the table below reflect the operating results and gain on sale of the Divested Benefits Continuation Businesses reported as discontinued operations, as well as supplemental disclosures of the discontinued operations:
The purchase price of the Consumer-Directed Benefit Services was subject to adjustment, dependent upon which customers transitioned to the acquirer. Since a portion of the customer contracts were assigned to the acquirer on the sale date, that portion of the purchase price was recognized upon the sale date. For the remaining contracts that required transition, the purchase price was deferred and recognized as each contract transferred.
|
| Year Ended December 31, |
| |||||
|
| 2017 |
|
| 2016 |
| ||
Net revenues |
| $ | — |
|
| $ | 4.8 |
|
Loss from operations before income taxes |
|
| — |
|
|
| (0.8 | ) |
Gain on sale of businesses |
|
| 0.5 |
|
|
| 21.0 |
|
Income tax expense |
|
| (0.2 | ) |
|
| (10.3 | ) |
Income from discontinued operations, net of income taxes |
| $ | 0.3 |
|
| $ | 9.9 |
|
Depreciation and amortization |
| $ | — |
|
| $ | — |
|
Capital expenditures |
| $ | — |
|
| $ | — |
|
For both sales of the Divested Benefits Continuation Businesses, consideration received was contingent upon the number and dollar value of successful customer transitions and was recorded when earned. Proceeds of $21.0 were received and earned based on the customers transitioned during the years ended December 31, 2016. The proceeds received during the year ended December 31, 2017, were for a final purchase price true-up related to one of the transactions.
The remaining liabilities related to discontinued operations for the Divested Benefits Continuation Businesses as of December 31, 2018, and 2017, were $0.2 and $0.3 of other accrued expenses.
Fair value is defined as the price that would be received to sell an asset or paid to transfer a liability in an orderly transaction between market participants at the measurement date (an exit price). GAAP outlines a valuation framework and creates a fair value hierarchy intended to increase the consistency and comparability of fair value measurements and the related disclosures. Certain assets and liabilities must be measured at fair value, and disclosures are required for items measured at fair value.
We measure our financial instruments using inputs from the following three levels of the fair value hierarchy. The three levels are as follows:
Level 1 inputs are unadjusted quoted prices in active markets for identical assets or liabilities that we have the ability to access at the measurement date.
Level 2 inputs include quoted prices for similar assets and liabilities in active markets, quoted prices for identical or similar assets or liabilities in markets that are not active, inputs other than quoted prices that are observable for the asset or liability (that is, interest rates, yield curves, etc.), and inputs that are derived principally from or corroborated by observable market data by correlation or other means (market corroborated inputs).
Level 3 inputs include unobservable inputs that reflect our assumptions about the assumptions that market participants would use in pricing the asset or liability. These inputs are developed based on the best information available, including internal data.
Financial Assets and Liabilities Measured at Fair Value on a Recurring Basis
As of December 31, 2018, ourOur financial assets and liabilities measured at fair value on a recurring basis were categorized as follows:
|
| December 31, 2023 |
| ||||||||||||||
|
| Level 1 |
|
| Level 2 |
|
|
| Level 3 |
|
| Total |
| ||||
|
| (In millions) |
| ||||||||||||||
Assets |
|
|
|
|
|
|
|
|
|
|
|
|
| ||||
Available for sale customer funds assets |
| $ | — |
|
| $ | 2,178.3 |
| (a) |
| $ | — |
|
| $ | 2,178.3 |
|
Total assets measured at fair value |
| $ | — |
|
| $ | 2,178.3 |
|
|
| $ | — |
|
| $ | 2,178.3 |
|
|
|
|
|
|
|
|
|
|
|
|
|
|
| ||||
Liabilities |
|
|
|
|
|
|
|
|
|
|
|
|
| ||||
DataFuzion contingent consideration |
| $ | — |
|
| $ | — |
|
|
| $ | 14.9 |
| (b) | $ | 14.9 |
|
Total liabilities measured at fair value |
| $ | — |
|
| $ | — |
|
|
| $ | 14.9 |
|
| $ | 14.9 |
|
|
| Total |
|
| Level 1 |
|
| Level 2 |
|
|
| Level 3 |
| ||||
Assets |
|
|
|
|
|
|
|
|
|
|
|
|
|
|
|
|
|
Available for sale customer trust funds assets |
| $ | 1,719.6 |
|
| $ | — |
|
| $ | 1,719.6 |
| (a) |
| $ | — |
|
Total assets measured at fair value |
| $ | 1,719.6 |
|
| $ | — |
|
| $ | 1,719.6 |
|
|
| $ | — |
|
65 | 2023 Form 10-K
|
| December 31, 2022 |
| ||||||||||||||
|
| Level 1 |
|
| Level 2 |
|
|
| Level 3 |
|
| Total |
| ||||
|
| (In millions) |
| ||||||||||||||
Assets |
|
|
|
|
|
|
|
|
|
|
|
|
| ||||
Available for sale customer funds assets |
| $ | — |
|
| $ | 2,011.0 |
| (a) |
| $ | — |
|
| $ | 2,011.0 |
|
Total assets measured at fair value |
| $ | — |
|
| $ | 2,011.0 |
|
|
| $ | — |
|
| $ | 2,011.0 |
|
|
|
|
|
|
|
|
|
|
|
|
|
|
| ||||
Liabilities |
|
|
|
|
|
|
|
|
|
|
|
|
| ||||
DataFuzion contingent consideration |
| $ | — |
|
| $ | — |
|
|
| $ | 10.6 |
| (b) | $ | 10.6 |
|
Total liabilities measured at fair value |
| $ | — |
|
| $ | — |
|
|
| $ | 10.6 |
|
| $ | 10.6 |
|
During the year ended December 31, 2023 and 2022, we recognized expense of $4.3 million and $4.6 million, respectively, within general and administrative expense in our consolidated statements of operations due to the remeasurement of the DataFuzion contingent consideration.
|
| Total |
|
| Level 1 |
|
| Level 2 |
|
|
| Level 3 |
| ||||
Assets |
|
|
|
|
|
|
|
|
|
|
|
|
|
|
|
|
|
Available for sale customer trust funds assets |
| $ | 1,782.1 |
|
| $ | — |
|
| $ | 1,782.1 |
| (a) |
| $ | — |
|
Total assets measured at fair value |
| $ | 1,782.1 |
|
| $ | — |
|
| $ | 1,782.1 |
|
|
| $ | — |
|
|
|
Assets and Liabilities Measured at Fair Value on a Nonrecurring Basis
During the yearsyear ended December 31, 20182023 and 2017,2022, we did not re-measure any financial assets or liabilities at fair value on a nonrecurring basis.
4. Customer Funds
5. Customer Trust FundsOverview
Overview
In connection with our U.S. and Canadian payroll and tax filing services,certain jurisdictions, we collect funds for payment of payroll and taxes; temporarily hold such funds in trust until payment is due; remit the funds to the clients’customers’ employees and appropriate taxing authorities; file federal, state, and local tax returns; and handle related regulatory correspondence and amendments. The customer assets are held in trust aresegregated accounts intended for the specific purpose of satisfying client fundfunding obligations and therefore are not freely available for our general business use. In the U.S. and Canada, these customer funds are held in trusts.
Our customer trust funds are held and invested with the primary objectives being to protect the principal balance and to ensure adequate liquidity to meet cash flow requirements. Accordingly, we maintain on average approximately 46%45% to 55% of customer trust funds in liquidity portfolios with maturities ranging from one to 120 days, consisting of high-quality bank deposits, money market mutual funds, commercial paper, or collateralized short-term investments; and we maintain on average approximately 54%45% to 55% of customer trust funds in fixed income portfolios with maturities ranging from 120 days to 10 years, consisting of U.S. Treasury and agency securities, Canada government and provincial securities, as well as highly rated asset-backed, mortgage-backed, municipal, corporate, and bank securities. To maintain sufficient liquidity in the trust to meet payment obligations, we also have financing arrangements and may pledge fixed income securities for short-term financing.
66 | 2023 Form 10-K
Financial Statement Presentation
Investment income from invested customer trust funds, constitutesalso referred to as float revenue or float, is a component of our compensation for providing services under agreements with our customers. Investment income from invested customer trust funds included in revenue amounted to $67.0, $46.5,$168.7 million, $80.2 million, and $39.1$41.1 million for the years ended December 31, 2018, 2017,2023, 2022, and 2016,2021, respectively. Investment income includes interest income, realized gains and losses from sales of customer trust funds’ investments, and unrealized credit losses determined to be other-than-temporary.unrecoverable.
The amortized cost of customer trust funds as of December 31, 20182023, and 2017,2022, is comprised of the original cost of assets acquired. The amortized cost and fair values of investments of customer trust funds available for sale at December 31, 2018 and 2017, were as follows:
|
| December 31, 2023 |
| |||||||||||||
|
| Amortized |
|
| Gross Unrealized |
|
| Fair |
| |||||||
|
| Cost |
|
| Gain |
|
| Loss |
|
| Value |
| ||||
|
| (In millions) |
| |||||||||||||
Money market securities, investments carried at cost |
| $ | 2,800.7 |
|
| $ | — |
|
| $ | — |
|
| $ | 2,800.7 |
|
Available for sale investments: |
|
|
|
|
|
|
|
|
|
|
|
| ||||
U.S. government and agency securities |
|
| 768.3 |
|
|
| 2.3 |
|
|
| (35.1 | ) |
|
| 735.5 |
|
Canadian and provincial government securities |
|
| 448.7 |
|
|
| 1.3 |
|
|
| (11.3 | ) |
|
| 438.7 |
|
Corporate debt securities |
|
| 664.7 |
|
|
| 2.6 |
|
|
| (19.4 | ) |
|
| 647.9 |
|
Asset-backed securities |
|
| 208.9 |
|
|
| 1.0 |
|
|
| (3.3 | ) |
|
| 206.6 |
|
Mortgage-backed securities |
|
| 60.3 |
|
|
| 0.8 |
|
|
| (0.7 | ) |
|
| 60.4 |
|
Other short-term investments |
|
| 16.1 |
|
|
| — |
|
|
| — |
|
|
| 16.1 |
|
Other securities |
|
| 76.2 |
|
|
| 0.1 |
|
|
| (3.2 | ) |
|
| 73.1 |
|
Total available for sale investments |
|
| 2,243.2 |
|
|
| 8.1 |
|
|
| (73.0 | ) |
|
| 2,178.3 |
|
Invested customer funds |
|
| 5,043.9 |
|
| $ | 8.1 |
|
| $ | (73.0 | ) |
|
| 4,979.0 |
|
Receivables |
|
| 49.6 |
|
|
|
|
|
|
|
|
| 49.6 |
| ||
Total customer funds |
| $ | 5,093.5 |
|
|
|
|
|
|
|
| $ | 5,028.6 |
| ||
|
| December 31, 2022 |
| |||||||||||||
|
| Amortized |
|
| Gross Unrealized |
|
| Fair |
| |||||||
|
| Cost |
|
| Gain |
|
| Loss |
|
| Value |
| ||||
|
| (In millions) |
| |||||||||||||
Money market securities, investments carried at cost |
| $ | 2,698.7 |
|
| $ | — |
|
| $ | — |
|
| $ | 2,698.7 |
|
Available for sale investments: |
|
|
|
|
|
|
|
|
|
|
|
| ||||
U.S. government and agency securities |
|
| 721.3 |
|
|
| — |
|
|
| (53.1 | ) |
|
| 668.2 |
|
Canadian and provincial government securities |
|
| 438.7 |
|
|
| 0.1 |
|
|
| (17.8 | ) |
|
| 421.0 |
|
Corporate debt securities |
|
| 653.8 |
|
|
| 0.5 |
|
|
| (35.5 | ) |
|
| 618.8 |
|
Asset-backed securities |
|
| 169.6 |
|
|
| 0.1 |
|
|
| (6.1 | ) |
|
| 163.6 |
|
Mortgage-backed securities |
|
| 14.5 |
|
|
| — |
|
|
| (0.7 | ) |
|
| 13.8 |
|
Other short-term investments |
|
| 57.0 |
|
|
| — |
|
|
| — |
|
|
| 57.0 |
|
Other securities |
|
| 74.4 |
|
|
| — |
|
|
| (5.9 | ) |
|
| 68.6 |
|
Total available for sale investments |
|
| 2,129.3 |
|
|
| 0.7 |
|
|
| (119.1 | ) |
|
| 2,011.0 |
|
Invested customer funds |
|
| 4,828.0 |
|
| $ | 0.7 |
|
| $ | (119.1 | ) |
|
| 4,709.7 |
|
Receivables |
|
| 20.0 |
|
|
|
|
|
|
|
|
| 19.8 |
| ||
Total customer funds |
| $ | 4,848.0 |
|
|
|
|
|
|
|
| $ | 4,729.5 |
| ||
67 | 2023 Form 10-K
Investments of Customer Trust Funds at December 31, 2018
|
| Amortized |
|
| Gross Unrealized |
|
| Fair |
| |||||||
|
| Cost |
|
| Gain |
|
| Loss |
|
| Value |
| ||||
Money market securities, investments carried at cost and other cash equivalents |
| $ | 872.3 |
|
| $ | — |
|
| $ | — |
|
| $ | 872.3 |
|
Available for sale investments: |
|
|
|
|
|
|
|
|
|
|
|
|
|
|
|
|
U.S. government and agency securities |
|
| 573.4 |
|
|
| 0.2 |
|
|
| (11.4 | ) |
|
| 562.2 |
|
Canadian and provincial government securities |
|
| 392.5 |
|
|
| 3.4 |
|
|
| (1.4 | ) |
|
| 394.5 |
|
Corporate debt securities |
|
| 499.5 |
|
|
| 0.5 |
|
|
| (4.7 | ) |
|
| 495.3 |
|
Asset-backed securities |
|
| 247.1 |
|
|
| 0.2 |
|
|
| (2.7 | ) |
|
| 244.6 |
|
Mortgage-backed securities |
|
| 8.5 |
|
|
| — |
|
|
| (0.2 | ) |
|
| 8.3 |
|
Other securities |
|
| 14.8 |
|
|
| — |
|
|
| (0.1 | ) |
|
| 14.7 |
|
Total available for sale investments |
|
| 1,735.8 |
|
|
| 4.3 |
|
|
| (20.5 | ) |
|
| 1,719.6 |
|
Invested customer trust funds |
|
| 2,608.1 |
|
| $ | 4.3 |
|
| $ | (20.5 | ) |
|
| 2,591.9 |
|
Trust receivables |
|
| 11.6 |
|
|
|
|
|
|
|
|
|
|
| 11.6 |
|
Total customer trust funds |
| $ | 2,619.7 |
|
|
|
|
|
|
|
|
|
| $ | 2,603.5 |
|
Investments of Customer Trust Funds at December 31, 2017
|
| Amortized |
|
| Gross Unrealized |
|
| Fair |
| |||||||
|
| Cost |
|
| Gain |
|
| Loss |
|
| Value |
| ||||
Money market securities, investments carried at cost and other cash equivalents |
| $ | 2,309.3 |
|
| $ | — |
|
| $ | — |
|
| $ | 2,309.3 |
|
Available for sale investments: |
|
|
|
|
|
|
|
|
|
|
|
|
|
|
|
|
U.S. government and agency securities |
|
| 584.6 |
|
|
| 0.1 |
|
|
| (7.1 | ) |
|
| 577.6 |
|
Canadian and provincial government securities |
|
| 418.2 |
|
|
| 6.6 |
|
|
| (1.5 | ) |
|
| 423.3 |
|
Corporate debt securities |
|
| 472.3 |
|
|
| 0.8 |
|
|
| (2.5 | ) |
|
| 470.6 |
|
Asset-backed securities |
|
| 280.8 |
|
|
| — |
|
|
| (1.8 | ) |
|
| 279.0 |
|
Mortgage-backed securities |
|
| 15.0 |
|
|
| — |
|
|
| (0.2 | ) |
|
| 14.8 |
|
Other securities |
|
| 17.0 |
|
|
| — |
|
|
| (0.2 | ) |
|
| 16.8 |
|
Total available for sale investments |
|
| 1,787.9 |
|
|
| 7.5 |
|
|
| (13.3 | ) |
|
| 1,782.1 |
|
Invested customer trust funds |
|
| 4,097.2 |
|
| $ | 7.5 |
|
| $ | (13.3 | ) |
|
| 4,091.4 |
|
Trust receivables |
|
| 8.3 |
|
|
|
|
|
|
|
|
|
|
| 8.3 |
|
Total customer trust funds |
| $ | 4,105.5 |
|
|
|
|
|
|
|
|
|
| $ | 4,099.7 |
|
The following represents the gross unrealized losses and the related fair value of the investments of customer trust funds available for sale, aggregated by investment category and length of time that individual securities have been in a continuous unrealized loss position at December 31, 2018.position.
|
| December 31, 2023 |
| |||||||||||||||||||||||||||||||||||||||||||||
|
| Less than 12 months |
|
| 12 months or more |
|
| Total |
| |||||||||||||||||||||||||||||||||||||||
|
| Less than 12 months |
|
| 12 months or more |
|
| Total |
|
| Unrealized |
|
| Fair |
|
| Unrealized |
|
| Fair |
|
| Unrealized |
|
| Fair |
| |||||||||||||||||||||
|
| Unrealized Losses |
|
| Fair Value |
|
| Unrealized Losses |
|
| Fair Value |
|
| Unrealized Losses |
|
| Fair Value |
|
| (In millions) |
| |||||||||||||||||||||||||||
U.S. government and agency securities |
| $ | (1.0 | ) |
| $ | 100.1 |
|
| $ | (10.4 | ) |
| $ | 419.1 |
|
| $ | (11.4 | ) |
| $ | 519.2 |
|
| $ | (0.5 | ) |
| $ | 38.5 |
|
| $ | (34.6 | ) |
| $ | 508.3 |
|
| $ | (35.1 | ) |
| $ | 546.8 |
|
Canadian and provincial government securities |
|
| (0.1 | ) |
|
| 14.5 |
|
|
| (1.3 | ) |
|
| 130.5 |
|
|
| (1.4 | ) |
|
| 145.0 |
|
|
| (0.7 | ) |
|
| 101.8 |
|
|
| (10.6 | ) |
|
| 234.8 |
|
|
| (11.3 | ) |
|
| 336.6 |
|
Corporate debt securities |
|
| (1.1 | ) |
|
| 136.6 |
|
|
| (3.6 | ) |
|
| 204.6 |
|
|
| (4.7 | ) |
|
| 341.2 |
|
|
| (0.2 | ) |
|
| 36.6 |
|
|
| (19.2 | ) |
|
| 465.7 |
|
|
| (19.4 | ) |
|
| 502.3 |
|
Asset-backed securities |
|
| (0.2 | ) |
|
| 40.7 |
|
|
| (2.5 | ) |
|
| 169.1 |
|
|
| (2.7 | ) |
|
| 209.8 |
|
|
| (0.2 | ) |
|
| 39.2 |
|
|
| (3.1 | ) |
|
| 101.5 |
|
|
| (3.3 | ) |
|
| 140.7 |
|
Mortgage-backed securities |
|
| — |
|
|
| — |
|
|
| (0.2 | ) |
|
| 8.2 |
|
|
| (0.2 | ) |
|
| 8.2 |
|
|
| (0.1 | ) |
|
| 3.9 |
|
|
| (0.6 | ) |
|
| 11.6 |
|
|
| (0.7 | ) |
|
| 15.5 |
|
Other securities |
| (a) |
|
|
| 1.7 |
|
|
| (0.1 | ) |
|
| 12.8 |
|
|
| (0.1 | ) |
|
| 14.5 |
|
|
| — |
|
|
| 1.9 |
|
|
| (3.2 | ) |
|
| 67.1 |
|
|
| (3.2 | ) |
|
| 69.0 |
| |
Total available for sale investments |
| $ | (2.4 | ) |
| $ | 293.6 |
|
| $ | (18.1 | ) |
| $ | 944.3 |
|
| $ | (20.5 | ) |
| $ | 1,237.9 |
|
| $ | (1.7 | ) |
| $ | 221.9 |
|
| $ | (71.3 | ) |
| $ | 1,389.0 |
|
| $ | (73.0 | ) |
| $ | 1,610.9 |
|
|
|
Management does not believe that any individual unrealized loss was unrecoverable as of December 31, 2018, represents an other-than-temporary impairment.2023. The unrealized losses are primarily attributable to changes in interest rates and not to credit deterioration. We currently do not intend to sell or expect to be required to sell the securities before the time required to recover the amortized cost.
The amortized cost and fair value of investment securities available for sale at December 31, 2018,2023, by contractual maturity are shown below. Expected maturities will differ from contractual maturities because borrowers may have the right to call or to prepay obligations with or without call or prepayment penalties.
|
| December 31, 2023 |
| |||||
|
| Cost |
|
| Fair Value |
| ||
|
| (In millions) |
| |||||
Due in one year or less |
| $ | 3,100.7 |
|
| $ | 3,095.8 |
|
Due in one to three years |
|
| 951.1 |
|
|
| 909.5 |
|
Due in three to five years |
|
| 793.4 |
|
|
| 775.7 |
|
Due after five years |
|
| 198.7 |
|
|
| 198.0 |
|
Invested customer funds |
| $ | 5,043.9 |
|
| $ | 4,979.0 |
|
|
| December 31, 2018 |
| |||||
|
| Cost |
|
| Fair Value |
| ||
Due in one year or less |
| $ | 1,139.4 |
|
| $ | 1,139.4 |
|
Due in one to three years |
|
| 599.9 |
|
|
| 593.8 |
|
Due in three to five years |
|
| 651.3 |
|
|
| 646.9 |
|
Due after five years |
|
| 217.5 |
|
|
| 211.8 |
|
Invested customer trust funds |
| $ | 2,608.1 |
|
| $ | 2,591.9 |
|
6.5. Trade and Other Receivables, Net
The balance in tradeTrade and other receivables, net, is comprisedconsist of the following:
|
| December 31, |
| |||||
|
| 2023 |
|
| 2022 |
| ||
|
| (In millions) |
| |||||
Trade receivables from customers |
| $ | 177.5 |
|
| $ | 143.0 |
|
Interest receivable from invested customer funds |
|
| 18.1 |
|
|
| 12.7 |
|
Dayforce Wallet on-demand pay receivables |
|
| 19.6 |
|
|
| 22.2 |
|
Other |
|
| 27.6 |
|
|
| 11.4 |
|
Total gross receivables |
|
| 242.8 |
|
|
| 189.3 |
|
Less: reserve for sales adjustments |
|
| (5.6 | ) |
|
| (4.6 | ) |
Less: allowance for doubtful accounts |
|
| (8.4 | ) |
|
| (4.6 | ) |
Trade and other receivables, net |
| $ | 228.8 |
|
| $ | 180.1 |
|
|
| December 31, |
| |||||
|
| 2018 |
|
| 2017 |
| ||
Trade receivables from customers |
| $ | 68.6 |
|
| $ | 67.2 |
|
Interest receivable from invested customer trust funds |
|
| 0.9 |
|
|
| 1.7 |
|
Other |
|
| 5.5 |
|
|
| 3.7 |
|
Total gross receivables |
|
| 75.0 |
|
|
| 72.6 |
|
Less: reserve for sales adjustments |
|
| (3.8 | ) |
|
| (4.7 | ) |
Less: allowance for doubtful accounts |
|
| (1.3 | ) |
|
| (1.3 | ) |
Trade and other receivables, net |
| $ | 69.9 |
|
| $ | 66.6 |
|
68 | 2023 Form 10-K
The activity related to the allowance for doubtful accounts was as follows:
|
| Year Ended December 31, |
| |||||||||
|
| 2023 |
|
| 2022 |
|
| 2021 |
| |||
|
| (In millions) |
| |||||||||
Balance at beginning of year |
| $ | 4.6 |
|
| $ | 3.9 |
|
| $ | 3.1 |
|
Provision for doubtful accounts |
|
| 5.4 |
|
|
| 2.2 |
|
|
| 1.8 |
|
Charge-offs, net of recoveries |
|
| (1.6 | ) |
|
| (1.5 | ) |
|
| (1.0 | ) |
Balance at end of year |
| $ | 8.4 |
|
| $ | 4.6 |
|
| $ | 3.9 |
|
6. Leases
Our leases primarily consist of office space. Leases with an initial term of 12 months or less are not recorded on the balance sheet; we recognize lease expense for these leases on a straight-line basis over the lease term. For leases beginning 2019 and later, we account for lease components separately from the non-lease components.
Most leases include options to renew, and the lease renewal is as followsat our sole discretion. Therefore, the depreciable life of assets and leasehold improvements is limited by the expected lease term unless there is a transfer of title or purchase option reasonably certain of exercise. Our lease agreements do not contain any material residual value guarantees or material restrictive covenants.
We rent or sublease certain real estate to third parties. Our sublease portfolio mainly consists of operating leases for eachspace within our office facilities.
In 2021, we sold the office building, land, and fixed assets of our St. Petersburg, Florida facility for $40 million, less fees and expenses, resulting in a gain on the sale of $19.1 million, which was recognized in the consolidated statements of operations within general and administrative expense. Upon the sale of the periods:building, we entered into a two year agreement to lease a portion of the building as of the sale date.
Supplemental balance sheet information related to leases was as follows:
Lease Type |
| Balance Sheet Classification |
| December 31, 2023 |
|
| December 31, 2022 |
| ||
|
|
|
| (In millions) |
| |||||
ASSETS |
|
|
|
|
|
|
|
| ||
Operating lease assets |
| Trade and other receivables, net |
| $ | 0.9 |
|
| $ | 0.1 |
|
Operating lease assets |
| Prepaid expenses and other current assets |
|
| 2.3 |
|
|
| 2.8 |
|
Operating lease assets |
| Right of use lease assets, net |
|
| 19.1 |
|
|
| 24.3 |
|
Financing lease assets |
| Property, plant, and equipment, net |
|
| 5.8 |
|
|
| 7.0 |
|
Total lease assets |
|
|
| $ | 28.1 |
|
| $ | 34.2 |
|
LIABILITIES |
|
|
|
|
|
|
|
| ||
Financing lease liabilities |
| Current portion of long-term debt |
| $ | 0.8 |
|
| $ | 1.0 |
|
Operating lease liabilities |
| Current portion of long-term lease liabilities |
|
| 7.0 |
|
|
| 10.0 |
|
Financing lease liabilities |
| Long-term debt, less current portion |
|
| 6.5 |
|
|
| 7.4 |
|
Operating lease liabilities |
| Long-term lease liabilities, less current portion |
|
| 18.9 |
|
|
| 23.7 |
|
Total lease liabilities |
|
|
| $ | 33.2 |
|
| $ | 42.1 |
|
|
| Year Ended December 31, |
| |||||||||
|
| 2018 |
|
| 2017 |
|
| 2016 |
| |||
Balance at beginning of year |
| $ | 1.3 |
|
| $ | 1.8 |
|
| $ | 1.1 |
|
Provision for doubtful accounts |
|
| 0.7 |
|
|
| 0.2 |
|
|
| 1.1 |
|
Charge-offs, net of recoveries |
|
| (0.7 | ) |
|
| (0.7 | ) |
|
| (0.4 | ) |
Balance at end of year |
| $ | 1.3 |
|
| $ | 1.3 |
|
| $ | 1.8 |
|
69 | 2023 Form 10-K
The components of lease expense were as follows:
|
| Year Ended December 31, |
| |||||||||
|
| 2023 |
|
| 2022 |
|
| 2021 |
| |||
Lease Cost |
| (In millions) |
| |||||||||
Operating lease cost |
| $ | 8.8 |
|
| $ | 9.8 |
|
| $ | 6.1 |
|
Financing lease cost: |
|
|
|
|
|
|
|
|
| |||
Depreciation of lease assets |
|
| 1.7 |
|
|
| 1.3 |
|
|
| 1.3 |
|
Interest on lease liabilities |
|
| 0.3 |
|
|
| 0.3 |
|
|
| 0.3 |
|
Sublease income |
|
| (0.4 | ) |
|
| (0.5 | ) |
|
| (2.2 | ) |
Total lease cost, net |
| $ | 10.4 |
|
| $ | 10.9 |
|
| $ | 5.5 |
|
Supplemental cash flow information related to leases was as follows:
|
| Year Ended December 31, |
| |||||
|
| 2023 |
|
| 2022 |
| ||
|
| (In millions) |
| |||||
Cash paid for amounts included in the measurement of lease liabilities: |
|
|
|
|
|
| ||
Operating cash flows from operating leases |
| $ | 8.1 |
|
| $ | 8.7 |
|
Operating cash flows from finance leases |
|
| 0.3 |
|
|
| 0.3 |
|
Financing cash flows from finance leases |
|
| 2.0 |
|
|
| 1.6 |
|
Lease assets obtained in exchange for new lease liabilities: |
|
|
|
|
|
| ||
Operating leases |
|
| 1.9 |
|
|
| 7.8 |
|
The future minimum lease payments under our operating and financing leases were as follows:
Year Ended December 31, |
| Amount |
| |
|
| (In millions) |
| |
2024 |
| $ | 10.1 |
|
2025 |
|
| 8.3 |
|
2026 |
|
| 6.5 |
|
2027 |
|
| 4.1 |
|
2028 |
|
| 3.2 |
|
Thereafter |
|
| 5.1 |
|
Total lease payments |
| $ | 37.3 |
|
Less: Interest |
|
| (4.1 | ) |
Total |
| $ | 33.2 |
|
Weighted average remaining lease term and weighted average discount rate were as follows:
|
|
|
| December 31, |
| |||||
|
|
|
| 2023 |
|
| 2022 |
| ||
Weighted average remaining lease term (in years) |
|
|
|
|
| |||||
Operating leases |
|
|
|
| 4.0 |
|
|
| 3.6 |
|
Financing leases |
|
|
|
| 7.6 |
|
|
| 8.3 |
|
Weighted average discount rate |
|
|
|
|
|
|
|
| ||
Operating leases |
|
|
|
| 5.06 | % |
|
| 4.34 | % |
Financing leases |
|
|
|
| 3.91 | % |
|
| 3.88 | % |
70 | 2023 Form 10-K
7. Property, Plant, and Equipment, Net
Property, plant, and equipment, net consist of the following:
|
| December 31, |
| |||||||||||||
|
| 2018 |
|
| 2017 |
|
| December 31, |
| |||||||
Land |
| $ | 7.5 |
|
| $ | 7.5 |
| ||||||||
|
| 2023 |
|
| 2022 |
| ||||||||||
|
| (In millions) |
| |||||||||||||
Software |
|
| 225.0 |
|
|
| 197.4 |
|
| $ | 536.6 |
|
| $ | 449.4 |
|
Machinery and equipment |
|
| 117.5 |
|
|
| 120.3 |
|
|
| 130.0 |
|
|
| 126.4 |
|
Buildings and improvements |
|
| 40.5 |
|
|
| 36.3 |
|
|
| 44.9 |
|
|
| 41.8 |
|
Total property, plant and equipment |
|
| 390.5 |
|
|
| 361.5 |
| ||||||||
Total property, plant, and equipment |
|
| 711.5 |
|
|
| 617.6 |
| ||||||||
Accumulated depreciation |
|
| (286.1 | ) |
|
| (259.5 | ) |
|
| (501.4 | ) |
|
| (442.7 | ) |
Property, plant and equipment, net |
| $ | 104.4 |
|
| $ | 102.0 |
| ||||||||
Property, plant, and equipment, net |
| $ | 210.1 |
|
| $ | 174.9 |
| ||||||||
Depreciation expense ofrelated to property, plant, and equipment, totaled $38.1, $35.3,net was $72.0 million, $58.1 million, and $34.8$53.6 million for the years ended December 31, 2018, 2017,2023, 2022, and 2016,2021, respectively.
8. Goodwill and Intangible Assets
Goodwill
GoodwillOur goodwill balance was $2,293.9 million and changes therein were$2,280.0 million as follows for the years endedof December 31, 2018,2023 and 2017:2022, respectively. The change in goodwill was due to fluctuations in foreign currency exchange rates. Tax-deductible goodwill at December 31, 2023 was $46.5 million.
Balance at December 31, 2016 |
| $ | 1,933.1 |
|
Translation |
|
| 27.9 |
|
Balance at December 31, 2017 |
|
| 1,961.0 |
|
Translation |
|
| (33.6 | ) |
Balance at December 31, 2018 |
| $ | 1,927.4 |
|
Tax-deductible goodwill at December 31, 2018 |
| $ | 10.6 |
|
We perform an impairment assessment of our goodwill balances as of October 1 of each year. Goodwill impairment testing is performed at the reporting unit level, which is the operating segment level or one level below. After consideration of the LifeWorks Disposition, management has concluded that we have one reporting unit. Please refer to Note 3, “Discontinued Operations,” for further discussion of the LifeWorks Disposition.
We performed a qualitative impairment testassessment as of October 1, 2018,2023 and concluded that it is not more likely than not that the fair value of our reporting unit is lessmore than its carrying amount.
Intangible Assets
Other intangible assets, net consist of the following asfollowing:
|
| December 31, 2023 |
| |||||||||||||
|
| Gross Carrying |
|
| Accumulated |
|
| Net |
|
| Weighted Average Remaining Amortization Period |
| ||||
|
| (In millions) |
|
| (In years) |
| ||||||||||
Customer lists and relationships |
| $ | 302.3 |
|
| $ | (239.5 | ) |
| $ | 62.8 |
|
|
| 6.6 |
|
Trade name |
|
| 183.6 |
|
|
| (41.9 | ) |
|
| 141.7 |
|
|
| 1.6 |
|
Technology |
|
| 227.5 |
|
|
| (201.8 | ) |
|
| 25.7 |
|
|
| 2.3 |
|
Total other intangible assets |
| $ | 713.4 |
|
| $ | (483.2 | ) |
| $ | 230.2 |
|
|
| 3.2 |
|
|
| December 31, 2022 |
| |||||||||||||
|
| Gross Carrying |
|
| Accumulated |
|
| Net |
|
| Weighted Average Remaining Amortization Period |
| ||||
|
| (In millions) |
|
| (In years) |
| ||||||||||
Customer lists and relationships |
| $ | 299.8 |
|
| $ | (228.6 | ) |
| $ | 71.2 |
|
|
| 7.4 |
|
Trade name |
|
| 183.4 |
|
|
| (4.7 | ) |
|
| 178.7 |
|
|
| 2.2 |
|
Technology |
|
| 213.5 |
|
|
| (181.8 | ) |
|
| 31.7 |
|
|
| 3.2 |
|
Total other intangible assets |
| $ | 696.7 |
|
| $ | (415.1 | ) |
| $ | 281.6 |
|
|
| 6.1 |
|
71 | 2023 Form 10-K
Table of December 31, 2018:Contents
|
| Gross Carrying Amount |
|
| Accumulated Amortization |
|
| Net |
|
| Estimated Life Range (Years) |
| ||||
Customer lists and relationships |
| $ | 205.4 |
|
| $ | (190.2 | ) |
| $ | 15.2 |
|
| 5-15 |
| |
Tradename |
|
| 173.5 |
|
|
| (1.9 | ) |
|
| 171.6 |
|
|
| — |
|
Technology |
|
| 152.2 |
|
|
| (151.5 | ) |
|
| 0.7 |
|
| 3-4 |
| |
Total other intangible assets |
| $ | 531.1 |
|
| $ | (343.6 | ) |
| $ | 187.5 |
|
|
|
|
|
We perform an impairment assessmentIn the third quarter of 2023, our tradeBoard of Directors approved plans to transition our Company’s name intangible assets as of October 1 of each year. We performed the relief from royalty method impairment test as of October 1, 2018, and concluded that the fair value of our trade name intangible assets exceeded their respective carrying amount. We continue to evaluate the use of our trade names and branding in our sales and marketing efforts. If there is a fundamental shift into Dayforce, Inc. Given the methodsignificance of our branding in the future,this transition, we will assessassessed the impact on the carrying amount of $167.2 million related to our Ceridian trade name intangible assets andasset to determine whether an impairment exists. If itexists, and/or if the asset is deemed to have a finite life and should be amortized. It was determined that an impairment has occurred,the Ceridian trade name was not impaired, but the asset was deemed to have a non-cash expense would be recognized duringfinite life of two years and began being amortized in the period in which the decision was made to make the fundamental shift. third quarter of 2023.
Other intangible assets consist of the following as of December 31, 2017:
|
| Gross Carrying Amount |
|
| Accumulated Amortization |
|
| Net |
|
| Estimated Life Range (Years) |
| ||||
Customer lists and relationships |
| $ | 210.1 |
|
| $ | (177.0 | ) |
| $ | 33.1 |
|
| 5-15 |
| |
Tradename |
|
| 174.1 |
|
|
| (2.1 | ) |
|
| 172.0 |
|
|
| — |
|
Technology |
|
| 155.6 |
|
|
| (154.2 | ) |
|
| 1.4 |
|
| 2-7 |
| |
Total other intangible assets |
| $ | 539.8 |
|
| $ | (333.3 | ) |
| $ | 206.5 |
|
|
|
|
|
Amortization expense related to definite-lived intangible assets was $18.5, $18.5,$60.5 million, $30.9 million, and $18.4$23.9 million for the years ended December 31, 2018, 2017,2023, 2022, and 2016,2021, respectively. We estimate the future amortization of other intangible assets held at December 31, 2018, will be:as follows:
Years Ending December 31, |
| Amount |
| |
|
| (In millions) |
| |
2024 |
| $ | 103.9 |
|
2025 |
|
| 73.1 |
|
2026 |
|
| 13.0 |
|
2027 |
|
| 9.1 |
|
2028 |
|
| 8.8 |
|
Thereafter |
|
| 17.7 |
|
Long-Lived Assets by Geographic Area
Years Ending December 31, |
| Amount |
| |
2019 |
| $ | 15.2 |
|
2020 |
|
| 0.2 |
|
2021 |
|
| 0.2 |
|
2022 |
|
| 0.2 |
|
2023 |
| $ | 0.1 |
|
Long-lived assets consist of right of use lease assets, net, property, plant and equipment, net, goodwill, and other intangible assets, net. Long-lived assets by country consist of the following:
|
| December 31, |
| |||||
|
| 2023 |
|
| 2022 |
| ||
|
| (In millions) |
| |||||
United States |
| $ | 1,796.8 |
|
| $ | 1,803.5 |
|
Canada |
|
| 526.7 |
|
|
| 507.4 |
|
Australia |
|
| 244.4 |
|
|
| 259.3 |
|
Other |
|
| 185.4 |
|
|
| 190.6 |
|
Total long-lived assets |
| $ | 2,753.3 |
|
| $ | 2,760.8 |
|
Overview
Set forth below is a description of certain debt facilities for which Ceridian was obligated during the periods covered by these consolidated financial statements. Our debt obligations consist of the following:
|
| December 31, |
|
| December 31, |
| ||
|
| 2023 |
|
| 2022 |
| ||
|
| (In millions) |
| |||||
Term Debt, interest rate of 8.0% and 6.9%, respectively |
| $ | 644.3 |
|
| $ | 651.1 |
|
Revolving Credit Facility ($300.0 million available capacity less $1.3 million and $1.4 million, respectively, reserved for letters of credit) |
|
| — |
|
|
| — |
|
Convertible Senior Notes, interest rate of 0.25% |
|
| 575.0 |
|
|
| 575.0 |
|
Line of Credit ($0.5 million and $1.0 million letter of credit capacity, respectively, which were fully utilized) |
|
| — |
|
|
| — |
|
Financing lease liabilities (Note 6) |
|
| 7.3 |
|
|
| 8.4 |
|
Total debt |
|
| 1,226.6 |
|
|
| 1,234.5 |
|
Less unamortized discount on Term Debt |
|
| 0.4 |
|
|
| 0.6 |
|
Less unamortized debt issuance costs on Term Debt and Convertible Senior Notes |
|
| 8.5 |
|
|
| 12.7 |
|
Less current portion of long-term debt |
|
| 7.6 |
|
|
| 7.8 |
|
Long-term debt, less current portion |
| $ | 1,210.1 |
|
| $ | 1,213.4 |
|
Accrued interest and fees related to our debt obligations were $0.9 million and $0.7 million as of December 31, 2023 and 2022, respectively, and are included within other accrued expenses in our consolidated balance sheets.
|
| December 31, |
| |||||
|
| 2018 |
|
| 2017 |
| ||
Term Debt, interest rate of 5.8% and 5.1% as of December 31, 2018 and 2017, respectively |
| $ | 678.3 |
|
| $ | 657.3 |
|
Senior Notes, interest rate of 11.0% as of December 31, 2017 |
|
| — |
|
|
| 475.0 |
|
Revolving Credit Facility ($300.0 available capacity less amounts reserved for letters of credit, which were $2.7 as of December 31, 2018, and $130.0 available capacity less amounts reserved for letters of credit, which were $2.9 as of December 31, 2017) |
|
| — |
|
|
| — |
|
Canada Line of Credit (CDN $7.0 available capacity as of December 31, 2018 and 2017; USD $5.1 as of December 31, 2018 and USD $5.6 as of December 31, 2017) |
|
| — |
|
|
| — |
|
Total debt |
|
| 678.3 |
|
|
| 1,132.3 |
|
Less unamortized discount on Term Debt |
|
| 1.7 |
|
|
| 0.9 |
|
Less unamortized debt issuance costs on Senior Notes and Term Debt |
|
| 6.3 |
|
|
| 11.6 |
|
Less current portion of long-term debt |
|
| 6.8 |
|
|
| — |
|
Long-term debt, less current portion |
| $ | 663.5 |
|
| $ | 1,119.8 |
|
72 | 2023 Form 10-K
Senior Secured Credit Facilities
Principal Amounts and Maturity Dates
On November 14, 2014, the 2014 Senior Secured Credit Facility was put into place, consisting of (i) a $702.0 term loan debt facility (the “2014 Term Debt”)
Principal Amounts, Interest, and (ii) a $130.0 revolving credit facility (the “2014 Revolving Credit Facility”). As of December 31, 2017, the 2014 Term Debt had a maturity date of September 2020, and the 2014 Revolving Credit Facility had a maturity date of September 2019. The 2014 Term Debt required quarterly principal payments of 0.25% of the original principal amount. Ceridian made mandatory pre-payments towards the principal balance of the 2014 Term Debt with the proceeds received from the sale of the UK Business during the years ended December 31, 2018, and 2017, of $0.3 and $25.9, respectively. These pre-payments were applied against the scheduled quarterly principal payments.Maturity Dates
On April 30, 2018, Ceridianwe completed the refinancing of the remainingour debt under the 2014 Senior Secured Credit Facility by entering into a new credit agreement. Pursuant to the terms of the new credit agreement, Ceridianwe became borrower of (i) a $680.0$680.0 million term loan debt facility (the “2018 Term“Term Debt”) and (ii) a $300.0$300.0 million revolving credit facility (the “2018 Revolving“Revolving Credit Facility”) (collectively, and collectively with the “2018 SeniorTerm Debt, the “Senior Secured Credit Facility”). The 2018Our obligations under the Senior Secured Credit Facility isare secured by first priority security interests in substantially all of our assets of Ceridian.and the domestic subsidiary guarantors, subject to permitted liens and certain exceptions.
In connection with the refinancingThe Term Debt and Revolving Credit Facility were set to mature on April 30, 2025 and January 29, 2025, respectively. We are required to make annual amortization payments in respect of the 2014Term Debt in an amount equal to 1.00% of the original principal amount thereof, payable in equal quarterly installments of 0.25% of the original principal amount of the first lien term debt. The Revolving Credit Facility does not require amortization payments. On August 1, 2023, we completed the third amendment to our Senior Secured Credit Facility, we recognized a loss on debt extinguishmentwhich replaced the London Interbank Offered Rate ("LIBOR") with Secured Overnight Financing Rate ("SOFR") as the reference rate for the floating rate Term Debt interest rate. As of $7.1 within interest expense, net on our consolidated statement of operations during the year ended December 31, 2018.
Interest
The effective interest2023, our floating rate on the 2014 Term Debt at December 31, 2017interest was 5.1%. The 2014SOFR plus 2.5% and the applicable Term Debt had an interest rate of LIBOR plus 3.5%SOFR Adjustment ranged from approximately 0.1% to 0.4%, subject to a 1.0% LIBOR floor.depending on term.
The effective interest rate on the 2018 Term Debt at December 31, 2018 was 5.8%. The 2018 Term Debt is currently subject to an interest rate of LIBOR plus 3.25%. In the event our corporate rating from Moody’s Investors Service, Inc. is B2 or better, the interest rate is reduced to LIBOR plus 3.00%, so long as the rating is maintained.
Financing Costs and Issuance Discounts
The 2014 Term Debt had associated unamortized deferred financing costs of $5.4$2.1 million and $3.7 million at December 31, 2017 which were being amortized at the effective interest rate of 4.8%.
In connection with the refinancing of the 2014 Senior Secured Credit Facility, we capitalized $3.6 of additional financing costs2023, and wrote off $0.5 of existing unamortized deferred financing costs, which was included in the loss on extinguishment of debt. The 2018 Term Debt had associated unamortized deferred financing costs of $8.0 at December 31, 2018,2022, respectively, which are being amortized at an effective interest rate of 5.3%5.3%.
Collateral and Guarantees
The 2018 Senior Secured Credit Facility names Ceridianus as the sole borrower and is unconditionally guaranteed by Ceridian’sour domestic, wholly-owned financially material restricted subsidiaries, subject to certain customary exceptions. The 2018 Senior Secured Credit Facility is secured by a perfected first priority security interest, subject to certain exceptions (including customer trust funds), in substantially all of Ceridian’sour and the subsidiary guarantors’ tangible and intangible assets. The security interest includes a pledge of the capital stock of certain of Ceridian’sour direct and indirect material restricted subsidiaries.
Representations, Warranties and Covenants
The documents governing the 2018 Senior Secured Credit Facility contain certain customary representations and warranties. In addition, those documents contain customary covenants restricting Ceridian’sour ability and certain of itsour subsidiaries’ ability to, among other things: incur additional indebtedness, issue disqualified stock and preferred stock; create liens; declare dividends; redeem capital stock; make investments; engage in a materially different line of business; engage in certain mergers, consolidations, acquisitions, asset sales, or other fundamental changes; engage in certain transactions with affiliates; enter into certain restrictive agreements; make prepayments on any subordinated indebtedness; modify junior financing documentation; and make changes to our fiscal year.
The 2018 Senior Secured Credit Facility documents contain a requirement that Ceridianwe maintain a ratio of adjusted first lien debt to Credit Facility EBITDA below specified levels on a quarterly basis; however, such requirement is applicable only if more than 35% of the 2018 Revolving Credit Facility is drawn. As of December 31, 2018,2023, no portion of the 2018 Revolving Credit Facility was drawn.
Events of Default
Events of default under the 2018 Senior Secured Credit Facility documents include, but are not limited to: failure to pay interest, principal and fees, or other amounts when due; material breach of any representation or warranty; covenant defaults; cross defaults to other material indebtedness; events of bankruptcy, invalidity of security interests; a change of control; material judgments for payment of money; involuntary acceleration of any debt; and other customary events of default. There were no events of default as of December 31, 2018.2023.
73 | 2023 Form 10-K
Convertible Senior Notes
General Description
On October 1, 2013, CeridianIn March 2021, we issued the$575.0 million in aggregate principal amount of 0.25% Convertible Senior Notes due 2026 in a private offering to qualified institutional buyers pursuant to Rule 144A promulgated under the Securities Act of 1933, as amended, and pursuant to exemptions from the prospectus requirements of applicable Canadian securities laws, including the exercise in full by the initial purchasers of their option to purchase an additional $75.0 million in aggregate principal amount of 0.25% Convertible Senior Notes due 2026 (collectively, the “Convertible Senior Notes”). The Convertible Senior Notes bear interest at a rate of 0.25% per year and interest is payable semiannually in arrears on March 15 and September 15 of each year, beginning on September 15, 2021. The Convertible Senior Notes mature on March 15, 2026, unless earlier converted, redeemed or repurchased. The total net proceeds from the offering, after deducting initial purchase discounts and other debt issuance costs, were $561.8 million.
The Convertible Senior Notes are unsecured obligations and do not contain any financial covenants or restrictions on the payments of dividends, the incurrence of indebtedness or the issuance or repurchase of securities by us or any of our subsidiaries.
The following table presents details of the Convertible Senior Notes:
|
| Initial Conversion Rate per $1,000 Principal |
| Initial Conversion Price per Share |
| |
|
|
|
|
|
| |
Convertible Senior Notes |
| 7.5641 shares |
| $ | 132.20 |
|
The Convertible Senior Notes will be convertible at the option of the holders at any time only under the following circumstances:
Upon conversion, we may satisfy the conversion obligation by paying or delivering, as applicable, cash, shares of our common stock or a combination of cash and shares of our common stock, at our election, in the manner and subject to the terms and conditions provided in the Indenture under which the Convertible Senior Notes were issued. On December 30, 2021, we notified the holders of the Convertible Senior Notes of our irrevocable election to settle the conversion obligations in connection with the Convertible Senior Notes submitted for conversion on or after January 1, 2022, or at maturity with a combination of cash and shares of our common stock. Generally, under this settlement method, the conversion value will be settled in cash in an amount no less than the principal amount being converted, and any excess of the conversion value over the principal amount will be settled, at the Company's election, in cash or shares of our common stock. The conditions allowing holders of the Convertible Senior Notes to convert have not been met and therefore were not convertible as of December 31, 2023.
74 | 2023 Form 10-K
We may not redeem the Convertible Senior Notes prior to March 20, 2024. On or after March 20, 2024, and on or before the 30th scheduled trading day immediately preceding the maturity date, we may redeem the Convertible Senior Notes at a cash purchase price equal to the principal amount of $475.0.
Using the net proceeds received from the IPO and concurrent private placement, we satisfied and discharged the indenture governing theConvertible Senior Notes to be redeemed, plus accrued and unpaid interest, if any, but only if the last reported sale price per share of our common stock exceeds 130% of the conversion price on April (1) each of at least 20 trading days, whether or not consecutive, during the 30 2018, consecutive trading days ending on, and including, the trading day immediately before the date we send the related redemption notice; and (2) the trading day immediately before the date we send such notice. In addition, calling any Convertible Senior Note for redemption will constitute a make-whole fundamental change with respect to that Convertible Senior Note, in which case the conversion rate applicable to the conversion of that Convertible Senior Note will be increased in certain circumstances if it is converted after it is called for redemption.
If a “fundamental change” (as defined in the Indenture under which the Convertible Senior Notes were redeemed on May 30, 2018. In connection withissued) occurs, then noteholders may require us to repurchase their Convertible Senior Notes at a cash repurchase price equal to the redemptionprincipal amount of the Convertible Senior Notes we recognizedto be repurchased, plus accrued and unpaid interest, if any.
The Convertible Senior Notes are accounted for as a loss on extinguishmentsingle liability, and the carrying amount of debt of $18.6 within interest expense, net on our consolidated statement of operations during the year ended December 31, 2018.
Interest
The interest rate on theConvertible Senior Notes was fixed at 11.0%$568.2 million as of December 31, 2017.
Financing Costs and Issuance Discounts
2023, with principal of $575.0 million, net of issuance costs of $6.8 million. The Convertible Senior Notes had unamortized deferred financing costsare included within long-term debt, less current portion in our consolidated balance sheets as of $6.2 at December 31, 2017, which were2023. The issuance costs related to the Convertible Senior Notes are being amortized to interest expense over the contractual term of the Convertible Senior Notes at an effective interest rate of 11.45%5.1%. On May 30, 2018,
The following table sets forth total interest expense recognized related to the redemption date, theConvertible Senior Notes had unamortizedfor the period:
|
|
| Year Ended December 31, |
| |||||||||
|
|
| 2023 |
|
| 2022 |
|
| 2021 |
| |||
|
| (Dollars in millions) |
| ||||||||||
Contractual interest expense |
|
| $ | 1.4 |
|
| $ | 1.5 |
|
| $ | 1.2 |
|
Amortization of debt discount (a) |
|
|
| — |
|
|
| — |
|
|
| 14.0 |
|
Amortization of debt issuance costs (a) |
|
|
| 2.8 |
|
|
| 3.1 |
|
|
| 1.7 |
|
Total |
|
| $ | 4.2 |
|
| $ | 4.6 |
|
| $ | 16.9 |
|
Capped Calls
In March 2021, in connection with the pricing of the Convertible Senior Notes, we entered into capped call transactions with the option counterparties (the “Capped Calls”). The Capped Calls each have an initial strike price of $132.20 per share, and an initial cap price of $179.26 per share, both subject to certain adjustments. The capped call transactions are generally expected to reduce potential dilution to our common stock upon any conversion of the Convertible Senior Notes and/or offset any potential cash payments we would be required to make in excess of the principal amount of converted Convertible Senior Notes, as the case may be, with such reduction and/or offset subject to a cap based on the cap price. For accounting purposes, the Capped Calls are separate transactions, and not part of the terms of the Convertible Senior Notes. As the Capped Calls qualify for a scope exception from derivative accounting for instruments that are both indexed to the issuer's own stock and classified in stockholder’s equity in our consolidated balance sheet, we have recorded an amount of $33.0 million as a reduction to additional paid-in capital, which will not be remeasured. This represents the premium of $45.0 million paid for the purchase of the Capped Calls, net of the deferred financing coststax impact of $5.5, which were written off and included in the loss on extinguishment$12.0 million.
75 | 2023 Form 10-K
Other Information Relating to Indebtedness
Future Payments and Maturities of Debt
The future principal payments and maturities of our indebtedness, excluding financing lease obligations, are as follows:
Years Ending December 31, |
| Amount |
| |
|
| (Dollars in millions) |
| |
2024 |
| $ | 6.8 |
|
2025 |
|
| 637.5 |
|
2026 |
|
| 575.0 |
|
| $ | 1,219.3 |
| |
Years Ending December 31, |
| Amount |
| |
2019 |
| $ | 6.8 |
|
2020 |
|
| 6.8 |
|
2021 |
|
| 6.8 |
|
2022 |
|
| 6.8 |
|
2023 |
|
| 6.8 |
|
Thereafter |
|
| 644.3 |
|
|
| $ | 678.3 |
|
CeridianWe may be required to make additional payments on the 2018 Term Debt from various sources, including proceeds of certain indebtedness which may be incurred from time to time, certain asset sales, and a certain percentage of cash flow. There is an excess cash flow calculation associated with the 2018 Term Debt, commencing withand based on this calculation, we are not required to make a prepayment on the year ending December 31, 2019.Term Debt in 2024.
Fair Value of Debt
Our debt does not trade in active markets. Basedmarkets and was considered to be a Level 2 measurement at December 31, 2023. The fair value of the Term Debt was based on the borrowing rates currently available to us for bank loans with similar terms and average maturities and the limited trades of our debt,debt. The fair value of the Convertible Senior Notes was determined based on the closing trading price per $1,000 of the Convertible Senior Notes as of the last day of trading for the period and is primarily affected by the trading price of our common stock and market interest rates. The fair value of our indebtednessdebt was estimated to be $649.5$1.16 billion and $1,154.1$1.14 billion as of December 31, 2018,2023, and 2017,2022, respectively.
Other Debt Financing
Ceridian Canada had available at December 31, 2018, and 2017, a committed bank credit facility that provides up to CDN $7.0, for issuance of letters of credit, and it is a discretionary line at the option of the bank. The amounts of letters of credit outstanding under this facility were CDN $7.0 (USD $5.1) and CDN $7.0 (USD $5.6) at December 31, 2018, and 2017, respectively.
10. Employee Benefit Plans
Ceridian maintainsWe maintain numerous benefit plans for current and former employees. As of December 31, 2018,2023, our current active benefit plans include defined contributionscontribution plans for substantially allthe majority of our employees. All of our defined benefit plans have been frozen.
Defined Contribution Plans
Ceridian maintainsWe maintain defined contribution plans that provide retirement benefits to substantially allthe majority of our employees. Contributions are based upon the contractual obligations of each respective plan. We recognized expense of $8.4, $7.5,$28.2 million, $23.0 million, and $7.0$15.4 million for the years ended December 31, 2018, 2017,2023, 2022, and 2016,2021, respectively, with regardrelated to employer contributions to these plans.
Defined Benefit Plans
Ceridian maintainsWe maintain defined benefit pension plans covering certain of our current and former U.S. employees (the U.S. defined benefitpension plan and nonqualified defined benefit plan, collectively referred to as our “defined benefit plans”), as well as other postretirement benefit plans for certain U.S. retired employees that include heath care and life insurance benefits.
76 | 2023 Form 10-K
The largest defined benefit pension plan (the “U.S. defined benefitpension plan”) is a defined benefit plan for certain current and former U.S. employees that closed to new participants on January 2, 1995. In 2007, the U.S. defined benefitpension plan was amended (1) to exclude from further participation any participant or former participant who was not employed by the ParentCeridian or another participating employer on January 1, 2008, (2) to discontinue participant contributions, and (3) to freeze the accrual of additional benefits as of December 31, 2007. The measurement date for pension benefit plans is December 31.
Assets of the U.S. defined benefitpension plan are held in an irrevocable trust and do not include any Ceridian securities. Benefits under this plan are generally calculated on final or career average earnings and years of participation in the plan. Most participating employees were required to permit salary reduction contributions to the plan on their behalf by the employer as a condition of active participation. Retirees and other former employees are inactive participants in this plan and constitute approximately 99%99% of the plan participants. This plan is funded in accordance with funding requirements under the Employee Retirement Income Security Act of 1974, based on determinations of a third-party consulting actuary. Investment of the U.S. defined benefitpension plan assets in Ceridian securities is prohibited by the investment policy. We madedid not make any contributions amounting to $18.5 in 20182023 to the U.S. defined benefit plan. The required minimumplan and we do not expect to make any contributions in 2024.
In addition to the U.S. defined benefit plan, are expected to be $6.4 during 2019.
Ceridianwe also sponsorssponsor a nonqualified supplemental defined benefit plan (the “nonqualified defined benefit plan”), which is unfunded and provides benefits to selected U.S. employees in addition to the U.S. defined benefit plan.employees. We made contributions to the nonqualified defined benefit plan amounting to $1.9$1.3 million in 20182023 and expect to make contributions of $1.7 during 2019.$1.2 million in 2024.
We account for our defined benefit plans using actuarial models. These models use an attribution approach that generally spreads the effect of individual events over the estimated life expectancy of the employees in such plans. These events include plan amendments and changes in actuarial assumptions such as the expected long-term rate of return on plan assets, discount rate related to the benefit obligation, and mortality rates.
One of the principal components of the net periodic pension calculation is the expected long-term rate of return on plan assets. The required use of expected long-term rate of return on plan assets may result in recognized pension income that is greater or less than the actual returns of those plan assets in any given year. Over time, however, the expected long-term returns are designed to approximate the actual long-term returns that contribute to the settlement of the liability. Differences between actual and expected returns are recognized in the net periodic pension calculation over three years. We use long-term historical actual return information, the mix of investments that comprise plan assets, and future estimates of long-term investment returns by reference to external sources to develop our expected return on plan assets.
The discount rate assumption is used to determine the benefit obligation and the interest portion of the net periodic pension cost (credit) for the following year. We utilize a full yield curve approach for our discount rate assumption by applying the specific spot rates along the yield curve used in the determination of the benefit obligation to the relevant projected cash flows. As of December 31, 2018,2023, a 25 basis point decrease in the discount rate would result in a $0.1 decreasean immaterial impact to expense for all pension plans.
At December 31, 2017,2023, we updated ourincorporated white collar adjustments to the baseline mortality assumptions utilizing an improvement scaleassumption as issued by the Society of ActuariesActuaries. The change in October 2017, whichmortality assumption resulted in a $6.0 reduction$13.0 million increase in the projected benefit obligation. AtThe mortality assumption was not updated at December 31, 2018, we updated our mortality assumptions utilizing an improvement scale issued by the Society of Actuaries in October 2018, which resulted in a $1.5 reduction in the projected benefit obligation.2022.
The funded status of defined benefit plans represents the difference between the projected benefit obligation (“PBO”) and the plan assets at fair value. The projected benefit obligationPBO of defined benefit plans exceeded the fair value of plan assets by $145.8$21.5 million and $154.4$11.1 million at December 31, 20182023 and 2017,2022, respectively. We are required to record the unfundedfunded status as aan asset or liability in our consolidated balance sheets and recognize the change in the funded status in comprehensive income, net of deferred income taxes.
77 | 2023 Form 10-K
The projected future payments to participants from defined benefit plans are included in the table below.as follows:
Years Ending December 31, |
| Amount |
| |
|
| (In millions) |
| |
2024 |
| $ | 41.2 |
|
2025 |
|
| 39.3 |
|
2026 |
|
| 37.4 |
|
2027 |
|
| 35.8 |
|
2028 |
|
| 34.7 |
|
Next five years |
|
| 143.7 |
|
Years Ending December 31, |
| Amount |
| |
2019 |
| $ | 46.0 |
|
2020 |
|
| 45.0 |
|
2021 |
|
| 44.0 |
|
2022 |
|
| 42.7 |
|
2023 |
|
| 41.5 |
|
Next five years |
| $ | 183.5 |
|
The accompanying tables reflect the combined funded status and net periodic pension cost and combined supporting assumptions for the defined benefit elements of our defined benefit plans.
|
| Year Ended December 31, |
| |||||
|
| 2023 |
|
| 2022 |
| ||
|
| (In millions) |
| |||||
Funded Status of Defined Benefit Retirement Plans at Measurement Date |
|
|
|
|
|
| ||
Change in Projected Benefit Obligation During the Year: |
|
|
|
|
|
| ||
Projected benefit obligation at beginning of year |
| $ | 383.5 |
|
| $ | 503.4 |
|
Interest cost |
|
| 17.1 |
|
|
| 8.8 |
|
Actuarial loss (gain) |
|
| 21.5 |
|
|
| (83.1 | ) |
Benefits paid and plan expenses |
|
| (43.3 | ) |
|
| (45.6 | ) |
Projected benefit obligation at end of year |
| $ | 378.8 |
|
| $ | 383.5 |
|
Change in Fair Value of Plan Assets During the Year: |
|
|
|
|
|
| ||
Plan assets at fair value at beginning of year |
|
| 372.4 |
|
|
| 505.0 |
|
Actual return on plan assets |
|
| 26.9 |
|
|
| (88.4 | ) |
Employer contributions |
|
| 1.3 |
|
|
| 1.4 |
|
Benefits paid and plan expenses |
|
| (43.3 | ) |
|
| (45.6 | ) |
Plan assets at fair value at end of year |
|
| 357.3 |
|
|
| 372.4 |
|
Funded status of plans |
| $ | (21.5 | ) |
| $ | (11.1 | ) |
|
| December 31, |
| |||||
|
| 2023 |
|
| 2022 |
| ||
|
| (In millions) |
| |||||
Amounts recognized in Consolidated Balance Sheets |
|
|
|
|
|
| ||
Current liability |
| $ | 1.2 |
|
| $ | 1.2 |
|
Noncurrent liability |
|
| 20.3 |
|
|
| 9.9 |
|
Amounts recognized in Accumulated Other Comprehensive Loss |
|
|
|
|
|
| ||
Accumulated other comprehensive loss, net of tax of $53.5 million and $51.2 million, respectively |
| $ | 170.1 |
|
| $ | 163.6 |
|
The overall decrease in our benefit obligation for the year ended December 31, 2023 was primarily driven by benefit payments paid and plan expenses, partially offset by the actuarial loss.
|
| Year Ended December 31, |
| |||||
|
| 2018 |
|
| 2017 |
| ||
Funded Status of Defined Benefit Retirement Plans at Measurement Date |
|
|
|
|
|
|
|
|
Change in Projected Benefit Obligation During the Year: |
|
|
|
|
|
|
|
|
Projected benefit obligation at beginning of year |
| $ | 593.0 |
|
| $ | 605.9 |
|
Service cost |
|
| — |
|
|
| — |
|
Interest cost |
|
| 16.3 |
|
|
| 17.2 |
|
Actuarial (gain) loss |
|
| (31.6 | ) |
|
| 20.3 |
|
Benefits paid and plan expenses |
|
| (50.3 | ) |
|
| (50.4 | ) |
Projected benefit obligation at end of year |
| $ | 527.4 |
|
| $ | 593.0 |
|
Change in Fair Value of Plan Assets During the Year: |
|
|
|
|
|
|
|
|
Plan assets at fair value at beginning of year |
|
| 438.6 |
|
|
| 416.4 |
|
Actual return on plan assets |
|
| (27.1 | ) |
|
| 49.6 |
|
Employer contributions |
|
| 20.4 |
|
|
| 23.0 |
|
Benefits paid and plan expenses |
|
| (50.3 | ) |
|
| (50.4 | ) |
Plan assets at fair value at end of year |
|
| 381.6 |
|
|
| 438.6 |
|
Funded status of plans |
| $ | (145.8 | ) |
| $ | (154.4 | ) |
|
| December 31, |
| |||||
|
| 2018 |
|
| 2017 |
| ||
Amounts recognized in Consolidated Balance Sheets |
|
|
|
|
|
|
|
|
Current liability |
| $ | 8.1 |
|
| $ | 20.3 |
|
Noncurrent liability |
|
| 137.7 |
|
|
| 134.1 |
|
Amounts recognized in Accumulated Other Comprehensive Loss |
|
|
|
|
|
|
|
|
Accumulated other comprehensive loss, net of tax of $91.5 and $91.5, respectively |
| $ | 158.6 |
|
| $ | 151.4 |
|
The other comprehensive (income) loss related to pension benefit plans iswas as follows:
|
| Year Ended December 31, |
| |||||||||
|
| 2023 |
|
| 2022 |
|
| 2021 |
| |||
|
| (In millions) |
| |||||||||
Net actuarial loss |
| $ | 17.0 |
|
| $ | 21.2 |
|
| $ | 9.9 |
|
Amortization of net actuarial loss |
|
| (8.2 | ) |
|
| (13.6 | ) |
|
| (17.3 | ) |
Tax (benefit) expense |
|
| (2.3 | ) |
|
| (1.9 | ) |
|
| 2.0 |
|
Other comprehensive loss (income), net of tax |
| $ | 6.5 |
|
| $ | 5.7 |
|
| $ | (5.4 | ) |
|
| Year Ended December 31, |
| |||||||||
|
| 2018 |
|
| 2017 |
|
| 2016 |
| |||
Net actuarial loss (gain) |
| $ | 21.4 |
|
| $ | (3.0 | ) |
| $ | 9.5 |
|
Amortization of net actuarial loss |
|
| (14.2 | ) |
|
| (12.8 | ) |
|
| (12.5 | ) |
Tax expense |
|
| — |
|
|
| — |
|
|
| 0.1 |
|
Other comprehensive income, net of tax |
| $ | 7.2 |
|
| $ | (15.8 | ) |
| $ | (2.9 | ) |
78 | 2023 Form 10-K
|
| Year Ended December 31, |
|
| Year Ended December 31, |
| ||||||||||||||||||
|
| 2018 |
|
| 2017 |
|
| 2016 |
|
| 2023 |
|
| 2022 |
|
| 2021 |
| ||||||
Assumptions Used in Calculations |
|
|
|
|
|
|
|
|
|
|
|
|
|
|
|
|
|
|
|
| ||||
Discount rate used to determine net benefit cost |
|
| 3.25 | % |
|
| 3.63 | % |
|
| 3.76 | % |
|
| 4.84 | % |
|
| 2.36 | % |
|
| 1.87 | % |
Expected return on plan assets |
|
| 6.30 | % |
|
| 6.30 | % |
|
| 6.30 | % |
|
| 5.20 | % |
|
| 3.30 | % |
|
| 2.70 | % |
Discount rate used to determine benefit obligations% |
|
| 3.92 | % |
|
| 3.25 | % |
|
| 3.63 | % | ||||||||||||
Discount rate used to determine benefit obligations |
|
| 4.65 | % |
|
| 4.84 | % |
|
| 2.36 | % | ||||||||||||
|
| Year Ended December 31, |
| |||||||||
|
| 2023 |
|
| 2022 |
|
| 2021 |
| |||
|
| (In millions) |
| |||||||||
Net Periodic Pension Cost |
|
|
|
|
|
|
|
|
| |||
Interest cost |
| $ | 17.1 |
|
| $ | 8.8 |
|
| $ | 6.7 |
|
Actuarial loss amortization |
|
| 8.2 |
|
|
| 13.6 |
|
|
| 17.3 |
|
Less: Expected return on plan assets |
|
| (22.3 | ) |
|
| (15.9 | ) |
|
| (13.1 | ) |
Net periodic pension cost |
| $ | 3.0 |
|
| $ | 6.5 |
|
| $ | 10.9 |
|
|
| Year Ended December 31, |
| |||||||||
|
| 2018 |
|
| 2017 |
|
| 2016 |
| |||
Net Periodic Pension Cost |
|
|
|
|
|
|
|
|
|
|
|
|
Interest cost |
| $ | 16.3 |
|
| $ | 17.2 |
|
| $ | 18.2 |
|
Actuarial loss amortization |
|
| 14.2 |
|
|
| 12.8 |
|
|
| 12.5 |
|
Less: Expected return on plan assets |
|
| (25.8 | ) |
|
| (26.3 | ) |
|
| (25.7 | ) |
Net periodic pension cost |
| $ | 4.7 |
|
| $ | 3.7 |
|
| $ | 5.0 |
|
The accumulated benefit obligation of defined benefit plans was $527.4 and $593.0 as of December 31, 2018 and 2017, respectively.
The amount in accumulated other comprehensive loss that is expected to be recognized as a component of net periodic pension cost during 2019 is a net actuarial loss of $12.7.
Our overall investment strategy for the U.S. defined benefitpension plan is to achieve a mix of approximately 70% of investments for long term growth, 28%86% for liability hedging purposes, 13% of investments for long-term growth, and 2%1% for near-term benefit payments. Target asset allocations are based upon actuarial and capital market studies performed by experienced outside consultants. The target allocations for the long-term growth assets are 41%58% public equity, 25% fixed income, 26% international equities, 23% domestic equities and 10% hedge funds.17% alternative investments. Specifically, the target allocation is managed through investments in fixed income securities, equity funds, collective investment funds, partnerships and other investment types. The underlying domestic equity securities include exposure to large/mid-cap companies and small-cap companies. Fixed income securities include corporate debt, mortgage-backed securities, U.S. Treasury and U.S. agency debt, emerging market debt and high yield debt securities. The alternative investment strategy is allocated to investments in hedge funds. The liability hedging portfolio fair value is intended to move in a direction that partiallysubstantially offsets the increase or decrease in the plan liabilities resulting from changes in interest rates. To achieve this objective, the portfolio will invest in corporate debt securities, U.S. Treasury strips and various interest rate derivatives contracts. We hire outside managers to manage all assets of the U.S. defined benefit plan.
In determining the fair values of the defined benefit plan’s assets, we calculate the fair value of certain investments using net asset value ("NAV") per share. Collective investmentMutual funds are valued at the NAV, which is based on the readily determinable fair value of the underlying securities owned by the fund. The NAV unit price is quoted on a private market or one that is not active. Partnerships consist primarily of a bond fund partnership valued at the NAV as reported by the fund manager and an investment in a venture capital fund valued by an independent appraisal. The NAV represents the value at which the defined benefit plan initiates a transaction. These investments do not have any significant unfunded commitments, conditions or restrictions on redemption, or any other significant restriction on their sale. The hedge fund of funds investment has a quarterly redemption restriction with a 65 day notice period. Plan investments with estimated fair value using NAV were $212.6 and $280.6 as of December 31, 2018 and 2017, respectively.
The fair values of the defined benefit plan’s assets at December 31, 2018, by asset category are as follows:
|
| Total |
|
| Level 1 |
|
| Level 2 |
|
| Level 3 |
| ||||
Investments, at fair value: |
|
|
|
|
|
|
|
|
|
|
|
|
|
|
|
|
Short-term investments |
| $ | 57.9 |
|
| $ | 57.9 |
|
| $ | — |
|
| $ | — |
|
Derivatives (a) |
|
| — |
|
|
| — |
|
|
| — |
|
|
| — |
|
Government securities |
|
| 92.4 |
|
|
| — |
|
|
| 92.4 |
|
|
| — |
|
Corporate debt securities |
|
| 18.7 |
|
|
| — |
|
|
| 18.7 |
|
|
| — |
|
Collective investment funds: |
|
|
|
|
|
|
|
|
|
|
|
|
|
|
|
|
Domestic equity (b) |
|
| 80.1 |
|
|
| — |
|
|
| 80.1 |
|
|
| — |
|
Foreign equity (b) |
|
| 48.5 |
|
|
| — |
|
|
| 48.5 |
|
|
| — |
|
Foreign bond (c) |
|
| 23.8 |
|
|
| — |
|
|
| 23.8 |
|
|
| — |
|
Partnerships (d) |
|
| 32.1 |
|
|
| — |
|
|
| 32.1 |
|
|
| — |
|
Hedge fund of funds (e) |
|
| 28.1 |
|
|
| — |
|
|
| 28.1 |
|
|
| — |
|
Total investments, at fair value |
| $ | 381.6 |
|
| $ | 57.9 |
|
| $ | 323.7 |
|
| $ | — |
|
The fair values of our defined benefit plan’s assets at December 31, 2017, by asset category arewere as follows:
|
| December 31, 2023 |
| |||||||||||||
|
| Level 1 |
|
| Level 2 |
|
| Level 3 |
|
| Total |
| ||||
|
| (In millions) |
| |||||||||||||
Investments, at fair value: |
|
|
|
|
|
|
|
|
|
|
|
| ||||
Short-term investments |
| $ | 19.2 |
|
| $ | — |
|
| $ | — |
|
| $ | 19.2 |
|
Government securities |
|
| — |
|
|
| 6.2 |
|
|
| — |
|
|
| 6.2 |
|
Corporate debt securities |
|
| — |
|
|
| 285.8 |
|
|
| — |
|
|
| 285.8 |
|
Collective investment funds |
|
| — |
|
|
| 46.1 |
|
|
| — |
|
|
| 46.1 |
|
Total investments, at fair value |
| $ | 19.2 |
|
| $ | 338.1 |
|
| $ | — |
|
| $ | 357.3 |
|
|
| December 31, 2022 |
| |||||||||||||
|
| Level 1 |
|
| Level 2 |
|
| Level 3 |
|
| Total |
| ||||
|
| (In millions) |
| |||||||||||||
Investments, at fair value: |
|
|
|
|
|
|
|
|
|
|
|
| ||||
Short-term investments |
| $ | 17.2 |
|
| $ | — |
|
| $ | — |
|
| $ | 17.2 |
|
Government securities |
|
| — |
|
|
| 6.3 |
|
|
| — |
|
|
| 6.3 |
|
Corporate debt securities |
|
| — |
|
|
| 301.8 |
|
|
| — |
|
|
| 301.8 |
|
Collective investment funds |
|
| — |
|
|
| 47.1 |
|
|
| — |
|
|
| 47.1 |
|
Total investments, at fair value |
| $ | 17.2 |
|
| $ | 355.2 |
|
| $ | — |
|
| $ | 372.4 |
|
|
| Total |
|
| Level 1 |
|
| Level 2 |
|
| Level 3 |
| ||||
Investments, at fair value: |
|
|
|
|
|
|
|
|
|
|
|
|
|
|
|
|
Short-term investments |
| $ | 36.8 |
|
| $ | 36.8 |
|
| $ | — |
|
| $ | — |
|
Derivatives (a) |
|
| 14.8 |
|
|
| — |
|
|
| 14.8 |
|
|
| — |
|
Government securities |
|
| 88.1 |
|
|
| — |
|
|
| 88.1 |
|
|
| — |
|
Corporate debt securities |
|
| 18.3 |
|
|
| — |
|
|
| 18.3 |
|
|
| — |
|
Collective investment funds: |
|
|
|
|
|
|
|
|
|
|
|
|
|
|
|
|
Domestic equity (b) |
|
| 144.4 |
|
|
| — |
|
|
| 144.4 |
|
|
| — |
|
Foreign equity (b) |
|
| 57.5 |
|
|
| — |
|
|
| 57.5 |
|
|
| — |
|
Foreign bond (c) |
|
| 41.8 |
|
|
| — |
|
|
| 41.8 |
|
|
| — |
|
Partnerships (d) |
|
| 35.3 |
|
|
| — |
|
|
| 35.3 |
|
|
| — |
|
Hedge fund of funds (e) |
|
| 1.6 |
|
|
| — |
|
|
| 1.6 |
|
|
| — |
|
Total investments, at fair value |
| $ | 438.6 |
|
| $ | 36.8 |
|
| $ | 401.8 |
|
| $ | — |
|
79 | 2023 Form 10-K
|
|
|
|
|
|
|
|
|
|
Postretirement Benefits
Ceridian providesWe provide health care and life insurance benefits for eligible retired employees, including individuals who retired from operations we subsequently sold or discontinued. Ceridian sponsorsWe sponsor several health care plans in the United StatesU.S. for both pre- and post-age 65 retirees. The contributions to these plans differ for various groups of retirees and future retirees. Most retirees outside of the United StatesU.S. are covered by governmental health care programs, and our cost is not significant. The measurement date for postretirement benefit plans is December 31.
The discount rate assumption is used to determine the benefit obligation and the interest portion of the net periodic postretirement cost (credit) for the following year. We utilize a full yield curve approach for our discount rate assumption by applying the specific spot rates along the yield curve used in the determination of the benefit obligation to the relevant projected cash flows. As of December 31, 2018,2023, a 25 basis point decrease in the discount rate would result in an immaterial impact on expense for the postretirement plan.
The accompanying tables present the amounts and changes in the aggregate benefit obligation and the components of net periodic postretirement benefit cost for U.S. plans. We fund these costs as they become due.
|
| Year Ended |
| |||||
|
| 2023 |
|
| 2022 |
| ||
|
| (In millions) |
| |||||
Funded Status of Postretirement Health Care and Life Insurance Plans |
|
|
|
|
|
| ||
Change in Benefit Obligation: |
|
|
|
|
|
| ||
At beginning of year |
| $ | 8.8 |
|
| $ | 12.6 |
|
Interest cost |
|
| 0.4 |
|
|
| 0.2 |
|
Participant contributions |
|
| — |
|
|
| 0.6 |
|
Actuarial gain |
|
| (0.3 | ) |
|
| (3.1 | ) |
Benefits paid |
|
| (0.4 | ) |
|
| (1.5 | ) |
At end of year |
| $ | 8.5 |
|
| $ | 8.8 |
|
Change in Plan Assets: |
|
|
|
|
|
| ||
At beginning of year |
| $ | — |
|
| $ | — |
|
Company contributions |
|
| 0.4 |
|
|
| 0.9 |
|
Participant contributions |
|
| 0.4 |
|
|
| 0.6 |
|
Benefits paid |
|
| (0.8 | ) |
|
| (1.5 | ) |
At end of year |
|
| — |
|
|
| — |
|
Funded Status |
| $ | (8.5 | ) |
| $ | (8.8 | ) |
|
| December 31, |
| |||||
|
| 2023 |
|
| 2022 |
| ||
|
| (In millions) |
| |||||
Amounts recognized in Consolidated Balance Sheets |
|
|
|
|
|
| ||
Current liability |
| $ | 1.5 |
|
| $ | 1.6 |
|
Noncurrent liability |
|
| 7.0 |
|
|
| 7.2 |
|
Amounts recognized in Accumulated Other Comprehensive Loss |
|
|
|
|
|
| ||
Accumulated other comprehensive loss (income), net of tax of $(4.7) million and $(5.4) million, respectively |
| $ | (7.1 | ) |
| $ | (8.4 | ) |
|
| Year Ended December 31, |
| |||||
|
| 2018 |
|
| 2017 |
| ||
Funded Status of Postretirement Health Care and Life Insurance Plans |
|
|
|
|
|
|
|
|
Change in Benefit Obligation: |
|
|
|
|
|
|
|
|
At beginning of year |
| $ | 19.6 |
|
| $ | 21.0 |
|
Interest cost |
|
| 0.5 |
|
|
| 0.5 |
|
Participant contributions |
|
| 0.5 |
|
|
| 1.1 |
|
Actuarial gain |
|
| (2.1 | ) |
|
| (0.7 | ) |
Benefits paid |
|
| (1.7 | ) |
|
| (2.3 | ) |
At end of year |
| $ | 16.8 |
|
| $ | 19.6 |
|
Change in Plan Assets: |
|
|
|
|
|
|
|
|
At beginning of year |
| $ | — |
|
| $ | — |
|
Company contributions |
|
| 1.2 |
|
|
| 1.2 |
|
Participant contributions |
|
| 0.5 |
|
|
| 1.1 |
|
Benefits paid |
|
| (1.7 | ) |
|
| (2.3 | ) |
At end of year |
|
| — |
|
|
| — |
|
Funded Status |
| $ | (16.8 | ) |
| $ | (19.6 | ) |
|
| December 31, |
| |||||
|
| 2018 |
|
| 2017 |
| ||
Amounts recognized in Consolidated Balance Sheets |
|
|
|
|
|
|
|
|
Current liability |
| $ | 2.2 |
|
| $ | 2.4 |
|
Noncurrent liability |
|
| 14.6 |
|
|
| 17.2 |
|
Amounts recognized in Accumulated Other Comprehensive Loss |
|
|
|
|
|
|
|
|
Accumulated other comprehensive income, net of tax of $(9.9) and $(9.9), respectively |
| $ | (8.5 | ) |
| $ | (8.9 | ) |
The other comprehensive (income) loss related to postretirement benefits iswas as follows:
|
| Year Ended December 31, |
| |||||||||
|
| 2023 |
|
| 2022 |
|
| 2021 |
| |||
|
| (In millions) |
| |||||||||
Net actuarial gain |
| $ | (0.3 | ) |
| $ | (3.1 | ) |
| $ | (0.8 | ) |
Amortization of net actuarial gain |
|
| 2.3 |
|
|
| 1.9 |
|
|
| 2.2 |
|
Tax (benefit) expense |
|
| (0.7 | ) |
|
| 0.4 |
|
|
| (0.4 | ) |
Other comprehensive loss (gain), net of tax |
| $ | 1.3 |
|
| $ | (0.8 | ) |
| $ | 1.0 |
|
|
| Year Ended December 31, |
| |||||||||
|
| 2018 |
|
| 2017 |
|
| 2016 |
| |||
Net actuarial gain |
| $ | (2.1 | ) |
| $ | (0.7 | ) |
| $ | (1.4 | ) |
Amortization of net actuarial gain |
|
| 2.5 |
|
|
| 2.7 |
|
|
| 2.6 |
|
Tax expense |
|
| — |
|
|
| — |
|
|
| — |
|
Other comprehensive loss (income), net of tax |
| $ | 0.4 |
|
| $ | 2.0 |
|
| $ | 1.2 |
|
80 | 2023 Form 10-K
|
| Year Ended December 31, |
| |||||||||||||||||||||
|
| Year Ended December 31, |
|
| 2023 |
|
| 2022 |
|
| 2021 |
| ||||||||||||
|
| 2018 |
|
| 2017 |
|
| 2016 |
|
| (In millions) |
| ||||||||||||
Net Periodic Postretirement Benefit |
|
|
|
|
|
|
|
|
|
|
|
|
|
|
|
|
|
|
| |||||
Service cost |
| $ | — |
|
| $ | — |
|
| $ | — |
| ||||||||||||
Interest cost |
|
| 0.5 |
|
|
| 0.5 |
|
|
| 0.6 |
|
| $ | 0.4 |
|
| $ | 0.2 |
|
| $ | 0.1 |
|
Actuarial gain amortization |
|
| (2.2 | ) |
|
| (2.4 | ) |
|
| (2.3 | ) |
|
| (2.3 | ) |
|
| (1.9 | ) |
|
| (2.0 | ) |
Prior service credit amortization |
|
| (0.3 | ) |
|
| (0.3 | ) |
|
| (0.3 | ) |
|
| — |
|
|
| — |
|
|
| (0.2 | ) |
Net periodic postretirement benefit gain |
| $ | (2.0 | ) |
| $ | (2.2 | ) |
| $ | (2.0 | ) |
| $ | (1.9 | ) |
| $ | (1.7 | ) |
| $ | (2.1 | ) |
The amount in accumulated other comprehensive loss that is expected to be recognized as a component of net periodic postretirement benefit cost during 2019 is a $2.6 gain, comprised of $2.3 of actuarial gain and $0.3 of prior service credit.
The assumed health care cost trend rate represents the rate at which health care costs are assumed to increase. The assumed health care cost trend rate used in measuring the benefit obligation in 20182023 is 6.90%7.7% for pre-age 65 retirees and 7.70%8.3% for post-age 65 retirees. These rates are assumed to decrease gradually to the ultimate health care cost trend rate of 4.5%4.5% in 20282032 for both groups. A one percent increase in this rate would increase the benefit obligation at December 31, 2018, by $0.7 and would have an immaterial impact on the interest cost for 2018. A one percent decrease in this rate would decrease the benefit obligation at December 31, 2018, by $0.6 and would have an immaterial impact on the interest cost for 2018.
|
| Year Ended December 31, |
| |||||||||
|
| 2023 |
|
| 2022 |
|
| 2021 |
| |||
Assumptions Used in Calculations |
|
|
|
|
|
|
|
|
| |||
Weighted average discount rate used to determine |
|
| 4.72 | % |
|
| 2.00 | % |
|
| 1.42 | % |
Weighted average discount rate used to determine |
|
| 4.52 | % |
|
| 4.72 | % |
|
| 2.00 | % |
|
| Year Ended December 31, |
| |||||||||
|
| 2018 |
|
| 2017 |
|
| 2016 |
| |||
Assumptions Used in Calculations |
|
|
|
|
|
|
|
|
|
|
|
|
Weighted average discount rate used to determine net periodic postretirement cost (credit) |
|
| 3.01 | % |
|
| 3.26 | % |
|
| 3.38 | % |
Weighted average discount rate used to determine benefit obligation at measurement date |
|
| 3.70 | % |
|
| 3.01 | % |
|
| 3.26 | % |
The projected future postretirement benefit payments and future receipts from the federal subsidy for each of the next five years and the five-year period following are included in the table below.as follows:
Years Ending December 31, |
| Payments |
|
| Receipts |
| ||
|
| (In millions) |
| |||||
2024 |
| $ | 1.6 |
|
| $ | — |
|
2025 |
|
| 1.3 |
|
|
| — |
|
2026 |
|
| 1.2 |
|
|
| — |
|
2027 |
|
| 1.0 |
|
|
| — |
|
2028 |
|
| 0.9 |
|
|
| — |
|
Next five years |
|
| 3.0 |
|
|
| — |
|
Years Ending December 31, |
| Payments |
|
| Receipts |
| ||
2019 |
| $ | 2.2 |
|
| $ | 0.1 |
|
2020 |
|
| 1.9 |
|
|
| 0.1 |
|
2021 |
|
| 1.9 |
|
|
| — |
|
2022 |
|
| 1.8 |
|
|
| — |
|
2023 |
|
| 1.6 |
|
|
| 0.1 |
|
Next five years |
| $ | 6.2 |
|
| $ | 0.1 |
|
Prior to November 1, 2013,In 2018, our Board of Directors approved the Ceridian employees participated in a share-based compensation plan of the ultimate parent of Ceridian. The 2007 StockHCM Holding Inc. 2018 Equity Incentive Plan (“2007 SIP”(as amended, "2018 EIP") authorized the issuance of up to 10,540,540 shares of common stock of Parent to eligible participants through stock options and stock awards. Eligible participants in the 2007 SIP included the Parent’s directors, employees and consultants.
Effective November 1, 2013, most participants who held stock options under the 2007 SIP converted their options to, which serves as a newly created option plan,successor to the 2013 Ceridian HCM Holding Inc. Stock Incentive Plan, (“2013 SIP”(as amended, "2013 SIP") (collectively, the "Plans"). A small numberMost of participants maintained their stock options in the 2007 SIP. As of December 31, 2018, there were 5,000 stock options outstanding under the 2007 SIP.
The 2013 SIP authorized the issuance of up to 12,500,000 shares of common stock of Ceridian to eligible participants through stock options and other stockour equity awards which was increased to 15,000,000 on March 20, 2017, by the Board of Directors. Eligible participants in the 2013 HCM SIP include Ceridian’s directors, employees, and consultants.
As part of the 2013 SIP, the Board of Directors approved a stock appreciation rights program that authorized the issuance of up to 600,000 stock appreciation rights. The performance criteria for all stock appreciation rights was met on April 30, 2018, resulting in the vesting and cash settlement of all outstanding stock appreciation rights. We recognized $1.5 of share-based compensation expense related to the vesting of these stock appreciation rights during the year ended December 31, 2018. As of December 31, 2018, there were no remaining outstanding stock appreciation rights.
Stock options awarded under the 2013 SIP and 2018 EIP vest either annually or quarterly on a pro rata basis, generally over a four-one-, three-, four-, or five-year period or on a specific date if certain performance criteria are satisfied and certain equity values are attained. In addition, upon termination of service, all vested optionsawards must be exercised generally within 90 days after termination, or these awards will be forfeited. The stock optionequity awards have a 10-year contractual term, and the stock options have an exercise price that is not less than the fair market value of the underlying common stock on the date of grant.
As of December 31, 2018,2023, there were 9,356,90411,991,895 stock options, RSUs, and restricted stock units outstanding under the 2013 SIP. We do not intend to grant any additional awards under the 2007 SIP or the 2013 SIP following our IPO.
On April 24, 2018, in connection with the IPO, the Board of Directors approved the Ceridian HCM Holding Inc. 2018 Equity Incentive Plan (“2018 EIP”), which authorizes the issuance of up to 13,500,000 shares of common stock to eligible participants through equity awards. Equity awards under the 2018 EIP vest annually on a pro rata basis, generally over a four-year period. In addition, upon termination of service, all vested awards must be exercised within 90 days after termination, or these awards will be forfeited. The equity awards have a 10-year contractual term and have an exercise price that is not less than the fair market value of the underlying stock on the date of the grant. As of December 31, 2018, there were 5,218,315 stock options and restricted stock unitsPSUs outstanding and 8,281,68512,175,694 shares available for future grants of equity awards under the 2018 EIP.
On November 9, 2018, the Compensation Committee of the Board of Directors approved the Ceridian HCM Holding Inc. Global Employee Stock Purchase Plan (the “GESPP”), which authorizes the issuance of up to 2,500,000 shares of common stock to eligible participants through purchases via payroll deductions at a discount to the fair market value of our common stock. The GESPP has a 10-year contractual term, and purchases will commence in 2019, subject to approval by the Company’s stockholders.
Plans. Share-based compensation expense was $24.7, $16.1,$136.7 million, $144.8 million, and $12.5$113.4 million for the years ended December 31, 2018, 2017,2023, 2022, and 2016,2021, respectively.
81 | 2023 Form 10-K
Performance-Based Stock Options
Performance-based stock option activity under the 2007 SIP and the 2013 SIP for the periods presented was as follows:
|
| Shares |
|
| Weighted Average Exercise Price (per share) |
|
| Weighted Average Remaining Contractual Term (in years) |
|
| Aggregate Intrinsic Value (in millions) |
| ||||
Options outstanding at December 31, 2015 |
|
| 1,283,368 |
|
| $ | 13.46 |
|
|
| 5.2 |
|
| $ | — |
|
Granted |
|
| — |
|
|
| — |
|
|
| — |
|
|
| — |
|
Exercised |
|
| — |
|
|
| — |
|
|
| — |
|
|
| — |
|
Forfeited or expired |
|
| (52,942 | ) |
|
| (13.46 | ) |
|
| — |
|
|
| — |
|
Options outstanding at December 31, 2016 |
|
| 1,230,426 |
|
| $ | 13.46 |
|
|
| 4.2 |
|
| $ | — |
|
Granted |
|
| — |
|
|
| — |
|
|
| — |
|
|
| — |
|
Exercised |
|
| (167,202 | ) | (a) |
| (13.46 | ) |
|
| — |
|
|
| — |
|
Forfeited or expired |
|
| (25,077 | ) |
|
| (13.46 | ) |
|
| — |
|
|
| — |
|
Options outstanding at December 31, 2017 |
|
| 1,038,147 |
|
| $ | 13.46 |
|
|
| 3.5 |
|
| $ | — |
|
Granted |
|
| — |
|
|
| — |
|
|
| — |
|
|
| — |
|
Exercised |
|
| (663,412 | ) |
|
| (13.46 | ) |
|
| — |
|
|
| — |
|
Forfeited or expired |
|
| (8,358 | ) |
|
| (13.46 | ) |
|
| — |
|
|
| — |
|
Options outstanding at December 31, 2018 |
|
| 366,377 |
|
| $ | 13.50 |
|
|
| 3.1 |
|
| $ | 7.7 |
|
Options exercisable at December 31, 2018 |
|
| 366,377 |
|
| $ | 13.50 |
|
|
| 3.1 |
|
| $ | 7.7 |
|
|
| Shares |
|
| Weighted |
|
| Weighted |
|
| Aggregate |
| ||||
Outstanding at December 31, 2020 |
|
| 1,844,279 |
|
| $ | 64.55 |
|
|
| 9.2 |
|
| $ | 77.5 |
|
Exercised |
|
| (65,882 | ) |
| $ | (47.23 | ) |
|
| — |
|
| $ | — |
|
Forfeited or expired |
|
| (1,347 | ) |
|
| — |
|
|
| — |
|
|
| — |
|
Outstanding at December 31, 2021 |
|
| 1,777,050 |
|
| $ | 64.72 |
|
|
| 8.3 |
|
| $ | 70.6 |
|
Exercised |
|
| (14,755 | ) |
|
| (13.46 | ) |
|
| — |
|
|
| — |
|
Forfeited or expired |
|
| (1,857 | ) |
|
| — |
|
|
| — |
|
|
| — |
|
Outstanding at December 31, 2022 |
|
| 1,760,438 |
|
| $ | 66.10 |
|
|
| 7.4 |
|
| $ | 0.1 |
|
Exercised |
|
| (5,657 | ) |
|
| (48.25 | ) |
|
| — |
|
|
| — |
|
Forfeited or expired |
|
| — |
|
|
| — |
|
|
| — |
|
|
| — |
|
Outstanding at December 31, 2023 |
|
| 1,754,781 |
|
| $ | 65.26 |
|
|
| 6.4 |
|
| $ | 3.3 |
|
Exercisable at December 31, 2023 |
|
| 254,781 |
|
| $ | 65.26 |
|
|
| 6.6 |
|
| $ | 0.5 |
|
|
|
The performance criteria for all outstandingIn 2020, 1,500,000 performance-based stock options (“Performance Option Award”) were granted with an exercise price of $65.26. The vesting conditions for the Performance Option Award are based on our performance on the New York Stock Exchange (“NYSE”) with (i) 750,000 shares available to vest when our per share closing price on the NYSE meets or exceeds $110.94, or 1.7 times the exercise price, for ten consecutive trading days (“Performance Metric #1”) and (ii) the remaining 750,000 shares available to vest when our per share closing price on the NYSE meets or exceeds $130.52, or 2.0 times the exercise price, for ten consecutive trading days (“Performance Metric #2”, collectively with Performance Metric #1, the “Performance Metrics”). The vesting conditions of the Performance Metrics must be achieved prior to May 8, 2025, or any unvested portion of the Performance Option Award will terminate. Further, no portion of the Performance Option Award were allowed to vest and become exercisable until May 8, 2023 (the “Time-Based Metric”). The shares underlying Performance Metric #1, which was achieved on October 6, 2021, vested and became exercisable on May 8, 2023. The shares underlying Performance Metric #2 have met the Time-Based metric, but if Performance Metric #2 has not been met on June 7, 2018, resulting inor prior to May 8, 2025, these shares will be terminated. We have estimated an expected term of 5.3 years, based on the vesting of all outstanding performance-based stock options on this date. We recognized $4.8 of share-based compensation expense related to the vesting of these performance-based stock options during the year ended December 31, 2018. period and contractual term.
As of December 31, 2018,2023, there was no share-based compensation unrecognized expense related to unvested performance-based stock optionsoptions.
82 | 2023 Form 10-K
Performance Stock Units
PSU activity was as follows:
Shares | ||||
Outstanding at December 31, 2020 | 135,220 | |||
Granted | 348,483 | |||
Vested and released | (2,050 | ) | ||
Forfeited or canceled | (162,908 | ) | ||
Outstanding at December 31, 2021 | 318,745 | |||
Granted | 582,662 | |||
Vested and released | (168,414 | ) | ||
Forfeited or canceled | (26,526 | ) | ||
Outstanding at December 31, 2022 | 706,467 | |||
Granted | 662,723 | |||
Vested and released | (272,592 | ) | ||
Forfeited or canceled | (318,574 | ) | ||
Outstanding at December 31, 2023 | 778,024 | |||
Releasable at December 31, 2023 | — | |||
In 2023, 2022, and 2021, we granted PSU awards under our Management Incentive Plan ("MIP") for the incentive period of January 1 through December 31, and also as part of long-term incentive ("LTI") grants to certain members of management. These awards are primarily earned based upon performance of key financial metrics, and certain LTI awards granted in 2023 are earned based upon our total shareholder return, a market condition, as compared to an indexed shareholder return over the course of a fiscal based three-year performance period, starting in the year of grant. Earned awards typically vest in the quarter following the conclusion of the performance period.
One-third of the LTI PSUs granted in 2022 and 2021 vested in the first quarter of 2023 and one-third are expected to vest in the first quarter of 2024. Based on the performance achieved, most of the MIP PSUs granted in 2023 are expected to vest in the first quarter of 2024 and one-third of the LTI awards based upon the performance of key financial metrics are expected to vest in March 2024. Share based compensation was recognized in accordance with the achievement levels.
As of December 31, 2023, there was $15.4 million of share-based compensation expense not yet recognized.recognized related to unvested LTI PSUs that have a three-year vesting period, which is expected to be recognized over a weighted average period of 1.9 years.
Term-Based Stock Options
Term-based stock option activity including stock options under the 2007 SIP, the 2013 SIP and the 2018 EIP, for the periods presented was as follows:
|
| Shares |
|
| Weighted |
|
| Weighted |
|
| Aggregate |
| ||||
Outstanding at December 31, 2020 |
|
| 10,983,074 |
|
| $ | 40.47 |
|
|
| 7.8 |
|
| $ | 725.9 |
|
Granted |
|
| 759,126 |
|
|
| 84.07 |
|
|
| — |
|
|
| — |
|
Exercised |
|
| (2,942,465 | ) |
|
| (26.71 | ) |
|
| — |
|
|
| — |
|
Forfeited or expired |
|
| (283,866 | ) |
|
| (48.62 | ) |
|
| — |
|
|
| — |
|
Outstanding at December 31, 2021 |
|
| 8,515,869 |
|
| $ | 48.87 |
|
|
| 7.3 |
|
| $ | 473.4 |
|
Granted |
|
| 81,145 |
|
|
| 56.29 |
|
|
| — |
|
|
| — |
|
Exercised |
|
| (931,520 | ) |
|
| (32.14 | ) |
|
| — |
|
|
| — |
|
Forfeited or expired |
|
| (369,408 | ) |
|
| (58.59 | ) |
|
| — |
|
|
| — |
|
Outstanding at December 31, 2022 |
|
| 7,296,086 |
|
| $ | 50.59 |
|
|
| 6.4 |
|
| $ | 117.4 |
|
Granted |
|
| — |
|
|
| — |
|
|
| — |
|
|
| — |
|
Exercised |
|
| (875,140 | ) |
|
| (40.55 | ) |
|
| — |
|
|
| — |
|
Forfeited or expired |
|
| (206,948 | ) |
|
| (70.65 | ) |
|
| — |
|
|
| — |
|
Outstanding at December 31, 2023 |
|
| 6,213,998 |
|
| $ | 51.34 |
|
|
| 5.5 |
|
| $ | 110.8 |
|
Exercisable at December 31, 2023 |
|
| 5,567,406 |
|
| $ | 48.65 |
|
|
| 5.4 |
|
| $ | 110.3 |
|
|
| Shares |
|
| Weighted Average Exercise Price (per share) |
|
| Weighted Average Remaining Contractual Term (in years) |
|
| Aggregate Intrinsic Value (in millions) |
| ||||
Options outstanding at December 31, 2015 |
|
| 7,609,658 |
|
| $ | 16.02 |
|
|
| 7.3 |
|
| $ | 14.1 |
|
Granted |
|
| 2,339,238 |
|
|
| 16.80 |
|
|
| — |
|
|
| — |
|
Exercised |
|
| — |
|
|
| — |
|
|
| — |
|
|
| — |
|
Forfeited or expired |
|
| (176,626 | ) |
|
| (16.54 | ) |
|
| — |
|
|
| — |
|
Options outstanding at December 31, 2016 |
|
| 9,772,270 |
|
| $ | 16.20 |
|
|
| 7.1 |
|
| $ | 9.9 |
|
Granted |
|
| 2,285,981 |
|
|
| 17.46 |
|
|
| — |
|
|
| — |
|
Exercised |
|
| (595,464 | ) |
|
| (15.14 | ) |
|
| — |
|
|
| — |
|
Forfeited or expired |
|
| (468,606 | ) |
|
| (16.10 | ) |
|
| — |
|
|
| — |
|
Options outstanding at December 31, 2017 |
|
| 10,994,181 |
|
| $ | 16.52 |
|
|
| 6.9 |
|
| $ | 48.8 |
|
Granted |
|
| 5,236,037 |
|
|
| 23.07 |
|
|
| — |
|
|
| — |
|
Exercised |
|
| (2,501,983 | ) |
|
| (15.26 | ) |
|
| — |
|
|
| — |
|
Forfeited or expired |
|
| (178,466 | ) |
|
| (17.30 | ) |
|
| — |
|
|
| — |
|
Options outstanding at December 31, 2018 |
|
| 13,549,769 |
|
| $ | 19.28 |
|
|
| 7.5 | �� |
| $ | 206.8 |
|
Options exercisable at December 31, 2018 |
|
| 5,731,295 |
|
| $ | 16.75 |
|
|
| 5.7 |
|
| $ | 101.7 |
|
83 | 2023 Form 10-K
Other information pertaining to term-based options iswas as follows:
|
| Year Ended December 31, |
| |||||||
|
| 2023 |
| 2022 |
|
| 2021 |
| ||
Weighted average grant date fair value per share |
| n/a |
| $ | 24.12 |
|
| $ | 33.09 |
|
|
| Year Ended December 31, |
| |||||||||
|
| 2018 |
|
| 2017 |
|
| 2016 |
| |||
Weighted average grant date fair value per share |
| $ | 7.80 |
|
| $ | 5.88 |
|
| $ | 5.74 |
|
The fair value of the term-based stock options was estimated at the date of grant using the Black-Scholes option pricing model with the following weighted-averageweighted average assumptions:
|
| Year Ended December 31, |
|
| Year Ended December 31, |
| ||||||||||||||||
|
| 2018 |
|
| 2017 |
|
| 2016 |
|
| 2023 |
| 2022 |
|
| 2021 |
| |||||
Expected volatility |
|
| 25.0 | % |
|
| 30.0 | % |
|
| 30.0 | % |
| n/a |
|
| 40.7 | % |
|
| 35.8 | % |
Expected dividend rate |
|
| — |
|
|
| — |
|
|
| — |
|
| n/a |
|
| — |
|
|
| — |
|
Risk-free interest rate |
|
| 2.9 | % |
|
| 2.3 | % |
|
| 1.9 | % |
| n/a |
|
| 2.6 | % |
|
| 1.3 | % |
For most stock options granted under the 2007 SIP, we used the simplified method to estimate the expected term of the stock options. For stock options granted under the 2013 SIP and 2018 EIP,Plans, we estimated an expected term of 7.0 years, based on the vesting period and contractual life. As of December 31, 2018,2023, there was $46.6$9.2 million of share-based compensation expense related to unvested term-based awards not yet recognized, which is expected to be recognized over a weighted average period of 1.80.2 years.
Restricted Stock Units
RSU activity was as follows:
Shares | ||||
Outstanding at December 31, 2020 | 1,389,385 | |||
Granted | 890,852 | |||
Vested and released | (262,239 | ) | ||
Forfeited or canceled | (82,059 | ) | ||
Outstanding at December 31, 2021 | 1,935,939 | |||
Granted | 1,624,345 | |||
Vested and released | (504,586 | ) | ||
Forfeited or canceled | (164,881 | ) | ||
Outstanding at December 31, 2022 | 2,890,817 | |||
Granted | 1,775,638 | |||
Vested and released | (1,056,901 | ) | ||
Forfeited or canceled | (364,462 | ) | ||
Outstanding at December 31, 2023 | 3,245,092 | |||
Releasable at December 31, 2023 | — | |||
Other information pertaining to RSUs was as follows:
|
| Year Ended December 31, |
| |||||||||
|
| 2023 |
|
| 2022 |
|
| 2021 |
| |||
Weighted average grant date fair value per share |
| $ | 71.66 |
|
| $ | 69.35 |
|
| $ | 85.08 |
|
As of December 31, 2018, there were 5,731,295 vested term-based stock options.
Restricted stock units (“RSUs”) activity, including RSUs under the 2013 SIP and the 2018 EIP, for the periods presented was as follows:
| ||||
|
| |||
|
| |||
|
|
| ||
|
| |||
|
| |||
|
| |||
|
|
| ||
|
| |||
|
| |||
|
| |||
|
|
| ||
|
| |||
|
| |||
|
| |||
Other information pertaining to restricted stock units is as follows:
|
| Year Ended December 31, |
| |||||||||
|
| 2018 |
|
| 2017 |
|
| 2016 |
| |||
Weighted average grant date fair value per share |
| $ | 35.55 |
|
| $ | 17.26 |
|
| $ | 17.40 |
|
During the year ended December 31, 2018, 230,990 RSUs vested, of which 105,990 shares of common stock were issued, and 125,000 RSUs remained vested and releasable. Restricted stock units generally vest annually over a three- or four-year period. As of December 31, 2018,2023, there was $9.9$115.1 million of share-based compensation expense related to unvested restricted stock unitsRSUs not yet recognized, which is expected to be recognized over a weighted average period of 2.91.4 years.
84 | 2023 Form 10-K
Global Employee Stock Purchase Plan
GESPP activity was as follows:
|
| Year Ended December 31, |
| |||||||||
|
| 2023 |
|
| 2022 |
|
| 2021 |
| |||
Shares issued |
|
| 243,669 |
|
|
| 243,043 |
|
|
| 153,235 |
|
Weighted average purchase price (per share) |
| $ | 52.33 |
|
| $ | 48.59 |
|
| $ | 81.69 |
|
A total of 1,415,089 shares of common stock are remaining for issuance under the GESPP plan as of December 31, 2023.
The fair value was estimated using the following weighted average assumptions:
|
| Year Ended December 31, |
| |||||||
|
| 2023 |
| 2022 |
| 2021 |
| |||
Expected volatility |
|
| 44.8 | % |
| 29.3 | % |
| 33.7 | % |
Expected dividend rate |
|
| — |
|
| — |
|
| — |
|
Risk-free interest rate |
|
| 4.6 | % |
| 0.2 | % |
| 0.1 | % |
Expected term (in years) |
|
| 0.3 |
|
| 0.3 |
|
| 0.3 |
|
Grant date fair value per share |
| $ | 15.11 |
| $ | 21.16 |
| $ | 22.07 |
|
12. Supplementary DataRevenue
Our Solutions
We categorize our solutions into three categories: Cloud recurring, other recurring (formerly referred to Statementsas Bureau), and professional services and other. We also generate recurring revenue from investment income on our Cloud recurring and other recurring customer funds before such funds are remitted to taxing authorities, customer employees, or other third parties. We refer to this investment income as float revenue.
Cloud Recurring
Cloud recurring revenue is primarily generated from solutions that are delivered via two Cloud offerings, Dayforce and Powerpay. The Dayforce offering is a single application with continuous calculation that offers a full suite of Operationscapabilities, including global HR, payroll and tax, workforce management, benefits, and talent intelligence. Dayforce recurring revenue is primarily generated from monthly recurring fees charged on a PEPM basis. We also offer Dayforce Wallet, which is a digital payment solution that gives employees instant access to their net earnings through on-demand pay requests via a paycard, which generates interchange fee revenue when used.
In addition to customers who use our payroll services, certain customers use our tax filing services on a stand-alone basis; which we recently modernized the technology platforms used to provide stand-alone tax services. Beginning in 2023, with the technology migration complete, we classified recurring revenues from stand-alone tax customers as Dayforce recurring revenue.
We offer Powerpay for Canadian organizations with fewer than 100 employees. The majority of Powerpay revenue is generated from recurring fees charged on a per-employee, per-process basis. Typical processes include the customer’s payroll runs, year-end tax packages, and delivery of customers’ remittance advices or checks. Powerpay can typically be implemented on a remote basis within one to three days, at which point we start receiving recurring fees.
|
| Year Ended December 31, |
| |||||||||
|
| 2018 |
|
| 2017 |
|
| 2016 |
| |||
Other (Income) Expense, Net |
|
|
|
|
|
|
|
|
|
|
|
|
Asset impairment |
| $ | — |
|
| $ | — |
|
| $ | 10.4 |
|
Environmental reserve |
|
| — |
|
|
| — |
|
|
| 5.9 |
|
Foreign currency translation (income) expense |
|
| (2.9 | ) |
|
| 7.3 |
|
|
| (3.4 | ) |
Total other (income) expense, net |
| $ | (2.9 | ) |
| $ | 7.3 |
|
| $ | 12.9 |
|
85 | 2023 Form 10-K
Other Recurring
Asset Impairment
TheOther recurring revenue is generated primarily from solutions delivered via a service-bureau model. These solutions are delivered via three primary service lines: payroll, payroll-related tax filing services, and outsourced human resource solutions. Revenue from payroll services is generated from recurring fees charged on a per-process basis. Typical processes include the customer’s payroll runs, year-end tax packages, and delivery of customers’ remittance advices or checks. In addition to customers who use our payroll services, prior to modernizing the technology platforms utilized for stand-alone tax services, certain customers used our legacy tax filing services on a stand-alone basis through 2022. Our outsourced human resource solutions are tailored to meet the needs of individual customers, and entail our contracting to perform many of the duties of a customer’s human resources department, including payroll processing, time and labor management, performance management, and recruiting.
Professional Services and Other
Professional services and other revenue is primarily generated from implementation and post go-live professional services revenue. Other sources of professional services revenue includes revenue from the sale, rental and maintenance of time clocks; revenue from the sale of third-party services, and billable travel expenses. Other professional services is generated from the UK Business in 2016performance of individual services for customers, such as check printing, wage attachment and disbursement, and Affordable Care Act (“ACA”) management.
Disaggregation of Revenue
Revenue by solution and category was considered a triggering event to test the trade name intangible asset for impairment. Given the reduction in future revenuesas follows:
|
| Year Ended December 31, |
| |||||||||
|
| 2023 |
|
| 2022 |
|
| 2021 |
| |||
|
| (In millions) |
| |||||||||
Revenue: |
|
|
|
|
|
|
|
|
| |||
Recurring revenue: |
|
|
|
|
|
|
|
|
| |||
Dayforce recurring |
| $ | 1,111.1 |
|
| $ | 815.2 |
|
| $ | 626.6 |
|
Powerpay recurring |
|
| 100.3 |
|
|
| 93.2 |
|
|
| 86.3 |
|
Total Cloud recurring |
|
| 1,211.4 |
|
|
| 908.4 |
|
|
| 712.9 |
|
Other recurring |
|
| 85.9 |
|
|
| 139.2 |
|
|
| 137.8 |
|
Total recurring revenue |
|
| 1,297.3 |
|
|
| 1,047.6 |
|
|
| 850.7 |
|
Professional services and other |
|
| 216.4 |
|
|
| 198.6 |
|
|
| 173.5 |
|
Total revenue |
| $ | 1,513.7 |
|
| $ | 1,246.2 |
|
| $ | 1,024.2 |
|
Recurring revenue includes float revenue of the UK Business previously included in the relief from royalty models used to support the trade name value, we recorded an impairment charge during the year ended December 31, 2016, of $10.2 to the trade name intangible asset. The remaining impairment amount is related to immaterial asset write-offs.
In September 1989, Parent’s predecessor entered into an Environmental Matters Agreement (“EMA”) with Seagate Technology plc (“Seagate”) related to groundwater contamination on a parcel of real estate sold by Parent’s predecessor to Seagate. Ceridian is now responsible for the EMA. The EMA requires expense sharing between Ceridian$168.7 million, $80.2 million, and Seagate for the remediation of groundwater contamination up to a certain limit. Based on additional information obtained with respect to more stringent remediation requirements, we updated our estimate of the potential liability related to the EMA, resulting in an increase to the environmental reserve of $5.9 during the year ended December 31, 2016, which represented the limit under the EMA. Please refer to Note 15, “Commitments and Contingencies,” for further discussion of our environmental liabilities.
Foreign Currency Translation (Income) Expense
We had foreign currency translation income of $2.9$41.1 million for the year ended December 31, 2018. 2023, 2022, and 2021 respectively.
Revenue by Geographic Area
The foreign currency translation incomecountry in which the revenue is recorded is determined by the legal entity with which the customer has contracted. Revenue by country was as follows:
|
| Year Ended December 31, |
| |||||||||
|
| 2023 |
|
| 2022 |
|
| 2021 |
| |||
|
| (In millions) |
| |||||||||
United States |
| $ | 989.5 |
|
| $ | 784.1 |
|
| $ | 624.4 |
|
Canada |
|
| 331.0 |
|
|
| 288.6 |
|
|
| 254.2 |
|
Other |
|
| 193.2 |
|
|
| 173.5 |
|
|
| 145.6 |
|
Total revenue |
| $ | 1,513.7 |
|
| $ | 1,246.2 |
|
| $ | 1,024.2 |
|
86 | 2023 Form 10-K
Contract Balances
We record a contract asset when revenue recognized for professional services or cloud recurring subscription performance obligations exceed the year endedcontractual amount of billings for implementation related professional services and recurring subscriptions. Contract assets were $89.0 million and $68.5 million as of December 31, 2018, was2023 and 2022, respectively. Contract assets expected to be recognized in revenue within twelve months are included within Prepaid expenses and other current assets, with the remaining contract assets included within Other assets on our consolidated balance sheets.
Deferred Revenue
Deferred revenue primarily related to foreign currency remeasurement gains resulting from an intercompany payableconsists of a U.S. operating subsidiary which is repaidpayments received in Canadian dollars. This intercompany payable was repaidadvance of revenue recognition. The changes in the second quarterdeferred revenue were as follows:
|
| Year Ended December 31, |
| |||||
|
| 2023 |
|
| 2022 |
| ||
|
| (In millions) |
| |||||
Deferred revenue, beginning of period |
| $ | 41.2 |
|
| $ | 48.7 |
|
New billings |
|
| 836.4 |
|
|
| 673.6 |
|
Revenue recognized |
|
| (838.1 | ) |
|
| (679.2 | ) |
Effect of exchange rate |
|
| 0.7 |
|
|
| (1.9 | ) |
Deferred revenue, end of period |
| $ | 40.2 |
|
| $ | 41.2 |
|
Transaction Price for Remaining Performance Obligations
As of 2018.
We incurred foreign currency translation expense of $7.3 for the year ended December 31, 2017. The foreign currency translation expense2023, approximately $1.22 billion of revenue is expected to be recognized over the next three years from remaining performance obligations, which represents contracted revenue for recurring services and fixed price professional services, primarily implementation services, that has not yet been recognized, including deferred revenue and unbilled amounts that will be recognized as revenue in future periods. In accordance with the year ended December 31, 2017, waspractical expedient provided in ASC Topic 606, performance obligations that are billed and recognized as they are delivered, primarily related to foreign currency remeasurement losses resultingprofessional services contracts that are on a time and materials basis, are excluded from an intercompany payablethe transaction price for remaining performance obligations disclosed above.
Customer Information
No single customer accounted for 2% or more of a U.S. operating subsidiary which is repaid in Canadian dollars.our consolidated revenue for any of the periods presented.
87 | 2023 Form 10-K
We had foreign currency translation income of $3.4 for the year ended December 31, 2016. The foreign currency translation income for the year ended December 31, 2016, was primarily related to foreign currency remeasurement gains on intercompany receivables and payables between international subsidiaries that were settled in early 2017.
13. Accumulated Other Comprehensive Income (Loss)
The components of accumulated other comprehensive income (loss) were as follows:
|
| Foreign |
|
| Unrealized Gain |
|
| Pension |
|
| Total |
| ||||
|
| (In millions) |
| |||||||||||||
Balance as of December 31, 2021 |
| $ | (177.3 | ) |
| $ | 2.8 |
|
| $ | (150.3 | ) |
| $ | (324.8 | ) |
Other comprehensive loss before income taxes and reclassifications |
|
| (56.7 | ) |
|
| (134.6 | ) |
|
| (17.5 | ) |
|
| (208.8 | ) |
Income tax benefit |
|
| — |
|
|
| 35.4 |
|
|
| 1.5 |
|
|
| 36.9 |
|
Reclassifications to earnings |
|
| — |
|
|
| — |
|
|
| 11.7 |
|
|
| 11.7 |
|
Other comprehensive income |
|
| (56.7 | ) |
|
| (99.2 | ) |
|
| (4.3 | ) |
|
| (160.2 | ) |
Balance as of December 31, 2022 |
|
| (234.0 | ) |
|
| (96.4 | ) |
|
| (154.6 | ) |
|
| (485.0 | ) |
Other comprehensive loss before income taxes and reclassifications |
|
| 16.6 |
|
|
| 54.4 |
|
|
| (17.3 | ) |
|
| 53.7 |
|
Income tax expense |
|
| — |
|
|
| (14.3 | ) |
|
| 3.0 |
|
|
| (11.3 | ) |
Reclassifications to earnings |
|
| — |
|
|
| — |
|
|
| 5.9 |
|
|
| 5.9 |
|
Other comprehensive income |
|
| 16.6 |
|
|
| 40.1 |
|
|
| (8.4 | ) |
|
| 48.3 |
|
Balance as of December 31, 2023 |
| $ | (217.4 | ) |
| $ | (56.3 | ) |
| $ | (163.0 | ) |
| $ | (436.7 | ) |
14. Income Taxes
|
| Foreign Currency Translation Adjustment |
|
| Unrealized Gain (Loss) from Invested Customer Trust Funds |
|
| Pension Liability Adjustment |
|
| Total |
| ||||
Balance as of December 31, 2016 |
| $ | (199.9 | ) |
| $ | 4.7 |
|
| $ | (156.3 | ) |
| $ | (351.5 | ) |
Other comprehensive income (loss) before income taxes and reclassifications |
|
| 39.3 |
|
|
| (17.3 | ) |
|
| 3.7 |
|
|
| 25.7 |
|
Income tax benefit |
|
| — |
|
|
| 3.6 |
|
|
| — |
|
|
| 3.6 |
|
Reclassifications to earnings |
|
| — |
|
|
| — |
|
|
| 10.1 |
|
|
| 10.1 |
|
Other comprehensive income (loss) attributable to Ceridian |
|
| 39.3 |
|
|
| (13.7 | ) |
|
| 13.8 |
|
|
| 39.4 |
|
Balance as of December 31, 2017 |
|
| (160.6 | ) |
|
| (9.0 | ) |
|
| (142.5 | ) |
|
| (312.1 | ) |
Other comprehensive loss before income taxes and reclassifications |
|
| (47.4 | ) |
|
| (10.5 | ) |
|
| (19.3 | ) |
|
| (77.2 | ) |
Income tax benefit |
|
| — |
|
|
| 1.2 |
|
|
| — |
|
|
| 1.2 |
|
Reclassifications to earnings |
|
| — |
|
|
| — |
|
|
| 11.7 |
|
|
| 11.7 |
|
Other comprehensive (loss) income attributable to Ceridian |
|
| (47.4 | ) |
|
| (9.3 | ) |
|
| (7.6 | ) |
|
| (64.3 | ) |
LifeWorks Disposition |
|
| 0.7 |
|
|
| — |
|
|
| — |
|
|
| 0.7 |
|
Balance as of December 31, 2018 |
| $ | (207.3 | ) |
| $ | (18.3 | ) |
| $ | (150.1 | ) |
| $ | (375.7 | ) |
|
| Years Ended December 31, |
| |||||||||
|
| 2023 |
|
| 2022 |
|
| 2021 |
| |||
|
| (In millions) |
| |||||||||
Components of Earnings and Taxes from Operations |
|
|
|
|
|
|
|
|
| |||
Income (loss) before income taxes: |
|
|
|
|
|
|
|
|
| |||
U.S. |
| $ | 109.3 |
|
| $ | (0.7 | ) |
| $ | (73.6 | ) |
International |
|
| (13.3 | ) |
|
| (62.2 | ) |
|
| (16.7 | ) |
Total |
| $ | 96.0 |
|
| $ | (62.9 | ) |
| $ | (90.3 | ) |
Income tax expense (benefit): |
|
|
|
|
|
|
|
|
| |||
Current: |
|
|
|
|
|
|
|
|
| |||
U.S. |
| $ | 7.4 |
|
| $ | 4.5 |
|
| $ | 0.9 |
|
State and local |
|
| 4.0 |
|
|
| 1.9 |
|
|
| 0.4 |
|
International |
|
| 25.7 |
|
|
| 5.8 |
|
|
| 22.3 |
|
Total current income tax expense |
|
| 37.1 |
|
|
| 12.2 |
|
|
| 23.6 |
|
Deferred: |
|
|
|
|
|
|
|
|
| |||
U.S. |
|
| 12.3 |
|
|
| 7.8 |
|
|
| (22.3 | ) |
State and local |
|
| (4.6 | ) |
|
| (2.1 | ) |
|
| (5.0 | ) |
International |
|
| (3.6 | ) |
|
| (7.4 | ) |
|
| (11.2 | ) |
Total deferred income tax expense (benefit) |
|
| 4.1 |
|
|
| (1.7 | ) |
|
| (38.5 | ) |
Total income tax expense (benefit) |
| $ | 41.2 |
|
| $ | 10.5 |
|
| $ | (14.9 | ) |
88 | 2023 Form 10-K
|
| Year Ended December 31, |
| |||||||||
|
| 2023 |
|
| 2022 |
|
| 2021 |
| |||
Effective Tax Rate Reconciliation |
|
|
|
|
|
|
|
|
| |||
Federal statutory tax rate |
|
| 21.0 | % |
|
| 21.0 | % |
|
| 21.0 | % |
Change in valuation allowance |
|
| 10.2 |
|
|
| 2.5 |
|
|
| (0.7 | ) |
State income taxes, net of federal benefit |
|
| 4.7 |
|
|
| 0.8 |
|
|
| 5.9 |
|
Share-based compensation |
|
| 12.1 |
|
|
| (25.6 | ) |
|
| (3.5 | ) |
International tax rate differential |
|
| 0.9 |
|
|
| 0.2 |
|
|
| (2.4 | ) |
Disallowed officers compensation |
|
| 2.6 |
|
|
| — |
|
|
| — |
|
Foreign capital gain income |
|
| — |
|
|
| — |
|
|
| (1.3 | ) |
Unremitted foreign earnings |
|
| — |
|
|
| — |
|
|
| 2.9 |
|
Acquisition costs |
|
| — |
|
|
| — |
|
|
| (2.3 | ) |
Base erosion tax |
|
| 2.7 |
|
|
| (5.7 | ) |
|
| (1.6 | ) |
U.S. tax on international inclusions |
|
| (8.3 | ) |
|
| (11.3 | ) |
|
| — |
|
Reserve for tax contingencies |
|
| 1.0 |
|
|
| — |
|
|
| 2.1 |
|
Tax credits |
|
| (5.9 | ) |
|
| — |
|
|
| — |
|
Change in tax rate |
|
| — |
|
|
| 1.6 |
|
|
| — |
|
Unutilized tax benefits |
|
| — |
|
|
| — |
|
|
| (3.4 | ) |
Other |
|
| 1.9 |
|
|
| (0.2 | ) |
|
| (0.2 | ) |
Total tax rate |
|
| 42.9 | % |
|
| (16.7 | )% |
|
| 16.5 | % |
|
| Year Ended December 31, |
| |||||||||
|
| 2018 |
|
| 2017 |
|
| 2016 |
| |||
Components of Earnings and Taxes from Operations |
|
|
|
|
|
|
|
|
|
|
|
|
(Loss) Income Before Income Taxes: |
|
|
|
|
|
|
|
|
|
|
|
|
U.S. |
| $ | (73.2 | ) |
| $ | (83.4 | ) |
| $ | (163.4 | ) |
International |
|
| 42.8 |
|
|
| 29.3 |
|
|
| 64.8 |
|
Total |
| $ | (30.4 | ) |
| $ | (54.1 | ) |
| $ | (98.6 | ) |
Income Tax Expense (Benefit): |
|
|
|
|
|
|
|
|
|
|
|
|
Current: |
|
|
|
|
|
|
|
|
|
|
|
|
U.S. |
| $ | 3.8 |
|
| $ | (0.3 | ) |
| $ | (0.4 | ) |
State and local |
|
| 0.3 |
|
|
| 0.1 |
|
|
| 0.2 |
|
International |
|
| 20.4 |
|
|
| 12.9 |
|
|
| 15.2 |
|
Total current income tax expense |
|
| 24.5 |
|
|
| 12.7 |
|
|
| 15.0 |
|
Deferred: |
|
|
|
|
|
|
|
|
|
|
|
|
U.S. |
|
| (14.4 | ) |
|
| (60.3 | ) |
|
| (15.7 | ) |
State and local |
|
| (2.2 | ) |
|
| 0.8 |
|
|
| (0.1 | ) |
International |
|
| (0.2 | ) |
|
| (2.8 | ) |
|
| 7.5 |
|
Total deferred income tax (benefit) expense |
|
| (16.8 | ) |
|
| (62.3 | ) |
|
| (8.3 | ) |
Total income tax expense (benefit) |
| $ | 7.7 |
|
| $ | (49.6 | ) |
| $ | 6.7 |
|
|
| Year Ended December 31, |
| |||||||||
|
| 2018 |
|
| 2017 |
|
| 2016 |
| |||
Effective Rate Reconciliation |
|
|
|
|
|
|
|
|
|
|
|
|
U.S. statutory rate% |
|
| (21.0 | )% |
|
| (35.0 | )% |
|
| (35.0 | )% |
Change in valuation allowance |
|
| 10.5 |
|
|
| (116.9 | ) |
|
| (5.4 | ) |
State income taxes, net of federal benefit |
|
| (27.9 | ) |
|
| (5.2 | ) |
|
| (1.2 | ) |
Share-based compensation |
|
| (8.8 | ) |
|
| 8.3 |
|
|
| 2.6 |
|
International tax rate differential |
|
| 11.5 |
|
|
| (6.7 | ) |
|
| (6.4 | ) |
Foreign dividend income |
|
| 17.8 |
|
|
| 48.1 |
|
|
| 1.0 |
|
Foreign capital gain income |
|
| 6.3 |
|
|
| — |
|
|
| — |
|
Unremitted foreign earnings |
|
| 3.6 |
|
|
| (35.6 | ) |
|
| 22.0 |
|
Global intangible low-taxed income |
|
| 20.4 |
|
|
| — |
|
|
| — |
|
Base erosion tax |
|
| 12.5 |
|
|
| — |
|
|
| — |
|
Reserve for tax contingencies |
|
| 0.3 |
|
|
| — |
|
|
| (0.2 | ) |
Expiration of un-utilized tax credits |
|
| — |
|
|
| 1.5 |
|
|
| — |
|
Unrealized gain on investments |
|
| — |
|
|
| — |
|
|
| 30.7 |
|
Change in tax rate |
|
| (5.2 | ) |
|
| 52.4 |
|
|
| — |
|
Other |
|
| 5.3 |
|
|
| (2.6 | ) |
|
| (1.5 | ) |
Income tax provision% |
|
| 25.3 | % |
|
| (91.7 | )% |
|
| 6.6 | % |
Our income tax provision represents federal, state, and international taxes on our income recognized for financial statement purposes and includes the effects of temporary differences between financial statement income and income recognized for tax return purposes. Deferred tax assets and liabilities are recorded for temporary differences between the financial reporting basis and the tax basis of assets and liabilities as adjusted for the expected benefits of utilizing net operating loss carryforwards.liabilities. We record a valuation allowance to reduce our deferred tax assets to reflect the net deferred tax assets that we believe will be realized. In assessing the likelihood that we will be able to recover our deferred tax assets and the need for a valuation allowance, we consider all available evidence, both positive and negative, including historical levels of pre-tax book income, expiration of net operating losses, changes in our debt and equity structure, expectations and risks associated with estimates of future taxable income, and ongoing prudent and feasible tax planning strategies, as well as current tax laws. As of December 31, 2018, and December 31, 2017,2023, we continue to recordhave a full valuation allowance of $55.0 million against our domesticcertain deferred tax assets that are not offset by the reversalprimarily consisting of deferred tax liabilities. In the future, if it is determined that we no longer have a requirement$27.2 million attributable to record a valuation allowance against all or a portion of ourforeign net operating loss carryovers and $24.6 million attributable to other deferred tax assets the releaseprimarily consisting of the valuation allowance would have a positive impact on our income tax provision.foreign intangible assets.
|
| December 31, |
| |||||
|
| 2023 |
|
| 2022 |
| ||
|
| (In millions) |
| |||||
Tax Effect of Items That Comprise a Significant Portion of the Net Deferred Tax Asset and Deferred Tax Liability |
|
|
|
|
|
| ||
Deferred tax asset: |
|
|
|
|
|
| ||
Employment related accruals |
| $ | 31.3 |
|
| $ | 27.8 |
|
Intangibles |
|
| 15.4 |
|
|
| 13.5 |
|
Software development costs |
|
| 51.6 |
|
|
| 14.9 |
|
Depreciation |
|
| 18.1 |
|
|
| 11.2 |
|
Customer funds |
|
| 17.0 |
|
|
| 31.2 |
|
Other |
|
| 23.3 |
|
|
| 33.7 |
|
Foreign tax credit carryover and other credit carryovers |
|
| 5.0 |
|
|
| 0.3 |
|
Net operating loss carryforwards |
|
| 82.7 |
|
|
| 120.8 |
|
Total gross deferred tax asset |
|
| 244.4 |
|
|
| 253.4 |
|
Valuation allowance |
|
| (55.0 | ) |
|
| (44.1 | ) |
Total deferred tax asset |
| $ | 189.4 |
|
| $ | 209.3 |
|
Deferred tax liability: |
|
|
|
|
|
| ||
Intangibles |
| $ | (49.5 | ) |
| $ | (60.8 | ) |
Deferred contract costs |
|
| (45.5 | ) |
|
| (33.5 | ) |
Other |
|
| (12.9 | ) |
|
| (19.0 | ) |
Total deferred tax liability |
|
| (107.9 | ) |
|
| (113.3 | ) |
Net deferred tax asset |
| $ | 81.5 |
|
| $ | 96.0 |
|
89 | 2023 Form 10-K
On December 22, 2017, the Tax Cut and Jobs Act legislation (the “Tax Act”) was signed into law. The Tax Act made broad and complex changes to the U.S. tax code including: (a) lower U.S. federal corporate income tax rate from 35% to 21% effective January 1, 2018, (b) accelerated expensing of qualified capital investments for a specific period, and (c) a transition from a worldwide tax system to a territorial tax system.
|
| December 31, |
| |||||
|
| 2023 |
|
| 2022 |
| ||
|
| (In millions) |
| |||||
Net Deferred Tax by Geography |
|
|
|
|
|
| ||
U.S. |
| $ | 66.8 |
|
| $ | 79.8 |
|
International |
|
| 14.7 |
|
|
| 16.2 |
|
Total |
| $ | 81.5 |
|
| $ | 96.0 |
|
ASC 740, Income Taxes, requires a company to record the effects of a tax law change in the period of enactment; however, shortly after enactment of the Tax Act, the SEC staff issued Staff Accounting Bulletin (“SAB”) 118, which allows a company to record a provisional amount when it does not have the necessary information available to complete its accounting for the change in the tax law. The FASB subsequently issued ASU No. 2018-05 to codify SAB 118 by amending ASC 740. ASU No. 2018-05 continues to allow a company to record a provisional amount when it does not have the necessary information available, prepared, or analyzed in reasonable detail to complete its accounting for the change in the tax law. The measurement period ends when the company has obtained, prepared, and analyzed the information necessary to finalize its accounting, but cannot extend beyond one year.
We have completed our analysis of the income tax effects of the Tax Act. In January and April of 2018, the Internal Revenue Service (the “IRS”) issued guidance that provided additional clarification on certain aspects of the transition tax calculation. The application of the additional IRS guidance resulted in a $16.2 increase in includible untaxed foreign earnings, which resulted in a $5.7 increase in tax expense. This increase was offset by the tax benefit of the utilization of $16.2 of net operating loss carryover. The overall impact to tax expense in the year ended December 31, 2018, was zero.
Other provisions introduced by the Tax Act that had a significant impact on our current year tax provision were the provisions introducing the Global Intangible Low-Taxed Income (“GILTI”) and the Base Erosion and Anti-Abuse Tax (“BEAT”). The GILTI resulted in an increase of $29.7 in taxable income, which resulted in a $6.6 increase in tax expense. This tax increase was offset by the tax benefit of the utilization of $29.7 of net operating loss carryover. The BEAT resulted in an increase of $3.8 in tax expense in the year ended December 31, 2018.
|
| December 31, |
| |||||
|
| 2018 |
|
| 2017 |
| ||
Tax Effect of Items That Comprise a Significant Portion of the Net Deferred Tax Asset and Deferred Tax Liability |
|
|
|
|
|
|
|
|
Deferred Tax Asset: |
|
|
|
|
|
|
|
|
Employment related accruals |
| $ | 51.2 |
|
| $ | 51.0 |
|
Foreign tax credit carryover and other credit carryovers |
|
| 0.3 |
|
|
| 0.2 |
|
Net operating loss carryforwards |
|
| 78.2 |
|
|
| 100.3 |
|
Total gross deferred tax asset |
|
| 129.7 |
|
|
| 151.5 |
|
Valuation allowance |
|
| (93.3 | ) |
|
| (90.7 | ) |
Total deferred tax asset |
| $ | 36.4 |
|
| $ | 60.8 |
|
Deferred Tax Liability: |
|
|
|
|
|
|
|
|
Intangibles |
| $ | (62.1 | ) |
| $ | (65.7 | ) |
Unremitted foreign earnings |
|
| — |
|
|
| — |
|
Unrealized gain on investment |
|
| — |
|
|
| (22.2 | ) |
Other |
|
| (5.8 | ) |
|
| (5.0 | ) |
Total deferred tax liability |
|
| (67.9 | ) |
|
| (92.9 | ) |
Net deferred tax liability |
| $ | (31.5 | ) |
| $ | (32.1 | ) |
|
| December 31, |
| |||||
|
| 2018 |
|
| 2017 |
| ||
Net Deferred Tax by Geography |
|
|
|
|
|
|
|
|
U.S. |
| $ | (19.8 | ) |
| $ | (18.4 | ) |
International |
|
| (11.7 | ) |
|
| (13.7 | ) |
Total |
| $ | (31.5 | ) |
| $ | (32.1 | ) |
As of December 31, 2018,2023, we had federal, state, and foreign net operating loss carryovers, which will reduce future taxable income when utilized. Approximately $47.2$28.4 million in net federal tax benefit is available from the loss carryovers and an additional $0.3 is available in federal tax credit carryovers. The state loss carryovers will result in state tax benefit of approximately $31.0 when utilized. The federal net operating loss tax benefit has an indefinite carryover period. The state loss carryovers and foreign loss carryovers will begin to expireresult in 2031,a tax benefit of approximately $23.2 million and $31.1 million, respectively, when utilized. The state net operating loss carryovers will begin to expire in 2019.2024. The federalmajority of the foreign operating loss carryovers have an indefinite carryover period. The $5.0 million tax credit carryovers are composedcarryover consists primarily of foreign taxresearch credits whichthat will begin to expire in 2019; research credits, which will begin to expire in 2027; and alternative minimum tax credits, which have no expiration date.2042.
As of December 31, 2018, we carried a full valuation allowance against our domestic net deferred tax asset (“DTA”) position after excluding a portion of the deferred tax liability for long-lived, non-amortizable taxable temporary differences. We periodically re-assess the likelihood that DTA reported in the accompanying consolidated financial statements will be recovered from future taxable income.
We have re-evaluated the likelihood of recovering our net DTA, and we have determined that it is still more likely than not that the tax benefit associated with a portion of the DTA will not be realized. We assessed the available positive and negative evidence to estimate if sufficient future taxable income will be generated to use the existing net DTAs not already identified as requiring a valuation allowance. The cumulative loss incurred over the three-year period ended December 31, 2018, is a significant piece of objective negative evidence. Such objective evidence limits the ability to consider other subjective evidence, such as our projections for positive future growth. As of December 31, 2018, we had a total valuation allowance of $93.3. The amount of the DTA considered realizable could be adjusted in the future if objective negative evidence in the form of cumulative losses is no longer present, and additional weight may be given to subjective evidence, such as our projections for growth.
We file income tax returns in the U.S. federal jurisdiction, and various states and foreign jurisdictions. With a few exceptions, we are no longer subject to U.S. federal, state and local, or non-U.S. income tax examinations by tax authorities for years before 2014.2019.
The following table summarizes the activity for unrecognized tax benefits:
|
| Year Ended December 31, |
| |||||
|
| 2018 |
|
| 2017 |
| ||
Federal, State and Foreign Tax |
|
|
|
|
|
|
|
|
Beginning unrecognized tax balance |
| $ | 1.5 |
|
| $ | 1.4 |
|
Increase prior period positions |
|
| 0.1 |
|
|
| 0.2 |
|
Increase current period positions |
|
| 0.2 |
|
|
| 0.1 |
|
Decrease prior period positions |
|
| (0.1 | ) |
|
| — |
|
Decrease current period positions |
|
| (0.3 | ) |
|
| — |
|
Statutes expiring |
|
| (0.1 | ) |
|
| (0.2 | ) |
Ending unrecognized tax benefits |
| $ | 1.3 |
|
| $ | 1.5 |
|
|
| Year Ended |
| |||||
|
| 2023 |
|
| 2022 |
| ||
|
| (In millions) |
| |||||
Federal, State and Foreign Tax |
|
|
|
|
|
| ||
Beginning unrecognized tax balance |
| $ | — |
|
| $ | — |
|
Increase in current period positions |
|
| 1.0 |
|
|
| — |
|
Ending unrecognized tax benefits |
| $ | 1.0 |
|
| $ | — |
|
The total amount of unrecognized tax benefits as of December 31, 2018,2023, was $1.3 including $0.2 of accrued interest and penalty. Of the total amount of unrecognized tax benefits, $1.3$1.0 million. The $1.0 million represents the amount that, if recognized, would impact our effective income tax rate as of December 31, 2018. It is expected2023. We make adjustments to these reserves when facts and circumstances change, such as the closing of tax audits or the refinement of an estimate. To the extent that the amountfinal tax outcome of unrecognized tax benefitsthese matters is different than the amounts recorded, such differences will changeaffect the provision for income taxes in the next 12 months; however, we cannot reasonably estimate the amount of the change. We do not expect the change toperiod in which such determination is made and could have a significantmaterial impact on our results of operations or financial condition.condition and operating results.
The Tax Act imposed a mandatory transition tax on the unremitted earnings of our international subsidiaries and generally eliminated US taxes on foreign subsidiary distributions for years beginning after December 31, 2017. As of December 31, 2018,2023, we have $298.5$442.8 million of unremitted foreign earnings. We consider $174.6 ofall the unremitted earnings to be indefinitely reinvested. For the portion of theBecause all unremitted earnings not considered indefinitely reinvested, $123.9, we have provided a deferred tax liability of $6.2, which represents the expected withholding tax cost of repatriating such earnings. In the event the portion of the unremitted earningsare considered to be indefinitely reinvested, were repatriated, we would incurno deferred tax liability has been recorded. It is not practical to make a withholdingdetermination of any unrecognized tax expenseliability because of approximately $8.7. the complexities of the hypothetical calculation.
15. Commitments and Contingencies
Leasing
We conduct substantially all of our operations in leased facilities. Most of our leases contain renewal options and require payments for taxes, insurance and maintenance. We recognize rent holidays, including the time period during which we have access to the property for construction of improvements, construction allowances and escalating rent provisions on a straight-line basis over the term of the lease.
Substantially all of our leasing arrangements for equipment and facilities are operating leases and the rental payments under these leases are charged to operations as incurred. The amounts in the accompanying tables do not include capital lease obligations recorded as liabilities.
Our rental expense and sublease income were as follows:
|
| Year Ended December 31, |
| |||||||||
|
| 2018 |
|
| 2017 |
|
| 2016 |
| |||
Rental Expense, Net |
|
|
|
|
|
|
|
|
|
|
|
|
Rental expense |
| $ | 17.6 |
|
| $ | 17.0 |
|
| $ | 16.8 |
|
Sublease rental income |
|
| (4.9 | ) |
|
| (4.2 | ) |
|
| (3.5 | ) |
Net rental expense |
| $ | 12.7 |
|
| $ | 12.8 |
|
| $ | 13.3 |
|
Our future minimum noncancellable lease payments on existing operating leases at December 31, 2018, which have an initial term of more than one year, are as follows:
Years Ending December 31, |
| Amount |
| |
2019 |
| $ | 13.6 |
|
2020 |
|
| 11.8 |
|
2021 |
|
| 7.7 |
|
2022 |
|
| 7.4 |
|
2023 |
|
| 6.2 |
|
Thereafter |
|
| 9.4 |
|
Total (a) |
| $ | 56.1 |
|
|
|
Environmental Matters
We accrue for losses associated with environmental remediation obligations when such losses are probable and reasonably estimable. Accruals for estimated losses from environmental remediation obligations generally are recognized no later than completion of the remedial feasibility study. Such accruals are adjusted as further information develops or circumstances change. Costs of future expenditures for environmental remediation obligations are not discounted to their present value.
In February 1988, Parent’s predecessor entered into an arrangement with Northern Engraving Corporation (“NEC”) and the Minnesota Pollution Control Agency (“MPCA”) in relation to groundwater contamination on a parcel of real estate sold by Parent’s predecessor to NEC. Ceridian is now responsible for the arrangement with NEC and the MPCA. The arrangement requires expense sharing between Ceridian and NEC for the remediation of groundwater contamination.
In September 1989, Parent’s predecessor entered into an EMA with Seagate related to groundwater contamination on a parcel of real estate sold by Parent’s predecessor to Seagate. Ceridian is now responsible for the EMA. The EMA requires expense sharing between Ceridian and Seagate for the remediation of groundwater contamination up to a certain limit. Based on additional information obtained with respect to more stringent remediation requirements, we updated our estimate of the potential liability related to the EMA, resulting in an increase to the environmental reserve of $5.9 for the year ended December 31, 2016, which represented the limit under the EMA.
We have recognized an undiscounted liability of approximately $5.2 and $5.4 as of December 31, 2018 and 2017, respectively, in our consolidated balance sheets to comply with the NEC arrangement and EMA described above. The ultimate cost, however, will depend on the extent of continued monitoring activities as these projects progress. Please refer to Note 12, “Supplementary Data to Statements of Operations,” for further discussion of changes in the liability during the year ended December 31, 2016.
Legal Matters
We are subject to claims and a number of judicial and administrative proceedings considered normal in the course of our current and past operations, including employment-related disputes, contract disputes, disputes with our competitors, intellectual property disputes, government audits and proceedings, customer disputes, and tort claims. In some proceedings, the claimant seeks damages as well as other relief, which, if granted, would require substantial expenditures on our part.
Our general terms and conditions in customer contracts frequently include a provision indicating we will indemnify and hold our customers harmless from and against any and all claims alleging that the services and materials furnished by us violate any third party’s patent, trade secret, copyright or other intellectual property right. We are not aware of any material pending litigation concerning these indemnifications.
90 | 2023 Form 10-K
Some of these matters raise difficult and complex factual and legal issues and are subject to many uncertainties, including the facts and circumstances of each particular action, and the jurisdiction, forum, and law under which each action is proceeding. Because of these complexities, final disposition of some of these proceedings may not occur for several years. As such, we are not always able to estimate the amount of our possible future liabilities, if any.
There can be no certainty that we may not ultimately incur charges in excess of presently established or future financial accruals or insurance coverage. Although occasional adverse decisions or settlements may occur, it is management’s opinion that the final disposition of these proceedings will not, considering the merits of the claims and available resources or reserves and insurance, and based upon the facts and circumstances currently known, have a material adverse effect on our financial position or results of operations.
16. Related Party TransactionsEnvironmental Matters
Management AgreementsWe accrue for losses associated with environmental remediation obligations when such losses are probable and reasonably estimable. Accruals for estimated losses from environmental remediation obligations generally are recognized no later than completion of the remedial feasibility study. Such accruals are adjusted as further information develops or circumstances change. Costs of future expenditures for environmental remediation obligations are not discounted to their present value.
Prior toIn February 1988, our IPO, Ceridian was party to management agreementspredecessor entered into an arrangement with affiliates of our Sponsors, Fidelity National Financial, Inc.Northern Engraving Corporation (“FNF”NEC”) and THL Managers VI, LLCthe Minnesota Pollution Control Agency (“THLM”MPCA”). FNF assigned its management in relation to groundwater contamination on a parcel of real estate sold by our predecessor to NEC. We are now responsible for the arrangement with NEC and the MPCA. The arrangement requires expense sharing between us and NEC for the remediation of groundwater contamination.
In September 1989, our predecessor entered into an environmental matters agreement ("EMA") with Seagate related to Cannae in November 2017. Pursuantgroundwater contamination on a parcel of real estate sold by our predecessor to these management agreements, CannaeSeagate. We are now responsible for the EMA. The EMA requires expense sharing between us and THLM each, respectively, agreedSeagate for the remediation of groundwater contamination up to provide the Company with financial advisory, strategic, and general oversight services. These management agreements provided that we pay annual management fees to each of Cannae and THLM ina certain limit. We have recognized an amountenvironmental reserve liability equal to the greaterEMA limit.
We have recognized an undiscounted liability of (a) $0.9, or (b) 0.5 percent of Adjusted EBITDA. Adjusted EBITDA, for purposes of the management agreements, is EBITDA as defined in the 2014 Senior Secured Credit Facility, further adjusted to exclude the payments made pursuant to the management agreementsapproximately $4.0 million and certain stock options or other equity compensation.
In April 2018, the management agreements terminated upon consummation of our IPO. Upon termination, the management agreements provided that we pay a termination fee equal to the net present value of the management fee for a seven-year period, which was $11.3.
We recorded a management fee expense in selling, general, and administrative expense of $12.0, $1.9, and $5.0 for the years ended December 31, 2018, 2017, and 2016, respectively, related to these management agreements. The expense for the year ended December 31, 2016, included transaction advisory fees of $3.0 related to the issuance of the senior convertible participating preferred stock. Please refer to Note 18, “Capital Stock,” for further discussion of this transaction.
Indebtedness
Prior to its split-off from FNF, Cannae was an affiliate of FNF. FNF and its subsidiaries owned $24.0 of the Senior Notes$4.3 million as of December 31, 2017,2023 and 2016, respectively. Based on this ownership, $1.3, $3.2,2022, respectively, in our consolidated balance sheets to comply with the NEC and $3.2 in interest payments were made to affiliates of Cannae during the years ended December 31, 2018, 2017,MPCA arrangement and 2016, respectively.EMA described above. The affiliates of Cannae conducted the debt transactions through third parties in the ordinary course of their business and not directly with us. Following Cannae’s split-off from FNF, FNF retained ownership of the Senior Notes.
Service and Vendor Related Agreements
Ceridian is a party to a service agreement with CompuCom Systems, Inc. (“CompuCom”), an investment portfolio company of THL Partners. Pursuant to the service agreement, CompuCom agrees to provide us with service desk and desk side support services. Pursuant to this arrangement, we made payments to CompuCom totaling $1.8, $3.1, and $5.0 during the years ended December 31, 2018, 2017, and 2016, respectively.
Other Transactions
On July 23, 2018, Ronald F. Clarke was appointed to our Board of Directors. Mr. Clarke has been the chief executive officer of FleetCor Technologies Inc. (“FleetCor Technologies”) since August 2000 and its chairman of the board of directors since March 2003. We provide services to FleetCor Technologies or one of its wholly owned affiliates through certain commercial arrangements entered into in the ordinary course of business, which include provision of Dayforce HCM services, reseller or referral arrangements whereby we resell or refer FleetCor Technologies services to its customers, and other administrative services. For these services, we have recorded revenue of $2.3 and $2.9 for the years ended December 31, 2018, and 2017, respectively. We are also a corporate charge card customer of FleetCor Technologies. FleetCor Technologies receives a fee from the merchants from whom purchases are madeultimate cost, however, will depend on the FleetCor Technologies corporate charge card by us. In connection with charge card purchases made by us, FleetCor Technologies has provided us with rebatesextent of approximately $0.2 for year ended December 31, 2017.continued monitoring activities as these projects progress.
91 | 2023 Form 10-K
We provide Dayforce and related services to The Stronach Group, for which we recorded revenue of $0.3 and $0.2 for the years ended December 31, 2018, and 2016, respectively. Alon Ossip, the brother of David Ossip, was the chief executive officer, and is currently a minority shareholder, of The Stronach Group.
We provide payroll-related tax filing services to FNF for which we recorded revenue of $0.4, $0.5, and $0.3 for the years ended December 31, 2018, 2017, and 2016, respectively.16. Related Party Transactions
We provide Dayforce and related services to certain investment portfolio companies of THLM and Cannae. We recorded revenue of $1.8 million from American Blue Ribbon Holdings, LLC; $0.5 million from Essex Bargain Hunt Superstores; $0.5 million from Guaranteed Rate; $0.3 million from Phillips Feed Services; and $0.3 million from System One Holdings LLC for the year ended December 31, 2018.
17. Segments and Financial Data by Solution and Geographic Area
Segments
After consideration of the LifeWorks Disposition, management has concluded that we have one operating and reportable segment. This conclusion aligns with how management monitors operating performance, allocates resources, and deploys capital. Please refer to Note 3, “Discontinued Operations,” for further discussion of the LifeWorks Disposition.
Our Solutions
We categorize our solutions into two categories: Cloud and Bureau offerings.
|
Bureau revenue is generated primarily from HCM solutions delivered via a service-bureau model. These solutions are delivered via three primary service lines: payroll, payroll-related tax filing services, and outsourced human resource solutions. Revenue from payroll services is generated from recurring fees charged on a per-process basis. Typical processes include the customer’s payroll runs, year-end tax packages, and delivery of customers’ remittance advices or checks. In addition to customers who use our payroll services, certain customers use our tax filing services on a stand-alone basis. Our outsourced human resource solutions are tailored to meet the needs of individual customers, and entail our contracting to perform many of the duties of a customer’s human resources department, including payroll processing, time and labor management, performance management, and recruiting. We also perform individual services for customers, such as check printing, wage attachment and disbursement, and Affordable Care Act (“ACA”) management. Additional items included in Bureau revenue are custom professional services revenue; investment income generated from holding Bureau customer funds in trust before funds are remitted to taxing authorities, Bureau customer employees, or other third parties; consulting services related to Bureau offerings; and revenue from the salethese related parties was as follows:
|
|
|
| Year Ended December 31, |
| |||||||||
Counter-Party |
| Related Persons Interest |
| 2023 |
|
| 2022 |
|
| 2021 |
| |||
|
|
|
| (In millions) |
| |||||||||
FleetCor Technologies, Inc. |
| Shared board members. One board member is also the CEO and the chairman of the board of the counter-party |
| $ | 0.9 |
|
| $ | 0.8 |
|
| $ | 0.6 |
|
The Stronach Group |
| The brother of David D. Ossip, our Chair and CEO, was formerly the CEO, and is currently a minority shareholder |
|
| 0.1 |
|
|
| 0.1 |
|
|
| 0.1 |
|
Verve Senior Living |
| David D. Ossip, our Chair and CEO, and his brother are currently minority shareholders |
|
| 0.4 |
|
|
| 0.4 |
|
|
| 0.4 |
|
Environmental 360 Solutions |
| David D. Ossip's, our Chair and CEO, brother is a board member |
|
| 0.5 |
|
|
| 0.2 |
|
|
| — |
|
Fidelity National Financial, Inc. |
| Shared board members |
|
| 0.4 |
|
|
| 0.4 |
|
|
| 0.4 |
|
Guaranteed Rate, Inc. |
| Portfolio company of Thomas H. Lee Partners, L.P. ("THL"), of which certain members of our board are managing directors. |
|
| 1.7 |
|
|
| 1.7 |
|
|
| 1.7 |
|
HighTower Advisors, LLC |
| Portfolio company of THL, of which certain members of our board are managing directors. One board member also serves on the board of HT Holding, LLC, which is an affiliate of the counter-party |
|
| 0.4 |
|
|
| 0.4 |
|
|
| 0.3 |
|
Ten-X, LLC |
| Portfolio company of THL, of which certain members of our board are managing directors |
|
| 0.2 |
|
|
| 0.2 |
|
|
| 0.2 |
|
Smile Doctors |
| Portfolio company of THL, of which certain members of our board are managing directors |
|
| 1.1 |
|
|
| 1.0 |
|
|
| — |
|
The Dun & Bradstreet Corporation |
| Shared board members with Dun & Bradstreet Holdings, Inc., which owns the counter-party and is a portfolio company of THL |
|
| 1.8 |
|
|
| 1.8 |
|
|
| — |
|
We are party to service agreements with certain companies that are considered related parties. Payments made to related parties were as follows:
|
|
|
| Year Ended December 31, |
| |||||||||
Counter-Party |
| Related Persons Interest |
| 2023 |
|
| 2022 |
|
| 2021 |
| |||
|
|
|
| (In millions) |
| |||||||||
Manulife Financial |
| Shared board member |
| $ | 10.0 |
|
| $ | 6.0 |
|
| $ | 8.1 |
|
The Dun & Bradstreet Corporation |
| Shared board members with Dun & Bradstreet Holdings, Inc., which owns the counter-party and is a portfolio company of THL |
|
| 3.2 |
|
|
| 0.3 |
|
|
| 0.4 |
|
92 | 2023 Form 10-K
Revenue by solution is as follows:
|
| Year Ended December 31, |
| |||||||||
|
| 2018 |
|
| 2017 |
|
| 2016 |
| |||
Cloud |
| $ | 534.3 |
|
| $ | 404.3 |
|
| $ | 297.8 |
|
Bureau |
|
| 212.1 |
|
|
| 266.5 |
|
|
| 325.6 |
|
Total revenue |
| $ | 746.4 |
|
| $ | 670.8 |
|
| $ | 623.4 |
|
Geographic and Customer Information
No single customer accounts for 1% or more of our consolidated revenue for any of the periods presented.
Revenue by country is as follows. The country in which the revenue is recorded is determined by the legal entity with which the customer has contracted.
|
| Year Ended December 31, |
| |||||||||
|
| 2018 |
|
| 2017 |
|
| 2016 |
| |||
United States |
| $ | 518.5 |
|
| $ | 465.2 |
|
| $ | 432.7 |
|
Canada |
|
| 224.7 |
|
|
| 203.4 |
|
|
| 189.0 |
|
Other |
|
| 3.2 |
|
|
| 2.2 |
|
|
| 1.7 |
|
Total revenue |
| $ | 746.4 |
|
| $ | 670.8 |
|
| $ | 623.4 |
|
Long-lived assets by country is as follows:
|
| December 31, |
| |||||
|
| 2018 |
|
| 2017 |
| ||
United States |
| $ | 1,778.7 |
|
| $ | 1,786.1 |
|
Canada |
|
| 438.1 |
|
|
| 480.6 |
|
Other |
|
| 2.5 |
|
|
| 2.8 |
|
Total long-lived assets |
| $ | 2,219.3 |
|
| $ | 2,269.5 |
|
18.17. Capital Stock and Net Income (Loss) per Share
As of October 1, 2013, Ceridian was authorized to issue 100,000,000 shares of common stock with a par value of $0.01 per share and 70,000,000 shares of junior convertible participating preferred stock (“Junior Preferred Stock”) with a par value of $0.01 per share. On March 30, 2016, the Board of Directors increased the number of authorized shares of common stock to 150,000,000 and authorized 70,000,000 shares of senior convertible participating preferred stock (“Senior Preferred Stock”) with a par value of $0.01 per share. In April 2018, the Board of Directors increased the number of authorized shares of common stock to 500,000,000 and decreased the number of authorized shares of preferred stock to 10,000,000.
On March 30, 2016, we entered into an equity financing transaction with Ceridian Holding II. Ceridian Holding II raised $150.2 from our Sponsors, certain of their co-investors, and certain other existing stockholders of Ceridian Holding. Of such amount, $75.0 was contributed by Ceridian Holding II to Ceridian on March 30, 2016. The remaining $75.2 was committed to be funded to Ceridian HCM Holding Inc. within the following three years, and was recorded within equity as a receivable from stockholder. During the second quarter of 2017, the board of directors of Ceridian Holding II approved the funding of the remaining $75.2, which was transferred to Ceridian HCM Holding Inc. on June 28, 2017.
In connection therewith, Ceridian issued $150.2 of the Senior Preferred Stock to Ceridian Holding II. The Senior Preferred Stock was senior in priority to all outstanding equity securities of Ceridian and had the rights to be converted to common stock at the option of the stockholder for a number of shares based on the conversion price. The initial conversion price was equal to the original issuance price and was subject to adjustment for certain events of dilution, including common stock dividends, stock splits, mergers and reorganizations, and the initial public offering price upon such event. In the event of an initial public offering, the Senior Preferred Stock would be automatically converted to common stock. The Senior Preferred Stock received a 12.5% annual dividend (not cash paying). In the event of liquidation, the Senior Preferred Stock had a liquidation preference equal to 1.5 times the initial face amount plus any accrued but unpaid dividends.
The Junior Preferred Stock provided holders with the equivalent number of votes on an “as converted” basis. The Junior Preferred Stock had the rights to be converted to common stock at the option of the holder for a number of shares based on the conversion price. The initial conversion price was equal to the original issuance price adjusted for certain events of dilution other than shares issued to employees and directors pursuant to the 2013 SIP and certain other instances of issuances of shares of common stock. In the event of an initial public offering, the Junior Preferred Stock would be automatically converted to common stock. In the event of liquidation, Junior Preferred Stock received the greater of up to $13.50 per share of preferred stock (adjusted for dividend, stock split, combination or other similar recapitalization with respect to the convertible participating preferred stock) or a pro rata price per share of all common stock if converted in a liquidation event, subject to the total amount of net assets available in liquidation.
On April 30, 2018, we completed our IPO, in which we issued a total of 24,150,000 shares of common stock at a public offering price of $22.00. Concurrently with our IPO, we issued an additional 4,545,455 shares of our common stock in a private placement at $22.00 per share. Concurrent with the IPO and private placement, all outstanding Junior and Senior Preferred Stock were automatically converted into common shares pursuant to their terms.
As of December 31, 2018,2023 and 2022, there were 139,453,710 shares of common stock issued156.3 million and outstanding. As of December 31, 2017, there were 65,285,962153.9 million shares of common stock issued and outstanding, 16,802,144 shares of Senior Preferred Stock issued and outstanding, and 58,244,308 shares of Junior Preferred Stock issued and outstanding.respectively.
Holders of our common stock are entitled to the rights set forth as follows. Directors are elected by a plurality of the votes entitled to be cast except as set forth below with respect to directors to be elected by the holders of common stock. Our stockholders do not have cumulative voting rights. Except as otherwise provided in our third amended and restated certificate of incorporation or as required by law, all matters to be voted on by our stockholders other than matters relating to the elections and removal of directors must be approved by a majority of the shares present in person or by proxy at the meeting and entitled to vote on the subject matter or by a written resolution of the stockholders representing the number of affirmative votes required for such matter at a meeting.
Our stockholders have no preemptive or other rights to subscribe for additional shares. All holders of our common stock are entitled to share equally on a share-for-share basis in any assets available for distribution to common stockholders upon our liquidation, dissolution or winding up. All outstanding shares are validly issued, fully paid and nonassessable.
We compute net loss per share of common stock using the treasury stock method.
Basic net lossincome (loss) per share is computed by dividing net loss attributable to Ceridianincome (loss) available to common stockholders by the weighted-averageweighted average number of shares of common stock outstanding during the period.
For the calculation of diluted net lossincome (loss) per share, net lossincome (loss) per share is adjusted by the effect of dilutive securities, including awards under our share-based compensation plans. Diluted net lossincome (loss) per share is computed by dividing the resulting net loss attributable to Ceridian available to common stockholdersincome (loss) by the weighted-averageweighted average number of fully diluted common shares outstanding. In the years ended December 31, 2018, 2017,2022, and 2016,2021 our potential dilutive shares, such as term-based stock options, RSUs, and shares of senior and junior convertible preferred stockPSUs were not included in the computation of diluted net loss per share as the effect of including these shares in the calculation would have been anti-dilutive.
The numerators and denominators of the basic and diluted net lossincome (loss) per share computations arewere calculated as follows:
|
| Years Ended December 31, |
| |||||||||
|
| 2023 |
|
| 2022 |
|
| 2021 |
| |||
|
| (In millions, except per share data) |
| |||||||||
Numerator: |
|
|
|
|
|
|
|
|
| |||
Net income (loss) |
| $ | 54.8 |
|
| $ | (73.4 | ) |
| $ | (75.4 | ) |
|
|
|
|
|
|
|
|
|
| |||
Denominator: |
|
|
|
|
|
|
|
|
| |||
Weighted average shares outstanding - basic |
|
| 155.3 |
|
|
| 152.9 |
|
|
| 150.4 |
|
Effect of dilutive equity instruments |
|
| 3.2 |
|
|
| — |
|
|
| — |
|
Weighted average shares outstanding - diluted |
|
| 158.5 |
|
|
| 152.9 |
|
|
| 150.4 |
|
|
|
|
|
|
|
|
|
|
| |||
Net income (loss) per share - basic |
| $ | 0.35 |
|
| $ | (0.48 | ) |
| $ | (0.50 | ) |
Net income (loss) per share - diluted |
| $ | 0.35 |
|
| $ | (0.48 | ) |
| $ | (0.50 | ) |
|
| Year Ended December 31, |
| |||||||||
|
| 2018 |
|
| 2017 |
|
| 2016 |
| |||
Numerator: |
|
|
|
|
|
|
|
|
|
|
|
|
Net loss attributable to Ceridian |
| $ | (63.4 | ) |
| $ | (9.2 | ) |
| $ | (92.9 | ) |
Less: (Loss) income from discontinued operations |
|
| (25.8 | ) |
|
| (6.0 | ) |
|
| 12.5 |
|
Net loss from continuing operations attributable to Ceridian |
|
| (37.6 | ) |
|
| (3.2 | ) |
|
| (105.4 | ) |
Less: Senior Preferred Stock dividends declared |
|
| 7.7 |
|
|
| 20.5 |
|
|
| 14.1 |
|
Net loss from continuing operations attributable to Ceridian available to common stockholders |
| $ | (45.3 | ) |
| $ | (23.7 | ) |
| $ | (119.5 | ) |
Denominator: |
|
|
|
|
|
|
|
|
|
|
|
|
Weighted-average shares outstanding—basic |
|
| 114,049,682 |
|
|
| 65,204,960 |
|
|
| 64,988,338 |
|
Weighted-average shares outstanding—diluted |
|
| 114,049,682 |
|
|
| 65,204,960 |
|
|
| 64,988,338 |
|
Net loss per share from continuing operations attributable to Ceridian—basic and diluted |
| $ | (0.40 | ) |
| $ | (0.36 | ) |
| $ | (1.84 | ) |
Net (loss) income per share from discontinued operations—basic and diluted |
| $ | (0.22 | ) |
| $ | (0.10 | ) |
| $ | 0.19 |
|
Net loss per share attributable to Ceridian—basic and diluted |
| $ | (0.62 | ) |
| $ | (0.46 | ) |
| $ | (1.65 | ) |
The following potentially dilutive shares were excluded from the calculation of diluted net lossincome (loss) per share because their effect would have been anti-dilutive:
|
| Year Ended December 31, |
| |||||||||
|
| 2023 |
|
| 2022 |
|
| 2021 |
| |||
|
| (In millions) |
| |||||||||
Stock options |
|
| 2.4 |
|
|
| 5.6 |
|
|
| 5.9 |
|
Restricted stock units |
|
| — |
|
|
| 0.5 |
|
|
| 0.6 |
|
Performance stock units |
|
| — |
|
|
| 1.4 |
|
|
| 0.5 |
|
|
| Year Ended December 31, |
| |||||||||
|
| 2018 |
|
| 2017 |
|
| 2016 |
| |||
Senior convertible preferred stock |
|
| 5,523,993 |
|
|
| 16,802,144 |
|
|
| 12,601,608 |
|
Junior convertible preferred stock |
|
| 19,148,814 |
|
|
| 58,244,308 |
|
|
| 58,244,308 |
|
Stock options |
|
| 14,227,487 |
|
|
| 10,201,105 |
|
|
| 8,423,124 |
|
RSUs |
|
| 587,283 |
|
|
| 451,190 |
|
|
| 155,692 |
|
93 | 2023 Form 10-K
The shares underlying the conversion option in the Convertible Senior Notes were not considered in the calculation of diluted net loss per share as the effect would have been anti-dilutive. Based on the initial conversion price, the entire outstanding principal amount of the Convertible Senior Notes as of December 31, 2023, would have been convertible into approximately 4.3 million shares of our common stock. Since we expect to settle the principle amount of the Convertible Senior Notes in cash, we use the treasury stock method for calculating any potential dilutive effect on diluted net income per share, if applicable. As a result, only the amount by which the conversion value exceeds the aggregate principal amount of the Convertible Senior Notes (the “conversion spread”) is considered in the diluted earnings per share computation. The conversion spread has a dilutive impact on diluted net income per share when the average market price of our common stock for a given period exceeds the initial conversion price of $132.20 per share for the Convertible Senior Notes. We excluded the potentially dilutive effect of the conversion spread of the Convertible Senior Notes as the average market price of our common stock during the twelve months ended December 31, 2023, was less than the conversion price of the Convertible Senior Notes. In connection with the issuance of the Convertible Senior Notes, we entered into Capped Calls, which were not included for purposes of calculating the number of diluted shares outstanding, as their effect would have been anti-dilutive.
18. Subsequent Events
Effective on January 31, 2024, Ceridian HCM Holding Inc. changed its corporate name to Dayforce, Inc. Effective on February 1, 2024, we ceased trading under the ticker symbol "CDAY" and began trading under our new ticker symbol, "DAY," on the NYSE and the Toronto Stock Exchange.
On February 1, 2024 we completed the purchase of 100% of the outstanding shares of eloomi A/S, a learning experience platform software provider based in Copenhagen, Denmark, and Orlando, Florida.
94 | 2023 Form 10-K
Item 9. Changes in and Disagreements With AccountantsAccountants on Accounting and Financial Disclosure.
None.
Item 9A. Controls and Procedures.
Evaluation of Disclosure Controls and Procedures
We maintain “disclosureManagement, under the supervision and with the participation of the Chief Executive Officer and Chief Financial Officer, have conducted an evaluation of the effectiveness of the design and operation of our disclosure controls and procedures” as (as defined in RuleRules 13a-15(e) and Rule 15d-15(e) under the Exchange Act thatAct). Disclosure controls and procedures are designed to ensure that information required to be disclosed by a company in the reports that it files or submits under the Exchange Act is recorded, processed, summarized, and reported within the time periods specified in the SEC’s rules and forms. Disclosure controls and procedures include, without limitation, controls and procedures designed to ensure that information required to be disclosed by a company in the reports that it files or submits under the Exchange Act is accumulated and communicated to our management, including our principal executive and principal financial officers, as appropriate to allow timely decisions regarding required disclosure.
Our management, with the participation ofBased on that evaluation, our Chief Executive Officer and our Chief Financial Officer evaluated the effectiveness of our disclosure controls and proceduresconcluded that as of December 31, 2018. Based on the evaluation of our disclosure controls and procedures as of December 31, 2018, our Chief Executive Officer and Chief Financial Officer concluded that, as of such date,2023, our disclosure controls and procedures were not effective atdue to the reasonable assurance level.GITC Material Weakness defined below under the heading "Management's Report on Internal Control Over Financial Reporting." The GITC Material Weakness is the sole material weakness in our internal control over financial reporting as of December 31, 2023. We have in place and are executing a remediation plan to address the GITC Material Weakness.
In light of the GITC Material Weakness, management performed additional analyses and other procedures to ensure that our consolidated financial statements were prepared in accordance with GAAP. Accordingly, management believes that the consolidated financial statements included in this Annual Report on Form 10-K fairly present, in all material respects, our financial position, results of operations, and cash flows as of and for the periods presented, in accordance with GAAP.
Management's Report on Internal Control over Financial Reporting
This Form 10-K does not include a report of management's assessment regardingOur management is responsible for establishing and maintaining adequate internal control over financial reporting or(as defined in Rules 13a-15(f) and 15d-15(f) under the Exchange Act). Management conducted an attestation reportassessment of the effectiveness of our independent registered public accounting firminternal control over financial reporting based on the criteria set forth in Internal Control—Integrated Framework issued by the Committee of Sponsoring Organizations of the Treadway Commission (2013 framework). Based on the assessment, management has concluded that its internal control over financial reporting was not effective as of December 31, 2023 because of the GITC Material Weakness. A material weakness is a deficiency, or a combination of deficiencies, in internal control over financial reporting, such that there is a reasonable possibility that a material misstatement of our annual or interim financial statements will not be prevented or detected on a timely basis.
We identified a material weakness with respect to ineffective general information technology controls (“GITCs”) related to user access and change management over the information technology ("IT") systems supporting our Canada trust and Powerpay revenue processes (“GITC Material Weakness”).
The GITC Material Weakness was primarily due to ineffective reporting lines necessary to plan, execute, control, and periodically assess our IT activities. In addition, there was an insufficient number of trained resources with expertise, responsibility, and accountability for the design, documentation, implementation, and operation of GITCs. As a transitionresult, we did not perform an effective risk assessment related to the impact of ineffective GITCs on the operation of manual and automated control activities in order to identify all relevant risks of material misstatement to the consolidated financial statements.
Specifically, we did not effectively design control activities to restrict technology access rights to authorized users commensurate with their job responsibilities; we did not have an effective information and communication process that identified and assessed the controls necessary to ensure the reliability of information used in financial reporting; and we lacked effective ongoing evaluations of whether GITCs are present and functioning.
KPMG, who audited the consolidated financial statements included in this Annual Report on Form 10-K, issued an adverse opinion on the effectiveness of our internal control over financial reporting as of December 31, 2023, which appears in Part II, Item 8, "Financial Statements and Supplementary Data" of this Form 10-K.
95 | 2023 Form 10-K
Management's Plan to Remediate the Identified Material Weakness
We have already begun certain efforts and activities in the process to remediate the GITC Material Weakness. We expect that the GITC Material Weakness will be remediated promptly, however, it will not be considered fully remediated until the applicable controls operate for a sufficient period established byof time and management has concluded, through testing, that these controls are operating effectively, which we expect to occur in connection with our annual audit covering the rulesyear ended December 31, 2024. These remediation activities consist of enhanced risk assessments; modified reporting lines of key control owners to improve the planning, execution, and periodic assessment of the SEC for newly public companies.IT activities; improved training of our resources, and in some cases additional resources, focused on the design, implementation, operation, and documentation of GITCs; and the implementation of improved monitoring procedures, stronger user access controls, and greater segregation of duties in certain areas around our Canada trust and Powerpay revenue processes.
Changes in Internal Control Over Financial Reporting
There wasWe have implemented internal controls to remediate the previously identified deficiencies related to Professional Services revenue accounts and the presentation of cash and cash equivalents for our Canada customer funds. Otherwise, there were no changematerial changes in our internal control over financial reporting identified(as defined in connection with the evaluation required by Rule 13a-15(d)Rules 13a-15(f) and 15d-15(d) of15d-15(f) under the Exchange Act that occurredAct) during the fiscal quarter ended December 31, 20182023 that has materially affected, or iswere reasonably likely to materially affect, our internal control over financial reporting.
Inherent Limitations on Effectiveness of Controls
Our management, including our Chief Executive Officer and Chief Financial Officer, believes that our disclosure controls and procedures and internal control over financial reporting are not designed to provide reasonable assurance of achieving their objectives and are not effective at the reasonable assurance level. However, ourOur management does not expect that our disclosure controls and procedures or our internal control over financial reporting will prevent all errors and all fraud. A control system, no matter how well conceived and operated, can provide only reasonable, not absolute, assurance that the objectives of the control system are met. Further, the design of a control system must reflect the fact that there are resource constraints, and the benefits of controls must be considered relative to their costs. Because of the inherent limitations in all control systems, no evaluation of controls can provide absolute assurance that all control issues and instances of fraud, if any, have been detected. These inherent limitations include the realities that judgments in decision making can be faulty, and that breakdowns can occur because of a simple error or mistake. Additionally, controls can be circumvented by the individual acts of some persons, by collusion of two or more people or by management override of the controls. The design of any system of controls also is based in part upon certain assumptions about the likelihood of future events, and there can be no assurance that any design will succeed in achieving its stated goals under all potential future conditions; over time, controls may become inadequate because of changes in conditions, or the degree of compliance with policies or procedures may deteriorate. Because of the inherent limitations in a cost-effective control system, misstatements due to error or fraud may occur and not be detected.
Insider Adoption or Termination of Trading Arrangements
None.On December 18, 2023, William E. McDonald, Executive Vice President, General Counsel and Corporate Secretary of the Company, adopted a “Rule 10b5-1 trading arrangement” as defined in Regulation S-K Item 408 (the “McDonald Plan”). The McDonald Plan provides for the potential sale of up to 39,419 shares of the Company’s common stock, subject to certain conditions, from May 20, 2024 through September 3, 2024. The entry into the McDonald Plan was effected within the Company’s open trading window periods and was done in compliance with our insider trading policy.
Other than the aforementioned, during the fiscal quarter ended December 31, 2023, none of our directors or officers adopted or terminated any contract, instruction, or written plan for the purchase or sale of Company securities that was intended to satisfy the affirmative defense conditions of Rule 10b5-1(c) or any non-Rule 10b5-1 trading arrangement.
Item 9C. Disclosure Regarding Foreign Jurisdictions that Prevent Inspections.
Not applicable.
96 | 2023 Form 10-K
Item 10. Directors, Executive Officers and Corporate Governance.
Other than “ExecutiveDirectors
The information provided under the headings “Election of Directors” under Proposal One and “Board of Directors” in the Proxy Statement for Dayforce, Inc.'s 2024 Annual Meeting of Stockholders (“Proxy Statement”), is incorporated herein by reference.
Executive Officers of the Registrant” which
Information regarding our executive officers is set forth at the end ofin Part I, Item 1, in Part I"Information about Our Executive Officers" of this Form 10-K the information required by this item (other than the information set forth in the next paragraph in this Item) is incorporated herein by reference to the information set forth in Ceridian’s Proxy Statement for the 2019 Annual Meeting.
Code of Stockholders under the headings “Board of Directors and Corporate Governance”, “Security Ownership of Certain Beneficial Owners and Management, Section 16(a) Beneficial Ownership Reporting Compliance”, and “Additional Information”.Ethics
We have adopted a code of ethics known as the “Code of Conduct” that applies to all employees, contractors, officers and directors of Dayforce, Inc. The Code of Conduct may be viewed online on Dayforce, Inc.'s website https://www.dayforce.com/Ceridian/media/documents/Dayforce-Code-of-Conduct-022024.pdf. We intend to satisfy the disclosure requirement under Item 5.05 of Form 8-K regarding an amendment to, or waiver from, a provision of our Code of Conduct that applies to all of our employees, officers and directors. A copy of the Code of Conduct is availableprincipal executive officer, principal financial officer or principal accounting officer by posting such information on our website located at www.ceridian.com. Any amendments or waivers from our Code of Conduct granted to directors or executive officers will be disclosed on our Internet website promptlywithin four business days following the date of such amendment or waiver.
There have been no material changes to the procedures by which stockholders may recommend nominees to our Board.
Audit Committee; Audit Committee Financial Expert
The information provided under the subheadings “Committees of the Board of Directors” under the Board of Directors heading and “Report of the Audit Committee of the Board of Directors” under Proposal Three in the Proxy Statement is incorporated herein by reference.
Item 11. Executive Compensation.
The information required by this item is incorporated herein by reference to the information set forth in Ceridian’sthe Proxy Statement for the 2019 Annual Meeting of Stockholders under the headings “Executive and Director“Director Compensation” and, "Executive Compensation”, “Equity Compensation Plan Information”, and “Corporate Governance”.
Item 12. Security Ownership of Certain Beneficial Owners and Management and Related Stockholder Matters.
Securities Authorized for Issuance Under Equity Compensation Plans
The information required by this item is incorporated herein by reference to the information set forth in Ceridian’sthe Proxy Statement for the 2019 Annual Meeting of Stockholders under the heading “Security“Equity Compensation Plan Information”.
Security Ownership of Certain Beneficial Owners and Management”, “Equity Compensation Plan Information”, and “Board of Directors and Corporate Governance”.Management
Item 13. Certain Relationships and Related Transactions, and Director Independence.
The information required by this item is incorporated herein by reference to the information set forth in Ceridian’sthe Proxy Statement for the 2019 Annual Meeting of Stockholders under the headings “Certainheading “Security Ownership of Certain Beneficial Owners and Management”.
97 | 2023 Form 10-K
Item 14. Principal Accounting Fees and Services.
The information required by this item is incorporated herein by reference to the information set forth in Ceridian’sthe Proxy Statement forunder the 2019 Annual Meetingheadings “Certain Relationships and Related Party Transactions”, “Election of StockholdersDirectors” under Proposal One, “Board of Directors” and “Corporate Governance”.
Item 14. Principal Accounting Fees and Services.
Our independent registered public accounting firm is KPMG LLP, Minneapolis, MN, Auditor Firm ID: 185.
The information required by this item is incorporated herein by reference to the information set forth in the Proxy Statement under the heading “Proposal Three, Ratification“Ratification of the Appointment of KPMG LLP as our Independent Registered Public Accounting Firm”.Firm for Fiscal Year 2024” under Proposal Three.
98 | 2023 Form 10-K
Item 15. Exhibits, Financial Statement Schedules.
|
|
See Index to Consolidated Financial Statements at Item 8 herein.
|
|
All schedules are omitted because they are not applicable or the required information is shown in the consolidated financial statements or notes thereto.thereto.
|
|
The following is a list of exhibits filed as part of this Annual Report on Form 10-K.
Exhibit Number | Description | |
3.1 | ||
| ||
| ||
3.2 | ||
| ||
4.1 | ||
4.2^ | ||
4.3 | ||
4.4 | ||
| ||
10.1 | ||
10.2 | ||
10.3 | ||
| ||
10.4 | ||
| ||
10.5 | ||
10.6* |
99 | 2023 Form 10-K
| ||
| ||
10.8* | ||
10.9* | ||
10.10* | ||
10.11* | ||
10.12* | ||
10.13* | ||
10.14* | ||
10.15* | ||
10.16* | ||
10.17* | ||
| ||
10.18* | ||
10.19* | ||
10.20* | ||
| ||
10.21* | ||
| ||
10.22* | ||
|
100 | 2023 Form 10-K
10.23* | ||
| ||
| ||
| ||
| ||
10.25* | ||
| ||
10.26* | ||
| ||
10.27* | ||
| ||
10.28* |
10.29* | ||
10.30* | ||
10.31* | ||
| ||
10.32* | ||
10.33* | ||
10.34* | ||
| ||
10.35* | ||
| ||
10.36* | ||
10.37* | ||
10.38* | ||
10.39* | ||
10.40*^ | Form of Restricted Stock Unit Award Agreement (for awards made after January 1, 2024). | |
10.41*^ | Form of Restricted Stock Unit Award Agreement (for Canadian executive awards). | |
101 | 2023 Form 10-K
10.42*^ | ||
10.43*^ | Form of Performance Stock Unit Award Agreement (for awards made after January 1, 2024). | |
10.44*^ | Form of Performance Stock Unit Award Agreement (for Canadian executive awards). | |
10.45* | ||
| ||
10.46* | ||
10.47*+ | ||
| ||
10.48*^ | ||
21.1^ | ||
23.1^ | Consent of KPMG LLP, Independent Registered Public Accounting Firm. | |
| ||
24.1 | ||
| ||
31.1^ | ||
| ||
31.2^ | ||
| ||
32.1# | ||
| ||
32.2# | ||
|
| |
| ||
101.INS^ | Inline XBRL Instance Document (the instance document does not appear in the Interactive Data File because its XBRL tags are embedded within the Inline XBRL document) | |
101.SCH^ | Inline XBRL Taxonomy Extension Schema with Embedded Linkbases Document | |
|
| |
| Cover Page Interactive Data File (formatted as Inline XBRL | |
|
| |
|
|
|
|
|
|
* Management compensatory plan or arrangement.
^ Filed herewith.
+ Confidential portions of this exhibit have been redacted in compliance with Item 16.601(b)(10) of Regulation S-K.
# In accordance with Item 601(b)(32)(ii) of Regulation S-K and SEC Release Nos. 33-8238 and 34-47986, Final Rule: Management’s Reports on Internal Control Over Financial Reporting and Certification of Disclosure in Exchange Act Periodic Reports, the certifications furnished in Exhibits 32.1 and 32.2 hereto are deemed to accompany this Annual Report on Form 10-K Summary.and will not be deemed “filed” for purpose of Section 18 of the Exchange Act. Such certifications will not be deemed to be incorporated by reference into any filing under the Securities Act or the Exchange Act, except to the extent that the registrant specifically incorporates it by reference.
102 | 2023 Form 10-K
Not applicable.
Pursuant to the requirements of Section 13 or 15(d) of the Securities Exchange Act of 1934, as amended, the Registrant has duly caused this Report to be signed on its behalf by the undersigned, thereunto duly authorized.
| |||
Date: February 28, | By: | /s/ David D. Ossip | |
Name: David D. Ossip | |||
Title: Chief Executive Officer | |||
KNOW ALL MEN BY THESE PRESENTS, that each of the undersigned constitutes and appoints each of Arthur Gitajn, Scott A. KitchingJeremy R. Johnson and William E. McDonald, or any of them, each acting alone, histheir true and lawful attorney-in-fact and agent, with full power of substitution and resubstitution, for such person and in histheir name, place and stead, in any and all capacities, to sign this Annual Report on Form 10-K, and to file the same, with all exhibits thereto, and other documents in connection therewith, with the Securities and Exchange Commission, granting unto said attorneys-in-fact and agents, each acting alone, full power and authority to do and perform each and every act and thing requisite and necessary to be done in and about the premises, as fully to all intents and purposes as hethey might or could do in person, hereby ratifying and confirming that any such attorney-in-fact and agent, or his substitute or substitutes, may lawfully do or cause to be done by virtue hereof.
Pursuant to the requirements of the Securities Exchange Act of 1934, as amended, this Report has been signed below by the following persons on behalf of the Registrant in the capacities and on the dates indicated.
Name | Title | Date | ||
/s/ David D. Ossip |
(Principal Executive Officer) | February 28, | ||
David D. Ossip | ||||
/s/ | Executive Vice President and Chief Financial Officer (Principal Financial | February 28, | ||
| ||||
/s/ Jeffrey S. Jacobs | Head of Accounting and Financial Reporting (Principal Accounting Officer) | February 28, 2024 | ||
Jeffrey S. Jacobs | ||||
/s/ Brent B. Bickett | Director | February 28, | ||
Brent B. Bickett | ||||
/s/ Ronald F. Clarke | Director | February 28, | ||
Ronald F. Clarke | ||||
/s/ | Director | February 28, | ||
| ||||
/s/ Thomas M. Hagerty | Director | February 28, | ||
Thomas M. Hagerty | ||||
/s/ Linda P. Mantia | Director | February 28, 2024 | ||
Linda P. Mantia | ||||
/s/ Ganesh B. Rao | Director | February 28, | ||
Ganesh B. Rao | ||||
/s/ Andrea S. Rosen | Director | February 28, | ||
Andrea S. Rosen | ||||
/s/ Gerald C. Throop | Director | February 28, | ||
Gerald C. Throop |
103 | 2023 Form 10-K
117
