whole flower;
ground flower;
full-spectrum oil drops and capsules;
purified oil drops and capsules; and
clinical compounds.
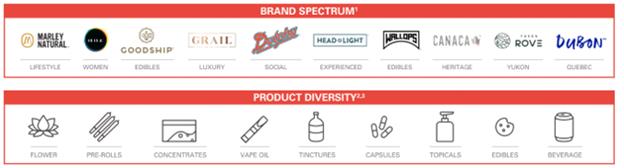
Each form factor platform
• | Symbios® - Launched in 2021, Symbios was developed to provide Canadian patients with a broader spectrum of formats and unique cannabinoid ratios at a better price point while offering a full comprehensive assortment of products, including flower, oils, and pre-rolls. |
• | Navcora® - Launched in 2020, Navcora is dedicated to making pharmaceutical grade cannabis more accessible and reliable in the German market. The Navcora brand is complementary to our existing Tilray medical brand, and is designed to increase our points of distribution in the German medical cannabis market. |
• | Charlotte's WebTM - During the year, the Company entered into a strategic alliance which includes licensing, manufacturing, quality, marketing and distribution for Charlotte’s WebTM CBD hemp extract products in Canada. For the first time, Canadians will have the ease of nationwide availability of Charlotte’s WebTM full spectrum CBD products through Tilray’s medical cannabis distribution network. While no shipments were completed during the fiscal year, production commenced and the Company anticipates the first sale to be in the first half of fiscal year 2024. |
We are committed to meeting the needs of our patients whether they are looking for more natural options for their medical needs, exploring their options in wellness, or seeking alternatives in their lifestyle. Accessibility is divided into different product categories that correspond witha top priority for Tilray. We are committed to ensuring patients have access to the particular chemical composition of each product basedmedication they depend on the concentration of two active ingredients: THCthrough a strong supply chain and CBD. For instance,dedicated support through our whole flower and full-spectrum oil drops and capsules are available in categories THC-Dominant, CBD-Dominant and THC and CBD Balanced.
dedicated patient care teams. Our product line focuseslines focus on active ingredients and standardized, well-defined preparation methods. We use formulations and delivery formats that are intended to allow for consistent and measured dosing, and we test all our products for potency and purity. Each of our commercial products are developed with comprehensive analysis and thorough documentation. We follow detailed and rigorous documentation standards not only for our own internal purposes but also because this type of documentation is required by researchers, regulators, importers and distributors.
6
We take a scientific approach to our medical-use product development which we believe gives usestablishes credibility and respecttrust in the medical community. We produce products that are characterized by well-defined and reproducible cannabinoid and terpene content, formulated for stable pharmacokinetic profiles, which are customizable in a variety of formulations and available in capsule or liquid forms.formulations. We continue to conduct extensive research and development activities as well asand develop and promote new products for medical use.
Our Adult-Use Cannabis Brands
We are also currently working with established pharmaceutical companies, such as Sandoz Canada, a division of Novartis, to develop non-combustible, co-branded products for saleleader in pharmacies when regulations permit.
Our Adult-Use Brands
Our wholly owned subsidiary, High Park, securedthe exclusive rights from a subsidiary of Privateer Holdings to produce and distribute a broad-based portfolio of certain adult-use brands and products in Canada. The brand licensing agreement includes the rights to recognized brands and proprietary product formulations for a wide range of products. In addition to licensing certain adult-use brands from a wholly owned subsidiary of Privateer Holdings, we also developed and launched new brands for therecreational adult-use market in Canada which are wholly owned by us, such as CANACA™, Yukon Rove™ and Dubon™.
We currently produce and distribute many of these brands and products to Canadian consumers through High Park, formed to serve the pending adult-use market in Canada, and intend to introduce additional brands and products when regulations change to permit new form factors, such as concentrates, tinctures, and edibles. Our portfolio of brands and products have been specifically adapted, and our marketing activities carefully structured, to enable us to develop our brands in an effective and compliant manner.
Retail Strategy and Brands
We have the foundation in place to be a leader in the adult-use cannabis market with High Park Company, a wholly owned subsidiary of Tilray designed to cultivate, produce, sell and distribute adult-use cannabis brands and products. High Park Company has secured the exclusive rights to produce and distributewhere we offer a broad-based portfolio of adult-use brands and products and continue to expand our portfolio to include new innovative cannabis products and formats. We maintain agreements to supply all Canadian provinces and territories with our adult-use products for sale through their established retail distribution systems. We believe that our differentiated portfolio of brands, which is designed to resonate with consumers in Canada throughall categories, sets us apart from our competitors and is providing us with the ability to establish a licensing agreement, which includesleading position in the rightsadult-use market in Canada. Therefore, we are investing in brand building with our consumers, new product innovation, insights, distribution, trade marketing and cannabis education to recognizeddrive market share in the Canadian adult-use cannabis industry.
We believe that our portfolio of brands, developed for consumers across broad demographics and targeted segments, remains unmatched in the industry. With a focus on brand building, innovation, loyalty and conversion, we seek to drive growth with our differentiated portfolio of brands and proprietary formulations forproducts, both in sales and market share across categories. The Company is investing capital and resources to establish a wide rangeleadership position in the adult-use market in Canada. These investments are focused on brand building with consumers, product innovation, distribution, trade marketing and cannabis education. Our strategy is to develop a brand focused portfolio that resonates with consumers in all category segments.
We are positioned to grow our adult-use brand portfolio to specifically meet the needs and preferences of products. In October 2018, whendifferent consumer segments of the Canadian government federally legalized adult-use cannabis High Park Company launchedmarket. We leverage our selection of strains to offer each consumer segment a numberdifferent experience through its product and terpene profiles, while also focusing on the value proposition for each of these segments as it relates to price, potency and product assortment.
Each brand is unique to a specific consumer segment and designed to meet the needs of these targeted segments, as described below. Our portfolio of brands and products and our marketing activities have been carefully curated and structured to enable us to develop and promote our brands and product lines in an effective and compliant manner. We continue to develop additional brands and new products, such as edibles and beverages, with more innovative products in our pipeline. Our brand portfolio consists of the following:
ECONOMY BRANDS | |
B!NGO | B!NGO is like a nice cold beer on a summer’s day. Our products hit the spot and gives consumers that little something that lets them enjoy the moment. It’s the everyday companion that keeps it light and simple. |
The Batch | A no-frills cannabis value brand focused on delivering quality cannabis flower and pre-rolls at competitive prices. The Batch categorizes its product offering by potency rather than cultivar, allowing us to offer quality cannabis at prices that beat the illicit market. |
VALUE BRANDS | |
Dubon | “The good stuff”, a vibrantly Québécois cannabis brand and champion of inspired, creative living. Dubon offers master-crafted cannabis cultivars as whole flower and pre-rolls, exclusively available in Québec. |
CORE BRANDS | |
Good Supply | Quality Bud, No B.S. Good Supply is brand that embraces the goodness of classic cannabis culture – it speaks your language and reminds you of when you first fell in love with cannabis. |
Solei Sungrown Cannabis (“Solei”) | Solei is a brand designed to embrace the bright Moments in your day. Solei’s Moments-based products help to make cannabis simple, approachable and welcoming. |
Chowie Wowie | An edibles’ brand bringing the ‘wow’ with perfectly crafted fusions of flavor offered in an array of reliably dosed cannabis-infused chocolates and gummies in THC and CBD varieties. |
Canaca | A brand that proudly builds on its homegrown heritage with cannabis whole flower, pre-rolls, oil products and pure cannabis vapes handcrafted by and for Canadian cannabis enthusiasts. Our plants are sourced in BC and expertly cultivated in Ontario for homegrown, down-to-earth quality that’s enjoyed across Canada. |
PREMIUM BRANDS | |
RIFF | RIFF is not your conventional cannabis brand. It is a brand by creatives for creatives. An unconventional brand, fueled by creativity and collaboration |
PREMIUM + BRANDS | |
Broken Coast | West Coast, Naturally. Broken Coast relies on small batch growing techniques / craft approach with a reputation for its high-quality flower, aroma, bud composition, and heavy trichome appearance that delivers an incredible experience. |
Our Wellness Brands
Our Tilray Wellness segment primarily consists of the Manitoba Harvest branded hemp-based food business, which develops, manufactures, markets and distributes a diverse portfolio of hemp-based food and wellness products under various brands, which include Manitoba Harvest, Hemp Yeah!, Just Hemp Foods, and Happy Flower. Manitoba Harvest products are sold in major retailers across the U.S. and Canada.
Our Beverage Alcohol and Spirits Brands
We are also a major player in the country’scraft alcohol and beverage business through SW Brewing Company, LLC (“SweetWater”), the 9th largest markets, including Ontario, Quebeccraft brewery in the United States according to the Brewers Association. Founded in 1997, SweetWater has broad consumer appeal and British Columbia. has established strong distribution across the United States. From its state-of-the-art breweries in Atlanta, Georgia and Colorado, SweetWater produces a balanced variety of year-round and seasonal specialty craft brews, under the SweetWater Green Flash, Alpine and Montauk brands. The Company also operates in the craft spirits businesses through Breckenridge Distillery, which was founded in 2008 as a small craft spirits brand in Breckenridge, Colorado but has since grown its award-winning bourbon whiskey collection and innovative craft spirits portfolio to be distributed in all 50 states in addition to owning two tasting rooms/retail shops and a world class restaurant.
Our understandingbeverage alcohol brands include:
• | SweetWater – The 9th largest craft brewery in the United States according to the Brewers Association has created an award-winning lineup of year-round, seasonal and specialty beers under a portfolio of brands closely aligned with a cannabis lifestyle, which include the flagship 420 alcoholic beverage offerings, its SweetWater Spirits, a new collection of bright and refreshing ready-to-drink mixed cocktails in a can and our newest innovation SweetWater Gummies, a fruit forward 9.5% ABV of refreshing double IPA. We believe the SweetWater product offerings, including the new Red White and Blue American Lager resonate across all consumer’s that want to drink flavorful and refreshing products and that it will be a staple at backyard barbecues, tailgates, and get-togethers. We also continue to be innovative with our 420 Strain G13 IPA, which plays a critical role in our portfolio and resonates as a cannabis lifestyle brand. SweetWater’s various 420 strains of craft brews use plant-based terpenes and natural hemp flavors that, when combined with select hops, emulate the flavors and aromas of popular cannabis strains to appeal to a loyal consumer base. |
• | Breckenridge Distillery –A highly sought-after and award-winning brand widely known for its blended bourbon whiskey and its collection of artisanal spirits including vodka and gin that brings to life the best that Colorado has to offer. Breckenridge continues to be one of the most awarded craft distilleries in the U.S. |
• | Alpine Beer Company –An award-winning craft brand founded in 1999, and is rated a top 50 brand in the United States with highly-rated favorites including Nelson IPA and Duet IPA. We recently launched Infinite Haze, a brilliant Hazy IPA bursting with endless aromas of citrus and sweet, tropical fruits which complement our existing product offerings that make up our highly acclaimed year-round lineup. |
• | Green Flash –An award-winning, independently owned and operated craft brand founded in 2002 to bring fresh ideas and a sense of adventure to craft beer. Green Flash delivers an eclectic lineup of specialty craft beers and distributes them throughout the west. Our staple brand, West Coast IPA, as well as our newly launched Hazy West Coast IPA, continue to excite consumers across the west coast. Green Flash has now created a variety 12-pack that takes the best of the west and the east to make an exciting and adventurous consumer experience. |
• | Montauk –As the #1 craft brewer in Metro New York. Montauk is well-known for its beloved product portfolio, premium price point, and distribution across over 6,400 points of distribution. Wave Chaser IPA is a staple of Montauk and has expanded into The Surf Beer, a Golden Ale, Tropical IPA, Juicy IPA and Eastern Haze a Hazy IPA. We have also launched Project 4:20, a terpene flavored beer with earthy aromas which is focused on giving back to local green charities. Montauk’s brand reach has predominantly been in New York City, Long Island, and northern New Jersey, but has now been expanded into Connecticut, Rhode Island, Upstate New York, Pennsylvania and the remainder of New Jersey. |
Our Operations
Through our cannabis reporting segment, we have invested in state-of-the-art facilities and infrastructure, and we believe that we maintain some of the adult-use consumer is informed by extensive research, including post-adult use legalization focus groups acrosshighest-quality, lowest cost cannabis production operations in Canada, with the country including Toronto, Vancouverscale and Quebec City.distribution network that differentiates us from our competitors in the industry. We also made significant investments in our operations within Europe and we are well-positioned to pursue international growth opportunities with our strong medical cannabis brands, distribution network in Germany, and end-to-end European Union Good Manufacturing Practices (“EU-GMP”) supply chain, which includes EU-GMP production facilities in Portugal and Germany. We seek to continue to invest in the expansion of our global supply chain to address the unmet needs of patients around the world.
We have establishedcurrently maintain key international operations in Portugal, Germany, Italy, United Kingdom, Australia, New Zealand and Argentina as well as strategic relationships in Denmark, Luxembourg and Poland. In establishing our portfoliointernational footprint, we sought to create operational hubs in those continents where we identified the biggest opportunities for growth and pricing strategiesdesigned our operations to compete for whatensure consistent, high-quality supply of cannabis products as well as a distribution network. While these markets are still at various stages of development, and the regulatory environment around them is either newly formed or still being formed, we believeare uniquely positioned to bebring the largest adult-use consumer segments of the addressable market.
We also believe we have industry-leading customer service, supported by trained, multilingual customer service representatives available 24 hours a day, seven days a week from our Canadian call center.
The brands launched in October 2018 across Canada include:
Grail – a super-premium cannabis brand that offers discerning connoisseurs a collection of sought-after strainsknowledge and top-shelf products.
Irisa – a women’s brand with products that include cannabis oil drops and a massage oil designed to naturally integrate with consumers’ self-care rituals.
Canaca – a brand that proudly builds on its homegrown heritage with cannabis whole flower, pre-roll and oil products handcrafted by and for Canadian cannabis enthusiasts.
7
Dubon – “the good stuff”, a vibrantly Québécois cannabis brand and champion of inspired, creative living. Dubon offers master-crafted cannabis strains as whole flower and pre-rolls, exclusively available in Québec.
Yukon Rove – a cannabis brand born “wild and free” with the unique spirit of Northern-Canada. An assortment of local favorite strains will be available from Yukon Rove in whole flower and pre-rolls, exclusively in the Yukon territory.
High Park Company launched a physical and online retail presence in October 2018 with product available for sale in British Columbia, Yukon, North West Territories, Saskatchewan, Ontario, Quebec and Prince Edward Island. In March of 2019, High Park has expanded its presence to include retail access in Alberta and Manitoba, bringing its national presence to 9 of 13 provinces and territories. In June 2019, High Park plans to launch retail availability in Nova Scotia and New Brunswick with Newfoundland expected to be the final province to receive High Park product in July 2019. As a result of this provincial roll out plan, High Park brands are anticipated to have access to the entire retail market in Canada.
Retail storesexpertise gained in Canada fall under two key banners:
|
|
|
|
Supporting the national coverage of retail in Canada, High Park Company has deployed a sales organization with the purpose of delivering retail optimization solutions across all government and privately-operated accounts. The sales team will lean on Customer Relationship Management (“CRM”) and trade tool supportleverage our operational footprint in order to maximizegenerate profitable growth in these geographies.
In beverage alcohol, we have state-of-the-art breweries in Atlanta, Georgia, Fort Collins, Colorado and New York from which SweetWater and Montauk produce a balanced variety of year-round and seasonal specialty craft brews under the SweetWater, Alpine, Green Flash and Montauk brands as well as Breckenridge Distillery, the world’s highest distillery, located in Breckenridge, Colorado. Most recently, the Company entered into a new partnership with Mercedes-Benz Stadium and is opening two new SweetWater branded bars at Atlanta’s premier sports and entertainment venue, which is home to the NFL’s Atlanta Falcons and Atlanta United of Major League Soccer.
Lastly, in Wellness, we own two BRC accredited facilities located in Manitoba, Canada that are dedicated to hemp processing and packaging Manitoba Harvest, Just Hemp Foods, and Hemp Yeah! Branded products including hulled hemp seeds, hemp oil, and hemp protein.
Distribution
Canadian Adult-use Market
Under the Canadian legislative regime, provincial, territorial and municipal governments have the authority to prescribe regulations regarding retail growth and deliver retailer value.distribution of adult-use cannabis. As such, the distribution model for adult-use cannabis is prescribed by provincial regulations and differs from province to province. Some provinces utilize government run retailers, while others utilize government-licensed private retailers, and some a combination of the two. All of our adult-use sales are conducted according to the applicable provincial and territorial legislation and through applicable local agencies.
Brands licensed or developed by us or
Through our subsidiaries, include:Aphria and High Park Holdings Ltd. (“High Park”), we maintain supply agreements for adult-use cannabis with all the provinces and territories in Canada.
8
Our OperationsTilray is party to a distribution agreement with Great North Distributors to provide sales force and wholesale/retail channel expertise required to efficiently distribute our adult-use products through each of the provincial/territorial cannabis control agencies, excluding Quebec. We also engage Rose Life Sciences Ltd. as our sale agent exclusively for the Province of Quebec, representing our entire brand portfolio.
We are building
Canadian Medical Market
In Canada, Tilray Medical operates a multinational supply chaindirect to patient distribution model and distribution networkonline platform for patients to capitalize oneffectively and efficiently manage the globalprocess of registering and ordering medical products from Tilray Medical’s full portfolio of medical brands including Tilray, Aphria, Broken Coast, Symbios and Charlotte's WebTM.
International Medical Markets
Tilray Medical currently offers broad access to medical cannabis marketproducts in legal medical markets across Europe, Australia, New Zealand and the adult-use market in Canada.
Tilray North America Campus – Nanaimo, British Columbia.Latin America. Our global head office is located at our Tilray North America Campus in Nanaimo. We believe that Tilray Nanaimo is oneportfolio of the world’s most sophisticated, technologically advanced licensed cannabis production facilities based on the amount of capital we have invested, the amount of data we have generated about how to grow cannabis well and the standard operating procedures we have created to ensure maximum yield and product quality. Tilray Nanaimo is a 60,000-square foot facility. It houses approximately 40,000 plants in 33 cultivation rooms, five manufacturing and processing rooms and three laboratories, including an advanced extraction laboratory, all of which allow us to produce more than 50 distinct cannabis strains and various cannabis extract products. The primary purpose of Tilray Nanaimo is to continue to serve the Canadian medical market and the global medical export market for the near term. Tilray Nanaimo is licensed by Health Canada and is GMP-certified by multiple EU recognized health regulators, or Competent Authorities. It also features a patient and physician service center that is open 24 hours a day, seven days a week. At this facility we complete each step of the production process including housing mother stock, cutting clones, cultivating pre-vegetative, vegetative and flowering plants; harvesting and curing plants; securing product in the vault; trimming product; extracting cannabinoids from harvested products; analyzing products in our lab; and packaging and shipping.
Tilray Toronto Regional Office – Toronto, Ontario. Members of our senior leadership team are based in Toronto, along with our finance, legal, sales and marketing staff.
Tilray European Union Regional Office – Berlin, Germany. Our executive, finance, sales, marketing, operations and regulatory support staff for Europe are located in Berlin, Germany.
Tilray Australia and New Zealand Regional Office – Sydney, Australia. Our sales, marketing and operations team focused on Australia and New Zealand are based in Sydney. We have signed two government contracts with the largest states in Australia: New South Wales and Victoria to supply medical cannabis to children suffering from pediatric epilepsy. Ourproducts includes high-quality and GMP-certified flower and extracts. Through our various subsidiaries and partnerships with distributors, our medical products are available in three major hospitals in Victoria, as well as other hospitals and pharmacies throughout Australia and New Zealand.
Tilray European Union Campus – Cantanhede, Portugal. In July 2017, the Portuguese National Authority of Medicines and Health Products (INFARMED) awarded Tilray a license to cultivate, import and export bulk medical cannabis. We anticipate receiving approvals for our pending manufacturing license and GMP certification in 2019, which will allow us to manufacture and distribute finished medical cannabis products. The 60 acre campus includes a 65,000-square foot outdoor cultivation plot which was harvested in the fall of 2018, a 108,000-square foot greenhouse with a first harvest completed in February 2019, and a 66,000-square foot manufacturing facility with an expected completion date in the early part of the second quarter of 2019. Tilray Portugal will serve as our primary supply source for patients in 21 countries on 5 continents, which include the European Union that have access to cannabis-derived products. Locating cultivation and manufacturing operations in the European Union results in easier and more cost-effective production and distribution. Although each European Union member state has its own health and drugs regulatory body, these entities have ongoing cooperation mechanisms that promote similar, though not equal, treatment for medical cannabis, which we believe will facilitate cannabis product sales from Portugal into other European countries.following international distribution channels:
• | Our products are also distributed by multiple wholesalers and directly to pharmacies in Germany. As a result, we are able to fulfill prescriptions for our medical cannabis products throughout Germany. |
• | We |
• | In Argentina, ABP, S.A., our wholly-owned subsidiary, distributes medical cannabis throughout Argentina under the |
High Park Processing Facility – London, Ontario. We entered a 10-year lease in February 2018 for a 56,000-square foot processing facility in London. We have two five-year extension options. We also have a purchase option on the property, which is exercisable in 2022 or 2027. When fully operational, this facility will handle all post-harvest processing from cannabis harvested at the High Park Farms. The High Park Processing Facility has received a processing license and we expect to receive a sales license by the end of Q2 2019. We
9
|
High Park Gardens (“Natura Naturals”) – Leamington, Ontario. In February 2019, we acquired a 662,000 square-foot greenhouse cultivation facility, of which 155,000 square-feet are currently licensed by Health Canada.
Total Global Production and Processing Capacity
Once we have obtained the required amendments to our licenses to operate at the facilities described above, we believe that our total production and processing space across all facilities worldwide will total approximately 1.15 million-square feet. We believe that the maximum potential development of the parcels we currently own would be 5.5 million square feet.Wholesale
Sales and Distribution
Pharmaceutical distribution and pharmacy supply agreements. We work with established pharmaceutical distributors and pharmacy suppliers to sell our products around the world.
In Canada, we have entered into a definitive agreement to supply Shoppers Drug Mart, the largest pharmacy chain in Canada, with our cannabis products. Shoppers Drug Mart is currently distributing our products under its license to sell cannabis products for medical purposes. We believe we are one of four Licensed Producers who have entered into supply agreements with Shoppers Drug Mart. Additionally, we have signed a collaboration agreement with Sandoz Canada, a division of Novartis, to market our non-combustible products to health care practitioners and pharmacists and to co-develop new cannabis products.
In Germany, our products are distributed via multiple wholesalers, including Noweda, a cooperative comprised of approximately 9,000 pharmacists with a network of 16,000 pharmacies throughout Germany and one of the largest wholesalers of pharmaceutical products in Germany, to fulfill prescriptions of our medical cannabis products across Germany.
Elsewhere around the world, we have formed partnerships with distributors in multiple countries. Our products are currently available in twelve countries, including Argentina, Argentina, Australia, Chile, Croatia, Cyprus, the Czech Republic, New Zealand and South Africa. We have also entered into a global framework agreement with Sandoz AG, pursuant to which we will work with Sandoz AG to develop and commercialize non-smokable and non-combustible medical cannabis products internationally.
Adult-use supply agreements. Through supply agreements and purchase orders from crown corporations or licensed retailers, we have supplied the adult-use market in Quebec, Ontario, British Columbia, Prince Edward Island, Northwest Territories, Saskatchewan and the Yukon, and anticipate providing product to additional markets in Canada this year.
Direct-to-patient (“DTP”). In Canada, medical cannabis patients order from us primarily through our e-commerce platform or over the phone. In Canada, medical cannabis is and will continue to be delivered by secured courier or other methods permitted by the Cannabis Regulations. The DTP channel accounts for the majority of our medical sales.
Wholesale.In Canada, we are also authorized under the Cannabis Regulations to sell wholesale bulk and finished cannabis products to other licensees under the Cannabis Regulations (“Licensed Producers”).Regulations. The bulk wholesale sales and distribution channel requires minimal selling, general, administrative, and fulfillment costs. Our focus on the right strain assortment, quality of flower, extraction capabilities and processing, enables us to drive wholesale channel opportunities for revenue growth.
Changes in the Canadian market continue to result in more competitors moving towards an asset light model through the rationalization of cultivation facilities. As this transition occurs, the Company anticipates demand for its saleable flower to increase, providing new opportunities in the wholesale channel.
We also intend to expand our capabilities outside of saleable flower, as our quality of extraction processes continue to grow into new categories including the latest in cannabis 3.0 products. We plan to be selective in choosing partners, with the intent to secure supply agreements to further optimize and drive efficiency within our supply chain and operations. While we intend to pursue these wholesale sales channels as a part of our adult-use and medical-use growth strategies in Canada.Canada, these sales will continue to be used to aid in balancing inventory levels.
10
Wellness Sales and Distribution
Our Commitmentwellness sales consist of hemp and other hemp-based food products, which are sold to Researchretailers, wholesalers, and Innovation
direct to consumers. We believeare a leading provider of hemp seeds and related food products that our strength as a medical brand is rootedare sold in our commitment to research and development. Our research and development program focuses on developing innovative products, including novel delivery systems and precisely formulated cannabinoid products, and on the creation and improvement of methods, processes and technologies that allow us to efficiently manufacture such products on a large scale.
Patents and proprietary programs. Our commitment to innovation is a core tenet. We have nine filed patentsover 21,000 retail locations in the fields of cannabis processing technology, formulation, composition delivery system,United States and treatment methods. We also have exclusive rights to at least 20 issued or pending patents, several of which allow for a process aimed at significantly shortening the drying and curing periods. These patents are owned by EnWave Corporation, or EnWave; as licensee, we hold the exclusive, sublicensable right to use the technology embodied by these patents to manufacture cannabis products within Canada and Portugal, provided that certain royalty requirementsavailable globally in 18 countries.
Beverage Alcohol Sales and Distribution
In the U.S., our craft beer, including SweetWater, Alpine, Green Flash and Montauk, are met, as well asdistributed under a three-tier model utilized for beverage alcohol. Distribution points include approximately 29,000 off-premises retail locations ranging from independent bottle shops to national chains. SweetWater’s significant on-premises business allows consumers to enjoy its varietals in more than 10,000 restaurants and bars. Further, in addition to its traditional distribution footprint, SweetWater Elevated HAZY IPA and 420 Strain series are served on all Delta Air Lines flights nationwide plus internationally, totaling more than 50 countries across six continents which have served to extend SweetWater’s brand reach on both a national and international level. The Company supplements this distribution with Delta Air Lines through a kiosk in Atlanta’s Hartsfield-Jackson Airport and secured access to distribute through an on-premises location at the nonexclusive right to marketDenver International Airport. SweetWater is also available in Canada through limited distribution within Ontario and sell such products worldwide. We also have a royalty-bearing commercial sublicense with The Green Organic Dutchman Holdings Ltd (“TGOD”). The sublicense grants TGOD the right to use the technology embodied by EnWave’s patents to manufacture cannabis products. Of the EnWave patents directed to significantly shortening the cannabis drying and curing periods, the earliest expiration dateQuebec. Montauk is June 3, 2019. The other patents directed to either drying or dehydrating biological materials expire from approximately January 2027 to December 2032. We do not expect the expirationdistributed across over 6,400 points of one EnWave patent in 2019 to have a material effect on our current or future financial position nor to impact our future operations.
To retain exclusivity, we will also pay EnWave a minimum annual royalty rate during the termdistribution, including many of the agreement. The minimum annual royaltytop national retailers. In addition, our craft spirit brands from Breckenridge are distributed in all 50-states, and in two on-premises tasting and retail store locations. Breckenridge is based on the amount of full microwave rated power of any EnWave equipment delivered to us.
We have developed a number of innovative and proprietary programs designed to improve efficiency and overall product quality, including: a micro-propagation program that allows for the mass production of disease-free cannabis plants; methods and formulations to improve cannabinoid bioavailability and stability; a delivery platform to allow for the quick and efficient delivery of cannabinoidsalso distributed in formulation; the fast preservation methods that allow for improved smell, texture and flavor of cannabis products; an integrated pest management system; proprietary plant trimming machines to minimize manufacturing waste and software improvements to optimize manufacturing, inventory and distribution processes.
Trademarks and trade dress. We invest heavily in our growing trademark portfolio and hold 19 approved or registered trademarks in a variety of8 different countries, including Canada, Germany, UK, Macau, Australia, New Zealand, and Singapore, with the United States, the European Union, Australia, Israel and several countries in South America and Asia. We also have at least 42 additional trademarks filed and pending in several countries throughout the world. In addition, as a resultintention of further expanding our brand licensing agreement with a former Privateer Holdings subsidiary, we have exclusive access in Canada to a number of strong marks, both registered and applied-for, including Marley Natural and Goodship.
Observational research program. We have implemented an extensive observational research program which includes large-scale prospective and cross-sectional studies in order to gather pre-clinical evidence on medical cannabis patient patterns of use, and the impact of that use on sleep, pain, mental health, quality of life, and the use of opioids/prescription drugs, alcohol, tobacco and other substances. These studies include a biennial national Canadian patient survey, the Tilray Observational Patient Study (“TOPS”), and the Medical Cannabis in Older Patients (“MCOP”) study. This research takes place in partnership with Canadian and U.S. academic institutions, and has provided insight into the use of cannabis in the treatment of headaches/migraines, anxiety, and problematic substance use, and has led to a number of publications in high ranking academic journals, including the following:
Lucas, P., & Walsh, Z. (2017). Medical cannabis access, use, and substitution for prescription opioids and other substances: A survey of authorized medical cannabis patients. International Journal of Drug Policy, 42, 30–35.
Baron, E. P., Lucas, P., Eades, J., & Hogue, O. (2018). Patterns of medicinal cannabis use, strain analysis, and substitution effect amongpatients with migraine, headache, arthritis, and chronic pain in a medicinal cannabis cohort. The Journal of Headache and Pain, 19(1), 37.
11
Lucas, P., Baron, E. P., & Jikomes, N. (2019). Medical cannabis patterns of use and substitution for opioids & other pharmaceuticaldrugs, alcohol, tobacco, and illicit substances; results from a cross-sectional survey of authorized patients. Harm Reduction Journal, 16(1), 9.
Turna, J., Simpson, W., Patterson, B., Lucas, P., & Van Ameringen, M. (2019). Cannabis use behaviors and prevalence of anxiety anddepressive symptoms in a cohort of Canadian medicinal cannabis users. Journal of Psychiatric Research, 111, 134–139.
Clinical trials. Participation in clinical trials is a differentiating element of our research and development program. We believe that the development of clinical data on the use of well-characterized and properly defined cannabinoid products will increase mainstream acceptance within the medical community. As such, we have developed techniques that achieve pharmaceutical-grade Active Pharmaceutical Ingredients (“APIs”) extracted from the cannabis plant to allow Tilray to partner with select academic research partners on trials that meet regulatory agency standards. Our participation in clinical studies includes R&D on the investigational study drug to generate the Chemistry and Manufacturing Controls (“CMC”) documentation required by regulatory agencies, collation of the CMC sections our investigational study drugs, as well as providing assistance in designing the protocol and determining the formulation of the study drug. In some cases, we provide funding for the study itself and/or pharmacokinetic data on the specific study drug. Although some trials, such as the chemotherapy-induced nausea and vomiting, or CINV, trial described below, are undertaken with an aim toward market authorization, most of the trials we participate in serve to generate early phase data that can be used to support patent filings, basic prescribing data for physicians and signals of efficacy to narrow our focus for future clinical trials. We leverage our research by educating physicians about the unique benefits of cannabis-based medicines in various treatments, which we believe promotes the Tilray brand as the most trusted medical brand in the industry. Our Medical Advisory Board, consisting of experts in a variety of areas, participates in the clinical trial selection process and provides us with additional credibility as a clinical trial participant.international distribution.
Clinical trials are typically conducted in phases, with Phase I establishing the safety and pharmacokinetics of the investigational study drug, Phase II further providing a signal for the drug’s efficacy and Phase III establishing statistical significance for the treatment of the disease or symptom being studied over the placebo. Below is a list of the clinical trials in which we are currently involved.
Clinical Trials
|
|
|
|
|
|
|
|
|
| |||||||||
|
|
|
|
|
|
|
|
|
| |||||||||
|
|
|
|
|
|
|
|
|
| |||||||||
|
|
|
|
|
|
|
|
|
| |||||||||
|
|
|
|
|
|
|
|
|
| |||||||||
|
|
|
|
|
|
|
|
|
|
1 See the section titled “Risk Factors”
2 Regulatory approval pending
Regulatory Environment
Canadian Medical and Adult-Use
Medical and adult-use cannabis in Canada is regulated under the federal Cannabis Act (Canada) (the “Cannabis Act”) and the Cannabis Regulations (“CR”), promulgated under the Cannabis Act. Both the CR and the Cannabis Act were adoptedand CR came into force in October 2018, superseding earlier regulationslegislation that only permitted commercial distribution and home cultivation of medical cannabis. Health Canada, a federal government entity, is the oversight and regulatory body for cannabis licenses in Canada. The following are the highlights of the current federal legislation:
• | a federal license is required for companies to cultivate, process and sell cannabis for medical or non-medical purposes. Health Canada, a federal government entity, is the oversight and regulatory body for cannabis licenses in Canada; |
• | allows individuals to purchase, possess and cultivate limited amounts of cannabis for medical purposes and, for individuals over the age of 18 years, for adult-use recreational purposes; |
• | enables the provinces and territories to regulate other aspects associated with recreational adult-use. In particular, each province or territory may adopt its own laws governing the distribution, sale and consumption of cannabis and cannabis accessory products, and those laws may set lower maximum permitted quantities for individuals and higher age requirements; |
allows individuals over the age of 18 to purchase, possess and cultivate limited amounts of cannabis for adult-use purposes; each province is also being permitted to adopt its own laws governing the distribution, sale and consumption of cannabis and cannabis accessory products within the province, and those laws may set lower maximum permitted quantities for individuals and higher age requirements;
promotion, packaging and labelling of cannabis is strictly regulated. For example, promotion is largely restricted to the place of sale, and promotions that appeal to underage individuals are prohibited;
currently, limited classes of cannabis, including dried cannabis and oils, are permitted for sale into the medical and adult-use markets. New classes, including edibles, topicals, and extracts (both ingested and inhaled), are expected to be permitted on or before October 17, 2019;
export is restricted to medical cannabis, cannabis for scientific purposes and industrial hemp;
• | promotion, packaging and labelling of cannabis is strictly regulated. For example, promotion is largely restricted to the place of sale and age-gated environments (i.e., environments with verification measures in place to restrict access to persons of legal age). Promotions that appeal to underage individuals are prohibited; |
• | since the current federal regime came into force on October 17, 2018, certain classes of cannabis, including dried cannabis and oils, have been permitted for sale into the medical and adult-use markets; |
• | following amendments to the CR that came into force on October 17, 2019 (often referred to as Cannabis 2.0 regulations), other non-combustible form-factors, including edibles, topicals, and extracts (both ingested and inhaled), are permitted in the medical and adult-use markets; |
• | export is restricted to medical cannabis, cannabis for scientific purposes, and industrial hemp; and |
• | sale of medical cannabis occurs |
All provincial and territorial governments;
governments have, to varying degrees, enacted regulatory regimes for the distribution and sale of recreational adult-use cannabis within their jurisdiction, including minimum age requirements. The retail-distribution models for adult-use cannabis varyvaries nationwide:
• | Quebec, New Brunswick, Nova Scotia and Prince Edward Island adopted a government-run model for retail and distribution; |
• | Ontario, British Columbia, Alberta, and Newfoundland and Labrador adopted a hybrid model with some aspects, including distribution and online retail being government-run while allowing for private licensed retail stores; |
• | Manitoba and Saskatchewan adopted a private model, with privately-run retail stores and online sales, with distribution in Manitoba managed by the provincial government; |
• | the three northern territories of Yukon, Northwest Territories and Nunavut adopted a model that mirrors their government-run liquor distribution model. |
In addition, the cannabis industry is subject to substantial federal and Prince Edward Island have adopted a government-run model for retailprovincial excise taxes. Excise taxes may be increased in the future by the federal or any provincial government or both.
United States Regulation of Hemp-Based CBD
Hemp products are subject to state and distribution;
Ontario, British Columbia, Alberta, Manitoba and Newfoundland have adopted a hybrid model with some aspects, including stores,federal regulation in respect to the production, distribution and online retail being government-run while allowingsale of products intended for private retail;human ingestion or topical application. Hemp is categorized as Cannabis sativa L., a subspecies of the cannabis genus. Numerous unique, chemical compounds are extractable from Hemp, including CBD. Hemp, as defined in the Agriculture Improvement Act of 2018 (the “2018 Farm Bill”), is distinguishable from marijuana, which also comes from the Cannabis sativa L. subspecies, by its absence of more than trace amounts (0.3% or less) of the psychoactive compound THC.
Saskatchewan has announced a fully private system and;
the three northern territories of Yukon, Northwest Territories and Nunavut have adopted a model that mirrors their government-run liquor distribution model.
All provinces
The 2018 Farm Bill preserves the authority and territories have secured supply agreements from Licensed Producersjurisdiction of the Food and Drug Administration (the “FDA”), under the Food Drug & Cosmetic Act (the “FD&C Act”), to regulate the manufacture, marketing, and sale of food, drugs, dietary supplements, and cosmetics, including products that contain Hemp extracts and derivatives, such as CBD. As a result, the FD&C Act will continue to apply to Hemp-derived food, drugs, dietary supplements, cosmetics, and devices introduced, or prepared for their respective markets, and we are fulfilling adult-use supply agreements and purchase orders from various jurisdictions, consisting of: Quebec, Ontario, British Columbia, Prince Edward Island, Saskatchewan, Manitoba, Alberta, Northwest Territories,introduction, into interstate commerce. The 2018 Farm Bill has also enabled production of hemp seed in the U.S. and the Yukon.FDA approved these products for sale as a food by acknowledging them as GRAS (Generally Recognized as Safe). As a producer and marketer of Hemp-derived products and hemp seed-derived food products, the Company must comply with the FDA regulations applicable to manufacturing and marketing of certain products, including food, dietary supplements, and cosmetics.
As a result of the 2018 Farm Bill, federal law dictates that CBD derived from Hemp is not a controlled substance; however, CBD derived from Hemp may still be considered a controlled substance under applicable state law. Individual states take varying approaches to regulating the production and sale of Hemp and Hemp-derived CBD. Some states explicitly authorize and regulate the production and sale of Hemp-derived CBD or otherwise provide legal protection for authorized individuals to engage in commercial Hemp activities. Other states, however, maintain drug laws that do not distinguish between marijuana and Hemp and/or Hemp-derived CBD which results in Hemp being classified as a controlled substance under certain state laws.
European Union Medical Use
While each country in the European Union (“EU”) has its own laws and regulations, theremany common practices are many commonalities in howbeing adopted relative to the developing and growing medical cannabis markets for EU countries are developing.market. For example, to ensure quality and safe products for patients, many EU countries only permit the import and sale of medical cannabis when the manufacturer can demonstrate certification by a Competent Authority of compliance with Good Manufacturing Practice (“GMP”) standards.from EU-GMP certified manufacturers.
The EU requires adherence to GMPEU-GMP standards for the manufacture of active substances and medicinal products, including cannabis products. Under theThe EU system for certification of GMP adopted in the EU,allows a Competent Authority of any EU member state mayto conduct an inspection at a druginspections of manufacturing sitesites and, if the GMPstrict EU-GMP standards are met, to issue a certificate of GMPEU-GMP compliance that is issuedalso accepted in other EU member countries.
Craft Brewing in the United States
The alcoholic beverage industry in the United States is regulated by federal, state and local governments. These regulations govern the production, sale and distribution of alcoholic beverages, including permitting, licensing, marketing and advertising. To operate their production facilities, SweetWater and Breckenridge must obtain and maintain numerous permits, licenses and approvals from various governmental agencies, including but not limited to, the manufacturer for specific elements ofAlcohol and Tobacco Tax and Trade Bureau (the “TTB”), the manufacturing process being carried onFDA, state alcohol regulatory agencies and state and federal environmental agencies. Our brewery operations are subject to audit and inspection by the TTB at that site.any time.
13
Each countryIn addition, the alcohol industry is subject to substantial federal and state excise taxes. Excise taxes may be increased in the EU will generally recognizefuture by the federal government or any state government or both. In the past, increases in excise taxes on alcoholic beverages have been considered in connection with various governmental budget-balancing or funding proposals.
Environmental Regulation
Our cannabis, brewing and spirits operations are subject to a GMP certificate issuedvariety of federal, state and local environmental laws and regulations and local permitting requirements and agreements regarding, among other things, the maintenance of air and water quality standards and land reclamation. They also set forth limitations on the generation, transportation, storage and disposal of hazardous waste. In addition, any new products introduced by us are subject to a comprehensive environmental assessment by an independent third-party expert, including an assessment of how such products may create environmental risks.
While we have no reason to believe the operation of our facilities violates any Competent Authority withinsuch regulation or requirement, including the EU as evidenceClean Air Act, the Clean Water Act and the Resource Conservation and Recovery Act, environmental regulation is evolving in a manner which may require stricter standards and enforcement, increased fines and penalties for non-compliance, more stringent environmental assessments of compliance with GMP standards. Certificatesproposed projects and a heightened degree of GMP compliance issued byresponsibility for companies and their officers, directors and employees. If a Competent Authorityviolation were to occur, or if environmental regulations were to become more stringent in another country outside of the EU will alsofuture, we could be recognized if that country has a mutual recognition agreement with the EU.adversely affected.
Competitive Conditions
Cannabis Market
We continue to face intense competition from the illicit market as well as other companies, some of which may have longer operating histories and more financial resources and manufacturing and marketing experience. With potential consolidation in the cannabis industry, we could face increased competition by larger and better financed competitors.
Growers of cannabis and retailers operating in the illicit market continue to hold significant market share in Canada and are effectively competitors to our business. Illicit market participants divert customers away through product offering, price point, anonymity and convenience.
Outdoor cultivation also significantly reduces the barrier to entry by reducing the start-up capital required for new entrants in the cannabis industry. It may also ultimately lower prices as capital expenditure requirements related to growing outside are typically much lower than those associated with indoor growing. Further, the licensed outdoor cultivation capacity is extremely large. While outdoor cultivation is almost exclusively extraction grade, its presence in the market will have a negative effect on pricing of extraction grade wholesale cannabis.
As of February 22, 2019, approximately 150 licenses were issued by Health Canada. To our knowledge, only a limited number of licenses are issued byMay 31, 2023, Health Canada monthly, althoughhas issued approximately 980 active licenses to cannabis cultivators, processors and sellers. Health Canada streamlined its license review process to respond to adult-use legalization.
Health Canada licenses are limited to individual properties. As such, if a Licensed Producerlicensed producer seeks to commence production at a new site, it must apply to Health Canada for a new license.
As theof May 31, 2023, approximately 3,700 authorized retail cannabis stores have opened across Canada. As demand for legal cannabis increases and the application backlog with Health Canada is processed,number of authorized retail distribution points increases, we believe that new competitors willare likely to enter the Canadian cannabis market. The principal competitive factors on whichNevertheless, we competebelieve our brand recognition combined with other Licensed Producers are the quality, consistency, and variety of cannabis products we offer will allow us to maintain a prominent position in the Canadian adult use and medical markets.
Competition is also based on product innovation, product quality, price, brand recognition and physician familiarity.loyalty, effectiveness of marketing and promotional activity, the ability to identify and satisfy consumer preferences, as well as convenience and service.
Employees
Internationally, cannabis companies are limited to those countries which have legalized aspects of the cultivation, distribution, sale or use of cannabis. We focused on developing assets in certain strategic international jurisdictions, which maintain legalized aspects of the cannabis business. We possess operational hubs in continents with significant growth opportunities and the production capability and distribution network to distribute such products throughout the region served by each hub. The barrier to entry for competitors in these jurisdictions is significantly influenced by the national regulatory landscape with respect to cannabis and the economic climate subsisting in each region.
We expect more countries to pass regulation allowing for the use of medical and/or recreational cannabis. While expansion of the global cannabis market will provide more opportunities to grow our international business, we also expect to experience increased global competition.
Craft Brewing and Craft Distillery Markets
Through SweetWater, Montauk and Breckenridge, we compete in the craft brewing and distillery markets, respectively, as well as in the much larger alcohol beverage market, which encompasses domestic and imported beers, flavored alcohol beverages, spirits, wine, hard ciders and hard seltzers. With the proliferation of participants and offerings in the wider alcohol beverage market and within the craft beer and craft spirits segments, we face significant competition. There have also been numerous acquisitions and investments in craft brewers by larger breweries and private equity and other investors, which further intensified competition within the craft beer market.
While the craft beer and craft spirits markets are highly competitive, we believe that we possess certain competitive advantages. Our unique portfolio combines an award-winning lineup of craft beers and craft spirits with a unique portfolio of brands closely aligned with a cannabis lifestyle, and supported by state-of-the-art breweries and distilleries and strong distribution across the United States. Additionally, as domestic breweries and distillery, we maintain certain competitive advantages over imported beers and spirits, such as lower transportation costs, a lack of import charges and superior product freshness.
Seasonality
SweetWater’s and Montauk's sales of craft beer and Breckenridge’s sales of craft spirits generally reflect a degree of seasonality, with comparatively higher sales in the summer and the winter holiday season. Typically, the demand for cannabis and hemp-based products is fairly consistent throughout the calendar year, with an increase in the pre-roll cannabis category in the Canadian adult-use market during the summer months. Therefore, the results for any particular quarter may not be indicative of the results to be achieved for the full year.
Environmental and Social
Environmental
Tilray recognizes the importance of climate change and the potential risks it poses to our business and the environment. We are committed to playing our part in mitigating climate change by monitoring our greenhouse gas (GHG) emissions, minimizing our environmental footprint, and promoting sustainable practices within our operations. We understand that climate change presents both risks and opportunities to our business. As a global cannabis-lifestyle and consumer packaged goods company, we recognize that climate-related risks may include changing weather patterns, water scarcity, and regulatory developments related to emissions and energy consumption. These risks can affect our supply chain, cultivation processes, and distribution networks, potentially impacting our financial performance. On the other hand, we see opportunities in adopting sustainable practices, developing innovative solutions, and embracing renewable energy sources. By proactively managing climate-related risks and identifying opportunities, we aim to enhance our resilience, reduce costs, and create long-term value for our shareholders. As such, the Company has implemented several initiatives to address climate change and promote sustainability across our operations which include:
• | GHG Emissions Monitoring: We are committed to monitoring our GHG emissions by assessing energy-efficient technologies, optimizing transportation logistics, and monitoring our energy consumption. |
• | Supply Chain Sustainability: We are working closely with our suppliers to encourage innovative solutions to improve our environmental footprint. This includes assessing suppliers' environmental performance, promoting responsible sourcing, and supporting initiatives that enhance sustainability throughout the value chain. Specifically, in our Cannabis business we recently adopted the use of biodegradable Hemp packaging on certain products to reduce the use of single-use plastics. |
• | Waste Management: We have implemented waste management programs to minimize waste generation and promote recycling and reuse. Through these efforts, we strive to reduce our environmental impact and contribute to the circular economy. |
Social
As a socially responsible corporation, Tilray recognizes the importance of December 31, 2018, we employed 688 total employees, 657addressing the social dimensions of which are full time employees and engaged contractors located in Canada, Germany, Portugal, Ireland the United States, Australia and Czech Republic, including 425 employees in research, product development, engineering andour operations and logistics, 84their impact on various stakeholders. We actively engage with the communities in which we operate, understanding that our success is intertwined with their well-being. Through donations to the Erie Shores Community Hospital in Leamington, support to our Canadian veterans and other compassionate use cannabis programs, and donations from SweetWater to Ch8sing Waterfalls in Atlanta, a non-profit focused on empowering women of color, we aim to address local needs and contribute to social development. Additionally, the Company donated a substantial amount of medical supplies from our subsidiary CC Pharma, to the Ukraine to aid them during the existing conflict. We strive to help inspire and empower the worldwide community to live their very best life, and build long-lasting relationships based on trust and mutual benefit.
Employees and Human Capital Resources
Our Commitments and Values
Our vision and purpose unite, inform and inspire our employees to apply their talents to make a positive difference. We foster a collaborative and dynamic work environment providing all employees with the opportunity to work cross-functionally and easily gain exposure to other teams’ diverse opinions and perspectives. We strive for every employee to reach their full potential and grow with Tilray.
We continue to focus on developing a culture of compliance, which includes annual training for the Company's employees on applicable corporate policies, including our Code of Conduct, Insider Trading and Trading Window Policy, Corporate Governance Guidelines and Open Door Policy for Reporting Complaints Regarding Accounting and Auditing Matters.
In an emerging and constantly evolving industry, our values unite us, informing and inspiring the way we work with one another and our patients, consumers, customers and partners. The following core values serve as our compass in generalour strategic direction and administrativedecisions:
| • | We foster a culture of openness, inclusivity and belonging; |
| • | We continually set the bar higher for ourselves and are resilient and adaptive in the face of change; |
| • | We make choices rooted in the belief that transparency, integrity & accountability are at the core of all that we do; and |
| • | We strive for excellence and are steadfast yet agile in the pursuit of our goals. |
At Tilray, we recognize that our people are our greatest asset, and 88we strive to create a workplace that fosters their growth, development, and wellbeing. As of May 31, 2023, we have approximately 1,600 employees in sales and marketing.worldwide. We consider relations with our employees to be good and have never experienced work stoppage. Apartstoppages. Aside from certain employees in Portugal, none of our employees are represented by a labor unionunions or are subject to a collective bargaining agreement. Inagreements. As is common for most companies doing business in Portugal, some of our employeeswe are subject to a government-mandated collective bargaining agreement which grants affected employees certainnominal additional benefits beyond those required by the local labor code.
Our human capital resource management approach is centered on the following key areas:
• | Talent Acquisition and Development. We have implemented a comprehensive talent acquisition and development program to attract, retain, and develop our employees. This includes regular performance assessments, feedback mechanisms, and opportunities for skill-building and career advancement. |
• | Diversity and Inclusion. We are committed to creating a diverse and inclusive workplace, where all employees feel valued, respected, and supported. We have globally mandated unconscious bias training, and are focused on setting strategies for increasing diversity, promoting inclusivity, and reducing biases across the organization. Diversity and inclusion is a priority for our company, and we seek out talented people from a variety of backgrounds to staff our teams in all our markets. |
• | Health and Safety. We are committed to providing a safe and healthy workplace for all employees. We have implemented strict health and safety protocols, including regular safety training, ergonomic assessments, and mental health support. |
• | Compensation and Benefits. We strive to provide competitive compensation and benefits packages that align with industry standards and reflect the value that our employees bring to the organization. |
• | Employee Engagement. We prioritize employee engagement and satisfaction, as we believe that engaged employees are more productive, innovative, and committed. |
Available Information
Our website address is www.tilray.com. We file or furnish annual, quarterly and current reports, proxy statements and other information with the United States Securities and Exchange Commission (“SEC”). You may obtain a copy of any of these reports, free of charge, from the investors section of our website as soon as reasonably practicable after we electronically file such material with, or furnish it to, the SEC. The SEC maintains an Internet site that also contains these reports at: www.sec.gov. In addition, copies of our annual report are available, free of charge, on written request to us.
We have a Code of Conduct that applies to our Board of Directors (“Board”) and all of our officers and employees, including, without limitation, our Chief Executive Officer and Chief Financial Officer. You can obtain a copy of our Code of Conduct, as well as our Corporate Governance Guidelines and charters for each of the Board’s standing committees, from the Investors section of our website at: www.tilray.com. If we change or waive any portion of the Code of Conduct that applies to any of our directors, executive officers or senior financial officers, we will disclose such information. Information on our website is not incorporated by reference into this Form 10-K or any other report filed with the SEC.
Careful consideration should
Risks Related to each of the HEXO Transaction and MedMen Investment
We may experience difficulties integrating Tilray and HEXO’s operations and realizing the expected benefits of the Arrangement Agreement.
The success of the Arrangement Agreement will depend in part on our ability to realize the expected operational efficiencies and associated cost synergies and anticipated business opportunities and growth prospects from combining Tilray and HEXO in an efficient and effective manner. We may not be givenable to fully realize the operational efficiencies and associated cost synergies or leverage the potential business opportunities and growth prospects to the following risk factors, in additionextent anticipated or at all. Additionally, closing of the Arrangement transactions remains subject to the other informationsatisfaction of various closing conditions set forth in this Annual Reportthe Arrangement Agreement.
The Arrangement Agreement was entered into on Form 10-KApril 10, 2023, which closed on June 22, 2023, and we are in other documents that we filethe early stages of our integration efforts. The integration of operations and corporate and administrative infrastructures may require substantial resources and divert management attention. Challenges associated with the SECintegration may include those related to retaining and motivating executives and other key employees, blending corporate cultures, eliminating duplicative operations, and making necessary modifications to internal control over financial reporting and other policies and procedures in accordance with applicable laws. Some of these factors are outside our control, and any of them could delay or publiclyincrease the cost of our integration efforts.
The integration process could take longer than anticipated and could result in Canada,the loss of key employees, the disruption of each company’s ongoing businesses, increased tax costs, inefficiencies, and inconsistencies in evaluatingstandards, controls, information technology systems, policies and procedures, any of which could adversely affect our companyability to maintain relationships with employees, customers or other third parties, or our ability to achieve the anticipated benefits of the transaction, and could harm our financial performance. If we are unable to successfully integrate certain aspects of the operations of Tilray and HEXO or experience delays, we may incur unanticipated liabilities and be unable to fully realize the potential benefit of the revenue growth, synergies and other anticipated benefits resulting from the arrangement, and our business. Investing in our securities involves a high degree of risk. If any of the following risks actually occur, our business, financial condition, results of operations and future growth prospectsfinancial condition could be materiallyadversely affected. Even if we are able to successfully close the Arrangement transactions, the foregoing risks for the Company would still exist.
We have made substantial commitments of resources and adversely affected.capital in connection with the MedMen investment.
Also, on August 13, 2021 the Company acquired $165.8 million of certain senior secured convertible notes and related warrants issued by MedMen Enterprises Inc., via the Company’s ownership interest in a limited partnership. These investments, separately and in the aggregate, represent a significant commitment of capital by the Company, and there can be no assurance that the Company will be able to realize returns on these investments or recoup its initial investments.
Risks Related to our Medicalthe Cannabis Business and the Medical Cannabis Industry
We are
Our cannabis business is dependent upon regulatory approvals and licenses, for our ability to grow, process, package, store, sell and export medical cannabis and other products derived therefrom, and these regulatory approvals are subject to ongoing compliance requirements,and reporting obligations, and fixed terms requiring renewal.timely renewals.
Our ability to grow,cultivate, process, package, store and sell driedmedical and adult-use cannabis, cannabis-derived extracts and derivative cannabis extracts, including both bottled oil and capsules, for medical purposesproducts in Canada is dependent on maintaining the licenses issued to our currentoperating subsidiaries by Health Canada licenses under the Cannabis Regulations, (“CR”), covering our production facility at our Tilray North America Campus in Nanaimo, British Columbia, or Tilray Nanaimo.CR. These licenses allow us to produce dried cannabis in bulk and cannabis extracts at Tilray Nanaimofinished forms and to sell and distribute driedsuch cannabis bottled cannabis oil and encapsulated cannabis oil in Canada. They also allow us to import and export medical cannabis raw materialin bulk and productsfinished form to and from specified jurisdictions around the world, subject to obtaining, for each specific shipment, an export approval from Health Canada and an import approval (or no objection notice) from the applicable regulatory authority in the country to or from which the export or import is being made. TheThese CR licenses for Tilray Nanaimoand other approvals are valid for fixed periods and we must obtain renewals on a periodic basis. There can be no assurance that existing licenses will need to be renewed ator new licenses obtained on the end of such periods.same or similar terms as our existing licenses, nor can there be any assurance that Health Canada will continue to issue import or export permits on the same terms or on the same timeline, or that other countries will allow, or continue to allow, imports or exports.
We are also holdrequired to obtain and maintain certain permits, licenses under the CR covering our facilitiesor other approvals from regulatory agencies in Enniskillen, London,countries and Leamington, Ontariomarkets outside of Canada in which we intendoperate or to use to servicewhich we export our product, including, in the adult-use market. These licenses allow us to produce, sell, and distribute cannabis and/or cannabis products in Canada. These licenses are valid for fixed periods and will need to be renewed atcase of certain countries, the end of such periods.
14
Our ability to operate in our proposed facilitydemonstrate compliance with EU-GMP standards. We have received certification of compliance with EU-GMP standards for cultivation and production at our Tilray European Union Campus located in Cantanhede, Portugal, or Tilray Portugal is dependent on ourand Aphria RX in Germany, as well as Part II EU-GMP certification for Aphria One and Part I EU-GMP certification for ARA-Avanti Rx Analytics Inc.’s (“Avanti”) approved facility. These GMP certified facilities are subject to extensive ongoing compliance reviews to ensure that we continue to maintain compliance with current authorization forGMP standards. There can be no assurance that we will be able to continue to comply with these standards. Moreover, future governmental actions in countries where we operate, or export products, may limit or altogether restrict the cultivation, import andand/or export of cannabis and in the future will be dependent on our pending authorization (assuming such authorization is approved) for the manufacture of cannabis products and Good Manufacturing Practices, or GMP, certification, by the Portuguese National Authority of Medicines and Health Products, or INFARMED. This license is valid for a single growing season at a time and notification to INFARMED is needed to renew the license for subsequent growing seasons. All licenses are subject to ongoing compliance and reporting requirements and renewal.products.
We have applied for a sale license under the CR for our facility in London, Ontario, or the High Park Processing Facility. This application has not yet been approved.
Any future medical cannabis production facilities that we operate in Canada or elsewhere will also be subject to separate licensing requirements under the CR.CR or applicable local requirements. Although we believe that we will meet the requirements of the CR for future renewals of our existing licenses and grants of permits under such licenses, and to obtain correspondingrequisite licenses for future facilities, in Canada, there can be no assurance that existing licenses will be renewed or new licenses obtained on the same or similar terms as our existing licenses, nor can there be any assurance that Health Canada will continue to issue import or export permits on the same terms or on the same timeline, or that other countries will allow, or continue to allow, imports or exports. An agency’s denial of or delay in issuing or renewing a permit, license or other approval, or revocation or substantial modification of an existing permit, license or approval, could restrict or prevent us from continuing the affected operations, or limit the export and/or import of our cannabis products. In addition, the export and import of cannabis is subject to United Nations treaties establishing country-by-country national estimates and our export and import permits are subject to these estimates which could limit the amount of cannabis we can export to any particular country.
Further, weour facilities are subject to ongoing inspections by Health Canadathe governing regulatory authority to monitor our compliance with itstheir licensing requirements. Our existing licenses and any new licenses that we may obtain in the future in Canada or other jurisdictions may be revoked or restricted at any time in the event that we are found not to be in compliance. Should we fail to comply with the applicable regulatory requirements or with conditions set out under our licenses, should our licenses not be renewed when required, or be renewed on different terms, or should our licenses be revoked, we may not be able to continue producing or distributing medical cannabis in Canada or other jurisdictions or to import or export medical cannabis outside of Canada or Portugal.
products. In addition, we may be subject to enforcement proceedings resulting from a failure to comply with applicable regulatory requirements in Canada or other jurisdictions, which could result in damage awards, athe suspension, of our existing approvals, a withdrawal of our existing approvals, the denial of the renewalor non-renewal of our existing approvals or anydenial of future approvals, recallsrecall of products, product seizures, the imposition of future operating restrictions on our business or operations or the imposition of civil, regulatory or criminal fines or penalties against us, our officersother penalties.
Government regulation is evolving, and directors and other parties. These enforcement actionsunfavorable changes or lack of commercial legalization could delay or entirely prevent us from continuing the production, testing, marketing, sale or distribution of our medical products and divert management’s attention and resources away from our business operations.
The laws, regulations and guidelines generally applicable to the medical cannabis industry in Canada and other countries may change in ways that impact our ability to continuecarry on our business as currently conducted or proposed to be conducted.and the potential expansion of our business.
We operate in a highly regulated and rapidly evolving industry. The successful execution of our medical cannabis business objectives is contingent upon compliance with all applicable laws and regulatory requirements in Canada (including the Cannabis Act and CR), Europe and other jurisdictions, including the requirements of the CR in Canada, and obtaining all other required regulatory approvals for the production, sale, import and export of our medical cannabis products. The commerciallaws, regulations and guidelines generally applicable to the cannabis industry domestically and internationally may change in ways currently unforeseen. Any amendment to or replacement of existing laws, regulations, guidelines or policies may cause adverse effects to our operations, financial condition, results of operations and prospects.
The federal legislative framework pertaining to the Canadian cannabis market is still very new. In addition, the governments of every Canadian province and territory have implemented different regulatory regimes for the distribution and sale of cannabis for adult-use purposes within those jurisdictions. There is no guarantee that the Canadian legislative framework regulating the cultivation, processing, distribution and sale of cannabis will not be amended or replaced or the current legislation will create the growth opportunities we currently anticipate.
In the United States, despite cannabis having been legalized at the state level for medical use in many states and for adult-use in a number of states, cannabis meeting the statutory definition of “marijuana” continues to be categorized as a Schedule I controlled substance under the federal Controlled Substances Act, or the CSA, and subject to the Controlled Substances Import and Export Act, or the CSIEA. Hemp and marijuana both originate from the Cannabis sativa plant and CBD is a constituent of both. “Marihuana” or “marijuana” is defined in the CSA as a Schedule I controlled substance whereas “hemp” is essentially any parts of the Cannabis sativa plant that has not been determined to be marijuana. Pursuant to the 2018 Farm Bill, “hemp,” or cannabis and cannabis derivatives containing no more than 0.3% of tetrahydrocannabinol, or THC, is now excluded from the statutory definition of “marijuana” and, as such, is no longer a Schedule I controlled substance under the CSA. As a result, our activity in the United States is limited to (a) certain corporate and administrative services, including accounting, legal and creative services, (b) supply of study drug for clinical trials under DEA and FDA authorization, and (c) participation in the market for hemp and hemp-derived products containing CBD in compliance with the 2018 Farm Bill.
There can be no assurance that the United States will implement federal legalization of cannabis. With respect to CBD and hemp, while the 2018 Farm Bill exempts hemp and hemp derived products from the CSA, the commercialization of hemp products in the United States is subject to various laws, including the 2018 Farm Bill, the FD&C Act, the Dietary Supplement Health and Education Act, or (the “DSHEA”), applicable state and/or local laws, and FDA regulations. See also Risk Factor “United States regulations relating to hemp-derived CBD products are new and rapidly evolving, and changes may not develop in the timeframe or manner most favorable to our business objectives”.
Our ability to expand internationally is also contingent, in part, upon compliance with applicable regulatory requirements enacted by governmental authorities and obtaining all requisite regulatory approvals. We cannot predict the impact of the compliance regime that governmental authorities may implement to regulate the adult-use or medical cannabis industry is a relatively new industry in Canadaindustry. Similarly, we cannot predict how long it will take to secure all appropriate regulatory approvals for our products, or the extent of testing and the CR is a regimedocumentation that has only been in effect in its current form since October 2018.may be required by governmental authorities. The effect of Health Canada’s administration, application and enforcementimpact of the regime established by the CR on us and our businessvarious compliance regimes, any delays in Canada,obtaining, or the administration, application and enforcement of the laws of other countries by the appropriate regulators in those countries,failure to obtain regulatory approvals may significantly delay or impact our ability to participate in the Canadian medical cannabis market or medical cannabisdevelopment of markets, outside Canada, to develop medical cannabis products and producesales initiatives and sell these medicalcould have a material adverse effect on our business, financial condition, results of operations and prospects. As the commercial cannabis products.
industry develops in Canada and other jurisdictions, we anticipate that regulations governing cannabis in Canada and globally will continue to evolve. Further, Health Canada or the regulatory authorities in other countries in which we operate or to which we export our medical cannabis products may change their administration interpretation or application of the applicable regulations or their compliance or enforcement procedures at any time. Any such changes could require us to revise our ongoing compliance procedures, requiring us to incur increased compliance costs and expend additional resources. There is no assurance that we will be able to comply or continue to comply with applicable regulations.regulations, which could impact our ability to continue to carry on business as currently conducted and the potential expansion of our business.
15
AnyWe currently incur and will continue to incur ongoing costs and obligations related to regulatory compliance. A failure on our part to comply with applicable regulations could prevent us from being able to carrymay result in additional costs for corrective measures, penalties or restrictions on our business.
Health Canada inspectors routinely assess Tilray Nanaimo, High Park Farms and High Park Gardens for compliance with applicable regulatory requirements. Our Tilray Portugal facilities will also be inspected for compliance by applicable regulators once construction is complete, and both our Tilray Portugal facilities and our High Park Processing Facility will be subject to certain ongoing inspections and audits once licensing is complete. Furthermore, the import of our products intobusiness or operations. In addition, changes in regulations, more vigorous enforcement thereof or other jurisdictions, such as Germany and Australia, is subject to the regulatory requirements of the respective jurisdiction. Any failure by us to comply with the applicable regulatory requirementsunanticipated events could require extensive changes to our operations; result in regulatory or agency proceedings or investigations,operations, increased compliance costs damage awards, civil or criminal fines or penalties or restrictions on our operations; and harm our reputation or give rise to material liabilities, or a revocation of our licenses and other permits. There can be no assurance that any pending or future regulatory or agency proceedings, investigations or audits will not result in substantial costs, a diversion of management’s attention and resources or other adverse consequences to us and our business.
Our ability to produce and sell our medical products in, and export our medical products to, other jurisdictions outside of Canada is dependent on compliance with additional regulatory and other requirements.
We are required to obtain and maintain certain permits, licenses or other approvals from regulatory agencies in countries and markets outside of Canada in which we operate, or to which we export, to produce or export to, and sell our medical products in, these countries, including, in the case of certain countries, the ability to demonstrate compliance with GMP standards. Our current certification of compliance with GMP standards for production at Tilray Nanaimo and any other GMP certification that we may receive in the future subject us, or will in the future subject us, to extensive ongoing compliance reviews to ensure that we continue to maintain compliance with GMP standards. There can be no assurance that we will be able to continue to comply with these standards.
The continuation or expansion of our international operations depends on our ability to renew or secure necessary permits, licenses and other approvals. An agency’s denial of or delay in issuing or renewing a permit, license or other approval, or revocation or substantial modification of an existing permit, license or approval, could prevent us from continuing our operations in, marketing efforts in, or exports to countries other than Canada. For example, Tilray Nanaimo’s current certification of GMP compliance must be renewed via re-inspection prior to October 2020, and our failure to maintain such certification, or to comply with applicable industry quality assurance standards or receive similar regulatory certifications at any of our other facilities, may prevent us from continuing the expansion of our international operations. In addition, the export and import of medical cannabis is subject to United Nations treaties establishing country-by-country quotas and our export and import permits are subject to these quotas which could limit the amount of medical cannabis we can export to any particular country.
The long-term effect of the legalization of adult-use cannabis in Canada on the medical cannabis industry is unknown, and may have a significant negative effect upon our medical cannabis business if our existing or future medical use customers decide to purchase products available in the adult-use market instead of purchasing medical use products from us.
In June 2018, the government of Canada passed Bill C-45, or the Cannabis Act, the Canadian federal legislation allowing individuals over the age of 18 to legally purchase, process and cultivate limited amounts of cannabis for adult use in Canada. The Cannabis Act and accompanying regulations, the CR, became effective on October 17, 2018. As a result, individuals who previously relied upon the medical cannabis market to supply their medical cannabis and cannabis-based products may cease this reliance, and instead turn to the adult-use cannabis market to supply their cannabis and cannabis-based products. Factors that may influence this decision include the availability of product in each market, the price of medical cannabis products in relation to similar adult-use cannabis products, and the ease with which each market can be accessed in the individual provinces and territories of Canada. The impact of adult-use cannabis on the medical market is not yet ascertainable by us given the newness of the adult-use market in Canada, and given industry-wide supply shortages in both the medical and adult-use markets.
16
A decrease in the overall size of the medical cannabis market as a result of the legal adult-use market in Canada may reduce our medical sales and revenue prospects in Canada. Moreover, the CR regulation of cannabis for medical purposes is expected to be reviewed in light of the adult-use market. Thematerial adverse effect on our business, financial condition, results of operations and the medical cannabis market in general, of such a review is uncertain.prospects.
There has been limited study on the effects of medical cannabis
Our production and future clinical research studies may lead to conclusions that dispute or conflict with our understanding and belief regarding the medical benefits, viability, safety, efficacy, dosing and social acceptance of cannabis.
Research in Canada, the United States and internationally regarding the medical benefits, viability, safety, efficacy and dosing of cannabis or isolated cannabinoids (such as CBD and THC) remains in relatively early stages. There have been few clinical trials on the benefits of cannabis or isolated cannabinoids conducted by us or by others.
Future research and clinical trials may draw opposing conclusions to statements contained in the articles, reports and studies referenced in this Annual Report on Form 10-K, or could reach different or negative conclusions regarding the medical benefits, viability, safety, efficacy, dosing or other facts and perceptions related to medical cannabis, which could adversely affect social acceptance of cannabis and the demand for our products.
Tilray Nanaimo, High Park Farms, High Park Gardens and our High Park Processing Facility and Tilray Portugalprocessing facilities are expected to become integral to our business and adverse changes or developments affecting any of theseour facilities may have an adverse impact on us.our business.
Currently,
Our cultivation and processing facilities are integral to our activitiesbusiness and resources are focused on the operation of Tilray Nanaimo, High Park Farms, High Park Gardens and our current licenses under the CR areissued by applicable regulatory authorities is specific to Tilray Nanaimo, High Park Farms, High Park Gardens and our High Park Processing Facility.each of these facilities. Adverse changes or developments affecting these facilities, including, but not limited to, disease or infestation of our crops, a fire, an explosion, a power failure, a natural disaster, an epidemic, pandemic or other public health crisis, or a material failure of our security infrastructure, could reduce or require us to entirely suspend our production of cannabis. operations at the affected facilities.
A significant failure of our site security measures and other facility requirements, including any failure to comply with applicable regulatory requirements, under the CR, could have an impact on our ability to continue operating under our Health Canadafacility licenses and our prospects of renewing our Health Canada licenses, and could also result in a suspension or revocation of these licenses.
We face intense competition, and anticipate competition will increase, which could hurt our business.
We face, and we expect to continue to face, intense competition from other Licensed Producers and other potential competitors, some of which have longer operating histories and more financial resources than we have. In addition, we anticipate that the cannabis industry will continue to undergo consolidation, creating larger companies with financial resources, manufacturing and marketing capabilities and product offerings that may be greater than ours. As a result of this competition, we may be unable to maintain our operations or develop them as currently proposed, on terms we consider acceptable, or at all.
Health Canada licenses. As we produce our medical cannabis products in Tilray Nanaimo, any event impactinghas issued hundreds of licenses for Licensed Producers. The number of licenses granted and the number of Licensed Producers ultimately authorized by Health Canada could have an adverse impact on our ability to continue production at Tilray Nanaimo, or requiring us to delay production, would prevent us from continuing to operate our business until operations at Tilray Nanaimo could be resumed, or until we were able to commence production at another facility.
compete for market share in Canada. We expect to expand Tilray Nanaimo, High Park Farms,face additional competition from new market entrants and may experience downward price pressure on our High Park Processing Facility,cannabis products as new entrants increase production. If the number of users of cannabis in Canada increases, the demand for products will increase and the Company expects that competition will become more intense, as current and future competitors begin to complete constructionoffer an increasing number of diversified products and pricing strategies.
Our commercial opportunity in the medical and adult-use markets could also be impacted if our Tilray Portugal facilities. Wecompetitors produce and commercialize products that, among other things, are also contemplating expanding our newly acquired High Park Gardens facility. We expectsafer, more effective, more convenient or less expensive than the products that expanded and additional facilities will significantly increase our cultivation, growing, processingwe may produce, have greater sales, marketing and distribution capacity; however,support than our products, enjoy enhanced timing of market introduction and perceived effectiveness advantages over our products and receive more favorable publicity than our products. To remain competitive, we intend to continue to invest in research and development, impediments such as construction delays or cost over-runs in respectmarketing and sales and client support. We may not have sufficient resources to maintain research and development, marketing and sales and client support efforts on a competitive basis.
In addition to the developmentforegoing, the legal landscape for medical and adult-use cannabis is changing internationally. We maintain operations outside of these facilities, howsoever caused,Canada, which may be affected as other countries develop, adopt and change their laws related to medical and adult-use cannabis. Increased international competition, including competition from suppliers in other countries who may be able to produce at lower cost, and limitations placed on us by Canadian or other regulations, might lower the demand for our cannabis products on a global scale.
Competition from the illicit cannabis market could delay or preventimpact our ability to producesucceed.
We face competition from illegal market operators that are unlicensed and unregulated including illegal dispensaries and illicit market suppliers selling cannabis atand cannabis-based products. As these facilities. Itillegal market participants do not comply with the regulations governing the cannabis industry, their operations may have significantly lower costs. The perpetuation of the illegal market for cannabis may have a material adverse effect on our business, results of operations, as well as the perception of cannabis use. Furthermore, given the restrictions on regulated cannabis retail, it is also possible that the final costs of the major equipment contemplated by our capital expenditure program relatinglegal cannabis consumers revert to the developmentillicit market as a matter of our High Park Farms, our High Park Processing Facility and Tilray Portugal may be significantly greater than anticipated, in which circumstance we may be required to curtail, or extend the timeframes for completing, such capital expenditure plans which would reduce our production capacity.convenience.
We have periodically procured cannabis from other CR sources to supplement internal production, which, during 2018, 2017 and 2016 represented approximately twenty-six, five, and two percent, respectively, of our total production. If we are unsuccessful in scaling operations at our facilities, we may need to continue to procure cannabis from third parties, likely at a higher price than our own cost to produce, which would have a negative impact on gross margin.
17
The medical cannabis industry and market are relatively new in Canada and other jurisdictions, and this industry and market may not continue to exist or develop as anticipated or we may ultimately be unableevolving, which could impact our ability to succeed in this industry and market.
We are operating our current business in a relatively new medical cannabis industry and market that is expanding globally, and our success depends on our ability to attract and retain consumers and patients. In additionThere are many factors which could impact our ability to being subjectattract and retain consumers and patients, including but not limited to generalbrand awareness, our ability to continually produce desirable and effective cannabis products and the ability to bring new consumers and patients into the category. The failure to acquire and retain consumers and patients could have a material adverse effect on our business, risks applicable to a business involving an agricultural productfinancial condition, results of operations and a regulated consumer product,prospects.
To remain competitive, we need towill continue to innovate new products, build brand awareness of our Tilray brand in the medical cannabis industry and make significant investments in our business strategy and production capacity. These investments include introducing new products into the markets in which we operate, adopting quality assurance protocols and procedures, building our international presence and undertaking regulatory compliance efforts.research and development. These activities may not promote our medical products as effectively as intended, or at all, and we expect that our competitors will undertake similar investments to compete with us for market share. Competitive conditions, consumer preferences, regulatory conditions, patient requirements, healthcare practitioner prescribing practices, and spending patterns in this industry and market are relatively unknown and may have unique characteristics that differ from other existing industries and markets and that cause our efforts to further our business to be unsuccessful or to have undesired consequences. As a result, we may not be successful in our efforts to attract and retain patientscustomers or to develop new medical cannabis products and produce and distribute these medical cannabis products to the markets in which we operate or to which we export in time to be effectively commercialized, or these activities may require significantly more resources than we currently anticipate in order to be successful.
We compete for market share with other companies, including other producers licensed by Health Canada, some of which have longer operating histories and more financial resources and manufacturing and marketing experience than we have.
We face, and we expect to continue to face, intense competition from Licensed Producers and other potential competitors, some of which have longer operating histories and more financial resources and manufacturing and marketing experience than we have. In addition, it is possible that the medical cannabis industry will undergo consolidation, creating larger companies with financial resources, manufacturing and marketing capabilities and product offerings that are greater than ours. As a result of this competition, we may be unable to maintain our operations or develop them as currently proposed, on terms we consider acceptable, or at all.
There are currently hundreds of applications for Licensed Producer status being processed by Health Canada. The number of licenses granted and the number of Licensed Producers ultimately authorized by Health Canada could have an adverse impact onRegulations constrain our ability to compete for market share in Canada’s medical cannabis industry. We expect to face additional competition from new market entrants that are granted licenses under the CR or existing license holders that are not yet active in the industry. If a significant number of new licenses are granted by Health Canada, we may experience increased competition for market share and may experience downward price pressure ondistribute our medical cannabis products as new entrants increase production.
In addition, the CR permits patients in Canada to produce a limited amount of cannabis for their own medical purposes or to designate a person to produce a limited amount of cannabis on their behalf for such purposes. Widespread reliance upon this allowance could reduce the current or future consumer demand for our medical cannabis products.
If the number of users of cannabis for medical purposes in Canada increases, the demand for products will increase. This could result in the competition in the medical cannabis industry becoming more intense as current and future competitors begin to offer an increasing number of diversified medical cannabis products. Conversely, if there is a contraction in the medical market for cannabis in Canada, resulting from the legalization of adult-use cannabis or otherwise, competition for market share may increase. To remain competitive, we intend to continue to invest in research and development and sales and patient support; however, we may not have sufficient resources to maintain research and development and sales and patient support efforts on a competitive basis.
In addition to the foregoing, the legal landscape for medical cannabis use is changing internationally. We have operations outside of Canada, which may be affected as other countries develop, adopt and change their medical cannabis laws. Increased international competition, including competition from suppliers in other countries who may be able to produce at lower cost, and limitations placed on us by Canadian or other regulations, might lower the demand for our medical cannabis products on a global scale.
18
The illicit supply of cannabis and cannabis-based products may reduce our sales and impede our ability to succeed in the medical and adult-use cannabis markets
In addition to competition from Licensed Producers and those able to produce cannabis legally without a license, we also face competition from unlicensed and unregulated market participants, including illegal dispensaries and black market suppliers selling cannabis and cannabis-based products in Canada.
Despite the legalization of medical and adult-use cannabis in
In Canada, black market operations remain abundant andthere are a substantial competitor to our business. In addition, illegal dispensaries and black market participants may be able to (i) offer products with higher concentrations of active ingredients that are either expressly prohibited or impracticable to produce under current Canadian regulations, and (ii) use delivery methods, including edibles, concentrates and extract vaporizers, that we are currently prohibited from offering to individuals in Canada, (iii) brand products more explicitly, and (iv) describe/discuss intended effects of products. As these illicit market participants do not comply with the regulations governing the medical and adult-use cannabis industry in Canada, their operations may also have significantly lower costs.
As a result of the competition presented by the black market for cannabis, any unwillingness by consumers currently utilizing these unlicensed distribution channels to begin purchasing from Licensed Producers for any reason or any inability or unwillingness of law enforcement authorities to enforce laws prohibiting the unlicensed cultivation and sale of cannabis and cannabis-based products could (i) result in the perpetuation of the black market for cannabis, (ii) adversely affect our market share and (iii) adversely impact the public perception of cannabis use and licensed cannabis producers and dealers, all of which would have a materially adverse effect on our business, operations and financial condition.
Risks Related to our Adult-Use Cannabis Business and the Adult-Use Cannabis Industry in Canada
The adult-use cannabis industry, and the regulations governing this industry, may develop in a way that is significantly different from our current expectations, resulting in our decreased ability, or inability, to compete in this market and industry.
The Cannabis Act allows for regulated and restricted access to cannabis for recreational adult use in Canada. We expect to operate a part of our business in the adult-use cannabis industry and market.
There is no assurance that the adult-use cannabis industry, and the regulations governing this industry, will develop as anticipated. There are and will be significant regulatory restrictions on the marketing, branding, product formats, product composition, packaging, and distribution channels allowed under the Cannabis Act, which may reduce the value of certain of our products and brands or negatively impact our ability to compete with other companies in the adult-use cannabis market. Adult-use legislationproducts. For instance, the CR includes a requirement for health warnings on product packaging, the limited ability to use logos and branding (only one logobrand name and one brand element per package), restrictions on packaging itself, and restrictions on types and avenues of marketing. AdditionalCannabis 2.0 regulations, which govern the production and sale of new classes or forms of cannabis products (including vapes and edibles), impose considerable restrictions on product composition, labeling, and packaging in addition to being subject to similar marketing restrictions have been imposed by some provinces and territories. We are reasonably certain that we will continue to be able to adapt our licensed brands and products to satisfy these restrictions and to package and successfully distinguish these brands in the marketplace while remaining compliant with applicable laws (including all provincial legislation); however further provincial or other legislation containing additional restrictions, such as a complete ban on marketing, may impact our ability to do so. Such additional restrictions may impair our ability to develop our adult-use brands, and a complete ban on marketing may make it uneconomic or unfeasible for us to introduce our entire portfolio of brands and products into the Canadian market, which means that we will be unable to reap the full benefit of the exclusive rights we have secured to such brands and products. existing form factors.
Further, each province and territory of Canada has the ability to separately regulate the distribution of cannabis within such province or territory (including the legal age), and the rules (including associated regulations)and regulations adopted by these provinces or territories vary significantly. Additional marketing and product composition restrictions have been imposed by some provinces and territories. Such variancefederal and provincial restrictions may make participation in theimpair our ability to differentiate our products and develop our adult-use cannabis market uneconomic or of limited economic benefit for us in thosebrands. Some provinces orand territories and could result inalso impose significant additional compliance or other costs and limitationsrestrictions on our ability to compete successfullymerchandise products; for example, some provinces impose restrictions on investment in each such market.
19
The adult-use cannabis marketretailers or distributors as well as in Canada may experience supply fluctuations resulting in revenue and price decreases.
As a result of the legalization of adult cannabis use in Canada, the demand for cannabis may dramatically increase. Licensed Producers, and others licensed to produce cannabis under the Cannabis Act, may not be able to produce enough cannabis to meet adult-use demand. This may result in lower than expected sales and revenues and may result in increased competition for sales and sources of supply. This competition may adversely affect our adult-use business and there is no guarantee that we will be able to supply or acquire the supply, on commercially reasonable terms or at all, to meet the demand for medical and adult-use cannabis.
In response to this surge in demand for cannabis, we and other cannabis producers in Canada may produce more cannabis than is needed to satisfy the collective demand of the Canadian medical and adult-use markets, and we may be unable to export that oversupply into other markets where cannabis use is fully legal under all federal and state or provincial laws. As a result, the available supply of cannabis could exceed demand, resulting in a significant decline in the market price for cannabis. If this were to occur, there is no assurance that we would be able to generate sufficient revenue from the sale of adult-use cannabis to result in profitability.
Any failure on our part to comply with supplier standards established by provincial or territorial distributors could prevent us from accessing certain markets in Canada.
Government-run provincial and territorial distributors in Canada require suppliers to meet certain service and business standards, and routinely assess for compliance with such standards. Any failure by us to comply with such standards could result in our being downgraded or disqualified as a supplier, and would severely impede or eliminate our ability to access certain markets within Canada.
The adult-use cannabis industry and market in Canada is subject to many of the same risks as the medical cannabis industry and market, including risks related to our neednegotiate for regulatory approvals, the early status and uncertain growth of this industry and the competition we expect to face in this industry.
The adult-use cannabis industry and market in Canada is subject to certain risks that are unique to this industry, as well as the risks that are currently applicable to the medical cannabis industry, which are described under the heading above titled “Risk Factors-Risks Related to our Medical Cannabis Business and the Medical Cannabis Industry.”
If any of these shared risks occur, our business, financial condition, results of operations and prospects could be adversely affected in a number of ways, including by our not being able to successfully compete in the adult-use cannabis industry and by our being subject to fines, damage awards and other penalties as a result of regulatory infractionspreferential retail space or other claims brought against us.
We may be unsuccessful in competing in the legal adult-use cannabis market in Canada.
Our Canadian adult-use business faces enhanced competition from other Licensed Producers and those individuals and corporations who are licensed under the Cannabis Act to participate in the adult-use cannabis industry. The Cannabis Act has established a licensing regime for the production, testing, packaging, labelling, delivery, transportation, sale, possession and disposal of cannabis for adult use. While holders of licenses relating to medical cannabis under the ACMPR, including us, have automatically been licensed under the Cannabis Act for these activities, other individuals and corporations are able to apply for such licenses.
Moreover, the Cannabis Act allows individuals to cultivate, propagate, harvest and distribute up to four cannabis plants per household, provided that each plant meets certain requirements.in-store marketing. If we are unable to effectively market our products and compete for market share, our sales and results of operations may be adversely affected.
Research regarding the health effects of cannabis is in relatively early stages and subject to further study which could impact demand for cannabis products.
Research and clinical trials on the potential benefits and the short-term and long-term effects of cannabis use on human health remains in relatively early stages and there is limited standardization. As such, there are inherent risks associated with using cannabis and cannabis derivative products. Moreover, future research and clinical trials may draw opposing conclusions to statements contained in articles, reports and studies we relied on or could reach different or negative conclusions regarding the benefits, viability, safety, efficacy, dosing or other suppliersfacts and perceptions related to cannabis, which could adversely affect social acceptance of cannabis and the demand for our products.
United States regulations relating to hemp-derived CBD products are new and rapidly evolving, and changes may not develop in the timeframe or manner most favorable to our business objectives.
Our participation in the market for hemp-derived CBD products in the United States and elsewhere may require us to employ novel approaches to existing regulatory pathways. Although the passage of the 2018 Farm Bill legalized the cultivation of hemp in the United States to produce products containing CBD and other non-THC cannabinoids, it remains unclear whether and when the FDA will propose or implement new or additional regulations. While, to date, there are no laws or regulations enforced by the FDA which specifically address the manufacturing, packaging, labeling, distribution, or sale of hemp or hemp-derived CBD products and the FDA has issued no formal regulations addressing such matters, the FDA has issued various guidance documents and other statements reflecting its non-binding opinion on the regulation of such products.
The hemp plant and the cannabis/marijuana plant are both part of the same cannabis sativa genus/species of plant, except that hemp, by definition, has less than 0.3% THC content, but the same plant with a higher THC content is cannabis/marijuana, which is legal under certain state laws, but which is not legal under United States federal law. The similarities between these two can cause confusion, and our activities with legal hemp in the United States may be incorrectly perceived as us being involved in federally illegal cannabis. The FDA has stated in guidance and other public statements that it is prohibited to sell a food, beverage or dietary supplement to which THC or CBD has been added. While the FDA does not have a formal policy of enforcement discretion with respect to any products with added CBD, the agency has stated that its primary focus for enforcement centers on products that put the health and safety of consumers at risk, such as those claiming to prevent, diagnose, mitigate, treat, or cure diseases in the absence of requisite approvals. While the agency’s enforcement to date has therefore focused on products containing CBD and that make drug-like claims, there is the risk that the FDA could expand its enforcement activities and require us to alter our marketing for our hemp-derived CBD products or cease distributing them altogether. The FDA could also issue new regulations that prohibit or limit the sale of hemp-derived CBD products. Such regulatory actions and associated compliance costs may hinder our ability to successfully compete in the market for such products.
In addition, such products may be subject to regulation at the state or local levels. State and local authorities have issued their own restrictions on the cultivation or sale of hemp or hemp-derived CBD. This includes laws that ban the cultivation or possession of hemp or any other plant of the cannabis genus and derivatives thereof, such as CBD. State regulators may take enforcement action against food and dietary supplement products that contain CBD, or enact new laws or regulations that prohibit or limit the sale of such products.
The regulation of hemp and CBD in the United States has been constantly evolving, with changes in federal and state laws and regulation occurring on a frequent basis. Violations of applicable FDA and other laws could result in warning letters, significant fines, penalties, administrative sanctions, injunctions, convictions or settlements arising from civil proceedings. Unforeseen regulatory obstacles or compliance costs may hinder our ability to successfully compete in the market for such products.
Risks related to the adult-use cannabis market,Beverage Alcohol Business
Changes in consumer preferences or public attitudes about alcohol could decrease demand for our beverage alcohol products.
If general consumer trends lead to a decrease in the demand for SweetWater’s and Montauk's beers and other alcohol products or Breckenridge’s whiskey products, including craft beer, our sales and results of operations in the beverage alcohol segment may be adversely affected. There is no assurance that the craft brewing segment will experience growth in future periods. If the markets for wine, spirits or flavored alcohol beverages continue to grow, this could draw consumers away from the industry in general and our beverage alcohol products specifically.
Further, the alcoholic beverage industry is subject to public concern and political attention over alcohol-related social problems, including drunk driving, underage drinking and health consequences from the misuse of alcohol. In reaction to these concerns, steps may be taken to restrict advertising, to impose additional cautionary labeling or packaging requirements, or to increase excise or other taxes on beverage alcohol products. Any such developments may have an adverse impact on the financial condition, operating results and cash flows for SweetWater, Montauk and Breckenridge.
Developments affecting production at our brewery in Atlanta or our distillery in Breckenridge could negatively impact financial results for our beverage alcohol business segment.
Adverse changes or developments affecting our brewery in Atlanta or our distillery in Breckenridge, including, fire, power failure, natural disaster, public health crisis, or a significantmaterial failure of our security infrastructure, could reduce or require us to entirely suspend operations. Additionally, due to many factors, including seasonality and production schedules of our various products and packaging, actual production capacity may fluctuate throughout the year and may not reach full working capacity. If we experience contraction in our sales and production volumes, the excess capacity and unabsorbed overhead may have an adverse effect on gross margins, operating cash flows and overall financial performance of SweetWater, Montauk or Breckenridge.
SweetWater, Breckenridge and Montauk each face substantial competition in the beer industry and the broader market for alcoholic beverage products which could impact our business and financial results.
The market for alcoholic beverage products within the United States is highly competitive due to the increasing number of individualsdomestic and international beverage companies with similar pricing and target drinkers, the introduction and expansion of hard seltzers and ready-to-drink beverages, gains in market share achieved by domestic specialty beers and imported beers, and the acquisition of craft brewers and smaller producers by larger companies. We anticipate competition among domestic craft brewers and distillers will also remain strong as existing facilities build more capacity, expand geographically and add more products, flavors and styles. The continued growth in the sales of hard seltzers, craft-brewed domestic beers and imported beers is expected to increase competition in the market for alcoholic beverages within the United States and, as a result, prices and market share of SweetWater’s, Montauk Brewing's and Breckenridge’s products may fluctuate and possibly decline.
The alcohol industry has seen continued consolidation among producers in order to take advantage of cost savings opportunities for supplies, distribution and operations. Due to the abilityincreased leverage that these combined operations have in distribution and sales and marketing expenses, the costs to cultivateSweetWater, Montauk and useBreckenridge of competing could increase. The potential also exists for these large competitors to increase their own cannabis, our successinfluence with their distributors, making it difficult for smaller producers to maintain their market presence or enter new markets. The increase in the adult-usenumber and availability of competing products and brands, the costs to compete and potential decrease in distribution support and opportunities may adversely affect our business mayand financial results.
SweetWater, Breckenridge and Montauk are each dependent on distributors to deliver sustained growth and distribute products.
In the United States, each of SweetWater, Breckenridge and Montauk sells its alcohol beverages to independent distributors for distribution to retailers and, ultimately, to consumers. No assurance can be limitedgiven that SweetWater, Breckenridge and Montauk will be able to maintain their current distribution networks or secure additional distributors on favorable terms. If existing distribution agreements are terminated, it may not fulfill the expectations of management.
20
We will also face competition from existing Licensed Producersbe possible to enter into new distribution agreements on substantially similar terms or to timely put in place replacement distribution agreements, which may result in an impairment to distribution and other producers licensed under the Cannabis Act. Certain of these competitors have significantly greater financial, production, marketing, research and development and technical and human resources than we do. As a result, our competitors may be more successful than us in gaining market penetration and market share. Our commercial opportunityan increase in the adult-use market could be reduced or eliminated if our competitors produce and commercialize products for the adult-use market that, among other things, are safer, more effective, more convenient or less expensive than the products that we may produce, have greater sales, marketing and distribution support than our products, enjoy enhanced timingcosts of market introduction and perceived effectiveness advantages over our products and receive more favorable publicity than our products. If our adult-use products do not achieve an adequate level of acceptance by the adult-use market, we may not generate sufficient revenue from these products, and our adult-use business may not become profitable.distribution.
General Business Risks and Risks Related to Our Financial Condition and Operations
Additional impairments of our goodwill, impairments of our intangible and other long-lived assets, and changes in the estimated useful lives of intangible assets could have a material adverse impact on our financial results.
Goodwill, intangible and other long-lived assets comprise a significant portion of our total assets. As of May 31, 2023 our goodwill and intangible assets totaled $2.0 billion and $971.3 million, respectively. We test goodwill and indefinite lived intangible assets for impairment annually, while our other long-lived assets, including our finite-lived intangible assets, are tested for impairment when circumstances indicate that the carrying amount may not be recoverable, in accordance with Generally Accepted Accounting Principles in the U.S. (“GAAP”). A decrease in our market capitalization or profitability, or unfavorable changes in market, economic or industry conditions could increase the risk of additional impairment. Any resulting additional impairments could have a negative impact on our stock price.
For the year ended May 31, 2023, the Company recognized non-cash impairment charges of $603.5 million in cannabis goodwill and $15 million in wellness goodwill, $205 million in intangible assets and $104 million in capital assets. These non-cash impairment charges were a result of a decline in the Company's market value which was determined to be other than temporary, as well as increased borrowing rates which forced the Company to adjust the company specific risk premium.
We will continue to monitor key assumptions and other factors utilized in our goodwill, intangible and other long-lived assets impairment analysis, and if business or other market conditions develop that are materially different than we currently anticipate, we will conduct an additional impairment evaluation. Any reduction in or impairment of the value of goodwill, intangible assets and long-lived assets will result in a charge against earnings, which could have a material adverse impact on our reported financial results.
We have a limited operating history and a history of net losses, and we may not achieve or maintain profitability in the future.
We began operating in 2014 and have yet to generate a profit. We generated net losses of $67.7 million, $7.8 million and $7.9 million for the years ended December 31, 2018, 2017 and 2016, respectively. Our accumulated deficit was $108.2 million and $40.5 million as of December 31, 2018 and 2017, respectively. We intend to continue to expend significant funds to increase our growing capacity,explore potential opportunities and complete strategic mergers and acquisitions, invest in research and development, expand our marketing and sales operations to increase our base of registered patients and meet the increased compliance requirements associated with our transition to and operation as a public company. As we continue to grow, we expect the aggregate amount of these expenses will also continue to grow.
Our efforts to grow our business may be more costly than we expect and we may not be able to increase our revenue enough to offset higher operating expenses. We may incur significant losses in the future for a number of reasons, including as a result of unforeseen expenses, difficulties, complications and delays, the other risks described in this Annual Report on Form 10-Kherein and other unknown events. The amount of future net losses will depend, in part, on the growth of our future expenses and our ability to generate revenue. If we continue to incur losses in the future, the net losses and negative cash flows incurred to date, together with any such future losses, will have an adverse effect on our stockholders’stockholders’ equity and working capital. Because of the numerous risks and uncertainties associated with producing and selling cannabis and beverage alcohol products, as outlined herein, we are unable to accurately predict when, or if, we will be able to achieve profitability. Even if we achieve profitability in the future, we may not be able to sustain profitability in subsequent periods. If we are unable to achieve and sustain profitability, the market price of our Class 2 common stock may significantly decrease and our ability to raise capital, expand our business or continue our operations may be impaired.
We are subject to litigation, arbitration and demands, which could result in significant liability and costs, and impact our resources and reputation.
Tilray has previously been named as a defendant in a class action relating to the prior merger of Privateer Holdings, Inc. with and into a wholly owned subsidiary (referred to as the Downstream Merger), and a class action related to the drop in our stock price. In addition, legal proceedings covering a wide range of matters are pending or threatened in various U.S. and foreign jurisdictions against the Company. The type of claims that may be raised in these proceedings include product liability, unfair trade practices, antitrust, tax, contraband shipments, patent infringement, employment matters, claims for contribution and claims of competitors, shareholders or distributors. Litigation is subject to uncertainty and it is possible that there could be adverse developments in pending or future cases.
We are also subject to other litigation and demands relating to business decisions, regulatory and industry changes, supply relationships, and our business acquisition matters and related activities. Litigation may include claims for substantial compensatory or punitive damages or claims for indeterminate amounts of damages. Tilray and its various subsidiaries are also involved from time to time in other reviews, investigations and proceedings (both formal and informal) by governmental and self-regulatory agencies regarding our business. These matters could result in adverse judgments, settlements, fines, penalties, injunctions or other relief.
We have incurredand may continue to incur substantial costs and expenses relating directly to these actions. Responding to such actions could divert management’s attention away from our business operations and result in substantial costs. For more information on our pending legal proceedings, see “Part I, Item 3. Legal Proceedings”.
We are exposed to risks relating to the laws of various countries as a result of our international operations.
We currently conduct operations in multiple countries and plan to expand these international operations. As a result of our operations, we are exposed to various levels of political, economic, legal and other risks and uncertainties associated with operating in or exporting to these jurisdictions. These risks and uncertainties include, but are not limited to, changes in the laws, regulations and policies governing the production, sale and use of cannabis and cannabis-basedour products, political instability, instability at the United Nations level, currency controls, fluctuations in currency exchange rates and rates of inflation, labor unrest, changes in taxation laws, regulations and policies, restrictions on foreign exchange and repatriation and changing political conditions and governmental regulations relating to foreign investment and the cannabis business more generally.
Changes, if any, in the laws, regulations and policies relating to the advertising, production, sale and use of cannabis and cannabis-basedour products or in the general economic policies in these jurisdictions, or shifts in political attitude related thereto, may adversely affect the operations, or profitability of our international operations, in these countries. As we explore novel business models, such as global co-branded products, cannabinoid clinics and cannabis retail, international regulations will become increasingly challenging to manage. Specifically, our operations may be affected in varying degrees by government regulations with respect to, but not limited to, restrictions on advertising, production, price controls, export controls, controls on currency remittance, increased income taxes, restrictions on foreign investment, land and water use restrictions and government policies rewarding contracts to local competitors or requiring domestic producers or vendors to purchase supplies from a particular jurisdiction. Failure to comply strictly with applicable laws, regulations and local practices could result in additional taxes, costs, civil or criminal fines or penalties or other expenses being levied on our international operations, as well as other potential adverse consequences such as the loss of necessary permits or governmental approvals.
21
Furthermore, although we have begun production at Tilray Portugal with a view toward facilitating exports of our cannabis products to countries in the European Union from Portugal rather than from Canada, there is no assurance that these EU countrieswe will authorizebe able to secure the requisite import and export permits for the international distribution of our cannabis products from Portugal, or that Portugal will authorize or continue to authorize such exports, or that such exports will provide us with advantages over our current EU export strategy. Each country in the European Union (or elsewhere)products. Countries may also impose restrictions or limitations on imports that require the use of, or confer significant advantages upon, producers within that particular country. As a result, we may be required to establish production facilities similar to Tilray Portugal in one or more countries in the European UnionEU (or elsewhere) where we wish to distribute our cannabis products in order to take advantage of the favorable legislation offered to producers in these countries.
We plan to expand our business and operations into jurisdictions outside of the current jurisdictions where we conduct business, and there are risks associated with doing so.
We plan in the future to expand our operations and business into jurisdictions outside of the jurisdictions where we currently carry on business. There can be no assurance that any market for our products will develop in any such foreign jurisdiction. We may face new or unexpected risks or significantly increase our exposure to one or more existing risk factors, including economic instability, new competition, changes in laws and regulations, including the possibility that we could be in violation of these laws and regulations as a result of such changes, and the effects of competition. These factors may limit our capability to successfully expand our operations in, or export our products to, those other jurisdictions.
Our business is subject to a variety of U.S. and foreign laws, many of which are unsettled and still developing and which could subject us to claims or otherwise harm our business.
We are subject to a variety of laws in the United States, Canada and elsewhere. In the United States, despite cannabis having been legalized at the state level for medical use in many states and for adult use in a number of states, cannabis continues to be categorized as a Schedule I controlled substance under the federal Controlled Substances Act, or the CSA, and subject to the Controlled Substances Import and Export Act, or the CSIEA. Our activity in the United States is limited to (a) certain corporate and administrative services, including accounting, legal and creative services, (b) supply of study drug for clinical trials under DEA and FDA authorization, and (c) in the near future, participation in the market for hemp-derived CBD products; except as described above, we do not produce or distribute cannabis products in the United States. Therefore, we believe that we are not subject to the CSA or CSIEA.
We plan in the future to commercialize in the United States a variety of products containing broad spectrum hemp extract, which might include certain cannabinoids including CBD but excluding THC. While the Agriculture Improvement Act of 2018, or the Farm Bill, exempted hemp and hemp derived products from the CSA, any such product commercialization will be subject to various laws, including the Farm Bill, the Food, Drug and Cosmetic Act, or the FD&CA, the Dietary Supplement Health and Education Act, or DSHEA, applicable state and/or local laws, and FDA regulations. We intend to offer broad spectrum hemp extract products in full compliance with applicable food, drug, cosmetic, and dietary supplement laws and regulations. Nevertheless, violations of any such law or regulation could result in warning letters, significant fines, penalties, administrative sanctions, injunctions, convictions or settlements arising from civil proceedings initiated.
We are further subject to a variety of laws and regulations in the United States, Canada and elsewhere that prohibit money laundering, including the Proceeds of Crime and Terrorist Financing Act (Canada) and the Money Laundering Control Act (United States), as amended, and the rules and regulations thereunder and any related or similar rules, regulations or guidelines issued, administered or enforced by governmental authorities in the United States, Canada or any other jurisdiction in which we have business operations or to which we export. Although we believe that none of our activities implicate any applicable money laundering statutes, in the event that any of our business activities, any dividends or distributions therefrom, or any profits or revenue accruing thereby are found to be in violation of money laundering statutes, such transactions may be viewed as proceeds of crime under one or more of the statutes described above or any other applicable legislation, and any persons, including such U.S.-based investors, found to be aiding and abetting us in such violations could be subject to liability. Any violations of these laws, or allegations of such violations, could disrupt our operations, involve significant management distraction and involve significant costs and expenses, including legal fees. We could also suffer severe penalties, including criminal and civil penalties, disgorgement and other remedial measures.
22
As a result of an investment in our securities, you could be prevented from entering the United States or become subject to a lifetime ban on entry into the United States.
U.S. Customs and Border Protection (“CBP”) has confirmed that border agents may seek to permanently ban any foreign visitor who admits to working or investing in the cannabis industry, or admits to having used cannabis, even though adult-use cannabis is now legal in Canada. CBP confirmed that investing even in publicly-traded cannabis companies is considered facilitation of illicit drug trade under CBP policy. This policy is limited to citizens of foreign countries and not citizens of the United States. Therefore, as a result of an investment in our securities, if you are not a citizen of the United States, you could be prevented from entering the United States or could become subject to a lifetime ban on entry into the United States.
We are required to comply concurrently with federal, state or provincial, and localall applicable laws in each jurisdiction where we operate or to which we export our products.products, and any changes to such laws could adversely impact our business.
Various federal, state, or provincial and local laws and regulations govern our business in the jurisdictions in which we operate or propose to operate, or toand in which we export or propose to export our products, includingproducts. Such laws and regulations include those relating to health and safety, conduct of operations and the production, management, transportation, storage and disposal of our products and of certain material used in our operations. Compliance with these laws and regulations requires concurrent complianceIn many cases, we must concurrently comply with complex federal, provincial, state and/or state and local laws.laws in multiple jurisdictions. These laws change frequently and may be difficult to interpret and apply. Compliance with these laws and regulations requires the investment of significant financial and managerial resources, and a determination that we are not in compliance with any of these laws and regulations could harm our brand image and business. Moreover, it is impossible for us to predict the cost or effect of such laws, regulations or guidelines upon our future operations. Changes to these laws or regulations could negatively affect our competitive position within our industry and the markets in which we operate, and there is no assurance that various levels of government in the jurisdictions in which we operate will not pass legislation or regulation that adversely impacts our business.
U.S. regulations relating to hemp-derived CBD products are unclear and rapidly evolving.
Our intent to participate in the market for hemp-derived CBD products in the United States and elsewhere may require us to employ novel approaches to existing regulatory pathways. Although the passage of the Farm Bill in December 2018 legalized the cultivation of hemp in the United States to produce products containing CBDstrategic alliances and other non-THC cannabinoids, it is unclear how the FDA will respond to our approach, or whether the FDA will propose or implement new or additional regulations. In addition, such products may be subject to regulation at the state or local levels. Unforeseen regulatory obstacles may hinder our ability to successfully compete in the market for such products.
We may seek to enter into strategic alliances, or expand the scope of currently existing relationships, with third parties that we believe will have a beneficial impact on us, and there are risks that such strategic alliances or expansions of our currently existingthird-party business relationships may not enhance our business inachieve the desired manner.intended beneficial impact and expose us to risks.
We currently have, and may expandadjust the scope of, and may in the future enter into, strategic alliances with third parties that we believe will complement or augment our existing business. Examples of such strategic alliances include our agreement with Sandoz AG, joint venture with AB InBev and partnership with ABG. Our ability to complete further strategic alliances is dependent upon, and may be limited by, among other things, the availability of suitable candidates and capital. In addition, strategic alliances could present unforeseen integration obstacles or costs, may not enhance our business or profitability and may involve risks that could adversely affect us, including the investment of significant amounts of management time that may be diverted from operations in order to pursue and complete such transactions or maintain such strategic alliances. We may become dependent on our strategic partners and actions by such partners could harm our business. Future strategic alliances could result in the incurrence of debt, impairment charges, costs and contingent liabilities, and there can be no assurance that future strategic alliances will achieve, or that our existing strategic alliances will continue to achieve, the expected benefits to our business or that we will be able to consummate future strategic alliances on satisfactory terms, or at all.
23
We may not be able to successfully identify and execute future acquisitions, dispositions or dispositionsother equity transactions or to successfully manage the impacts of such transactions on our operations.
Material acquisitions, dispositions and other strategic transactions involve a number of risks, including: (i) the potential disruption of our ongoing business; (ii) the distraction of management away from the ongoing oversight of our existing business activities; (iii) incurring additional indebtedness; (iv) the anticipated benefits and cost savings of those transactions not being realized fully, or at all, or taking longer to realize than anticipated; (v) an increase in the scope and complexity of our operations andoperations; (vi) the loss or reduction of control over certain of our assets.assets; and (vii) capital stock or cash to pay for the acquisition. Material acquisitions and strategic transactions have been and may continue to be material to our business strategy. There can be no assurance that we will find suitable opportunities for strategic transactions at acceptable prices, have sufficient capital resources to pursue such transactions, be successful in negotiating required agreements, or successfully close transactions after signing such agreements. There is no guarantee that any acquisitions such as High Park Gardens and Manitoba Harvest, will be accretive.accretive, or that past or future acquisitions will not result in additional impairments or write downs.
The existence of one or more material liabilities of an acquired company that are unknown to us at the time of acquisition could result in our incurring those liabilities. A strategic transaction may result in a significant change in the nature of our business, operations and strategy, and we may encounter unforeseen obstacles or costs in implementing a strategic transaction or integrating any acquired business into our operations.
We are subject to risks inherent in an agricultural business, including the risk of crop failure.
We grow cannabis, which is an agricultural process. As such, our business is subject to the risks inherent in the agricultural business, including risks of crop failure presented by weather, climate change, forest fires, insects, plant diseases and similar agricultural risks. Although we currentlyprimarily grow our products indoors under climate controlledclimate-controlled conditions, we are developingalso have certain outdoor operationscultivation capacity and there can be no assurance that natural elements, such as insects, climate change and plant diseases, will not entirely interrupt our production activities or have an adverse effect on our business.
We depend on a significant customercustomers for a substantial portion of our revenue. If we fail to retain or expand our customer relationships or if this significant customer were to terminate its relationship with us orcustomers reduce itstheir purchases, our revenue could decline significantly.
We had one customer that accounted 24%derive a significant portion of revenue from the supply contracts we have with 12 Canadian provinces and territories for adult-use cannabis products. There are many factors which could impact our total revenue forcontractual agreements with the year ended December 31, 2018. No one customer accounted for greater than 10%provinces and territories, including but not limited to availability of supply, product selection and the popularity of our revenue in 2017products with retail customers. If our supply agreements with certain Canadian provinces and territories are amended, terminated or 2016, respectively. We believe thatotherwise altered, our operatingsales and results forof operations could be adversely affected, which could have a material adverse effect on our business, financial condition, results of operations and prospects.
In addition, not all of our supply contracts with the foreseeable future will continue to depend on sales from a small number of customers. This one customer has noCanadian provinces and territories contain purchase commitments andor otherwise obligate the provincial or territorial wholesaler to buy a minimum or fixed volume of cannabis products from us. The amount of cannabis that the provincial or territorial wholesalers may cancel, changepurchase under the supply contracts may therefore vary from what we expect or delay its purchases with little or no notice or penalty.planned for. As a result, of this customer concentration, our revenuerevenues could fluctuate materially in the future and could be materially and disproportionately impacted by the purchasing decisions of this one customerthe provincial or any other significant customer.territorial wholesalers. In the future, this one customerthese customers may decide to purchase less product from us than it hasthey have in the past, may alter its purchasing patterns at any time with limited notice,or return inventory, or may decide not to continue to purchase our products, at all, any of which could cause our revenue to decline materially and materially harm our financial condition and results of operations. If we are unable to diversify our customer base, we will continue to be susceptible to risks associated with customer concentration.
We may be unable to attract or retain key personnel, with sufficient experience in the cannabis industry, and we may be unable to attract, develop and retain additional employees required for our development and future success.
Our success is largely dependent on the performance of our management team and certain employees and our continuing ability to attract, develop, motivate and retain highly qualified and skilled employees. Qualified individuals are in high demand, and we may incur significant costs to attract and retain them. The loss of the services of any key personnel, or an inability to attract other suitably qualified persons when needed, could prevent us from executing on our business plan and strategy, and we may be unable to find adequate replacements on a timely basis, or at all. We do not currently maintain key-person insurance on the lives of any
Further, officers, directors, and certain key personnel at each of our key personnel.
24
Further, each director and officer, as well as certain additional key personnel, of a companyfacilities that holds a license isare licensed by Health Canada are subject to the requirement to obtain and maintain a security clearance from Health Canada under the CR. Moreover, under the CR, an individual with security clearance must be physically present on site when other individuals are conducting activities with cannabis. Under the CR, and the Cannabis Act, a security clearance is valid for a limited time and must be renewed before the expiry of a current security clearance. There is no assurance that any of our existing personnel who presently or may in the future require a security clearance will be able to obtain or renew such clearances or that new personnel who require a security clearance will be able to obtain one. A failure by an individual in a key operational position to maintain or renew his or her security clearance could result in a reduction or complete suspension of our operations. In addition, if an individual in a key operational position leaves us, and we are unable to find a suitable replacement who is able to obtain a security clearance required by the CR in a timely manner, or at all, we may not be able to conduct our operations at planned production volume levels or at all. In addition, the
The CR also requires us to designate a qualified individual in charge who is responsible for supervising activities relating to the production of study drugdrugs for clinical trials, which individual must meet certain educational and security clearance requirements. If our current designated qualified person in charge fails to maintain histheir security clearance, or if our current designated qualified person in charge leaves us and we are unable to find a suitable replacement who meets these requirements, we may no longer be able to continue our clinical trial activities.
Increased labor costs, potential organization of our workforce, employee strikes, and other labor-related disruption may adversely affect our operations.
Outside Portugal, none of our employees are represented by a labor union or subject to a collective bargaining agreement. In Portugal, none of our employees are represented by a labor union or subject to any workforce-initiated labor agreement. As with other companies carrying on business in Portugal, we are subject to a government-mandated collective bargaining agreement, which grants employees nominal additional benefits beyond those required by the local labor code. We cannot assure that our labor costs going forward will remain competitive based on various factors, such as: (i) our workforce may organize in the future and labor agreements may be put in place that have significantly higher labor rates and company obligations; (ii) our competitors may maintain significantly lower labor costs, thereby reducing or eliminating our comparative advantages vis-à-vis one or more of our competitors or the larger industry; and (iii) our labor costs may increase in connection with our growth.
Significant interruptions in our access to certain supply chains for key inputs such as raw materials, supplies, electricity, water and other utilities may impair our cannabis growing operations.
Our business is dependent on a number of key inputs and their related costs (certain of which are sourced in other countries and on different continents), including raw materials, supplies and equipment related to our operations, as well as electricity, water and other utilities. AnyWe operate global manufacturing facilities, and have dispersed suppliers and customers. Governments may regulate or restrict the flow of labor or products, and the Company's operations, suppliers, customers and distribution channels could be severely impacted. While we have not experienced any material supply chain disruptions, any significant future governmental-mandated or market-related interruption, price increase or negative change in the availability or economics of the supply chain for key inputs and, in particular, rising or volatile energy costs could curtail or preclude our ability to continue production. In addition, our operations would be significantly affected by a prolonged power outage.
Our ability to compete and grow cannabis is dependent on us having access, at a reasonable cost and in a timely manner, to skilled labor, equipment, parts and components. No assurances can be given that we will be successful in maintaining our required supply of labor, equipment, parts and components. In addition, the invasion of Ukraine by Russia and the resulting measures that have been taken, and could be taken in the future, have and may continue to have a negative impact on our costs, including for input materials, energy and transportation.
Fluctuations in cannabinoid prices relative to contracted prices with third party suppliers could negatively impact our earnings.
A portion of our results of operations and financial condition, as well as the selling prices for our products, are dependent upon cannabinoid supply contracts. Production and pricing of cannabinoids are determined by constantly changing market forces of supply and demand over which we have limited or no control. The market for cannabis biomass is particularly volatile compared to other commoditized markets due to the relatively nascent maturity of the industry in which we operate. The lack of centralized data and large variations in product quality make it difficult to establish a “spot price” for cannabinoids and develop an effective price hedging strategy. Accordingly, supply contracts with any term may prove to be costly in the future to the extent cannabinoid prices decrease dramatically or at a faster rate than anticipated.
Our failure to successfully negotiate supply contracts that address such market vagaries could result in us being contractually obligated to purchase products, some of which may be priced above then-current market prices, or interruption of the supply of inputs for the manufacturing of our products, all of which could have a material adverse effect on our business, results of operations, financial condition, liquidity and prospects.
We may not be ablenegatively impacted by volatility in the political and economic environment, and a period of sustained inflation across the markets in which we operate could result in higher operating costs.
Trade, monetary and fiscal policies, and political and economic conditions may substantially change, and credit markets may experience periods of constriction and variability. These conditions may impact our business. Further rising inflation may negatively impact our business, raise cost and reduce profitability. While we would take actions, wherever possible, to transportreduce the impact of the effects of inflation, in the case of sustained inflation across several of the markets in which we operate, it could become increasingly difficult to effectively mitigate the increases to our cannabiscosts. In addition, the effects of inflation on consumers’ budgets could result in the reduction of our customers’ spending habits. If we are unable to take actions to effectively mitigate the effect of the resulting higher costs, our profitability and financial position could be negatively impacted.
We face risks associated with the transportation of our products to consumers in a safe and efficient manner.
Due to our direct-to-consumer shipping model for medical cannabis in Canada, we
We depend on fast, cost-effective, and efficient third-party transportationcourier services to distribute our medical cannabis products. We also use such servicesproducts to transfer bulk shipments to provincesboth wholesale and territories for further distribution to consumers.retail customers. Any prolonged disruption of third-party transportation services such as the ongoing Canada Post labor disruptions, could have a material adverse effect on our sales volumes or satisfaction with our services. Rising costs associated with third-party transportation services used by us to ship our products may also adversely impact our profitability, and more generally our business, financial condition and results of operations.
The security of our products during transportation to and from our facilities is of the utmost concern. A breach of security during transport or delivery could result in the loss of high-value product and forfeiture of import and export approvals, since such approvals are shipment specific. Any failure to take steps necessary to ensure the safekeeping of our cannabis products could also have an impact on our ability to continue supplying provinces and territories, to continue operating under our existing licenses, to renew or receive amendments to our existing licenses or to receive requiredobtain new licenses.
25
Our cannabis products may be subject to recalls for a variety of reasons, which could require us to expend significant management and capital resources.
Manufacturers and distributors of cannabis, hemp and beverage alcohol products are sometimes subject to the recall or return of their products for a variety of reasons, including product defects, such as contamination, adulteration, unintended harmful side effects or interactions with other substances, packaging safety, and inadequate or inaccurate labeling disclosure. Although we have detailed procedures in place for testing finished cannabis products, there can be no assurance that any quality, potency or contamination problems will be detected in time to avoid unforeseen product recalls, regulatory action or lawsuits, whether frivolous or otherwise. If any of the cannabis products produced by us are recalled due to an alleged product defect or for any other reason, we could be required to incur the unexpected expense of the recall and any legal proceedings that might arise in connection with the recall. As a result of any such recall, we may lose a significant amount of sales and may not be able to replace those sales at an acceptable margingross profit or at all. In addition, a product recall may require significant management attention or damage our reputation and goodwill or that of our products or brands.
In March 2015, we voluntarily recalled certain lots of our milled House Blend as a result of the microbial level of this product falling outside of acceptable limits during secondary testing. In August 2016, we withdrew cannabis oil capsules supplied to Croatia for pharmacy distribution because certain capsules suffered damage during transport. In both of these cases, we were able to complete the recall and withdrawal successfully; however, there is no assurance that any similar future incidents will not result in regulatory action or civil lawsuits, whether frivolous or otherwise, or an adverse effect on our reputation or goodwill, or that of our products or brands.
Additionally, product recalls may lead to increased scrutiny of our operations by Health Canada or other regulatory agencies, requiring further management attention, increased compliance costs and potential legal fees, fines, penalties and other expenses. Any product recall affecting the cannabis industry more broadly, whether or not involving us, could also lead consumers to lose confidence in the safety and security of thecannabis products sold by Licensed Producers generally, including products sold by us.
We may be subject to product liability claims or regulatory action if our products are alleged to have caused significant loss or injury.action. This risk is exacerbated by the fact that cannabis use may increase the risk of serious adverse side effects.
As a manufacturer and distributor of products which are ingested by humans, we face the risk of exposure to product liability claims, regulatory action and litigation if our products are alleged to have caused loss or injury. We may be subject to these types of claims due to allegations that our products caused or contributed to injury or illness, failed to include adequate instructions for use or failed to include adequate warnings concerning possible side effects or interactions with other substances. This risk is exacerbated by the fact that cannabis use may increase the risk of developing schizophrenia and other psychoses, symptoms for individuals with bipolar disorder, and other side effects. Furthermore, we are now offering an expanded assortment of form factors, some of which may have additional adverse side effects, such as vaping products. See also Risk Factor “Our vape business is subject to uncertainty in the evolving vape market due to negative public sentiment and regulatory scrutiny.” Previously unknown adverse reactions resulting from human consumption of cannabis or beverage alcohol products alone or in combination with other medications or substances could also occur.
In addition, the manufacture and sale of cannabisour products, like the manufacture and sale of any ingested product, involves a risk of injury to consumers due to tampering by unauthorized third parties or product contamination. We have in the past recalled, and may again in the future have to recall, certain of our cannabis products as a result of potential contamination and quality assurance concerns. A product liability claim or regulatory action against us could result in increased costs and could adversely affect our reputation and goodwill with our patientscustomers and consumers generally. There can be no assurance that we will be able to maintain product liability insurance on acceptable terms or with adequate coverage against potential liabilities. Such insurance is expensive and may not be available in the future on acceptable terms, or at all. The inability to obtain sufficient insurance coverage on reasonable terms or to otherwise protect against potential product liability claims could result in us becoming subject to significant liabilities that are uninsured and also could adversely affect our commercial arrangements with third parties.
We rely on third-party distributors to distribute our products, and those distributors may not perform their obligations.
We rely on third-party distributors, including pharmaceutical distributors, courier services, and government agencies, and may in the future rely on other third parties, to distribute our products. If these distributors do not successfully carry out their contractual duties, if there is a delay or interruption in the distribution of our products, such as the ongoing Canada Post labor disruptions, or if these third parties damage our products, it could negatively impact our revenue from product sales. Any damage to our products, such as product spoilage, could expose us to potential product liability, damage our reputation and the reputation of our brands or otherwise harm our business.
26
We, or the cannabis industry more generally, may receive unfavorable publicity or become subject to negative consumer or investor perception.
We believe that the cannabis industry is highly dependent upon positive consumer and investor perception regarding the benefits, safety, efficacy and quality of the cannabis distributed to consumers. The perception of the cannabis industry and cannabis products, currently and in the future, may be significantly influenced by scientific research or findings, regulatory investigations, litigation, political statements, media attention and other publicity (whether or not accurate or with merit) both in Canada and in other countries relating to the consumption of cannabis products, including unexpected safety or efficacy concerns arising with respect to cannabis products or the activities of industry participants. There can be no assurance that future scientific research, findings, regulatory proceedings, litigation, media attention or other research findings or publicity will be favorable to the cannabis market or any particular cannabis product or will be consistent with earlier publicity. Adverse future scientific research reports, findings and regulatory proceedings that are, or litigation, media attention or other publicity that is, perceived as less favorable than, or that questions, earlier research reports, findings or publicity (whether or not accurate or with merit) could result in a significant reduction in the demand for our cannabis products. Further, adverse publicity reports or other media attention regarding the safety, efficacy and quality of cannabis, or our products specifically, or associating the consumption of cannabis with illness or other negative effects or events, could adversely affect us. This adverse publicity could arise even if the adverse effects associated with cannabis products resulted from consumers’consumers’ failure to use such products legally, appropriately or as directed.
Certain events or developments in the cannabis industry more generally may impact our reputation.
Damage to our reputation can result from the actual or perceived occurrence of any number of events, including any negative publicity, whether true or not. As a producer and distributor of cannabis, which is a controlled substance in Canada that has previously been commonly associated with various other narcotics, violence and criminal activities, there is a risk that our business might attract negative publicity. There is also a risk that the actions of other Licensed Producers or of other companies and service providers in the cannabis industry may negatively affect the reputation of the industry as a whole and thereby negatively impact our reputation. The increased usage of social media and other web-based tools used to generate, publish and discuss user-generated content and to connect with other users has made it increasingly easier for individuals and groups to communicate and share negative opinions and views in regards to our activities and the cannabis industry in general, whether true or not.
We do not ultimately have direct control over how we or the cannabis industry is perceived by others. Reputational issues may result in decreased investor confidence, increased challenges in developing and maintaining community relations and present an impediment to our overall ability to advance our business strategy and realize on our growth prospects.
Licensed Producers are constrained by law in their ability to market their products in Canada.
The development of our business and operating results may be hindered by applicable restrictions on sales and marketing activities imposed by Health Canada. The regulatory environment in Canada limits our ability to compete for market share in a manner similar to other industries. All products we distribute into the Canadian adult-use market must comply with requirements under Canadian legislation, including with respect to product formats, product packaging, and marketing activities around such products. As such, our portfolio of brands and products has been specifically adapted, and our marketing activities carefully structured, to enable us to develop our brands in an effective and compliant manner. If we are unable to effectively market our cannabis products and compete for market share, or if the costs of compliance with government legislation and regulation cannot be absorbed through increased selling prices for our cannabis products, then our sales and operating results could be adversely affected.
27
We may not be able to obtain adequate insurance coverage in respect of the risks our business faces, the premiums for such insurance may not continue to be commercially justifiable or there may be coverage limitations and other exclusions which may result in such insurance not being sufficient to cover potential liabilities that we face.
We currently have insurance coverage, including product liability insurance, protecting many, but not all, of our assets and operations. Our insurance coverage is subject to coverage limits and exclusions and may not be available for the risks and hazards to which we are exposed. In addition, no assurance can be given that such insurance will be adequate to cover our liabilities, including potential product liability claims, or will be generally available in the future or, if available, that premiums will be commercially justifiable. If we were to incur substantial liability and such damages were not covered by insurance or were in excess of policy limits, we may be exposed to material uninsured liabilities that could impede our liquidity, profitability or solvency.
If we are not ableFailure to comply with all safety, health and environmental regulations applicable to our operations and industry we may be held liable for any breaches of those regulations.expose us to liability and impact operations.
Safety, health and environmental laws and regulations affect nearly all aspects of our operations, including product development, working conditions, waste disposal, emission controls, the maintenance of air and water quality standards and land reclamation, and, with respect to environmental laws and regulations, impose limitations on the generation, transportation, storage and disposal of solid and hazardous waste. Continuing to meetCompliance with GMP standards, which we follow voluntarily, requires satisfying additional standards for the conduct of our operations and subjects us to ongoing compliance inspections in respect of these standards.standards in connection with our GMP certified facilities. Compliance with safety, health and environmental laws and regulations can require significant expenditures, and failure to comply with such safety, health and environmental laws and regulations may result in the imposition of fines and penalties, the temporary or permanent suspension of operations, the imposition of clean-up costs resulting from contaminated properties, the imposition of damages and the loss of or refusal of governmental authorities to issue permits or licenses to us or to certify our compliance with GMP standards. Exposure to these liabilities may arise in connection with our existing operations, our historical operations and operations that we may undertake in the future. We could also be held liable for worker exposure to hazardous substances and for accidents causing injury or death. There can be no assurance that we will at all times be in compliance with all safety, health and environmental laws and regulations notwithstanding our attempts to comply with such laws and regulations.
In addition, government environmental approvals and permits are currently, and may in the future be required in connection with our operations. To the extent such approvals are required and not obtained, we may be curtailed or prohibited from its proposed business activities or from proceeding with the development of our operations as currently proposed. Failure to comply with applicable environmental laws, regulations and permitting requirements may result in enforcement actions thereunder, including orders issued by regulatory or judicial authorities causing operations to cease or be curtailed, and may include corrective measures requiring capital expenditures, installation of additional equipment, or remedial actions. We may be required to compensate those suffering loss or damage due to our operations and may have civil or criminal fines or penalties imposed for violations of applicable environmental laws or regulations.
Changes in applicable safety, health and environmental standards may impose stricter standards and enforcement, increased fines and penalties for non-compliance, more stringent environmental assessments of proposed projects and a heightened degree of responsibility for companies and their officers, directors and employees. We are not able to determine the specific impact that future changes in safety, health and environmental laws and regulations may have on our industry, operations and/or activities and our resulting financial position; however, we anticipate that capital expenditures and operating expenses will increase in the future as a result of the implementation of new and increasingly stringent safety, health and environmental laws and regulations. Further changes in safety, health and environmental laws and regulations, new information on existing safety, health and environmental conditions or other events, including legal proceedings based upon such conditions or an inability to obtain necessary permits in relation thereto, may require increased compliance expenditures by us.
We may become subject to liability arising from any fraudulent or illegal activity by our employees, contractors, consultants and others.
We are exposed to the risk that our employees, independent contractors, consultants, service providers and licensors may engage in fraudulent or other illegal activity. Misconduct by these parties could include intentional undertakings of unauthorized activities, or reckless or negligent undertakings of authorized activities, in each case on our behalf or in our service that violate: (i) government regulations, specifically Health Canada regulations; (ii) manufacturing standards; (iii) Canadian federal and provincial healthcare laws and regulations; (iv) laws that require the true, complete and accurate reporting of financial information or data; (v) U.S. federal laws banning the possession, sale or importation of cannabis into the United States and prohibiting the financing of activities outside the United States that are unlawful under Canadian or other foreign laws or (vi) the terms of our agreements with insurers. In particular, we could be exposed to class action and other litigation, increased Health Canada inspections and related sanctions, the loss of current GMP compliance certifications or the inability to obtain future GMP compliance certifications, lost sales and revenue or reputational damage as a result of prohibited activities that are undertaken in the growing or production process of our products without our knowledge or permission and contrary to our internal policies, procedures and operating requirements.
28
We cannot always identify and prevent misconduct by our employees and other third parties, including service providers and licensors, and the precautions taken by us to detect and prevent this activity may not be effective in controlling unknown, unanticipated or unmanaged risks or losses or in protecting us from governmental investigations or other actions or lawsuits stemming from such misconduct. If any such actions are instituted against us, and we are not successful in defending ourselves or asserting our rights, those actions could have a significant impact on our business, including the imposition of civil, criminal or administrative penalties, damages, monetary fines and contractual damages, reputational harm, diminished profits and future earnings or curtailment of our operations.
We may experience breaches of security at our facilities, orwhich could result in product loss as a result of the theft of our products.and liability.
Because of the nature of our products and the limited legal channels for distribution, as well as the concentration of inventory in our facilities, we are subject to the risk of theft of our products and other security breaches. A security breach at Tilray Nanaimo, High Park Farms, our High Park Processing Facility, or, once completed,any one of our planned facilities could result in a significant loss of available products, expose us to additional liability under applicable regulations and to potentially costly litigation or increase expenses relating to the resolution and future prevention of similar thefts, any of which could have an adverse effect on our business, financial condition and results of operations.
We may be subject to risks related to our information technology systems, including the risk that weservice interruption, cyber-attacks and misappropriation of data, which could disrupt operations and may be the subject of a cyber-attackresult in financial losses and the risk that we may be in non-compliance with applicable privacy laws.reputational damage.
We have entered into agreements with third parties for hardware, software, telecommunications and other information technology, or IT, services in connection with our operations. Our operations depend, in part, on how well we and our vendors protect networks, equipment, IT systems and software against damage from a number of threats, including, but not limited to, cable cuts, damage to physical plants, natural disasters, intentional damage and destruction, fire, power loss, hacking, computer viruses, vandalism, theft, malware, ransomware and phishing attacks. We are increasingly reliant on Cloud-based systems for economies of scale and our mobile workforce, which could result in increased attack vectors or other significant disruptions to our work processes. Any of these and other events could result in IT system failures, delays or increases in capital expenses. Our operations also depend on the timely maintenance, upgrade and replacement of networks, equipment and IT systems and software, as well as preemptive expenses to mitigate the risks of failures. The failure of IT systems or a component of IT systems could, depending on the nature of any such failure, adversely impact our reputation and results of operations.
There are a number of laws protecting the confidentiality of certainpersonal information and patient health information, and other personal information, including patient records, and restricting the use and disclosure of that protected information. In particular, the privacy rules under the Personal Information Protection and Electronics Documents Act (Canada), or the PIPEDA, the European Unions’ General Data Protection Regulation, (“GDPR”),or the GDPR, and similar laws in other jurisdictions, protect personal information, including medical records and other personal health information by limiting their use and disclosure to the minimum level reasonably necessary to accomplish the intended purpose.of individuals. We collect and store personal information about our consumersemployees and customers and are responsible for protecting that information from privacy breaches. A privacy breach may occur through a procedural or process failure, an IT malfunction or deliberate unauthorized intrusions. Theft of data for competitive purposes, particularly patient lists and preferences, is an ongoing risk whether perpetrated through employee collusion or negligence or through deliberate cyber-attack. Moreover, if we are found to be in violation of the privacy or security rules under PIPEDA or other laws protecting the confidentiality of patient health information, including as a result of data theft and privacy breaches, we could be subject to sanctionssanction, litigation and civil or criminal penalties, which could increase our liabilities and harm our reputation.
As cyber threats continue to evolve, we may be required to expandexpend significant additional resources to continue to modify or enhance our protective measures or to investigate and remediate any information security vulnerabilities. While we have implemented security resources to protect our data security and information technology systems, such measures may not prevent such events. Significant disruption to our information technology system or breaches of data security could have a material adverse effect on our business, financial condition and results of operations.
29
We may be unable
The cannabis industry continues to sustain our revenue growthface significant funding challenges, and development.
Our revenue has grown in recent years. Our ability to sustain this growth will depend on a number of factors, many of which are beyond our control, including, but not limited to, the availability of sufficient capital on suitable terms, changes in laws and regulations respecting the production of cannabis products, competition from other Licensed Producers, the size of the black market and the adult-use market, and our ability to produce sufficient volumes of our cannabis-based products to meet demand. Regulatory changes in the United States and Canada may continue to attract market entrants, therefore diluting our potential opportunity and early-mover advantage. In addition, we are subject to a variety of business risks generally associated with developing companies. Future development and expansion could place significant strain on our management personnel and likely will require us to recruit additional management personnel, and there is no assurance that we will be able to do so.
We may be unable to expand our operations quickly enough to meet demand or manage our operations beyond their current scale.
There can be no assurance that we will be able to manage our expanding operations, including any acquisitions, effectively, that we will be able to sustain or accelerate our growth or that such growth, if achieved, will result in profitable operations, that we will be able to attract and retain sufficient management personnel necessary for continued growth or that we will be able to successfully make strategic investments or acquisitions.
Demand for cannabis-based products is dependent on a number of social, political and economic factors that are beyond our control. There is no assurance that an increase in existing demand will occur, that we will benefit from any such demand increase or that our business will remain profitable even in the event of such an increase in demand. If we are unable to sustain profitability, the value of our Class 2 common stock and the notes may significantly decrease.
We may not be able to secure adequate or reliable sources of funding, required to operatewhich may impact our business or increase our production to meet consumer demand for our products.operations and potential expansion.
The continued development of our business will require significant additional financing, and there is no assurance that we will be able to obtain the financing necessary to be able to achieve our business objectives. Our ability to obtain additional financing will depend on investor demand, our performance and reputation, market conditions, and other factors. Our inability to raise such capital could result in the delay or indefinite postponement of our current business objectives or in our inability to continue to carry onoperate our business. There can be no assurance that additional capital or other types of equity or debt financing will be available if needed or that, if available, the terms of such financing will be favorable to us.
In addition, from time to time, we may enter into transactions to acquire assets or the capital stock or other equity interests of other entities. Our continued growth may be financed, wholly or partially, with debt, which may increase our debt levels above industry standards. Any
Our existing and future debt financing securedagreements may contain covenant restrictions that limit our ability to operate our business and pursue beneficial transactions.
Our existing debt agreements and future debt agreements may contain, covenant restrictions that limit our ability to operate our business, including restrictions on our ability to invest in the future could involve restrictiveour existing facilities, incur additional debt or issue guarantees, create additional liens, repurchase stock or make other restricted payments. As a result of these covenants, relatingour ability to capital raising activitiesrespond to changes in business and other financialeconomic conditions and operational matters, which may make it more difficult for usengage in beneficial transactions, including to obtain additional capitalfinancing and to pursue business opportunities, including potential acquisitions. Debt financings may also contain provisions that, if breached, may entitle lenders or their agentsbe restricted. Furthermore, our failure to comply with our debt covenants could result in a default under our debt agreements, which could permit the holders to accelerate our obligation to repay the repayment of loans or realize upondebt and to enforce security over our assets, and thereassets. If any of our debt is no assurance thataccelerated, we wouldmay not have sufficient funds available to repay it or be able to repay such loans in such an event or preventobtain new financing to refinance the enforcement of security granted pursuant to any such debt financing.debt.
Servicing our debt will require a significant amount of cash, and we may not have sufficient cash flow from our business to pay our substantial debt.
Our substantial consolidated indebtedness (refer to the consolidated financial statements included elsewhere in this Form 10-K) may increase our vulnerability to any generally adverse economic and industry conditions. We and our subsidiaries may, subject to the limitations in the terms of our existing and future indebtedness, incur additional debt, secure existing or future debt or recapitalize our debt. Our ability to make scheduled payments of the principal of, to pay interest on or to refinance our current and future indebtedness, including the notes, depends on our future performance, which is subject to economic, financial, competitive and other factors beyond our control.control, including rising interest rates. Our business mayhas not generategenerated positive cash flow from operationsoperations. If this continues in the future, we may not have sufficient cash flows to service our debt and make necessary capital expenditures. If we are unable to generate such cash flow, we may be required to adopt one or more alternatives, such as selling assets, restructuring debt or obtaining additional equity capital on terms that may be onerous or highly dilutive. Our ability to refinance our current and future indebtedness will depend on the capital markets and our financial condition at such time. We may not be able to engage in any of these activities or engage in these activities on desirable terms, which could result in a default on our debt obligations.
30
We incur increased costs as a result of operating as a public company and our management is required to devote substantial time to new compliance initiatives.
Prior to our IPO, we operated as a private company. As a public company, we will incur significant legal, accounting and other expenses that we did not incur as a private company. We may also lose status as an emerging growth company, which may further increase legal, accounting and other expenses resulting from increased disclosure and compliance obligations. In addition, the Sarbanes-Oxley Act of 2002, or the Sarbanes-Oxley Act, and rules implemented by the SEC and the Nasdaq Global Select Market, impose various requirements on public companies, including requirements to file annual, quarterly and event-driven reports with respect to our business and financial condition and operations and establish and maintain effective disclosure and financial controls and corporate governance practices. Our management and other personnel have limited experience operating a public company, which may result in operational inefficiencies or errors, or a failure to improve or maintain effective ICFR and DCP necessary to ensure timely and accurate reporting of operational and financial results. Our existing management team will need to devote a substantial amount of time to these compliance initiatives, and we may need to hire additional personnel to assist us with complying with these requirements. Moreover, these rules and regulations have increased and will continue to increase our legal and financial compliance costs and will make some activities more time consuming and costly.
Pursuant to Section 404 of the Sarbanes-Oxley Act, or Section 404, we will be required to furnish a report by our management on our ICFR, which, after we are no longer an emerging growth company, must be accompanied by an attestation report on ICFR issued by our independent registered public accounting firm. To achieve compliance with Section 404 within the prescribed period, we will document and evaluate our ICFR, which is both costly and challenging. In this regard, we will need to continue to dedicate internal resources, potentially engage outside consultants and adopt a detailed work plan to assess and document the adequacy of our ICFR, continue steps to improve control processes as appropriate, validate through testing that controls are functioning as documented and implement a continuous reporting and improvement process for ICFR. Despite our efforts, there is a risk that we will not be able to conclude within the prescribed timeframe that our ICFR is effective as required by Section 404. This could result one or more material weaknesses in our ICFR, which could cause an adverse reaction in the financial markets due to a loss of confidence in the reliability of our consolidated financial statements.
Management may not be able to successfully implement adequateestablish and maintain effective internal controls over financial reporting. In the course of preparing our consolidated financial statements, we have identified a material weakness in our
Management is responsible for establishing and maintaining adequate internal control over financial reporting.
Proper systems of ICFR As defined in Rules 13a-15(f) and disclosure are critical to15d(f) under the operation of a public company. However, we do not expect that our DCP or ICFR will prevent all errors and all fraud. For example, in the course of preparing our consolidated financial statements for the year ended December 31, 2018, we have identified a material weakness in our internal control over financial reporting. A material weakness is a deficiency, or combination of control deficiencies, inExchange Act, internal control over financial reporting such that there is a process designed to provide reasonable possibility that a material misstatementassurance regarding the reliability of our financial reporting and the annual or interim consolidatedpreparation of financial statements will not be prevented or detected on a timely basis. The material weakness identified related to inventory costing and the financial close process. Specifically, our processes are manualfor external purposes in nature such that a timely, sufficiently precise and detailed review to mitigate the risk of material misstatement is not currently feasible dueaccordance with United States Generally Accepted Accounting Principles (“GAAP”). Due to the complexity of the spreadsheet-based models used in inventory cost calculationswork around integration and the financial close. We have developed a planmodification to remediate the material weakness, including increasing the depth and experience within our accounting and finance organization, as well as designing and implementing improved processes and internal controls with the intent of increasing the use of system-based processes to limit manual calculations and adjustments in the costing and financial closing processes. However, our efforts to remediate this material weakness may not be effective or prevent future material weaknesses or significant deficiencies in our internal control over financial reporting.reporting and other policies and procedures, internal control over financial reporting may not prevent or detect misstatements. Also, projections of any evaluation of effectiveness to future periods are subject to risk that controls may become inadequate because of changes in conditions, or that the degree of compliance with the policies or procedures may deteriorate.
It is not expected that our disclosure controls and procedures and internal controls over financial reporting will prevent all error or fraud. A control system, no matter how well designed and operated,implemented, can provide only reasonable, not absolute, assurance that the control system’ssystem’s objectives will be met. Further, the design of a control system must reflect the fact that there are resource constraints, and the benefits of such controls must be considered relative to their costs. BecauseDue to inherent limitations, our internal control over financial reporting may not prevent or detect all misstatements. The inherent limitations include the realities that judgments in decision-making can be faulty, and that breakdowns can occur because of simple errors or mistakes. Controls can also be circumvented by individual acts of certain persons, by collusion of two or more people or by management override of the inherent limitations in all control systems, no evaluation of controls can provide absolute assurance that all control issues and instances of fraud, if any, have been detected.controls. Due to the inherent limitations in a cost-effective control system, misstatements due to error or fraud may occur and may not be detected in a timely manner or at all. If we cannot provide reliable financial reports or prevent fraud, our reputation and operating results could be materially and adversely affected, which could cause investors
31
to lose confidence in us and our reported financial information, which in turn could result in a reduction in the value of our Class 2 common stock.
We are an emerging growth company and intend to take advantage of reduced disclosure requirements applicable to emerging growth companies, which could make our securities less attractive to investors.
We are an “emerging growth company” as defined in the JOBS Act. We will remain an emerging growth company until the earliest to occur of (i) the last day of the fiscal year in which we have total annual gross revenue of $1.07 billion or more; (ii) December 31, 2023 (the last day of the fiscal year ending after the fifth anniversary of the date of the completion of our IPO; (iii) the date on which we have issued more than $1.0 billion in non-convertible debt securities during the prior three-year period or (iv) the date we qualify as a “large accelerated filer” under the rules of the SEC, which means the market value of our common stock held by non-affiliates exceeds $700 million as of the last business day of our most recently completed second fiscal quarter after we have been a reporting company for at least 12 months. For so long as we remain an emerging growth company, we are permitted to and intend to rely upon exemptions from certain disclosure requirements that are applicable to other public companies that are not emerging growth companies. These exemptions include:
not being required to comply with the auditor attestation requirements of Section 404;
not being required to comply with any requirement that may be adopted by the Public Company Accounting Oversight Board regarding mandatory audit firm rotation or a supplement to the auditor’s report providing additional information about the audit and the financial statements (auditor discussion and analysis);
Reduced “Management’s Discussion and Analysis of Financial Condition and Results of Operations”;
reduced disclosure about executive compensation arrangements;
exemptions from the requirements to obtain a non-binding advisory vote on executive compensation and stockholder approval of any golden parachute arrangements not previously approved; and
an extended transition period for complying with new or revised accounting standards, which we have elected to take advantage of.
We may take advantage of some, but not all, of the available exemptions described above. We cannot predict whether investorsguarantee that we will find our securities less attractive if we rely on these exemptions. If some investors find our securities less attractive as a result, there may be a less active trading market for our securities and the price of our securities may be more volatile.
Conflicts of interest may arise between us and our directors and officers as a result of other business activities undertaken by such individuals, including continuing involvement by these individuals in Privateer Holdings.
We may be subject to various potential conflicts of interest because some of our directors and executive officers may be engaged in a range of business activities. In addition, our directors and executive officers are permitted under their employment agreements with us to devote time to their outside business interests, so long as such activities do not materially or adversely interfere with their duties to us and subject to any contractual restrictions restricting such activities. These business interests could require the investment of significant time and attention by our executive officers and directors. In some cases, our executive officers and directors, including our Chief Executive Officer and President, Brendan Kennedy, may have fiduciary obligations associated with business interests that interfere with their ability to devote time to our business and affairs, such as business obligations related to the employment or involvement of these persons with Privateer Holdings, which could adversely affect our operations.
32
Third parties with whom we do business may perceive themselves as being exposed to reputational risk as a result of their relationship with us.
The parties with whom we do business, or would like to do business, may perceive that they are exposed to reputational risk as a result of our business activities relating to cannabis, which could hinder our ability to establish or maintain business relationships. These perceptions relating to the cannabis industry may interfere with our relationship with service providers in Canada and other countries, particularly in the financial services industry.
Tax and accounting requirements may change in ways that are unforeseen to us and we may face difficulty or be unable to implement or comply with any such changes.
We are subject to numerous tax and accounting requirements, and changes in existing accounting or taxation rules or practices, or varying interpretations of current rules or practices, could have a significant adverse effect onmaterial weakness in our financial results, the manner in which we conduct our business or the marketability of any of our products. We currently have international operations and plan to expand such operationsinternal controls in the future. These operations, andIf we experience any expansion thereto, will require us to comply with the tax laws and regulations of multiple jurisdictions, which may vary substantially. Complying with the tax laws of these jurisdictions can be time consuming and expensive and could potentially subject us to penalties and feesmaterial weakness in our internal controls in the future, ifour financial statements may contain misstatements and we werecould be required to fail to comply.restate our financial statements.
Because a significant portion of our sales are generated in Canada and other countries outside the United States, fluctuations in foreign currency exchange rates could harm our results of operations.
The reporting currency for our consolidated financial statements is the U.S.United States dollar. We derive a significant portion of our revenue and incur a significant portion of our operating costs in Canada and Europe, as well as other countries outside the United States, including Australia. As a result, changes in the exchange rates betweenrate in these jurisdictions relative to the Canadian dollar and the U.S.United States dollar, may have a significant, and potentially adverse, effect on our results of operations. In addition, our obligations under our credit facilities with Privateer Holdings are denominated in U.S. dollars. Our primary risk of loss regarding foreign currency exchange rate risk is caused by fluctuations in the exchange rates between the U.S.United States dollar against the Canadian dollar and the Canadian dollar,Euro, although as we expand internationally, we will be subject to additional foreign currency exchange risks. Because we recognize revenue in Canada in Canadian dollars and revenue in Europe in Euros, if the Canadian dollar weakenseither or both of these currencies weaken against the U.S.United States dollar it would have a negative impact on our Canadian and/or European operating results upon the translation of those results into U.S.United States dollars for the purposes of consolidation. In addition, a weakening of the Canadian dollarthese foreign currencies against the U.S.United States dollar would make it more difficult for us to meet our obligations under the notes and our credit facilities with Privateer Holdings.convertible securities we have issued. We have not historically engaged in hedging transactions and do not currently contemplate engaging in hedging transactions to mitigate foreign exchange risks. As we continue to recognize gains and losses in foreign currency transactions, depending upon changes in future currency rates, such gains or losses could have a significant, and potentially adverse, effect on our results of operations.
We may have exposure to greater than anticipated tax liabilities, which could seriously harm our business.
Our income tax obligations are based on our corporate operating structure and third-party and intercompany arrangements, including the manner in which we develop, value and use our intellectual property and the valuations of our intercompany transactions. The tax laws applicable to our international business activities, including the laws of the United States, Canada and other jurisdictions, are subject to change and uncertain interpretation. The taxing authorities of the jurisdictions in which we operate may challenge our methodologies for valuing developed technology, intercompany arrangements, or transfer pricing, all of which could increase our worldwide effective tax rate and the amount of taxes that we pay and seriously harm our business. Taxing authorities may also determine that the manner in which we operate our business is not consistent with how we report our income, which could increase our effective tax rate and the amount of taxes that we pay and could seriously harm our business. In addition, our future income taxes could fluctuate because of earnings being lower than anticipated in jurisdictions that have lower statutory tax rates and higher than anticipated in jurisdictions that have higher statutory tax rates, by changes in the valuation of our deferred tax assets and liabilities or by changes in tax laws, regulations or accounting principles.
We are subject to regular review and audit by U.S. federal, state, provincial and state and foreignlocal tax authorities. Any adverse outcome from a review or audit could seriously harm our business. In addition, determining our worldwide provision for income taxes and other tax liabilities requires significant judgment by management, and there are many transactions where the ultimate tax determination is uncertain. Although we believe that the amounts recorded in our financial statements are reasonable, the ultimate tax outcome relating to such amounts may differ for such period or periods and may seriously harm our business.
33
The long-term effect of U.S. Furthermore, due to shifting economic and political conditions, tax reform could adversely affect our business and financial condition.
On December 22, 2017, the legislation commonly referredpolicies, laws, or rates in various jurisdictions, we may be subject to as the Tax Cuts and Jobs Act was enacted, which contains significant changes to U.S. tax law, including, but not limited to, a reduction in the corporate tax rate, limitationways that impair our financial results. Our results of the tax deduction for interest expense (with certain exceptions), limitation of the deduction for net operating losses arising after 2017 to 80% of current year taxable incomeoperations and elimination of carryback of such net operating losses, one-time taxation of offshore earnings at reduced rates regardless of whether they are repatriated, immediate deductions for certain new investments instead of deductions for depreciation expense over time, modifying or repealing many business deductions and credits, deemed repatriation of certain intangible related income and a transition to a new quasi-territorial system of taxation. Notwithstanding the reduction in the corporate income tax rate, our business and financial conditioncash flows could be adversely affected in future periods by the overall impact of the Tax Act. In addition, the Tax Act could be amendedadditional taxes imposed on us prospectively or subject to technical correction, possibly with retroactive effect, which could change the financial impacts that were recorded at December 31, 2018,retroactively or are expected to be recorded in future periods. Additionally, further guidance may be forthcomingadditional taxes or penalties resulting from the Financial Accounting Standards Board and SEC, as well as regulations, interpretations and rulings from federal and statefailure to comply with any collection obligations or failure to provide information for tax agencies,reporting purposes to various government agencies.
We may not be able to utilize our net operating loss carryforwards which could result in additional impacts, possibly with retroactive effect. Any suchgreater than anticipated tax liabilities.
We have accumulated net operating loss carryforwards in the United States, Canada and other jurisdictions. Our ability to use our net operating loss carryforwards is dependent upon our ability to generate taxable income in future periods. In addition, these net operating loss carryforwards could expire unused or be subject to limitations which impact our ability to offset future income tax liabilities. U.S. federal net operating losses incurred in 2018 and in future years may be carried forward indefinitely. However, our Canadian net operating loss carry-forwards begin to expire in 2028, and limited carryforward periods also exist in other jurisdictions. As a result, we may not be able realize the full benefit of our net operating loss carryforwards in Canada and other jurisdictions, which could result in increased future tax liability to us. Further, our ability to utilize net operating loss carryforwards in the United States and other jurisdictions could be limited from ownership changes in the current and/or potential additional impacts could adversely affect our business and financial condition. We will continue to examine and assess the impact this tax reform legislation may have on our businessprior periods.
Risks Related to our Intellectual Property
We may be subject to risks related to the protection and enforcement of our intellectual property rights, or intellectual property we license from others, and may become subject to allegations that we or our licensors are in violation of intellectual property rights of third parties.
The ownership, licensing and protection of trademarks, patents and intellectual property rights are significant aspects of our future success. Unauthorized parties may attempt to replicate or otherwise obtain and use our products and technology. Policing the unauthorized use of our current or future trademarks, patents or other intellectual property rights now or in the future could be difficult, expensive, time consuming and unpredictable, as may be enforcing these rights against the unauthorized use by others. Identifying the unauthorized use of intellectual property rights is difficult as we may be unable to effectively monitor and evaluate the products being distributed by our competitors, including parties such as unlicensed dispensaries and black-market participants, and the processes used to produce such products. In addition, in any infringement proceeding, some or all of our trademarks, patents or other intellectual property rights or other proprietary know-how, and that which we license from others, or arrangements or agreements seeking to protect the same for our benefit, may be found invalid, unenforceable, anti-competitive or not infringed or may be interpreted narrowly and such proceeding could put existing intellectual property applications at risk of not being issued.
In addition, other parties may claim that our products, or those that we license from others, infringe on their proprietary or patent protected rights. Such claims, whether or not meritorious, may result in the expenditure of significant financial and managerial resources and legal fees, result in injunctions or temporary restraining orders or require the payment of damages. As well, we may need to obtain licenses from third parties who allege that we have infringed on their lawful rights. Such licenses may not be available on terms acceptable to us, or at all. In addition, weWe may not be able to obtain or utilize on termsadequately protect our intellectual property.
As long as cannabis remains illegal under U.S. federal law as a Schedule I controlled substance under the CSA, the benefit of certain federal laws and protections that are favorablemay be available to us, or at all, licenses or other rights with respectmost businesses, such as federal trademark and patent protection, may not be available to us. As a result, our intellectual property may not be adequately or sufficiently protected against the use or misappropriation by third parties under such U.S. laws. In addition, since the regulatory framework of the cannabis industry is in a state of flux, we can provide no assurance that we do not own.
We also rely on certain trade secrets, technical know-how and proprietary information that are not protected by patents to maintainwill obtain protection for our competitive position. Our trade secrets, technical know-how and proprietary information, which are not protected by patents, may become known to or be independently developed by competitors, which could adversely affect us.
34
We license some intellectual property, rights, and the failure of the owner of such intellectual property to properly maintainwhether on a federal, state or enforce the intellectual property underlying such licenses could have a material adverse effect on our business, financial condition and performance.local level.
We are party to a number of licenses, including with Privateer Holdings, that give us rights to use third-party intellectual property that is necessary or useful to our business. Our success will depend, in part, on the ability of the licensor to maintain and enforce its licensed intellectual property, in particular, those intellectual property rights to which we have secured exclusive rights. Without protection for the intellectual property we have licensed, other companies might be able to offer substantially similar products for sale or utilize substantially similar processes, which could have a material adverse effect on us.
Any of our licensors may allege that we have breached our license agreement, whether with or without merit, and accordingly seek to terminate our license. If successful, this could result in our loss of the right to use the licensed intellectual property, which could adversely affect our ability to commercialize our products or services, as well as have a material adverse effect on us.
We may not realize the full benefit of the clinical trials or studies that we participate in becauseif we are unable to secure ownership or the terms of some of our agreementsexclusive right to participate do not give us full rights touse the resulting intellectual property, the ability to acquire full rights to that intellectual property on commercially reasonable terms or the ability to prevent other parties from using that intellectual property.terms.
Although we have participated in several clinical trials, we are not the sponsor of many of these trials and, as such, do not have full control over the design, conduct and terms of the trials. In some cases, for instance, we are only the provider of a cannabis study drug for a trial that is designed and initiated by an independent investigator within an academic institution. In such cases, we are often not able to acquire rights to all the intellectual property generated by the trials. Although the terms of all clinical trial agreements entered into by us provide us with, at a minimum, ownership of intellectual property relating directly to the study drug being trialed (e.g. intellectual property relating to use of the study drug), and ownership of intellectual property that does not relate directly to the study drug is often retained by the institution. As such, we are vulnerable to any dispute among the investigator, the institution and us with respect to classification and therefore ownership of any particular piece of intellectual property generated during the trial. Such a dispute may affect our ability to make full use of intellectual property generated by a clinical trial.
Where intellectual property generated by a trial is owned by the institution, we are often granted a right of first negotiation to obtain an exclusive license to such intellectual property. If we exercise such a right, there is a risk that the parties will fail to come to an agreement on the license, in which case such intellectual property may be licensed to other parties or commercialized by the institution.
We may not realize the full benefit of our licenses if the licensed material has less market appeal than expected, or if restrictions on packaging and marketing hinder our ability to realize value from our licenses, and our licenses may not be profitable to us.
An integral part of our Canadian adult-use cannabis business strategy involves obtaining territorially exclusive licenses to produce products using various brands and images. As a licensee of brand-based properties, we have no assurance that a particular brand or property will translate into a successful adult-use cannabis product. Additionally, a successful brand may not continue to be successful or maintain a high level of sales. As well, the popularity of licensed properties may not result in popular products or the success of the properties with the public. Promotion, packaging and labelling of adult-use cannabis is strictly regulated. These restrictions may further hinder our ability to benefit from our licenses. Acquiring or renewing licenses may require the payment of minimum guaranteed royalties that we consider to be too high to be profitable, which may result in losing licenses we currently hold when they become renewable under their terms or missing business opportunities for new licenses. If we are unable to acquire or maintain successful licenses on advantageous terms, or to derive sufficient revenue from sales of licensed products, our adult-use business may not be successful.
35
Risks Relating to our Relationship with Privateer Holdings
We are a “controlled company” within the meaning of the listing rules of the Nasdaq Global Select Stock Market and, as a result, qualify for exemptions from certain corporate governance requirements. As we intend to rely on these exemptions, you do not have the same protections afforded to stockholders of companies that are subject to such requirements.
Privateer Holdings owns a majority of the voting power of all outstanding shares of our capital stock. As a result, we are a “controlled company” within the meaning of the listing rules of the Nasdaq Global Select Market. Under these rules, a company of which more than 50% of the voting power for the election of directors is held by an individual, group or another company is a “controlled company” and may elect not to comply with certain corporate governance requirements, including the following:
that a majority of the board of directors consist of independent directors;
for an annual performance evaluation of the nominating and corporate governance and compensation committees;
that we have a nominating and corporate governance committee that is composed entirely of independent directors with a written charter addressing the committee’s purpose and responsibilities; and
that we have a compensation committee that is composed entirely of independent directors with a written charter addressing the committee’s purpose and responsibility.
We may use some of these exemptions for the foreseeable future. As a result, you will not have the same protections afforded to stockholders of companies that are subject to all of the Nasdaq Global Select Market listing rules.
In addition, the Nasdaq Global Select Market has developed listing standards regarding compensation committee independence requirements and the role and disclosure of compensation consultants and other advisers to the compensation committee that, among other things, require:
compensation committees be composed of independent directors, as determined pursuant to new independence requirements;
compensation committees be explicitly charged with hiring and overseeing compensation consultants, legal counsel and other committee advisors; and
compensation committees be required to consider, when engaging compensation consultants, legal counsel or other advisors, independence factors, including factors that examine the relationship between the consultant’s or advisor’s employer and us.
As a controlled company, we are not subject to these compensation committee independence requirements.
We are exposed to risks arising from Privateer Holdings’ stockholdings, its provision of services to us and its participation in our management and conflicts of interest associated therewith.
Privateer Holdings beneficially owns or controls an approximate 80% equity interest in us through ownership or control of 16,666,667 shares of our Class 1 common stock and 58,333,333 shares of our Class 2 common stock, representing approximately 93% of the voting power of our capital stock. In addition, because our Class 1 common stock, which is held entirely by Privateer Holdings, has 10 votes per share, Privateer Holdings will continue to own a majority of the voting power of all outstanding shares of our capital stock and control all matters submitted to our stockholders for approval as long as it holds at least approximately 10.01% of all outstanding shares of our capital stock.
36
As a result of provisions in our amended and restated certificate of incorporation and the terms of agreements we have entered, our relationship with Privateer Holdings, as our majority stockholder, does not impose any duty on Privateer Holdings or its affiliates to act in our best interests and, other than as set out in the agreements entered into between us and Privateer Holdings or its affiliates, Privateer Holdings is not prohibited from engaging in other business activities that may compete with us. In certain instances, the interests of Privateer Holdings may differ from our interests and the interests of our other stockholders, including with respect to future acquisitions or strategic decisions. It is possible that conflicts of interest may arise between Privateer Holdings and us and that such conflicts may not be resolved in a manner that is in our best interests or the best interests of our other stockholders. Additionally, Privateer Holdings and its affiliates will have access to our material confidential information.
Generally, a transfer by Privateer Holdings of the Class 1 common stock it holds would cause a conversion of such shares into Class 2 common stock. However, a transfer by Privateer Holdings to the three founders of Privateer Holdings, or certain entities controlled by them, such as estate planning entities, would not result in a conversion and these individuals would continue to hold Class 1 common stock the superior voting rights of 10 votes per share. These three founders are Brendan Kennedy (our Chief Executive Officer and President as well as one of our directors), Michael Blue and Christian Groh, and such founders hold 45% of the shares of Privateer Holdings.
For so long as Privateer Holdings, either directly or indirectly, owns a significant interest in and holds voting power over our capital stock, Privateer Holdings will have the ability to exercise substantial influence with respect to our affairs and significantly affect the outcome of stockholder votes and may have the ability to cause or prevent certain fundamental transactions. Additionally, Privateer Holdings’ significant voting power may discourage transactions involving a change of control of us, including transactions in which an investor might otherwise receive a premium for our Class 2 common stock over the then-current market price.
Future changes in our relationship with Privateer Holdings may cause our business to be adversely affected.
The arrangements between us and Privateer Holdings do not require Privateer Holdings, either directly or indirectly, to maintain any minimum ownership level in us. Accordingly, Privateer Holdings may transfer all or a substantial portion of its interest in our common stock to a third party, including in connection with a merger, consolidation, sale or spin-off of Privateer Holdings, without our consent or the consent of our other stockholders, although at such time any transferred shares of Class 1 common stock, except for shares transferred to the founders of Privateer Holdings or certain entities controlled by them, would be converted into shares of Class 2 common stock with a single vote per share rather than 10 votes per share. The interests of a transferee of our common stock may be different from Privateer Holdings’ and may not align with those of the other stockholders, and any such transaction may cause the shared services, licenses and industry relationships that we currently benefit from as a result of our affiliation with Privateer Holdings to be disrupted or eliminated. We cannot predict with any certainty the effect that any such transfer would have on the trading price of our Class 2 common stock or our ability to raise capital in the future. Additionally, although our agreements with Privateer Holdings are not terminable in the event that Privateer Holdings ceases to hold a controlling interest in us, our data license agreement is terminable for any reason by either party on 90 days’ notice and our brand licensing agreement is terminable for any reason by either party on six months’ notice prior to the expiration of each automatically renewing five-year term commencing from the first five-year period that ends in February 2023. Further, our debt agreements with Privateer Holdings provide that all outstanding obligations are payable upon demand of Privateer Holdings. As a result of the foregoing, in the event of a change of our relationship with Privateer Holdings, our future would be uncertain and our business, financial condition and results of operations may suffer.
37
Future sales or distributions of our securities by Privateer Holdings could cause the market price for our Class 2 common stock to fall.
Sales of a substantial number of shares of our common stock in the public market could occur at any time. These sales or distributions, or the market perception that the holders of a large number of shares of our Class 2 common stock, or shares of our Class 1 common stock which are convertible into Class 2 common stock on a one-for-one basis, intend to sell our Class 2 common stock, could significantly reduce the market price of our Class 2 common stock. We cannot predict the effect, if any, that future public sales of these securities or the availability of these securities for sale will have on the market price of our Class 2 common stock. If the market price of our Class 2 common stock were to drop as a result, this might impede our ability to raise additional capital and might cause our remaining stockholders to lose all or part of their investment.
The intentions of Privateer Holdings regarding its long-term economic ownership of our capital stock are subject to change, with the result that it may sell more or less of our common stock than anticipated. Factors that could cause Privateer Holdings’ intentions with respect to its ownership of our Class 1 common stock and Class 2 common stock to change include changes in the circumstances of Privateer Holdings or its affiliates, changes in our management and operation and changes in tax laws, market conditions and our financial performance.
Risks Related to Ownership of Our Securities
Holders of Class 2 common stock have limited voting rights as compared to holders of Class 1 common stock. We cannot predict the impact that our capital structure and concentrated control by Privateer Holdings may have on the market price of our Class 2 common stock.
Privateer Holdings beneficially owns or controls 16,666,667 shares of our Class 1 common stock and 58,333,333 shares of our Class 2 common stock, representing 93% of the voting power of our capital stock. Class 1 common stock, held entirely by Privateer Holdings, has 10 votes per share, resulting in Privateer Holdings control of a majority of the voting power of all outstanding shares of our capital stock and control of all matters that may be submitted to our stockholders for approval as long as it holds at least approximately 10.01% of all outstanding shares of our capital stock. This concentrated control reduces other stockholders’ ability to influence corporate matters and, as a result, we may take actions that our stockholders other than Privateer Holdings do not view as beneficial. Further, the concentration of the ownership of our Class 1 common stock may prevent or delay the consummation of change of control transactions that stockholders other than Privateer Holdings may consider favorable, including transactions in which stockholders might otherwise receive a premium for their shares. Future issuances of Class 1 common stock with Privateer Holdings may also be dilutive to the holders of Class 2 common stock. As a result, the market price of our Class 2 common stock could be adversely affected.
Additionally, while other companies listed on U.S. stock exchanges have publicly traded classes of stock with limited voting rights, we cannot predict whether this structure, combined with concentrated control by Privateer Holdings, will result in a lower trading price or greater fluctuations in the trading price of our Class 2 common stock as compared to the market price were we to have a single class of common stock, or will result in adverse publicity or other adverse consequences.
The price of our Class 2 common stock in public markets has experienced and may continue to experience significantsevere volatility and fluctuations.
The market price for our Class 2 common stock, and the market price of stock of other companies operating in the cannabis industry, has been extremely volatile. For example, since our IPO in July 2018,during the 2023 fiscal year, the trading price of our common stock has fluctuatedranged between a low sales price of $20.29$1.78 and a high sales price of $300 per share, demonstrating an unusual degree of volatility even relative to other cannabis companies during the same time period.$5.12. The market price of our Class 2 common stock may continue to be volatile and subject to wide fluctuations in response to numerous factors, many of which are beyond our control, including the following: (i) actual or anticipated fluctuations in our quarterly results of operations; (ii) recommendations by securities research analysts; (iii) changes in the economic performance or market valuations of other issuers that investors deem comparable to us; (iv) the addition or departure of our executive officers or other key personnel; (v) the release or expiration of lock-up or other transfer restrictions on our common stock; (vi) sales or perceived sales, or the expectation of future sales, of our common stock; (vii) significant acquisitions or business combinations, strategic partnerships, joint ventures or capital commitments by or involving us or our competitors; and (viii) news reports or social media relating to trends, concerns, technological or competitive developments, regulatory changes and other related issues in ourthe cannabis industry or our target markets.markets; and (ix) the increase in the number of retail investors and their participation in social media platforms targeted at speculative investing.
38
Financial markets have recently experienced significant price
The volatility of our stock and volume fluctuationsthe stockholder base may hinder or prevent us from engaging in beneficial corporate initiatives.
Our stockholder base is comprised of a large number of retail (or non-institutional) investors, which have affectedcreates more volatility since stock changes hands frequently. In accordance with our governing documents and applicable laws, there are a number of initiatives that require the market pricesapproval of stockholders at the annual or a special meeting. To hold a valid meeting, a quorum comprised of stockholders representing one-third of the equity securitiesvoting power of public entities. In many cases, these fluctuations,our outstanding shares of common stock is necessary. A record date is established to determine which stockholders are eligible to vote at the meeting, which record date must be 30 – 60 days prior to the meeting. Since our stocks change hands frequently, there can be a significant turnover of stockholders between the record date and the effectmeeting date which makes it harder to get stockholders to vote. While we make every effort to engage retail investors, such efforts can be expensive and the frequent turnover creates logistical issues. Further retail investors tend to be less likely to vote in comparison to institutional investors. Failure to secure sufficient votes or to achieve the minimum quorum needed for a meeting to happen may impede our ability to move forward with initiatives that they have on market prices, have been unrelatedare intended to grow the business and create stockholder value or prevent us from engaging in such initiatives at all. If we find it necessary to delay or adjourn meetings or to seek approval again, it will be time consuming and we will incur additional costs.
The terms of our outstanding warrants may limit our ability to raise additional equity capital or pursue acquisitions, which may impact funding of our ongoing operations and cause significant dilution to existing stockholders.
On March 13, 2020, we entered into an underwriting agreement with Canaccord Genuity LLC relating to the operating performance, underlying asset valuesissuance and sale of shares of our common stock at a price to the public of $4.76 per share and included warrants to purchase additional common stock at a price of $4.7599 per warrant. As of May 31, 2023, 6,209,000 warrants remain outstanding and do not expire until March 13, 2025. The warrants contain a price protection, or prospectsanti-dilution feature, pursuant to which, the exercise price of such entities. Accordingly,warrants will be reduced to the marketconsideration paid for, or the exercise price or conversion price of, our Class 2 common stockas the case may decline even if our operating results or prospects have not changed. Additionally, these factors, as well as other related factors,be, any newly issued securities issued at a discount to the original warrant exercise price of $5.95 per share. Therefore, the exercise price of the warrants may cause decreases in asset values that are deemed not to be temporary,end up being lower than $5.95 per share, which maycould result in impairment lossesincremental dilution to us. Furthermore, certain investorsexisting stockholders.
Additionally, so long as the warrants remain outstanding, we may base their investment decisions on considerations ofonly issue up to $20 million in aggregate gross proceeds under our environmental, governance and social practices or our industry as a whole, and our performance in these areas against such investors’ respective investment guidelines and criteria. The failure to satisfy such criteria may result in limited or no investment in our Class 2 common stock by those investors, which could materially and adversely affectat-the-market offering program at prices less than the tradingexercise price of our Class 2 common stock.
There can bethe warrants, and in no assurance that continuing fluctuationsevent more than $6 million per quarter at prices below the exercise price of the warrants, without triggering the warrant’s anti-dilution feature described in the paragraph immediately above. If our stock price and volume of equity securities in public markets will not occur. If such increased levels of volatility and market turmoil continue for a protracted period of time, there could be a material adverse effect onwere to remain below the tradingwarrant exercise price of $5.95 per share for an extended time, we may be forced to lower the warrant exercise price at unfavorable terms in order to fund our Class 2 common stock.ongoing operations. As of May 31, 2023, the warrant exercise price was $3.15. Refer to Part II, Item 8, Note 20, Warrants, of this form 10-K for additional information.
If securities or industry analysts do not publish research, or publish inaccurate or unfavorable research, about our business, our stock price and trading volume could decline.
The trading market for our Class 2 common stock depends, in part, on the research and reports that securities or industry analysts publish about us or our business. We do not have any control over these analysts. If one or more of the securities or industry analysts who cover us downgrade our stock or publish inaccurate or unfavorable research about our business, our stock price would likely decline. In addition, if our operating results fail to meet the forecast of analysts, our stock price would likely decline. If one or more of these analysts cease coverage of our company or fail to publish reports on us regularly, demand for our stock could decrease, which might cause our stock price and trading volume to decline.
We may not have the ability to raise the funds necessary to settle conversions of the notesConvertible Securities in cash or to repurchase the notesConvertible Securities upon a fundamental change, andchange.
We issued various securities convertible into shares of our future debt may contain limitations on our ability to pay cash upon conversioncommon stock, or repurchase of the notes.
Convertible Securities. Holders of the notescertain Convertible Securities have the right to require us to repurchase their notesConvertible Securities upon the occurrence of a fundamental change at a fundamental change repurchase price equal to 100% of the principal amount of the notes to be repurchased, plus accrued and unpaid interest, if any.change. In addition, upon conversion, of the notes, unless we elect to deliver solely shares of our Class 2 common stock to settle such conversion (other than paying cash in lieu of delivering any fractional share), we will be required to make cash payments in respect of the notesConvertible Securities being converted. However, we may not have enough available cash or be able to obtain financing at the time we are required to make repurchases of notes surrendered therefor or notes being converted.Convertible Securities surrendered. In addition, our ability to repurchase the notesConvertible Securities or to pay cash upon conversions of the notesConvertible Securities may be limited by law, by regulatory authority or by agreements governing our future indebtedness. Our failure to repurchase notesConvertible Securities at a time when the repurchase is required by the indenture or to pay any cash payable on future conversions of the notesConvertible Securities as required by the indenture would constitute a default under the indenture. A default under the indenture or the fundamental change itself could also lead to a default under agreements governing our existing or future indebtedness. If the repayment of the related indebtedness were to be accelerated after any applicable notice or grace periods, we may not have sufficient funds to repay the indebtedness and repurchase the notesConvertible Securities or make cash payments upon conversions thereof.
The conditional conversion feature of the notes,Convertible Securities, if triggered, may adversely affect our financial condition and operating results.
In the event thea conditional conversion feature of the notesConvertible Securities is triggered, holders of notesConvertible Securities will be entitled to convert the notesConvertible Securities at any time during specified periods at their option. If one or more holders elect to convert their notes,Convertible Securities, unless we elect to satisfy our conversion obligation by delivering solely shares of our Class 2 common stock (other than paying cash in lieu of delivering any fractional share), we would be required to settle a portion or all of our conversion obligation through the payment of cash, which could adversely affect our liquidity. In addition, even if holders of notesConvertible Securities do not elect to convert their notes,Convertible Securities, we could be required under applicable accounting rules to reclassify all or a portion of the outstanding principal of the notesConvertible Securities as a current rather than long-term liability, which would result in a material reduction of our net working capital.
39
HoldersConversion of the Convertible Securities may dilute the ownership interest of our Class 2stockholders or may otherwise depress the price of our common stock.
The conversion of some or all of the Convertible Securities may dilute the ownership interests of our stockholders. Upon conversion of the Convertible Securities, we have the option to pay or deliver, as the case may be, cash, shares of our common stock, or a combination of cash and shares of our common stock. If we elect to settle our conversion obligation in shares of our common stock or a combination of cash and shares of our common stock, any sales in the public market of our common stock issuable upon such conversion could adversely affect prevailing market prices of our common stock. In addition, the existence of the Convertible Securities may encourage short selling by market participants because the conversion of the Convertible Securities could be used to satisfy short positions, or anticipated conversion of the Convertible Securities into shares of our common stock could depress the price of our common stock.
Certain provisions in the indentures governing the Convertible Securities may delay or prevent an otherwise beneficial takeover attempt of us.
Certain provisions in the indentures governing the Convertible Securities may make it more difficult or expensive for a third party to acquire us. For example, we may be required to repurchase certain Convertible Securities for cash upon the occurrence of a fundamental change and, in certain circumstances, to increase the relevant conversion rate for a holder that converts its Convertible Securities in connection with a make-whole fundamental change. A takeover of us may trigger the requirement that we repurchase the Convertible Securities and/or increase the conversion rate, which could make it more costly for a potential acquirer to engage in such takeover. Such additional costs may have the effect of delaying or preventing a takeover of us that would otherwise be beneficial to investors.
Our stockholders may be subject to dilution resulting from future offerings of common stock by us.
We may raise additional funds in the future by issuing common stock or equity-linked securities. Holders of our securities have no preemptive rights in connection with such further issuances. Our board of directors has the discretion to determine if an issuance of our capital stock is warranted, the price at which such issuance is to be effected and the other terms of any future issuance of capital stock. In addition, additional common stock will be issued by us in connection with the exercise of options or grant of other equity awards granted by us. Such additional equity issuances could, depending on the price at which such securities are issued, substantially dilute the interests of the holders of our existing securities.
Conversion of the notes may dilute the ownership interest of our stockholders or may otherwise depress the price of our Class 2 common stock.
The conversion of some or all of the notes may dilute the ownership interests of our stockholders. Upon conversion of the notes, we have the option to pay or deliver, as the case may be, cash, shares of our Class 2 common stock, or a combination of cash and shares of our Class 2 common stock. If we elect to settle our conversion obligation in shares of our Class 2 common stock or a combination of cash and shares of our Class 2 common stock, any sales in the public market of our Class 2 common stock issuable upon such conversion could adversely affect prevailing market prices of our Class 2 common stock. In addition, the existence of the notes may encourage short selling by market participants because the conversion of the notes could be used to satisfy short positions, or anticipated conversion of the notes into shares of our Class 2 common stock could depress the price of our Class 2 common stock.
It is not anticipated that any dividends will be paid to holders of our Class 2 common stock for the foreseeable future.
No dividends on our Class 2 common stock have been paid to date. We anticipate that, for the foreseeable future, we will retain future earnings and other cash resources for the operation and development of our business. The payment of any future dividends will be at the discretion of our board of directors after taking into account many factors, including our earnings, operating results, financial condition and current and anticipated cash needs.
Provisions in our corporate charter documents could make an acquisition of us more difficult and may prevent attempts by our stockholders to replace or remove our current management.board of directors.
Provisions in our corporate charter and our bylaws may discourage, delay or prevent a merger, acquisition or other change in control of us that stockholders may consider favorable, including transactions in which stockholders might otherwise receive a premium for their shares. These provisions could also limit the price that investors might be willing to pay in the future for shares of our Class 2 common stock, thereby depressing the market price of our Class 2 common stock. In addition, these provisions may frustrate or prevent any attempts by our stockholders to replace or remove our current management by making it more difficult for stockholders to replace members of our board of directors. Because our board of directors is responsible for appointing the members of our management team, these provisions could in turn affect any attempt by our stockholders to replace current members of our management team. Among others, these provisions include the following:
our board of directors is divided into three classes with staggered three-year terms which may delay or prevent a change of our management or a change in control;
• | Our board of directors is divided into three classes with staggered three-year terms which may delay or prevent a change of our management or a change in control; |
our board of directors has the right to elect directors to fill a vacancy created by the expansion of the board of directors or the resignation, death or removal of a director, which prevents stockholders from being able to fill vacancies on our board of directors;
• | Our board of directors has the right to elect directors to fill a vacancy created by the expansion of the board of directors or the resignation, death or removal of a director, which prevents stockholders from being able to fill vacancies on our board of directors; |
our stockholders may not act by written consent or call special stockholders’
• | Except in limited circumstances, our stockholders may not act by written consent or call special stockholders’ meetings; as a result, a holder, or holders, controlling a majority of our capital stock would not be able to take certain actions other than at annual stockholders’ meetings or special stockholders’ meetings called by the board of directors, the chairman of the board or our chief executive officer; |
• | Our certificate of incorporation prohibits cumulative voting in the election of directors, which limits the ability of minority stockholders to elect director candidates; |
• | Stockholders must provide advance notice and additional disclosures in order to nominate individuals for election to the board of directors or to propose matters that can be acted upon at a stockholders’ meeting, which may discourage or deter a potential acquirer from conducting a solicitation of proxies to elect the acquirer’s own slate of directors or otherwise attempting to obtain control of our company; and |
• | Our board of directors may issue, without stockholder approval, shares of undesignated preferred stock; the ability to issue undesignated preferred stock makes it possible for our board of directors to issue preferred stock with voting or other rights or preferences that could impede the success of any attempt to acquire us. |
General Risk Factors
We may not be able to take certain actions other than at annual stockholders’ meetingsmaintain adequate insurance coverage, the premiums may not continue to be commercially justifiable, and coverage limitations or special stockholders’ meetings called by the boardexclusions may leave us exposed to uninsured liabilities.
We currently maintain insurance coverage, including product liability insurance, protecting many, but not all, of directors, the chairmanour assets and operations. Our insurance coverage is subject to coverage limits and exclusions and may not be available for all of the boardrisks and hazards to which we are exposed, or the coverage limits may not be sufficient to protect against the full amount of loss. In addition, no assurance can be given that such insurance will be adequate to cover our chief executive officer;
40
our certificate of incorporation prohibits cumulative votingliabilities, including potential product liability claims, or will be generally available in the electionfuture or, if available, that premiums will be commercially justifiable. If we were to incur substantial liability and such damages were not covered by insurance or were in excess of directors, whichpolicy limits, the ability of minority stockholderswe may be exposed to elect director candidates;
stockholders must provide advance notice and additional disclosures in order to nominate individuals for election to the board of directors or to propose matters that can be acted upon at a stockholders’ meeting, which may discourage or deter a potential acquirer from conducting a solicitation of proxies to elect the acquirer’s own slate of directors or otherwise attempting to obtain control of our company; and
our board of directors may issue, without stockholder approval, shares of undesignated preferred stock; the ability to issue undesignated preferred stock makes it possible for our board of directors to issue preferred stock with voting or other rights or preferencesmaterial uninsured liabilities that could impedediminish our liquidity, profitability or solvency.
The financial reporting obligations of being a public company and maintaining a dual listing on the success of any attempt to acquire us.
Provisions under Delaware law could make an acquisition of ourTSX and on NASDAQ requires significant company more difficult, limit attempts by our stockholders to replace or remove our currentresources and management and limit the market price of our Class 2 common stock.attention.
In addition to our corporate charter and our bylaws, because we are incorporated in Delaware, we
We are subject to the provisionspublic company reporting obligations under the Exchange Act and the rules and regulations regarding corporate governance practices, including those under the Sarbanes-Oxley Act, the Dodd-Frank Act, and the listing requirements of Section 203Nasdaq Global Select Market (“NASDAQ”) and the Toronto Stock Exchange (“TSX”). We incur significant legal, accounting, reporting and other expenses in order to maintain a dual listing on both the TSX and NASDAQ. Moreover, our listing on both the TSX and NASDAQ may increase price volatility due to various factors, including the ability to buy or sell common shares, different market conditions in different capital markets and different trading volumes. In addition, low trading volume may increase the price volatility of the Delaware General Corporation Law,common shares.
As a cannabis company, we may be subject to heightened scrutiny in Canada and the United States that could materially adversely impact the liquidity of our shares of common stock.
Our existing operations in the United States, and any future operations, may become the subject of heightened scrutiny by regulators, stock exchanges and other authorities in the United States and Canada.
Given the heightened risk profile associated with cannabis in the United States, the Canadian Depository for Securities Ltd., or CDS, may implement procedures or protocols that would prohibit or significantly impair the ability of CDS to settle trades for companies that have cannabis businesses or assets in the United States.
On February 8, 2018, following discussions with the Canadian Securities Administrators and recognized Canadian securities exchanges, the TMX Group, the parent company of CDS, announced the signing of a Memorandum of Understanding (the “TMX MOU”) with Aequitas NEO Exchange Inc., the CSE, the Toronto Stock Exchange, and the TSX Venture Exchange. The TMX MOU outlines the parties’ understanding of Canada’s regulatory framework applicable to the rules, procedures, and regulatory oversight of the exchanges and CDS as it relates to issuers with cannabis-related activities in the United States. The TMX MOU confirms, with respect to the clearing of listed securities, that CDS relies on the exchanges to review the conduct of listed issuers. As a result, there is no CDS ban on the clearing of securities of issuers with cannabis-related activities in the United States. However, there can be no assurances given that this approach to regulation will continue in the future. If such a ban were to be implemented, it could have a material adverse effect on the ability of holders of the common stock to settle trades. In particular, the shares of common stock would become highly illiquid until an alternative was implemented, and investors would have no ability to effect a trade of the common stock through the facilities of a stock exchange.
Tax and accounting requirements may change in ways that are unforeseen to us and we may face difficulty or be unable to implement or comply with any such changes.
We are subject to numerous tax and accounting requirements, and changes in existing accounting or taxation rules or practices, or varying interpretations of current rules or practices, could have a significant adverse effect on our financial results, the manner in which generally prohibits a Delaware corporation from engaging inwe conduct our business or the marketability of any of our products. We currently maintain international operations and plan to expand such operations in the future. These operations, and any expansion thereto, will require us to comply with the tax laws and regulations of multiple jurisdictions, which may vary substantially. Complying with the tax laws of these jurisdictions can be time consuming and expensive and could potentially subject us to penalties and fees in the future if we fail to comply.
We may be materially adversely affected by negative impacts on the global economy, capital markets or other geopolitical conditions resulting from the recent invasion of Ukraine by Russia and subsequent sanctions against Russia, Belarus and related individuals and entities.
United States and global markets are experiencing volatility and disruption following the escalation of geopolitical tensions and the recent invasion of Ukraine by Russia in February 2022. In response to such invasion, the North Atlantic Treaty Organization (“NATO”) deployed additional military forces to eastern Europe, and the United States, the United Kingdom, the European Union and other countries have announced various sanctions and restrictive actions against Russia, Belarus and related individuals and entities, including the removal of certain financial institutions from the Society for Worldwide Interbank Financial Telecommunication (SWIFT) payment system. Certain countries, including the United States, have also provided and may continue to provide military aid or other assistance to Ukraine during the ongoing military conflict, increasing geopolitical tensions with Russia. The invasion of Ukraine by Russia and the resulting measures that have been taken, and could be taken in the future, by NATO, the United States, the United Kingdom, the European Union and other countries have created global security concerns that could have a broad rangelasting impact on regional and global economies. Although the length and impact of business combinations withthe ongoing military conflict in Ukraine is highly unpredictable, the conflict could lead to market disruptions, including significant volatility in commodity prices, credit and capital markets, as well as supply chain interruptions. Additionally, Russian military actions and the resulting sanctions could adversely affect the global economy and financial markets and lead to instability and lack of liquidity in capital markets.
Any of the above mentioned factors, or any holderother negative impact on the global economy, capital markets or other geopolitical conditions resulting from the Russian invasion of at least 15%Ukraine and subsequent sanctions, could adversely affect our business. The extent and duration of our capital stockthe Russian invasion of Ukraine, resulting sanctions and any related market disruptions are impossible to predict, but could be substantial, particularly if current or new sanctions continue for aan extended period of three years following the datetime or if geopolitical tensions result in expanded military operations on which the stockholder became a 15% stockholder.
Certain provisions in the indenture governing the notesglobal scale. Any such disruptions may delay or prevent an otherwise beneficial takeover attempt of us.
Certain provisions in the indenture governing the notes may make it more difficult or expensive for a third party to acquire us. For example, the indenture governing the notes requires us to repurchase the notes for cash upon the occurrence of a fundamental change and, in certain circumstances, to increase the relevant conversion rate for a holder that converts its notes in connection with a make-whole fundamental change. A takeover of us may trigger the requirement that we repurchase the notes and/or increase the conversion rate, which could make it more costly for a potential acquirer to engage in such takeover. Such additional costs mayalso have the effect of delaying or preventing a takeover of us that would otherwise be beneficial to investors.
Our amended and restated certificate of incorporation provides that the Court of Chanceryheightening many of the Stateother risks described in this “Risk Factors” section, such as those related to the market for our securities, cross-border transactions or our ability to raise equity or debt financing. If these disputes or other matters of Delawareglobal concern continue for an extensive period of time, our operations may be adversely affected.
In addition, the recent invasion of Ukraine by Russia, and the federal district courtsimpact of sanctions against Russia, and the United States of America will be the exclusive forumspotential for substantially all disputes between us and our stockholders, whichretaliatory acts from Russia, could limit our stockholders’ ability to obtain a favorable judicial forum for disputes with us or our directors, officers or employees.result in increased cyber-attacks against U.S. companies.
Our amended and restated certificate of incorporation provides that the Court of Chancery of the State of Delaware is the exclusive forum for:
any derivative action or proceeding brought on our behalf;
any action asserting a breach of fiduciary duty;
any action asserting a claim against us arising under the Delaware General Corporation Law, our amended and restated certificate of incorporation or our amended and restated bylaws; and
any action asserting a claim against us that is governed by the internal-affairs doctrine.
Our amended and restated certificate of incorporation further provides that the federal district courts of the United States of America will be the exclusive forum for resolving any complaint asserting a cause of action arising under the Securities Act.
41
These exclusive-forum provisions may limit a stockholder’s ability to bring a claim in a judicial forum that it finds favorable for disputes with us or our directors, officers or other employees, which may discourage lawsuits against us and our directors, officers and other employees. If a court were to find the exclusive-forum provision in our amended and restated certificate of incorporation to be inapplicable or unenforceable in an action, we may incur additional costs associated with resolving the dispute in other jurisdictions, which could seriously harm our business.
Item 1B. Unresolved Staff Comments.
None.
Our headquarters are in Nanaimo, British Columbia. Our Nanaimo campus is comprised of one
The following outlines our principal cultivation, manufacturing and R&D facility which we own and one leased buildingstorage facilities by reporting segment as of office space. May 31, 2023:
Facility and Primary Use | Location | Reporting Segment | Owned/ Leased | Approximate Square Footage |
Canada: | ||||
Aphria One (Cannabis Cultivation and Processing) | Leamington, ON | Cannabis | Owned | 1,400,000 |
1974568 Ontario Ltd. (operating as “Aphria Diamond”) (Cannabis Cultivation) | Leamington, ON | Cannabis | Owned1 | 1,500,000 |
Broken Coast (Cannabis Cultivation and Processing) | Vancouver Island, BC | Cannabis | Owned | 47,000 |
Avanti (EU-GMP Cannabis Processing and Lab) | Brampton, ON | Cannabis | Owned | 18,000 |
Tilray North America Campus (EU-GMP Cannabis Cultivation and Processing) | Nanaimo, BC | Cannabis | Owned2 | 60,000 |
High Park Farms (Cannabis Cultivation and Processing) | Enniskillen, ON | Cannabis | Leased2 | 626,000 |
High Park Holdings (Cannabis 2.0 Processing) | London, ON | Cannabis | Leased | 134,000 |
Manitoba Harvest (Hemp Processing) | Winnipeg, MB | Wellness | Leased | 15,000 |
Manitoba Harvest (Hemp Processing) | St. Agathe, MB | Wellness | Owned | 35,000 |
United States: | ||||
SweetWater Brewery (Craft Brewery) | Atlanta, GA | Beverage Alcohol | Owned3 | 158,000 |
SweetWater Colorado (Craft Brewery) | Fort Collins, CO | Beverage Alcohol | Owned | 33,000 |
Breckenridge Distillery | Breckenridge, CO | Beverage Alcohol | Owned | 23,000 |
| Breckenridge Distillery Warehouse | Denver, CO | Beverage Alcohol | Owned | 75,000 |
| Montauk Brewing Company | Montauk, NY | Beverage Alcohol | Owned | 4,000 |
| Fort Collins (CBD extraction site) | Fort Collins, CO | Cannabis | Owned | 50,000 |
International: | ||||
Tilray EU Campus and Cultivation Site (Cannabis Cultivation and Processing) | Cantanhede, Portugal | Cannabis | Owned4 | 3,300,000 |
CC Pharma (Distribution Operations) | Densborn, Germany | Distribution | Owned | 70,000 |
Aphria RX (Cannabis Cultivation) | Neumünster, Germany | Cannabis | Owned | 65,000 |
FL Group Srl (Distribution Operations) | Vado Ligure, Italy | Cannabis | Leased | 4,700 |
ABP (Distribution Operations) | Buenos Aires, Argentina | Distribution | Leased | 10,000 |
1 | Aphria Diamond is a 51% majority-owned subsidiary of Aphria, Inc. Aphria Diamond is a strategic venture with Double Diamond Farms. |
2 | We announced our decision to close these facilities in Enniskillen, ON and Nanaimo, BC. These facilities have ceased operations. |
3 | We purchased the building during the year. |
4 | In Cantanhede, Portugal, we own one cultivation and manufacturing location used for medical cannabis and land adjacent to this facility for future expansion. |
We also have two manufacturing locations under leases, locatedlease space for other smaller offices in Enniskillenthe United States, Canada, Europe and London Ontario. In Cantanhede Portugal, we own one manufacturing location and land adjacent this facility for future expansion, currently this property is vacant. We also have leased space in Toronto, Ontario, Sydney Australia, San Francisco, California, Berlin, Germany, and Dublin, Ireland to be used for general and administrative purposes. Our lease in Enniskillen has a purchase option at the endother parts of the lease and all other significant leases have renewal options. world.
We believe that our facilities and committed leased space are currently adequate to meet our needs. As we continue to expand our operations, we may need to acquire or lease additional facilities or alternativedispose of existing facilities.
From time
The information called for by this item is incorporated herein by reference to time, we may become involved in legal proceedings arisingNote 27, Commitments and Contingencies, in the ordinary courseNotes to the Consolidated Financial Statements included in Part II, Item 8 of our business. We are not currently a party to any legal proceedings the outcome of which, if determined adversely to us, would individually or in the aggregate have a material adverse effect on our business, financial condition, results of operations or prospects.this Form 10-K.
Item 4. Mine Safety Disclosures.
Not applicable.
42
Item 5. Market for Registrant’sRegistrant’s Common Equity, Related Stockholder Matters and Issuer Purchases of Equity Securities.
Our Class 2 common stock is traded on the Nasdaq Global Select Market under the symbol “TLRY.”
Holders
As of March 25, 2019,July 24, 2023, there were approximately 85703,257,224 holders of record of our Class 2 common stock. The actual number of stockholders is greater than this number of record holders and includes stockholders who are beneficial owners but whose shares are held in street name by brokers and other nominees.
Dividends
We have never declared ornot paid any cash dividends on our Class 2 common stock. We currentlystock to date. It is our current intention to not declare or pay any dividends for the foreseeable future as we intend to retainutilize all available funds and any future earnings to support operations and to finance the growth and development of our business. Any declared dividends will be declared on both our Class 1 common stock and Class 2 common stock at the same rate per share. We do not intend to declare or pay cash dividends on our Class 2 common stock in the foreseeable future. Any future determination to pay dividends will be made at the discretion of our board of directors subject to applicable laws and will depend upon, among other factors, our results of operations, financial condition, contractual restrictions and capital requirements. Because a significant portion of our operations is conducted through our wholly owned subsidiaries, our ability to pay dividends depends in part on our receipt of cash dividends from such subsidiaries, which may further restrict our ability to pay dividends as a result of the laws of their jurisdiction of organization or covenants under any future outstanding indebtedness such subsidiaries incur. Our future ability to pay cash dividends on our Class 2 common stock may beis limited by the terms of the Aphria Diamond credit facility, as well as any future debt or preferred securities.
Use
Recent sales of Proceedsunregistered securities; use of proceeds from Initial Public Offeringregistered securities.
Pursuant to the IPO, we issued and sold 10,350,000 shares
Each issuance of our Class 2 common stock at a price to the public of $17.00 per share (CAD $22.45 per share), including shares sold resultingdescribed below, unless otherwise noted, were exempt from the exerciseregistration under Section 4(2) of the over-allotment optionSecurities Act 1933 in transactions by an issuer not involving a public offering and no underwriter participated in the underwriters. The offer and sale of the shares issued pursuant to the foregoing issuances, and no commission or other remuneration was paid or given directly or indirectly in connection therewith.
On June 30, 2022, Tilray entered into an assignment and assumption agreement with Double Diamond Holdings Ltd. (“DDH”), an Ontario corporation, pursuant to which, among other things, Tilray acquired from DDH a promissory note in the amount of $5,063,709 (the “Note”) payable by 1974568 Ontario Limited (“Aphria Diamond”). DDH is a joint venturer with Aphria Inc. (Tilray’s wholly-owned subsidiary) in Aphria Diamond. As consideration for the Note, Tilray issued 1,529,821 shares of its common stock to DDH.
On July 12, 2022, Tilray acquired from HT Investments MA LLC (“HTI”) all of the outstanding principal and interest under a secured convertible note (the “HEXO Note”) issued by HEXO Corp. (“HEXO”) with certain amendments, pursuant to the amended and restated assignment and assumption agreement, dated as of June 14, 2022. As consideration for the acquisition of the HEXO Note, Tilray paid a purchase price in an aggregate amount equal to $155 million, which purchase price was satisfied through the issuance to HTI of 33,314,412 shares of our Class 2Tilray’s common stock and the issuance of a newly issued $50 million convertible promissory note.
On September 1, 2022, the Company issued 10,276,305 shares of Tilray's common stock to DDH in connection with the assignment from DDH to the Company of a promissory note payable by 1974568 Ontario Limited.
On December 5, 2022, the Company issued 1,979,541 shares of Tilray's common stock to DDH in connection with the assignment from DDH to the Company of a promissory note payable by 1974568 Ontario Limited.
On February 21, 2023, the Company issued 2,328,739 shares of Tilray's common stock to DDH in connection with the assignment from DDH to the Company of a promissory note payable by 1974568 Ontario Limited.
On May 30, 2023, the Company issued 38,500,000 shares of Tilray's common stock as part of a share lending agreement with an affiliate of Jefferies LLC in connection with the registered offering of $150 million of unsecured convertible senior notes. The net proceeds from this offering were used to finance the concurrent repurchase of a portion of its outstanding 5.00% Convertible Senior Notes due 2023 (TLRY 23) and 5.25% Convertible Senior Notes due 2024 (APHA 24), as described in Note 17 (Convertible debentures payable). On June 9, 2023, the Company issued an additional $22.5 million of unsecured convertible senior notes by way of overallotment bringing the outstanding balance to $172.5 million as described in Note 30 (Subsequent events).
Stock Performance Graph
The following graph compares the performance of our common stock to the Nasdaq Composite and the Horizons Marijuana Life Sciences Index for the period from July 18, 2018, date of initial public offering, through May 31, 2023 in comparison to the indicated indexes. The results assume that $100, which was invested on July 18, 2018 in our IPO were registeredcommon stock and each of the indicated indexes.

July 18, | May 31, | |||||||||||||||||||||||
2018 | 2019 | 2020 | 2021 | 2022 | 2023 | |||||||||||||||||||
Tilray Brands, Inc. | $ | 100.00 | $ | 169.76 | $ | 43.99 | $ | 74.45 | $ | 18.50 | $ | 6.88 | ||||||||||||
Nasdaq Composite | $ | 100.00 | $ | 95.24 | $ | 121.27 | $ | 175.70 | $ | 154.86 | $ | 165.81 | ||||||||||||
Horizons Marijuana Life Sciences Index | $ | 100.00 | $ | 110.97 | $ | 44.93 | $ | 62.28 | $ | 23.71 | $ | 12.65 | ||||||||||||
This information under “Stock Performance Graph” is not deemed filed with the Securities and Exchange Commission and is not to be incorporated by reference in any filing of Tilray under the Securities Act pursuant to a registration statementof 1933, as amended, or the Securities Exchange Act of 1934, as amended, whether made before or after the date of this Annual Report on Form S-1 (File No. 333-225741), which was declared effective by the SEC on July 18, 2018.10-K and irrespective of any general incorporation language in those filings.
There has been no material change in our planned use of the net proceeds from the IPO as described in our final prospectuses filed with the SEC on July 19, 2018.
None.
Item 6. Selected Financial Data.
Not applicable.[Reserved]
43
Item 7. Management’sManagement’s Discussion and Analysis of Financial Condition and Results of Operations.
The following Management’s Discussion and Analysis of Financial Condition and Results of Operations is intended to help the reader understand our operations and our present business environment from the perspective of management. You should read the following discussion and analysis of our financial condition and results of operations together with the financial statements“Cautionary Note Regarding Forward-Looking Statements”; the sections in Part I entitled “Item 1A. Risk Factors” and the relatedfinancial information and the notes to those statementsthereto included elsewherein Part II, Item 8 of this Form 10-K in this report. This discussion contains forward-looking statementsAnnual Report for the fiscal year ended May 31, 2023 (“Annual Report”). We use certain non-GAAP measures that involve risks and uncertainties. As a resultare more fully described below under the caption “—Use of many factors, such as those set forth in the section of this report captioned “Risk Factors” and elsewhere in this report, our actual results may differ materially from those anticipated in these forward-looking statements.
Overview
We aspire to lead, legitimize and define the future of our industry by building the world’s most trusted and valuable cannabis company.
We are pioneering the future of medical and adult-use cannabis research, cultivation, processing and distribution globally, and we intend to become a global leader in the cannabis market where regulations permit.
We produce medical cannabis in Canada and Europe, and we have supplied high-quality cannabis products to tens of thousands of patients in twelve countries spanning five continents through our subsidiaries in Australia, Canada, Germany, Latin America and Portugal and through agreements with established pharmaceutical distributors. In Canada, we are also authorized to distribute certain products on a wholesale basis and to sell certain products direct to patients through our e-commerce platform or over the phone.
We are witnessing a global paradigm shift with regard to cannabis, and as a result of this shift, the transformation of a multibillion dollar industry from a state of prohibition to a state of legalization. Medical cannabis is now authorized at the national or federal level in forty-one countries. The legal market for medical cannabis is still in its early stages andNon-GAAP Measures,” which we believe the number of countries with legalized regimes will continue to increase. We believe that as this transformation occurs, trusted global brands with multinational supply chains will become market leaders by earning the confidence of patients, doctors, governments and adult consumers around the world.
We are a leader in the Canadian adult-use market. We have entered into agreements to supply certain provinces and territories with our adult-use products for sale through the distribution systems they have established. Adult-use legalization occurred in Canada on October 17, 2018. As a result of adult-use legalization, we expect the adult-use market to represent a higher proportion of our revenues as new consumers participate in, and previously illicit consumers adopt, Canada’s framework for the sale of cannabis.
Key Operating Metrics
We use the following key operating metricsappropriate supplemental non-GAAP measures to evaluate our business and operations, measure our performance, identify trends affecting our business, project our future performance, and make strategic decisions.
Amounts are presented in thousands of United States dollars, except for shares, warrants, per share data and per warrant data or as otherwise noted.
Company Overview
We are a leading global cannabis-lifestyle and consumer packaged goods company headquartered in Leamington and New York, with operations in Canada, the United States, Europe, Australia, and Latin America that is changing people’s lives for the better – one person at a time – by inspiring and empowering a worldwide community to live their very best life, enhanced by moments of connection and wellbeing. Tilray’s mission is to be the most responsible, trusted and market leading cannabis consumer products company in the world with a portfolio of innovative, high-quality and beloved brands that address the needs of the consumers, customers and patients we serve.
Our overall strategy is to leverage our brands, infrastructure, expertise and capabilities to drive market share in the industries in which we compete, achieve industry-leading, profitable growth and build sustainable, long-term shareholder value. In order to ensure the long-term sustainable growth of our Company, we continue to focus on developing strong capabilities in consumer insights, drive category management leadership and assess growth opportunities with the introduction of new products and entries into new geographies. In addition, we are relentlessly focused on managing our cost of goods and expenses in order to maintain our strong financial position.
Trends and Other Factors Affecting Our Business
Canadian cannabis market trends.
The cannabis industry in Canada continues to evolve at a rapid pace during the early periods following the federal legalization of adult-use cannabis. Through analysis of the current market conditions, the following key trends have emerged and are anticipated to influence the near-term future in the industry:
- | Price compression. We have historically seen price compression in the market, when compared to the prior fiscal year, which was driven by intense competition from the approximately 1,000 Licensed Producers in Canada. The price compression year over year has reduced the Company's revenue by approximately $32.8 million for the year ended May 31, 2023. |
- | Excise taxes. Given the impacts of the above-referenced price compression, excise tax has grown to become a larger component of net revenue as it is predominantly computed as a fixed price on grams sold rather than as a percentage of the selling price. The Cannabis Council of Canada has formed an Excise Task Force to present these challenges to the Ministry of Finance in Canada and continues to pursue reform. Additionally, as many as two-thirds of Canadian licensed producers had excise tax deficits owed, which they were unable to pay on time. The Company believes this will be a key element of potential consolidation in the industry and we believe long term there is a possibility of some level of reform but it will likely not occur in the next 12 months; |
- | Market share. Tilray continues to maintain its market leadership position in Canada and we experienced an increase in share from 8.1% to an 8.3% market share, from the immediately preceding quarter, as reported by Hifyre data for all provinces excluding Quebec where Weedcrawler was deemed more accurate. This increase in the final quarter of the year, was attributed to our relentless dedication to our innovation pipeline which we anticipate to keep driving market share increases in the coming fiscal year. This increase was offset by challenges in the province of Quebec during the year, which had a negative impact on adult-use revenue during the year. |
|
| Year Ended December 31, |
|
| 2018 vs 2017 Change |
|
| 2017 vs 2016 Change |
| |||||||||||||||||||
|
| 2018 |
|
| 2017 |
|
| 2016 |
|
| Qty/$ |
|
| % |
|
| Qty/$ |
|
| % |
| |||||||
Kilogram equivalents sold |
|
| 6,478 |
|
|
| 3,024 |
|
|
| 2,216 |
|
|
| 3,454 |
|
|
| 114 | % |
|
| 808 |
|
|
| 36 | % |
Kilograms harvested |
|
| 11,022 |
|
|
| 6,779 |
|
|
| 4,526 |
|
|
| 4,243 |
|
|
| 63 | % |
|
| 2,253 |
|
|
| 50 | % |
Average net selling price per gram |
| $ | 6.61 |
|
| $ | 6.52 |
|
| $ | 5.41 |
|
| $ | 0.09 |
|
|
| 1 | % |
| $ | 1.11 |
|
|
| 21 | % |
Average cost per gram sold |
| $ | 3.70 |
|
| $ | 2.84 |
|
| $ | 4.04 |
|
| $ | 0.86 |
|
|
| 30 | % |
| $ | (1.20 | ) |
|
| (30 | )% |
44
- | Change in potency preferences. Evolving consumer demand for higher potency products has caused a substantial shift in consumer purchasing patterns. We revised our flower strategy to remain innovative and evolve with the industry, launching a large volume of new beta flower strains in the current year which continue to be newly listed in the provinces during the remainder of the fiscal year to contend with this change in demand. |
Kilogram equivalents sold. We sell two product categories: (1) dried cannabis, which includes whole flower and ground flower and (2) cannabis extracts, which includes full-spectrum and purified oil drops and capsules. The latter products are converted to flower equivalent grams based
These identified trends have had impacts on the typecurrent period results of operations and number of dried cannabis grams required to produce extracted cannabisare discussed in greater detail in the form ofrespective section.
International cannabis oils. This conversion ratio is based on the amount of active cannabinoids in the products rather than the volume of oil. For example, our 40mL oil drops are converted to five gram equivalents.market trends.
Total kilogram equivalents sold increased for 2018 from 2017, primarily due to increased bulk, adult-use, and international medical sales.
The increasecannabis industry in kilogram sold during 2017 from 2016 was primarily driven by patient demandEurope is in its early stages of development whereby countries within Europe are at different stages of legalization of medical and growth of extract products.
Kilograms harvestedadult-use cannabis as some countries have expressed a clear political ambition to legalize adult-use cannabis (Germany, Portugal, Luxembourg and Czech Republic), some are engaging in an experiment for adult-use (Netherlands, Switzerland) and some are debating regulations for cannabinoid-based medicine (France, Spain, Italy, and the United Kingdom). Kilograms harvested representsIn Europe, we believe that, despite continuing recessionary economic conditions and the weight of dried whole plants post-harvest, dryingRussian conflict with Ukraine, cannabis legalization (both medicinal and curing. This operating metric is used to measure the production efficiency of our facilities and production team.
Total kilograms harvested increased for 2018 from 2017, primarily due to the additional operational capacity provided by our new facility High Park Farms brought into operations in 2018.
Total kilograms harvested increased for 2017 from 2016, primarily due to reaching full utilization at Tilray Canada Ltd. by the end of 2016 and increased production yields per harvest. Weadult-use) will continue to test numerous environmental variablesgain traction albeit more slowly than originally expected. We also continue to optimize strain-specific production yields.believe that Tilray remains uniquely positioned to maintain and gain significant market share in these markets with its infrastructure and its investments, which is comprised of two EU-GMP cultivation facilities within Europe located in Portugal and Germany, our distribution network and our demonstrated commitment to the availability, quality and safety of our cannabinoid-based medical products. Today, Germany remains the largest medical cannabis market in Europe.
Average net selling price per gram. The average net selling price per gram is an indicator that shows our pricing trends over time on a gram equivalent basis and is impacted by sales mix by channels and by product type. We exclude revenue associated with accessories and freight sales from revenue to arrive at cannabis-related revenue. We calculate average net selling price per gram by dividing cannabis-related revenue by kilogram equivalents sold.
The average net selling price per gram increased for year ended December 31, 2018 from 2017, due to shift in mix demandfollowing is a summary of our products. In 2018 there was significant revenue growth for our extract products compared to dried flower. We introduced several new extract products which increased extract revenue from 20% in 2017 to 50%the state of cannabis-related revenue in 2018. We expect our average selling price to decline over time as a result of a higher mix of products sold through Canadian adult-use channels through wholesale channels compared to Canadian medical, which is sold direct-to-patient.cannabis legalization within Europe:
The average net selling price per gram increased from 2016 to 2017, primarily due to the consistent production of high-potency dried flower and growth in extract sales.
To determine the Canadian dollar average net selling price per gram range above, revenue and costs are converted using the average exchange rate during the reporting period. All input costs are individually converted by multiplying the U.S. dollar to Canadian dollar rate to determine the Canadian dollar amount.
Average cost per gram soldGermany. The average cost per gram sold measuresnew coalition government led by chancellor Olaf Schulz declared its intention to legalize adult-use cannabis use, which aims to regulate the efficiency in ourcontrolled dispensing of cannabis for adult-use consumption. In late October 2022, the German government published key details of its plan to legalize and regulate adult-use cannabis, including what Health Minister Karl Lauterbach described as “complete” cultivation manufacturing and fulfillment operations. We deduct inventory adjustments andwithin the costcountry. Subsequently, Lauterbach announced that a first draft of sales related to accessories from total cost of sales to arrive at cannabis-related cost of sales. Cannabis-related cost of sales is then divided by total kilogram equivalents sold to calculate the average cost per gram sold.
The average cost per gram sold increased for 2018 from 2017, primarily due to sourcing product from other Licensed Producers as well as launching of our new cultivation facilities that were scaling up during 2018. High Park Farms manufactured adult use products until High Park Processing Facility received its license. This was temporary operation, as a result our manufacturing costs were higher and output was lower than our established manufacturing facilities. High Park Processing Facility received its licenseproposed regulations shall be issued in the first quarter of 2019. calendar year 2023, which will be evaluated by the European Union Commission in a formal notification procedure.
Recently, Mr. Lauterbach advised that the proposal had been revised and that the new plan is a two-part model, which appears to be designed in order to legalize cannabis as broadly as possibly without running afoul of European Union rules. On July 6, 2023, it was announced that the draft regulations pertaining to decriminalization, home cultivation and non-commercial “cultivation associations” (i.e., social clubs) had been finalized by the health ministry and was ready to be delivered to the German parliament.
We expectcontinue to see costs atbelieve that Tilray is well-positioned in Germany to provide consistent and sustainable cannabis products for the adult-use market whether only in-country cultivation is permitted or whether imports are also allowed given our Aphria RX facility located in Germany and our EU-GMP-certified production facility in Portugal, as well as our distribution platform, which provides us with access to 13,000 pharmacies in Germany.
Switzerland. In October 2021, Switzerland announced its intention to legalize cannabis by allowing production, cultivation, trade, and consumption. In the meantime, a three-year pilot project commenced on January 30, 2023, which permits selected participants to purchase cannabis for adult-use in various pharmacies in Basel, and more recently in Zurich, to conduct studies on the cannabis market and its impact on Swiss society. It is the first trial for the legal distribution of adult-use cannabis containing THC in Europe.
Spain. The Spanish Congress' Health Committee has recently approved a Medical Cannabis Report that paves the way for a government-sponsored bill on medical cannabis. The Report explicitly opens the door to standardized preparations other than the drugs already approved, highlighting their advantages in relation to safety, security and stability; as well as the possibility to prescribe medical cannabis in community pharmacies and not only in hospitals, favoring the access to the patients that may need it.
France. France launched a two-year pilot experiment to supply approximately 3,000 patients with medical cannabis. To date, 2,300 patients are enrolled in the experiment, which has been extended for another year and is now ending March 2024 in order to collect more data and to adopt a legal framework. The first results of the experimentation are positive. Several independent agencies have produced reports that show the effectiveness of medical cannabis, especially in situations of chronic pain.
Czech Republic. The Czech Republic has discussed plans to launch a fully regulated adult-use cannabis market in first half of calendar year 2023.
Malta. In 2021, became the first country in the European Union to legalize personal possession of the drug and permit private “cannabis clubs,” where members can grow and share the drug.
Beverage alcohol market trends.
The beverage alcohol category, while more established, continues to shift with changes in consumer trends for the craft industry. Specifically, based on IRI data for the last 10 weeks ended May 31, 2023, the US beer industry declined 0.6%, with craft beer down 2.7% during the same period SweetWater however, outperformed both the US craft beer market and the US beer industry in the same period as the brand grew 7.7% on total sales for multi-outlet. The Company anticipates continuing to grow its beer sales by expanding distribution points of its SweetWater, Green Flash, Alpine and Montauk brands as well as launching innovative products such as hard seltzers, rose beer, lager, hazy IPAs and pale ales to continue to be a market leader in the craft beer industry.
Breckenridge Distillery is a leader in the Colorado bourbon industry and continues to gain market share in both the vodka and gin markets. A primary growth objective is to continue expansion of market share across the United States, as well as expanding the national chains footprint, to maintain a double-digit annual top-line growth. To ensure continued growth in the future, the company is focused on expanding the marketing strategy, highlighting its quality products. Breckenridge Distillery’s commitment to quality has been recognized in recent awards by Whisky Magazine as the World's Best Blended, Best American Blended Malt, Best American Blended Limited Release, and Best American Blended. The overall bourbon market continues to grow, although competition from tequila and RTD’s remains a challenge. The integration of the national distributer agreement signed with RNDC in Fall 2022 has been slow, but will also be a growth driver for the business.
Wellness market trends.
Manitoba Harvest’s branded hemp business continued to expand its U.S. and Canadian leading market share position this facilityyear. These market share gains were offset by many customers reducing inventory levels amidst the current economic climate to conserve cash. During the year, the Company successfully expanded its Hemp Food portfolio into more accessible consumer formats and launched a breakthrough CBD wellness beverage, Happy Flower™. The Company will look to expand the Happy Flower™ brand with retail distribution into key markets, focusing on states with established CBD permissibility and sales momentum in future periods when this facility is operating at capacity.periods.
45Acquisitions, Strategic Transactions and Synergies
We strive to continue to expand our business on a consolidated basis, through a combination of organic growth and acquisition. While we continue to execute against our strategic initiatives that we believe will result in the long-term, sustainable growth and value to our stockholders, we continue to evaluate potential acquisitions and other strategic transactions of businesses that we believe complement our existing portfolio, infrastructure and capabilities or provide us with the opportunity to enter attractive new geographic markets and product categories as well as expand our existing capabilities. In 2017,addition, we have exited certain businesses and continue to evaluate certain businesses within our portfolio that are dilutive to profitability and cash flow. As a result, we incur transaction costs in connection with identifying and completing acquisitions and strategic transactions, as well as ongoing integration costs as we combine acquired companies and continue to achieve synergies, which is offset by income generated in connection with the execution of these transactions. For the year ended May 31, 2023, we incurred $1.6 million of transaction costs, net of recoveries.
Our acquisition and wind down strategy has had a material impact on the Company’s results in the current quarter and we expect will continue to persist into future periods generating accretive impacts for our stockholders. There are currently three primary cost saving initiatives as follows:
• | Tilray and HEXO strategic alliance and Arrangement Agreement: |
On July 12, 2022, Tilray acquired the HEXO Convertible Note from HTI and entered into a strategic alliance with HEXO Corp. (“HEXO”) as discussed in Note 11 (Convertible notes receivable) and Note 17 (Convertible debentures payable). In addition, Tilray and HEXO entered into various commercial transaction agreements, including (i) an advisory services agreement regarding Tilray’s provision of advisory services to HEXO in exchange for an $18 million annual advisory fee payable to Tilray; (ii) a co-manufacturing agreement providing for third-party manufacturing services between the parties and setting forth the terms of Tilray’s international bulk supply to HEXO; and (iii) a procurement and cost savings agreement for shared savings related to specified optimization activities, procurement, and other similar cost savings realized by the parties as a result of the foregoing commercial arrangements.
Through this strategic alliance, Tilray achieved substantial cash savings and production efficiencies. In the year ended May 31, 2023, the Company recognized $40.4 million of advisory services revenue included in Canadian adult-use cannabis revenue. Included in interest expense, net is $7.7 million of interest income for the year ended May 31, 2023. The Company earned $47.9 from this transaction during the year, which exceeded the initial target of $40 million to be earned during the first 12 month period in connection with the HEXO Convertible Note transaction.
On April 10, 2023, Tilray entered into an Arrangement Agreement to purchase 100% of the outstanding shares of HEXO to be satisfied through the issuance of 0.4352 of Tilray Common Stock for each outstanding HEXO share, see Note 30 (Subsequent events). The acquisition of HEXO builds on the successful strategic alliance between the two companies and positions Tilray for continued strong growth and market leadership in Canada, the largest federally legal cannabis market in the world. The company expects to realize $25 million of additional synergies over the first two years from the transaction close date.
• | Canadian Cannabis business cost reduction plan: |
During our fourth quarter of our fiscal year ended May 31, 2022, the Company launched a $30 million cost optimization plan of our existing cannabis business to solidify our position as an industry leading low-cost producer. The Company took decisive action to manage cash flow amid an evolving retail environment by identifying opportunities to leverage technology, supply chain, procurement, and packaging efficiencies while driving labor savings. During the year ended May 31, 2023, we have achieved $22 million of our cost optimization plan on an annualized run-rate basis of which $18.5 million represented actual cost savings during the period. The amount achieved is comprised of the following items:
- | Optimizing cultivation. We made impactful strides to right-size our cultivation footprint by maximizing our yield per plant and by honing the ability to flex production during optimal growing seasons to manage our cost to grow. |
- | Refining selling fees. We assessed our current product-to-market strategy to optimize our direct and controllable selling fees as a percentage of revenue without compromising our sales strategy on a go-forward basis. |
- | Reducing general and administrative costs. We remain focused on reducing operating expenses by leveraging innovative solutions to maintain a lean organization. We plan to further automate processes, reducing outside spend where efficient, and ensuring we are obtaining competitive pricing on our administrative services. |
• | International Cannabis business cost reduction plan: |
During our fiscal year ended May 31 2023, the Company launched an $8.0 million cost optimization plan for our international cannabis business to adapt to changing market dynamics and slower than anticipated legalization in Europe. During the year, the Company achieved an annualized run-rate basis of $6.2 million of cost savings. This was driven by the integration of our Distribution and European cannabis business for redundant costs including headcount consolidation in addition to optimization of our facility utilization.
• | Tilray-Aphria Arrangement Agreement: |
In connection with the Tilray-Aphria Arrangement Agreement, we committed to achieving $80 million, subsequently increased to $100 million, of synergies in connection with the integration of Tilray and Aphria and developed a robust plan and timeline to achieve such synergies. In executing our integration plan, we evaluated and optimized the organizational structure, evaluated and retained the talent and capabilities we identified as necessary to achieve our longer-term growth plan and vision, reviewed contracts and arrangements, and analyzed our supply chain and our strategic partnerships. Due to the Company’s actions in connection with the integration of Tilray and Aphria, during the prior fiscal year ended May 31, 2022, we exceeded the identified $80 million of cost synergies by $5 million and achieved such synergies ahead of our plan.
During the year ended May 31, 2023, the Company achieved the remaining $15 million of the targeted $100 million in cost-saving synergies on an annualized run-rate basis. While this milestone marks the completion of the Tilray and Aphria Arrangement Agreement synergy plan, the Company intends to continue to prioritize cost saving initiatives in the future while remaining committed to our growth plan and vision.
| • | Strategic transactions related to facility closures and exits: |
In connection with evaluating the profitability of our CC Pharma distribution business, Tilray decided to discontinue its partnership in a medical device reprocessing business given it was not core to CC Pharma's business and was both dilutive from a profitability and cash flow perspective. In connection with evaluating the profitability of our international cannabis business, Tilray also discontinued transactions with one of its customers in Israel to focus on markets which we believe are more accretive to our profitability and cash flow. In addition, Tilray terminated its relationship with a supplier in Uruguay due to a breach of the underlying contract. During the year ended May 31, 2023 the Company sold its interest in ASG Pharma Ltd., a wholly-owned subsidiary incorporated in Malta.
As a result of these strategic business decisions, there were the following impacts on the results for the year ended May 31, 2023 aggregating $9.3 million which increased our net loss, summarized as follows:
- | we recognized a one-time return adjustment of $3.1 million in our international cannabis revenue from a customer in Israel; |
- | we recognized a decrease in gross profit of $1.4 million which related to the above mentioned return from a customer in Israel; |
- | We recognized restructuring charges of $1.6 million of exit costs and $2.8 million for inventory adjustments from the termination of our producer partnership in Uruguay due to a breach of the underlying contract; |
- | there was an increase to office and general expenses of $1.6 million for a bad debt expense related to the aforementioned customer in Israel; and |
- | the Company recognized a $2.2 million of restructuring costs as a result of CC pharma discontinuing its partnership in the medical reprocessing business. |
- | the Company recognized a $0.3 million gain on the disposal of our investment in ASG Malta in other non-operating (loss) gain, net. |
The impacts of the items discussed in this section are assessed further in our analysis of the results of operations below.
Business Acquisitions
Acquisition of Montauk Brewing Company, Inc.
On November 7, 2022, Tilray acquired Montauk Brewing Company, Inc. (“Montauk”), a leading craft brewer company based in Montauk, New York. As consideration for the acquisition of Montauk, the Company paid after post closing adjustments of $35.1 million, which was paid with $28.7 million in cash and $6.4 million from the issuance of 1,708,521 shares of Tilray's common stock. In the event that Montauk achieves certain volume and/or EBITDA targets on or before December 31, 2025, the stockholders of Montauk shall be eligible to receive as additional contingent cash consideration of up to $18 million. The Company, determined that the closing date fair value of this contingent consideration was $10.2 million. In connection with this transaction, the Company is leveraging SweetWater’s existing nationwide infrastructure and Montauk’s northeast influence to significantly expand our distribution network and drive profitable growth in our beverage-alcohol segment. This distribution network is part of Tilray’s strategy to leverage our growing portfolio of CPG brands and ultimately to launch THC-based product adjacencies upon federal legalization in the U.S.
Results of Operations
Our consolidated results, in millions except for per share data, are as follows:
For the year ended May 31, | Change | Change | ||||||||||||||||||||||||||
(in thousands of U.S. dollars) | 2023 | 2022 | 2021 | 2023 vs. 2022 | 2022 vs. 2021 | |||||||||||||||||||||||
Net revenue | $ | 627,124 | $ | 628,372 | $ | 513,085 | (1,248 | ) | (0 | )% | 115,287 | 22 | % | |||||||||||||||
Cost of goods sold | 480,164 | 511,555 | 389,903 | (31,391 | ) | (6 | )% | 121,652 | 31 | % | ||||||||||||||||||
Gross profit | 146,960 | 116,817 | 123,182 | 30,143 | 26 | % | (6,365 | ) | (5 | )% | ||||||||||||||||||
Operating expenses: | ||||||||||||||||||||||||||||
General and administrative | 165,159 | 162,801 | 111,575 | 2,358 | 1 | % | 51,226 | 46 | % | |||||||||||||||||||
Selling | 34,840 | 34,926 | 26,576 | (86 | ) | (0 | )% | 8,350 | 31 | % | ||||||||||||||||||
Amortization | 93,489 | 115,191 | 35,221 | (21,702 | ) | (19 | )% | 79,970 | 227 | % | ||||||||||||||||||
Marketing and promotion | 30,937 | 30,934 | 17,539 | 3 | 0 | % | 13,395 | 76 | % | |||||||||||||||||||
Research and development | 682 | 1,518 | 830 | (836 | ) | (55 | )% | 688 | 83 | % | ||||||||||||||||||
Change in fair value of contingent consideration | 855 | (44,650 | ) | — | 45,505 | (102 | )% | (44,650 | ) | 0 | % | |||||||||||||||||
Impairments | 934,000 | 378,241 | — | 555,759 | 147 | % | 378,241 | 0 | % | |||||||||||||||||||
Other than temporary change in fair value of convertible notes receivable | 246,330 | — | — | 246,330 | 0 | % | - | 0 | % | |||||||||||||||||||
Litigation (recovery) costs | (505 | ) | 16,518 | 3,251 | (17,023 | ) | (103 | )% | 13,267 | 408 | % | |||||||||||||||||
Restructuring costs | 9,245 | 795 | — | 8,450 | 1,063 | % | 795 | 0 | % | |||||||||||||||||||
Transaction costs | 1,613 | 30,944 | 60,361 | (29,331 | ) | (95 | )% | (29,417 | ) | (49 | )% | |||||||||||||||||
Total operating expenses | 1,516,645 | 727,218 | 255,353 | 789,427 | 109 | % | 471,865 | 185 | % | |||||||||||||||||||
Operating loss | (1,369,685 | ) | (610,401 | ) | (132,171 | ) | (759,284 | ) | 124 | % | (478,230 | ) | 362 | % | ||||||||||||||
Interest expense, net | (13,587 | ) | (27,944 | ) | (27,977 | ) | 14,357 | (51 | )% | 33 | (0 | )% | ||||||||||||||||
Non-operating (expense) income, net | (66,909 | ) | 197,671 | (184,838 | ) | (264,580 | ) | (134 | )% | 382,509 | (207 | )% | ||||||||||||||||
Loss before income taxes | (1,450,181 | ) | (440,674 | ) | (344,986 | ) | (1,009,507 | ) | 229 | % | (95,688 | ) | 28 | % | ||||||||||||||
Income tax benefits, net | (7,181 | ) | (6,542 | ) | (8,972 | ) | (639 | ) | 10 | % | 2,430 | (27 | )% | |||||||||||||||
Net loss | $ | (1,443,000 | ) | $ | (434,132 | ) | $ | (336,014 | ) | (1,008,868 | ) | 232 | % | (98,118 | ) | 29 | % | |||||||||||
Use of Non-GAAP Measures
The Company reports its financial results in accordance with U.S. GAAP. However, throughout this Management’s Discussion and Analysis of Financial Condition and Results of Operations in this Annual Report on Form 10-K, we discuss non-GAAP financial measures, including reference to:
• | adjusted gross profit (excluding purchase price allocation (“PPA”) step up and inventory valuation allowance) for each reporting segment (Cannabis, Beverage alcohol, Distribution and Wellness), |
• | adjusted gross margin (excluding purchase price allocation (“PPA”) step up and inventory valuation allowance) for each reporting segment (Cannabis, Beverage alcohol, Distribution and Wellness), |
• | adjusted EBITDA, |
• | cash and marketable securities, and |
• | constant currency presentation of net revenue. |
All these non-GAAP financial measures should be considered in addition to, and not in lieu of, the financial measures calculated and presented in accordance with accounting principles generally accepted in the United States of America, (“GAAP”). These measures are presented to help investors’ overall understanding of our financial performance and should not be considered in isolated or as a substitute for, or superior to, the financial information prepared and presented in accordance with GAAP. Because non-GAAP financial measures are not standardized, it may not be possible to compare these financial measures with other companies' non-GAAP financial measures having the same or similar names. These non-GAAP financial measures reflect an additional way of viewing aspects of operations that, when viewed with U.S. GAAP results, provide a more complete understanding of the business. The Company strongly encourages investors and shareholders to review Company financial statements and publicly filed reports in their entirety and not to rely on any single financial measure. Please see “Reconciliation of Non-GAAP Financial Measures to GAAP Measures” below for a reconciliation of such non-GAAP Measures to the most directly comparable GAAP financial measures, as well as a discussion of our adjusted gross margin, adjusted gross profit and adjusted EBITDA measures and the calculation of such measures.
Constant Currency Presentation
We believe that this measure provides useful information to investors because it provides transparency to underlying performance in our consolidated net sales by excluding the effect that foreign currency exchange rate fluctuations have on period-to-period comparability given the volatility in foreign currency exchange markets. To present this information for historical periods, current period net sales for entities reporting in currencies other than the U.S. Dollar are translated into U.S. Dollars at the average costs per gram sold declinedmonthly exchange rates in effect during the corresponding period of the prior fiscal year rather than at the actual average monthly exchange rate in effect during the current period of the current fiscal year. As a result, the foreign currency impact is equal to the current year results in local currencies multiplied by 30% from 2016. The declinethe change in average cost per gram sold was primarily dueforeign currency exchange rate between the current fiscal period and the corresponding period of the prior fiscal year.
Cash and Marketable Securities
The Company combines the Cash and cash equivalent financial statement line item with the Marketable securities financial statement line item as an aggregate total as reconciled in the liquidity and capital resource section below. The Company’s management believes that this presentation provides useful information to Tilray Canada Ltd. reaching full capacitymanagement, analysts and increased production yields. investors regarding certain additional financial and business trends relating to its short-term liquidity position by combing these two GAAP metrics.
Operating Metrics and Non-GAAP Measures
We also drove efficiencies through automation inuse the following operating metrics and non-GAAP measures to evaluate our post-harvest processes across trimming, drying, extractionbusiness and fulfillment.
operations, measure our performance, identify trends affecting our business, project our future performance, and make strategic decisions. Other companies, including companies in our industry, may calculate keynon-GAAP measures and operating metrics with similar names differently which may reduce their usefulness as comparative measures.
Factors Impacting
For the years ended May 31, | ||||||||||||
(in thousands of U.S. dollars) | 2023 | 2022 | 2021 | |||||||||
Net cannabis revenue | $ | 220,430 | $ | 237,522 | $ | 201,392 | ||||||
Net beverage alcohol revenue | 95,093 | 71,492 | 28,599 | |||||||||
Distribution Revenue | 258,770 | 259,747 | 277,300 | |||||||||
Wellness revenue | 52,831 | 59,611 | 5,794 | |||||||||
Cannabis costs | 162,755 | 194,834 | 130,511 | |||||||||
Beverage alcohol costs | 48,770 | 32,033 | 12,687 | |||||||||
Distribution costs | 231,309 | 243,231 | 242,472 | |||||||||
Wellness costs | 37,330 | 41,457 | 4,233 | |||||||||
Total adjusted gross profit (excluding PPA step-up and inventory valuation adjustments) | 206,442 | 186,031 | 143,936 | |||||||||
Cannabis adjusted gross margin (excluding inventory valuation adjustments) | 51 | % | 43 | % | 45 | % | ||||||
Beverage alcohol adjusted gross margin (excluding PPA step-up) | 53 | % | 58 | % | 59 | % | ||||||
Distribution gross margin (excluding inventory valuation adjustments) | 11 | % | 9 | % | 13 | % | ||||||
Wellness gross margin | 29 | % | 30 | % | 27 | % | ||||||
Adjusted EBITDA | $ | 61,479 | $ | 48,047 | $ | 40,771 | ||||||
Cash and marketable securities | 448,529 | 415,909 | 488,466 | |||||||||
Working capital | $ | 340,050 | $ | 523,161 | $ | 482,368 | ||||||
(1) | Adjusted EBITDA, adjusted gross profit and adjusted gross margin for each of our segments are non-GAAP financial measures. See “Reconciliation of Non-GAAP Financial Measures to GAAP Measures” below for a reconciliation of these Non-GAAP Measures to our most comparable GAAP measure. |
Segment Reporting
Our reportable segments revenue is primarily comprised of revenues from our Businesscannabis, distribution, wellness and beverage alcohol operations, as follows:
We
For the year ended May 31, | Change | Change | ||||||||||||||||||||||||||
(in thousands of U.S. dollars) | 2023 | 2022 | 2021 | 2023 vs. 2022 | 2022 vs. 2021 | |||||||||||||||||||||||
Cannabis business | $ | 220,430 | $ | 237,522 | $ | 201,392 | $ | (17,092 | ) | (7 | )% | $ | 36,130 | 18 | % | |||||||||||||
Distribution business | 258,770 | 259,747 | 277,300 | (977 | ) | 0 | % | (17,553 | ) | (6 | )% | |||||||||||||||||
Beverage alcohol business | 95,093 | 71,492 | 28,599 | 23,601 | 33 | % | 42,893 | 150 | % | |||||||||||||||||||
Wellness business | 52,831 | 59,611 | 5,794 | (6,780 | ) | (11 | )% | 53,817 | 929 | % | ||||||||||||||||||
Total net revenue | $ | 627,124 | $ | 628,372 | $ | 513,085 | $ | (1,248 | ) | 0 | % | $ | 115,287 | 22 | % | |||||||||||||
Our reportable segments revenue reported in constant currency(1) are as follows:
For the year ended May 31, | Change | |||||||||||||||
as reported in constant currency | Change | % Change | ||||||||||||||
(in thousands of U.S. dollars) | 2023 | 2022 | 2023 vs. 2022 | |||||||||||||
Cannabis business | $ | 233,227 | $ | 237,522 | $ | (4,295 | ) | (2 | )% | |||||||
Distribution business | 285,115 | 259,747 | 25,368 | 10 | % | |||||||||||
Beverage alcohol business | 95,093 | 71,492 | 23,601 | 33 | % | |||||||||||
Wellness business | 54,429 | 59,611 | (5,182 | ) | (9 | )% | ||||||||||
Total net revenue | $ | 667,864 | $ | 628,372 | $ | 39,492 | 6 | % | ||||||||
Our geographic revenue is, as follows:
For the year ended May 31, | Change | Change | ||||||||||||||||||||||||||
(in thousands of U.S. dollars) | 2023 | 2022 | 2021 | 2023 vs. 2022 | 2022 vs. 2021 | |||||||||||||||||||||||
North America | $ | 324,645 | $ | 314,132 | $ | 229,120 | $ | 10,513 | 3 | % | $ | 85,012 | 37 | % | ||||||||||||||
EMEA | 284,567 | 296,911 | 279,062 | (12,344 | ) | (4 | )% | 17,849 | 6 | % | ||||||||||||||||||
Rest of World | 17,912 | 17,329 | 4,903 | 583 | 3 | % | 12,426 | 253 | % | |||||||||||||||||||
Total net revenue | $ | 627,124 | $ | 628,372 | $ | 513,085 | $ | (1,248 | ) | 0 | % | $ | 115,287 | 22 | % | |||||||||||||
Our geographic revenue in constant currency(1) is, as follows:
For the year ended May 31, | Change | |||||||||||||||
as reported in constant currency | Change | % Change | ||||||||||||||
(in thousands of U.S. dollars) | 2023 | 2022 | 2023 vs. 2022 | |||||||||||||
North America | $ | 335,243 | $ | 314,132 | $ | 21,111 | 7 | % | ||||||||
EMEA | 309,152 | 296,911 | 12,241 | 4 | % | |||||||||||
Rest of World | 23,469 | 17,329 | 6,140 | 35 | % | |||||||||||
Total net revenue | $ | 667,864 | $ | 628,372 | $ | 39,492 | 6 | % | ||||||||
Our geographic capital assets are, as follows:
For the year ended May 31, | Change | |||||||||||||||
(in thousands of U.S. dollars) | 2023 | 2022 | 2023 vs. 2022 | |||||||||||||
North America | $ | 319,173 | $ | 464,370 | $ | (145,197 | ) | (31 | )% | |||||||
EMEA | 107,131 | 119,409 | (12,278 | ) | (10 | )% | ||||||||||
Rest of World | 3,363 | 3,720 | (357 | ) | (10 | )% | ||||||||||
Total capital assets | $ | 429,667 | $ | 587,499 | $ | (157,832 | ) | (27 | )% | |||||||
Cannabis revenue
Cannabis revenue based on market channel is, as follows:
For the year ended May 31, | Change | Change | ||||||||||||||||||||||||||
(in thousands of US dollars) | 2023 | 2022 | 2021 | 2023 vs. 2022 | 2022 vs. 2021 | |||||||||||||||||||||||
Revenue from Canadian medical cannabis | $ | 25,000 | $ | 30,599 | $ | 25,539 | $ | (5,599 | ) | (18 | )% | $ | 5,060 | 20 | % | |||||||||||||
Revenue from Canadian adult-use cannabis | 214,319 | 209,501 | 222,930 | 4,818 | 2 | % | (13,429 | ) | (6 | )% | ||||||||||||||||||
Revenue from wholesale cannabis | 1,436 | 6,904 | 6,615 | (5,468 | ) | (79 | )% | 289 | 4 | % | ||||||||||||||||||
Revenue from international cannabis | 43,559 | 53,887 | 9,250 | (10,328 | ) | (19 | )% | 44,637 | 483 | % | ||||||||||||||||||
Total cannabis revenue | 284,314 | 300,891 | 264,334 | (16,577 | ) | (6 | )% | 36,557 | 14 | % | ||||||||||||||||||
Excise taxes | (63,884 | ) | (63,369 | ) | (62,942 | ) | (515 | ) | 1 | % | (427 | ) | 1 | % | ||||||||||||||
Total cannabis net revenue | $ | 220,430 | $ | 237,522 | $ | 201,392 | $ | (17,092 | ) | (7 | )% | $ | 36,130 | 18 | % | |||||||||||||
Cannabis revenue based on market channel in constant currency(1) is, as follows:
For the year ended May 31, | Change | |||||||||||||||
as reported in constant currency | Change | % Change | ||||||||||||||
(in thousands of US dollars) | 2023 | 2022 | 2023 vs. 2022 | |||||||||||||
Revenue from Canadian medical cannabis | $ | 26,612 | $ | 30,599 | $ | (3,987 | ) | (13 | )% | |||||||
Revenue from Canadian adult-use cannabis | 225,694 | 209,501 | 16,193 | 8 | % | |||||||||||
Revenue from wholesale cannabis | 1,529 | 6,904 | (5,375 | ) | (78 | )% | ||||||||||
Revenue from international cannabis | 47,434 | 53,887 | (6,453 | ) | (12 | )% | ||||||||||
Total cannabis revenue | 301,269 | 300,891 | 378 | 0 | % | |||||||||||
Excise taxes | (68,042 | ) | (63,369 | ) | (4,673 | ) | 7 | % | ||||||||
Total cannabis net revenue | $ | 233,227 | $ | 237,522 | $ | (4,295 | ) | (2 | )% | |||||||
(1) | The constant currency presentation of our Cannabis revenue based on market channel is a non-GAAP financial measure.See “Use of Non-GAAP Measures –Constant Currency Presentation” above for a discussion of these Non-GAAP Measures. |
Revenue from medical cannabis: Revenue from Canadian medical cannabis decreased 18% to $25.0 million for the year ended May 31, 2023, compared to revenue of $30.6 million for the year ended May 31, 2022. On a constant currency basis revenue from Canadian medical cannabis decreased to $26.6 million from $30.6 million for the year ended May 31, 2022. This decrease in revenue from medical cannabis is primarily driven by increased competition from the adult-use recreational market and its related price compression impacting the medical cannabis market.
Revenue from adult-use cannabis: During the year ended, May 31, 2023, our revenue from Canadian adult-use cannabis product increased 2% to $214.3 million compared to revenue of $209.5 million for the prior year. Due to the decline in the Canadian dollar, on a constant currency basis, our revenue from Canadian adult-use cannabis increased 8% to $225.7 million for the year ended May 31, 2023. Included in the current period results was the favorable impact of the HEXO arrangement which resulted in $40.4 million of advisory services revenue for the year ended May 31, 2023 that did not occur in the prior period comparative. This increase was offset by the negative impacts of price compression, challenges in the province of Quebec and change in potency preferences.
Wholesale cannabis revenue: Revenue from wholesale cannabis decreased to $1.4 million for the year ended May 31, 2023, compared to revenue of $6.9 million for the prior year same period which is consistent on a constant currency basis. The Company continues to believe that wholesale cannabis revenue will remain subject to quarter-to-quarter variability and is based on opportunistic sales.
International cannabis revenue: Revenue from international cannabis decreased to $43.6 million for the year ended May 31, 2023, compared to revenue of $53.9 million for the year ended May 31, 2022. Given the deterioration of the Euro against the U.S. Dollar in the quarter, on a constant currency basis, revenue from international cannabis decreased to $47.4 million from $53.9 million in the prior year same period. During the year, the Company recognized a one-time return adjustment of $3.1 million related to a customer in Israel. In addition, the Company had $9.8 million of revenue in the prior year to Israel, which did not repeat in the current period results given the challenging and severe deterioration of market conditions in Israel. These negative impacts were partially offset by expansion into other European countries that have legalized medical cannabis.
Distribution revenue
Revenue from Distribution operations decreased to $258.8 million for the year ended May 31, 2023 compared to revenue of $259.7 million for the prior year same period. Revenue was negatively impacted during year from the deterioration of the Euro against the U.S. Dollar, which when the impacts are eliminated on a constant currency basis, revenue increased to $285.1 million for the year ended May 31, 2023 when compared to prior year same period. However, this impact is offset by the impact of the flood that occurred in the comparative prior period and forced a business closure for approximately five days leading to a decrease in net revenue in the prior period of almost $5.0 million, which did not recur in the current year. Additionally, the Company is continuing to prioritize higher margin sales, and as a result of our focus on higher margin sales and capacity constraints, management believes in future periods we can continue to drive larger profit margins despite not increasing revenue in our distribution business as we approach full utilization of our facility.
Beverage alcohol revenue
Revenue from our Beverage operations increased to $95.1 million the year ended May 31, 2023, compared to revenue of $71.5 million for the prior year same period. The increase in the year relates primarily to our acquisition of Montauk on November 7, 2022.
Wellness revenue
Our Wellness revenue from Manitoba Harvest decreased to $52.8 million for the year ended May 31, 2023 compared to $59.6 million for the prior year same period. On a constant currency basis for the year ended May 31, 2023, Wellness revenue decreased to $54.4 million from $59.6 million. The decrease in revenue for the year related to continual changes of inventory management by one of our customers based on a warehousing strategy as well as a decline in sales velocity from a recent price increase required to protect our margin given the inflation on our ingredient costs.
Gross profit and gross margin
Our gross profit and gross margin for the years ended May 31, 2023, 2022 and 2021, is as follows, for our each of our operating segments:
(in thousands of U.S. dollars) | For the year ended May 31. | Change | Change | |||||||||||||||||
Cannabis | 2023 | 2022 | 2021 | 2023 vs. 2022 | 2022 vs. 2021 | |||||||||||||||
Net revenue | $ | 220,430 | $ | 237,522 | $ | 201,392 | $ | (17,092 | ) | $ | 36,130 | |||||||||
Cost of goods sold | 162,755 | 194,834 | 130,511 | (32,079 | ) | 64,323 | ||||||||||||||
Gross profit (loss) | 57,675 | 42,688 | 70,881 | 14,987 | (28,193 | ) | ||||||||||||||
Gross margin | 26 | % | 18 | % | 35 | % | 8 | % | -17 | % | ||||||||||
Inventory valuation adjustments | 55,000 | 59,500 | 19,919 | (4,500 | ) | 39,581 | ||||||||||||||
Adjusted gross profit (1) | 112,675 | 102,188 | 90,800 | 10,487 | 11,388 | |||||||||||||||
Adjusted gross margin (1) | 51 | % | 43 | % | 45 | % | 8 | % | -2 | % | ||||||||||
Distribution | ||||||||||||||||||||
Net revenue | 258,770 | 259,747 | 277,300 | (977 | ) | (17,553 | ) | |||||||||||||
Cost of goods sold | 231,309 | 243,231 | 242,472 | (11,922 | ) | 759 | ||||||||||||||
Gross profit | 27,461 | 16,516 | 34,828 | 10,945 | (18,312 | ) | ||||||||||||||
Gross margin | 11 | % | 6 | % | 13 | % | 5 | % | (7 | %) | ||||||||||
Inventory valuation adjustments | — | 7,500 | — | (7,500 | ) | 7,500 | ||||||||||||||
Adjusted gross profit (1) | 27,461 | 24,016 | 34,828 | 3,445 | (10,812 | ) | ||||||||||||||
Adjusted gross margin (1) | 11 | % | 9 | % | 13 | % | 2 | % | -4 | % | ||||||||||
Beverage alcohol | ||||||||||||||||||||
Net revenue | 95,093 | 71,492 | 28,599 | 23,601 | 42,893 | |||||||||||||||
Cost of goods sold | 48,770 | 32,033 | 12,687 | 16,737 | 19,346 | |||||||||||||||
Gross profit | 46,323 | 39,459 | 15,912 | 6,864 | 23,547 | |||||||||||||||
Gross margin | 49 | % | 55 | % | 56 | % | (6 | %) | (1 | %) | ||||||||||
Purchase price accounting step-up | 4,482 | 2,214 | 835 | 2,268 | 1,379 | |||||||||||||||
Adjusted gross profit (1) | 50,805 | 41,673 | 16,747 | 9,132 | 24,926 | |||||||||||||||
Adjusted gross margin (1) | 53 | % | 58 | % | 59 | % | -5 | % | -1 | % | ||||||||||
Wellness | ||||||||||||||||||||
Net revenue | 52,831 | 59,611 | 5,794 | (6,780 | ) | 53,817 | ||||||||||||||
Cost of goods sold | 37,330 | 41,457 | 4,233 | (4,127 | ) | 37,224 | ||||||||||||||
Gross profit | 15,501 | 18,154 | 1,561 | (2,653 | ) | 16,593 | ||||||||||||||
Gross margin | 29 | % | 30 | % | 27 | % | (1 | %) | 3 | % | ||||||||||
Total | ||||||||||||||||||||
Net revenue | 627,124 | 628,372 | 513,085 | (1,248 | ) | 115,287 | ||||||||||||||
Cost of goods sold | 480,164 | 511,555 | 389,903 | (31,391 | ) | 121,652 | ||||||||||||||
Gross profit (loss) | 146,960 | 116,817 | 123,182 | 30,143 | (6,365 | ) | ||||||||||||||
Gross margin | 23 | % | 19 | % | 24 | % | 4 | % | -5 | % | ||||||||||
Inventory valuation adjustments | 55,000 | 67,000 | 19,919 | (12,000 | ) | 47,081 | ||||||||||||||
Purchase price accounting step-up | 4,482 | 2,214 | 835 | 2,268 | 1,379 | |||||||||||||||
Adjusted gross profit (1) | $ | 206,442 | $ | 186,031 | $ | 143,936 | $ | 20,411 | $ | 42,095 | ||||||||||
Adjusted gross margin (1) | 33 | % | 30 | % | 28 | % | 3 | % | 2 | % | ||||||||||
(1) | Adjusted gross profit is our Gross profit (adjusted to exclude inventory valuation adjustment and purchase price accounting valuation step-up) and adjusted gross marginis our Gross margin (adjusted to exclude inventory valuation adjustment and purchase price accounting valuation step-up) and are non-GAAP financial measures. See “Reconciliation of Non-GAAP Financial Measures to GAAP Measures” for additional discussion regarding these non-GAAP measures. The Company’s management believes that adjusted gross profit and adjusted gross margin are useful to our management to evaluate our business and operations, measure our performance, identify trends affecting our business, project our future performance, and make strategic decisions. We do not consider adjusted gross profit and adjusted gross margin in isolation or as an alternative to financial measures determined in accordance with GAAP. |
Adjusted Gross Profit and Adjusted Gross Margin
Adjusted gross profit and adjusted gross margin are non-GAAP financial measures and may not be comparable to similar measures presented by other companies. Adjusted gross profit is our Gross profit (adjusted to exclude inventory valuation adjustment and purchase price accounting valuation step-up) and adjusted gross margin is our Gross margin (adjusted to exclude inventory valuation adjustment and purchase price accounting valuation step-up) and are non-GAAP financial measures. The Company’s management believes that adjusted gross profit and adjusted gross margin are useful to our management to evaluate our business and operations, measure our performance, identify trends affecting our business, project our future success will primarily dependperformance, and make strategic decisions. We do not consider adjusted gross profit and adjusted gross margin percentage in isolation or as an alternative to financial measures determined in accordance with GAAP.
Cannabis gross margin: Gross margin increased during the year ended May 31, 2023, to 26% from 18% for the prior year same periods. The largest impact in the change in cannabis gross margin was related to the non-cash inventory valuation adjustments that occurred in the current year which was higher in the prior year. Excluding these valuation adjustments, adjusted gross margin during the year ended May 31, 2023, increased to 51% from 43% when comparing the same prior year period. The largest impact on the following factors:
Global medical market expansion. We believe that we have a significant opportunity to capitalize oncurrent period adjusted gross margin is the inclusion of the $40.4 million of HEXO advisory fee revenue included in cannabis markets globally as medicalrevenue. When this revenue is excluded from this computation, our adjusted cannabis becomes legal in more markets. Medical cannabis is now authorized at the national or federal level in over 41 countries, and more than half of these countries have legalized or introduced significant reforms to their cannabis-use laws to broaden the scope of permitted use since the beginning of 2015. Over the past two years, we have established regional offices in Germany, Australia and Chile, and have invested significant resources in personnel, partnerships and in-country sales and marketing to build the foundation for new and existing export channels. Our productsgross margin would have been 40%. The reason for the decline in the year when excluding the impacts from HEXO is attributed to the impacts of price compression as well as a decrease in utilization of our cannabis facilities to manage demand requirements. Additionally, the Company recognized a one-time return as discussed in the international cannabis revenue section that reduced our top line revenue as well as a one-time inventory disposals incurred as exit costs from Israel for a combined impact of reducing gross profit by $1.4 million. Further impacting the decrease in the adjusted gross cannabis margin is a shift in strategic priorities to focus on pursuing cash flow generating activities. The Company has made availablethe business decision to lower production in 12 countries, and weour cannabis facilities as a result of slower than anticipated legalization globally. We will continue to explore market expansion opportunitiesprioritize reductions in operational costs as more countries legalize medical cannabis.we continue to assess additional potential cost saving initiatives.
Adult-use legalization
Distribution gross margin: Gross margin of 11% for the year ended May 31, 2023, increased from 6% the year ended May 31, 2022. The distribution gross margin for the year ended May 31, 2023, increased to 11% from the prior year's adjusted gross margin of 9%, which included a write-off of $7.5 million from excess inventory related to medicines purchased during the peak of the pandemic that occurred in Canada. prior period comparative figure and did not recur. The legalizationadjusted year over year increase relates to a change in product mix as the Company continues to focus on higher margin sales in the current year.
Beverage alcohol gross margin: Gross margin of adult-use cannabis49% for the year ended May 31, 2023, decreased from 55% the prior year ended May 31, 2022. Adjusted gross margin of 53% decreased in Canada representedthe year ended May 31, 2023, from 58% in the year ended May 31, 2022. The adjusted gross margin for Beverage alcohol was 53% in the year compared to 58% for the prior year. The decrease in beverage alcohol gross margin for the year is a significant opportunity for us,result of the Montauk acquisition that was not completed in the prior period comparison and the anticipated expansionBreckenridge acquisition which was only in two quarters of the adult-use cannabis market on or before October 17, 2019comparative period. Both acquired companies operate at a slightly lower margin than SweetWater, which contributed to include new form factors represents another significant opportunity. Our license under predecessor regulations allowed us to immediately participatethe decrease. Additionally, SweetWater has expanded operations in Colorado in the current period which has had negative impacts on the margin as it is still in the start-up phase.
Wellness gross margin: Gross margin of 29% for the year ended May 31, 2023, decreased from a gross margin of 30% for the year ended May 31, 2022. The decrease is related to the impacts of higher input costs of seed ingredients as a result of inflation. The Company increased prices in the second quarter to combat the impacts of this inflation and as a result the gross margin has remained overall consistent.
Operating expenses
For the year ended May 31, | Change | Change | ||||||||||||||||||||||||||
(in thousands of US dollars) | 2023 | 2022 | 2021 | 2023 vs. 2022 | 2022 vs. 2021 | |||||||||||||||||||||||
General and administrative | $ | 165,159 | $ | 162,801 | $ | 111,575 | $ | 2,358 | 1 | % | $ | 51,226 | 46 | % | ||||||||||||||
Selling | 34,840 | 34,926 | 26,576 | (86 | ) | (0 | )% | 8,350 | 31 | % | ||||||||||||||||||
Amortization | 93,489 | 115,191 | 35,221 | (21,702 | ) | (19 | )% | 79,970 | 227 | % | ||||||||||||||||||
Marketing and promotion | 30,937 | 30,934 | 17,539 | 3 | 0 | % | 13,395 | 76 | % | |||||||||||||||||||
Research and development | 682 | 1,518 | 830 | (836 | ) | (55 | )% | 688 | 83 | % | ||||||||||||||||||
Change in fair value of contingent consideration | 855 | (44,650 | ) | — | 45,505 | (102 | )% | (44,650 | ) | NM | ||||||||||||||||||
Impairments | 934,000 | 378,241 | — | 555,759 | 147 | % | 378,241 | NM | ||||||||||||||||||||
Other than temporary change in fair value of convertible notes receivable | 246,330 | — | — | 246,330 | NM | — | NM | |||||||||||||||||||||
Litigation (recovery) costs | (505 | ) | 16,518 | 3,251 | (17,023 | ) | (103 | )% | 13,267 | 408 | % | |||||||||||||||||
Restructuring costs | 9,245 | 795 | — | 8,450 | 1,063 | % | 795 | NM | ||||||||||||||||||||
Transaction costs | 1,613 | 30,944 | 60,361 | (29,331 | ) | (95 | )% | (29,417 | ) | (49 | )% | |||||||||||||||||
Total operating expenses | $ | 1,516,645 | $ | 727,218 | $ | 255,353 | $ | 789,427 | 109 | % | $ | 471,865 | 185 | % | ||||||||||||||
Total operating expenses for the year ended May 31, 2023, increased by $789.4 million to $1,516.6 million from $727.2 million as compared to prior year. Operating expenses are comprised of general and administrative, share-based compensation, selling, amortization, marketing and promotion, research and development, change in fair value of contingent consideration, impairments, litigation (recovery) costs, restructuring costs and transaction (income) costs. This increase was primarily a result of the non-cash impairments and changes in fair value of convertible notes receivable recorded in the period described in detail below.
General and administrative costs
For the year ended May 31, | Change | Change | ||||||||||||||||||||||||||
(in thousands of US dollars) | 2023 | 2022 | 2021 | 2023 vs. 2022 | 2022 vs. 2021 | |||||||||||||||||||||||
Executive compensation | $ | 13,655 | $ | 14,128 | $ | 8,645 | $ | (473 | ) | (3 | )% | $ | 5,483 | 63 | % | |||||||||||||
Office and general | 27,845 | 27,153 | 19,503 | 692 | 3 | % | 7,650 | 39 | % | |||||||||||||||||||
Salaries and wages | 57,228 | 51,693 | 37,126 | 5,535 | 11 | % | 14,567 | 39 | % | |||||||||||||||||||
Stock-based compensation | 39,595 | 35,994 | 17,351 | 3,601 | 10 | % | 18,643 | 107 | % | |||||||||||||||||||
Insurance | 12,033 | 17,536 | 12,257 | (5,503 | ) | (31 | )% | 5,279 | 43 | % | ||||||||||||||||||
Professional fees | 7,166 | 13,047 | 11,779 | (5,881 | ) | (45 | )% | 1,268 | 11 | % | ||||||||||||||||||
Gain on sale of capital assets | (48 | ) | (682 | ) | — | 634 | (93 | )% | (682 | ) | NM | |||||||||||||||||
Insurance proceeds | — | (4,032 | ) | — | 4,032 | (100 | )% | (4,032 | ) | NM | ||||||||||||||||||
Travel and accommodation | 4,530 | 4,203 | 2,711 | 327 | 8 | % | 1,492 | 55 | % | |||||||||||||||||||
Rent | 3,155 | 3,761 | 2,203 | (606 | ) | (16 | )% | 1,558 | 71 | % | ||||||||||||||||||
Total general and administrative costs | $ | 165,159 | $ | 162,801 | $ | 111,575 | $ | 2,358 | 1 | % | $ | 51,226 | 46 | % | ||||||||||||||
Executive compensation decreased by 3% in the year ended May 31, 2023 compared to $14.1 the prior year, primarily due to a minor changes in the executive team structure and otherwise remained consistent.
Office and general increased by 3% in the year ended May 31, 2023 compared to $27.2 the prior year, primarily due to the acquisition of Montauk, increased operations and some reclassification of other expenses during the period.
Salaries and wages increased 11% in the year ended May 31, 2023 compared to $51.7 the prior year. The increase is primarily due to additions associated with the inclusion of Breckenridge employees, who were partially included in the prior year and Montauk employees, who were not included in the prior year.
The Company recognized stock-based compensation expense of $39.6 million in the year ended May 31, 2023 compared to $36.0 million to the prior year. The increase is primarily driven by the increased number of employees and the accelerated vesting of certain elements of our stock-based compensation awards.
Insurance expenses decreased by 31% in the year ended May 31, 2023 compared to the prior year, due primarily to our revised directors and officers’ insurance policy. This item was a target of the Tilray-Aphria Arrangement Agreement synergies.
Professional fees decreased by 45% to $7.2 million in the year ended May 31, 2023 from $13.0 when compared to the prior year. This item was a target of the Tilray-Aphria Arrangement Agreement synergies which drove the large decrease in the year. As well, some of our charter amendment costs were recorded in transactions costs during the period.
The Company recognized $4.0 million in the year ended May 31, 2022 related to insurance recoveries under the business interruption and extra expense portions of CC Pharma’s property insurance and had no recoveries in 2023.
Selling costs
For the year ended May 31, 2023, the Company incurred selling costs of $34.8 million or 5.6% of revenue as compared to $34.9 or 5.6% of revenue in the prior year. These costs relate to third-party distributor commissions, shipping costs, Health Canada cannabis fees, and patient acquisition and maintenance costs. Patient acquisition and ongoing patient maintenance costs include funding to individual clinics to assist with additional costs incurred by clinics resulting from the education of patients using the Company’s products. The amount has remained consistent as a percentage of revenue on a year over year basis.
Amortization
The Company incurred non-production related amortization charges of $93.5 million for the year ended May 31, 2023 compared to $115.2 million in 2022. The decreased amortization is a result of the reduced intangible asset levels.
Marketing and promotion cost
For the year ended May 31, 2023, the Company incurred marketing and promotion costs of $30.9 million, as compared to $30.9 in the prior year. This amount has remained consistent period over period as marketing is not directly proportionate to sales and is discretionary.
Research and development
Research and development costs were $0.7 million in the year ended May 31, 2023, compared to $1.5 million in the prior year. Research and development costs relate to external costs associated with the development of new products.
Impairment
Based upon a combination of factors including a sustained decline in the Company’s market capitalization below the Company’s carrying value, coupled with challenging macro-economic conditions, most particularly the rising interest rate environment and slower than anticipated progress in global cannabis legalization, the Company concluded that it is more likely than not that indicators of impairment were present in the Company's third quarter ended February 28, 2023. Accordingly, the Company performed the applicable impairment tests by computing the fair value of each reporting segment by using the income approach, and a combination of the income approach and the market approach for all other asset categories identified to have indicators of impairment as summarized below. As a result the Company incurred a non-cash impairment expense for the year ended May 31, 2023 of $934.0 million which is comprised of the following components:
● | Capital asset impairments of $81.5 million on a production facility in Canada and $22.5 million on equipment which the Company has temporarily made idle in order to reduce cultivation costs and right-size the Company's production to align with current and projected demand, as references in Note 6 (Capital assets), and; |
● | Intangible asset impairments of $110.0 million on customer relationships & distribution channels, $55.0 million of its licenses, permits & applications and $40.0 million of its intellectual property, trademarks, knowhow & brands, as a result of the decline in market share in its Canadian cannabis with certain product lines and customers, as referenced in Note 8 (Intangible assets), and; |
● | Goodwill impairments of $603.5 million in cannabis goodwill and $15.0 million in wellness goodwill, as a result of the increased Company specific risk premium which was driven by increased borrowing rates and the decline of the company’s market capitalization, as referenced in Note 10 (Goodwill), and; |
● | Other current assets impairments of $6.5 million. |
This non-cash impairment expense has no impact on the Company’s compliance with debt covenants, its cash flows or available liquidity.
Other than temporary write-down of convertible notes receivable
During the year the Company recognized an other-than-temporary change in fair value, which resulted in a non-cash impairment expense of convertible notes receivable impairments of $128.6 million on the HEXO Convertible Notes Receivable due to changes in the HEXO share price and HEXO operations, which culminated in HEXO's assessment of a going concern issue primarily surrounding their ability to meet their minimum liquidity covenant and $117.8 million on the MedMen Convertible Notes due to the deterioration of capital market conditions from increased interest rates and recent delays in US Federal cannabis legalization, as referenced in Note 11 (Convertible Notes Receivable). Subsequent to year-end, the Company converted the HEXO Convertible Notes Receivable and acquired all the outstanding shares of HEXO, see Note 30 (Subsequent events).
Litigation costs
Litigation costs of ($0.5) million were expensed during the year ended May 31, 2023 compared to $16.5 million in the prior year. Litigation costs include fees and expenses incurred in connection with defending and settling ongoing litigation matters, net of any judgments or settlement recoveries received from third parties. See Note 27 (Commitments and Contingencies)for additional information on significant litigation matters.
Restructuring costs
In connection with executing our acquisition strategy and strategic transactions, the Company incurred non-recurring restructuring and exit costs associated with the integration efforts of these transactions. For the year ended May 31, 2023 and May 31, 2022 respectively, the Company incurred $9.2 million and $0.8 million of restructuring costs. The breakdown of the restructuring charges for the year ended May 31, 2023 are as follows:
In the year the Company incurred $2.7 million of expenses related to severance costs required to right size the Company's production to better align with current demand requirements. The Company also incurred $1.6 million of exit cost and $2.8 million for inventory adjustments from the termination of our producer partnership in Uruguay due to a breach of the underlying contract in our International cannabis business. Additionally, amounts related to the Tilray-Aphria arrangement agreement for the closure of our Canadian adult-use market upon legalizationcannabis facility in October 2018. We have invested, andEnniskillen were reclassified from transaction costs to restructuring costs during the quarter in the amount of $1.4 million. It is anticipated that there will continue to invest, significant resources into production capacity, brand development,be additional costs associated with this transaction until the resolution of our lease termination for our Enniskillen facility and the restructuring of Nanaimo facility are completed. The Company also incurred $2.2 million of write-offs from the exit of our medical device reprocessing business developmentin our distribution reporting segment. These one-time non-cash charges were a required exit cost as we determined this business venture was no longer accretive to our focus of being free cash flow positive and corporate infrastructure so that we can serveis not anticipated to have ongoing expenses.
Transaction costs
Items classified as transaction (income) costs are non-recurring in nature and correspond largely to our acquisitions, and synergy strategy. The decrease of 95% from $30.9 million in the prior year to $1.6 million in the current year is related to the following items:
• | the prior year included fees related to the MedMen transaction, and there are no further expected costs to be incurred unless the Triggering Event arises; |
• | we recognized a change in fair value of $18.3 million on the HTI Share Consideration's purchase price derivative as a result of an increase in our share price on the shares paid for the HEXO convertible note receivable Note 11 (Convertible notes receivable). This gain was payable to the Company from HTI and was collected in cash during the current year. This gain offsets the following items in the year and contributes to the year over year decrease in transaction costs, |
• | a non-reimbursed compensation payment of $5.0 million, as a result of the HEXO transaction; |
• | fees incurred for the Montauk acquisition in the current year which differed from the fees incurred for the Breckenridge acquisitions which occurred in the prior year; and | |
• | fees associated with amending our charter during the year. |
Non-operating income (expense), net
For the year ended May 31, | Change | Change | ||||||||||||||||||||||||||
(in thousands of US dollars) | 2023 | 2022 | 2021 | 2023 vs. 2022 | 2022 vs. 2021 | |||||||||||||||||||||||
Change in fair value of convertible debenture payable | $ | (43,651 | ) | $ | 163,670 | $ | (170,453 | ) | $ | (207,321 | ) | (127 | )% | $ | 334,123 | (196 | )% | |||||||||||
Change in fair value of warrant liability | 12,438 | 63,913 | 1,234 | (51,475 | ) | (81 | )% | 62,679 | 5,079 | % | ||||||||||||||||||
Foreign exchange loss | (25,535 | ) | (28,383 | ) | (22,347 | ) | 2,848 | (10 | )% | (6,036 | ) | 27 | % | |||||||||||||||
Loss on long-term investments | (2,190 | ) | (6,737 | ) | (2,352 | ) | 4,547 | (67 | )% | (4,385 | ) | 186 | % | |||||||||||||||
Other non-operating (losses) gains, net | (7,971 | ) | 5,208 | 9,080 | (13,179 | ) | (253 | )% | (3,872 | ) | (43 | )% | ||||||||||||||||
Total non-operating income (expense) | $ | (66,909 | ) | $ | 197,671 | $ | (184,838 | ) | $ | (264,580 | ) | (134 | )% | $ | 382,509 | (207 | )% | |||||||||||
For the year ended May 31, 2023, the Company recognized a gain on the change in fair value of its APHA 24 convertible debentures of ($43.7) million, compared to a loss on the change in fair value of $163.7 million for the prior year. The change is driven primarily by the changes in the Company’s share price and future adult-use marketthe change in Canada.
Expanding distribution channels. Historically, the vast majority of our revenue has been DTP in Canada through sales under the ACMPR. We have also generated revenue through wholesale to other Licensed Producers in Canada. With the passingtrading price of the Cannabis Actconvertible debentures. For the year ended May 31, 2023, the Company recognized a change in Canadafair value of its warrants of $12.4 million compared to a change in October 2018, wholesale distribution opportunities now exist, including finished, packaged goods. This has driven higher volume product sales, but resultedfair value of $63.9 million for the prior year. Furthermore, for the year ended May 31, 2023, the Company recognized a loss of ($25.5) million, resulting from the changes in lower margins.foreign exchange rates during the period, compared to a loss of ($28.4) million for the prior year, largely associated with the strengthening of the US dollar against the Canadian dollar. The remaining other losses relate to changes in fair value in the Company’s convertible notes receivable and long-term investments.
Reconciliation of Non-GAAP Financial Measures to GAAP Measures
Adjusted EBITDA
Adjusted EBITDA is a non-GAAP financial measure that does not have any standardized meaning prescribed by GAAP and may not be comparable to similar measures presented by other companies. The Company calculates adjusted EBITDA as net (loss) income before income taxes, interest expense, net, non-operating expense (income), net, amortization, stock-based compensation, change in fair value of contingent consideration, impairment, inventory valuation adjustments, purchase price accounting step up, facility start-up and closure costs, lease expense, litigation costs and transaction costs.
The Company’s management believes that this presentation provides useful information to management, analysts and investors regarding certain additional financial and business trends relating to its consolidated results of operations and financial condition before non-controlling interests. In most medical cannabis markets globally, medical cannabisaddition, management uses this measure for reviewing the financial results of the Company and as a component of performance-based executive compensation.
We do not consider adjusted EBITDA in isolation or as an alternative to financial measures determined in accordance with GAAP. The principal limitation of adjusted EBITDA is soldthat it excludes certain expenses and income that are required by GAAP to be recorded in traditional pharmaciesour consolidated financial statements. In addition, adjusted EBITDA is subject to inherent limitations as this metric reflects the exercise of judgment by management about which expenses and income are excluded or included in certain countries,determining adjusted EBITDA. In order to compensate for these limitations, management presents adjusted EBITDA in connection with GAAP results.
For the costyear ended May 31, 2023, adjusted EBITDA increased by $13.5 million to $61.5 million compared to $48.0 in the prior year.
For the year ended May 31, | Change | Change | ||||||||||||||||||||||||||
Adjusted EBITDA reconciliation: | 2023 | 2022 | 2021 | 2023 vs. 2022 | 2022 vs. 2021 | |||||||||||||||||||||||
Net (loss) income | $ | (1,443,000 | ) | $ | (434,132 | ) | $ | (336,014 | ) | $ | (1,008,868 | ) | 232 | % | $ | (98,118 | ) | 29 | % | |||||||||
Income tax benefits, net | (7,181 | ) | (6,542 | ) | (8,972 | ) | (639 | ) | 10 | % | 2,430 | (27 | )% | |||||||||||||||
Interest expense, net | 13,587 | 27,944 | 27,977 | (14,357 | ) | (51 | )% | (33 | ) | (0 | )% | |||||||||||||||||
Non-operating income (expense), net | 66,909 | (197,671 | ) | 184,838 | 264,580 | (134 | )% | (382,509 | ) | (207 | )% | |||||||||||||||||
Amortization | 130,149 | 154,592 | 67,832 | (24,443 | ) | (16 | )% | 86,760 | 128 | % | ||||||||||||||||||
Stock-based compensation | 39,595 | 35,994 | 17,351 | 3,601 | 10 | % | 18,643 | 107 | % | |||||||||||||||||||
Change in fair value of contingent consideration | 855 | (44,650 | ) | — | 45,505 | (102 | )% | (44,650 | ) | NM | ||||||||||||||||||
Impairments | 934,000 | 378,241 | — | 555,759 | 147 | % | 378,241 | NM | ||||||||||||||||||||
Other than temporary change in fair value of convertible notes receivable | 246,330 | — | — | 246,330 | NM | — | NM | |||||||||||||||||||||
Inventory valuation adjustments | 55,000 | 67,000 | 19,919 | (12,000 | ) | (18 | )% | 47,081 | 236 | % | ||||||||||||||||||
Purchase price accounting step-up | 4,482 | 2,214 | 835 | 2,268 | 102 | % | 1,379 | 165 | % | |||||||||||||||||||
Facility start-up and closure costs | 7,600 | 13,700 | 2,056 | (6,100 | ) | (45 | )% | 11,644 | 566 | % | ||||||||||||||||||
Lease expense | 2,800 | 3,100 | 1,337 | (300 | ) | (10 | )% | 1,763 | 132 | % | ||||||||||||||||||
Litigation (recovery) costs | (505 | ) | 16,518 | 3,251 | (17,023 | ) | (103 | )% | 13,267 | 408 | % | |||||||||||||||||
Restructuring costs | 9,245 | 795 | — | 8,450 | 1,063 | % | 795 | NM | ||||||||||||||||||||
Transaction costs | 1,613 | 30,944 | 60,361 | (29,331 | ) | (95 | )% | (29,417 | ) | (49 | )% | |||||||||||||||||
Adjusted EBITDA | $ | 61,479 | $ | 48,047 | $ | 40,771 | $ | 13,432 | 28 | % | $ | 7,276 | 18 | % | ||||||||||||||
Adjusted EBITDA should not be considered in isolation from, or as a substitute for, net loss. There are a number of limitations related to the consumer is reimbursed by public and private insurance companies. We expect that Canada ultimately will align with these practices.
Expanding capacity. At this early stageuse of the industry, we believe that it is beneficial to be vertically integrated and control our entire production process to generate consistency and quality on a large scale. As we expand into new and existing markets, we will need to invest significant resources into cultivation and production facilities, which may require us to raise additional capital.
New product innovation. We believe there is a significant market opportunity for non-combustible productsadjusted EBITDA as global medical markets mature. In certain developed cannabis markets, non-combustible products have surpassed dried flower on a market share basis. In 2016, 2017 and 2018, dried flower sales comprised 90%, 79%, 50% of cannabis-related revenue, respectively. We believe our success will depend on our ability to continually develop, introduce and expand non-combustible products and brands, which we believe will have higher gross margins compared to combustible products. According to data from Health Canada, overnet loss, the past four quarters ended September 30, 2018, dried cannabis sales had a compound quarterly growth rate, or CQGR, of 0.3% and cannabis oils had a CQGR of 14.4%.closest comparable GAAP measure. Adjusted EBITDA excludes:
46
• | Non-cash inventory valuation adjustments; |
• | Non-cash amortization expenses, although these are non-cash charges, the assets being depreciated and amortized may have to be replaced in the future; |
• | Stock-based compensation expenses, which has been, and will continue to be for the foreseeable future, a significant recurring expense in our business and an important part of our compensation strategy; |
• | Non-cash impairment charges, as the charges are not expected to be a recurring business activity; |
• | Non-cash other than temporary write-down of convertible notes receivable, as the charges are not expected to be a recurring business activity; |
• | Non-cash foreign exchange gains or losses, which accounts for the effect of both realized and unrealized foreign exchange transactions. Unrealized gains or losses represent foreign exchange revaluation of foreign denominated monetary assets and liabilities; |
• | Non-cash change in fair value of warrant liability; |
• | Interest expense, net; |
• | Costs incurred to start up new facilities such as Sweetwater Colorado, and to fund emerging market operations such as Malta and our German cultivation facilities and closure costs to run facilities through the wind-down of operations; |
• | Lease expense, to conform with competitors who report under IFRS; |
• | Transaction costs includes acquisition related expenses, which vary significantly by transactions and are excluded to evaluate ongoing operating results; |
• | Litigation (recovery) costs includes costs related to ongoing litigations, legal settlements and recoveries which are excluded to evaluate ongoing operating results; |
• | Restructuring costs; |
• | Amortization of purchase accounting step-up in inventory value included in costs of sales - product costs; and |
• | Current and deferred income tax expenses and recoveries, which are a significant recurring expense or recovery in our business in the future and reduce or increase cash available to us. |
Critical Accounting Policies and Significant Judgments and Estimates
Our consolidated financial statements are prepared in accordance with accounting principles generally accepted in the United States of America (“U.S. GAAP”). A detailed discussion of our significant accounting policies can be found in “PartPart II, Item 8.8, Note 2 – 3, “Summary of Significant Accounting Policies” to our consolidated financial statements,Policies”, and the impact and risks associated with our accounting policies are discussed throughout this Annual Report on Form 10‑K and in the notesNotes to the consolidated financial statements.Consolidated Financial Statements. We have identified certain policies and estimates as critical to our business operations and the understanding of our past or present results of operations related to (i) revenue recognitionlong-term investments and convertible notes receivable, (ii) estimated useful lives, impairment consideration and amortization of capital and intangible assets, (iii) stock-based compensation.compensation, (iv) business combinations, (v) convertible debentures and (vi) warrant liability. These policies and estimates are considered critical because they had a material impact, or they have the potential to have a material impact, on our consolidated financial statements and because they require us to make significant judgments, assumptions or estimates. We believe that the estimates, judgments and assumptions made when accounting for the items described below were reasonable, based on information available at the time they were made. Actual results could differ materially from these estimates.
Revenue
We generate revenues from the following channels:
(i) |
|
|
|
|
|
|
|
|
|
Our products currently include: whole flower, ground flower, broad-spectrum cannabis oils and capsules, purified cannabis oils and capsules and accessories.
We recognize revenue as earned when the four revenue recognition criteria have been met, which includes:
i) Existence of a persuasive evidence of an arrangement;
ii) Delivery of product to a customer;
iii) Fixed or determinable sales price; and
iv) Collection is reasonably assured.
Revenue is recognized when the control of the promised goods, through performance obligation, is transferred to the customer in an amount that reflects the consideration we expect to be entitled to in exchange for the performance obligations or as advisory services are provided. Payments received for the goods or services in advance of performance are recognized as a contract liability.
Excise taxes remitted to tax authorities are government-imposed excise taxes on cannabis and beer. Excise taxes are recorded as a reduction of sales in net revenue in the consolidated statements of operations and recognized as a current liability within accounts payable and other current liabilities on the consolidated balance sheets, with the liability subsequently reduced when the taxes are remitted to the tax authority.
In addition, amounts disclosed as net revenue are net of excise taxes, sales incentivestax, duty tax, allowances, discounts and returns, after allowancesrebates.
In determining the transaction price for the sale of goods, the Company considers the effects of variable consideration and the existence of significant financing components, if any.
Some contracts for the sale of goods may provide customers with a right of return, volume discount, bonuses for volume/quality achievement, or sales allowance. In addition, the Company may provide in certain circumstances, a retrospective price reduction to a customer based primarily on inventory movement. These items give rise to variable consideration. The Company uses the expected value method to estimate the variable consideration because this method best predicts the amount of variable consideration to which the Company will be entitled. The Company uses historical evidence, current information and forecasts to estimate the variable consideration. The Company reduces revenue and recognizes a contract liability equal to the amount expected to be refunded to the customer in the form of a future rebate or credit for a retrospective price reduction, representing its obligation to return the customer’s consideration. The estimate is updated at each reporting period date.
(ii) | Valuation of inventory |
Refer to Part II, Item 8, Note 3, “Summary of Significant Accounting Policies” for further details on our assurance program, veterans coverage programinventory cost policy. At the end of each reporting period, the Company performs an assessment of inventory and compassionate programs.
Medical cannabis is mainly sold direct-to-patients, through wholesale arrangements to Licensed Producersrecords write-downs for excess and through export sales to third-party international distributors, hospitals, pharmacies and patients. Revenue is recognizedobsolete inventories based on the contractual termsCompany’s estimated forecast of product demand, production requirements, market conditions, regulatory environment, and spoilage. Actual inventory losses may differ from management’s estimates and such differences could be material to the Company’s statements of financial position, statements of loss and comprehensive loss and statements of cash flows. Changes in the regulatory structure, lack of retail distribution locations or lack of consumer demand could result in future inventory reserves.
(iii) | Impairment of goodwill and indefinite-lived intangible assets |
Goodwill and indefinite-lived intangible assets are tested for impairment annually, or more frequently when events or circumstances indicate that impairment may have occurred. As part of the agreement, which can be upon shipment or deliveryimpairment evaluation, we may elect to the customer. In some instances, judgementperform an assessment of qualitative factors. If this qualitative assessment indicates that it is required in determining whether the customer is the distributor or the end patient using the four criteria noted above.
Cannabis for recreational adult use in Canada was legalized in October 2018. We have signed supply agreements with seven provinces and two territories. Revenue is recognized when title has transferred to the province and the province has assumed the risks and rewards of ownership. This typically occurs upon shipment or delivery to the customer, depending on the contractual terms. Revenues to the recreational market are recorded net of applicable reserves for these product returns.
Stock-based compensation
Stock-based compensation consists of non-cash costs formore likely than not that the fair value of the indefinite-lived intangible asset or the reporting unit (for goodwill) is less than its carrying value, a quantitative impairment test to compare the fair value to the carrying value is performed. An impairment charge is recorded if the carrying value exceeds the fair value. The assessment of whether an indication of impairment exists is performed at the end of each reporting period and requires the application of judgment, historical experience, and external and internal sources of information. We make estimates in determining the future cash flows and discount rates in the quantitative impairment test to compare the fair value to the carrying value.
(iv) | Stock-based compensation |
We measure and recognize compensation expenses for stock options and restricted stock units (“RSUs”) that are issued to employees, directors and consultants. The stock-based compensation expense is recognized over the expected life of the instrument.
47
Stock options
Compensation expense for stock-options is measured and recognized on a straight-line basis over the vesting period based on their grant date fair values. The fair value of stock options is estimated using the Black-Scholes option pricing model based on the date of grant. Forfeitures are estimated at the time of grant, and the Company revises these estimates in subsequent periods if there is a difference in actual forfeitures and the estimates.
The critical assumptions and estimates used in determining the fair value of stock-based compensation on the grant date include; fair value of common shares on the grant date, risk-free interest rate at the date of grant, share price volatility of comparable companies, and the expected term.
Compensation expense related to performance-based stock options are recorded over the estimated service period once the achievement of the performance-based milestone is considered probable. The probability of achieving a milestone is reviewed at each reporting date. If the achievement of the milestone is assessed as being probable, then compensation expense is recorded based on the portion of the service period elapsed to date with respect to that milestone, with a cumulative catch-up, net of estimated forfeitures. The remaining compensation expense for the particular milestone is recognized over the remaining estimated service period.
RSUs
Compensation expense for RSUs is measured and recognizedconsultants on a straight-line basis over the vesting period based on their grant date fair values. We estimate forfeitures for RSUs consistent with how they are estimated for stock options.
Components of Results of Operations
Revenue
Revenue is comprised of sales to patients through the medical program under the Cannabis Regulations, wholesale of bulk and finished product to other Licensed Producers under the Cannabis Regulations, wholesale of finished product to provinces and provincially regulated distributors under the Cannabis Act and applicable provincial legislation, and export sales to third-party distributors, hospitals, pharmacies and patients. Our products currently include: whole flower, ground flower, broad-spectrum cannabis oils and capsules, purified cannabis oils and capsules and accessories. Revenue is net of incentives, after discounts, returns and allowances for our assurance program and veterans coverage program.
Cost of sales
Cost of sales is mainly comprised of three categories: pre-harvest, post-harvest and shipment and fulfillment. Pre-harvest costs include labor and direct materials to grow cannabis, which includes water, electricity, nutrients, integrated pest management, growing supplies and allocated overhead. Post-harvest costs include costs associated with drying, trimming, blending, extraction, purification, quality testing and allocated overhead. Shipment and fulfillment costs include the costs of packaging, labelling, courier services and allocated overhead. Total cost of sales also includes cost of sales associated with accessories and inventory adjustments.
Research and development expenses
Research and development expenses consist of new product development, clinical trial expenses, study drug production, patient studies and surveys, pharmacokinetic studies, consultants and legal expenses. Research and development expenses also include process and systems engineering in both production and manufacturing aspects.
Sales and marketing expenses
Sales and marketing expenses primarily consist of personnel-related costs, including salaries, benefits, commissions for our employees engaged in physician and patient support, customer service and public relations. Sales and marketing expenses also include business development costs to support patient, physician, distributor, hospital, pharmacy and government relationships. Costs also include the development of branding, marketing, packaging and educational materials for adult-use market.
48
General and administrative expenses
General and administrative expenses consist of costs incurred in our corporate offices, primarily related to personnel costs, which include salaries, variable compensation and benefits. General and administrative costs also include audit, legal, tax and professional fees and governance costs associated with operating as a public company. Other expenses in this category include general support services and commercialization costs associated with the expansion of our business in North America, Europe, Latin America and Asia Pacific.
Stock-based compensation
Stock-Based Compensation consist of non-cash costs for the fair value of compensation chargesstock options on the date of grant using the Black-Scholes option pricing model. The fair value of RSUs is based on the share price as at the date of grant. We estimate forfeitures at the time of grant and revise these estimates in subsequent periods if actual forfeitures differ from those estimates.
Determining the estimated fair value at the grant date requires judgment in determining the appropriate valuation model and assumptions, including the fair value of common shares on the grant date, risk-free rate, volatility rate, annual dividend yield and the expected term. Volatility is estimated by using the historical volatility of the accounting acquirer and, other companies that we consider comparable and have trading and volatility history.
(v) | Business combinations and goodwill |
We use judgement in applying the acquisition method of accounting for business combinations and estimates to value contingent consideration, identifiable assets and liabilities assumed at the acquisition date. Estimates are used to determine cash flow projections, including the period of future benefit, and future growth and discount rates, among other factors. The values allocated to the acquired assets and liabilities assumed affect the amount of goodwill recorded on acquisition. Fair value of assets acquired and liabilities assumed is typically estimated using an income approach, which is based on the present value of future discounted cash flows. Significant estimates in the discounted cash flow model include the discount rate, rate of future revenue growth and profitability of the acquired business and working capital effects. The discount rate considers the relevant risk associated with the business-specific characteristics and the uncertainty related to the ability to achieve projected cash flows. These estimates and the resulting valuations require significant judgment. Management engages third party experts to assist in the valuation of material acquisitions.
(vi) | Convertible notes receivable |
Convertible notes receivables include various investments in which the Company has the right, or potential right to convert the indenture into common stock optionsshares of the investee and RSUsare classified as available-for-sale and are recorded at fair value. Unrealized gains and losses during the year, net of the related tax effect, are excluded from income and reflected in other comprehensive income (loss), and the cumulative effect is reported as a separate component of shareholders’ equity until realized. We use judgement to assess convertible notes receivables for impairment at each measurement date. Convertible notes receivables are impaired when a decline in fair value is determined to be other-than-temporary. If the cost of an investment exceeds its fair value, we evaluate, among other factors, general market conditions, credit quality of debt instrument issuers, and the duration and extent to which the fair value is less than cost. Once a decline in fair value is determined to be other-than-temporary, an impairment charge is recorded in the statements of loss and comprehensive loss and a new cost basis for the investment is established. We also evaluate whether there is a plan to sell the security, or it is more likely than not that we will be required to sell the security before recovery. If neither of the conditions exist, then only the portion of the impairment loss attributable to credit loss is recorded in the statements of net loss and the remaining amount is recorded in other comprehensive income (loss).
(vii) | Warrants |
Warrants are accounted for in accordance with applicable accounting guidance provided in ASC Topic 815, Derivatives and Hedging – Contracts in Entity's Own Equity (“ASC 815”), as either liabilities or as equity instruments depending on the specific terms of the warrant agreement. Our warrants are classified as liabilities and are recorded at fair value. The warrants are subject to re-measurement at each settlement date and at each balance sheet date and any change in fair value is recognized as a component of change in fair value of warrant liability in the statements of net loss and comprehensive loss. Transaction costs allocated to warrants that are issuedpresented as a liability are expensed immediately within transaction costs in the statements of net loss and comprehensive loss.
We estimate the fair value of the warrant liability using a Black-Scholes pricing model. We are required to employees, directorsmake assumptions and consultantsestimates in determining an appropriate risk-free interest rate, volatility, term, dividend yield, discount due to exercise restrictions, and the fair value of common stock. Any significant adjustments to the unobservable inputs would have a direct impact on the fair value of the warrant liability.
(viii) | Convertible debentures |
The Company accounts for its convertible debentures in accordance with ASC 470-20 Debt with Conversion and Other Options, whereby the convertible instrument is initially accounted for as a single unit of account, unless it contains a derivative that must be bifurcated from the host contract in accordance with ASC 815-15 Derivatives and Hedging – Embedded Derivatives or the substantial premium model in ASC 470-20 Debt – Debt with Conversion and Other Options applies. Where the substantial premium model applies, the premium is recorded in additional paid-in capital. The resulting debt discount is amortized over the period during which the convertible notes are expected life of the instrument.
Foreign exchange gains and losses, net
Foreign exchange gains and losses represent the gains or losses resulting from foreign currency transactions. Revenues and expenses denominated in foreign currencies were translated into U.S. dollars at the monthly average exchange rate for the period.
Interest expense, net
Interest expense is related to loans from convertible senior notes, a third-party mortgage on our Tilray Canada Ltd. property and Privateer Holdings debt facilities.
Income taxes
We are subject to income taxes in the jurisdictions where we operate or otherwise have a taxable presence. Consequently, income tax expense is driven by the allocation of taxable income to those jurisdictions. Activities performed in each jurisdiction impact the magnitude and timing of taxable events.
Results of Operations
Financial data is expressed in thousands of U.S. dollars.
49
Consolidated Statements of Net Loss Databe outstanding as additional non-cash interest expenses.
|
| Year Ended December 31, |
| |||||||||
|
| 2018 |
|
| 2017 |
|
| 2016 |
| |||
Revenue |
| $ | 43,130 |
|
| $ | 20,538 |
|
| $ | 12,644 |
|
Cost of sales |
|
| 28,855 |
|
|
| 9,161 |
|
|
| 9,974 |
|
Gross margin |
|
| 14,275 |
|
|
| 11,377 |
|
|
| 2,670 |
|
Research and development expenses |
|
| 4,264 |
|
|
| 3,171 |
|
|
| 1,136 |
|
Sales and marketing expenses |
|
| 15,366 |
|
|
| 7,164 |
|
|
| 3,599 |
|
General and administrative expenses |
|
| 31,307 |
|
|
| 8,401 |
|
|
| 4,890 |
|
Stock-based compensation expense |
|
| 20,988 |
|
|
| 139 |
|
|
| 94 |
|
Operating loss |
|
| (57,650 | ) |
|
| (7,498 | ) |
|
| (7,049 | ) |
Foreign exchange loss (gain), net |
|
| 7,234 |
|
|
| (1,363 | ) |
|
| (186 | ) |
Interest expense, net |
|
| 9,110 |
|
|
| 1,686 |
|
|
| 1,019 |
|
Other (income) expense, net |
|
| (1,820 | ) |
|
| (12 | ) |
|
| 1 |
|
Deferred income tax recovery |
|
| (4,485 | ) |
|
| — |
|
|
| — |
|
Current income tax expense |
|
| 34 |
|
|
| — |
|
|
| — |
|
Net loss |
| $ | (67,723 | ) |
| $ | (7,809 | ) |
| $ | (7,883 | ) |
Other Financial Data |
|
|
|
|
|
|
|
|
|
|
|
|
Adjusted EBITDA (1) |
| $ | (33,100 | ) |
| $ | (5,506 | ) |
| $ | (5,002 | ) |
|
| Year Ended December 31, |
| |||||||||
|
| 2018 |
|
| 2017 |
|
| 2016 |
| |||
(as a percentage of revenue) |
|
|
|
|
|
|
|
|
|
|
|
|
Revenue |
|
| 100 | % |
|
| 100 | % |
|
| 100 | % |
Cost of sales |
|
| 67 |
|
|
| 45 |
|
|
| 79 |
|
Gross margin |
|
| 33 |
|
|
| 55 |
|
|
| 21 |
|
Research and development expenses |
|
| 10 |
|
|
| 15 |
|
|
| 9 |
|
Sales and marketing expenses |
|
| 36 |
|
|
| 35 |
|
|
| 28 |
|
General and administrative expenses |
|
| 73 |
|
|
| 41 |
|
|
| 39 |
|
Stock-based compensation expense |
|
| 49 |
|
|
| 1 |
|
|
| 1 |
|
Operating loss |
|
| (134 | ) |
|
| (37 | ) |
|
| (56 | ) |
Foreign exchange loss (gain), net |
|
| 17 |
|
|
| (7 | ) |
|
| (1 | ) |
Interest expense, net |
|
| 21 |
|
|
| 8 |
|
|
| 8 |
|
Other (income) expense, net |
|
| (4 | ) |
| N/A |
|
| N/A |
| ||
Deferred income tax recovery |
|
| (10 | ) |
| N/A |
|
| N/A |
| ||
Current Income tax expense |
| N/A |
|
| N/A |
|
| N/A |
| |||
Net loss |
|
| (157 | )% |
|
| (38 | )% |
|
| (62 | )% |
Other Financial Data |
|
|
|
|
|
|
|
|
|
|
|
|
Adjusted EBITDA (1) |
|
| (77 | )% |
|
| (27 | )% |
|
| (40 | )% |
|
|
|
|
50
Revenue
|
| Year Ended December 31, |
|
|
|
| 2018 vs 2017 Change |
|
|
|
| 2017 vs 2016 Change |
| ||||||||||||||||||||||||||
|
| 2018 |
|
| 2017 |
|
| 2016 |
|
|
|
| $ |
|
| % |
|
|
|
| $ |
|
| % |
| ||||||||||||||
Revenue |
| $ |
| 43,130 |
|
| $ |
| 20,538 |
|
| $ |
| 12,644 |
|
|
|
| $ |
| 22,592 |
|
|
|
| 110 | % |
|
|
| $ |
| 7,894 |
|
|
|
| 62 | % |
Revenue was $43.1 million ($56.4 million CAD) in 2018, $20.5 million ($26.6 million CAD) in 2017, and $12.6 million ($16.9 million CAD) in 2016, respectively. Growth was driven by increased patient demand, ramp-up of production, new product introductions, bulk sales to other Licensed Producers, introduction of the adult-use market, and wholesale distribution in export markets. In January 2018, we launched high CBD oil drops, which helped drive extract sales in Canada. Our extract products revenue was $21.2 million ($26.4 million CAD) in 2018, and $4.0 million ($5.2 million CAD) in 2017 and $1.1 million ($1.6 million CAD) in 2016, respectively. On a percentage of revenue basis, extract products accounted for 49% of revenue for December 31, 2018, 19% in 2017 and 9% in 2016. On October 17, 2018 the adult-use market was launched in Canada and contributed $4.4 million ($5.9 million CAD) to our revenue growth, representing 10% of revenue in 2018. We expect Canadian adult-use revenues to be a greater percentage of total revenues for 2019 due to a full year of sales compared to 2018.
2017 revenue growth from 2016 was driven by increase in high potency products, bulk sales to other Licensed Producers and introduction of wholesale distribution in export markets.
The Canadian dollar revenue was derived using the average exchange rate during the reporting period. Amounts are individually converted by multiplying the U.S. dollar to Canadian dollar rate to determine the Canadian dollar amount.
Cost of sales and gross margin
|
| Year Ended December 31, |
|
| 2018 vs 2017 Change |
| 2017 vs 2016 Change |
|
| ||||||||||||||||||||||||
|
| 2018 |
|
| 2017 |
|
| 2016 |
|
| $ |
|
| % |
|
|
| $ |
|
| % |
|
| ||||||||||
Cost of sales |
| $ |
| 28,855 |
| $ |
| 9,161 |
| $ |
| 9,974 |
|
| $ |
| 19,694 |
|
|
| 215 |
| % |
| $ |
| (813 | ) |
|
| (8 | ) | % |
Gross margin |
|
|
| 14,275 |
|
|
| 11,377 |
|
|
| 2,670 |
|
|
|
| 2,898 |
|
|
| 25 |
|
|
|
|
| 8,707 |
|
|
| 326 |
|
|
Gross margin percentage |
|
|
| 33 | % |
|
| 55 | % |
|
| 21 | % |
|
|
|
|
|
|
|
|
|
|
|
|
|
|
|
|
|
|
|
|
Cost of sales increased in 2018 from the comparable period in 2017 primarily due to increased sales, the start-up of High Park Farms, a shift towards a mix of high THC and high CBD cultivars that have lower yields along with procurement of third-party supply. In mid-2018, we had our initial harvest of product at our High Park Farms facility and manufactured product. In 2017 our costs of sales decreased from the comparable period in 2016 due to Tilray Canada reaching full capacity and increased production yields.
Gross margin percentage decreased in 2018 from the comparable period in 2017 primarily due to our post-harvest costs per gram increasing due to procurement of third-party supply and low yields and low through put during the scaling of new facilities.
51
Operating Expenses
|
| Year Ended December 31, |
|
|
| 2018 vs 2017 Change |
|
|
| 2017 vs 2016 Change |
| |||||||||||||||||||
|
| 2018 |
|
| 2017 |
|
| 2016 |
|
|
| $ |
|
| % |
|
|
| $ |
|
| % |
| |||||||
Research and development expenses |
| $ | 4,264 |
|
| $ | 3,171 |
|
| $ | 1,136 |
|
|
| $ | 1,093 |
|
|
| 34 | % |
|
| $ | 2,035 |
|
|
| 179 | % |
Sales and marketing expenses |
|
| 15,366 |
|
|
| 7,164 |
|
|
| 3,599 |
|
|
|
| 8,202 |
|
|
| 114 |
|
|
|
| 3,565 |
|
|
| 99 |
|
General and administrative expenses |
|
| 31,307 |
|
|
| 8,401 |
|
|
| 4,890 |
|
|
|
| 22,906 |
|
|
| 273 |
|
|
|
| 3,511 |
|
|
| 72 |
|
Stock-based compensation expense |
|
| 20,988 |
|
|
| 139 |
|
|
| 94 |
|
|
|
| 20,849 |
|
| N/A |
|
|
|
| 45 |
|
|
| 48 |
| |
Total operating expenses |
| $ | 71,925 |
|
| $ | 18,875 |
|
| $ | 9,719 |
|
|
| $ | 53,050 |
|
|
| 281 | % |
|
| $ | 9,156 |
|
|
| 94 | % |
(as a percentage of revenue) |
|
|
|
|
|
|
|
|
|
|
|
|
|
|
|
|
|
|
|
|
|
|
|
|
|
|
|
|
|
|
Research and development expenses |
|
| 10 | % |
|
| 15 | % |
|
| 9 | % |
|
|
|
|
|
|
|
|
|
|
|
|
|
|
|
|
|
|
Sales and marketing expenses |
|
| 36 |
|
|
| 35 |
|
|
| 28 |
|
|
|
|
|
|
|
|
|
|
|
|
|
|
|
|
|
|
|
General and administrative expenses |
|
| 73 |
|
|
| 41 |
|
|
| 39 |
|
|
|
|
|
|
|
|
|
|
|
|
|
|
|
|
|
|
|
Stock-based compensation expense |
|
| 49 |
|
|
| 1 |
|
|
| 1 |
|
|
|
|
|
|
|
|
|
|
|
|
|
|
|
|
|
|
|
Total operating expenses |
|
| 167 | % |
|
| 92 | % |
|
| 77 | % |
|
|
|
|
|
|
|
|
|
|
|
|
|
|
|
|
|
|
N/A: Not a meaningful comparison
Research and development expenses increased year over year in 2018 and 2017 as compared to the prior years, primarily due to increase of new product initiatives and the production of drug for clinical trials. We expect our research and development expenses to increase as we pursue more clinical trial opportunities and continue to invest in developing non-combustible delivery formats and formulations.
Sales and marketing expenses increased in 2018 from the comparable period in 2017 primarily due to development of our Canadian adult-use sales and marketing team and the increase in headcount in Tilray Deutschland GmbH. In 2017, sales and marketing expenses increased from 2016 primarily due to increase in headcount to support global expansion with launching of Tilray Deutschland GmbH and Tilray Australia New Zealand Pty Ltd and expansion of our patient care team which works directly with our patients to onboard them and find the right product and dosage.
General and administrative expenses increased in 2018 and 2017 as compared to prior years primarily due to increases in professional fees related to legal, audit and human resources, IT services to support our growth, public company costs and expansion plans and costs incurred for the startup of the operations of our subsidiaries High Park Farms, Ltd., High Park Holdings, Ltd. and Tilray Portugal Unipessoal, Lda.
Stock-based compensation expense increased in 2018 as compared to 2017 primarily due to issuance of stock options, restricted stock units and certain IPO contingency triggers related to performance-based awards granted under our new 2018 Equity Incentive Plan, (the “New Plan”).
Foreign exchange loss (gain), net
Foreign exchange in 2018 was $7.2 million loss compared to $1.4 million gain in 2017 and $0.2 million gain in 2016. The loss in 2018 was driven by significantly larger cash balances held in Canadian currency and the rapid decline in Canadian currency compared to US currency. The increase in 2017 from 2016 was related to foreign currency transaction gains on our Privateer Holdings debt facilities.
Interest expense
Interest expense in 2018 was $9.1 million compared to $1.7 million in 2017 and $1.0 million in 2016. The increase in expense in 2018 from 2017 was primarily due to the addition of the $475 million in Convertible Senior Notes Due 2023 (“Convertible Notes”) that were issued in October 2018. In 2017 and 2016 interest expense was related to loans from a third-party mortgage on Tilray Canada, Ltd. and Privateer Holdings debt facilities. We expect an increase in interest expense in 2019 to reflect a full year of expense related to the Convertible Notes.
52
Net loss and Adjusted EBITDA
|
| Year Ended December 31, |
|
| 2018 vs 2017 Change |
| 2017 vs 2016 Change |
| ||||||||||||||||||
|
| 2018 |
|
| 2017 |
|
| 2016 |
|
| $ |
|
| % |
| $ |
|
| % |
| ||||||
Net loss |
| $ | (67,723 | ) |
| $ | (7,809 | ) |
| $ | (7,883 | ) |
| $ | (59,914 | ) |
| N/A |
| $ | 74 |
|
| NA |
| |
Adjusted EBITDA |
| $ | (33,100 | ) |
| $ | (5,506 | ) |
| $ | (5,002 | ) |
| $ | (27,594 | ) |
| N/A |
| $ | (504 | ) |
|
| 10 | % |
N/A: Not a meaningful comparison
|
| Year Ended December 31, |
| |||||||||
|
| 2018 |
|
| 2017 |
|
| 2016 |
| |||
Adjusted EBITDA reconciliation: |
|
|
|
|
|
|
|
|
|
|
|
|
Net loss |
| $ | (67,723 | ) |
| $ | (7,809 | ) |
| $ | (7,883 | ) |
Stock-based compensation expense |
|
| 20,988 |
|
|
| 139 |
|
|
| 94 |
|
Foreign exchange loss (gain), net |
|
| 7,234 |
|
|
| (1,363 | ) |
|
| (186 | ) |
Interest expense, net |
|
| 9,110 |
|
|
| 1,686 |
|
|
| 1,019 |
|
Other (income) expense, net |
|
| (1,820 | ) |
|
| (12 | ) |
|
| 1 |
|
Deferred income tax recovery |
|
| (4,485 | ) |
|
| — |
|
|
| — |
|
Current income tax expense |
|
| 34 |
|
|
| — |
|
|
| — |
|
Depreciation and amortization |
|
| 3,562 |
|
|
| 1,853 |
|
|
| 1,953 |
|
Adjusted EBITDA |
| $ | (33,100 | ) |
| $ | (5,506 | ) |
| $ | (5,002 | ) |
Net loss increased in 2018 from the comparable period in 2017 primarily due to an increase in operating expenses related to continued growth, the expansion of our international teams, interest related to our Convertible Notes, foreign exchange loss (gain), net, stock-based compensation expense and our IPO. Net loss remained relatively flat in 2017 compared to 2016, as the growth in gross profit was offset by the increase in operating expenses.
Adjusted EBITDA decreased in 2018 from the comparable period in 2017 primarily due increase in third-party purchases for product supply and increase in growth in our facility expansion of our international teams.
To supplement our consolidated financial statements, which are prepared and presented in accordance with U.S. generally accepted accounting principles, or GAAP, we use Adjusted EBITDA, as described below, to understand and evaluate our operating performance. Adjusted EBITDA, which may be different than similarly titled measures used by other companies, is presented to help investors’ overall understanding of our financial performance and should not be considered a substitute for, or superior to, the financial information prepared and presented in accordance with GAAP.
Adjusted EBITDA should not be considered in isolation from, or as a substitute for, net loss. There are a number of limitations related to the use of Adjusted EBITDA as compared to net loss, the closest comparable GAAP measure. Some of these limitations are that:
Adjusted EBITDA excludes certain recurring, non-cash charges such as depreciation and amortization and, although these are non-cash charges, the assets being depreciated and amortized may have to be replaced in the future;
Adjusted EBITDA excludes foreign exchange gains or losses, which accounts for the effect of both realized and unrealized foreign exchange transactions. Unrealized gains or losses represent foreign exchange revaluation of foreign denominated monetary assets and liabilities;
Adjusted EBITDA excludes stock-based compensation expense, which has been, and will continue to be for the foreseeable future, a significant recurring expense in our business and an important part of our compensation strategy;
53
Adjusted EBITDA does not reflect interest expense, which has been,Upon repurchase of convertible debt instruments, ASC 470-20 requires the issuer to allocate total settlement consideration, inclusive of transaction costs, amongst the liability and will continueequity components of the instrument based on the fair value of the liability component immediately prior to repurchase. The difference between the settlement consideration allocated to the liability component and the net carrying value of the liability component, including unamortized debt issuance costs, would be for the foreseeable future, a significant recurring expense in our business and reduces cash available to us;
Adjusted EBITDA does not reflect tax expense, which could be a significant recurring expense in our businessrecognized as gain (loss) on extinguishment of debt in the futurestatements of loss and reduces cash availablecomprehensive loss. The remaining settlement consideration allocated to us.the equity component would be recognized as a reduction of additional paid-in capital in the statements of financial position.
In 2018, we revisedFor convertible debentures with an embedded conversion feature that did not meet the definitionequity scope exception from derivative accounting pursuant to ASC 815-15, the Company elected the fair value option under ASC 825 Fair Value Measurements. When the fair value option is elected, the convertible debenture is initially recognized at fair value on the statements of Adjusted EBITDA to excludefinancial position and all subsequent changes in fair value, excluding the impact of deferredthe change in fair value related to instrument-specific credit risk are recorded in non-operating income tax recovery, which could be a significant recurring deferred(loss). The changes in fair value related to instrument-specific credit risk is recorded through other comprehensive income tax recovery in our business(loss). Transaction costs directly attributable to the issuance of the convertible debenture is immediately expensed in the future. Prior periodsstatements of loss and comprehensive loss.
New Standards and Interpretations Applicable Effective June 1, 2022
Refer to Part II, Item 8, Note 3, Significant Accounting Policies, of this Form 10-K for additional information on changes in accounting policies. There have been recastno new standards or interpretations applicable to reflect the change.Company during the year.
Liquidity and Capital Resources
As of December 31, 2018, we had
We actively manage our cash and cash equivalents of $487.3 millioninvestments in order to internally fund operating needs, make scheduled interest and short-term investments totaling $30.3 million, which were held for working capitalprincipal payments on our borrowings, and general corporate purposes. Our cash, cash equivalents, and short-term investments consist primarily of cash, money market funds, treasury bills, corporate bonds and commercial papers.
In February andmake acquisitions. On March 2018, we issued 7,794,042 shares of Series A preferred stock at $7.10 per share ($8.90 per share CAD) in exchange for cash gross proceeds of approximately $55.0 million ($69.1 million CAD) from third-party institutional investors.
In July 2018, we completed our IPO, whereby 10,350,000 shares of our Class 2 common stock were sold at a price of $17.00 per share ($22.45 per share CAD), which included 1,350,000 shares sold pursuant to the underwriters’ option to purchase additional shares. We received net proceeds of $163.7 million after deducting the underwriting discount.
In October 2018,3, 2022, we entered into an indenture relating toat the issuance of $475.0 million aggregate principal amount of Convertible Notes, which included $25.0 millionmarket offering arrangement (the "ATM Program") pursuant to which we offered and sold our common stock having an aggregate offering price of up to $400 million. The ATM Program was intended to strengthen our balance sheet and improve our liquidity position and was utilized to offer and sell common stock having a total of $400 million. The Company fully completed its sales of shares under the underwriters’ optionATM Program during the fiscal year. In addition, the Company issued additional convertible debentures payable (Note 17) to purchase an additional aggregate principal amount. Netpay off certain existing convertible debentures. We believe that existing cash, cash equivalents, short-term investments and cash generated by operations, together with received proceeds from the issuance were approximately $460.3 million, after deductingATM Program and access to external sources of funds, will be sufficient to meet our domestic and foreign capital needs for a short and long term outlook.
For the initial purchasers’ commissions and other fees and expenses payable by the Company.
Our primary need forCompany's short-term liquidity is to fund working capital requirements, capital expenditures, debt service obligations and for general corporate purposes. Our ability to fundwe are focused on generating positive cash flows from operations and make planned capital expenditures and debt service obligations depends on future operating performance andbeing free cash flows,flow positive. As a result of delays in legalization across multiple markets, management continues to reduce operations, headcount, as well as the elimination of other discretionary operational costs. Some of these actions may be less accretive to our Adjusted EBITDA in the short term, however we believe that they will be required for our liquidity aspirations in the near term future. Additionally, the Company continues to invest our excess cash in the short-term in marketable securities which are subjectcomprised of U.S. treasury bills and term deposits with major Canadian banks.
For the Company's long-term liquidity requirements, we will be focused on funding operations through profitable organic and inorganic growth through acquisitions. We may need to prevailing economic conditions and financial, business and other factors.take on additional debt or equity financing arrangements in order to achieve these ambitions on a long-term basis.
The following table sets forth the major components of our consolidated statements of cash flows for the periods presented:
|
| Year Ended December 31, |
| |||||||||
|
| 2018 |
|
| 2017 |
|
| 2016 |
| |||
Net cash used in operating activities |
| $ | (46,248 | ) |
| $ | (6,003 | ) |
| $ | (3,318 | ) |
Net cash used in investing activities |
|
| (98,620 | ) |
|
| (11,815 | ) |
|
| (1,025 | ) |
Net cash provided by financing activities |
|
| 630,998 |
|
|
| 12,235 |
|
|
| 10,919 |
|
Effect of foreign currency translation |
|
| (1,198 | ) |
|
| 375 |
|
|
| 226 |
|
Cash and cash equivalents, beginning of year |
|
| 2,323 |
|
|
| 7,531 |
|
|
| 729 |
|
Cash and cash equivalents, ending of year |
|
| 487,255 |
|
|
| 2,323 |
|
|
| 7,531 |
|
Increase (decrease) in cash and cash equivalents |
| $ | 484,932 |
|
| $ | (5,208 | ) |
| $ | 6,802 |
|
For the Year ended May 31, | Change | Change | ||||||||||||||||||||||||||
2023 | 2022 | 2021 | 2023 vs. 2022 | 2022 vs. 2021 | ||||||||||||||||||||||||
Net cash provided by (used in) operating activities | $ | 7,906 | $ | (177,262 | ) | $ | (44,717 | ) | $ | 185,168 | (104 | )% | $ | (132,545 | ) | 296 | % | |||||||||||
Net cash (used in) provided by investing activities | (285,111 | ) | (21,533 | ) | 46,105 | (263,578 | ) | 1,224 | % | (67,638 | ) | (147 | )% | |||||||||||||||
Net cash provided by financing activities | 70,158 | 128,196 | 124,308 | (58,038 | ) | (45 | )% | 3,888 | 3 | % | ||||||||||||||||||
Effect on cash of foreign currency translation | (2,230 | ) | (1,958 | ) | 2,124 | (272 | ) | 14 | % | (4,082 | ) | (192 | )% | |||||||||||||||
Cash and cash equivalents, beginning of period | 415,909 | 488,466 | 360,646 | (72,557 | ) | (15 | )% | 127,820 | (176 | )% | ||||||||||||||||||
Cash and cash equivalents, end of period | $ | 206,632 | $ | 415,909 | $ | 488,466 | $ | (209,277 | ) | -50 | % | $ | (72,557 | ) | 35 | % | ||||||||||||
Marketable securities | 241,897 | - | - | 241,897 | NM | - | NM | |||||||||||||||||||||
Cash and marketable securities | $ | 448,529 | $ | 415,909 | $ | 488,466 | $ | 32,620 | 8 | % | $ | (72,557 | ) | (222 | )% | |||||||||||||
Cash flows from operating activities
The changesimprovement in net cash usedprovided by operating activities in 2018of $7.9 million during the year ended May 31, 2023, compared to 2017 was primarily due to an increasethe net cash used in operating costsactivities of $177.3 million in the prior year same period is primarily related to expand cultivation facilities, enter new marketsimproved operating efficiencies realized through our synergy and public company costs. The changes in operatingcost optimization programs, improved management of our working capital requirements, the $18.3 million of the cash in 2017 compared to 2016 were primarily due to increased levelscollected from the HTI Share Consideration’s purchase price derivative and the $33.0 million of working capital.cash received from the SLC Settlement.
54
Cash flows from investing activities
The changesincrease in net cash used in investing activities to $285.1 million from $21.5 million in 20182023 compared to 2017 was2022 changed primarily due to an increase in investments purchased using proceeds from the Convertible Notes$243.1 million purchase of marketable securities and IPO as well as capital expendituresthe $26.7 million for expansionour acquisition of cultivation and production assets. The changes in net cash used in investing activities in 2017 compared to 2016 was primarily due to capital expenditures related to the construction of High Park Farms facility.Montauk Brewing Company.
Cash flows from financing activities
The changesdecrease in net cash provided by financing activities to $70.2 million from $128.2 million in 2018 compare2023 compared to 2017 includes net proceeds2022 is primarily due to less funds received from our Convertible Notes, Series A preferred stockthe ATM financing IPOcompleted in fiscal year 2023, and repaymentthe early payment on the Company’s convertible debentures of $187.4 million in fiscal year 2023 compared to $88.0 million in fiscal year 2022, offset by the convertible debt facilities.financing for $145.1 million completed in fiscal year 2023 that did not occur in fiscal year 2022.
Cash resources and working capital requirements
The table below sets outCompany constantly monitors and manages its cash flows to assess the liquidity necessary to fund operations. As of May 31, 2023, the Company maintained $448.5 million of cash and cash equivalents inventoryon hand and contractual obligationsmarketable securities, compared to $415.9 million in cash and commitments:cash equivalents at May 31, 2022.
|
| As of December 31, |
|
| As of December 31, |
| ||
|
| 2018 |
|
| 2017 |
| ||
Cash and cash equivalents |
| $ | 487,255 |
|
| $ | 2,323 |
|
Short-term investments |
|
| 30,335 |
|
|
| — |
|
Inventory |
|
| 16,211 |
|
|
| 7,421 |
|
Privateer Holdings debt facilities |
|
| — |
|
|
| 32,826 |
|
Current portion of long-term debt |
|
| — |
|
|
| 9,432 |
|
|
|
|
|
|
|
|
|
|
Working capital provides funds for the Company to meet its operational and capital requirements. As of May 31, 2023, the Company maintained working capital of $340.1 million. We primarily havehistorically financed our operations through the issuance of common stock, sale of convertible notes and preferred stock, revenue generating activities, advances under the Privateer Holdings credit facility and the private placement of our Convertible Notes. We believe that our existing cash will be sufficient to meet our working capital requirements.
We manage our liquidity risk by preparing budgets and cash forecasts to ensure we have sufficient funds to meet obligations. In managing working capital, we may limit the amount of our cash needs by: selling inventory at wholesale rates, pursuing additional financing sources and managing the timing of capital expenditures.activities. While we believe we have sufficient cash to meet existing working capital requirements in the short term, we may need additional sources of capital and/or financing, to meet plannedour U.S. growth requirementsambitions, expansion of our international operations and to fund construction activities at our cultivation and processing facilities.
Contractual Obligations and Commitments
The following table reflects our future non-cancellable minimum contractual commitments as of December 31, 2018:other strategic transactions.
|
|
|
|
|
| Payments due by period |
| |||||||||||||
|
|
|
|
|
| <1 Year |
|
| 1-3 Years |
|
| 4-5 Years |
|
| > 5 Years |
| ||||
Operating leases |
| $ | 4,971 |
|
| $ | 916 |
|
| $ | 1,584 |
|
| $ | 1,099 |
|
| $ | 1,372 |
|
Capital leases |
|
| 3,115 |
|
|
| 733 |
|
|
| 1,466 |
|
|
| 916 |
|
|
| — |
|
Convertible senior notes due 2023 |
|
| 475,000 |
|
|
| — |
|
|
| — |
|
|
| — |
|
|
| 475,000 |
|
Total |
| $ | 483,086 |
|
| $ | 1,649 |
|
| $ | 3,050 |
|
| $ | 2,015 |
|
| $ | 476,372 |
|
In December 2018, we signed an agreementContractual obligations
We lease various facilities, under non-cancelable operating leases, which expire at various dates through September 2040:
Operating | ||||
leases | ||||
2024 | $ | 4,106 | ||
2025 | 3,295 | |||
2026 | 3,486 | |||
2027 | 3,412 | |||
Thereafter | 4,012 | |||
Total minimum lease payments | $ | 18,311 | ||
Imputed interest | (7,952 | ) | ||
Obligations recognized | $ | 10,359 | ||
Purchase and other commitments
The Company has payments for long-term debt, convertible debentures, material purchase commitments and constructions commitments, as follows:
Total | 2024 | 2025 | 2026 | 2027 | Thereafter | |||||||||||||||||||
Long-term debt repayment | $ | 161,707 | $ | 24,080 | $ | 14,208 | $ | 41,798 | $ | 10,522 | $ | 71,099 | ||||||||||||
Convertible notes payable | 464,070 | 177,330 | 136,740 | — | — | 150,000 | ||||||||||||||||||
Material purchase obligations | 24,468 | 18,726 | 5,140 | 602 | — | — | ||||||||||||||||||
Construction commitments | 8,410 | 8,410 | — | — | — | — | ||||||||||||||||||
Total | $ | 658,655 | $ | 228,546 | $ | 156,088 | $ | 42,400 | $ | 10,522 | $ | 221,099 | ||||||||||||
Except as disclosed elsewhere in this Part II, Item 7, Management’s Discussion and Analysis of Financial Condition and Results of Operations, there have been no material changes with Rose Lifescience, Inc.,respect to the contractual obligations of the Company during the year-to-date period except for distribution and marketing of our product in Quebec in exchange for minimum fees of $0.5 million per annum for an initial term of five years.those related to the Company’s acquisitions.
55
Contingencies
In the normal course of business, we may receive inquiries or become involved in legal disputes regarding various litigation matters. In the opinion of management, any potential liabilities resulting from such claims would not have a material adverse effect on our consolidated financial statements.
Segment and Geographic Information
For segment and geographic information refer to “Part II, Item 8. Note 19 – Business Segment Information” to our annual report.
Emerging Growth Company Status
We are an “emerging growth company” as defined in Section 2(a) of the Exchange Act, as modified by the Jumpstart Our Business Start-ups Act of 2012, or the JOBS Act. The JOBS Act provides that an emerging growth company can take advantage of the extended transition period provided in Section 13(a) of the Exchange Act for complying with new or revised accounting standards applicable to public companies. We have elected to take advantage of this extended transition period and as a result of this election, our financial statements may not be comparable to companies that comply with public company effective dates. We may take advantage of these exemptions up until the last day of the fiscal year following the fifth anniversary of our IPO or such earlier time that we are no longer an emerging growth company. We would cease to be an emerging growth company if we have more than $1.07 billion in annual revenue, have more than $700 million in market value of our stock held by non-affiliates (and we have been a public company for at least 12 months, and have filed one annual report on Form 10-K), or we issue more than $1.0 billion of non-convertible debt securities over a three-year period.
Off-Balance Sheet Arrangements
We did not have during the periods presented, and we do not currently have, any off-balance sheet arrangements, as defined in the rules and regulations of the SEC.
Refer to the Exhibit 21.1 for listing of the Company’s subsidiaries, which also includes entities acquired and/or created in 2019.
Recently Issued Accounting Pronouncements
A description of recently issued accounting pronouncements that may potentially impact our financial position and results of operations is disclosed in “Part II, Item 8. Note 2 – Summary of Significant Accounting Policies” to our consolidated financial statements appearing elsewhere in this Annual Report on Form 10-K.
Item 7A. Quantitative and Qualitative Disclosures About Market Risk.
Interest Rate Risk
InterestThe Company has exposure to the following risks from its use of financial instruments: credit; liquidity; currency rate; and, interest rate price.
(a) | Credit risk |
Credit risk is the risk of financial loss to the Company if a customer or counterparty to a financial instrument fails to meet its contractual obligations. The maximum credit exposure at May 31, 2023, is the carrying amount of cash and cash equivalents, accounts receivable, prepaids and other current assets and convertible notes receivable. All cash and cash equivalents are placed with major financial institutions in Canada, Australia, Portugal, Germany, Colombia, Argentina and the United States.To date, the Company has not experienced any losses on its cash deposits. Accounts receivable are unsecured, and the Company does not require collateral from its customers.
(b) | Liquidity risk |
As at May 31, 2023, the Company’s financial liabilities consist of bank indebtedness and accounts payable and accrued liabilities, which have contractual maturity dates within one-year, long-term debt, and convertible debentures which have contractual maturities over the next five years.
The Company maintains debt service charge and leverage covenants on certain loans secured by its Aphria Diamond facilities and 420 that are measured quarterly. The Company believes that it has sufficient operating room with respect to its financial covenants for the value or yieldnext fiscal year and does not anticipate being in breach of fixed-income investments may decline if interest rates change. Fluctuations in interest rates may impact the levelany of income and expense recordedits financial covenants.
The Company manages its liquidity risk by reviewing its capital requirements on an ongoing basis. Based on the Company’s cash equivalent, short-term investments, convertible note and the market value of all interest-earning assets, other than those which possessworking capital position at May 31, 2023, management regards liquidity risk to be low.
(c) | Currency rate risk |
As at May 31, 2023, a short term to maturity. A 10% change in the interest rate in effect on December 31, 2018 would not have a material effect on i) fair value of our cash equivalents and short-term investments as the majority of the portfolio have a maturity date of three-months or less, and ii) interest income as interest income is not a significant componentportion of the Company’s earningsfinancial assets and liabilities held in Canadian dollars and Euros consist of cash and cash flow. In addition,equivalents, convertible notes receivable, and long-term investments. The Company’s objective in managing its foreign currency risk is to minimize its net exposure to foreign currency cash flows by transacting, to the Convertible Notes bear interest at a fixed rate of 5% and are not publicly traded. Therefore, fair value of the Convertible Notes and interest expense is not affected by changesgreatest extent possible, with third parties in the market interest rates.
56
Equity Price Risks
As of December 31, 2018, we held long-term investments classified as either available-for-sale or cost method investments.functional currency. The fair values of the available-for-sale investment in equities fluctuate based on changes in the stock prices. These investment in equities were acquired as part of the Company’s strategic transactions.
Accordingly, the changes in fair values of investment in equities under the available-for-sale investments are recognized through other comprehensive income. Based on the fair value of investment in equities held as of December 31, 2018, a hypothetical decrease of 10% in the prices for these companies would reduce the fair values of the investments and result in unrealized loss recordedCompany is exposed to currency rate risk in other comprehensive income, by $185,000. We did not hold any investments classified as either available-for-sale or cost method investments in 2017.
Foreign Currency Risk
Our consolidated financial statements are expressed in U.S. dollars, but we have net assets and liabilities denominated in Canadian dollars, Euro, Australian dollars and Chilean dollars. As a result, we are exposedrelating to foreign currency translation gains and losses. Revenue and expensessubsidiaries which operate in a foreign currency. The Company does not currently use foreign exchange contracts to hedge its exposure of all foreign operations are translated into U.S. dollars at theits foreign currency exchangecash flows as management has determined that this risk is not significant at this point in time.
(d) | Interest rate price risk |
The Company’s exposure to changes in interest rates that approximate the rates in effect at the dates when such items are recognized. Appreciating foreign currencies relativerelates primarily to the U.S. dollar will adversely impact operating incomeCompany’s outstanding debt. The Company manages interest rate risk by restricting the type of investments and net earnings, while depreciating foreign currencies relativevarying the terms of maturity and issuers of marketable securities. Varying the terms to maturity reduces the sensitivity of the portfolio to the U.S. dollar will have a positive impact.
A 10% change in the exchange rates for the foreign currencies would affect the carrying valueimpact of net assets by approximately $2,817 as of December 31, 2018, with a corresponding impact to accumulated other comprehensive income. We have not historically engaged in hedging transactions and do not currently contemplate engaging in hedging transactions to mitigate foreign exchange risks. As we continue to recognize gains and losses in foreign currency transactions, depending upon changes in future currency rates, such gains or losses could have a significant, and potentially adverse, effect on our results of operations.interest rate fluctuations.
57
Item 8. Financial StatementsStatements and Supplementary Data.
INDEX TO CONSOLIDATED FINANCIAL STATEMENTS
| |
|
|
| |
| |
| |
| |
Report of Independent Registered Public Accounting Firm PCAOB ID 271 | |
All financial statement schedules have been omitted, since the required information is not applicable or is not present in amounts sufficient to require submission of the schedule, or because the information required is included in the consolidated financial statements and accompanying notes. | |
F-1
REPORT OF INDEPENDENT REGISTERED PUBLIC ACCOUNTING FIRMTilray Brands, Inc.
To the Stockholders and the BoardConsolidated Statements of Directors of Tilray, Inc.
Opinion on the Financial Statements
We have audited the accompanying consolidated balance sheets of Tilray, Inc. and subsidiaries (the "Company") as of December 31, 2018 and 2017, the related consolidated statements of net loss and comprehensive loss, stockholders’ equity (deficit), and cash flows, for each of the three years in the period ended December 31, 2018, and the related notes (collectively referred to as the "financial statements"). In our opinion, the financial statements present fairly, in all material respects, the financial position of the Company as of December 31, 2018 and 2017, and the results of its operations and its cash flows for each of the three years in the period ended December 31, 2018, in conformity with accounting principles generally accepted in the United States of America.
Basis for Opinion
These financial statements are the responsibility of the Company's management. Our responsibility is to express an opinion on the Company's financial statements based on our audits. We are a public accounting firm registered with the Public Company Accounting Oversight Board (United States) (PCAOB) and are required to be independent with respect to the Company in accordance with the U.S. federal securities laws and the applicable rules and regulations of the Securities and Exchange Commission and the PCAOB.
We conducted our audits in accordance with the standards of the PCAOB. Those standards require that we plan and perform the audit to obtain reasonable assurance about whether the financial statements are free of material misstatement, whether due to error or fraud. The Company is not required to have, nor were we engaged to perform, an audit of its internal control over financial reporting. As part of our audits, we are required to obtain an understanding of internal control over financial reporting but not for the purpose of expressing an opinion on the effectiveness of the Company’s internal control over financial reporting. Accordingly, we express no such opinion.
Our audits included performing procedures to assess the risks of material misstatement of the financial statements, whether due to error or fraud, and performing procedures that respond to those risks. Such procedures included examining, on a test basis, evidence regarding the amounts and disclosures in the financial statements. Our audits also included evaluating the accounting principles used and significant estimates made by management, as well as evaluating the overall presentation of the financial statements. We believe that our audits provide a reasonable basis for our opinion.
/s/ Deloitte LLP
Chartered Professional Accountants
Vancouver, Canada
March 25, 2019
We have served as the Company's auditor since 2017.
F-2
Consolidated Balance SheetsPosition
(inIn thousands of U.S. dollars, except for share and per share data)dollars)
|
| December 31, |
|
| December 31, |
| ||
|
| 2018 |
|
| 2017 |
| ||
Assets |
|
|
|
|
|
|
|
|
Current assets: |
|
|
|
|
|
|
|
|
Cash and cash equivalents |
| $ | 487,255 |
|
| $ | 2,323 |
|
Short-term investments |
|
| 30,335 |
|
|
| — |
|
Accounts receivable, net of allowance for doubtful accounts of $292 and $8 as of December 31, 2018 and 2017, respectively |
|
| 16,525 |
|
|
| 983 |
|
Other receivables |
|
| 969 |
|
|
| 1,131 |
|
Inventory |
|
| 16,211 |
|
|
| 7,421 |
|
Prepaid expenses and other current assets |
|
| 3,007 |
|
|
| 545 |
|
Total current assets |
|
| 554,302 |
|
|
| 12,403 |
|
Property and equipment, net |
|
| 80,214 |
|
|
| 39,985 |
|
Intangible assets, net |
|
| 4,486 |
|
|
| 934 |
|
Investments |
|
| 16,911 |
|
|
| — |
|
Deposits and other assets |
|
| 754 |
|
|
| 626 |
|
Total assets |
| $ | 656,667 |
|
| $ | 53,948 |
|
Liabilities |
|
|
|
|
|
|
|
|
Current liabilities: |
|
|
|
|
|
|
|
|
Accounts payable |
|
| 10,649 |
|
|
| 5,563 |
|
Accrued expenses and other current liabilities |
|
| 14,818 |
|
|
| 2,021 |
|
Accrued obligations under capital lease |
|
| 470 |
|
|
| 379 |
|
Current portion of long-term debt |
|
| — |
|
|
| 9,432 |
|
Privateer Holdings debt facilities |
|
| — |
|
|
| 32,826 |
|
Total current liabilities |
|
| 25,937 |
|
|
| 50,221 |
|
Accrued obligations under capital lease |
|
| 8,286 |
|
|
| 8,579 |
|
Deferred tax liability |
|
| 4,424 |
|
|
| — |
|
Convertible senior notes due 2023, net of issuance cost |
|
| 420,367 |
|
|
| — |
|
Total liabilities |
| $ | 459,014 |
|
| $ | 58,800 |
|
Stockholders' equity (deficit): |
|
|
|
|
|
|
|
|
Class 1 common stock ($0.0001 par value, 250,000,000 shares authorized and 16,666,667 shares issued and outstanding at December 31, 2018; none authorized, issued or outstanding at December 31, 2017) |
|
| 2 |
|
|
| — |
|
Class 2 common stock ($0.0001 par value; 500,000,000 shares authorized and 76,504,200 shares issued and outstanding at December 31, 2018; none authorized, issued or outstanding at December 31, 2017) |
|
| 8 |
|
|
| — |
|
Capital stock (none authorized, issued or outstanding at December 31, 2018; 1 share authorized, issued and outstanding at December 31, 2017) |
|
| — |
|
|
| — |
|
Additional paid-in capital |
|
| 302,057 |
|
|
| 31,736 |
|
Accumulated other comprehensive income |
|
| 3,763 |
|
|
| 3,866 |
|
Accumulated deficit |
|
| (108,177 | ) |
|
| (40,454 | ) |
Total stockholders' equity (deficit) |
|
| 197,653 |
|
|
| (4,852 | ) |
Total liabilities and stockholders' equity (deficit) |
| $ | 656,667 |
|
| $ | 53,948 |
|
May 31, | May 31, | |||||||
2023 | 2022 | |||||||
Assets | ||||||||
Current assets | ||||||||
Cash and cash equivalents | $ | 206,632 | $ | 415,909 | ||||
Marketable securities | 241,897 | — | ||||||
Accounts receivable, net | 86,227 | 95,279 | ||||||
Inventory | 200,551 | 245,529 | ||||||
Prepaids and other current assets | 37,722 | 46,786 | ||||||
Total current assets | 773,029 | 803,503 | ||||||
Capital assets | 429,667 | 587,499 | ||||||
Right-of-use assets | 5,941 | 12,996 | ||||||
Intangible assets | 973,785 | 1,277,875 | ||||||
Goodwill | 2,008,843 | 2,641,305 | ||||||
Interest in equity investees | 4,576 | 4,952 | ||||||
Long-term investments | 7,795 | 10,050 | ||||||
Convertible notes receivable | 103,401 | 111,200 | ||||||
Other assets | 222 | 314 | ||||||
Total assets | $ | 4,307,259 | $ | 5,449,694 | ||||
Liabilities | ||||||||
Current liabilities | ||||||||
Bank indebtedness | $ | 23,381 | $ | 18,123 | ||||
Accounts payable and accrued liabilities | 190,682 | 157,431 | ||||||
Contingent consideration | 16,218 | 16,007 | ||||||
Warrant liability | 1,817 | 14,255 | ||||||
Current portion of lease liabilities | 2,423 | 6,703 | ||||||
Current portion of long-term debt | 24,080 | 67,823 | ||||||
Current portion of convertible debentures payable | 174,378 | — | ||||||
Total current liabilities | 432,979 | 280,342 | ||||||
Long - term liabilities | ||||||||
Contingent consideration | 10,889 | — | ||||||
Lease liabilities | 7,936 | 11,329 | ||||||
Long-term debt | 136,889 | 117,879 | ||||||
Convertible debentures payable | 221,044 | 401,949 | ||||||
Deferred tax liabilities | 167,364 | 196,638 | ||||||
Other liabilities | 215 | 191 | ||||||
Total liabilities | 977,316 | 1,008,328 | ||||||
Commitments and contingencies (see to Note 27) | ||||||||
Stockholders' equity | ||||||||
Common stock ($0.0001 par value; 990,000,000 shares authorized; 656,655,455 and 532,674,887 shares issued and outstanding, respectively) | 66 | 53 | ||||||
Additional paid-in capital | 5,777,743 | 5,382,367 | ||||||
Accumulated other comprehensive loss | (46,610 | ) | (20,764 | ) | ||||
Accumulated Deficit | (2,415,507 | ) | (962,851 | ) | ||||
Total Tilray Brands, Inc. stockholders' equity | 3,315,692 | 4,398,805 | ||||||
Non-controlling interests | 14,251 | 42,561 | ||||||
Total stockholders' equity | 3,329,943 | 4,441,366 | ||||||
Total liabilities and stockholders' equity | $ | 4,307,259 | $ | 5,449,694 | ||||
The accompanying notes are an integral part of these consolidated financial statements.statements
F-3
TILRAY, INC.Tilray Brands, Inc.
Consolidated Statements of Net Loss and Comprehensive Loss
(inIn thousands of U.S. dollars, except for share and per share data)amounts)
|
| Years ended December 31, |
| |||||||||
|
| 2018 |
|
| 2017 |
|
| 2016 |
| |||
Revenue |
| $ | 43,130 |
|
| $ | 20,538 |
|
| $ | 12,644 |
|
Cost of sales |
|
| 28,855 |
|
|
| 9,161 |
|
|
| 9,974 |
|
Gross margin |
|
| 14,275 |
|
|
| 11,377 |
|
|
| 2,670 |
|
Research and development expenses |
|
| 4,264 |
|
|
| 3,171 |
|
|
| 1,136 |
|
Sales and marketing expenses |
|
| 15,366 |
|
|
| 7,164 |
|
|
| 3,599 |
|
General and administrative expenses |
|
| 31,307 |
|
|
| 8,401 |
|
|
| 4,890 |
|
Stock-based compensation expense |
|
| 20,988 |
|
|
| 139 |
|
|
| 94 |
|
Operating loss |
|
| (57,650 | ) |
|
| (7,498 | ) |
|
| (7,049 | ) |
Foreign exchange loss (gain), net |
|
| 7,234 |
|
|
| (1,363 | ) |
|
| (186 | ) |
Interest expense, net |
|
| 9,110 |
|
|
| 1,686 |
|
|
| 1,019 |
|
Other (income) expense, net |
|
| (1,820 | ) |
|
| (12 | ) |
|
| 1 |
|
Loss before income taxes |
|
| (72,174 | ) |
|
| (7,809 | ) |
|
| (7,883 | ) |
Deferred income tax recovery |
|
| (4,485 | ) |
|
| — |
|
|
| — |
|
Current income tax expense |
|
| 34 |
|
|
| — |
|
|
| — |
|
Net loss |
| $ | (67,723 | ) |
| $ | (7,809 | ) |
| $ | (7,883 | ) |
Net loss per share - basic and diluted |
|
| (0.82 | ) |
|
| (0.10 | ) |
|
| (0.11 | ) |
Weighted average shares used in computation of net loss per share - basic and diluted |
|
| 83,009,656 |
|
|
| 75,000,000 |
|
|
| 75,000,000 |
|
Net loss |
| $ | (67,723 | ) |
| $ | (7,809 | ) |
| $ | (7,883 | ) |
Foreign currency translation gain |
|
| 662 |
|
|
| 282 |
|
|
| 418 |
|
Unrealized gain (loss) on cash equivalents and investments |
|
| (765 | ) |
|
| — |
|
|
| — |
|
Comprehensive loss |
| $ | (67,826 | ) |
| $ | (7,527 | ) |
| $ | (7,465 | ) |
For the year ended May 31, | ||||||||||||
2023 | 2022 | 2021 | ||||||||||
Net revenue | $ | 627,124 | $ | 628,372 | $ | 513,085 | ||||||
Cost of goods sold | 480,164 | 511,555 | 389,903 | |||||||||
Gross profit | 146,960 | 116,817 | 123,182 | |||||||||
Operating expenses: | ||||||||||||
General and administrative | 165,159 | 162,801 | 111,575 | |||||||||
Selling | 34,840 | 34,926 | 26,576 | |||||||||
Amortization | 93,489 | 115,191 | 35,221 | |||||||||
Marketing and promotion | 30,937 | 30,934 | 17,539 | |||||||||
Research and development | 682 | 1,518 | 830 | |||||||||
Change in fair value of contingent consideration | 855 | (44,650 | ) | — | ||||||||
Impairments | 934,000 | 378,241 | — | |||||||||
Other than temporary change in fair value of convertible notes receivable | 246,330 | — | — | |||||||||
Litigation (recovery) costs | (505 | ) | 16,518 | 3,251 | ||||||||
Restructuring costs | 9,245 | 795 | — | |||||||||
Transaction costs | 1,613 | 30,944 | 60,361 | |||||||||
Total operating expenses | 1,516,645 | 727,218 | 255,353 | |||||||||
Operating loss | (1,369,685 | ) | (610,401 | ) | (132,171 | ) | ||||||
Interest expense, net | (13,587 | ) | (27,944 | ) | (27,977 | ) | ||||||
Non-operating income (expense), net | (66,909 | ) | 197,671 | (184,838 | ) | |||||||
Loss before income taxes | (1,450,181 | ) | (440,674 | ) | (344,986 | ) | ||||||
Income tax benefits, net | (7,181 | ) | (6,542 | ) | (8,972 | ) | ||||||
Net loss | $ | (1,443,000 | ) | $ | (434,132 | ) | $ | (336,014 | ) | |||
Total net income (loss) attributable to: | ||||||||||||
Stockholders of Tilray Brands, Inc. | (1,452,656 | ) | (476,801 | ) | (367,421 | ) | ||||||
Non-controlling interests | 9,656 | 42,669 | 31,407 | |||||||||
Other comprehensive income (loss), net of tax | ||||||||||||
Foreign currency translation gain (loss) | (83,533 | ) | (125,306 | ) | 156,649 | |||||||
Unrealized gain (loss) on convertible notes receivable | 75,177 | (71,428 | ) | (3,824 | ) | |||||||
Total other comprehensive income (loss), net of tax | (8,356 | ) | (196,734 | ) | 152,825 | |||||||
Comprehensive loss | $ | (1,451,356 | ) | $ | (630,866 | ) | $ | (183,189 | ) | |||
Total comprehensive income (loss) attributable to: | ||||||||||||
Stockholders of Tilray Brands, Inc. | (1,478,502 | ) | (650,233 | ) | (214,596 | ) | ||||||
Non-controlling interests | 27,146 | 19,367 | 31,407 | |||||||||
Weighted average number of common shares - basic | 617,982,589 | 481,219,130 | 269,549,852 | |||||||||
Weighted average number of common shares - diluted | 617,982,589 | 481,219,130 | 269,549,852 | |||||||||
Net loss per share - basic | $ | (2.35 | ) | $ | (0.99 | ) | $ | (1.36 | ) | |||
Net loss per share - diluted | $ | (2.35 | ) | $ | (0.99 | ) | $ | (1.36 | ) | |||
The accompanying notes are an integral part of these consolidated financial statements.statements
F-4
TILRAY, INC.Tilray Brands, Inc.
Consolidated Statements of Stockholders’Changes in Equity (Deficit)
(inIn thousands of U.S. dollars, except for share and per share data)amounts)
|
|
|
|
|
| Convertible preferred shares |
|
| Common stock |
|
|
|
|
|
|
|
|
|
|
|
|
|
|
|
|
| ||||||||||
|
| Capital stock |
|
| Number of shares |
|
| Amount |
|
| Number of shares |
|
| Amount |
|
| Additional paid-in capital |
|
| Accumulated other comprehensive income |
|
| Accumulated deficit |
|
| Total equity (deficit) |
| |||||||||
Balance at December 31, 2015 |
|
| — |
|
|
| — |
|
| $ | — |
|
|
| — |
|
| $ | — |
|
| $ | 31,495 |
|
| $ | 3,166 |
|
| $ | (24,762 | ) |
| $ | 9,899 |
|
Stock-based compensation expense |
|
| — |
|
|
| — |
|
|
| — |
|
|
| — |
|
|
| — |
|
|
| 94 |
|
|
| — |
|
|
| — |
|
|
| 94 |
|
Foreign currency translation gain |
|
| — |
|
|
| — |
|
|
| — |
|
|
| — |
|
|
| — |
|
|
| — |
|
|
| 418 |
|
|
| — |
|
|
| 418 |
|
Net loss |
|
| — |
|
|
| — |
|
|
| — |
|
|
| — |
|
|
| — |
|
|
| — |
|
|
| — |
|
|
| (7,883 | ) |
|
| (7,883 | ) |
Balance at December 31, 2016 |
|
| — |
|
|
| — |
|
|
| — |
|
|
| — |
|
|
| — |
|
|
| 31,589 |
|
|
| 3,584 |
|
|
| (32,645 | ) |
|
| 2,528 |
|
Contributions |
|
| — |
|
|
| — |
|
|
| — |
|
|
| — |
|
|
| — |
|
|
| 8 |
|
|
| — |
|
|
| — |
|
|
| 8 |
|
Stock-based compensation expense |
|
| — |
|
|
| — |
|
|
| — |
|
|
| — |
|
|
| — |
|
|
| 139 |
|
|
| — |
|
|
| — |
|
|
| 139 |
|
Foreign currency translation gain |
|
| — |
|
|
| — |
|
|
| — |
|
|
| — |
|
|
| — |
|
|
| — |
|
|
| 282 |
|
|
| — |
|
|
| 282 |
|
Net loss |
|
| — |
|
|
| — |
|
|
| — |
|
|
| — |
|
|
| — |
|
|
| — |
|
|
| — |
|
|
| (7,809 | ) |
|
| (7,809 | ) |
Balance at December 31, 2017 |
|
| — |
|
|
| — |
|
|
| — |
|
|
| — |
|
|
| — |
|
|
| 31,736 |
|
|
| 3,866 |
|
|
| (40,454 | ) |
|
| (4,852 | ) |
Issuance of convertible preferred stock, net of issuance costs |
|
| — |
|
|
| 7,794,042 |
|
|
| 2 |
|
|
| — |
|
|
| — |
|
|
| 52,558 |
|
|
| — |
|
|
| — |
|
|
| 52,560 |
|
Conversion of convertible preferred stock |
|
| — |
|
|
| (7,794,042 | ) |
|
| (2 | ) |
|
| 7,794,042 |
|
|
| 2 |
|
|
| — |
|
|
| — |
|
|
| — |
|
|
| — |
|
Issuance of common stock, net of issuance cost |
|
| — |
|
|
| — |
|
|
| — |
|
|
| 85,350,000 |
|
|
| 8 |
|
|
| 160,784 |
|
|
| — |
|
|
| — |
|
|
| 160,792 |
|
Stock-based compensation expense |
|
| — |
|
|
| — |
|
|
| — |
|
|
| — |
|
|
| — |
|
|
| 20,988 |
|
|
| — |
|
|
| — |
|
|
| 20,988 |
|
Foreign currency translation gain |
|
| — |
|
|
| — |
|
|
| — |
|
|
| — |
|
|
| — |
|
|
| — |
|
|
| 662 |
|
|
| — |
|
|
| 662 |
|
Deferred tax liability related to convertible senior notes due 2023, net of issuance costs |
|
| — |
|
|
| — |
|
|
| — |
|
|
| — |
|
|
| — |
|
|
| (8,809 | ) |
|
| — |
|
|
| — |
|
|
| (8,809 | ) |
Unrealized gain (loss) on cash equivalents and investments |
|
| — |
|
|
| — |
|
|
| — |
|
|
| — |
|
|
| — |
|
|
| — |
|
|
| (765 | ) |
|
| — |
|
|
| (765 | ) |
Issuance of shares for Alef acquisition |
|
| — |
|
|
| — |
|
|
| — |
|
|
| 26,825 |
|
|
| — |
|
|
| 2,855 |
|
|
| — |
|
|
| — |
|
|
| 2,855 |
|
Equity component related to issuance of convertible senior notes due 2023, net of issuance costs |
|
| — |
|
|
| — |
|
|
| — |
|
|
| — |
|
|
| — |
|
|
| 41,945 |
|
|
| — |
|
|
| — |
|
|
| 41,945 |
|
Net loss |
|
| — |
|
|
| — |
|
|
| — |
|
|
| — |
|
|
| — |
|
|
| — |
|
|
| — |
|
|
| (67,723 | ) |
|
| (67,723 | ) |
Balance at December 31, 2018 |
|
| — |
|
|
| — |
|
| $ | — |
|
|
| 93,170,867 |
|
| $ | 10 |
|
| $ | 302,057 |
|
| $ | 3,763 |
|
| $ | (108,177 | ) |
| $ | 197,653 |
|
Accumulated | ||||||||||||||||||||||||||||
Number of | Additional | other | Non- | |||||||||||||||||||||||||
common | Common | paid-in | comprehensive | Accumulated | controlling | |||||||||||||||||||||||
shares | stock | capital | income (loss) | Deficit | interests | Total | ||||||||||||||||||||||
Balance at May 31, 2020 | 240,132,635 | $ | 24 | $ | 1,366,736 | $ | (5,434 | ) | $ | (113,352 | ) | $ | 26,957 | $ | 1,274,931 | |||||||||||||
Share issuance - legal settlement | 1,893,858 | — | 10,454 | — | — | — | 10,454 | |||||||||||||||||||||
Share issuance - equity financing | 14,610,496 | 2 | 103,535 | — | — | — | 103,537 | |||||||||||||||||||||
Share issuance - SweetWater acquisition | 8,232,810 | 1 | 65,888 | — | — | 65,889 | ||||||||||||||||||||||
Share issuance - contract settlement | 1,165,861 | 1 | 21,370 | — | — | (40,266 | ) | (18,895 | ) | |||||||||||||||||||
Share issuance - Arrangement | 179,635,973 | 18 | 3,204,888 | — | — | — | 3,204,906 | |||||||||||||||||||||
Share issuance - options exercised | 318,299 | — | 144 | — | — | — | 144 | |||||||||||||||||||||
Share issuance - RSUs exercised | 450,709 | — | — | — | — | — | — | |||||||||||||||||||||
Stock-based payments | — | — | 19,391 | — | — | — | 19,391 | |||||||||||||||||||||
Settlement of convertible notes receivable | — | — | — | 5,277 | (5,277 | ) | — | — | ||||||||||||||||||||
Dividends paid to non-controlling interests | — | — | — | — | — | (11,855 | ) | (11,855 | ) | |||||||||||||||||||
Comprehensive income (loss) for the year | — | — | — | 152,825 | (367,421 | ) | 31,407 | (183,189 | ) | |||||||||||||||||||
Balance at May 31, 2021 | 446,440,641 | $ | 46 | $ | 4,792,406 | $ | 152,668 | $ | (486,050 | ) | $ | 6,243 | $ | 4,465,313 | ||||||||||||||
Third party contribution to Superhero Acquisition LP | — | — | — | — | — | 52,995 | 52,995 | |||||||||||||||||||||
Share issuance - Superhero Acquisition LP | 9,817,061 | — | 117,804 | — | — | — | 117,804 | |||||||||||||||||||||
Share issuance - Breckenridge Acquisition | 12,540,479 | 2 | 114,066 | — | — | — | 114,068 | |||||||||||||||||||||
Share issuance - equity financing | 51,741,710 | 5 | 262,504 | — | — | — | 262,509 | |||||||||||||||||||||
Share issuance - Double Diamond Holdings note | 2,677,596 | — | 28,560 | — | — | (36,044 | ) | (7,484 | ) | |||||||||||||||||||
Share issuance - legal settlement | 2,959,386 | — | 22,170 | — | — | — | 22,170 | |||||||||||||||||||||
Share issuance - purchase of capital and intangible assets | 1,289,628 | — | 12,146 | — | — | — | 12,146 | |||||||||||||||||||||
Share issuance - options exercised | 719,031 | — | 5,403 | — | — | — | 5,403 | |||||||||||||||||||||
Share issuance - RSUs exercised | 4,489,355 | — | — | — | — | — | — | |||||||||||||||||||||
Shares effectively repurchased for employee withholding tax | — | — | (8,686 | ) | — | — | — | (8,686 | ) | |||||||||||||||||||
Stock-based compensation | — | — | 35,994 | — | — | — | 35,994 | |||||||||||||||||||||
Comprehensive income (loss) for the year | — | — | — | (173,432 | ) | (476,801 | ) | 19,367 | (630,866 | ) | ||||||||||||||||||
Balance at May 31, 2022 | 532,674,887 | $ | 53 | $ | 5,382,367 | $ | (20,764 | ) | $ | (962,851 | ) | $ | 42,561 | $ | 4,441,366 | |||||||||||||
Share issuance -Montauk Acquisition | 1,708,521 | — | 6,422 | — | — | — | 6,422 | |||||||||||||||||||||
Share issuance - equity financing | 32,481,149 | 3 | 129,590 | — | — | — | 129,593 | |||||||||||||||||||||
Share issuance- purchase of HEXO convertible note receivable | 33,314,412 | 3 | 107,269 | — | — | — | 107,272 | |||||||||||||||||||||
HTI Convertible Note - conversion feature | — | — | 9,055 | — | — | — | 9,055 | |||||||||||||||||||||
Share issuance - Double Diamond Holdings note | 16,114,406 | 3 | 60,062 | — | — | (47,598 | ) | 12,467 | ||||||||||||||||||||
Share issuance - options exercised | 7,960 | — | — | — | — | — | — | |||||||||||||||||||||
Share issuance - RSUs exercised | 1,854,120 | — | — | — | — | — | — | |||||||||||||||||||||
Share issuance - convertible notes share lending agreement | 38,500,000 | 4 | 26,157 | — | — | — | 26,161 | |||||||||||||||||||||
Equity component related to issuance of convertible debt, net of issuance costs | — | — | 18,415 | — | — | — | 18,415 | |||||||||||||||||||||
Shares effectively repurchased for employee withholding tax | — | — | (1,189 | ) | — | — | — | (1,189 | ) | |||||||||||||||||||
Stock-based compensation | — | — | 39,595 | — | — | — | 39,595 | |||||||||||||||||||||
Dividends declared to non-controlling interests | — | — | — | — | — | (7,858 | ) | (7,858 | ) | |||||||||||||||||||
Comprehensive income (loss) for the year | — | — | — | (25,846 | ) | (1,452,656 | ) | 27,146 | (1,451,356 | ) | ||||||||||||||||||
Balance at May 31, 2023 | 656,655,455 | $ | 66 | $ | 5,777,743 | $ | (46,610 | ) | $ | (2,415,507 | ) | $ | 14,251 | $ | 3,329,943 | |||||||||||||
The accompanying notes are an integral part of these consolidated financial statements.statements
F-5
TILRAY, INC.Tilray Brands, Inc.
Consolidated Statements of Cash Flows
(inIn thousands of U.S. dollars, except for per share data)amounts)
|
| Year ended December 31, |
| |||||||||
|
| 2018 |
|
| 2017 |
|
| 2016 |
| |||
Operating activities |
|
|
|
|
|
|
|
|
|
|
|
|
Net loss |
| $ | (67,723 | ) |
| $ | (7,809 | ) |
| $ | (7,883 | ) |
Adjusted for the following items: |
|
|
|
|
|
|
|
|
|
|
|
|
Foreign currency loss (gain) |
|
| 6,477 |
|
|
| (1,363 | ) |
|
| (187 | ) |
Provision for doubtful accounts and returns |
|
| 285 |
|
|
| — |
|
|
| 9 |
|
Inventory write-downs |
|
| 384 |
|
|
| 204 |
|
|
| 234 |
|
Depreciation and amortization |
|
| 3,562 |
|
|
| 1,853 |
|
|
| 1,953 |
|
Stock-based compensation expense |
|
| 20,988 |
|
|
| 139 |
|
|
| 94 |
|
Non-cash interest expense |
|
| 5,669 |
|
|
| 693 |
|
|
| 772 |
|
Deferred income tax recovery |
|
| (4,485 | ) |
|
| — |
|
|
| — |
|
(Gain) Loss on disposal of property and equipment |
|
| (2 | ) |
|
| 11 |
|
|
| 2 |
|
Loss on sale of investment |
|
| 6 |
|
|
| — |
|
|
| — |
|
Amortization of discount on convertible senior notes due 2023 |
|
| 2,180 |
|
|
| — |
|
|
| — |
|
Changes in non-cash working capital: |
|
|
|
|
|
|
|
|
|
|
|
|
Accounts receivable |
|
| (16,512 | ) |
|
| (507 | ) |
|
| 317 |
|
Other receivables |
|
| 101 |
|
|
| (1,187 | ) |
|
| (1 | ) |
Inventory |
|
| (9,226 | ) |
|
| (3,295 | ) |
|
| 693 |
|
Prepaid expenses and other current assets |
|
| (2,588 | ) |
|
| (433 | ) |
|
| (8 | ) |
Accounts payable |
|
| 5,218 |
|
|
| 4,728 |
|
|
| 122 |
|
Accrued expenses and other current liabilities |
|
| 9,418 |
|
|
| 963 |
|
|
| 565 |
|
Net cash used in operating activities |
|
| (46,248 | ) |
|
| (6,003 | ) |
|
| (3,318 | ) |
Investing activities |
|
|
|
|
|
|
|
|
|
|
|
|
Decrease (increase) in deposits and other assets |
|
| — |
|
|
| (397 | ) |
|
| 6 |
|
Purchases of short-term and non-current investments |
|
| (319,373 | ) |
|
| — |
|
|
| — |
|
Proceeds from sale of short-term investments |
|
| 274,497 |
|
|
| — |
|
|
| — |
|
Purchases of property and equipment |
|
| (50,198 | ) |
|
| (10,910 | ) |
|
| (488 | ) |
Proceeds from disposal of property and equipment |
|
| 713 |
|
|
| 23 |
|
|
| — |
|
Purchases of intangible assets |
|
| (4,259 | ) |
|
| (531 | ) |
|
| (543 | ) |
Net cash used in investing activities |
|
| (98,620 | ) |
|
| (11,815 | ) |
|
| (1,025 | ) |
Financing activities |
|
|
|
|
|
|
|
|
|
|
|
|
Repayment under Privateer Holdings debt facilities |
|
| (36,940 | ) |
|
| — |
|
|
| — |
|
Advances under Privateer Holdings debt facilities |
|
| 3,453 |
|
|
| 6,039 |
|
|
| 4,406 |
|
Advances under Privateer Holdings construction facilities |
|
| — |
|
|
| 6,395 |
|
|
| — |
|
Proceeds from Preferred Shares - Series A, net of transaction costs |
|
| 52,560 |
|
|
| — |
|
|
| — |
|
Repayment of mortgage debt |
|
| (9,136 | ) |
|
| — |
|
|
| — |
|
Proceeds from mortgage debt |
|
| — |
|
|
| — |
|
|
| 9,062 |
|
Payments on long-term debt |
|
| — |
|
|
| — |
|
|
| (2,190 | ) |
Long-term debt financing costs |
|
| — |
|
|
| — |
|
|
| (359 | ) |
Minimum lease payments under capital lease |
|
| — |
|
|
| (199 | ) |
|
| — |
|
Proceeds from issuance of convertible senior notes due 2023, net of issuance costs |
|
| 460,269 |
|
|
| — |
|
|
| — |
|
Proceeds from issuance of common stock pursuant to IPO |
|
| 176,091 |
|
|
| — |
|
|
| — |
|
Payment of costs from issuance of common stock pursuant to IPO |
|
| (15,299 | ) |
|
| — |
|
|
| — |
|
Net cash provided by financing activities |
|
| 630,998 |
|
|
| 12,235 |
|
|
| 10,919 |
|
Effect of foreign currency translation on cash, cash equivalents and restricted cash |
|
| (1,198 | ) |
|
| 375 |
|
|
| 226 |
|
Cash, cash equivalents and restricted cash |
|
|
|
|
|
|
|
|
|
|
|
|
Increase (decrease) in cash, cash equivalents and restricted cash |
|
| 484,932 |
|
|
| (5,208 | ) |
|
| 6,802 |
|
Cash and cash equivalents, beginning of period |
|
| 2,323 |
|
|
| 7,531 |
|
|
| 729 |
|
Cash, cash equivalents and restricted cash, end of period |
| $ | 487,255 |
|
| $ | 2,323 |
|
| $ | 7,531 |
|
Supplemental Disclosure for Cash Flow Information |
|
|
|
|
|
|
|
|
|
|
|
|
Cash paid for interest |
| $ | 1,189 |
|
| $ | 1,157 |
|
| $ | 295 |
|
Non-cash financing activities |
|
|
|
|
|
|
|
|
|
|
|
|
Capital lease obligation |
| $ | — |
|
| $ | 8,958 |
|
| $ | — |
|
Conversion of preferred stock to common stock |
| $ | 2 |
|
| $ | — |
|
| $ | — |
|
Non-cash investing |
|
|
|
|
|
|
|
|
|
|
|
|
Addition to property and equipment under capital lease |
| $ | 114 |
|
| $ | 8,958 |
|
| $ | — |
|
Alef acquisition |
| $ | 2,855 |
|
| $ | — |
|
| $ | — |
|
For the year | ||||||||||||
ended May 31, | ||||||||||||
2023 | 2022 | 2021 | ||||||||||
Cash provided by (used in) operating activities: | ||||||||||||
Net loss | $ | (1,443,000 | ) | $ | (434,132 | ) | $ | (336,014 | ) | |||
Adjustments for: | ||||||||||||
Deferred income tax recovery | (31,953 | ) | (27,538 | ) | (24,873 | ) | ||||||
Unrealized foreign exchange loss | 17,768 | 18,001 | 49,342 | |||||||||
Amortization | 130,149 | 154,592 | 67,832 | |||||||||
Gain on sale of capital assets | (48 | ) | (682 | ) | — | |||||||
Inventory valuation write down | 55,000 | 67,000 | 19,919 | |||||||||
Impairments | 934,001 | 378,240 | — | |||||||||
Other than temporary change in fair value of convertible notes receivable | 246,330 | — | — | |||||||||
Other non-cash items | 11,406 | (9,647 | ) | 1,502 | ||||||||
Stock-based compensation | 39,595 | 35,994 | 17,351 | |||||||||
Loss on long-term investments & equity investments | 2,190 | 4,914 | 1,624 | |||||||||
Loss (gain) on derivative instruments | 31,213 | (227,583 | ) | 169,537 | ||||||||
Change in fair value of contingent consideration | 855 | (44,650 | ) | — | ||||||||
Transaction costs associated with business acquisitions | — | — | 59,917 | |||||||||
Change in non-cash working capital: | ||||||||||||
Accounts receivable | 4,168 | (5,842 | ) | (23,512 | ) | |||||||
Prepaids and other current assets | 3,122 | 4,472 | (6,772 | ) | ||||||||
Inventory | (12,934 | ) | (45,749 | ) | (55,205 | ) | ||||||
Accounts payable and accrued liabilities | 20,044 | (44,652 | ) | 14,635 | ||||||||
Net cash provided by (used in) operating activities | 7,906 | (177,262 | ) | (44,717 | ) | |||||||
Cash provided by (used in) investing activities: | ||||||||||||
Investment in capital and intangible assets | (20,800 | ) | (34,064 | ) | (38,874 | ) | ||||||
Proceeds from disposal of capital and intangible assets | 4,304 | 12,205 | 6,608 | |||||||||
Promissory notes advances | — | — | (2,419 | ) | ||||||||
Repayment of notes receivable | — | — | 5,752 | |||||||||
Change in marketable securities | (241,897 | ) | — | — | ||||||||
Proceeds from disposal of long-term investments and equity investees | — | — | 8,430 | |||||||||
Net cash (paid for) acquired in business acquisition | (26,718 | ) | 326 | 66,608 | ||||||||
Net cash (used in) provided by investing activities | (285,111 | ) | (21,533 | ) | 46,105 | |||||||
Cash provided by (used in) financing activities: | ||||||||||||
Share capital issued, net of cash issuance costs | 129,593 | 262,509 | 102,550 | |||||||||
Proceeds from warrants and options exercised | — | 5,403 | 144 | |||||||||
Shares effectively repurchased for employee withholding tax | (1,189 | ) | (8,686 | ) | — | |||||||
Proceeds from convertible debentures issuance | 145,052 | — | — | |||||||||
Repayment of convertible debentures | (187,394 | ) | (88,026 | ) | — | |||||||
Proceeds from long-term debt | 1,288 | — | 102,798 | |||||||||
Repayment of long-term debt | (21,336 | ) | (40,254 | ) | (64,559 | ) | ||||||
Repayment of lease liabilities | (1,114 | ) | (4,672 | ) | (1,058 | ) | ||||||
Net increase in bank indebtedness | 5,258 | 9,406 | 8,328 | |||||||||
Dividend paid to NCI | — | (7,484 | ) | (23,895 | ) | |||||||
Net cash provided by financing activities | 70,158 | 128,196 | 124,308 | |||||||||
Effect of foreign exchange on cash and cash equivalents | (2,230 | ) | (1,958 | ) | 2,124 | |||||||
Net (decrease) increase in cash and cash equivalents | (209,277 | ) | (72,557 | ) | 127,820 | |||||||
Cash and cash equivalents, beginning of period | 415,909 | 488,466 | 360,646 | |||||||||
Cash and cash equivalents, end of period | $ | 206,632 | $ | 415,909 | $ | 488,466 | ||||||
The accompanying notes are an integral part of these consolidated financial statements.statements
TILRAY, INC.Tilray Brands, Inc.
Notes to the Consolidated Financial Statements
1. Description(In thousands of BusinessU.S. dollars, except share and Summaryper share amounts)
1. | Description of business |
Tilray Brands, Inc. (the “Company”) was incorporated in Delaware on January 24, 2018 as a wholly owned subsidiary of Privateer Holdings, Inc. (“Privateer Holdings”). On January 25, 2018, Privateer Holdings transferred the equity interest in Decatur Holdings, B.V. (“Decatur”) to Tilray, Inc. Decatur was subsequently dissolved on December 27, 2018.
Prior to the incorporation of Decatur on March 8, 2016, the four, and its wholly owned subsidiaries of Privateer Holdings consisted of Tilray(collectively “Tilray”, the “Company”, “we”, or “us”) is a leading global cannabis-lifestyle and consumer packaged goods company headquartered in Leamington, Ontario, Canada, Ltd., Dorada Ventures, Ltd., Gatenhielm Group, CV, and High Park Farms, Ltd. and were capitalized with a nominal amount for each capital stock. In 2016, Privateer Holdings made capital contributions to Tilrayoperations in Canada, Ltd. in the aggregate amount of $31,495. The equity interests of the four wholly owned subsidiaries were transferred to Decatur upon incorporation in 2016.
Subsequent to its formation, Decatur incorporated Tilray Deutschland GmbH, Tilray Portugal Unipessoal, Lda., Pardel Holdings, Lda. and TilrayUnited States, Europe, Australia, New Zealand Pty. Ltd.and Latin America. Tilray’s mission is to be the trusted partner for its patients and consumers by providing them with a cultivated experience and health and wellbeing through high-quality, differentiated brands and innovative products. A pioneer in cannabis research, cultivation and distribution, Tilray’s production platform supports over 20 brands in over 20 countries, including comprehensive cannabis offerings, hemp-based foods, and alcoholic beverages.
The transfers
On April 30, 2021, Tilray acquired all of the equity interests described above were between entitiesissued and outstanding common shares of Aphria Inc. (“Aphria”), an international organization focused on building a global cannabis-lifestyle consumer packaged goods company in addition to its businesses in the marketing and manufacturing beverage alcohol products in the United States, and in the distribution of (non-Cannabis) pharmaceutical products in Germany and Argentina, pursuant to a plan of arrangement (the “Arrangement”) under common controlthe Business Corporations Act (Ontario).
On January 10, 2022, Tilray, Inc. changed its corporate name to Tilray Brands, Inc., pursuant to a second certificate of amendment of the amended and were recorded at their carrying amounts. restated certificate of incorporation filed with the Delaware Secretary of State (the “Name Change”), and amended and restated its bylaws on that same date to reflect the Name Change.
2. | Basis of preparation |
The policies applied in these consolidated financial statements of the Company (the “financial statements”) are prepared, on a continuity of interest basis, reflecting the historical financial information of Decatur prior to January 25, 2018.
The principal activities of the Company are the production and sale of medical and adult-use cannabis in Canada, as well as export and sale of medical cannabis from Canada into other jurisdictions. These activities were previously regulated by the Access to Cannabis for Medical Purposes Regulations (“ACMPR”) under the Controlled Drugs and Substances Act; on October 17, 2018, the ACMPR was superseded by the Cannabis Regulations under the Cannabis Act. The Company’s license to cultivate, process and sell medical cannabis products in Canada was first granted on March 24, 2014. Subsequently, the Company received a Licensed Dealer designation under Canada’s Narcotic Control Regulations (“NCR”) from Health Canada, allowing the Company to sell medical cannabis in Canada and export medical cannabis products to other countries in accordance with applicable laws. These licenses have now been consolidated under the Cannabis Regulations.
2. Summary of Significant Accounting Policies
Basis of presentation
The accompanying consolidated financial statements (the “financial statements”) have been prepared in accordance with accounting principles generally accepted in the United States of America (“U.S. GAAP”). To and pursuant to the extent relevant,rules and regulations of the United States Securities and Exchange Commission (“SEC”).
Based on the determination that Aphria was the accounting acquirer in the Arrangement, Aphria’s historical financial statements include expense allocations for certain corporate functions historically provided by Privateer Holdings. The assumptions underlyingbecame the financial statements, including the assumptions regarding allocated expenses, reasonably reflect the utilization of services provided to or the benefit received by the Company during the periods presented. The allocations may not however reflect the expenses the Company has incurred or will incur as a stand-alone company for the periods presented. Actual costs that may have been incurred if the Company had been a stand-alone company would depend on a number of factors, including the chosen organizational structure, which functions were outsourced or performed by employees and strategic decisions made in areas such as treasury, information technology, financial reporting and oversight.
The Company is an “emerging growth company,” as defined in Section 2(a) of the Securities Act of 1933, as amended, as modified by the Jumpstart Our Business Start-ups Act of 2012, (the “JOBS Act”). Section 107 of the JOBS Act provides that an emerging growth company can take advantage of the extended transition period provided in Section 13(a) of the Securities Exchange Act of 1934, as amended, for complying with new or revised accounting standards applicable to public companies. In other words, an emerging growth company can delay the adoption of certain accounting standards until those standards would otherwise apply to private companies. The Company has elected to take advantage of this extended transition period. As a result of this election, the Company’s financial statements may not be comparable to companies that comply with public company effective dates for such new or revised standards.
Basis of consolidation
These financial statements include the accounts of the following entities wholly owned by the Company as of December 31, 2018:
|
|
| ||
|
|
| ||
|
|
| ||
|
|
| ||
|
|
| ||
|
|
| ||
|
|
| ||
|
|
| ||
|
|
| ||
|
|
| ||
|
|
| ||
|
|
| ||
Tilray, Inc. was incorporated in Delaware in January 2018. Prior to January 2018, we operated our business under Decatur, which was formed in March 2016. Decatur was incorporated under the laws of the Netherlands on March 8, 2016 as a wholly owned subsidiary of Privateer Holdings to hold a 100% ownership interest in the underlying entities included above. Decatur has been disolved as of December 31, 2018. The entities listed above are wholly owned by the Company and have been formed to support the intended operations of the Company and all intercompany transactions and balances have been eliminated in thehistorical financial statements of the Company. The results of Tilray's operations and cash flows are included in the Company’s consolidated statement of loss and comprehensive loss and cash flows for periods beginning after April 30, 2021. In conjunction with the reverse acquisition, the Company elected to adopt Aphria’s fiscal year end of June 1 to May 31. Accordingly, comparisons between the Company's results for the years ended May 31, 2023 and May 31, 2022 with prior periods may not be meaningful, as the reported results do not include the operations of legacy-Tilray and its subsidiaries on and prior to April 30, 2021.
Use of estimates
The preparation of theThese consolidated financial statements have been prepared on the going concern basis which assumes that the Company will continue in conformity with U.S. GAAP requires managementoperation for the foreseeable future and, accordingly, will be able to make judgments, estimatesrealize its assets and assumptions that affect the reported amountsdischarge its liabilities in the normal course of operations as they come due, under the historical cost convention except for certain financial statements and accompanying notes. Actual results may differ from these estimates. Key estimates in these financial statements include the allowance for doubtful accounts, inventory write-downs, capitalization of internally developed software costs, estimated useful lives of property, plant and equipment and intangible assets, valuation allowance on deferred income tax assets,instruments that are measured at fair value, of stock options granted under Privateer Holdings’ equity-based compensation plan (the “Original Plan”) andas detailed in the new 2018 Equity Incentive Plan (the “New Plan”) and the fair value of the Convertible Senior Notes due 2023 (“Convertible Notes”) and equity component.Company’s accounting policies.
Foreign currency
These consolidated financial statements are presented in the United States dollarU.S. dollars (“USD”), which is the Company’s reporting currency. Functional currencies forcurrency; however, the functional currency of the entities in these financial statements are their respective local currencies, including the Canadian dollar, (“CAD”),USD, Euro, Australian dollar, Chilean Peso and Great Britain pound.
Foreign currency transactions are remeasured to the Euro.
The assets and liabilitiesrespective functional currencies of each entity are translated to USDthe Company’s entities at the exchange raterates in effect as at December 31, 2018 and 2017. Certain transactions affectingon the stockholders’ equity (deficit) are translated at historical foreign exchange rates. The statementsdate of net loss and comprehensive loss and statements of cash flows are translated to USD applying the average foreign exchange rate in effect during the reporting period. The resulting translation adjustments are included in other comprehensive loss.
transactions. Monetary assets and liabilities denominated in foreign currencies are translatedremeasured to the functional currency by applyingat the foreign exchange rate in effectapplicable at the balance sheetstatement of financial position date. Revenues and expensesNon-monetary items carried at historical cost denominated in foreign currencies are translated usingremeasured to the averagefunctional currency at the date of the transactions. Non-monetary items carried at fair value denominated in foreign exchange rate forcurrencies are remeasured to the reporting period.functional currency at the date when the fair value was determined. Realized and unrealized exchange gains and losses are recognized through profit and loss.
On consolidation, the assets and liabilities of foreign operations reported in their functional currencies are translated into USD, the Group’s presentation currency, at period-end exchange rates. Income and expenses, and cash flows of foreign operations are translated into USD using average exchange rates. Exchange differences resulting from translating foreign operations are recognized in other comprehensive income (loss) and accumulated in equity.
Basis of consolidation
The consolidated financial statements of the statementCompany, include the accounts of the company, its wholly-owned subsidiaries and majority owned subsidiaries see Note 21 (Non-controlling interests). All significant intercompany transactions are eliminated.
Equity method investments
In accordance with ASC 323,Investments – Equity Method and Joint Ventures, investments in entities over which the Company does not have a controlling financial interest but has significant influence are accounted for using the equity method, with the Company’s share of earnings or losses reported in earnings or losses from equity method investments on the statements of net loss and comprehensive loss. Equity method investments are recognized initially at cost, which includes transaction costs. After initial recognition, the consolidated financial statements include the Company’s share of undistributed earnings or losses, and impairment, if any, until the date on which significant influence ceases.
If the Company’s share of losses in an equity investment equals or exceeds its interest in the entity, including any net advances, the group does not recognize further losses, unless it has guaranteed obligations of the investee or is otherwise committed to provide further financial support for the investee.
Unrealized gains on transactions between the Company and its equity-method investees are eliminated only to the extent of the Company’s interest in these entities. Unrealized losses are also eliminated, except to the extent that the underlying asset is impaired.
3. | Significant accounting policies |
Net loss per share
Basic net loss per share is computed by dividing reported net lossThe significant accounting policies used by the weighted average number of common shares outstanding for the reported period. Diluted net loss per share reflects the potential dilution that could occur if securities or other contracts to issue common stock were exercised or converted into common stock of the Company during reported periods. Diluted net loss per share is computed by dividing net loss by the sum of the weighted average number of common shares and the number of dilutive potential common share equivalents outstanding during the period. Potential dilutive common share equivalents consist of the incremental common shares issuable upon the exercise of vested share options and the incremental shares issuable upon conversion of the Convertible Notes. Potential dilutive common share equivalents consist of stock options, restricted stock units (“RSUs”) and restricted stock awards.are as follows:
In computing diluted earnings per share, common share equivalents are not considered in periods in which a net loss is reported, as the inclusion of the common share equivalents would be anti-dilutive. As of December 31, 2018, there were 7,902,263 common share equivalents with potential dilutive impact. Since the Company is in a net loss for all periods presented in these financial statements, there is no difference between the Company’s basic and diluted net loss per share for the periods presented. There were no common share equivalents that would have a dilutive impact in 2016 and 2017.
Cash and cash equivalents
Cash and cash equivalents are comprised of cash and highly liquid investments that are both readily convertible into known amounts of cash with original maturities of three months or less.
Cash and cash equivalents include amounts held primarily in U.S.United States dollar, Canadian dollar, Euro, Australian dollar, ChileanGreat Britain pound, Colombian peso, Argentine peso, and corporate bonds, commercial paper, treasury bills and money market funds.
Investments
Investments consist
Marketable Securities
The Company classifies term deposits and other investments that have maturities of treasury bills and equitygreater than three months but less than one year as marketable securities. The fair value of marketable securities. Equity is based on quoted market prices for publicly traded securities. Marketable securities generally consist of securities that represent ownership interests in an enterprise for which do not have significant influence or a controlling interest. The Company’s investments are classified as available-for-sale securities or as a cost method investment.
Available-for-sale securities
Securities classified as available-for-sale are recordedcarried at fair value. Unrealized gains and losses during the year, net of the related tax effect applicable to available-for-sale, are excluded from income and reflected in other comprehensive income (“OCI”), and the cumulative effect is reported as a separate component of shareholders’ equity until realized. If a declinevalue with changes in fair value is deemed to be other-than-temporary, the investment is written down to its fair value and the amount of the write-down is recorded as other-than-temporary impairment (“OTTI”) loss in the statement of net loss. Any portion of such decline relatedloss and comprehensive loss, within the line, “Non-operating income (expense)”.
Accounts receivable
The Company maintains an allowance for credit losses at an amount sufficient to the securities that are not held-to-maturity and is believed to arise from factors other than credit is recordedabsorb losses inherent in its accounts receivable portfolio as a component of other comprehensive income rather than against income.
Net realized gains and losses on investments are determined in accordance with the specific identification method.
Cost method investments
Equity securities for which the fair value is not readily determinable are carried at cost. Distributions from the equity security are recognized as income dividend when received.
An impairment charge is recorded if the carrying amount of the investment exceedsreporting dates based on the projection of expected credit losses. The Company applies the aging method to estimate the allowance for expected credit losses. The aging method is applied to accounts receivables at the business unit level to reflect shared risk characteristics, such as receivable type, customer type and geographical location. The aging method assigns accounts receivables to a level of delinquency and applies loss rates to each class based on historical loss experience. The Company also considers relevant qualitative and quantitative factors to assess whether historical loss experience should be adjusted to better reflect the risk characteristics of the current classes and the expected future loss. This assessment incorporates all available information relevant to considering the collectability of its fair valuecurrent classes, including considering economic and determined to be other-than-temporary.
Fair value measurementsbusiness conditions, default trends, changes in its class composition, among other internal and external factors. The expected credit loss estimates are adjusted for current conditions and reasonable supportable forecasts.
The carrying value
As part of the Company’s analysis of expected credit losses, it may analyze contracts on an individual basis in situations where such accounts receivable, other receivables accounts payable, accrued expensesexhibit unique risk characteristics and other current liabilities approximateare not expected to experience similar losses to the rest of their fair value due to their short-term nature. Investments classified as available-for-sale are recorded at fair value. The estimated fair value for securities held is determined using quoted market prices or broker or dealer quotations.class.
Fair value is the price that would be received to sell an asset or paid to transfer a liability in an orderly transaction between marketparticipants at the measurement date. In estimating the fair value of an asset or a liability, the Company takes into account the characteristics of the asset or liability if market participants would take those characteristics into account when pricing the asset or liability at the measurement date.
Inventory
Inventory
Inventory is comprised of raw materials, finished goods and work-in-progress such as pre-harvested cannabis plants and by-products to be extracted. The costs of growing cannabis including but not limited to labor, utilities, nutrition and irrigation, are capitalized into inventory until the time of harvest.
Inventory is statedvalued at the lower of cost orand net realizable value, determined using weighted average cost. Cost includes expenditures directlyAll direct and indirect costs related to manufacturinginventory are capitalized as they are incurred, and distributionthey are subsequently recorded in cost of goods sold on the products. Primary costs include raw materials, packaging, direct labor, overhead, shippingstatements of loss and comprehensive loss at the depreciation of manufacturing equipment and production facilities determined at normal capacity. Manufacturing overhead and related expenses include salaries, wages, employee benefits, utilities, maintenance and property taxes.
time inventory is sold. Net realizable value is defined as the estimated selling price in the ordinary course of business, less reasonably predictable costs of completion, disposal and transportation. At the end of each reporting period, the Company performs an assessment of inventory obsolescenceand records write-downs for excess and obsolete inventories based on the Company’s estimated forecast of product demand, production requirements, market conditions, regulatory environment, and spoilage. Actual inventory losses may differ from management’s estimates and such differences could be material to measure inventory at the lowerCompany’s statements of cost or net realizable value. Factors considered in the determinationfinancial position, statements of obsolescence include slow-moving or non-marketable items.loss and comprehensive loss and statements of cash flows.
Property and equipment
Property and equipment
Capital assets
Capital assets are recorded at cost net of accumulated depreciation. Assets held under capital leases are capitalized at the commencement of the lease at the lower of the present value of minimum lease payments at the inception of the lease or fair value. Depreciation is computed using theand amortized on a straight-line methodbasis over the estimated useful lives of the assets.or lease term, whichever is shorter. The estimated useful life of buildings is 20 years and the estimated useful life of property and equipment, other than buildings, ranges from three to seven years. Land is not depreciated. Leasehold improvements are amortized over the lesser of the asset’s estimated useful life or the remaining lease term.
WhenCompany’s capital assets are retired or disposed of, the cost and accumulated depreciationreviewed when impairment indicators are removed from the respective accounts and any related gain or loss is recognized.present by analyzing underlying cash flow projections. Maintenance and repairs are charged to expenseexpenses as incurred. Significant expenditures, which extendThe Company uses the useful livesfollowing ranges of assets or increase productivity, are capitalized. When significant parts of an item of property and equipment have different useful lives, they are accounted for as separate items or components of property and equipment.asset lives:
Construction in progress includes construction progress payments, deposits, engineering costs, interest expense for debt financing on long-term construction projects and other costs directly related to the construction
Asset type | Depreciation method | Depreciation term (estimated useful life) |
Production facility | Straight-line | 20 – 30 years |
Equipment | Straight-line | 3 – 25 years |
Leasehold improvements | Straight-line | Lesser of estimated useful life or lease term |
Finance lease right-of-use assets | Straight-line | Lesser of |
Intangible assets
Intangible assets are available for use,recorded at which point the depreciation of the asset commences.
Intangible assets
The Company capitalizes certain internal-use software development costs, consisting primarily of contractor costscost and employee salaries and benefits allocated to the software. Capitalization of costs incurred in connection with internally developed software commences when both the preliminary project stage is completed and management has authorized further funding for the project, based on a determination that it is probable the project will be completed and used to perform the function intended. Capitalization of costs ceases no later than the point at which the project is substantially complete and ready for its intended use. All other costs are expensed as incurred. Amortization is calculatedamortized on a straight-line basis over three years. Costs incurred for enhancements that are expected to result in additional functionalities are capitalized.
Thethe estimated useful lives are reviewed atlives. The Company uses the endfollowing ranges of each reporting period, with the effect of any changes in estimate being accounted for on a prospective basis.asset lives:
Intangible assets also include the license acquired as part of the acquisition of Alef Biotechnology SpA (“Alef”). The acquistion of Alef was accounted for as an asset acquisition as it did not meet the defintion of a business.
Asset type | Amortization term |
Customer relationships & distribution channel | 14 – 16 years |
Licences, permits & applications | 90 months – indefinite |
Intellectual property, trademarks & brands | 15 months – 25 years |
Non-compete agreements | Over term of non-compete |
Know how | 5 years |
Impairment of long-lived assets
The Company reviews long-lived assets, including capital assets and definite life intangible assets for impairment whenever events or changes in circumstances indicate that the carrying value of an asset may not be recoverable. In order to determine if assets have been impaired, assets are grouped and tested at the lowest level for which identifiable independent cash flows are available (“asset group”). An impairment loss is recognized when the sum of projected undiscounted cash flows is less than the carrying value of the asset group. The measurement of the impairment loss to be recognized is based on the difference between the fair value and the carrying value of the asset group. Fair value can may be determined using a market approach or income approach or cost approach. The reversal of impairment losses is prohibited.
Capitalization of interest
Interest incurred relating to the construction or expansion of facilities is capitalized to the construction in progress. The Company ceases the capitalization of interest when construction activities are substantially completed
Business combinations and the facility is available for commercial use.goodwill
Leases
The Company enters into various leasesaccounts for business combinations using the acquisition method in conductingaccordance with Accounting Standards Codification, ASC 805,Business Combinations which requires recognition of assets acquired and liabilities assumed, including contingent assets and liabilities, at their respective fair values on the date of acquisition.
Contingent consideration is measured at its business. Atacquisition-date fair value and included as part of the inceptionconsideration transferred in a business combination. Contingent consideration that is classified as a liability is remeasured at subsequent reporting dates, with the corresponding gain or loss recognized in profit or loss.
Non-controlling interests in the acquiree are measured at fair value on acquisition date. Acquisition-related costs are recognized as expenses in the periods in which the costs are incurred and the services are received (except for the costs to issue debt or equity securities which are recognized according to specific requirements).
Purchase price allocations may be preliminary and, during the measurement period not to exceed one year from the date of each lease,acquisition, changes in assumptions and estimates that result in adjustments to the Company evaluatesfair value of assets acquired and liabilities assumed are recorded in the lease agreementperiod the adjustments are determined.
Goodwill represents the excess of the consideration transferred for the acquisition of subsidiaries over the net of the acquisition-date amounts of the identifiable assets acquired and the liabilities assumed. Following initial recognition, goodwill is measured at cost less any accumulated impairment losses.
Impairment of goodwill and indefinite-lived intangible assets
Goodwill is allocated to determine whether the leasereporting unit in which the business that created the goodwill resides. A reporting unit is an operating segment, or capital lease. A capital leasea business unit one level below that operating segment, for which discrete financial information is a leaseprepared and regularly reviewed by segment management. We operate in four operating segments which 1) ownership ofare our reporting units, and goodwill is allocated at the property transfers tooperating segment level. The Company reviews goodwill and indefinite-lived intangible assets annually for impairment in the lessee by the end of the lease term; 2) the lease contains a bargain purchase option; 3) the lease term is equal to 75%fourth quarter, or more frequently, if events or circumstances indicate that the carrying amount of an asset may not be recoverable.
Leases
Arrangements containing leases are evaluated as an operating or finance lease at lease inception. For operating leases, the economic life of the leased property; or 4)Company recognizes an operating lease right-of-use ("ROU") asset and operating lease liability at lease commencement based on the present value of lease payments over the minimum lease paymentterm. With the exception of certain finance leases, an implicit rate of return is not readily determinable for the Company's leases. For these leases, an incremental borrowing rate is used in determining the present value of lease payments and is calculated based on information available at the inceptionlease commencement date.
The incremental borrowing rate is determined using a portfolio approach based on the rate of interest the Company would have to pay to borrow funds on a collateralized basis over a similar term. The Company references market yield curves which are risk-adjusted to approximate a collateralized rate in the currency of the lease. These rates are updated on a quarterly basis for measurement of new lease obligations.
The Company’s lease terms may include options to extend or terminate the lease when it is reasonably certain that the option will be exercised. Leases with an initial term equalsof 12 months or less are not recognized on the Company's consolidated statements of financial position. Operating lease assets are presented as right-of-use assets, and corresponding operating lease liabilities are presented within lease liabilities, on the Company’s consolidated statements of financial position. Finance lease assets are included in capital assets, and corresponding finance lease liabilities are included within current lease liabilities, on the Company’s consolidated statements of financial position.
Convertible notes receivable
Convertible notes receivables include various investments in which the Company has the right, or potential right see Note 11 (Convertible notes receivable) to convert the instrument into common stock shares of the investee are classified as available-for-sale ("AFS") and are recorded at fair value. Unrealized gains and losses during the year, net of the related tax effect, are excluded from income and reflected in other comprehensive income (loss), and the cumulative effect is reported as a separate component of shareholders’ equity until realized. The Company assesses its convertible notes receivables classified as AFS for impairment at each measurement date. Convertible notes receivables are impaired when a decline in fair value is determined to be other-than-temporary. If the cost of an investment exceeds 90%its fair value, the Company evaluates, among other factors, general market conditions, credit quality of debt instrument issuers, and the duration and extent to which the fair value is less than cost. Once a decline in fair value is determined to be other-than-temporary, an impairment charge is recorded in the statements of loss and comprehensive loss and a new cost basis for the investment is established. The Company also evaluates whether there is a plan to sell the security or it is more likely than not that the Company will be required to sell the security before recovery. If neither of the conditions exist, then only the portion of the impairment loss attributable to credit loss is recorded in the statements of net loss and the remaining amount is recorded in other comprehensive income (loss).
Long-term investments
Long-term investments include investments in equity securities of entities over which the Company does not have a controlling financial interest, joint control or significant influence and are accounted for at fair value. Equity investments without readily determinable fair values are measured at cost with adjustments for observable changes in price or impairments (referred to as the “measurement alternative”). In applying the measurement alternative, the Company performs a qualitative assessment on a quarterly basis and recognizes an impairment if there are sufficient indicators that the fair value of the leased property.equity investments is less than carrying values. Changes in value are recorded in non-operating income (loss).
An asset
Equity method investments
Investments in entities over which the Company does not have a controlling financial interest but has significant influence, are accounted for using the equity method, with the Company’s share of losses reported in loss from equity method investments on the statements of loss and a corresponding liabilitycomprehensive loss. Equity method investments are establishedrecorded at inception for capital leases. The capital lease assets are includedcost, plus the Company’s share of undistributed earnings or losses, and impairment, if any, within interest in property, plant and equipment andequity investees on the capital lease obligations are included in accrued obligations under capital lease. Operating lease payments are recognized as an expense on a straight-line basis over the lease term.statements of financial position.
Convertible Senior Notes due 2023debentures
The Company accounts for its Convertible Notes with a cash conversion featureconvertible debentures in accordance with ASC 470-20 “Debt470-20Debt with Conversion and Other Options” which requiresOptions, whereby the liability and equity components of convertible debt instruments that may be settled in cash upon conversion, including partial cash settlement, to be separatelyinstrument is initially accounted for inas a mannersingle unit of account, unless it contains a derivative that reflects the issuer’s nonconvertible debt borrowing rate. The initial proceedsmust be bifurcated from the sale of Convertible Notes are allocated between a liability componenthost contract in accordance with ASC 815-15Derivatives and an equity componentHedging – Embedded Derivatives or the substantial premium model in a manner that reflects interest expense atASC 470-20Debt – Debt with Conversion and Other Options applies. Where the rate of similar nonconvertible debt that could have been issued at such time. The equity component representssubstantial premium model applies, the excess initial proceeds received over the fair value of the liability component of the notes as of the date of issuance.premium is recorded in additional paid-in capital. The resulting debt discount is amortized over the five-year period during which the Convertible Notesconvertible notes are expected to be outstanding as additional non-cash interest expense.expenses.
Upon repurchase of convertible debt instruments, ASC 470-20470-20 requires the issuer to allocate total settlement consideration, inclusive of transaction costs, amongst the liability and equity components of the instrument based on the fair value of the liability component immediately prior to repurchase. The difference between the settlement consideration allocated to the liability component and the net carrying value of the liability component, including unamortized debt issuance costs, would be recognized as gain (loss) on extinguishment of debt in the Consolidated Statementsstatements of Net Lossloss and Comprehensive Loss.comprehensive loss. The remaining settlement consideration allocated to the equity component would be recognized as a reduction of additional paid-in capital in the Consolidated Balance Sheets.statements of financial position.
For convertible debentures with an embedded conversion feature that did not meet the equity scope exception from derivative accounting pursuant to ASC 815-15, the Company elected the fair value option under ASC 825Fair Value Measurements. When the fair value option is elected, the convertible debenture is initially recognized at fair value on the statements of financial position and all subsequent changes in fair value, excluding the impact of the change in fair value related to instrument-specific credit risk are recorded in non-operating income (loss). The changes in fair value related to instrument-specific credit risk is recorded through other comprehensive income (loss). Transaction costs directly attributable to the issuance of the convertible debenture is immediately expensed in the statements of loss and comprehensive loss.
Warrants
Warrants are accounted for in accordance with applicable accounting guidance provided in ASC 815Derivatives and Hedging – Contracts in Entity's Own Equity, as either liabilities or as equity instruments depending on the specific terms of the warrant agreement. Warrants classified as liabilities are recorded at fair value and are remeasured at each reporting date until settlement. Changes in fair value is recognized as a component of change in fair value of warrant liability in the statements of loss and comprehensive loss. Transaction costs allocated to warrants that are presented as a liability are immediately expensed in the statements of loss and comprehensive loss. Warrants classified as equity instruments are initially recognized at fair value and are not subsequently remeasured.
Fair value measurements
Fair value is defined as the price that would be received to sell an asset or paid to transfer a liability in an orderly transaction between market participants at the measurement date. The carrying values of accounts receivable, prepaids and other current assets, bank indebtedness and accounts payable and accrued liabilities approximate their fair values due to their short periods to maturity. The Company calculates the estimated fair value of financial instruments, including convertible notes receivable, long-term investments, warrant liability, contingent consideration, and convertible debentures, using quoted market prices when available. When quoted market prices are not available, fair value is determined based on valuation techniques using the best information available and may include quoted market prices, market comparables, and discounted cash flow projections.
Income taxes
Income taxes are recognized in the consolidated statements of loss and comprehensive loss and are comprised of current and deferred taxes. Current tax is recognized in connection with income for tax purposes, unrealized tax benefits and the recovery of tax paid in a prior period and measured using enacted tax rates and laws applicable to the taxation period during which the income for tax purposes arose. Deferred tax assets and liabilities are determined based on the differences between the financial reporting and the tax basis of assets and liabilities and are measured using the enacted tax rates and laws that will be in effect when the differences are expected to reverse. Management makes an assessment of the likelihood that a deferred tax asset will be realized, and a valuation allowance is provided to the extent that it is more likely than not that all or a portion of a deferred tax asset will not be realized.
The Company recognizes revenue as earneduncertain income tax positions at the largest amount that is more likely than not to be sustained upon audit by the relevant tax authority. An uncertain income tax position will not be recognized if it has less than a 50% likelihood of being sustained. A change in the recognition or measurement of an unrealized tax benefit is reflected in the period during which the change occurs.
Revenue
Revenue is recognized when the following four criteria have been met: (i)control of the promised goods, through performance obligation, is transferred to the customer in an amount that reflects the consideration we expect to be entitled to in exchange for the performance obligations or as advisory services are provided. Payments received for the goods or services in advance of performance are recognized as a contract liability.
Excise taxes remitted to tax authorities are government-imposed excise taxes on cannabis and beer. Excise taxes are recorded as a reduction of sales in net revenue in the consolidated statements of operations and recognized as a current liability within accounts payable and other current liabilities on the consolidated balance sheets, with the liability subsequently reduced when persuasive evidencethe taxes are remitted to the tax authority.
In addition, amounts disclosed as net revenue are net of an arrangement exists, (ii)excise taxes, sales tax, duty tax, allowances, discounts and rebates.
In determining the product has been deliveredtransaction price for the sale of goods, the Company considers the effects of variable consideration and the existence of significant financing components, if any.
Some contracts for the sale of goods may provide customers with a right of return, volume discount, bonuses for volume/quality achievement, or sales allowance. In addition, the Company may provide in certain circumstances, a retrospective price reduction to a customer (iii)based primarily on inventory movement. These items give rise to variable consideration. The Company uses the sales price is fixed or determinable,expected value method to estimate the variable consideration because this method best predicts the amount of variable consideration to which the Company will be entitled. The Company uses historical evidence, current information and (iv) collection is reasonably assured. Revenue is recognized net of sales incentivesforecasts to estimate the variable consideration. The Company reduces revenue and returns, after discounts for the assurance program, veterans coverage program and compassionate programs.
Direct-to-patient sales are recognized when the products are shippedrecognizes a contract liability equal to the customers. Bulk and adult-use sales under wholesale agreements are recognized based on the shipping terms of the agreements. Export sales under pharmaceutical distribution and pharmacy supply agreements are recognized when products are deliveredamount expected to be refunded to the end customerscustomer in the form of a future rebate or patients.credit for a retrospective price reduction, representing its obligation to return the customer’s consideration. The estimate is updated at each reporting period date.
Customer loyalty awards are accounted for as a separate component
Cost of the sales transaction in which they are granted. A portion of the consideration received in a transaction that includes the issuance of an award is deferred until the awards are ultimately redeemed. The allocation of the consideration to the award is based on an evaluation of the award’s estimated fair value at the date of the transaction. The customer loyalty program was discontinued in September 2017 and all customer loyalty awards expired as at December 31, 2017.goods sold
Cost of sales
Cost of salesgoods sold represents costs directly related to manufacturing and distribution of the Company’s products. Primary costs include raw materials, packaging, direct labor, overhead, shipping and handling, and the depreciationamortization of manufacturing equipment and production facilities.facilities and tariffs. Manufacturing overhead and related expenses include salaries, wages, employee benefits, utilities, maintenance and property taxes. The Company recognizes the costCost of salesgoods sold also includes inventory valuation adjustments.
General and administrative
General and administrative expenses are comprised primarily of (i) personnel related costs such as thesalaries, benefits, annual employee bonus expense and stock-based ‘compensation costs; (ii) legal, accounting, consulting and other professional fees; and (iii) corporate insurance and other facilities costs associated revenueswith our corporate and administrative locations.
Selling
Selling expenses are recognized.comprised of direct selling costs which primarily consist of (i) commissions paid to our third-party workforce, (ii) patient acquisition and maintenance fees, (iii) Health Canada’s cannabis fees and (iv) freight.
Marketing and promotion
Marketing and promotion expenses are comprised primarily of marketing and advertising expenses.
Research and development
Research and development costs are expensed as incurred. Research and development are comprised primarily of costs for clinical study costs, contracted research, consulting services, materials, supplies and other expenses incurred to sustain our overall research and development programs.
Stock-based compensation
The Company measures and recognizes compensation expense forhas an omnibus plan which includes issuances of stock options, restricted stock units (“RSUs”) and RSUs on a straight-line basis over the vesting period based on their grant date fair values.stock appreciation rights (“SARs”). The Company estimates the fair value of stock options on the date of grant using the Black-Scholes option pricing model. The fair value of RSUs is based on the share price as at date of grant. For stock optionsgrant and RSUs granted in May and June 2018, priorno SARs were issued to the Company’s IPO,date. The share-based compensation expense is based on the fair value of common stockthe stock-based awards at the grant date of grant was determined byand the Board of Directors with assistance from third-party valuation specialists.expense is recognized over the related service period following a straight-line vesting expense schedule. The Company estimates forfeitures at the time of grant and revises these estimates in subsequent periods if actual forfeitures differ from those estimates. Any revisions are recognized in the consolidated statements of loss and comprehensive loss such that the cumulative expense reflects the revised estimate.
The critical assumptions and estimates used in determining the fair value of stock-based compensation on the grant date are: fair value of common shares on the grant date, risk-free interest rate, share price volatility of comparable companies, and the expected term.
For performance-based stock options and RSUs, the Company records compensation expense over the estimated service period once the achievementadjusted for a probability factor of achieving the performance-based milestone is considered probable.milestones. At each reporting date, the Company assesses whether achievement of a milestone is considered probable,the probability factor and if so, records compensation expense based on the portion of the service period elapsed to date with respect to that milestone, with a cumulative catch-up,accordingly, net of estimated forfeitures.
Earnings (loss) per share
Basic earnings (loss) per share is computed by dividing reported net income (loss) by the weighted average number of common shares outstanding during the year. Diluted earnings (loss) per share is computed by dividing reported net income (loss) by the sum of the weighted average number of common shares and the number of dilutive potential common share equivalents outstanding during the period. Potential dilutive common share equivalents consist of the incremental common shares issuable upon the exercise of vested share options, warrants, and RSUs and the incremental shares issuable upon conversion of the convertible debentures and similar instruments. Shares of common stock outstanding under the share lending arrangement entered into in conjunction with the TLRY 27 notes, see Note 17 (Convertible debentures payable) are excluded from the calculation of basic and diluted earnings per share because the borrower of the shares is required under the share lending.
In computing diluted earnings (loss) per share, common share equivalents are not considered in periods in which a net loss is reported, as the inclusion of the common share equivalents would be anti-dilutive.
Critical accounting estimates and judgments
The preparation of the Company’s financial statements requires management to make judgments, estimates and assumptions that affect the application of policies and reported amounts of assets, liabilities, revenues and expenses. These estimates and judgements are subject to change based on experience and new information which could result in outcomes that require a material adjustment to the carrying amounts of assets or liabilities affecting future periods. Actual results may differ from these estimates. The estimates and underlying assumptions are reviewed on an ongoing basis. Revisions to accounting estimates are recognized prospectively.
Financial statement areas that require significant judgement and estimates are as follows:
Long-term investments and convertible notes receivable –The determination of fair value of the Company’s long-term investments and convertible notes receivable at other than initial cost is subject to certain limitations. Financial information for private companies in which the Company has investments may not be available and, even if available, that information may be limited and/or unreliable.
Use of the valuation approach described below may involve uncertainties and determinations based on the Company’s judgment and any value estimated from these techniques may not be realized or realizable.
Company-specific information is considered when determining whether the fair value of a long-term investment or convertible notes receivable should be adjusted upward or downward at the end of each reporting period. In addition to company-specific information, the Company will recognize remaining compensation expense with respectconsider trends in general market conditions and the share performance of comparable publicly traded companies when valuing long-term investments and convertible notes receivable.
The fair value of long-term investments and convertible notes receivable may need to be adjusted if:
• | There has been a significant subsequent equity financing provided by outside investors at a valuation different than the current value of the investee company, in which case the fair value of the investment is set to the value at which that financing took place; |
• | There have been significant corporate, political, or operating events affecting the investee company that, in management’s opinion, have a material impact on the investee company’s prospects and therefore its fair value. In these circumstances, the adjustment to the fair value of the investment will be based on management’s judgment and any value estimated may not be realized or realizable; |
• | The investee company is placed into receivership or bankruptcy; |
• | Based on financial information received from the investee company, it is apparent to the Company that the investee company is unlikely to be able to continue as a going concern; |
• | Important positive or negative management changes by the investee company that the Company’s management believes will have a positive or negative impact on the investee company’s ability to achieve its objectives and build value for shareholders. |
Adjustment to the fair value of a milestone,long-term investment and convertible notes receivable will be based upon management’s judgment and any value estimated may not be realized or realizable. The resulting values for non-publicly traded investments may differ from values that would be realized if any, overa ready market existed.
Estimated useful lives, impairment considerations and amortization of capital and intangible assets –Amortization of capital and intangible assets is dependent upon estimates of useful lives based on management’s judgment.
Goodwill and indefinite-lived intangible asset impairment testing require management to make estimates in the remaining estimated service period.impairment testing model. On at least an annual basis, the Company tests whether goodwill and indefinite-lived intangible assets are impaired. Impairment of definite long-lived assets is influenced by judgment in defining a reporting unit and determining the indicators of impairment, and estimates used to measure impairment losses
Income taxes
The Company usesreporting unit’s fair value is determined using discounted future cash flow models, which incorporate assumptions regarding future events, specifically future cash flows, growth rates and discount rates.
Stock-based compensation –The fair value of stock-based compensation expenses are estimated using the Black-Scholes option pricing model and rely on a number of assumptions including the fair value of common shares on the grant date, risk-free rate, volatility rate, annual dividend yield, the expected term, and the estimated rate of forfeiture of options granted. Volatility is estimated by using the historical volatility of the Company.
Business combinations –Judgement is used in determining a) whether an acquisition is a business combination or an asset and liabilityacquisition. We use judgement in applying the acquisition method of accounting for income taxes. Under this method, deferred taxbusiness combinations and estimates to value identifiable assets and liabilities at the acquisition date. Estimates are determinedused to determine cash flow projections, including the period of future benefit, and future growth and discount rates, among other factors. The values allocated to the acquired assets and liabilities assumed affect the amount of goodwill recorded on acquisition. Fair value of assets acquired and liabilities assumed is typically estimated using an income approach, which is based on the differences betweenpresent value of future discounted cash flows. Significant estimates in the financial reportingdiscounted cash flow model include the discount rate, rate of future revenue growth and profitability of the acquired business and working capital effects. The discount rate considers the relevant risk associated with the business-specific characteristics and the tax basesuncertainty related to the ability to achieve projected cash flows. These estimates and the resulting valuations require significant judgment. Management engages third party experts to assist in the valuation of assetsmaterial acquisitions.
Convertible debentures –The fair value of Convertible Debentures where the Company had elected the fair value option are determined using the Black-Scholes option pricing model. Assumptions and liabilitiesestimates are made in determining an appropriate conversion price, volatility, dividend yield, and arethe fair value of common stock. There is judgement in assessing what portion of the gain or loss, if any, relates to the change in the instrument-specific credit risk.
Warrant liability –The fair value of the warrant liability is measured using a Black Scholes pricing model. Assumptions and estimates are made in determining an appropriate risk-free interest rate, volatility, term, dividend yield, discount due to exercise restrictions, and the enacted tax rates and laws that will be in effect whenfair value of common stock. Any significant adjustments to the differences are expected to reverse. Management makes an assessmentunobservable inputs would have a direct impact on the fair value of the likelihood that the resulting deferred tax assets will be realized. A valuation allowance is provided when it is more likely than not that some portion or all of a deferred tax asset will not be realized.warrant liability.
The Company recognizes uncertain income tax positions at the largest amount that is more likely than not to be sustained upon audit by the relevant taxing authority. An uncertain income tax position will not be recognized if it has less than a 50% likelihood of being sustained. Changes in recognition or measurement are reflected in the period in which judgment occurs.
New accounting pronouncements not yet adopted
In May 2014, the Financial Accounting Standards Board (“FASB”) issued Accounting Standard Update (“ASU”) 2014-09, Revenue from Contracts with Customers (Topic 606), a new standard on revenue recognition. Further, the FASB has issued a number of additional ASUs regarding the new revenue recognition standard. The new standard, as amended, will supersede existing revenue recognition guidance and apply to all entities that enter into contracts to provide goods or services to customers. In August 2015, October 2021, the FASB issued ASU 2015-14, Revenue2021-08,Business Combinations (Subtopic805), Accounting for Contract Assets and Contract Liabilities from Contracts with Customers – Deferral of (“ASU 2021-08”), which is intended to improve the Effective Date, which amendsaccounting for acquired revenue contracts with customers in a business combination by addressing diversity in practice and inconsistency. ASU 2014-09 to defer2021-08 is effective for the Company beginning June 1, 2023. This update will be applied prospectively on or after the effective date by one year. For public companies,of the new standard is effective for annual reporting periods beginning after December 31, 2017, including interim periods within that reporting period. For all other entities, including emerging growth companies, this standard is effective for annual reporting periods beginning after December 15, 2018. The Company is evaluating the impact and expects to implement the provisions of ASU 2014-09 for the annual periods beginning on January 1, 2019.amendments. The Company is currently evaluating the effect of adopting this ASU on the Company’s financial statements.ASU.
New accounting pronouncements recently adopted
In January 2016, August 2020, the FASB issued ASU 2016-01, Financial2020-06,Debt—Debt with Conversion and Other Options (Subtopic470-20) and Derivatives and Hedging—Contracts in Entity’s Own Equity (Subtopic815-40): Accounting for Convertible Instruments – Overall (Subtopic 825-10) – Recognition and MeasurementContracts in an Entity’s Own Equity (“ASU 2020-06”), which amends and simplifies existing guidance in an effort to reduce the complexity of Financial Assetsaccounting for convertible instruments and Financial Liabilities. ASU 2016-01 is intended to enhance the reporting model for financial instruments to provide financial statement users ofwith more meaningful information. The Company adopted ASU 2020-06 beginning June 1, 2022 and the adoption did not have material retrospective impacts on our consolidated financial statements with more decision-useful information. For public companies, the new standard is effective for annual periods beginning after December 15, 2017, including interim periods within the fiscal year. For all other entities, including emerging growth companies, ASU 2016-01 is effective for annual periods beginning after December 15, 2018, and interim periods within those annual periods beginning after December 15, 2019. The Company is evaluating the impact and expects to implement the provisions of ASU 2016-01 for the annual periods beginning on January 1, 2019..
In February 2016, May 2021, the FASB issued ASU 2016-02, Leases2021-04,Modifications and Extinguishments (Subtopic470-50), Compensation—Stock Compensation (Topic 842)718), and Derivatives and Hedging—Contracts in Entity’s Own Equity (Subtopic815-40) (“ASU 2021-04”), which supersedes the current accounting for leases and while retaining two distinct types of leases, finance and operating, (1) requires lessees to record a right of use asset and a related liability for the rights and obligations associated with a lease, regardless of lease classification, and recognize lease expense in a manner similar to current accounting, (2) eliminates most real estate specific lease provisions, and, (3) aligns many of the underlying lessor model principles with those in the new revenue standard. Leases with a term of 12 months or less will be accounted for similar toamends existing guidance for operating leases today. For public companies, the new standard is effective for annual and interim periodsearnings per share (EPS) in fiscal years beginning after December 15, 2018. For all other entities, including emerging growth companies, this standard is effective for annual reporting periods beginning after December 15, 2019, and interim periods within fiscal years beginning after December 2020. Earlier application is permitted.accordance with Topic 260. The Company expects to implementadopted the provisionsASU beginning June 1, 2022 and the adoption of ASU 2016-02 for annual periods beginning January 1, 2020. The Company is currently evaluating the2021-04 did not have an impact of the new standard on the Company’sour consolidated financial statements.
In March 2016, November 2021, the FASB issued ASU 2016-09, Compensation – Stock Compensation2021-10,Government Assistance (Topic 718). ASU 2016-09832), Disclosures by Business Entities about Government Assistance, which is intended to simplifyincrease the transparency of government assistance including the disclosure of (1) the types of assistance, (2) an entity’s accounting for share-based payment transactions, including income tax consequences, classification of awards as either assets or liabilitiesthe assistance, and classification on the statement of cash flows. ASU 2016-09 is effective for annual periods beginning after December 15, 2017 and interim periods within annual periods beginning after December 15, 2018. The Company expects to implement the provisions of ASU 2016-09 as
of January 1, 2019. The Company is currently evaluating(3) the effect of adopting thisthe assistance on an entity’s financial statements. The Company adopted the ASU beginning June 1, 2022 and the adoption of ASU 2021-04 did not have an impact on the Company’sdisclosure in our consolidated financial statements.
In June 2016, the FASB issued ASU 2016-13, Financial Instruments – Credit Losses (Topic 326): Measurement of Credit Losses on Financial Instruments. ASU 2016-13 requires the measurement of all expected credit losses for financial assets held at the reporting date based on historical experience, current conditions and reasonable and supportable forecasts. Adoption of ASU 2016-13 will require financial institutions and other organizations to use forward-looking information to better formulate their credit loss estimates. In addition, the ASU amends the accounting for credit losses on available for sale debt securities and purchased financial assets with credit deterioration. This update will be effective for fiscal years beginning after December 15, 2020 and interim periods within fiscal years beginning after December 15, 2021. The Company expects to implement the provisions of ASU 2016-13 as of January 1, 2022. The Company is currently evaluating the effect of adopting this ASU on the Company’s financial statements.
In August 2018, the FASB issued ASU 2018-13, Disclosure Framework – Changes to the Disclosure Requirements for Fair Value Measurement (Topic 820). ASU 2018-13 adds, modifies, and removes certain fair value measurement disclosure requirements. ASU 2018-13 is effective for annual and interim periods beginning after December 15, 2019. Early adoption is permitted. The Company is currently evaluating the effect of adopting this ASU on the Company’s financial statements.
3. Investments
The Company’s short-term investments are classified as available-for-sale investments and the long-term investments are classified as either available-for-sale or cost method investments.
The following table summarizes the unrealized gains and losses and estimated fair value of our short-term investments as of December 31, 2018:
|
| Cost |
|
| Gross unrealized gains |
|
| Gross unrealized losses |
|
| Fair value |
| ||||
Treasury bills |
| $ | 30,367 |
|
| $ | 32 |
|
| $ | 64 |
|
| $ | 30,335 |
|
Total |
| $ | 30,367 |
|
| $ | 32 |
|
| $ | 64 |
|
| $ | 30,335 |
|
4. | Inventory |
Our short-term investments consist of treasury bills, which are deemed to be low risk based on their credit ratings from the major rating agencies. All our short-term investments have contractual maturities of one year or less.
The following table summarizes the unrealized gains and losses and estimated fair value of our long-term investments as of December 31, 2018:
|
| Cost |
|
| Gross unrealized gains |
|
| Gross unrealized losses |
|
| Fair value |
| ||||
| $ | 17,713 |
|
| $ | — |
|
| $ | 802 |
|
| $ | 16,911 |
| |
Total |
| $ | 17,713 |
|
| $ | — |
|
| $ | 802 |
|
| $ | 16,911 |
|
Our investment in equities are reported in long-term investments on our Consolidated Balance Sheets. The following table provides a summary of the classification of our investment in equities:
|
| December 31, |
| |||||
|
| 2018 |
|
| 2017 |
| ||
Investments in equities under available-for-sale method |
| $ | 1,845 |
|
| $ | — |
|
Investment in equities under the cost method |
|
| 15,066 |
|
|
| — |
|
Total investment in equities |
| $ | 16,911 |
|
| $ | — |
|
Total unrealized loss recognized to other comprehensive income related to the long-term available-for-sale equity securities during the year was $802.
As at December 31, 2017, the Company did not hold any short-term and long-term investments.
4. Fair Value Measurement
The Company complies with FASB ASC 820, Fair Value Measurements, for its financial assets and liabilities that are re-measured and reported at fair value at each reporting period, and non-financial assets and liabilities that are re-measured and reported at fair value at least annually.
The following table presents information about the Company’s assets that are measured at fair value on a recurring basis as of December 31, 2018 and 2017, and indicates the fair value hierarchy of the valuation techniques the Company utilized to determine such fair value. In general, fair values determined by Level 1 inputs utilize quoted prices (unadjusted) in active markets for identical assets or liabilities. Fair values determined by Level 2 inputs utilize data points that are observable such as quoted prices, interest rates and yield curves. Fair values determined by Level 3 inputs are unobservable data points for the asset or liability, and includes situations where there is little, if any, market activity for the asset or liability:
|
| Quoted prices in active markets for identical assets (Level 1) |
|
| Other observable inputs (Level 2) |
|
| Significant unobservable inputs (Level 3) |
|
| Total |
| ||||
December 31, 2018 |
|
|
|
|
|
|
|
|
|
|
|
|
|
|
|
|
Cash equivalents: |
|
|
|
|
|
|
|
|
|
|
|
|
|
|
|
|
Money market fund |
| $ | 33,111 |
|
| $ | — |
|
|
| — |
|
| $ | 33,111 |
|
Corporate bonds |
|
| 7,796 |
|
|
| — |
|
|
| — |
|
|
| 7,796 |
|
Commercial paper |
|
| 9,975 |
|
|
| — |
|
|
| — |
|
|
| 9,975 |
|
Treasury bills |
|
| 152,879 |
|
|
| — |
|
|
| — |
|
|
| 152,879 |
|
Total cash equivalents |
|
| 203,761 |
|
|
| — |
|
|
| — |
|
|
| 203,761 |
|
Investments: |
|
|
|
|
|
|
|
|
|
|
|
|
|
|
|
|
Treasury bills |
|
| 30,335 |
|
|
| — |
|
|
| — |
|
|
| 30,335 |
|
Investment in equities |
|
| 1,163 |
|
|
| 682 |
|
|
| — |
|
|
| 1,845 |
|
Total investments |
|
| 31,498 |
|
|
| 682 |
|
|
| — |
|
|
| 32,180 |
|
Total |
| $ | 235,259 |
|
| $ | 682 |
|
| $ | — |
|
| $ | 235,941 |
|
The cash equivalents carrying amount as of 2018 includes an unrealized gain of $69, which is recorded in other comprehensive income. As at December 31, 2017 the Company did not hold any assets that were measured at fair value.
5. Inventory
Inventory is comprised of the following items:of:
|
| December 31, |
| |||||
|
| 2018 |
|
| 2017 |
| ||
Raw materials |
| $ | 2,132 |
|
| $ | 163 |
|
Work-in-process – dry cannabis |
|
| 9,982 |
|
|
| 1,396 |
|
Work-in-process – cannabis extracts |
|
| 2,830 |
|
|
| 30 |
|
Finished goods – dry cannabis |
|
| 113 |
|
|
| 3,501 |
|
Finished goods – cannabis extracts |
|
| 1,083 |
|
|
| 2,158 |
|
Finished goods – accessories |
|
| 71 |
|
|
| 173 |
|
Total |
| $ | 16,211 |
|
| $ | 7,421 |
|
May 31, | May 31, | |||||||
2023 | 2022 | |||||||
Plants | $ | 10,884 | $ | 14,521 | ||||
Dried cannabis | 89,801 | 116,739 | ||||||
Cannabis trim | 322 | 592 | ||||||
Cannabis derivatives | 9,229 | 24,685 | ||||||
Cannabis vapes | 1,173 | 542 | ||||||
Packaging and other inventory items | 19,997 | 21,691 | ||||||
Wellness inventory | 11,164 | 13,275 | ||||||
Beverage alcohol inventory | 27,837 | 27,840 | ||||||
Distribution inventory | 30,144 | 25,644 | ||||||
Total | $ | 200,551 | $ | 245,529 | ||||
Inventory is written down for any obsolescence, spoilage and excess inventory or when the net realizable value of inventory is less than the carrying value. ForDuring the year ended DecemberMay 31, 2018,2023, the Company recorded write-downs relatedcharges for inventory and inventory-related write downs as a component of cost of sales. Cannabis inventory was written down by $55,000 for the year ended May 31, 2023, and by $59,500 for the year ended May 31, 2022. This charge was driven by the decision of management to repurpose a portion of our existing supply of dried cannabis inventory. There were no write downs for Distribution inventory within work-in-process of $4,561 (2017 – $617)for the year ended May 31, 2023, however in the year ended May 31, 2022 Distribution inventory was written down by $7,500. Included in cost of sales.goods sold for the year ended May 31, 2023 is $4,482 fair value step up adjustment under purchase accounting (PPA) for beverage alcohol inventory sold in the year and $2,214 for the year ended May 31, 2022.
6. Property
5. | Related party transactions |
In the normal course of business, the Company enters into related party transactions with certain entities under common control and Equipment, Netjoint ventures as detailed below.
Property
RIKI Ventures, LLC
The Company entered into a strategic partnership on December 12, 2022, with RIKI Ventures, LLC in which the Company has a joint venture arrangement with a 50% ownership and equipment, netvoting interest. This venture is held by our craft beverage company Breckenridge. During the year there were no transactions with this entity.
Docklight LLC (“Docklight”) royalty and management services
The Company previously paid Docklight a royalty fee pursuant to a brand licensing agreement which provided the Company with exclusive rights in Canada for the use of certain adult-use brands up until the Company returned the brand to Docklight. The Company has since terminated the agreement Docklight see Note 27 (Commitments and contingencies). During the year ended May 31, 2023, 2022 and 2021 royalty fees of $nil, $1,430 and $125, respectively were recorded within selling expenses in the statements of loss and comprehensive loss. While historically Docklight was considered a related party, as of May 31, 2023, Docklight is no longer a defined related party.
Cannfections Group Inc. (“Cannfections”)
The Company has a joint venture arrangement with a 50% ownership and voting interest in Cannfections. During the year, the Company terminated the Supply Agreement with Cannfections and will not be transacting with them in future periods despite the joint venture arrangement remaining active. The Company is currently in arbitration with the other party that has an ownership interest in Cannfections in association with this termination. During the year ended May 31, 2023, 2022 and 2021, co-manufacturing fees on edible cannabis products were $1,377, $2,560, and $1,370 respectively and were recorded within cannabis costs of goods sold in the statements of loss and comprehensive loss.
6. | Capital assets |
Capital asset consisted of the following:
|
| December 31, |
| |||||
|
| 2018 |
|
| 2017 |
| ||
Land |
| $ | 4,498 |
|
| $ | 2,547 |
|
Buildings and leasehold improvements |
|
| 51,111 |
|
|
| 19,569 |
|
Laboratory and manufacturing equipment |
|
| 6,131 |
|
|
| 2,815 |
|
Office and computer equipment |
|
| 970 |
|
|
| 571 |
|
Assets under capital lease |
|
| 9,661 |
|
|
| 9,191 |
|
Construction in process |
|
| 15,343 |
|
|
| 9,872 |
|
|
|
| 87,714 |
|
|
| 44,565 |
|
Less: accumulated depreciation and amortization |
|
| (7,500 | ) |
|
| (4,580 | ) |
Total |
| $ | 80,214 |
|
| $ | 39,985 |
|
May 31, | May 31, | |||||||
2023 | 2022 | |||||||
Land | $ | 30,635 | $ | 31,882 | ||||
Production facility | 344,627 | 453,412 | ||||||
Equipment | 185,422 | 254,486 | ||||||
Leasehold improvement | 7,753 | 7,455 | ||||||
Construction in progress | 8,048 | 7,505 | ||||||
| $ | 576,485 | $ | 754,740 | |||||
Less: accumulated amortization | (146,818 | ) | (167,241 | ) | ||||
Total | $ | 429,667 | $ | 587,499 | ||||
Depreciation expense included
The Company recorded non-cash impairments of $81,500 on its production facility in cost of sales relating to manufacturing equipmentCanada and production facilities for the year ended December 31, 2018 is $1,964 (2017 – $1,303 and 2016 – $1,247). Depreciation expense included in general administrative expenses related to general office space and$22,500 on its equipment for the year ended DecemberMay 31, 2018 is $149 (2017 – $952023, which the Company has temporarily made idle in order to reduce cultivation costs and 2016 – $92).right-size the Company's production to align with current and projected demand. The impairment was calculated based on the excess of carrying value over fair value which was determined using a market approach. A reasonably possible change in any of the inputs within the determination of fair value would not result in a material change to the impairment recorded.
7. | Leases |
The Company has operating leases for facilities, office spaces, production equipment and vehicles.
Leases have varying terms with remaining depreciation is included in inventory.lease terms of up to approximately 20 years. Certain of our lease arrangements provide us with the option to extend or to terminate the lease early.
The table below presents the lease-related assets and liabilities recorded on the balance sheet.
Classification on Balance Sheet | May 31, 2023 | May 31, 2022 | |||||||
Assets | |||||||||
Total Operating right-of-use asset | Right of use assets | $ | 5,941 | $ | 12,996 | ||||
Liabilities | |||||||||
Current: | |||||||||
Operating lease liability | Accrued lease obligations - current | $ | 2,423 | $ | 6,703 | ||||
Non-current: | |||||||||
Operating lease liability | Accrued lease obligations - non-current | 7,936 | 11,329 | ||||||
Total lease liabilities | $ | 10,359 | $ | 18,032 | |||||
For the year ended DecemberMay 31, 2018, there is $158 (2017 – $34)2023 the Company had $3,140 of capitalized interestoperating lease expenses which included in construction-in-progress.an offset of $662 for sublease income compared to $3,499 and $553 respectively for the year ended May 31, 2022.
The following table presents the future undiscounted payment associated with lease liabilities as of May 31, 2023:
Operating | ||||
leases | ||||
2024 | $ | 4,106 | ||
2025 | 3,295 | |||
2026 | 3,486 | |||
2027 | 3,412 | |||
Thereafter | 4,012 | |||
Total minimum lease payments | $ | 18,311 | ||
Imputed interest | (7,952 | ) | ||
Obligations recognized | $ | 10,359 | ||
8. | Intangible assets |
7. Intangible Assets
Intangible assets are comprised of the following items:items
|
|
|
|
|
| December 31, |
| |||||||||||||||||||||
|
|
|
|
|
| 2018 |
|
| 2017 |
| ||||||||||||||||||
|
| Weighted Average Amortization Period (in years) |
|
| Cost |
|
| Accumulated Amortization |
|
| Net |
|
| Cost |
|
| Accumulated Amortization |
|
| Net |
| |||||||
Amortizing intangible assets: |
|
|
|
|
|
|
|
|
|
|
|
|
|
|
|
|
|
|
|
|
|
|
|
|
|
|
|
|
Website |
|
| 3 |
|
| $ | 3,755 |
|
| $ | 2,253 |
|
| $ | 1,502 |
|
| $ | 2,813 |
|
| $ | 1,879 |
|
| $ | 934 |
|
Total |
|
|
|
|
|
| 3,755 |
|
|
| 2,253 |
|
|
| 1,502 |
|
|
| 2,813 |
|
|
| 1,879 |
|
|
| 934 |
|
Other intangible assets: |
|
|
|
|
|
|
|
|
|
|
|
|
|
|
|
|
|
|
|
|
|
|
|
|
|
|
|
|
Alef license |
|
| — |
|
|
| 2,984 |
|
|
| — |
|
|
| 2,984 |
|
|
| — |
|
|
| — |
|
|
| — |
|
Total |
|
|
|
|
|
| 2,984 |
|
|
| — |
|
|
| 2,984 |
|
|
| — |
|
|
| — |
|
|
| — |
|
Total intangible assets |
|
|
|
|
| $ | 6,739 |
|
| $ | 2,253 |
|
| $ | 4,486 |
|
| $ | 2,813 |
|
| $ | 1,879 |
|
| $ | 934 |
|
May 31, | May 31, | |||||||
2023 | 2022 | |||||||
Customer relationships & distribution channel | $ | 614,062 | $ | 617,437 | ||||
Licenses, permits & applications | 366,793 | 377,897 | ||||||
Non-compete agreements | 12,394 | 12,512 | ||||||
Intellectual property, trademarks, knowhow & brands | 583,468 | 634,997 | ||||||
| 1,576,717 | 1,642,843 | |||||||
Less: accumulated amortization | (187,088 | ) | (154,124 | ) | ||||
Less: impairments | (415,844 | ) | (210,844 | ) | ||||
Total | $ | 973,785 | $ | 1,277,875 | ||||
The Company recorded non-cash impairments of $110,000 of its customer relationships & distribution channel, $55,000 of its licenses, permits & applications, which were considered indefinite-lived intangible assets and $40,000 of its intellectual property, trademarks, knowhow & brands during the Company's third quarter ended February 28, 2023, as a result of the decline in market share in its Canadian cannabis with certain product lines and customers. For the year ended May 31, 2022, as a result of delays in product registrations in Latin America and changes in market opportunities, causing a shift in our strategic priorities, management recorded a non-cash impairment of $110,033 of licenses, permits and applications and $85,471 of intellectual property, trademarks, knowhow & brands, representing all of the intangible asset values related to those entities, and discounted cash flows.
As of May 31, 2023, included in licenses, permits & applications is $181,093 of indefinite-lived intangible assets. As of May 31, 2022, there was $248,411 of indefinite-lived intangible assets included in Licenses, permits & applications.
In calculating the 2023 impairment amount, using an income approach, the Company used a discount rate of 13.50%, increased from 11.21% used in the May 31, 2022 annual assessment, a terminal growth rate of 2%-5% consistent with the rate used in the May 31, 2022 annual assessment, and an average revenue growth rate of 0%-40% over 5 years to correlate with the cash flows anticipated with the individual intangible assets that were assessed, while these assets have not been assessed individually in the past the associated cash flows were included in the May 31, 2022 goodwill annual assessment which used an average growth rate of 46%. A reasonably possible change in any of the inputs within the determination of fair value would not result in a material change to the impairment recorded.
The Company performed the annual impairment test during the fourth quarter ended May 31, 2023, and determined there was no additional impairments. The Company used a discount rate of 13.50%, a terminal growth rate of 2%-5% and an average revenue growth rate of 0%-40% over 5 years. A reasonably possible change in any of the inputs within the determination of fair value would not result in a material change to the impairment recorded.
Estimated amortization expense for each of the five succeeding fiscal years and thereafter is as follows:
Amortization | ||||
2024 | $ | 74,169 | ||
2025 | 72,502 | |||
2026 | 72,502 | |||
2027 | 72,502 | |||
2028 | 72,502 | |||
Thereafter | 428,515 | |||
Total | $ | 792,692 | ||
9. | Business Acquisitions |
Acquisition of Double Diamond Distillery LLC (d/b/a Breckenridge Distillery)
On December 7, 2021, the Company through its wholly-owned subsidiary Four Twenty Corporation, completed the purchase of all the membership interests of Double Diamond Distillery LLC (d/b/a Breckenridge Distillery), a Colorado limited liability company and distilled spirits brand located in Breckenridge, Colorado (the “Breckenridge Acquisition”). As consideration for the Breckenridge Acquisition, the Company paid a purchase price in an aggregate amount equal to $114,068, which purchase price was satisfied through the issuance of 12,540,479 shares of Tilray’s common shares.
The table below summarizes the fair value of the assets acquired and the liabilities assumed at the effective acquisition date.
Amount | ||||
Consideration | ||||
Shares | $ | 114,068 | ||
Net assets acquired | ||||
Current assets | ||||
Cash and cash equivalents | 326 | |||
Accounts receivable | 2,128 | |||
Prepaids and other current assets | 367 | |||
Inventory | 20,351 | |||
Long-term assets | ||||
Capital assets | 11,179 | |||
Customer relationships (15 years) | 9,800 | |||
Intellectual property, trademarks & brands (15 years) | 69,950 | |||
Goodwill | 2,797 | |||
Total Assets | 116,898 | |||
Current liabilities | ||||
Accounts payable and accrued liabilities | 2,228 | |||
Long-term liabilities | ||||
Deferred tax liability | 602 | |||
Total liabilities | 2,830 | |||
Total net assets acquired | $ | 114,068 | ||
The goodwill of $2,797 is primarily related to factors such as synergies and market opportunities and is reported under the Company’s Beverage alcohol segment. Revenue for the Company would have been higher by approximately $12,000 for the year ended May 31, 2022, if the acquisition had taken place on June 1, 2021. Net loss and comprehensive net loss would have increased by approximately $3,000 for the year ended May 31, 2022, if the acquisition had taken place on June 1, 2021, primarily as a result of amortization of the intangible assets acquired.
Acquisition ofMontauk Brewing Company, Inc.
On November 7, 2022, Tilray acquired Montauk Brewing Company, Inc. (“Montauk”), a leading craft brewer company based in Montauk, New York. As consideration for the acquisition of Montauk, and after giving effect to post-closing adjustments, the Company paid an aggregate amount equal to $35,123. This purchase price was satisfied through payment of $28,701 in cash and $6,422 from the issuance of 1,708,521 shares of Tilray's common stock. In the event that Montauk achieves certain volume and/or EBITDA targets on or before December 31, 2025, the stockholders of Montauk shall be eligible to receive additional contingent cash consideration of up to $18,000. The Company determined that the closing date fair value of this contingent consideration was $10,245 based on the inputs disclosed in Note 28 (Financial risk management and financial instruments). In connection with this transaction, the Company is leveraging SweetWater’s existing nationwide infrastructure and Montauk’s northeast influence to significantly expand our distribution network and drive profitable growth in our beverage-alcohol segment. This distribution network is part of Tilray’s strategy to leverage our growing portfolio of CPG brands and ultimately to launch THC-based product adjacencies upon federal legalization in the U.S.
The Company is in the process of assessing the fair value of the net assets acquired and, as a result, the fair value of the net assets acquired may be subject to adjustments pending completion of final valuations and post-closing adjustments. The table below summarizes preliminary estimated fair value of the assets acquired and the liabilities assumed at the effective acquisition date. During the six months ended May 31, 2023, the Company recorded measurement period adjustments to its initial allocation of purchase price as a result of ongoing valuation procedures on assets and liabilities assumed, included: (i) an increase in the cash consideration of $13, related to finalized working capital calculations; (ii) an increase to customer relationships of $1,970; (iii) an increase to intellectual property, trademarks & brand of $1,220; (iii) a decrease to non-compete agreements of $1,240; (ii) an increase in other liabilities of $3,750, related to identified unfavorable contracts with third party production companies; (ii) a decrease in deferred tax liability of $1,617; and (iii) an increase to goodwill of $196 due to the incremental period adjustments. The impact of measurement period adjustments to the results of operations was immaterial.
Amount | ||||
Consideration | ||||
Cash | $ | 28,701 | ||
Shares | 6,422 | |||
Contingent consideration | 10,245 | |||
Net assets acquired | ||||
Current assets | ||||
Cash and cash equivalents | 1,983 | |||
Accounts receivable | 1,116 | |||
Prepaids and other current assets | 467 | |||
Inventory | 1,570 | |||
Long-term assets | ||||
Capital assets | 420 | |||
Customer relationships (15 years) | 18,540 | |||
Intellectual property, trademarks & brands (15 years) | 13,650 | |||
Goodwill | 17,803 | |||
Total Assets | 55,549 | |||
Current liabilities | ||||
Accounts payable and accrued liabilities | 1,580 | |||
Long-term liabilities | ||||
Deferred tax liability | 4,851 | |||
Other liabilities | 3,750 | |||
Total liabilities | 10,181 | |||
Total net assets acquired | $ | 45,368 | ||
The goodwill of $17,803 is primarily related to factors such as synergies and market opportunities and is reported under the Company’s Beverage alcohol segment. Revenue for the Company would have been higher by approximately $9,000 and $15,000 for the years ended May 31, 2023 and 2022 respectively, if the acquisition had taken place on June 1, 2021. Net loss and comprehensive net loss would have increased by approximately $1,700 for the year ended May 31, 2023, and 2022 if the acquisition had taken place on June 1, 2021, primarily as a result of amortization of the intangible assets acquired. This unaudited pro forma financial information does not reflect the realization of any expected ongoing synergies relating to the integration of Montauk.
10. | Goodwill |
The following table shows the carrying amount of goodwill:
May 31, | May 31, | |||||||
Reporting Unit | 2023 | 2022 | ||||||
Cannabis | $ | 2,640,669 | $ | 2,640,669 | ||||
Distribution | 4,458 | 4,458 | ||||||
Beverage alcohol | 120,802 | 102,999 | ||||||
Wellness | 77,470 | 77,470 | ||||||
Effect of foreign exchange | 7,875 | 39,640 | ||||||
Impairments | (842,431 | ) | (223,931 | ) | ||||
Total | $ | 2,008,843 | $ | 2,641,305 | ||||
As of February 28, 2023, based upon a combination of factors including a sustained decline in the Company’s market capitalization below the Company’s carrying value, coupled with challenging macro-economic conditions, most particularly the rising interest rate environment and slower than anticipated progress in global cannabis legalization, the Company concluded that it is more likely than not, that the fair value of intangible assets asour reporting units was less than their carrying amounts. Accordingly, the Company valued the fair value of December 31, 2018 includes $43 (December 31, 2017 – $381)each reporting segment by using the income approach, which estimates the fair value of intangible assets under construction, relatingeach reporting unit based on the future discounted cash flows. Upon updating the Company’s forecasted cash flows there were no impairments identified from changes in management’s forecasts, however, due to expenditures incurred to develop additional functionalitiesthe increased borrowing rates and the decline of the company’s market capitalization, the Company adjusted the Company specific risk premium which resulted in the non-cash impairment charges of $603,500 of cannabis goodwill and $15,000 of wellness goodwill for the patient portal.year ended May 31, 2023. The non-cash charge has no impact on the Company’s compliance with debt covenants, its cash flows or available liquidity.
Intangible asset additionsIn the Company's cannabis goodwill assessment the Company used a discount rate of 13.50%, increased from 11.21% used in 2018the May 31, 2022 annual assessment, a terminal growth rate of 5% consistent with the rate used in the May 31, 2022 annual assessment, and an average revenue growth rate of 40% over 5 years as a result of anticipated federal legalization in various countries, decreased from 46% used in the May 31, 2022 annual assessment. A 1% increase in the discount rate would result in an additional $300,000 in impairment, a 1% decrease in the terminal growth rate would result in an additional $250,000 in impairment and a 5% decrease in the average growth rate would result in an additional $200,000 in impairment.
In the Company's wellness goodwill assessment the Company used a discount rate of 11.80%, increased from 10% used in the May 31, 2022 annual assessment, a terminal growth rate of 3% consistent with the rate used in the May 31, 2022 annual assessment, and an average revenue growth rate of 10% over 5 years, consistent with the rate used in the May 31, 2022 annual assessment. A 1% increase in the discount rate would result in an additional $14,000 in impairment, a 1% decrease in the terminal growth rate would result in an additional $10,000 in impairment and a 5% decrease in the average growth rate would result in an additional $5,000 in impairment.
As of May 31, 2023, the Company completed its annual test for impairment, the Company used discount rates between 11.80% and 14.50%, terminal growth rates 2% and 5%, and average revenue growth rates between 2% and 40%. Based on the discounted cash flows there was no further impact from the February 28, 2023 assessment, and determined there were no additional impairments. A 1% increase in the discount rates would result in an additional $200,000 in impairment, a 1% decrease in the terminal growth rates would result in an additional $100,000 in impairment and a 5% decrease in the average growth rates would result in an additional $300,000 in impairment.
For the year ended May 31, 2022, the Company recognized impairment charges of $182,736 in cannabis goodwill. This impairment charge was related to changes in market opportunities, causing a shift in our strategic priorities, and market conditions inclusive of higher rates of borrowing and lower foreign exchange rates.
11. | Convertible notes receivable |
Convertible notes receivable is comprised of the following investments:
May 31, | May 31, | |||||||
2023 | 2022 | |||||||
HEXO Convertible Note | $ | 28,720 | $ | — | ||||
MedMen Convertible Note | 74,681 | 111,200 | ||||||
Total convertible notes receivable | 103,401 | 111,200 | ||||||
Less - current portion | — | — | ||||||
Total convertible notes receivable, non current portion | $ | 103,401 | $ | 111,200 | ||||
HEXO Corp. ("HEXO")
On July 12, 2022, the Company closed a strategic alliance with HEXO, pursuant to which the Company acquired the HEXO Convertible Note from HT Investments MA LLC (“HTI”). At the time of closing, the HEXO Convertible Note had a principal balance of $173,700, which is to be repaid and or redeemed at 110% of the outstanding principal balance. The purchase price paid to HTI for the HEXO Convertible Note was $157,272. The purchase price paid to HTI was satisfied by Tilray's issuance of (i) a newly-issued $50,000 convertible promissory note ("HTI Convertible Note"), see Note 17 (Convertible debentures payable) and (ii) the remaining balance was paid through the issuance of 33,314,412 shares of Tilray's common stock, par value $0.0001 (collectively, the “HTI Share Consideration”). The HEXO Convertible Note bears interest at a rate of 5.0% per annum, calculated daily, which is payable to Tilray on a semi-annual basis. Interest payments made under the HEXO Convertible Note will be paid in cash until July 12, 2023 and, thereafter, such interest shall accrue but be added to the principal amount. The HEXO Convertible Note has a maturity date of May 1, 2026. Subject to certain limitations and adjustments, the HEXO Convertible Note was convertible into HEXO Common Shares at Tilray's option at any time prior to the second scheduled trading day prior to the maturity date, at a conversion price of CAD$5.60 per HEXO Common share as determined the day before exercise, including all capitalized interest. HEXO has the ability to force the conversion if the daily VWAP per common share is equal to or exceeds $42.00 per share for twenty consecutive trading days. The conversion price was updated on December 19, 2022, from CAD$0.40 to CAD$5.60 to reflect HEXO's 14:1 reverse stock split. Under the HEXO Convertible Note, the Company held a first-priority security interest on substantially all of HEXO’s assets. In the event of a default on the HEXO Convertible Note, the Company would be entitled to exercise its rights as a secured creditor, and the Note would become redeemable at 115% of the outstanding principal balance.
All third-party transaction costs associated with the acquisition of these notes were reimbursed by HEXO. During year ended May 31, 2023, in connection with the HEXO Convertible Note, the Company recognized interest income of $7,720, and an other-than-temporary change in fair value of the HEXO Convertible Note, which resulted in a loss of $128,552 for the year ended May 31, 2023. Due to changes in HEXO's share price and operations, which culminated in HEXO's assessment of a going concern issue regarding HEXO's ability to meet their minimum liquidity covenant, resulting in the Company increasing the forfeiture rate to 75% on the HEXO Convertible Note.
The HTI Share Consideration included a licence acquiredpurchase price derivative, where the consideration paid is adjusted based on the sum of the VWAP of the Company's common stock for the 44 trading days after the issuance of the shares. The purchase price derivative is settled through the issuance of additional shares of the Company if the share price declined, or a cash payment back to the Company if the share price increased over the applicable period. On issuance this was valued at $nil. The subsequent change in fair value resulted in a gain of $18,256 due to the share price increasing, which was recorded in Transaction (income) costs, and was collected in cash by the Company during the period ended May 31, 2023.
The fair value of the HEXO Convertible Note was determined using the Black-Scholes model using the following assumptions: the risk-free rate of 3.50%; expected life of the convertible note; volatility of 90% based on comparable companies; forfeiture rate of 75%; dividend yield of nil and the exercise price of the respective conversion feature.
Concurrent with the aforementioned purchase of the HEXO Convertible Note, the Company and HEXO also entered into various commercial transaction agreements as described in Note 29 (Segment reporting). On April 10, 2023, we entered into an Arrangement Agreement with HEXO to acquire all of the issued and outstanding common shares of HEXO, upon closing this transaction, these convertible notes receivable were converted into shares of HEXO, as described in Note 30 (Subsequent events).
MedMen Enterprises Inc. (“MedMen”)
On August 31, 2021, the Company issued 9,817,061 shares valued at $117,804 to acquire 68% interest in Superhero Acquisition L.P. (“SH Acquisition”), which purchased a senior secured convertible note (the "MedMen Convertible Note"), together with certain associated warrants to acquire Class B subordinate voting shares of MedMen, in the principal amount of $165,799. The total purchase price including non-controlling interests contribution was $170,799, the MedMen Convertible Note bears interest at the Secured overnight financing rate ("SOFR") plus 6%, with a SOFR floor of 2.5% and, any accrued interest is added to the outstanding principal amount, and is to be paid at maturity of the MedMen Convertible Note. SH Acquisition was also granted “top-up” rights enabling it (and its limited partners) to maintain its percentage ownership (on an “as-converted” basis) in the event that MedMen issues equity securities upon conversion of convertible securities that may be issued by MedMen. The Company’s ability to convert the MedMen Convertible Note and exercise the Warrants is dependent upon U.S. federal legalization of cannabis (a “Triggering Event”) or Tilray’s waiver of such requirement as well as any additional regulatory approvals. The MedMen Convertible Note has a maturity date of August 17, 2028.
During the year ended May 31, 2023, in connection with the MedMen Convertible Note, the Company recognized an other-than-temporary change in fair value, which resulted in a non-cash impairment expense of $117,778 which includes the reversal of the fair value adjustments which were previously recorded in accumulated other comprehensive loss. As a result, of the deterioration of capital market conditions from increased interest rates and recent delays in US Federal cannabis legalization, the Company increased the forfeiture rate to 35% on the MedMen Convertible Note and recorded the aforementioned loss on the MedMen Convertible Notes through impairments.
The Company recognized interest income, which is included as part of the Alef acquisition. convertible debentures in the amount of $10,480 for the year ended May 31, 2023. The Company also recognized an unrealized gain (loss) on convertible notes receivable in other comprehensive income of $70,779 and ($70,779) for the year ended May 31, 2023 and May 31, 2022 respectively.
The fair value of the license is $2,984. Refer toMedMen Convertible Note 16 for detail description.was determined using the Black-Scholes model using the following assumptions: the risk-free rate of 3.50%; expected life of the convertible note; volatility of 70% based on comparable companies; forfeiture rate of 35%; dividend yield of nil; probability of legalization between 0% and 60%; and, the exercise price of the respective conversion feature.
The amortization expense for the next five years on intangibles assets in use are as follows: 2019 – $731; 2020 – $431; 2021 – $340; and thereafter – nil.
12. | Long-term investments |
8. Accounts Payable and Accrued Expenses
Accounts payable and accrued expensesLong-term investments are comprised of the following items:
|
| December 31, |
| |||||
|
| 2018 |
|
| 2017 |
| ||
Accounts payable - trade |
| $ | 9,716 |
|
| $ | 5,563 |
|
Accounts payable - related parties |
|
| 933 |
|
|
| — |
|
Accrued interest on convertible senior notes due 2023 |
|
| 5,302 |
|
|
| — |
|
Accrued legal fees |
|
| 565 |
|
|
| 10 |
|
Accrued payroll |
|
| 3,278 |
|
|
| 610 |
|
Other accrued expenses |
|
| 5,673 |
|
|
| 1,401 |
|
Total |
| $ | 25,467 |
|
| $ | 7,584 |
|
May 31, | May 31, | |||||||
2023 | 2022 | |||||||
Equity investments measured at fair value | $ | 2,144 | $ | 4,347 | ||||
Equity investments under measurement alternative | 5,651 | 5,703 | ||||||
Total | $ | 7,795 | $ | 10,050 | ||||
9. Long-Term DebtThe Company’s equity investments at fair value consist of publicly traded shares, equity interest in non-traded companies and warrants held by the Company. The Company’s equity investments under measurement alternative include equity investments without readily determinable fair values. For the year ended May 31, 2023 the Company received proceeds of $nil on the sale of investments (2022-$nil,2021-$8,430) and recognized $2,366 in unrealized losses due to the change in fair value of investments (2022-$6,731 2021-$1,567), the remaining change in long-term investments is a result of currency translation recognized in other comprehensive income.
Long-term debt
13. | Income taxes and deferred income taxes |
Loss before income taxes includes the following components:
For the year ended May 31, | ||||||||||||
2023 | 2022 | 2021 | ||||||||||
United States | $ | (506,984 | ) | $ | (233,697 | ) | $ | (7,814 | ) | |||
Canada | (912,717 | ) | (81,772 | ) | (323,964 | ) | ||||||
Other countries | (30,480 | ) | (125,205 | ) | (13,208 | ) | ||||||
| $ | (1,450,181 | ) | $ | (440,674 | ) | $ | (344,986 | ) | ||||
The (recoveries) expense for income taxes consists of:
For the year ended May 31, | ||||||||||||
2023 | 2022 | 2021 | ||||||||||
Current: | ||||||||||||
United States | $ | 226 | 262 | $ | — | |||||||
Canada | 26,290 | 23,268 | 15,227 | |||||||||
Other countries | (62 | ) | 479 | 697 | ||||||||
| $ | 26,454 | $ | 24,009 | $ | 15,924 | |||||||
Deferred: | ||||||||||||
United States | $ | (4,055 | ) | $ | 520 | $ | 1,517 | |||||
Canada | (24,364 | ) | (17,154 | ) | (30,111 | ) | ||||||
Other countries | (5,216 | ) | (13,917 | ) | 3,698 | |||||||
| $ | (33,635 | ) | $ | (30,551 | ) | $ | (24,896 | ) | ||||
Income tax benefits, net | $ | (7,181 | ) | $ | (6,542 | ) | $ | (8,972 | ) | |||
A reconciliation of income taxes at the statutory rate with the reported taxes is as follows:
|
| December 31, |
| |||||
|
| 2018 |
|
| 2017 |
| ||
Mortgage payable, due January 2019, annual interest 11.5% |
| $ | — |
|
| $ | 9,537 |
|
Unamortized deferred financing costs |
|
| — |
|
|
| (105 | ) |
|
|
| — |
|
|
| 9,432 |
|
Less current portion of long-term debt |
|
| — |
|
|
| (9,432 | ) |
Total |
| $ | — |
|
| $ | — |
|
For the year ended May 31, | ||||||||||||
2023 | 2022 | 2021 | ||||||||||
Loss before net income taxes: | $ | (1,450,181 | ) | $ | (440,674 | ) | $ | (344,986 | ) | |||
Income tax benefits at statutory rate | (304,538 | ) | (92,542 | ) | (72,408 | ) | ||||||
Tax impact of foreign operations | (25,857 | ) | 81,316 | (19,016 | ) | |||||||
Foreign exchange and other | 13,434 | 14,941 | 1,011 | |||||||||
Non-deductible expenses | 3,982 | 6,404 | (1,347 | ) | ||||||||
Non-deductible (taxable) losses | 23,150 | 748 | 45,230 | |||||||||
Changes in enacted rates | (816 | ) | — | 135 | ||||||||
Change in fair value of warrant liability | (2,612 | ) | (13,359 | ) | (259 | ) | ||||||
Stock based and other compensation | — | 994 | 2,902 | |||||||||
Change in valuation allowance | 285,698 | 17,255 | 46,007 | |||||||||
Non deductible dividend | — | — | (755 | ) | ||||||||
Impact on convertible debenture and other differences | 378 | (22,299 | ) | — | ||||||||
Effect of transaction | — | — | (10,472 | ) | ||||||||
Income tax benefits, net | $ | (7,181 | ) | $ | (6,542 | ) | $ | (8,972 | ) | |||
The following table summarizes the components of deferred tax:
May 31, | ||||||||
2023 | 2022 | |||||||
Deferred assets | ||||||||
Operating loss carryforwards - United States | $ | 85,259 | $ | 77,868 | ||||
Operating loss carryforwards - Canada | 145,111 | 132,293 | ||||||
Operating loss carryforwards - Other Countries | 18,787 | 15,606 | ||||||
Capital loss carryforwards | 34,355 | 38,087 | ||||||
Intangible assets | 244,227 | 150,543 | ||||||
Property and equipment | 46,400 | 20,592 | ||||||
Currently nondeductible interest | 2,812 | 7,165 | ||||||
Investments and convertible notes receivable | 66,718 | 19,055 | ||||||
Investment tax credits and related pool balance | 22,054 | 21,590 | ||||||
Other | 50,074 | 26,976 | ||||||
Total Deferred tax assets | 715,797 | 509,775 | ||||||
Less valuation allowance | (625,368 | ) | (354,071 | ) | ||||
Net deferred tax assets | 90,429 | 155,704 | ||||||
Deferred tax liabilities | ||||||||
Property and equipment | (18,129 | ) | (38,387 | ) | ||||
Intangible assets | (225,460 | ) | (305,577 | ) | ||||
Convertible Senior Notes Due 2023 | (14,204 | ) | (8,378 | ) | ||||
Total deferred tax liabilities | (257,793 | ) | (352,342 | ) | ||||
Net deferred tax liability | $ | (167,364 | ) | $ | (196,638 | ) | ||
The Tax Cuts and Jobs Act (2017 Tax Act) was enacted on December 22, 2017 and reduced the U.S. statutory federal corporate tax rate from 35% to 21%. The Tax Act also contains additional provisions that are effective for the company in 2018, including a new tax on Global Intangible Low-Taxed Income (“GILTI”). Under GAAP, we are allowed to make an accounting policy choice to either (i) treat taxes due on future U.S. inclusions in taxable income related to GILTI as a current-period expense when incurred (the "period cost method"); or (ii) factor in such amounts into the measurement of our deferred taxes (the "deferred method"). The Company has made a policy decision to record GILTI tax as a current-period expense when incurred.
Deferred income taxes have not been recorded on the basis differences for investments in consolidated subsidiaries as these basis differences are indefinitely reinvested or will reverse in a non-taxable manner. Quantification of the deferred income tax liability, if any, associated with indefinitely reinvested basis differences is not practicable. Deferred income taxes have been recorded on the basis differences for investments in nonconsolidated entities.
At May 31, 2023, the Company had United States net operating loss carry-forwards of approximately $405,994 that can be carried forward indefinitely and generally limited in annual use to 80% of the current year taxable income starting 2021. The Company has Canadian net operating loss carry-forwards of approximately $545,712 that can be carried forward 20 years and begin to expire in 2028. Management believes that it is more-likely-than-not that the benefit from certain United States and foreign net operating loss carry-forwards will not be realized. In recognition of this risk, the Company has provided a valuation allowance on the deferred tax assets relating to these carry-forwards. The net change in the total valuation allowance was an increase of $271,297 and $88,131 for the years ended May 31, 2023 and 2022, respectively. The net change in the total valuation allowance was primarily a result of finalization of the purchase accounting related to the reverse acquisition transaction with Aphria Inc. during the prior year and certain current year losses.
The Company recognizes the financial statement impact of a tax position only after determining that the relevant tax authority would more-likely-than-not sustain the position following an audit. For tax positions meeting the more-likely-than-not threshold, the amount recognized in the financial statements is the largest impact that has a greater than fifty percent likelihood of being realized upon ultimate settlement with the relevant tax authority.
The total amount of gross unrecognized tax benefits (“GUTB”) was $0, $0, and $0 as of May 31, 2023, 2022 and 2021 respectively. There is a reasonable possibility that the Company’s unrecognized tax benefits will change within twelve months due to audit settlements or the expiration of statute of limitations, but the Company does not expect the change to be material to the financial statements.
The Company recognizes interest and, if applicable, penalties for any uncertain tax positions. Interest and penalties are recorded as a component of income tax expenses. In the years ended May 31, 2023, 2022 and 2021, the Company recorded approximately $0, $0 and $0, respectively, of interest and penalty expenses related to uncertain tax positions. As of May 31, 2023, and 2022, the Company had a cumulative balance of accrued interest and penalties on unrecognized tax positions of $0 and $0, respectively.
The Company and its subsidiaries are subject to United States federal income tax as well as the income tax of multiple state and foreign jurisdictions. The Company is not currently under audit in any jurisdiction for any period. Major jurisdictions where there are wholly owned subsidiaries of Tilray Brands, Inc. which require income tax filings include the Canada, Portugal, Germany, and Australia. The earliest periods open for review by local taxing authorities are fiscal years 2018 for Canada, 2019 for Portugal, 2018 for Germany, 2019 for Australia, and 2019 for United States.
14. | Bank indebtedness |
Aphria Inc., a subsidiary of the Company, has an operating line of credit in the amount of C$1,000 which bears interest at the lender’s prime rate plus 75 basis points. As of May 31, 2023, the Company has not drawn on the line of credit. The operating line of credit is secured by a security interest on that certain real property at 265 Talbot St. West, Leamington, Ontario.
CC Pharma GmbH, a subsidiary of the Company, has three operating lines of credit for €5,000,€3,500, and €500 each, which bear interest at Euro Over Night Index Average plus 1.79% and Euro Interbank Offered Rate ("EURIBOR") plus 3.682% respectively. As of May 31, 2023, a total of €7,833 ($8,381) was drawn down from the available credit of €9,000. The operating lines of credit for €5,000 and €3,500 are secured by an interest in the inventory of CC Pharma GmbH and the property where the Densborn facility is located as well as the building. The operating line of credit for €500 is unsecured.
Four Twenty Corporation (“420”), a subsidiary of the Company, has a revolving credit facility of $30,000 which bears interest at EURIBOR plus an applicable margin. As of May 31, 2023, the Company has drawn $15,000 on the revolving line of credit. The revolving credit facility is secured by all of 420's assets and includes a corporate guarantee by a subsidiary of the Company.
15. | Accounts payable and accrued liabilities |
Accounts payable and accrued liabilities comprised of:
May 31, | May 31, | |||||||
2023 | 2022 | |||||||
Trade payables | $ | 70,819 | $ | 68,604 | ||||
Accrued liabilities | 82,240 | 57,497 | ||||||
Accrued payroll and employment related taxes | 18,772 | 17,736 | ||||||
Income taxes payable | 14,934 | 6,150 | ||||||
Accrued interest | 3,869 | 6,772 | ||||||
Other accruals | 48 | 672 | ||||||
Total | $ | 190,682 | $ | 157,431 | ||||
16. | Long-term debt |
The following table sets forth the net carrying amount of long-term debt instruments:
May 31, | May 31, | |||||||
2023 | 2022 | |||||||
Credit facility - C$66,000 - Canadian prime interest rate plus an applicable margin, 3-year term, with a 10-year amortization, repayable in blended monthly payments, due in November 2025 | $ | 45,260 | $ | 53,720 | ||||
Term loan - C$25,000 - Canadian prime plus 1.00%, compounded monthly, 5-year term, with a 15-year amortization, repayable in equal monthly installments of C$194 including interest, due in July 2023 | 10,959 | 12,750 | ||||||
Term loan - C$25,000 - Canadian prime plus 1.50%, compounded monthly, 5-year term with a 15-year amortization, repayable in equal monthly installments of C$190 including interest, due in April 2032 | 13,092 | 15,050 | ||||||
Term loan - C$1,250 - Canadian prime plus 1.50%, 5-year term, with a 10-year amortization, repayable in equal monthly installments of C$12 including interest, due in August 2026 | 346 | 462 | ||||||
Mortgage payable - C$3,750 - Canadian prime plus 1.50%, 5-year term, with a 20-year amortization, repayable in equal monthly installments of C$23 including interest, due in August 2026 | 2,104 | 2,327 | ||||||
Term loan ‐ €5,000 ‐ EURIBOR plus 1.79%, 5‐year term, repayable in quarterly installments of €250 plus interest, due in December 2023 | 803 | 1,878 | ||||||
Term loan ‐ €1,200 ‐ EURIBOR plus 1.79%, 1‐year term, repayable in monthly installments of €100 plus interest, due in December 2023 | 755 | — | ||||||
Term loan ‐ €5,000 ‐ EURIBOR plus 2.68%, 5‐year term, repayable in quarterly installments of €250 plus interest, due in December 2023 | 803 | 1,878 | ||||||
Term loan ‐ €1,500 ‐ EURBIOR plus 2.00%, 5‐year term, repayable in quarterly installments of €92 including interest, due in April 2025 | 819 | 1,219 | ||||||
Term loan ‐ €1,500 ‐ EURIBOR plus 2.00%, 5‐year term, repayable in quarterly installments of €94 including interest, due in June 2025 | 903 | 1,307 | ||||||
Mortgage payable - $22,635 - EURIBOR rate plus 1.5%, 10-year term, with a 10-year amortization, repayable in monthly installments of $57 plus interest, due in October 2030 | 20,863 | 21,561 | ||||||
Term loan - $65,000 - SOFR rate plus an applicable margin, 5-year term, repayable in quarterly installments, due in June 2028 | 65,000 | 75,000 | ||||||
Carrying amount of long-term debt | 161,707 | 187,152 | ||||||
Unamortized financing fees | (738 | ) | (1,450 | ) | ||||
Net carrying amount | 160,969 | 185,702 | ||||||
Less principal portion included in current liabilities | (24,080 | ) | (67,823 | ) | ||||
Total noncurrent portion of long-term debt | $ | 136,889 | $ | 117,879 | ||||
On November 28, 2022, the Company, through its 51% owned subsidiary Aphria Diamond, entered into an Amended and Restated Credit Agreement (the “Amended and Restated Credit Agreement”) amending and restating the existing credit facility in the aggregate principal amount of C$66,000. The Amended and Restated Credit Agreement extended the term of the existing credit facility to November 28, 2025. The principal amount of loans outstanding at the time of the amendment was C$66,000 and is secured by the property at 620 Country Road 14, Leamington, Ontario, owned by Aphria Diamond and a guarantee from Aphria Inc.
The term loan of C$25,000 was entered into on July 27, 2018 and is secured by the property at 223,231,239,265,269,271 and 275 Talbot Street West, Leamington Ontario, a first position on a general security agreement, and an assignment of fire insurance to the lender.
The term loan of C$25,000 was entered into on May 9, 2017 and is secured by the property at 265 Talbot Street West, Leamington Ontario, a first position on a general security agreement, and an assignment of fire insurance to the lender.
The term loan of C$1,250 and mortgage payable of C$3,750 were entered into on July 22, 2016 and are secured by the property at 265 Talbot Street West, Leamington, Ontario and a first position on a general security agreement.
The Company entered into term loans between December 2016, Tilray Canada, Ltd.2019 and November 2023 for €14,200 through wholly owned subsidiary CC Pharma. These term loans are secured against the distribution inventory held by CC Pharma and by the land where the facility is located and the building.
During the year ended May 31, 2022, the Company acquired all the membership interests in Cheese Grits, LLC, a Georgia limited liability company that owns the SweetWater Brewing Company brewery and taproom in Atlanta, Georgia, which facility was previously leased to the Company. Cheese Grits, LLC, was owned by certain former equity holders of SweetWater and current employees. As part of this purchase, the Company through subsidiary Cheese Grits, LLC, acquired the mortgage payable which is secured against the brewery and taproom.
The Company, entered into a mortgage secured credit agreement on March 31, 2021 for ana term loan of $100,000 through wholly owned subsidiary Four Twenty Corporation (“420”). 420 provided all of its and its subsidiaries’ assets as security for the loan and Aphria Inc. provided a corporate guarantee. Subsequent to year end, the Company refinanced this debt which amended the interest rates to lower the applicable margins, extended the maturity to June 2028, provided a new repayment schedule and amended the corporate guarantee from Aphria Inc. to Tilray Brands, Inc. See Note 30 (Subsequent Events) for additional details.
The Company maintains, certain financial covenants or minimum balances in certain Canadian cash operating accounts, as at May 31, 2023, the Company was in compliance with all the long-term debt covenants.
17. | Convertible debentures payable |
The following table sets forth the net carrying amount of $8,909 ($12,000 CAD) with an annualthe convertible debentures:
May 31, | May 31, | |||||||
2023 | 2022 | |||||||
5.20% Convertible Notes ("TLRY 27") | $ | 100,476 | $ | — | ||||
HTI Convertible Note | 47,834 | — | ||||||
5.25% Convertible Notes ("APHA 24") | 120,568 | 216,753 | ||||||
5.00% Convertible Notes ("TLRY 23") | 126,544 | 185,196 | ||||||
Total | 395,422 | 401,949 | ||||||
Less - current portion | 174,378 | - | ||||||
Total convertible debentures payable, non current portion | $ | 221,044 | $ | 401,949 | ||||
HTI Convertible Note
May 31, | May 31, | |||||||
2023 | 2022 | |||||||
4.00% Contractual debenture | $ | 50,000 | $ | — | ||||
Unamortized discount | (2,166 | ) | — | |||||
Net carrying amount | $ | 47,834 | $ | — | ||||
On July 12, 2022, the Company issued a $50,000 convertible promissory note to HTI ("HTI Convertible Note"), bearing a 4% interest rate payable on a quarterly basis and having a maturity date of 11.5% maturingSeptember 1, 2023. The fair value of the conversion feature was determined to be $9,055, recorded in additional paid in capital. Refer to Note 11 (Convertible notes receivable) for additional details on this transaction. HTI may convert the HTI Convertible Note, in whole or in part, at any time prior to the second trading day immediately preceding the maturity date, into shares of Common Stock at a conversion price equal to $4.03, which is calculated as 125% of the closing sale price as of the closing date ( July 12, 2022). In no event will HTI be allowed to effect a conversion of the HTI Convertible Note if such conversion, along with all other shares of Common Stock beneficially owned by HTI and its affiliates, would exceed 9.99% of the outstanding Common Stock (the "Beneficial Ownership Limitation") of the Company. If HTI does not elect or is unable to elect to convert under the Beneficial Ownership Limitation or if the share price on the immediately preceding Trading Day is not equal to or greater than $2.00, the Company will be responsible for repaying the HTI Convertible Note in cash.
TLRY 27
May 31, | May 31, | |||||||
2023 | 2022 | |||||||
5.20% Contractual debenture | $ | 150,000 | $ | — | ||||
Unamortized discount | (49,524 | ) | — | |||||
Net carrying amount | $ | 100,476 | $ | — | ||||
The TLRY 27 convertible debentures, were entered into on May 30, 2023, in the principal amount of $150,000, bears interest at a rate of 5.20% per annum, payable semi-annually in arrears on June 2018.15 and December 15 of each year, and matures on June 15, 2027, unless earlier converted. The TLRY 27 is an unsecured obligation and ranks senior in right of payment to all indebtedness that is expressly subordinated in right of payment to TLRY 27. The TLRY 27 will rank equal in right of payment with all liabilities that are not subordinated. The TLRY 27 is effectively junior to any secured indebtedness to the extent of the value of the assets securing such indebtedness. Noteholders will have the right to convert their TLRY 27 Notes into shares of Tilray’s common stock at their option, at any time, until the close of business on the second scheduled trading day immediately before June 15, 2027. The initial conversion rate is 376.6478 shares per $1,000 principal amount of TLRY 27 Notes, which represents an initial conversion price of approximately $2.66 per share. The conversion rate and conversion price will be subject to adjustment upon the occurrence of certain events.
The TLRY 27 Notes will be redeemable, in whole and not in part, at Tilray’s option at any time on or after June 20, 2025 at a cash redemption price equal to the principal amount of the notes to be redeemed, plus accrued and unpaid interest, if any, to, but excluding, the redemption date, but only if the last reported sale price of Tilray’s common stock exceeds 130% of the conversion price for a specified period of time. If certain corporate events that constitute a fundamental change occur, then, subject to a limited exception, noteholders may require Tilray to repurchase their TLRY 27 Notes for cash. The repurchase price will be equal to the principal amount of the notes to be repurchased, plus accrued and unpaid interest, if any, to, but excluding, the applicable repurchase date. In July 2018,connection with the Company’s offering of the TLRY 27 Notes, the Company entered into a Mortgage Loan Extension Agreementshare lending agreement with an affiliate of Jefferies LLC (the “Share Borrower”), under which it lent to extend the mortgage. The termShare Borrower 38,500,000 shares of the mortgage was extended for a further period of six months to January 1, 2019Company’s common stock. The borrowed shares were newly-issued shares, issued in connection with a renewal fee of CAD $90, or .75 basis pointsthe offering of the loan balance.
TLRY 27 Notes and will be held as treasury shares until the expiration or early termination of the share lending agreement. Purchasers of the TLRY 27 Notes may separately sell up to 38,500,000 shares of the Company’s common stock that they may borrow through the Share Borrower. The mortgage was secured by a deed of trust on all assets of Tilray Canada, Ltd. and was guaranteed by Privateer Holdings. The carryingfair value of the mortgage approximates its fair value becauseshare lending agreement has been recorded as part of the interest rateunamortized discount on the mortgagedebenture. The Company expects that the selling stockholders will use their position created by such sales to establish their initial hedge with respect to their investments in the TLRY 27 Notes. The Company did not receive any proceeds from the sale of the borrowed shares from the Note purchasers. See Note 30 (Subsequent Events) for additional details of transactions related to this security that occurred after period end.
As at May 31, 2023, there was $150,000 principal outstanding (2022 - $nil).
APHA 24
May 31, | May 31, | |||||||
2023 | 2022 | |||||||
5.25% Contractual debenture | $ | 350,000 | $ | 350,000 | ||||
Principal amount paid | (213,260 | ) | (90,760 | ) | ||||
Fair value adjustment | (16,172 | ) | (42,487 | ) | ||||
Net carrying amount | $ | 120,568 | $ | 216,753 | ||||
The APHA 24 convertible debentures, were entered into in April 2019, in the principal amount of $350,000, bears interest at a rate of 5.25% per annum, payable semi-annually in arrears on June 1 and December 1 of each year, and matures on June 1, 2024, unless earlier converted. The APHA 24 is an unsecured obligation and ranks senior in right of payment to all indebtedness that is expressly subordinated in right of payment to APHA 24. The APHA 24 ranks equal in right of payment with all liabilities that are not subordinated. The APHA 24 is effectively junior to any secured indebtedness to the extent of the value of the assets securing such indebtedness.
Holders of the APHA 24may convert all or any portion of their Notes, in multiples of one thousand dollars principal amount, at their option at any time between December 1, 2023 to the maturity date. The initial conversion rate for the APHA 24 will be 89.31162364 shares of common stock per one thousand dollars principal amount of Notes, which will be settled in cash, common shares of Aphria or a combination thereof, at Tilray’s election. This is equivalent to current market rates.an initial conversion price of approximately $11.20 per common share, subject to adjustments in certain events. In October 2018, addition, holders of the APHA 24may convert all or any portion of their Notes, in multiples of one thousand dollars principal amount, at their option at any time preceding December 1, 2023, if any of the following:
(a) | the last reported sales price of the common shares for at least 20 trading days during a period of 30 consecutive trading days immediately preceding fiscal quarter is greater than or equal to 130% of the conversion price on each applicable trading day; |
(b) | during the five-business day period after any five consecutive trading day period (the “measurement period”) in which the trading price per one thousand dollars principal amount of the APHA 24 for each trading day of the measurement period is less than 98% of the product of the last reported sale price of the Company’s common shares and the conversion rate on each such trading day; |
(c) | the Company calls any or all of the APHA 24 for redemption or; |
(d) | upon occurrence of specified corporate event. |
The Company was not able to redeem the APHA 24 prior to June 6, 2022, except upon the occurrence of certain changes in tax laws. On or after June 6, 2022, the Company repaidmay redeem for cash all or part of the outstanding mortgage balance.
10. Convertible Senior Notes Due 2023
In October 2018APHA 24, at its option, if the last reported sale price of the Company’s common shares has been at least 130% of the conversion price then in effect for at least 20 trading days during any 30 consecutive trading day period ending on and including trading day immediately preceding the date on which the Company issued Convertible Notes with a faceprovides notice of redemption. The redemption of the APHA 24 will be equal to 100% of the principal amount plus accrued and unpaid interest to, but excluding, the redemption date.
The Company elected the fair value option under ASC 825Fair Value Measurements for the APHA 24. The APHA 24 was initially recognized at fair value on the balance sheet. All subsequent changes in fair value, excluding the impact of the change in fair value related to instrument-specific credit risk are recorded in non-operating income. The changes in fair value related to instrument-specific credit risk is recorded through other comprehensive income (loss).
The Company may from time to time seek to retire or purchase its APHA 24, in open market purchases, privately negotiated transactions or otherwise. Such purchases or exchanges, if any, will depend on prevailing market conditions, the company's liquidity requirements, contractual restrictions and other factors. During the year, the Company purchased $122,500 principal of APHA 24.
The overall change in fair value of $475,000. The net proceeds from the offering were approximately $460,134, after deducting commissions and other fees and expenses payableAPHA 24 during the year ended May 31, 2023 increased by $26,315, this was comprised of $43,733 of fair value changes which was offset by the Company.decrease in foreign exchange of $17,418 (2022 – decrease of $163,670 and $19,021, 2021 – increase of $170,453 and $32,586).
The Convertible Notes bearaggregate change in fair value of convertible debenture payable of $43,651 recorded in Note 24 (Other non-operating (expense) income) is comprised of the increase from APHA 24 of $43,733 less the decrease of $82 in fair value on the repurchased TLRY 23 debentures noted below.
As at May 31, 2023, there was $136,740 principal outstanding (2022 - $259,400).
During the year ended May 31, 2023, the Company recognized total interest expense of $13,610 (2022 – $13,600, 2021 – $13,600).
TLRY 23
May 31, | May 31, | |||||||
2023 | 2022 | |||||||
5.00% Contractual debenture | $ | 277,856 | $ | 277,856 | ||||
Principal amount paid | (150,526 | ) | (88,026 | ) | ||||
Unamortized discount | (786 | ) | (4,634 | ) | ||||
Net carrying amount | $ | 126,544 | $ | 185,196 | ||||
The TLRY 23 bears interest at a rate of 5.00% per annum, payable semi-annually in arrears on April 1 and October 1 of each year, beginning on April 1, 2019.year. Additional interest may accrue on the Convertible NotesTLRY 23 in specified circumstances. The Convertible NotesTLRY 23 will mature on October 1, 2023, unless earlier repurchased, redeemed or converted. There are no principal payments required over the five year-year term of the Convertible Notes,TLRY 23, except in the case of redemption or events of defaults.
The Convertible Notes are governed byTLRY 23 is an Indenture between the Company, as issuer,unsecured obligation and GLAS Trust Company LLC, as trustee. The Convertible Notes are the Company’s general unsecured obligations and rankranks senior in right of payment to all of the Company’s indebtedness that is expressly subordinated in right of payment to the notes;TLRY 23; equal in right of payment with any of the Company’s unsecured indebtedness that is not so subordinated; effectively junior in right of payment to any of Company’s secured indebtedness to the extent of the value of the assets securing such indebtedness; and structurally junior to all indebtedness and other liabilities (including trade payables but excluding intercompany obligations) of the Company’s current or future subsidiaries.
The IndentureTLRY 23 includes customary covenants and sets forth certain events of default after which the Convertible Notes convertible notes may be declared immediately due and payable, including certain types of bankruptcy or insolvency involving the Company.
To the extent the Company so elects, the sole remedy for an event of default relating to certain failures by the Company to comply with certain reporting covenants, in the Indenture will, for the first365 days after such event of default, consist exclusively of the right to receive additional interest on the notes. Upon conversion, the Company will pay or deliver, as the case may be, cash, shares of our common stock or a combination of cash and shares of ourthe Company’s common stock, at the Company’s election (the “cash conversion option”). The initial conversion rate for the Convertible Notesconvertible notes is 5.9735 shares of common stock per one thousand dollar principal amount of notes, which is equivalent to an initial conversion price of approximately $167.41 per share of common stock.stock, which represents approximately 760,588 shares of common stock, based on the $127,330 aggregate principal amount of convertible notes outstanding as of May 31, 2023 (2022 - shares of 1,133,923 based on principal of $189,830. Throughout the term of the Convertible Notes,TLRY 23, the conversion rate may be adjusted upon the occurrence of certain events.
Prior to the close of business on the business day immediately preceding April 1, 2023, the Convertible NotesTLRY 23 will be convertible only under the specified circumstances. On or after April 1, 2023 until the close of business on the business day immediately preceding the maturity date, holders may convert all or any portion of their Convertible Notes,TLRY 23, in multiples of one thousand dollar dollars principal amount, at the option of the holder regardless of the forementionedaforementioned circumstances.
As a result of
The Company may from time to time seek to retire or purchase its TLRY 23, in open market purchases, privately negotiated transactions or otherwise. Such purchases or exchanges, if any, will depend on prevailing market conditions, the cash conversion option,company's liquidity requirements, contractual restrictions and other factors. During the year, the Company separately accounts forpurchased $62,500 of principal of its TLRY 23 reducing the carrying value to $126,544. This repurchase resulted in a loss of the embedded conversion option as a component of equity. The value of the embedded conversion option is the residual of the net proceeds of the issuance, less the estimated$82 which was recorded in change in fair value of the debt without the conversion feature, and amounted to $57.6 million at issuance. The estimated fair value of the debt without the conversion feature, was determined using the expected cash flows of the Convertible Notes discounted by the estimated interest rate of similar nonconvertible debt; the debt discount is being amortized as additional non-cash interest expense over the term of the Convertible Notes using the interest method with an effective interest rate of 8% per annum. The equity component is not remeasured as long as it continues to meet the conditions for equity classification.convertible debentures payable Note 24 (Other non-operating (expense) income).
As of DecemberMay 31, 2018,2023, the Convertible Notes are TLRY 23 is not yet convertible. The Convertible Notesconvertible notes will become convertible upon the satisfaction of the above circumstances. In accounting for the transaction costsThe remaining unamortized debt discount related to the issuanceconvertible notes as of the Convertible Notes, the Company allocated the total amount of offering costs incurred to the debt and equity components based on their relative values. Direct issue costs attributable to the debt component, totaling $13,467, are being amortized as non-cash interest expenseMay 31, 2023 will be accreted over the remaining term of the Convertible Notes, and offering costs attributable to the equity component, totaling $1,398, were recorded within stockholders’ equity (deficit).TLRY 23, which is approximately 4 months.
As at Decemberof May 31, 2018,2023, the Company was in compliance with all the covenants set forth under the Indenture.TLRY 23.
The following table sets forth
During the net carrying amountyear ended May 31, 2023, the Company recognized total interest expense on TLRY 23 of $12,120 (2022 – $18,860, 2021 – $1,585), which included contractual interest coupon of $9,303 (2022 - $14,684, 2021 – 1,158) and amortization of the Convertible Notes:discount of $2,817 (2022 - $4,176, 2021 – $427).
|
| December 31, 2018 |
| |
5.00% Convertible Senior Notes |
| $ | 475,000 |
|
Unamortized discount |
|
| (41,687 | ) |
Unamortized transaction costs |
|
| (12,946 | ) |
Net carrying amount |
| $ | 420,367 |
|
18. | Warrants |
During the year ended May 31, 2022, 5,994,651 warrants expired with exercise prices between $3.08 and $9.08. As of May 31, 2023, there are 6,209,000 warrants outstanding, with an original exercise price of $5.95 per warrant, expiring March 17, 2025. Each warrant is exercisable for one common share of the Company.
The following table sets forth total interest expense recognized relatedwarrants contain anti-dilution price protection features, which adjust the exercise price of the warrants if the Company subsequently issues common stock at a price lower than the exercise price of the warrants. In the event additional warrants or convertible debt are issued with a lower and/or variable exercise price, the exercise price of the warrants will be adjusted accordingly. During the year ended May 31, 2023, the Company issued shares which triggered the anti-dilution price protection feature lowering the exercise price to $2.66. These warrants are classified as liabilities as they are to be settled in registered shares, and the registration statement is required to be active, unless such shares may be subject to an applicable exemption from registration requirements. The holders, at their sole discretion, may elect to affect a cashless exercise, and be issued exempt securities in accordance with Section 3(a)(9) of the 1933 Act. In the event the Company does not maintain an effective registration statement, the Company may be required to pay a daily cash penalty equal to 1% of the number of shares of common stock due to be issued multiplied by any trading price of the common stock between the exercise date and the share delivery date, as selected by the holder. Alternatively, the Company may deliver registered common stock purchased by the Company in the open market. The Company may also be required to pay cash if it does not have sufficient authorized shares to deliver to the Convertible Notes:holders upon exercise.
|
| Year ended December 31, 2018 |
| |
Contractual coupon interest |
| $ | 5,302 |
|
Amortization of discount |
|
| 2,152 |
|
Amortization of direct issue costs |
|
| 28 |
|
Total |
| $ | 7,482 |
|
The Company estimated the fair value of the warrant liability at May 31, 2023 at $0.49 per warrant using the Black Scholes pricing model (Level 3) with the following assumptions: Risk-free interest rate of 3.84%, expected volatility of 70%, expected term of 2.3 years, strike price of $2.66 and fair value of common stock of $1.67.
11. CapitalExpected volatility is based on both historical and implied volatility of the Company’s common stock.
19. | Stockholders’ equity |
On March 16,2023, Tilray’s stockholders formally approved a proposal to amend its certificate of incorporation (the “Charter Amendment”), which modified Tilray’s existing certificate of incorporation by canceling its Class 1 Common Stock and re-allocating such authorized shares to Class 2 Common Stock. In addition, the Charter Amendment reclassified each issued and outstanding share of Class 2 Common Stock as one share of Common Stock of Tilray.
Capital Stock
As of DecemberIssued and outstanding
At May 31, 2017,2023, the Company had 990,000,000 shares authorized to be issued with 656,655,455 shares issued and outstanding, one share of capital stock with a one dollar par value. Each share of capital stock was entitled to one vote. As of Decemberat May 31, 2018, no shares of capital stock were authorized, issued or outstanding.
Common2022 – 743,333,333 and Convertible Preferred Stock
The Company’s certificate of incorporation authorized the Company to issue the following classes of shares with the following par value and voting rights as of December 31, 2018.532,674,887 respectively.
|
| Par Value |
|
| Authorized |
|
| Voting Rights | ||
Class 1 common stock |
| $ | 0.0001 |
|
|
| 250,000,000 |
|
| 10 votes for each share |
Class 2 common stock |
| $ | 0.0001 |
|
|
| 500,000,000 |
|
| 1 vote for each share |
Convertible preferred stock |
| $ | 0.0001 |
|
|
| 10,000,000 |
|
| N/A |
In February 2018,During the Company completed a recapitalization in whichyear-ended May 31, 2023, the Company issued 75,000,000 shares of Class 1 common stock to Privateer Holdings in exchange for the net assets of Decatur Holdings, BV. Of which 58,333,333 Class 1 common stock was converted into Class 2 common stock upon IPO, resulting in Privateer share ownership of 58,333,333 of Class 2 common stock and 16,666,667 of Class 1 common stock.
In July 2018, the Company completed its IPO, whereby 10,350,000 shares of our Class 2 common stock were sold at a price of $17.00 ($22.45 CAD) per share, which included 1,350,000 shares pursuant to the
underwriters’ option to purchase additional shares. Upon the closing of the IPO, all shares of the outstanding Series A preferred stock automatically converted into 7,794,042 shares of Class 2 common stock on a one-for-one basis.
The liquidation and dividend rights are identical among Class 1 common stock and Class 2 common stock, and all classes of common stock share equally in our earnings and losses.
In February and March 2018, the Company issued an aggregate of 7,794,042 shares of Series A preferred stock at an issue price of $7.10 ($8.90 CAD) per share. In July 2018, the Company completed its IPO and upon the closing of the IPO, all shares of the outstanding Series A preferred stock automatically converted into 7,794,042 shares of Class 2 common stock on a one-for-one basis.
12. General and Administrative Expenses
General and administrative expenses are comprised of the following items:shares:
|
| Year ended December 31, |
| |||||||||
|
| 2018 |
|
| 2017 |
|
| 2016 |
| |||
Salaries |
| $ | 11,721 |
|
| $ | 3,717 |
|
| $ | 2,640 |
|
Professional fees |
|
| 7,557 |
|
|
| 1,715 |
|
|
| 424 |
|
Travel expenses |
|
| 2,031 |
|
|
| 287 |
|
|
| 109 |
|
Depreciation and amortization |
|
| 1,598 |
|
|
| 902 |
|
|
| 591 |
|
Other expenses |
|
| 8,400 |
|
|
| 1,780 |
|
|
| 1,126 |
|
Total |
| $ | 31,307 |
|
| $ | 8,401 |
|
| $ | 4,890 |
|
a) | 32,481,149 shares under its At-the-Market (“ATM”) program for gross proceeds of $132,238. The Company paid $2,645 in commissions and other fees associated with these issuances for net proceeds of $129,593. |
b) | 33,314,412 shares to purchase the HEXO convertible notes receivable. | |
c) | 16,114,406 shares to settle amounts owed to the non-controlling shareholders of Aphria Diamond in the amount of $60,062. |
d) | 1,862,080 shares for the exercise of various stock-based compensation awards. |
e) | 1,708,521 shares issued to acquire Montauk Brewing Company Inc. |
e) | 38,500,000 shares issued as part of a share lending agreement with an affiliate of Jefferies LLC in connection with the registered offering of $150 Million of unsecured convertible senior notes (TLRY 27). |
13. Stock-Based CompensationStock-based compensation
Original Stock Option Plan
Certain employees of the Company participate in the Original Plan. For the year ended DecemberMay 31, 2018,2023, the total stock-based compensation expense associated with the Original Plan was $359 (December 31, 2017 – $139$39,595 (2022 - $35,994 and 2016 – $94)2021- $17,351).
The Original Plan has 6,760,879 shares of Privateer Holdings common stock reserved for issuance under the Original Plan. Stock options granted under the Original Plan may be either incentive stock options or nonqualified stock options. Stock options and shares of Privateer Holdings common stock issued under the Original Plan are determined by the Board of Directors of Privateer Holdings and may not be issued at less than 100% of the fair value of the shares on the date of the grant. Fair value is determined by the Board of Directors of Privateer Holdings. Stock options will generally vest over a period of four years and expire, if not exercised, 10 years from the date of grant. Shares of Privateer Holdings common stock may be issued in exchange for services based on the fair value of the services or the fair value of the Privateer Holdings common stock at the time of grant, as determined by the Board of Directors of Privateer Holdings. The compensation expense under the Original Plan is allocated from Privateer Holdings to Tilray employees who holds options under the Original Plan.
The fair value of each stock option to employees granted under the Original Plan is estimated on the date of grant using the Black-Scholes option pricing model with the following weighted-average assumptions:
|
| 2018 |
|
| 2017 |
|
| 2016 |
| |||
Expected stock option life |
| 5.15 years |
|
| 5.84 years |
|
| 6.05 years |
| |||
Expected volatility |
|
| 48.82 | % |
|
| 56.23 | % |
|
| 63.32 | % |
Risk-free interest rate |
|
| 2.35 | % |
|
| 2.01 | % |
|
| 1.46 | % |
Expected dividend yield |
|
| - | % |
|
| - | % |
|
| - | % |
The expected life of the stock options represents the period of time stock options are expected to be outstanding and is estimated considering vesting terms and employees’ historical exercise and post-vesting employment termination behavior. Expected volatility is based on historical volatilities of public companies
operating in a similar industry to Privateer Holdings. The risk-free rate is based on the U.S. Treasury yield curve in effect at the time of grant. The expected dividend yield was determined based on the stock option’s exercise price and expected annual dividend rate at the time of grant.
Stock option activity for the Company under the Original Plan isoperates multiple stock-based award plans as follows:
|
| Stock Options |
|
| Weighted- average exercise price |
|
| Weighted-average remaining contractual term (years) |
|
| Aggregate intrinsic value |
| ||||
Balance December 31, 2017 |
|
| 364,571 |
|
| $ | 2.41 |
|
|
| 7.9 |
|
| $ | 1,185 |
|
Granted |
|
| 304,942 |
|
|
| 5.92 |
|
|
|
|
|
|
|
|
|
Exercised |
|
| (45,688 | ) |
|
| 1.81 |
|
|
|
|
|
|
|
|
|
Forfeited |
|
| (25,881 | ) |
|
| 5.14 |
|
|
|
|
|
|
|
|
|
Cancelled |
|
| (5,350 | ) |
|
| 3.29 |
|
|
|
|
|
|
|
|
|
Balance December 31, 2018 |
|
| 592,594 |
|
| $ | 4.14 |
|
|
| 8.1 |
|
| $ | 989 |
|
Vested and expected to vest, December 31, 2018 |
|
| 522,301 |
|
| $ | 3.94 |
|
|
| 8.0 |
|
| $ | 955 |
|
Vested and exercisable, December 31, 2018 |
|
| 286,393 |
|
| $ | 2.85 |
|
|
| 7.2 |
|
| $ | 805 |
|
Tilray 2018 Equity Incentive Plan and Original Plan
The weighted-average fair values of all stock options granted in 2018 2017 and 2016 were $3.05, $1.79 and $1.91, respectively. The total intrinsic values of stock options exercised in 2018, 2017 and 2016 were $176, $19 and $51, respectively. As of December 31, 2018, the total remaining unrecognized compensation expense related to non-vested stock options amounted to $557, which will be amortized over the weighted-average remaining requisite service period of approximately 1.1 years. The total fair values of stock options vested in 2018, 2017 and 2016 were $276, $145 and $118, respectively.
New Stock Option and Restricted Stock Unit Plan
The Company adopted the New Equity Incentive Plan which was amended and approved by stockholders in May 2018. The New Plan(EIP) authorizes the award of stock options, restricted stock units (“RSUs”) and RSUsstock appreciation rights (“SARs”) to employees, including officers, non-employee directors and consultants and the employees and consultants of our affiliates. Shares subject to awards granted under the New PlanEIP that expire or terminate without being exercised in full, or that are paid out in cash rather than in shares, do not reduce the number of shares available for issuance under the New Plan.EIP. Additionally, shares become available for future grant under the New PlanEIP if they were issued under the New PlanEIP and if the Company repurchases them or they are forfeited. This includes shares used to pay the exercise price of an award or to satisfy the tax withholding obligations related to an award. The maximum number of shares of common stock subject to stock awards granted under the New PlanEIP or otherwise during any one calendar year to any non-employee director, taken together with any cash fees paid by the Company to such non-employee director during such calendar year for service on the boardBoard of directors,Directors, will not exceed five hundred thousand dollars in total value, calculating the value of any such stock awards based on the grant date fair value of such stock awards for financial reporting purposes, or, with respect to the calendar year in which a nonemployee director is first appointed or elected to our boardBoard of directors, Directors, one million dollars.
Stock options represent the right to purchase shares of our Class 2 common stock on the date of exercise at a stated exercise price. The exercise price of a stock option generally must be at least equal to the fair market value of our shares of Class 2 common stock on the date of grant. OurThe Company’s compensation committee may provide for stock options to be exercised only as they vest or to be immediately exercisable with any shares issued on exercise being subject to ourthe Company’s right of repurchase that lapses as the shares vest. The maximum term of stock options granted under the New PlanEIP is ten years.
RSUs represent an offer by the Companya right to issue or sell shares of our Class 2receive common stock subject toor their cash equivalent for each RSU that vests, which vesting restrictions, which may lapsebe based on time or achievement of performance conditions. Unless otherwise determined by our compensation committee at the time of grant, vesting will cease on the date the participant no longer provides services to the Company and unvested shares will be forfeited or repurchased by the Company.forfeited. If an RSU has not been forfeited, then on the date specified in the RSUs, the Company will deliver to the holder a
number of whole shares of Class 2 common stock, cash or a combination of shares of our Class 2 common stock and cash. Additionally, dividend equivalents may be credited in respect of shares covered by the RSUs. Any additional shares covered by the RSU credited by reason of such dividend equivalents will be subject to all of the same terms and conditions of the underlying RSU agreement to which they relate. The RSUs generally vest over a 3-or-4 year period. The fair value of RSUs are based on the share price as at date of grant.
Stock appreciation rights (“SAR”)
SARs provide for a payment, or payments, in cash or shares of Class 2 common stock to the holder based upon the difference between the fair market value of shares of our Class 2 common stock on the date of exercise and the stated exercise price. The maximum term of SARs granted under the New PlanEIP is ten years. No SARs were issued in 2018.to date.
The New PlanEIP permits the grant of performance-based stock and cash awards. The performance goals may be based on company-wide performance or performance of one or more business units, divisions, affiliates or business segments and may be either absolute or relative to the performance of one or more comparable companies or the performance of one or more relevant indices. The length of any performance period, the performance goals to be achieved during the performance period, and the measure of whether and to what degree such performance goals have been attained will be conclusively determined by the boardBoard of directors.Directors.
As of May 21, 2018, 9,199,338April 30, 2021, 9,806,851 shares of Class 2 common stock had been reserved for issuance under the New Plan.EIP. The number of shares of Class 2 common stock reserved for issuance under the New Plan2018 EIP will automatically increase on January 1 of each calendar year, for a period of not more than ten years, starting on January 1, 2019 and ending on and including January 1, 2027, in an amount equal to 4% of the total number of shares of our common stock outstanding on December 31 of the prior calendar year, or a lesser number of shares determined by our boardBoard of directors.Directors. The shares reserved include only the outstanding shares related to stock options and RSUs and excludes stock options outstanding under the Original Plan. The number
Certain employees and other service providers of shares reserved for issuancethe Company participate in the equity-based compensation plan of Privateer Holdings, Inc (the “Original Plan”) under the New Plan are 12,926,172 shares, effective as of January 1, 2019.
For the year ended December 31, 2018, the total stock-based compensation expense associated with the New Plan was $20,629. As at December 31, 2017, no stock options, RSUs or restricted stock awards were granted under the New Plan.
The fair value of each stock option granted to employees under the New Plan is estimated on the date of grant using the Black-Scholes option pricing model with the following weighted average assumptions:
| ||||
|
| |||
|
|
| ||
|
|
| ||
|
|
| ||
terms and valuation method detailed below. The expected life of the awards representsstock options represented the period of time stock options arewere expected to be outstanding and iswas estimated considering vesting terms and employees’ historical exercise and post-vesting employment termination behavior. Expected volatility iswas based on historical volatilities of public companies operating in a similar industry to the Company. A forfeiture rate is estimated at the time of grant to reflect the amount of awards that are granted but are expected to be forfeited by the award holder prior to vesting. The estimated forfeiture rate applied to these amounts is derived from management’s estimate of the future stock option forfeiture behavior over the expected life of the awards.Privateer Holdings. The risk-free rate is based on the U.S.United States Treasury yield curve in effect at the time of grant. The expected dividend yield was determined based on the stock option’s exercise price and expected annual dividend rate at the time of grant.
No stock options were granted under the EIP during the year ended May 31, 2023 and 2022. For the year ended May 31, 2021, the fair value of each stock option granted is estimated on grant date using the Black-Scholes option pricing model using the following assumptions: risk-free rate for 2.10% on the date of grant; expected life of 8.97 years; volatility of 61.33% based on comparable companies; dividend yield of $nil; and, the exercise price of the respective option. The expected life of the award is estimated using the simplified method since the Company does not have adequate historical exercise data to estimate the expected term.
Stock-based activity under the EIP and Original Plan for the year ended May 31, 2023 is as follows:
EIP Time-based stock option activity | ||||||||||||||||
Weighted- | ||||||||||||||||
Weighted- | average | |||||||||||||||
average | remaining | |||||||||||||||
Stock | exercise | contractual | Aggregate | |||||||||||||
Options | price | term (years) | intrinsic value | |||||||||||||
Balance, May 31, 2022 | 2,881,749 | $ | 14.93 | 6.0 | $ | — | ||||||||||
Granted | — | — | — | — | ||||||||||||
Exercised | — | — | — | — | ||||||||||||
Forfeited | — | — | — | — | ||||||||||||
Cancelled | (72,551 | ) | 11.37 | — | — | |||||||||||
Balance, May 31, 2023 | 2,809,198 | $ | 14.88 | 5.0 | $ | — | ||||||||||
Original plan time-based stock option activity | ||||||||||||||||
Weighted- | ||||||||||||||||
Weighted- | average | |||||||||||||||
average | remaining | |||||||||||||||
Stock | exercise | contractual | Aggregate | |||||||||||||
Options | price | term (years) | intrinsic value | |||||||||||||
Balance, May 31, 2022 | 92,777 | $ | 3.52 | 3.8 | $ | 117 | ||||||||||
Exercised | (7,853 | ) | 3.27 | — | — | |||||||||||
Forfeited | — | — | — | — | ||||||||||||
Cancelled | (20,955 | ) | 4.80 | — | — | |||||||||||
Balance, May 31, 2023 | 63,969 | $ | 3.27 | 3.8 | $ | 7.68 | ||||||||||
EIP Time-based RSU activity | ||||||||||||||||
Weighted- | Weighted- | |||||||||||||||
average | average | |||||||||||||||
grant-date | remaining | |||||||||||||||
Time-based | fair value | contractual | Aggregate | |||||||||||||
RSUs | per share | term (years) | intrinsic value | |||||||||||||
Balance, May 31, 2022 | 6,710,780 | $ | 11.76 | 2.6 | $ | 25,894 | ||||||||||
Granted | 8,639,739 | 3.39 | — | — | ||||||||||||
Vested | (2,081,268 | ) | 11.15 | — | — | |||||||||||
Forfeited | (1,130,559 | ) | 5.43 | — | — | |||||||||||
Cancelled | — | — | — | — | ||||||||||||
Balance, May 31, 2023 | 12,138,692 | $ | 6.04 | 1.7 | $ | 24,857 | ||||||||||
Predecessor Plan - Aphria
Aphria had established the Aphria Omnibus Incentive Plan (the “Predecessor Plan”). Following stockholder approval of the EIP, no new awards have been granted under the Predecessor Plan. In connection with the reverse acquisition Aphria stock options, Aphria RSUs and DSUs issued under the Predecessor Plan were exchanged for options, RSUs under the EIP. As a result of the modification, all grantees were affected, and the Company recognized nil incremental compensation cost.
The fair value of each stock option granted under the Predecessor Plan is estimated on grant date using the Black-Scholes option pricing model using the following assumptions: risk-free rate for 2021 of 0.39% and 2020 of 1.20 – 1.56% on the date of grant; expected life for 2021 of 5 years and 2020 of 5 years; volatility for 2021 of 70% and 2020 of 70%) based on comparable companies; forfeiture rate for 2021 of 35% and 2020 of 20%; dividend yield for 2021 of $nil and 2020 of $nil); and, the exercise price of the respective option. The expected life of the award is estimated using the simplified method since the Company does not have adequate historical exercise data to estimate the expected term.
Stock option, RSU and RSUDSU activity for the Company under the NewPredecessor Plan is as follows:
Time-based stock stock option activity
|
| Stock Options |
|
| Weighted- average exercise price |
|
| Weighted-average remaining contractual term (years) |
|
| Aggregate intrinsic value |
| ||||
Balance December 31, 2017 |
|
| — |
|
| $ | — |
|
|
|
|
|
| $ | — |
|
Granted |
|
| 6,106,011 |
|
|
| 13.66 |
|
|
|
|
|
|
| — |
|
Exercised |
|
| — |
|
|
| — |
|
|
|
|
|
|
| — |
|
Forfeited |
|
| (90,970 | ) |
|
| 21.49 |
|
|
|
|
|
|
| — |
|
Cancelled |
|
| — |
|
|
| — |
|
|
|
|
|
|
| — |
|
Balance December 31, 2018 |
|
| 6,015,041 |
|
| $ | 13.54 |
|
|
| 7.7 |
|
| $ | 342,916 |
|
Vested and expected to vest, December 31, 2018 |
|
| 5,708,817 |
|
| $ | 13.54 |
|
|
| 9.4 |
|
| $ | 326,567 |
|
Vested and exercisable, December 31, 2018 |
|
| 1,312,500 |
|
| $ | 7.76 |
|
|
| 9.4 |
|
| $ | 82,399 |
|
May 31, 2023 | ||||||||||||||||||||
Weighted | Weighted | |||||||||||||||||||
Weighted | average | average | ||||||||||||||||||
average | grant | remaining | Aggregate | |||||||||||||||||
Number of | exercise | date fair | contractual | Intrinsic | ||||||||||||||||
options | price | value | term (years) | Amount | ||||||||||||||||
Balance, May 31, 2022 | 1,839,028 | $ | 11.29 | $ | 64.44 | 1.8 | — | |||||||||||||
Exercised | — | — | — | N/A | N/A | |||||||||||||||
Granted | — | — | — | N/A | N/A | |||||||||||||||
Forfeited | (396 | ) | 8.95 | 112.24 | N/A | N/A | ||||||||||||||
Expired | (132,005 | ) | 13.07 | 41.93 | N/A | N/A | ||||||||||||||
Balance, May 31, 2023 | 1,706,627 | $ | 11.16 | $ | 60.75 | 1.0 | — | |||||||||||||
Vested and exercisable, May 31, 2023 | 1,706,627 | $ | 11.16 | $ | 60.75 | 1.0 | — | |||||||||||||
The weighted-average fair values of all time-based stock options granted in 2018 was $7.74 per share. As of December 31, 2018, the total remaining unrecognized compensation expense related to non-vested stock options amounted to $38,250, which will be amortized over the weighted-average remaining requisite service period of approximately 2.8 years. The total fair value of stock options vested in 2018 were $5,508.
Time-based and Performance-based stock option RSU activity
May 31, 2023 | ||||||||
Weighted | ||||||||
average | ||||||||
grant - | ||||||||
date fair | ||||||||
Time- based | value per | |||||||
RSUs | share | |||||||
Balance, May 31, 2022 | 777,112 | $ | 11.09 | |||||
Granted | — | — | ||||||
Vested | (390,419 | ) | $ | 14.55 | ||||
Forfeited | (15,511 | ) | $ | 8.75 | ||||
Balance, May 31, 2023 | 371,182 | $ | 11.37 | |||||
|
| Stock Options |
|
| Weighted- average exercise price |
|
| Weighted-average remaining contractual term (years) |
|
| Aggregate intrinsic value |
| ||||
Balance December 31, 2017 |
|
| — |
|
| $ | — |
|
|
|
|
|
| $ | — |
|
Granted |
|
| 600,000 |
|
|
| 7.76 |
|
|
|
|
|
|
| — |
|
Exercised |
|
| — |
|
|
| — |
|
|
|
|
|
|
| — |
|
Forfeited |
|
| — |
|
|
| — |
|
|
|
|
|
|
| — |
|
Cancelled |
|
| — |
|
|
| — |
|
|
|
|
|
|
| — |
|
Balance December 31, 2018 |
|
| 600,000 |
|
| $ | 7.76 |
|
|
| 9.4 |
|
| $ | 37,668 |
|
Vested and expected to vest, December 31, 2018 |
|
| 591,486 |
|
| $ | 7.76 |
|
|
| 9.4 |
|
| $ | 37,134 |
|
Vested and exercisable, December 31, 2018 |
|
| 300,000 |
|
| $ | 7.76 |
|
|
| 9.4 |
|
| $ | 18,834 |
|
20. | Accumulated other comprehensive loss |
The weighted-average fair values of all performance-based stock options granted in 2018 was $4.15 per share. As of December 31, 2018, the total remaining unrecognized compensation expense related to non-vested stock options amounted to $593, which will be amortized over the weighted-average remaining requisite service period of approximately 0.6 years. The total fair value of stock options vested in 2018 were $1,246.
Time-based RSU activity
The following table summarizes non-vested time-based RSU activity during 2018:
|
| Time-based RSUs |
|
| Weighted-average grant-date fair value per share |
| ||
Non-vested December 31, 2017 |
|
| — |
|
| $ | — |
|
Granted |
|
| 238,082 |
|
|
| 50.08 |
|
Exercised |
|
| — |
|
|
| — |
|
Forfeited |
|
| (860 | ) |
|
| 110 |
|
Non-vested December 31, 2018 |
|
| 237,222 |
|
| $ | 49.86 |
|
As of December 31, 2018, there was approximately $10,336 of total unrecognized compensation cost related to non-vested time-based RSUs that will be recognized as expense over a weighted-average period of 3.17 years. No time-based RSUs vested during the period.
Performance-based RSUs
The following table summarizes non-vested performance-based RSU activity during 2018:
|
| Performance-based RSUs |
|
| Weighted-average grant-date fair value per share |
| ||
Non-vested December 31, 2017 |
|
| — |
|
| $ | — |
|
Granted |
|
| 1,050,000 |
|
|
| 7.76 |
|
Exercised |
|
| — |
|
|
| — |
|
Forfeited |
|
| — |
|
|
| — |
|
Non-vested December 31, 2018 |
|
| 1,050,000 |
|
| $ | 7.76 |
|
As of December 31, 2018, there was approximately $1,882 of total unrecognized compensation cost related to non-vested performance-based RSUs that will be recognized as expense over a weighted-average period of 1.73 years. No performance-based RSUs vested during the period.
14. Income Taxes
In connection with the Convertible Notes issued in 2018, we recognized a deferred tax liability of $8,809 in equity. As a result, we recorded an income tax benefit of $4,485 for the release of a valuation allowance on our existing U.S. deferred tax assets in order to offset the deferred tax liability established for the equity portion of the Convertible Notes. We recorded a deferred tax liability of $100 resulting from the purchase price allocation for Alef. We have net deferred tax assets which are fully offset by a valuation allowance due to our determination that it is more likely than not that the deferred tax assets will not be realized, with the exception of deferred tax assets that were applied to offset the deferred tax liability on the equity portion of the Convertible Notes. The realization of deferred tax assets is dependent on the Company generating sufficient taxable income in the years that the temporary differences become deductible. A valuation allowance has been provided for the portion of the deferred tax assets that the Company determined is more likely than not to remain unrealized based on estimated future taxable income. In the event we were to determine that we would be able to realize our net deferred tax assets in the future, an adjustment to the valuation allowance will be made, which will increase income (or decrease losses) in the period in which such a determination is made. We follow the guidance related to accounting for uncertainty in income taxes, which requires the recognition of an uncertain tax position provision when the position is not more likely than not to be sustainable upon audit by the applicable taxing authority
For financial reporting purposes,Accumulated other comprehensive loss before income taxes includes the following components:
Unrealized | ||||||||||||
Foreign | loss on | |||||||||||
currency | convertible | |||||||||||
translation | notes | |||||||||||
gain (loss) | receivables | Total | ||||||||||
Balance May 31, 2020 | $ | (232 | ) | $ | (5,202 | ) | $ | (5,434 | ) | |||
Settlement of convertible notes receivable | — | 5,277 | 5,277 | |||||||||
Other comprehensive loss | 156,649 | (3,824 | ) | 152,825 | ||||||||
Balance May 31, 2021 | 156,417 | (3,749 | ) | 152,668 | ||||||||
Other comprehensive loss | (102,004 | ) | (71,428 | ) | (173,432 | ) | ||||||
Balance May 31, 2022 | 54,413 | (75,177 | ) | (20,764 | ) | |||||||
Other comprehensive (loss) reversal | (101,023 | ) | 75,177 | (25,846 | ) | |||||||
Balance May 31, 2023 | $ | (46,610 | ) | $ | - | $ | (46,610 | ) | ||||
|
| Year ended December 31, |
| |||||||||
|
| 2018 |
|
| 2017 |
|
| 2016 |
| |||
Canada |
| $ | (25,333 | ) |
| $ | (7,411 | ) |
| $ | (7,883 | ) |
U.S. |
|
| (42,418 | ) |
|
| — |
|
|
| — |
|
Portugal |
|
| (2,208 | ) |
|
| — |
|
|
| — |
|
Other countries |
|
| (2,215 | ) |
|
| (398 | ) |
|
| — |
|
Total |
| $ | (72,174 | ) |
| $ | (7,809 | ) |
| $ | (7,883 | ) |
21. | Non-controlling interests |
The expense for income taxes consists of:
|
| Year ended December 31, |
| |||||||||
|
| 2018 |
|
| 2017 |
|
| 2016 |
| |||
Current: |
|
|
|
|
|
|
|
|
|
|
|
|
Canada |
| $ | — |
|
| $ | — |
|
| $ | — |
|
Other countries |
|
| 34 |
|
|
| — |
|
|
| — |
|
Total |
| $ | 34 |
|
| $ | — |
|
| $ | — |
|
|
|
|
|
|
|
|
|
|
|
|
|
|
Deferred: |
|
|
|
|
|
|
|
|
|
|
|
|
Canada |
| $ | — |
|
| $ | — |
|
| $ | — |
|
U.S. |
|
| (4,485 | ) |
|
| — |
|
|
| — |
|
Total |
| $ | (4,485 | ) |
| $ | — |
|
| $ | — |
|
Income tax expense in 2018 was related to taxable profit in Germany. The income tax benefit in 2018 was relatedfollowing tables summarize the information relating to the release valuation allowance for deferred tax assets recognized to offset the deferred tax liability recorded for the Convertible Notes.Company’s majority-owned subsidiaries, CC Pharma Nordic ApS (75%), Aphria Diamond (51%), ColCanna S.A.S. (90%), and SH Acquisition (68%) before intercompany eliminations.
We recognizedSummarized balance sheet information of the entities in which there is a non-controlling interest and penalties related to unrecognized tax benefits on the income tax expense line in the accompanying Consolidated Statements of Net Loss and Comprehensive Loss. Accrued interest and penalties are included on the related tax liability line in the Consolidated Balance Sheets.as at May 31, 2023:
SH | CC Pharma | Aphria | ColCanna | May 31, | ||||||||||||||||
Acquisition | Nordic ApS | Diamond | S.A.S. | 2023 | ||||||||||||||||
Current assets | $ | — | $ | 114 | $ | 127,689 | $ | 224 | $ | 128,027 | ||||||||||
Non-current assets | 74,681 | — | 135,085 | 3,307 | 213,073 | |||||||||||||||
Current liabilities | — | (1,166 | ) | (142,554 | ) | (6,697 | ) | (150,417 | ) | |||||||||||
Non-current liabilities | — | — | (53,197 | ) | (1,428 | ) | (54,625 | ) | ||||||||||||
Net assets | $ | 74,681 | $ | (1,052 | ) | $ | 67,023 | $ | (4,594 | ) | $ | 136,058 | ||||||||
Reconciliation
Summarized balance sheet information of the expected income taxentities in which there is a non-controlling interest as at the United States statutory income tax rate of 21% (2017 – 35%) to income tax expense:May 31, 2022:
|
| Year ended December 31, |
| |||||||||
| 2018 |
|
| 2017 |
|
| 2016 |
| ||||
Loss before income taxes: |
| $ | (72,174 | ) |
| $ | (7,809 | ) |
| $ | (7,883 | ) |
Expected income tax recovery |
|
| (15,157 | ) |
|
| (2,733 | ) |
|
| (2,797 | ) |
Difference in foreign tax rates |
|
| (1,864 | ) |
|
| 675 |
|
|
| 719 |
|
Foreign exchange and other |
|
| 1,399 |
|
|
| (480 | ) |
|
| (72 | ) |
Non-deductible expenses |
|
| 5,331 |
|
|
| 61 |
|
|
| (40 | ) |
Changes in enacted rates |
|
| — |
|
|
| (288 | ) |
|
| — |
|
Utilization of losses no previously recognized |
|
| — |
|
|
| (9 | ) |
|
| — |
|
Change in valuation allowance |
|
| 5,840 |
|
|
| 2,774 |
|
|
| 2,190 |
|
Income tax recovery, net |
| $ | (4,451 | ) |
| $ | — |
|
| $ | — |
|
The following table summarizes the components of deferred tax:
|
| Year ended December 31, |
| |||||||||
|
| 2018 |
|
| 2017 |
|
| 2016 |
| |||
Deferred assets |
|
|
|
|
|
|
|
|
|
|
|
|
Tax loss carryforwards – Canada |
| $ | 13,723 |
|
| $ | 8,297 |
|
| $ | 5,821 |
|
Tax loss carryforwards – U.S. |
|
| 4,173 |
|
|
| — |
|
|
| — |
|
Tax loss carryforwards – other countries |
|
| 607 |
|
|
| 148 |
|
|
| 9 |
|
Property and equipment |
|
| 2,510 |
|
|
| 183 |
|
|
| 98 |
|
Deferred financing costs |
|
| 27 |
|
|
| 37 |
|
|
| — |
|
Investment tax credits and related pool balance |
|
| 57 |
|
|
| 57 |
|
|
| 57 |
|
Other |
|
| — |
|
|
| 8 |
|
|
| — |
|
Total Deferred tax assets |
|
| 21,097 |
|
|
| 8,730 |
|
|
| 5,985 |
|
Less valuation allowance |
|
| (14,433 | ) |
|
| (8,601 | ) |
|
| (5,836 | ) |
Net deferred tax assets |
|
| 6,664 |
|
|
| 129 |
|
|
| 149 |
|
Deferred tax liabilities |
|
|
|
|
|
|
|
|
|
|
|
|
Plant and equipment |
|
| (2,328 | ) |
|
| — |
|
|
| — |
|
Intangible assets |
|
| (289 | ) |
|
| (129 | ) |
|
| (144 | ) |
Deferred financing costs |
|
| — |
|
|
| — |
|
|
| (5 | ) |
Equity portion of convertible senior notes due 2023 |
|
| (8,471 | ) |
|
| — |
|
|
| — |
|
Total deferred tax liabilities |
|
| (11,088 | ) |
|
| (129 | ) |
|
| (149 | ) |
Net deferred tax liability |
| $ | (4,424 | ) |
| $ | — |
|
| $ | — |
|
SH | CC Pharma | Aphria | ColCanna | May 31, | ||||||||||||||||
Acquisition | Nordic ApS | Diamond | S.A.S. | 2022 | ||||||||||||||||
Current assets | $ | — | $ | 485 | $ | 20,546 | $ | 193 | $ | 21,224 | ||||||||||
Non-current assets | 111,200 | 158 | 152,786 | 93,738 | 357,882 | |||||||||||||||
Current liabilities | — | (642 | ) | (63,196 | ) | (53 | ) | (63,891 | ) | |||||||||||
Non-current liabilities | — | (410 | ) | (29,653 | ) | (6,537 | ) | (36,600 | ) | |||||||||||
Net assets | $ | 111,200 | $ | (409 | ) | $ | 80,483 | $ | 87,341 | $ | 278,615 | |||||||||
The realization of deferred tax assets is dependent on the Company generating sufficient taxableSummarized income in the years that the temporary differences become deductible. A valuation allowance has been provided for the portionstatement information of the deferred tax assets that the Company determinedentities in which there is more likely than not to remain unrealized based on estimated future taxable income.
As of December 31, 2018 and 2017, the Company had accumulated tax losses available to offset future years’ federal and provincial taxable income in Canada of approximately $51,064 and $30,000, respectively. The Canadian non-capital loss carryforwards expire as noted in the table below:
December 31, |
| Amount |
| |
2033 |
| $ | 381 |
|
2034 |
|
| 6,429 |
|
2035 |
|
| 7,627 |
|
2036 |
|
| 7,230 |
|
2037 |
|
| 6,195 |
|
2038 |
|
| 23,202 |
|
|
| $ | 51,064 |
|
As of December 31, 2018, the Company has Australian net operating loss carryforward of $162 (2017 – $167). The loss may be carried forward indefinitely. The Company has Portuguese net operating loss of $2,538 (2017 – $74). Portuguese net operating loss carry forward 5 years and expire in 2023. The Company has U.S. net operating losses available to offset future years' taxable income in the U.S. approximately $19,872. The net operating loss can only offset 80% of taxable income and it may be carried forward indefinitely.
The Company files federal income tax returns in Canada, Germany, and other foreign jurisdictions. The Company has open tax years with various taxing jurisdictions. These open years contain certain matters that could be subject to differing interpretations of applicable tax laws and regulations, and tax treaties, as they relate to the amount, timing, or inclusion of revenue and expense.
|
| |
|
| |
|
| |
|
| |
|
| |
|
|
Tilray Canada, Ltd. is currently under examination by the Canada Revenue Agency for the 2014 and 2015 taxation years.
The following table outlines the movements in the valuation allowance:
|
| Balance at beginning of year |
|
| Change due to expense and foreign exchange |
|
| Deductions |
|
| Balance at end of year |
| ||||
Year ended December 31, 2018 |
| $ | 8,601 |
|
| $ | (113 | ) |
| $ | 5,945 |
|
| $ | 14,433 |
|
Year ended December 31, 2017 |
| $ | 5,836 |
|
| $ | 395 |
|
| $ | 2,370 |
|
| $ | 8,601 |
|
The valuation allowance increased by $5,832 in 2018, increased by $2,765 in 2017, which was mostly related to the changes in our deferred tax asset balances. The 2018 increase in the valuation allowance was due to $10,317 related to the current year loss, tax credits, foreign exchange and other activity, offset by $4,485 decrease for release of valuation allowance related to the deferred tax liabilities charged to equity.
15. Commitments and Contingencies
Legal proceedings
In the normal course of business, the Company may become involved in legal disputes regarding various litigation matters. In the opinion of management, any potential liabilities resulting from such claims would not have a material effect on the financial statements.
Lease commitments
The Company leases various facilities, under non-cancelable capital and operating leases, which expire at various dates through September 2027.
Under the terms of the operating lease agreements, the Company is responsible for certain insurance and maintenance expenses. The Company records rent expense on a straight-line basis over the terms of the underlying leases. Rent expensenon-controlling interest for the year ended DecemberMay 31, 2018 was $745 (2017 – $1752023:
SH | CC Pharma | Aphria | ColCanna | May 31, | ||||||||||||||||
Acquisition | Nordic ApS | Diamond | S.A.S. | 2023 | ||||||||||||||||
Revenue | $ | — | $ | 126 | $ | 161,453 | $ | 1 | $ | 161,580 | ||||||||||
Total expenses | 107,297 | 748 | 85,460 | 57,293 | 250,798 | |||||||||||||||
Net (loss) income | (107,297 | ) | (622 | ) | 75,993 | (57,292 | ) | (89,218 | ) | |||||||||||
Other comprehensive (loss) income | 70,778 | (21 | ) | (961 | ) | (34,643 | ) | 35,153 | ||||||||||||
Net comprehensive (loss) income | $ | (36,519 | ) | $ | (643 | ) | $ | 75,032 | $ | (91,935 | ) | $ | (54,065 | ) | ||||||
Non-controlling interest % | 32 | % | 25 | % | 49 | % | 10 | % | NA | |||||||||||
Comprehensive (loss) income attributable to NCI | (11,686 | ) | (161 | ) | 36,766 | (9,194 | ) | 15,725 | ||||||||||||
Additional income attributable to NCI | — | — | 11,421 | — | 11,421 | |||||||||||||||
Net comprehensive (loss) income attributable to NCI | $ | (11,686 | ) | $ | (161 | ) | $ | 48,187 | $ | (9,194 | ) | $ | 27,146 | |||||||
Summarized income statement information of the entities in which there is a non-controlling interest for the year ended May 31, 2022:
SH | CC Pharma | Aphria | ColCanna | May 31, | ||||||||||||||||
Acquisition | Nordic ApS | Diamond | S.A.S. | 2022 | ||||||||||||||||
Revenue | $ | — | $ | 354 | $ | 148,323 | $ | — | $ | 148,677 | ||||||||||
Total expenses | (11,180 | ) | 470 | 77,057 | 35 | 66,382 | ||||||||||||||
Net (loss) income | 11,180 | (116 | ) | 71,266 | (35 | ) | 82,295 | |||||||||||||
Other comprehensive (loss) income | (70,778 | ) | 47 | (2,353 | ) | (4,737 | ) | (77,821 | ) | |||||||||||
Net comprehensive (loss) income | $ | (59,598 | ) | $ | (69 | ) | $ | 68,913 | $ | (4,772 | ) | $ | 4,474 | |||||||
Non-controlling interest % | 32 | % | 25 | % | 49 | % | 10 | % | NA | |||||||||||
Net comprehensive (loss) income | $ | (19,071 | ) | $ | (17 | ) | $ | 33,767 | $ | (477 | ) | $ | 14,202 | |||||||
Summarized income statement information of the entities in which there is a non-controlling interest for the year ended May 31, 2021:
CC Pharma | Aphria | ColCanna | May 31, | |||||||||||||
Nordic ApS | Diamond | S.A.S. | 2021 | |||||||||||||
Revenue | $ | 827 | $ | 131,381 | $ | — | $ | 132,208 | ||||||||
Total expenses (recovery) | 958 | 67,030 | 923 | 68,911 | ||||||||||||
Net (loss) income | (131 | ) | 64,351 | (923 | ) | 63,297 | ||||||||||
Other comprehensive (loss) income | — | — | — | — | ||||||||||||
Net comprehensive (loss) income | $ | (131 | ) | $ | 64,351 | $ | (923 | ) | $ | 63,297 | ||||||
Non-controlling interest % | 25 | % | 49 | % | 10 | % | NA | |||||||||
Net comprehensive (loss) income | $ | (33 | ) | $ | 31,532 | $ | (92 | ) | $ | 31,407 | ||||||
22. | Net revenue |
Net revenue is comprised of:
For the year ended May 31, | ||||||||||||
2023 | 2022 | 2021 | ||||||||||
Cannabis revenue | $ | 284,314 | $ | 300,891 | $ | 264,334 | ||||||
Cannabis excise taxes | (63,884 | ) | (63,369 | ) | (62,942 | ) | ||||||
Net cannabis revenue | 220,430 | 237,522 | 201,392 | |||||||||
Beverage alcohol revenue | 100,679 | 74,959 | 29,661 | |||||||||
Beverage alcohol excise taxes | (5,586 | ) | (3,467 | ) | (1,062 | ) | ||||||
Net beverage alcohol revenue | 95,093 | 71,492 | 28,599 | |||||||||
Distribution revenue | 258,770 | 259,747 | 277,300 | |||||||||
Wellness revenue | 52,831 | 59,611 | 5,794 | |||||||||
Total | $ | 627,124 | $ | 628,372 | $ | 513,085 | ||||||
23. | Cost of goods sold |
Cost of goods sold is comprised of:
For the year ended May 31, | ||||||||||||
2023 | 2022 | 2021 | ||||||||||
Cannabis costs | $ | 162,755 | $ | 194,834 | $ | 130,511 | ||||||
Beverage alcohol costs | 48,770 | 32,033 | 12,687 | |||||||||
Distribution costs | 231,309 | 243,231 | 242,472 | |||||||||
Wellness costs | 37,330 | 41,457 | 4,233 | |||||||||
Total | $ | 480,164 | $ | 511,555 | $ | 389,903 | ||||||
24. | General and administrative expenses |
General and 2016 – $0).administrative expenses are comprised of the following items:
For the year ended May 31, | ||||||||||||
2023 | 2022 | 2021 | ||||||||||
Executive compensation | $ | 13,655 | $ | 14,128 | $ | 8,645 | ||||||
Office and general | 27,845 | 27,153 | 19,503 | |||||||||
Salaries and wages | 57,228 | 51,693 | 37,126 | |||||||||
Stock-based compensation | 39,595 | 35,994 | 17,351 | |||||||||
Insurance | 12,033 | 17,536 | 12,257 | |||||||||
Professional fees | 7,166 | 13,047 | 11,779 | |||||||||
Gain on sale of capital assets | (48 | ) | (682 | ) | — | |||||||
Insurance proceeds | — | (4,032 | ) | — | ||||||||
Travel and accommodation | 4,530 | 4,203 | 2,711 | |||||||||
Rent | 3,155 | 3,761 | 2,203 | |||||||||
Total | $ | 165,159 | $ | 162,801 | $ | 111,575 | ||||||
25. | Interest expense, net |
Interest expense, net is comprised of:
For the year ended May 31, | ||||||||||||
2023 | 2022 | 2021 | ||||||||||
Interest income | $ | 33,025 | $ | 11,736 | $ | 2,926 | ||||||
Interest expense | (46,612 | ) | (39,680 | ) | (30,903 | ) | ||||||
| $ | (13,587 | ) | $ | (27,944 | ) | $ | (27,977 | ) | ||||
26. | Non-operating (expense) income |
Non-operating (expense) income is comprised of:
For the year ended May 31, | ||||||||||||
2023 | 2022 | 2021 | ||||||||||
Change in fair value of convertible debenture payable | $ | (43,651 | ) | $ | 163,670 | $ | (170,453 | ) | ||||
Change in fair value of warrant liability | 12,438 | 63,913 | 1,234 | |||||||||
Foreign exchange loss | (25,535 | ) | (28,383 | ) | (22,347 | ) | ||||||
Loss on long-term investments | (2,190 | ) | (6,737 | ) | (2,352 | ) | ||||||
Other non-operating (losses) gains, net | (7,971 | ) | 5,208 | 9,080 | ||||||||
| $ | (66,909 | ) | $ | 197,671 | $ | (184,838 | ) | |||||
Other non-operating (losses) gains, net for the year ended May 31, 2023, includes amounts to settle outstanding notes with non-controlling interest shareholders.
27. | Commitments and contingencies |
Purchase and other commitments
The Company has payments on long-term debt (refer to Note 16 Long-term debt), convertible notes (refer to Note 17 Convertible Debentures), material purchase commitments and construction commitments as follows:
Total | 2024 | 2025 | 2026 | 2027 | Thereafter | |||||||||||||||||||
Long-term debt repayment | $ | 161,707 | $ | 24,080 | $ | 14,208 | $ | 41,798 | $ | 10,522 | $ | 71,099 | ||||||||||||
Convertible notes payable | 464,070 | 177,330 | 136,740 | — | — | 150,000 | ||||||||||||||||||
Material purchase obligations | 24,468 | 18,726 | 5,140 | 602 | — | — | ||||||||||||||||||
Construction commitments | 8,410 | 8,410 | — | — | — | — | ||||||||||||||||||
Total | $ | 658,655 | $ | 228,546 | $ | 156,088 | $ | 42,400 | $ | 10,522 | $ | 221,099 | ||||||||||||
Legal proceedings
In the ordinary course of business, we are at times subject to various legal proceedings and disputes, including the proceedings specifically discussed below. We assess our liabilities and contingencies in connection with outstanding legal proceedings utilizing the latest information available. Where it is probable that we will incur a loss and the amount of the loss can be reasonably estimated, we record a liability in our consolidated financial statements. These legal reserves may be increased or decreased to reflect any relevant developments on a quarterly basis. Where a loss is not probable or the amount of loss is not estimable, we do not accrue legal reserves. While the outcome of legal proceedings is inherently uncertain, based on information currently available and available insurance coverage, our management believes that it has established appropriate legal reserves. Any incremental liabilities arising from pending legal proceedings are not expected to have a material adverse effect on our consolidated financial position, consolidated results of operations, or consolidated cash flows. However, it is possible that the ultimate resolution of these matters, if unfavorable, may be material to our consolidated financial position, consolidated results of operations, or consolidated cash flows.
Class Action Suits and Stockholder Derivative Suits
Approved Settlement of Tilray Brands, Inc. Reorganization Litigation (Delaware, New York) – Special Litigation Committee
On February 27, 2020, Tilray stockholders Deborah Braun and Nader Noorian filed a class action and derivative complaint in the Delaware Court of Chancery styled Braun v. Kennedy, C.A. No.2020-0137-KSJM. On March 2, 2020, Tilray stockholders Catherine Bouvier, James Hawkins, and Stephanie Hawkins filed a class action and derivative complaint in the Delaware Court of Chancery styled Bouvier v. Kennedy, C.A. No.2020-0154-KSJM.
On March 4, 2020, the Delaware Court of Chancery entered an order consolidating the two cases and designating the complaint in the Braun/Noorian action as the operative complaint. The operative complaint asserts claims for breach of fiduciary duty against Brendan Kennedy, Christian Groh, Michael Blue, and Privateer Evolution, LLC (the “Privateer Defendants”) for alleged breaches of fiduciary duty in their alleged capacities as Tilray’s controlling stockholders and against Kennedy, Maryscott Greenwood, and Michael Auerbach for alleged breaches of fiduciary duties in their capacities as directors and/or officers of Tilray in connection with the prior merger of Privateer Holdings, Inc. with and into a wholly owned subsidiary (the “Downstream Merger”). The complaint alleges that the Privateer Defendants breached their fiduciary duties by causing Tilray to enter into the Downstream Merger and Tilray’s Board to approve that Downstream Merger, and that Defendants Kennedy, Greenwood, and Auerbach breached their fiduciary duties as directors by approving the Downstream Merger. Plaintiffs allege that the Downstream Merger gave the Privateer Defendants hundreds of millions of dollars of tax savings without providing a corresponding benefit to Tilray and its minority stockholders and that the Downstream Merger unfairly transferred and extended Kennedy, Blue, and Groh’s control over Tilray.
In August 2021, the Company’s Board of Directors established a Special Litigation Committee (the “SLC”) of independent directors to re-assert director control and investigate the derivative claims in this litigation matter. The SLC has appointed the law firm Wilson Sonsini to assist the SLC with an ongoing investigation of the underlying claim and determine whether continued prosecution of such claims was in the best interests of the Company.
On May 27, 2022, the SLC informed the Court that it had completed its investigation; determined not to seek dismissal of the Action; and confirmed its determination that the Company had suffered significant damages and that the SLC would pursue claims to recover appropriate amounts for the Company's benefit. Thereafter, the SLC, all of the Defendants, and certain non-parties participated in two mediation sessions before former Chancellor of the Delaware Court of Chancery Andre G. Bouchard.
On July 15, 2022, the SLC reached an agreement in principle with Defendants and certain of the non-parties, and their respective insurers, to resolve the claims asserted in the Action in exchange for an aggregate amount of $26,900 to be paid to Tilray plus mutual releases. The SLC subsequently reached further agreement with an additional non-party and plaintiffs to settle the entire Action. On December 20, 2022, the parties submitted a Stipulation and Agreement of Compromise, Settlement, and Release (“Settlement Stipulation”) to the Court for approval which provides for, among other things, an aggregate cash amount of $39,900 to be paid to Tilray and mutual releases. A hearing to approve the Settlement Stipulation was held on February 27, 2023, and was formally approved by the Court shortly thereafter. Tilray received the settlement proceeds following such approval. Plaintiffs' counsel was awarded fees equal to $6,500. Tilray stockholders did not receive any direct payment from the Settlement Stipulation.
Authentic Brands Group Related Class Action (New York, United States)
On May 4, 2020, Ganesh Kasilingam filed a lawsuit in the United States District Court for the Southern District of New York (“SDNY”), against Tilray Brands, Inc., Brendan Kennedy and Mark Castaneda, on behalf of himself and a putative class, seeking to recover damages for alleged violations of Sections 10(b) and 20(a) of the Securities Exchange Act of 1934 (the “Kasilingam litigation”). The complaint alleges that Tilray and the individual defendants overstated the anticipated advantages of the Company’s revenue sharing agreement with Authentic Brands Group (“ABG”), announced on January 15, 2019, and that the plaintiff suffered losses when Tilray’s stock price dropped after Tilray recognized an impairment with respect to the ABG deal on March 2, 2020. On August 6, 2020, SDNY entered an order appointing Saul Kassin as Lead Plaintiff and The Rosen Law Firm, P.A. as Lead Counsel. Lead Plaintiff filed an amended complaint on October 5, 2020, which asserts the same Sections 10(b) and 20(a) claims against the same defendants on largely the same theory, and includes new allegations that Tilray’s reported inventory, cost of sales, and gross margins in its financial reports during the class period were false and misleading because Tilray improperly recorded unsellable “trim” as inventory and understated the cost of sales for its products.
On September 27, 2021, the U.S. District Court entered an Opinion & Order granting the Defendants’ motion to dismiss the complaint in the Kasilingam litigation without prejudice. On December 3, 2021, the lead plaintiff filed a second amended complaint alleging similar claims against Tilray and Brendan Kennedy. The defendants moved to dismiss the amended complaint on February 2, 2022. On September 28, 2022, the Court granted in part and denied in part the defendants’ motion to dismiss the second amended complaint. On October 12, 2022, the Company filed a motion for reconsideration and/or interlocutory appeal of this Court decision which remain pending.
Aphria Inc. Securities Litigation (New York, United States)
On December 5, 2018,a putative securities class action was commenced in SDNY against Aphria and certain current and former officers and directors. The action claims that the defendants misrepresented the value of three cannabis-producing properties Aphria acquired in Jamaica, Colombia, and Argentina (the “LATAM Assets”). On December 3, 2018, two notorious short-sellers issued a report about the acquisitions, claiming the LATAM Assets were non-functional or non-existent, which allegedly caused Aphria’s stock price to fall. On April 15, 2019, Aphria took impairment charges on the LATAM Assets, which also allegedly caused Aphria’s stock price to decline. The putative class action claims that Aphria artificially inflated the price of its publicly-traded stock by making false statements about the LATAM Assets, and when the purported truth was revealed by a short-seller report and write-down, the stock price declined, harming investors.
On September 30, 2020, the Court denied the motion to dismiss the complaint as to Aphria, Vic Neufeld, and Carl Merton, and granted the motion as to Cole Cacciavillani, John Cervini, Andrew DeFrancesco, and SOL Global Investments. On October 1, 2020, Plaintiffs moved for reconsideration of the order dismissing DeFrancesco and SOL or, in the alternative, to amend their complaint. On October 14, 2020, Aphria, Neufeld, and Merton moved for reconsideration of the order denying their motion to dismiss.
On September 29, 2021, the U.S. District Court issued an Order that (i) permitted the plaintiffs to amend their lawsuit to revive the claims against Andy DeFrancecso; and (ii) declined to revisit his decision that claims could proceed against Aphria/Tilray, Vic Neufeld, and Carl Merton. Plaintiffs declined to amend their complaint, however, and so the action is proceeding solely against Aphria/Tilray, Neufeld, and Merton. On December 5, 2022, the parties engaged in a mediation session with an independent mediator. However, no settlement agreement was reached.
It is too early to determine any potential damages from this proceeding. The Company and the individual defendants believe the claims are without merit, and intend to vigorously defend against the claims, but there can be no assurances as to the outcome.
LATAM and Nuuvera Class Actions and Individual Actions (Canada)
On January 29, 2018, Aphria announced the acquisition of Nuuvera Inc. On July 17, 2018, Aphria announced a planned expansion into Latin America and the Caribbean with the acquisition of LATAM Holdings Inc. The following class actions and four individual proceedings have been commenced in Canada against Aphria and several current or former officers relating to the Nuuvera and LATAM transactions:
(i) | a proposed class action (the "Vecchio Action") commenced in the Ontario Superior Court in February 2019, and amended thereafter, alleging statutory and common law misrepresentations and oppression relating to the Nuuvera and LATAM transactions. The Vecchio Action names Aphria, Merton, Neufeld, Cacciavillani and 5 underwriters as defendants; |
(ii) | four individual actions (the "Individual Actions") commenced by Wan, Bergerson, Landry, and Profinsys in the Ontario Superior Court alleging statutory and common law misrepresentations relating to the LATAM and Nuuvera transactions. The Individual Actions name Aphria, Merton, Neufeld, and Cacciavillani as defendants. |
In the Vecchio Action a motion for certification and leave was heard. For Reasons for Decision released August 6, 2021, and with the consent of Aphria and the individually named Defendants, the Court granted leave to proceed with the secondary market statutory cause of action, and certified the Action on behalf of a defined class of purchasers. Also, on consent, the Court dismissed the claims of oppression and common law misrepresentation against Aphria and the individual defendants, as well as all claims against Carl Merton. The Court granted certification of the primary market statutory cause of action against all remaining Defendants but made it conditional on a successful motion by the Plaintiff to have the Court appoint a second Plaintiff for that aspect of the Claim. The defendant underwriters are appealing one term of that final aspect of the Court's decision. We continue to believe that these claims are without merit and plan to vigorously defend against this action.
Langevin Canada Class Action Regarding Alleged Mislabled Products (Alberta, Canada)
On June 16, 2020, Lisa Langevin commenced a purported class action against Tilray, Aphria, and Broken Coast Cannabis Ltd. (a subsidiary of Aphria) in the Alberta Court of Queen’s Bench, on her behalf and on behalf of a proposed class of all medicinal and recreational users in Canada of the defendants’ cannabis products who consumed the products before their expiry date. The plaintiff alleges that the defendants marketed medicinal and recreational cannabis products in circumstances where the defendants misrepresented the amount of Tetrahydrocannabinol or Cannabidiol in certain of their respective products. The plaintiff claims that as a result of the alleged mislabeling, the plaintiff and proposed class members did not receive and consume the product that they believed they had purchased causing them loss, risk of injury and actual injury. The plaintiff seeks $500,000 in damages and restitution and $5,000 in punitive damages plus interest and costs collectively from the defendants. On July 20, 2020, plaintiff filed an Amended Statement of Claim, and on December 4, 2020 filed a Third Amended Statement of Claim. The application by the defendants to be relieved from the obligation to file a Statement of Defense was argued before the case management justice on June 1, 2021, and a decision is under reserve. The Company believes the claims are without merit, and intends to vigorously defend against them, but there can be no assurances as to the outcome.
Legal Proceedings Related to Contractual Obligations
420 Investments Ltd. Litigation
On February 21, 2020, 420 Investments Ltd., as Plaintiff (“420 Investments”), filed a lawsuit against Tilray Brands, Inc. and High Park Shops Inc. (“High Park”), as Defendants, in Calgary, Alberta in the Court of Queen’s Bench of Alberta. In August 2019, Tilray and High Park entered into an Arrangement Agreement with 420 Investments and others (the “Agreement”). Pursuant to the Agreement, High Park was to acquire the securities of 420 Investments. In February 2020, Tilray and High Park gave notice of termination of the Agreement. 420 Investments alleges that the termination was unlawful and without merit and further alleges that the Defendants had no legal basis to terminate. 420 Investments alleges that the Defendants did not meet their contractual and good faith obligations under the Agreement. 420 Investment seeks damages in the stated amount of C$110,000, plus C$20,000 in aggravated damages. The Tilray and High Park Statement of Defense and counterclaim were both filed on March 20, 2020. 420 Investment’s Statement of Defense to our counterclaim was filed on April 20, 2020. Respectively, 420 Investments and Tilray / High Park served each other with their Affidavits of Records (“AOR”) on August 25, 2020 and November 30, 2020. Tilray and High Park cross-examined the litigation representative of 420 Investments about its AOR with 420 Investments producing supplemental documents in August 2021 and 2022. Additional discovery may take place in the Fall of 2023. In February 2023, Tilray and High Park filed an Application for Summary Judgment to collect an unpaid C$7,000 bridge loan made to 420 Investments on August 28, 2019, relating to the subject transaction. That debt was repayable in March 2020, but was never repaid. The application is pending and a decision from the Court is expected in September or October 2023. No trial date has been set. The Company denies the Plaintiff’s allegations and intends to vigorously defend this litigation matter, although there can be no assurance as to its outcome.
Docklight Litigation
On November 5, 2021 Docklight Brands, Inc. (“Docklight”) filed a complaint against the Company and its wholly-owned subsidiary, High Park Holdings, Ltd. entered into(“High Park”) in Superior Court of the State of Washington, King County. Docklight claimed breach of contract against High Park arising from a 2018 license agreement pursuant to which Docklight licensed certain Bob Marley-related brands to High Park (as amended in 2020 and 2021, the “High Park License”). In addition, Docklight brought a negligent misrepresentation claim against Tilray, alleging that certain individuals at Tilray or Aphria had made false statements to Docklight in order to induce Docklight to waive Docklight’s alleged right to terminate the High Park License for change-of-control on the basis of the 2021 Tilray-Aphria Arrangement Agreement. Docklight seeks injunctive relief as well as unspecified damages. On December 17, 2021, Defendants removed the case to the United States District Court, Federal District of Washington. Defendants’ answer to the complaint was filed January 21, 2022, and discovery is ongoing. Mediation was held April 2023, but the parties were unable to reach a resolution. Tilray and High Park continue to believe that the claims are without merit and we intend to continue to vigorously defend the Docklight suit.
Cannfections Group Inc. / High Park Farms Ltd. and High Park Holdings Ltd. (Canada, Commercial Arbitration)
On December 2, 2022 Cannfections Group Inc., a JV that is 50% owned by High Park, (“Cannfections”) delivered a Request to Arbitrate along with a Statement of Claim to Tilray’s subsidiaries High Park Farms Ltd. and High Park Holdings Ltd. for an operating leasearbitration to financebe held in Toronto, Ontario. Cannfections claims breach of contract against Tilray arising from a 2019 supply agreement pursuant to which Tilray retained Cannfections to manufacture cannabis-infused chocolates and gummies. Cannfections primarily alleges that Tilray failed to meet certain minimum order volumes of products from Cannfections resulting in claimed damages of C$27,500. Tilray has filed a Statement of Defense denying the allegations and the parties have completed document production and selected an arbitrator to hear this matter in November 2023. Tilray believes these claims are without merit intends to vigorously defend the claims during arbitration proceeding
Included in Litigation (recovery) costs is $33,400 relating to the SLC Settlement (net of costs) and expense accruals equaling $25,000 to cover various ongoing litigation matters that are probable and estimable, for the year ended May 31, 2023.
28. | Financial risk management and financial instruments |
Financial instruments
The Company has classified its expansionfinancial instruments as described in Note 3 (Significant accounting policies).
The carrying values of production operationsaccounts receivable, bank indebtedness and accounts payable and accrued liabilities approximate their fair values due to their short periods to maturity.
The Company’s long-term debt of $nil (2022 - $17,839) and the principal portion of convertible debentures payable of $464,070 are subject to fixed interest rates.
Fair value hierarchy
Financial instruments recorded at fair value are classified using a fair value hierarchy that reflects the significance of inputs used in London, Ontario, Canada.
Aggregate future minimum rental payments under all non-cancelable capitalmaking the measurements. Cash and operating leasescash equivalents are Level 1. The hierarchy is summarized as follows:
Level 1 | Quoted prices (unadjusted) in active markets for identical assets and liabilities |
Level 2 | Inputs that are observable for the asset or liability, either directly (prices) or indirectly (derived from prices) from observable market data |
Level 3 | Inputs for assets and liabilities not based upon observable market data |
|
| Operating Leases |
|
| Capital Leases |
| ||||||||||
|
| December 31, |
|
| December 31, |
| ||||||||||
|
| 2018 |
|
| 2017 |
|
| 2018 |
|
| 2017 |
| ||||
2019 |
| $ | 916 |
|
| $ | 46 |
|
| $ | 733 |
|
| $ | 772 |
|
2020 |
|
| 857 |
|
|
| 15 |
|
|
| 733 |
|
|
| 772 |
|
2021 |
|
| 727 |
|
|
| — |
|
|
| 733 |
|
|
| 772 |
|
2022 |
|
| 589 |
|
|
| — |
|
|
| 733 |
|
|
| 772 |
|
2023 |
|
| 510 |
|
|
| — |
|
|
| 183 |
|
|
| 579 |
|
Thereafter |
|
| 1,372 |
|
|
| — |
|
|
| — |
|
|
| — |
|
|
| $ | 4,971 |
|
| $ | 61 |
|
| $ | 3,115 |
|
| $ | 3,667 |
|
Purchase commitments
In December 2018,The following tables present information about the Company’s assets and liabilities that are measured at fair value on a recurring basis as of May 31, 2023 and 2022 and indicates the fair value hierarchy of the valuation techniques the Company signed an agreementutilized to determine such fair value:
May 31, | ||||||||||||||||
Level 1 | Level 2 | Level 3 | 2023 | |||||||||||||
Financial assets | ||||||||||||||||
Cash and cash equivalents | $ | 206,632 | $ | — | $ | — | $ | 206,632 | ||||||||
Marketable securities | 241,897 | — | — | 241,897 | ||||||||||||
Convertible notes receivable | — | — | 103,401 | 103,401 | ||||||||||||
Equity investments measured at fair value | 1,056 | 1,088 | 5,651 | 7,795 | ||||||||||||
Financial liabilities | ||||||||||||||||
Warrant liability | — | — | (1,817 | ) | (1,817 | ) | ||||||||||
Contingent consideration | — | — | (27,107 | ) | (27,107 | ) | ||||||||||
APHA 24 Convertible debenture | — | — | (120,568 | ) | (120,568 | ) | ||||||||||
Total recurring fair value measurements | $ | 449,585 | $ | 1,088 | $ | (40,440 | ) | $ | 410,233 | |||||||
May 31, | ||||||||||||||||
Level 1 | Level 2 | Level 3 | 2022 | |||||||||||||
Financial assets | ||||||||||||||||
Cash and cash equivalents | $ | 415,909 | $ | — | $ | — | $ | 415,909 | ||||||||
Convertible notes receivable | — | — | 111,200 | 111,200 | ||||||||||||
Equity investments measured at fair value | 1,878 | 2,469 | 5,703 | 10,050 | ||||||||||||
Financial liabilities | ||||||||||||||||
Warrant liability | — | — | (14,255 | ) | (14,255 | ) | ||||||||||
Contingent consideration | — | — | (16,007 | ) | (16,007 | ) | ||||||||||
APHA 24 Convertible debenture | — | — | (216,753 | ) | (216,753 | ) | ||||||||||
Total recurring fair value measurements | $ | 417,787 | $ | 2,469 | $ | (130,112 | ) | $ | 290,144 | |||||||
The Company’s financial assets and liabilities required to be measured on a recurring basis are its convertible notes receivable, equity investments measured at fair value, convertible debentures measured at fair value, acquisition-related contingent consideration, and warrant liability.
Convertible notes receivable and long-term investments are recorded at fair value. The estimated fair value is determined using the Black Scholes option pricing model, probability of legalization and is classified as Level 3.
Convertible debentures payable are recorded at fair value when elected or required under US GAAP. Specifically, the APHA 24 instrument's estimated fair value is determined using the Black-Scholes option pricing model and is classified as Level 3.
Certain equity investments recorded at fair value have quoted prices in active markets for identical assets and are classified as Level 1.The Company classified securities with Rose Lifescience, Inc., for distributionobservable inputs as level 2 and marketingwithout a quoted market price as Level 3.
The warrants associated with the warrant liability are classified as Level 3 derivatives. Consequently, the estimated fair value of the Company’s productwarrant liability is determined using the Black-Scholes pricing model. Until the warrants are exercised, expire, or other facts and circumstances lead the warrant liability to be reclassified to stockholders’ equity, the warrant liability (which relates to warrants to purchase shares of common stock) is marked-to-market each reporting period with the change in Quebecfair value recorded in exchange for minimum feeschange in fair value of $500 per annum for an initial termwarrant liability. Any significant adjustments to the unobservable inputs disclosed in the table below would have a direct impact on the fair value of five years.the warrant liability.
16. Acquisitions
Acquisition of Alef
In October 2018, the Company acquired Alef, a privately held company, which is an existing import and distribution partner. With this acquisition, the Company expanded its reach to the South American markets, and is now Tilray Latin America, a subsidiary of Tilray, Inc. The total consideration paid was $2,893, comprising of $2,855 of Company’s Class 2 common stock, of which $736 is held in escrow and cash consideration of $38.
The transaction was accounted for as an asset acquisition, as it did not constitute a business as defined in ASC 805 Business Combinations. The escrow consideration has not been released as of the issuance date of these financial statements because the 12 months have not elapsed. The Company notes that the cost of a group of assets acquired in an asset acquisition shall be allocated to the individual assets acquired or liabilities assumed based on their relative fair values. Part of the asset acquisition included Alef’s cannabis license, $2,984, which has been recognized as intangible asset.
The consideration includes a contingent component based upon the achievement of certain milestones. The contingent consideration will befrom the acquisitions of SweetWater and Montauk, due in December 2023 and December 2025, respectively and payable in cash, is determined by discounting future expected cash outflows at a discount rate of 5%, and 11.4%, respectively and probability of achievement of 25% and 80%. The unobservable inputs into the future expected cash outflows result in a fair value measurement classified as Level 3.
The balances of assets and liabilities categorized within Level 3 of the fair value hierarchy measured at fair value on a recurring basis are reconciled, as follows:
APHA 24 | ||||||||||||||||||||||||
Convertible | Equity | Warrant | Contingent | Convertible | ||||||||||||||||||||
notes receivable | Investments | Liability | Consideration | Debt | Total | |||||||||||||||||||
Balance, May 31, 2022 | $ 111,200 | $ 5,703 | $ (14,255) | $ (16,007) | $ (216,753) | $ (130,112) | ||||||||||||||||||
Additions / (repayments) | 167,752 | — | — | (10,245) | 122,500 | 280,007 | ||||||||||||||||||
Unrealized gain (loss) on fair value | 70,779 | (52) | 12,438 | (855) | (26,315) | 55,995 | ||||||||||||||||||
Impairments | (246,330) | — | — | — | — | (246,330) | ||||||||||||||||||
Balance, May 31, 2023 | $ 103,401 | $ 5,651 | $ (1,817) | $ (27,107) | $ (120,568) | $ (40,440) | ||||||||||||||||||
The unrealized gain (loss) on fair value for the Convertible Debenture, warrant liability, contingent consideration and convertible notes payable are recognized in non-operating income (loss) and other comprehensive income for the convertible notes receivable using the following inputs:
Significant | ||||||||
Valuation | unobservable | |||||||
Financial asset / financial liability | technique | input | Inputs | |||||
APHA Convertible debentures | Black-Scholes | Volatility, | 50% | |||||
expected life (in years) | 1.0 | |||||||
Warrant liability | Black-Scholes | Volatility, | 50% | |||||
expected life (in years) | 1.8 | |||||||
Contingent consideration | Discounted cash flows | Discount rate, | 5% | - | 11% | |||
achievement | 25% | - | 80% | |||||
Convertible notes receivable | Black-Scholes | Effective interest rate, | 17% | - | 22% | |||
forfeiture rate, | 35% | - | 75% | |||||
conversion | 0% | - | 60% | |||||
Items measured at fair value on a non-recurring basis
The Company's prepayments and other current assets, long lived assets, including property and equipment, goodwill and intangible assets are measured at fair value when there is an indicator of impairment and are recorded at fair value only when an impairment charge is recognized.
Financial risk management
The Company has exposure to the milestones will be reached.following risks from its use of financial instruments: credit; liquidity; currency rate; interest rate price; equity price risk; and capital management risk.
17. Financial Instruments
(a) | Credit risk |
Credit risk is the risk of financial loss to the Company if a customer or counterparty to a financial instrument fails to meet its contractual obligations, and arises principally fromobligations. The maximum credit exposure at May 31, 2023, is the Company’scarrying amount of cash and cash equivalents, accounts receivable, prepaids and short-term investments.
The Company’sother current assets and convertible notes receivable. All cash and cash equivalents are deposited inplaced with major financial institutions in Canada, Australia, Portugal, Germany, NetherlandsColombia, Argentina and the United States.To date, the Company has not experienced any losses on its cash deposits. Accounts receivable are unsecured, and the Company does not require collateral from its customers.
The Company is also exposed to credit risk from the potential default by any of its counterparties on its financial assets.
The Company evaluates the collectability of its accounts receivable and providesmaintains an allowance for potential credit losses at an amount sufficient to absorb losses inherent in the existing accounts receivable portfolio as necessary. of the reporting dates based on the estimate of expected net credit losses.
Trade receivables included an allowance for doubtful accounts and credit loss provision of $6,641 at May 31, 2023 (2022-$5,404) are broken out below as follows:
Balance at the beginning of period | Movement during the year(1) | Balance at end of period | ||||||||||
Fiscal year ended May 31, 2023 | ||||||||||||
Allowance for doubtful accounts and credit loss provision | $ | 5,404 | $ | 1,237 | $ | 6,641 | ||||||
Fiscal year ended May 31, 2022 | ||||||||||||
Allowance for doubtful accounts and credit loss provision | 4,571 | 833 | 5,404 | |||||||||
Fiscal year ended May 31, 2021 | ||||||||||||
Allowance for doubtful accounts and credit loss provision | 2,313 | 2,258 | 4,571 | |||||||||
(1) | Included in movements for the period is the total movements for foreign exchange, additions to the provisions and utilization of the credit loss provision and allowance for doubtful accounts. |
(b) | Liquidity risk |
As at DecemberMay 31, 20182023, the Company’s financial liabilities consist of bank indebtedness and Decemberaccounts payable and accrued liabilities, which have contractual maturity dates within one-year, long-term debt, and convertible debentures which have contractual maturities over the next five years.
The Company maintains a minimum deposit on certain Canadian cash operating accounts tied to loans secured by its Aphria One and SweetWater facilities. The Company maintains debt service charge and leverage covenants on certain loans secured by its Aphria Diamond facilities and 420 that are measured quarterly. The Company believes that it has sufficient operating room with respect to its financial covenants for the next fiscal year and does not anticipate being in breach of any of its financial covenants.
The Company manages its liquidity risk by reviewing its capital requirements on an ongoing basis. Based on the Company’s working capital position at May 31, 2017, the Company is not exposed2023, management regards liquidity risk to any significant credit risk related to counterparty performance of outstanding accounts receivable.be low.
Foreign currency
(c) | Currency rate risk |
As the Company conducts its business in many areas of the world involving transactions denominated inat May 31, 2023, a variety of currencies, the Company is exposed to foreign currency risk. A significant portion of the Company’s financial assets revenue, and expenses are denominatedliabilities held in the Canadian dollar. A 10% change in the exchange rates for the Canadian dollar would affect the carrying value of net assets by approximately $2,817 as of December 31, 2018, with a corresponding impact to accumulated other comprehensive income. As at December 31, 2018 the Company had foreign currency loss (gain), net of $7,234. This amount was primarily related to the translationdollars and Euros consist of cash and cash equivalents, convertible notes receivable, and short-term investments onlong-term investments. The Company’s objective in managing its foreign currency risk is to minimize its net exposure to foreign currency cash flows by transacting, to the Consolidated Balance Sheets.greatest extent possible, with third parties in the functional currency. The Company is exposed to currency rate risk in other comprehensive income, relating to foreign subsidiaries which operate in a foreign currency. The Company does not currently use foreign exchange contracts to hedge its exposure of its foreign currency cash flows as management has determined that this risk is not significant at this point in time.
Liquidity
(d) | Interest rate price risk |
The Company’s objective isexposure to have sufficient liquiditychanges in interest rates relates primarily to the Company’s outstanding debt. The Company manages interest rate risk by restricting the type of investments and varying the terms of maturity and issuers of marketable securities. Varying the terms to maturity reduces the sensitivity of the portfolio to the impact of interest rate fluctuations.
(e) | Capital management |
The Company’s objectives when managing its capital are to safeguard its ability to continue as a going concern, to meet its liabilities when due. The Company monitors its cash balances and cash flows generated from operations to meet its requirements. As at December 31, 2018 and December 31, 2017, the most significant financial liabilities are acconts payable and debt facilities due to Privateer Holdings, Convertible Senior Notes Due 2023, current portion of long-term debt and accounts payable and accrued liabilities.
18. Related-Party Transaction
In the normal course of business, the Company enters into related party transactions with Privateer Holdings and its subsidiaries, including certain debt facilities and charge for services provided by executives and employees of Privateer Holdings.
The various components of the Privateer Holdings debt facilities which represents the related-party balances outstanding are as follows:
|
| As of December 31, |
| |||||
| 2018 |
|
| 2017 |
| |||
Privateer Holdings credit facility |
| $ | — |
|
| $ | 24,700 |
|
Privateer Holdings construction facility |
|
| — |
|
|
| 6,395 |
|
Privateer Holdings start-up loans |
|
| — |
|
|
| 1,731 |
|
Total |
| $ | — |
|
| $ | 32,826 |
|
Privateer Holdings credit facility
Effective January 1, 2016, Tilray Canada, Ltd. entered into an agreement with Privateer Holdings for a demand revolving credit facility in an aggregate principal amount not to exceed $25,000. As of December 31, 2017, the facility bore interest at a floating rate of 2.54%, reset annually based on the mid-term applicable federal U.S. rate.
Effective April 1, 2018, Tilray, Inc. entered into an agreement with Privateer Holdings for a demand revolving credit facility in an aggregate principal amount not to exceed $7,000. The facility bears interest at a floating rate of 2.62%. The interest rate resets annually based on the mid-term applicable federal U.S. rate.
For the fiscal year ended December 31, 2018, the Company recognized $567 (2017 – $548 and 2016 – $992) in interest expense related to the Privateer Holdings credit facility.
Privateer Holdings construction facilities:
High Park Farms, Ltd. construction facility
Effective November 1, 2017, High Park Farms, Ltd. entered into an agreement with Privateer Holdings for a demand revolving construction facility in an aggregate principal amount not to exceed $10,000 to be used for the construction of its facility in Enniskillen, Ontario, Canada. Beginning January 1, 2018, the facility bears interest at a floating rate of 2.54%, reset annually based on the mid-term applicable federal U.S. rate.
Tilray Canada, Ltd. construction facility
Effective December 1, 2017, Tilray Canada Ltd. entered into an agreement with Privateer Holdings for a demand construction facility of $1,000. The proceeds of the facility were to be used to fund capital expenditures for Tilray Canada, Ltd.its continued operations, and to maintain a flexible capital structure which optimizes the cost of capital within a framework of acceptable risk. The Company manages its affiliated company, High Park Farms, Ltd. Beginning January 1, 2018,capital structure and adjusts it in light of changes in economic conditions and the facility bears interest at a floating rate of 2.54%, reset annually based on the mid-term applicable federal U.S. rate.
Privateer Holdings start-up loans
As partrisk characteristics of the Company’s strategic initiatives to expand into additional geographic locations, Privateer Holdings providedunderlying assets. To maintain or adjust its capital structure, the Company with initial workingmay issue new shares, issue new debt, or acquire or dispose of assets. The Company is not subject to externally imposed capital funding in the form of non-interest-bearing loans. The advances are repayable upon demand. The outstanding balances under these loans are:requirements.
|
| Year ended December 31, |
| |||||
|
| 2018 |
|
| 2017 |
| ||
Tilray Deutschland GmbH |
| $ | — |
|
| $ | 1,340 |
|
Tilray Portugal Unipessoal, Lda. |
|
| — |
|
|
| 105 |
|
Other |
|
| — |
|
|
| 286 |
|
|
| $ | — |
|
| $ | 1,731 |
|
In July 2018, the Company repaid $36,940 of the outstanding Privateer Holdings debt facility, which included repayment of the Privateer Holdings credit facility, Privateer Holdings construction facility and the Privateer Holdings start-up loans.
Privateer HoldingsManagement reviews its capital management services
Prior to the repayment of the credit facility, accrued management fees charged by Privateer Holdings for services performed, including management services, support services, business development services and research and development services were included in the credit facility and reported within Privateer Holdings debt facility. Following the repayment of the credit facilities, and due to the change in nature of the relationship with Privateer Holdings, management services are reported under accounts payable. Management services owed to Privateer Holdings in accounts payable during the year ended December 31, 2018 was $3,878 (2017 – $3,397) and were included in operating expenses.
Amounts for the provision of management and support services are charged at cost based on the compensation of the respective employees of Privateer Holdings, which is estimated from the time devoted to the Company. Business development and research and development services are charged at cost plus a 9% markup. In February 2018, the Company entered into an agreement with Privateer Holdings, pursuant to which Privateer Holdings provides the Company with certain general administrative and corporate servicesapproach on an as-requested basis. Pursuant toongoing basis and believes that this agreement,approach, given the Company pays Privateer Holdings a monthly services fee that is based on the proportional sharerelative size of the actual costs incurred by Privateer Holdings in performing the requested services. Personnel compensation is charged at cost plus a 3.0% markup and other services provided are charged at cost. The interest on the management services fee accrues at a floating rate of 2.54%, reset annually based on the mid-term applicable federal U.S. rate.
Leafly Holdings, Inc. (“Leafly”) operational expenses
The Company pays on behalf of Leafly, previously a wholly owned subsidiary of Privateer Holdings, certain operational expenses and vice-versa. These payments are then recharged to company that incurred the expense. Such payments made during the year are deemed immaterial.
Docklight LLC (“Docklight”) royalty and management services
The Company pays Docklight, previously a wholly owned subsidiary of Privateer Holdings, a royalty fee for using their branding on company products. The royalty fees paid during the year are deemed immaterial. Additionally, the Company receives management services from Docklight, for which the Company, is charged management fees. The management service fees paid during the year are deemed immaterial.
19. Business Segment Information
Segment reporting is prepared on the same basis thatreasonable. There have been no changes to the Company’s Chief Executive Officer, who iscapital management approach in the Company’syear. The Company considers its cash and cash equivalents and marketable securities as capital.
29. | Segment reporting |
Information reported to the Chief Operating Decision Maker manages(“CODM”) for the business, makes operating decisionspurpose of resource allocation and assesses performance. Management has determined thatassessment of segment performance focuses on the nature of the operations. The Company operates in one segment:four segments. 1) cannabis operations, which encompasses the developmentproduction, distribution, sale, co-manufacturing and advisory services of both medical and adult-use cannabis, 2) beverage alcohol operations, which encompasses the production, marketing and sale of beverage alcohol products, 3) distribution operations, which encompasses the purchase and resale of pharmaceuticals products to customers, and 4) wellness products, which encompasses hemp foods and cannabidiol (“CBD”) products. This structure is in line with how our Chief Operating Decision Maker (“CODM”) assesses our performance and allocates resources.
Operating segments have not been aggregated and no asset information is provided for the segments because the Company’s CODM does not receive asset information by segment on a regular basis.
Segment gross profit from external customers:
For the year ended May 31, | ||||||||||||
Cannabis | 2023 | 2022 | 2021 | |||||||||
Net revenue | $ | 220,430 | $ | 237,522 | $ | 201,392 | ||||||
Cost of goods sold | 162,755 | 194,834 | 130,511 | |||||||||
Gross profit | 57,675 | 42,688 | 70,881 | |||||||||
Distribution | ||||||||||||
Net revenue | $ | 258,770 | $ | 259,747 | $ | 277,300 | ||||||
Cost of goods sold | 231,309 | 243,231 | 242,472 | |||||||||
Gross profit | 27,461 | 16,516 | 34,828 | |||||||||
Beverage alcohol | ||||||||||||
Net revenue | 95,093 | 71,492 | 28,599 | |||||||||
Cost of goods sold | 48,770 | 32,033 | 12,687 | |||||||||
Gross profit | 46,323 | 39,459 | 15,912 | |||||||||
Wellness | ||||||||||||
Net revenue | 52,831 | 59,611 | 5,794 | |||||||||
Cost of goods sold | 37,330 | 41,457 | 4,233 | |||||||||
Gross profit | 15,501 | 18,154 | 1,561 | |||||||||
Channels of cannabis products.
Sources of revenuesrevenue were as follows:
|
| Year Ended December 31, |
| |||||||||
|
| 2018 |
|
| 2017 |
|
| 2016 |
| |||
Dried Cannabis |
| $ | 21,674 |
|
| $ | 16,260 |
|
| $ | 11,324 |
|
Cannabis extracts |
|
| 21,179 |
|
|
| 3,965 |
|
|
| 1,107 |
|
Accessories and other |
|
| 277 |
|
|
| 313 |
|
|
| 213 |
|
Total |
| $ | 43,130 |
|
| $ | 20,538 |
|
| $ | 12,644 |
|
For the year ended May 31, | ||||||||||||
2023 | 2022 | 2021 | ||||||||||
Revenue from Canadian medical cannabis | $ | 25,000 | $ | 30,599 | $ | 25,539 | ||||||
Revenue from Canadian adult-use cannabis | 214,319 | 209,501 | 222,930 | |||||||||
Revenue from wholesale cannabis | 1,436 | 6,904 | 6,615 | |||||||||
Revenue from international cannabis | 43,559 | 53,887 | 9,250 | |||||||||
Less excise taxes | (63,884 | ) | (63,369 | ) | (62,942 | ) | ||||||
Total | $ | 220,430 | $ | 237,522 | $ | 201,392 | ||||||
Revenues attributedOn July 12, 2022, Tilray acquired the HEXO Convertible Note from HTI and also entered into a strategic alliance with HEXO Corp. (“HEXO”) as discussed in Note 11 (Convertible notes receivable) and Note 17 (Convertible debentures payable). In addition, the Company and HEXO entered into various commercial transaction agreements, including (i) an advisory services agreement regarding Tilray’s provision of advisory services to HEXO in exchange for an $18 million annual advisory fee payable to Tilray; (ii) a geographic region based onco-manufacturing agreement providing for third-party manufacturing services between the locationparties and setting forth the terms of Tilray’s international bulk supply to HEXO; and (iii) a procurement and cost savings agreement for shared savings related to specified optimization activities, procurement, and other similar cost savings realized by the parties as a result of the customer wereforegoing commercial arrangements.
Included in revenue from Canadian adult-use cannabis is $40,377 of advisory services, as follows:well as amendment fees related to modifications to the existing advisory services agreement and procurement services revenue for the year ended May 31, 2023 from the aforementioned HEXO commercial transaction agreements.
|
| Year Ended December 31, |
| |||||||||
|
| 2018 |
|
| 2017 |
|
| 2016 |
| |||
Canada |
| $ | 40,209 |
|
| $ | 19,775 |
|
| $ | 12,644 |
|
Other countries |
|
| 2,921 |
|
|
| 763 |
|
|
| — |
|
Total |
| $ | 43,130 |
|
| $ | 20,538 |
|
| $ | 12,644 |
|
Geographic net revenue:
For the year ended May 31, | ||||||||||||
2023 | 2022 | 2021 | ||||||||||
North America | $ | 324,645 | $ | 314,132 | $ | 229,120 | ||||||
EMEA | 284,567 | 296,911 | 279,062 | |||||||||
Rest of World | 17,912 | 17,329 | 4,903 | |||||||||
Total | $ | 627,124 | $ | 628,372 | $ | 513,085 | ||||||
Long-lived assets consisting of property and equipment, net of accumulated depreciation, attributed to geographic regions based on their physical location were as follows:Geographic capital assets:
|
| December 31, |
| |||||
|
| 2018 |
|
| 2017 |
| ||
Canada |
| $ | 64,687 |
|
| $ | 39,086 |
|
Portugal |
|
| 15,455 |
|
|
| — |
|
Other countries |
|
| 72 |
|
|
| 899 |
|
Total |
| $ | 80,214 |
|
| $ | 39,985 |
|
May 31, | May 31, | |||||||
2023 | 2022 | |||||||
North America | $ | 319,173 | $ | 464,370 | ||||
EMEA | 107,131 | 119,409 | ||||||
Rest of World | 3,363 | 3,720 | ||||||
Total | $ | 429,667 | $ | 587,499 | ||||
Major Customers
The company sells products through a limited number of major customers. Major customers are defined as customers that each individually accountedaccount for greater than than 10% of the Company’s annual revenuesrevenues. For the years ended May 31, 2023, 2022 and2021 there were no major customers representing greater than 10% of accounts receivable as noted below.
We had one customer that accounted for 24% of our revenueannual revenues.
30. | Subsequent Events |
On June 9, 2023, the Company issued $22,500 of additional convertible debentures payable under TLRY 27 by way of overallotment.
On June 22, 2023, the Company acquired all shares of HEXO Corp. ("HEXO"), by way of the Arrangement agreement filed on April 10, 2023. As consideration for the HEXO acquisition, the Company issued 39,705,962 of Tilray's common shares and the convertible note receivable due from HEXO was exercised the immediately preceding trading day prior to closing the transaction.
On June 30, 2023, the Company refinanced its term loan of $100,000 through wholly owned subsidiary Four Twenty Corporation (“420”) which amended the interest rates to lower the applicable margins, extended the maturity to June 2028, provided a new repayment schedule and amended the corporate guarantee from Aphria Inc. to Tilray Brands, Inc.
REPORT OF INDEPENDENT REGISTERED PUBLIC ACCOUNTING FIRM
To the Board of Directors and Shareholders of Tilray Brands, Inc.
Opinions on the Financial Statements and Internal Control over Financial Reporting
We have audited the accompanying consolidated statements of financial position of Tilray Brands, Inc. and its subsidiaries (together, the Company) as of May 31, 2023 and 2022, and the related consolidated statements of loss and comprehensive loss, of changes in equity and of cash flows for each of the three years in the period ended May 31, 2023, including the related notes (collectively referred to as the consolidated financial statements). We also have audited the Company's internal control over financial reporting as of May 31, 2023, based on criteria established in Internal Control – Integrated Framework (2013) issued by the Committee of Sponsoring Organizations of the Treadway Commission (COSO).
In our opinion, the consolidated financial statements referred to above present fairly, in all material respects, the financial position of the Company as of May 31, 2023 and 2022, and the results of its operations and its cash flows for each of the three years in the period ended May 31, 2023 in conformity with accounting principles generally accepted in the United States of America. Also in our opinion, the Company maintained, in all material respects, effective internal control over financial reporting as of May 31, 2023, based on criteria established in Internal Control – Integrated Framework (2013) issued by the COSO.
Basis for Opinions
The Company's management is responsible for these consolidated financial statements, for maintaining effective internal control over financial reporting, and for its assessment of the effectiveness of internal control over financial reporting, included in Management's Report on Internal Controls over Financial Reporting. Our responsibility is to express opinions on the Company’s consolidated financial statements and on the Company's internal control over financial reporting appearing under Item 9A. based on our audits. We are a public accounting firm registered with the Public Company Accounting Oversight Board (United States) (PCAOB) and are required to be independent with respect to the Company in accordance with the U.S. federal securities laws and the applicable rules and regulations of the Securities and Exchange Commission and the PCAOB.
We conducted our audits in accordance with the standards of the PCAOB. Those standards require that we plan and perform the audits to obtain reasonable assurance about whether the consolidated financial statements are free of material misstatement, whether due to error or fraud, and whether effective internal control over financial reporting was maintained in all material respects.
Our audits of the consolidated financial statements included performing procedures to assess the risks of material misstatement of the consolidated financial statements, whether due to error or fraud, and performing procedures that respond to those risks. Such procedures included examining, on a test basis, evidence regarding the amounts and disclosures in the consolidated financial statements. Our audits also included evaluating the accounting principles used and significant estimates made by management, as well as evaluating the overall presentation of the consolidated financial statements. Our audit of internal control over financial reporting included obtaining an understanding of internal control over financial reporting, assessing the risk that a material weakness exists, and testing and evaluating the design and operating effectiveness of internal control based on the assessed risk. Our audits also included performing such other procedures as we considered necessary in the circumstances. We believe that our audits provide a reasonable basis for our opinions.
As described in Management's Report on Internal Controls over Financial Reporting, management has excluded Montauk Brewing Company, Inc. from its assessment of internal control over financial reporting as of May 31, 2023 because it was acquired by the Company in a purchase business combination during the year ended May 31, 2023. Montauk Brewing Company, Inc. is a wholly-owned subsidiary whose total assets and total revenues excluded from management’s assessment and our audit of internal control over financial reporting represent 1% and 1%, respectively, of the related consolidated financial statement amounts as of and for the year ended DecemberMay 31, 2018. No one customer accounted for greater than 10%2023.
Definition and Limitations of our revenue in 2017 or 2016, respectively.
We had two customers that accounted for 16% and 30% of our accounts receivable balance as of December 31, 2018. No one customer accounted for greater than 10% of our accounts receivable in 2017.Internal Control over Financial Reporting
20. Quarterly Financial Data (unaudited)A company’s internal control over financial reporting is a process designed to provide reasonable assurance regarding the reliability of financial reporting and the preparation of financial statements for external purposes in accordance with generally accepted accounting principles. A company’s internal control over financial reporting includes those policies and procedures that (i) pertain to the maintenance of records that, in reasonable detail, accurately and fairly reflect the transactions and dispositions of the assets of the company; (ii) provide reasonable assurance that transactions are recorded as necessary to permit preparation of financial statements in accordance with generally accepted accounting principles, and that receipts and expenditures of the company are being made only in accordance with authorizations of management and directors of the company; and (iii) provide reasonable assurance regarding prevention or timely detection of unauthorized acquisition, use, or disposition of the company’s assets that could have a material effect on the financial statements.
Because of its inherent limitations, internal control over financial reporting may not prevent or detect misstatements. Also, projections of any evaluation of effectiveness to future periods are subject to the risk that controls may become inadequate because of changes in conditions, or that the degree of compliance with the policies or procedures may deteriorate.
Critical Audit Matters
The following table contains selected quarterly data for 2018critical audit matter communicated below is a matter arising from the current period audit of the consolidated financial statements that was communicated or required to be communicated to the audit committee and 2017. The information should be read in conjunction withthat (i) relates to accounts or disclosures that are material to the Company’sconsolidated financial statements and related notes included elsewhere(ii) involved our especially challenging, subjective, or complex judgments. The communication of critical audit matters does not alter in this report. The Company believesany way our opinion on the consolidated financial statements, taken as a whole, and we are not, by communicating the critical audit matter below, providing a separate opinion on the critical audit matter or on the accounts or disclosures to which it relates.
Impairment Assessments of Goodwill and Indefinite-lived Intangible Assets
As described in Notes 3, 8 and 10 to the consolidated financial statements, the Company’s consolidated goodwill and indefinite-lived intangible assets balances were $2,008.8 million and $181.1 million respectively at May 31, 2023. Management conducts an impairment assessment annually in the fourth quarter, or more frequently if events or changes in circumstances indicate that the following information reflects all normal recurring adjustments necessary for acarrying value of goodwill or indefinite-lived intangibles may not be recoverable. Any impairment charges are determined by comparing the fair presentationvalue of the informationreporting unit to its carrying value. Fair value amounts are estimated by management using discounted cash flow models. As of February 28, 2023, management concluded that it was more likely than not, that the fair value of the reporting units was less than their carrying amounts. As a result, the Company performed impairment tests which resulted in impairment charges of $603.5 million of cannabis goodwill, $15 million of wellness goodwill and $55 million of cannabis indefinite-lived intangible assets. As at May 31, 2023, management performed the annual impairment tests which resulted in no further impairment to be recorded beyond the charges recorded from the February 28, 2023 assessment. Management's cash flow models included significant judgements and assumptions relating to future cash flows, growth rates and discount rates.
The principal considerations for our determination that performing procedures relating to the periods presented. The operating resultsimpairment assessments of goodwill and indefinite-lived intangible assets is a critical audit matter are (i) the significant judgement required by management when developing the fair values of the assets or reporting units; and (ii) a high degree of auditor judgement, subjectivity and effort in performing procedures to evaluate management’s significant assumptions, including future cash flows, growth rates and discount rates.
Addressing the matter involved performing procedures and evaluating audit evidence, in connection with forming our overall opinion on the consolidated financial statements. These procedures included testing the effectiveness of controls relating to management’s goodwill and indefinite-lived intangible assets impairment assessments, including controls over the determination of the fair values of the assets or reporting units. These procedures also included, among others, (i) testing management’s process for any quarter are not necessarily indicativedeveloping the fair value estimates of results for anythe assets or reporting units; (ii) evaluating the appropriateness of the underlying discounted cash flow models; (iii) testing the completeness and accuracy of underlying data used in the models; and (iv) evaluating the reasonableness of the significant assumptions used by management, including the future period.
Quarterly Financial Data (in thousands, except per share data):cash flows, growth rates and discount rates. Evaluating management’s significant assumptions related to future cash flows, growth rates and the discount rates involved evaluating whether the assumptions used by management were reasonable considering (i) the current and past performance of the assets or reporting units; (ii) the consistency with external market and industry data; and (iii) whether these assumptions were consistent with evidence obtained in other areas of the audit, as applicable.
|
| Three months ended |
| |||||||||||||
|
| March 31, |
|
| June 30, |
|
| September 30, |
|
| December 31, |
| ||||
2018 |
|
|
|
|
|
|
|
|
|
|
|
|
|
|
|
|
Revenue |
| $ | 7,808 |
|
| $ | 9,744 |
|
| $ | 10,047 |
|
| $ | 15,531 |
|
Gross Margin |
|
| 3,896 |
|
|
| 4,177 |
|
|
| 3,068 |
|
|
| 3,134 |
|
Operating Loss |
|
| (3,740 | ) |
|
| (10,990 | ) |
|
| (20,012 | ) |
|
| (22,908 | ) |
Net loss |
|
| (5,181 | ) |
|
| (12,833 | ) |
|
| (18,699 | ) |
|
| (31,010 | ) |
Net loss per share—basic and diluted |
| $ | (0.07 | ) |
| $ | (0.17 | ) |
| $ | (0.21 | ) |
| $ | (0.33 | ) |
2017 |
|
|
|
|
|
|
|
|
|
|
|
|
|
|
|
|
Revenue |
| $ | 5,027 |
|
| $ | 4,992 |
|
| $ | 5,406 |
|
| $ | 5,113 |
|
Gross Margin |
|
| 2,768 |
|
|
| 2,708 |
|
|
| 2,967 |
|
|
| 2,934 |
|
Operating Loss |
|
| (388 | ) |
|
| (2,316 | ) |
|
| (2,182 | ) |
|
| (2,612 | ) |
Net loss |
|
| (679 | ) |
|
| (2,435 | ) |
|
| (1,767 | ) |
|
| (2,928 | ) |
Net loss per share—basic and diluted |
| $ | (0.01 | ) |
| $ | (0.01 | ) |
| $ | (0.02 | ) |
| $ | (0.04 | ) |
21. Subsequent Events/s/PricewaterhouseCoopers LLP
Acquisitions
In February 2019,Chartered Professional Accountants, Licensed Public Accountants
Oakville, Canada
July 26, 2023
We have served as the Company acquired all issued and outstanding shares of FHF Holdings Ltd. (“Manitoba Harvest”), a hemp and natural foods producer based in Winnipeg, Manitoba, for up to $319,000 ($419,000 CAD), subject to certain revenue milestones. Manitoba Harvest distributes its products to over 16,000 retail locations in the U.S. and Canada. The acquisition will expand the Company’s product portfolio into the natural foods category and bring Manitoba Harvest’s expertise in working with cannabinoids, including cannabidiol (CBD), to Tilray. Given the timing of the transaction, the Company is in process of determining our estimate of fair value and purchase price allocation.
In February 2019, the Company acquired all issued and outstanding shares of Natura Naturals Holdings Inc. (“Natura”) for up to $53,400 ($70,000 CAD), subject to certain cultivation miletones. Natura, through a wholly owned subsidiary located in Leamington, Ontario, is a licensed cultivator under the Cannabis Act specializing in the greenhouse cultivation and will increase the Company’s cannabis supply. Given the timing of the transaction, the Company is in process of determining our estimate of fair value and purchase price allocation.Company's auditor since 2017.
Item 9. Changes in and Disagreements With AccountantsAccountants on Accounting and Financial Disclosure.
None.
Item 9A. Controls and Procedures.
(a)
Evaluation of Disclosure Controls and Procedures
We have established disclosure controls and procedures (as defined in Rules 13a-15(e) and 15d-15(e) under the Exchange Act) to ensure that material information relating to us, including our consolidated subsidiaries, is made known to the officers who certify our financial reports and to other members of senior management and the Board.
Our management, with the participation of our principal executive officer and principal financial officer, conducted an evaluation of the effectiveness of our disclosure controls and procedures. Based on this evaluation, as of the end of the period covered by this Annual Report on Form 10-K, our principal executive officer and principal financial officer have concluded that our disclosure controls and procedures are effective to ensure that the information required to be disclosed by us in the reports that we file or submit under the Exchange Act is (1) recorded, processed, summarized, and reported within the time periods specified in the SEC rules and forms, and (2) accumulated and communicated to management, including our principal executive officer and principal financial officer, as appropriate, to allow timely decisions regarding required disclosure.
Management's Report on Internal Control over Financial Reporting
Our management is responsible for establishing and maintaining adequate internal control over financial reporting as defined in Rules 13a-15(f) and 15d-15(f) under the Securities Exchange Act of 1934. The Company's internal control over financial reporting is designed to provide reasonable assurance regarding the reliability of financial reporting and the preparation of financial statements for external purposes in accordance with accounting principles generally accepted in the United States. Internal control over financial reporting includes policies and procedures that:
• | pertain to the maintenance of records that in reasonable detail accurately and fairly reflect the transactions and dispositions of the Company's assets; |
• | provide reasonable assurance that transactions are recorded as necessary to permit preparation of financial statements in accordance with generally accepted accounting principles, and that receipts and expenditures are being made only in accordance with the authorization of management and directors of the Company; and |
• | provide reasonable assurance regarding prevention or timely detection of unauthorized acquisition, use or disposition of the Company's assets that could have a material effect on the financial statements. |
It is important to understand that there are inherent limitations on effectiveness of internal controls as stated within COSO. Internal controls, no matter how well designed and operated, may not prevent or detect misstatements and can only provide reasonable assurance to management and the Board of Directors regarding achievement of an entity’s objectives. Also, projections of any evaluation of effectiveness to future periods are subject to the risk that controls may become inadequate because of changes in conditions, or that the degree of compliance with the policies or procedures may deteriorate. These inherent limitations include the following:
• | Judgments in decision-making can be faulty, and control and process breakdowns can occur because of simple errors or mistakes; |
• | Controls can be circumvented by individuals, acting alone or in collusion with each other, or by management override; |
• | The design of any system of controls is based in part on certain assumptions about the likelihood of future events, and there can be no assurance that any design will succeed in achieving its stated goals under all potential future conditions; and |
• | Over time, controls may become inadequate because of changes in conditions or deterioration in the degree of compliance with policies or procedures. |
Under the supervision and with the participation of our management, including our principal executive officer and principal financial officer, we conducted an evaluation of the effectiveness of our internal control over financial reporting as of May 31, 2023, based on the criteria set forth by the Committee of Sponsoring Organizations of the Treadway Commission (COSO) in Internal Control - Integrated Framework (2013) issued. Based on this evaluation, our management concluded that our internal control over financial reporting was effective as of May 31, 2023.
The effectiveness of the Company’s internal control over financial reporting as of May 31, 2023 has been audited by PricewaterhouseCoopers LLP, an independent registered public accounting firm, as stated in their report which accompanies the consolidated financial statements.
In the second quarter of our fiscal year ended May 31, 2023, we completed the acquisition of Montauk. As a result of the acquisition, Montauk became a wholly-owned subsidiary of Tilray Brands, Inc. In accordance with guidance issued by the SEC, companies are permitted to exclude acquisitions from their final assessment of internal control over financial reporting for the first fiscal year in which the acquisition occurred. Our management, with the participation of our Chief Executive Officer and Chief Financial Officer, (our principal executive officer and principal financial officer, respectively), evaluated the effectiveness of our disclosure controls and procedures as of December 31, 2018. The term “disclosure controls and procedures,” as defined in Rules 13a-15(e) and 15d-15(e) under the Exchange Act, or DCPs, means controls and other procedures of a company that are designed to ensure that information required to be disclosed by a company in the reports that it files or submits under the Exchange Act is recorded, processed, summarized and reported, within the time periods specified in the SEC’s rules and forms. DCPs include, without limitation, controls and procedures designed to ensure that information required to be disclosed by a company in the reports that it files or submits under the Exchange Act is accumulated and communicated to the company’s management, including its principal executive and principal financial officers, as appropriate to allow timely decisions regarding required disclosure. Management recognizes that any controls and procedures, no matter how well designed and operated, can provide only reasonable assurance of achieving their objectives and management necessarily applies its judgment in evaluating the cost-benefit relationship of possible controls and procedures.
Based onhas limited the evaluation of internal controls over our DCPs as of December 31, 2018, our Chief Executive Officerfinancial reporting to exclude controls, policies and Chief Financial Officer concluded that, as a resultprocedures and internal controls over financial reporting of the material weakness inrecently acquired Montauk. The operations of Montauk represent approximately 1% of our internal control described below, astotal assets and 1% of such date, our DCPs were not effective.net revenue for the year ended May 31, 2023.
(b)
Changes in internal control over financial reporting. No changeInternal Control Over Financial Reporting
There were no changes in our internal control over financial reporting (as such term is defined in Rules 13a-15(f) and 15d-15(f) under the Exchange Act), or ICFR, that occurred during the three months ended December 31, 2018our most recent quarter, that has materially affected, or is reasonably likely to materially affect, our internal control over financial reporting.
As of December 31, 2018, we have a material weakness in our ICFR relating to inventory costing and the financial close process. Specifically, our processes are manual in nature such that a timely, sufficiently precise and detailed review to mitigate the risk of material misstatement is not currently feasible due to the complexity of the spreadsheet-based models used in inventory cost calculations and the financial close process.
A material weakness is a deficiency, or combination of control deficiencies, in ICFR, such that there is a reasonable possibility that a material misstatement of the annual or interim consolidated financial statements will not be prevented or detected on a timely basis.
We have developed a plan to remediate the material weakness, including increasing the depth and experience within our accounting and finance organization, as well as designing and implementing improved processes and internal controls with the intent of increasing the use of system-based processes to limit manual calculations and adjustments in the costing and financial closing processes.
If we fail to fully remediate the material weakness or fail to maintain effective ICFR in the future, it could result in a material misstatement of our financial statements that would not be prevented or detected on a timely basis, which could cause investors to lose confidence in our financial information or cause our stock price to decline.
(c) Management’s Report on Internal Control Over Financial Reporting. This Annual Report does not include a report of management’s assessment regarding internal control over financial reporting or an attestation report of our independent registered public accounting firm due to a transition period established by the rules of the SEC for newly public companies.
Our DCPs and ICFR are designed to provide reasonable assurance of achieving their objectives as specified above. Management does not expect, however, that our DCPs or our ICFR will prevent or detect all error and fraud. Any control system, no matter how well designed and operated, is based upon certain assumptions and can provide
only reasonable, not absolute, assurance that its objectives will be met. Further, no evaluation of controls can provide absolute assurance that misstatements due to error or fraud will not occur or that all control issues and instances of fraud, if any, within the Company have been detected.
On July 26, 2023, the Company’s Compensation Committee (the “Committee”) approved performance-based grants, allocated as 50% performance stock units (“PSUs”) and 50% performance cash awards (“PCAs,” and collectively with the PSUs, the “Performance Awards”) to certain of the Company’s named executive officers and other key employees under the Tilray, Inc. Amended and Restated 2018 Equity Incentive Plan (the “2018 Plan”). The percentage of the Performance Awards earned will be based on the Company’s financial performance as measured against target goals for annual and cumulative Adjusted EBITDA, as defined in the Company’s public filings (the “Performance Goals”) over the period beginning on June 1, 2023 and ending on May 31, 2026 (the “Performance Period”). The Performance Awards will vest as of the end of the Performance Period (May 31, 2026) subject to the executive officer’s Continuous Service (as defined in the 2018 Plan), but will not settle and payout until the percentage of the Performance Awards earned is determined by the Committee. The executive officer may earn between 0% and 100% of the Target Award Value based on the Company’s achievement of the Performance Goals.
Each PSU represents a contingent right to receive one share of the Company’s common stock. The number of PSUs issued to the Company’s executive officers will be equivalent to 50% of the Target Award Value divided by the Company’s closing common stock price on the grant date for the awards, which is July 26, 2023.
If the executive officer’s Continuous Service terminates for any reason other than: (i) without Cause (as defined in the 2018 Plan) within 3 months of the end of the Performance Period; (ii) death; (iii) Disability (as defined in the 2018 Plan); or (iv) in connection with a Change in Control (as defined in the 2018 Plan), unless the Committee determines otherwise, the Performance Award shall be forfeited and canceled immediately without consideration.
If the executive officer’s Continuous Service terminates without Cause within 3 months before the end of the Performance Period, a pro rata portion of the Performance Awards (calculated based on the days elapsed in a Performance Period prior to the termination of Continuous Service divided by the total days in the Performance Period) shall vest and become payable.
If the executive officer’s Continuous Service terminates due to death or Disability prior to the end of the Performance Period, the Performance Awards will vest at 100% of the Target Award Value. If the executive officer’s Continuous Service is terminated without Cause within following a Change in Control, the Performance Awards will vest at 100% of the Target Award Value.
The foregoing description is only a summary of the terms of the Performance Awards and is qualified in its entirety by reference to the full text of the Performance Awards which will be set forth in separate PSU and PCA notice and award agreements (the “Award Agreements”), forms of which will be filed as exhibits to the Company’s Quarterly Report on Form 10-Q for the quarterly period ending August 31, 2023.
Item 9C. Disclosure Regarding Foreign Jurisdictions that Prevent Inspections.
None.
This Part III incorporates certain information by reference from the definitive proxy statement to be filed in connection with our 2023 Annual Meeting of Stockholders (the “2023 Proxy Statement”). We will file the Proxy Statement with the Securities and Exchange Commission pursuant to Regulation 14A not later than 120 days after the end of the year ended May 31, 2023. If our Proxy Statement is not filed within 120 days of May 31, 2023, the omitted information will be included in an amendment to this Annual Report on Form 10‑K filed not later than the end of such 120-day period.
Item 10. Directors, Executive Officers and Corporate Governance.
(1) | The information required by this Item concerning our executive officers and our directors and nominees for director, including information with respect to our audit committee and audit committee financial expert, may be found under the section entitled “Proposal No. 1 Election of Directors,” “Information Regarding the Board of Directors and Corporate Governance,” and “Executive Officers” appearing in the |
(2) | The information required by this Item concerning our code of ethics may be found under the section entitled “Information Regarding the Board of Directors and Corporate Governance” appearing in the |
(3) | The information required by this Item concerning compliance with Section 16(a) of the Securities Exchange Act of 1934 may be found in the section entitled |
Item 11. Executive Compensation.
The information required by this Item may be found under the sections entitled “Director Compensation,”Compensation”, “Executive Compensation” and “Equity Compensation Plan Information” appearing in the 20192023 Proxy Statement. Such information is incorporated herein by reference.
Item 12. Security Ownership of Certain Beneficial Owners and Management and Related Stockholder Matters.
(1) | The information required by this Item with respect to security ownership of certain beneficial owners and management may be found under the section entitled “Security Ownership of Certain Beneficial Owners and Management” appearing in the |
(2) | The information required by this Item with respect to securities authorized for issuance under our equity compensation plans may be found under the sections entitled “Equity Compensation Plan Information” appearing in the |
Item 13. Certain Relationships and Related Transactions, and Director Independence.
(1) | The information required by this Item concerning related party transactions may be found under the section entitled “Transactions with Related Persons” appearing in the |
(2) | The information required by this Item concerning director independence may be found under the sections entitled “Information Regarding the Board of Directors and Corporate Governance—Independence of the Board of Directors” and “Information Regarding the Board of Directors and Corporate Governance—Information Regarding Committees of the Board of Directors” appearing in the |
Item 14. Principal Accounting Fees and Services.
The information required by this Item may be found under the section entitled “Proposal No. 23 - Ratification of Appointment of Independent Registered Public Accounting Firm” appearing in the 20192023 Proxy Statement. Such information is incorporated herein by reference.
Item 15. Exhibits, Financial Statement Schedules.
(a) | The following documents are filed as part of this report: |
(1) |
|
| Financial |
|
|
Financial Statement Schedules have been omitted because the information required to be set forth therein is not applicable or is shown in the financial statements or notes thereto.
(3) | Exhibits are incorporated herein by reference or are filed with this report as indicated below (numbered in accordance with Item 601 of Regulation S-K). |
| Exhibits |
|
|
The exhibits listed below on the Exhibit Index are filed herewith or are incorporated by reference to exhibits previously filed with the SEC.
Incorporate by Reference | ||||||
Exhibit No. | Description of Document | Schedule Form | File Number | Exhibit | Filing Date | Filed Herewith |
3.1 | Amended and Restated Certificate of Incorporation, as currently in effect | 8-K | 001-38594 | 3.1 | 12/17/2019 | |
3.2 | 8-K | 001-38594 | 3.1 | 9/10/2021 | ||
3.3 | 8-K | 001-38594 | 3.1 | 1/10/2022 | ||
3.4 | 8-A/A | 001-38594 | 3.1 | 10/1/2020 | ||
| 3.5 | Third Amended and Restated Certificate of Incorporation, dated as of March 16, 2023. | 10-Q | 001-38594 | 3.1 | 4/10/2023 | |
| 3.6 | Certificate of Designation of Series A Preferred Stock, dated February 21, 2023. | 8-K | 001-38594 | 3.1 | 2/21/2023 | |
3.7 | Amended and Restated Bylaws, as of January 10, 2022, as currently in effect | 8-K | 001-38594 | 3.2 | 1/10/2022 | |
4.1 | 8-K | 001-38594 | 4.1 | 10/10/2018 | ||
|
|
|
| Incorporate by Reference |
| |||||||
Exhibit No. |
| Description of Document |
| Schedule Form |
| File Number |
| Exhibit |
| Filing Date |
| File Herewith |
2.1 |
|
| 8-K |
| 001-38594 |
| 2.1 |
| 1/25/2019 |
|
| |
|
|
|
|
|
|
|
|
|
|
|
|
|
2.2 |
|
| 8-K |
| 001-38594 |
| 2.2 |
| 2/25/2019 |
|
| |
|
|
|
|
|
|
|
|
|
|
|
|
|
2.3 |
|
| 8-K |
| 001-38594 |
| 2.3 |
| 3/4/2019 |
|
| |
|
|
|
|
|
|
|
|
|
|
|
|
|
3.1 |
|
| 8-K |
| 001-38594 |
| 3.1 |
| 7/24/2018 |
|
| |
|
|
|
|
|
|
|
|
|
|
|
|
|
3.2 |
| Form of Amended and Restated Bylaws to be effective upon the closing of this offering. |
| S-1 |
| 333-225741 |
| 3.4 |
| 7/9/2018 |
|
|
|
|
|
|
|
|
|
|
|
|
|
|
|
4.1 |
| Indenture, dated October 10, 2018, between Tilray, Inc. and GLAS Trust Company LLC. |
| 8-K |
| 001-38594 |
| 4.1 |
| 10/10/2018 |
|
|
|
|
|
|
|
|
|
|
|
|
|
|
|
4.2 |
| Form of 5.00% Convertible Senior Note due 2023 (included in Exhibit 4.1). |
| 8-K |
| 001-38594 |
| 4.2 |
| 10/10/2018 |
|
|
|
|
|
|
|
|
|
|
|
|
|
|
|
10.1 |
|
| S-1 |
| 333-225741 |
| 10.1 |
| 7/9/2018 |
|
| |
|
|
|
|
|
|
|
|
|
|
|
|
|
10.2+ |
|
| S-1 |
| 333-225741 |
| 10.2 |
| 7/9/2018 |
|
| |
|
|
|
|
|
|
|
|
|
|
|
|
|
10.3+ |
|
| S-1 |
| 333-225741 |
| 10.3 |
| 7/9/2018 |
|
| |
|
|
|
|
|
|
|
|
|
|
|
|
|
10.4+ |
|
| S-1 |
| 333-225741 |
| 10.4 |
| 7/9/2018 |
|
| |
|
|
|
|
|
|
|
|
|
|
|
|
|
10.5 |
| Form of Indemnity Agreement by and between the Registrant and its directors and officers. |
| S-1 |
| 333-225741 |
| 10.5 |
| 7/9/2018 |
|
|
|
|
|
|
|
|
|
|
|
|
|
|
|
10.6+ |
| Employment Agreement by and between the Registrant and Brendan Kennedy dated May 30, 2018. |
| S-1 |
| 333-225741 |
| 10.6 |
| 6/20/2018 |
|
|
|
|
|
|
|
|
|
|
|
|
|
|
|
10.7+ |
| Employment Agreement by and between the Registrant and Mark Castaneda dated May 30, 2018. |
| S-1 |
| 333-225741 |
| 10.7 |
| 6/20/2018 |
|
|
|
|
|
|
|
|
|
|
|
|
|
|
|
10.8+ |
|
| S-1 |
| 333-225741 |
| 10.8 |
| 6/20/2018 |
|
| |
|
|
|
|
|
|
|
|
|
|
|
|
|
10.9 |
|
| S-1 |
| 333-225741 |
| 10.9 |
| 6/20/2018 |
|
| |
|
|
|
|
|
|
|
|
|
|
|
|
|
10.10 |
|
| S-1 |
| 333-225741 |
| 10.10 |
| 6/20/2018 |
|
| |
|
|
|
|
|
|
|
|
|
|
|
|
|
10.11 |
|
| S-1 |
| 333-225741 |
| 10.11 |
| 6/20/2018 |
|
| |
|
|
|
|
|
|
|
|
|
|
|
|
|
10.12 |
|
| S-1 |
| 333-225741 |
| 10.12 |
| 6/20/2018 |
|
| |
|
|
|
|
|
|
|
|
|
|
|
|
|
10.13 |
|
| S-1 |
| 333-225741 |
| 10.13 |
| 6/20/2018 |
|
| |
|
|
|
|
|
|
|
|
|
|
|
|
|
10.14 |
| Board Services Agreement by and between the Registrant and Michael Auerbach dated June 1, 2018. |
| S-1 |
| 333-225741 |
| 10.14 |
| 7/9/2018 |
|
|
|
|
|
|
|
|
|
|
|
|
|
|
|
10.15 |
| Board Services Agreement by and between the Registrant and Rebekah Dopp dated June 1, 2018. |
| S-1 |
| 333-225741 |
| 10.15 |
| 7/9/2018 |
|
|
|
|
|
|
|
|
|
|
|
|
|
|
|
10.16 |
| Board Services Agreement by and between the Registrant and Maryscott Greenwood dated May 29, 2018. |
| S-1 |
| 333-225741 |
| 10.16 |
| 7/9/2018 |
|
|
|
|
|
|
|
|
|
|
|
|
|
|
|
10.17 |
| Board Services Agreement by and between the Registrant and Christine St. Clare dated June 1, 2018. |
| S-1 |
| 333-225741 |
| 10.17 |
| 7/9/2018 |
|
|
|
|
|
|
|
|
|
|
|
|
|
|
|
10.18† |
|
|
|
|
|
|
|
|
|
| X | |
|
|
|
|
|
|
|
|
|
|
|
|
|
10.19 |
|
| 8-K |
| 001-38594 |
| 10.19 |
| 1/15/2019 |
|
| |
|
|
|
|
|
|
|
|
|
|
|
|
|
21.1 |
|
|
|
|
|
|
|
|
|
| X | |
|
|
|
|
|
|
|
|
|
|
|
|
|
23.1 |
| Consent of Deloitte LLP, Independent Registered Public Accounting Firm. |
|
|
|
|
|
|
|
|
| X |
|
|
|
|
|
|
|
|
|
|
|
|
|
31.1 |
|
|
|
|
|
|
|
|
|
| X | |
|
|
|
|
|
|
|
|
|
|
|
|
|
31.2 |
|
|
|
|
|
|
|
|
|
| X | |
|
|
|
|
|
|
|
|
|
|
|
|
|
32.1* |
|
|
|
|
|
|
|
|
|
| X |
| Incorporate by Reference | ||||||
Exhibit No. | Description of Document | Schedule Form | File Number | Exhibit | Filing Date | Filed Herewith |
4.2 | 8-K | 001-38594 | 4.1 | 5/4/2021 | ||
4.3 | 8-K | 001-38594 | 4.2 | 5/4/2021 | ||
4.4 | X | |||||
4.5 | 8-K | 001-38594 | 4.1 | 03/17/2020 | ||
4.6 | 8-K | 001-38594 | 4.2 | 03/17/2020 | ||
4.7 | 8-K | 001-38594 | 4.1 | 1/28/2022 | ||
4.8 | 8-K | 001-38594 | 4.2 | 1/28/2022 | ||
4.9 | 8-K | 001-38594 | 4.3 | 1/28/2022 | ||
10.1+ | S-1 | 333-225741 | 10.2 | 7/9/2018 | ||
10.2+ | S-1 | 333-225741 | 10.3 | 7/9/2018 | ||
10.3+ | S-1 | 333-225741 | 10.4 | 7/9/2018 | ||
10.4 | Form of Indemnity Agreement by and between the Registrant and its directors and officers | 8-K | 001-38594 | 10.5 | 8/10/2020 | |
10.5 | 10-K | 001-38594 | 10.11 | 2/19/2021 | ||
10.6 | 10-K | 001-38594 | 10.12 | 2/19/2021 | ||
10.7 | 10-K | 001-38594 | 10.39 | 7/28/2021 | ||
+ Indicates management contract or compensatory plan.
* Document has been furnished, is not deemed filed and is not to be incorporated by reference into any of the Company’s filings under the Securities Act of 1933, as amended, or the Securities Exchange Act of 1934, as amended, irrespective of any general incorporation language contained in any such filing.
| Incorporate by Reference | ||||||
Exhibit No. | Description of Document | Schedule Form | File Number | Exhibit | Filing Date | Filed Herewith |
10.8 | 8-K | 001-38594 | 10.1 | 11/29/2022 | ||
10.9 | 10-K | 001-38594 | 10.41 | 7/28/2021 | ||
| 10.10 | Employment Agreement by and between the Registrant and Irwin Simon, dated August 28, 2021 | 10-Q | 001-38594 | 10.1 | 10/7/2021 |
†
Incorporate by Reference | ||||||
Exhibit No. | Description of Document | Schedule Form | File Number | Exhibit | Filing Date | Filed Herewith |
10.24 | 8-K | 001-38594 | 10.3 | 7/12/2022 | ||
10.25 | 8-K | 001-38594 | 10.1 | 6/14/2022 | ||
10.26 | 8-K | 001-38594 | 10.2 | 6/14/2022 | ||
10.27 | 8-K | 001-38594 | 10.4 | 7/12/2022 | ||
10.28 | Form of Convertible Note due September 1, 2023, issued and owing by the Company to HTI | 8-K | 001-38594 | 10.5 | 7/12/2022 | |
10.29 | 8-K | 001-38594 | 10.6 | 7/12/2022 | ||
10.30 | 8-K | 001-38594 | 10.7 | 7/12/2022 | ||
| 10.31 | Voting Agreement, dated as of February 21, 2023, by and between the Company and Double Diamond Holdings Ltd. | 8-K | 001-38594 | 10.1 | 2/21/2023 | |
| 10.32 | Arrangement Agreement, dated as of April 10, 2023, by and between Tilray and HEXO. | 8-K | 001-38594 | 10.1 | 4/10/2023 | |
| 10.33 | Letter Agreement, dated as of April 10, 2023, by and between Tilray and HEXO | 8-K | 001-38594 | 10.2 | 4/10/2023 | |
21.1 | X | |||||
23.1 | Consent of PricewaterhouseCoopers LLP, Independent Registered Public Accounting Firm | X | ||||
31.1 | X | |||||
31.2 | X | |||||
32.1 | X | |||||
Incorporate by Reference | ||||||
Exhibit No. | Description of Document | Schedule Form | File Number | Exhibit | Filing Date | Filed Herewith |
101 | The following financial statements from the Company's Annual Report on Form 10-K for the year ended May 31, 2023, formatted in Inline XBRL: (i) Consolidated Statements of Financial Position, (ii) Consolidated Statements of Loss and Comprehensive Loss, (iii) Consolidated Statements of Changes in Equity, (iv) Consolidated Statements of Cash Flows, and (v) Notes to Consolidated Financial Statements, tagged as blocks of text and including detailed tags. | |||||
104 | Cover Page Interactive Data File (embedded within the Inline XBRL document) | |||||
+ | Indicates management contract or compensatory plan. |
* | Schedules and certain other information have been omitted pursuant to Item 601(b)(2) of Regulations S-K. The registrant will furnish copies of any such schedules to the Securities and Exchange Commission upon request. |
† | Registrant has omitted portions of the referenced exhibit pursuant to a request for confidential treatment under Rule 406 promulgated under the Securities Act. |
Item 16. Form 10-K SummarySummary.
None.
Pursuant to the requirements of Section 13 or 15(d) of the Securities Exchange Act of 1934, as amended, the Registrant has duly caused this Report to be signed on its behalf by the undersigned, thereunto duly authorized.
Tilray Brands, Inc. | |||||
Date: | By: | /s/ | |||
| |||||
| |||||
Pursuant to the requirements of the Securities Exchange Act of 1934, as amended, this Report has been signed below by the following persons on behalf of the Registrant in the capacities and on the dates indicated.
Name | Title | Date | ||
/s/ |
(Principal Executive Officer) |
| ||
| ||||
| Chief Financial Officer (Principal Financial and Accounting Officer) |
| ||
| ||||
/s/ |
|
| ||
| ||||
/s/ | Director |
| ||
| ||||
/s/ | Director |
| ||
| ||||
/s/ | Director |
| ||
| ||||
/s/ John M. Herhalt | Director | July 26, 2023 | ||
John M. Herhalt | ||||
/s/ David Hopkinson | Director | July 26, 2023 | ||
David Hopkinson | ||||
/s/ Tom Looney | Director | July 26, 2023 | ||
Tom Looney | ||||
64