December 31, 2023, our total commercial SBA portfolio, excluding PPP loans, was $2.7 million, net of $3.5 million in loans sold, with $1.3 million guaranteed by the SBA. We participate in the SBA 7(a) program in order to meet the needs of our small business community. As an approved participant in the SBA Preferred Lender’s Program, we enable our clients to obtain SBA loans without being subject to the potentially lengthy SBA approval process necessary for lenders that are not SBA Preferred Lenders. The SBA’s 7(a) program provides up to a 75% guaranty for loans greater than $150,000.
Commercialcommercial and industrial loans included $3.0 million in PPP loans. These are often larger and involve greater risks than other types of lending. Because payments on commercialSBA loans are often dependent onthat allowed small business owners to apply for financial assistance via the operating cash flows of the borrower’s business, repayment of these loans is often more sensitive to adverse conditionsPPP as prescribed in the general economy, which in turn increases repayment risk. We also faceCARES Act. These loans have a contractual rate of 1.0%, with maturity terms of two to five years, are unsecured, 100% guaranteed and loan proceeds may be forgiven by the risk that losses incurred on a small numberSBA if used for certain purposes.
Commercial Real Estate.loans, representing 43.0% of total loans. We make commercial mortgage loans collateralized by owner-occupiedowner- and non-owner-occupied real estate, as well as multi-family residential loans. Loans secured by owner-occupied real estate totaled $391.4 million and comprised 38.4%30.0% of our commercial real estate portfolio at December 31, 2018.2023. The real estate securing our existing commercial real estate loans includes a wide variety of property types, such as manufacturing and processing facilities, business parks, warehouses, retail centers, convenience stores, and gas stations, hotels and motels, office buildings, mixed-use residential and commercial, and other properties. We originate both fixed- and adjustable-rate loans with terms up to 20 years. Fixed-rate loans typically amortize over a 10-to-25 year period with a final maturity and balloon paymentspayment at the end of five to ten years. Adjustable-rate loans are generally based on the prime rate and adjust with the prime rate or are based on term equivalent Federal Home Loan Bank rates. At December 31, 2018,2023, approximately 40.8%33.6% of the commercial real estate loan portfolio consisted of fixed rate loans. Loan amounts generally do not exceed 75% of the lesser of the appraised value or the purchase price.
We make
Commercial real estate lending with respect to non-owner occupied properties typically involves higher loan principal amounts and the repayment is dependent, in large part, on sufficient income from the properties securing the loans to cover operating expenses and debt service. We require that our commercial real estate loans to investors to be secured by well-managed properties with adequate margins and generally obtain a guaranty from responsible parties.
As of December 31, 2023, we held $542.6 million in other non-owner occupied loans, excluding multifamily loans, representing 41.6% of our commercial real estate loans and 17.9% of total loans.
until the foreclosed property is sold.
primarily originated through our CCBX partners. Consumer loans typically have shorter terms, lower balances, higher yields and higher risks of default than residential real estate mortgage loans. Consumer loan collections are dependent on the borrower’s continuing financial stability and are therefore more likely to be affected by adverse personal circumstances, such as a loss of employment, divorce, or unexpected medical costs.
The community bank segment has $1.6 million in consumer loans as of December 31, 2023. We make a variety of consumer loans to individuals, mainly business owners and family of business owners, for personal and household purposes, including automobile, boat and recreational vehicle loans and secured term loans. We also offer personal lines of credit including overdraft protection. Consumer loans are underwritten based on the individual borrower’s income, current debt level, past credit history and the value of any available collateral. The terms of consumer loans vary considerably based upon the loan type, nature of collateral and size of the loan.
•understanding the customer’s financial condition and ability to repay the loan;
•verifying that the primary and secondary sources of repayment are adequate in relation to the amount and structure of the loan;
•observing appropriate loan-to-value guidelines for collateral secured loans;
•maintaining our targeted levels of diversification for the loan portfolio, both as to type of borrower and type of collateral; and
•ensuring that each loan is properly documented with perfected liens on collateral.
surplus.
2023.
We are primarily holding the majority of our on-balance sheet liquidity in interest bearing bank deposits to limit our exposure to interest rate and price risk and to provide readily available funds for loan growth.
Information Technology Systems
Emerging Growth
enters and expands its presence in more complex arenas including BaaS, we seek out diverse and qualified director candidates who bring a background and expertise in the fintech and digital banking sectors regardless of their gender, race, or other personal characteristics. Additionally, we strive for the Company's board of directors to be as diverse as the fintechs themselves. Since beginning this effort the board of directors has added three women and two directors from minoritized backgrounds. We strive to maintain a diverse and inclusive work culture in which individual differences and experiences are valued and all employees have the opportunity to contribute and thrive. We believe that leveraging our employees’ diverse perspectives and capabilities will enhance innovation, foster a collaborative work culture and enable us to better serve our customers and communities.
we may present as few as two years of audited financial statements and as few as two years of related management’s discussion and analysis of financial condition and results of operations;
we are exempt from the requirement to obtain an attestation report from our auditors on management’s assessment of the effectiveness of our internal control over financial reporting under the Sarbanes-Oxley Act of 2002, or the Sarbanes-Oxley Act;
we may choose not to comply with any new requirements adopted by the Public Company Accounting Oversight Board requiring mandatory audit firm rotation or a supplement to the auditor’s report providing additional information about the audit and our financial statements;
we are permitted to provide reduced disclosure regarding our executive compensation arrangements pursuant to the rules applicable to smaller reporting companies, which means we do not have to include a compensation discussion and analysis and certain other disclosures regarding our executive compensation; and
we are not required to give our shareholders non-binding advisory votes on executive compensation or golden parachute arrangements.
We will cease to be an “emerging growth company” upon the earliest of:
the last day of the fiscal year in which we have total annual gross revenues of $1.07 billion or more;
the date on which we become a “large accelerated filer” (the fiscal year end on which the total market value of our common equity securities held by non-affiliates is $700 million or more as of June 30);
the date on which we have, during the previous three-year period, issued more than $1.0 billion in non-convertible debt; and
the last day of the fiscal year following the fifth anniversary of the completion of our initial public offering.
We have elected to adopt certain of the reduced disclosure requirements above with respect to the periodic reports we will file with the Securities and Exchange Commission, or the SEC, and proxy statements that we use to solicit proxies from our shareholders.
In addition, Section 107 of the JOBS Act permits us to take advantage of an extended transition period for complying with new or revised accounting standards affecting public companies. However, we have irrevocably opted out of the extended transition period and, as a result, we will adopt newtry to conduct business responsibly, with awareness to environmental, social, and human rights issues while also monitoring credit risks. This process involves management and board of director oversight. In general, we evaluate each credit or revised accounting standardstransaction on the relevant dates on which adoption of such standards is required for other public companies.
Our Employees
its individual merits, with larger deals receiving more attention and deeper analysis.
Bank Holding Company Regulation
•acquiring direct or indirect ownership or control of any voting shares of any bank if, after the acquisition, the bank holding company will, directly or indirectly, own or control more than 5% or more of the bank’s voting shares;
•acquiring all or substantially all of the assets of any bank; or
•merging or consolidating with any other bank holding company.
•banking or managing or controlling banks; and
•any activity that the Federal Reserve determines to be so closely related to banking as to be a proper incident to the business of banking.
•factoring accounts receivable;
•making, acquiring, brokering or servicing loans and usual related activities in connection with the foregoing;
•leasing personal or real property under certain conditions;
•operating a non-bank depository institution, such as a savings association;
•engaging in trust company functions in a manner authorized by state law;
•financial and investment advisory activities;
•discount securities brokerage activities;
•underwriting and dealing in government obligations and money market instruments;
•providing specified management consulting and counseling activities;
•performing selected data processing services and support services;
•acting as an agent or broker in selling credit life insurance and other types of insurance in connection with credit transactions; and
•performing selected insurance underwriting activities.
In addition to the permissible bank holding company activities listed above, a bank holding company may qualify and elect to become a financial holding company, thereby permitting the bank holding company to engage in activities that are financial in nature or incidental or complementary to financial activity. The BHC Act expressly lists the followingactivity, which are broader activities as financial in nature:
lending, exchanging, transferring, investing for others, or safeguarding money or securities;
insuring, guaranteeing, or indemnifying against loss or harm, or providing and issuing annuities, and acting as principal, agent, or broker for these purposes, in any state;
providing financial, investment, or economic advisory services;
issuing or selling instruments representing interests in pools of assetsthan are otherwise permissible for a bank to hold directly;
engaging in other activities that the Federal Reserve may determine to be so closely related to banking or managing or controlling banks as to be a proper incident to managing or controlling banks;
engaging in the United States in activities permitted outside of the United States if the Federal Reserve has determined them to be usual in connection with banking or other financial operations abroad;
merchant banking through securities or insurance affiliates; and
insurance company portfolio investments.
For us to qualify to become a financial holding company, we must be well-capitalized and well-managed. In addition, the Bank and any other depository institution subsidiary we control must be well-capitalized and well-managed and must have a CRACommunity and Reinvestment Act (“CRA”) rating of at least “satisfactory.“Satisfactory.” Additionally, we must file an election with the Federal Reserve to become a financial holding company and must provide the Federal Reserve with 30 days written notice prior to engaging in a permitted financial activity. We have not elected to become a financial holding company at this time.
rules and at a time when the bank holding company would not otherwise be inclined to do so.
Additionally, under Federal Reserve guidance, a bank holding company is generally expected to consult with Federal Reserve supervisory staff prior to repurchasing or redeeming stock in a number of circumstances, including when the company is considering expansion.
Branching
branch, and if the bank meets certain supervisory and financial criteria.
In addition to its risk-based insurance assessments, As of September 30, 2023, which is the FDIC also imposes Financing Corporation, or FICO, assessments to help paymost recent information available, the $780 million in annual interest payments on the approximately $8 billion of bonds issued in the late 1980s as part of the government rescue of the savings and loan industry. For the fourth quarter of 2018, the bank’s FICO assessmentDIF reserve ratio was equal to 0.035%, or 0.14% annually, per $100 of assessment base. FICO assessments will continue until all outstanding bonds mature in 2019.
1.13%.
March 7, 2022.
Reserves
•the Federal Truth in Lending Act, governing disclosures of credit terms to consumer borrowers; •the Real Estate Settlement Procedures Act, imposing requirements on the settlement and servicing of residential mortgage loans; •the Home Mortgage Disclosure Act, requiring financial institutions to provide information to enable the public and public officials to determine whether a financial institution is fulfilling its obligation to help meet the housing needs of the communities it serves; •the Equal Credit Opportunity Act, prohibiting discrimination on the basis of race, color, religion, national origin, sex, marital status or certain other prohibited factors in all aspects of credit transactions; •the Fair Credit Reporting Act •the Fair Debt Collection Practices Act, governing the manner in which consumer debts may be collected by debt collectors; •the Service Members Civil Relief Act, governing the repayment terms of, and property rights underlying, secured obligations of persons in military service; •the Gramm-Leach-Bliley Act, governing the disclosure and safeguarding of sensitive non-public personal information of our clients; •the Right to Financial Privacy Act, imposing a duty to maintain confidentiality of consumer financial records and •the Electronic Funds Transfer Act governing automatic deposits to and withdrawals from deposit accounts and clients’ rights and liabilities arising from the use of automated teller machines and other electronic banking services; andor FCRA,(“FCRA”), governing the use and provision of information to credit reporting agencies;prescribesprescribing procedures for complying with administrative subpoenas of financial records;
•the rules and regulations of the CFPB and various federal agencies charged with the responsibility of implementing these federal laws.
In order to avoid limitations on capital distributions, including dividend payments and certain discretionary bonus payments to executive officers, a banking organization must maintain a capital conservation buffer composed of common equity Tier 1 capital above its minimum risk-based capital requirements. The buffer is measured relative to risk-weighted assets. holding company that crosses the $3.0 billion total consolidated assets threshold as of June 30 of a particular year is no longer permitted to file reports as a small holding company beginning the following March. The Company’s total assets were in excess of $3.0 billion as of June 30, 2023, and as a consequence, beginning in March 2024, the Company will no longer prepare and file financial reports with the Federal Reserve as a small bank holding company. not adopted the CBLR. A critically undercapitalized bank, one with a ratio of tangible equity to total assets of 2% or less, is presumptively subject to a supervisory acquisition or the appointment of a conservator or receiver. •a bank’s loans or extensions of credit to affiliates; •a bank’s investment in securities issued by affiliates; •loans or extensions of credit made by a bank to third parties collateralized by the securities or obligations of affiliates; •a bank’s guarantee, acceptance or letter of credit issued on behalf of an affiliate; •a bank’s transactions with an affiliate involving the borrowing or lending of securities to the extent they create credit exposure to the affiliate; and •a bank’s derivative transactions with an affiliate to the extent they create credit exposure to the affiliate. The Bank is also subject to Section 23B of the Federal Reserve Act, which, among other things, prohibits a bank from engaging in the above transactions with affiliates, as well as other types of transactions set forth in Section 23B, unless the transactions are on terms substantially the same, or at least as favorable to the bank, as those prevailing at the time for comparable transactions with nonaffiliated companies. 2023 and 2022, respectively. •requirements for financial institutions to develop policies and procedures to identify potential identity theft and, upon the request of a consumer, to place a fraud alert in the consumer’s credit file stating that the consumer may be the victim of identity theft or other fraud; •requirements for entities that furnish information to consumer reporting agencies to implement procedures and policies regarding the accuracy and integrity of the furnished information and regarding the correction of previously furnished information that is later determined to be inaccurate; •requirements for mortgage lenders to disclose credit scores to consumers in certain circumstances; and •limitations on the ability of a business that receives consumer information from an affiliate to use that information for marketing purposes. •The Dodd-Frank Act imposed •The Dodd-Frank Act addresses many investor protection, corporate governance and executive compensation matters that The CFPB has proposed or issued a number of important rules affecting a wide range of consumer financial products. The changes resulting from the Dodd-Frank Act and CFPB rulemakings and enforcement policies may impact the profitability of our business activities, limit our ability to make, or the desirability of making, certain types of loans, require us to change our business practices, impose upon us more stringent capital, liquidity and leverage ratio requirements or otherwise adversely affect our business or profitability. The changes may also require us to dedicate significant management attention and resources to evaluate and make necessary changes to comply with the new statutory and regulatory requirements. recent past. We are among the exempt institutions. Position Eric M. Sprink Curt T. Queyrouze Chief Financial Officer, Corporate Secretary Chief Chief Credit could adversely affect our business, financial condition, results of operations or cash flows and our access to liquidity. Therefore, the risk factors below should not be considered a complete list of potential risks we may face. interest rate sensitivity profile was liability sensitive as of December 31, 2023, meaning that we estimate our net interest income would increase more from falling interest rates than from rising interest rates. Loans and deposits in our CCBX segment are more sensitive to interest rate changes than our community bank segment. Over time we anticipate that this will increase sensitivity to both increasing and decreasing interest rates. business, financial condition and results of operations. financial condition and results of operations. allowance for credit losses. If current conditions in the housing and real estate markets weaken, we expect we will experience increased delinquencies and credit losses. In addition, results of operations. Economic conditions could condition and results of operations. results of operations. We may need to raise additional capital in the future, and such capital may not be available when needed or at all. raise additional capital. Federal regulatory agencies have the ability to take strong supervisory actions against financial institutions that have experienced increased loan production and losses and other underwriting weaknesses or have compliance weaknesses. These actions include entering into formal or informal written agreements and cease and desist orders that place certain limitations on their operations. If we were to become subject to a regulatory action, such action could negatively impact our ability to execute our business plan, and result in operational restrictions, as well as our ability to grow, pay dividends, repurchase stock or engage in mergers and acquisitions. See “Item In order to comply with regulations, guidelines and examination procedures in this area, we have dedicated significant resources to our anti-money laundering program. If our policies, procedures and systems are deemed deficient, we could be subject to liability, including fines and regulatory actions such as restrictions on our ability to pay dividends and the inability to obtain regulatory approvals to proceed with certain aspects of our business plans, including acquisitions and de novo branching. Our failure to comply with applicable laws and regulations could possibly lead to: civil and criminal liability; loss of licensure; damage to our reputation in the industry; fines and penalties and litigation, including class action lawsuits; and administrative enforcement actions. Any of these outcomes could results of operations. Additionally, we may be adversely affected by the soundness of other financial institutions even when we do not have direct or indirect relationships with those institutions. For example, the failures of Silicon Valley Bank, Signature Bank and First Republic Bank in 2023 resulted in significant disruption in the financial services industry and negative media attention, which has also adversely impacted the volatility and market prices of the securities of financial institutions and resulted in outflows of deposits for many financial institutions. operations. Item 103 of the SEC’s Regulation S-K requires disclosure of certain environmental matters when a governmental authority is a party to the proceedings and the proceedings involve potential monetary sanctions unless we reasonably believe the monetary sanctions will not equal or exceed a threshold which we determine is reasonably designed to result in disclosure of any such proceeding that is material to our business or financial condition. We have determined such disclosure threshold to be $1,000,000. •our historic and projected financial condition, liquidity and results of operations; •our capital levels and needs; •tax considerations; •any acquisitions or potential acquisitions that we may pursue; •statutory and regulatory prohibitions and other limitations; •the terms of any credit agreements or other borrowing arrangements that restrict our ability to pay cash dividends; •general economic conditions; and •other factors that our board of directors may deem relevant. Period Ending Index 07/18/18 07/31/18 08/31/18 09/30/18 10/31/18 11/30/18 12/31/18 Coastal Financial Corporation 100.00 99.02 98.90 103.66 99.57 97.26 92.87 NASDAQ Composite Index 100.00 97.69 103.41 102.68 93.27 93.73 84.92 SNL Bank Index 100.00 100.99 102.19 97.71 92.58 95.13 81.52 Purchases of Equity Securities As of or for the Year Ended December 31, 2018 2017 2016 2015 2014 (Dollars in thousands, except per share data) Statement of Income Data: Total interest income $ 38,743 $ 32,113 $ 28,460 $ 24,829 $ 22,451 Total interest expense 3,926 2,875 2,523 2,501 2,032 Provision for loan losses 1,826 870 1,919 941 1,690 Net interest income after provision for loan losses 32,991 28,368 24,018 21,387 18,729 Total noninterest income 5,467 4,154 4,977 3,506 3,574 Total noninterest expense 26,216 22,433 21,538 20,406 18,829 Provision for income taxes 2,541 4,653 2,454 1,483 1,127 Net income 9,701 5,436 5,003 3,004 2,347 Adjusted net income (1) 9,701 6,731 5,003 3,004 2,347 Balance Sheet Data: Cash and due from banks 125,782 89,751 86,975 84,674 80,167 Investment securities 37,922 38,336 34,994 16,150 13,757 Loans 767,899 656,788 596,128 499,186 431,119 Allowance for loan losses 9,407 8,017 7,544 5,989 5,557 Total assets 952,110 805,753 740,611 622,678 546,475 Interest-bearing deposits 510,089 460,937 424,707 370,028 333,230 Noninterest-bearing deposits 293,525 242,358 223,955 173,554 138,931 Total deposits 803,614 703,295 648,662 543,582 472,161 Total borrowings 33,546 33,529 28,513 20,376 19,374 Total shareholders’ equity 109,156 65,711 59,897 55,753 52,521 Share and Per Share Data: (2) Earnings per share—basic 0.93 0.59 0.54 0.33 0.30 Earnings per share—diluted 0.91 0.59 0.54 0.33 0.30 Adjusted earnings per share—diluted (3) 0.91 0.73 0.54 0.33 0.30 Dividends per share — — — — — Book value per share (4) 9.18 7.11 6.48 6.04 5.70 Tangible book value per share (5) 9.18 7.11 6.48 6.04 5.70 Weighted average common shares outstanding–basic 10,440,740 9,232,398 9,226,204 9,218,418 7,859,830 Weighted average common shares outstanding–diluted 10,608,764 9,237,629 9,227,216 9,220,836 7,859,830 Shares outstanding at end of period 11,893,203 9,248,901 9,238,788 9,232,538 9,213,204 Performance Ratios: Return on average assets 1.14 % 0.73 % 0.76 % 0.52 % 0.49 % Pre-tax, pre-provision ROAA (6) 1.66 % 1.46 % 1.43 % 0.93 % 1.08 % Adjusted return on average assets (7) 1.14 % 0.90 % 0.76 % 0.52 % 0.49 % Return on average shareholders’ equity 11.40 % 8.27 % 8.56 % 5.52 % 5.33 % Adjusted return on average shareholders’ equity (8) 11.40 % 10.24 % 8.56 % 5.52 % 5.33 % Yield on earnings assets 4.72 % 4.48 % 4.53 % 4.51 % 4.93 % Yield on loans 5.18 % 4.98 % 5.16 % 5.34 % 5.60 % Cost of funds 0.52 % 0.42 % 0.42 % 0.48 % 0.47 % Cost of deposits 0.42 % �� 0.32 % 0.36 % 0.46 % 0.44 % Cost of interest bearing deposits 0.66 % 0.50 % 0.55 % 0.67 % 0.63 % Net interest margin 4.24 % 4.08 % 4.13 % 4.06 % 4.49 % Noninterest expense to average assets 3.09 % 3.00 % 3.28 % 3.51 % 3.92 % Efficiency ratio (9) 65.08 % 67.18 % 69.67 % 78.99 % 78.48 % Loans to deposits 95.56 % 93.40 % 91.90 % 91.80 % 91.30 % Credit Quality Ratios: Nonperforming assets to total assets 0.19 % 0.26 % 1.11 % 1.52 % 1.90 % Nonperforming assets to total loans and OREO 0.24 % 0.32 % 1.38 % 1.89 % 2.39 % 0.24 % 0.32 % 0.27 % 0.54 % 0.35 % Allowance for loan losses to nonperforming loans 515.17 % 378.16 % 468.28 % 221.32 % 365.35 % Allowance for loan losses to total loans 1.23 % 1.22 % 1.27 % 1.20 % 1.29 % Net charge-offs to average loans 0.06 % 0.06 % 0.07 % 0.11 % 0.10 % Capital Ratios : Total shareholders’ equity to total assets 11.46 % 8.16 % 8.09 % 8.95 % 9.61 % Tangible equity to tangible assets (10) 11.46 % 8.16 % 8.09 % 8.95 % 9.61 % Common equity tier 1 capital ratio (11) 12.84 % 11.67 % 11.60 % 11.14 % N/A Tier 1 leverage ratio (11) 11.35 % 9.94 % 10.11 % 9.58 % 10.10 % Tier 1 risk-based capital ratio (11) 12.84 % 11.67 % 11.60 % 11.14 % 12.46 % Total risk-based capital ratio (11) 14.05 % 12.90 % 12.85 % 12.31 % 13.71 % (1) Adjusted net income is a non-GAAP financial measure that excludes the impact of the revaluation of our deferred tax assets as a result of the reduction in the corporate income tax rate under the Tax Cuts and Jobs Act in fiscal year 2017. The most directly comparable GAAP measure is net income. See our reconciliation of non-GAAP financial measures to their most directly comparable GAAP financial measures under the caption “GAAP Reconciliation and Management Explanation of Non-GAAP Financial Measures.” (2) Share and per share amounts are based on total common shares outstanding, which includes common stock and nonvoting common stock. There was no nonvoting common stock at December 31, 2018. (3) Adjusted earnings per share is a non-GAAP financial measure that excludes the impact of the revaluation of our deferred tax assets as a result of the reduction in the corporate income tax rate under the Tax Cuts and Jobs Act in fiscal year 2017. The most directly comparable GAAP measure is earnings per share. See our reconciliation of non-GAAP financial measures to their most directly comparable GAAP financial measures under the caption “GAAP Reconciliation and Management Explanation of Non-GAAP Financial Measures.” (4) We calculate book value per share as total shareholders’ equity at the end of the relevant period divided by the outstanding number of our common shares, which includes common stock and any nonvoting common stock, at the end of each period. (5) Tangible book value per share is a non-GAAP financial measure. We calculate tangible book value per share as total shareholders’ equity at the end of the relevant period, less goodwill and other intangible assets, divided by the outstanding number of our common shares, which includes common stock and any nonvoting common stock, at the end of each period. The most directly comparable GAAP financial measure is book value per share. We had no goodwill or other intangible assets as of any of the dates indicated. As a result, tangible book value per share is the same as book value per share as of each of the dates indicated. (6) Pre-tax, pre-provision ROA is a non-GAAP measure defined as net income increased by provision for income tax and provision for loan losses divided by average assets. The most directly comparable GAAP measure is return on average assets. (7) Adjusted return on average assets is a non-GAAP financial measure that excludes the impact of the revaluation of our deferred tax assets as a result of the reduction in the corporate income tax rate under the Tax Cuts and Jobs Act in fiscal year 2017. The most directly comparable GAAP measure is return on average assets. See our reconciliation of non-GAAP financial measures to their most directly comparable GAAP financial measures under the caption “GAAP Reconciliation and Management Explanation of Non-GAAP Financial Measures.” (8) Adjusted return on average shareholder’s equity is a non-GAAP financial measure that excludes the impact of the revaluation of our deferred tax assets as a result of the reduction in the corporate income tax rate under the Tax Cuts and Jobs Act in fiscal year 2017. The most directly comparable GAAP measure is return on average shareholders’ equity. See our reconciliation of non-GAAP financial measures to their most directly comparable GAAP financial measures under the caption “GAAP Reconciliation and Management Explanation of Non-GAAP Financial Measures.” (9) Efficiency ratio represents noninterest expense divided by the sum of net interest income and noninterest income. (10) Tangible equity to tangible assets is a non-GAAP financial measure. We calculate tangible equity to tangible assets as total shareholders’ equity at the end of the relevant period, less goodwill and other intangible assets. The most directly comparable GAAP financial measures is total shareholders’ equity to total assets. We had no goodwill or other intangible assets as of the dates indicated. As a result, tangible equity to tangible assets is the same as total shareholders’ equity to total assets as of each of the dates indicated. (11) Capital ratios are for the Bank. (Dollars in thousands, except share and per share data) As of and for the Year Ended December 31, 2017 Adjusted net income: Net income $ 5,436 Plus: additional income tax expense 1,295 Adjusted net income $ 6,731 Adjusted earnings per share—diluted Net income $ 5,436 Plus: additional income tax expense 1,295 Adjusted net income $ 6,731 Weighted average common shares outstanding—diluted (1) 9,237,629 Adjusted earnings per share—diluted (1) $ 0.73 Adjusted effective tax rate Income before provision for income taxes $ 10,089 Provision for income taxes $ 4,653 Less: additional income tax expense 1,295 Adjusted provision for income taxes $ 3,358 Adjusted effective tax rate 33.3 % Adjusted return on average assets Net income $ 5,436 Plus: additional income tax expense 1,295 Adjusted net income $ 6,731 Average assets $ 748,940 Adjusted return on average assets 0.90 % Adjusted return on average shareholders’ equity Net income $ 5,436 Plus: additional income tax expense 1,295 Adjusted net income $ 6,731 Average shareholders’ equity $ 65,720 Adjusted return on average shareholders’ equity 10.24 % Item 7. Management’s Discussion and Analysis enforcing the rule with respect to American Bankers Association members, which include the Company, pending the U.S. Supreme Court's consideration of the constitutionality of the CFPB's funding structure in a separate case. The court expanded its stay to cover all covered financial institutions in October 2023. Our efficiency ratio has been impacted by the increase in CCBX income and CCBX expense. Our efficiency ratio was 45.92% at December 31, 2023, compared to 56.26% at December 31, 2022. This change is largely due to an increase in net interest income and credit enhancement income for the year ended December 31, 2023 compared to the year ended December 31, 2022. The economic environment is continuously changing, due to GDP, inflation, higher interest rates, unemployment, global unrest, the war in Ukraine, conflicts in the Middle East, the political environment, and trade issues all contribute to economic uncertainty which has caused increased market volatility and may lead to an economic recession and/or a significant decrease in consumer confidence and business generally. The increase in noninterest income, provision expense and noninterest expense are largely related to CCBX loan and deposit growth. The increase in interest expense is related to higher average interest bearing deposits and an increase in cost of deposits as a result of higher interest rates. Average balance sheets For the Year ended December 31, 2018 2017 2016 Average Interest & Yield / Average Interest & Yield / Average Interest & Yield / (Dollars in thousands) Balance Dividends Cost Balance Dividends Cost Balance Dividends Cost Assets Interest earning assets: Interest earning deposits $ 73,330 $ 1,432 1.95 % $ 58,418 $ 666 1.14 % $ 57,810 $ 402 0.70 % Investment securities, available for sale (1) 38,322 586 1.53 35,808 512 1.43 30,908 324 1.05 Investment securities, held to maturity (1) 1,318 32 2.43 1,640 22 1.34 2,023 40 1.98 Other investments 3,022 156 5.16 2,886 138 4.78 2,697 124 4.60 Loans receivable (2) 705,292 36,537 5.18 618,452 30,775 4.98 534,186 27,570 5.16 Total interest earning assets 821,284 38,743 4.72 % 717,204 32,113 4.48 % 627,624 28,460 4.53 % Noninterest earning assets: Allowance for loan losses (8,657 ) (7,849 ) (6,739 ) Other noninterest earning assets 36,631 39,585 36,512 Total assets $ 849,258 $ 748,940 $ 657,397 Liabilities and Shareholders’ Equity Interest bearing liabilities: Interest bearing deposits $ 478,231 $ 3,141 0.66 % $ 431,628 $ 2,139 0.50 % $ 384,566 $ 2,118 0.55 % FHLB advances and other borrowings 2,010 41 2.04 1,911 27 1.41 5,814 51 0.88 Subordinated debt 9,957 587 5.90 9,943 587 5.90 4,244 252 5.94 Junior subordinated debentures 3,580 157 4.39 3,578 122 3.41 3,569 102 2.86 Total interest bearing liabilities 493,778 3,926 0.80 % 447,060 2,875 0.64 % 398,193 2,523 0.63 % Noninterest bearing deposits 267,227 233,054 197,779 Other liabilities 3,154 3,106 2,989 Total shareholders' equity 85,099 65,720 58,436 Total liabilities and shareholders' equity $ 849,258 $ 748,940 $ 657,397 Net interest income $ 34,817 $ 29,238 $ 25,937 Interest rate spread 3.92 % 3.83 % 3.90 % Net interest margin (3) 4.24 % 4.08 % 4.13 % (1) For presentation in this table, average balances and the corresponding average rates for investment securities are based upon historical cost, adjusted for amortization of premiums and accretion of discounts. (2) Includes nonaccrual loans (3) Net interest margin represents net interest income divided by the average total interest earning assets Year Ended December 31, 2018 Compared to Year Ended December 31, 2017 Compared to Year Ended December 31, 2017 Year Ended December 31, 2016 Increase (Decrease) Total Increase (Decrease) Total Due to Increase Due to Increase (Dollars in thousands) Volume Rate (Decrease) Volume Rate (Decrease) Interest income: Interest earning deposits $ 291 $ 475 $ 766 $ 7 $ 257 $ 264 Investment securities, available for sale 38 36 74 58 130 188 Investment securities, held to maturity (8 ) 18 10 (5 ) (13 ) (18 ) Other investments 7 11 18 9 5 14 Loans receivable 4,499 1,263 5,762 4,193 (988 ) 3,205 Total increase in interest income 4,827 1,803 6,630 4,262 (609 ) 3,653 Interest expense: Interest bearing deposits 306 696 1,002 233 (212 ) 21 FHLB advances 2 12 14 (62 ) 38 (24 ) Subordinated debt 1 (1 ) — 336 (1 ) 335 Junior subordinated debentures — 35 35 — 20 20 Total increase in interest expense 309 742 1,051 507 (155 ) 352 Increase in net interest income $ 4,518 $ 1,061 $ 5,579 $ 3,755 $ (454 ) $ 3,301 2022. portfolio. At December 31, 2023, our portion of this portfolio represented $29.1 million in loans. Provision expense on these loans was $5.1 million and $1.4 million for the years ended December 31, 2023 and 2022, respectively, with net charge-offs of $3.6 million in 2023 and $216,000 in 2022. In 2023, $52,000 of net charge-offs were recognized for community bank loans and $144.9 million of net-charge-offs were recognized for CCBX loans. In 2022, $382,000 of net charge-offs were recognized for community bank loans and $33.3 million of charge-offs were recognized for CCBX loans. Although agreements with our CCBX partners provide for credit enhancements that provide protection to the Bank from credit and fraud losses by indemnifying or reimbursing incurred credit and fraud losses, if our partner is unable to fulfill their contracted obligations to replenish their cash reserve account then the Bank would be exposed to additional losses, as a result of this counterparty risk. If a CCBX partner does not replenish their cash reserve account then the Bank can declare the agreement in default, take over servicing and cease paying the partner for servicing the loan and providing credit enhancements. The Bank would write-off any remaining credit enhancement asset from the CCBX partner but would retain the full yield and any fee income on the loan portfolio going forward, and BaaS loan expense would decrease once default occurred and payments to the CCBX partner were stopped. Year Ended Year Ended December 31, Increase Percent December 31, Increase Percent (Dollars in thousands) 2018 2017 (Decrease) Change 2017 2016 (Decrease) Change Deposit service charges and fees $ 3,061 $ 2,617 $ 444 17.0 % $ 2,617 $ 2,123 $ 494 23.3 % Wholesale banking service fees 709 — 709 NA — — — NA Loan referral fees 618 439 179 40.8 439 423 16 3.8 Gain on sale of loans, net 264 102 162 158.8 102 790 (688 ) -87.1 Mortgage broker fees 215 255 (40 ) (15.7 ) 255 346 (91 ) (26.3 ) Sublease and lease income 81 222 (141 ) (63.5 ) 222 234 (12 ) (5.1 ) Gain on sale of securities, net — — — NA — 160 (160 ) (100.0 ) Other 519 519 — (0.0 ) 519 901 (382 ) (42.4 ) Total noninterest income $ 5,467 $ 4,154 $ 1,313 31.6 % $ 4,154 $ 4,977 $ (823 ) -16.5 % indicated: strengthen our portfolio. Gain on financial services space. the future, which reduced BOLI earnings by $212,000. other expenses. 31.9%. Year Ended Year Ended December 31, Increase Percent December 31, Increase Percent (Dollars in thousands) 2018 2017 (Decrease) Change 2017 2016 (Decrease) Change Salaries and employee benefits $ 16,026 $ 13,383 $ 2,643 19.7 % $ 13,383 $ 11,988 $ 1,395 11.6 % Occupancy 3,314 3,037 277 9.1 3,037 2,694 343 12.7 Data processing 1,971 1,777 194 10.9 1,777 1,995 (218 ) -10.9 Director and staff expenses 701 561 140 25.0 561 543 18 3.3 Legal and professional fees 677 355 322 90.7 355 380 (25 ) -6.6 Excise taxes 559 459 100 21.8 459 357 102 28.6 Marketing and promotion 391 455 (64 ) (14.1 ) 455 437 18 -(4.1 ) Business development 326 294 32 10.9 294 294 — 0.0 FDIC assessments 295 331 (36 ) (10.9 ) 331 367 (36 ) (9.8 ) OREO and repossessed assets operations, net (2 ) (23 ) 21 (91.3 ) (23 ) 342 (365 ) (106.7 ) Other 1,958 1,804 154 8.5 1,804 2,141 (337 ) -15.7 Total noninterest expense $ 26,216 $ 22,433 $ 3,783 16.9 % $ 22,433 $ 21,538 $ 895 4.2 % Salaries and Employee Benefits. Salaries and employee benefits are the largest component of noninterest expense excluding BaaS loan expense and include payroll expense, incentive compensation costs, benefit plans, health insurance and payroll taxes. Salaries and employee benefits were marketing plan. The provision for unfunded commitments has increased with the addition of CCBX loan partners. Other noninterest expense increased to fraud expenses: Year Ended December 31, CCBX loans were transferred to loans held for sale, with $599.9 million in loans sold during the year ended December 31, 2023 and zero remaining in loans held for sale as of December 31, 2023. A portion of these loans were sold at par and a portion were sold with a gain on sale of $253,000. or 13.3%. The following table summarizes our loan portfolio by type of loan as of the dates indicated: As of December 31, 2018 As of December 31, 2017 (Dollars in thousands) Amount Percent Amount Percent Commercial and industrial loans $ 90,390 11.8 % $ 88,688 13.5 % Real estate: Construction, land and land development 64,045 8.3 41,641 6.3 Residential real estate 94,745 12.3 87,031 13.3 Commercial real estate 515,959 67.1 437,717 66.6 Consumer and other loans 3,584 0.5 2,058 0.3 Gross loans receivable 768,723 100.0 % 657,135 100.0 % Net deferred origination fees (824 ) (347 ) Loans receivable $ 767,899 $ 656,788 As of December 31, 2016 2015 2014 (Dollars in thousands) Amount Percent Amount Percent Amount Percent Commercial and industrial loans $ 71,397 12.0 % $ 68,347 13.7 % $ 51,088 11.8 % Real estate loans: Construction, land and land development 55,565 9.3 44,522 8.9 37,397 8.7 Residential real estate 77,361 13.0 82,750 16.5 53,925 12.5 Commercial real estate 391,046 65.5 302,747 60.6 286,698 66.4 Consumer and other loans 1,276 0.2 1,229 0.3 2,638 0.6 Gross loans 596,645 100.0 % 499,595 100.0 % 431,746 100.0 % Net deferred origination fees (517 ) — (409 ) — (627 ) — Loans $ 596,128 — $ 499,186 — $ 431,119 — guarantees on these loans. Commercial and industrial loans Contractual Maturity Ranges. The contractual maturity ranges of loans in our loan portfolio and the amount of such loans with fixed and floating interest rates in each maturity range as of date indicated are summarized in the following tables: As of December 31, 2018 Due after One Due in One Year Through Due after Gross (Dollars in thousands) Year or Less Five Years Five Years Loans Commercial and industrial loans $ 27,808 $ 46,716 $ 15,866 $ 90,390 Real estate: Construction, land and land development 35,582 21,471 6,992 64,045 Residential 13,338 22,409 58,998 94,745 Commercial real estate 25,978 188,409 301,572 515,959 Consumer and other 1,672 1,616 296 3,584 Total $ 104,378 $ 280,621 $ 383,724 $ 768,723 Floating or (Dollars in thousands) Fixed Rates Adjustable Rates Total Commercial and industrial loans $ 44,910 $ 17,672 $ 62,582 Real estate: Construction, land and land development 13,244 15,219 28,463 Residential 17,736 63,671 81,407 Commercial real estate 190,577 299,404 489,981 Consumer and other 1,744 168 1,912 Total $ 268,211 $ 396,134 $ 664,345 We define nonperforming loans as loans on nonaccrual status and accruing loans 90 days or more past due. Nonperforming assets also include other real estate owned and repossessed assets. The following table presents information regarding community bank and CCBX nonperforming assets at the dates indicated: As of As of As of As of As of December 31, December 31, December 31, December 31, December 31, (Dollars in thousands) 2018 2017 2016 2015 2014 Nonaccrual loans: Commercial and industrial loans $ 493 $ 372 $ 28 $ 1,297 $ 59 Real estate: Construction, land and land development — — — — — Residential 72 88 98 — — Commercial real estate 1,261 1,660 1,363 1,409 1,462 Consumer and other loans — — — — — Total nonaccrual loans $ 1,826 $ 2,120 $ 1,489 $ 2,706 $ 1,521 Accruing loans past due 90 days or more: Commercial and industrial loans $ — $ — $ — $ — $ — Real estate: Construction, land and land development — — 122 — — Residential — — — — — Commercial real estate — — — — — Consumer and other — — — — — Total accruing loans past due 90 days or more $ — $ — $ 122 $ — $ — Total nonperforming loans $ 1,826 $ 2,120 $ 1,611 $ 2,706 $ 1,521 Real estate owned — — 1,297 1,231 3,059 Repossessed assets — — — 100 350 Troubled debt restructurings, accruing — — 5,326 5,416 5,467 Total nonperforming assets $ 1,826 $ 2,120 $ 8,234 $ 9,453 $ 10,397 Total nonperforming loans to loans receivable 0.24 % 0.32 % 0.27 % 0.54 % 0.35 % Total nonperforming assets to total assets 0.19 % 0.26 % 1.11 % 1.52 % 1.90 % As of December 31, 2018 Pass Other Loans Especially Mentioned Sub- Standard Doubtful Total (dollars in thousands) Commercial and industrial loans $ 84,859 $ 3,908 $ 1,623 $ — $ 90,390 Real estate loans: Construction, land, and land development 55,666 8,379 — — 64,045 Residential real estate 94,548 125 72 — 94,745 Commercial real estate 512,151 2,547 1,261 — 515,959 Consumer and other loans 3,584 — — — 3,584 $ 750,808 $ 14,959 $ 2,956 $ — 768,723 Less net deferred origination fees (824 ) Loans receivable $ 767,899 As of December 31, 2017 Pass Other Loans Especially Mentioned Sub- Standard Doubtful Total (dollars in thousands) Commercial and industrial loans $ 87,247 $ 376 $ 902 $ 163 $ 88,688 Real estate loans: Construction, land, and land development 39,081 2,560 — — 41,641 Residential real estate 86,464 479 88 — 87,031 Commercial real estate 434,421 1,636 1,315 345 437,717 Consumer and other loans 2,058 — — — 2,058 $ 649,271 $ 5,051 $ 2,305 $ 508 657,135 Less net deferred origination fees (347 ) Loans receivable $ 656,788 As of December 31, As of or for the Year Ended December 31, (Dollars in thousands) 2018 2017 2016 2015 2014 Allowance at beginning of period $ 8,017 $ 7,544 $ 5,989 $ 5,557 $ 4,268 Provision for loan losses 1,826 870 1,919 941 1,690 Charge-offs: Commercial and industrial loans 408 81 128 637 — Real estate: Construction, land and land development — — — — 15 Residential — — 79 25 280 Commercial real estate 84 408 150 — 200 Consumer and other 27 11 10 3 3 Total charge-offs $ 519 $ 500 $ 367 $ 665 $ 498 Recoveries: Commercial and industrial loans $ 4 $ 3 $ 2 $ 7 $ — Real estate: Construction, land and land development — 95 — — 15 Residential 65 — — 141 77 Commercial real estate — — — 8 — Consumer and other 14 5 1 — 5 Total recoveries $ 83 $ 103 $ 3 $ 156 $ 97 Net (charge-offs ) recoveries (436 ) (397 ) (364 ) (509 ) (401 ) Allowance at end of period $ 9,407 $ 8,017 $ 7,544 $ 5,989 $ 5,557 Allowance to nonperforming loans 515.17 % 378.16 % 468.28 % 221.32 % 365.35 % Allowance to loans receivable 1.23 % 1.22 % 1.27 % 1.20 % 1.29 % Net charge-offs (recoveries) to average loans 0.06 % 0.06 % 0.07 % 0.11 % 0.10 % The following table shows the allocation of the allowance for At December 31, 2018 2017 2016 2015 2014 (dollars in thousands) Allowance Allocated to Loan Portfolio Loan Category as a % of Total Loans (1) Allowance Allocated to Loan Portfolio Loan Category as a % of Total Loans (1) Allowance Allocated to Loan Portfolio Loan Category as a % of Total Loans (1) Allowance Allocated to Loan Portfolio Loan Category as a % of Total Loans (1) Allowance Allocated to Loan Portfolio Loan Category as a % of Total Loans (1) Commercial and industrial loans $ 2,039 11.8 % $ 1,864 13.5 % $ 1,606 12.0 % $ 1,311 13.7 % $ 1,028 11.8 % Real estate: Construction, land and land development 1,806 8.3 % 1,063 6.3 % 1,398 9.3 % 1,031 8.9 % 1,231 8.7 % Residential 1,647 12.3 % 1,343 13.2 % 1,495 13.0 % 1,744 16.5 % 925 12.5 % Commercial real estate 2,648 67.1 % 2,014 66.6 % 1,474 65.5 % 1,509 60.6 % 2,107 66.4 % Consumer and other 77 0.5 % 43 0.4 % 26 0.2 % 35 0.3 % 39 0.6 % Total allocated 8,217 6,327 5,999 5,630 5,330 Unallocated 1,190 n/a 1,690 n/a 1,545 n/a 359 n/a 227 n/a Total allowance for loan losses $ 9,407 100.0 % $ 8,017 100.0 % $ 7,544 100.0 % $ 5,989 100.0 % $ 5,557 100.0 % placed in our held-to-maturity portfolio and the average yield of these securities is 5.22% for the year ended December 31, 2023. As of December 31, 2023, our available for sale portfolio has an unrealized loss of $537,000, compared to an unrealized loss of $3.0 million as of December 31, 2022. As of December 31, 2018 2017 2016 Amortized Fair Amortized Fair Amortized Fair (Dollars in thousands) Cost Value Cost Value Cost Value Securities available-for-sale: U.S. Treasury securities $ 34,831 $ 33,241 $ 34,794 $ 33,396 $ 29,746 $ 28,248 U.S. Government securities 3,000 2,957 3,000 2,970 4,000 3,961 U.S. Agency collateralized mortgage obligations 172 169 224 221 290 289 U.S. Agency residential mortgage- backed securities 39 38 79 80 119 121 Municipal bonds 259 255 261 260 490 487 Total available-for-sale securities 38,301 36,660 38,358 36,927 34,645 33,106 Securities held-to-maturity: U.S. Agency residential mortgage- backed securities 1,262 1,205 1,409 1,374 1,888 1,816 Total held-to-maturity securities 1,262 1,205 1,409 1,374 1,888 1,816 Total investment securities $ 39,563 $ 37,865 $ 39,767 $ 38,301 $ 36,533 $ 34,922 As of December 31, 2018 One Year or Less More than One Year to Five Years More than Five Years to Ten Years More than Ten Years Total Carrying Weighted Average Carrying Weighted Average Carrying Weighted Average Carrying Weighted Average Carrying Weighted Average (Dollars in thousands) Value Yield Value Yield Value Yield Value Yield Value Yield Securities available-for-sale: U.S. Treasury securities $ — 0.000 % $ 23,765 1.364 % $ 9,476 1.901 % $ — 0.000 % $ 33,241 1.52 % U.S. government securities — 0.000 % 2,957 1.500 % — 0.000 % — 0.000 % 2,957 1.50 % U.S. Agency collateralized mortgage obligations — 0.000 % — 0.000 % — 0.000 % 169 2.024 % 169 2.93 % U.S. Agency residential mortgage-backed securities — 0.000 % 38 3.713 % — 0.000 % — 0.000 % 38 1.72 % Municipals — 0.000 % 255 2.564 % — 0.000 % — 0.000 % 255 2.05 % Total available-for-sale — 0.000 % 27,015 1.394 % 9,476 1.901 % 169 2.024 % 36,660 1.529 % Securities held to maturity: U.S. Agency residential mortgage-backed securities — 0.000 % — 0.000 % — 0.000 % 1,262 2.669 % 1,262 2.67 % Total held to maturity — 0.000 % — 0.000 % — 0.000 % 1,262 2.669 % 1,262 2.67 % Total $ — 0.000 % $ 27,015 1.394 % $ 9,476 1.901 % $ 1,431 2.593 % $ 37,922 1.567 % Additionally, we offer deposit products through our CCBX segment. CCBX deposits are generally classified as interest bearing negotiable order of withdrawal (“NOW”) and money market accounts. CCBX deposit products allow us to offer a broader range of partner specific products, which include products designed to reach specific under-served or under-banked populations served by our CCBX partners. 2022, respectively. with other financial institutions. we focus on growing and retaining less costly core deposits. As of December 31, 2018 2017 2016 Percent of Percent of Percent of (Dollars in thousands) Amount Total Deposits Amount Total Deposits Amount Total Deposits Demand, noninterest bearing $ 293,525 36.5 % $ 242,358 34.5 % $ 223,955 34.5 % NOW and money market 360,473 44.9 326,412 46.4 308,934 47.6 Savings 52,572 6.5 43,876 6.2 38,650 6.0 Time deposits less than $100,000 25,851 3.2 27,059 3.8 28,929 4.5 Time deposits $100,000 and over 71,193 8.9 63,590 9.0 48,194 7.4 Total $ 803,614 100.0 % $ 703,295 100.0 % $ 648,662 100.0 % (Dollars in thousands) As of December 31, 2018 Maturity Period: Three months or less $ 8,228 Over three through six months 13,166 Over six through twelve months 28,196 Over twelve months 21,603 Total $ 71,193 2023. The increase in average rate paid on deposit accounts for the year ended December 31, 2023, is the result of the increased interest rates by the FOMC. Further changes to the Fed funds rate and rate pressure from market competition is expected to continue to impact future cost of deposits and our pricing strategies. For the Year Ended December 31, 2018 2017 (Dollars in thousands) Average Balance Average Rate Average Balance Average Rate Demand, noninterest bearing $ 267,227 0.00 % $ 233,054 0.00 % NOW and money market 335,533 0.53 312,573 0.40 Savings 48,330 0.04 41,844 0.03 Time deposits less than $100,000 26,831 1.15 26,851 0.84 Time deposits $100,000 and over 67,537 1.55 50,360 1.29 Total deposits $ 745,458 0.42 % $ 664,682 0.32 % advance that would have matured in March 2025. We have sufficient liquidity for our current loan demand, and with no prepayment penalty for early repayment, management opted to repay these term advances and save the unnecessary interest expense As of and For the Years Ended December 31, (Dollars in thousands) 2018 2017 Maximum amount outstanding at any month-end during period: FHLB Advances $ 20,000 $ 20,000 Average outstanding balance during period: FHLB Advances $ 1,900 $ 1,752 Weighted average interest rate during period: FHLB Advances 2.07 % 1.34 % Balance outstanding at end of period: FHLB Advances $ 20,000 $ 20,000 Weighted average interest rate at end of period: FHLB Advances 2.63 % 1.63 % We continually monitor our liquidity position to ensure that our assets and liabilities are managed in a manner to meet all reasonably foreseeable short-term, long-term and strategic liquidity demands. Management has established a comprehensive process for identifying, measuring, monitoring and controlling liquidity risk. Because of its critical importance to the viability of the Bank, liquidity risk management is fully integrated into our risk management processes. Critical elements of our liquidity risk management include: effective corporate governance consisting of oversight by the board of directors and active involvement by management; appropriate strategies, policies, procedures, and limits used to manage and mitigate liquidity risk; comprehensive liquidity risk measurement and monitoring systems that are commensurate with the complexity of our business activities; active management of intraday liquidity and collateral; an appropriately diverse mix of existing and potential future funding sources; adequate levels of readily available cash, deposits and highly liquid marketable securities free of legal, regulatory, or operational impediments, that can be used to meet liquidity needs in stressful situations; contingency funding policies and plans that sufficiently address potential adverse liquidity events and emergency cash flow requirements; and internal controls and internal audit processes sufficient to determine the adequacy of the Bank’s liquidity risk management process. necessary and are closely monitoring liquidity in this uncertain economic environment. As In addition, the Company maintains an effective registration statement on Form S-3 with the Securities and Exchange Commission which allows the Company to raise additional capital in an amount up to $115.5 million. The Company raised $34.5 million in December 2021. The Company, through a private placement, raised $25.0 million in subordinated debt in 2021 and repaid $10.0 million of subordinated debt with the proceeds and used the remainder for general corporate purposes. On November 1, 2022 the Actual Minimum Required for Capital Adequacy Purposes Required to be Well Capitalized Under the Prompt Corrective Action Provisions Amount Ratio Amount Ratio Amount Ratio (dollars in thousands) December 31, 2018 Common Equity Tier I risk-based capital ratio (to risk-weighted assets) Company $ 110,307 13.70 % $ 36,238 4.50 % $ 52,343 6.50 % Bank Only 103,597 12.84 % 36,294 4.50 % 52,425 6.50 % Leverage Capital (to average assets) Company 113,807 12.46 % 36,529 4.00 % 45,661 5.00 % Bank Only 103,597 11.35 % 36,524 4.00 % 45,655 5.00 % Tier I Capital (to risk-weighted assets) Company 113,807 14.13 % 48,317 6.00 % 64,423 8.00 % Bank Only 103,597 12.84 % 48,317 6.00 % 64,253 8.00 % Total Capital (to risk-weighted assets) Company 133,518 16.58 % 64,423 8.00 % 80,528 10.00 % Bank Only 113,308 14.05 % 64,523 8.00 % 80,653 10.00 % December 31, 2017 Common Equity Tier I risk-based capital ratio (to risk-weighted assets) Company $ 66,494 9.98 % $ 29,990 4.50 % $ 43,319 6.50 % Bank Only 77,756 11.67 % 29,984 4.50 % 43,311 6.50 % Leverage Capital (to average assets) Company 69,994 8.95 % 31,286 4.00 % 39,107 5.00 % Bank Only 77,756 9.94 % 31,280 4.00 % 39,099 5.00 % Tier I Capital (to risk-weighted assets) Company 69,994 10.50 % 39,987 6.00 % 53,316 8.00 % Bank Only 77,756 11.67 % 39,979 6.00 % 53,306 8.00 % Total Capital (to risk-weighted assets) Company 88,222 13.24 % 53,316 8.00 % 66,645 10.00 % Bank Only 85,983 12.90 % 53,306 8.00 % 66,632 10.00 % Payments Due by Period Less than 1 to 2 2 to 5 More than (Dollars in thousands) Total 1 Year Years Years 5 Years Contractual Cash Obligations Time Deposits $ 97,044 $ 67,588 $ 17,742 $ 11,714 $ — FHLB advances 20,000 20,000 — — — Subordinated note 10,000 — — 4,500 5,500 Junior subordinated debentures 3,609 — — — 3,609 Deferred compensation plans 1,636 175 175 526 760 Operating leases 9,240 1,336 1,342 3,657 2,905 Capital leases 76 70 6 — — non-maturing deposits, including noninterest bearing demand deposits, interest bearing demand deposits, money market accounts, savings accounts and brokered deposits, which can generally be withdrawn on demand. the issuance of debt or equity securities. As of December 31, (Dollars in thousands) 2018 2017 Commitments to extend credit: Commercial and industrial loans $ 47,033 $ 38,958 Construction – commercial real estate 33,128 3,343 Construction – residential real estate 30,269 27,447 Commercial real estate 12,871 4,757 Residential real estate 12,543 12,488 Other 656 846 Total commitments to extend credit $ 136,500 $ 87,839 Standby letters of credit $ 2,331 $ 2,004 Standby and commercial letters of credit are conditional commitments issued by us to guarantee the performance of a customer to a third party. In the event of nonperformance by the customer, we have rights to the underlying collateral, which can include commercial real estate, physical plant and property, inventory, receivables, cash and/or marketable securities. Our credit risk associated with issuing letters of credit is essentially the same as the risk involved in extending loan facilities to our customers. The FOMC raised interest rates 0.25% in mid-March 2022, 1.25% in the second quarter of 2022, 1.50% in the third quarter of 2022, 1.25% in the fourth quarter of 2022, 0.50% in the first quarter 2023, and 0.25% in the second quarter 2023 and 0.25% in the third quarter of 2023 and then pausing at an upper Fed Funds target range of 5.50% through the fourth quarter of 2023. A potential decrease in rates is expected in the future although the timing and magnitude of such decreases is still uncertain. The impact of this and any future changes will impact financial results. To help ensure the accuracy of the model, we perform a quarterly back test against our actual results. curve shifts. Parallel shock scenarios assume instantaneous parallel movements in the yield curve compared to a flat yield curve scenario. Non-parallel simulations are also conducted and involve analysis of net interest income and expense under various changes in the shape of the yield curve including a forward curve, flat curve, steepening curve, and an inverted curve. Our internal policy regarding internal rate risk simulations currently specifies that for instantaneous parallel shifts of the yield curve, estimated net interest income at risk for the subsequent one- and two-year period should not decline by more than 10% for a 100 basis point shift, 15% for a 200 basis point shift, 20% for a 300 basis point shift, and 25% for a 400 basis point shift. Estimated Increase (Decrease) in Net Interest Income Change in Market Interest Rates Twelve Month Projection December 31, 2018 Twelve Month Projection December 31, 2017 Static Balance Sheet and Rate Shifts +400 basis points 15.2 % 13.2 % +300 basis points 11.2 9.7 +200 basis points 7.4 6.4 +100 basis points 3.7 3.2 -100 basis points (1.5 ) (2.8 ) -200 basis points (8.7 ) (8.1 ) -300 basis points (14.0 ) (10.4 ) Dynamic Balance Sheet and Rate Shifts +400 basis points 17.9 16.1 +300 basis points 13.2 11.9 +200 basis points 8.8 7.8 +100 basis points 4.4 3.9 -100 basis points (2.3 ) (3.6 ) -200 basis points (10.1 ) (9.8 ) -300 basis points (16.2 ) (12.5 ) (a) Number of securities to be issued upon exercise of outstanding options (b) Weighted- average exercise price of outstanding options (c) Number of securities remaining available for issuance under equity compensation plans (excluding securities reflected in column (a)) Equity compensation plan approved by stockholders 688,310 $ 6.39 487,000 Equity compensation plan not approved by shareholders — — — Total 688,310 $ 6.39 487,000 To the Shareholders and the Board of Directors of Our audits included performing procedures to assess the risks of material misstatement of the consolidated Washington, 15, 2024 ASSETS ASSETS December 31, December 31, 2018 2017 Cash and due from banks $ 16,315 $ 13,787 Interest earning deposits with other banks (restricted cash of $24,004 and $17,332 at December 31, 2018 and December 31, 2017, respectively) 109,467 75,964 Investment securities, available for sale, at fair value 36,660 36,927 Investment securities, held to maturity, at amortized cost 1,262 1,409 Other investments 3,766 3,680 Loans receivable 767,899 656,788 Allowance for loan losses (9,407 ) (8,017 ) Total loans receivable, net 758,492 648,771 Premises and equipment, net 13,167 13,121 Accrued interest receivable 2,526 2,274 Bank-owned life insurance, net 6,688 6,500 Deferred tax asset, net 2,518 2,092 Other assets 1,249 1,228 Total assets $ 952,110 $ 805,753 LIABILITIES AND SHAREHOLDERS’ EQUITY LIABILITIES AND SHAREHOLDERS’ EQUITY LIABILITIES Deposits $ 803,614 $ 703,295 Federal Home Loan Bank (FHLB) advances 20,000 20,000 Subordinated debt Principal amount $10,000 (less unamortized debt issuance costs of $35 and $50 at December 31, 2018 and December 31, 2017, respectively) 9,965 9,950 Junior subordinated debentures Principal amount $3,609 (less unamortized debt issuance costs of $28 and $30 at December 31, 2018 and December 31, 2017, respectively) 3,581 3,579 Deferred compensation 1,078 1,175 Accrued interest payable 279 228 Other liabilities 4,437 1,815 Total liabilities 842,954 740,042 SHAREHOLDERS’ EQUITY Preferred stock, no par value: Authorized: 25,000,000 shares at December 31, 2018 and December 31, 2017; issued and outstanding: zero shares at December 31, 2018 and December 31, 2017 — — Common stock, no par value: Authorized: 300,000,000 shares at December 31, 2018 and December 31, 2017; 11,893,203 voting shares at December 31, 2018 issued and outstanding and 8,887,457 voting and 361,444 nonvoting shares at December 31, 2017 issued and outstanding 86,431 52,521 Retained earnings 24,021 14,134 Accumulated other comprehensive loss, net of tax (1,296 ) (944 ) Total shareholders’ equity 109,156 65,711 Total liabilities and shareholders’ equity $ 952,110 $ 805,753 Year ended December 31, 2018 2017 INTEREST AND DIVIDEND INCOME Interest and fees on loans $ 36,537 $ 30,775 Interest on investment securities 618 534 Interest on interest earning deposits with other banks 1,432 666 Dividends on other investments 156 138 Total interest income 38,743 32,113 INTEREST EXPENSE Interest on deposits 3,141 2,139 Interest on borrowed funds 785 736 Total interest expense 3,926 2,875 Net interest income 34,817 29,238 PROVISION FOR LOAN LOSSES 1,826 870 Net interest income after provision for loan losses 32,991 28,368 NONINTEREST INCOME Deposit service charges and fees 3,061 2,617 Wholesale banking service fees 709 — Loan referral fees 618 439 Gain on sales of loans, net 264 102 Mortgage broker fees 215 255 Sublease and lease income 81 222 Other income 519 519 Total noninterest income 5,467 4,154 NONINTEREST EXPENSE Salaries and employee benefits 16,026 13,383 Occupancy 3,314 3,037 Data processing 1,971 1,777 Director and staff expenses 701 561 Legal and professional fees 677 355 Excise taxes 559 459 Marketing and promotion 391 455 Business development 326 294 Federal Deposit Insurance Corporation (FDIC) assessments 295 331 Other expense 1,956 1,781 Total noninterest expense 26,216 22,433 Income before provision for income taxes 12,242 10,089 PROVISION FOR INCOME TAXES 2,541 4,653 NET INCOME $ 9,701 $ 5,436 Basic earnings per common share $ 0.93 $ 0.59 Diluted earnings per common share $ 0.91 $ 0.59 Weighted average number of common shares outstanding: Basic 10,440,740 9,234,490 Diluted 10,608,764 9,237,666 Year ended December 31, 2018 2017 NET INCOME $ 9,701 $ 5,436 OTHER COMPREHENSIVE INCOME (LOSS), before tax Securities available-for-sale Unrealized holding gain (loss) gain during the year (210 ) 108 Income tax benefit (provision) related to unrealized holding gain (loss) 44 (36 ) OTHER COMPREHENSIVE (LOSS) INCOME, net of tax (166 ) 72 COMPREHENSIVE INCOME $ 9,535 $ 5,508 Shares of Common Stock Common Stock Retained Earnings Accumulated Other Comprehensive Income (Loss) Total BALANCE, December 31, 2016 9,238,783 $ 52,215 $ 8,698 $ (1,016 ) $ 59,897 Net income — — 5,436 — 5,436 Issuance of vested stock awards 600 — — — — Issuance of restricted stock awards 6,210 — — — — Exercise of stock options 3,680 24 — — 24 Stock repurchase (375 ) (3 ) — — (3 ) Stock-based compensation — 285 — — 285 Other comprehensive income — — — 72 72 BALANCE, December 31, 2017 9,248,898 $ 52,521 $ 14,134 $ (944 ) $ 65,711 Net income — — 9,701 — 9,701 Reclassification of stranded tax effect due to federal tax rate change — — 186 (186 ) — Issuance of restricted stock awards 8,405 — — — — Exercise of stock options 58,400 357 — — 357 Stock-based compensation — 310 — — 310 Stock issuance and net proceeds from initial public offering 2,577,500 33,243 — — 33,243 Other comprehensive loss — — — (166 ) (166 ) BALANCE, December 31, 2018 11,893,203 $ 86,431 $ 24,021 $ (1,296 ) $ 109,156 Year ended December 31, 2018 2017 CASH FLOWS FROM OPERATING ACTIVITIES Net income $ 9,701 $ 5,436 Adjustments to reconcile net income to net cash provided by operating activities Provision for loan losses 1,826 870 Depreciation and amortization 1,071 993 Loss on disposition of fixed assets 32 38 Gain on sales of loans (264 ) (102 ) Gain on sale of other real estate owned — (32 ) Net discount accretion on investment securities (24 ) (2 ) Stock-based compensation 310 285 Bank-owned life insurance earnings (188 ) (185 ) Deferred tax (expense) benefit (382 ) 1,284 Net change in other assets and liabilities 2,320 (968 ) Total adjustments 4,701 2,181 Net cash provided by operating activities 14,402 7,617 CASH FLOWS FROM INVESTING ACTIVITIES Net (increase) decrease in interest earning deposits with other banks (26,831 ) 2,734 Purchase of investment securities available-for-sale — (5,011 ) Purchase of other investments, net (86 ) (581 ) Principal paydowns of investment securities available-for-sale 88 100 Principal paydowns of investment securities held-to-maturity 141 454 Maturities and calls of investment securities available -for-sale — 1,226 Purchase of participation loans (32,653 ) — Proceeds from sale of loans 3,174 1,353 Purchase of loans (14,094 ) (29,688 ) Increase in loans receivable, net (67,711 ) (32,620 ) Proceeds from sale of other real estate owned — 1,329 Purchases of premises and equipment, net (1,149 ) (1,057 ) Net cash used by investing activities (139,121 ) (61,761 ) CASH FLOWS FROM FINANCING ACTIVITIES Net increase in demand deposits, NOW, money market and savings 93,924 41,107 Net increase in time deposits 6,395 13,526 Net proceeds from short-term FHLB borrowings — 5,000 Net proceeds from initial public offering 33,243 — Proceeds from exercise of stock options 357 24 Repurchase of common stock — (3 ) Net cash provided by financing activities 133,919 59,654 NET INCREASE IN CASH, DUE FROM BANKS AND RESTRICTED CASH 9,200 5,510 CASH DUE FROM BANKS AND RESTRICTED CASH, beginning of year 31,119 25,609 CASH, DUE FROM BANKS AND RESTRICTED CASH, end of year $ 40,319 $ 31,119 SUPPLEMENTAL SCHEDULE OF OPERATING AND INVESTING ACTIVITIES Interest paid $ 3,875 $ 2,871 Income taxes paid 2,520 3,820 SUPPLEMENTAL SCHEDULE OF NONCASH TRANSACTIONS Fair value adjustment of securities available-for-sale, gross $ (210 ) $ 108 Arlington Olympic LLC was formed in 2021 and owns the Arlington branch site, which the Bank leases from the LLC. disclosure Investmentsecurities- Debt securitiesthatmanagementhas theabilityand intentto hold to maturityare classifiedas held-to-maturityand carriedatamortizedcost.The amortizationof premiumsand accretionof discountsarerecognizedin interestincomeusingtheinterestmethodor methodsapproximatingtheinterest methodovertheperiodto maturity. Bancshares, as well as investments in bank technology funds. Loansalesrecognition- The Company recognizesa saleon loansifthetransferredportion CCBX loans. Otherrealestate 2022. Business Segments segments, see Note 21. 2022, respectively twelve months ended months ended December 31, 2023. Amortized Cost Gross Unrealized Gains Gross Unrealized Losses Fair Value (dollars in thousands) December 31, 2018 Available-for-sale U.S. Treasury securities $ 34,831 $ — $ (1,590 ) $ 33,241 U.S. Government agencies 3,000 — (43 ) 2,957 U.S. Agency collateralized mortgage obligations 172 — (3 ) 169 U.S. Agency residential mortgage-backed securities 39 — (1 ) 38 Municipals 259 — (4 ) 255 Total available-for-sale securities 38,301 — (1,641 ) 36,660 Held-to-maturity U.S. Agency residential mortgage-backed securities 1,262 — (57 ) 1,205 Total investment securities $ 39,563 $ — $ (1,698 ) $ 37,865 Amortized Cost Gross Unrealized Gains Gross Unrealized Losses Fair Value (dollars in thousands) December 31, 2017 Available-for-sale U.S. Treasury securities $ 34,794 $ — $ (1,398 ) $ 33,396 U.S. Government agencies 3,000 — (30 ) 2,970 U.S. Agency collateralized mortgage obligations 224 — (3 ) 221 U.S. Agency residential mortgage-backed securities 79 1 — 80 Municipals 261 — (1 ) 260 Total available-for-sale securities 38,358 1 (1,432 ) 36,927 Held-to-maturity U.S. Agency residential mortgage-backed securities 1,409 — (35 ) 1,374 Total investment securities $ 39,767 $ 1 $ (1,467 ) $ 38,301 Available-for-Sale Held-to-Maturity Amortized Cost Fair Value Amortized Cost Fair Value (dollars in thousands) Amounts maturing in One year or less $ — $ — $ — $ — After one year through five years 28,107 26,977 — — After five years through ten years 9,983 9,476 — — 38,090 36,453 — — U.S. Agency residential mortgage-backed securities and collateralized mortgage obligations 211 207 1,262 1,205 $ 38,301 $ 36,660 $ 1,262 $ 1,205 law and an additional $25.0 million in securities were pledged for borrowing lines at December 31, 2023, with no securities pledged for borrowing lines at December 31, 2022. During the year ended December 31, 2023, a total of 16 U.S. Agency mortgage backed securities were �� Less Than 12 Months 12 Months or Greater Total Fair Value Gross Unrealized Losses Fair Value Gross Unrealized Losses Fair Value Gross Unrealized Losses (dollars in thousands) December 31, 2018 Available-for-sale U.S. Treasury securities $ — $ — $ 33,241 $ (1,590 ) $ 33,241 $ (1,590 ) U.S. Government agencies — — 2,957 (43 ) 2,957 (43 ) U.S. Agency collateralized mortgage obligations — — 169 (3 ) 169 (3 ) Municipals — — 255 (4 ) 255 (4 ) U.S. Agency residential mortgage-backed securities 38 (1 ) — — 38 (1 ) Total available-for-sale securities 38 (1 ) 36,622 (1,640 ) 36,660 (1,641 ) Held-to-maturity U.S. Agency residential mortgage-backed securities — — 1,205 (57 ) 1,205 (57 ) Total investment securities $ 38 $ (1 ) $ 37,827 $ (1,697 ) $ 37,865 $ (1,698 ) December 31, 2017 Available-for-sale U.S. Treasury securities $ 4,934 $ (77 ) $ 28,463 $ (1,321 ) $ 33,397 $ (1,398 ) U.S. Government agencies — — 2,970 (30 ) 2,970 (30 ) U.S. Agency collateralized mortgage obligations 220 (3 ) — — 220 (3 ) Municipals 260 (1 ) — — 260 (1 ) Total available-for-sale securities 5,414 (81 ) 31,433 (1,351 ) 36,847 (1,432 ) Held-to-maturity U.S. Agency residential mortgage-backed securities — — 1,374 (35 ) 1,374 (35 ) Total investment securities $ 5,414 $ (81 ) $ 32,807 $ (1,386 ) $ 38,221 $ (1,467 ) (“ACL”) December 31, December 31, 2018 2017 (dollars in thousands) Commercial and industrial loans $ 90,390 $ 88,688 Real estate loans: Construction, land, and land development 64,045 41,641 Residential real estate 94,745 87,031 Commercial real estate 515,959 437,717 Consumer and other loans 3,584 2,058 Gross loans receivable 768,723 657,135 Net deferred origination fees and premiums (824 ) (347 ) Loans receivable $ 767,899 $ 656,788 These loans are included in the applicable loan category depending upon the collateral and purpose of the individual loan. 30-89 Days Past Due 90 Days or More Past Due Total Past Due Current Total Loans Recorded Investment 90 Days or More Past Due and Still Accruing (dollars in thousands) December 31, 2018 Commercial and industrial loans $ 171 $ 494 $ 665 $ 89,725 $ 90,390 $ — Real estate loans: Construction, land and land development 823 — 823 63,222 64,045 — Residential real estate — 72 72 94,673 94,745 — Commercial real estate — — — 515,959 515,959 — Consumer and other loans 2 — 2 3,582 3,584 — $ 996 $ 566 $ 1,562 $ 767,161 $ 768,723 $ — Less net deferred origination fees and premiums (824 ) Loans receivable $ 767,899 30-89 Days Past Due 90 Days or More Past Due Total Past Due Current Total Loans Recorded Investment 90 Days or More Past Due and Still Accruing (dollars in thousands) December 31, 2017 Commercial and industrial loans $ 791 $ 372 $ 1,163 $ 87,525 $ 88,688 $ — Real estate loans: Construction, land and land development 218 — 218 41,423 41,641 — Residential real estate 76 — 76 86,955 87,031 — Commercial real estate 333 345 678 437,039 437,717 — Consumer and other loans — — — 2,058 2,058 — $ 1,418 $ 717 $ 2,135 $ 655,000 657,135 $ — Less net deferred origination fees and premiums (347 ) Loans receivable $ 656,788 Unpaid Contractual Principal Balance Recorded Investment With No Allowance Recorded Investment With Allowance Total Recorded Investment Related Allowance (dollars in thousands) December 31, 2018 Commercial and industrial loans $ 766 $ 493 $ — $ 493 $ — Real estate loans: Residential real estate 74 72 — 72 — Commercial real estate 1,491 1,261 — 1,261 — Total $ 2,331 $ 1,826 $ — $ 1,826 $ — December 31, 2017 Commercial and industrial loans $ 1,123 $ 1,065 $ — $ 1,065 $ — Real estate loans: Residential real estate 94 89 — 89 — Commercial real estate 2,249 1,660 — 1,660 — Total $ 3,466 $ 2,814 $ — $ 2,814 $ — December 31, 2018 December 31, 2017 Average Recorded Investment Interest Income Recognized Average Recorded Investment Interest Income Recognized (dollars in thousands) Commercial and industrial loans $ 1,103 $ 28 $ 1,157 $ 56 Real estate loans: Construction, land and land development — — — — Residential real estate 306 5 93 — Commercial real estate 1,288 — 1,888 11 Total $ 2,697 $ 33 $ 3,138 $ 67 $26.1 million as of December 31, 2022. The Accrual Status Nonaccrual Status Total Restructured Loans (dollars in thousands) December 31, 2018 Commercial real estate $ — $ 1,261 $ 1,261 December 31, 2017 Commercial real estate $ — $ 1,315 $ 1,315 nonperforming/substandard, 90 days or more days past due and still accruing. December 31, December 31, 2018 2017 (dollars in thousands) Commercial and industrial loans $ 493 $ 372 Real estate loans: Residential real estate 72 88 Commercial real estate 1,261 1,660 Total nonaccrual loans $ 1,826 $ 2,120 Pass Other Loans Especially Mentioned Sub- Standard Doubtful Total (dollars in thousands) December 31, 2018 Commercial and industrial loans $ 84,859 $ 3,908 $ 1,623 $ — $ 90,390 Real estate loans: Construction, land, and land development 55,666 8,379 — — 64,045 Residential real estate 94,548 125 72 — 94,745 Commercial real estate 512,151 2,547 1,261 — 515,959 Consumer and other loans 3,584 — — — 3,584 $ 750,808 $ 14,959 $ 2,956 $ — 768,723 Less net deferred origination fees and premiums (824 ) Loans receivable $ 767,899 December 31, 2017 Commercial and industrial loans $ 87,247 $ 376 $ 902 $ 163 $ 88,688 Real estate loans: Construction, land, and land development 39,081 2,560 — — 41,641 Residential real estate 86,464 479 88 — 87,031 Commercial real estate 434,421 1,636 1,315 345 437,717 Consumer and other loans 2,058 — — — 2,058 $ 649,271 $ 5,051 $ 2,305 $ 508 657,135 Less net deferred origination fees and premiums (347 ) Loans receivable $ 656,788 ("ACL") The following tables summarize the allocation of the Commercial and Industrial Construction, Land, and Land Development Residential Real Estate Commercial Real Estate Consumer and Other Unallocated Total (dollars in thousands) ALLL balance, December 31, 2017 $ 1,864 $ 1,063 $ 1,343 $ 2,014 $ 43 $ 1,690 $ 8,017 Provision for loan losses or (recapture) 579 743 239 718 47 (500 ) 1,826 2,443 1,806 1,582 2,732 90 1,190 9,843 Loans charged-off (408 ) — — (84 ) (27 ) — (519 ) Recoveries of loans previously charged-off 4 — 65 — 14 — 83 Net (charge-offs) recoveries (404 ) — 65 (84 ) (13 ) — (436 ) ALLL balance, December 31, 2018 $ 2,039 $ 1,806 $ 1,647 $ 2,648 $ 77 $ 1,190 $ 9,407 ALLL amounts allocated to Individually evaluated for impairment $ — $ — $ — $ — $ — $ — $ — Collectively evaluated for impairment 2,039 1,806 1,647 2,648 77 1,190 9,407 ALLL balance, December 31, 2018 $ 2,039 $ 1,806 $ 1,647 $ 2,648 $ 77 $ 1,190 $ 9,407 Loans individually evaluated for impairment $ 493 $ — $ 72 $ 1,261 $ — $ 1,826 Loans collectively evaluated for impairment 89,897 64,045 94,673 514,698 3,584 766,897 Loan balance, December 31, 2018 $ 90,390 $ 64,045 $ 94,745 $ 515,959 $ 3,584 $ 768,723 Commercial and Industrial Construction, Land, and Land Development Residential Real Estate Commercial Real Estate Consumer and Other Unallocated Total (dollars in thousands) ALLL balance, December 31, 2016 $ 1,606 $ 1,398 $ 1,495 $ 1,474 $ 26 $ 1,545 $ 7,544 Provision for loan losses or (recapture) 336 (430 ) (152 ) 948 23 145 870 1,942 968 1,343 2,422 49 1,690 8,414 Loans charged-off (81 ) — — (408 ) (11 ) — (500 ) Recoveries of loans previously charged-off 3 95 — — 5 — 103 Net (charge-offs) recoveries (78 ) 95 — (408 ) (6 ) — (397 ) ALLL balance,December 31, 2017 $ 1,864 $ 1,063 $ 1,343 $ 2,014 $ 43 $ 1,690 $ 8,017 ALLL amounts allocated to Individually evaluated for impairment $ — $ — $ — $ — $ — $ — $ — Collectively evaluated for impairment 1,864 1,063 1,343 2,014 43 1,690 8,017 ALLL balance, September 30, 2017 $ 1,864 $ 1,063 $ 1,343 $ 2,014 $ 43 $ 1,690 $ 8,017 Loans individually evaluated for impairment $ 1,065 $ — $ 89 $ 1,660 $ — $ 2,814 Loans collectively evaluated for impairment 87,623 41,641 86,942 436,057 2,058 654,321 Loan balance, December 31, 2017 $ 88,688 $ 41,641 $ 87,031 $ 437,717 $ 2,058 $ 657,135 2018 2017 (dollars in thousands) Land $ 2,426 $ 2,426 Buildings 7,429 7,392 Leasehold Improvements 3,439 3,421 Furniture 1,894 1,821 Equipment 3,439 3,134 Software 772 508 Projects in process 332 132 . 19,731 18,834 Less accumulated depreciation and amortization (6,564 ) (5,713 ) Premises and equipment, net $ 13,167 $ 13,121 Operating Lease Payments Capital Lease Payments Lease and Sublease Income (dollars in thousands) 2019 $ 1,336 $ 70 $ 41 2020 1,342 6 42 2021 1,264 — 44 2022 1,225 — 41 2023 1,168 — — Thereafter 2,905 — — $ 9,240 $ 76 $ 168 December 31, December 31, 2018 2017 (dollars in thousands) Demand, noninterest bearing $ 293,525 $ 242,358 Now and money market 360,473 326,412 Savings 52,572 43,876 Time deposits less than $250,000 62,272 60,445 Time deposits $250,000 and over 34,772 30,204 Total deposits $ 803,614 $ 703,295 Twelve months $ 67,588 One to two years 17,742 Two to three years 8,652 Three to four years 2,459 Four to five years 603 $ 97,044 Note Year Ended December 31, 2018 2017 (dollars in thousands) Average balance outstanding $ 1,900 $ 1,752 Maximum amount outstanditng at any month-end during the year 20,000 20,000 Balance outstanding at year end 20,000 20,000 Weighted average interest rate during the year 2.07 % 1.34 % 2022. 2022. Aggregate Principal Amount December 31, 2018 Aggregate Principal Amount December 31, 2017 (dollars in thousands) Total liability, at par $ 10,000 $ 10,000 Less: unamortized debt issuance costs (35 ) (50 ) Total liability, at carrying value $ 9,965 $ 9,950 Stated Maturity: August 1, 2026 Interest Rate: Fixed @ 5.65% 5 years; then Wall Street Prime +2.5% starting August 1, 2021 Coastal (WA) Statutory Trust I Aggregate Principal Amount December 31, 2018 Aggregate Principal Amount December 31, 2017 (dollars in thousands) Total liability, at par $ 3,609 $ 3,609 Less: unamortized debt issuance costs (28 ) (30 ) Total liability, at carrying value $ 3,581 $ 3,579 Stated Maturity: December 15, 2034 Interest Rate Spread: Three-month LIBOR +2.10% 2018 2017 (dollars in thousands) Current tax expense $ 2,923 $ 3,369 Deferred tax benefit (382 ) 1,284 Total tax expense $ 2,541 $ 4,653 $1.3 million. 2018 2017 (dollars in thousands) Amount Rate Amount Rate Federal income tax at statutory rate $ 2,571 21.0 % $ 3,431 34.0 % Effect of tax-exempt interest income (70 ) (0.6 ) (120 ) (1.2 ) Stock-based compensation 42 0.3 68 0.7 Bank owned life insurance earnings (39 ) (0.3 ) (63 ) (0.6 ) Other 37 0.3 42 0.4 Remeasurement of deferred tax assets for federal rate change — — 1,295 12.8 $ 2,541 20.8 % $ 4,653 46.1 % 2018 2017 (dollars in thousands) Deferred tax assets: Allowance for loan losses $ 1,975 $ 1,683 Net unrealized loss on available-for-sale securities 345 301 Deferred compensation 226 247 Accrued expenses 178 15 Nonqualified stock options 52 56 Allowance for unfunded commitments 64 44 Interest on nonaccrual loans 59 56 Deferred income 34 46 Total deferred tax assets 2,933 2,448 Deferred tax liabilities: Depreciation and amortization (415 ) (356 ) Total deferred tax liabilities (415 ) (356 ) Net deferred tax asset $ 2,518 $ 2,092 CCBX partners reimburse the Bank for credit losses on loans covered by credit enhancements, therefore the credit enhancement recovery deferred tax liability partially offsets the allowance for credit losses deferred tax asset. 2018 2017 (dollars in thousands) Beginning Balance January 1 $ 5,189 $ 3,989 Additions 6,831 2,260 Amounts Collected (2,267 ) (1,060 ) Ending Balance December 31 $ 9,753 $ 5,189 2018 2017 (dollars in thousands) Commitments to extend credit Commercial and industrial $ 47,033 $ 38,958 Construction - commercial real estate 33,128 3,343 Construction - residential real estate 30,269 27,447 Commercial real estate 12,871 4,757 Residential real estate 12,543 12,488 Other 656 846 Total commitments to extend credit $ 136,500 $ 87,839 Standby letters of credit $ 2,331 $ 2,004 As of December 31, 2023, $1.63 billion of the $2.34 billion in total commitments to extend credit were unconditionally cancelable. 2023. Year Ended December 31, 2018 Year Ended December 31, 2017 Expected term 7.5 -10.0 years 10.0 years Expected stock price volatility 31.06% - 41.89 43.41 % Risk-free interest rate 2.66% - 3.14% 2.51 % Expected dividends Zero Zero Weighted average grant date fair value $3.95 - $6.56 $ 3.70 A summary of stock option activity under the Company’s Plan during the year ended December 31, Options Shares Weighted- Average Exercise Price Weighted- Average Remaining Contractual Term (Years) Aggregate Intrinsic Value Outstanding at December 31, 2017 668,934 $ 6.12 6.36 Granted 125,046 7.74 Exercised (58,400 ) 6.12 Forfeited or expired (47,270 ) 6.54 Outstanding at December 31, 2018 688,310 $ 6.39 6.38 6,094,217 Vested or expected to vest at December 31, 2018 688,310 $ 6.39 6.38 6,094,217 Exercisable at December 31, 2018 214,114 $ 5.95 4.96 1,986,051 The total intrinsic value (which is the amount by which the stock price exceeds the exercise price) of options exercised during the year ended December 31, $10.3 million. Nonvested shares Shares Weighted- Average Grant Date Fair Value Aggregate Intrinsic Value Nonvested shares at December 31, 2017 1,400 $ 6.25 Granted 4,000 15.35 Forfeited — — Vested (200 ) 6.25 Nonvested shares at December 31, 2018 5,200 $ 12.32 $ 10,776 2022. 2022. Actual Minimum Required for Capital Adequacy Purposes Required to be Well Capitalized Under the Prompt Corrective Action Provisions Amount Ratio Amount Ratio Amount Ratio (dollars in thousands) December 31, 2018 Common Equity Tier I risk-based capital ratio (to risk-weighted assets) Consolidated $ 110,307 13.70 % $ 36,238 4.50 % $ 52,343 6.50 % Bank Only 103,597 12.84 % 36,294 4.50 % 52,425 6.50 % Leverage Capital (to average assets) Consolidated 113,807 12.46 % 36,529 4.00 % 45,661 5.00 % Bank Only 103,597 11.35 % 36,524 4.00 % 45,655 5.00 % Tier I Capital (to risk-weighted assets) Consolidated 113,807 14.13 % 48,317 6.00 % 64,423 8.00 % Bank Only 103,597 12.84 % 48,392 6.00 % 64,253 8.00 % Total Capital (to risk-weighted assets) Consolidated 133,518 16.58 % 64,423 8.00 % 80,528 10.00 % Bank Only 113,308 14.05 % 64,523 8.00 % 80,653 10.00 % December 31, 2017 Common Equity Tier I risk-based capital ratio (to risk-weighted assets) Consolidated $ 66,494 9.98 % $ 29,990 4.50 % $ 43,319 6.50 % Bank Only 77,756 11.67 % 29,984 4.50 % 43,311 6.50 % Leverage Capital (to average assets) Consolidated 69,994 8.95 % 31,286 4.00 % 39,107 5.00 % Bank Only 77,756 9.94 % 31,280 4.00 % 39,099 5.00 % Tier I Capital (to risk-weighted assets) Consolidated 69,994 10.50 % 39,987 6.00 % 53,316 8.00 % Bank Only 77,756 11.67 % 39,979 6.00 % 53,306 8.00 % Total Capital (to risk-weighted assets) Consolidated 88,222 13.24 % 53,316 8.00 % 66,645 10.00 % Bank Only 85,983 12.90 % 53,306 8.00 % 66,632 10.00 % December 31, 2018 Fair Value Measurements Using Carrying Value Estimated Fair Value Level 1 Level 2 Level 3 (dollars in thousands) Financial assets Cash and due from banks $ 16,315 $ 16,315 $ 16,315 $ — $ — Interest earning deposits with other banks 109,467 109,467 109,467 — — Investment securities 37,922 37,865 33,241 4,624 — Other investments 3,766 3,766 — 3,766 — Loans receivable, net (1) 758,491 743,354 — — 743,354 Accrued interest receivable 2,526 2,526 — 2,526 — Financial liabilities Deposits (1) $ 803,614 802,645 $ — $ 802,645 $ — FHLB advances 20,000 20,000 — 20,000 — Subordinated debt 9,965 9,804 — 9,804 — Junior subordinated debentures 3,581 3,265 — 3,265 — Capital lease 76 74 — 74 — Accrued interest payable 279 279 — 279 — December 31, 2017 Fair Value Measurements Using Carrying Value Estimated Fair Value Level 1 Level 2 Level 3 (dollars in thousands) Financial assets Cash and due from banks $ 13,787 $ 13,787 $ 13,787 $ — $ — Interest earning deposits with other banks 75,964 75,891 75,891 — — Investment securities 38,336 38,301 33,396 4,905 — Other investments 3,680 3,680 — 3,680 — Loans receivable, net 648,771 636,334 — — 636,334 Accrued interest receivable 2,274 — — 2,274 — Financial liabilities Deposits $ 703,295 $ 702,525 $ — $ 702,525 $ — FHLB advances 20,000 20,000 — 20,000 — Subordinated debt 9,950 9,601 — 9,601 — Junior subordinated debentures 3,579 2,978 — 2,978 — Capital lease 137 134 — 134 — Accrued interest payable 228 — — 228 — •Level 1 – Quoted prices in active markets for identical instruments. An active market is a market in which transactions occur with sufficient frequency and volume to provide pricing information on an ongoing basis. A quoted price in an active market provides the most reliable evidence of fair value and shall be used to measure fair value whenever available. •Level 2 – Observable inputs other than Level 1 including quoted prices in active markets for similar instruments, quoted prices in less active markets for identical or similar instruments, or other observable inputs that can be corroborated by observable market data. •Level 3 – Unobservable inputs supported by little or no market activity for financial instruments whose value is determined using pricing models, discounted cash flow methodologies, or similar techniques, as well as instruments for which the determination of fair value requires significant management judgment or estimation; also includes observable inputs from non-binding single dealer quotes not corroborated by observable market data. Items measured at fair value on a recurring basis – The following fair value hierarchy table presents information about the Company’s assets that are measured at fair value on a recurring basis at the dates indicated: Level 1 Level 2 Level 3 Total Fair Value (dollars in thousands) December 31, 2018 Available-for-sale U.S. Treasury securities $ 33,241 $ — $ — $ 33,241 U.S. Government agencies — 2,957 — 2,957 U.S. Agency collateralized mortgage obligations — 169 — 169 U.S. Agency residential mortgage-backed securities — 38 — 38 Municipals — 255 — 255 $ 33,241 $ 3,419 $ — $ 36,660 December 31, 2017 Available-for-sale U.S. Treasury securities $ 33,396 $ — $ — $ 33,396 U.S. Government agencies — 2,970 — 2,970 U.S. Agency collateralized mortgage obligations — 260 — 260 U.S. Agency residential mortgage-backed securities — 81 — 81 Municipals — 220 — 220 $ 33,396 $ 3,531 $ — $ 36,927 Valuation Technique Unobservable Inputs December 31, 2018 Weighted Average Rate December 31, 2017 Weighted Average Rate Impaired loans Collateral valuations Discount to appraised value 9 % 13 % Level 1 Level 2 Level 3 Total Fair Value (dollars in thousands) December 31, 2018 Impaired loans $ — $ — $ 493 $ 493 Total $ — $ — $ 493 $ 493 December 31, 2017 Impaired loans $ — $ — $ 508 $ 508 Total $ — $ — $ 508 $ 508 Note 2018 2017 (dollars in thousands) Deposit service charges Overdraft fees $ 464 $ 436 Other 706 502 Interchange income 1,436 1,262 Wholesale banking income 709 — Loan referral fees 618 439 Merchant service fees 455 417 Gain on sale of loans (1) 264 102 Mortgage broker fees 215 255 Earnings on life insurance (1) 188 185 Loan servicing fees (1) 138 100 Lease and sublease income (1) 81 223 Other (2) 193 233 Total noninterest income $ 5,467 $ 4,154 (1) Not within the scope of Topic 606. (2) Includes the following immaterial income streams that are within the scope of Topic 606: wire transfer fees, annuity fees, brokerage fees, and credit card revenue. Topic 606: Year ended December 31, 2018 December 31, 2017 (dollars in thousands, except share data) Net Income $ 9,701 $ 5,436 Basic weighted average number common shares outstanding 10,440,740 9,234,490 Dilutive effect of share-based compensation 168,024 3,176 Diluted weighted average number common shares outstanding 10,608,764 9,237,666 Basic earnings per share $ 0.93 $ 0.59 Diluted earnings per share $ 0.91 $ 0.59 December 31, December 31, 2018 2017 ASSETS Cash $ 20,252 $ 2,252 Investment in trust equities 109 109 Investment in subsidiaries 102,445 76,972 Other assets 6 23 TOTAL ASSETS $ 122,812 $ 79,356 LIABILITIES AND SHAREHOLDERS' EQUITY Junior subordinated debentures, net of issuances costs $ 3,581 $ 3,579 Subordinated debt, net of debt issuance costs 9,965 9,950 Interest and dividends payable 103 102 Other liabilities 7 14 Shareholders' equity 109,156 65,711 TOTAL LIABILITIES AND SHAREHOLDERS' EQUITY $ 122,812 $ 79,356 Year ended December 31, 2018 2017 INCOME Interest bearing deposits $ 5 $ 4 Total income 5 4 EXPENSE Interest expense 744 709 Other expenses 85 88 Total expense 829 797 Loss before income taxes and undistributed net income of subsidiary (824 ) (793 ) Equity in undistributed income of consolidated subsidiaries 10,360 5,975 Income tax benefit (165 ) (254 ) NET INCOME $ 9,701 $ 5,436 Year ended December 31, 2018 2017 CASH FLOWS FROM OPERATING ACTIVITIES: Net income $ 9,701 $ 5,436 Adjustments to reconcile net income to net cash used by operating activities: Equity in undistributed income of consolidated subsidiaries (10,360 ) (5,975 ) Stock-based compensation 31 31 Decrease in other assets 18 12 Increase in other liabilities 10 18 Net cash used by operating activities (600 ) (478 ) CASH FLOWS FROM INVESTING ACTIVITIES: Investments in subsidiaries (15,000 ) — Net cash used by investing activities (15,000 ) — CASH FLOWS FROM FINANCING ACTIVITIES: Proceeds from initial public offering, net 33,243 — Proceeds from exercise of stock options 357 24 Repurchase of common stock — (3 ) Net cash provided by financing activities 33,600 21 NET CHANGE IN CASH 18,000 (457 ) Cash, beginning of year 2,252 2,709 Cash, end of year $ 20,252 $ 2,252 Phase-in of the capital conservation buffer requirements began on January 1, 2016, and the requirements were fully phased in on January 1, 2019. The capital conservation buffer requirement for 2018 was 1.875%. A banking organization with a buffer greater than 2.5% once the capital conservation buffer is fully phased in would not be subject to limits on capital distributions or discretionary bonus payments; however, a banking organization with a buffer of 2.5% or less than 2.5% would be subject to increasingly stringent limitations as the buffer approaches zero. A banking organization also would be prohibited from making distributions or discretionary bonus payments during any quarter if its eligible retained income is zero or negative in that quarter and its capital conservation buffer ratio was 2.5% or less than 2.5% at the beginning of the quarter. Effectively, the Basel III framework, will requireincluding the capital conservation buffer, requires the Bank to meet minimum risk-based capital ratios of (i) 7% for common equity Tier 1 capital, (ii) 8.5% Tier 1 capital, and (iii) 10.5% total capital, once it is fully phased in.capital. The eligible retained income of a banking organization is defined as the greater of (1) its net income for the four calendar quarters preceding theincome. Whenincome, and (2) the rule is fully phased in,average of its net income over the preceding four quarters. The minimum capital requirements plus the capital conservation buffer will exceed the prompt corrective action or PCA,(“PCA”), well-capitalized thresholds for risk-based capital ratios, which are described below under “—Prompt Corrective Action.” permanently include non-qualifying instruments that were issued and included in Tier 1 or Tier 2 capital prior to May 19, 2010 in Additional Tier 1 or Tier 2 capital until they redeem such instruments or until the instruments mature. At December 31, 2018,2023 the Company had $3.5 million of non-qualifying instruments includable in Tier 1 capital that were issued prior to May 19, 2010.In December 2017,Basel Committee published standards that it described asBank are required to meet the finalizationgenerally applicable regulatory capital requirements of the Basel III post-crisis regulatory reforms, which standards are commonly referred to as Basel IV. Among other things, these standards revise the Basel Committee’s standardized approach for credit risk (including the recalibration of the risk weightsFederal Reserve and the introductionFDIC. Historically, the Company had been operating under the Small Bank Holding Company Policy Statement, which exempts bank holding companies that have total consolidated assets of newless than $3.0 billion and meet other criteria from the Federal Reserve’s risk-based- and leverage capital requirements for certain “unconditionally cancellable commitments,” suchrules. Because the Company’s total consolidated assets exceeded $3.0 billion as unused credit card lines of credit) and provides a new standardized approach for operational risk capital. UnderSeptember 30, 2022, the Basel framework, these standards will generally be effective on January 1, 2022, with an aggregate output floor phasing in through January 1, 2027. Under the current U.S. capital rules, operational risk capital requirements and a capital floor apply only to advanced approaches institutions, and are not applicableCompany is no longer subject to the Bank. The impact of Basel IV on us will depend on how itFederal Reserve’s Small Bank Holding Company Policy Statement and is implementedevaluated relative to the capital adequacy standards established by the federalFederal Reserve. A bank regulators.billion and an appropriate risk profile. The required regulations must specify a minimum community bank leverage ratio of not less than 8% and not more than 10%, as well as procedures for treatment of a qualifying community bank that has a community bank leverage ratio that falls below the required minimum.billion. Qualifying banks that exceed the minimum community bank leverage ratio will beCBLR are deemed to be in compliance with all other capital and leverage requirements. The federal banking agenciesCBLR is currently set at 9.0%. The Company and Bank have proposed regulations that would establish a community bank leverage ratio of 9.0% into which; all insured depository institutions are placed.fall into one of these categories. The federal banking agencies have specified by regulation the relevant capital thresholds and other qualitative requirements for each of thosethe categories. For an insured depository institution to be “well-capitalized” under the PCA framework, it must have a common equity Tier 1 capital ratio of 6.5%6.50%, Tier 1 capital ratio of 8.0%8.00%, a total capital ratio of 10.0%10.00%, and a leverage ratio of 5.0%5.00%, and must not be subject to any written agreement, order or capital directive, or prompt corrective action directive issued by its primary federal regulator to meet and maintain a specific capital level for any capital measure. At December 31, 2018,2023, the Bank qualified for the well-capitalized category. This scrutiny has increased during recent years, as the economic downturn that began in the late 2000s negatively affected the liquidity of many financial institutions. Various bank regulatory publications, including Federal Reserve SR 10-6 (Funding and Liquidity Risk Management), address the identification, measurement, monitoring and control of funding and liquidity risk by financial institutions.introduced two new liquiditystandardized metrics for large banking organizations. The first metric is the “liquidity coverage ratio,” and it aims to require a financial institution to maintain sufficient high-quality liquid resources to survive an acute stress scenario that lasts for one month. The second metric is the “net stable funding ratio,” and its objective is to require a financial institution to maintain a minimum amount of stable sources relative to the liquidity profiles of the institution’s assets, as well as the potential for contingent liquidity needs arising from off-balance sheet commitments, over a one-year horizon.The federal banking regulators finalized the liquidity coverage ratio in September 2014, and proposed the net stable funding ratio in May 2016. proposed net stable funding ratio only apply to the largest banking organizations in the country, certain elements may filter down and become applicable to or expected of all insured depository institutions.institutions including the Bank.approval.approval of the Washington DFI. Under Federal Reserve regulations, the Bank may not declare or pay a dividend if the total of all dividends declared during the calendar year, including the proposed dividend, exceeds the sum of the Bank’s net income during the current calendar year and the retained net income of the prior two calendar years, unless the dividend has been approved by the Federal Reserve.assets •a bank maybank’s purchase of assets from affiliates;Under federal law, total loans and extensions of credit to a borrower may not exceed 15% of the Bank’s unimpaired capital and surplus. However, such loans may be in excess of that percentage, but not above 25%, if each loan in excess of 15% is fully collateralized by readily marketable collateral. or CRE,(“CRE”), loans. In addition, in December 2015, the federal bank agencies issued additional guidance entitled “Statement on Prudent Risk Management for Commercial Real Estate Lending.” Together, these guidelines describe the criteria the agencies will use as indicators to identify institutions potentially exposed to CRE concentration risk. An institution that has (i) experienced rapid growth in CRE lending, (ii) notable exposure to a specific type of CRE, (iii) total reported loans for construction, land development, and other land representing 100% or more of the institution’s capital, or (iv) total CRE loans representing 300% or more of the institution’s capital, and the outstanding balance of the institutions CRE portfolio has increased by 50% or more in the prior 36 months, may be identified for further supervisory analysis of the level and nature of its CRE concentration risk. As of December 31, 2018, theThe Bank’s total non-owner-occupied commercial real estate loans, including loans secured by apartment buildings, investor commercial real estate, and construction and land loans, represented 333.0%238.3% and 269.2% of its capital, thus exceeding the 300% target. However, the ratio has decreased sinceat December 31, 2017 when it was at 354.7%. non-publicnonpublic personal information of their clients. Clients generally may prevent financial institutions from sharing non-public personal information with nonaffiliated third parties except under certain circumstances, such as the processing of transactions requested by the consumer or when the financial institution is jointly offering a product or service with a nonaffiliated financial institution. Additionally, financial institutions generally are prohibited from disclosing consumer account numbers to any nonaffiliated third party for use in telemarketing, direct mail marketing or other marketing to consumers.or FFIEC,(“FFIEC”), has issued several policy statements and other guidance for banks as new cybersecurity threats arise. FFIEC has recently focused on such matters as compromised customer credentials and business continuity planning. Examinations by the banking agencies now include review of an institution’s information technology and its ability to thwart cyberattacks.
Federal banking agency rules require banking organizations to notify their primary federal regulator of significant security incidents within 36 hours of determining that such an incident has occurred as soon as possible and no later than within 36 hours of a significant cybersecurity incident. In addition, the SEC recently enacted rules, effective as of December 18, 2023, requiring public companies to disclose material cybersecurity incidents that they experience on Form 8-K within four business days of determining that a material cybersecurity incident has occurred and to disclose on annual basis material information regarding their cybersecurity risk management, strategy, and governance.a bureau within the Treasury Department, including the Financial Crimes Enforcement Network, but compliance by individual institutions is overseen by its primary federal regulator.or OFAC,(“OFAC”), is responsible for helping to ensure that U.S. entities do not engage in transactions with certain prohibited parties, as defined by various Executive Orders and Acts of Congress. OFAC publishes lists of persons, organizations and countries suspected of aiding, harboring or engaging in terrorist acts, known as Specially Designated Nationals and Blocked Persons. If the Company or the Bank finds a name on any transaction, account or wire transfer that is on an OFAC list, the Company or the Bank must freeze or block such account or transaction, file a suspicious activity report, and notify the appropriate authorities.a newan accounting oversight board to enforce auditing standards and restrict the scope of services that accounting firms may provide to their publicpublicly traded company audit clients.Economic Growth, Regulatory Relief,EGRRCPA(EGRRCPA)As final rules and regulations implementing the (“Dodd-Frank Act have been adopted, this law hasAct”) significantly changed and is significantly changing the bank regulatory framework and affected the lending, deposit, investment, trading and operating activities of banks and their holding companies.A number ofcompanies, including in the effects of the Dodd-Frank Act are described or otherwise accounted for in various parts of this “—Supervision and Regulation” section. The following items provide a brief description of certain other provisions of the Dodd-Frank Act that may be relevant to us and the Bank.newadditional requirements regarding the origination and servicing of residential mortgage loans. The law created a variety of new consumer protections, including limitations, subject to exceptions, on the manner by which loan originators may be compensated and an obligation on the part of lenders to verify a borrower’s “ability to repay” a residential mortgage loan. Final rules implementing these latter statutory requirements became effective in 2014.The Dodd-Frank Act eliminated the federal prohibitions on paying interest on demand deposits effective one year after the date of its enactment, thus allowing businesses to have interest-bearing checking accounts. Depending on competitive responses, this significant change to existing law could have an adverse impact on our interest expense. will affect most U.S. publicly traded companies. The Dodd-Frank Act (i) requires publicly traded companies to give shareholders a non-binding vote on executive compensation and golden parachute payments; (ii) enhances independence requirements for compensation committee members; (iii) requires national securities exchanges to require listed companies to adopt incentive-based compensation clawback policies for executive officers; (iv) authorizes the SEC to promulgate rules that would allow shareholders to nominate their own candidates using a company’s proxy materials; and (v) directs the federal banking regulators to issue rules prohibiting incentive compensation that encourages inappropriate risks.agenciesagency for compliance with federal consumer protection laws and regulations. The CFPB also has authority to prevent unfair, deceptive or abusive acts or practices in connection with the offering of consumer financial products. The Dodd-Frank Act permits states to adopt consumer protection laws and standards that are more stringent than those adopted at the federal The EGRRCPA requires amendments generally intended to narrow the scope of certain of these rules, but we are not currently able to determine how these changes may affect the Bank’s business.The CFPB has concentrated much of its rulemaking efforts on reforms related to residential mortgage transactions. These rules, which become effective on a rolling basis through January 1, 2019, include significant regulatorycompliance changesenforcement activities and are expected tostrategic priorities have a broad impact onshifted as its leadership has changed, and in the financial services industry.With the recent change in leadership at the CFPB, the agency has released a new strategic plan and published formal requests for information on possible changes to its supervisory, enforcement and other programs. These developments suggest thatfuture, the CFPB may be takingtake a different approach to its implementation of consumer financial protection laws butthan it has taken in the agency has not proposed specific changes to its regulations. The EGRRCPA requires the CFPB to make changes to various regulations.entities”entities,” including insured depository institutions and their affiliates, from engaging in “proprietary trading.” Banking entities also are prohibitedtrading” and from sponsoring or investing in private equity or hedge funds, or extending credit to or engaging in other covered transactions with affiliated private equity or hedge funds. The fundamental prohibitions of the Volcker Rule generally apply to banking entities of any size, including us, the bank and any other “affiliate” under the BHC Act.funds that they sponsor or advise. The EGRRCPA amendsamended Section 619 to exempt from the Volcker Rule any insured depository institution that has $10.0 billion or less in total consolidated assets and whose total trading assets and trading liabilities are 5% or less of total consolidated assets.2018.2023.Name Age Age51 46President, Chief Executive Officer and Director62 President Joel G. Edwards 63 58RussMichael E. Culp35 Chief Revenue Officer Tarah M. Herger 38 CCBX Division Manager Russell A. Keithley 58 53LendingBanking OfficerJohn J. DicksonDaniel J. Lee53 5862Chief Operations OfficerandOfficerAndrew G. Stines 53 Chief Risk Officer President and Chief Executive Officer. Mr. Sprink joined the Company in late 2006 as President and Chief Operating Officer and became Chief Executive Officer in 2010. Mr. Sprink began his banking career working for Security Pacific Bank while enrolled at Arizona State University. He assumed increasing levels of responsibility in the areas of retail operations, consumer and commercial lending and wealth management with Security Pacific Bank and its successor, Bank of America. He then moved to Centura Bank, where he held management positions in retail operations and corporate finance. After Centura Bank was acquired, he held senior management positions at Washington Trust Bank and Global Credit Union. Mr. Sprink is active in industry trade groups and is a director and past chairman of the Community Bankers of Washington. Mr. Sprink received a bachelor’s degree from Arizona State University and an M.B.A. from the University of North Carolina. Mr. Sprink brings to our board of directors leadership experience, significant experience in many facets of the financial services business, and familiarity with our market area. Mr. Sprink has been a member of our board of directors since 2006.Russ A. Keithley servesLendingRevenue Officer of the Bank positionssince 2023. Mr. Culp joined the Bank in September 2013. From 2021 to 2023 Mr. Culp was the Senior Vice President and Chief Revenue Officer for the Bank and from 2018 to 2021 he served as the Vice President and Senior Vice President of the Bank’s Portfolio Risk Officer. Mr. Culp’s responsibilities at the Bank have included budgeting, managing interest rate risk, overseeing the Bank’s interest rate swaps, and working on strategic initiatives. Prior to joining the Bank, Mr. Culp was a Portfolio Risk Manager at Premier West Bank. Mr. Culp graduated summa cum laude with a bachelor’s degree in economics and a certificate of applied finance and economics. He completed post-graduate studies in accounting. Mr. Culp received an M.B.A. from Washington State University with a concentration in finance.heldserved as Executive Vice President and CCBX Division Manager of the Bank since 2015.2022. Mrs. Herger joined the Bank in 2016 and in 2018 was the first employee assigned to the CCBX Division as Vice President and Strategic Partner Program Manager. Mrs. Herger was responsible for designing and implementing the operational and oversight aspects of the CCBX segment.John J. Dickson joined Bank in 2010 and currently serves as Executive Vice President and Chief Operations Officer of the Bank. Prior to joining the Bank, he served in various roles for Frontier Financial Corporation and Frontier Bank from 1985 to 2010, most recently serving as President of Frontier Bank from 2008 to 2010. In 2010, Frontier Bank was closed by the Washington DFI, and the FDIC was named receiver. Mr. Dickson received a bachelor’s degree in economics from the University of Puget Sound and graduated with honors from the Graduate School of Banking at the University of Wisconsin-Madison. Mr. Dickson practiced accounting as a CPA for three years in the audit division of a large accounting firm. Mr. Dickson is past Chairman of the Washington Bankers Association.Daniel J. Lee joined the Bank in 2018 and currently serves as Executive Vice President and Chief Credit Officer of the Bank since April of 2020 and Risk Officer.as the Chief Credit Officer of the CCBX segment of the Bank since January of 2023. Prior to becoming the Chief Credit Officer, Mr. Sand served as Senior Credit Administrator since 2012. Prior to joining the Bank, he most recentlyMr. Sand held the position of Senior Credit Administrator with Cascade Bank after starting his banking career with Frontier Bank. Mr. Sand is a graduate of Central Washington University and Pacific Coast Banking School.Vice President,Director with Ernst and Young LLP in its Regulatory Practices Group assisting large financial institutions with their remediation of enforcement actions, compliance program designs and advising on similar regulatory matters. Before joining Ernst and Young, Mr. Stines served as Chief CreditRisk Officer and BSA Officer for Bank of the Cascades where he managed all credit administration and loan operations. After helping Bank of the Cascades to more than double its assets and loans in just five years, Bank of the Cascades was acquired by First InterstateSunwest Bank in 2017. Prior to that,California. Mr. Lee servedStines has over 20 years of experience working with financial institutions on various legal, regulatory and compliance matters. Mr. Stines holds a BS in senior leadership roles of both public and privately held banks. Mr. Lee earned his BS and MBAManagement from the Kelley School of Business, Indiana University. He attended the ABA Stonier Graduate School of Banking—currently domiciled at the Wharton Business School, University of Pennsylvania. He served asColorado, a Director on the Government Relations CouncilJuris Doctor from Seattle University and a Master in Science and Finance from Seattle University.the American Bankers Associationrisks inherent in our transactions and has a rich history of helping advocate for community resources that benefit new businesses and charitable services.Investingpresent in the Company’s common stock involves risks. The investor should carefully considerbusiness decisions we make. Described below are the following risk factors before deciding to makematerial risks and uncertainties that if realized could have an investment decision regarding the Company’s stock. The risk factors may cause future earnings to be lower or theadverse effect on our business, financial condition, results of operations or cash flows, and our access to be less favorable than expected. In addition, other risks that the Company is not aware of, or which are not believed to be material, may cause earnings to be lower, or may deteriorate the financial condition of the Company.liquidity. Consideration should also be given to the other information in this Annual Report on Form 10-K, as well as in the documents incorporated by reference into this Form 10-K. However, other factors not discussed below or elsewhere in this Annual Report on Form 10-K.Businessloancredit losses.2018,2023, our commercial real estate loan portfolio totaled $516.0 million,$1.30 billion, or 67.1%43.0% of our total loan portfolio. Our current business strategy is to continue our originations of commercial real estate loans. Commercial real estate loans generally expose a lender to greater risk of non-payment or late payment and loss than one-to-four family residential mortgage loans because repayment of the loans often depends on the successful operation of the properties and the income stream of the borrowers. These loans involve larger loan balances to single borrowers or groups of related borrowers compared to one-to-four family residential mortgage loans. To the extent that borrowers have more than one commercial real estate loan outstanding, an adverse development with respect to one loan or one credit relationship could expose us to a significantly greater risk of loss compared to an adverse development with respect to a one-to-four family residential real estate loan. Moreover, if loans that are collateralized by commercial real estate become troubled and the value of the real estate has been significantly impaired, then we may not be able to recover the full contractual amount of principal and interest that we anticipated at the time we originated the loan, which could cause us to increase our provision for loancredit losses and would adversely affect our earningsbusiness, financial condition and financial condition.Impositionresults of limits byoperations. Furthermore, should the bank regulators on commercial real estate lending activities could curtail our growth and adversely affect our earnings.In 2006, the federal banking regulators issued joint guidance entitled “Concentrations in Commercial Real Estate Lending, Sound Risk Management Practices,” or the CRE Guidance. Although the CRE Guidance did not establish specific lending limits, it provides that a bank’s commercial real estate lending exposure could receive increased supervisory scrutiny where total non-owner-occupied commercial real estate loans, including loans secured by apartment buildings, investor commercial real estate, and construction and land loans, represent 300% or more of an institution’s total risk-based capital, and the outstanding balancefundamentals of the commercial real estate loan portfolio has increased by 50% or more duringmarket deteriorate due to macroeconomic and other factors, our business, financial condition and results of operations could be adversely affected.preceding 36 months. Our total non-owner-occupied commercialreal properties we own and the foreclosure on real estate assets securing our loan portfolio.includingwe make. As a result, we could be subject to environmental liabilities with respect to those properties. We may be held liable to a governmental entity or to third parties for property damage, personal injury, investigation and clean-up costs incurred by these parties in connection with environmental contamination, or we may be required to investigate or clean up hazardous or toxic substances or chemical releases at a property. The costs associated with investigation or remediation activities could be substantial. In addition, if we are the owner or former owner of a contaminated site, we may be subject to common law claims by third parties based on damages and costs resulting from environmental contamination emanating from the property.apartment buildings, investor commercial real estate,those properties, we may not have adequate remedies against the prior owners or other responsible parties and construction and land loans, represented 333.0%we may not be able to resell the affected properties either before or after completion of its total risk-based capital at December 31, 2018. However, the ratio has decreased since December 31, 2017 when it was at 354.7%. In December 2015, the federal banking regulators released a new statement on prudent risk management for commercial real estate lending, referred to herein as the 2015 Statement. In the 2015 Statement, the federal banking regulators, among other things, indicate the intent to continue “to pay special attention” to commercial real estate lending activities and concentrations going forward.any such removal or abatement procedures. If the Federal Reserve, our primary federal regulator, were to impose restrictionsmaterial environmental problems are discovered before foreclosure, we generally will not foreclose on the amountrelated collateral or will transfer ownership of commercial real estatethe loan to a subsidiary. It should be noted, however, that the transfer of the property or loans to a subsidiary may not protect us from environmental liability. Furthermore, despite these actions on our part, the value of the property as collateral will generally be substantially reduced or we can hold inmay elect not to foreclose on the property and, as a result, we may suffer a loss upon collection of the loan. Any significant environmental liabilities could adversely affect our portfolio, for reasons noted above or otherwise, our earnings would be adversely affected.itself.itself and the conditions in the general economy. Further, any losses incurred on a small number of commercial loans could have an adverse impact on our financial condition and results of operations due to the larger average size of commercial loans as compared with other loans and the risk that collateral securing such loans may depreciate over time, may be difficult to appraise, may fluctuate in value and may depend on the borrower’s ability to collect receivables. We have increased our focus on commercial business lending in recent years and intend to continue to focus on this type of lending in the future.2018, $94.72023, $463.4 million, or 12.3%15.3%, of our loan portfolio was secured by one-to-four family real estate, a significant majority of which is located in the Puget Sound region.estate. One-to-four family residential mortgage lending is generally sensitive to regional and local economic conditions that significantly impact the ability of borrowers to meet their loan payment obligations, making loss levels difficult to predict. A decline in residential real estate values as a result of a downturn in the Puget Sound housing market could reduce the value of the real estate collateral securing these types of loans. Declines in real estate values could cause some of our residential mortgages to be inadequately collateralized, which would expose us to a greater risk of loss if we seek to recover on defaulted loans by selling the real estate collateral.Thethat we lend to may have fewer resources to endure adverseadversely affect our business, developments than larger firms, which may impair our borrowers’ ability to repay loans. of or interest on any loan will not be repaid timely or at all or that the value of any collateral supporting the loan will be insufficient to cover our outstanding exposure. These risks may be affected by the strength of the borrower’s business sector and local, regional and national market and economic conditions. Many of our loans are made to small to medium-sized businesses that may be less able to withstand competitive, economic and financial pressures than larger borrowers. Our risk management practices, such as monitoring the concentration of our loans within specific industries and our credit approval practices, may not adequately reduce credit risk, and our credit administration personnel, policies and procedures may not adequately adapt to changes in economic or any other conditions affecting customers and the quality of the loan portfolio. A failure to effectively measure and limit the credit risk associated with our loan portfolio could lead to unexpected losses and have a material adverse effect onadversely affect our business, financial condition and results of operations.Ifloancredit losses ismay prove to be insufficient to absorb actuallosses in our loan portfolio.our resultson financial assets measured at amortized cost. The ACL is evaluated and calculated on a collective basis for those loans which share similar risk characteristics. At each reporting period, the Company evaluates whether the loans in a pool continue to exhibit similar risk characteristics as the other loans in the pool and whether it needs to evaluate the allowance on an individual basis. The Bank must estimate expected credit losses over the loans’ contractual terms, adjusted for expected prepayments. In estimating the life of operations wouldthe loan, the Bank cannot extend the contractual term of the loan for expected extensions, renewals, and modifications, unless the extension or renewal options are included in the contract at the reporting date and are not unconditionally cancellable by the Bank. Because expected credit losses are estimated over the contractual life adjusted for estimated prepayments, determination of the life of the loan may significantly affect the ACL. The Company has chosen to segment its portfolio consistent with the manner in which it manages the risk of the type of credit.negatively affected.In determiningadequately represented in the amountquantitative method. For example, factors that the Company considers include environmental business conditions, borrower’s financial condition, credit rating and the volume and severity of past due loans and non-accrual loans. Based on this analysis, the Company records a provision for credit losses to maintain the allowance at appropriate levels.loancredit losses we analyze our lossinherently involves a high degree of subjectivity and delinquency experience by loan categoriesrequires us to make significant estimates of current credit risks and we consider the effectfuture trends, all of existing economic conditions. In addition, we make various assumptions and judgments about the collectability of our loan portfolio, including the creditworthiness of our borrowers and the value of the real estate and other assets serving as collateral for the repayment of many of our loans.which may undergo material changes. If the actual results are different from our estimates or our analyses are incorrect, ourthe allowance for loancredit losses may not be sufficient to cover losses inherent in our loan portfolio, which would require additions toresulting in the need for increases in our allowance for credit losses through the provision for losses on loans which is charged against income. Management also recognizes that significant new growth in loan portfolios, through the community bank and/or CCBX, new loan products and the refinancing of existing loans can result in portfolios comprised of unseasoned loans that may not perform in a historical or projected manner and will increase the risk that our allowance may be insufficient to absorb losses without significant additional provisions.decreasehave to absorb any credit losses associated with the CCBX partner that cannot fulfill its contractual obligations.net income. Our emphasis on loan growth and on increasing our portfolio, as well as any future credit deterioration, willcontrol, may require us toan increase our allowance further in the future.our banking regulatorsbank regulatory agencies periodically review our allowance for loancredit losses and couldmay require usan increase in the provision for credit losses or the recognition of further loan charge-offs, based on their judgments about information available to them at the time of their examination. In addition, if charge-offs in future periods exceed the allowance for credit losses, we will need additional provisions to increase our provisionthe allowance for loancredit losses. Any increase inWhile we believe that our allowance for loancredit losses or loan charge-offswas adequate at December 31, 2023, there is no assurance that it will be sufficient to cover future credit losses, especially if there is a significant deterioration in economic conditions.required by regulatory authoritiesCECL which requires financial institutions to determine periodic estimates of lifetime expected credit losses on loans and recognize the expected credit losses as allowances for credit losses. We adopted this accounting pronouncement effective for our fiscal year beginning January 1, 2023.have a material adverse effect on our results of operations and financial condition.Nonperforming assets take significant time and resources to resolve and adversely affectimpact our earnings and financial condition.Nonperforming assets adversely affectcould increase the credit risk associated with our net incomeloan portfolio.various ways. We generally do not record interest incomeour market area on other real estate owned, or OREO, or on nonperformingwhich a significant number of our customers are dependent, a substantial portion of our loan portfolio is comprised of loans thereby adversely affectingsecured by property located in the Puget Sound region and substantially all of our incomeloan and increasing loan administration costs. When we take collateraldeposit customers are businesses and individuals in foreclosures and similar proceedings, we are required to mark the related asset to the then fair market valuegreater Puget Sound region. A deterioration of the collateral, which may ultimatelyeconomy in the market areas we serve could result in a loss. An increase in our levelthe following consequences, any of nonperforming assets increases our risk profile and maywhich would have an adverse impact, the capital levels regulators believe are appropriate in light of the ensuing risk profile. While we seek to reduce problem assets through loan workouts, restructurings and otherwise, decreases in the value of the underlying collateral, or in these borrowers’ performance or financial condition, whether or not due to economic and market conditions beyond our control,which could have abe material, effect on our business, financial condition, and results of operations. In addition, the resolution of nonperformingoperations:requires significant commitments of time from management, whichand foreclosures may materially and adversely impact their ability to perform their other responsibilities. Weincrease;not experience future increasesdecline in value, in turn reducing customers’ borrowing power, reducing the value of nonperforming assets.assets and collateral associated with existing loans;
•certain securities within our investment portfolio could become other than temporarily impaired, requiring a write-down through earnings to fair value, thereby reducing equity; Small Business Administration, or SBA lending program is dependent upon the U.S. federal government, and we face specific risks associated with originating SBA loans.a materialan adverse effect to our financial results. Any changes to the SBA program, including but not limited to changes to the level of guarantee provided by the federal government on SBA loans, changes to program specific rules impacting volume eligibility under the guaranty program, as well as changes to the program amounts authorized by Congress or exhaustion of the available funding for SBA programs may also have a materialan adverse effect on our business.business, financial condition and results of operation. In addition, any default by the U.S. governmentGovernment on its obligations or any prolonged government shutdown could, among other things, impede our ability to originate SBA loans or sell such loans in the secondary market, which could materially and adversely affect our business, financial condition and earnings.Theresults of operations.materially and adversely affect our business, financial condition and earnings.profitability.results of operation. Because government regulation greatly affects the business and financial results of all commercial banks and bank holding companies and especially our organization, changes in the laws, regulations and procedures applicable to SBA loans could adversely affect our ability to operate profitably.The geographic concentration of our loan portfolio and lending activities makes us vulnerable to a downturn in the economy of the Puget Sound region.While there is not a single employer or industry in our market area on which a significant number of our customers are dependent, a substantial portion of our loan portfolio is comprised of loans secured by property located in the Puget Sound region. This makes us vulnerable to a downturn in the local economy and real estate markets. Adverse conditions in the local economy such as unemployment, recession, a catastrophic event or other factors beyond our control could impact the ability of our borrowers to repay their loans, which could impact our net interest income. Uncertainties have arisen regarding the potential for a reversal or renegotiation of international trade agreements under the current administration, and the impact such actions and other policies of the current administration may have on economic and market conditions. In addition, concerns about the performance of international economies, especially in Europe and emerging markets, and economic conditions in Asia, particularly the economies of China, South Korea and Japan, can impact the economy and financial markets here in the United States. If the national, regional and local economies experience worsening economic conditions, including high levels of unemployment, our growth and profitability could be constrained. Weak economic conditions are characterized by, among other indicators, deflation, elevated levels of unemployment, fluctuations in debt and equitycapital markets, increased delinquencies on mortgage, commercial and consumer loans, residential and commercial real estate price declines, and lower home sales and commercial activity. All of these factors are generally detrimental to our business. Our business is significantly affected by monetary and other regulatory policies of the U.S. federal government, its agencies and government-sponsored entities. Changes in any of these policies are influenced by macroeconomic conditions and other factors that are beyond our control, are difficult to predict and could have a material adverse effect on our business, financial position, results of operations and growth prospects. In addition, decreases in local real estate values caused by economic conditions, recent changes in tax laws or other events could adversely affect the value of the property used as collateral for our loans, which could cause us to realize a loss in the event of a foreclosure. Further, deterioration in local economic conditions could drive the level of loan losses beyond the level we have provided for in our allowance for loan losses, which in turn could necessitate an increase in our provision for loan losses and a resulting reduction to our earnings and capital.result in increases inincrease our level of nonperforming loans and/or reduce demand for our products and services, which could have an adverse effect on our results of operations.liquidity,business, financial condition, results of operations or cash flows and our access to liquidity.condition.other real estate ownedOREO and repossessed personal property may not accurately describereflect the net value of the asset.loancredit losses may not reflect accurate loan impairments. This could have a material adverse effect onadversely affect our business, financial condition orand results of operations. As of December 31, 2018,2023, we did not hold any OREO or repossessed property and equipment.earnings.materially and adversely affect our business, financial condition and earnings.Our agreement with Aspiration may produce limited revenue and may expose us to liability for compliance violations by Aspiration.We have entered into an agreement with Aspiration, an online investment platform that offers socially-conscious and sustainable banking and investing, pursuant to which we will provide certain banking services for Aspiration’s new cash management account program that Aspiration launched in the fourth quarter of 2018, including serving as the issuing bank for debit cards issued to Aspiration’s customers and establishing one or more settlement accounts for the purpose of settling customer transactions in the cash management account program. The agreement with Aspiration has an initial term (subject to two automatic renewals for successive 12-month terms) of three years from November 23, 2018 it may be earlier terminated by the parties under certain circumstances. If Aspiration is not successful in achieving customer acceptance of its cash management account program or terminates the agreement before the end of its term, our revenue under the agreement may be limited or may cease altogether. In addition, because we will provide banking services with respect to the cash features of Aspiration’s cash management account program, our bank regulators may hold us responsible for Aspiration’s activities with respect to the marketing or administration of Aspiration’s cash management account program, which may result in increased compliance costs for us or potentially compliance violations as a result of Aspiration’s activities.Our business strategy includes growth, and our financial condition and results of operations could be negatively affected if we fail to grow or fail to manage our growth effectively. Growing our operations could also cause our expenses to increase faster than our revenues.Our business strategy includes growth in assets, deposits and the scale of our operations. Achieving such growth will require us to attract customers that currently bank at other financial institutions in our market area. Our ability to successfully grow will depend on a variety of factors, including our ability to attract and retain experienced bankers, the continued availability of desirable business opportunities, competition from other financial institutions in our market area and our ability to manage our growth. Growth opportunities may not be available or we may not be able to manage our growth successfully. If we do not manage our growth effectively, our financial condition and operating results could be negatively affected. Furthermore, there can be considerable costs involved in expanding deposit and lending capacity that generally require a period of time to generate the necessary revenues to offset their costs, especially in areas in which we do not have an established presence and that require alternative delivery methods. Accordingly, any such business expansion can be expected to negatively impact our earnings for some period of time until certain economies of scale are reached. Our expenses could be further increased if we encounter delays in modernizing existing facilities, opening new branches or deploying new services.We may not be able to implement our expansion strategy, which may adversely affect our ability to maintain our historical earnings trends.Our expansion strategy focuses on organic growth, supplemented by strategic acquisitions and expansion of the Bank’s banking location network, or de novo branching. We may not be able to execute on aspects of our expansion strategy, which may impair our ability to sustain our historical rate of growth or prevent us from growing at all. More specifically, we may not be able to generate sufficient new loans and deposits within acceptable risk and expense tolerances, obtain the personnel or funding necessary for additional growth or find suitable acquisition candidates. Various factors, such as economic conditions and competition with other financial institutions, may impede or prohibit the growth of our operations, the opening of new banking locations and the consummation of acquisitions. Further, we may be unable to attract and retain experienced bankers, which could adversely affect our growth. The success of our strategy also depends on our ability to effectively manage growth, which is dependent upon a number of factors, including our ability to adapt our credit, operational, technology and governance infrastructure to accommodate expanded operations. If we fail to implement one or more aspects of our strategy, we may be unable to maintain our historical earnings trends, which could have a material adverse effect on our business, financial condition and results of operations.We are subject to certain risks in connection with growing through mergers and acquisitions.It is possible that we could acquire other banking institutions, other financial services companies or branches of banks in the future. Acquisitions typically involve the payment of a premium over book and trading values and, therefore, may result in the dilution of our tangible book value per share and/or our earnings per share. Our ability to engage in future mergers and acquisitions depends on various factors, including: (1) our ability to identify suitable merger partners and acquisition opportunities; (2) our ability to finance and complete transactions on acceptable terms and at acceptable prices; and (3) our ability to receive the necessary regulatory and, when required, shareholder approvals. Our inability to engage in an acquisition or merger for any of these reasons could have an adverse impact on the implementation of our business strategies. Furthermore, mergers and acquisitions involve a number of risks and challenges, including our ability to achieve planned synergies and to integrate the branches and operations we acquire, and the internal controls and regulatory functions into our current operations, as well as the diversion of management’s attention from existing operations, which may adversely affect our ability to successfully conduct our business and negatively impact our financial results.We rely heavily on our executive management team and other key employees, and we could be adversely affected by the unexpected loss of their services.Our success depends in large part on the performance of our executive management team and other key personnel, as well as on our ability to attract, motivate and retain highly qualified senior and middle management and other skilled employees. Competition for qualified employees is intense, and the process of locating key personnel with the combination of skills, attributes and business relationships required to execute our business plan may be lengthy. We may not be successful in retaining our key employees, and the unexpected loss of services of one or more of our key personnel could have an adverse effect on our business because of their skills, knowledge of and business relationships within our primary markets, years of industry experience and the difficulty of promptly finding qualified replacement personnel. If the services of any of our key personnel should become unavailable for any reason, we may not be able to identify and hire qualified persons on terms acceptable to us, or at all, which could have a material adverse effect on our business, financial condition, results of operations and future prospects.a materialan adverse effect on our business, financial condition and results of operations.We are subject to interest rate risk and fluctuations in interest ratesour earnings.The majoritythe market price of our banking assets and liabilities are monetarysecurities.nature and subject to risk from changes inthe future through equity offerings. The issuance of additional shares of common stock or the issuance of convertible securities would dilute the ownership interest rates. Like most financial institutions, our earnings are significantly dependent on our net interest income, the principal component of our earnings, which is the difference between interest earned by us from our interest-earning assets, such as loans and investment securities, and interest paid by us on our interest-bearing liabilities, such as deposits and borrowings. We expect that we will periodically experience “gaps” in the interest rate sensitivitiesexisting common shareholders. The market price of our assets and liabilities, meaning that either our interest-bearing liabilities will be more sensitive tochanges in market interest rates than our interest-earning assets, or vice versa. In either event, if market interest rates should move contrary to our position, this “gap” will negatively impact our earnings. The impact on earnings is more adverse when the slope of the yield curve flattens, that is, when short-term interest rates increase more than long-term interest rates or when long-term interest rates decrease more than short-term interest rates. Many factors impact interest rates, including governmental monetary policies, inflation, recession, changes in unemployment, the money supply and international economic weakness and disorder and instability in domestic and foreign financial markets. Our interest rate sensitivity profile was asset sensitive as of December 31, 2018, meaning that we estimate our net interest income would increase more from rising interest rates than from falling interest rates.Interest rate increases often result in larger payment requirements for our borrowers, which increases the potential for default andcommon stock could result in a decrease in the demand for loans. At the same time, the marketability of the property securing a loan may be adversely affected by any reduced demand resulting from higher interest rates. In a declining interest rate environment, there may be an increase in prepayments on loans as borrowers refinance their loans at lower rates. In addition, in a low interest rate environment, loan customers often pursue long-term fixed rate credits, which could adversely affect our earnings and net interest margin if rates increase. Changes in interest rates also can affect the value of loans, securities and other assets. An increase in interest rates that adversely affects the ability of borrowers to pay the principal or interest on loans may lead to an increase in nonperforming assets and a reduction of income recognized, which could have a material adverse effect on our results of operations and cash flows. Further, when we place a loan on nonaccrual status, we reverse any accrued but unpaid interest receivable, which decreases interest income. At the same time, we continue to have a cost to fund the loan, which is reflected as interest expense, without any interest income to offset the associated funding expense. Thus, an increase in the amount of nonperforming assets would have an adverse impact on net interest income. If short-term interest rates continue to remain at their historically low levels for a prolonged period, and assuming longer-term interest rates fall further, we could experience net interest margin compression as our interest-earning assets would continue to reprice downward while our interest-bearing liability rates could fail to decline in tandem. Such an occurrence would have an adverse effect on our net interest income and could have a material adverse effect on our business, financial condition and results of operations.We may be adversely affected by recent changes in U.S. tax laws and regulations.Changes in tax laws contained in the Tax Cuts and Jobs Act, which was enacted in December 2017, include a number of provisions that will have an impact on the banking industry, borrowers and the market for residential real estate. Included in this legislation was a reduction of the corporate income tax rate from 35% to 21%. In addition, other changes included: (i) a lower limit on the deductibility of mortgage interest on single-family residential mortgage loans, (ii) the elimination of interest deductions for home equity loans, (iii) a limitation on the deductibility of business interest expense and (iv) a limitation on the deductibility of property taxes and state and local income taxes.Further changes in income tax laws could be enacted, or interpretations of existing income tax laws could change, causing an adverse effect on our financial condition or results of operations. Similarly, our accounting policies and methods are fundamental to how we report our financial condition and results of operations. Some of these policies require use of estimates and assumptions that may affect the value of our assets, liabilities, and financial results. Periodically, new accounting standards are issued or existing standards are revised, changing the methods for preparing our financial statements. These changes are not within our control and may significantly impact our financial condition and results of operations. We are dependent on our information technology and telecommunications systems and third-party service providers; systems failures, interruptions and cybersecurity breaches could have a material adverse effect on us.Our business is dependent on the successful and uninterrupted functioning of our information technology and telecommunications systems and third-party service providers. The failure of these systems, or the termination of a third-party software license or service agreement on which any of these systems is based, could interrupt our operations. Because our information technology and telecommunications systems interface with and depend on third-party systems, we could experience service denials if demand for such services exceeds capacity or such third-party systems fail or experience interruptions. If significant, sustained or repeated, a system failure or service denial could compromise our ability to operate effectively, damage our reputation, result in a loss of customer business, and/or subject us to additional regulatory scrutiny and possible financial liability, any of which could have a material adverse effect on us.Our third-party service providers may be vulnerable to unauthorized access, computer viruses, phishing schemes and other security breaches. We likely will expend additional resources to protect against the threat of such security breaches and computer viruses, or to alleviate problems caused by such security breaches or viruses. To the extent that the activities of our third-party service providers or the activities of our customers involve the storage and transmission of confidential information, security breaches and viruses could expose us to claims, regulatory scrutiny, litigation costs and other possible liabilities.Security breaches and cybersecurity threats could compromise our information and expose us to liability, which would cause our business and reputation to suffer.In the ordinary course of our business, we collect and store sensitive data, including our proprietary business information and that of our customers, suppliers and business partners, as well as personally identifiable information about our customers and employees. The secure processing, maintenance and transmission of this information is critical to our operations and business strategy. We, our customers, and other financial institutions with which we interact, are subject to ongoing, continuous attempts to penetrate key systems by individual hackers, organized criminals, and in some cases, state-sponsored organizations. While we have established policies and procedures to prevent or limit the impact of cyber-attacks, there can be no assurance that such events will not occur or will be adequately addressed if they do. In addition, we also outsource certain cybersecurity functions, such as penetration testing, to third-party service providers, and the failure of these service providers to adequately perform such functions could increase our exposure to security breaches and cybersecurity threats. Despite our security measures, our information technology and infrastructure may be vulnerable to attacks by hackers or breached due to employee error, malfeasance or other malicious code and cyber-attacks that could have an impact on information security. Any such breach or attacks could compromise our networks and the information stored there could be accessed, publicly disclosed, lost or stolen. Any such unauthorized access, disclosure or other loss of information could result in legal claims or proceedings, liability under laws that protect the privacy of personal information, and regulatory penalties; disrupt our operations and the services we provide to customers; damage our reputation; and cause a loss of confidence in our products and services, all of which could adversely affect our business, financial condition and earnings.We must keep pace with technological change to remain competitive.Financial products and services have become increasingly technology-driven. Our ability to meet the needs of our customers competitively, and in a cost-efficient manner, is dependent on the ability to keep pace with technological advances and to invest in new technology as it becomes available, as well as related essential personnel. In addition, technology has lowered barriers to entry into the financial services market and made it possible for financial technology companies and other non-bank entities to offer financial products and services traditionally provided by banks. The ability to keep pace with technological change is important, and the failure to do so, due to cost, proficiency or otherwise, could have a material adverse impact on our business and therefore on our financial condition and results of operations.Because the nature of the financial services business involves a high volume of transactions, we face significant operational risks.We rely on the ability of our employees and systems to process a high number of transactions. Operational risk is the risk of loss resulting from our operations, including but not limited to, the risk of fraud by employees or outside persons, the execution of unauthorized transactions by employees, errors relating to transaction processing and technology, breaches of our internal control system and compliance requirements, and business continuation and disaster recovery. Insurance coverage may not be available for such losses, or where available, such losses may exceed insurance limits. This risk of loss also includes the potential legal actions that could arise as a result of an operational deficiencyequity offering, as well as other sales of a large block of shares of our common stock or similar securities in the market after an equity offering, or the perception that such sales could occur. Both we and our regulators perform a variety of analyses of our assets, including thenoncompliance with applicable regulations, adverse business decisions or their implementation, and customer attrition due to potential negative publicity. Although our control testing has not identified any significant deficiencies in our internal control system, a breakdown in our internal control system, improper operation of our systems or improper employee actions could result in material financial loss to us, the imposition of regulatory action, and damage to our reputation.We are subject to laws regarding the privacy, information security and protection of personal information and any violation of these laws or another incident involving personal, confidential or proprietary information of individuals could damage our reputation and otherwise adversely affect our business, financial condition and earnings.Our business requires the collection and retention of large volumes of customer data, including personally identifiable information in various information systems that we maintain and in those maintained by third parties with whom we contract to provide data services. We also maintain important internal company data such as personally identifiable information about our employees and information relating to our operations. We are subject to complex and evolving laws and regulations governing the privacy and protection of personal information of individuals (including customers, employees, suppliers and other third parties). For example, our business is subject to the Gramm-Leach-Bliley Act which, among other things: (i) imposes certain limitations on our ability to share nonpublic personal information about our customers with nonaffiliated third parties; (ii) requires that we provide certain disclosures to customers about our information collection, sharing and security practices and afford customers the right to “opt out” of any information sharing by us with nonaffiliated third parties (with certain exceptions); and (iii) requires that we develop, implement and maintain a written comprehensive information security program containing appropriate safeguards based on our size and complexity, the nature and scope of our activities, and the sensitivity of customer information we process, as well as plans for responding to data security breaches. Various state and federal laws and regulations impose data security breach notification requirements with varying levels of individual, consumer, regulatory or law enforcement notification in certain circumstances in the event of a security breach. Ensuring that our collection, use, transfer and storage of personal information complies with all applicable laws and regulations can increase our costs.Furthermore, we may not be able to ensure that all of our clients, suppliers, counterparties and other third parties have appropriate controls in place to protect the confidentiality of the information that they exchange with us, particularly where such information is transmitted by electronic means. If personal, confidential or proprietary information of customers or others were to be mishandled or misused (in situations where, for example, such information was erroneously provided to parties who are not permitted to have the information, or where such information was intercepted or otherwise compromised by third parties),assessments we could be exposed to litigationdetermine, or regulatory sanctions under personal information laws and regulations. Concerns regarding the effectiveness of our measures to safeguard personal information, or even the perception that such measures are inadequate, could cause us to lose customers or potential customers for our products and services and thereby reduce our revenues. Accordingly, any failure or perceived failure to comply with applicable privacy or data protection laws and regulations may subject us to inquiries, examinations and investigations that could result in requirements to modify or cease certain operations or practices or in significant liabilities, fines or penalties, and could damage our reputation and otherwise adversely affect our business, financial condition and earnings.We are dependent on the use of data and modeling in our management’s decision-making, and faulty data or modeling approaches could negatively impact our decision-making ability or possibly subject us to regulatory scrutiny in the future.The use of statistical and quantitative models and other quantitative analyses is widespread in bank decision-making, and the employment of such analyses is becoming increasingly widespread in our operations. Liquidity stress testing, interest rate sensitivity analysis, and the identification of possible violations of anti-money laundering regulations are all examples of areas in which we are dependent on models and the data that underlies them. The use of statistical and quantitative models is also becoming more prevalent in regulatory compliance. While we are not currently subject to annual stress testing under the Dodd-Frank Wall Street Reform and Consumer Protection Act, or the Dodd-Frank Act, we anticipate that model-derived testing may become more extensively implemented by regulators in the future.We anticipate data-based modeling will penetrate further into bank decision-making, particularly risk management efforts, as the capacities developed to meet rigorous stress testing requirements are able to be employed more widely and in differing applications. While we believe these quantitative techniques and approaches improve our decision-making, they also create the possibility that faulty data or flawed quantitative approaches could negatively impact our decision-making ability or, if we become subject to regulatory stress testing in the future, adverse regulatory scrutiny. Further, because of the complexity inherent in these approaches, misunderstanding or misuse of their outputs could similarly result in suboptimal decision-making.We depend on the accuracy and completeness of information provided to us by our borrowers and counterparties and any misrepresented information could adversely affect our business, financial condition and earnings.In deciding whether to approve loans or to enter into other transactions with borrowers and counterparties, we rely on information furnished to us by, or on behalf of, borrowers and counterparties, including financial statements, credit reports and other financial information. We also rely on representations of borrowers and counterparties as to the accuracy and completeness of that information and, with respect to financial statements, on reports of independent auditors. If any of this information is intentionally or negligently misrepresented and such misrepresentation is not detected prior to loan funding, the value of the loan may be significantly lower than expected and we may be subject to regulatory action. Whether a misrepresentation is made by the loan applicant, another third party, or one of our employees, we generally bear the risk of loss associated with the misrepresentation. Our controls and processes may not have detected, or may not detect all, misrepresented information in our loan originations or from our business clients. Any such misrepresented information could adversely affect our business, financial condition and earnings.We are subject to certain operational risks, including, but not limited to, customer, employee or third-party fraud and data processing system failures and errors.Because we are a financial institution, employee errors and employee or customer misconduct could subject us in particular to financial losses or regulatory sanctions and seriously harm our reputation. Misconduct by our employees could include hiding unauthorized activities from us, improper or unauthorized activities on behalf of our customers or improper use of confidential information, each of which can be particularly damaging for financial institutions. It is not always possible to prevent employee errors and misconduct, and the precautions we take to prevent and detect this activity may not be effective in all cases. Employee errors could also subject us to financial claims for negligence.We maintain a system of internal controls to mitigate operational risks, including data processing system failures and errors and customer or employee fraud, as well as insurance coverage designed to protect us from material losses associated with these risks, including losses resulting from any associated business interruption. If our internal controls fail to prevent or detect an occurrence, or if any resulting loss is not insured or exceeds applicable insurance limits, it could adversely affect our business, financial condition and earnings.The building of market share through our branch office strategy, and our ability to achieve profitability on new branch offices, may increase our expenses and negatively affect our earnings.We believe there are branch expansion opportunities within our market area and adjacent markets and will seek to grow our deposit base by adding branches to our existing network. There are considerable costs involved in opening branch offices, especially in light of the capabilities needed to compete in today’s environment. Moreover, new branch offices generally require a period of time to generate sufficient revenues to offset their costs, especially in areas in which we do not have an established presence. Accordingly, new branch offices could negatively impact our earnings and may do so for some period of time. Our investments in products and services, and the related personnel required to implement new policies and procedures, take time to earn returns and can be expected to negatively impact our earnings for the foreseeable future. The profitability of our expansion strategy will depend on whether the income that we generate from the new branch offices will offset the increased expenses resulting from operating these branch offices.Strong competition within our market area could hurt our profits and slow growth.Our profitability depends upon our continued ability to compete successfully in our market area. We face intense competition both in making loans and attracting deposits. Our competitors for commercial real estate loans include other community banks and commercial lenders, some of which are larger than us and have greater resources and lending limits than we have and offer services that we do not provide. We face stiff competition for one-to-four family residential loans from other financial service providers, including large national residential lenders and local community banks. Other competitors for one-to-four family residential loans include credit unions and mortgage brokers which keep overhead costs and mortgage rates down by selling loans and not holding or servicing them. Price competition for loans and deposits might result in us earning less on our loans and paying more on our deposits, which reduces net interest income. We expect competition to remain strong in the future.The Washington State Department of Financial Institutions, or Washington DFI, recently entered into a multi-state agreement with six other states that is intended to streamline the licensing process for money service businesses, which include money transmitters and payment service providers. Increasing the relative ease of obtaining a license to operate a money service business within the state of Washington may encourage financial technology, or fintech, companies to offer services in the state, thereby increasing competition for such services.Negative public opinion regarding our company or failure to maintain our reputation in the communities we serve could adversely affect our business and prevent us from growing our business.As a community bank, our reputation within the communities we serve is critical to our success. We believe we have set ourselves apart from our competitors by building strong personal and professional relationships with our customers and being active members of the communities we serve. As such, we strive to enhance our reputation by recruiting, hiring and retaining employees who share our core values of being an integral part of the communities we serve and delivering superior service to our customers. If our reputation is negatively affected by the actions of our employees or otherwise, we may be less successful in attracting new talent and customers or may lose existing customers, and our business, financial condition and earnings could be adversely affected. Further, negative public opinion can expose us to litigation and regulatory action and delay and impede our efforts to implement our expansion strategy, which could further adversely affect our business, financial condition and earnings.We could recognize losses on investment securities held in our securities portfolio, particularly if interest rates increase or economic and market conditions deteriorate.While we attempt to invest a significant majority of our total assets in loans (our loan-to-asset ratio was 80.7% as of December 31, 2018), we invest a percentage of our total assets (4.0% as of December 31, 2018) in investment securities with the primary objectives of providing a source of liquidity and meeting pledging requirements. As of December 31, 2018, the fair value of our available for sale investment securities portfolio was $36.7 million, which included a net unrealized loss of $1.6 million. Factors beyond our control can significantly and adversely influence the fair value of securities in our portfolio. For example, fixed-rate securities are generally subject to decreases in market value when interest rates rise. Additional factors include, but are not limited to, rating agency downgrades of the securities, defaults by the issuer or individual borrowers with respect to the underlying securities, and instability in the credit markets. Any of the foregoing factors could cause other-than-temporary impairment in future periods and result in realized losses. The process for determining whether impairment is other-than-temporary usually requires difficult, subjective judgments about the future financial performance of the issuer and any collateral underlying the security in order to assess the probability of receiving all contractual principal and interest payments on the security. Although we have not recognized other-than-temporary impairment related to our investment portfolio as of December 31, 2018, changing economic and market conditions affecting interest rates, the financial condition of issuers of the securities and the performance of the underlying collateral, among other factors, may cause us to recognize losses in future periods, which could have a material adverse effect on our business, financial condition and results of operations.The accuracy of our financial statements and related disclosures could be affected if the judgments, assumptions or estimates used in our critical accounting policies are inaccurate.The preparation of financial statements and related disclosures in conformity with GAAP requires us to make judgments, assumptions and estimates that affect the amounts reported in our consolidated financial statements and related notes to those financial statements. Our critical accounting policies, which are included in the section entitled “Management’s Discussion and Analysis of Financial Condition and Results of Operations” in this report, describe those significant accounting policies and methods used in the preparation of our consolidated financial statements that we consider “critical” because they require judgments, assumptions and estimates that materially affect our consolidated financial statements and related disclosures. As a result, if future events or regulatory views concerning such analysis differ significantly from the judgments, assumptions and estimates in our critical accounting policies, those events or assumptions could have a material impact on our consolidated financial statements and related disclosures, in each case resulting in our needing to revise or restate prior period financial statements, cause damage to our reputation and the price of our common stock, and adversely affect our business, financial condition and earnings.We expect that the implementation of a new accounting standard could require us, to increase our allowance for loan losses and may have a material adverse effect on our financial condition and results of operations.The FASB, has adopted a new accounting standard that will be effective for our first fiscal year after December 15, 2019. This standard, referred to as Current Expected Credit Loss, or CECL, will require financial institutions to determine periodic estimates of lifetime expected credit losses on loans, and provide for the expected credit losses as allowances for loan losses. This will change the current method of providing allowances for loan losses that are probable, which we expect could require us to increase our allowance for loan losses, and will likely greatly increase the data we would need to collect and review to determine the appropriate level of the allowance for loan losses. Any increase in our allowance for loan losses, or expenses incurred to determine the appropriate level of the allowance for loan losses, may have a material adverse effect on our financial condition and results of operations.We may be subject to environmental liabilities in connection with the real properties we own and the foreclosure on real estate assets securing our loan portfolio.In the course of our business, we may purchase real estate in connection with our acquisition and expansion efforts, or we may foreclose on and take title to real estate or otherwise be deemed to be in control of property that serves as collateral on loans we make. As a result, we could be subject to environmental liabilities with respect to those properties. We may be held liable to a governmental entity or to third parties for property damage, personal injury, investigation and clean-up costs incurred by these parties in connection with environmental contamination, or we may be required to investigate or clean up hazardous or toxic substances or chemical releases at a property. The costs associated with investigation or remediation activities could be substantial. In addition, if we are the owner or former owner of a contaminated site, we may be subject to common law claims by third parties based on damages and costs resulting from environmental contamination emanating from the property.The cost of removal or abatement may substantially exceed the value of the affected properties or the loans secured by those properties, we may not have adequate remedies against the prior owners or other responsible parties and we may not be able to resell the affected properties either before or after completion of any such removal or abatement procedures. If material environmental problems are discovered before foreclosure, we generally will not foreclose on the related collateral or will transfer ownership of the loan to a subsidiary. It should be noted, however, that the transfer of the property or loans to a subsidiary may not protect us from environmental liability. Furthermore, despite these actions on our part, the value of the property as collateral will generally be substantially reduced or we may elect not to foreclose on the property and, as a result, we may suffer a loss upon collection of the loan. Any significant environmental liabilities could have a material adverse effect on our business, financial condition and results of operations.examination.examination at both the federal and state level. The Bank’s deposits are insured in whole or in part by the FDIC. The Bank is subject to regulation by the Federal Reserve and the Washington DFI. The Federal Reserve also has supervisory authority over the Company. Such regulation, supervision and examination govern the activities in which we may engage, and are intended primarily for the protection of the deposit insurance fund and the Bank’s depositors, rather than for shareholders.In 20102011, in responseregulations can be difficult and costly, and changes to the financial crisislaws and recession that began in 2008,regulations can impose additional compliance costs. The Dodd-Frank Act, which imposed significant regulatory and legislativecompliance changes resulted in broad reform and increased regulation affecting financial institutions. The Dodd-Frank Act has created a significant shift in the wayon financial institutions, operate. The Dodd-Frank Act also created the CFPB, to implement consumer protection and fair lending laws, a function that was formerly performed by the depository institution regulators. The Dodd-Frank Act contains various provisions designed to enhance the regulation of depository institutions and prevent the recurrence of a financial crisis such as that which occurred in 2008 and 2009. The Dodd-Frank Act has had and may continue to have a material impact on our operations, particularly through increased regulatory burden and compliance costs. On May 24, 2018, the EGRRCPA, became law. Among other things, the EGRRCPA changes certain of the regulatory requirements of the Dodd-Frank Act and includes provisions intended to relieve the regulatory burden on community banks. We cannot currently predict the impactis an example of this legislation on us.type of federal law. Any future legislative changes could have a material impact on our profitability, the value of assets held for investment or the value of collateral for loans. Future legislative changes could also require changes to business practices and potentially expose us to additional costs, liabilities, enforcement action and reputational risk.1:1. Business—SupervisionRegulation and Regulation—Supervision—Bank Regulation and Supervision—Capital Adequacy” for a discussion of regulatory capital requirements.earnings and results of operations as well as our reputation could be adversely affected.intend tomay complement and expand our business by growing our BaaS segment, expanding the Bank’s banking location network, or de novo branching, and pursuing strategic acquisitions of financial institutions and other complementary businesses, and expansion of the Bank’s banking location network, or de novo branching.businesses. Generally, we must receive federal and state regulatory approval before we can acquire a depository institution or related business insured by the FDIC or before we open a de novo branch. In determining whether to approve a proposed acquisition, federal banking regulators will consider, among other factors, the effect of the acquisition on competition, our financial condition, our future prospects, and the impact of the proposal on U.S. financial stability. The regulators also review current and projected capital ratios and levels, the competence, experience and integrity of management and its record of compliance with laws and regulations, the convenience and needs of the communities to be served (including the acquiring institution’s record of compliance under the CRA) and the effectiveness of the acquiring institution in combating money laundering activities. Such regulatory approvals may not be granted on terms that are acceptable to us, or at all.or the (“USA PATRIOT Act,Act”), and other laws and regulations require financial institutions, among other duties, to institute and maintain an effective anti-money laundering program and file suspicious activity and currency transaction reports as appropriate. The Financial Crimes Enforcement Network, established by the U.S. Department of the Treasury, or the Treasury Department to administer the Bank Secrecy Act, has authority to impose significant civil money penalties for violations of these requirements and has recently engaged in coordinated enforcement efforts with the individual federal banking regulators, as well as the U.S. Department of Justice, Drug Enforcement Administration and the Internal Revenue Service. There is also increased scrutiny of compliance with the sanctions programs and rules administered and enforced by the Treasury Department’s Office of Foreign Assets Control.Federal Reserve determines that the Bank needs to improve its performance or is in substantial non-compliance with CRA requirements,performs unsatisfactorily, various adverse regulatory consequences may ensue. ensue, including an inability to secure regulatory approval of expansionary transactions or new branches. Additionally, on October 24, 2023, the FDIC, the Federal Reserve and the OCC released a final rule revising the framework that they use to evaluate banks’ records of community reinvestment under the CRA that may make it more challenging and/or costly for insured depository institutions to achieve an “Outstanding” or “Satisfactory” CRA rating, which could negatively impact our ability to obtain regulatory approval for an acquisition.ongoing broad rulemaking powers of the CFPB have potential to have a significant impact on the operations of financial institutions offering consumer financial products or services.the CRA, fair lending laws or regulations, or other consumer lending laws and regulations could result in a wide variety of sanctions, including damages and civil money penalties, injunctive relief, restrictions on mergers and acquisitions activity, restrictions on expansion, and restrictions on entering new business lines. Private parties may also have the ability to challenge an institution’s performance under fair lending laws in private class action litigation. Such actions could have a materialan adverse effect on our business, financial condition and results of operations.loanCCBX partners service most loans originated through them. Loan servicing is subject to extensive regulation by federal, state and local governmental authorities, as well as various laws and judicial and administrative decisions imposing requirements and restrictions on those activities. The volume of new or modified laws and regulations has increased in recent years and, in addition, some individual municipalities have begun to enact laws that restrict loan servicing activities, including delaying or temporarily preventing foreclosures or forcing the modification of certain mortgages. If regulators impose new or more restrictive requirements, we may incur additional significant costs to comply with such requirements, which may further adversely affect us. In addition, were we to be subject to regulatory investigation or regulatory action regarding our loan modification and foreclosure practices, our business, financial condition and earningsresults of operations could be adversely affected.materially and adversely affect us.1:1. Business—SupervisionRegulation and Regulation—Supervision—Bank Regulation and Supervision—Prompt Corrective Action.” Accordingly, we could be required to provide financial assistance to the Bank if it experiences financial distress.earnings.2018.2023 for ourthreefive of our other branch offices and lease the remainder of our branch offices. The leases, excluding renewal periods, on our branch offices expire in 20212024 through 2029.2044. We believe that these facilities and additional or alternative space available to us are adequate to meet our needs for the foreseeable future.earnings.December 31, 2018,March 7, 2024, there were 439279 holders of record of the Company’s common stock.1:1. Business—Supervision and Regulation—Bank Regulation and Supervision—Payment of Bank Holding Company Regulation—Dividends.” The present and future dividend policy of the Bank is subject to the discretion of its board of directors. The Bank is not obligated to pay us dividends.provided by SNL Financial comparesshows the cumulativefive-year comparison of the total return to shareholders of the Company’s common stock withas compared to the cumulative total returnreturns of the Nasdaq CompositeS&P United States SmallCap Banks (Industry Group) Index and S&P 600 Small Cap during the SNL Bank Index. The graph assumes $100 was invested on July 18,five-year period beginning December 31, 2018 the first day of tradingand ending December 31, 2023. Total return includes appreciation or depreciation in market value of the Company’s common stock. Cumulative total returnstock as well as actual cash and stock dividends paid to common shareholders. The graph assumes reinvestmentthe value of the investment in Company’s common stock and each index was $100 on December 31, 2018, and all dividends. dividends were reinvested. There can be no assurance that our future stock performance will be the same or similar to the historical stock performance shown in the graph below. We neither make nor endorse any predictions as to stock performance.
2018 2019 2020 2021 2022 2023 Coastal Financial Corporation $ 100.00 $ 108.14 $ 137.89 $ 332.37 $ 312.02 $ 291.60 S&P 600 Small Cap 100.00 122.78 136.64 173.29 145.39 168.73 S&P United States SmallCap Banks (Industry Group) Index 100.00 125.46 113.94 158.62 139.85 140.55 Source: S&P Global Market Intelligence performance graph is being furnished solelyinformation set forth under the heading “Performance Graph” shall not be deemed to accompany this report pursuantbe “soliciting material” or to Item 201(e) of Regulation S-K, and is not being filed for purposesbe “filed” with the SEC or subject to the liabilities of Section 18 of the Securities Exchange Act, of 1934,except to the extent that the Company specifically requests that such information to be treated as amended, and is notsoliciting material or specifically to be incorporated by reference into anya filing under the Securities Act of 1933 or the Company, whether made before or after the date hereof, regardless of any general incorporation language in such filing.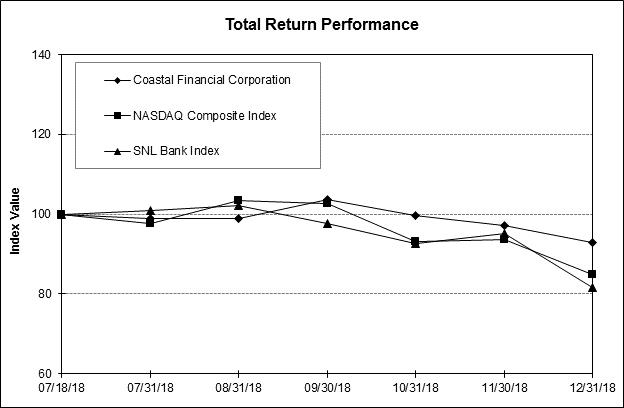
2018.Item 6.Selected Financial Data The following table sets forth selected historical consolidated financial data as of and for the years ended December 31, 2018, 2017, 2016, 2015 and 2014. The selected balance sheet data as of December 31, 2018 and2017, and the selected statement of income data for the years ended December 31, 2018 and 2017, have been derived from our audited consolidated financial statements included elsewhere in this report. The selected balance sheet data as of December 31, 2016, 2015 and 2014 and the selected statement of income data for the years ended December 31, 2016, 2015 and 2014 have been derived from our audited consolidated financial statements that are not included in this report. Our historical results are not necessarily indicative of any future performance. The information presented in the following table has been adjusted to give effect to a one-for-five reverse stock split of our common shares completed effective May 4, 2018. The effect of the reverse stock split on outstanding shares and per share figures has been retroactively applied to all periods presented.The selected historical consolidated financial data presented below contains financial measures that are not presented in accordance with accounting principles generally accepted in the United States and have not been audited. See “GAAP Reconciliation and Management Explanation of Non-GAAP Financial Measures.”GAAP Reconciliation and Management Explanation of Non-GAAP Financial MeasuresSome of the financial measures included in this report are not measures of financial performance recognized by GAAP. Our management uses the non-GAAP financial measures set forth below in its analysis of our performance.“Adjusted net income” is a non-GAAP measure defined as net income increased by the additional income tax expense that resulted from the revaluation of deferred tax assets as a result of the reduction in the corporate income tax rate under the recently enacted Tax Cuts and Jobs Act. The most directly comparable GAAP measure is net income.“Adjusted earnings per share” is a non-GAAP measure defined as net income, plus additional income tax expense, divided by weighted average outstanding shares (diluted). The most directly comparable GAAP measure is earnings per share.“Pre-tax, pre-provision ROAA” is a non-GAAP measure defined as net income increased by provision for income tax and provision for loan losses, divided by average assets. The most directly comparable GAAP measure is return on average assets.•“Adjusted effective tax rate” is a non-GAAP measure defined as provision for income taxes, less additional income tax expense, divided income before provision for income taxes.“Adjusted return on average assets” is a non-GAAP measure defined as net income, plus additional income tax expense, divided by average assets. The most directly comparable GAAP measure is return on average assets.“Adjusted return on average shareholders’ equity” is a non-GAAP measure defined as net income, plus additional income tax expense, divided by average shareholders’ equity. The most directly comparable GAAP measure is return on average shareholders’ equity.We believe that these non-GAAP financial measures provide information that is important to investors and that is useful in understanding our results of operations. However, these non-GAAP financial measures are supplemental and are not a substitute for an analysis based on GAAP measures. As other companies may use different calculations for these measures, this presentation may not be comparable to other similarly titled measures by other companies.(1)Share and per share information has been adjusted to give effect to a one-for-five reverse stock split of our common shares completed effective May 4, 2018.ofof Financial Condition and Results of Operationssubsidiary,subsidiaries, Coastal Community Bank.Bank (“Bank”) and Arlington Olympic LLC . We are headquartered in Everett, Washington, which by population is the largest city in, and the county seat of, Snohomish County. WeOur business is conducted through three reportable segments: The community bank, CCBX and treasury & administration. The community bank segment includes all community banking activities, with a primary focus on providing a wide range of banking products and services to consumers and small to medium sized businesses in the broader Puget Sound region in the state of Washington.Washington and through the Internet and our mobile banking application. We currently operate 14 full-service banking locations, 1112 of which are located in Snohomish County, where we are the largest community bank by deposit market share, and threetwo of which are located in neighboring counties (one in King County and twoone in Island County). The CCBX segment provides banking as a service (“BaaS”) that allows our broker-dealer and digital financial service partners to offer their customers banking services. The CCBX segment has 21 partners as of December 31, 2023. The treasury & administration segment includes investments, debt and other reporting items that are not specific to the community bank or CCBX segments. The Bank’s deposits are insured in whole or in part by the Federal Deposit Insurance Corporation (“FDIC”). The Bank is subject to regulation by the Federal Reserve and the Washington State Department of Financial Institutions Division of Banks. The Federal Reserve also has supervisory authority over the Company.2018,2023, we had total assets of $952.1 million,$3.75 billion, total gross loans receivable of $767.9 million,$3.03 billion, total deposits of $803.6 million$3.36 billion and total shareholders’ equity of $109.2$295.0 million.Coastal Communitythe Bank, the discussion and analysis relate to activities primarily conducted by the Bank.As a bank holding company that operates through one segment, community banking, we This discussion and analysis should be read in conjunction with the audited consolidated financial statements and the accompanying notes presented elsewhere in this Annual Report on Form 10-K.investments.CCBX revenue from BaaS fee income and interest on loans. Our primary source of funding for our loans is commercial and retail deposits.deposits from our customer relationships and from our partner deposit relationships. We place secondary reliance on wholesale funding, primarily borrowings from the Federal Home Loan Bank (“FHLB”). Less commonly used sources of funding include borrowings from the Federal Reserve System (“Federal Reserve”) discount window, draws on established federal funds lines from unaffiliated commercial banks, brokered funds, which allows us to obtain deposits from sources that do not have a relationship with the Bank and can be obtained through certificate of deposit listing services, via the internet or FHLB.through other advertising methods, or a one-way buy through an insured cash sweep (“ICS”) account, which allows us to obtain funds from other institutions that have deposited funds through ICS. Our largest expenses are provision for credit losses - loans, BaaS loan expense, BaaS fraud expense, salaries and related employee benefits, occupancy, interest on deposits and borrowings, occupancy expense, legal and professional expenses and data processing, and provision for loan losses.processing. Our principal lending products are commercial real estate loans, consumer loans, residential real estate, commercial and industrial loans and construction, land and land development loans.lesserJuly 2023 interagency proposal to revise the capital framework applicable to banking organizations with total assets of $100 billion or more or with significant trading activity, an August 2023 FDIC proposal to require covered insured depository institutions with total assets of $50 billion or more to develop and submit resolution plans, and an August 2023 interagency proposal to require bank holding companies with total assets of $100 billion or more to issue and maintain minimum amounts of long-term debt.residential real estateof final actions to be taken by the federal banking agencies in responses to these bank failures, including the potential changes discussed by the Federal Reserve Vice Chair or highlighted in the Federal Reserve and FDIC reports, remain unclear.consumer loans.assets.assets for the community bank. Through our thorough underwriting process, we strive to originate quality loans that will maintain and enhance the overall credit quality of our loan portfolio, and through our careful monitoring of our community bank loan portfolio and prompt attention to delinquencies, we seek to minimize the impact of problem loans. However, credit trends in the markets in which we operate are largely impacted by economic conditions beyond our control and can adversely impact our financial condition. We originate loans through our CCBX partners and while these loans will have higher levels of charge-offs and nonperforming assets, agreements with our CCBX partners provide for a credit enhancement which protects the Bank by absorbing incurred losses. If our partners are unable to fulfill their contracted obligations then the Bank would be exposed to additional credit losses as a result of this counterparty risk. Management regularly evaluates and manages this counterparty risk. The Company is responsible for credit losses on approximately 10% of a $288.1 million CCBX loan portfolio. At December 31, 2023, 10% of this portfolio represented $29.1 million in loans.OursalariesBaaS loan and employee benefits, which consist primarily of salaries and wages paid to our employees, payroll taxes, and expenses for health insurance, retirement plans and other employee benefits.fraud expense. Other significant operating expenses include salaries and employee benefits, occupancy expense, legal and professional expenses, data processing expense, director and staff expense and marketing expense, and legal and professional fees.expense. Our operating efficiency, as measured by our efficiency ratio, has gradually improved primarily because the growth of our deposits and loans has enabled our net interest income and noninterest income to outpace the growth of our expenses. When we make substantial investments in the infrastructure of new segments, open new branches or make substantial investments to increase our operating capacity, our operating efficiency decreases until we generate enough revenue growth to offset the increased costs however, prior to making such investments, we focus on how best and most expediently we can achieve the revenue growth necessary to offset the costs of these investments or new branches.2018,2023, Compared to Year Ended December 31, 20172022. Net income for the year ended December 31, 2018,2023 was $9.7$44.6 million, or $0.91$3.27 per diluted share, compared to $5.4$40.6 million, or $0.59$3.01 per diluted share, for the year ended December 31, 2017.2022. The increase in net income over the prior year was attributable to a $5.6$67.0 million increase in net interest income, $1.3$82.5 million increase in noninterest income and $2.2 million decrease in the provision for income taxes, as a result of the reduction in the corporate income tax rate under the Tax Cuts and Jobs Act, which decreased tax expense in 2018, and as a result of the revaluation of deferred tax assets under the Tax Cuts and Jobs Act, increased tax expense in 2017. See “Item 6—Selected Financial Data—GAAP Reconciliation and Management Explanation of Non-GAAP Financial Measures.” These increases in net income were partially offset by $1.0a $104.9 million increase in interest expense, $956,000 increase in the provision for loancredit losses - loans and $3.8a $38.0 million increase in noninterest expense.2017,2023, Compared to Year Ended December 31, 2016. Net income for the year ended December 31, 2017, was $5.4 million, or $0.59 per diluted share, compared to $5.0 million, or $0.54 per diluted share, for the year ended December 31, 2016. Net income for 2017 included the impact of $1.3 million in additional income tax expense that resulted from the revaluation of deferred tax assets as a result of the reduction in the corporate income tax rate under the Tax Cuts and Jobs Act. Adjusted net income, which excludes the effect of the additional income tax expense, for the year ended December 31, 2017, was $6.7 million, or $0.73 per diluted share. See “Item 6—Selected Financial Data—GAAP Reconciliation and Management Explanation of Non-GAAP Financial Measures.” The increase in net income over the prior year was attributable to a $3.3 million increase in net interest income and a $1.0 million decrease in the provision for loan losses, which were partially offset by an $823,000 decrease in noninterest income and an $895,000 increase in noninterest expense.Net Interest IncomeYear Ended December 31, 2018, Compared to Year Ended December 31, 201720222018,2023 was $34.8$238.7 million, compared to $29.2$171.8 million for the year ended December 31, 2017,2022, an increase of $5.6$67.0 million, or 19.2%39.0%. Yield on loans receivable was 10.60% for the year ended December 31, 2023, compared to 8.12% for the year ended December 31, 2022. The increase in net interest income consisted of a $6.6 million, or 20.6%, increase in interest income offset by a $1.0 million, or 36.6%, increase in interest expense.Thecompared to the year ended December 31, 2022 was largely related to increased yield on loans from growth in higher yielding CCBX and community bank loans and interest income was primarily attributable to a $86.8 million, or 14.0%, increase in averagerate increases on variable rate and new loans. Average loans outstandingreceivable for the year ended December 31, 2018,2023 was $2.94 billion, compared to the prior year, combined with a 20 basis point increase in the yield on total loans. The increase in average loans outstanding was largely due to organic growth with a continued focus on actively calling on new customers and deepening relationships with existing borrowers. Also contributing to the increase in 2018 was $46.7 million in purchased loans during 2018, which included $14.1 million in purchased pools and $32.7 million in purchased participations. The hiring of additional lending teams and lenders also contributed to loan growth, as new lenders were able to transition many of their existing customers and pending transactions to the Bank. The increase in the yield on loans was largely due to higher prepayment penalties and deferred fees recognized on loans paid off. Additionally, the composition of the loan portfolio changed slightly to loans that earn higher rates and higher fees at a quicker rate, and there were increases in average loan yields overall. The increase in interest expense$2.26 billion for the year ended December 31, 2018, was primarily related to a $46.6 million, or 10.8%, increase in average interest-bearing deposits over the prior year. The majority of this increase is attributable to growth in core deposit accounts, which we define as deposits excluding all brokered2022.time deposits. Noninterest bearing deposits (such as demand or checking accounts) grew $51.2 million or 21.1%, in 2018. Savings, interest bearing checking, and money market accounts grew $42.8 million, or 11.5%, in 2018, while customer time deposits grew $6.4 million, or 7.1%. We do not regularly advertise time deposit rates or money market rates, although we occasionally advertise promotional rates in targeted portions of our market area. Our branch managers, business development officers, and lenders collaborate to provide consistent and coordinated customer service and to seek deposits from new and existing customers.For the year ended December 31, 2018, net interest margin and net interest spread were 4.24% and 3.92%, respectively, compared to 4.08% and 3.83% for the year ended December 31, 2017.Year Ended December 31, 2017, Compared to Year Ended December 31, 2016. Net interest income for the year ended December 31, 2017, was $29.2 million compared to $26.0fees on loans totaled $311.4 million for the year ended December 31, 2016, an increase of $3.22023 compared to $183.4 million or 12.3%. The increase in net interest income consisted of a $3.7 million, or 12.8%, increase in interest income offset by a $352,000, or 14.0%, increase in interest expense.The growth in interest income was primarily attributable to a $84.3 million, or 15.8%, increase in average loans outstanding for the year ended December 31, 2017, compared to the prior year, partially offset by an 18 basis point decrease in the yield on total loans.2022. The increase in average loans outstanding was primarily due to our dual strategies of focusing on deepening relationships with existing borrowers and actively calling on new customers. The hiring of additional lenders also contributed to loan growth, as new lenders were able to transition many of their existing customers and pending transactions to the Bank. The decline in the yield on total loans reflects the competitive nature of the markets in which we operate, as well as the decline in interest income on our construction, land, and land development loans, which is one of our highest yielding loan categories. In 2017, the robust real estate market in the Puget Sound region resulted in newly constructed homes selling quickly, enabling builders to repay their loans more quickly and resulting in our maintaining a lower balance of construction and development loans.The$128.1 million increase in interest expenseand fees on loans for the year ended December 31, 2017, was primarily related2023, compared to a $47.1 million, or 12.2%, increase in average interest-bearing deposits over the prior year. The majority of this increase is attributable to growth in core deposit accounts, which we define as deposits excluding all time deposits. Noninterest bearing deposits (such as demand or checking accounts) grew $18.4 million, or 8.2%, in 2017. Savings, interest bearing checking, and money market accounts grew $22.7 million, or 6.5%, in 2017, while customer time deposits grew $13.5 million, or 17.5%. We do not regularly advertise time deposit rates or money market rates, although we occasionally advertise promotional rates in targeted portions of our market area. Our branch managers, business development officers, and lenders collaborate to provide consistent and coordinated customer service and to seek deposits from new and existing customers.For the year ended December 31, 2017, net2022, was largely due to increased yield on loans from growth in higher yielding CCBX and community bank loans and an overall increase in interest margin and net interest spread were 4.08% and 3.83%rates. Loan growth of $398.8 million, or 15.2%, respectively, compared to 4.13% and 3.90% for the year ended December 31, 2016.For the Year Ended December 31, 2023 December 31, 2022 December 31, 2021 (unaudited) Yield on
LoansCost of
DepositsYield on
LoansCost of
DepositsYield on
LoansCost of
DepositsCommunity Bank 6.20% 1.14% 5.32% 0.18% 4.90% 0.14% 16.89% 4.55% 13.85% 1.57% 4.46% 0.03% Consolidated 10.60% 2.87% 8.12% 0.71% 4.86% 0.12% For the Year Ended December 31, 2023 December 31, 2022 December 31, 2021 (dollars in thousands; unaudited) Income / Expense Income / expense divided by average CCBX loans Income / Expense Income / expense divided by average CCBX loans Income / Expense Income / expense divided by average CCBX loans BaaS loan interest income $ 204,458 16.89 % $ 102,808 13.85 % $ 6,532 4.46 % Less: BaaS loan expense 86,900 7.18 % 53,294 7.18 % 2,976 2.03 % $ 117,558 9.71 % $ 49,514 6.67 % $ 3,556 2.43 % $ 1,210,413 $ 742,392 $ 146,304 $1,288,000$4.4 million and $542,000 $3.2 millionfor the years ended December 31, 20182023 and 2017,2022, respectively. For the years ended December 31, 20182023 and 2017,2022, the amount of interest income not recognized on nonaccrual loans was not material.Average Balance Sheets
For the Year Ended December 31,2023 2022 2021 (dollars in thousands) Average
BalanceInterest &
DividendsAverage
BalanceInterest &
DividendsAverage
BalanceInterest &
DividendsYield /
CostAssets Interest earning assets: Interest earning deposits with
other banks$ 295,808 $ 15,346 5.19 % $ 515,967 $ 6,728 1.30 % $ 402,081 $ 608 0.15 % 100,260 2,158 2.15 91,970 1,710 1.86 27,908 49 0.18 19,918 1,039 5.22 1,266 35 2.76 2,137 30 1.40 Other investments 11,512 387 3.36 10,146 345 3.40 7,052 284 4.03 2,936,908 311,441 10.60 2,257,787 183,352 8.12 1,688,925 82,112 4.86 Total interest earning assets 3,364,406 330,371 9.82 2,877,136 192,170 6.68 2,128,103 83,083 3.90 Noninterest earning assets: Allowance for credit losses (91,194) (46,769) (19,870) Other noninterest earning assets 198,071 119,817 74,088 Total assets $ 3,471,283 $ 2,950,184 $ 2,182,321 Liabilities and Shareholders’ Equity Interest bearing liabilities: Interest bearing deposits $ 2,395,012 $ 89,000 3.72 % $ 1,724,020 $ 19,004 1.10 % $ 910,106 $ 2,327 0.26 % PPPLF borrowings — — — — — — 68,699 240 0.35 FHLB advances and borrowings — — — 6,029 69 1.14 24,999 284 1.14 Subordinated debt 44,066 2,373 5.39 27,626 1,179 4.27 15,379 711 4.62 Junior subordinated debentures 3,589 271 7.55 3,587 143 3.99 3,585 84 2.34 Total interest bearing liabilities 2,442,667 91,644 3.75 1,761,262 20,395 1.16 1,022,768 3,646 0.36 Noninterest bearing deposits 707,641 942,087 989,945 Other liabilities 49,271 24,097 12,926 Total shareholders' equity 271,704 222,738 156,682 Total liabilities and shareholders' equity $ 3,471,283 $ 2,950,184 $ 2,182,321 Net interest income $ 238,727 $ 171,775 $ 79,437 Interest rate spread 6.07 % 5.52 % 3.54 % 7.10 % 5.97 % 3.73 % For the Year Ended December 31, 2023 December 31, 2022 December 31, 2021 (dollars in thousands; unaudited) Average
BalanceInterest &
DividendsYield /
CostAverage
BalanceInterest &
DividendsYield /
CostAverage
BalanceInterest &
DividendsYield /
CostCommunity Bank Assets Interest earning assets: $ 1,726,495 $ 106,983 6.20 % $ 1,515,395 $ 80,544 5.32 % $ 1,542,621 $ 75,580 4.90 % — — — 123,156 796 0.65 n/a n/a n/a Total interest earning assets 1,726,495 106,983 6.20 1,638,551 81,340 4.96 1,542,621 75,580 4.90 Liabilities Interest bearing liabilities: Interest bearing deposits 900,516 17,354 1.93 905,447 2,896 0.32 877,389 2,228 0.25 198,176 10,404 5.25 — — — n/a n/a n/a Total interest bearing liabilities 1,098,692 27,758 2.53 905,447 2,896 0.32 877,389 2,228 0.25 Noninterest bearing deposits 627,803 733,104 674,509 Net interest income $ 79,225 $ 78,444 $ 73,352 4.59 % 4.79 % 4.76 % CCBX Assets Interest earning assets: $ 1,210,413 $ 204,458 16.89 % $ 742,392 $ 102,808 13.85 % $ 146,304 $ 6,532 4.46 % 363,921 19,071 5.24 285,164 4,106 1.44 n/a n/a n/a Total interest earning assets 1,574,334 223,529 14.20 1,027,556 106,914 10.40 146,304 6,532 4.46 Liabilities Interest bearing liabilities: Interest bearing deposits 1,494,496 71,646 4.79 818,573 16,108 1.97 32,717 99 0.30 Total interest bearing liabilities 1,494,496 71,646 4.79 818,573 16,108 1.97 32,717 99 0.30 Noninterest bearing deposits 79,838 208,983 315,436 Net interest income $ 151,883 $ 90,806 $ 6,433 9.65 % 8.84 % 4.40 % 4.13 % 3.65 % 4.40 % For the Year Ended December 31, 2023 December 31, 2022 December 31, 2021 (dollars in thousands; unaudited) Average
BalanceInterest &
DividendsYield /
CostAverage
BalanceInterest &
DividendsYield /
CostAverage
BalanceInterest &
DividendsYield /
CostTreasury & Administration Assets Interest earning assets: Interest earning deposits with
other banks$ 295,808 $ 15,346 5.19 % $ 515,967 $ 6,728 1.30 % $ 402,081 $ 608 0.15 % 100,260 2,158 2.15 91,970 1,710 1.86 27,908 49 0.18 19,918 1,039 5.22 1,266 35 2.76 2,137 30 1.40 Other investments 11,512 387 3.36 10,146 345 3.40 7,052 284 4.03 Total interest earning assets 427,498 18,930 4.43 619,349 8,818 1.42 439,178 971 0.22 Liabilities Interest bearing liabilities: PPPLF borrowings — — — 68,699 240 0.35 FHLB advances and borrowings — — — % 6,029 69 1.14 % 24,999 284 1.14 % Subordinated debt 44,066 2,373 5.39 27,626 1,179 4.27 15,379 711 4.62 Junior subordinated debentures 3,589 271 7.55 3,587 143 3.99 3,585 84 2.34 165,745 8,667 5.23 408,320 4,902 1.20 n/a n/a n/a Total interest bearing liabilities 213,400 11,311 5.30 445,562 6,293 1.41 112,662 1,319 1.17 Net interest income $ 7,619 $ 2,525 $ (348) 1.78 % 0.41 % (0.08) % interest-earninginterest earning assets and interest-bearinginterest bearing liabilities and distinguishes between the changes attributable to changes in volume and changes attributable to changes in interest rates. The table illustrates the $56.1 million increase in loan interest income that is attributable to an increase in loan rates and $72.0 million increase in loan interest income that is attributable to an increase in loan volume. For purposes of this table, changes attributable to both rate and volume that cannot be segregated have been allocated to volume.Increase (Decrease)
Due toIncrease (Decrease)
Due toTotal Increase
(Decrease)Increase (Decrease)
Due toTotal Increase
(Decrease)(dollars in thousands) Interest income: Interest income: Interest earning deposits Interest earning deposits Other Investments Interest expense: Interest expense: Interest bearing deposits Interest bearing deposits PPPLF borrowings LoanCredit Lossesloancredit losses - loans is an expense we incur to maintain an allowance for loancredit losses at a level that is deemed appropriate by management to absorb inherentexpected losses on existing loans. For a description of the factors taken into account by our management in determining the allowance for loancredit losses see “— “Item 7. Management’s Discussion and Analysis of Financial Condition and Operations—Financial Condition—Allowance for LoanCredit Losses.”Year Ended2018, Compared to Year Ended December 31, 2017. The2023 and included $3.0 million in PPP loans, which are 100% guaranteed, and are excluded from the provision for loancredit losses for the year ended December 31, 2018, was $1.8 million, compared to $870,000 for the year ended December 31, 2017. The increase of $956,000 was primarily due to loan growth totaling $111.1 million in 2018 compared to $60.7 million in 2017.- loans calculation. The allowance for loancredit losses as a percentage of loans was 1.23%3.86% at December 31, 2018,2023, compared to 1.22%2.82% at December 31, 2017.Year Ended (dollars in thousands; unaudited) December 31, 2023 December 31, 2022 December 31, 2021 Community bank $ 1,322 $ 719 $ 1,275 CCBX 182,721 78,345 8,640 Total provision expense $ 184,043 $ 79,064 $ 9,915 2018,2023 totaled $436,000,$145.0 million, or 0.06%4.94% of total average loans, as compared to net charge-offs of $397,000,$33.7 million, or 0.06%1.49% of total average loans, for the year ended December 31, 2017.2022. Net charge-offs for both years were consistent on a percentage basis and with 2018 seeing a slight increaseup significantly in dollars due to higher balance loans.Year Ended December 31, 2017, Compared to Year Ended December 31, 2016. The provision for loan losses for the year ended December 31, 2017, was $870,000,2023 compared to $1.9 million for the year ended December 31, 2016. The decrease of $1.0 million was primarily due to loan growth totaling $60.7 million in 2017 compared to $96.9 million in 2016, as well as improved credit quality. The allowance for loan losses as a percentage of loans was 1.22% at December 31, 2017, compared to 1.27% at December 31, 2016. The lower allowance that resulted from stronger credit quality reduced the amount of provision needed for 2017.Net charge-offs for the year ended December 31, 2017, totaled $397,000, or 0.06% of total average loans, as compared to net charge-offs of $364,000, or 0.07% of total average loans, for the year ended December 31, 2016. Net charge-offs for both years were consistent on a percentage basis and were only slightly higher in 20172022 as a result of higherthe growth in loans originated through CCBX partners. In accordance with GAAP, CCBX losses are recorded as charge-offs, but CCBX partner agreements provide for a credit enhancement that indemnifies and as a result CCBX partners reimburse the Bank for net-charge-offs on CCBX loans and negative deposit accounts, except in accordance with the program agreement for one partner where the Company is responsible for credit losses on approximately 10% of a $288.1 million loan balances.(dollars in thousands) Community Bank CCBX Total Community Bank CCBX Total Community Bank CCBX Total Gross charge-offs $ 64 $ 151,933 $ 151,997 $ 428 $ 33,321 $ 33,749 $ 255 $ 385 $ 640 Gross recoveries (12) (7,019) (7,031) (46) (36) (82) (83) (12) (95) Net charge-offs $ 52 $ 144,914 $ 144,966 $ 382 $ 33,285 $ 33,667 $ 172 $ 373 $ 545 Net charge-offs to
average loans0.00 % 11.97 % 4.94 % 0.03 % 4.48 % 1.49 % 0.01 % 0.25 % 0.03 % % of CCBX charge-offs
covered by credit
enhancement97.5 % 99.4 % 100.0 % account service charges and fees, wholesale banking service fees, loan referral fees, mortgage broker fees, and sublease and lease income.fees. Noninterest income does not include loan origination fees, to the extent they exceed the direct loan origination costs, which are generally recognized over the life of the related loan as an adjustment to yield using the interest or similar method.Year Ended
December 31,2023 compared to 2022 2022 compared to 2021 (dollars in thousands) 2023 2022 2021 Increase
(Decrease)Percent
ChangeIncrease
(Decrease)Percent
ChangeDeposit service charges and fees $ 3,854 $ 3,804 $ 3,698 $ 50 1.3 % $ 106 2.9 % Loan referral fees 683 810 2,126 (127) (15.7) (1,316) (61.9) Gain on sale of bank branch including deposits and loans, net — — 1,263 — 0.0 (1,263) (100.0) Gain on sales of loans, net 253 — 396 253 100.0 (396) (100.0) Unrealized gain (loss) on equity securities, net 279 (153) 1,469 432 (282.4) (1,622) (110.4) Other 884 1,344 1,859 (460) (34.2) (515) (27.7) Noninterest income, excluding BaaS program income and BaaS indemnification income 5,953 5,805 10,811 148 2.5 (5,006) (46.3) Servicing and other BaaS fees 3,855 4,408 4,467 (553) (12.5) (59) (1.3) Transaction fees 4,011 3,211 544 800 24.9 2,667 490.3 Interchange fees 4,252 2,583 701 1,669 64.6 1,882 268.5 Reimbursement of expenses 4,175 2,732 1,004 1,443 52.8 1,728 172.1 BaaS program income 16,293 12,934 6,716 3,359 26.0 6,218 92.6 BaaS credit enhancements 177,764 76,374 9,086 101,390 132.8 67,288 740.6 BaaS fraud enhancements 7,165 29,571 1,505 (22,406) (75.8) 28,066 1864.9 BaaS indemnification income 184,929 105,945 10,591 78,984 74.6 95,354 900.3 Total BaaS income $ 201,222 $ 118,879 $ 17,307 $ 82,343 69.3 $ 101,572 586.9 Total noninterest income $ 207,175 $ 124,684 $ 28,118 $ 82,491 66.2 % $ 96,566 343.4 % As of (unaudited) December 31, 2023 December 31, 2022 Active 19 19 Friends and family / testing 1 1 Implementation / onboarding 1 0 Signed letters of intent 0 5 Wind down - preparing to exit relationship 0 2 Total CCBX relationships 21 27 $3.1$3.9 million for the year ended December 31, 2018,2023, an increase of $444,000,$50,000, or 17.0%1.3%, over the prior year. Serviceyear primarily due to increases in point-of-sale fees of $121,000 and service charges on deposit accounts of $32,000, partially offset by a decrease in overdraft fees of $97,000.on deposit accounts were $2.6 million for the year ended December 31, 2017, an increase of $494,000, or 23.3%, over the prior year. The increases in deposit account service charges in these periods were primarily the result of a fee income initiative to adjust the pricing of fees, types of fees, and features of our deposit accounts, as well as growth in deposit balances and accounts which also lead to more transactional fees. We were able to increase these fees without losing customers.Wholesale Banking Service Fees. We provide wholesale banking services to a customer that provides financial services to its customers. In exchange for providing these services, we earn fixed fees and reimbursement of costs incurred for providing these services. In 2018 we earned $709,000 in wholesale banking service fees. This was a new service for us in 2018, therefore no income is reported for 2017 or 2016.Year Ended
December 31,2023 compared to 2022 2022 compared to 2021 (dollars in thousands) 2023 2022 2021 Increase
(Decrease)Percent
ChangeIncrease
(Decrease)Percent
ChangePoint of sale fees $ 2,176 $ 2,055 $ 1,959 121 5.9 % $ 96 4.9 % Service charges on accounts 500 468 410 32 6.8 58 14.1 Merchant services 498 508 568 (10) (2.0) (60) (10.6) Overdraft and NSF fees 213 310 316 (97) (31.3) (6) (1.9) ATM fees 239 218 227 21 9.6 (9) (4.0) Cash management fees 98 118 113 (20) (16.9) 5 4.4 Other 130 127 105 3 2.4 22 21.0 $ 3,854 $ 3,804 $ 3,698 $ 50 1.3 % $ 106 2.9 % the assuming the interest rate risk. Loan referral fees were $618,000 for the year ended December 31, 2018, compared to $439,000 in the prior year, an increase of $179,000 or 40.8%. Interest rate volatility, swap rates, and the timing of loan closings all impact the demand for long-term fixed rate swaps. The recognition of loan referral fees fluctuatefluctuates in response to these market conditions and as a result we may recognize more or less, or may not recognize any, loan referral fees in some periods. Current market conditions are making interest rate swap agreements less attractive in the higher rate environment. Loan referral fees were $439,000$683,000 for the year ended December 31, 2017, an increase2023, a decrease of $16,000,$127,000, or 3.8%15.7%, over the year ended December 31, 2016.2022. Interest rate volatility, swap rates, and the timing of loan closings all impact the demand for long-term fixed rate swaps.Mortgage Broker FeesGain on Sale of Loans, net. Gain on sales of loans occurs when we sell certain CCBX loans to the originating partner, in accordance with partner agreements. We earn mortgage broker fees for residential mortgagesold $599.9 million in CCBX loans that we broker through mortgage lenders. Mortgage broker fees decreased $40,000 induring the year ended December 31, 2018, compared2023 and expect to 2017 as a result ofcontinue selling CCBX loans over the next several months in an increase in mortgage rates that resulted in less purchasingeffort to optimize and refinancing volume. Mortgage broker fees declined $91,000 in 2017 compared to 2016 as a result of lower volume.Salesale of Loans. We typicallyloans may also occur when we sell in the secondary market the guaranteed portion (generally 75% of the principal balance) of the SBA and United StatesU.S. Department of Agriculture or USDA,(“USDA”) loans that we originate. GainThis activity fluctuates based on sale of loans increased $162,000 to $264,000 inSBA and USDA loan activity.2018,2023, we recognized an unrealized gain on equity securities of $279,000, compared to 2017 asthe year ended December 31, 2022, when we recognized a result of increased focus$153,000 unrealized holding loss on production after restructuring our SBA loan program in 2018. Gain on sale of loans declined to $102,000 in 2017 from $790,000 in 2016 as we reduced staff and restructured our underwriting and administration of this program, while reducing our focus on originating loans for sale. In 2018, we originated $7.8 million of SBA loans compared to $4.8equity securities. We hold $3.0 million in 2017equity securities focused on entities providing products to the BaaS and $7.4 million in 2016. In 2018 we originated $814,000 in USDA loans compared to zero in 2017 and 2016.annuity brokercredit card fee income, wire transfer fees, interest earned on bank owned life insurance (“BOLI”), and SBA and USDA servicing fees. Other noninterest income was $519,000 indecreased $460,000, or 34.2%, for the year ended December 31, 2018, and 2017. Other noninterest income decreased $382,000, or 42.4%, in 20172023 compared to 2016the year ended December 31, 2022, due primarilyin part to athe one-time $325,000 break-up settlement feecost of converting an existing BOLI policy to one that was recognizedwill yield higher returns in 2016 in connection with an acquisition transaction that was terminated in 2015.includesis composed of all employee expenses and costs associated with operating our facilities, obtaining and retaining customer relationships and providing bank services. The largest componentcomponents of noninterest expense isare BaaS loan and fraud expense combined and salaries and employeeoccupancy expense,legal and professional expenses, data processing and software licenses, occupancy, point of sale expense, FDIC assessment, director and staff expense,expenses, excise taxes, marketing expense, and legal and professional fees.2018,2023, noninterest expense totaled $26.2$204.8 million, an increase of $3.8$38.0 million, or 16.9%22.8%, compared to $22.4$166.8 million for the year ended December 31, 2017. For the year ended December 31, 2017, noninterest2022. Noninterest expense, excluding BaaS loan and BaaS fraud expense totaled $22.4$110.7 million an increase of $895,000,and increased $26.8 million or 4.2%, compared to $21.5 million for the year ended December 31, 2016.Year Ended
December 31,2023 compared to 2022 2022 compared to 2021 (dollars in thousands) 2023 2022 2021 Increase
(Decrease)Percent
ChangeIncrease
(Decrease)Percent
ChangeSalaries and employee benefits $ 66,461 $ 52,228 $ 37,101 $ 14,233 27.3 % $ 15,127 40.8 % Legal and professional expenses 14,803 6,760 3,133 8,043 119.0 3,627 115.8 Data processing and software licenses 8,595 6,487 4,951 2,108 32.5 1,536 31.0 Occupancy 4,926 4,548 4,128 378 8.3 420 10.2 Point of sale expense 3,534 2,109 671 1,425 67.6 1,438 214.3 FDIC assessments 2,524 2,859 1,632 (335) (11.7) 1,227 75.2 Director and staff expenses 2,152 1,711 1,205 441 25.8 506 42.0 Excise taxes 1,976 2,204 1,589 (228) (10.3) 615 38.7 Marketing 517 351 451 166 47.3 (100) (22.2) Other 5,224 4,652 3,921 572 12.3 731 18.6 Noninterest expense, excluding BaaS loan and BaaS fraud expense 110,712 83,909 58,782 26,803 31.9 25,127 42.7 BaaS loan expense 86,900 53,294 2,976 33,606 63.1 50,318 1,690.8 BaaS fraud expense 7,165 29,571 1,505 (22,406) (75.8) 28,066 1864.9 BaaS loan and fraud expense 94,065 82,865 4,481 11,200 13.5 78,384 1,749.3 Total noninterest expense $ 204,777 $ 166,774 $ 63,263 $ 38,003 22.8 % $ 103,511 163.6 % $16.0$66.5 million for the year ended December 31, 2018,2023, an increase of $2.6$14.2 million, or 19.7%27.3%, compared to $13.4 million for 2017. The increase was primarily due to the continued organic growth initiatives, and include increases in sales staff, including hiring new banking teams, adding lenders, staff for the newly opened Edmonds location, and additional back office staffing to support the incremental increases in banking teams, wholesale banking activities and for operation as a public company. Salaries and employee benefits were $13.4$52.2 million for the year ended December 31, 2017, an2022. The increase was primarily due to hiring staff for our CCBX segment and additional staff for our ongoing community bank related growth initiatives. As our CCBX segment grows, we expect to continue to add employees to support this line of $1.4 million, or 11.6%,business. As of December 31, 2023, we had 507 full-time equivalent employees, compared to $12.0448 at December 31, 2022.2016. The increase was primarily due to an increase in staffing to support our growth objectives, including hiring additional staff for our Woodinville branch, and to enhance our compliance infrastructure. As of December 31, 2018, we had 183 full-time equivalent employees,2023 compared to 156 at December 31, 2017, and 148 at December 31, 2016.Occupancy Expenses. Occupancy expenses were $3.3$6.8 million for the year ended December 31, 2018, compared to $3.02022, an increase of $8.0 million, for 2017. Occupancyor 119.0%. The increase in legal and professional expenses were $3.0primarily focused on building infrastructure for future growth.2017,2023, compared to $2.7$6.5 million for the year ended December 31, 2016.2022, an increase of $2.1 million, or 32.5%.$1.1$2.3 million $993,000 and $895,000$1.8 million for years ended December 31, 2018, 20172023 and 2016,2022, respectively. The increase of $277,000, or 9.1%,$378,000 in occupancy expenses for 2023 compared to 2022, was primarily the result of $222,000 increase in depreciation expense, resulting from increased costs associated with the increase in FTE and growth in CCBX and $138,000 increase in maintenance and repairs expense. Occupancy expenses rent, utilities, janitorial and other maintenance expenses, property insurances and taxes. Also included is depreciation on building, leasehold, furniture, fixtures and equipment. Although our hybrid and remote workforce has increased, which helps keep some occupancy expenses down, we do expect occupancy expenses to increase as we continue to grow.2018,2023, compared to $2.1 million for the year ended December 31, 2022, an increase of $1.4 million, or 67.6%.was primarily dueperiod. On October 18, 2022 the FDIC finalized an increase of 2 basis points in the initial base deposit insurance assessment rates schedules, beginning with the first quarterly assessment period of 2023. The rise is intended to increase the recent openingreserve ratio of the Edmonds branch combined with a full year of occupancy expensesDeposit Insurance Fund to 1.35%, the statutory requirement. The increase in the base rates will remain in place until the reserve ratio reaches or exceeds 2.0%. FDIC assessments were $2.5 million for the Woodinville location that was opened late in 2017. Theyear ended December 31, 2023, compared to $2.9 million for the year ended December 31, 2022, a decrease of $335,000, or 11.7%.$343,000,$441,000, or 12.7%,25.8%. In 2023 we saw an increase in occupancythese expenses for 2017 comparedas the number of employees increased.2016 was primarily dueother states is also removed to increased lease costs and higher building maintenance. We opened our 13th branch in Woodinville inarrive at the fall of 2017. This new branch increased our lease, depreciation, maintenance, and utility costs for 2017.Data Processing. Data processing coststaxable base. Excise taxes were $2.0 million for the year ended December 31, 2018,2023, compared to $1.8$2.2 million for the year ended December 31, 2017. Data processing2022, an decrease of $228,000, or 10.3%.$1.8 million$517,000 for the year ended December 31, 2017,2023, compared to $2.0 million$351,000 for the year ended December 31, 2016. Data processing2022, a increase of $166,000, or 47.3%. Marketing and promotion costs include all of our customer processing, computer processing, and network costs. In 2018, we saw increases in our loan and deposit bases as well as new products and branches, all of which impact data processing expense. In 2016, we upgraded our core processing system and achieved costs savings that enabled usare starting to grow deposits, loans, and customers while decreasing our data processing costs in 2017. We anticipate that our data processing costs will increase proportionately as we growdeploy more branding and targeted advertising for the community bank and CCBX. We are using more cost-effective advertising options, but expect costs to increase as we expand our customer base and deposits and loans.subscriptions,memberships, office supplies, mail services, telephone, examination fees, internal loan expenses, services charges from banks, operational losses, directors and officersofficer’s insurance, donations, provision for unfunded commitments, and miscellaneous other expenses.$2.0$5.2 million for the year ended December 31, 2018,$1.8$4.7 million for the year ended December 31, 2017.2022, an increase of $572,000, or 12.3%. The increase was primarilylargely due to overall increases resulting from growth for the year ended December 31, 2023, as compared to the same period last year.office supplies, duesBaaS loan and subscription costs,fraud expense is partner loan expense including overdraft balances and telephone expenses, all of whichBaaS fraud expense. Partner loan expense represents the amount paid or payable to partners for credit enhancements, fraud enhancements and servicing CCBX loans. BaaS fraud expense represents noncredit fraud losses on loans and deposits originated through partners. Fraud losses are related to increasesrecorded when incurred as losses in staffing, the addition of new banking teamsnoninterest expense, and the new branch thatreimbursement from the CCBX partner is recorded in noninterest income, resulting in a net impact of zero to the income statement. For the year ended December 31, 2023, BaaS loan and fraud expense was added in 2018. Other noninterest expense decreased$94.1 million, compared to $1.8$82.9 million for the year ended December 31, 2017, compared to $2.1 million2022 as a result of increased partner activity. For more information on the accounting for BaaS loan and fraud expenses see the section titled “CCBX – BaaS Reporting Information.”year ended December 31, 2016, a decrease of $328,000, or 15.3%. The decrease was primarily due to decreasedperiods indicated, the BaaS loan expenses as we benefitted from stronger credit quality, lower mail service expenses, and lower directors and officers insurance expense.Year Ended
December 31,2023 compared to 2022 2022 compared to 2021 (dollars in thousands) 2023 2022 2021 Increase
(Decrease)Increase
(Decrease)BaaS loan expense $ 86,900 $ 53,294 $ 2,976 $ 33,606 $ 50,318 BaaS fraud expense 7,165 29,571 1,505 (22,406) 28,066 Total BaaS loan and fraud expense $ 94,065 $ 82,865 $ 4,481 $ 11,200 $ 78,384 2018,2023, Compared to Year Ended December 31, 2017. 2022. For the year ended December 31, 2018,2023, income tax expense totaled $2.5$12.6 million, compared to $4.7$10.0 million for the year ended December 31, 2017. In 2018, the Company saw a decrease in federal income tax expense as a result of the reduced tax rate under the Tax Cuts and Jobs Act. The income tax expense for 2017 included $1.3 million in additional expense that resulted from the revaluation of our deferred tax assets as a result of the reduction in the corporate income tax rate under the Tax Cuts and Jobs Act. Excluding the effect of the charge for revaluation of our deferred tax assets, our2022. Our effective tax rates for the years ended December 31, 20182023, and 2017, were 20.8%2022, was 22.0% and 33.3%19.7%, respectively. See “Item 6—Selected Financial Data—GAAP ReconciliationManagement Explanationtreasury & administration. The primary focus of Non-GAAP Financial Measures.”the community bank is on providing a wide range of banking products and services to consumers and small to medium sized businesses in the broader Puget Sound region in the state of Washington and through the Internet and our mobile banking application. We currently operate 14 full-service banking locations, 12 of which are located in Snohomish County, where we are the largest community bank by deposit market share, and two of which are located in neighboring counties (one in King County and one in Island County).Year Ended The CCBX segment provides banking as a service (“BaaS”) that allows our broker-dealer and digital financial service partners to offer their customers banking services. The CCBX segment has 21 partners, 19 that are active with two more currently in the testing or implementation stage as of December 31, 2017, Compared2023. The treasury & administration segment includes treasury management, overall administration and all other aspects of the Company.Year Endedpreviously reported segment financial data. The Company continues to evaluate its methodology on allocating items to the Company’s various segments to support strategic business decisions by the Company’s executive leadership. The difference in total loans receivable and total deposits in the community bank and CCBX segments is recorded on the balance sheet of each segment as an intrabank asset or intrabank liability, with the treasury & administration segment as the offset to those entries. Income and expenses that are specific to a segment are directly posted to each segment. Additionally, certain indirect expenses are allocated to each segment utilizing various metrics, such as number of employees, utilization of space, and allocations based on loan and deposit balances. We have implemented a transfer pricing process that credits or charges the community bank and CCBX segments with intrabank interest income or expense for the difference in average loans and average deposits, with the treasury & administration segment as the offset for those entries. The accounting policies of the segments are the same as those described in “Note 1 – Description of Business and Summary of Significant Accounting Policies” in the accompanying notes to the consolidated financial statements included in this report.December 31, 2023 December 31, 2022 (dollars in thousands; unaudited) Community Bank CCBX Treasury & Administration Consolidated Community Bank CCBX Treasury & Administration Consolidated Assets Cash and due from banks $ 4,702 $ 9,601 $ 468,825 $ 483,128 $ 4,603 $ 12,899 $ 324,637 $ 342,139 Intrabank asset $ — $ 653,178 $ (653,178) $ — $ — $ 254,096 $ (254,096) $ — Securities — — 150,364 150,364 — — 98,353 98,353 Loans held for sale — — — — — — — — Total loans receivable 1,830,154 1,195,938 — 3,026,092 1,614,752 1,012,504 — 2,627,256 Allowance for credit losses (21,595) (95,363) — (116,958) (20,636) (53,393) — (74,029) All other assets 30,169 136,931 43,640 210,740 25,508 76,111 49,129 150,748 Total assets $ 1,843,430 $ 1,900,285 $ 9,651 $ 3,753,366 $ 1,624,227 $ 1,302,217 $ 218,023 $ 3,144,467 Liabilities Total deposits $ 1,497,601 $ 1,862,762 $ — $ 3,360,363 $ 1,538,218 $ 1,279,303 $ — $ 2,817,521 Total borrowings — — 47,734 47,734 — — 47,587 47,587 Intrabank liability $ 338,614 $ — $ (338,614) $ — $ 80,392 $ — $ (80,392) $ — All other liabilities 7,215 37,523 5,553 50,291 5,617 22,914 7,334 35,865 Total liabilities $ 1,843,430 $ 1,900,285 $ (285,327) $ 3,458,388 $ 1,624,227 $ 1,302,217 $ (25,471) $ 2,900,973 2016. For2023 increased $219.2 million, or 13.5%, to $1.84 billion, compared to $1.62 billion as of December 31, 2022. Loans receivable net of deferred fees for the community bank segment increased $215.4 million, or 13.3%, to $1.83 billion as of December 31, 2023, compared to $1.61 billion as of December 31, 2022. The increase in community bank loans receivable is the result of gross loan growth of $216.4 million. Total community bank deposits decreased $40.6 million, or 2.64%, to $1.50 billion, as of December 31, 2023, compared to $1.54 billion as of December 31, 2022. The decrease in community bank deposits was a result of pricing disciplines as some customers sought higher rate products elsewhere. Our cost of deposits for the community bank was 1.57% for the three months ended December 31, 2023. The intrabank liability, which is the difference in total community bank assets and total community bank liabilities, increased $258.2 million, or 321.2%, to $338.6 million at December 31, 2023, compared to $80.4 million at December 31, 2022. This increase is the result of the increase in community bank loans and the decrease in community bank deposits discussed above.2017,2021.Year Ended December 31, 2023 December 31, 2022 December 31, 2021 (dollars in thousands) Community Bank CCBX Treasury & Administration Total Community Bank CCBX Treasury & Administration Total Community Bank CCBX Treasury & Administration Total INTEREST INCOME AND EXPENSE Interest income $ 106,983 $ 204,458 $ 18,930 $ 330,371 $ 80,544 $ 102,808 $ 8,818 $ 192,170 $ 76,551 $ 6,532 N/A $ 83,083 Interest income (expense)
intrabank transfer(10,404) 19,071 (8,667) — 796 4,106 (4,902) — N/A N/A N/A — Interest expense 17,354 71,646 2,644 91,644 2,896 16,108 1,391 20,395 3,547 99 N/A 3,646 Net interest income 79,225 151,883 7,619 238,727 78,444 90,806 2,525 171,775 73,004 6,433 N/A 79,437 Provision for credit
losses - loans1,322 182,721 — 184,043 719 78,345 — 79,064 1,275 8,640 N/A 9,915 (Recapture)/Provision for
unfunded commitments(211) 160 — (51) — — — — — — N/A — Net interest income
after provision
(recovery)for credit
losses - loans and
unfunded
commitments78,114 (30,998) 7,619 54,735 77,725 12,461 2,525 92,711 71,729 (2,207) N/A 69,522 NONINTEREST INCOME Deposit service charges
and fees3,810 44 — 3,854 3,757 47 — 3,804 3,698 — N/A 3,698 Other income 1,165 433 501 2,099 1,411 356 234 2,001 7,015 98 N/A 7,113 BaaS program income — 16,293 — 16,293 — 12,934 — 12,934 — 6,716 N/A 6,716 BaaS indemnification
income— 184,929 — 184,929 — 105,945 — 105,945 — 10,591 N/A 10,591 Noninterest income 4,975 201,699 501 207,175 5,168 119,282 234 124,684 10,713 17,405 N/A 28,118 Year Ended December 31, 2023 December 31, 2022 December 31, 2021 (dollars in thousands) Community Bank CCBX Treasury & Administration Total Community Bank CCBX Treasury & Administration Total Community Bank CCBX Treasury & Administration Total NONINTEREST EXPENSE Salaries and employee
benefits24,104 25,159 17,198 66,461 20,476 18,007 13,745 52,228 32,562 4,539 N/A 37,101 Occupancy 3,815 339 772 4,926 3,956 317 275 4,548 4,039 89 N/A 4,128 Data processing and
software licenses4,521 2,303 1,771 8,595 3,172 1,746 1,569 6,487 4,509 442 N/A 4,951 Legal and professional
expenses1,580 9,645 3,578 14,803 213 3,163 3,384 6,760 2,654 479 N/A 3,133 Other expense 3,954 6,812 5,161 15,927 5,202 3,026 5,658 13,886 7,783 1,686 N/A 9,469 BaaS loan expense — 86,900 — 86,900 — 53,294 — 53,294 — 2,976 N/A 2,976 BaaS fraud expense — 7,165 — 7,165 — 29,571 — 29,571 — 1,505 N/A 1,505 Total noninterest
expense37,974 138,323 28,480 204,777 33,019 109,124 24,631 166,774 51,547 11,716 N/A 63,263 Net income before income
taxes$ 45,115 $ 32,378 $ (20,360) $ 57,133 $ 49,874 $ 22,619 $ (21,872) $ 50,621 $ 30,895 $ 3,482 N/A $ 34,377 Income taxes 9,913 7,116 (4,475) 12,554 10,068 4,248 (4,320) 9,996 6,638 734 N/A 7,372 Net Income 35,202 25,262 (15,885) 44,579 39,806 18,371 (17,552) 40,625 24,257 2,748 N/A 27,005 tax expense totaled $4.7 million, compared to $2.5for the community bank was $79.2 million for the year ended December 31, 2016.2023, an increase of $781,000, or 1.0%, compared to $78.4 million for the year ended December 31, 2022. The increase in net interest income taxis largely due to loan growth and increased interest rates on new and variable rate loans. As a result of the community bank having higher average loans than deposits for the twelve months ended December 31, 2023 compared to the twelve months ended December 31, 2022, intrabank interest expense for 2017 includedthe community bank was $10.4 million for the twelve months ended December 31, 2023, compared to intrabank interest income of $796,000 for the twelve months ended December 31, 2022. Increased interest rates also contributed to the increase in intrabank interest expense. Provision for credit losses - loans for the community bank was $1.3 million in additional expense that resulted fromfor the revaluation of our deferred tax assetsyear ended December 31, 2023, compared to $719,000 for the year ended December 31, 2022, as a result of the reduction in the corporate income tax rate under the Tax Cuts and Jobs Act. Excluding the effect of the charge for revaluation of our deferred tax assets, our effective tax ratesloan growth. Net charge-offs to average loans for the yearscommunity bank segment have remained consistently low and were 0.00% and 0.03% for the twelve months ended December 31, 20172023, and 2016, were 33.3%2022, respectively. Noninterest income for the community bank was $5.0 million, for the year ended December 31, 2023, a decrease of $193,000, or 3.7%, compared to $5.2 million for the year ended December 31, 2022. Loan referral fees decreased $127,000 for the twelve months ended December 31, 2023 compared to the twelve months ended December 31, 2022. The recognition of loan referral fees fluctuates in response to market conditions and 32.9%, respectively. See “Item 6—Selected Financial Data—GAAP Reconciliation and Management Explanation of Non-GAAP Financial Measures.”.Financial ConditionOur total assetsas a result we may recognize more or less, or may not recognize any, loan referral fees in some periods. Noninterest expenses for the community bank increased $146.3$5.0 million, or 18.2%15.0%, to $952.1$38.0 million as of December 31, 2018, from $805.82023, compared to $33.0 million as of December 31, 2017. Our asset growth in 2018 was primarily2022. The increase is largely due to $111.1increased salaries and employee benefits as a result of growth, higher data processing and software licensing costs related to new reporting software that helps monitor and assess risk and to automate and create efficiencies in reporting, and increased legal and professional fees associated with our infrastructure enhancement projects to improve processing, automate processes, reduce compliance costs, and enhance our data management.a $36.0higher loss rates from CCBX partners. Noninterest income for CCBX was $201.7 million for the year ended December 31, 2023, an increase in cash and cash equivalents, offset by a decrease of $414,000 in investment securities. Our asset growth was primarily funded by $100.3$82.4 million, or 69.1%, compared to $119.3 million for the year ended December 31, 2022, due to an increase of $3.4 million in deposit growth during 2018, plusBaaS fee program income, which was the $33.2result of increased activity with Baas partners, including $101.4 million in equity fromBaaS credit enhancements related to the capital raise. Our total assetsallowance for credit losses, and $22.4 million in BaaS fraud enhancements. Noninterest expenses for CCBX increased $65.2$29.2 million, or 8.8%26.8%, to $805.8$138.3 million as of December 31, 2017, from $740.62023, compared to $109.1 million as of December 31, 2016. Our asset growth2022. The increase in 2017 was primarilynoninterest expense is largely due to $60.7growth from active CCBX relationships resulting in an increase in BaaS loan expense, BaaS fraud expense and increased salaries and benefits, for the twelve months ended December 31, 2023, compared to the twelve months ended December 31, 2022. Also contributing to the increase in noninterest expense is higher legal and professional fees associated with our infrastructure enhancement projects to improve processing, automate processes, reduce compliance costs, and enhance our data management. For more information on the accounting for BaaS income and expenses see the section titled “CCBX – BaaS Reporting Information.”.loan growth, which we funded primarily through growthinterest earning deposits with other banks.customer deposits.and real estate loans secured by commercial real estate properties locatedprimarily in the Puget Sound region. Our consumer and other loans also represent a significant portion of our loan portfolio with the growth of our CCBX segment. Our loan portfolio represents the highest yielding component of our earning assets.2018,2023, loans receivable totaled $767.9 million,$3.03 billion, an increase of $111.1$398.8 million, or 16.9%15.2%, compared to December 31, 2017. As2022. Total loans receivable is net of December 31, 2017, loans totaled $656.8$7.3 million anin net deferred origination fees. The increase includes CCBX loan growth of $60.7$183.4 million, or 10.2%18.1%, compared to $596.1and community bank loan growth of $216.4 million, as of December 31, 2016. These increases were primarily due to our efforts to increase income by building a diversified loan portfolio while maintaining strong credit quality.95.6%90.1% as of December 31, 2018, 93.4%2023, compared to 93.2% as of December 31, 2017, and 91.9% as of December 31, 2016.2022. We areremain focused on serving our communities and markets by growing loans and funding those loans with customer deposits.As of December 31, As of December 31, 2023 2023 2022 (dollars in thousands) (dollars in thousands) Amount Percent Amount Percent Commercial and industrial loans: PPP loans PPP loans PPP loans $ 3,033 0.1 % $ 4,699 0.2 % Capital call lines All other commercial & industrial loans Total commercial and industrial loans: Real estate loans: Construction, land and land development Construction, land and land development Gross loans receivable 3,033,392 100.0 100.0 % 2,633,363 100.0 100.0 % Net deferred origination fees - PPP loans Net deferred origination fees - all other loans Net deferred origination fees - all other loans Net deferred origination fees - all other loans Loans receivable Loans receivable Loan Yield Loan Yield Loan Yield Community Bank As of December 31, 2023 December 31, 2022 (dollars in thousands; unaudited) Balance % to Total Balance % to Total Commercial and industrial loans: PPP loans $ 3,033 0.2 % $ 4,699 0.3 % All other commercial & industrial loans 146,469 8.0 146,982 9.1 Real estate loans: Construction, land and land development loans 157,100 8.5 214,055 13.2 Residential real estate loans 225,391 12.3 204,581 12.6 Commercial real estate loans 1,303,533 70.9 1,048,752 64.7 Consumer and other loans: Other consumer and other loans 1,628 0.1 1,725 0.1 Gross Community Bank loans receivable 1,837,154 100.0 % 1,620,794 100.0 % Net deferred origination fees (7,000) (6,042) Loans receivable $ 1,830,154 $ 1,614,752 Loan Yield 6.20 % 5.32 % CCBX As of December 31, 2023 December 31, 2022 (dollars in thousands; unaudited) Balance % to Total Balance % to Total Commercial and industrial loans: Capital call lines $ 87,494 7.3 % $ 146,029 14.4 % All other commercial & industrial loans 54,298 4.5 14,918 1.5 Real estate loans: Residential real estate loans 238,035 19.9 244,576 24.2 Consumer and other loans: Credit cards 505,837 42.3 279,644 27.6 Other consumer and other loans 310,574 26.0 327,402 32.3 Gross CCBX loans receivable 1,196,238 100.0 % 1,012,569 100.0 % Net deferred origination (fees) costs (300) (65) Loans receivable $ 1,195,938 $ 1,012,504 16.89 % 13.85 % Loans.Loans. Commercial and industrial loans decreased $21.3 million, or 6.8%, to $291.3 million as of December 31, 2023, from $312.6 million as of December 31, 2022. The decrease in commercial and industrial loans receivable over December 31, 2022 was due to a decrease of $58.5 million in capital call lines and $1.7 million in forgiven and repaid PPP loans partially offset by a $38.9 million increase in other commercial and industrial loans. Included in the commercial and industrial loan balance is $87.5 million and $146.0 million in capital call lines resulting from relationships with our CCBX partners as of December 31, 2023 and December 31, 2022, respectively. As of December 31, 2023, there were $54.3 million in CCBX other commercial loans, compared to $14.9 million at December 31, 2022.inventory,equipment, and we generally includeobtain personal guarantees.increased $1.7includes $48.6 million and $45.1 million in loans to financial institutions as of December 31, 2023, and December 31, 2022, respectively.1.9%26.6%, to $90.4$157.1 million as of December 31, 2018,2023, from $88.7$214.1 million as of December 31, 2017.2022. The $1.7 million increasedecrease is the result of more than $31.1 million in new loans, net of $29.4 million in principal reductions and payoffs. Commercial and industrial loans increased $17.3 million, or 24.2%, to $88.7 million as of December 31, 2017, from $71.4 million as of December 31, 2016. The increase was due,attributed in part to our diversification strategy, which includes sourcing loans from strong markets with good returnsthe completion of projects related to these community bank loans.risk characteristics to supplement growth in our existing markets. In 2017, we purchased $9.9 million of high-quality medical equipment loans made to doctors. Theland development loans were individually underwritten$113.5 million at December 31, 2023, compared to the Bank’s standards before being funded. We may purchase additional loans of various types$142.5 million at December 31, 2022. Although we have seen a strong commercial and residential real estate market in the future to supportPuget Sound region in 2023, the diversification of our loan portfolioeconomic environment is continuously changing and to invest excess liquidity. We may consider additional purchases of medical equipment loans after we assessis impacted by GDP, unemployment, inflation, higher interest rates, global unrest, the performance of our initial purchase of these loans.Construction, Landwar in Ukraine, conflicts in the Middle East, the political environment and Land Development Loans.trade issues that have resulted in some economic uncertainty and slowing in construction lending.Construction, land and land development loans increased $22.4 million, or 53.8%, to $64.0 million as As of December 31, 2018, from $41.6 million as of December 31, 2017. The increase was primarily due to favorable economic conditions for building in our market area. Unfunded loan commitments for2023, construction, land and land development loans increased as of December 31, 2018. We had a number ofincluded $81.5 million in commercial construction loans, that have been approved, primarily for$7.9 million in undeveloped land loans, $34.2 million in residential projects, where the contractor/developer had not requested the funds, resultingconstruction loans and $33.5 million in our unfunded construction and development commitments to grow to $63.4 million at December 31, 2018, from $30.8 million at December 31, 2017. Construction, land and land development loans decreased $14.0 million, or 25.2%, to $41.6 million as of December 31, 2017, from $55.6 million as of December 31, 2016, as the robust real estate market in the Puget Sound region resulted in newly constructed homes selling quickly, enabling builders to repay their loans more quickly. Unfunded loan commitments forother construction, land and land development loans, compared to $100.7 million in commercial construction loans, $44.6 million in undeveloped land loans, $32.9 million in residential construction loans and $35.9 million in other construction, land and land development loans as of December 31, 2022.$30.8$463.4 million as of December 31, 2023, from $449.2 million as of December 31, 2022 due to an increase of $20.8 million in community bank loans partially offset by a decrease of $6.5 million in CCBX loans.2017, from $18.9 million at December 31, 2016. Because2022. These home equity lines of the strongcredit are secured by residential real estate marketand are accessed by using a credit card. We sold $321.5 million in CCBX residential real estate loans during the Puget Sound region, we expect to see construction and development loans continue to pay off more quickly thanyear ended December 31, 2023.experienced historically.Residential Real Estate Loans. We originate one-to-four family adjustable rate mortgage loans for our own loan portfolio and as a mortgage broker for mortgage lenders. Loans that we originate as a broker are not funded by us and do not appear on our balance sheet. From time to time, we purchasepurchased residential mortgages originated bythrough other financial institutions to hold for investment with the intent to diversifyfor purposes of diversifying our residential mortgage loan portfolio, meetmeeting certain regulatory requirements and increaseincreasing our interest income. We last purchased residential mortgage loans in 2018. As of December 31, 2018,2023 and December 31, 2022, we held $8.1 million and $9.4 million, respectively, in purchased residential real estate mortgage loans. These loans totaled $38.8 million. We also makepurchased typically have a fixed rate with a term of 15 to 30 years and are collateralized by one-to-four family residential real estate. We have a defined set of credit guidelines that we use when evaluating these loans. Although purchased loans were originated and underwritten by another institution, our mortgage, credit, and compliance departments conduct an independent review of each underlying loan that includes re-underwriting each of these loans to investors to finance their rental propertiesour credit and to business owners to secure their business loans. As of December 31, 2018,compliance standards.madeare secured by real estate, the value of which may fluctuate significantly over a short period of time as a result of market conditions in the area in which the real estate is located. Adverse developments affecting real estate values in our market areas could therefore increase the credit risk associated with these loans, impair the value of property pledged as collateral on loans, and affect our ability to investors and business owners totaled $34.1 million. In addition, we originate home equity lines of credit and home equity term loans for our portfolio.Our residentialsell the collateral upon foreclosure without a loss or additional losses.$7.7$254.8 million, or 8.9%24.3%, to $94.7 million$1.30 billion as of December 31, 2018,2023, from $87.0 million$1.05 billion as of December 31, 2017. Our residential loans increased $9.6 million, or 12.4%, to $87.0 million as2022.were primarily a resultwhich occurred across the various segments of our diversification strategy to supplement existing loan growth with purchased loans individually underwrittenportfolio, were due to our credit standards. Most ofcommitment to continue growing the one-to-four family loans that we purchase are from other lendersportfolio in the Puget Sound region orregion. We actively seek commercial real estate loans in California.Commercial Real Estate Loans.our markets and our lenders are experienced in competing for these loans and managing these relationships.and gas stations, hotels and motels, office buildings, mixed-use residential and commercial, and other properties. We originate both fixed- and adjustable-rate loans with terms up to 20 years. Fixed-rate loans typically amortize over a 10 to 25 year period with balloon payments due at the end of five to ten years. Adjustable-rate loans are generally based on the prime rate and adjust with the prime rate or are based on term equivalent FHLB rates. At December 31, 2023, approximately 33.6% of the commercial real estate loan portfolio consisted of fixed rate loans. Commercial real estate loans represented 67.1%43.0% of our loan portfolio at December 31, 2018, and are our largest source2023. As of revenue.CommercialDecember 31, 2023, we held $43.0 million in purchased commercial real estate loans, compared to $42.4 million at December 31, 2022. Our credit administration team has substantial experience in underwriting, managing, monitoring and working out commercial real estate loans, and remains diligent in communicating and proactively working with borrowers to help mitigate potential credit deterioration.$78.3$209.3 million, or 17.9%34.4%, to $516.0$818.0 million, from $608.8 million as of December 31, 2018, from $437.72022, as a result of growth in CCBX loans originated through our partners. We sold $278.4 million in CCBX consumer and other loans during the year ended December 31, 2023. We intentionally reduced the CCBX portfolio in an effort to optimize and strengthen our balance sheet and expect that additional loans will be sold in the coming months as we continue working to optimize our balance sheet. We will continue growing our CCBX portfolio with loans that we believe are lower risk and more aligned with our long term portfolio and profitability objectives.2017. Commercial real estate2023, compared to $607.0 million at December 31, 2022. CCBX consumer loans increased $46.7 million, or 11.9%, to $437.7include installment loans, credit cards, lines of credit and other loans. Our community bank consumer and other loans totaled $1.6 million as of December 31, 2017, from $391.02023, compared to $1.7 million as ofat December 31, 2016. These increases, which occurred across the various segments of our portfolio, were due to our commitment to grow this portfolio in the Puget Sound region. We actively seek commercial real estate loans in our markets2022 and our lenders are experienced in competing for these loans.Consumer and Other Loans. Our consumer and other loans are comprised of personal lines of credit, automobile, boat, and recreational vehicle loans, and secured term loans. Consumer and other loansincreased$1.5 million, or 71.4%, to $3.6 million as of December 31, 2018, from $2.1 million as of December 31, 2017. Consumer and other loans increased $782,000, or 61.3%, to $2.1 million as of December 31, 2017, from $1.3 million as of December 31, 2016. The increases in these loans were primarily a result of strong consumer confidence and economic strength in the Puget Sound region.As of December 31, 2023 (dollars in thousands) Due in One
Year or LessDue after One
Year Through
Five YearsDue after Five
Years Through
Fifteen YearsDue After
Fifteen YearsGross
LoansCommercial and industrial loans: PPP loans $ — $ 3,033 $ — $ — $ 3,033 All other commercial and industrial loans 125,424 87,622 75,131 84 288,261 Real estate loans: Construction, land and land development loans 106,271 17,308 33,352 169 157,100 Residential real estate loans 77,080 227,347 114,693 44,306 463,426 Commercial real estate loans 35,964 403,354 751,238 112,977 1,303,533 Consumer and other loans 73,888 695,021 46,593 2,537 818,039 Total $ 418,627 $ 1,433,685 $ 1,021,007 $ 160,073 $ 3,033,392 2018,2023, that are due after December 31, 2019,2024, and have either fixed interest rates or floating or adjustable interest rates:(dollars in thousands) Fixed Rates Total Commercial and industrial loans: PPP loans 3,033 $ — $ 3,033 All other commercial and industrial loans 104,166 58,671 162,837 Real estate loans: Construction, land and land development loans 13,244 37,585 50,829 Residential real estate loans 66,593 319,753 386,346 Commercial real estate loans 414,342 853,227 1,267,569 Consumer and other loans 242,729 501,422 744,151 Total $ 844,107 $ 1,770,658 $ 2,614,765 (dollars in thousands) Outstanding Balance Available Loan Commitments Total Outstanding Balance & Available Commitment Average Loan Balance Number of Loans Community bank commercial real estate loans Apartments $ 356,046 $ 10,783 $ 366,829 6.8 % $ 3,359 106 Hotel/Motel 172,437 2,345 174,782 3.2 6,387 27 Convenience Store 132,007 1,086 133,093 2.5 2,164 61 Warehouse 114,572 2,166 116,738 2.2 1,975 58 Retail 101,688 719 102,407 1.9 987 103 Mixed use 93,850 3,475 97,325 1.8 1,079 87 Office 89,007 3,447 92,454 1.7 989 90 Mini Storage 65,731 23,979 89,710 1.7 3,130 21 Strip Mall 44,590 — 44,590 0.8 6,370 7 Manufacturing 37,946 1,514 39,460 0.7 1,186 32 Groups < 0.70% of total 95,659 4,775 100,434 1.9 1,139 84 Total $ 1,303,533 $ 54,289 $ 1,357,822 25.2 % $ 1,928 676 (dollars in thousands) Outstanding Balance Available Loan Commitments Average Loan Balance Number of Loans CCBX consumer loans Credit cards $ 505,837 $ 1,014,959 $ 1,520,796 28.3 % $ 1.6 308,955 Installment loans 302,241 134 302,375 5.6 1.1 266,203 Lines of credit 5,788 63 5,851 0.1 0.1 102,805 Other loans 2,545 — 2,545 0.1 0.2 10,993 Community bank consumer loans Installment loans 1,151 — 1,151 0.0 57.6 20 Lines of credit 147 582 729 0.0 3.5 42 Other loans 330 — 330 0.0 1.1 314 Total $ 818,039 $ 1,015,738 $ 1,833,777 34.1 % $ 1.2 689,332 (dollars in thousands) Outstanding Balance Available Loan Commitments % of Total Loans
(Outstanding Balance &
Available Commitment)Average Loan Balance Number of Loans CCBX residential real estate loans Home equity line of credit $ 238,035 $ 418,761 $ 656,796 12.2 % $ 24 9,792 Community bank residential real estate loans Closed end, secured by first liens 192,805 3,268 196,073 3.7 610 316 Home equity line of credit 23,049 42,048 65,097 1.2 106 217 Closed end, second liens 9,537 1,810 11,347 0.2 281 34 Total $ 463,426 $ 465,887 $ 929,313 17.3 % $ 45 10,359 (dollars in thousands) Outstanding Balance Available Loan Commitments Average Loan Balance Number of Loans Capital Call Lines $ 87,494 $ 608,837 $ 696,331 12.9 % $ 537 163 Construction/Contractor Services 24,360 31,020 55,380 1.0 129 189 Retail 52,208 1,842 54,050 1.0 18 2,887 Financial Institutions 48,648 — 48,648 0.9 4,054 12 Medical / Dental / Other Care 20,732 3,852 24,584 0.5 942 22 Manufacturing 8,022 3,967 11,989 0.2 187 43 Groups < 0.20% of total 49,830 45,453 95,283 1.8 67 744 Total $ 291,294 $ 694,971 $ 986,265 18.3 % $ 72 4,060 (dollars in thousands) Outstanding Balance Available Loan Commitments Total Outstanding Balance & Available Commitment Average Loan Balance Number of Loans Community bank construction, land and land development loans Commercial construction $ 81,489 $ 85,584 $ 167,073 3.1 % $ 5,433 15 Residential construction 34,213 16,687 50,900 1.0 1,711 20 Undeveloped land loans 7,890 4,391 12,281 0.2 564 14 Developed land loans 20,515 2,734 23,249 0.4 789 26 Land development 12,993 4,138 17,131 0.3 866 15 Total $ 157,100 $ 113,534 $ 270,634 5.0 % $ 1,746 90 conservative lending practices and active approach to managing nonperforming assets has resulted in sound asset quality and timely resolution of problem assets. We have several procedures in place to assist us in maintaining the overall credit quality of our loan portfolio. We have established underwriting guidelines, concentration limits and we also monitor our delinquency levels for any negative or adverse trends. We actively manage problem assets to reduce our risk for loss.$1.8$53.8 million in nonperforming assets including performing troubled debt restructurings, or TDRs, as of December 31, 2018,2023, compared to $2.1$33.2 million as of December 31, 2017,2022. This includes $46.5 million in CCBX loans more than 90 days past due and still accruing interest as of which thereDecember 31, 2023, compared to $26.1 million at December 31, 2022. All of our nonperforming assets were $1.8 million in nonperforming loans as of December 31, 2018,2023 and December 31, 2022. Our nonperforming loans to loans receivable ratio was 1.78% at December 31, 2023, compared to $2.1 million as of1.26% at December 31, 2017.2022. The decreaseincrease in nonperforming assets was due to a $20.4 million increase in CCBX partner loans that are 90 days or more past due and still accruing interest. Additionally, community bank nonaccrual loans increased $235,000 during the result of two of our nonperforming loans paying off. We had $2.1 million in nonperforming assets, including performing TDRs, as oftwelve months ended December 31, 2017, compared2023 to $8.2$7.3 million and includes a multifamily loan for $6.9 million which we believe is well secured.2016,2023. CCBX loans have a higher level of expected losses than our community bank loans, which is reflected in the factors for the allowance for credit losses. Agreements with our CCBX partners provide for a credit enhancement which protects the Bank by indemnifying or reimbursing incurred losses, when accruing consumer loans originated through CCBX partners are charged-off at 120 days past due for installment loans (primarily unsecured loans to consumers) and we had $2.1 million in nonperforming180 days past due for revolving loans as(primarily credit cards).(dollars in thousands) As of December 31, 2023 As of December 31, 2022 Nonaccrual loans: Commercial and industrial loans $ — $ 113 Real estate loans: Construction, land and land development — 66 Residential real estate 170 — Commercial real estate 7,145 6,901 Total nonaccrual loans 7,315 7,080 Accruing loans past due 90 days or more: Commercial & industrial loans 2,086 404 Real estate loans: Residential real estate loans 1,115 876 Consumer and other loans: Credit cards 34,835 10,570 Other consumer and other loans 8,488 14,245 Total accruing loans past due 90 days or more 46,524 26,095 Total nonperforming loans 53,839 33,175 Real estate owned — — Repossessed assets — — Modified loans for borrowers experiencing financial difficulty — — Total nonperforming assets $ 53,839 $ 33,175 Total nonaccrual loans to loans receivable 0.24 % 0.27 % Total nonperforming loans to loans receivable 1.78 % 1.26 % Total nonperforming assets to total assets 1.43 % 1.06 % Potential Problem LoansFrom a credit risk standpoint, we classify loans in onepass category, we classify loans into one of the following five subcategories based on perceived credit risk, including repayment capacitycommunity bank and collateral security: minimal risk; low risk; modest risk; average risk; and acceptable risk. The classifications of loans reflect a judgment about the risks of default and loss given default. We review the risk ratings of our credits on an annual basis, or more frequently if circumstances warrant. Risk ratingsCCBX nonperforming assets which are adjusted to reflect the degree of risk and loss that is believed to be inherent in each credit as of each monthly reporting period. Our methodology is structured so that specific reserve allocations are increased in accordance with deterioration in credit quality (and a corresponding increase in risk and loss) or decreased in accordance with improvement in credit quality (and a corresponding decrease in risk and loss).Credits rated as other loans especially mentioned show clear signs of financial weaknesses or deterioration in creditworthiness; however, such concerns are not so pronounced that we generally expect to experience significant loss within the short-term. Such credits typically maintain the ability to perform within standard credit terms and credit exposure is not as prominent as credits with a lower rating.Credits rated as substandard are those in which the normal repayment of principal and interest may be, or has been, jeopardized by reason of adverse trends or developments of a financial, managerial, economic or political nature, or important weaknessesincluded in the collateral for the loan. A protracted workout on these credits is a distinct possibility. Prompt corrective action is therefore required to reduce exposure and to assure that adequate remedial measures are taken by the borrower. Credit exposure becomes more likely in such credits and a serious evaluation of the secondary support to the credit is performed.Credits rated as doubtful have weaknesses of substandardtotal nonperforming assets that are sufficient to make collection or liquidation in full questionable and there is a high probability of loss based on currently existing facts, conditions and values.Credits rated as loss are charged-off. We have no expectation of the recovery of any payments in respect of credits rated as loss.The following table summarizes the internal ratings of our loans as of the dates indicated:We maintain an allowance for loan losses that represents management’s best estimate of the loan losses and risks inherent in our loan portfolio. The amount of the allowance for loan losses should not be interpreted as an indication that charge-offs in future periods will necessarily occur in those amounts. In determining the allowance for loan losses, we estimate losses on specific loans, or groups of loans, where the probable loss can be identified and reasonably determined. The balance of the allowance for loan losses is based on internally assigned risk classifications of loans, historical loan loss rates, changes in the nature of our loan portfolio, overall portfolio quality, industry concentrations, delinquency trends, and current economic factors. See “—Critical Accounting Policies—Allowance for Loan Losses.”In connection with the review of our loan portfolio, we consider risk elements applicable to particular loan types or categories in assessing the quality of individual loans. Some of the risk elements we consider include:for commercial and industrial loans, the debt service coverage ratio (income from the business in excess of operating expenses compared to loan repayment requirements), the operating results of the commercial, professional or agricultural enterprise, the borrower’s business, professional and financial ability and expertise, the specific risks and volatility of income and operating results typical for businesses in that category and the value, nature and marketability of collateral;for commercial real estate loans, the debt service coverage ratio, operating results of the owner in the case of owner-occupied properties, the loan-to-value ratio, the age and condition of the collateral and the volatility of income, property value and future operating results typical of properties of that type;Community Bank As of (dollars in thousands; unaudited) December 31,
2023December 31,
2022Nonaccrual loans: Commercial and industrial loans $ — $ 113 Real estate: Construction, land and land development — 66 Residential real estate 170 — Commercial real estate 7,145 6,901 Total nonaccrual loans 7,315 7,080 Accruing loans past due 90 days or more: Total accruing loans past due 90 days or more — — Total nonperforming loans 7,315 7,080 Other real estate owned — — Repossessed assets — — Total nonperforming assets $ 7,315 $ 7,080 Total nonperforming community bank loans to total loans receivable 0.24 % 0.27 % for residential mortgage loans, the borrower’s ability to repay the loan, including a consideration of the debt-to-income ratio and employment and income stability, the loan-to-value ratio, and the age, condition and marketability of the collateral; andCCBX As of (dollars in thousands; unaudited) December 31,
2023December 31,
2022Nonaccrual loans $ — $ — Accruing loans past due 90 days or more: Commercial & industrial loans 2,086 404 Real estate loans: Residential real estate loans 1,115 876 Consumer and other loans: Credit cards 34,835 10,570 Other consumer and other loans 8,488 14,245 Total accruing loans past due 90 days or more 46,524 26,095 Total nonperforming loans 46,524 26,095 Other real estate owned — — Repossessed assets — — Total nonperforming assets $ 46,524 $ 26,095 Total nonperforming CCBX loans to total loans receivable 1.54 % 0.99 % for construction, land and land development loans, the perceived feasibility of the project including the ability to sell developed lots or improvements constructed for resale or the ability to lease property constructed for lease, the quality and nature of contracts for presale or prelease, if any, experience and ability of the developer and loan-to-value ratio.2018,2023, $44.3 million of the $46.5 million in nonperforming CCBX loans were covered by CCBX partner credit enhancements. Agreements with our CCBX partners provide for a credit enhancement which protects the Bank by indemnifying or reimbursing incurred losses. Under the agreement, the CCBX partner will indemnify or reimburse the Bank for its loss/charge-off on these loans.$9.4$74.0 million, or 1.23%2.82% of total loans. OurEffective January 1, 2023 the Company implemented the CECL allowance model which calculates reserves over the life of the loan and is largely driven by portfolio characteristics, economic outlook, and other key methodology assumptions versus the incurred loss model, which is what we were previously using. As a result of implementing CECL, there was a one-time adjustment to the 2023 opening allowance balance of $3.9 million. The day one CECL adjustment for community bank loans included a reduction of $310,000 to the community bank allowance driven by the reversal of the unallocated balance and a reduction of $340,000 related to the community bank unfunded commitment reserve also driven by the reversal of the unallocated balance. This was offset by an increase to the CCBX allowance for loan$4.2 million. With the mirror image approach accounting related to the contingent credit enhancement asset for CCBX partner loans, there was a CECL day one increase to the indemnification asset in the amount of $4.5 million. Net, the day one impact to retained earnings for the Bank’s transition to CECL was an increase of $954,000, excluding the impact of income taxes.as offor the year ended December 31, 2018, increased by $1.4 million, or 17.5%,2023 compared to December 31, 2017, primarily due2022, is largely related to growth in our loan portfolio, both organic and through purchasedthe provision for CCBX partner loans. As ofDuring the year ended December 31, 2017,2023, a $182.7 million provision for credit losses - loans was recorded for CCBX partner loans based on management’s analysis. The factors used in management’s analysis for community bank credit losses indicated that a provision for credit losses - loans of $1.3 million was needed for the year ended December 31, 2023. . The economic environment is continuously changing with the GDP, inflation, higher interest rates, unemployment, global unrest, the war in Ukraine, conflicts in the Middle East, the political environment, including a potential shutdown of the U.S. government, and trade issues that have resulted in some economic uncertainty. As described above, CCBX loans have a higher level of expected losses than our community bank loans, which is reflected in the factors for the allowance for loancredit losses.totaled $8.0 million,for these CCBX loans and reclassified negative deposit accounts. When the provision for credit losses - loans and provision for unfunded commitments is recorded, a credit enhancement asset is also recorded on the balance sheet through noninterest income (BaaS credit enhancements) in recognition of the CCBX partner's legal commitment to indemnify or 1.22%reimburse losses. The credit enhancement asset is relieved as credit enhancement payments and recoveries are received from the CCBX partner or taken from the partner's cash reserve account. BaaS fraud includes noncredit fraud losses on loans and deposits originated through partners. Agreements with our CCBX partners also provide protection to the Bank from fraud by indemnifying and/or reimbursing incurred fraud losses. Fraud losses are recorded when incurred as losses in noninterest expense, and the enhancement received from the CCBX partner is recorded in noninterest income, resulting in a net impact of total loans. Our allowancezero to the income statement. CCBX partners also pledge a cash reserve account at the Bank which the Bank can collect from when losses occur. That account is then replenished by the partner on a regular interval. Although agreements with our CCBX partners provide for loancredit enhancements that provide protection to the Bank from credit and fraud losses by indemnifying or reimbursing incurred credit and fraud losses, if our partner is unable to fulfill its contracted obligations to replenish its cash reserve account then the Bank would be exposed to additional losses, as a result of December 31, 2017, increased by $473,000, or 6.3%, compared to December 31, 2016, primarily duethis counterparty risk. If a CCBX partner does not replenish its cash reserve account then the Bank can declare the agreement in default, take over servicing and cease paying the partner for servicing the loan and providing credit enhancements. The Bank would write-off any remaining credit enhancement asset from the CCBX partner but would retain the full yield and any fee income on the loan portfolio going forward, and BaaS loan expense would decrease once default occurred and payments to the organic growthCCBX partner were stopped.December 31, 2016and for the allowance for loan losses totaled $7.5 million, or 1.25% of total loans.periods indicated, net charge-off information by segment:Year Ended December 31, 2023 December 31, 2022 (dollars in thousands; unaudited) Community Bank CCBX Total Community Bank CCBX Total Gross charge-offs $ 64 $ 151,933 $ 151,997 $ 428 $ 33,321 $ 33,749 Gross recoveries (12) (7,019) (7,031) (46) (36) (82) Net charge-offs $ 52 $ 144,914 $ 144,966 $ 382 $ 33,285 $ 33,667 Net charge-offs to
average loans0.00 % 11.97 % 4.94 % 0.03 % 4.48 % 1.49 % Year Ended December 31, 2021 (dollars in thousands; unaudited) Community Bank CCBX Total Gross charge-offs $ 255 $ 385 $ 640 Gross recoveries (83) (12) (95) Net charge-offs $ 172 $ 373 $ 545 Net charge-offs to average loans 0.01 % 0.25 % 0.03 % loancredit losses and other related data:As of or for the Year Ended December 31, As of or for the Year Ended December 31, (dollars in thousands; unaudited) (dollars in thousands; unaudited) 2023 2022 2021 Impact of adopting CECL (ASC 326) Provision for credit losses Commercial and industrial loans Commercial and industrial loans Residential real estate Commercial and industrial loans Commercial and industrial loans Residential real estate Net charge-offs Allowance for credit losses to nonaccrual loans Allowance for credit losses to nonaccrual loans 1598.88 % 1045.61 % 12955.66 % Allowance to nonperforming loans 217.24 % 223.15 % 1657.90 % Allowance to loans receivable 3.86 % 2.82 % 1.64 % As of December 31, 2023 As of December 31, 2022 (dollars in thousands; unaudited) Community Bank CCBX Total Community Bank CCBX Total Loans receivable $ 1,830,154 $ 1,195,938 $ 3,026,092 $ 1,614,752 $ 1,012,504 $ 2,627,256 Allowance for credit losses (21,595) (95,363) (116,958) $ (20,636) $ (53,393) (74,029) Allowance for credit losses to
total loans receivable1.18 % 7.97 % 3.86 % 1.28 % 5.27 % 2.82 % loancredit losses in accordance with GAAP and that the allowance for loancredit losses was adequate to provide for known and inherentexpected losses in the portfolio at all times shown above, future provisions for loancredit losses will be subject to ongoing evaluations of the risks in our loan portfolio. We continue to have low levels of charge-offs and nonperforming community bank loans, however, the economic environment is continuously changing with inflation, higher interest rates, GDP, unemployment, global unrest, the war in Ukraine, conflicts in the Middle East, the political environment and trade issues that have resulted in some economic uncertainty. If economic conditions worsen then the U.S., Washington state and Puget Sound region experiences anmay experience a more severe economic downturn, and our asset quality could deteriorate, or if we are successful in continuing to grow our loan portfolio, our allowancewhich may become inadequate andrequire material additional provisions for loan losses could be necessary.credit losses.loancredit losses among loan categories and certain other information as of the dates indicated. The allocation of the allowance for loancredit losses as shown in the table should neither be interpreted as an indication of future charge-offs, nor as an indication that charge-offs in future periods will necessarily occur in these amounts or in the indicated proportions. The total allowance is available to absorb losses from any loan category.At December 31, 2023 2022 (dollars in thousands) Allowance
Allocated
to Loan
PortfolioLoan
Category
as a % of
Total
LoansAllowance
Allocated
to Loan
PortfolioLoan
Category
as a % of
Total
LoansCommercial and industrial loans $ 8,877 9.6 % $ 4,831 11.8 % Real estate loans: Construction, land and land development loans 6,386 5.2 7,425 8.1 Residential real estate loans 13,049 15.3 4,142 17.1 Commercial real estate loans 7,441 43.0 5,470 39.8 Consumer and other loans 81,205 26.9 50,996 23.2 Total allocated 116,958 72,864 Unallocated — 1,165 Total allowance for credit losses $ 116,958 $ 74,029
Securitiespledgepledged for public deposits or other business purposes. At December 31, 2018, 87.8%2023, 66.1% of our investment portfolio consisted primarily of U.S. Treasury securities. The remainder of our securities portfolio was invested in U.S. Government agency securities, agencyAgency collateralized mortgagesecurities, and municipal bonds.securities. Because we target a loan-to-deposit ratio in the range of 90% to 100%, we prioritize liquidity over the earnings of our securities portfolio. At December 31, 2018,2023, our loan-to-deposit ratio was 95.6%90.1% due to our strong growth in both loans and ourdeposits. Our securities portfolio represented less than 5% of assets. To the extent our securities represent more than 5% of assets, absent an immediate need for liquidity, we anticipate investing excess funds to provide a higher return.2018,2023, the carrying amountamortized cost of our investment securities totaled $37.9$150.9 million, a decreasean increase of $414,000,$49.6 million, or 1.1%49.0%, compared to $38.3$101.3 million as of December 31, 2017. The decrease in the securities portfolio was primarily the result of the decline in fair value and pay-downs on mortgage-backed securities. As of December 31, 2017, the carrying amount of our investment securities totaled $38.3 million, an increase of $3.3 million, or 9.4%, compared to $35.0 million as of December 31, 2016.2022. The increase in the securities portfolio was due primarily to the investmentpurchase of excess cash and cash equivalent balances. Investment16 government agency backed securities represented 4.0% and 4.8%, and 4.8% of total assets as offor $50.2 million during the year ended December 31, 2018, 20172023. These securities were purchased for CRA purposes and 2016, respectively.As of December 31, As of December 31, 2023 2023 2022 (dollars in thousands) (dollars in thousands) Amortized
CostFair
ValueAmortized
CostFair
ValueU.S. Treasury securities U.S. Treasury securities U.S. Agency collateralized mortgage obligations U.S. Agency collateralized mortgage obligations U.S. Agency residential mortgage-backed securities U.S. Agency residential mortgage-backed securities U.S. Agency residential mortgage-backed securities U.S. Agency residential mortgage-backed securities 2018,2023, we did not hold any Fannie Mae or Freddie Mac preferred stock, corporate equity, collateralized debt obligations, collateralized loan obligations, structured investment vehicles, private label collateralized mortgage obligations, subprime, Alt-A or second lien elements in our investment portfolio.Our management evaluates securities for other-than-temporary impairment on at least a quarterly basis, and more frequently when economic or market conditions warrant such an evaluation.2018,2023 and December 31, 2017 and 2016,2022, we did not own securities of any one issuer, other than the U.S. Government and its agencies, for which aggregate adjusted cost exceeded 10.0% of consolidated shareholders’ equity.
Restricted equity securities totaled $6.8 million as of December 31, 2023 and $7.5 million as of December 31, 2022 The decrease was attributable to a reduction of the amount of FHLB stock that we are required to hold. Federal Reserve and FHLB stock are carried at par and do not have a readily determinable fair value. Ownership of FHLB stock is restricted to the FHLB and member institutions, and can only be purchased and redeemed at par.For the Twelve Months Ended
December 31,(dollars in thousands) 2023 2022 2021 Carrying value, beginning of period $ 2,572 $ 2,322 850 Purchases 50 350 — Observable price change — (100) 1,472 Carrying value, end of period $ 2,622 $ 2,572 $ 2,322 For the Twelve Months Ended
December 31,(dollars in thousands) 2023 2022 2021 Carrying value, beginning of period 456 160 — Purchases/capital calls/capital returns, net 75 349 163 Net change recognized in earnings 278 (53) (3) Carrying value, end of period 809 456 160 As of December 31, 2023 As of December 31, 2023 One Year or Less One Year or Less More than Ten Years Total (dollars in thousands) (dollars in thousands) Carrying
ValueCarrying
ValueCarrying
ValueCarrying
ValueCarrying
ValueWeighted
Average
YieldSecurities available-for-sale: U.S. Treasury securities U.S. Treasury securities U.S. Treasury securities $ 99,461 2.138 % $ - 0.000 % $ - 0.000 % $ - 0.000 % $ 99,461 2.138 % U.S. Agency collateralized mortgage obligations U.S. Agency collateralized mortgage obligations - 0.000 % - 0.000 % 43 2.924 % — 0.000 % 43 2.924 % Total available-for-sale Total available-for-sale 99,461 2.138 2.138 % — 0.000 0.000 % 43 2.924 2.924 % — 0.000 0.000 % 99,504 2.138 2.138 % Securities held to maturity: Securities held to maturity: U.S. Agency residential mortgage-backed securities U.S. Agency residential mortgage-backed securities - 0.000 % - 0.000 % - 0.000 % 51,041 5.489 % 51,041 5.489 % Total held to maturity - 0.000 0.000 % - 0.000 0.000 % - 0.000 0.000 % 51,041 5.489 5.489 % 51,041 5.489 5.489 % Total Total $ 99,461 2.138 % $ — 0.000 % $ 43 2.924 % $ 51,041 5.489 % $ 150,545 3.267 %
Depositssavings, money market, savings, and time accounts.accounts as well as IntraFi network reciprocal sweep deposits. Sweep deposits enable us to provide an FDIC insured deposit option to customers that have balances in excess of the FDIC insurance limit. This service trades our customers’ funds as certificates of deposit or interest bearing demand deposits in increments under the FDIC insured amount to other participating financial institutions and in exchange we receive time deposit or interest bearing demand investments from participating financial institutions in a reciprocal agreement. We rely primarily on competitive pricing policies, convenient locations, electronic delivery channels (internet and mobile), and personalized service to attract new deposits and retain theseexisting deposits. 2018,2023 were $803.6 million,$3.36 billion, an increase of $100.3$542.8 million, or 14.3%19.3%, compared to $703.3$2.82 billion as of December 31, 2022. The increase in deposits was largely in core deposits, which increased $655.5 million to $3.34 billion from $2.69 billion at December 31, 2022. We define core deposits as all deposits except time deposits and brokered deposits. The $655.5 million increase in core deposits was largely a result of customer movement from noninterest to interest bearing accounts. Our cost of deposits for the community bank was 1.57% for the three months ended December 31, 2023. BaaS-brokered deposits are now classified as NOW accounts due to a change in the relationship agreement with one of our partners; these deposits increased $153.1 million to $254.7 million as of December 31, 2017. 2023. Additionally, we started sweeping deposits for an additional CCBX partner as a result of deposit growth, which increased the amount of CCBX deposits that were transferred off balance sheet for increased FDIC insurance coverage to $69.4 million as of December 31, 2023.2017,2023 were $703.3$625.2 million, an increasea decrease of $54.6$149.8 million, or 8.4%19.3%, compared to $648.7$775.0 million as of December 31, 2016. The increases were primarily related to our successful execution2022. Noninterest bearing deposits represent 18.6% and 27.5% of our strategytotal deposits for December 31, 2023 and December 31, 2022, respectively. Community bank noninterest bearing deposits represent 37.5% and 45.2% of deepening relationships with existing customers and actively seeking new customers.Noninterest-bearingcommunity bank deposits as of December 31, 2018, were $293.5 million, an increase of $51.2 million, or 21.1%, compared to $242.4 million as of2023 and December 31, 2017. Noninterest-bearing deposits as of December 31, 2017, were $242.4 million, an increase of $18.4 million, or 8.2%, compared to $224.0 million as of December 31, 2016. The increases were due to the collaboration of our branch managers, business development officers and lenders to grow core deposits. As a team, we actively pursue the business of new customers.interest-bearinginterest bearing account balances, excluding time deposits, as of December 31, 2018,2023 were $413.0 million,$2.72 billion, an increase of $42.7$703.7 million, or 11.5% from $370.3 million35.0%, compared to $2.01 billion as of December 31, 2017. Total interest-bearing account balances2022. The $703.7 million increase is the due in part to former BaaS-brokered deposits now being classified as NOW accounts due to a change in the relationship agreement with one of our partners in the first quarter of 2023, combined with CCBX growth in interest bearing deposits and a community bank increase in interest bearing deposits of $103.1 million. Included in total deposits is $340.1 million in IntraFi network reciprocal NOW and money market sweep accounts as of December 31, 2017, were $370.3 million, an increase2023, which provides our customers with fully insured deposits through a sweep and exchange of $22.7 million, or 6.5% from $347.6 million as of December 31, 2016. The increases were due to our team focusing on growing core deposits. Included in interest bearing account balances is $10.5 million in brokered demand deposits from a wholesale banking services customer as an accommodation to them. We generally do not use brokered deposits to fund loan growth and we did not use these brokered deposits to fund loan growth. The balance at December 31, 2017 and 2016 was zero. 2018,2023 were $97.0$18.4 million, an increasea decrease of $6.4$11.1 million, or 7.1%37.7%, from $90.6$29.4 million as of December 31, 2017.2022. The decrease is due to the strong increase in totalcore deposits, and our focus on core deposits and letting higher rate deposits run off as they mature. We have seen competitors increase rates on time deposits, during the period was primarily a result of our growth initiatives. Total time deposit balancesand we have not globally matched their rates in response as of December 31, 2017, were $90.6 million, an increase of $13.5 million, or 17.5%, from $77.1 million as of December 31, 2016.As of December 31, As of December 31, 2023 2023 2022 (dollars in thousands) (dollars in thousands) Amount Amount Demand, noninterest bearing $ 625,202 18.6 18.6 % $ 775,012 27.5 27.5 % Total core deposits Brokered deposits Total $ 3,360,363 100.0 100.0 % $ 2,817,521 100.0 100.0 % Cost of deposits Community Bank As of December 31, 2023 December 31, 2022 (dollars in thousands) Balance % to Total Balance % to Total Demand, noninterest bearing $ 561,572 37.5 % $ 694,179 45.2 % NOW and money market 846,072 56.5 709,490 46.1 Savings 71,598 4.8 105,101 6.8 Total core deposits 1,479,242 98.8 1,508,770 98.1 Brokered deposits 1 0.0 1 0.0 Time deposits less than $100,000 8,109 0.5 12,596 0.8 Time deposits $100,000 and over 10,249 0.7 16,851 1.1 Total Community Bank deposits $ 1,497,601 100.0 % $ 1,538,218 100.0 % Cost of deposits 1.57 % 0.37 % CCBX As of December 31, 2023 December 31, 2022 (dollars in thousands) Balance % to Total Balance % to Total Demand, noninterest bearing $ 63,630 3.4 % $ 80,833 6.3 % NOW and money market 1,794,168 96.3 1,094,909 85.6 Savings 4,964 0.3 2,016 0.2 Total core deposits 1,862,762 100.0 1,177,758 92.1 BaaS-brokered deposits — — 101,545 7.9 Total CCBX deposits $ 1,862,762 100.0 % $ 1,279,303 100.0 % Cost of deposits 4.90 % 3.13 % As of December 31, As of December 31, (dollars in thousands) (dollars in thousands) 2023 2022 Three months or less Three months or less Weighted average maturity (in years) Weighted average maturity (in years) 0.75 0.76 2018,2023, were $745.5 million,$3.10 billion, an increase of $80.8$436.5 million, or 12.2%16.4%, compared to the year ended December 31, 2017. Average deposits$2.67 billion for the year ended December 31, 2017, were $664.7 million, an2022. The increase of $82.4 million, or 14.2%, compared to the year ended December 31, 2016. The increases in average deposits werewas primarily due to ouran increase in core deposits, in interest bearing deposits. Included in this increase is growth in CCBX deposits. We expect deposits to increase with continued growth in CCBX as well as in the community bank through our primary market areas, and the increase in commercial lending relationships for which we also seek deposit balances and the results of business development efforts by our business development officers, branch managers, treasury service personnel and lenders.0.66%2.87% for the year ended December 31, 2018,2023, compared to 0.50%0.71% for the year ended December 31, 2017.2022. The average rate paid on total interest-bearing deposits was 0.50%3.72% for the2017, compared to 0.55%2022. NOW and money market account interest rates increased 2.72%, for the year ended December 31, 2016.For the Year Ended December 31, For the Year Ended December 31, 2023 2023 2022 2021 (dollars in thousands) (dollars in thousands) Demand, noninterest bearing $ 707,641 0.00 0.00 % $ 942,087 0.00 0.00 % $ 989,945 0.00 0.00 % NOW and money market 2,254,138 3.89 3.89 1,509,492 1,509,492 1.17 1.17 740,045 740,045 0.24 0.24 % Savings 90,705 0.25 0.25 106,061 106,061 0.05 0.05 93,409 93,409 0.03 0.03 % BaaS-brokered deposits BaaS-brokered deposits 25,969 4.08 71,532 1.46 26,020 0.35 % Time deposits less than $100,000 9,999 0.35 0.35 13,980 13,980 0.28 0.28 16,838 16,838 1.06 1.06 % Time deposits $100,000 and over 14,201 0.37 0.37 22,955 22,955 0.85 0.85 33,794 33,794 0.71 0.71 % Total deposits $ 3,102,653 2.87 2.87 % $ 2,666,107 0.71 0.71 % $ 1,900,051 0.12 0.12 % 2018, 20172023 and 2016,2022, was 35.8%, 35.1%22.8% and 34.0%35.3%, respectively.0.80%, 0.64%3.75% and 0.63%1.16% for the years ended December 31, 2018, 20172023 and 2016,2022, respectively. The increasein our cost of deposits in 20182023 was primarily due to higher deposit rates throughout the market resulting from rate increases from the Federal Reserve.FOMC. We actively manage our interest rates on deposits, however, additional increasesrate changes from the Federal Reserve willFOMC and competition can and do impact our deposit costs.decrease inFDIC insures our costdeposits up to $250,000 per depositor, per insured bank for each account ownership category. Deposits that exceed insurance limits are uninsured. At December 31, 2023, deposits totaled $3.36 billion, of which total estimated uninsured deposits were $558.6 million, or 16.6% of total deposits. At December 31, 2022, deposits totaled $2.82 billion, of which total estimated uninsured deposits were $835.8 million, or 29.7% of total deposits. The Bank is using sweep deposits to provide our customers with fully insured deposits through a sweep and exchange of deposits in 2017 was primarily due to pricing tactics used in 2016 to lower our deposit costs prior to interest rates increasing. Our last rate reduction was in December 2016. In 2017, we limited our deposit rates increases and received almost a full year savings onwith other financial institutions.rate reductions we deployed in 2016.estimated uninsured time deposits, by account, for the maturity periods indicated:(dollars in thousands) As of December 31, 2023 Maturity Period: Three months or less $ 1,479 Over three through six months 52 Over six through twelve months 8 Over twelve months 152 Total $ 1,691 (FHLB) Advances.The FHLB allows us to borrow against our line of credit, which is collateralized by certain loans. As of December 31, 2018, 20172023 and 2016, totalDecember 31, 2022, we had borrowing capacity of $79.3$204.6 million $59.3 million and $60.2$120.8 million, respectively, was available under this arrangement. As ofwith the FHLB. During the year ended December 31, 20182022, we repaid a total of $25.0 million in FHLB term advances. This included a $10.0 million advance that would have matured in March of 2023 and 2017, FHLB advances totaled $20.0 million, compared to $15.0 million at December 31, 2016.As of and For the Years
Ended December 31,(dollars in thousands) 2023 2022 Maximum amount outstanding at any month-end during period: $ — $ 24,999 Average outstanding balance during period: $ 1 $ 6,029 Weighted average interest rate during period: 5.60 % 1.13 % Balance outstanding at end of period: $ — $ — Weighted average interest rate at end of period: 0.00% 0.00 % I, or the Trust,(the “Trust”), of which we own all of the outstanding common securities. The Trust used the proceeds from the issuance of its underlying common securities and preferred securities to purchase the debentures issued by the Company. These debentures are the Trust’s only assets and the interest payments from the debentures finance the distributions paid on the preferred securities. ThePrior to June 30, 2023, the debentures bearbore interest at a rate per annum equal to the 3-month LIBOR plus 2.10%. Beginning with rate adjustments subsequent to June 30, 2023, the rate is based off three-month CME Term SOFR plus 0.26%. The effective rate as of December 31, 2018, 20172023 and 2016,2022, was 4.88%, 3.69%7.75% and 3.06%6.87%, respectively. We generally have the right to defer payment of interest on the debentures at any time or from time to time for a period not exceeding five years provided that no extension period may extend beyond the stated maturity of the debentures. During any such extension period, distributions on the trust’sTrust’s preferred securities will also be deferred, and our ability to pay dividends on our common stock will be restricted. The Trust’s preferred securities are mandatorily redeemable upon maturity of the debentures, or upon earlier redemption as provided in the indenture.indenture, subject to Federal Reserve approval. If the debentures are redeemed prior to maturity, the redemption price will be the principal amount and any accrued but unpaid interest. We unconditionally guarantee payment of accrued and unpaid distributions required to be paid on the Trust Securitiessecurities subject to certain exceptions, the redemption price with respect to any Trust securities called for redemption and amounts due if the Trust is liquidated or terminated.Debt.Debt. In 2016,August 2021, the Company issued a subordinated note to a commercial bank in the amount of $10.0$25.0 million. The note matures on AugustSeptember 1, 2026,2031, and bears interest at the rate of 5.65%3.375% per year for five years and, thereafter, reprices quarterly beginning September 1, 2026, at a rate equal to the three-month SOFR plus 2.76%. The Wall Street Journal prime rate plus 2.50%. Principal payments of $500,000 per quarter commence Novemberfive-year 3.375% interest period ends on September 1, 2021.2026. We may redeem the subordinated note, in whole or in part, without premium or penalty, in principal redemption multiples of $1,000, after July 29, 2021,August 18, 2026, subject to any required regulatory approvals. Proceeds were used to repay $10.0 million in existing 5.65% interest subordinated debt on August 9, 2021 and $11.5 million was contributed to the Bank as capital.Our liquidity position is supported by management Unlike many industrial companies, substantially all of our liquid assets and liabilities are monetary in nature. As a result, interest rates have a more significant impact on our performance than the effects of general levels of inflation. Interest rates may not necessarily move in the same direction or in the same magnitude as the prices of goods and access to alternative sourcesservices. However, other operating expenses do reflect general levels of funds. inflation.wholesaleBaaS deposits, advances from the FHLB and proceeds from the sale of loans. Less commonly used sources of funding include borrowings from the Federal Reserve discount window, draws on established federal funds lines from unaffiliated commercial banks, funds from online rate services, brokered deposits, a one-way buy through an ICS account, and the issuance of debt or equity securities. We believe we have ample liquidity resources to fund future growth and meet other cash needs as necessary.costscosts. During the year ended December 31, 2023, the Company contributed $15.0 million to the Bank. The Company currently holds $5.5 million in cash for the next two or three years.debt servicing and operating purposes. In addition, the Bank can declare and pay dividends to the Company to meet the Company’s debt and operating expenses. There are statutory and regulatory limitations that affect the ability of the Bank to pay dividends to the Company. We believe that these limitations will not impact the ability of the Bank to pay dividends to the Company to meet ongoing operating needs.manages toestablished a minimum (regulatory calculation) liquidity ratio of 10% of assets., and usually targets a liquidity ratio between 12% and 15%. Both of these minimum liquidity levels are on-balance sheet sources. Per policythe Bank’s policies and the Bank’sits liquidity contingency plan, in event of a liquidity emergency the Bank can utilize wholesale funds in an amount up to 30% of assets. Since the Bank uses only a small portion of its borrowing or wholesale funding capacity, the Bank has access to funds if needed in a liquidity emergency.become subject to regulatory capital requirements once its consolidated assets exceed a certain threshold. That threshold is currently $3.0 billion, but the EGRRCPA requiresno longer prepare and file financial reports with the Federal Reserve to lift the threshold to $3.0 billion by November 21, 2018. See “Item 1: Business—Supervision and Regulation—Bank Regulation and Supervision—Capital Adequacy” for additional discussion regarding the regulatory capital requirements applicable to the Bank.as a small bank holding company. of each of December 31, 20182023, and 2017,December 31, 2022, the Company and the Bank waswere in compliance with all applicable regulatory capital requirements, and the Bank was classified as “well capitalized” for purposes of the Federal Reserve’s prompt corrective action regulations. As we deploy our capital and continue to grow our operations, our regulatory capital levels may decrease depending on our level of earnings. However, we expect to monitor and control our growth in order to remain in compliance with all regulatory capital standards applicable to us.CompanyCompany’s and the Bank’s regulatory capital ratios as of the dates presented, as well as the regulatory capital ratios that are required by Federal Reserve regulations to maintain “well-capitalized” status:Actual Actual Required to be Well
Capitalized
Under the Prompt
Corrective Action
Provisions(dollars in thousands) (dollars in thousands) Amount Ratio Amount Ratio Amount Ratio December 31, 2023 Tier 1 Leverage Capital Tier 1 Leverage Capital Tier 1 Leverage Capital Company Company $ 298,920 8.10 8.10 % $ 147,616 4.00 4.00 % N/A Bank Only 333,848 9.06 9.06 % 147,469 4.00 4.00 % 184,336 5.00 5.00 % Common Equity Tier 1 Capital (to risk-weighted assets) Company Company 295,450 9.10 9.10 % 146,137 4.50 4.50 % N/A Bank Only 333,848 10.30 10.30 % 145,875 4.50 4.50 % 210,708 6.50 6.50 % Tier 1 Capital (to risk-weighted assets) Company Company 298,920 9.20 9.20 % 194,849 6.00 6.00 % N/A Bank Only 333,848 10.30 10.30 % 194,500 6.00 6.00 % 259,334 8.00 8.00 % Company 385,464 11.87 11.87 % 259,799 8.00 8.00 % N/A Bank Only 375,320 11.58 11.58 % 259,334 8.00 8.00 % 324,167 10.00 10.00 % December 31, 2022 Tier 1 Leverage Capital Tier 1 Leverage Capital Tier 1 Leverage Capital Company Company $ 204,585 8.07 8.07 % $ 101,460 4.00 4.00 % N/A Bank Only 201,783 7.96 7.96 % 101,350 4.00 4.00 % 126,687 5.00 5.00 % Common Equity Tier 1 Capital (to risk-weighted assets) Company Company Company 201,085 11.06 % 81,834 4.50 % N/A Bank Only Bank Only 201,783 11.12 % 81,623 4.50 % 117,900 6.50 % Tier 1 Capital (to risk-weighted assets) Company Company 204,585 11.25 11.25 % 109,112 6.00 6.00 % N/A Bank Only 201,783 11.12 11.12 % 108,830 6.00 6.00 % 145,107 8.00 8.00 % Company Company 252,405 13.88 % 145,483 8.00 % N/A Bank Only 224,545 12.38 12.38 % 145,107 8.00 8.00 % 181,384 10.00 10.00 %
(1) Presents the minimum capital adequacy requirements that apply to the Bank (excluding the capital conservation buffer) and the Company. The capital conservation buffer is an additional 2.5% of the amount necessary to meet the minimum risk-based capital requirements for total, tier 1, and common equity tier 1 risk-based capital. Prior to September 30, 2022, the Company operated under the Small Bank Holding Company Policy Statement and therefore was not subject to Basel III capital adequacy requirements.summarizesprovides the material cash requirements from known contractual obligations and other commitments to make future payments (other than non-time deposit obligations), which consist of future cash payments associated with our contractual obligations as of December 31, 2018.2023:Payments Due by Period (dollars in thousands) Total Less than
1 YearOver
1 yearOther (1) Cash requirements Time Deposits $ 18,358 $ 13,999 $ 4,359 $ — Subordinated notes 45,000 — 45,000 — Junior subordinated debentures 3,609 — 3,609 — Deferred compensation plans 760 175 585 — Operating leases 7,335 1,016 6,319 — Non-maturity deposits 3,342,005 — — 3,342,005 Equity investment commitment 653 653 — — For a discussion(1)Represents the undefined maturity of our borrowings, see “—Financial Condition—Borrowings.”believe that will we be ablemaintain sufficient cash and cash equivalents and investment securities to meet short-term cash requirements and the levels of these assets are dependent on our contractual obligations as they come due. Adequateoperating, investing and financing activities during any given period. Cash on hand, cash levelsat third-party banks, investments available-for-sale and maturing or prepaying balances in our investment and loan portfolios are expectedour most liquid assets. Other sources of liquidity that are routinely available to us include funds from retail, commercial, and BaaS deposits, advances from the FHLB and proceeds from the sale of loans. Less commonly used sources of funding include borrowings from the Federal Reserve discount window, draws on established federal funds lines from unaffiliated commercial banks, funds from online rate services, brokered funds, a one-way buy through profitability, repayments from loansan ICS account, and securities, deposit gathering activity, access to borrowing sources and periodic loan sales.Off-Balance Sheet Items(dollars in thousands) As of December 31, 2023 As of December 31, 2022 Commitments to extend credit: Commercial and industrial loans $ 86,134 $ 81,568 Commercial and industrial loans - capital call lines 608,837 772,732 Construction – commercial real estate loans 92,709 109,715 Construction – residential real estate loans 20,825 32,827 Residential real estate loans 465,887 374,735 Commercial real estate loans 54,289 35,024 Consumer and other loans 1,015,738 793,563 Total commitments to extend credit $ 2,344,419 $ 2,200,164 Standby letters of credit $ 1,096 $ 3,064 Equity investment commitment $ 653 $ 988 (dollars in thousands) As of December 31, 2023 As of December 31, 2022 Commitments to extend credit: Commercial and industrial loans $ 617,981 $ 773,684 Residential real estate loans 418,761 329,193 Consumer and other loans 1,015,156 792,447 Total commitments to extend credit $ 2,051,898 $ 1,895,324 As of December 31, 2023 As of December 31, 2022 (dollars in thousands) Type of Lending Maximum Portfolio Size Increase/(decrease) Commercial and industrial loans: Capital call lines Business - Venture Capital $ 350,000 $ 350,000 $ — All other commercial & industrial loans Business - Small Business 305,905 65,856 240,049 Real estate loans: Home equity lines of credit Home Equity - Secured Credit Cards 375,000 250,000 125,000 Consumer and other loans: Credit cards Credit Cards - Primarily Consumer 756,614 600,770 155,844 Installment loans Consumer 933,374 1,048,134 (114,760) Other consumer and other loans Consumer - Secured Credit Builder & Unsecured consumer 709,108 190,240 518,868 $ 3,430,001 $ 2,505,000 $ 925,001 Total Existing Portfolio Size $ 1,195,938 $ 1,012,504 $ 183,434 Twelve Months Ended December 31,
2023December 31,
2022December 31,
2020December 31,
2019December 31,
2018Return on average assets 1.28 % 1.38 % 0.98 % 1.28 % 1.14 % Return on average equity 16.41 % 18.24 % 11.44 % 11.29 % 11.40 % Yield on earnings assets 9.82 % 6.68 % 4.21 % 4.90 % 4.72 % Yield on loans receivable 10.60 % 8.12 % 4.64 % 5.38 % 5.18 % Cost of funds 2.91 % 0.75 % 0.40 % 0.73 % 0.52 % Cost of deposits 2.87 % 0.71 % 0.35 % 0.65 % 0.42 % Net interest margin 7.10 % 5.97 % 3.83 % 4.23 % 4.24 % Noninterest expense to average assets 5.90 % 5.65 % 2.47 % 3.01 % 3.09 % Noninterest income to average assets 5.97 % 4.23 % 0.53 % 0.80 % 0.64 % Efficiency ratio 45.92 % 56.26 % 58.14 % 61.79 % 65.08 % 90.1 % 93.2 % 108.9 % 97.0 % 95.6 % Loan income and related loan expense Year. Ended (dollars in thousands) December 31,
2023December 31,
2022December 31,
2021BaaS loan interest income $ 204,458 $ 102,808 $ 6,532 Less: BaaS loan expense 86,900 53,294 2,976 117,558 49,514 3,556 9.71 % 6.67 % 2.43 % Yield on loans 16.89 % 13.85 % 4.46 % Interest income Year Ended (dollars in thousands; unaudited) December 31,
2023December 31,
2022December 31,
2021Loan interest income $ 204,458 $ 102,808 $ 6,532 Total BaaS interest income $ 204,458 $ 102,808 $ 6,532 Interest expense Year Ended (dollars in thousands; unaudited) December 31,
2023December 31,
2022December 31,
2021BaaS interest expense $ 71,646 $ 16,108 $ 99 Total BaaS interest expense $ 71,646 $ 16,108 $ 99 Year Ended (dollars in thousands; unaudited) December 31,
2023December 31,
2022December 31,
2021BaaS program income: Servicing and other BaaS fees $ 3,855 $ 4,408 $ 4,467 Transaction fees 4,011 3,211 544 Interchange fees 4,252 2,583 701 Reimbursement of expenses 4,175 2,732 1,004 BaaS program income 16,293 12,934 6,716 BaaS indemnification income: BaaS credit enhancements 177,764 76,374 9,086 BaaS fraud enhancements 7,165 29,571 1,505 BaaS indemnification income 184,929 105,945 10,591 Total noninterest BaaS income $ 201,222 $ 118,879 $ 17,307 Year Ended (dollars in thousands; unaudited) December 31,
2023December 31,
2022December 31,
2021BaaS loan expense $ 86,900 $ 53,294 $ 2,976 BaaS fraud expense 7,165 29,571 1,505 Total BaaS loan and fraud expense $ 94,065 $ 82,865 $ 4,481 As of and for the Year Ended (dollars in thousands) December 31,
2023December 31,
2022December 31,
2021Net BaaS loan income divided by average CCBX loans: CCBX loan yield (GAAP) 16.89 % 13.85 % 4.46 % Total average CCBX loans receivable $ 1,210,413 $ 742,392 $ 146,304 Interest and earned fee income on CCBX loans (GAAP) 204,458 102,808 6,532 BaaS loan expense (86,900) (53,294) (2,976) Net BaaS loan income $ 117,558 $ 49,514 $ 3,556 Net BaaS loan income divided by average CCBX loans 9.71 % 6.67 % 2.43 % Net interest margin, net of BaaS loan expense: CCBX interest margin 9.65 % 8.84 % 4.40 % CCBX earning assets 1,574,334 1,027,556 146,304 Net interest income 151,883 90,806 6,433 Less: BaaS loan expense (86,900) (53,294) (2,976) Net interest income, net of BaaS $ 64,983 $ 37,512 $ 3,457 CCBX net interest margin, net of BaaS loan expense 4.13 % 3.65 % 2.36 % interest-earninginterest earning assets and interest-bearinginterest bearing liabilities, other than those which have a short term to maturity. Interest rate risk is the potential for economic losses due to future interest rate changes. These economic losses can be reflected as a loss of future net interest income and/or a decrease in current fair market values. Our objective is to measure the effect on net interest income and to adjust the balance sheet to minimize the inherent risk while at the same time maximizing income.or ALCO,(“ALCO”), of the Bank and reviewed by the Asset Liability and Investment Committee of our board of directors in accordance with policies approved by our board of directors. ALCO formulates strategies based on appropriate levels of interest rate risk. In determining the appropriate level of interest rate risk, ALCO considers the impact on earnings and capital on the current outlook on interest rates, potential changes in interest rates, regional economies, liquidity, business strategies and other factors. ALCO meets regularly to review, among other things, the sensitivity of assets and liabilities to interest rate changes, the book and market values of assets and liabilities, unrealized gains and losses, purchase and sale activities, commitments to originate loans and the maturities of investments and borrowings. Additionally, ALCO reviews liquidity, cash flows, maturities of deposits and consumer and commercial deposit activity. Management employs various methodologies to manage interest rate risk including an analysis of relationships between interest-earninginterest earning assets and interest-bearinginterest bearing liabilities and interest ratequarterlyregularly to review the Bank’s interest rate risk profile, liquidity position, including contingent liquidity, and investment portfolio.(unaudited) Change in Market Interest Rates Change in Market Interest Rates Twelve Month Projection
As of December 31, 2023Twelve Month Projection
As of December 31, 2022+400 basis points +400 basis points (6.2)% 15.2% +300 basis points (4.6)% 11.4% +200 basis points (3.0)% 7.6% +100 basis points (1.4)% 3.8% -100 basis points 1.1% (4.1)% -200 basis points 1.8% (8.5)% -300 basis points 2.1% (13.0)% -400 basis points -400 basis points 2.2% (18.8)% Dynamic Balance Sheet and Rate Shifts Dynamic Balance Sheet and Rate Shifts +400 basis points +400 basis points (1.3)% 17.6% +300 basis points (0.9)% 13.2% +200 basis points (0.5)% 8.8% +100 basis points (0.2)% 4.4% -100 basis points (0.1)% (4.6)% -200 basis points (0.6)% (9.5)% -300 basis points (1.5)% (14.5)% -400 basis points -400 basis points (2.8)% (20.8)% BankCompany’s static balance sheet has shifted to liability sensitive, however, the dynamic balance sheet is fairly neutral to rate shifts. As the Company’s composition has shifted over time due to the growth of the CCBX segment to more variable/adjustable in nature, our interest rate risk profile has been mitigated, reducing variability in both rising and falling rate environments, as the community bank and CCBX segments work to offset one another. The community bank segment remains asset sensitive and generally performs better in an increasing interest rate environment. The resultsFor the community bank, the drivers are primarily due to behavior of demand, money market and savings deposits during such rate fluctuations. We have found that, historically, interestoffering rates on these community bank deposits change more slowly than changes in short-term market rates. For the discountCCBX segment, the offering rates on the loan portfolio are modeled using partner contractual net yields which mostly adjust with market shifts. For this CCBX portfolio, the offering rates on the majority of the loans and federal fundsthe deposits nearly fully reprice with changes in market rates. This assumptionHowever, during the fourth quarter 2023, one of the material CCBX lending partners contractual yields converted to a fixed rate product, continuing to reduce the overall variability in the Company’s balance sheet. As of December 31, 2023 the overall Company’s funding mix is incorporated intonow more heavily weighted towards the simulation model.CCBX deposits which are primarily variable rate deposits aiding with the neutrality of the balance sheet and the overall shift to liability sensitive. The assumptions incorporated into the simulation model are inherently uncertain and, as a result, the model cannot precisely measure future net interest income or precisely predict the impact ofthat fluctuations in market interest rates have on net interest income. Actual results will differ from the model’s simulated results due to timing, magnitude, and frequency of interest rate changes as well as changes in market conditions, the shape of the interest yield curve, and the application and timing of various assumptions and strategies.reportReport on Form 10-K have been prepared in accordance with GAAP. GAAP requires the measurement of financial position and operating results in terms of historical dollars, without considering changes in the relative value of money over time due to inflation or recession.Our accounting policies are integral to understanding our resultsFor further discussion of operations. Our accounting policies are described in greater detail in Note 1the risks to our consolidated financial statements included elsewhere is this report. We believe that of our accounting policies,business resulting from inflation, see “Item 1A. Risk Factors” and the following may involve a higher degree of judgment and complexity:SecuritiesSecuritiessection captioned “Risks Related to Credit Matters-We are classified as available for sale when they might be sold before maturity. Securities available for sale are carried at fair value. Unrealized gains and losses are excluded from earnings and reported in other comprehensive income. Securities within the available for sale portfolio may be used as part of our asset/liability strategy and may be sold in responsesubject to changes in interest rate risk prepayment risk or other similar economic factors. Securities held to maturity are carried at cost, adjusted for the amortization of premiums and the accretion of discounts.Interest earned on these assets is included in interest income. Interest income includes amortization of purchase premium or discount. Premiums and discounts on securities are amortized using the level-yield method, except for mortgage backed securities where prepayments are anticipated. Gains and losses on sales are recorded on the trade date and determined using the specific identification method.Management evaluates debt securities for other-than-temporary impairment, or OTTI, on at least a quarterly basis, and more frequently when economic or market conditions warrant such an evaluation. For securities in an unrealized loss position, management considers the extent and duration of the unrealized loss, and the financial condition and near-term prospects of the issuer. Management also assesses whether it intends to sell, or it is more likely than not that it will be required to sell, a security in an unrealized loss position before recovery of its amortized cost basis. If either of the criteria regarding intent or requirement to sell is met, the entire difference between amortized cost and fair value is recognized as impairment through earnings. For debt securities that do not meet the aforementioned criteria, the amount of impairment is split into two components as follows: (1) OTTI related to credit loss, which must be recognized in the income statement, and (2) OTTI related to other factors, which is recognized in other comprehensive income, net of applicable taxes. The credit loss is defined as the difference between the present value of the cash flows expected to be collected and the amortized cost basis. The previous amortized cost basis less the OTTI recognized in earnings becomes the new amortized cost basis of the security.Loans Held for InvestmentLoans held for investment are those that management has the intent and ability to hold for the foreseeable future or until maturity or payoff are reported at the principal balance outstanding, net of deferred loan fees and costs, and an allowance for loan losses. Loans are typically secured by specific items of collateral including business assets, consumer assets, and commercial and residential real estate. Commercial loans are expected to be repaid from cash flow from operations of businesses. Interest income is accrued on the unpaid principal balance. Loan origination fees and certain direct origination costs are deferred and recognized as adjustments to interest income using a level yield methodology and a method approximating the level yield methodology.Allowance for Loan LossesThe allowance for loan losses represents management’s estimate of probable and reasonably estimable credit losses inherent in the loan portfolio. In determining the allowance, the Company estimates losses on individual impaired loans, or groups of loans which are not impaired, where the probable loss can be identified and reasonably estimated. On a quarterly basis, the Company assesses the risk inherent in the Company’s loan portfolio based on qualitative and quantitative trends in the portfolio, including the internal risk classification of loans, historical loss rates, changes in the nature and volume of the loan portfolio, industry or borrower concentrations, delinquency trends, detailed reviews of significant loans with identified weaknesses and the impacts of local, regional and national economic factors on the quality of the loan portfolio. Based on this analysis, the Company records a provision for loan losses to maintain the allowance at appropriate levels.Determining the amount of the allowance is considered a critical accounting estimate, as it requires significant judgment and the use of subjective measurements, including management’s assessment of overall portfolio quality. The Company maintains the allowance at an amount the Company believes is sufficient to provide for estimated losses inherent in the Company’s loan portfolio at each balance sheet date, and fluctuations in the provision for loan lossesinterest rates may result from management’s assessment of the adequacy of the allowance. Changes in these estimates and assumptions are possible and may have a material impact on the Company’s allowance, and therefore the Company’s financial position, liquidity or results of operations.Transfers of Financial AssetsManagement accounts for the transfers of financial assets as sales when control over the assets has been surrendered. Control is surrendered when the assets have been isolated, a transferee obtains the right to pledge or exchange the transferred assets and there is no agreement to repurchase the assets before their maturity. Management believes the loan participations sold subject to this guidance met the condition to be treated as a sale.Stock-based CompensationWe grant stock options and restricted stock toadversely affect our employees and directors. We record the related compensation expense based on the grant date fair value calculated in accordance with the authoritative guidance issued by FASB. We recognize these compensation costs on a straight-line basis over the requisite service period of the award. We estimate the grant date fair value of stock options using the Black-Scholes valuation model. Stock-based compensation expense related to awards of restricted stock is based on the fair value at the grant date.The determination of fair value using the Black-Scholes model is affected by the price of our common stock, as well as the input of other subjective assumptions. These assumptions include, but are not limited to, the expected term of stock options and our stock price volatility. As there has been no public market for our common stock prior to July 20, 2018, the estimated fair value of our common stock was determined by our board of directors as of the date of each option grant, with input from management, based on our board of directors’ assessment of objective and subjective factors that it believed were relevant. The factors considered by our board of directors included the prices of known transactions in our common stock, the book value per share of our common stock, and our board of directors’ understanding of pricing multiples for comparable financial institutions that were not publicly traded.The assumptions underlying these valuations represented management’s best estimate, which involved inherent uncertainties and the application of management’s judgment. As a result, if we had used different assumptions or estimates, the fair value of our common stock and our stock-based compensation expense could have been materially different.Emerging Growth CompanyThe JOBS Act permits an “emerging growth company” to take advantage of an extended transition period to comply with new or revised accounting standards applicable to public companies. However, we have decided not to take advantage of this provision. As a result, we will comply with new or revised accounting standards to the same extent that compliance is required for non-emerging growth companies. Our decision to opt out of the extended transition period under the JOBS Act is irrevocable.Recently Issued Accounting PronouncementsFor a discussion of the expected impact of accounting pronouncements recently issued but not adopted by us as of December 31, 2018, see Note 2 of our audited consolidated financial statements included elsewhere in this report.7:7. Management’s Discussion and Analysis of Results of OperationsFinancial Condition and Financial Condition.Operations-Quantitative and Qualitative Disclosures about Market Risk.”is included beginning on page F-1follows.this report.Item 9. Changes in and Disagreements with Accountants on Accounting and Financial DisclosureNone.Item 9A. Controls and ProceduresConclusion Regarding the Effectiveness of Disclosure Controls and ProceduresAn evaluation was performed under the supervision and with the participation of the Company’s management, including the Chief Executive Officer and the Chief Financial Officer, of the effectiveness of the design and operation of the Company’s disclosure controls and procedures (as defined in Rule 13a-15(e) promulgated under the Exchange Act) as of December 31, 2018. In designing and evaluating the Company’s disclosure controls and procedures, the Company and its management recognize that any controls and procedures, no matter how well-designed and operated, can provide only a reasonable assurance of achieving the desired control objectives, and management necessarily was required to apply its judgment in evaluating and implementing possible controls and procedures. Based on that evaluation, the Company’s management, including the Chief Executive Officer and the Chief Financial Officer, concluded that the Company’s disclosure controls and procedures are effective to ensure that information required to be disclosed by the Company in the reports it files or submits under the Exchange Act is recorded, processed, summarized and reported as of the end of the period covered by this annual report.Changes in Internal Control over Financial ReportingThere were no changes in our internal control over financial reporting that occurred during the fourth quarter that have materially affected, or are reasonably likely to materially affect, the Company’s internal control over financial reporting.Management’s Report on Internal Control Over Financial ReportingThis annual report does not include a management’s report regarding internal control over financial reporting due to a transition period established by rules of the Securities and Exchange Commission for newly public companies.None.Item 10. Directors, Executive Officers and Corporate GovernanceBoard of DirectorsFor information relating to the directors of the Company, the section captioned “Items to be Voted on by Stockholders—Item 1—Election of Directors” in the Company’s Proxy Statement for the 2019 Annual Meeting of Stockholders is incorporated herein by reference.Executive OfficersFor information relating to officers of the Company, see Part I, Item 1, “Business— Executive Officers” to this Annual Report on Form 10-K.Compliance with Section 16(a) of the Securities Exchange Act of 1934For information regarding compliance with Section 16(a) of the Securities Exchange Act of 1934, the cover page to this Annual Report on Form 10-K and the section captioned “Other Information Relating to Directors and Executive Officers—Section 16(a) Beneficial Ownership Reporting Compliance” in the Company’s Proxy Statement for the 2019 Annual Meeting of Stockholders are incorporated herein by reference.Disclosure of Code of EthicsFor information concerning the Company’s Code of Ethics, the information contained under the section captioned “Corporate Governance—Code of Ethics and Business Conduct” in the Company’s Proxy Statement for the 2019 Annual Meeting of Stockholders is incorporated by reference. A copy of the Code of Ethics and Business Conduct is available to stockholders on the Company’s website at www.coastalbank.com.Corporate GovernanceFor information regarding the Audit Committee and its composition and the audit committee financial expert, the section captioned “Corporate Governance — Committees of the Board of Directors — Audit Committee” in the Company’s Proxy Statement for the 2019 Annual Meeting of Stockholders is incorporated herein by reference.Item 11. Executive CompensationExecutive CompensationFor information regarding executive compensation, the sections captioned “Executive Compensation” and “Director Compensation” in the Company’s Proxy Statement for the 2019 Annual Meeting of Stockholders are incorporated herein by reference.Corporate GovernanceFor information regarding the compensation committee report, the section captioned “Report of the Compensation Committee” in the Company’s Proxy Statement for the 2019 Annual Meeting of Stockholders is incorporated herein by reference.Item 12. Security Ownership of Certain Beneficial Owners and Management and Related Stockholder Matters(a) Security Ownership of Certain Beneficial OwnersInformation required by this item is incorporated herein by reference to the section captioned “Stock Ownership” in the Company’s Proxy Statement for the 2019 Annual Meeting of Stockholders.(b) Security Ownership of ManagementInformation required by this item is incorporated herein by reference to the section captioned “Stock Ownership” in in the Company’s Proxy Statement for the 2019 Annual Meeting of Stockholders.(c) Changes in ControlManagement of the Company knows of no arrangements, including any pledge by any person or securities of the Company the operation of which may at a subsequent date result in a change in control of the registrant.(d) Equity Compensation Plan InformationThe following table sets forth information about the Company common stock that may be issued upon the exercise of stock options, warrants and rights under all of the Company’s equity compensation plans as of December 31, 2018.Item 13. Certain Relationships and Related Transactions, and Director IndependenceCertain Relationships and Related TransactionsFor information regarding certain relationships and related transactions, the section captioned “Other Information Relating to Directors and Executive Officers—Transactions with Related Persons” in the Company’s Proxy Statement for the 2019 Annual Meeting of Stockholders is incorporated herein by reference.Corporate GovernanceFor information regarding director independence, the section captioned “Corporate Governance—Director Independence” in the Company’s Proxy Statement for the 2019 Annual Meeting of Stockholders is incorporated herein by reference.Item 14. Principal Accountant Fees and ServicesFor information regarding the principal accountant fees and expenses, the section captioned “Items to Be Voted on By Stockholders—Item 2—Ratification of Independent Registered Public Accounting Firm” in the Company’s Proxy Statement for the 2019 Annual Meeting of Stockholders is incorporated herein by reference.Item 15.Exhibits and Financial Statement Schedules(1)The financial statements required in response to this item are incorporated herein by reference from Item 8 of this Annual Report on Form 10-K.
REPORT OF INDEPENDENT REGISTERED PUBLIC ACCOUNTING FIRM(2)All financial statement schedules are omitted because they are not required or applicable, or the required information is shown in the consolidated financial statements or the notes thereto.(3)Exhibits No.DescriptionLocation 3.1Second Amended and Restated Certificate of Incorporation of Coastal Financial CorporationIncorporated herein by reference toExhibit 3.1 to the Company’s Registration Statement on Form S-1 (File No. 333-225715), initially filed on June 19, 2018 3.2Incorporated herein by reference toExhibit 3.2 to the Company’s Registration Statement on Form S-1 (File No. 333-225715), initially filed on June 19, 2018 3.3Amended and Restated Bylaws of Coastal Financial CorporationIncorporated herein by reference toExhibit 3.3 to the Company’s Registration Statement on Form S-1 (File No. 333-225715), initially filed on June 19, 2018 4.0Form of Common Stock Certificate of Coastal Financial CorporationCertain instruments defining the rights of holders of long-term debt securities of the Company and its subsidiaries are omitted pursuant to section (b)(4)(iii)(A) of Item 601 of Regulation S-K. The Company hereby agrees to furnish copies of these instruments to the SEC upon request.Incorporated herein by reference toExhibit 4.1 to the Company’s Registration Statement on Form S-1 (File No. 333-225715), initially filed on June 19, 201810.1Incorporated herein by reference toExhibit 10.1 to the Company’s Registration Statement on Form S-1 (File No. 333-225715), initially filed on June 19, 201810.2Incorporated herein by reference toExhibit 10.2 to the Company’s Registration Statement on Form S-1 (File No. 333-225715), initially filed on June 19, 201810.3Incorporated herein by reference toExhibit 10.3 to the Company’s Registration Statement on Form S-1 (File No. 333-225715), initially filed on June 19, 201810.4Incorporated herein by reference toExhibit 10.4 to the Company’s Registration Statement on Form S-1 (FileNo. 333-225715), initially filed on June 19, 201810.5Incorporated herein by reference toExhibit 10.5 to the Company’s Registration Statement on Form S-1 (File No. 333-225715), initially filed on June 19, 201810.6Incorporated herein by reference toExhibit 10.6 to the Company’s Registration Statement on Form S-1 (File No. 333-225715), initially filed on June 19, 201810.7Commercial Real Estate Lease between JMHLS, LLC and Coastal Community Bank dated June 4, 2008Incorporated herein by reference toExhibit 10.7 to the Company’s Registration Statement on Form S-1 (File No. 333-225715), initially filed on June 19, 201810.8Incorporated herein by reference toExhibit 10.8 to the Company’s Registration Statement on Form S-1 (File No. 333-225715), initially filed on June 19, 201810.9Lease dated October 21, 1996, between certain persons and Coastal Community BankIncorporated herein by reference toExhibit 10.9 to the Company’s Registration Statement on Form S-1 (File No. 333-225715), initially filed on June 19, 201810.10Lease Amendment 1.0 dated as of August 15, 2006, between certain persons and Coastal Community BankIncorporated herein by reference toExhibit 10.10 to the Company’s Registration Statement on Form S-1 (File No. 333-225715), initially filed on June 19, 201810.11Lease Amendment 2.0 dated as of March 31, 2008, between certain persons and Coastal Community BankIncorporated herein by reference toExhibit 10.11 to the Company’s Registration Statement on Form S-1 (File No. 333-225715), initially filed on June 19, 201810.12Lease Amendment 3.0 dated as of June 29, 2009, between certain persons and Coastal Community BankIncorporated herein by reference toExhibit 10.12 to the Company’s Registration Statement on Form S-1 (File No. 333-225715), initially filed on June 19, 201810.13Incorporated herein by reference toExhibit 10.13 to the Company’s Registration Statement on Form S-1 (File No. 333-225715), initially filed on June 19, 201810.14Incorporated herein by reference toExhibit 10.14 to the Company’s Registration Statement on Form S-1 (FileNo. 333-225715), initially filed on June 19, 201810.15Incorporated herein by reference toExhibit 10.15 to the Company’s Registration Statement on Form S-1 (File No. 333-225715), initially filed on June 19, 201810.16Incorporated herein by reference toExhibit 10.20 to the Company’s Registration Statement on Form S-1 (File No. 333-225715), initially filed on June 19, 201810.17Incorporated herein by reference toExhibit 10.21 to the Company’s Registration Statement on Form S-1 (File No. 333-225715), initially filed on June 19, 201810.18Incorporated herein by reference to Exhibit 10.1 to Amendment No. 1 to the Company’s Current Report on Form 8-K/A (File No. 001-38589) filed on March 21, 2019.21.0Filed herewith23.1Filed herewith31.1Rule 13a-14(a)/15d-14(a) Certification of Chief Executive OfficerFiled herewith31.2Rule 13a-14(a)/15d-14(a) Certification of Chief Financial OfficerFiled herewith32.0Section 1350 Certification of Chief Executive Officer and Chief Financial OfficerFiled herewith101.0The following materials from the Company’s Annual Report on Form 10-K for the year ended December 31, 2018, formatted in XBRL (Extensible Business Reporting Language): (i) the Consolidated Balance Sheet, (ii) the Consolidated Statements of Income, (iii) the Consolidated Statements of Comprehensive Income, (iv) the Consolidated Statement of Changes in Shareholders’ Equity, (v) the Consolidated Statements of Cash Flows and (vi) the Notes to the Consolidated Financial StatementsFiled herewith+Management contract or compensatory plan, contract or arrangement.#Portions of this exhibit have been omitted pursuant to a request for confidential treatment and the non-public information has been filed separately with the SEC.None.Pursuant to the requirements of Section 13 or 15(d) of the Securities Exchange Act of 1934, the registrant has duly caused this report to be signed on its behalf by the undersigned, thereunto duly authorized.COASTAL FINANCIAL CORPORATIONDated:March 27, 2019/s/Eric M. SprinkEric M. SprinkPresident and Chief Executive OfficerPursuant to the requirements of the Securities Exchange Act of 1934, this report has been signed below by the following persons on behalf of the registrant and in the capacities and on the dates indicated.NameTitleDate/s/Eric M. SprinkEric M. SprinkPresident and Chief Executive Officer and Director(principal executive officer)March 27, 2019/s/Joel G. EdwardsJoel G. EdwardsExecutive Vice President and Chief Financial Officer(principal financial and accounting officer)March 27, 2019/s/Andrew P. SkotdalAndrew P. SkotdalChairman of the BoardMarch 27, 2019/s/ Christopher D. AdamsChristopher D. AdamsVice Chairman of the BoardMarch 27, 2019/s/ Andrew R. DaleAndrew R. DaleDirectorMarch 27, 2019/s/ John M. Haugen, Jr.John M. Haugen, Jr.DirectorMarch 27, 2019/s/ Steven D. HovdeSteven D. HovdeDirectorMarch 27, 2019/s/ Stephan KleeStephan KleeDirectorMarch 27, 2019/s/ Thomas D. LaneThomas D. LaneDirectorMarch 27, 2019/s/ Gregory A. TisdelGregory A. TisdelDirectorMarch 27, 2019Report of Independent Registered Public Accounting FirmSubsidiarysubsidiaries (the “Company”) as of December 31, 20182023 and 2017,2022, the related consolidated statements of income, comprehensive income, changes in shareholders’ equity and cash flows for each of the three years thenin the period ended December 31, 2023, and the related notes (collectively referred to as the “consolidatedfinancial statements”). In our opinion, the consolidated financial statements present fairly, in all material respects, the consolidated financial position of the Company as of December 31, 20182023 and 2017,2022, and the consolidated results of its operations and its cash flows for each of the three years thenin the period ended December 31, 2023, in conformity with accounting principles generally accepted in the United States of America.Public Company Accounting Oversight Board (United States) (“PCAOB”)PCAOB and are required to be independent with respect to the Company in accordance with the U.S. federal securities laws and the applicable rules and regulations of the Securities and Exchange Commission and the PCAOB.The Company is not required to have, nor were we engaged to perform, an audit of its internal control over financial reporting. As part of our audits we are required to obtain an understanding of internal control over financial reporting but not for the purpose of expressing an opinion on the effectiveness of the Company’s internal control over financial reporting. Accordingly, we express no such opinion.WA27, 2019ASSETS December 31,
2023December 31,
2023December 31,
2022Interest earning deposits with other banks Loans receivable Loans receivable Allowance for credit losses CCBX credit enhancement asset CCBX receivable Operating lease right-of-use assets LIABILITIES AND SHAREHOLDERS’ EQUITY LIABILITIES AND SHAREHOLDERS’ EQUITY Deposits Deposits Subordinated debt, net Subordinated debt, net Subordinated debt, net Principal amount $45,000 (less unamortized debt issuance costs of $856 and $1,001) at December 31, 2023 and December 31, 2022, respectively Principal amount $45,000 (less unamortized debt issuance costs of $856 and $1,001) at December 31, 2023 and December 31, 2022, respectively Principal amount $45,000 (less unamortized debt issuance costs of $856 and $1,001) at December 31, 2023 and December 31, 2022, respectively Junior subordinated debentures, net Principal amount $3,609 (less unamortized debt issuance costs of $19 and $21 at December 31, 2023 and December 31, 2022, respectively) Principal amount $3,609 (less unamortized debt issuance costs of $19 and $21 at December 31, 2023 and December 31, 2022, respectively) Principal amount $3,609 (less unamortized debt issuance costs of $19 and $21 at December 31, 2023 and December 31, 2022, respectively) Operating lease liabilities CCBX payable Preferred stock, no par value: Preferred stock, no par value: Authorized: 25,000,000 shares at December 31, 2023 and December 31, 2022; issued and outstanding: zero shares at December 31, 2023 and December 31, 2022 Authorized: 25,000,000 shares at December 31, 2023 and December 31, 2022; issued and outstanding: zero shares at December 31, 2023 and December 31, 2022 Authorized: 25,000,000 shares at December 31, 2023 and December 31, 2022; issued and outstanding: zero shares at December 31, 2023 and December 31, 2022 Authorized: 300,000,000 shares at December 31, 2023 and December 31, 2022; 13,304,339 shares at December 31, 2023 issued and outstanding and 13,161,147 shares at December 31, 2022 issued and outstanding Authorized: 300,000,000 shares at December 31, 2023 and December 31, 2022; 13,304,339 shares at December 31, 2023 issued and outstanding and 13,161,147 shares at December 31, 2022 issued and outstanding Authorized: 300,000,000 shares at December 31, 2023 and December 31, 2022; 13,304,339 shares at December 31, 2023 issued and outstanding and 13,161,147 shares at December 31, 2022 issued and outstanding Year Ended December 31, Year Ended December 31, 2023 2023 2022 2021 Interest and fees on loans Interest and fees on loans Interest on interest earning deposits with other banks Interest on deposits Interest on deposits PROVISION FOR CREDIT LOSSES Net interest income after provision for credit losses - loans
and unfunded commitmentsNet interest income after provision for credit losses - loans
and unfunded commitmentsNet interest income after provision for credit losses - loans
and unfunded commitmentsDeposit service charges and fees Deposit service charges and fees Unrealized gain (loss) on equity securities, net Unrealized gain (loss) on equity securities, net Unrealized gain (loss) on equity securities, net Gain on sale of bank branch including deposits and loans, net Noninterest income, excluding BaaS program income and BaaS indemnification income Servicing and other BaaS fees Transaction fees Interchange fees Reimbursement of expenses BaaS program income BaaS credit enhancements BaaS fraud enhancements BaaS indemnification income Salaries and employee benefits Salaries and employee benefits Data processing and software licenses Legal and professional expenses Point of sale expense Excise taxes Federal Deposit Insurance Corporation ("FDIC") assessments Marketing Noninterest expense, excluding BaaS loan and BaaS fraud expense 110,712 83,909 58,782 BaaS loan expense 86,900 53,294 2,976 BaaS fraud expense 7,165 29,571 1,505 BaaS loan and fraud expense 94,065 82,865 4,481 Total noninterest expense 204,777 166,774 63,263 Income before provision for income taxes 57,133 50,621 34,377 PROVISION FOR INCOME TAXES 12,554 9,996 7,372 NET INCOME $ 44,579 $ 40,625 $ 27,005 Basic earnings per common share $ 3.36 $ 3.14 $ 2.25 Diluted earnings per common share $ 3.27 $ 3.01 $ 2.16 Weighted average number of common shares outstanding: Basic 13,261,664 12,949,266 12,022,954 Diluted 13,640,182 13,514,952 12,521,426 Year Ended December 31, Year Ended December 31, 2023 2023 2022 2021 Securities available-for-sale Securities available-for-sale Unrealized holding income (loss) during the period Unrealized holding income (loss) during the period Unrealized holding income (loss) during the period Income tax (expense) benefit related to unrealized holding gain/loss Income tax (expense) benefit related to unrealized holding gain/loss (553) 621 8 OTHER COMPREHENSIVE INCOME (LOSS), net of tax Total BALANCE, December 31, 2020 11,954,327 $ 87,815 $ 52,368 $ 34 140,217 Net income — — 27,005 — 27,005 Issuance of restricted stock awards 10,714 — — — — Vesting of restricted stock units 7,851 — — — — Exercise of stock options 50,570 359 — — 359 Stock-based compensation — 1,284 — — 1,284 Stock issuance and net proceeds from
public offering851,853 32,387 — — 32,387 Other comprehensive loss, net of tax — — — (30) (30) BALANCE, December 31, 2021 12,875,315 $ 121,845 $ 79,373 $ 4 $ 201,222 BALANCE, December 31, 2021 12,875,315 $ 121,845 $ 79,373 $ 4 $ 201,222 Net income — — 40,625 — 40,625 Issuance of restricted stock awards 10,396 — — — — Vesting of restricted stock units 28,215 — — — — Exercise of stock options 247,221 1,468 — — 1,468 Stock-based compensation — 2,517 — — 2,517 Stock issuance and net proceeds from
public offering— — — — — Other comprehensive loss, net of tax — — — (2,338) (2,338) BALANCE, December 31, 2022 13,161,147 $ 125,830 $ 119,998 $ (2,334) $ 243,494 BALANCE, December 31, 2022 13,161,147 $ 125,830 $ 119,998 $ (2,334) $ 243,494 Net income — — 44,579 — 44,579 Adjustment to retained earnings;
adoption of ASU 2016- 13— 0 — 734 — 734 Issuance of restricted stock awards 13,538 — — — — Vesting of restricted stock units 46,520 — — — — Exercise of stock options 83,134 618 — — 618 Stock-based compensation — 3,688 — — 3,688 Other comprehensive income,
net of tax— — — 1,865 1,865 BALANCE, December 31, 2023 13,304,339 $ 130,136 $ 165,311 $ (469) $ 294,978 Year Ended December 31, 2023 2022 2021 CASH FLOWS FROM OPERATING ACTIVITIES Net income $ 44,579 $ 40,625 $ 27,005 Adjustments to reconcile net income to net cash provided by operating activities: Provision for credit losses 183,992 79,064 9,915 Depreciation and amortization 2,328 1,809 1,587 Loss on disposition of fixed assets 39 35 — Increase in operating lease right-of-use assets 833 1,087 1,056 Increase in operating lease liabilities (857) (1,086) (1,044) Gain on sales of loans (253) — (396) Net discount accretion on investment securities (25) (50) 32 Unrealized holding (gain) loss on equity investment (279) 153 (1,469) Stock-based compensation 3,688 2,517 1,284 Gain on sale of bank branch, including deposits and loans — — (1,263) Increase in bank-owned life insurance value 27 (360) (172) Deferred tax benefit (expense) 13,879 (11,018) (3,011) Net change in CCBX receivable 1,328 (9,150) (1,096) Net change in CCBX credit enhancement asset (50,079) (44,665) (8,712) Net change in CCBX payable 13,232 18,578 1,841 Net change in other assets and liabilities (15,919) (10,441) 4,290 Total adjustments 151,934 26,473 2,842 Net cash provided by operating activities 196,513 67,098 29,847 CASH FLOWS FROM INVESTING ACTIVITIES Purchase of investment securities available for sale — (134,912) (117,493) Purchase of investment securities held for investment (50,244) — — Change in other investments, net 607 (2,230) (950) Principal paydowns of investment securities available-for-sale 9 17 33 Principal paydowns of investment securities held-to-maturity 417 256 1,515 Maturities and calls of investment securities available-for-sale 250 70,000 102,500 Purchase of bank owned life insurance (230) (53) (5,000) Proceeds from sales of loans held for sale 600,199 152,546 — Proceeds from sales of loan participations — 10,300 — Purchase of loans (91,465) (168,464) (60,260) Purchase of loan participations — (52) — Proceeds from sale of loans related to sale of bank branch — — 4,092 Increase in loans receivable, net (1,052,283) (912,518) (141,503) Net cash transfer for branch sale — — (19,980) Purchases of premises and equipment, net (6,245) (2,838) (2,593) Net cash used by investing activities (598,985) (987,948) (239,639) CASH FLOWS FROM FINANCING ACTIVITIES Net increase in demand deposits, NOW and money market, and savings 553,932 467,744 980,766 Net decrease in time deposits (11,089) (14,010) (14,223) Net repayment from long term FHLB borrowing — (24,999) — Increase from subordinated debt proceeds — 19,625 24,263 Decrease from subordinated debt repayment — — (10,000) Net advances from Paycheck Protection Program Liquidity Facility — — (153,716) Proceeds from exercise of stock options 618 1,468 359 Proceeds from public offering — — 32,387 Net cash provided by financing activities 543,461 449,828 859,836 NET CHANGE IN CASH, DUE FROM BANKS AND RESTRICTED CASH 140,989 (471,022) 650,044 CASH, DUE FROM BANKS AND RESTRICTED CASH, beginning of year 342,139 813,161 163,117 CASH, DUE FROM BANKS AND RESTRICTED CASH, end of quarter $ 483,128 $ 342,139 $ 813,161 SUPPLEMENTAL SCHEDULE OF OPERATING AND INVESTING ACTIVITIES Interest paid $ 91,436 $ 20,068 $ 3,820 Income taxes paid $ 6,843 $ 23,498 $ 8,759 SUPPLEMENTAL SCHEDULE OF NONCASH TRANSACTIONS Fair value adjustment of securities available-for-sale, gross $ 2,418 $ (2,959) $ (37) Operating lease right-of-use assets $ 1,747 $ — $ 41 Operating lease liabilities $ (1,747) $ — $ (41) Transfer from loans to loans held for sale $ 599,946 $ 152,546 $ — Adjustment to retained earnings - adoption of ASU 2016-13,
net of deferred tax$ (734) $ — $ — (Corporation(“Corporation” or Company)“Company”) is a registered bank holding company whose wholly owned subsidiary issubsidiaries are Coastal Community Bank (Bank).(“Bank”) and Arlington Olympic LLC. The Company is a Washington state corporation that was organized in 2003. The Bank was incorporated and commenced operations in 1997 and is a Washington state-chartered commercial bank and Federal Reserve System (Federal Reserve)(“Federal Reserve”) state member bank.providesoperates through the Bank and is headquartered in Everett, Washington, which by population is the largest city in, and the county seat of, Snohomish County. The Company’s business is conducted through three reportable segments: The community bank, CCBX and treasury & administration. The community bank offers a full range of banking services to small and medium-sized businesses, professionals, and individuals throughout the greater Puget Sound arearegion through its 14 branches in Snohomish, Island and King Counties, the Internet, and its mobile banking application. The Bank’s main branchCCBX segment provides Banking as a Service (“BaaS”) that allows our broker dealers and digital financial service partners to offer their customers banking services. Through CCBX’s partners the headquartersCompany is able to offer banking services and products across the nation. The treasury & administration segment includes treasury management, overall administration and all other aspects of the Bank and Company are located in Everett, Washington. Company.(FDIC)(“FDIC”). The Bank’scommunity bank’s loans and deposits are primarily within the greater Puget Sound area,region, while CCBX loans and deposits are dependent upon the partner’s market. The Bank’s primary funding source is deposits from customers. The Bank is subject to regulation and supervision by the Board of Governors of the Federal Reserve System and the Washington State Department of Financial Institutions Division of Banks. The Federal Reserve also has regulatory and supervisory authority over the Company.(GAAP)(“GAAP”) for reporting requirements and practices within the banking industry. Amounts presented in the consolidated financial statements and footnote tables are rounded and presented in thousands of dollars except per-share amounts, which are presented in dollars. In the narrative footnote discussion, amounts are rounded to thousands and presented in dollars.Bank.LLC. All significant intercompany accounts have been eliminated in consolidation.policiesestimates include determining the allowance for loancredit losses, the fair value of the Company’s investment securities,financial instruments, and the valuation of deferred tax assets, financial instruments, and other fair value measurements. Actual results could differ significantly from those estimates.through the date of the issuance of its financial statementssubsequent to December 31, 2023 for potential recognition or disclosure. All subsequent events are disclosed in Note 21.thepurposepurposes of presentationreporting cash flows, cash and cash equivalents include cash on hand and in thestatementsof cashflows,the Company considersallamountsincludedin thebalancesheetunder“cashbanks and due frombanks”, all of whichinterest-bearing deposits. All have maturitydatesoriginal maturities of threemonthsor less, and restricted cash, as cash equivalents.Interest-bearingdepositsatless. CDs with otherfinancial institutions, (excluding restricted cash),federalfundssoldand cashflowsfromloansand depositsarereportedas netincreasesor decreases undercashflowsfrominvestingactivitiesor fromfinancingactivities.Declines inindividualthe security. The impairment is recognized by establishing an ACL through provision for credit losses. Impairment related to noncredit factors is recognized in accumulated other comprehensive income, net of applicable taxes. The Company evaluates AFS security impairment on a quarterly basis.available-for-salecalculated on a collective basis for those securities below their amortized cost thatwhich share risk characteristics. The Company aggregates similar securities and reports the security portfolio segments based on shared risk characteristics. The only segment included in the held-to-maturity portfolio are other than temporary resultU.S. Agency Residential Mortgage Backed Securities which have an expected zero credit loss and were purchased for CRA purposes.write-downsstock of the individual securities to their fair value. The related write-downs are included in earnings as realized losses. In estimating other-than-temporary impairment losses, management considers (1) the length of time and the extent to which the fair value has been less than cost, (2) the financial condition and near-term prospects of the issuer, and (3) the intent and ability of the Company to retain its investment in the issuer for a period of time sufficient to allow for any anticipated recovery in fair value.Other investments - Otherinvestmentson thebalancesheetconsistsof investmentsin stockof FederalHome Loan Bank of Des Moines (“FHLB”), the FederalReserveBank andof San Francisco (“FRB”), PacificCoast Banker’sBancshares.Federal Reserve Bank of San Francisco (FRB)FRB in an amount based on itsthe Bank’s capital. The recorded amount of the FRB stock equals its fair value because the shares can only be redeemed by the FRB at their par value. The Bank’s investment in FRB stock was $1,899,000$4.8 million and $1,891,000$4.3 million at December 31, 20182023 and 2017,2022, respectively.Federal Home Loan Bank of Des Moines (FHLB),FHLB, is required to maintain an investment in capital stock of FHLB in an amount equal to 4%4.5% of advances outstanding, plus 0.12%0.06% of total assets from the prior fiscal year end. The recorded amount of FHLB stock equals its fair value because the shares can only be redeemed by FHLB at the $1 per share par value. The investment in FHLB stock was $1,767,000$1.9 million and $1,689,000$3.2 million at December 31, 20182023 and 2017,2022, respectively.(PCBB)(“PCBB”) stock consists of an equity security. This investment is carried at its cost of $100,000 at December 31, 20182023 and 2017,2022, which approximates its fair value.For the Twelve Months Ended
December 31,(dollars in thousands) 2023 2022 2021 Carrying value, beginning of period $ 2,572 $ 2,322 850 Purchases 50 350 — Observable price change — (100) 1,472 Carrying value, end of period $ 2,622 $ 2,572 $ 2,322 For the Twelve Months Ended
December 31,(dollars in thousands) 2023 2022 2021 Carrying value, beginning of period $ 456 $ 160 — Purchases/capital calls/capital returns, net 75 349 163 Net change recognized in earnings 278 (53) (3) Carrying value, end of period $ 809 $ 456 $ 160 loancredit losses -– Loans arestatedattheprincipalamountoutstandinglesstheallowance forloan credit lossesand netof any deferredfeesor costson originatedloans,and unamortizedpremiumsor discounts on purchasedloans.Loan feesand certaindirectloanoriginationcostsaredeferred,and thenetfeeor costis recognizedas an adjustmentto interestincomeusingthelevelyieldmethodologyand a methodthat approximatesthelevelyieldmethodology.Interestincomeon loansisrecognizedbasedupon theprincipal amountsoutstanding.Generally,theisreversedagainstcurrentincome.Ifmanagementdeterminesthatthe ultimatecollectabilityof principalor interestisin doubt, cashreceiptson nonaccrualloansareappliedto reduce theprincipalbalanceon a cash-basismethod,untiltheloansqualifyforreturnto accrualstatusor principalis paidin full.Loans arereturnedto accrualstatuswhen allprincipaland interestamountscontractuallydue are broughtreversed against currentborrowerhas demonstratedabilityto makeregularpayments,generallya periodof atleastsix months,and futurepaymentsarereasonablyassured.Pastdue statusisdeterminedbasedon contractualterms.The allowanceforloanlossesiscomprisedof amountschargedagainstincomein theformof theprovisionfor loanlosses,lesscharged-offloans,netof recoveries.When availableinformationconfirmsthatspecificloansor portionsthereofareuncollectible,identifiedamountsarechargedagainsttheallowanceforloanlosses.The existenceof someor allof thefollowingcriteriawillgenerallyconfirmthata losshas been incurred:(1)theloan issignificantlydelinquentand theborrowerhas not demonstratedtheabilityor intentto bringtheloancurrent; (2)theCompany has no recourseto theborroweror ifitdoes, theborrowerhas insufficientassetsto pay the debt;(3)theestimatedfairvalueof theloancollateralissignificantlybelow thecurrentloanbalance;and (4)thereislittleor no near-termprospectforimprovement.Subsequentrecoveries,ifany, arecreditedto the allowanceforloanlosses.The allowance for loan losses is evaluated on a regular basis by income. If management and is based upon management’s periodic review of the collectability of the loans in light of historical experience, the nature and volume of the loan portfolio, adverse situations that may affect the borrower’s ability to repay, estimated value of any underlying collateral, and prevailing economic conditions. This evaluation is inherently subjective as it requires estimates that are susceptible to significant revision as more information becomes available.The allowance consists of specific and general components. The specific component relates to loans that are determined to be impaired. For such loans (including troubled debt restructurings), an allowance is established when the discounted cash flows (or collateral value or observable market price) of the impaired loan is lower than the carrying value of that loan. The general component covers various loans and is based on the probability of default and loss given default, type of loan, peer information, risk rating and adjusted for qualitative factors.A loan is considered impaired when, based on current information and events, it is probabledetermines that the Company will be unable to collect the scheduled paymentsultimate collectability of principal or interest is in doubt, cash receipts on nonaccrual loans are applied to reduce the principal balance on a cash-basis method, until the loans qualify for return to accrual status or principal is paid in full. Loans are returned to accrual status when all principal and interest amounts contractually due accordingare brought current, borrower has demonstrated ability to make regular payments, generally a period of at least six months, and future payments are reasonably assured.contractual termsborrower or if it does, the borrower has insufficient assets to pay the debt; (3) the estimated fair value of the loan agreement. Factorscollateral is significantly below the current loan balance; and (4) there is little or no near-term prospect for improvement. Subsequent recoveries, if any, are credited to the allowance for credit losses.managementthe Company. Loan commitments may have a funded and unfunded portion, of which the liability for unfunded commitments is derived based upon the commitments to extend credit to a borrower. The expected credit losses for funded portions are reported in determining impairment include payment status, collateral value,the previously discussed ACL.collecting scheduled principalfunding.interest payments when due. Loans that experience insignificant payment delaysare primarily sold for credit and payment shortfalls generally are not classified as impaired. Management determines the significanceconcentration management. As of payment delaysDecember 31, 2023 and payment shortfalls on a case-by-case basis, taking into consideration all2022 there were no loans held for sale.circumstances surroundingguaranteed portion of SBA loans and USDA loans the Company intends to sell after origination and are reflected at the lower of aggregate cost or fair value. Loans are generally sold with servicing of the sold portion retained by the Company when the sale of the loan andoccurs, the borrower, includingpremium received is combined with the length of the delay, the reasons for the delay, the borrower’s prior payment record, and the amount of the shortfall in relation to the principal and interest owed. Impairment is measured on a loan-by-loan basis for commercial and construction loans by either theestimated present value of expected future cash flows discounted at the loan’s effective interest rate, the loan’s obtainable market price, or the fair value of the collateral if the loan is collateral-dependent.A troubled debt restructuring (TDR) is a loan for which the Company, for reasons related to the borrower’s financial difficulties, grants a concession to the borrower that the Company would not otherwise consider. TDRs are individually evaluated for impairment and included in the separately identified impairment disclosures. TDRs are measured at the present value of estimated future cash flows using the loan’s effective rate at inception. If a TDR is considered to be a collateral-dependent loan, the loan is reported, net, at the fair value of the collateral. For TDRs that subsequently default, the Company determines the amount of allowance on that loan in accordance with the accounting policy for the allowance for loan losses on loans individually identified as impaired. The Company incorporates recent historical experience with TDRs including the performance of TDRs that subsequently default into the calculation of the allowance by loan portfolio segment.Periodically, regulatory agencies review the Company’s allowance for loan losses as an integral part of their examination process, and may require the Company to make additions to the allowance based on their judgment about information available to them at the time of their examination.Loans held-for-sale - Loans held-for-saleconsistof theguaranteedportionof SmallBusinessAdministration (SBA) loans and United States Department of Agriculture (USDA) loans theCompany intendsto sellafteroriginationand arereflectedatthelowerof aggregatecostor fair value.Loans aregenerallysoldwith servicingof thesoldportionretainedby theCompany. When thesaleof the loanoccurs,thepremiumreceivediscombinedwith theestimatedpresentvalueof futurecashflowson the relatedservicingassetand recordedas a gainon saleof loansin noninterestincome.Therewere no loansheldfor saleatDecember31, 20182023 and 2017.(or (or portions)and any portionthatcontinuesto be heldby thetransferorareparticipatinginterests.Participatinginterestisdefined as a portionof a financialassetthat(a)conveysproportionateownershiprightswith equalpriorityto each participatinginterestholder,(b)involvesno recourse(other (other thanstandardrepresentationsand warranties),and (c)does not entitleany participatinginterestholderto receivecashbeforeany otherparticipatinginterestholder. The transferof theparticipatinginterest(or (or participatinginterests)mustalsomeettheconditionsforsurrenderof control.SBA and USDA The Company also retains the servicing on the sold guaranteed portion of Main Street Lending Program (“MSLP”) loans. The net deferred fee on the sold portion of the loan is recognized when sold. The Company does not retain the servicing on sold CCBX loans.accountsmaintains a balance sheet liability forSBA expected losses on unfunded commitments, which is recognized if both the following conditions are met: (1) the Company has a present contractual obligation to extend credit; and USDA servicingrightsas separatelyrecognizedservicing rights(2) the obligation is not unconditionally cancellable by the Company. Loan commitments may have a funded and initiallymeasurethematfairvalue.Fairvalueunfunded portion, of which the liability for unfunded commitments is derived basedon marketpricesforcomparableservicing contracts,when available,or alternatively,isbasedon upon the commitments to extend credit to a valuationmodelthatcalculatesthepresentvalueborrower. An estimate of estimatedfuturenetservicingincome.expected credit losses is not established for unfunded portions of loan commitment that are unconditionally cancellable by the Company. The expected credit losses for funded portions are reported in the previously discussed ACL. The Company subsequentlymeasureseachSBAsegments its unfunded commitment portfolio consistent with the ACL calculation, separating between unfunded lines and USDA servicingassetusingcommitments to originate. The Company incorporates the amortizationmethod.Underprobability of funding (i.e. estimate of utilization) for each segment and then utilizes theamortizationmethod,servicingassetsareamortizedintononinterestincomein proportion ACL loss rates for each segment on an aggregate basis to calculate the allowance for unfunded commitments. The reserve for unfunded commitments was $582,000 and overtheperiodof, estimatednetservicingincome.The amortizedassetsareassessedfor impairmentor increasedobligations,attheloanlevel,basedon thefairvalueof eachreportingdate.As of December31, 2018 and 2017, SBA and USDA servicingassetstotaled$395,000 and $406,000, respectively, and areincludedin otherassetson thebalancesheets,and SBA and USDA loansservicedtotaled$20,966,000 and $23,774,000,$974,000 as of December 31, 20182023 and 2017 respectively.Reserve2022, respectively, and includes a reserve for unfunded commitments - A reserveforunfundedcommitmentsismaintainedata levelthat,in theopinionof management,isadequateto absorbprobablelossesassociatedwith theCompany’scommitmentto lendfundsunderexistingagreements,such as lettersor linesof credit.Managementdeterminestheadequacyof thereserveforunfundedcommitmentsbasedon reviewof individualcreditfacilities,currenteconomic conditions,community bank loans and riskcharacteristicsof thevariouscategoriesof commitmentsand otherrelevantfactors.The reserveisbasedon estimates,and ultimatelossesmayvaryfromthecurrentestimates.These estimatesare evaluatedon a regularbasisand adjustmentsarereportedin earningsin theperiodsin which theybecomeknown. Draws on unfundedcommitmentsthatareconsidereduncollectibleatthetimefundsareadvancedarechargedto theallowanceforloanlosses.Provisionforunfundedcommitmentslossesareadded to thereserveforunfunded commitments,which isincludedin theotherliabilitiessectionof theconsolidatedbalancesheets.years. years.Leaseholdimprovementsareamortizedoverthe expectedtermof thelease including options to extend which are reasonably certain to be exercised or theestimatedusefullifeof theimprovement,whicheverisless.(free (free of conditionsthatconstrainitfromtakingadvantageof that right)to pledgeor exchangethetransferredassets,and (3)theCompany does not maintaineffectivecontrolover thetransferredassetsthroughan agreementto repurchasethembeforetheirmaturity.ownedand repossessedassets- Otherrealestateowned and repossessedassets- Other real estate owned and repossessed assets are foreclosedpropertyheldpendingdispositionand isare initiallyrecordedatfairvaluelessestimatedsellingcosts when acquired,establishinga new costbasis.At foreclosure,ifthefairvalueof theassetacquiredlessestimated sellingcostsislessthantheCompany’srecordedinvestmentin therelatedloan,a write-downisrecognized througha chargeto theallowanceforloan credit losses.Costs of significantpropertyimprovements that increase the value of the property arecapitalized, whereascostsrelatingto holding the propertyareexpensed.Valuationsareperiodicallyperformedby management, and a valuation allowance is established for subsequentdeclines, whicharerecordedas a chargeto income,ifnecessary,to reducethecarryingvalueof thepropertyto itsfairvaluelessestimatedsellingcosts.Federal incomereturn. return and state tax returns as applicable. Deferred federalincometaxesresultfromtemporarydifferencesbetweenthetaxbasisof assetsand liabilities,and their reportedamountsin thefinancialstatements.Deferredtaxesaretemporarydifferencesthatwillbe recognizedin futureperiods.As changesin taxlaw or ratesareenacted,deferredtaxassetsand liabilitiesareadjustedthrough theprovisionforincometaxes.Taxes Federal taxes arepaidby theBank to theCompany basedon theseparatetaxableincome of theBank. The Company and Bank maintaintheirrecordson theaccrualbasisof accountingforfinancial reportingand forincometaxreportingpurposes.Withfew exceptions,theCompany isno longersubjectto incometaxexaminationforyearsbefore2015.20182023 and 2017,2022, the Company had no material unrecognized income tax benefits. The Company recognizes interest accrued and penalties related to unrecognized tax benefits in other noninterest expense. There were no interest and penalties assessed on income taxes during 20182023 or 2017.awards,basedon thefairvalueof theseawardsatthegrantdate.A Black-Scholesmodelisutilizedto estimate thefairvalueof stockoptions,whilethemarketpriceof theCompany’scommonstockatthegrantdateisused forrestrictedstockawards and restricted stock units and isdeterminedon thebasisof objectivecriteriaincludingtradedata.Compensation costisrecognizedovertherequired requisite serviceperiod,generallydefinedas thevestingperiod.For awardswith gradedvesting,compensationcostisrecognizedon a straight-linebasisovertherequisiteserviceperiodforthe entireaward. (EPS) (“EPS”) iscomputedunderthetwo-classmethod.Pursuant to thetwo-classmethod,nonvestedstockbasedpaymentawardsthatcontainnonforfeitable non-forfeitable rightsto dividendsor dividendequivalentsareparticipatingsecuritiesand areincludedin thecomputationof EPS.The two-class methodisan earningsallocationformulathatdeterminesearningspershareforeachclassof commonstockand participatingsecurityaccordingto dividendsdeclared(or (or accumulated)and participationrightsin undistributed earnings.Applicationof thetwo-classmethodresultedin theequivalentearningspershareto thetreasury method.loss income consistsof only one component:unrealizedgainsor losseson investmentsecuritiesavailable-for-sale.- – For financial reporting purposes, the Company has three segments: The Companycommunity bank, CCBX and treasury & administration. The community bank business ismanagedby legalentityand not by linesof business.The entity’s primarybusinessisthatof a traditionalbankinginstitution,gatheringdepositsand originatingloansforportfolio in itsmarketareas.The Bankcommunity bank offersa wide varietyof depositproductsto theircustomers.Lending activities includetheoriginationof realestate,commercialand industrial,and consumerloans.Interestincomeon loansis theCompany’sprimarysourceof revenue,and issupplementedby interestincomefrominvestmentsecurities, depositservicecharges,and otherserviceprovidedactivities. The CCBX segment provides banking as a service (“BaaS”) that allows our broker-dealer and digital financial service partners to offer their customers banking services. The CCBX segment has 21 partners as of December 31, 2023. The treasury & administration segment includes treasury management, overall administration and all other aspects of the Company. The performanceof theCompany isreviewedand monitoredby theCompany’sexecutivemanagement on a daily basis and the Board of Directors reviews and monitors the performance of the Company at minimum, on a monthlybasis.The Company has determinedthatitscurrent For additional information regarding the businessand operationsconsistof a singlereportingsegmentand, therefore, segmentdisclosuresarenot required.$373,000$517,000 and $446,000$351,000 were expensedduring the year ended December 31, 20182023 and 2017, respectively.stockholders’shareholders’ equity or net income.Accounting Standards Adopted in 20182018,2023, the Company adopted Accounting Standards Update (ASU) No. 2014-09, Revenue from Contracts with Customers (Topic 606) and all related amendments to all contracts using the modified retrospective approach. The core principle of the guidance is that an entity should recognize revenue to depict the transfer of promised goods or services to customers in an amount that reflects the consideration to which the entity expects to be entitled in exchange for those goods or services.The Company concluded that there is no change to the timing and pattern of revenue recognition for its current revenue streams or the presentation of revenue as gross versus net. No adjustment to retained earnings was required on the adoption date. Because there is no change to the timing and pattern of revenue recognition, there are no material changes to the Company’s processes and internal controls.All of the Company’s revenue from contracts with customers within the scope of Topic 606 is recognized within noninterest income. A description of the Company’s revenue streams accounted for under Topic 606 can be found in Note 18.As of January 1, 2018, the Company adopted Financial Accounting Standards Board (FASB) ASU No. 2016-01, Financial Instruments—Overall (Subtopic 825-10): Recognition and Measurement of Financial Assets and Financial Liabilities. ASU 2016-01 requires equity investments (except those accounted for under the equity method of accounting) to be measured at fair value with changes in fair value recognized in net income. In addition, the amendments in this ASU require an entity to disclose the fair value of financial instruments using the exit price notion. Exit price is the price that would be received to sell an asset or paid to transfer a liability in an orderly transaction between market participants at the measurement date. The methods of determining the fair value of assets and liabilities are consistent with the methodologies disclosed in Note 8—Fair Value Measurements, except for the valuation of loans held-for-investment which was impacted by the adoption of ASU 2016-01. Prior to adopting the amendments included in the standard, the Company was allowed to measure fair value under an entry price notion. The entry price notion previously applied by the Company used a discounted cash flows technique to calculate the present value of expected future cash flows for a financial instrument. The exit price notion uses the same approach, but also incorporates other factors, such as enhanced credit risk, illiquidity risk and market factors that sometimes exist in exit prices in dislocated markets. As of December 31, 2018, the technique used by the Company to estimate the exit price of the loan portfolio consists of similar procedures to those used as of December 31, 2017, but with added emphasis on both illiquidity risk and credit risk that may not have been captured by the previously applied entry price notion. This credit risk assumption is intended to approximate the fair value that a market participant would realize in a hypothetical orderly transaction. This ASU also eliminates the requirement to disclose the method(s) and significant assumptions used to estimate the fair value that is required to be disclosed for financial instruments measured at amortized cost on the balance sheet. The amendments in this ASU were effective for fiscal years beginning after December 15, 2017, including interim periods within those fiscal years. The adoption of ASU 2016-01 did not have a material impact on the Company’s consolidated financial statements.In November 2016, the FASB issued ASU No. 2016-18, Statement of Cash Flows (Topic 230), Restricted Cash. The ASU amends the required statement of cash flow disclosures to include the change in amounts generally described as restricted cash. Management adopted the new guidance effective December 31, 2018. The adoption of ASU No. 2016-18 did not have a material impact on the Company’s consolidated financial statements.In August 2016, the FASB issued ASU No. 2016-15, Statement of Cash Flows (Topic 230): Classification of Certain Receipts and Cash Payments, a consensus of the FASB’s Emerging Issues Task Force. The ASU is intended to reduce diversity in practice in how certain transactions are presented and classified in the statement of cash flows. The standard will take effect for fiscal years, and interim periods within those fiscal years, beginning after December 15, 2017. This standard did not have a material impact on the Company’s consolidated financial statements.In January 2017, the FASB issued ASU No. 2017-01, Business Combinations (Topic 805): Clarifying the Definition of a Business. The amendments in this update provide a more robust framework to use in determining when a set of assets and activities is a business. Because the current definition of a business is interpreted broadly and can be difficult to apply, stakeholders indicated that analyzing transactions is inefficient and costly and that the definition does not permit the use of reasonable judgment. The amendments provide more consistency in applying the guidance, reduce the costs of application, and make the definition of a business more operable. The amendments in this update become effective for annual periods and interim periods within those fiscal years, beginning after December 15, 2017. The adoption of this standard did not have a material effect on the Company’s operating results or financial condition.In February 2018, the FASB issued ASU No. 2018-02, Income Statement—Reporting Comprehensive Income (Topic 220): Reclassification of Certain Tax Effects from Accumulated Other Comprehensive Income. The amendments in this ASU allow a reclassification from accumulated other comprehensive income (AOCI) to retained earnings for stranded tax effects resulting from the Tax Cuts and Jobs Act. Consequently, the amendments eliminate the stranded tax effects resulting from the Tax Cuts and Jobs Act and will improve the usefulness of information reported to financial statement users. The amendments in this ASU also require certain disclosures about stranded tax effects. The amendments are effective for fiscal years beginning after December 15, 2018, and interim periods within those fiscal years. Early adoption of the amendments in this ASU is permitted, including adoption in any interim period, (1) for reporting periods for which financial statements have not yet been made available for issuance. The amendments in this ASU should be applied either in the period of adoption or retrospectively to each period (or periods) in which the effect of the change in the U.S. federal corporate income tax rate in the Tax Cuts and Jobs Act is recognized. The Company elected to early adopt in the first quarter of 2018. Accordingly, the Company recorded an increase to retained earnings and a decrease to AOCI of $186,000 for stranded tax effects on investment available for sale securities in the first quarter of 2018.In May 2018, the FASB issued ASU No. 2018-06, Codification Improvements to Topic 942, Financial Services - Depository and Lending. This ASU updates outdated guidance related to the Office of Comptroller of the Currency’s (OCC) Banking Circular 202, Accounting for Net Deferred Tax Charges, as the guidance has been rescinded by OCC and is no longer relevant. The amendments in this ASU are effective immediately. The adoption of ASU No. 2018-06 is not expected to have a material impact on the Company's consolidated financial statements.Recent Accounting Guidance Not Yet EffectiveIn February 2016, FASB issued ASU 2016-02, Leases (Topic 842). The new standard was issued to increase the transparency and comparability around lease obligations. Previously unrecorded off-balance sheet obligations will now be brought more prominently to light by presenting lease liabilities on the face of the balance sheet, accompanied by enhanced qualitative and quantitative disclosures in the notes to the financial statements. The ASU is effective in fiscal years beginning after December 15, 2018, and interim periods within those fiscal years. The Company implemented the new standard effective January 1, 2019, which included identifying the population of the Company’s leases that were within the scope of the new guidance and gathering all key lease data necessary to facilitate application of the new accounting requirements. As a result of implementation, the Company recognized a liability for the remaining obligations under its operating lease agreements, and a corresponding right of use asset for its right to use the underlying assets for the lease term. There was an increase to the Company’s assets and liabilities upon adoption. The increase in assets and liabilities was 1.0% of total assets when it was adopted on January 1, 2019.Instruments-CreditInstruments — Credit Losses (Topic 326): Measurement of Credit Losses on Financial Instruments,. The amendments replace which replaces the incurred loss impairment methodology in current GAAP with aan expected loss methodology that reflectsis referred to as the current expected credit loss ("CECL") methodology. The measurement of expected credit losses under the CECL methodology is applicable to financial assets measured at amortized costs, including loan receivables and requires considerationheld-to-maturity debt securities. It also applies to off-balance sheet credit exposures not accounted for as insurance (loan commitments, standby letters of credit, financial guarantees, and other similar instruments) and net investments in certain leases. In addition, ASC 326 made changes to the accounting for available-for-sale debt securities. One such change is to require increases or decreases in credit losses be presented as an allowance rather than as a broader rangewrite-down on available-for-sale debt securities management does not intend to sell or believe it is more likely than not the Company will be required to sell the security before recovery of reasonable and supportable information to inform credit loss estimates. the amortized cost basis.amendment is effectiveCompany adopted ASC 326 using the modified retrospective method. Results for annualthe reporting periods beginning after December 15, 2019January 1, 2023 are presented under ASC 326 while prior period amounts continue to be reported in accordance with previously applicable GAAP. The day one CECL adjustment for community bank loans included a reduction of $310,000 to the community bank allowance in the first quarter of 2023 and interim period within those annual periods. Early application will be permitteda reduction of $340,000 related to the community bank unfunded commitment reserve in the first quarter of 2023. This was offset by an increase to the CCBX allowance for fiscal years,$4.2 million in the same period. There was a CECL day one increase to the indemnification asset in the amount of $4.5 million due to the mirror image approach related to the credit enhancement for CCBX loans. Net, the day one impact for the Bank’s transition to CECL was an increase of $954,000 in the first quarter of 2023, which included an income tax impact of $220,000, resulting in an increase to retained earnings of $734,000, net of income taxes.interim periods within those fiscal years, beginning after December 15, 2018. determined that no loss reserves were required.Company is actively assessing its data and the model needs and are evaluatingfollowing table illustrates the impact of adoptingASU 2016-13:January 1, 2023 As reported
under ASC 326Pre-ASC 326
AdoptionImpact of
ASC 326 AdoptionAssets: Allowance for credit losses $ 77,881 $ 74,029 $ 3,852 CCBX credit enhancement asset 57,842 53,377 4,465 Deferred tax asset 18,238 18,458 (220) Liabilities: Unfunded commitment reserve 634 974 (340) Shareholders' Equity: Retained earnings 120,732 119,998 734 amendment.Company adopted ASU 2022-02, Financial Instruments - Credit Losses (Topic 326): Troubled Debt Restructurings ("TDR") and Vintage Disclosures. The Company expectsASU eliminated the accounting guidance for TDR loans by creditors while enhancing disclosure requirements for certain loan refinancings and restructurings by creditors when a borrower is experiencing financial difficulty. Additionally, the ASU requires public business entities to recognize a one-time cumulative effect adjustment to the allowancedisclose current-period gross write-offs by year of origination for loan losses as of the beginning of the first reporting periodfinancing receivables and net investments in which the new standard is effective, but have not yet determined the magnitude of any such one-time adjustment or the overall impact of the new guidance on the consolidated financial statements.In June 2018, the FASB issued ASU No. 2018-07, Compensation - Stock Compensation (Topic 718): Improvements to Nonemployee Share-Based Payment Accounting.leases. This ASU was issued to expand the scope of Topic 718 to include share-based payment transactions for acquiring goods and services from nonemployees. Previously, these awards were recorded at the fair value of consideration received or the fair value of the equity instruments issued and was measured as of the earlier of the commitment date or the date performance was completed. The amendments in this ASU require the awards to be measured at the grant-date fair value of the equity instrument. ASU No. 2018-07 is effective for fiscal years, and interim periods within those fiscal years, beginning after December 15, 2018. Early adoption is permitted, but no earlier than an entity's adoption of Topic 606. Theupon adoption of ASU No. 2018-07 is not expected2016-13 and was applied on a prospective basis. See “have a material impact onborrowers experiencing financial difficulty during the Company's future consolidated financial statements.fair valuesallowance for credit losses and the corresponding amounts of investmentgross unrealized gains and losses of available-for-sale securities at the date indicated are as follows:Amortized
CostGross
Unrealized
GainsGross
Unrealized
LossesFair
ValueAllowance for Credit Losses (dollars in thousands; unaudited) December 31, 2023 Available-for-sale U.S. Treasury securities $ 99,996 $ — $ (535) $ 99,461 $ — U.S. Agency collateralized
mortgage obligations45 — (2) 43 — Total available-for-sale
securities100,041 — (537) 99,504 — Held-to-maturity U.S. Agency residential
mortgage-backed securities50,860 467 (286) 51,041 — Total investment securities $ 150,901 $ 467 $ (823) $ 150,545 $ — Amortized
CostAmortized
CostGross
Unrealized
GainsGross
Unrealized
LossesFair
Value(dollars in thousands) (dollars in thousands) December 31, 2022 Available-for-sale Available-for-sale U.S. Treasury securities U.S. Treasury securities U.S. Agency collateralized mortgage obligations U.S. Agency collateralized mortgage obligations Municipal bonds U.S. Agency residential mortgage-backed securities U.S. Agency residential mortgage-backed securities 2018,2023, by contractual maturity, are shown below. Expected maturities will differ from contractual maturities because borrowers in mortgage backed securities or obligations may have the right to call or prepay obligations with or without call or prepayment penalties. Mortgage-backed securities and collateralized mortgage obligations are shown separately, since they are not due at a single maturity date.Available-for-Sale Available-for-Sale Held-to-Maturity Amortized
CostAmortized
CostFair
ValueAmortized
CostFair
Value(dollars in thousands) (dollars in thousands) December 31, 2023 Amounts maturing in Amounts maturing in One year or less One year or less 99,996 $ carrying valuesamortized cost of $19,678,000$21.8 million and $15,123,000$37.8 million at December 31, 20182023 and December 31, 20172022 respectively, were pledged to secure public deposits and for other purposes as required or permitted by law.investment securitiesinvestments during the yearsyear ended December 31, 20182023 or December 31, 2022.2017.Information pertaining to2022, there were nine and six securities, withrespectively, in an unrealized loss position. The following table shows the investments’ gross unrealized losses at the dates indicated,and fair values, aggregated by investment category and length of time that individual securities have been in a continuous unrealized loss position follows:Less Than 12 Months 12 Months or Greater Total Fair
ValueGross
Unrealized
LossesFair
ValueGross
Unrealized
LossesFair
ValueGross
Unrealized
Losses(dollars in thousands) December 31, 2023 Available-for-sale U.S. Treasury securities $ — $ — $ 99,461 $ 535 $ 99,461 $ 535 U.S. Agency collateralized mortgage obligations — — 43 2 43 2 Total available-for-sale securities — — 99,504 537 99,504 537 Held-to-maturity U.S. Agency residential mortgage-backed securities 11,236 173 882 113 12,118 286 Total investment securities $ 11,236 $ 173 $ 100,386 $ 650 $ 111,622 $ 823 At2018 and December 31, 2017, there were 12 and 11 securities, respectively, in an unrealized loss position.2023, will be recognized into income. Unrealized losses have not been recognized into income because management does not intend to sell and does not expect it will be required to sell the investments. The decline is largely due to changes in market conditions and interest rates, rather than credit quality. The fair value is expected to recover as the underlying securities in the portfolio approach maturity date and market conditions improve. The Company doesManagement believes there is a high probability of collecting all contractual amounts due, because the majority of the securities in the portfolio are backed by government agencies or government sponsored enterprises. However, a recovery in value may not consideroccur for some time, if at all, and may be delayed for greater than the one year time horizon or perhaps even until maturity. Based on management's analysis no allowance for credit losses was required on these securities to be other than temporarily impaired at December 31, 2018 and December 31, 2017.securities.LoanCredit LossesDecember 31, 2023 (dollars in thousands) Community Bank Commercial and industrial loans $ 149,502 Real estate loans: Construction, land and land development loans 157,100 Residential real estate loans 225,391 Commercial real estate loans 1,303,533 Consumer and other loans: Other consumer and other loans 1,628 Gross Community Bank loans receivable 1,837,154 CCBX Commercial and industrial loans: Capital call lines $ 87,494 All other commercial & industrial loans 54,298 Real estate loans: Residential real estate loans 238,035 Consumer and other loans: Credit cards 505,837 Other consumer and other loans 310,574 Gross CCBX loans receivable 1,196,238 Total gross loans receivable 3,033,392 Net deferred origination fees and premiums (7,300) Loans receivable $ 3,026,092 December 31, 2022 Consolidated (dollars in thousands) Commercial and industrial loans $ 312,628 Real estate loans: Construction, land, and land development 214,055 Residential real estate 449,157 Commercial real estate 1,048,752 Consumer and other loans 608,771 Gross loans receivable 2,633,363 Net deferred origination fees and premiums (6,107) Loans receivable $ 2,627,256 consumercommercial and industrial loans is $87.5 million and $146.0 million in capital call lines, as of December 31, 2023 and December 31, 2022, respectively, provided to venture capital firms through one of our BaaS clients. These loans are secured by the capital call rights and are individually underwritten to the Bank’s credit standards and the underwriting is reviewed by the Bank on every line. Also included in commercial and industrial loans are Paycheck Protection Program (“PPP”) loans of $3.0 million and $4.7 million at December 31, 2023 and December 31, 2022, respectively. PPP loans are 100% guaranteed by the SBA.areincludes overdrafts of $36,000$2.8 million and $76,000$2.7 million at December 31, 20182023 and December 31, 2017,2022, respectively. Community bank overdrafts were $255,000 and $94,000 at December 31, 2023 and December 31, 2022, respectively and CCBX overdrafts were $2.5 million and $2.6 million at December 31, 2023 and December 31, 2022, respectively.$155,029,000$1.01 billion and $147,008,000$220.1 million at December 31, 20182023 and December 31, 2017,2022, respectively, for borrowing lines at the FHLB and FRB.$24,878,000$8.7 million and $29,910,000$14.3 million at December 31, 20182023 and December 31, 2017,2022, respectively. whole loans at fair value as of the acquisition date. PurchasedThe Company held purchased loans with remaining balances totaled $45,368,000$8.1 million and $43,213,000$9.6 million as of December 31, 20182023 and December 31, 2017,2022, respectively. Unamortized premiums totaled $701,000$154,000 and $718,000$167,000 as of December 31, 20182023 and December 31, 2017,2022, respectively, and are amortized into interest income over the life of the loans.$36,561,000$53.5 million and $8,124,000$63.9 million as of December 31, 20182023 and December 31, 2017,2022, respectively. These loans are included in the applicable loan category depending upon the collateral and purpose of the individual loan.
The Company, through the community bank, purchased loans from CCBX partners, at par, through agreements with those CCBX partners, and those loans had a remaining balance of $46.5 million as of December 31, 2023 and $157.4 million as of December 31, 2022. As of December 31, 2023, $40.2 million is included in consumer and other loans and $6.3 million is included in commercial and industrial loans, compared to $146.1 million in consumer and other loans and $11.3 million in commercial and industrial loans as of December 31, 2022.area.area and capital calls on venture and investment funds. Also included in commercial and industrial loans are $54.3 million in unsecured loans originated through CCBX partners as of December 31, 2023, compared to $14.9 million as of December 31, 2022. Loan types in this segment include PPP loans, revolving lines of credit, term loans, and loans secured by liquid collateral such as cash deposits or marketable securities. TheIn addition, included in commercial and industrial loans are loans to other financial institutions. Additionally, the Company also issues letters of credit on behalf of its customers. Risk arises primarily due to the difference between expected and actual cash flows of the borrowers. In addition, the recoverability of the Company’s investment in these loans is also dependent on other factors primarily dictated by the type of collateral securing these loans. The fair value of the collateral securing these loans may fluctuate as market conditions change. In the case of loans secured by accounts receivable, the recovery of the Company’s investment is dependent upon the borrower’s ability to collect amounts due from its customers.- We originate– The Company originates loans for the construction of 1-4 family, multifamily, and CRE properties in the Company’s market area. Construction loans are considered to have higher risks due to construction completion and timing risk, the ultimate repayment being sensitive to interest rate changes, government regulation of real property and the availability of long-term financing. Additionally, economic conditions may impact the Company’s ability to recover its investment in construction loans, as adverse economic conditions may negatively impact the real estate market, which could affect the borrower’s ability to complete and sell the project. Additionally, the fair value of the underlying collateral may fluctuate as market conditions change. WeThe Company occasionally originateoriginates land loans for the purpose of facilitating the ultimate construction of a home or commercial building. The primary risks include the borrower’s ability to pay and the inability of the Company to recover its investment due to a material decline in the fair value of the underlying collateral.includesloans include various types of loans for which the Company holds real property as collateral. We make commercial mortgage loans collateralized by owner-occupied and non-owner-occupied real estate, as well as multi-family residential loans. The primary risks of commercial real estate loans include the borrower’s inability to pay, material decreases in the value of the collateralized real estate and significant increases in interest rates, which may make the real estate loan unprofitable. Commercial real estate loans may be more adversely affected by conditions in the real estate markets or in the general economy.- We originate– The community bank originates a limited number of consumer loans, generally for banking customers only, which consist primarily of home equity lines of credit, saving account secured loans, and auto loans. CCBX originates consumer loans including credit cards, consumer term loans and secured and unsecured lines of credit. This loan category also includes overdrafts. Repayment of these loans is dependent on the borrower’s ability to pay and the fair value of the underlying collateral.
As of December 31, 2023 $816.4 million in CCBX loans are included in consumer and other loans, compared to $607.0 million at December 31, 2022.30-89
Days Past
Due30-89
Days Past
Due90 Days
or More
Past DueTotal
Past DueCurrent Total
Loans90 Days or
More Past
Due and
Still
Accruing(dollars in thousands; unaudited) (dollars in thousands; unaudited) December 31, 2023 Community Bank Community Bank Community Bank Commercial and industrial
loansCommercial and industrial
loansConstruction, land and Construction, land and Total community bank CCBX Commercial and industrial loans: Commercial and industrial loans: Commercial and industrial loans: Capital call lines Capital call lines Capital call lines Real estate loans: Residential real
estate loansResidential real
estate loansResidential real
estate loansConsumer and other loans: Credit cards Credit cards Credit cards Other consumer and
other loansTotal CCBX Total Consolidated Loans receivable Loans receivable Consolidated 30-89
Days Past
Due90 Days
or More
Past DueTotal
Past DueCurrent Total
Loans90 Days or
More Past
Due and
Still
Accruing(dollars in thousands) December 31, 2022 Commercial and industrial loans $ 393 $ 486 $ 879 $ 311,749 $ 312,628 $ 404 Real estate loans: Construction, land and land development — 66 66 213,989 214,055 — Residential real estate 1,016 876 1,892 447,265 449,157 876 Commercial real estate 95 6,901 6,996 1,041,756 1,048,752 — Consumer and other loans 37,932 24,815 62,747 546,024 608,771 24,815 $ 39,436 $ 33,144 $ 72,580 $ 2,560,783 $ 2,633,363 $ 26,095 Less net deferred origination fees and premiums (6,107) Loans receivable $ 2,627,256 the period indicated:The following tables summarize the average recorded investment and interest income recognized on impaired loans by loan class for the year ended December 31, 20182023, and 2017:Company grants restructuringsincrease is attributed to loans originated through CCBX lending partners which continue to accrue interest up to 180 days past due.response to borrower financial difficulty, and generally provides for a temporary modification of loan repayment terms. The restructured loans on accrual status represent the only impaired loans accruing interest. In order for a restructured loan to be considered for accrual status, the loan’s collateral coverage generally will be greater than or equal to 100% of the loan balance, the loan is current on payments, andmanagement’s opinion, the borrower mustmay be unable to meet payments as they become due or when they are 90 days past due as to either prefund anprincipal or interest, reserve or demonstrate the ability to make payments from a verified source of cash flow for an extended period of time, usually at least six months in duration.The following table presents troubled debt restructurings by accrual versus nonaccrual statusunless they are well secured and by loan class as of the period indicated:No loans were restructured in the year ended December 31, 2018process of collection. Installment/closed-end, and December 31, 2017 that qualifiedrevolving/open-end consumer loans originated through CCBX lending partners will continue to accrue interest until 120 and 180 days past due, respectively and an allowance is recorded through provision expense for these expected losses. For installment/closed-end and revolving/open-end consumer loans originated through CCBX lending partners with balances outstanding beyond 120 days and 180 days past due, respectively, principal and capitalized interest outstanding is charged off against the allowance and accrued interest outstanding is reversed against interest income. These consumer loans are reported as troubled debt restructurings. The Company had no commitments to loan additional funds to borrowers whose loans were classified as troubled debt restructurings at December 31, 2018.December 31, December 31, December 31, 2023 2023 2022 Total Nonaccrual Total Nonaccrual Nonaccrual with No ACL Total Nonaccrual (dollars in thousands; unaudited) (dollars in thousands; unaudited) Community Bank Commercial and industrial loans Commercial and industrial loans Construction, land and land development Construction, land and land development Construction, land and land development Consumer and other loans Principal Forgiveness Term Extension Interest Rate Reduction Principal Forgiveness & Payment Delay Principal Forgiveness, Payment Delay & Term Extension Total Total Class of Financing Receivable (dollars in thousands; unaudited) CCBX Commercial and industrial loans: All other commercial & industrial loans $ — $ 1,247 $ — $ 27 $ 18 $ 1,292 2.38 % Consumer and other loans: Credit cards 1 — 4,201 — — 4,202 0.83 Other consumer and other loans — 13,571 — 3,838 2,846 20,255 6.52 Total $ 1 $ 14,818 $ 4,201 $ 3,865 $ 2,864 $ 25,749 0.85 % 30-89
Days Past
Due90 Days
or More
Past DueTotal Past Due (dollars in thousands) CCBX Commercial and industrial loans: All other commercial & industrial loans $ 268 $ 219 $ 487 Consumer and other loans: Credit cards 1,747 1,436 3,183 Other consumer and other loans 3,436 716 4,152 Total CCBX $ 5,451 $ 2,371 $ 7,822 Principal Forgiveness Weighted Average Interest Rate Reduction Weighted Average Term Extension (years) (dollars in thousands) CCBX Commercial and industrial loans: All other commercial & industrial loans $ — — % 0.9 Real estate loans: Residential real estate loans 42 — n/a Consumer and other loans: Credit cards — 20.5 n/a Other consumer and other loans — — 0.8 Total CCBX $ 42 20.5 % 0.8 Term Extension Interest Rate Reduction Principal Forgiveness & Payment Delay Principal Forgiveness, Payment Delay & Term Extension Total (dollars in thousands; unaudited) CCBX Commercial and industrial loans: All other commercial & industrial loans $ 487 $ — $ 5 $ — $ 492 Consumer and other loans: Credit cards — 3,924 — — 3,924 Other consumer and other loans 3,155 — 1,143 619 4,917 Total $ 3,642 $ 3,924 $ 1,148 $ 619 $ 9,333 loancredit losses, thereby reducing that reserve.Term Loans Amortized Cost Basis by Origination Year Community Bank 2023 2022 2021 2020 2019 Prior Revolving Loans Amortized Cost Basis Revolving Loans Converted To Term Total (dollars in thousands) As of December 31, 2023 Commercial and industrial loans Risk rating Pass $ 15,882 $ 56,428 $ 15,566 $ 10,044 $ 12,429 $ 1,442 $ 33,412 $ 1,020 $ 146,223 Other Loan Especially Mentioned — — — 111 — — 3,168 — $ 3,279 Substandard — — — — — — — — $ — Doubtful — — — — — — — — — Total commercial and industrial
loans - All other commercial and
industrial loans$ 15,882 $ 56,428 $ 15,566 $ 10,155 $ 12,429 $ 1,442 $ 36,580 $ 1,020 $ 149,502 Current period gross write-offs $ — $ — $ — $ — $ — $ 46 $ — $ — $ 46 Real estate loans -
Construction, land and land
development loansRisk rating Pass $ 75,129 $ 49,275 $ 20,811 $ 2,859 $ 914 $ 1,598 $ — $ — $ 150,586 Other Loan Especially Mentioned — — 3,589 2,325 — — — — $ 5,914 Substandard — — — — — — 600 — $ 600 Doubtful — — — — — — — — $ — Total real estate loans -
Construction, land and land
development loans$ 75,129 $ 49,275 $ 24,400 $ 5,184 $ 914 $ 1,598 $ 600 $ — $ 157,100 Current period gross write-offs $ — $ — $ — $ — $ — $ — $ — $ — $ — Term Loans Amortized Cost Basis by Origination Year Community Bank 2023 2022 2021 2020 2019 Prior Revolving Loans Amortized Cost Basis Revolving Loans Converted To Term Total (dollars in thousands) As of December 31, 2023 Real estate loans -
Residential real estate loansRisk rating Pass $ 32,352 $ 41,362 $ 39,137 $ 30,259 $ 31,982 $ 22,429 $ 24,396 $ 18 $ 221,935 Other Loan Especially Mentioned — 1,098 2,020 28 — 40 100 — $ 3,286 Substandard — — — — — — — 170 $ 170 Doubtful — — — — — — — — $ — Total real estate loans -
Residential real estate loans$ 32,352 $ 42,460 $ 41,157 $ 30,287 $ 31,982 $ 22,469 $ 24,496 $ 188 $ 225,391 Current period gross write-offs $ — $ — $ — $ — $ — $ — $ — $ — $ — Real estate loans -
Commercial real estate loansRisk rating Pass $ 244,169 $ 303,329 $ 222,287 $ 144,602 $ 126,437 $ 233,482 $ 7,509 $ 1,719 $ 1,283,534 Other Loan Especially Mentioned — 3,257 5,891 171 506 2,099 100 — $ 12,024 Substandard — — — 924 6,900 — 151 — $ 7,975 Doubtful — — — — — — — — — Total real estate loans -
Commercial real estate loans$ 244,169 $ 306,586 $ 228,178 $ 145,697 $ 133,843 $ 235,581 $ 7,760 $ 1,719 $ 1,303,533 Current period gross write-offs $ — $ — $ — $ — $ — $ — $ — $ — $ — Consumer and other loans -
Other consumer and other loansRisk rating Pass $ 323 $ 272 $ 5 $ 679 $ 38 $ 164 $ 147 $ — $ 1,628 Other Loan Especially Mentioned — — — — — — — — $ — Substandard — — — — — — — — $ — Doubtful — — — — — — — — — Total consumer and other
loans - Other consumer and
other loans$ 323 $ 272 $ 5 $ 679 $ 38 $ 164 $ 147 $ — $ 1,628 Current period gross write-offs $ 18 $ — $ — $ — $ — $ — $ — $ — $ 18 Term Loans Amortized Cost Basis by Origination Year Community Bank 2023 2022 2021 2020 2019 Prior Revolving Loans Amortized Cost Basis Revolving Loans Converted To Term Total (dollars in thousands) As of December 31, 2023 Total community bank loans receivable Risk rating Pass $ 367,855 $ 450,666 $ 297,806 $ 188,443 $ 171,800 $ 259,115 $ 65,464 $ 2,757 $ 1,803,906 Other Loan Especially Mentioned — 4,355 11,500 2,635 506 2,139 3,368 — $ 24,503 Substandard — — — 924 6,900 — 751 170 $ 8,745 Doubtful — — — — — — — — — Total community bank loans $ 367,855 $ 455,021 $ 309,306 $ 192,002 $ 179,206 $ 261,254 $ 69,583 $ 2,927 $ 1,837,154 Current period gross write-offs $ 18 $ — $ — $ — $ — $ 46 $ — $ — $ 64 classifies some loans as Watch or Other Loans Especially Mentioned (OLEM). Loans classified as Watch are performing assets and classified as pass credits but have elements of risk that require more monitoring than other performing loans and are reported in the Pass column in the following table. Loans classified as OLEM are assets that continue to perform but have shown deterioration inevaluates credit quality based on the aging status of the loan, which was previously presented, and require close monitoring.by payment activity. The following table presents the loans in CCBX based on payment activity:Term Loans Amortized Cost Basis by Origination Year CCBX 2023 2022 2021 2020 2019 Prior Revolving Loans Amortized Cost Basis Revolving Loans Converted To Term Total (dollars in thousands) As of December 31, 2023 Commercial and industrial loans -
Capital call linesPayment performance Performing $ — $ — $ — $ — $ — $ — $ 87,494 $ — $ 87,494 Nonperforming — — — — — — — — — Total commercial and industrial
loans - Capital call lines$ — $ — $ — $ — $ — $ — $ 87,494 $ — $ 87,494 Current period gross write-offs $ — $ — $ — $ — $ — $ — $ — $ — $ — Commercial and industrial loans -
All other commercial and industrial loansPayment performance Performing $ 42,267 $ 6,835 $ 9 $ 11 $ — $ — $ 3,090 $ — $ 52,212 Nonperforming 1,333 277 — — — — 476 — 2,086 Total commercial and industrial
loans - All other commercial and
industrial loans$ 43,600 $ 7,112 $ 9 $ 11 $ — $ — $ 3,566 $ — $ 54,298 Current period gross write-offs $ 3,848 $ 2,502 $ 15 $ 16 $ — $ — $ 224 $ — $ 6,605 Term Loans Amortized Cost Basis by Origination Year CCBX 2023 2022 2021 2020 2019 Prior Revolving Loans Amortized Cost Basis Revolving Loans Converted To Term Total (dollars in thousands) As of December 31, 2023 Real estate loans -
Residential real estate loansPayment performance Performing $ — $ — $ — $ — $ — $ — $ 212,435 $ 24,485 $ 236,920 Nonperforming — — — — — — 1,115 — 1,115 Total real estate loans -
Residential real estate loans$ — $ — $ — $ — $ — $ — $ 213,550 $ 24,485 $ 238,035 Current period gross write-offs $ — $ — $ — $ — $ — $ — $ 4,641 $ — $ 4,641 Consumer and other loans -
Credit cardsPayment performance Performing $ — $ — $ — $ — $ — $ — $ 469,049 $ 1,953 $ 471,002 Nonperforming — — — — — — 33,655 1,180 34,835 Total consumer and other
loans - Credit cards$ — $ — $ — $ — $ — $ — $ 502,704 $ 3,133 $ 505,837 Current period gross write-offs $ — $ — $ — $ — $ — $ — $ 61,358 $ — $ 61,358 Consumer and other loans -
Other consumer and other loansPayment performance Performing $ 216,024 $ 50,732 $ 6,888 $ 98 $ 418 $ 317 $ 27,609 $ — $ 302,086 Nonperforming 4,229 3,074 477 — 7 10 691 — 8,488 Total consumer and other
loans - Other consumer and
other loans$ 220,253 $ 53,806 $ 7,365 $ 98 $ 425 $ 327 $ 28,300 $ — $ 310,574 Current period gross write-offs $ 17,815 $ 43,115 $ 11,574 $ 84 $ 346 $ 217 $ 6,178 $ — $ 79,329 Total CCBX loans receivable Payment performance Performing $ 258,291 $ 57,567 $ 6,897 $ 109 $ 418 $ 317 $ 799,677 $ 26,438 $ 1,149,714 Nonperforming 5,562 3,351 477 — 7 10 35,937 1,180 46,524 Total CCBX loans $ 263,853 $ 60,918 $ 7,374 $ 109 $ 425 $ 327 $ 835,614 $ 27,618 $ 1,196,238 Current period gross write-offs $ 21,663 $ 45,617 $ 11,589 $ 100 $ 346 $ 217 $ 72,401 $ — $ 151,933 ratingratings are as follows as of the periods indicated:Consolidated Consolidated Pass Other Loans
Especially
MentionedSub-
StandardDoubtful Total (dollars in thousands) (dollars in thousands) December 31, 2022 December 31, 2022 December 31, 2022 Commercial and industrial loans Commercial and industrial loans Construction, land, and land development Construction, land, and land development $ Less net deferred origination fees LoanCredit LossesCompany’s ALLL covers estimatedcredit enhancement asset is reduced when credit enhancement payments are received from the CCBX partner or taken from the partner's cash reserve account. CCBX partners provide for credit enhancements that provide protection to the Bank from credit and fraud losses by reimbursing the Bank for the losses. If the partner is unable to fulfill its contracted obligations then the Bank could be exposed to the loss of the reimbursement and credit enhancement income. In accordance with the program agreement for one CCBX partner, the Company is responsible for credit losses on individually evaluated loansapproximately 10% of a $288.1 million loan portfolio that are determined to be impaired as well as estimated probablewithout credit enhancement reimbursements. At December 31, 2023, 10% of this portfolio represented $29.1 million in loans. The partner is responsible for reimbursing credit losses inherent in the remainderon approximately 90% of this portfolio and for fraud losses on 100% of this portfolio. The Company earns 100% of the loan portfolio. The ALLL is prepared using the information provided by the Company’s credit review process and our historical loss data, together with data from peer institutions and economic information gathered from published sources.The loan portfolio is segmented into groups of loans with similar risk profiles. Each segment possesses varying degrees of risk basedinterest income on the typeaforementioned $29.1 million of loan, the typeloans.collateral, and the sensitivity of the borrower or industry to changes in external factors such as economic conditions. An estimated loss rate calculated the Company’s actual historical loss rates adjusted for current portfolio trends, economic conditions, and other relevant internal and external factors, is applied to each group’s aggregate loan balances.Contentsallowance for loan loss,ACL, as well as the activity in the allowance for loan lossACL attributed to various segments in the loan portfolio, as of and for the year ended December 31, 2018:The following tables summarize2023 and the allocation and activity of the loans and allowance for loan loss, as well as the activity in the allowance for loan losslosses ("ALLL ") attributed to the various segments in the loan portfolio as of and for the year ended December 31, 2017:Commercial
and
IndustrialConstruction,
Land, and
Land
DevelopmentResidential
Real
EstateCommercial
Real EstateConsumer
and OtherUnallocated Total (dollars in thousands) Twelve Months Ended December 31, 2023 ALLL balance, December 31, 2022 $ 4,831 $ 7,425 $ 4,142 $ 5,470 $ 50,996 $ 1,165 $ 74,029 Impact of adopting CECL (ASC 326) 1,428 (1,589) 1,623 1,240 2,315 (1,165) $ 3,852 Provision for credit losses or (recapture) 9,264 550 11,921 731 161,577 — 184,043 15,523 6,386 17,686 7,441 214,888 — 261,924 Loans charged-off (6,651) — (4,641) — (140,705) — (151,997) Recoveries of loans previously charged-off 5 — 4 — 7,022 — 7,031 Net charge-offs (6,646) — (4,637) — (133,683) — (144,966) ACL balance, December 31, 2023 $ 8,877 $ 6,386 $ 13,049 $ 7,441 $ 81,205 $ — $ 116,958 Twelve Months Ended December 31, 2022 ALLL Balance, December 31, 2021 $ 3,221 $ 6,984 $ 4,598 $ 6,590 $ 7,092 $ 147 $ 28,632 Provision for credit losses or (recapture) 2,125 441 (4) (1,120) 76,604 1,018 79,064 5,346 7,425 4,594 5,470 83,696 1,165 107,696 Loans charged-off (555) — (452) — (32,742) — (33,749) Recoveries of loans previously charged-off 40 — — — 42 — 82 Net charge-offs (515) — (452) — (32,700) — (33,667) ALLL Balance, December 31, 2022 $ 4,831 $ 7,425 $ 4,142 $ 5,470 $ 50,996 $ 1,165 $ 74,029 Twelve Months Ended December 31, 2021 ALLL balance, December 31, 2020 $ 3,353 $ 3,545 $ 3,410 $ 7,810 $ 127 $ 1,017 $ 19,262 Provision for credit losses or (recapture) 23 3,439 1,267 (1,220) 7,276 (870) 9,915 3,376 6,984 4,677 6,590 7,403 147 29,177 Loans charged-off (222) — (79) — (339) — (640) Recoveries of loans previously charged-off 67 — — — 28 — 95 Net charge-offs (155) — (79) — (311) — (545) ALLL balance, December 31, 2021 $ 3,221 $ 6,984 $ 4,598 $ 6,590 $ 7,092 $ 147 $ 28,632 Real Estate Business Assets Total ACL (dollars in thousands; unaudited) December 31, 2023 Real estate loans: Residential real estate $ 170 $ — $ 170 $ — Commercial real estate 7,145 — 7,145 — Total $ 7,315 $ — $ 7,315 $ — Unpaid
Contractual
Principal
BalanceRecorded
Investment
With No
AllowanceRecorded
Investment
With
AllowanceTotal
Recorded
InvestmentRelated
Allowance(dollars in thousands) December 31, 2022 Commercial and industrial loans $ 124 $ — $ 113 $ 113 $ 95 Real estate loans: Construction, land and land development 67 66 — 66 — Residential real estate — — — — — Commercial real estate 6,901 6,901 — 6,901 — Total $ 7,092 $ 6,967 $ 113 $ 7,080 $ 95 Twelve Months Ended December 31, 2022 December 31, 2021 Average
Recorded
InvestmentInterest Income
RecognizedAverage
Recorded
InvestmentInterest Income
Recognized(dollars in thousands) Commercial and industrial loans $ 121 $ — $ 498 $ — Real estate loans: Construction, land and land development 40 — — — Residential real estate 32 — 143 — Commercial real estate 1,395 — — — Total $ 1,588 $ — $ 641 $ — 2023 2023 2022 (dollars in thousands) (dollars in thousands) 34,238 $1,071,000$2.3 million and $993,000$1.8 million for the years ended December 31, 20182023 and 2017,2022, respectively.leases certain branch and office facilitieshas committed to rent premises used in business operations under non-cancelable operating leases and determines if an arrangement meets the definition of a lease upon inception.threeless than two months to twenty21.2 years, with additional renewal options on certain leases typically ranging from 5 to 10 years. ManyAt December 31, 2023, the dollar weighted average remaining lease term for the Company’s operating leases was 9.0 years.includeinclusive of renewal options and provide for rate adjustments based on changes in various economic indicators. Thethat the Company leases its Silver Lake and Everett facilities from related parties (Note 11). Gross rental expense for branch facilities was $1,178,000 and $1,065,000 for 2018 and 2017, respectively. is reasonably certain to renew:(dollars in thousands) December 31,
20232024 $ 1,016 2025 974 2026 977 2027 913 2028 692 2029 and thereafter 2,763 Total lease payments 7,335 Less: amounts representing interest 1,211 Present value of lease liabilities $ 6,124 In 2018 a long-term tenant did not renew their lease. Lease and sublease income was $81,000$205,000 and $222,000$157,000 for 20182023 and 2017,2022, respectively.Company entered into a capitalfollowing table presents the components of total lease expense and operating cash flows for the purchase of ATM equipment for $5,000 and $18,000 for 2018 and 2017, respectively. Depreciation related to the capitalized equipment totaled $65,000 and $52,000 for the yearsyear ended December 31, 2018 and 2017, respectively. This capital lease obligation is included2023:For the Year Ended (dollars in thousands) December 31,
2023December 31,
2022December 31,
2021Lease expense: Operating lease expense $ 1,074 $ 1,281 $ 1,283 Variable lease expense 236 193 148 Total lease expense (1) $ 1,310 $ 1,474 $ 1,431 Cash paid: Cash paid reducing operating lease liabilities $ 1,334 $ 1,473 $ 1,419 other liabilities onnet occupancy expense in the consolidated balance sheet.The following sets forth, asConsolidated Statements of December 31, 2018, the future minimum lease payments under noncancelable operating leases, capital leases and future minimum income receivable under noncancelable operating leases and subleases:67 - Deposits(dollars in thousands) (dollars in thousands) December 31,
2023December 31,
2022(dollars in thousands) (dollars in thousands) Demand, noninterest bearing NOW and money market Savings Brokered deposits Brokered deposits Brokered deposits 2018 (dollars2023:(dollars in thousands) Twelve months $ 13,999 One to two years 2,490 Two to three years 1,119 Three to four years 100 Four to five years 650 Thereafter — $ 18,358 thousands):total deposits is $340.1 million in IntraFi network reciprocal NOW and money market sweep accounts as of December 31, 2023, which provides our customers with fully insured deposits through a sweep and exchange of deposits with other financial institutions.78 – Federal Home Loan Bank Advances and Other Borrowings20182023 and 2017December 31, 2022 the Company had $20,000,000 inno overnight or term FHLB advances. TheFHLB advances are secured by a blanket pledge of eligible collateral including first lien single family and multi-family mortgages with a carrying value of $112,117,000$321.5 million and $103,092,000$175.1 million at December 31, 20182023 and 2017,2022, respectively. The Company has available borrowing capacity of an additional $59,300,000$204.6 million from FHLB at December 31, 2018,2023, subject to certain collateral requirements and with interest at then stated rate.summarizes activities in advances from theprovides details on FHLB advance borrowings for the periods indicated:Year Ended December 31, (Dollars in thousands) 2023 2022 Maximum amount outstanding at any month-end during period: $ — $ — Average outstanding balance during period: $ 1 $ 6,029 Weighted average interest rate during period: 5.60 % 1.13 % Balance outstanding at end of period: $ — $ — Weighted average interest rate at end of period: — % — % an $8,000,000a $50.0 million unsecured line of credit with interest payable at the then-stated rate, with PCBB, which expires in June 2019.2024. There were no borrowings on this line at December 31, 20182023 or 2017. (BIC)(“BIC”) arrangement with the FRB, which is secured by eligible loans, with interest payable at the then-stated rate. At December 31, 2018,2023, the Company had pledged commercial real estate loans totaling $42,912,000,$685.7 million, which provided available borrowing capacity of $20,780,000.$435.5 million. At December 31, 2017,2022, the Company had pledged commercial real estate loans totaling $43,916,000,$45.0 million, which provided available borrowing capacity of $21,140,000.$26.7 million. There were no borrowings outstanding on this line of credit at December 31, 20182023 or 2017.89 – Subordinated Debt20182023 and 2017,2022, the Company’s subordinated debt was as follows:Aggregate Principal
Amount December 31,
2023Aggregate Principal
Amount December 31,
2023Aggregate Principal
Amount December 31,
2022(dollars in thousands) (dollars in thousands) July 29, 2016,August 18, 2021, the Company issuedentered into a $25.0 million subordinated note payable to Banterra Bank. purchase agreement.The $10,000,000 note maturingmatures on AugustSeptember 1, 2026,2031, is fixed for five years at 5.65%3.375%, and thereafter is variable at a floating rate, calculated quarterly, based on the Wall Street Journal prime rate plus 2.5%3-month SOFR +2.76%. Interest is paid quarterly. Principal payments of $500,000 per quarter commence2021, in conjunction with2022, the Company entered into a $20.0 million subordinated note purchase agreement. The note matures on November 1, 2032, is fixed for five years at 7.000%, and thereafter is variable at a floating rate, period. Interestcalculated quarterly, based on the 3-month SOFR +2.90%.$587,000$2.4 million and $1.2 million was recognized during 20182023 and 2017,2022, respectively, and accrued interest payable on this notethese notes totaled $96,000$515,000 and $535,000 at December 31, 20182023 and 2017.2022, respectively.910 – Junior Subordinated Debentures20182023 and 2017,2022, the Company’s junior subordinated debentures were as follows:Coastal (WA) Statutory Trust I Aggregate Principal
Amount December 31,
2023Aggregate Principal
Amount December 31,
2022(dollars in thousands) (dollars in thousands) $3,609,000$3.6 million floating rate junior subordinated debentures to Coastal (WA) Statutory Trust I, which was formed for the issuance of trust preferred securities. ThePrior to June 30, 2023, the debentures bearbore interest at three-montha rate per annum equal to the 3-month LIBOR plus 2.10% (4.88% and 3.69% at. Beginning with rate adjustments subsequent to June 30, 2023, the rate is based off three-month CME Term SOFR plus 0.26%. The effective rate as of December 31, 20182023 and 2017, respectively).December 31, 2022 was 7.75% and 6.87%, respectively. Interest is payable quarterly. Interest expense of $157,000$271,000 and $122,000$143,000 was recognized during 20182023 and 2017,2022, respectively, and accrued interest payable on these securities totaled $7,000$13,000 and $6,000$12,000 at December 31, 20182023 and 2017,2022, respectively. There are no principal payments due on these debentures in the next five years.10 – Federal Income11 –Income Taxes federal income tax for the Company consisted of the following at December 31:2023 2023 2022 2021 (dollars in thousands) (dollars in thousands) 20182023 the current net income tax payablereceivable was $216,000$9.1 million and at December 31, 20172022 the net income tax receivable was $200,000. 2023 2023 2022 2021 (dollars in thousands) (dollars in thousands) Amount Amount Rate Amount Rate Amount Rate Federal income tax at statutory rate $ 11,998 21.0 21.0 % $ 10,630 21.0 21.0 % $ 7,219 21.0 21.0 % State income taxes Excess executive compensation Bank owned life insurance earnings $ $ 12,554 22.0 % $ 9,996 19.7 % $ 7,372 21.4 % 20182023 or 2017.2022. The Company and Bank have entered into a tax allocation agreement, which provides that income taxes shall be allocated between the parties on a separate monthly basis. The intent of this agreement is that each member of the consolidated group will incur no greater tax liability than it would have incurred on a stand-alone basis.2023 2023 2022 (dollars in thousands) (dollars in thousands) Deferred tax assets: Allowance for credit losses Allowance for credit losses Allowance for credit losses Lease liability Stock based compensation Accrued expenses Deferred compensation Net unrealized loss on available-for-sale securities Other Other Other Deferred tax liabilities: Credit enhancement recovery Right of use asset Other 20182023 will be fully realized and therefore no valuation allowance was recorded.2018,2023, the Company had no federal net operating loss carryforwards or tax credit carryforwards. The Company files federal and various state income tax returns. Federal tax returns for the 20152020 tax year and later are open for examination. The total amount of unrecognized tax benefits, including interest and penalties, at December 31, 20182023 was not material. The amount of tax benefits that would impact the effective rate, if recognized, is not expected to be material. The Company does not anticipate any significant changes with respect to unrecognized tax benefits within the next 12 months.On December 22, 2017, H.R.1, commonly known as the Tax Cuts and Jobs Act (the “Act”) was signed into law. Among other things, the Act reduced the Company’s corporate federal tax rate from 34% to 21% effective January 1, 2018. As a result, the Company was required to re-measure, through income tax expense, its deferred tax assets and liabilities’ using the enacted rate that management expects going forward. The re-measurement of the Company’s net deferred tax asset resulted in additional income tax expense of approximately $1,295,000 for the year ended December 31, 2017.1112 – Related Party Transactions20182023 and 2017,2022, the Company had transactions made in the ordinary course of business with certain of its executive officers and directors. All loans included in such transactions were made on substantially the same terms, including interest rate and collateral, as those prevailing at the time for comparable transactions with other persons, and did not, in the opinion of management, involve more than normal credit risk or present other unfavorable features.2023 2023 2022 (dollars in thousands) (dollars in thousands) Payments Ending Balance December 31 Ending Balance December 31 $3,168,000$4.0 million and $4,007,000$5.5 million from directors, principal shareholders and executive officers at December 31, 20182023 and 2017,2022, respectively.As discussed All deposits included in Note 5,such transactions were made on substantially the same terms, including interest rate, as those prevailing at the time for comparable transactions with other persons.leases two facilitiesobtains legal services from related parties.Adams and Duncan, Inc. P.S., a law firm in which one of the Company’s directors is a partner. The Silver Lakeservices provided include general legal counsel and specialized CCBX agreement counsel. The Company also uses other law firms for legal counsel and specialties such as regulatory and SEC counsel. For fiscal year ended December 31, 2023 and 2022, total payments for legal services were $1.0 million and $864,000, respectively.is leased under a noncancelable operating lease from an entity that is owned by a director. The lease was renewed in 2018 and amended at a market rate for ten years, with two renewal options of five years each. Payments are $15,000 a month and increase annually based on changes in the Consumer Price Index. The director has a related party loan with the Company that is secured by the Silver Lake facilityin 2023 and totals $1,865,000 at December 31, 2018.2022. The Everett branch facility is leased from a group of investors, one of which iswas a director.director until he retired from the board in May 2023. The Everett lease originated in 1997 for ten years and has been renewedextended multiple times. The current lease is through March 2024.2034. Monthly rent under the Everett lease iswas $46,000 through March 2023 and decreased to $19,000 a month beginning in May 2023, due to a lower lease rate and a reduction in the square footage leased; rent for the remaining lease term.April of 2023 was a blended rate. Rents paid during 20182023 and 2017 under these2022 for the related party leasesEverett lease totaled $ 721,000$316,000 and $684,000,$546,000, respectively.1213 – Commitments and Contingencies20182023 and 2017,2022, the Company had a reserve for unfunded commitments of $304,000$582,000 and $210,000,$974,000, respectively, included in other liabilities on the consolidated balance sheet.Financial instruments whose contract amount represents The following table presents commitments associated with outstanding commitments to extend credit, risk werestandby and commercial letters of credit and equity investment commitments as follows at December 31:(dollars in thousands; unaudited) 2023 2022 Commitments to extend credit: Commercial and industrial loans $ 86,134 $ 81,568 Commercial and industrial loans - capital call lines 608,837 772,732 Construction – commercial real estate loans 92,709 109,715 Construction – residential real estate loans 20,825 32,827 Residential real estate loans 465,887 374,735 Commercial real estate loans 54,289 35,024 Consumer and other loans 1,015,738 793,563 Total commitments to extend credit $ 2,344,419 $ 2,200,164 Standby letters of credit $ 1,096 $ 3,064 Equity investment commitment $ 653 $ 988 The Company evaluates We evaluate eachcustomer’screditworthinesson a case-by-casebasis.The amountof collateralobtained,ifdeemed considered necessaryby theCompanyus, upon extensionof credit,isbasedon management’screditevaluation. evaluation of the customer. The typeof collateralheldvariesbut mayincludeaccountsreceivable,inventory,propertyand equipment,and income- producingcommercialproperties.the Companyus to guarantee the performance of a customer to a third party. Standby lettersIn the event of credit generallynonperformance by the customer, we have fixed expiration dates rights to the underlying collateral, which can include commercial real estate, physical plant and property, inventory, receivables, cash and/or other termination clauses and may require payment of a fee. Themarketable securities. Our credit risk involved inassociated with issuing letters of credit is essentially the same as thatthe risk involved in extending loan facilities to our customers. The Company’s policy for obtaining collateral, and the nature of such collateral, is essentially the same as that involved in making commitments to extend credit. In the event the customer does not perform in accordance with the terms of the agreement with the third party, the Company would be required to fund the commitment. No losses were incurred in 20182023 or 20172022 under these commitments.(dollars in thousands; unaudited) 2023 2022 Commitments to extend credit: Commercial and industrial loans $ 9,144 $ 952 Commercial and industrial loans - capital call lines 608,837 772,732 Residential real estate loans 418,761 329,193 Consumer and other loans 1,015,156 792,447 Total commitments to extend credit $ 2,051,898 $ 1,895,324 (dollars in thousands; unaudited) Type of Lending Maximum Portfolio Size Commercial and industrial loans: Capital call lines Business - Venture Capital $ 350,000 All other commercial & industrial loans Business - Small Business 305,905 Real estate loans: Home equity lines of credit Home Equity - Secured Credit Cards 375,000 Consumer and other loans: Credit cards Credit Cards - Primarily Consumer 756,614 Installment loans Consumer 933,374 Other consumer and other loans Consumer - Secured Credit Builder & Unsecured consumer 709,108 3,430,001 1314 – Concentration of Credit RiskCompany’s community bank’s businessactivityiswith customerswho areconcentratedin thestateof Washington. Investmentsin municipalsecuritiesinvolvegovernmentalentitieswithinthestate.Generally,amountsplacedor investedin bank accountsareinsuredby theFDICup to $250,000 per depositor for each account ownership category at a bank. Uninsureddepositsin bank accounts held by the Company and Bank atDecember31, 20182023 and 2017,2022, totaled$36,055,000 $6.3 million and $6,717,000,$45.4 million, respectively.Loans to the same borrower aregenerallylimited,by state banking regulations,to 20% of theBank’s capital and surplus.The Company managesasset quality and controlscreditriskthroughdiversificationof theloanportfolio and theapplicationof policiesdesignedto promotesound underwritingand loanmonitoringpractices.The Company regularlyutilizesrealestateas collateralto reducetheriskof creditlossin theloanportfolio.As of December31, 20182023 and 2017,2022, theCompany has a concentrationof creditin commercialrealestate.Commercial realestateloansaretypicallysecuredby theBank’s firstlienpositionon thesubjectproperty.Standby lettersof creditwere grantedprimarilyto commercialborrowers.1415 - Stock-Based CompensationOn April 30, the Company’s shareholders approved the Coastal Financial Corporation Omnibus Plan (“2018 Omnibus Incentive Plan (2018 Plan). The 2018 PlanPlan”) authorizes the Company to grant awards, including but not limited to, stock options, restricted stock units, and restricted stock awards, to eligible employees, directors or individuals that provide service to the Company, up to an aggregate of 500,000 shares of common stock. On May 24, 2021, the Company’s shareholders approved the First Amendment to the 2018 Plan, which increased the authorized plan shares by 600,000. The 2018 Plan replaces both the 2006 Plan and ourthe Directors’ Stock Bonus Plan (2006 Plan)(“2006 Plan”). Existing awards will vest under the terms granted and no further awards will be madegranted under these previousprior plans. Shares available to be granted under the 2018 plan were 487,000433,644 at December 31, 2018.In January 2018, the Company granted 28,546 nonqualified stock options under the 2006 Plan to an employee, which vest ratably over 10 years. The Company also granted 87,500 qualified stock options under the 2006 Plan to employees, which vest ratably over 10 years. In October 2018, the Company granted 9,000 qualified stock options under the 2018 Plan to employees, which vest ratably over 7.5 years.model that uses the assumptions noted in the following table.model. Expected volatilities are based on historical volatility of the Company’s stock and other factors. The Company uses the vesting term and contractual life to determine the expected life. The risk-free interest rate for periods within the contractual life of the option is based on the U.S. Treasury yield curve in effect at the time of grant. Compensation expense related to unvested stock option awards is reversed at date of forfeiture.The following assumptionsused to estimate the value ofno new options granted under the 2006 Plan and the 2018 Plan as applicable in the periods indicated:year ended December 31, 2023.2018:Options Shares Weighted-
Average
Exercise
PriceWeighted-
Average
Remaining
Contractual
Term (Years)Aggregate
Intrinsic Value(dollars in thousands, except per share amounts) Outstanding at December 31, 2022 438,103 $ 8.79 4.1 $ 16,968 Granted — $ — Exercised (83,134) $ 7.43 Expired — $ — Forfeited — $ — Outstanding at December 31, 2023 354,969 $ 9.11 3.3 $ 12,531 Vested or expected to vest at December 31, 2023 354,969 $ 9.11 3.3 $ 12,531 Exercisable at December 31, 2023 181,820 $ 8.62 2.9 $ 6,508 20182023 was $193,000.$2.7 million. The intrinsic value of options exercised during the year ended December 31, 20172022 was not significant.2018,2023, there was $1,610,000$804,000 of total unrecognized compensation cost related to nonvested stock options granted under the Plan. Total unrecognized compensation costs is adjusted for unvested forfeitures. The Company expects to recognize that cost over a weighted-average period of approximately 6.83.8 years. Compensation expense recorded related to stock options was $276,000$319,000 and $253,000$331,000 for the years ended December 31, 2023 and 2022, respectively.2017,1,084 restricted stock units which vest ratably over 5 years. In the second quarter of 2023, the Company granted 9,827 restricted stock units under the 2018 Plan to employees, which vest ratably over 5 years. In the third quarter of 2023, the Company granted 4,000 restricted stock units under the 2018 Plan to employees, which vest ratably over 3 years and 2,150 restricted stock units that vest ratably over 5 years. In the fourth quarter of 2023, the Company granted no restricted stock units under the 2018 Plan.Nonvested shares - RSUs Shares Weighted-
Average
Grant Date
Fair
Value(dollars in thousands, except per share amounts) Nonvested shares at December 31, 2022 380,151 $ 28.61 Granted 90,672 $ 42.61 Forfeited (15,032) $ 36.70 Vested (46,520) $ 30.37 Nonvested shares at December 31, 2023 409,271 $ 31.22 20182023, there was $67,000$36,000 of total unrecognized compensation cost related to nonvested restricted stock awards. The Company expects to recognize that cost over the remaining weighted-average vesting period of approximately 7.74.1 years. Compensation expense recorded related to restricted stock awards was $3,000 and $1,000$9,000 for the years ended December 31, 2023 and 2022.2017,the Board Chair is granted stock with a total market value of approximately $75,000. Committee chairs receive additional stock in an amount that varies depending upon the nature and frequency of the committee meetings. The audit committee chair receives additional stock with a market value of approximately $10,000, non-financial risk and compensation committee chairs receive additional stock with a market value of approximately $7,500, and the asset liability & investment, credit and nominating & governance chairs receive additional stock with a market value of approximately $5,000. Stock is granted as of each annual meeting date and vest one day prior to the next annual meeting date. During the vesting period, the grants are considered participating securities.20182023 and changes during the year is presented below:Nonvested shares - RSAs Nonvested shares - RSAs Shares Weighted-
Average
Grant Date
Fair
Value(dollars in thousands, except per share amounts) (dollars in thousands, except per share amounts) Nonvested shares at December 31, 2022 Nonvested shares at December 31, 2023 Director’s Stock BonusThe Company adopted and subsequently amended the Director’s Stock Bonus Plan (Bonus Plan). The Bonus Plan was replaced on April 30, 2018, when the shareholders approved the 2018 Omnibus Incentive Plan.Under the Bonus Plan, the Company could grant up to 50,000 shares. Stock was granted to directors who have attended at least 75% of the scheduled board meetings during the prior year. Grants cliff vest over two years from date awarded, contingent on the director still being a director of the Company. During the vesting period, the grants are considered participating securities. Grants also immediately vest when a director has attained the retirement age of 72 and retires from the Board.The Bonus Plan granted shares with a total market value of $5,000 per director, per year, with the exception of the board chairman receiving $7,500 per year, and committee chairmen receiving $6,250 per year. Directors unable to receive stock will receive cash in lieu upon completion of the vesting period. Cash awards are recognized over the vesting period and recorded in other liabilities until paid. The amended Bonus Plan would have expired on May 31, 2018 if it was not replaced on April 30, 2018. Awards previously granted under the Bonus Plan will vest under the term granted.In January 2018, there were 4,405 shares granted to five directors at an estimated fair value of $7.10 per share. During 2017, there were 4,810 shares granted to five directors at an estimated fair value of $6.50 per share. Compensation expense recorded related to the Plan totaled $31,000 for the years ended December 31, 2018 and 2017.1516 – Employee Benefit Plansemployees,who have completedone yearor more employees. Match eligibility coincides with the first of service.the month following hire date in accordance with the 401(k) plan. Matchingcontributionsareusuallyequalto a percentageof employee compensation.20182023 and 2017,2022, the Company provided matching contributions totaling $436,000$1.6 million and $398,000,$1.3 million, respectively.$6,688,000$12.9 million and $6,500,000$12.7 million atDecember31, 20182023 and 2017,2022, respectively.Liabilitiesto employees,which arebeingaccruedoverthelifeof theparticipant’sPlan, were $1,078,000$479,000 and $1,175,000$616,000 at December31, 20182023 and 2017,2022, respectively.Compensationexpenserelatedto thisPlan was $78,000$39,000 and $85,000$48,000 fortheyearsended December31, 20182023 and 2017,2022, respectively.Paymentsof accruedbenefitstotaling$175,000 $175,000 were madeduring2018 2023 and 2017.1617 - Regulatory MattersBank’s financial statements. statements of the Bank and the Company.and the regulatory framework for prompt corrective action, theCompany and Bank must meet specific capital adequacy guidelines that involve quantitative measures of the Bank’stheir assets, liabilities and certain off-balance-sheet items as calculated under regulatory accounting practices. The Company’s and Bank’s capital amountsratios and the Bank’s classification under the20182023 and 2017.20182023 and 2017.2022. Such determination has been made based on the Bank’s total risk-based capital ratio, Tier 1 risk-based capital ratio, common equity Tier 1 totalrisk-based capital ratio, and leverage ratios.ratio. There have been no conditions or events since December 31, 2018,2023, that management believes would change the Bank’s category.The final rules implementing Basel Committee on Banking Supervision’sguidelines for U.S. banks (Basel III rules) became effective foradequacy regulations, the Bank on January 1, 2015, with full compliance with all of the requirements being phased in over a multi-year schedule,Company and fully phased in by January 1, 2019. Under the Basel III rules, the Bank must holdmaintain a capital conservation buffer of common equity Tier 1 capital of more than 2.5% above the adequately capitalizedminimum risk-based capital ratios. Theratios to avoid restrictions on the payment of capital conservation buffer is being phased in from 0.0% for 2015 to 2.50% by 2019. The capital conservation buffer for 2018 was 1.875%distributions and for 2017 was 1.25%. The net unrealized gain or loss on available-for-sale securities is not included in computing regulatory capital. discretionary bonus payments.exceedsexceed all capital adequacy requirements to which they are subject, including the Basel III rules,ratios described below and the capital conservation buffer, as of December 31, 2018.2023.Actual Actual Required to be Well
Capitalized
Under the Prompt
Corrective Action
ProvisionsAmount Amount Ratio Amount Ratio Amount Ratio (dollars in thousands) (dollars in thousands) December 31, 2023 Leverage Capital (to average assets) Leverage Capital (to average assets) Leverage Capital (to average assets) Consolidated Consolidated $ 298,920 8.10 8.10 % $ 147,616 4.00 4.00 % N/A Bank Only 333,848 9.06 9.06 % 147,469 4.00 4.00 % 184,336 5.00 5.00 % Common Equity Tier 1 risk-based capital ratio (to risk-weighted assets) Consolidated Consolidated 295,450 9.10 9.10 % 146,137 4.50 4.50 % N/A Bank Only 333,848 10.30 10.30 % 145,875 4.50 4.50 % 210,708 6.50 6.50 % Tier 1 Capital (to risk-weighted assets) Consolidated Consolidated 298,920 9.20 9.20 % 194,849 6.00 6.00 % N/A Bank Only 333,848 10.30 10.30 % 194,500 6.00 6.00 % 259,334 8.00 8.00 % Consolidated 385,464 11.87 11.87 % 259,799 8.00 8.00 % N/A Bank Only 375,320 11.58 11.58 % 259,334 8.00 8.00 % 324,167 10.00 10.00 % December 31, 2022 Leverage Capital (to average assets) Leverage Capital (to average assets) Consolidated Consolidated $ 204,585 8.07 % $ 101,460 4.00 % N/A Bank Only 201,783 7.96 7.96 % 101,350 4.00 4.00 % 126,687 5.00 5.00 % Common Equity Tier 1 risk-based capital ratio (to risk-weighted assets) Consolidated Consolidated Consolidated 201,085 11.06 % 81,834 4.50 % N/A Bank Only Bank Only 201,783 11.12 % 81,623 4.50 % 117,900 6.50 % Tier 1 Capital (to risk-weighted assets) Consolidated Consolidated 204,585 11.25 11.25 % 109,112 6.00 6.00 % N/A Bank Only 201,783 11.12 11.12 % 108,830 6.00 6.00 % 145,107 8.00 8.00 % Consolidated Consolidated 252,405 13.88 % 145,483 8.00 % N/A Bank Only 224,545 12.38 12.38 % 145,107 8.00 8.00 % 181,384 10.00 10.00 % Note 16 - Shareholders’ EquityOn May 4, 2018effected a 1-for-5 reverse stock split, decreasingoperated under the numberSmall Bank Holding Company Policy Statement and therefore was not subject to Basel III capital adequacy requirements.issued shares from 46,268,359 to 9,254,073, including 401 additional shares issued to shareholders with fractional shares. Authorized shares were not impacted by the reverse stock split. Share and per share amounts included in the consolidated financial statements and accompanying notes reflect the effect of the split for all periods presented.During 2017, the Articles of Incorporation of the Company were amended to increase the total authorized preferred stock from 500,000 shares to 25,000,000 shares. There were no shares of preferred stock issued and outstanding at December 31, 2018 and 2017.During 2017, the Articles of Incorporation of the Company were amended to increase total authorized common shares to 300,000,000 shares, an increase of 200,000,000 from the 100,000,000 common shares previously authorized. At December 31, 2018 and December 31, 2017, there were 11,893,203 and 8,887,457 common shares issued and outstanding.During 2017, the Articles of Incorporation of the Company were amended to provide that 1,000,000 shares of common stock, out of the 300,000,000 shares authorized, be designated as Class B nonvoting common shares. On September 26, 2018 all 100,000 shares of Class B nonvoting common stock were exchanged for voting common stock on terms and conditions approved by the Company’s board of directors. At December 31, 2017, there were 100,000 shares of Class B nonvoting common stock issued and outstanding.During 2017, the Articles of Incorporation of the Company were amended to provide that up to 100,000,000 shares of common stock, out of the 300,000,000 shares authorized, may be designated as Class C nonvoting common shares. On September 26, 2018, 261,444 Class C shares were exchanged for common stock on terms and conditions approved by the Company’s board of directors. There were zero and 261,444 shares of Class C nonvoting common stock issued and outstanding, at December 31, 2018 and 2017, respectively.Note17Note 18 - Fair Value Measurements(1)The estimated fair value of loans receivable, net and deposits for December 31, 2018 reflect exit price assumptions. The December 31, 2017 fair value estimates may not reflect exit price assumptions.December 31, 2023 Fair Value Measurements Using Carrying
ValueEstimated
Fair ValueLevel 1 Level 2 Level 3 (dollars in thousands) Financial assets Cash and due from banks $ 31,345 $ 31,345 $ 31,345 $ — $ — Interest earning deposits with other banks 451,783 451,783 451,783 — — Investment securities 150,364 150,545 99,461 51,084 — Other investments 10,227 10,227 — 7,605 2,622 Loans receivable 3,026,092 2,936,917 — — 2,936,917 Accrued interest receivable 26,819 26,819 — 26,819 — Financial liabilities Deposits $ 3,360,363 $ 3,359,867 $ — $ 3,359,867 $ — Subordinated debt 44,144 43,908 — 43,908 — Junior subordinated debentures 3,590 3,491 — 3,491 — Accrued interest payable 892 892 — 892 — December 31, 2022 Fair Value Measurements Using Carrying
ValueEstimated
Fair ValueLevel 1 Level 2 Level 3 (dollars in thousands) Financial assets Cash and due from banks $ 32,722 $ 32,722 $ 32,722 $ — $ — Interest earning deposits with other banks 309,417 309,417 309,417 — — Investment securities 98,353 98,233 97,015 1,218 — Other investments 10,555 10,555 — 7,933 2,622 Loans receivable, net 2,627,256 2,580,183 — — 2,580,183 Accrued interest receivable 17,815 17,815 — 17,815 — Financial liabilities Deposits $ 2,817,521 $ 2,816,602 $ — $ 2,816,602 $ — FHLB advances — — — — — Subordinated debt 43,999 42,743 — 42,743 — Junior subordinated debentures 3,588 3,484 — 3,484 — Accrued interest payable 684 684 — 684 — Level 1 Level 1 Level 2 Level 3 Total
Fair Value(dollars in thousands) (dollars in thousands) December 31, 2023 Available-for-sale Available-for-sale Available-for-sale U.S. Treasury securities U.S. Treasury securities U.S. Treasury securities U.S. Agency collateralized mortgage obligations $ $ $ December 31, 2022 Available-for-sale Available-for-sale U.S. Treasury securities U.S. Treasury securities $ 20182023 and December 31, 2017.2022. The factors used in the fair values estimates are subject to change subsequent to the dates the fair value estimates are completed, therefore, current estimates of fair value may differ significantly from the amounts presented herein.Level 1 Level 2 Level 3 Total
Fair Value(dollars in thousands) December 31, 2023 Collateral dependent loans $ — $ — $ 7,315 $ 7,315 Equity securities 2,622 2,622 Total $ — $ — $ 9,937 $ 9,937 December 31, 2022 Impaired loans $ — $ — $ 7,080 $ 7,080 Equity securities 2,572 2,572 Total $ — $ — $ 9,652 $ 9,652 For the Year Ended
December 31,(dollars in thousands) 2023 2022 2021 Carrying value, beginning of period $ 2,572 $ 2,322 $ 850 Purchases 50 350 — Observable price change — (100) 1,472 Carrying value, end of period $ 2,622 $ 2,572 $ 2,322 datesdate indicated:(unaudited) Valuation Technique Unobservable Inputs December 31, 2023 Weighted Average Rate Collateral dependent loans Collateral valuations Discount to appraised value 8.0% (unaudited) Valuation Technique Unobservable Inputs December 31, 2022 Weighted Average Rate Impaired loans Collateral valuations Discount to appraised value 8.0% The amounts disclosed above represent the fair values at the time the nonrecurring fair value measurements were made, and not necessarily the fair value as of the dates reported on.Impaired loans - A loan is considered impaired when it is probable that payment of interest and principal will not be made in accordance with the contractual terms of the loan agreement. Impairment is measured based on the fair value of the underlying collateral or the discounted cash expected future cash flows. The need for valuation adjustments arises when observable market prices or current appraised values of collateral indicate a shortfall in collateral value compared to current carrying values of the related loan. If the Company determines that the value of the impaired loan is less than the carrying value of the loan, the Company either establishes an impairment reserve as a specific component of the allowance for loan losses or charges off the impairment amount. These valuation adjustments are considered nonrecurring fair value adjustments.1819 – Revenue from Contracts with Customers2023 2022 2021 (dollars in thousands) Deposit service charges and fees Interchange income $ 2,176 $ 2,055 $ 1,959 Merchant service fees 498 508 568 Overdraft fees 213 310 316 Other 967 931 855 Loan referral fees 683 810 2,126 16,293 12,934 6,716 323 603 1,313 Total noninterest income subject to Topic 606 21,153 18,151 13,853 184,929 105,945 10,591 Gain (loss) on equity investment 279 (153) 1,469 Gain on sale of branch — — 1,263 Gain on sale of loans, net 253 — 396 Loan servicing fees 171 223 248 Earnings on life insurance 185 361 172 Lease and sublease income 205 157 126 Total noninterest income not subject to Topic 606 186,022 106,533 14,265 Total noninterest income $ 207,175 $ 124,684 $ 28,118 third partythird-party payment network provider. The Company is obligated to provide sales, customer support, marketing, deployment and installation of equipment, and savings analysis to merchant service customers. An exclusivity agreement is in place between the Company and the third partythird-party payment network provider. Fees are recognized on a monthly basis, as earned. Merchant service fees are included in Services Charges on Deposit Accounts in the consolidated statements of income.Wholesale Banking Servicegoverned by contract arrangements,and is reimbursed for certain expenses, as specified in the program agreement, for providing banking services to customersbroker-dealers anddigital financial service providers. Earned program fees and reimbursement of a third party company. Feesexpenses are recorded gross and recognized on a monthly basis, as earned.Loan Referral Fees: Loan referral Credit enhancements for fraud and credit losses are not within the scope of Topic 606.governed by contract arrangements executed with third party banks. The Company earns loan referral fees when our loan client enters into interest rate swap agreements with third party bankswithin and not within the rate on the swap is in excessscope of prevailing market rates. The spread or a portion of the spread, between the interest rate swap agreement and the prevailing market rate can be monetized and recognized as loan referral fee income.Mortgage Broker Fees: Mortgage broker fees are governed by contract arrangements executed with a third party mortgage company. The Company earns broker fees by partially underwriting mortgage loans and referring qualified loans to the third party mortgage company. Revenue is recognized at the date the mortgage company funds the mortgage loan. The contract arrangement includes a fee reimbursement requirement for funded mortgage loans that pay off within three months of origination.Year Ended
December 31,2023 compared to 2022 2022 compared to 2021 (dollars in thousands) 2023 2022 2021 Increase
(Decrease)Increase
(Decrease)Program income - within the scope of Topic 606 Servicing and other BaaS fees $ 3,855 $ 4,408 $ 4,467 $ (553) $ (59) Transaction 4,011 3,211 544 800 2,667 Interchange 4,252 2,583 701 1,669 1,882 Reimbursement of expenses 4,175 2,732 1,004 1,443 1,728 Total BaaS program income 16,293 12,934 6,716 3,359 6,218 Guarantees - not within the scope of Topic 606: BaaS credit enhancement 177,764 76,374 9,086 101,390 67,288 BaaS fraud enhancement 7,165 29,571 1,505 (22,406) 28,066 Total BaaS enhancements / guarantees 184,929 105,945 10,591 78,984 95,354 Total BaaS fees $ 201,222 $ 118,879 $ 17,307 $ 82,343 $ 101,572 1920 - Earnings Per Common ShareYear Ended Year Ended (dollars in thousands, except per share data) (dollars in thousands, except per share data) December 31, 2023 December 31, 2022 December 31, 2021 Basic weighted average number common shares outstanding 13,261,664 12,949,266 12,022,954 Dilutive effect of equity-based awards Dilutive effect of equity-based awards 378,518 565,686 498,472 Diluted weighted average number common shares outstanding 13,640,182 13,514,952 12,521,426 Antidilutive stock options and restricted stock outstanding Antidilutive stock options and restricted stock outstanding 130,837 147,423 176,097 For2018 and 2017 options to purchase an additional 9,000 and 648,936 shares2021.December 31, 2023 December 31, 2022 Community Bank CCBX Treasury & Administration Consolidated Community Bank CCBX Treasury & Administration Consolidated Assets (dollars in thousands) Cash and Due from Banks $ 4,702 $ 9,601 $ 468,825 $ 483,128 $ 4,603 $ 12,899 $ 324,637 $ 342,139 Intrabank assets — 653,178 (653,178) — — 254,096 (254,096) — Securities — — 150,364 150,364 — — 98,353 98,353 Total loans receivable 1,830,154 1,195,938 — 3,026,092 1,614,752 1,012,504 — 2,627,256 Allowance for credit losses (21,595) (95,363) — (116,958) (20,636) (53,393) — (74,029) All other assets 30,169 136,931 43,640 210,740 25,508 76,111 49,129 150,748 Total assets $ 1,843,430 $ 1,900,285 $ 9,651 $ 3,753,366 $ 1,624,227 $ 1,302,217 $ 218,023 $ 3,144,467 Liabilities Total deposits $ 1,497,601 $ 1,862,762 $ — $ 3,360,363 1,538,218 1,279,303 — 2,817,521 Total borrowings — — 47,734 47,734 — — 47,587 47,587 Intrabank liabilities 338,614 — (338,614) — 80,392 — (80,392) — All other liabilities 7,215 37,523 5,553 50,291 5,617 22,914 7,334 35,865 Total liabilities $ 1,843,430 $ 1,900,285 $ (285,327) $ 3,458,388 $ 1,624,227 $ 1,302,217 $ (25,471) $ 2,900,973 Year Ended December 31, 2023 Year Ended December 31, 2022 Community Bank CCBX Treasury & Administration Consolidated Community Bank CCBX Treasury & Administration Consolidated (dollars in thousands) INTEREST INCOME AND EXPENSE Interest income $ 106,983 $ 204,458 $ 18,930 $ 330,371 $ 80,544 $ 102,808 $ 8,818 $ 192,170 Interest income (expense)
intrabank transfer(10,404) 19,071 (8,667) — 796 4,106 (4,902) — Interest expense 17,354 71,646 2,644 91,644 2,896 16,108 1,391 20,395 Net interest income 79,225 151,883 7,619 238,727 78,444 90,806 2,525 171,775 Provision for credit
losses - loans1,322 182,721 — 184,043 719 78,345 — 79,064 (Recapture)/Provision for
unfunded commitments(211) 160 — (51) — — — — Net interest income after
provision for credit
losses - loans and
unfunded commitments78,114 (30,998) 7,619 54,735 77,725 12,461 2,525 92,711 NONINTEREST INCOME Deposit service charges and fees 3,810 44 — 3,854 3,757 47 — 3,804 Other income 1,165 433 501 2,099 1,411 356 234 2,001 BaaS program income — 16,293 — 16,293 — 12,934 — 12,934 BaaS indemnification income — 184,929 — 184,929 — 105,945 — 105,945 4,975 201,699 501 207,175 5,168 119,282 234 124,684 NONINTEREST EXPENSE Salaries and employee benefits 24,104 25,159 17,198 66,461 20,476 18,007 13,745 52,228 Occupancy 3,815 339 772 4,926 3,956 317 275 4,548 Data processing and software licenses 4,521 2,303 1,771 8,595 3,172 1,746 1,569 6,487 Legal and professional expenses 1,580 9,645 3,578 14,803 213 3,163 3,384 6,760 Other expense 3,954 6,812 5,161 15,927 5,202 3,026 5,658 13,886 BaaS loan expense — 86,900 — 86,900 — 53,294 — 53,294 BaaS fraud expense — 7,165 — 7,165 — 29,571 — 29,571 Total noninterest expense 37,974 138,323 28,480 204,777 33,019 109,124 24,631 166,774 Net income before income taxes 45,115 32,378 (20,360) 57,133 49,874 22,619 (21,872) 50,621 Income taxes 9,913 7,116 (4,475) 12,554 10,068 4,248 (4,320) 9,996 Net Income $ 35,202 $ 25,262 $ (15,885) $ 44,579 39,806 18,371 (17,552) 40,625 Year Ended December 31, 2021 Community Bank CCBX Treasury & Administration Consolidated (dollars in thousands) INTEREST INCOME AND EXPENSE Interest income $ 76,551 $ 6,532 N/A $ 83,083 Interest income (expense)
intrabank transferN/A N/A N/A — Interest expense 3,547 99 N/A 3,646 Net interest income 73,004 6,433 N/A 79,437 Provision for credit
losses - loans1,275 8,640 N/A 9,915 (Recapture)/Provision for
unfunded commitments— — N/A — Net interest income after
provision for credit
losses - loans and
unfunded commitments71,729 (2,207) N/A 69,522 NONINTEREST INCOME Deposit service charges and fees 3,698 — N/A 3,698 Other income 7,015 98 N/A 7,113 BaaS program income — 6,716 N/A 6,716 BaaS indemnification income — 10,591 N/A 10,591 10,713 17,405 N/A 28,118 NONINTEREST EXPENSE Salaries and employee benefits 32,562 4,539 N/A 37,101 Occupancy 4,039 89 N/A 4,128 Data processing and software licenses 4,509 442 N/A 4,951 Legal and professional expenses 2,654 479 N/A 3,133 Other expense 7,783 1,686 N/A 9,469 BaaS loan expense — 2,976 N/A 2,976 BaaS fraud expense — 1,505 N/A 1,505 Total noninterest expense 51,547 11,716 N/A 63,263 Net income before income taxes 30,895 3,482 N/A 34,377 Income taxes 6,638 734 N/A 7,372 Net Income 24,257 2,748 N/A 27,005 2022 – Parent Company Only Condensed Financial InformationDecember 31,
2023December 31,
2022ASSETS Cash $ 5,479 $ 22,904 Investment in trust equities 109 109 Investment in subsidiaries 333,690 265,741 Other investments 3,430 3,028 Other assets 532 (150) TOTAL ASSETS $ 343,240 $ 291,632 LIABILITIES AND SHAREHOLDERS' EQUITY Junior subordinated debentures, net of issuances costs $ 3,590 $ 3,588 Subordinated debt, net of debt issuance costs 44,144 43,999 Interest and dividends payable 528 546 Other liabilities — 5 Shareholders' equity 294,978 243,494 TOTAL LIABILITIES AND SHAREHOLDERS' EQUITY $ 343,240 $ 291,632 Year ended December 31, 2023 2022 2021 INTEREST INCOME Interest earned loans receivable $ — $ (14) $ 14 Interest bearing other investments 8 4 3 Total interest income 8 (10) 17 INTEREST EXPENSE Interest on borrowed funds 2,644 1,322 795 Total interest expense 2,644 1,322 795 Net interest expense (2,636) (1,332) (778) PROVISION FOR CREDIT LOSSES — 350 — Net interest expense after provision for credit losses (2,636) (1,682) (778) NONINTEREST INCOME Unrealized gain (loss) on equity investment 279 (153) 1,469 Other income 30 23 — Total noninterest income 309 (130) 1,469 NONINTEREST EXPENSE Other expenses 914 711 576 Total noninterest expense 914 711 576 Loss before income taxes and undistributed net income of subsidiary (3,241) (2,523) 115 Equity in undistributed income of consolidated subsidiaries 47,148 42,674 26,917 Income tax (benefit) expense (672) (474) 27 NET INCOME $ 44,579 $ 40,625 $ 27,005 Year ended December 31, 2023 2022 2021 CASH FLOWS FROM OPERATING ACTIVITIES: Net income $ 44,579 $ 40,625 $ 27,005 Adjustments to reconcile net income to net cash used by operating activities: Equity in undistributed income of consolidated subsidiaries (47,148) (42,674) (26,917) Stock-based compensation 432 295 162 Unrealized loss (gain) on equity investment (279) 153 (1,469) Decrease (increase) in other assets (683) 274 5 Increase in other liabilities 124 106 452 Net cash used by operating activities (2,975) (1,221) (762) CASH FLOWS FROM INVESTING ACTIVITIES: Investments in subsidiaries (14,945) (20,925) (26,500) Investments in loans receivable — 350 (350) Investments in other, net (123) (699) (163) Net cash used by investing activities (15,068) (21,274) (27,013) CASH FLOWS FROM FINANCING ACTIVITIES: Proceeds from exercise of stock options 618 1,468 360 Proceeds from public offering, net — - 32,387 Proceeds from subordinated debt — 19,625 24,263 Repayment of subordinated debt — - (10,000) Net cash provided by financing activities 618 21,093 47,010 NET CHANGE IN CASH (17,425) (1,402) 19,235 Cash, beginning of year 22,904 24,306 5,071 Cash, end of year $ 5,479 $ 22,904 $ 24,306 (dollars in thousands, except per share amounts; unaudited)
Number of
securities to be
issued upon
exercise of
outstanding
options
Weighted-
average
exercise price
of outstanding
optionsEquity compensation plan approved by stockholders 354,969 $ 9.11 433,644 Equity compensation plan not approved by shareholders - - - Total 354,969 $ 9.11 433,644 No. Description Location 3.1 Incorporated herein by reference to
Exhibit 3.1 to the Company’s Registration Statement on Form S-1 (File No. 333-225715), filed with the Commission on June 19, 20183.2 Incorporated herein by reference to
Exhibit 3.2 to the Company’s Registration Statement on Form S-1 (File No. 333-225715), filed with the Commission on June 19, 20183.3 Incorporated herein by reference to
Exhibit 3.3 to the Company’s Registration Statement on Form S-1 (File No. 333-225715), filed with the Commission on June 19, 20184.1* Incorporated herein by reference to
Exhibit 4.1 to the Company’s Registration Statement on Form S-1 (File No. 333-225715), filed with the Commission on June 19, 20184.2 4.3 Incorporated herein by reference to Exhibit 4.1 of the Company’s Form 8-K (File No. 001-38589), filed with the Securities and Exchange Commission on August 18, 2021. 4.4 Incorporated herein by reference to Exhibit 4.1 of the Company’s Form 8-K (File No. 001-38589), filed with the Securities and Exchange Commission on November 1, 2022. 10.1+ Incorporated herein by reference to
Exhibit 10.1 to the Company’s Registration Statement on Form S-1 (File No. 333-225715), filed with the Commission on June 19, 201810.2+ Incorporated herein by reference to
Exhibit 10.1 to the Company’s Quarterly Report on Form 10-Q (File No. 001-38589), filed with the Commission on August 7, 2020.10.3+ Incorporated herein by reference to
Exhibit 10.2 to the Company’s Registration Statement on Form S-1 (File No. 333-225715), filed with the Commission on June 19, 201810.4+ Incorporated herein by reference to
Exhibit 10.3 to the Company’s Registration Statement on Form S-1 (File No. 333-225715), filed with the Commission on June 19, 201810.5+ Incorporated herein by reference to
Exhibit 10.4 to the Company’s Registration Statement on Form S-1 (File No. 333-225715), filed with the Commission on June 19, 201810.6+ Incorporated herein by reference to Exhibit 10.1 of the Company’s Form 8-K (File No. 001-38589), filed with the Securities and Exchange Commission on October 7, 2021. 10.7+ Incorporated herein by reference to
Exhibit 10.6 to the Company’s Registration Statement on Form S-1 (File No. 333-225715), filed with the Commission on June 19, 201810.8 Incorporated herein by reference to
Exhibit 10.9 to the Company’s Registration Statement on Form S-1 (File No. 333-225715), filed with the Commission on June 19, 201810.9 Incorporated herein by reference to
Exhibit 10.10 to the Company’s Registration Statement on Form S-1 (File No. 333-225715), filed with the Commission on June 19, 201810.10 Incorporated herein by reference to
Exhibit 10.11 to the Company’s Registration Statement on Form S-1 (File No. 333-225715), filed with the Commission on June 19, 201810.11 Incorporated herein by reference to
Exhibit 10.12 to the Company’s Registration Statement on Form S-1 (File No. 333-225715), filed with the Commission on June 19, 201810.12 Incorporated herein by reference to Exhibit 10.12 to the Company’s Annual Report on Form 10-K (File No. 001-38589), filed with the Commission on March 16, 2023 10.13 Incorporated herein by reference to
Exhibit 10.13 to the Company’s Registration Statement on Form S-1 (File No. 333-225715), filed with the Commission on June 19, 201810.14 Incorporated herein by reference to
Exhibit 10.20 to the Company’s Registration Statement on Form S-1 (File No. 333-225715), filed with the Commission on June 19, 201810.15# Incorporated herein by reference to Exhibit 10.1 to Amendment No. 1 to the Company’s Current Report on Form 8-K/A (File No. 001-38589) filed on March 21, 2019. 10.16+ Incorporated herein by reference to
Exhibit 10.1 to the Company’s Quarterly Report on Form 10-Q (File No. 001-38589), filed with the Commission on May 8, 2020.10.17+ Incorporated herein by reference to
Exhibit 10.2 to the Company’s Quarterly Report on Form 10-Q (File No. 001-38589), filed with the Commission on November 6, 2020.10.18 Incorporated herein by reference to
Exhibit 10.1 of the Company’s Form 8-K (File No. 001-38589), filed with the Securities and Exchange Commission on August 18, 2021.10.19 Incorporated herein by reference to
Exhibit 10.1 of the Company’s Form 8-K (File No. 001-38589), filed with the Securities and Exchange Commission on November 1, 2022.21.1 Incorporated herein by reference to
Exhibit 21.1 of the Company’s Form 10-K (File No. 001-38589), filed with the Securities and Exchange Commission on March 14, 2022.23.1 Filed herewith 31.1 Filed herewith 31.2 Filed herewith 32.1 Filed herewith 32.2 Filed herewith 97.1 Filed herewith 101 The following materials from the Company’s Annual Report on Form 10-K for the year ended December 31, 2020, formatted in inline XBRL (Extensible Business Reporting Language): (i) the Consolidated Balance Sheet, (ii) the Consolidated Statements of Income, (iii) the Consolidated Statements of Comprehensive Income, (iv) the Consolidated Statement of Changes in Shareholders’ Equity, (v) the Consolidated Statements of Cash Flows and (vi) the Notes to the Consolidated Financial Statements Filed herewith 104 Cover Page Interactive Data (formatted as Inline XBRL and contained in Exhibit 101 filed herewith)
# Portions of this exhibit have been omitted pursuant to a request for confidential treatment and the non-public information has been filed separately with the SEC.F-41COASTAL FINANCIAL CORPORATION Dated: March 14, 2024 /s/ Eric M. Sprink Eric M. Sprink Chief Executive Officer Name Title Date /s/ Eric M. Sprink Chief Executive Officer and Director
(Principal Executive Officer)March 14, 2024 Eric M. Sprink /s/ Joel G. Edwards Executive Vice President and Chief Financial Officer
(Principal Financial and Accounting Officer)March 14, 2024 Joel G. Edwards /s/ Christopher D. Adams Chair of the Board March 14, 2024 Christopher D. Adams /s/ Steven D. Hovde Vice Chair of the Board March 14, 2024 Steven D. Hovde /s/ Pamela R. Unger Director March 14, 2024 Pamela R. Unger /s/ Rilla R. Delorier Director March 14, 2024 Rilla R. Delorier /s/ Stephan Klee Director March 14, 2024 Stephan Klee /s/ Thomas D. Lane Director March 14, 2024 Thomas D. Lane /s/ Sadhana Akella-Mishra Director March 14, 2024 Sadhana Akella-Mishra /s/ Michael R. Patterson Director March 14, 2024 Michael R. Patterson /s/ Gregory A. Tisdel Director March 14, 2024 Gregory A. Tisdel /s/ Brian T. Hamilton Director March 14, 2024 Brian T. Hamilton