| Director | Audit Committee | Compensation Committee | NG&S Committee | |||
| Neal P. Goldman | * | Chair | * | |||
| John H. Hollowell | * | Chair | ||||
| Ane Launy | * | * | ||||
| Patrick Carey Lowe | * | |||||
| Adam C. Peakes | Chair |
Item 1A. Risk Factors.
Our business is subject to a variety of risks and uncertainties. If any of these risks or uncertainties actually occur, our business, reputation, financial condition, results of operations, cash flows, including negative cash flows, prospects and the trading price of our securities, may be materially and adversely affected. You should carefully consider these risks when evaluating us and our securities.
The current protracted downturn in our industry may continue for several more years, and we cannot predict if or when it will end.
Over the past several years, crude oil prices have been volatile, reaching a high of $115 per barrel in 2014, declining to $55 per barrel by the end of 2014 and reaching a low of $28 per barrel during 2016. Oil prices recovered to nearly $57 per barrel by the end of 2016 and have continued to fluctuate. As of the date of this report, Brent crude oil prices were in the mid-$50-per-barrel range, having started 2020 in the mid-to-upper $60-per-barrel range. As a result of, among other things, this continued volatility in commodity price and its uncertain future, the offshore drilling industry has experienced, and is continuing to experience, a substantial decline in demand for its services, as well as a significant decline in dayrates for contract drilling services. The decline in demand for our contract drilling services and the dayrates for those services has had, and if the industry downturn continues, will continue to have, a material adverse effect on our financial condition, results of operations and cash flows, including negative cash flows. The protracted downturn in our industry will exacerbate many of the other risks included below and other risks that we face, and we cannot predict if or when the downturn will end.
The worldwide demand for drilling services has historically been dependent on the price of oil and, as a result of low oil prices, demand has continued to be depressed in 2019, and there continues a protracted downturn in our industry.
Demand for our drilling services depends in large part upon the oil and natural gas industry’s offshore exploration and production activity and expenditure levels, which are directly affected by oil and gas prices and market expectations of potential changes in oil and gas prices. Beginning in the second half of 2014, oil prices declined significantly, resulting in a sharp decline in the demand for offshore drilling services, including services that we provide, and materially adversely affecting our results of operations and cash flows compared to years before the decline. The continuation of low oil prices would make more severe the downturn in our industry and would continue to materially adversely affect many of our customers and, therefore, demand for our services and our financial condition, results of operations and cash flows, including negative cash flows.
Oil prices have been, and are expected to continue to be, volatile and are affected by numerous factors beyond our control, including:
|
|
|
|
8
|
|
|
|
|
|
|
|
|
|
|
|
|
|
|
|
|
|
|
|
|
|
|
|
|
|
|
|
|
|
|
|
|
|
Although, historically, higher sustained commodity prices have generally resulted in increases in offshore drilling projects, short-term or temporary increases in the price of oil and gas will not necessarily result in an increase in offshore drilling activity or an increase in the market demand for our rigs. The timing of commitment to offshore activity in a cycle depends on project deployment times, reserve replacement needs, availability of capital and alternative options for resource development, among other things. Timing can also be affected by availability, access to, and cost of equipment to perform work.
Our business depends on the level of activity in the offshore oil and gas industry, which has been cyclical, is currently in a protracted downturn and is significantly affected by many factors outside of our control.
Demand for our drilling services depends upon the level of offshore oil and gas exploration, development and production in markets worldwide, and those activities depend in large part on oil and gas prices, worldwide demand for oil and gas and a variety of political and economic factors. The level of offshore drilling activity is adversely affected when operators reduce or defer new investment in offshore projects, reduce or suspend their drilling budgets or reallocate their drilling budgets away from offshore drilling in favor of other priorities, such as shale or other land-based projects, which have reduced, and may in the future further reduce demand for our rigs. As a result, our business and the oil and gas industry in general are subject to cyclical fluctuations.
As a result of the cyclical fluctuations in the market, there have been periods of lower demand, excess rig supply and lower dayrates, followed by periods of higher demand, shorter rig supply and higher dayrates. We cannot predict the timing or duration of such fluctuations. Periods of lower demand or excess rig supply, such as the current protracted downturn in our industry that is continuing and may continue for several more years, intensify the competition in the industry and often result in periods of lower utilization and lower dayrates. During these periods,
9
our rigs may not be able to obtain contracts for future work and may be idle for long periods of time or may be able to obtain work only under contracts with lower dayrates or less favorable terms. Additionally, prolonged periods of low utilization and dayrates (such as we are currently experiencing) have in the past resulted in, and may in the future result in, the recognition of further impairment charges on certain of our drilling rigs if future cash flow estimates, based upon information available to management at the time, indicate that the carrying value of these rigs may not be recoverable. See “–We may incur additional asset impairments and/or rig retirements as a result of reduced demand for certain offshore drilling rigs.”
Our industry is highly competitive, with an oversupply of drilling rigs and intense price competition.
The offshore contract drilling industry is highly competitive with numerous industry participants, and such competitiveness may be exacerbated by the current protracted downturn in our industry. Some of our competitors are larger companies, have larger or more technologically advanced fleets and have greater financial or other resources than we do. The drilling industry has experienced consolidation and may experience additional consolidation, which could create additional large competitors. Drilling contracts are traditionally awarded on a competitive bid basis. Price is typically the primary factor in determining which qualified contractor is awarded a job; however, rig availability and location, a drilling contractor’s safety record and the quality and technical capability of service and equipment are also considered.
As of the date of this report, there are approximately 240 floater rigs currently available to meet customer drilling needs in the offshore contract drilling market, and many of these rigs are not currently contracted and/or are cold stacked. Although there have been over 135 floater rigs scrapped over the past six years, the market remains oversupplied as new rig construction, upgrades of existing drilling rigs, cancelation or termination of drilling contracts and established rigs coming off contract have contributed to the current oversupply, intensifying price competition. In addition, some shipyards own rigs recently constructed or under construction, which are not currently marketed, which, if acquired by us or our competitors, would further exacerbate the oversupply of rigs.
In addition, during industry downturns like the one we are currently experiencing, rig operators may take lower dayrates and shorter contract durations to keep their rigs operational. See “Management’s Discussion and Analysis of Financial Condition and Results of Operations – Market Overview” in Item 7 of this report.
We can provide no assurance that our drilling contracts will not be terminated early or that our current backlog of contract drilling revenue will be ultimately realized.
Our customers may terminate our drilling contracts under certain circumstances, such as the destruction or loss of a drilling rig, our suspension of drilling operations for a specified period of time as a result of a breakdown of major equipment, excessive downtime for repairs, failure to meet minimum performance criteria (including customer acceptance testing) or, in some cases, due to other events beyond the control of either party.
In addition, some of our drilling contracts permit the customer to terminate the contract after specified notice periods, often by tendering contractually specified termination amounts, which may not fully compensate us for the loss of the contract. In some cases, our drilling contracts may permit the customer to terminate the contract without cause, upon little or no notice or without making an early termination payment to us. During depressed market conditions, such as those currently in effect, certain customers have utilized, and may in the future utilize, such contract clauses to seek to renegotiate or terminate a drilling contract or claim that we have breached provisions of our drilling contracts in order to avoid their obligations to us under circumstances where we believe we are in compliance with the contracts. Additionally, because of depressed commodity prices, restricted credit markets, economic downturns, changes in priorities or strategy or other factors beyond our control, a customer may no longer want or need a rig that is currently under contract or may be able to obtain a comparable rig at a lower dayrate. For these reasons, customers have sought and may in the future seek to renegotiate the terms of our existing drilling contracts, terminate our contracts without justification or repudiate or otherwise fail to perform their obligations under our contracts. As a result of such contract renegotiations or terminations, our contract backlog has been and may in the future be adversely impacted. We might not recover any compensation (or any recovery we obtain may not fully compensate us for the loss of the contract) and we may be required to idle one or more rigs for an extended period of time. Each of these results has had, and may in the future have a material adverse effect on our financial condition, results of operations and cash flows. See “– Our industry is highly competitive, with an oversupply of
10
drilling rigs and intense price competition” and “Management’s Discussion and Analysis of Financial Condition and Results of Operations – Contract Drilling Backlog” in Item 7 of this this report.
We may not be able to renew or replace expiring contracts for our rigs.
As of the date of this report, all of our current customer contracts will expire between 2020 and 2023. Two of our contracts expire in 2020, six contracts expire in 2021, and two contracts expire in each of 2022 and 2023. Some of our drilling rigs are not currently contracted for continuous utilization between contracts and are being actively marketed for these uncontracted periods. Our ability to renew or replace expiring contracts or obtain new contracts, and the terms of any such contracts, will depend on various factors, including market conditions and the specific needs of our customers, at such times. Given the historically cyclical and highly competitive nature of our industry and the likelihood that the current protracted downturn in our industry continues, we may not be able to renew or replace the contracts or we may be required to renew or replace expiring contracts or obtain new contracts at dayrates that are below existing dayrates, or that have terms that are less favorable to us, including shorter durations, than our existing contracts. Moreover, we may be unable to secure contracts for these rigs. Failure to secure contracts for a rig may result in a decision to cold stack the rig, which puts the rig at risk for impairment and may competitively disadvantage the rig as many customers, during the current protracted market downturn, have expressed a preference for ready or “warm” stacked rigs over cold-stacked rigs. If a decision is made to cold stack a rig, our operating costs for the rig are typically reduced; however, we will incur additional costs associated with cold stacking the rig (particularly if we cold stack a newer rig, such as a drillship or other DP semisubmersible rig, for which cold-stacking costs are typically substantially higher than for an older non-DP rig). In addition, the costs to reactivate a cold-stacked rig may be substantial. See “– We must make substantial capital and operating expenditures to reactivate, build, maintain and upgrade our drilling fleet.”
We may incur additional asset impairments and/or rig retirements as a result of reduced demand for certain offshore drilling rigs.
The current oversupply of drilling rigs in the offshore drilling market has resulted in numerous rigs being idled and, in some cases, retired and/or scrapped. We evaluate our property and equipment for impairment whenever changes in circumstances indicate that the carrying amount of an asset may not be recoverable, and we have incurred impairment charges in the past, and may incur additional impairment charges in the future related to the carrying value of our drilling rigs. Impairment write-offs could result if, for example, any of our rigs become obsolete or commercially less desirable due to changes in technology, market demand or market expectations or their carrying values become excessive due to the condition of the rig, cold stacking the rig, the expectation of cold stacking the rig in the near future, contracted backlog of less than one year for a rig, a decision to retire or scrap the rig, or spending in excess of budget on a newbuild, construction project or major rig upgrade. We utilize an undiscounted probability-weighted cash flow analysis in testing an asset for potential impairment, reflecting management’s assumptions and estimates regarding the appropriate risk-adjusted dayrate by rig, future industry conditions and operations and other factors. Asset impairment evaluations are, by their nature, highly subjective. The use of different estimates and assumptions could result in materially different carrying values of our assets, which could impact the need to record an impairment charge and the amount of any charge taken. Since 2012, we have retired and sold 30 drilling rigs (inclusive of the sale of the Ocean Confidence, which is expected to be completed in the first quarter of 2020) and recorded impairment losses aggregating $1.7 billion. Historically, the longer a drilling rig remains cold stacked, the higher the cost of reactivation and, depending on the age, technological obsolescence and condition of the rig, the lower the likelihood that the rig will be reactivated at a future date. The current oversupply of rigs in our industry, together with the current protracted downturn, heightens the risk of the need for future rig impairments. See “Management’s Discussion and Analysis of Financial Condition and Results of Operations – Critical Accounting Estimates– Property, Plant and Equipment” in Item 7 of this report and Note 3 “Asset Impairments” to our Consolidated Financial Statements in Item 8 of this report.
We can provide no assurance that our assumptions and estimates used in our asset impairment evaluations will ultimately be realized or that the current carrying value of our property and equipment will ultimately be realized.
The incurrence of additional asset impairment charges would lower the aggregate carrying value of our rigs and could cause us to breach certain debt covenants under our credit facilities, such as the requirement to maintain a
11
specified ratio of (A) the aggregate value of certain of our rigs to (B) the aggregate value of substantially all rigs owned by us and the requirement to maintain a specified ratio of (A) the aggregate value of certain of our marketed rigs to (B) the sum of the commitments under our $950 million revolving credit facility, plus certain outstanding loans, letter of credit exposures and other indebtedness. See “– Our significant debt levels may limit our liquidity and flexibility in obtaining additional financing and in pursuing other business opportunities.”
Our significant debt levels may limit our liquidity and flexibility in obtaining additional financing and in pursuing other business opportunities.
Our business is highly capital intensive and dependent on having sufficient cash flow and/or available sources of financing in order to fund our capital expenditure requirements. During 2019, our cash and cash equivalents and marketable securities decreased an aggregate $300.8 million and during 2018 increased an aggregate $74.0 million. Based on our cash flow forecast, as of the date of this report, we expect to generate aggregate negative cash flows for 2020. If market conditions do not improve, we could continue to generate aggregate negative cash flows in future periods.
As of December 31, 2019, we had outstanding approximately $2.0 billion of senior notes, maturing at various times from 2023 through 2043. As of February 7, 2020, we had no borrowings outstanding under our $225 million revolving credit facility maturing in October 2020, which we may have difficulty replacing upon maturity, or our $950 million revolving credit facility maturing in October 2023 and had utilized $6.0 million for the issuance of a letter of credit under the latter in support of an existing bond. We expect to begin to utilize borrowing under our two credit facilities in the first half of 2020 to meet our liquidity requirements and anticipate ending 2020 with a drawn balance on our $950 million revolving credit facility. At February 7, 2020, we had approximately $1.2 billion available under such credit facilities in the aggregate, subject to their respective terms, to meet our short-term liquidity requirements. See “Management’s Discussion and Analysis of Financial Condition and Results of Operations – Liquidity and Capital Resources – Sources and Uses of Cash – Credit Agreements” in Item 7 of this report and Note 9 “Credit Agreements and Senior Notes” to our Consolidated Financial Statements in Item 8 of this report.
Our ability to meet our debt service obligations is dependent upon our future performance, which is unpredictable and dependent on our ability to manage through the current protracted industry downturn. Our levels of indebtedness could have negative consequences to us, including:
|
|
|
|
|
|
|
|
|
|
|
|
|
|
|
|
12
In addition, our failure to comply with the restrictive covenants in our debt instruments could result in an event of default that, if not cured or waived, could have a material adverse effect on our business. Among other things, these covenants:
|
|
|
|
|
|
|
|
|
|
In September 2019, S&P Global Ratings, or S&P, downgraded our corporate and senior unsecured notes credit ratings to CCC+ from B. The rating outlook from S&P changed to stable from negative. Our current corporate credit rating from Moody’s Investor Services, or Moody’s, is B2 and our current senior unsecured notes credit rating from Moody’s is B3. The rating outlook from Moody’s is negative. These credit ratings are below investment grade and could raise our cost of financing. Consequently, we may not be able to issue additional debt in amounts and/or with terms that we consider to be reasonable. These ratings could limit our ability to pursue other business opportunities or to refinance our indebtedness as it matures.
Our revolving credit facilities bear interest at variable rates, based on our corporate credit rating and market interest rates. If market interest rates increase, our cost to borrow under our revolving credit facilities may also increase. Although we may employ hedging strategies such that a portion of the aggregate principal amount outstanding under our credit facilities would effectively carry a fixed rate of interest, any hedging arrangement put in place may not offer complete protection from this risk.
Changes in tax laws and policies, effective income tax rates or adverse outcomes resulting from examination of our tax returns could adversely affect our financial results.
Tax laws and regulations are highly complex and subject to interpretation and disputes. We conduct our worldwide operations through various subsidiaries in a number of countries throughout the world. As a result, we are subject to highly complex tax laws, regulations and income tax treaties within and between the countries in which we operate as well as countries in which we may be resident, which may change and are subject to interpretation. In addition, in several of the international locations in which we operate, certain of our wholly-owned subsidiaries enter into agreements with each other to provide specialized services and equipment in support of our foreign operations. In such cases, we apply an intercompany transfer pricing methodology to determine the arm’s length amount to be charged for providing the services and equipment. In most cases, there are alternative transfer pricing methodologies that could be applied to these transactions and, if applied, could result in different chargeable amounts.
As a result, we determine our income tax expense based on our interpretation of the applicable tax laws and regulations in effect in each jurisdiction for the period during which we operate and earn income. Our overall effective tax rate could be adversely affected by lower than anticipated earnings in countries where we have lower statutory rates and higher than anticipated earnings in countries where we have higher statutory rates, by changes in the valuation of our deferred tax assets and liabilities or by changes in tax laws, tax treaties, regulations, accounting principles or interpretations thereof in one or more countries in which we operate. In addition, changes in laws, treaties and regulations and the interpretation of such laws, treaties and regulations may put us at risk for future tax assessments and liabilities which could be substantial.
13
Our income tax returns are subject to review and examination. We recognize the benefit of income tax positions we believe are more likely than not to be sustained on their merit should they be challenged by a tax authority. If any tax authority successfully challenges any tax position taken or any of our intercompany transfer pricing policies, or if the terms of certain income tax treaties are interpreted in a manner that is adverse to us or our operations, or if we lose a material tax dispute in any country, our effective tax rate on our worldwide earnings could increase substantially.
Our consolidated effective income tax rate may vary substantially from one reporting period to another.
Our consolidated effective income tax rate is impacted by the mix between our domestic and international pre-tax earnings or losses, as well as the mix of the international tax jurisdictions in which we operate. We cannot provide any assurance as to what our consolidated effective income tax rate will be in the future due to, among other factors, uncertainty regarding the nature and extent of our business activities in any particular jurisdiction in the future and the tax laws of such jurisdictions, as well as potential changes in U.S. and foreign tax laws, regulations or treaties or the interpretation or enforcement thereof, changes in the administrative practices and precedents of tax authorities or any reclassification or other matter (such as changes in applicable accounting rules) that increases the amounts we have provided for income taxes or deferred tax assets and liabilities in our consolidated financial statements. This variability may cause our consolidated effective income tax rate to vary substantially from one reporting period to another.
Our customer base is concentrated.
We provide offshore drilling services to a customer base that includes major and independent oil and gas companies and government-owned oil companies. During 2019, two of our customers in the GOM and our three largest customers in the aggregate accounted for 50% and 69%, respectively, of our annual total consolidated revenues. In addition, the number of customers we have performed services for has declined from 35 in 2014 to 12 in 2019. As of January 1, 2020, our contracted backlog was an aggregate $1.6 billion of which 43%, 44% and 24% for the years 2020, 2021 and 2022, respectively, was attributable to our operations in the GOM from three customers. The loss of a significant customer could have a material adverse impact on our financial condition, results of operations and cash flows, especially in a declining market (like the current protracted industry downturn) where the number of our working drilling rigs is declining along with the number of our active customers. In addition, if a significant customer experiences liquidity constraints or other financial difficulties, or elects to terminate one of our drilling contracts, it could have a material adverse effect on our utilization rates in the affected market and also displace demand for our other drilling rigs as the resulting excess supply enters the market. See “Management’s Discussion and Analysis of Financial Condition and Results of Operations – Contract Drilling Backlog” in Item 7 of this report.
We may be subject to litigation and disputes that could have a material adverse effect on us.
We are, from time to time, involved in litigation and disputes. These matters may include, among other things, contract disputes, personal injury claims, environmental claims or proceedings, asbestos and other toxic tort claims, employment and tax matters, claims of infringement of patent and other intellectual property rights, and other litigation that arises in the ordinary course of our business. We cannot predict with certainty the outcome or effect of any dispute, claim or other litigation matter, and there can be no assurance as to the ultimate outcome of any litigation. We may not have insurance for litigation or claims that may arise, or if we do have insurance coverage it may not be sufficient, insurers may not remain solvent, other claims may exhaust some or all of the insurance available to us or insurers may interpret our insurance policies such that they do not cover losses for which we make claims or may otherwise dispute claims made. Litigation may have a material adverse effect on us because of potential adverse outcomes, defense costs, the diversion of our management’s resources and other risk factors inherent in litigation or relating to the claims that may arise.
Our contract drilling expense includes fixed costs that will not decline in proportion to decreases in rig utilization and dayrates.
Our contract drilling expense includes all direct and indirect costs associated with the operation, maintenance and support of our drilling equipment, which is often not affected by changes in dayrates and utilization. During
14
periods of reduced revenue and/or activity (like the current protracted industry downturn), certain of our fixed costs will not decline and often we may incur additional operating costs, such as fuel and catering costs, for which the customer generally reimburses us when a rig is under contract. During times of reduced dayrates and utilization, like the current protracted industry downturn, reductions in costs may not be immediate as we may incur additional costs associated with cold stacking a rig (particularly if we cold stack a newer rig, such as a drillship or other DP semisubmersible rig, for which cold-stacking costs are typically substantially higher than for an older non-DP rig), or we may not be able to fully reduce the cost of our support operations in a particular geographic region due to the need to support the remaining drilling rigs in that region. Accordingly, a decline in revenue due to lower dayrates and/or utilization may not be offset by a corresponding decrease in contract drilling expense.
Contracts for our drilling rigs are generally fixed dayrate contracts, and increases in our operating costs could adversely affect our profitability on those contracts.
Our contracts for our drilling rigs generally provide for the payment of an agreed dayrate per rig operating day, although some contracts do provide for a limited escalation in dayrate due to increased operating costs we incur on the project. Over the term of a drilling contract, our operating costs may fluctuate due to events beyond our control. In addition, equipment repair and maintenance expenses vary depending on the type of activity the rig is performing, the age and condition of the equipment and general market factors impacting relevant parts, components and services. The gross margin that we realize on these fixed dayrate contracts will fluctuate based on variations in our operating costs over the terms of the contracts. In addition, for contracts with dayrate escalation clauses, we may not be able to fully recover increased or unforeseen costs from our customers.
We are subject to extensive domestic and international laws and regulations that could significantly limit our business activities and revenues and increase our costs.
Certain countries are subject to restrictions, sanctions and embargoes imposed by the U.S. government or other governmental or international authorities. These restrictions, sanctions and embargoes may prohibit or limit us from participating in certain business activities in those countries. Our operations are also subject to numerous local, state and federal laws and regulations in the U.S. and in foreign jurisdictions concerning the containment and disposal of hazardous materials, the remediation of contaminated properties and the protection of the environment. Laws and regulations protecting the environment have become increasingly stringent, and may in some cases impose “strict liability,” rendering a person liable for environmental damage without regard to negligence or fault on the part of that person. Failure to comply with such laws and regulations could subject us to civil or criminal enforcement action, for which we may not receive contractual indemnification or have insurance coverage, and could result in the issuance of injunctions restricting some or all of our activities in the affected areas. We may be required to make significant expenditures for additional capital equipment or inspections and recertifications thereof to comply with existing or new governmental laws and regulations. It is also possible that these laws and regulations may in the future add significantly to our operating costs or result in a substantial reduction in revenues associated with downtime required to install such equipment or may otherwise significantly limit drilling activity.
In addition, these laws and regulations require us to perform certain regulatory inspections, which we refer to as a special survey. For most of our rigs, these special surveys are due every five years, although the inspection interval for our North Sea rigs is two-and-one-half years. Our operating income is negatively impacted during these special surveys. These special surveys are generally performed in a shipyard and require scheduled downtime, which can negatively impact operating revenue. Operating expenses increase as a result of these special surveys due to the cost to mobilize the rigs to a shipyard, and inspection, repair and maintenance costs. Repair and maintenance activities may result from the special survey or may have been previously planned to take place during this mandatory downtime. The number of rigs undergoing a special survey will vary from year to year, as well as from quarter to quarter. Operating income may also be negatively impacted by intermediate surveys, which are performed at interim periods between special surveys. Although an intermediate survey normally does not require shipyard time, the survey may require some downtime for the rig. We can provide no assurance as to the exact timing and/or duration of downtime and/or the costs or lost revenues associated with regulatory inspections, planned rig mobilizations and other shipyard projects.
In addition, the offshore drilling industry is dependent on demand for services from the oil and gas exploration industry and, accordingly, can be affected by changes in tax and other laws relating to the energy business generally.
15
Governments in some countries are increasingly active in regulating and controlling the ownership of concessions, the exploration for oil and gas and other aspects of the oil and gas industry. The modification of existing laws or regulations or the adoption of new laws or regulations curtailing exploratory or developmental drilling for oil and gas for economic, environmental or other reasons could limit drilling opportunities.
U.S. federal, state, foreign and international laws and regulations address oil spill prevention and control and impose a variety of obligations on us related to the prevention of oil spills and liability for damages resulting from such spills. Some of these laws and regulations have significantly expanded liability exposure across all segments of the oil and gas industry. For example, the United States Oil Pollution Act of 1990 imposes strict and, with limited exceptions, joint and several liability upon each responsible party for oil removal costs and a variety of public and private damages. Failure to comply with such laws and regulations could subject us to civil or criminal enforcement action, for which we may not receive contractual indemnification or have insurance coverage, and could result in the issuance of injunctions restricting some or all of our activities in the affected areas. In addition, legislative and regulatory developments may occur that could substantially increase our exposure to liabilities that might arise in connection with our operations.
Regulation of greenhouse gases and climate change could have a negative impact on our business.
Governments around the world are increasingly considering and adopting laws and regulations to address climate change issues. Lawmakers and regulators in the U.S. and other jurisdictions where we operate have focused increasingly on restricting the emission of carbon dioxide, methane and other “greenhouse” gases. This may result in new environmental regulations that may unfavorably impact us, our suppliers and our customers. Moreover, there is increased focus, including by governmental and non-governmental organizations, investors and other stakeholders on these and other sustainability matters. In addition, efforts have been made and continue to be made in the international community toward the adoption of international treaties or protocols that would address global climate change issues and impose reductions of hydrocarbon-based fuels. We may be exposed to risks related to new laws, regulations, treaties or international agreements pertaining to climate change, greenhouse gases, carbon emissions or energy use that could decrease the use of oil or natural gas, thus reducing demand for hydrocarbon-based fuel and our drilling services. Governments may also pass laws or regulations incentivizing or mandating the use of alternative energy sources, such as wind power and solar energy, which may reduce demand for oil and natural gas and our drilling services. Such laws, regulations, treaties or international agreements could result in increased compliance costs or additional operating restrictions, or adversely affect the demand for hydrocarbons, which may have a negative impact on our business, and could materially adversely affect our operations by limiting drilling opportunities.
If we, or our customers, are unable to acquire or renew permits and approvals required for drilling operations, we may be forced to delay, suspend or cease our operations.
Oil and natural gas exploration and production operations require numerous permits and approvals for us and our customers from governmental agencies in the areas in which we operate or expect to operate. Depending on the area of operation, the burden of obtaining such permits and approvals to commence such operations may reside with us, our customers or both. Obtaining all necessary permits and approvals may necessitate substantial expenditures to comply with the requirements of these permits and approvals, future changes to these permits or approvals, or any adverse change in the interpretation of existing permits and approvals. In addition, such regulatory requirements and restrictions could also delay or curtail our operations.
Our business involves numerous operating hazards that could expose us to significant losses and significant damage claims. We are not fully insured against all of these risks and our contractual indemnity provisions may not fully protect us.
Our operations are subject to the significant hazards inherent in drilling for oil and gas offshore, such as blowouts, reservoir damage, loss of production, loss of well control, unstable or faulty sea floor conditions, fires and natural disasters such as hurricanes. The occurrence of any of these types of events could result in the suspension of drilling operations, damage to or destruction of the equipment involved and injury or death to rig personnel and damage to producing or potentially productive oil and gas formations, oil spillage, oil leaks, well blowouts and extensive uncontrolled fires, any of which could cause significant environmental damage. In addition, offshore drilling operations
16
are subject to marine hazards, including capsizing, grounding, collision and loss or damage from severe weather. Operations also may be suspended because of machinery breakdowns, abnormal drilling conditions, failure of suppliers or subcontractors to perform or supply goods or services or personnel shortages. Any of the foregoing events could result in significant damage or loss to our properties and assets or the properties and assets of others, injury or death to rig personnel or others, significant loss of revenues and significant damage claims against us.
Our drilling contracts with our customers provide for varying levels of indemnity and allocation of liabilities between our customers and us with respect to the hazards and risks inherent in, and damages or losses arising out of, our operations, and we may not be fully protected. Our contracts are individually negotiated, and the levels of indemnity and allocation of liabilities in them can vary from contract to contract depending on market conditions, particular customer requirements and other factors existing at the time a contract is negotiated. We may incur liability for significant losses or damages under such provisions.
Additionally, the enforceability of indemnification provisions in our contracts may be limited or prohibited by applicable law or such provisions may not be enforced by courts having jurisdiction, and we could be held liable for substantial losses or damages and for fines and penalties imposed by regulatory authorities. The indemnification provisions in our contracts may be subject to differing interpretations, and the laws or courts of certain jurisdictions may enforce such provisions while other laws or courts may find them to be unenforceable. The law with respect to the enforceability of indemnities varies from jurisdiction to jurisdiction and is unsettled under certain laws that are applicable to our contracts. There can be no assurance that our contracts with our customers, suppliers and subcontractors will fully protect us against all hazards and risks inherent in our operations. There can also be no assurance that those parties with contractual obligations to indemnify us will be financially able to do so or will otherwise honor their contractual obligations.
We maintain liability insurance, which generally includes coverage for environmental damage; however, because of contractual provisions and policy limits, our insurance coverage may not adequately cover our losses and claim costs. In addition, certain risks and contingencies related to pollution, reservoir damage and environmental risks are generally not fully insurable. Also, we do not typically purchase loss-of-hire insurance to cover lost revenues when a rig is unable to work. There can be no assurance that we will continue to carry the insurance we currently maintain, that our insurance will cover all types of losses or that we will be able to maintain adequate insurance in the future at rates we consider to be reasonable or that we will be able to obtain insurance against some risks.
We are self-insured for physical damage to rigs and equipment caused by named windstorms in the GOM. This results in a higher risk of material losses that are not covered by third party insurance contracts. In addition, certain of our shore-based facilities are located in geographic regions that are susceptible to damage or disruption from hurricanes and other weather events. Future hurricanes or similar natural disasters that impact our facilities, our personnel located at those facilities or our ongoing operations may negatively affect our financial position and operating results.
If an accident or other event occurs that exceeds our insurance coverage limits or is not an insurable event under our insurance policies, or is not fully covered by contractual indemnity, it could result in a significant loss to us.
We must make substantial capital and operating expenditures to reactivate, build, maintain and upgrade our drilling fleet.
Our business is highly capital intensive and dependent on having sufficient cash flow and/or available sources of financing in order to fund our capital expenditure requirements. Our expenditures could increase as a result of changes in offshore drilling technology; the cost of labor and materials; customer requirements; the cost of replacement parts for existing drilling rigs; the geographic location of the rigs; and industry standards. Changes in offshore drilling technology, customer requirements for new or upgraded equipment and competition within our industry may require us to make significant capital expenditures in order to maintain our competitiveness. In addition, changes in governmental regulations, safety or other equipment standards, as well as compliance with standards imposed by maritime self-regulatory organizations, may require us to make additional unforeseen capital expenditures. As a result, we may be required to take our rigs out of service for extended periods of time, with corresponding losses of revenues, in order to make such alterations or to add such equipment. Depending on the length of time that a rig has been cold-stacked, we may incur significant costs to restore the rig to drilling capability,
17
which may also include capital expenditures due to the possible technological obsolescence of the rig. Market conditions, such as the current protracted industry downturn, may not justify these expenditures or enable us to operate our older rigs profitably during the remainder of their economic lives. We can provide no assurance that we will have access to adequate or economical sources of capital to fund our capital and operating expenditures.
Significant portions of our operations are conducted outside the U.S. and involve additional risks not associated with U.S. domestic operations.
Our operations outside the U.S. accounted for approximately 47%, 41% and 58% of our total consolidated revenues for 2019, 2018 and 2017, respectively, and include, or have included, operations in South America, Australia and Southeast Asia, Europe and Mexico. Because we operate in various regions throughout the world, we are exposed to a variety of risks inherent in international operations, including risks of war or conflicts; political and economic instability and disruption; civil disturbance; acts of piracy, terrorism or other assaults on property or personnel; corruption; possible economic and legal sanctions (such as possible restrictions against countries that the U.S. government may consider to be state sponsors of terrorism); changes in global monetary and trade policies, laws and regulations; fluctuations in currency exchange rates; restrictions on currency exchange; controls over the repatriation of income or capital; and other risks. We may not have insurance coverage for these risks, or we may not be able to obtain adequate insurance coverage for such events at reasonable rates. Our operations may become restricted, disrupted or prohibited in any country in which any of these risks occur.
On January 29, 2020, the European Parliament approved the U.K.’s withdrawal from the European Union, commonly referred to as Brexit. The U.K. officially left the European Union on January 31, 2020. Following its departure, the U.K. entered into a transition period that is scheduled to last until December 31, 2020 during which period of time the U.K.’s trading relationship with the European Union is expected to remain largely the same while the two parties negotiate a trade agreement as well as other aspects of the U.K.’s relationship with the European Union. The impact of Brexit and the future relationship between the U.K. and the European Union are uncertain for companies that do business in the U.K. and the overall global economy. Approximately 17% of our total revenues for the year ended December 31, 2019 were generated in the U.K. Brexit, or similar events in other jurisdictions, could depress economic activity or impact global markets, including foreign exchange and securities markets, which may have an adverse impact on our business and operations as a result of changes in currency exchange rates, tariffs, treaties and other regulatory matters.
We are also subject to the following risks in connection with our international operations:
|
|
|
|
|
|
|
|
|
|
|
|
|
|
|
|
|
|
|
|
|
|
|
|
|
|
18
|
|
|
|
We are also subject to the regulations of the U.S. Treasury Department’s Office of Foreign Assets Control and other U.S. laws and regulations governing our international operations in addition to domestic and international anti-bribery laws and sanctions, trade laws and regulations, customs laws and regulations, and other restrictions imposed by other governmental or international authorities. Failure to comply with these laws and regulations could result in criminal and civil penalties, economic sanctions, seizure of shipments and/or the contractual withholding of monies owed to us, among other things. We have operated and may in the future operate in parts of the world where strict compliance with anti-corruption and anti-bribery laws may conflict with local customs and practices. Any failure to comply with the U.S. Foreign Corrupt Practices Act, the U.K. Bribery Act 2010 or other anti-corruption laws due to our own acts or omissions or the acts or omissions of others, including our partners, agents or vendors, could subject us to substantial fines, sanctions, civil and/or criminal penalties and curtailment of operations in certain jurisdictions. In addition, international contract drilling operations are subject to various laws and regulations in countries in which we operate, including laws and regulations relating to the equipping and operation of drilling rigs; import-export quotas or other trade barriers; repatriation of foreign earnings or capital; oil and gas exploration and development; local content requirements; taxation of offshore earnings and earnings of expatriate personnel; and use and compensation of local employees and suppliers by foreign contractors.
Any significant cyber attack or other interruption in network security or the operation of critical information technology systems could materially disrupt our operations and adversely affect our business.
Our business has become increasingly dependent upon information technologies, computer systems and networks, including those maintained by us and those maintained and provided to us by third parties (for example, “software-as-a-service” and cloud solutions), to conduct day-to-day operations, and we are placing greater reliance on information technology to help support our operations and increase efficiency in our business functions. We are dependent upon our information technology and infrastructure, including operational and financial computer systems, to process the data necessary to conduct almost all aspects of our business. Computer, telecommunications and other business facilities and systems could become unavailable or impaired from a variety of causes including, among others, storms and other natural disasters, terrorist attacks, utility outages, theft, design defects, human error or complications encountered as existing systems are maintained, repaired, replaced or upgraded. It has been reported that known or unknown entities or groups have mounted so-called “cyber attacks” on businesses and other organizations solely to disable or disrupt computer systems, disrupt operations and, in some cases, steal data. In addition, the U.S. government has issued public warnings that indicate that energy assets might be specific targets of cybersecurity threats. Cybersecurity risks and threats continue to grow and may be difficult to anticipate, prevent, discover or mitigate. A breach, failure or circumvention of our computer systems or networks, or those of our customers, vendors or others with whom we do business, including by ransomware or other attacks, could materially disrupt our business operations and our customers’ operations and could result in the alteration, loss, theft or corruption of data, and unauthorized release of, unauthorized access to, or our loss of access to confidential, proprietary, sensitive or other critical data or systems concerning our company, business activities, employees, customers or vendors. Any such breach, failure or circumvention could result in loss of customers, financial losses, regulatory fines, substantial damage to property, bodily injury or loss of life, or misuse or corruption of critical data and proprietary information and could have a material adverse effect on our operations, business or reputation.
Acts of terrorism, piracy and political and social unrest could affect the markets for drilling services, which may have a material adverse effect on our results of operations.
Acts of terrorism and social unrest, brought about by world political events or otherwise, have caused instability in the world’s financial and insurance markets in the past and may occur in the future. Such acts could be directed against companies such as ours. In addition, acts of terrorism, piracy and social unrest could lead to increased volatility in prices for crude oil and natural gas and could adversely affect the market for offshore drilling services. Insurance premiums could increase and coverage may be unavailable in the future. Government regulations may effectively preclude us from engaging in business activities in certain countries. These regulations could be amended to cover countries where we currently operate or where we may wish to operate in the future.
19
We rely on third-party suppliers, manufacturers and service providers to secure and service equipment, components and parts used in rig operations, conversions, upgrades and construction.
Our reliance on third-party suppliers, manufacturers and service providers to provide equipment and services exposes us to volatility in the quality, price and availability of such items. Certain components, parts and equipment that we use in our operations may be available only from a small number of suppliers, manufacturers or service providers. The failure of one or more third-party suppliers, manufacturers or service providers to provide equipment, components, parts or services, whether due to capacity constraints, production or delivery disruptions, price increases, quality control issues, recalls or other decreased availability of parts and equipment, is beyond our control and could materially disrupt our operations or result in the delay, renegotiation or cancellation of drilling contracts, thereby causing a loss of contract drilling backlog and/or revenue to us, as well as an increase in operating costs and an increased risk of additional asset impairments.
Additionally, our suppliers, manufacturers and service providers could be negatively impacted by the current protracted industry downturn or global economic conditions. If certain of our suppliers, manufacturers or service providers were to experience significant cash flow issues, become insolvent or otherwise curtail or discontinue their business as a result of such conditions, it could result in a reduction or interruption in supplies, equipment or services available to us and/or a significant increase in the price of such supplies, equipment and services,.
Changes in accounting principles and financial reporting requirements could adversely affect our results of operations or financial condition.
We are required to prepare our financial statements in accordance with accounting principles generally accepted in the U.S., or GAAP, as promulgated by the Financial Accounting Standards Board. It is possible that future accounting standards that we are required to adopt could change the current accounting treatment that we apply to our consolidated financial statements and that such changes could have a material adverse effect on our results of operations and financial condition. For a description of recent accounting standards that we have not yet adopted and, if known, our estimates of their expected impact, see Note 1 “General Information – Recent Accounting Pronouncements Not Yet Adopted” to the Consolidated Financial Statements included under Item 8 of this report.
Failure to obtain and retain highly skilled personnel could hurt our operations.
We require highly skilled personnel to operate and provide technical services and support for our business. A well-trained, motivated and adequately-staffed work force has a positive impact on our ability to attract and retain business. As a result, our future success depends on our continuing ability to identify, hire, develop, motivate and retain skilled personnel for all areas of our organization. To the extent that demand for drilling services and/or the size of the active worldwide industry fleet increases, shortages of qualified personnel could arise, creating upward pressure on wages and difficulty in staffing and servicing our rigs. Our continued ability to compete effectively depends on our ability to attract new employees and to retain and motivate our existing employees. Heightened competition for skilled personnel could materially and adversely limit our operations and further increase our costs.
We are controlled by a single stockholder, which could result in potential conflicts of interest.
Loews Corporation, which we refer to as Loews, beneficially owned approximately 53% of our outstanding shares of common stock as of February 7, 2020, and is in a position to control actions that require the consent of stockholders, including the election of directors, amendment of our Restated Certificate of Incorporation and any merger or sale of substantially all of our assets. In addition, three officers of Loews serve onassist our Board of Directors or Board. We have also entered into a services agreement and a registration rights agreement with Loews, and we may inits responsibility of overseeing the future enter into other agreements with Loews.
In addition, under each of our credit facilities, a change of control event would occur if (a) any person other than Loews, its subsidiaries or affiliates and/or certain issuers of investment grade debt owns or has the power to vote more than 50% of our outstanding common stock or (b) any combination of Loews, its subsidiaries or affiliates and/or certain issuers of investment grade debt ceases to own or have the power to vote more than 25% of our outstanding common stock. If a change of control event occurs, we would be required to cash collateralize part or all of the lenders’ credit exposures under the credit facility if we fail to obtain at least one investment grade credit rating
20
as set forth in the credit facility. Under our credit ratings as of the date of this report, we would be required to cash collateralize all of the lenders’ credit exposures under each credit facility if a change in control event occurred. See “–Our significant debt levels may limit our liquidity and flexibility in obtaining additional financing and in pursuing other business opportunities.
Loews is a holding company, with principal subsidiaries (in addition to us) consisting of CNA Financial Corporation, an 89%-owned subsidiary engaged in commercial property and casualty insurance; Boardwalk Pipeline Partners, LP, a wholly-owned subsidiary engaged in the transportation and storage of natural gas and natural gas liquids; Loews Hotels Holding Corporation, a wholly-owned subsidiary engaged in the operation of a chain of hotels; and Altium Packaging LLC, a 99%-owned subsidiary engaged in the manufacture of rigid plastic packaging solutions. It is possible that potential conflicts of interest could arise in the future for our directors who are also officers of Loews with respect to a number of areas relating to the past and ongoing relationships of Loews and us, including tax and insurance matters, financial commitments and sales of common stock pursuant to registration rights or otherwise. Although the affected directors may abstain from voting on matters in which our interests and those of Loews are in conflict so as to avoid potential violations of their fiduciary duties to stockholders, the presence of potential or actual conflicts could affect the process or outcome of Board deliberations.
Item 1B. Unresolved Staff Comments.
Not applicable.
Item 2. Properties.
We own an office building in Houston, Texas, where our corporate headquarters are located. We also own offices and other facilities in New Iberia, Louisiana, Aberdeen, Scotland, Macae, Brazil and Ciudad del Carmen, Mexico. Additionally, we currently lease various office, warehouse and storage facilities in Australia, Brazil, Louisiana, Malaysia, Singapore and the U.K. to support our offshore drilling operations.
Item 3. Legal Proceedings.
See information with respect to legal proceedings in Note 10 “Commitments and Contingencies” to our Consolidated Financial Statements in Item 8 of this report.
Item 4. Mine Safety Disclosures.
Not applicable.
21
PART II
Item 5. Market for the Registrant’s Common Equity, Related Stockholder Matters and Issuer Purchases of Equity Securities.
Market Information and Holders of Record
Our common stock is listed on the New York Stock Exchange, or NYSE, under the symbol “DO.”
As of February 7, 2020, there were approximately 118 holders of record of our common stock. This number represents registered stockholders and does not include stockholders who hold their shares through an institution.
Dividend Policy
We pay dividends at the discretion of our Board. Any determination to declare a dividend, as well as the amount of any dividend that may be declared, will be based on the Board’s consideration of our financial position, earnings, earnings outlook, capital spending plans, outlook on current and future market conditions and business needs, contractual obligations and other factors that our Board considers relevant at that time. The Board’s dividend policy may change from time to time, but there can be no assurance that we will declare any cash dividends at all or in any particular amounts. We have not paid a dividend to stockholders since 2015.
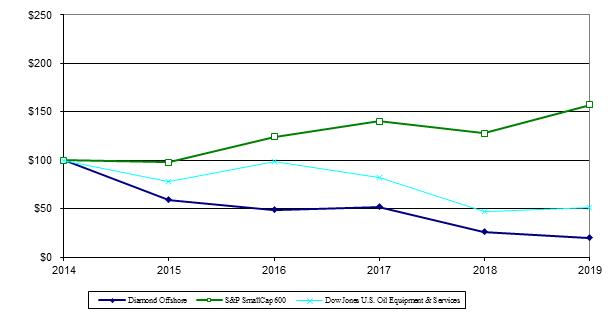
Cumulative Total Stockholder Return
The following graph shows the cumulative total stockholder return for our common stock, the Standard & Poor's SmallCap 600 Index and the Dow Jones U.S. Oil Equipment & Services index over the five-year period ended December 31, 2019.
Comparison of Five-Year Cumulative Total Return (1)
|
| Dec. 31, 2014 |
|
| Dec. 31, 2015 |
|
| Dec. 31, 2016 |
|
| Dec. 31, 2017 |
|
| Dec. 31, 2018 |
|
| Dec. 31, 2019 |
| ||||||
Diamond Offshore |
| $ | 100 |
|
|
| 59 |
|
|
| 49 |
|
|
| 52 |
|
|
| 26 |
|
|
| 20 |
|
S&P SmallCap 600 Index |
| $ | 100 |
|
|
| 98 |
|
|
| 124 |
|
|
| 140 |
|
|
| 128 |
|
|
| 157 |
|
Dow Jones U.S. Oil Equipment & Services |
| $ | 100 |
|
|
| 78 |
|
|
| 99 |
|
|
| 82 |
|
|
| 47 |
|
|
| 51 |
|
|
|
22
Item 6. Selected Financial Data.
The following table sets forth certain historical consolidated financial data relating to Diamond Offshore. We prepared the selected consolidated financial data from our consolidated financial statements as of and for the periods presented. The selected consolidated financial data below should be read in conjunction with "Management's Discussion and Analysis of Financial Condition and Results of Operations" in Item 7 and our Consolidated Financial Statements (including the Notes thereto) in Item 8 of this report.
|
| As of and for the Year Ended December 31, |
|
| |||||||||||||||||||||
|
| 2019 |
|
|
| 2018 |
|
|
| 2017 |
|
|
| 2016 |
|
|
| 2015 |
|
| |||||
|
| (In thousands, except per share data) |
|
| |||||||||||||||||||||
Income Statement Data: |
|
|
|
|
|
|
|
|
|
|
|
|
|
|
|
|
|
|
|
|
|
|
|
|
|
Total revenues |
| $ | 980,644 |
|
|
| $ | 1,083,215 |
| (1) |
| $ | 1,485,746 |
|
|
| $ | 1,600,342 |
|
|
| $ | 2,419,393 |
|
|
Operating (loss) income |
|
| (282,330 | ) |
|
|
| (112,183 | ) | (2) |
|
| 123,879 |
| (2) |
|
| (356,884 | ) | (2) |
|
| (294,074 | ) | (2) |
Net (loss) income |
|
| (357,214 | ) |
|
|
| (180,272 | ) |
|
|
| 18,346 |
|
|
|
| (372,503 | ) |
|
|
| (274,285 | ) |
|
Net (loss) income per share: |
|
|
|
|
|
|
|
|
|
|
|
|
|
|
|
|
|
|
|
|
|
|
|
|
|
Basic |
|
| (2.60 | ) |
|
|
| (1.31 | ) |
|
|
| 0.13 |
|
|
|
| (2.72 | ) |
|
|
| (2.00 | ) |
|
Diluted |
|
| (2.60 | ) |
|
|
| (1.31 | ) |
|
|
| 0.13 |
|
|
|
| (2.72 | ) |
|
|
| (2.00 | ) |
|
Balance Sheet Data: |
|
|
|
|
|
|
|
|
|
|
|
|
|
|
|
|
|
|
|
|
|
|
|
|
|
Drilling and other property and equipment, net |
| $ | 5,152,828 |
|
|
| $ | 5,184,222 |
| (2) |
| $ | 5,261,641 |
| (2) |
| $ | 5,726,935 |
| (2) |
| $ | 6,378,814 |
| (2) |
Total assets |
|
| 5,834,044 |
|
|
|
| 6,035,694 |
|
|
|
| 6,250,570 |
|
|
|
| 6,371,877 |
|
|
|
| 7,149,894 |
| (3) |
Long-term debt (excluding current maturities)(4) |
|
| 1,975,741 |
|
|
|
| 1,973,922 |
|
|
|
| 1,972,225 |
|
|
|
| 1,980,884 |
|
|
|
| 1,979,778 |
| (3) |
Other Financial Data: |
|
|
|
|
|
|
|
|
|
|
|
|
|
|
|
|
|
|
|
|
|
|
|
|
|
Capital expenditures, excluding accruals |
| $ | 326,090 |
|
|
| $ | 222,406 |
|
|
| $ | 139,581 |
|
|
| $ | 652,673 |
|
|
| $ | 830,655 |
|
|
Cash dividends declared per share |
|
| — |
|
|
|
| — |
|
|
|
| — |
|
|
|
| — |
|
|
|
| 0.50 |
|
|
|
|
|
|
|
|
|
|
23
Item 7. Management’s Discussion and Analysis of Financial Condition and Results of Operations.
The following discussion should be read in conjunction with Item 1A, “Risk Factors” and our Consolidated Financial Statements (including the Notes thereto) in Item 8 of this report.
This section of this Form 10-K generally discusses 2019 and 2018 items and year-to-year comparisons between 2019 and 2018. For a discussion of our financial condition and results of operations for 2018 compared to 2017, please refer to Item 7 of Part II, “Management’s Discussion and Analysis of Financial Condition and Results of Operations” in our Annual Report on Form 10-K for the year ended December 31, 2018 filed with the SEC on February 13, 2019.
We provide contract drilling services to the energy industry around the globe with a fleet of 15 offshore drilling rigs, consisting of four drillships and 11 semisubmersible rigs, including two semisubmersible rigs that are cold stacked as of the date of this report.
Market Overview
Over the past several years, crude oil prices have been volatile, reaching a high of $115 per barrel in 2014 but dropping to $55 per barrel by the end of 2014. In 2015, oil prices continued to decline, closing at $37 per barrel at the end of the year, and continuing to fall to a low of $28 per barrel during 2016 before recovering to nearly $57 per barrel by the end of 2016. The price of crude oil continued to fluctuate in 2017 and 2018, with oil prices in the $60- per-barrel range at the beginning of 2019. As of the date of this report, Brent crude oil prices were in the mid-$50-per-barrel range, having started 2020 in the mid-to-upper $60-per-barrel range. As a result of, among other things, this continued volatility in commodity price and its uncertain future, the offshore drilling industry has experienced a substantial decline in demand for its services, as well as a significant decline in dayrates for contract drilling services.
Industry-wide floater utilization was approximately 66% at the end of 2019 based on industry analyst reports, which was unchanged from the third quarter of 2019, but an increase from nearly 60% utilization at the end of 2018. Tendering activity has also increased in some markets, but drilling programs remain primarily short term in nature, with options for future wells. Industry analysts have reported that capital investments are expected to increase slightly in 2020 compared to recent years, but forecasted spending in 2020 remains lower than previous spending levels. Dayrates remain low and pricing power currently remains with the customer, as some industry analysts have indicated that, based on historical data, utilization rates must increase to the 80%-range before pricing power shifts to the drilling contractor.
From a supply perspective, the offshore floater market remains oversupplied with approximately 240 rigs available based on industry reports. Over the last six years, 135 floaters reportedly have been scrapped; however, the pace of rig attrition has now slowed. Industry reports indicate that there remain approximately 25 newbuild floaters on order with scheduled deliveries in 2020 through 2022. Of these newbuild rigs, 16 are scheduled for delivery in 2020, but only one is under contract as of the date of this report. In addition, over the next twelve months, more than 60 currently contracted floaters are estimated to roll off their contracts, further adding to the oversupply of floaters. This combination of factors points to a continued, challenging offshore drilling market and a continuation of the protracted industry downturn.
As a result of the continuing protracted industry downturn and these challenges, we are continuing to actively seek ways to drive efficiency, reduce non-productive time and provide technical innovation to our customers. We expect these innovations and efficiencies to result in faster and safer drilling and completion of wells, leading to lower overall well costs to the benefit of our customers.
See “– Contract Drilling Backlog”for future commitments of our rigs during 2020 through 2023.
ContractDrillingBacklog
Contract drilling backlog, as presented below, includes only firm commitments (typically represented by signed contracts) and is calculated by multiplying the contracted operating dayrate by the firm contract period. Our
24
calculation also assumes full utilization of our drilling equipment for the contract period (excluding scheduled shipyard and survey days); however, the amount of actual revenue to be earned and the actual periods during which revenues will be earned will be different than the amounts and periods shown in the tables below due to various factors. Utilization rates, which generally approach 92-98% during contracted periods, can be adversely impacted by downtime due to various operating factors including weather conditions and unscheduled repairs and maintenance. Contract drilling backlog excludes revenues for mobilization, demobilization, contract preparation and customer reimbursables. No revenue is generally earned during periods of downtime for regulatory surveys. Changes in our contract drilling backlog between periods are generally a function of the performance of work on term contracts, as well as the extension or modification of existing term contracts and the execution of additional contracts. In addition, under certain circumstances, our customers may seek to terminate or renegotiate our contracts, which could adversely affect our reported backlog.
See “Risk Factors — We can provide no assurance that our drilling contracts will not be terminated early or that our current backlog of contract drilling revenue will be ultimately realized” in Item 1A of this report, which is incorporated herein by reference.
The backlog information presented below does not, nor is it intended to, align with the disclosures related to revenue expected to be recognized in the future related to unsatisfied performance obligations, which are presented in Note 2 “Revenue from Contracts with Customers” to our Consolidated Financial Statements in Item 8 of this report. Contract drilling backlog includes only future dayrate revenue as described above, while the disclosure in Note 2 excludes dayrate revenue and only reflects expected future revenue for mobilization, demobilization and capital modifications to our rigs, which are related to non-distinct promises within our signed contracts.
The following table reflects our contract drilling backlog as of January 1, 2020 (based on information available at that time), October 1, 2019 (the date reported in our Quarterly Report on Form 10-Q for the quarter ended September 30, 2019), and January 1, 2019 (the date reported in our Annual Report on Form 10-K for the year ended December 31, 2018) (in millions).
|
| January 1, 2020(1) |
|
| October 1, 2019(1) |
|
| January 1, 2019(1) |
| |||
Contract Drilling Backlog |
| $ | 1,611 |
|
| $ | 1,835 |
|
| $ | 1,973 |
|
|
|
The following table reflects the amount of our contract drilling backlog by year as of January 1, 2020 (in millions).
|
| For the Years Ending December 31, |
| |||||||||||||||||
|
| Total |
|
| 2020 |
|
| 2021 |
|
| 2022 |
|
| 2023 |
| |||||
Contract Drilling Backlog (1) |
| $ | 1,611 |
|
| $ | 802 |
|
| $ | 486 |
|
| $ | 209 |
|
| $ | 114 |
|
|
|
25
The following table reflects the percentage of rig days committed by year as of January 1, 2020. The percentage of rig days committed is calculated as the ratio of total days committed under contracts, as well as scheduled shipyard, survey and mobilization days for all rigs in our fleet, to total available days (number of rigs, including cold-stacked rigs, multiplied by the number of days in a particular year).
|
| For the Years Ending December 31, |
| |||||||||
|
| 2020 |
|
| 2021 |
|
| 2022 |
|
| 2023 |
|
Rig Days Committed (1) |
| 75% |
|
| 42% |
|
| 15% |
|
| 8% |
|
|
|
Important Factors That May Impact Our Operating Results, Financial Condition or Cash Flows
Operating Income. Our operating income is primarily a function of contract drilling revenue earned less contract drilling expenses incurred or recognized. The two most significant variables affecting our contract drilling revenue are the dayrates earned and utilization rates achieved by our rigs, each of which is a function of rig supply and demand in the marketplace. These factors are not entirely within our control and are difficult to predict. We generally recognize revenue from dayrate drilling contracts as services are performed. Consequently, when a rig is idle, no dayrate is earned and revenue will decrease as a result.
Revenue is affected by the acquisition or disposal of rigs, rig mobilizations, required surveys and shipyard projects. In connection with certain drilling contracts, we may receive fees for the mobilization and demobilization of equipment. In addition, some of our drilling contracts require downtime before the start of the contract to prepare the rig to meet customer requirements for which we may or may not be compensated. We recognize these fees ratably as services are performed over the initial term of the related drilling contracts. We defer mobilization and contract preparation fees received (on either a lump-sum or dayrate basis), as well as direct and incremental costs associated with the mobilization of equipment and contract preparation activities, and amortize each, on a straight-line basis, over the term of the related drilling contracts. As noted above, demobilization revenue expected to be received upon contract completion is estimated and is also recognized ratably over the initial term of the contract.
Operating income also fluctuates due to varying levels of contract drilling expenses. Our operating expenses represent all direct and indirect costs associated with the operation and maintenance of our drilling equipment, which generally are not affected by changes in dayrates and short-term reductions in utilization. For instance, if a rig is to be idle for a short period of time, few decreases in operating expenses may actually occur since the rig is typically maintained in a prepared or “warm-stacked” state with a full crew. In addition, when a rig is idle, we are responsible for certain operating expenses such as rig fuel and supply boat costs, which are typically costs of our customer when a rig is under contract. However, if a rig is expected to be idle for an extended period of time, we may reduce the size of a rig’s crew and take steps to “cold stack” the rig, which lowers expenses and partially offsets the impact on operating income. The cost of cold stacking a rig can vary depending on the type of rig. The cost of cold stacking a drillship, for example, is typically substantially higher than the cost of cold stacking an older floater rig.
The principal components of our operating expenses include direct and indirect costs of labor and benefits, repairs and maintenance, freight, regulatory inspections, boat and helicopter rentals and insurance. Labor and repair and maintenance costs represent the most significant components of our operating expenses. In general, our labor costs increase primarily due to higher salary levels, rig staffing requirements and costs associated with labor regulations in the geographic regions in which our rigs operate. In addition, the costs associated with training employees can be significant. Costs to repair and maintain our equipment fluctuate depending upon the type of activity the drilling unit is performing, as well as the age and condition of the equipment and the regions in which our rigs are working. See “– Contractual Cash Obligations – Pressure Control by the Hour®.”
Regulatory Surveys and Planned Downtime. Our operating income is negatively impacted when we perform certain regulatory inspections, which we refer to as a special survey, that are due every five years for most of our rigs. The inspection interval for our North Sea rigs is two-and-one-half years. Operating revenue decreases because
26
these special surveys are generally performed during scheduled downtime in a shipyard. Operating expenses increase as a result of these special surveys due to the cost to mobilize the rigs to a shipyard, inspection costs incurred and repair and maintenance costs, which are recognized as incurred. Repair and maintenance activities may result from the special survey or may have been previously planned to take place during this mandatory downtime. The number of rigs undergoing a special survey will vary from year to year, as well as from quarter to quarter.
During 2020, we expect to spend approximately 480 days for upgrades, surveys, contract preparation and mobilization of rigs, which includes approximately 80 days for contract preparation for the Ocean Onyx, an aggregate of approximately 285 days for special surveys and upgrades for the Ocean BlackRhino and Ocean BlackLion, approximately60 days for the mobilization of and contract preparation for the Ocean Monarch prior to its contract in Myanmar and approximately 55 days for mobilization and contract preparation activities for other rigs. We can provide no assurance as to the exact timing and/or duration of downtime associated with these projects. See “ – Contract Drilling Backlog.”
Physical Damage and Marine Liability Insurance. We are self-insured for physical damage to rigs and equipment caused by named windstorms in the U.S. Gulf of Mexico. If a named windstorm in the U.S. Gulf of Mexico causes significant damage to our rigs or equipment, it could have a material adverse effect on our financial condition, results of operations and cash flows. Under our current insurance policy, we carry physical damage insurance for certain losses other than those caused by named windstorms in the U.S. Gulf of Mexico for which our deductible for physical damage is $25.0 million per occurrence. We do not typically retain loss-of-hire insurance policies to cover our rigs.
In addition, we carry marine liability insurance covering certain legal liabilities, including coverage for certain personal injury claims, and generally covering liabilities arising out of or relating to pollution and/or environmental risk. We believe that the policy limit for our marine liability insurance is within the range that is customary for companies of our size in the offshore drilling industry and is appropriate for our business. Under these policies our deductibles for marine liability coverage related to insurable events arising due to named windstorms in the U.S. Gulf of Mexico are $25.0 million for the first occurrence and vary in amounts ranging between $25.0 million and, if aggregate claims exceed certain thresholds, up to $100.0 million for each subsequent occurrence, depending on the nature, severity and frequency of claims that might arise during the policy year. Our deductibles for other marine liability coverage, including personal injury claims not related to named windstorms in the U.S. Gulf of Mexico, are $5.0 million for the first occurrence and vary in amounts ranging between $5.0 million and, if aggregate claims exceed certain thresholds, up to $100.0 million for each subsequent occurrence, depending on the nature, severity and frequency of claims that might arise during the policy year.
Impact of Changes in Tax Laws or Their Interpretation. We operate through our various subsidiaries in a number of jurisdictions throughout the world. As a result, we are subject to highly complex tax laws, treaties and regulations in the jurisdictions in which we operate, which may change and are subject to interpretation. Changes in laws, treaties and regulations and the interpretation of such laws, treaties and regulations may put us at risk for future tax assessments and liabilities which could be substantial and could have a material adverse effect on our financial condition, results of operations and cash flows.
Critical Accounting Estimates
Our significant accounting policies are included in Note 1 “General Information” to our Consolidated Financial Statements in Item 8 of this report. Judgments, assumptions and estimates by our management are inherent in the preparationintegrity of our financial statements, our compliance with legal and regulatory requirements, the applicationqualifications and independence of our significant accounting policies. We believe that our most critical accounting estimates are as follows:
Property, Plant and Equipment. We carry our drilling and other property and equipment at cost, less accumulated depreciation. Maintenance and routine repairs are charged to income currently while replacements and betterments that upgrade or increaseindependent auditor, the functionality of our existing equipment and that significantly extend the useful life of an existing asset, are capitalized. Significant judgments, assumptions and estimates may be required in determining whether or not such replacements and betterments meet the criteria for capitalization and in determining useful lives and salvage values of such assets. Changes in these judgments, assumptions and estimates could
27
produce results that differ from those reported. During the years ended December 31, 2019 and 2018, we capitalized $343.8 million and $243.6 million, respectively, in replacements and betterments of our drilling fleet.
We evaluate our property and equipment for impairment whenever changes in circumstances indicate that the carrying amount of an asset may not be recoverable (such as, but not limited to, cold stacking a rig, the expectation of cold stacking a rig in the near future, contracted backlog of less than one year for a rig, a decision to retire or scrap a rig, or excess spending over budget on a newbuild, construction project or major rig upgrade). We utilize an undiscounted probability-weighted cash flow analysis in testing an asset for potential impairment. Our assumptions and estimates underlying this analysis include the following:
|
|
|
|
|
|
|
|
|
|
|
|
|
|
Based on these assumptions, we develop a matrix for each rig under evaluation using multiple utilization/dayrate scenarios, to each of which we have assigned a probability of occurrence. We arrive at a projected probability-weighted cash flow for each rig based on the respective matrix and compare such amount to the carrying value of the asset to assess recoverability.
The underlying assumptions and assigned probabilities of occurrence for utilization and dayrate scenarios are developed using a methodology that examines historical data for each rig, which considers the rig’s age, rated water depth and other attributes and then assesses its future marketability in light of the current and projected market environment at the time of assessment. Other assumptions, such as operating, maintenance, inspection and reactivation costs, are estimated using historical data adjusted for known developments, cost projections for re-entry of rigs into the market and future events that are anticipated by management at the time of the assessment.
Management’s assumptions are necessarily subjective and are an inherent part of our asset impairment evaluation, and the use of different assumptions could produce results that differ from those reported. Our methodology generally involves the use of significant unobservable inputs, representative of a Level 3 fair value measurement, which may include assumptions related to future dayrate revenue, costs and rig utilization, quotes from rig brokers, the long-term future performance of our rigsinternal audit function and future market conditions. Management’s assumptions involve uncertainties about future demand for our services, dayrates, expenses and other future events, and management’s expectations may not be indicative of future outcomes. Significant unanticipated changes to these assumptions could materially alter our analysis in testing an asset for potential impairment. For example, changes in market conditions that exist at the measurement date or that are projected by management could affect our key assumptions. Other events or circumstances that could affect our assumptions may include, but are not limited to, a further sustained decline in oil and gas prices, cancelations of our drilling contracts or contracts of our competitors, contract modifications, costs to comply with new governmental regulations, capital expenditures required due to advances in offshore drilling technology, growth in the global oversupply of oil and geopolitical events, such as lifting sanctions on oil-producing nations. Should actual market conditions in the future vary significantly from market conditions used in our projections, our assessment of impairment would likely be different.
We did not incur an impairment loss in 2019 and recorded an impairment loss of $27.2 million in 2018. See Note 3 “Asset Impairments” to our Consolidated Financial Statements in Item 8 of this report.
Personal Injury Claims. Under our current insurance policies, our deductibles for marine liability insurance coverage with respect to personal injury claims not related to named windstorms in the U.S. Gulf of Mexico, which primarily result from Jones Act liability in the Gulf of Mexico, are $5.0 million for the first occurrence and vary in
28
amounts ranging between $5.0 million and, if aggregate claims exceed certain thresholds, up to $100.0 million for each subsequent occurrence, depending on the nature, severity and frequency of claims that might arise during the policy year. Our deductibles for personal injury claims arising due to named windstorms in the U.S. Gulf of Mexico are $25.0 million for the first occurrence and vary in amounts ranging between $25.0 million and, if aggregate claims exceed certain thresholds, up to $100.0 million for each subsequent occurrence, depending on the nature, severity and frequency of claims that might arise during the policy year. The Jones Act is a federal law that permits seamen to seek compensation for certain injuries during the course of their employment on a vessel and governs the liability of vessel operators and marine employers for the work-related injury or death of an employee. We engage outside consultants to assist us in estimating our aggregate liability for personal injury claims based on our historical losses and utilizing various actuarial models.
The models used in estimating our aggregate reserve for personal injury claims include actuarial assumptions such as:
|
|
|
|
|
|
|
|
|
|
The eventual settlement or adjudication of these claims could differ materially from our estimated amounts due to uncertainties such as:
|
|
|
|
|
|
|
|
|
|
Income Taxes. We account for income taxes in accordance with accounting standards that require the recognition of the amount of taxes payable or refundable for the current year and an asset and liability approach in recognizing the amount of deferred tax liabilities and assets for the future tax consequences of events that have been currently recognized in our financial statements or tax returns. In each of our tax jurisdictions we recognize a current tax liability or asset for the estimated taxes payable or refundable on tax returns for the current year and a deferred tax asset or liability for the estimated future tax effects attributable to temporary differences and carryforwards. Deferred tax assets are reduced by a valuation allowance, if necessary, which is determined by the amount of any tax benefits that, based on available evidence, are not expected to be realized under a “more likely than not” approach. We make judgments regarding future events and related estimates especially as they pertain to the forecasting of our effective tax rate, the potential realization of deferred tax assets such as net operating loss carryforwards, utilization of foreign tax credits, and exposure to the disallowance of items deducted on tax returns upon audit.
In several of the international locations in which we operate, certain of our wholly-owned subsidiaries enter into agreements with other of our wholly-owned subsidiaries to provide specialized services and equipment in support of our foreign operations. We apply a transfer pricing methodology to determine the arm’s length amount to be charged for providing the services and equipment, and utilize outside consultants to assist us in the development of such transfer pricing methodologies. In most cases, there are alternative transfer pricing methodologies that could be applied to these transactions and, if applied, could result in different chargeable amounts.
29
Results of Operations
Our operating results for contract drilling services are dependent on three primary metrics or key performance indicators: revenue-earning days, rig utilization and average daily revenue. The following table presents these three key performance indicators and other comparative data relating to our revenues and operating expenses (in thousands, except days, daily amounts and percentages).
|
| Year Ended December 31, |
| |||||
|
| 2019 |
|
| 2018 |
| ||
REVENUE-EARNING DAYS (1) |
|
| 3,317 |
|
|
| 3,192 |
|
UTILIZATION (2) |
|
| 56 | % |
|
| 51 | % |
AVERAGE DAILY REVENUE (3) |
| $ | 272,600 |
|
| $ | 329,400 |
|
|
|
|
|
|
|
|
|
|
REVENUE RELATED TO CONTRACT DRILLING SERVICES |
| $ | 934,934 |
|
| $ | 1,059,973 |
|
REVENUE RELATED TO REIMBURSABLE EXPENSES |
|
| 45,710 |
|
|
| 23,242 |
|
TOTAL REVENUES |
| $ | 980,644 |
|
| $ | 1,083,215 |
|
CONTRACT DRILLING EXPENSE, EXCLUDING DEPRECIATION |
| $ | 793,412 |
|
| $ | 722,834 |
|
REIMBURSABLE EXPENSES |
| $ | 45,016 |
|
| $ | 22,917 |
|
OPERATING LOSS |
|
|
|
|
|
|
|
|
Contract drilling services, net |
| $ | 141,522 |
|
| $ | 337,139 |
|
Reimbursable expenses, net |
|
| 694 |
|
|
| 325 |
|
Depreciation |
|
| (355,596 | ) |
|
| (331,789 | ) |
General and administrative expense |
|
| (67,878 | ) |
|
| (85,351 | ) |
Impairment of assets |
|
| — |
|
|
| (27,225 | ) |
Restructuring and separation costs |
|
| — |
|
|
| (5,041 | ) |
Loss on disposition of assets |
|
| (1,072 | ) |
|
| (241 | ) |
Total Operating Loss |
| $ | (282,330 | ) |
| $ | (112,183 | ) |
Other income (expense): |
|
|
|
|
|
|
|
|
Interest income |
|
| 6,382 |
|
|
| 8,477 |
|
Interest expense, net of amounts capitalized |
|
| (122,832 | ) |
|
| (123,240 | ) |
Foreign currency transaction loss |
|
| (3,936 | ) |
|
| (379 | ) |
Other, net |
|
| 702 |
|
|
| 700 |
|
Loss before income tax benefit |
|
| (402,014 | ) |
|
| (226,625 | ) |
Income tax benefit |
|
| 44,800 |
|
|
| 46,353 |
|
NET LOSS |
| $ | (357,214 | ) |
| $ | (180,272 | ) |
|
|
|
|
|
|
2019 Compared to 2018
Net results for 2019 decreased $176.9 million compared to 2018, reflecting lower margins from our contract drilling services, primarily driven by lower contract drilling revenue.
Contract Drilling Revenue. Contract drilling revenue decreased $125.0 million during 2019 compared to 2018, primarily due to lower average daily revenue earned ($187.7 million) and the absence of loss-of-hire insurance proceeds ($8.4 million), which were recognized during 2018. These negative factors were partially offset by the effect
30
in 2019 of 125 incremental revenue-earning days ($41.1 million) and recognition of revenues related to a gross margin commitment from a customer ($30.0 million). Comparing the two years, average daily revenue decreased primarily due to lower dayrates earned by some of our rigs as a result of renegotiating certain existing contracts during 2018 and a lower dayrate earned by the Ocean GreatWhite, which operated under new contracts in the U.K. in 2019. Revenue-earning days increased during 2019 primarily due to incremental revenue-earning days for the Ocean Endeavor (185 days), which was reactivated for a new contract in 2019, and fewer mobilization and non-productive days (250 days), partially offset by the unfavorable impact of incremental downtime for planned shipyard projects (78 days) and fewer revenue-earning days for the Ocean Guardian (232 days), which was sold in April 2019.
Contract Drilling Expense, Excluding Depreciation. Contract drilling expense, excluding depreciation, increased $70.6 million during 2019 compared to 2018, primarily due to incremental amortization of previously deferred contract preparation and mobilization costs ($28.3 million), incremental contract drilling expense for the reactivated Ocean Endeavor ($28.6 million), and increased costs for our 2019 rig fleet for labor and personnel ($5.1 million), repairs and maintenance ($18.1 million), equipment rental ($8.0 million), catering ($2.4 million), shorebase support and overhead costs ($10.1 million) and other rig costs ($3.0 million). These increases were partially offset by reduced costs in 2019 for the previously-owned Ocean Guardian ($24.4 million), which was sold in April 2019, and lower fuel costs ($8.6 million) for our fleet.
Other Operating Expenses. Our results for 2019 also reflect higher depreciation expense ($23.8 million), compared to the prior year, primarily due to capital expenditures and the completion of software implementation projects in 2019, partially offset by a reduction in general and administrative expense in 2019 due to the absence of a charge recorded in 2018 for settlement of a legal claim ($17.5 million). There were no impairments or restructuring charges incurred in 2019. See Note 3 “Asset Impairments” to our Consolidated Financial Statements in Item 8 of this report.
Income Tax Benefit. During 2019 and 2018, we recorded net income tax benefits of $44.8 million (11.4% effective tax rate) and $46.4 million (20.5% effective tax rate), respectively, on net losses of $402.0 million and $226.6 million, respectively. Income tax benefit for the 2018 period included a tax benefit related to the reversal of an uncertain tax position related to a toll charge related to the one-time mandatory repatriation of previously deferred earnings of our non-U.S. subsidiaries ($43.3 million), or Transition Tax. Income tax benefit for the 2019 period included a tax benefit associated with the reduction of our Transition Tax liability pursuant to final regulations issued by the Internal Revenue Service in June 2019 ($14.2 million), partially offset by deferred tax expense associated with Swiss tax reform ($12.1 million).
Other than these discrete tax adjustments, the difference in the amount of income tax benefit recognized in 2019, compared to 2018, was in large part due to the mix of our domestic and international pre-tax earnings and losses for the periods.
31
Liquidity and Capital Resources
During 2019, our cash and cash equivalents and marketable securities decreased an aggregate $300.8 million and during 2018 increased an aggregate $74.0 million. Based on our cash flow forecast, as of the date of this report, we expect to generate aggregate negative cash flows for 2020 and to begin to utilize borrowing under our two credit facilities in the first half of 2020 to meet our liquidity requirements. We anticipate ending 2020 with a drawn balance on our $950.0 million revolving credit facility. If market conditions do not improve, we could continue to generate aggregate negative cash flows in future periods. See “– Sources and Uses of Cash – Credit Agreements.”
Our worldwide cash balances are available to finance both our domestic and foreign activities. If and when circumstances require, we expect to record the withholding income tax impact associated with the potential distribution of earnings of our foreign subsidiaries; however, we have not provided income tax on the outside basis difference of our international subsidiaries as management does not intend to dispose of these subsidiaries and structuring alternatives exist to mitigate any potential liability should a disposition take place.
At December 31, 2019, we had cash available for current operations of $156.3 million. In addition, as of January 1, 2020, our contractual backlog was $1.6 billion, of which $0.8 billion is expected to be realized during 2020.
We have historically invested a significant portion of our cash flows in the enhancement of our drilling fleetindependent auditor and our ongoing rig equipment replacement and capital maintenance programs. The amountsystems of cash required to meet our capital commitments is determined by evaluating the need to upgrade our rigs to meet specific customer requirements and our rig equipment enhancement, maintenance and replacement programs. We make periodic assessments of our capital spending programs based on current and expected industry conditions and our cash flow forecast.
Based on our cash available and contractual backlog, we believe our 2020 capital spending and debt service requirements will be funded from a combination of our cash and cash equivalents, future operating cash flows and borrowings under our credit agreements. See “– Sources and Uses of Cash – Upgrades and Other Capital Expenditures.”
We may, from time to time, issue debt or equity securities, or a combination thereof, to finance capital expenditures, the acquisition of assets and businesses or for general corporate purposes. We have a shelf registration statement under which we may publicly issue from time to time up to $750 million of debt, equity or hybrid securities. Our ability to access the capital markets by issuing debt or equity securities will be dependent on our results of operations, our current financial condition, credit ratings, market conditions and other factors beyond our control at such time.
Sources and Uses of Cash
Cash Flow from Operations. Cash flow from operations for 2019 was $9.1 million, or a decrease of $223.0 million compared to 2018, reflecting the effects of the protracted downturn in the offshore contract drilling industry. Our cash flows for 2019, compared to 2018, reflected lower cash receipts for contract drilling services ($194.2 million), higher income tax payments, net of refunds, primarily in our foreign tax jurisdictions ($16.9 million), and higher cash expenditures related to contract drilling, shorebase support and general and administrative costs ($11.8 million).
Upgrades and Other Capital Expenditures. Capital expenditures during 2019 were $326.1 million and were funded from our operating cash flows and our available cash. As of the date of this report, we expect cash capital expenditures in 2020 to be approximately $190 million to $210 million. Planned spending in 2020 associated with projects under our capital maintenance and replacement programs includes equipment upgrades for the Ocean BlackRhino and Ocean BlackLion and costs associated with the completion of the reactivation and upgrade of the Ocean Onyx.
32
Credit Agreements. We currently have approximately $1.2 billion, in the aggregate, available under two credit facilities, of which $225.0 million matures in October 2020, which we may have difficulty replacing upon maturity, and $950.0 million matures in October 2023. These credit agreements may be used for general corporate purposes, including investments, acquisitions and capital expenditures. The $950.0 million facility includes a swingline subfacility of $100.0 million and a letter of credit subfacility in the amount of $250.0 million. As of December 31, 2019, there were no amounts outstanding under the credit agreements; however, in January 2020, a $6.0 million financial letter of credit was issued under the $950.0 million facility’s letter of credit subfacility in support of an outstanding surety bond.
We are subject to various restrictive covenants and borrowing limitations under our credit agreements, and repayment of borrowings under our credit agreements is subject to acceleration upon the occurrence of an event of default.
Senior Notes. As of December 31, 2019, we had an aggregate $2.0 billion in long-term, unsecured senior notes outstanding which will mature at various times beginning in 2023 through 2043.
See Note 9 “Credit Agreements and Senior Notes” to our Consolidated Financial Statements in Item 8 of this report.
Credit Ratings
In September 2019, S&P downgraded our corporate and senior unsecured notes credit ratings to CCC+ from B. The rating outlook from S&P changed to stable from negative. Our current corporate credit rating from Moody’s is B2 and our current senior unsecured notes credit rating from Moody’s is B3. The rating outlook from Moody’s is negative. These credit ratings are below investment grade and could raise our cost of financing. Consequently, we may not be able to issue additional debt in amounts and/or with terms that we consider to be reasonable. These ratings could limit our ability to pursue other business opportunities or to refinance our indebtedness as it matures.
Contractual Cash Obligations
The following table sets forth our contractual cash obligations at December 31, 2019 (in thousands).
|
| Payments Due By Period |
| |||||||||||||||||
Contractual Obligations(1) |
| Total |
|
| Less than 1 year |
|
| 1 – 3 years |
|
| 4 – 5 years |
|
| After 5 years |
| |||||
Long-term debt (principal and interest) |
| $ | 3,718,251 |
|
| $ | 113,063 |
|
| $ | 226,125 |
|
| $ | 467,500 |
|
| $ | 2,911,563 |
|
Well Control Equipment services agreement |
|
| 250,383 |
|
|
| 39,221 |
|
|
| 78,227 |
|
|
| 78,334 |
|
|
| 54,601 |
|
Operating leases |
|
| 209,592 |
|
|
| 33,952 |
|
|
| 62,649 |
|
|
| 61,207 |
|
|
| 51,784 |
|
Total obligations |
| $ | 4,178,226 |
|
| $ | 186,236 |
|
| $ | 367,001 |
|
| $ | 607,041 |
|
| $ | 3,017,948 |
|
|
|
Pressure Control by the Hour®. In 2016, we entered into a ten-year agreement with a subsidiary of Baker Hughes Company (formerly known as Baker Hughes, a GE company), or Baker Hughes, to provide services with respect to certain blowout preventer and related well control equipment, or Well Control Equipment, on our four drillships. Such services include management of maintenance, certification and reliability with respect to such equipment. In connection with the contractual services agreement, we sold the Well Control Equipment on our drillships to a Baker Hughes subsidiary and are leasing it back over separate ten-year operating leases for approximately $26 million per year in the aggregate. Collectively, we refer to the contractual services agreement and corresponding operating lease agreements with the Baker Hughes affiliate as the “PCbtH program.” See Note 10 “Commitments and Contingencies” and Note 11 “Leases and Lease Commitments” to our Consolidated Financial Statements in Item 8 of this report.
33
Except for our contractual requirements under the PCbtH program discussed above, we had no other purchase obligations for major rig upgrades or any other significant obligations at December 31, 2019, except for those related to our direct rig operations, which arise during the normal course of business.
Other Commercial Commitments - Letters of Credit
We were contingently liable as of December 31, 2019 in the amount of $37.1 million under certain tax, performance, supersedeas, VAT and customs bonds and letters of credit. Agreements relating to approximately $28.5 million of customs, tax, VAT and supersedeas bonds can require collateral at any time, while the remaining agreements, aggregating $8.6 million, cannot require collateral except in events of default. As of December 31, 2019, we had not been required to make any collateral deposits with respect to these agreements. However, in January 2020, we were required to issue a $6.0 million financial letter of credit as collateral in support of our outstanding surety bonds. The table below provides a list of these obligations in U.S. dollar equivalents and their time to expiration (in thousands).
|
|
|
|
|
| For the Years Ending December 31, |
| |||||||||
|
| Total |
|
| 2020 |
|
| 2021 |
|
| 2022 |
| ||||
Other Commercial Commitments |
|
|
|
|
|
|
|
|
|
|
|
|
|
|
|
|
Tax bonds |
| $ | 25,634 |
|
| $ | 6,058 |
|
| $ | 3,241 |
|
| $ | 16,335 |
|
Performance bonds |
|
| 7,100 |
|
|
| — |
|
|
| 7,100 |
|
|
| — |
|
Supersedeas bonds |
|
| 2,600 |
|
|
| 2,600 |
|
|
| — |
|
|
| — |
|
Customs bonds |
|
| 1,446 |
|
|
| 1,446 |
|
|
| — |
|
|
| — |
|
Other |
|
| 312 |
|
|
| 224 |
|
|
| — |
|
|
| 88 |
|
Total obligations |
| $ | 37,092 |
|
| $ | 10,328 |
|
| $ | 10,341 |
|
| $ | 16,423 |
|
Off-Balance Sheet Arrangements
At December 31, 2019 and 2018, we had no off-balance sheet debt or other off-balance sheet arrangements.
Other
Operations Outside the U.S. Our operations outside the U.S. accounted for approximately 47%, 41% and 58% of our total consolidated revenues for the years ended December 31, 2019, 2018 and 2017, respectively. See “Risk Factors – Significant portions of our operations are conducted outside the U.S. and involve additional risks not associated with U.S. domestic operations” in Item 1A of this report.
Currency Risk. Some of our subsidiaries conduct a portion of their operations in the local currency of the country where they conduct operations, resulting in foreign currency exposure. Currency environments in which we currently have or previously had significant business operations include Australia, Brazil, Egypt, Malaysia, Mexico, Trinidad and Tobago and the U.K., creating exposure to certain monetary assets and liabilities denominated in currencies other than the U.S. dollar. These assets and liabilities are revalued based on currency exchange rates at the end of the reporting period.
To reduce our currency exchange risk, we may, if possible, arrange for a portion of our international contracts to be payable to us in local currency in amounts equal to our estimated operating costs payable in local currency, with the balance of the contract payable in U.S. dollars. At present, however, only a limited number of our contracts are payable both in U.S. dollars and the local currency. The revaluation of liabilities denominated in currencies other than the U.S. dollar related to foreign income taxes, including deferred tax assets and liabilities and uncertain tax positions, is reported as a component of “Income tax benefit” in our Consolidated Statements of Operations.
34
Forward-Looking Statements
We or our representatives may, from time to time, either in this report, in periodic press releases or otherwise, make or incorporate by reference certain written or oral statements that are “forward-looking statements” within the meaning of Section 27A of the Securities Act of 1933, as amended, or the Securities Act, and Section 21E of the Exchange Act. All statements other than statements of historical fact are, or may be deemed to be, forward-looking statements. Forward-looking statements include, without limitation, any statement that may project, indicate or imply future results, events, performance or achievements, and may contain or be identified by the words “expect,” “intend,” “plan,” “predict,” “anticipate,” “estimate,” “believe,” “should,” “could,” “may,” “might,” “will,” “will be,” “will continue,” “will likely result,” “project,” “forecast,” “budget” and similar expressions. In addition, any statement concerning future financial performance (including, without limitation, future revenues, earnings or growth rates), ongoing business strategies or prospects, and possible actions taken by or against us are also forward-looking statements as so defined. Statements made by us in this report that contain forward-looking statements may include, but are not limited to, information concerning our possible or assumed future results of operations and statements about the following subjects:
|
|
|
|
|
|
|
|
|
|
|
|
|
|
|
|
|
|
|
|
|
|
|
|
|
|
|
|
|
|
|
|
|
|
|
|
|
|
|
|
|
|
|
|
|
|
|
|
|
|
|
|
|
|
35
|
|
|
|
|
|
|
|
These types of statements are based on current expectations about future events and inherently are subject to a variety of assumptions, risks and uncertainties, many of which are beyond our control, that could cause actual results to differ materially from those expected, projected or expressed in forward-looking statements. These risks and uncertainties include, among others, the following:
|
|
|
|
|
|
|
|
|
|
|
|
|
|
|
|
|
|
|
|
|
|
|
|
|
|
|
|
|
|
|
|
|
|
|
|
|
|
|
|
|
|
|
|
|
|
|
|
|
|
36
|
|
|
|
|
|
|
|
|
|
|
|
|
|
|
|
|
|
|
|
|
|
|
|
|
|
|
|
|
|
|
|
|
|
|
|
|
|
|
|
The risks and uncertainties included here are not exhaustive. Other sections of this report and our other filings with the SEC include additional factors that could adversely affect our business, results of operations and financial performance. Given these risks and uncertainties, investors should not place undue reliance on forward-looking statements. Forward-looking statements included in this report speak only as of the date of this report. We expressly disclaim any obligation or undertaking to release publicly any updates or revisions to any forward-looking statement to reflect any change in our expectations or beliefs with regard to the statement or any change in events, conditions or circumstances on which any forward-looking statement is based. In addition, in certain places in this report, we refer to reports of third parties that purport to describe trends or developments in energy production or drilling and exploration activity. While we believe that each of these reports is reliable, we have not independently verified the information included in such reports. We specifically disclaim any responsibility for the accuracy and completeness of such information and undertake no obligation to update such information.
New Accounting Pronouncements
For a discussion of recent accounting pronouncements, which are not yet effective, and their effect on our financial position, results of operations and cash flows, see Note 1 “General Information - Recent Accounting Pronouncements Not Yet Adopted” to our Consolidated Financial Statements in Item 8 of this report.
37
Item 7A. Quantitative and Qualitative Disclosures About Market Risk.
The information included in this Item 7A is considered to constitute “forward-looking statements” for purposes of the statutory safe harbor provided in Section 27A of the Securities Act and Section 21E of the Exchange Act. See “Management’s Discussion and Analysis of Financial Condition and Results of Operations – Forward-Looking Statements” in Item 7 of this report.
Our measure of market risk exposure represents an estimate of the change in fair value of our financial instruments. Market risk exposure is presented for each class of financial instrument held by us at December 31, 2019 and 2018, assuming immediate adverse market movements of the magnitude described below. We believe that the various rates of adverse market movements represent a measure of exposure to loss under hypothetically assumed adverse conditions. The estimated market risk exposure represents the hypothetical loss to future earnings and does not represent the maximum possible loss or any expected actual loss, even under adverse conditions, because actual adverse fluctuations would likely differ. In addition, since our investment portfolio is subject to change based on our portfolio management strategy as well as in response to changes in the market, these estimates are not necessarily indicative of the actual results that may occur.
Exposure to market risk is managed and monitored by our senior management. Senior management approves the overall investment strategy that we employ and has responsibility to ensure that the investment positions are consistent with that strategy and the level of risk acceptable to us. We may manage risk by buying or selling instruments or entering into offsetting positions.
Interest Rate Risk. We have exposure to interest rate risk arising from changes in the level or volatility of interest rates. Our investments in marketable securities are in fixed maturity securities, although we do not hold any marketable securities as of the date of this report. We monitor our sensitivity to interest rate risk by evaluating the change in the value of our financial assets and liabilities due to fluctuations in interest rates. The evaluation is performed by applying an instantaneous change in interest rates by varying magnitudes on a static balance sheet to determine the effect such a change in rates would have on the recorded market value of our investments and the resulting effect on stockholders’ equity. The analysis provides the sensitivity of the market value of our financial instruments to selected changes in market rates and prices which we believe are reasonably possible over a one-year period.
The sensitivity analysis estimates the change in the market value of our interest sensitive assets and liabilities that were held on December 31, 2019 and 2018, due to instantaneous parallel shifts in the yield curve of 100 basis points, with all other variables held constant.
The interest rates on certain types of assets and liabilities may fluctuate in advance of changes in market interest rates, while interest rates on other types may lag behind changes in market rates. Accordingly, the analysis may not be indicative of, is not intended to provide, and does not provide a precise forecast of the effect of changes in market interest rates on our earnings or stockholders’ equity. Further, the computations do not contemplate any actions we could undertake in response to changes in interest rates.
Our long-term debt, as of December 31, 2019 and 2018, is denominated in U.S. dollars. Our existing debt has been issued at fixed rates, and as such, interest expense would not be impacted by interest rate shifts. The impact of a 100-basis point increase in interest rates on fixed rate debt would result in a decrease in market value of $89.7 million and $94.9 million as of December 31, 2019 and 2018, respectively. A 100-basis point decrease would result in an increase in market value of $102.0 million and $108.6 million as of December 31, 2019 and 2018, respectively.
We are also subject to risk exposure related to the variable interest rates charged on our revolving credit agreements, which are calculated on a base rate as defined in the respective credit agreement.
At December 31, 2018, our marketable securities included investments in U.S. Treasury bills with a fair value of $299.9 million. The impact of a 100-basis point increase or decrease in interest rates would not have had a significant impact on the market value of these securities. We had no such investments outstanding as of December 31, 2019.
38
Item 8. Financial Statements and Supplementary Data.
REPORTOFINDEPENDENTREGISTEREDPUBLICACCOUNTINGFIRM
Tothe stockholders and the BoardofDirectorsofDiamondOffshoreDrilling,Inc.
Opinion on the Financial Statements
We have audited the accompanying consolidated balance sheets of Diamond Offshore Drilling, Inc. and subsidiaries (the "Company") as of December 31, 2019 and 2018, the related consolidated statements of operations, comprehensive income or loss, stockholders’ equity, and cash flows, for each of the three years in the period ended December 31, 2019, and the related notes (collectively referred to as the "financial statements"). In our opinion, the financial statements present fairly, in all material respects, the financial position of the Company as of December 31, 2019 and 2018, and the results of its operations and its cash flows for each of the three years in the period ended December 31, 2019, in conformity with accounting principles generally accepted in the United States of America.
We have also audited, in accordance with the standards of the Public Company Accounting Oversight Board (United States) (PCAOB), the Company's internal control over financial reporting as of December 31, 2019, based on criteria established in Internal Control — Integrated Framework (2013) issued by the Committee of Sponsoring Organizations of the Treadway Commission and our report dated February 11, 2020, expressed an unqualified opinion on the Company's internal control over financial reporting.
Basis for Opinion
These financial statements are the responsibility of the Company's management. Our responsibility is to express an opinion on the Company's financial statements based on our audits. We are a public accounting firm registered with the PCAOB and are required to be independent with respect to the Company in accordance with the U.S. federal securities laws and the applicable rules and regulations of the Securities and Exchange Commission and the PCAOB.
We conducted our audits in accordance with the standards of the PCAOB. Those standards require that we plan and perform the audit to obtain reasonable assurance about whether the financial statements are free of material misstatement, whether due to error or fraud. Our audits included performing procedures to assess the risks of material misstatement of the financial statements, whether due to error or fraud, and performing procedures that respond to those risks. Such procedures included examining, on a test basis, evidence regarding the amounts and disclosures in the financial statements. Our audits also included evaluating the accounting principles used and significant estimates made by management, as well as evaluating the overall presentation of the financial statements. We believe that our audits provide a reasonable basis for our opinion.
Critical Audit Matters
The critical audit matters communicated below are matters arising from the current-period audit of the financial statements that were communicated or required to be communicated to the audit committee and that (1) relate to accounts or disclosures that are material to the financial statements and (2) involved our especially challenging, subjective, or complex judgments. The communication of critical audit matters does not alter in any way our opinion on the financial statements, taken as a whole, and we are not, by communicating the critical audit matters below, providing separate opinions on the critical audit matters or on the accounts or disclosures to which they relate.
Impairment of Long-Lived Assets – Refer to Notes 1 and 3 to the financial statements.
Critical Audit Matter Description
39
The evaluation of drilling equipment, specifically drilling rigs, for impairment occurs whenever changes in circumstances indicate that the carrying amount of an asset may not be recoverable, such as cold stacking a drilling rig, the expectation of cold stacking a drilling rig in the near term, contracted backlog of less than one year, a decision to retire or scrap a drilling rig, or excess spending over budget on a newbuild, construction project or major drilling rig upgrade.
When the Company determines that the carrying value of a drilling rig may not be recoverable, they prepare an undiscounted probability-weighted cash flow analysis to determine if there is a potential impairment. This analysis utilizes certain assumptions for each drilling rig under evaluation and considers multiple probability-weighted utilization and dayrate scenarios. The Company’s development of the dayrate assumption involves judgments relative to the current and expected market for the drilling rigs and expectations of future oil and gas prices. The drilling and other property and equipment balance was $5.2 billion as of December 31, 2019, and no impairment expense was recorded for the year ended December 31, 2019.
We identified impairment of drilling rigs as a critical audit matter because of the significant judgments made by management to identify indicators of impairment and to prepare probability-weighted cash flow analyses to determine if potential impairments exist. This required a high degree of auditor judgment, including the involvement of fair value specialists, and increased extent of effort related to evaluating indicators of impairment and dayrate used in the undiscounted probability-weighted cash flow analysis.
How the Critical Audit Matter Was Addressed in the Audit
Our audit procedures related to (i) the identification of indicators of impairment and (ii) the evaluation of the Company’s undiscounted probability-weighted cash flow analysis for those drilling rigs with factors that indicated potential impairment included the following, among others:
|
|
|
|
|
|
|
|
|
|
|
|
|
|
|
|
Income Taxes – Refer to Notes 1 and 14 to the financial statements.
Critical Audit Matter Description
The Company accounts for income taxes in accordance with accounting standards that require the recognition of the amount of taxes payable or refundable for the current year and an asset and liability approach in recognizing the amount of deferred tax liabilities and assets for the future tax consequences of events that have been currently recognized in the financial statements or tax returns. In each of the tax jurisdictions, the Company recognized a current tax liability or asset for the estimated taxes payable or refundable on tax returns for the current year and a deferred tax asset or liability for the estimated future tax effects attributable to temporary differences and carryforwards. The deferred tax liability balance was $47.5 million as of December 31, 2019 and income tax benefit recorded in 2019 was $44.8 million.
In several of the jurisdictions in which the Company operates, certain wholly-owned subsidiaries entered into agreements with other wholly-owned subsidiaries to provide specialized service and equipment. The Company applied transfer pricing methodologies to determine the amount to be charged for providing the services and equipment and utilized outside consultants to assist in the development of such transfer pricing methodologies. Each jurisdiction enacts laws, which, in many cases, allows for alternative transfer pricing methodologies, which may differ from the Company’s selected methodologies. Alternative transfer pricing methodologies, if applied, could result in different chargeable amounts.
Given the multiple jurisdictions in which the Company files tax returns and the complexity of the tax laws and regulations, and transfer pricing methodologies applied to wholly-owned subsidiary transactions, auditing management’s estimates of income taxes in foreign jurisdictions required a high degree of auditor judgment and an increased extent of effort, including the use of our tax specialists and audit teams in the local jurisdiction knowledgeable of the tax laws of the applicable country.
How the Critical Audit Matter Was Addressed in the Audit
Our audit procedures related to the Company’s application of transfer pricing methodologies, included the following, among others:
|
|
|
|
|
|
|
|
/s/ DELOITTE & TOUCHE LLP
Houston,TexasFebruary 11,2020
We have served as the Company’s auditor since 1989.
41
REPORTOFINDEPENDENTREGISTEREDPUBLICACCOUNTINGFIRM
Tothe stockholders and the BoardofDirectorsofDiamondOffshoreDrilling,Inc.
Opinion on Internal Control over Financial Reporting
We have audited the internal control over financial reporting of [Blank Company] [and subsidiaries] (the “Company”) as of December 31, 20x5, based on criteria established in Internal Control — Integrated Framework (2013) issued by the Committee of Sponsoring Organizations of the Treadway Commission (COSO). In our opinion, the Company maintained, in all material respects, effective internal control over financial reporting as of December 31, 20x5, based on criteria established in Internal Control — Integrated Framework (2013) issued by COSO.
We have audited the internal control over financial reporting of [Blank Company] [and subsidiaries] (the “Company”) as of December 31, 20x5, based on criteria established in Internal Control — Integrated Framework (2013) issued by the Committee of Sponsoring Organizations of the Treadway Commission (COSO). In our opinion, the Company maintained, in all material respects, effective internal control over financial reporting as of December 31, 20x5, based on criteria established in Internal Control — Integrated Framework (2013) issued by COSOWe have audited the internal control over financial reporting of Diamond Offshore Drilling, Inc. and subsidiaries (the “Company”) as of December 31, 2019, based on criteria established in Internal Control — Integrated Framework (2013) issued by the Committee of Sponsoring Organizations of the Treadway Commission (COSO). In our opinion, the Company maintained, in all material respects, effective internal control over financial reporting as of December 31, 2019, based on criteria established in Internal Control — Integrated Framework (2013) issued by COSO.
We have also audited, in accordance with the standards of the Public Company Accounting Oversight Board (United States) (PCAOB), the consolidated financial statements as of and for the year ended December 31, 2019, of the Company and our report dated February 11, 2020, expressed an unqualified opinion on those consolidated financial statements.
Basis for Opinion
The Company’s management is responsible for maintaining effective internal control over financial reporting and compliance with our adopted ethical standards. Our internal audit controls function maintains critical oversight over the key areas of our business and financial processes and controls, and provides reports directly to the Audit Committee. The committee has sole authority to directly appoint, retain, compensate, evaluate and terminate the independent auditor and to approve all engagement fees and terms for its assessmentthe independent auditor. The members of the effectivenesscommittee meet regularly with representatives of our independent auditor firm and with our manager of internal control overaudit without the presence of management.
We conducted our audit in accordance with the standards of the PCAOB. Those standards require that we plan and perform the audit to obtain reasonable assurance about whether effective internal control over financial reporting was maintained in all material respects. Our audit included obtaining an understanding of internal control over financial reporting, assessing the risk that a material weakness exists, testing and evaluating the design and operating effectiveness of internal control based on the assessed risk, and performing such other procedures as we considered necessary in the circumstances. We believe that our audit provides a reasonable basis for our opinion.
Definition and Limitations of Internal Control over Financial Reporting
A company’s internal control over financial reporting is a process designed to provide reasonable assurance regarding the reliability of financial reporting and the preparation of financial statements for external purposes in accordance with generally accepted accounting principles. A company’s internal control over financial reporting includes those policies and procedures that (1) pertain to the maintenance of records that, in reasonable detail, accurately and fairly reflect the transactions and dispositions of the assets of the company; (2) provide reasonable assurance that transactions are recorded as necessary to permit preparation of financial statements in accordance with generally accepted accounting principles, and that receipts and expenditures of the company are being made only in accordance with authorizations of management and directors of the company; and (3) provide reasonable assurance regarding prevention or timely detection of unauthorized acquisition, use, or disposition of the company’s assets that could have a material effect on the financial statements.
Because of its inherent limitations, internal control over financial reporting may not prevent or detect misstatements. Also, projections of any evaluation of effectiveness to future periods are subject to the risk that controls may become inadequate because of changes in conditions, or that the degree of compliance with the policies or procedures may deteriorate.
/s/ DELOITTE & TOUCHE LLP
Houston, Texas
February 11,2020
42
DIAMOND OFFSHORE DRILLING, INC.
AND SUBSIDIARIES
CONSOLIDATED BALANCE SHEETS
(In thousands, except share and per share data)
|
| December 31, |
| |||||
|
| 2019 |
|
| 2018 |
| ||
ASSETS |
|
|
|
|
|
|
|
|
Current assets: |
|
|
|
|
|
|
|
|
Cash and cash equivalents |
| $ | 156,281 |
|
| $ | 154,073 |
|
Marketable securities |
|
| — |
|
|
| 299,849 |
|
Accounts receivable, net of allowance for bad debts |
|
| 250,856 |
|
|
| 168,620 |
|
Prepaid expenses and other current assets |
|
| 68,658 |
|
|
| 163,396 |
|
Asset held for sale |
|
| 1,000 |
|
|
| — |
|
Total current assets |
|
| 476,795 |
|
|
| 785,938 |
|
Drilling and other property and equipment, net of accumulated depreciation |
|
| 5,152,828 |
|
|
| 5,184,222 |
|
Other assets |
|
| 204,421 |
|
|
| 65,534 |
|
Total assets |
| $ | 5,834,044 |
|
| $ | 6,035,694 |
|
LIABILITIES AND STOCKHOLDERS’ EQUITY |
|
|
|
|
|
|
|
|
Current liabilities: |
|
|
|
|
|
|
|
|
Accounts payable |
| $ | 68,586 |
|
| $ | 43,933 |
|
Accrued liabilities |
|
| 210,780 |
|
|
| 172,228 |
|
Taxes payable |
|
| 23,228 |
|
|
| 20,685 |
|
Total current liabilities |
|
| 302,594 |
|
|
| 236,846 |
|
Long-term debt |
|
| 1,975,741 |
|
|
| 1,973,922 |
|
Deferred tax liability |
|
| 47,528 |
|
|
| 104,380 |
|
Other liabilities |
|
| 275,971 |
|
|
| 135,893 |
|
Total liabilities |
|
| 2,601,834 |
|
|
| 2,451,041 |
|
Commitments and contingencies (Note 10) |
|
| — |
|
|
| — |
|
Stockholders’ equity: |
|
|
|
|
|
|
|
|
Preferred stock (par value $0.01, 25,000,000 shares authorized, NaN issued and outstanding) |
|
| — |
|
|
| — |
|
Common stock (par value $0.01, 500,000,000 shares authorized; 144,781,766 shares issued and 137,703,910 shares outstanding at December 31, 2019; 144,383,662 shares issued and 137,438,353 shares outstanding at December 31, 2018) |
|
| 1,448 |
|
|
| 1,444 |
|
Additional paid-in capital |
|
| 2,024,347 |
|
|
| 2,018,143 |
|
Retained earnings |
|
| 1,412,201 |
|
|
| 1,769,415 |
|
Accumulated other comprehensive (loss) gain |
|
| (18 | ) |
|
| 21 |
|
Treasury stock, at cost (7,077,856 and 6,945,309 shares of common stock at December 31, 2019 and 2018, respectively) |
|
| (205,768 | ) |
|
| (204,370 | ) |
Total stockholders’ equity |
|
| 3,232,210 |
|
|
| 3,584,653 |
|
Total liabilities and stockholders’ equity |
| $ | 5,834,044 |
|
| $ | 6,035,694 |
|
The accompanying notes are an integral part of the consolidated financial statements.
43
DIAMOND OFFSHORE DRILLING, INC.
AND SUBSIDIARIES
CONSOLIDATED STATEMENTS OF OPERATIONS
(In thousands, except per share data)
|
| Year Ended December 31, |
| |||||||||
|
| 2019 |
|
| 2018 |
|
| 2017 |
| |||
Revenues: |
|
|
|
|
|
|
|
|
|
|
|
|
Contract drilling |
| $ | 934,934 |
|
| $ | 1,059,973 |
|
| $ | 1,451,219 |
|
Revenues related to reimbursable expenses |
|
| 45,710 |
|
|
| 23,242 |
|
|
| 34,527 |
|
Total revenues |
|
| 980,644 |
|
|
| 1,083,215 |
|
|
| 1,485,746 |
|
Operating expenses: |
|
|
|
|
|
|
|
|
|
|
|
|
Contract drilling, excluding depreciation |
|
| 793,412 |
|
|
| 722,834 |
|
|
| 801,964 |
|
Reimbursable expenses |
|
| 45,016 |
|
|
| 22,917 |
|
|
| 33,744 |
|
Depreciation |
|
| 355,596 |
|
|
| 331,789 |
|
|
| 348,695 |
|
General and administrative |
|
| 67,878 |
|
|
| 85,351 |
|
|
| 74,505 |
|
Impairment of assets |
|
| — |
|
|
| 27,225 |
|
|
| 99,313 |
|
Restructuring and separation costs |
|
| — |
|
|
| 5,041 |
|
|
| 14,146 |
|
Loss (gain) on disposition of assets |
|
| 1,072 |
|
|
| 241 |
|
|
| (10,500 | ) |
Total operating expenses |
|
| 1,262,974 |
|
|
| 1,195,398 |
|
|
| 1,361,867 |
|
Operating (loss) income |
|
| (282,330 | ) |
|
| (112,183 | ) |
|
| 123,879 |
|
Other income (expense): |
|
|
|
|
|
|
|
|
|
|
|
|
Interest income |
|
| 6,382 |
|
|
| 8,477 |
|
|
| 2,473 |
|
Interest expense, net of amounts capitalized |
|
| (122,832 | ) |
|
| (123,240 | ) |
|
| (113,528 | ) |
Loss on extinguishment of senior notes |
|
| — |
|
|
| — |
|
|
| (35,366 | ) |
Foreign currency transaction loss |
|
| (3,936 | ) |
|
| (379 | ) |
|
| (1,128 | ) |
Other, net |
|
| 702 |
|
|
| 700 |
|
|
| 2,230 |
|
Loss before income tax benefit |
|
| (402,014 | ) |
|
| (226,625 | ) |
|
| (21,440 | ) |
Income tax benefit |
|
| 44,800 |
|
|
| 46,353 |
|
|
| 39,786 |
|
Net (loss) income |
| $ | (357,214 | ) |
| $ | (180,272 | ) |
| $ | 18,346 |
|
(Loss) earnings per share: |
|
|
|
|
|
|
|
|
|
|
|
|
Basic |
| $ | (2.60 | ) |
| $ | (1.31 | ) |
| $ | 0.13 |
|
Diluted |
| $ | (2.60 | ) |
| $ | (1.31 | ) |
| $ | 0.13 |
|
Weighted-average shares outstanding: |
|
|
|
|
|
|
|
|
|
|
|
|
Shares of common stock |
|
| 137,652 |
|
|
| 137,399 |
|
|
| 137,213 |
|
Dilutive potential shares of common stock |
|
| — |
|
|
| — |
|
|
| 52 |
|
Total weighted-average shares outstanding |
|
| 137,652 |
|
|
| 137,399 |
|
|
| 137,265 |
|
The accompanying notes are an integral part of the consolidated financial statements.
44
DIAMOND OFFSHORE DRILLING, INC.
AND SUBSIDIARIES
CONSOLIDATED STATEMENTS OF COMPREHENSIVE INCOME OR LOSS
(In thousands)
|
| Year Ended December 31, |
| |||||||||
|
| 2019 |
|
| 2018 |
|
| 2017 |
| |||
Net (loss) income |
| $ | (357,214 | ) |
| $ | (180,272 | ) |
| $ | 18,346 |
|
Other comprehensive gains (losses), net of tax: |
|
|
|
|
|
|
|
|
|
|
|
|
Derivative financial instruments: |
|
|
|
|
|
|
|
|
|
|
|
|
Reclassification adjustment for gain included in net (loss) income |
|
| (7 | ) |
|
| (6 | ) |
|
| (6 | ) |
Investments in marketable securities: |
|
|
|
|
|
|
|
|
|
|
|
|
Unrealized holding gain on investments |
|
| 23 |
|
|
| 69 |
|
|
| — |
|
Reclassification adjustment for gain included in net (loss) income |
|
| (55 | ) |
|
| (37 | ) |
|
| — |
|
Total other comprehensive (loss) gain |
|
| (39 | ) |
|
| 26 |
|
|
| (6 | ) |
Comprehensive (loss) income |
| $ | (357,253 | ) |
| $ | (180,246 | ) |
| $ | 18,340 |
|
The accompanying notes are an integral part of the consolidated financial statements.
45
DIAMOND OFFSHORE DRILLING, INC.
AND SUBSIDIARIES
CONSOLIDATED STATEMENTS OF STOCKHOLDERS’ EQUITY
(In thousands, except number of shares)
|
|
|
|
|
|
|
|
|
|
|
|
|
|
|
|
|
| Accumulated |
|
|
|
|
|
|
|
|
|
|
|
|
| |
|
|
|
|
|
|
|
|
|
| Additional |
|
|
|
|
|
| Other |
|
|
|
|
|
|
|
|
|
| Total |
| |||
|
| Common Stock |
|
| Paid-In |
|
| Retained |
|
| Comprehensive |
|
| Treasury Stock |
|
| Stockholders’ |
| ||||||||||||||
|
| Shares |
|
| Amount |
|
| Capital |
|
| Earnings |
|
| Gains (Losses) |
|
| Shares |
|
| Amount |
|
| Equity |
| ||||||||
December 31, 2016 |
|
| 143,997,757 |
|
| $ | 1,440 |
|
| $ | 2,004,514 |
|
| $ | 1,946,765 |
|
| $ | 1 |
|
|
| 6,828,094 |
|
| $ | (202,586 | ) |
| $ | 3,750,134 |
|
Impact of change in accounting principle |
|
| — |
|
|
| — |
|
|
| 634 |
|
|
| (634 | ) |
|
| — |
|
|
| — |
|
|
| — |
|
|
| — |
|
Adjusted balance at January 1, 2017 |
|
| 143,997,757 |
|
| $ | 1,440 |
|
| $ | 2,005,148 |
|
| $ | 1,946,131 |
|
| $ | 1 |
|
|
| 6,828,094 |
|
| $ | (202,586 | ) |
| $ | 3,750,134 |
|
Net income |
|
| — |
|
|
| — |
|
|
| — |
|
|
| 18,346 |
|
|
| — |
|
|
| — |
|
|
| — |
|
|
| 18,346 |
|
Anti-dilution adjustment |
|
| — |
|
|
| — |
|
|
| — |
|
|
| 20 |
|
|
| — |
|
|
| — |
|
|
| — |
|
|
| 20 |
|
Stock-based compensation, net of tax |
|
| 87,535 |
|
|
| 1 |
|
|
| 6,249 |
|
|
| — |
|
|
| — |
|
|
| 29,416 |
|
|
| (483 | ) |
|
| 5,767 |
|
Net loss on derivative financial instruments |
|
|
|
|
|
| — |
|
|
| — |
|
|
| — |
|
|
| (6 | ) |
|
| — |
|
|
| — |
|
|
| (6 | ) |
December 31, 2017 |
|
| 144,085,292 |
|
| $ | 1,441 |
|
| $ | 2,011,397 |
|
| $ | 1,964,497 |
|
| $ | (5 | ) |
|
| 6,857,510 |
|
| $ | (203,069 | ) |
| $ | 3,774,261 |
|
Impact of change in accounting principle |
|
| — |
|
|
| — |
|
|
| — |
|
|
| (14,812 | ) |
|
| — |
|
|
| — |
|
|
| — |
|
|
| (14,812 | ) |
Adjusted balance at January 1, 2018 |
|
| 144,085,292 |
|
| $ | 1,441 |
|
| $ | 2,011,397 |
|
| $ | 1,949,685 |
|
| $ | (5 | ) |
|
| 6,857,510 |
|
| $ | (203,069 | ) |
| $ | 3,759,449 |
|
Net loss |
|
| — |
|
|
| — |
|
|
| — |
|
|
| (180,272 | ) |
|
| — |
|
|
| — |
|
|
| — |
|
|
| (180,272 | ) |
Anti-dilution adjustment |
|
| — |
|
|
| — |
|
|
| — |
|
|
| 2 |
|
|
| — |
|
|
| — |
|
|
| — |
|
|
| 2 |
|
Stock options exercised |
|
| 3,773 |
|
|
| — |
|
|
| — |
|
|
| — |
|
|
| — |
|
|
| — |
|
|
| — |
|
|
| — |
|
Stock-based compensation, net of tax |
|
| 294,597 |
|
|
| 3 |
|
|
| 6,746 |
|
|
| — |
|
|
| — |
|
|
| 87,799 |
|
|
| (1,301 | ) |
|
| 5,448 |
|
Net loss on derivative financial instruments |
|
| — |
|
|
| — |
|
|
| — |
|
|
| — |
|
|
| (6 | ) |
|
| — |
|
|
| — |
|
|
| (6 | ) |
Net gain on investments |
|
| — |
|
|
| — |
|
|
| — |
|
|
| — |
|
|
| 32 |
|
|
| — |
|
|
| — |
|
|
| 32 |
|
December 31, 2018 |
|
| 144,383,662 |
|
| $ | 1,444 |
|
| $ | 2,018,143 |
|
| $ | 1,769,415 |
|
| $ | 21 |
|
|
| 6,945,309 |
|
| $ | (204,370 | ) |
| $ | 3,584,653 |
|
Net loss |
|
| — |
|
|
| — |
|
|
| — |
|
|
| (357,214 | ) |
|
| — |
|
|
| — |
|
|
| — |
|
|
| (357,214 | ) |
Stock-based compensation, net of tax |
|
| 398,104 |
|
|
| 4 |
|
|
| 6,204 |
|
|
| — |
|
|
| — |
|
|
| 132,547 |
|
|
| (1,398 | ) |
|
| 4,810 |
|
Net loss on derivative financial instruments |
|
| — |
|
|
| — |
|
|
| — |
|
|
| — |
|
|
| (7 | ) |
|
| — |
|
|
| — |
|
|
| (7 | ) |
Net loss on investments |
|
| — |
|
|
| — |
|
|
| — |
|
|
| — |
|
|
| (32 | ) |
|
| — |
|
|
| — |
|
|
| (32 | ) |
December 31, 2019 |
|
| 144,781,766 |
|
| $ | 1,448 |
|
| $ | 2,024,347 |
|
| $ | 1,412,201 |
|
| $ | (18 | ) |
|
| 7,077,856 |
|
| $ | (205,768 | ) |
| $ | 3,232,210 |
|
The accompanying notes are an integral part of the consolidated financial statements.
46
DIAMOND OFFSHORE DRILLING, INC.
AND SUBSIDIARIES
CONSOLIDATED STATEMENTS OF CASH FLOWS
(In thousands)
|
| Year Ended December 31, |
| |||||||||
|
| 2019 |
|
| 2018 |
|
| 2017 |
| |||
Operating activities: |
|
|
|
|
|
|
|
|
|
|
|
|
Net (loss) income |
| $ | (357,214 | ) |
| $ | (180,272 | ) |
| $ | 18,346 |
|
Adjustments to reconcile net (loss) income to net cash |
|
|
|
|
|
|
|
|
|
|
|
|
provided by operating activities: |
|
|
|
|
|
|
|
|
|
|
|
|
Depreciation |
|
| 355,596 |
|
|
| 331,789 |
|
|
| 348,695 |
|
Loss on impairment of assets |
|
| — |
|
|
| 27,225 |
|
|
| 99,313 |
|
Loss on extinguishment of senior notes |
|
| — |
|
|
| — |
|
|
| 35,366 |
|
Restructuring and separation costs |
|
| — |
|
|
| 1,478 |
|
|
| 14,146 |
|
Loss (gain) on disposition of assets |
|
| 1,072 |
|
|
| 241 |
|
|
| (10,500 | ) |
Deferred tax provision |
|
| (56,908 | ) |
|
| (75,993 | ) |
|
| (72,127 | ) |
Stock-based compensation expense |
|
| 6,208 |
|
|
| 6,749 |
|
|
| 6,250 |
|
Contract liabilities, net |
|
| 27,578 |
|
|
| 183 |
|
|
| 8,676 |
|
Contract assets, net |
|
| 2,625 |
|
|
| (6,221 | ) |
|
| — |
|
Deferred contract costs, net |
|
| 59,141 |
|
|
| 22,765 |
|
|
| 46,337 |
|
Long-term employee remuneration programs |
|
| 3,169 |
|
|
| 547 |
|
|
| 3,801 |
|
Other assets, noncurrent |
|
| 52 |
|
|
| (1,307 | ) |
|
| (326 | ) |
Other liabilities, noncurrent |
|
| 6,514 |
|
|
| (3,217 | ) |
|
| (963 | ) |
Other |
|
| 2,380 |
|
|
| 1,013 |
|
|
| 3,907 |
|
Changes in operating assets and liabilities: |
|
|
|
|
|
|
|
|
|
|
|
|
Accounts receivable |
|
| (37,832 | ) |
|
| 87,970 |
|
|
| (11,049 | ) |
Prepaid expenses and other current assets |
|
| (1,170 | ) |
|
| 6,211 |
|
|
| (1,291 | ) |
Accounts payable and accrued liabilities |
|
| 3,897 |
|
|
| (7,587 | ) |
|
| 19,803 |
|
Taxes payable |
|
| (6,019 | ) |
|
| 20,484 |
|
|
| (14,576 | ) |
Net cash provided by operating activities |
|
| 9,089 |
|
|
| 232,058 |
|
|
| 493,808 |
|
Investing activities: |
|
|
|
|
|
|
|
|
|
|
|
|
Capital expenditures (including rig construction) |
|
| (326,090 | ) |
|
| (222,406 | ) |
|
| (139,581 | ) |
Proceeds from disposition of assets, net of disposal costs |
|
| 16,217 |
|
|
| 70,067 |
|
|
| 15,196 |
|
Proceeds from sale and maturities of marketable securities |
|
| 2,300,000 |
|
|
| 1,600,000 |
|
|
| 35 |
|
Purchase of marketable securities |
|
| (1,996,996 | ) |
|
| (1,895,997 | ) |
|
| — |
|
Net cash used in investing activities |
|
| (6,869 | ) |
|
| (448,336 | ) |
|
| (124,350 | ) |
Financing activities: |
|
|
|
|
|
|
|
|
|
|
|
|
Redemption of senior notes |
|
| — |
|
|
| — |
|
|
| (500,000 | ) |
Payment of debt extinguishment costs |
|
| — |
|
|
| — |
|
|
| (34,395 | ) |
Proceeds from issuance of senior notes |
|
| — |
|
|
| — |
|
|
| 496,360 |
|
Repayment of short-term borrowings, net |
|
| — |
|
|
| — |
|
|
| (104,200 | ) |
Debt issuance costs and arrangement fees |
|
| (12 | ) |
|
| (5,651 | ) |
|
| (7,263 | ) |
Other |
|
| — |
|
|
| (35 | ) |
|
| (156 | ) |
Net cash used in financing activities |
|
| (12 | ) |
|
| (5,686 | ) |
|
| (149,654 | ) |
Net change in cash and cash equivalents |
|
| 2,208 |
|
|
| (221,964 | ) |
|
| 219,804 |
|
Cash and cash equivalents, beginning of year |
|
| 154,073 |
|
|
| 376,037 |
|
|
| 156,233 |
|
Cash and cash equivalents, end of year |
| $ | 156,281 |
|
| $ | 154,073 |
|
| $ | 376,037 |
|
The accompanying notes are an integral part of the consolidated financial statements.
47
DIAMOND OFFSHORE DRILLING, INC.
AND SUBSIDIARIES
NOTES TO CONSOLIDATED FINANCIAL STATEMENTS
1. General Information
Diamond Offshore Drilling, Inc. provides contract drilling services to the energy industry around the globe with a fleet of 15 offshore drilling rigs, consisting of 4 drillships and 11 semisubmersible rigs, including 2 rigs that are currently cold stacked. Our current fleet excludes the Ocean Confidence, which we expect to complete the sale of in the first quarter of 2020. See Note 8.
Unless the context otherwise requires, references in these Notes to “Diamond Offshore,” “we,” “us” or “our” mean Diamond Offshore Drilling, Inc. and our consolidated subsidiaries. We were incorporated in Delaware in 1989.
As of February 7, 2020, Loews Corporation, or Loews, owned approximately 53% of the outstanding shares of our common stock.
Principles of Consolidation
Our consolidated financial statements include the accounts of Diamond Offshore Drilling, Inc. and our wholly-owned subsidiaries after elimination of intercompany transactions and balances.
Use of Estimates in the Preparation of Financial Statements
The preparation of financial statements in conformity with accounting principles generally accepted in the United States, or U.S., or GAAP, requires management to make estimates and assumptions that affect the reported amounts of assets and liabilities and disclosure of contingent assets and liabilities at the date of the financial statements and the reported amount of revenues and expenses during the reporting period. Actual results could differ from those estimated.
Changes in Accounting Principles
Leases. In February 2016, the Financial Accounting Standards Board or FASB, issued Accounting Standards Update, or ASU, No. 2016-02, Leases (Topic 842), or ASU 2016-02, which (i) requires lessees to recognize a right of use asset and a lease liability on the balance sheet for most leases, (ii) updates previous accounting standards for lessors to align certain requirements with the updates to lessee accounting standards and the revenue recognition accounting standards and (iii) requires enhanced disclosure of qualitative and quantitative information about an entity's leasing arrangements.
We adopted ASU 2016-02 effective January 1, 2019 using an optional transition method requiring leases existing at, or entered into after, January 1, 2019 to be recognized and measured under the new accounting standard. Prior period amounts have not been adjusted and continue to be reflected in accordance with our historical accounting for leases. In our adoption of ASU 2016-02, we also utilized a transition practical expedient package whereby we did not reassess (i) whether any of our expired or existing contracts contain a lease, (ii) the classification for any expired or existing leases and (iii) initial direct costs for any existing leases. The adoption of this standard resulted in the recording of operating lease assets and offsetting operating lease liabilities of $146.8 million as of January 1, 2019, with no related impact on our annual Consolidated Statement of Stockholders’ Equity. See Note 11.
Upon adoption of ASU 2016-02, we concluded that our drilling contracts contain a lease component for the use of our drilling rigs based on the updated definition of a lease. However, ASU 2016-02 provides for a practical expedient for lessors whereby, under certain circumstances, the lessor may combine the lease and non-lease components and account for the combined component in accordance with the accounting treatment for the
48
predominant component. We have determined that our current drilling contracts qualify for this practical expedient and have combined the lease and service components of our standard drilling contracts. We continue to account for the combined component under ASU No. 2014-09, Revenue from Contracts with Customers (Topic 606) and its related amendments.
Revenue Recognition. In May 2014, the FASB issued ASU No. 2014-09, Revenue from Contracts with Customers (Topic 606), or ASU 2014-09, which superseded the revenue recognition requirements in ASU Topic 605, Revenue Recognition. Under the new guidance, revenue is recognized when a customer obtains control of promised goods or services and in an amount that reflects the consideration the entity expects to receive in exchange for those goods or services.
We adopted ASU 2014-09 and its related amendments, or collectively Topic 606, effective January 1, 2018 using the modified retrospective implementation method. Accordingly, we have applied the five-step method outlined in Topic 606 for determining when and how revenue is recognized to all contracts that were not completed as of the date of adoption. Revenues for reporting periods beginning after January 1, 2018 are presented under Topic 606, while prior period amounts have not been adjusted and continue to be reported under the previous revenue recognition guidance. For contracts that were modified before the effective date, we have considered the modification guidance within the new standard and determined that the revenue recognized and contract balances recorded prior to adoption for such contracts were not impacted. While Topic 606 requires additional disclosure of the nature, amount, timing and uncertainty of revenue and cash flows arising from contracts with customers, its adoption has not had a material impact on the measurement or recognition of our revenues.
Our adoption of ASU 2014-09 represents a change in accounting principle and therefore, we have recorded the cumulative effect of adopting Topic 606 as an increase to opening retained earnings on January 1, 2018. This adjustment represents an accrual for the earned portion of demobilization revenue expected to be received for contracts not completed as of December 31, 2017, which was not recordable under previous revenue recognition guidance until completion of the demobilization activities. See Note 2.
Income Taxes. In October 2016, the FASB issued ASU No. 2016-16, Income Taxes (Topic 740): Intra-Entity Transfers of Assets Other Than Inventory, or ASU 2016-16. ASU 2016-16 amended the guidance in Topic 740 with respect to the accounting for the income tax consequences of intra-entity transfers of assets other than inventory. We have evaluated our historical intra-group transactions for impact under the provisions of ASU 2016-16 and adopted the guidance thereof effective January 1, 2018 using the modified retrospective approach. We recorded the $17.4 million cumulative effect of applying the new standard as a decrease to opening retained earnings with an offset to deferred income tax liability. See Note 14.
Stock-Based Compensation. In March 2016, the FASB issued ASU No. 2016-09, Compensation - Stock Compensation (Topic 718), or ASU 2016-09, which required (i) recognition of excess tax benefits and tax deficiencies as discrete tax items in the condensed consolidated statement of operations when share-based awards vest or are settled, (ii) exclusion of excess tax benefits from the computation of assumed proceeds under the treasury stock method when calculating earnings per share, and (iii) presentation of excess tax benefits as an operating activity on the statement of cash flows rather than as a financing activity. The guidance also provides for a policy election to either estimate the number of awards expected to vest or account for forfeitures when they occur.
We adopted ASU 2016-09 on January 1, 2017 using a modified retrospective approach and have elected to account for forfeitures of share-based awards in the period in which such forfeitures occur. The adoption resulted in a $0.6 million reduction in opening retained earnings and an offsetting increase in additional paid-in capital.
Recent Accounting Pronouncements Not Yet Adopted
In June 2016, the FASB issued ASU No. 2016-13, Financial Instruments – Credit Losses (Topic 326): Measurement of Credit Losses on Financial Instruments, or ASU 2016-13. ASU 2016-13 requires changes to the recognition of credit losses on financial instruments not accounted for at fair value through net income, including loans, debt securities, trade receivables, net investments in leases and available-for-sale debt securities. The amended standard broadens the information that an entity must consider in developing its estimate of expected credit losses, requiring an entity to estimate credit losses over the life of an exposure based on historical information, current information and reasonable and supportable forecasts. The guidance is effective for interim and annual
49
periods beginning after December 15, 2019. We adopted ASU 2016-13 effective January 1, 2020 by applying a modified retrospective method and the impact was not material to our consolidated financial statements.
Cash and Cash Equivalents
We consider short-term, highly liquid investments that have an original maturity of three months or less and deposits in money market mutual funds that are readily convertible into cash to be cash equivalents.
The effect of exchange rate changes on cash balances held in foreign currencies was not material for the years ended December 31, 2019, 2018 and 2017.
Provision for Bad Debts
Prior to the adoption of ASU 2016-13, we have historically recorded a provision for bad debts on a case-by-case basis when facts and circumstances indicated that a customer receivable may not be collectible. In establishing these reserves, we considered historical and other factors that predicted collectability of such customer receivables, including write-offs, recoveries and the monitoring of credit quality. Such provision was reported as a component of “Operating expense” in our Consolidated Statements of Operations. See Note 4.
Drilling and Other Property and Equipment
We carry our drilling and other property and equipment at cost, less accumulated depreciation. Maintenance and routine repairs are charged to income currently while replacements and betterments that upgrade or increase the functionality of our existing equipment and that significantly extend the useful life of an existing asset are capitalized. Significant judgments, assumptions and estimates may be required in determining whether or not such replacements and betterments meet the criteria for capitalizationselecting director nominees; identifying, evaluating and in determining useful livesrecommending candidates and salvage valuesnominees for the Board, including consideration of such assets. Changes in these judgments, assumptionsany director candidates recommended by stockholders; and estimates could produce results that differ from those reported. During the years ended December 31, 2019developing and 2018, we capitalized $343.8 million and $243.6 million, respectively, in replacements and betterments of our drilling fleet.
Costs incurred for major rig upgrades and/or the construction of rigs are accumulated in construction work-in-progress, with no depreciation recorded on the additions, until the month the upgrade or newbuild is completed and the rig is placed in service. Upon retirement or sale of a rig, the cost and related accumulated depreciation are removed from the respective accounts and any gains or losses are reported in our Consolidated Statements of Operations as “Loss (gain) on disposition of assets.” Depreciation is recognized up to applicable salvage values by applying the straight-line method over the remaining estimated useful lives from the year the asset is placed in service. Drilling rigs and equipment are depreciated over their estimated useful lives ranging from 3 to 30 years.
Capitalized Interest
We capitalize interest cost for rig construction and other qualifying projects. A reconciliation of our total interest cost to “Interest expense, net of amounts capitalized” as reported in our Consolidated Statements of Operations is as follows (in thousands):
|
| For the Year Ended December 31, |
| |||||||||
|
| 2019 |
|
| 2018 |
|
| 2017 |
| |||
Total interest cost including amortization of debt issuance costs |
| $ | 122,832 |
|
| $ | 123,816 |
|
| $ | 113,618 |
|
Capitalized interest |
|
| — |
|
|
| (576 | ) |
|
| (90 | ) |
Total interest expense as reported |
| $ | 122,832 |
|
| $ | 123,240 |
|
| $ | 113,528 |
|
50
Impairment of Long-Lived Assets
We evaluate our property and equipment for impairment whenever changes in circumstances indicate that the carrying amount of an asset may not be recoverable (such as, but not limited to, cold stacking a rig, the expectation of cold stacking a rig in the near term, contracted backlog of less than one year for a rig, a decision to retire or scrap a rig, or excess spending over budget on a newbuild, construction project or major rig upgrade). We utilize an undiscounted probability-weighted cash flow analysis in testing an asset for potential impairment. Our assumptions and estimates underlying this analysis include the following:
|
|
|
|
|
|
|
|
|
|
|
|
|
|
Based on these assumptions, we develop a matrix for each rig under evaluation using multiple utilization/dayrate scenarios, to each of which we have assigned a probability of occurrence. We arrive at a projected probability-weighted cash flow for each rig based on the respective matrix and compare such amountrecommending to the carrying valueBoard director independence standards, succession plans for the CEO and corporate governance policies and practices. The duties of the asset to assess recoverability.
The underlying assumptionscommittee also include reviewing and assigned probabilities of occurrence for utilization and dayrate scenarios are developed using a methodology that examines historical data for each rig, which considers the rig’s age, rated water depth and other attributes and then assesses its future marketability in light of the current and projected market environment at the time of assessment. Other assumptions, such as operating, maintenance, inspection and reactivation costs, are estimated using historical data adjusted for known developments, cost projections for re-entry of rigs into the market and future events that are anticipated by management at the time of the assessment.
Management’s assumptions are necessarily subjective and are an inherent part of our asset impairment evaluation, and the use of different assumptions could produce results that differ from those reported. Our methodology generally involves the use of significant unobservable inputs, representative of a Level 3 fair value measurement, which may include assumptions related to future dayrate revenue, costs and rig utilization, quotes from rig brokers, the long-term future performance of our rigs and future market conditions. Management’s assumptions involve uncertainties about future demand for our services, dayrates, expenses and other future events, and management’s expectations may not be indicative of future outcomes. Significant unanticipated changes to these assumptions could materially alter our analysis in testing an asset for potential impairment. For example, changes in market conditions that exist at the measurement date or that are projected by management could affect our key assumptions. Other events or circumstances that could affect our assumptions may include, but are not limited to, a further sustained decline in oil and gas prices, cancelations of our drilling contracts or contracts of our competitors, contract modifications, costs to comply with new governmental regulations, capital expenditures required due to advances in offshore drilling technology, growth in the global oversupply of oil and geopolitical events, such as lifting sanctions on oil-producing nations. Should actual market conditions in the future vary significantly from market conditions used in our projections, our assessment of impairment would likely be different. See Note 3.
Fair Value of Financial Instruments
We believe that the carrying amount of our current financial instruments approximates fair value because of the short maturity of these instruments. See Note 7.
51
Debt Issuance Costs
Deferred costs associated with our credit facilities are presented in “Other assets” in our Consolidated Balance Sheets at December 31, 2019 and 2018 and amortized as interest expense over the respective terms of the credit facilities. During 2018, we paid $5.7 million in debt issuance and arrangement fees in connection with our credit facilities. Deferred costs associated with our senior notes are presented in our Consolidated Balance Sheets at December 31, 2019 and 2018 as a reductionmaking recommendations to the related long-term debt and are amortized over the respective terms of the related debt. See Note 9.
Income Taxes
We account for income taxes in accordance with accounting standards that require the recognition of the amount of taxes payable or refundable for the current year and an asset and liability approach in recognizing the amount of deferred tax liabilities and assets for the future tax consequences of events that have been currently recognized in our financial statements or tax returns. In each of our tax jurisdictions we recognize a current tax liability or asset for the estimated taxes payable or refundable on tax returns for the current year and a deferred tax asset or liability for the estimated future tax effects attributable to temporary differences and carryforwards. Deferred tax assets are reduced by a valuation allowance, if necessary, which is determined by the amount of any tax benefits that, based on available evidence, are not expected to be realized under a “more likely than not” approach. Deferred tax assets and liabilities are classified as noncurrent in a classified statement of financial position. We make judgments regarding future events and related estimates especially as they pertain to the forecasting of our effective tax rate, the potential realization of deferred tax assets such as utilization of foreign tax credits, and exposure to the disallowance of items deducted on tax returns upon audit.
We record both interest and penalties related to accrued uncertain tax positions in “Income tax benefit” in our Consolidated Statements of Operations. Liabilities for uncertain tax positions, including any interest and penalties, are denominated in the currency of the related tax jurisdiction and are revalued for changes in currency exchange rates. The revaluation of such liabilities for uncertain tax positions is reported in “Income tax benefit” in our Consolidated Statements of Operations. See Note 14.
Comprehensive (Loss) Income
Comprehensive (loss) income is the change in equity of a business enterprise during a period from transactions and other events and circumstances except those transactions resulting from investments by owners and distributions to owners. Comprehensive (loss) income for the three years ended December 31, 2019, 2018 and 2017 includes net (loss) income and unrealized holding gains and losses on marketable securities and financial derivatives designated as cash flow accounting hedges.
Foreign Currency
Our functional currency is the U.S. dollar. Transactions incurred in currencies other than the U.S. dollar are subject to gains or losses due to fluctuations in those currencies. We report foreign currency transaction gains and losses as “Foreign currency transaction (loss) gain” in our Consolidated Statements of Operations. The revaluation of assets and liabilities related to foreign income taxes, including deferred tax assets and liabilities and uncertain tax positions, including any interest and/or penalties, is reported in “Income tax benefit” in our Consolidated Statements of Operations.
52
2. Revenue from Contracts with Customers
The activities that primarily drive the revenue earned from our contract drilling services includes (i) providing a drilling rig and the crew and supplies necessary to operate the rig, (ii) mobilizing and demobilizing the rig to and from the drill site and (iii) performing rig preparation activities and/or modifications required for the contract. Consideration received for performing these activities may consist of dayrate drilling revenue, mobilization and demobilization revenue, contract preparation revenue and reimbursement revenue. We account for these integrated services provided within our drilling contracts as a single performance obligation satisfied over time and comprised of a series of distinct time increments in which we provide drilling services.
Consideration for activities that are not distinct within the context of our contracts and do not correspond to a distinct time increment within the contract term are allocated across the single performance obligation and recognized ratably over the initial term of the contract (which is the period we estimate to be benefited from the corresponding activities and generally ranges from two to 60 months). Consideration for activities that correspond to a distinct time increment within the contract term is recognized in the period when the services are performed. The total transaction price is determined for each individual contract by estimating both fixed and variable consideration expected to be earned over the term of the contract. See below for further discussion regarding the allocation of the transaction price to the remaining performance obligations.
The amount estimated for variable consideration may be constrained (reduced) and is only included in the transaction price to the extent that it is probable that a significant reversal of previously recognized revenue will not occur throughout the term of the contract. When determining if variable consideration should be constrained, management considers whether there are factors outside of our control that could result in a significant reversal of revenue as well as the likelihood and magnitude of a potential reversal of revenue. These estimates are re-assessed each reporting period as required.
Dayrate Drilling Revenue. Our drilling contracts generally provide for payment on a dayrate basis, with higher rates for periods when the drilling unit is operating and lower rates or zero rates for periods when drilling operations are interrupted or restricted. The dayrate invoices billed to the customer are typically determined based on the varying rates applicable to the specific activities performed on an hourly basis. Such dayrate consideration is allocated to the distinct hourly increment it relates to within the contract term, and therefore, recognized in line with the contractual rate billed for the services provided for any given hour.
Mobilization/Demobilization Revenue. We may receive fees (on either a fixed lump-sum or variable dayrate basis) for the mobilization and demobilization of our rigs. These activities are not considered to be distinct within the context of the contract and therefore, the associated revenue is allocated to the overall performance obligation and recognized ratably over the initial term of the related drilling contract. We record a contract liability for mobilization fees received, which is amortized ratably to contract drilling revenue as services are rendered over the initial term of the related drilling contract. Demobilization revenue expected to be received upon contract completion is estimated as part of the overall transaction price at contract inception and recognized in earnings ratably over the initial term of the contract with an offset to an accretive contract asset.
In some contracts, there is uncertainty as to the likelihood and amount of expected demobilization revenue to be received. For example, contractual provisions may require that a rig demobilize a certain distance before the demobilization revenue is payable or the amount may vary dependent upon whether or not the rig has additional contracted work within a certain distance from the wellsite. Therefore, the estimate for such revenue may be constrained, as described above, depending on the facts and circumstances pertaining to the specific contract. We assess the likelihood of receiving such revenue basedBoard on our past experiencecompany’s policies and knowledge of market conditions.
Contract Preparation Revenue. Some of our drilling contracts require downtime before the start of the contract to prepare the rig to meet customer requirements. At times, we may be compensated by the customer for such work (on either a fixed lump-sum or variable dayrate basis). These activities are not considered to be distinct within the context of the contract. We record a contract liability for contract preparation fees received, which is amortized ratably to contract drilling revenue over the initial term of the related drilling contract.
53
Capital Modification Revenue. From time to time, we may receive fees from our customers for capital improvements or upgrades to our rigs to meet contractual requirements (on either a fixed lump-sum or variable dayrate basis). The activities related to these capital modifications are not considered to be distinct within the context of our contracts. We record a contract liability for such fees and recognize them ratably as contract drilling revenue over the initial term of the related drilling contract.
Revenues Related to Reimbursable Expenses. We generally receive reimbursements from our customers for the purchase of supplies, equipment, personnel services and other services provided at their request in accordance with a drilling contract or other agreement. Such reimbursable revenue is variable and subject to uncertainty, as the amounts received and timing thereof are highly dependent on factors outside of our influence. Accordingly, reimbursable revenue is fully constrained and not included in the total transaction price until the uncertainty is resolved, which typically occurs when the related costs are incurred on behalf of a customer. We are generally considered a principal in such transactions and record the associated revenue at the gross amount billed to the customer, as “Revenues related to reimbursable expenses” in our Consolidated Statements of Operations. Such amounts are recognized ratably over the period within the contract term during which the corresponding goods and services are to be consumed.
Contract Balances
Accounts receivable are recognized when the right to consideration becomes unconditional based upon contractual billing schedules. Payment terms on invoiced amounts are typically 30 days. Contract asset balances consist primarily of demobilization revenue that we expect to receive and is recognized ratably throughout the contract term, but invoiced upon completion of the demobilization activities. Once the demobilization revenue is invoiced, the corresponding contract asset is transferred to accounts receivable. Contract assets may also include amounts recognized in advance of amounts invoiced due to the blending of rates when a contract has operating dayrates that increase over the initial contract term. Contract liabilities include payments received for mobilization as well as rig preparation and upgrade activities which are allocated to the overall performance obligation and recognized ratably over the initial term of the contract. Contract liabilities may also include amounts invoiced in advance of amounts recognized due to the blending of rates when a contract has operating dayrates that decrease over the initial contract term.
Contract balances are netted at a contract level, such that deferred revenue for mobilization, contract preparation and capital modifications (contract liabilities) is netted with any accrued demobilization revenue (contract asset) for each applicable contract.
The following table provides information about receivables, contract assets and contract liabilities from our contracts with customers (in thousands):
|
| December 31, 2019 |
|
| December 31, 2018 |
| ||
Trade receivables |
| $ | 199,572 |
|
| $ | 160,478 |
|
Current contract assets (1) |
|
| 6,314 |
|
|
| 6,832 |
|
Noncurrent contract assets (1) |
|
| — |
|
|
| 2,107 |
|
Current contract liabilities (deferred revenue) (1) |
|
| (9,573 | ) |
|
| (2,803 | ) |
Noncurrent contract liabilities (deferred revenue) (1) |
|
| (38,531 | ) |
|
| (17,723 | ) |
|
|
54
Significant changes in the contract assets and the contract liabilities balances during the period are as follows (in thousands):
|
| Net Contract Balances |
| |||||
|
| December 31, |
| |||||
|
| 2019 |
|
| 2018 |
| ||
Contract assets, beginning of period |
| $ | 8,939 |
|
| $ | 2,718 |
|
Contract liabilities, beginning of period |
|
| (20,526 | ) |
|
| (20,343 | ) |
Net balance at beginning of period |
|
| (11,587 | ) |
|
| (17,625 | ) |
Decrease due to amortization of revenue that was included in the beginning contract liability balance |
|
| 6,952 |
|
|
| 19,026 |
|
Increase due to cash received, excluding amounts recognized as revenue during the period |
|
| (34,529 | ) |
|
| (19,353 | ) |
Increase due to revenue recognized during the period but contingent on future performance |
|
| 3,537 |
|
|
| 7,114 |
|
Decrease due to transfer to receivables during the period |
|
| (5,119 | ) |
|
| (893 | ) |
Adjustments |
|
| (1,044 | ) |
|
| 144 |
|
Net balance at end of period |
| $ | (41,790 | ) |
| $ | (11,587 | ) |
Contract assets at end of period |
| $ | 6,314 |
|
| $ | 8,939 |
|
Contract liabilities at end of period |
|
| (48,104 | ) |
|
| (20,526 | ) |
Deferred Contract Costs
Certain direct and incremental costs incurred for upfront preparation, initial mobilization and modifications of contracted rigs represent costs of fulfilling a contract as they relate directly to a contract, enhance resources that will be used in satisfying our performance obligations in the future and are expected to be recovered. Such costs are deferred and amortized ratably to contract drilling expense as services are rendered over the initial term of the related drilling contract. Such deferred contract costs in the amount of $20.0 million and $4.0 million are reported in “Prepaid expenses and other current assets” and “Other assets,” respectively, in our Consolidated Balance Sheets at December 31, 2019. Deferred contract costs in the amount of $70.0 million and $13.1 million are reported in “Prepaid expenses and other current assets” and “Other assets,” respectively, in our Consolidated Balance Sheets at December 31, 2018. During the years ended December 31, 2019 and 2018, the amount of amortization of such costs was $96.0 million and $67.7 million, respectively. There was 0 impairment loss in relation to capitalized costs.
Costs incurred forsustainability-related matters, including health and safety, process safety, the demobilization of rigs at contract completion are recognized as incurred during the demobilization process. Costs incurred for rig modifications or upgrades required for a contract, which are considered to be capital improvements, are capitalized as drilling and other property and equipment and depreciated over the estimated useful life of the improvement.
Transaction Price Allocated to Remaining Performance Obligations
The following table reflects revenue expected to be recognized in the future related to unsatisfied performance obligations as of December 31, 2019 (in thousands):
|
|
|
| |||||||||||||
|
| For the Years Ending December 31, |
| |||||||||||||
|
| 2020 |
|
| 2021 |
|
| 2022 |
|
| Total |
| ||||
Mobilization and contract preparation revenue |
| $ | 2,268 |
|
| $ | 630 |
|
| $ | 124 |
|
| $ | 3,022 |
|
Capital modification revenue |
|
| 9,028 |
|
|
| 1,777 |
|
|
| — |
|
|
| 10,805 |
|
Blended rate revenue |
|
| 27,848 |
|
|
| 9,114 |
|
|
| — |
|
|
| 36,962 |
|
Total |
| $ | 39,144 |
|
| $ | 11,521 |
|
| $ | 124 |
|
| $ | 50,789 |
|
55
The revenue included above consists of expected fixed mobilization and upgrade revenue for both wholly and partially unsatisfied performance obligations as well as expected variable mobilization and upgrade revenue for partially unsatisfied performance obligations, which has been estimated for purposes of allocating across the entire corresponding performance obligations. Revenue expected to be recognized in the future related to the blending of rates when a contract has operating dayrates that decrease over the initial contract term is also included. The amounts are derived from the specific terms within drilling contracts that contain such provisions, and the expected timing for recognition of such revenue is based on the estimated start date and duration of each respective contract based on information known at December 31, 2019. The actual timing of recognition of such amounts may vary due to factors outside of our control. We have applied the disclosure practical expedient in Topic 606 and have not included estimated variable consideration related to wholly unsatisfied performance obligations or to distinct future time increments within our contracts, including dayrate revenue.
3. Asset Impairments
2019 Impairment Evaluation. At December 31, 2019, we evaluated 3 drilling rigs with indicators of impairment. Based on our assumptions and analysis at that time, we determined that the undiscounted probability-weighted cash flow of each of these rigs was in excess of its carrying value. As a result, we concluded that 0 impairment of these rigs had occurred at December 31, 2019.
2018 Impairment. During 2018, we recorded an impairment loss of $27.2 million to recognize a reduction in fair value of the Ocean Scepter. We estimated the fair value of the impaired rig using a market approach based on a signed agreement to sell the rig, less estimated costs to sell. We considered this valuation approach to be a Level 3 fair value measurement due to the level of estimation involved as the sale had not yet been completed at the time of our analysis.
2017 Impairments. During 2017, we evaluated 10 of our drilling rigs with indicators of impairment and determined that the carrying values of 3 rigs were impaired (we collectively refer to these three rigs as the 2017 Impaired Rigs).
We estimated the fair value of 2 of the 2017 Impaired Rigs using an income approach, whereby the fair value of each rig was estimated based on a calculation of the rig’s future net cash flows. These calculations utilized significant unobservable inputs, including estimated proceeds that may be received on ultimate disposition of each rig. The fair value of the remaining 2017 Impaired Rig was estimated using a market approach, which required us to estimate the value that would be received for the rig in the principal or most advantageous market for that rig in an orderly transaction between market participants. This estimate was primarily based on an indicative bid to purchase the rig at that time, as well as our evaluation of other market data points. Our fair value estimates were representative of Level 3 fair value measurements due to the significant level of estimation involved and the lack of transparency as to the inputs used.
We recorded aggregate impairment losses of $99.3 million for the year ended December 31, 2017 related to our 2017 Impaired Rigs.
See Note 1.
56
4. Supplemental Financial Information
Consolidated Balance Sheets Information
Accounts receivable, net of allowance for bad debts, consists of the following (in thousands):
|
| December 31, |
| |||||
|
| 2019 |
|
| 2018 |
| ||
Trade receivables |
| $ | 199,572 |
|
| $ | 160,478 |
|
Federal income tax receivable |
|
| 38,574 |
|
|
| — |
|
Value added tax receivables |
|
| 17,716 |
|
|
| 13,237 |
|
Related party receivables |
|
| 166 |
|
|
| 174 |
|
Other |
|
| 287 |
|
|
| 190 |
|
|
|
| 256,315 |
|
|
| 174,079 |
|
Allowance for bad debts |
|
| (5,459 | ) |
|
| (5,459 | ) |
Total |
| $ | 250,856 |
|
| $ | 168,620 |
|
There was noenvironment, climate change, in our provision for bad debts for each of the years ended December 31, 2019, 2018 and 2017. See Note 7 for a discussion of our policy regarding uncollectible accounts.
Prepaid expenses and other current assets consist of the following (in thousands):
|
| December 31, |
| |||||
|
| 2019 |
|
| 2018 |
| ||
Deferred contract costs |
| $ | 20,019 |
|
| $ | 70,021 |
|
Rig spare parts and supplies |
|
| 18,250 |
|
|
| 20,256 |
|
Prepaid taxes |
|
| 12,475 |
|
|
| 54,412 |
|
Current contract assets |
|
| 6,314 |
|
|
| 6,832 |
|
Prepaid rig costs |
|
| 2,990 |
|
|
| 5,247 |
|
Prepaid insurance |
|
| 2,892 |
|
|
| 2,742 |
|
Prepaid software costs |
|
| 2,319 |
|
|
| 1,531 |
|
Other |
|
| 3,399 |
|
|
| 2,355 |
|
Total |
| $ | 68,658 |
|
| $ | 163,396 |
|
Accrued liabilities consist of the following (in thousands):
|
| December 31, |
| |||||
|
| 2019 |
|
| 2018 |
| ||
Accrued capital project/upgrade costs |
| $ | 56,603 |
|
| $ | 37,379 |
|
Payroll and benefits |
|
| 42,494 |
|
|
| 47,564 |
|
Rig operating expenses |
|
| 37,969 |
|
|
| 42,323 |
|
Interest payable |
|
| 28,234 |
|
|
| 28,234 |
|
Current operating lease liability (1) |
|
| 20,030 |
|
|
| — |
|
Deferred revenue |
|
| 9,573 |
|
|
| 2,803 |
|
Personal injury and other claims |
|
| 7,074 |
|
|
| 5,544 |
|
Shorebase and administrative costs |
|
| 5,275 |
|
|
| 6,217 |
|
Other |
|
| 3,528 |
|
|
| 2,164 |
|
Total |
| $ | 210,780 |
|
| $ | 172,228 |
|
|
|
57
Consolidated Statements of Cash Flows Information
Noncash investing activities excluded from the Consolidated Statements of Cash Flows and other supplemental cash flow information is as follows (in thousands):
|
| December 31, |
| |||||||||
|
| 2019 |
|
| 2018 |
|
| 2017 |
| |||
Accrued but unpaid capital expenditures at period end |
| $ | 56,603 |
|
| $ | 37,234 |
|
| $ | 3,698 |
|
Common stock withheld for payroll tax obligations (1) |
|
| 1,398 |
|
|
| 1,301 |
|
|
| 483 |
|
Cash interest payments |
|
| 113,063 |
|
|
| 113,063 |
|
|
| 97,096 |
|
Cash income taxes paid (refunded), net: |
|
|
|
|
|
|
|
|
|
|
|
|
Foreign |
|
| 17,821 |
|
|
| 9,286 |
|
|
| 43,999 |
|
U.S. federal |
|
| 1,001 |
|
|
| (7,389 | ) |
|
| — |
|
State |
|
| (15 | ) |
|
| 2 |
|
|
| 94 |
|
|
|
5. Stock-Based Compensation
We have an Equity Incentive Compensation Plan, or Equity Plan, for our officers, independent contractors, employees and non-employee directors, which is designed to encourage stock ownership by such persons. Under the Equity Plan, we may grant both time-vesting and performance-vesting awards, which are earned on the achievement of certain performance criteria. The following types of awards may be granted under the Equity Plan:
|
|
|
|
|
|
|
|
|
|
|
|
A maximum of 7,500,000 shares of our common stock is available for the grant or settlement of awards under the Equity Plan, subject to adjustment for certain business transactions and changes in capital structure. Vesting conditions and other terms and conditions of awards under the Equity Plan are determined by our Board of Directors or the compensation committee of our Board of Directors, subject to the terms of the Equity Plan. RSUs may be issued with performance-vesting or time-vesting features. Except for RSUs issued to our Chief Executive Officer, RSUs are not participating securities, and the holders of such awards have no right to receive regular dividends if or when declared. However, we have not paid a dividend to stockholders since 2015.
Total compensation cost recognized for all awards under the Equity Plan (or its predecessor) for the years ended December 31, 2019, 2018 and 2017 was $6.2 million, $6.8 million and $8.7 million, respectively. Tax benefits recognized for the years ended December 31, 2019, 2018 and 2017 related thereto were $0.5 million, $0.8 million and $2.6 million, respectively. As of December 31, 2019 there was $6.6 million of total unrecognized compensation cost related to non-vested awards under the Equity Plan, which we expect to recognize over a weighted average period of two years.
58
Time-Vesting Awards
SARs. Currently, SARs awarded under the Equity Plan generally vest immediately and expire in ten years. The exercise price per share of SARs awarded under the Equity Plan may not be less than the fair market value of our common stock on the date of grant.
The fair value of SARs granted under the Equity Plan (or its predecessor) during each of the years ended December 31, 2019, 2018 and 2017 was estimated using the Black Scholes pricing model with the following weighted average assumptions:
|
| Year Ended December 31, |
| |||||||||
|
| 2019 |
|
| 2018 |
|
| 2017 |
| |||
Expected life of SARs (in years) |
|
| 7 |
|
|
| 7 |
|
|
| 7 |
|
Expected volatility |
|
| 39.35 | % |
|
| 32.10 | % |
|
| 31.70 | % |
Risk free interest rate |
|
| 2.11 | % |
|
| 2.56 | % |
|
| 2.09 | % |
The expected life of SARs is based on historical data as is the expected volatility. Risk free interest rates are determined using the U.S. Treasury yield curve at time of grant with a term equal to the expected life of the SARs.
A summary of SARs activity under the Equity Plan as of December 31, 2019 and changes during the year then ended is as follows:
|
| Number of Awards |
|
| Weighted- Average Exercise Price |
|
| Weighted- Average Remaining Contractual Term (Years) |
|
| Aggregate Intrinsic Value (In Thousands) |
| ||||
Awards outstanding at January 1, 2019 |
|
| 1,029,082 |
|
| $ | 54.08 |
|
|
|
|
|
|
|
|
|
Granted |
|
| 28,000 |
|
| $ | 8.57 |
|
|
|
|
|
|
|
|
|
Expired |
|
| (134,852 | ) |
| $ | 71.46 |
|
|
|
|
|
|
|
|
|
Awards outstanding at December 31, 2019 |
|
| 922,230 |
|
| $ | 50.19 |
|
|
| 3.6 |
|
| $ | — |
|
Awards exercisable at December 31, 2019 |
|
| 922,230 |
|
| $ | 50.19 |
|
|
| 3.6 |
|
| $ | — |
|
The weighted-average grant date fair values per share of awards granted during the years ended December 31, 2019, 2018 and 2017 were $3.75, $7.11 and $5.61, respectively. The total intrinsic value of awards exercised during the years ended December 31, 2019, 2018 and 2017 was $0, $0.1 million and $0, respectively. The total fair value of awards vested during the years ended December 31, 2019, 2018 and 2017 was $0.1 million, $0.7 million and $1.2 million, respectively.
Restricted Stock Units. RSUs are contractual rights to receive shares of our common stock in the future if the applicable vesting conditions are met. In 2019, 2018 and 2017, we granted an aggregate of 310,700, 135,759 and 276,085 time-vesting RSUs, respectively. One-half of each annual grant of time-vesting RSUs will vest two years from the date of grant and the remaining 50% will vest three years from the date of grant, conditioned upon continued employment through the applicable vesting date. The fair value of time-vesting RSUs granted under the Equity Plan was estimated based on the fair market value of our common stock on the date of grant.
59
A summary of activity for time-vesting RSUs under the Equity Plan as of December 31, 2019 and changes during the year then ended is as follows:
|
| Number of Awards |
|
| Weighted -Average Grant Date Fair Value Per Share |
| ||
Nonvested awards at January 1, 2019 |
|
| 422,059 |
|
| $ | 16.57 |
|
Granted |
|
| 310,700 |
|
| $ | 10.47 |
|
Vested |
|
| (174,774 | ) |
| $ | 18.20 |
|
Forfeited |
|
| (24,382 | ) |
| $ | 13.42 |
|
Nonvested awards at December 31, 2019 |
|
| 533,603 |
|
| $ | 12.58 |
|
The total fair value of time-vesting RSUs vested during the years ended December 31, 2019, 2018 and 2017 was $1.9 million, $1.9 million and $1.1 million, respectively.
Performance-Vesting Awards
Restricted Stock Units. In 2019, 2018 and 2017, we granted an aggregate of 190,634, 194,563 and 370,616 performance-vesting RSUs, respectively, which will vest upon achievement of certain performance goals as set forth in the individual award agreements over the three-year performance period beginning on January 1 in the year of grant. The shares of our common stock to be received upon the vesting of the performance-vesting RSUs will be delivered no later than March 15 of the year following completion of the three-year performance period. The fair value of performance-vesting RSUs granted under the Equity Plan to employees was estimated based on the fair market value of our common stock on the date of grant.
A summary of activity for performance-vesting RSUs under the Equity Plan as of December 31, 2019 and changes during the year then ended is as follows:
|
| Number of Awards |
|
| Weighted -Average Grant Date Fair Value Per Share |
| ||
Nonvested awards at January 1, 2019 |
|
| 741,973 |
|
| $ | 17.53 |
|
Granted |
|
| 190,634 |
|
| $ | 10.49 |
|
Vested |
|
| (223,330 | ) |
| $ | 21.44 |
|
Nonvested awards at December 31, 2019 |
|
| 709,277 |
|
| $ | 14.41 |
|
The total grant date fair value of the performance-vesting RSUs that vested during the years ended December 31, 2019, 2018 and 2017 was $2.3 million, $2.5 million and $0.3 million, respectively.
6. (Loss) Earnings Per Share
We present basic and diluted (loss) earnings per share on our Consolidated Statements of Operations. Basic (loss) earnings per share excludes dilution and is computed by dividing net (loss) income by the weighted-average number of common shares outstanding for the period. Diluted (loss) earnings per share reflects the potential dilution that could occur if securities or other contracts to issue common stock (common share equivalents) were exercised or converted into common stock, unless the effect would be antidilutive. For all periods in which we experience a net loss, all shares of common stock issuable upon exercise of outstanding stock appreciationhuman rights and vesting of outstanding restricted stock units have been excluded from the calculation of weighted-average shares because theirworkplace policies, security and emergency management, charitable and philanthropic activities, public advocacy and political donations, culture, inclusion would be antidilutive.
60
The following table sets forth the share effects of stock-based awards excluded from the computation of diluted (loss) earnings per share (in thousands).
|
| Year Ended December 31, |
| |||||||||
|
| 2019 |
|
| 2018 |
|
| 2017 |
| |||
Employee and director: |
|
|
|
|
|
|
|
|
|
|
|
|
SARs |
|
| 982 |
|
|
| 1,133 |
|
|
| 1,315 |
|
RSUs | �� |
| 1,205 |
|
|
| 1,153 |
|
|
| 757 |
|
7. Financial Instruments and Fair Value Disclosures
Concentrations of Credit and Market Risk
Financial instruments that potentially subject us to significant concentrations of credit or market risk consist primarily of periodic temporary investments of excess cash, trade accounts receivable and investments in debt securities. We generally place our excess cash investments in U.S. Treasury Bills and U.S. government-backed short-term money market instruments through several financial institutions. We periodically evaluate the relative credit standing of these financial institutions as part of our investment strategy.
Concentrations of credit risk with respect to our trade accounts receivable are limited, primarily due to the entities comprising our customer base. Since the market for our services is the offshore oil and gas industry, this customer base consists primarily of major and independent oil and gas companies, as well as government-owned oil companies. We believe that we have potentially significant concentrations of credit risk on the basis of the limited number of our rigs currently contracted and the smaller population of customers, as several customers have contracted for multiple rigs.
In general, before working for a customer with whom we have not had a prior business relationship and/or whose financial stability may be uncertain to us, we perform a credit review on that company. Based on that analysis, we may require that the customer present a letter of credit, prepay or provide other credit enhancements. Historically, we have recorded a provision for bad debts on a case-by-case basis when facts and circumstances indicated that a customer receivable may not be collectible. Losses on our trade receivables have been infrequent occurrences.
Fair Values
Fair value is defined as the exchange price that would be received for an asset or paid to transfer a liability (an exit price) in the principal or most advantageous market for the asset or liability in an orderly transaction between market participants on the measurement date. The fair value hierarchy prescribed by GAAP requires an entity to maximize the use of observable inputs and minimize the use of unobservable inputs when measuring fair value. There are three levels of inputs that may be used to measure fair value:
|
|
|
|
|
|
61
Certain of our assets and liabilities are required to be measured at fair value on a recurring basis in accordance with GAAP. In addition, certain assets and liabilities may be recorded at fair value on a nonrecurring basis. Generally, we record assets at fair value on a nonrecurring basis as a result of impairment charges. We recorded an impairment charge related to one of our drilling rigs, which was measured at fair value on a nonrecurring basis in 2018, and have presented the aggregate loss in “Impairment of assets” in our Consolidated Statements of Operations for the year ended December 31, 2018.
Assets measured at fair value are summarized below (in thousands).
|
| December 31, 2019 |
|
|
| |||||||||||||
|
| Fair Value Measurements Using |
|
|
| |||||||||||||
|
| Level 1 |
|
| Level 2 |
|
| Level 3 |
|
| Assets at Fair Value |
|
|
| ||||
Recurring fair value measurements: |
|
|
|
|
|
|
|
|
|
|
|
|
|
|
|
|
|
|
Money market funds |
| $ | 135,300 |
|
| $ | — |
|
| $ | — |
|
| $ | 135,300 |
|
|
|
Total short-term investments |
| $ | 135,300 |
|
| $ | — |
|
| $ | — |
|
| $ | 135,300 |
|
|
|
|
| December 31, 2018 |
| |||||||||||||||||
|
| Fair Value Measurements Using |
| |||||||||||||||||
|
| Level 1 |
|
| Level 2 |
|
| Level 3 |
|
| Assets at Fair Value |
|
| Total Losses for Year Ended (1) |
| |||||
Recurring fair value measurements: |
|
|
|
|
|
|
|
|
|
|
|
|
|
|
|
|
|
|
|
|
U.S. Treasury bills |
| $ | 299,900 |
|
| $ | — |
|
| $ | — |
|
| $ | 299,900 |
|
|
|
|
|
Money market funds |
|
| 135,800 |
|
|
| — |
|
|
| — |
|
|
| 135,800 |
|
|
|
|
|
Short-term investments |
| $ | 435,700 |
|
| $ | — |
|
| $ | — |
|
| $ | 435,700 |
|
|
|
|
|
Nonrecurring fair value measurements: |
|
|
|
|
|
|
|
|
|
|
|
|
|
|
|
|
|
|
|
|
Impaired assets |
| $ | — |
|
| $ | — |
|
| $ | — |
|
| $ | — |
|
| $ | 27,225 |
|
|
|
We believe that the carrying amounts of our other financial assets and liabilities (excluding long-term debt), which are not measured at fair value in our Consolidated Balance Sheets, approximate fair value based on the following assumptions:
|
|
|
|
62
diversity. Our senior notes are not measured at fair value; however, under the GAAP fair value hierarchy, our long-term debt would be considered Level 2 liabilities. The fair value of our senior notes was derived using a third-party pricing service at December 31, 2019 and 2018. We perform control procedures over information we obtain from pricing services and brokers to test whether prices received represent a reasonable estimate of fair value. These procedures include the review of pricing service or broker pricing methodologies and comparing fair value estimates to actual trade activity executed in the market for these instruments occurring generally within a 10-day period of the report date. Fair values and related carrying values of our senior notes (see Note 9) are shown below (in millions).
|
| December 31, 2019 |
|
| December 31, 2018 |
| ||||||||||
|
| Fair Value |
|
| Carrying Value |
|
| Fair Value |
|
| Carrying Value |
| ||||
3.45% Senior Notes due 2023 |
| $ | 212.5 |
|
| $ | 249.6 |
|
| $ | 185.0 |
|
| $ | 249.5 |
|
7.875% Senior Notes due 2025 |
|
| 435.0 |
|
|
| 497.1 |
|
|
| 415.0 |
|
|
| 496.8 |
|
5.70% Senior Notes due 2039 |
|
| 292.5 |
|
|
| 497.3 |
|
|
| 305.0 |
|
|
| 497.2 |
|
4.875% Senior Notes due 2043 |
|
| 408.8 |
|
|
| 749.0 |
|
|
| 416.3 |
|
|
| 748.9 |
|
We have estimated the fair value amounts by using appropriate valuation methodologies and information available to management. Considerable judgment is required in developing these estimates, and accordingly, no assurance can be given that the estimated values are indicative of the amounts that would be realized in a free market exchange.
8. Drilling and Other Property and Equipment
Cost and accumulated depreciation of drilling and other property and equipment are summarized as follows (in thousands):
|
| December 31, |
| |||||
|
| 2019 |
|
| 2018 |
| ||
Drilling rigs and equipment |
| $ | 8,004,489 |
|
| $ | 8,210,824 |
|
Land and buildings |
|
| 64,267 |
|
|
| 63,757 |
|
Office equipment and other |
|
| 92,289 |
|
|
| 91,819 |
|
Cost |
|
| 8,161,045 |
|
|
| 8,366,400 |
|
Less: accumulated depreciation |
|
| (3,008,217 | ) |
|
| (3,182,178 | ) |
Drilling and other property and equipment, net |
| $ | 5,152,828 |
|
| $ | 5,184,222 |
|
During 2019, we recognized an aggregate pre-tax loss of $1.1 million on the disposal of assets, which included a pre-tax gain on the sale of the Ocean Guardian of $14.3 million offset by an aggregate pre-tax loss of $15.4 million on the disposal of certain other property and equipment. In 2019, we also transferred the $1.0 million net book value of the Ocean Confidence, a previously impaired semisubmersible rig, to “Asset held for sale” in our Consolidated Balance Sheets at December 31, 2019. We expect to complete the sale of the rig in the first quarter of 2020 for a net gain of $3.5 million.
9. Credit Agreements and Senior Notes
Credit Agreements
In September 2012, we entered into a syndicated 5-year revolving credit agreement, which, as amended as of August 18, 2016, provided for a $1.5 billion senior unsecured revolving credit facility for general corporate purposes. On October 2, 2018, we entered into Amendment No. 6 and Consent to Credit Agreement and Successor Agency Agreement, or the Amendment, which amended our 5-year revolving credit agreement, dated as of September 28, 2012, as amended (we refer to such credit agreement as the Amended Credit Facility). Among other things, the Amendment reduced the aggregate principal amount of commitments under the credit facility to $325.0 million, of which $100.0 million of the commitments matured in 2019. The remaining $225.0 million of commitments mature on October 22, 2020 and are available, subject to the terms of the Amended Credit Facility, for revolving loans.
On October 2, 2018, Diamond Offshore Drilling, Inc., or DODI, as the U.S. borrower, and our subsidiary Diamond Foreign Asset Company, or DFAC, as the foreign borrower, entered into a senior 5-year revolving credit
63
agreement with a syndicate of lenders and Wells Fargo Bank, National Association, as administrative agent (we refer to such credit agreement as the $950 Million Credit Facility). The maximum amount of borrowings available under the $950 Million Credit Facility is $950.0 million and may be used for general corporate purposes, including investments, acquisitions and capital expenditures. The $950 Million Credit Facility, which matures on October 2, 2023, provides for a swingline subfacility of $100.0 million and a letter of credit subfacility of $250.0 million.
The entire amount of borrowings available under the $950 Million Credit Facility is available for loans to DFAC, and a portion of such amount is available for loans to DODI, based on a ratio as specified in the $950 Million Credit Facility. The obligations of DODI and DFAC under the $950 Million Credit Facility are each guaranteed by certain subsidiaries of DODI and DFAC, respectively, and 65% of the equity interest in DFAC is pledged as collateral for the obligations under the $950 Million Credit Facility.
The $950 Million Credit Facility includes restrictions on borrowing if, after giving effect to any such borrowings and the application of the proceeds thereof, the aggregate amount of available cash, as defined in the $950 Million Credit Facility, would exceed $500.0 million. In addition, the ability to borrow revolving loans under the $950 Million Credit Facility is conditioned on there being no unused commitments to advance loans under the Amended Credit Facility.
We refer to the Amended Credit Facility and $950 Million Credit Facility collectively as the Credit Agreements. At December 31, 2019, we had 0 borrowings outstanding under the Credit Agreements, however, in January 2020, a $6.0 million financial letter of credit was issued under the $950 Million Credit Facility in support of a previously issued surety bond. As of February 7, 2020, there was approximately $1.2 billion available under the Credit Agreements in the aggregate, subject to their respective terms.
Covenants
The Amended Credit Facility contains customary covenants, including, but not limited to, maintenance of a ratio of consolidated indebtedness to total capitalization, as defined in the Amended Credit Facility, of not more than 60% at the end of each fiscal quarter, as well as limitations on liens; mergers, consolidations, liquidation and dissolution; changes in lines of business; swap agreements; transactions with affiliates; and subsidiary indebtedness.
The $950 Million Credit Facility contains certain financial covenants, including (i) maintenance of a ratio of consolidated indebtedness to total capitalization not to exceed 60% at the end of each fiscal quarter, (ii) maintenance of a ratio of not less than 80% at the end of each fiscal quarter of (A) the aggregate value of certain rigs directly wholly owned by the borrowers and subsidiary guarantors to (B) the aggregate value of substantially all rigs owned by us and (iii) maintenance of a ratio of not less than 3:00 to 1:00 at the end of each fiscal quarter of (A) the sum of the aggregate value of all marketed rigs, as defined in the $950 Million Credit Facility, wholly owned directly by DFAC and certain foreign guarantors, as specified in the $950 Million Credit Facility, plus the value of the Ocean Valiant at any time when it is a marketed rig owned by a guarantor to (B) the sum of commitments under the $950 Million Credit Facility, the outstanding loans and letter of credit exposures under the Amended Credit Facility plus certain other indebtedness of DFAC and certain foreign guarantors, as specified in the $950 Million Credit Facility.
The $950 Million Credit Facility also contains additional covenants generally applicable to DODI and its subsidiaries that we consider usual and customary for an agreement of this type, including a limit on the payment of dividends if certain minimum cash balances are not maintained.
The Credit Agreements provide for customary events of default including, among others, a cross-default provision with respect to DODI’s and its subsidiaries’ other indebtedness in excess of $100.0 million. At December 31, 2019, we were in compliance with all covenant requirements under the Credit Agreements.
Interest Rates and Fees
Revolving loans under the Credit Agreements bear interest, at our option, at a rate per annum based on either an alternate base rate, or ABR, or a Eurodollar Rate, as defined in the applicable Credit Agreement, plus the applicable interest margin for an ABR loan or a Eurodollar loan (determined based on our credit ratings). Swingline loans under the $950 Million Credit Facility bear interest, at our option, at a rate per annum equal to (i) the ABR plus the applicable
64
interest margin for ABR loans or (ii) the daily one-month Eurodollar Rate plus the applicable interest margin for Eurodollar loans.
Under the Credit Agreements, we also pay, based on our current long-term credit ratings, and as applicable, other customary fees including, but not limited to, a commitment fee on the unused commitments under each of the Credit Agreements and a fronting fee to the issuing bank for each letter of credit. Participation fees for letters of credit are dependent upon the type of letter of credit issued.
The following summarizes the interest rate margins and fees payable under the Credit Agreements, based on our current long-term credit ratings:
|
| |||
| ||||
|
|
| ||
|
|
| ||
|
|
| ||
| ||||
|
|
| ||
|
|
| ||
|
|
|
Favorable changes in our current credit ratings could lower the interest rate margins and fees that we pay under the Credit Agreements; however, current interest rates and fees under the Credit Agreements will apply should there be any further downgrade in our credit ratings.
Senior Notes
At December 31, 2019, our senior notes were comprised of the following debt issues (dollars in millions):
|
|
|
|
|
|
|
|
|
|
|
|
|
|
|
| Semiannual |
|
| Principal |
|
|
|
| Interest Rate |
|
| Interest Payment | ||||||
Debt Issue |
| Amount |
|
| Maturity Date |
| Coupon |
|
| Effective |
|
| Dates | |||
3.45% Senior Notes due 2023 |
| $ | 250.0 |
|
| November 1, 2023 |
|
| 3.45 | % |
|
| 3.50 | % |
| May 1 and November 1 |
7.875% Senior Notes due 2025 |
| $ | 500.0 |
|
| August 15, 2025 |
|
| 7.875 | % |
|
| 8.00 | % |
| February 15 and August 15 |
5.70% Senior Notes due 2039 |
| $ | 500.0 |
|
| October 15, 2039 |
|
| 5.70 | % |
|
| 5.75 | % |
| April 15 and October 15 |
4.875% Senior Notes due 2043 |
| $ | 750.0 |
|
| November 1, 2043 |
|
| 4.875 | % |
|
| 4.89 | % |
| May 1 and November 1 |
65
At December 31, 2019 and 2018, the carrying value of our senior notes, net of unamortized discount and debt issuance costs, was as follows (in thousands):
|
| December 31, |
| |||||
|
| 2019 |
|
| 2018 |
| ||
3.45% Senior Notes due 2023 |
| $ | 248,759 |
|
| $ | 248,455 |
|
7.875% Senior Notes due 2025 |
|
| 491,655 |
|
|
| 490,491 |
|
5.70% Senior Notes due 2039 |
|
| 493,316 |
|
|
| 493,139 |
|
4.875% Senior Notes due 2043 |
|
| 742,011 |
|
|
| 741,837 |
|
Total senior notes, net |
| $ | 1,975,741 |
|
| $ | 1,973,922 |
|
As of December 31, 2019, the aggregate annual maturity of our senior notes, excluding net unamortized discounts and debt issuance costs of $7.0 million and $17.3 million, respectively, was as follows (in thousands):
|
| Aggregate Principal Amount |
| |
Year Ending December 31, |
|
|
|
|
2020 |
| $ | — |
|
2021 |
|
| — |
|
2022 |
|
| — |
|
2023 |
|
| 250,000 |
|
2024 |
|
| — |
|
Thereafter |
|
| 1,750,000 |
|
Total maturities of senior notes |
| $ | 2,000,000 |
|
Notes Redemption. In August 2017, we redeemed all of our outstanding 5.875% senior notes due 2019, or 2019 Notes, for a redemption price of $543.0 million in the aggregate, including accrued and unpaid interest to the date of redemption. We accounted for the redemption as an extinguishment of debt and reported a corresponding loss of $35.4 million in our Consolidated Statements of Operations.
Senior Notes Due 2025. In August 2017, we issued $500.0 million aggregate principal amount of unsecured 7.875% senior notes due 2025, or 2025 Notes, and received net proceeds of $489.1 million after deduction of underwriter discounts, commissions and expenses. We used the net proceeds from the 2025 Notes, together with cash on hand, to fund the redemption of our previously outstanding 2019 Notes. The 2025 Notes are unsecured obligations of DODI, and rank equally in right of payment to all of its existing and future senior indebtedness, and are structurally subordinated to all existing and future obligations of our subsidiaries. We have the right to redeem some or all of the 2025 Notes at any time or from time to time, on at least 15 days but not more than 60 days prior written notice, at the applicable redemption price specified in the governing indenture, plus accrued and unpaid interest to, but excluding, the date of redemption.
Senior Notes Due 2023 and 2043. Our 3.45% Senior Notes due 2023 and 4.875% Senior Notes due 2043 are unsecured and unsubordinated obligations of DODI, and rank equally in right of payment to all of its existing and future unsecured and unsubordinated indebtedness, and are effectively subordinated to all existing and future obligations of our subsidiaries. We have the right to redeem all or a portion of these notes for cash at any time or from time to time, on at least 15 days but not more than 60 days prior written notice, at a make-whole redemption price specified in the governing indenture (if applicable) plus accrued and unpaid interest to, but excluding, the date of redemption.
Senior Notes Due 2039. Our 5.70% Senior Notes due 2039 are unsecured and unsubordinated obligations of DODI, and rank equally in right of payment to all of its existing and future unsecured and unsubordinated indebtedness, and are effectively subordinated to all existing and future obligations of our subsidiaries. We have the right to redeem all or a portion of these notes for cash at any time or from time to time, on at least 15 days but not more than 60 days prior written notice, at the redemption price specified in the governing indenture plus accrued and unpaid interest to the date of redemption.
The 2025 Notes, 3.45% Senior Notes due 2023, 4.875% Senior Notes due 2043 and 5.70% Senior Notes due 2039 contain customary covenants including limitations on liens, mergers, consolidations and certain sales of assets and on entering into sale and lease-back transactions covering a drilling rig or drillship, as specified in each governing indenture. As of December 31, 2019, we were in compliance with all of these covenants.
10. Commitments and Contingencies
Various claims have been filed against us in the ordinary course of business, including claims by offshore workers alleging personal injuries. With respect to each claim or exposure, we have made an assessment, in accordance with GAAP, of the probability that the resolution of the matter would ultimately result in a loss. When we determine that an unfavorable resolution of a matter is probable and such amount of loss can be determined, we record a liability for the amount of the estimated loss at the time that both of these criteria are met. Our management believes that we have recorded adequate accruals for any liabilities that may reasonably be expected to result from these claims.
Asbestos Litigation. We are one of several unrelated defendants in lawsuits filed in Louisiana state courts alleging that defendants manufactured, distributed or utilized drilling mud containing asbestos and, in our case, allowed such drilling mud to have been utilized aboard our drilling rigs. The plaintiffs seek, among other things, an award of unspecified compensatory and punitive damages. The manufacture and use of asbestos-containing drilling mud had already ceased before we acquired any of the drilling rigs addressed in these lawsuits. We believe that we are not liable for the damages asserted in the lawsuits pursuant to the terms of our 1989 asset purchase agreement with Diamond M Corporation. We are unable to estimate our potential exposure, if any, to these lawsuits at this time but do not believe that our ultimate liability, if any, resulting from this litigation will have a material effect on our financial condition, results of operations and cash flows, including negative cash flows.
Non-Income Tax and Related Claims. We have received assessments related to, or otherwise have exposure to, non-income tax items such as sales-and-use tax, value-added tax, ad valorem tax, custom duties, and other similar taxes in various taxing jurisdictions. We have determined that we have a probable loss for these taxes and the related penalties and interest and, accordingly, have recorded a $16.1 million and $12.3 million liability at December 31, 2019 and 2018, respectively. We intend to defend these matters vigorously; however, the ultimate outcome of these assessments and exposures could result in additional taxes, interest and penalties for which the fully assessed amounts would have a material adverse effect on our financial statements
Other Litigation. We have been named in various other claims, lawsuits or threatened actions that are incidental to the ordinary course of our business, including a claim by one of our customers in Brazil, Petróleo Brasileiro S.A., or Petrobras, that it will seek to recover from its contractors, including us, any taxes, penalties, interest and fees that it must pay to the Brazilian tax authorities for our applicable portion of withholding taxes related to Petrobras’ charter agreements with its contractors. We intend to defend these matters vigorously; however, litigation is inherently unpredictable, and the ultimate outcome or effect of any claim, lawsuit or action cannot be predicted with certainty. As a result, there can be no assurance as to the ultimate outcome of any litigation matter. Any claims against us, whether meritorious or not, could cause us to incur significant costs and expenses and require significant amounts of management and operational time and resources. In the opinion of our management, no such pending or known threatened claims, actions or proceedings against us are expected to have a material adverse effect on our consolidated financial position, results of operations or cash flows.
Personal Injury Claims. Under our current insurance policies, our deductibles for marine liability insurance coverage with respect to personal injury claims not related to named windstorms in the U.S. Gulf of Mexico, which primarily result from Jones Act liability in the U.S. Gulf of Mexico, are $5.0 million for the first occurrence and vary in amounts ranging between $5.0 million and, if aggregate claims exceed certain thresholds, up to $100.0 million for each subsequent occurrence, depending on the nature, severity and frequency of claims that might arise during the policy year. Our deductibles for personal injury claims arising due to named windstorms in the U.S. Gulf of Mexico are $25.0 million for the first occurrence and vary in amounts ranging between $25.0 million and, if
67
aggregate claims exceed certain thresholds, up to $100.0 million for each subsequent occurrence, depending on the nature, severity and frequency of claims that might arise during the policy year.
The Jones Act is a federal law that permits seamen to seek compensation for certain injuries during the course of their employment on a vessel and governs the liability of vessel operators and marine employers for the work-related injury or death of an employee. We engage outside consultants to assist us in estimating our aggregate liability for personal injury claims based on our historical losses and utilizing various actuarial models. We allocate a portion of the aggregate liability to “Accrued liabilities” based on an estimate of claims expected to be paid within the next twelve months with the residual recorded as “Other liabilities.” At December 31, 2019, our estimated liability for personal injury claims was $17.4 million, of which $6.4 million and $11.0 million were recorded in “Accrued liabilities” and “Other liabilities,” respectively, in our Consolidated Balance Sheets. At December 31, 2018, our estimated liability for personal injury claims was $27.9 million, of which $5.2 million and $22.7 million were recorded in “Accrued liabilities” and “Other liabilities,” respectively, in our Consolidated Balance Sheets. The eventual settlement or adjudication of these claims could differ materially from our estimated amounts due to uncertainties such as:
|
|
|
|
|
|
|
|
|
|
Purchase Obligations. At December 31, 2019, we had 0 purchase obligations for major rig upgrades or any other significant obligations, except for those related to our direct rig operations, which arise during the normal course of business.
Services Agreement. In February 2016, we entered into a ten-year agreement with a subsidiary of Baker Hughes Company (formerly named Baker Hughes, a GE company), or Baker Hughes, to provide services with respect to certain blowout preventer and related well control equipment, or Well Control Equipment, on our drillships. Such services include management of maintenance, certification and reliability with respect to such equipment. Future commitments under the contractual services agreements are estimated to be approximately $39 million per year or an estimated $250 million in the aggregate over the remaining term of the agreements.
In addition, we lease Well Control Equipment for our drillships under ten-year operating leases. See Note 11.
Letters of Credit and Other. We were contingently liable as of December 31, 2019 in the amount of $37.1 million under certain tax, performance, supersedeas, VAT and customs bonds and letters of credit. Agreements relating to approximately $28.5 million of customs, tax, VAT and supersedeas bonds can require collateral at any time, while the remaining agreements, aggregating $8.6 million, cannot require collateral except in events of default. As of December 31, 2019, we had not been required to make any collateral deposits with respect to these agreements. However, in January 2020, we were required to issue a $6.0 million financial letter of credit as collateral in support of our outstanding surety bonds.
11. Leases and Lease Commitments
Our leasing activities primarily consist of operating leases for shorebase offices, office and information technology equipment, employee housing, vehicles, onshore storage yards and certain rig equipment and tools. Our leases have terms ranging from one month to ten years, some of which include options to extend the lease for up to five years and/or to terminate the lease within one year.
Additionally, we are participants in four sale and leaseback arrangements with a subsidiary of Baker Hughes pursuant to the 2016 sale of Well Control Equipment on our drillships and corresponding agreements to lease back that equipment under ten-year operating leases for approximately $26 million per year in the aggregate with renewal options for two successive five-year periods. At the time of the transactions with Baker Hughes, the carrying value of the Well Control Equipment exceeded the aggregate proceeds received from the sale, resulting in the recognition
68
of prepaid rent, which was being amortized over the respective terms of the leases. On January 1, 2019, as a result of the adoption of ASU 2016-02, the aggregate remaining prepaid rent balances of $3.9 million and $10.6 million, previously recorded as “Prepaid expenses and other current assets” and “Other assets,” respectively, were reclassified to a right-of-use lease asset within “Other assets” in our Consolidated Balance Sheets and continue to be amortized over the remaining terms of the leases.
In applying ASU 2016-02, we utilized an exemption for short-term leases whereby we did not record leases with terms of one year or less on the balance sheet. We have also made an accounting policy election not to separate lease components from non-lease components for each of our classes of underlying assets, except for subsea equipment, which includes the Well Control Equipment discussed above. At inception, the consideration for the overall Well Control Equipment arrangement was allocated between the lease and service components based on an estimation of stand-alone selling price of each component, which maximized observable inputs. The costs associated with the service portion of the agreement are accounted for separately from the cost attributable to the equipment leases based on that allocation and thus, are not included in our right-of-use lease asset or lease liability balances. The non-lease components for each of our other classes of assets generally relate to maintenance, monitoring and security services and are not separated from their respective lease components. See Note 10.
The lease term used for calculating our right-of-use assets and lease liabilities is determined by considering the noncancelable lease term, as well as any extension options that we are reasonably certain to exercise. The determination to include option periods is generally made by considering the activity in the region or for the rig corresponding to the respective lease, among other contract-based and market-based factors. We have used our incremental borrowing rate to discount future lease payments as the rate implicit in our leases is not readily determinable. To arrive at our incremental borrowing rate, we consider our unsecured borrowings and then adjust those rates to assume full collateralization and to factor in the individual lease term and payment structure.
Total operating lease expense for the year ended December 31, 2019 was $39.7 million of which $3.4 million related to short-term leases. Total operating lease expense for the years ended December 31, 2018 and 2017 was $30.1 million and $30.6 million, respectively.
Supplemental information related to leases is as follows (in thousands, except weighted-average data):
|
| Year Ended December 31, 2019 |
| |
Operating cash flows used for operating leases |
| $ | 39,561 |
|
Right-of-use assets obtained in exchange for lease liabilities |
|
| 26,248 |
|
Weighted-average remaining lease term |
| 6.7 years |
| |
Weighted-average discount rate |
|
| 8.68 | % |
Future minimum rental payments under noncancelable operating leases as of December 31, 2018 were as follows (in thousands):
2019 |
| $ | 28,373 |
|
2020 |
|
| 27,144 |
|
2021 |
|
| 26,565 |
|
2022 |
|
| 26,281 |
|
2023 |
|
| 26,280 |
|
Thereafter |
|
| 64,062 |
|
Total lease payments |
| $ | 198,705 |
|
69
Maturities of lease liabilities as of December 31, 2019 are as follows (in thousands):
2020 |
| $ | 32,888 |
|
2021 |
|
| 30,548 |
|
2022 |
|
| 29,973 |
|
2023 |
|
| 29,499 |
|
2024 |
|
| 29,580 |
|
Thereafter |
|
| 51,784 |
|
Total lease payments |
|
| 204,272 |
|
Less: interest |
|
| (50,348 | ) |
Total lease liability |
| $ | 153,924 |
|
Amounts recognized in Consolidated Balance Sheets: |
|
|
|
|
Accrued liabilities |
| $ | 20,030 |
|
Other liabilities |
|
| 133,894 |
|
Total operating lease liability |
| $ | 153,924 |
|
Operating lease assets, including prepaid rent balances related to the Baker Hughes transaction, totaling $169.2 million are included in “Other assets” in our Consolidated Balance Sheets as of December 31, 2019.
As of December 31, 2019, we had an additional operating lease for mooring equipment to be used on a rig that had not yet commenced. The agreement, which commenced in January 2020, provides for fixed lease payments of approximately $5 million in the aggregate to be paid over a lease term of 5 years.
12. Related-Party Transactions
Transactions with Loews. We are party to a services agreement with Loews, or the Services Agreement, pursuant to which Loews performs certain administrative and technical services on our behalf. Such services include internal auditing services and advice and assistance with respect to obtaining insurance. Under the Services Agreement, we are required to reimburse Loews for (i) allocated personnel cost (such as salaries, employee benefits and payroll taxes) of the Loews personnel actually providing such services and (ii) all out-of-pocket expenses related to the provision of such services. The Services Agreement may be terminated at our option upon 30 days’ notice to Loews and at the option of Loews upon six months’ notice to us. In addition, we have agreed to indemnify Loews for all claims and damages arising from the provision of services under the Services Agreement unless due to the gross negligence or willful misconduct of Loews. We were charged $0.7 million, $0.6 million and $1.0 million by Loews for these support functions during the years ended December 31, 2019, 2018 and 2017, respectively.
13. Restructuring and Separation Costs
In late 2017, in response to expectations at the time that a recovery of the offshore drilling market would not occur in the near term, combined with changes to the size and composition of our drilling fleet since 2015, we reviewed our global cost and organizational structure, including the way in which we market our services in certain countries. As a result, our management approved and initiated a reduction in workforce at our onshore bases and corporate facilities, as well as the negotiation of a termination of our agency agreement in Brazil. We incurred $14.1 million in restructuring and employee separation related costs during 2017, including $11.5 million related to the termination of our Brazilian agency agreement. During 2018, we incurred an additional $5.0 million in severance and related costs for redundant employees identified in 2018 in connection with the restructuring plan and paid $12.4 million in previously accrued costs. During 2019, all remaining obligations under the restructuring plan were settled.
14. Income Taxes
Several of our rigs are owned by Swiss branches of entities incorporated in the U.K. that have historically been taxed under a special tax regime pursuant to Swiss corporate income tax rules. On September 3, 2019, the Swiss federal government, along with the Canton of Zug, enacted tax legislation, which we refer to as Swiss Tax Reform, effective as of January 1, 2020. Swiss Tax Reform significantly changed Swiss corporate income tax rules by,
70
among other things, abolishing special tax regimes. The legislation also provides transition rules under which companies can maintain their current basis of taxation through January 1, 2022.
The abolition of special tax regimes will require us to determine our Swiss tax liability on a net income basis beginning on January 1, 2022, thus also requiring deferred taxes to be computed on the difference between the Swiss tax basis and U.S. GAAP basis of certain items, including property, plant and equipment. There are still many uncertainties in the application of Swiss Tax Reform, including the values to be used to measure depreciable property. Therefore, we have recorded a $74.2 million net deferred tax asset for the difference in basis of certain of our rigs between Swiss tax and U.S. GAAP, offset, where appropriate, by a reserve for an uncertain tax position. As further clarification is issued by the Swiss tax authorities, deferred tax balances and the reserve for uncertain tax positions may need to be adjusted. The potential changes could have a material effect on our consolidated financial statements.
In 2019, the Internal Revenue Service, or IRS, issued final regulations with respect to the calculation of the toll charge associated with the deemed repatriation of previously deferred earnings of our non-U.S. subsidiaries, or Transition Tax, in response to the Tax Cuts and Jobs Act enacted in 2017, commonly referred to as the Tax Reform Act. Based on the new regulations, we recorded a net tax benefit of $14.2 million in the second quarter of 2019, primarily to reverse a previously recorded uncertain tax position related to the Transition Tax. Consequently, our revised net tax benefit associated with the Tax Reform Act is $34.5 million, which now consists of (i) a $38.0 million charge relating to the one-time mandatory repatriation of previously deferred earnings of certain non-US subsidiaries that are owned either wholly or partially by our U.S. subsidiaries, inclusive of the utilization of certain tax attributes and (ii) a $72.5 million credit resulting from the determination and re-measurement of our net U.S. deferred tax liabilities at the lower corporate income tax rate.
Our income tax expense is a function of the mix between our domestic and international pre-tax earnings or losses, the mix of international tax jurisdictions in which we operate and recognition of valuation allowances for deferred tax assets for which the tax benefits are not likely to be realized. Certain of our rigs are owned and operated, directly or indirectly, by DFAC. Our managementBoard has determined that we will no longer permanently reinvest foreign earnings.As of December 31, 2019, we recorded $0.4 million for the withholding income tax impact associated with the potential distribution of DFAC’s earnings. We have not provided income tax on the outside basis difference of our international subsidiaries as management does not intend to dispose of these subsidiaries and structuring alternatives exist to mitigate any potential liability should a disposition take place. The potential unrecorded tax liability associated with the outside basis difference is approximately $95 million.
The components of income tax expense (benefit) are as follows (in thousands):
|
| Year Ended December 31, |
| |||||||||
|
| 2019 |
|
| 2018 |
|
| 2017 |
| |||
Federal – current |
| $ | (13,810 | ) |
| $ | 20,107 |
|
| $ | 6,994 |
|
State – current |
|
| 19 |
|
|
| 2 |
|
|
| 95 |
|
Foreign – current |
|
| 25,899 |
|
|
| 9,531 |
|
|
| 25,252 |
|
Total current |
|
| 12,108 |
|
|
| 29,640 |
|
|
| 32,341 |
|
Federal – deferred |
|
| (67,015 | ) |
|
| (75,279 | ) |
|
| (85,066 | ) |
Foreign – deferred |
|
| 10,107 |
|
|
| (714 | ) |
|
| 12,939 |
|
Total deferred |
|
| (56,908 | ) |
|
| (75,993 | ) |
|
| (72,127 | ) |
Total |
| $ | (44,800 | ) |
| $ | (46,353 | ) |
| $ | (39,786 | ) |
71
The difference between actual income tax expense and the tax provision computed by applying the statutory federal income tax rate to income before taxes is attributable to the following (in thousands):
|
| Year Ended December 31, |
| |||||||||
|
| 2019 |
|
| 2018 |
|
| 2017 |
| |||
(Loss) income before income tax expense: |
|
|
|
|
|
|
|
|
|
|
|
|
U.S. |
| $ | (339,072 | ) |
| $ | (266,855 | ) |
| $ | (241,178 | ) |
Foreign |
|
| (62,942 | ) |
|
| 40,230 |
|
|
| 219,738 |
|
|
| $ | (402,014 | ) |
| $ | (226,625 | ) |
| $ | (21,440 | ) |
Expected income tax benefit at federal statutory rate |
| $ | (84,423 | ) |
| $ | (47,591 | ) |
| $ | (7,504 | ) |
Effect of tax rate changes |
|
| (74,168 | ) |
|
| 1,763 |
|
|
| (74,294 | ) |
Mandatory repatriation of earnings pursuant to Tax Reform Act |
|
| — |
|
|
| — |
|
|
| 94,194 |
|
Effect of foreign operations |
|
| 3,129 |
|
|
| 15 |
|
|
| (42,102 | ) |
Valuation allowance |
|
| 11,650 |
|
|
| 11,929 |
|
|
| (41,492 | ) |
Uncertain tax positions, settlements and adjustments relating to prior years |
|
| 96,960 |
|
|
| (15,777 | ) |
|
| 31,726 |
|
Other |
|
| 2,052 |
|
|
| 3,308 |
|
|
| (314 | ) |
Income tax benefit |
| $ | (44,800 | ) |
| $ | (46,353 | ) |
| $ | (39,786 | ) |
Deferred Income Taxes. Significant components of our deferred income tax assets and liabilities are as follows (in thousands):
|
| December 31, |
| |||||
|
| 2019 |
|
| 2018 |
| ||
Deferred tax assets: |
|
|
|
|
|
|
|
|
Net operating loss carryforwards, or NOLs |
| $ | 253,973 |
|
| $ | 209,679 |
|
Foreign tax credits |
|
| 43,026 |
|
|
| 43,225 |
|
Disallowed interest deduction |
|
| 40,777 |
|
|
| 16,248 |
|
Worker’s compensation and other current accruals |
|
| 6,250 |
|
|
| 8,375 |
|
Deferred deductions |
|
| 12,345 |
|
|
| 10,481 |
|
Deferred revenue |
|
| 7,209 |
|
|
| — |
|
Operating lease liability |
|
| 5,461 |
|
|
| — |
|
Other |
|
| 4,367 |
|
|
| 6,380 |
|
Total deferred tax assets |
|
| 373,408 |
|
|
| 294,388 |
|
Valuation allowance |
|
| (186,620 | ) |
|
| (174,970 | ) |
Net deferred tax assets |
|
| 186,788 |
|
|
| 119,418 |
|
Deferred tax liabilities: |
|
|
|
|
|
|
|
|
Property, plant and equipment |
|
| (225,643 | ) |
|
| (212,251 | ) |
Mobilization |
|
| (2,245 | ) |
|
| (11,012 | ) |
Right-of-use assets |
|
| (5,461 | ) |
|
| — |
|
Other |
|
| (967 | ) |
|
| (535 | ) |
Total deferred tax liabilities |
|
| (234,316 | ) |
|
| (223,798 | ) |
Net deferred tax liability |
| $ | (47,528 | ) |
| $ | (104,380 | ) |
Net Operating Loss Carryforwards. As of December 31, 2019, we recorded a deferred tax asset of $254.0 million for the benefit of NOL carryforwards, comprised of $149.4 million related to our U.S. losses and $104.6 million related to our international operations. Approximately $154.7 million of this deferred tax asset relates to NOL carryforwards that have an indefinite life. The remaining $99.3 million relates to NOL carryforwards in several of our foreign subsidiaries, as well as in the U.S. Unless utilized, these NOL carryforwards will expire between 2021 and 2038.
72
Foreign Tax Credits. As of December 31, 2019, we recorded a deferred tax asset of $43.0 million for the benefit of foreign tax credits in the U.S., all of which will expire, unless utilized, between 2020 to 2030.
Valuation Allowances. We record a valuation allowance on a portion of our deferred tax assets not expected to be ultimately realized. During the years ended December 31, 2019, 2018 and 2017, we established valuation allowances related to net operating losses, foreign tax credits and other deferred tax assets of $30.7 million, $35.2 million and $37.9 million, respectively. During the years ended December 31, 2019, 2018 and 2017, we released valuation allowances in various jurisdictions of $19.0 million, $23.3 million and $79.4 million, respectively. The valuation allowance was also reduced by a $6.2 million adjustment to retained earnings at January 1, 2018 in connection with our adoption of ASU 2016-16. See Note 1 “General Information - Changes in Accounting Principles - Income Taxes.”
As of December 31, 2019, valuation allowances aggregating $186.6 million have been recorded for our net operating losses, foreign tax credits and other deferred tax assets for which the tax benefits are not likely to be realized.
Unrecognized Tax Benefits. Our income tax returns are subject to review and examination in the various jurisdictions in which we operate, and we are currently contesting various tax assessments. We accrue for income tax contingencies, or uncertain tax positions, that we believe are not likely to be realized. A rollforwardeach member of the beginning and ending amountcommittee satisfies the definition of unrecognized tax benefits, excluding interest and penalties, is“independent” as follows (in thousands):
|
| For the Year Ended December 31, |
| |||||||||
|
| 2019 |
|
| 2018 |
|
| 2017 |
| |||
Balance, beginning of period |
| $ | (55,943 | ) |
| $ | (81,864 | ) |
| $ | (34,970 | ) |
Additions for current year tax positions |
|
| (85,970 | ) |
|
| (2,906 | ) |
|
| (51,260 | ) |
Additions for prior year tax positions |
|
| (2,113 | ) |
|
| (20,943 | ) |
|
| (2,938 | ) |
Reductions for prior year tax positions |
|
| 23,267 |
|
|
| 49,175 |
|
|
| 623 |
|
Reductions related to statute of limitation expirations |
|
| 1,875 |
|
|
| 595 |
|
|
| 6,681 |
|
Balance, end of period |
| $ | (118,884 | ) |
| $ | (55,943 | ) |
| $ | (81,864 | ) |
The addition for current year tax positions in 2019 is due to a recent change in Switzerland tax legislation. Due to the uncertainties regarding the application of Swiss Tax Reform, including the values to be used to measure depreciable property, a liability for an uncertain tax position was recorded in the amount of $ 86.2 million. The $23.3 million reduction for prior year tax positions is mainly due to reversal of an uncertain tax position recorded for the one-time mandatory repatriation provision of the Tax Reform Act, following final regulations issued by the IRS in June 2019.
The $20.9 million addition for prior year tax positions in 2018 and the $51.3 million addition for current year tax positions in 2017, as well as the $49.2 million reduction for prior year tax positions in 2018 are all primarily due to uncertainty associated with the enactment of the Tax Reform Act and subsequent clarification issued by the IRS related to the positions in question.
At December 31, 2019, $0.5 million, $91.1 million and $58.3 million of the net liability for uncertain tax positions were reflected in “Other assets,” “Deferred tax liability” and “Other liabilities,” respectively, in our Consolidated Balance Sheets. At December 31, 2018, $1.2 million, $7.5 million and $75.3 million of the net liability for uncertain tax positions were reflected in “Other assets,” “Deferred tax liability” and “Other liabilities,” respectively, in our Consolidated Balance Sheets. Of the net unrecognized tax benefits at December 31, 2019, 2018 and 2017, $148.8 million, $81.6 million and $101.9 million, respectively, would affect the effective tax rates if recognized.
At December 31, 2019, the amount of accrued interest and penalties related to uncertain tax positions was $4.0 million and $16.5 million, respectively. At December 31, 2018, the amount of accrued interest and penalties related to uncertain tax positions was $3.2 million and $16.3 million, respectively.
73
Interest expense recognized during the years ended December 31, 2019, 2018 and 2017 related to uncertain tax positions was $1.0 million, $0.1 million and $0.5 million, respectively. Penalties recognized during the years ended December 31, 2019, 2018 and 2017 related to uncertain tax positions were $0.3 million, $0.6 million and $(1.7) million, respectively.
We expect the statute of limitations for the 2013 through 2015 tax years to expire in 2020 for various of our subsidiaries operating in Ireland, Malaysia and Mexico. We anticipate that the related unrecognized tax benefit will decrease by $5.1 million at that time.
Tax Returns and Examinations. We file income tax returns in the U.S. federal jurisdiction, various state jurisdictions and various foreign jurisdictions. Tax years that remain subject to examination by these jurisdictions include the year 2000 and the years 2009 to 2018. We are currently under audit in Australia, Brazil, Egypt, Equatorial Guinea, Malaysia, Mexico, Nicaragua, Qatar and the United Kingdom, or U.K. We do not anticipate that any adjustments resulting from the tax audit of any of these years will have a material impact on our consolidated results of operations, financial condition or cash flows.
15. Employee Benefit Plans
Defined Contribution Plans
We maintain defined contribution retirement plans for our U.S., U.K., and third-country national, or TCN, employees. The plan for our U.S. employees, or the 401k Plan, is designed to qualify under Section 401(k) of the Code. Under the 401k Plan, each participant may elect to defer taxation on a portion of his or her eligible earnings, as defined by the 401k Plan, by directing his or her employer to withhold a percentage of such earnings. A participating employee may also elect to make after-tax contributions to the 401k Plan. During 2019, 2018 and 2017, we matched 100% of the first 5% of each employee’s qualifying annual compensation contributed to the 401k Plan on a pre-tax or Roth elective deferral basis in each respective year. Participants are fully vested in the employer match immediately upon enrollment in the 401k Plan. For the years ended December 31, 2019, 2018 and 2017, our provision for contributions was $9.1 million, $8.0 million and $8.9 million, respectively.
The defined contribution retirement plan for our U.K. employees provides that we make annual contributions in an amount equal to the employee's contributions generally up to a maximum percentage of the employee's defined compensation per year. Our contribution during 2019, 2018 and 2017 for employees working in the U.K. sector of the North Sea was 6% of the employee’s defined compensation. Our provision for contributions was $2.1 million, $1.5 million and $1.4 million for the years ended December 31, 2019, 2018 and 2017, respectively.
The defined contribution retirement plan for our TCN employees, or International Savings Plan, is similar to the 401k Plan. During 2019, 2018 and 2017, we matched 5% of each employee’s compensation contributed to the International Savings Plan in each respective year, and our provision for contributions was $0.4 million in each of the years ended December 31, 2019, 2018 and 2017.
Deferred Compensation and Supplemental Executive Retirement Plan
Our Amended and Restated Diamond Offshore Management Company Supplemental Executive Retirement Plan, or Supplemental Plan, provides benefits to a select group of our management or other highly compensated employees to compensate such employees for any portion of the applicable percentage of the base salary contribution and/or matching contributionestablished under the 401k Plan that could not be contributed to that plan because of limitations within the Code. Our provision for contributions to the Supplemental Plan for 2019, 2018 and 2017 was approximately $0.1 million in each respective year.
16. Segments and Geographic Area Analysis
Although we provide contract drilling services with different types of offshore drilling rigs and also provide such services in many geographic locations, we have aggregated these operations into 1 reportable segment based on the similarity of economic characteristics due to the nature of the revenue-earning process as it relates to the offshore drilling industry over the operating lives of our drilling rigs.
74
Our drilling rigs are highly mobile and may be moved to other markets throughout the world in response to market conditions or customer needs. At December 31, 2019, our active drilling rigs were located offshore 3 countries in addition to the United States. Revenues by geographic area are presented by attributing revenues to the individual country or areas where the services were performed.
The following tables provide information about disaggregated revenue by equipment-type and country (in thousands):
|
| Year Ended December 31, 2019 |
| |||||||||
|
| Total Contract Drilling Revenues (1) |
|
| Revenues Related to Reimbursable Expenses |
|
| Total |
| |||
United States |
| $ | 507,759 |
|
| $ | 7,881 |
|
| $ | 515,640 |
|
Brazil |
|
| 191,519 |
|
|
| 83 |
|
|
| 191,602 |
|
United Kingdom |
|
| 149,724 |
|
|
| 14,036 |
|
|
| 163,760 |
|
Australia |
|
| 85,932 |
|
|
| 23,710 |
|
|
| 109,642 |
|
Total |
| $ | 934,934 |
|
| $ | 45,710 |
|
| $ | 980,644 |
|
|
|
|
| Year Ended December 31, 2018 |
| |||||||||||||||||
|
| Floater Rigs |
|
| Jack-up Rigs (1) |
|
| Total Contract Drilling Revenues |
|
| Revenues Related to Reimbursable Expenses |
|
| Total |
| |||||
United States |
| $ | 628,574 |
|
| $ | 8,413 |
|
| $ | 636,987 |
|
| $ | 7,436 |
|
| $ | 644,423 |
|
Brazil |
|
| 170,839 |
|
|
| — |
|
|
| 170,839 |
|
|
| (26 | ) |
|
| 170,813 |
|
United Kingdom |
|
| 84,749 |
|
|
| — |
|
|
| 84,749 |
|
|
| 7,738 |
|
|
| 92,487 |
|
Australia |
|
| 53,170 |
|
|
| — |
|
|
| 53,170 |
|
|
| 7,612 |
|
|
| 60,782 |
|
Malaysia |
|
| 114,228 |
|
|
| — |
|
|
| 114,228 |
|
|
| (210 | ) |
|
| 114,018 |
|
Other countries (2) |
|
| — |
|
|
| — |
|
|
| — |
|
|
| 692 |
|
|
| 692 |
|
Total |
| $ | 1,051,560 |
|
| $ | 8,413 |
|
| $ | 1,059,973 |
|
| $ | 23,242 |
|
| $ | 1,083,215 |
|
|
|
|
|
|
| Year Ended December 31, 2017 |
| |||||||||||||||||
|
| Floater Rigs |
|
| Jack-up Rigs |
|
| Total Contract Drilling Revenues |
|
| Revenues Related to Reimbursable Expenses |
|
| Total |
| |||||
United States |
| $ | 619,655 |
|
| $ | — |
|
| $ | 619,655 |
|
| $ | 10,940 |
|
| $ | 630,595 |
|
Brazil |
|
| 280,798 |
|
|
| — |
|
|
| 280,798 |
|
|
| (311 | ) |
|
| 280,487 |
|
United Kingdom |
|
| 171,146 |
|
|
| — |
|
|
| 171,146 |
|
|
| 6,424 |
|
|
| 177,570 |
|
Australia |
|
| 125,568 |
|
|
| — |
|
|
| 125,568 |
|
|
| 15,385 |
|
|
| 140,953 |
|
Malaysia |
|
| 164,984 |
|
|
| — |
|
|
| 164,984 |
|
|
| 1,988 |
|
|
| 166,972 |
|
Trinidad |
|
| 67,924 |
|
|
| — |
|
|
| 67,924 |
|
|
| — |
|
|
| 67,924 |
|
Other countries (1) |
|
| — |
|
|
| 21,144 |
|
|
| 21,144 |
|
|
| 101 |
|
|
| 21,245 |
|
Total |
| $ | 1,430,075 |
|
| $ | 21,144 |
|
| $ | 1,451,219 |
|
| $ | 34,527 |
|
| $ | 1,485,746 |
|
|
|
75
The following table presents our long-lived tangible assets by country as of December 31, 2019, 2018 and 2017. A substantial portion of our assets is comprised of rigs that are mobile, and therefore asset locations at the end of the period are not necessarily indicative of the geographic distribution of the earnings generated by such assets during the periods and may vary from period to period due to the relocation of rigs. In circumstances where our drilling rigs were in transit at the end of a calendar year, they have been presented in the tables below within the country in which they were expected to operate (in thousands).
|
| December 31, |
| |||||||||
|
| 2019 |
|
| 2018 (1) |
|
| 2017 (1) |
| |||
Drilling and other property and equipment, net: |
|
|
|
|
|
|
|
|
|
|
|
|
United States |
| $ | 2,227,934 |
|
| $ | 2,245,989 |
|
| $ | 2,300,956 |
|
International: |
|
|
|
|
|
|
|
|
|
|
|
|
United Kingdom |
|
| 1,061,585 |
|
|
| 1,083,540 |
|
|
| 133,525 |
|
Brazil |
|
| 883,607 |
|
|
| 923,355 |
|
|
| 923,398 |
|
Australia |
|
| 570,964 |
|
|
| 242,929 |
|
|
| 629,436 |
|
Singapore |
|
| 404,420 |
|
|
| 366,798 |
|
|
| 17 |
|
Malaysia |
|
| 2,037 |
|
|
| 318,191 |
|
|
| 1,084,793 |
|
Other countries (2) |
|
| 2,281 |
|
|
| 3,420 |
|
|
| 189,516 |
|
|
|
| 2,924,894 |
|
|
| 2,938,233 |
|
|
| 2,960,685 |
|
Total |
| $ | 5,152,828 |
|
| $ | 5,184,222 |
|
| $ | 5,261,641 |
|
|
|
|
|
Major Customers
Our customer base includes major and independent oil and gas companies and government-owned oil companies. Revenues from our major customers for the years ended December 31, 2019, 2018 and 2017 that contributed more than 10% of our total revenues are as follows:
|
| Year Ended December 31, |
| |||||||||
Customer |
| 2019 |
|
| 2018 |
|
| 2017 |
| |||
Hess Corporation |
|
| 28.9 | % |
|
| 25.0 | % |
|
| 16.0 | % |
Occidental (formerly Anadarko) |
|
| 20.6 | % |
|
| 33.8 | % |
|
| 24.9 | % |
Petróleo Brasileiro S.A. |
|
| 19.5 | % |
|
| 15.8 | % |
|
| 18.9 | % |
BP |
|
| 3.1 | % |
|
| 10.5 | % |
|
| 15.8 | % |
76
17. Unaudited Quarterly Financial Data
Unaudited summarized financial data by quarter for the years ended December 31, 2019 and 2018 is shown below (in thousands).
|
| First |
|
| Second |
|
| Third |
|
| Fourth |
| ||||
|
| Quarter |
|
| Quarter |
|
| Quarter |
|
| Quarter |
| ||||
2019 |
|
|
|
|
|
|
|
|
|
|
|
|
|
|
|
|
Revenues |
| $ | 233,542 |
|
| $ | 216,706 |
|
| $ | 254,020 |
|
| $ | 276,376 |
|
Operating loss |
|
| (49,127 | ) |
|
| (111,500 | ) |
|
| (72,834 | ) |
|
| (48,869 | ) |
Loss before income tax expense |
|
| (77,390 | ) |
|
| (141,342 | ) |
|
| (102,610 | ) |
|
| (80,672 | ) |
Net loss |
|
| (73,328 | ) |
|
| (113,988 | ) |
|
| (95,128 | ) |
|
| (74,770 | ) |
Net loss per share, basic and diluted |
| $ | (0.53 | ) |
| $ | (0.83 | ) |
| $ | (0.69 | ) |
| $ | (0.54 | ) |
|
|
|
|
|
|
|
|
|
|
|
|
|
|
|
|
|
2018 |
|
|
|
|
|
|
|
|
|
|
|
|
|
|
|
|
Revenues |
| $ | 295,510 |
|
| $ | 268,861 |
|
| $ | 286,322 |
|
| $ | 232,522 |
|
Operating income (loss) (1) |
|
| 512 |
|
|
| (52,375 | ) |
|
| (23,043 | ) |
|
| (37,277 | ) |
Loss before income tax expense |
|
| (25,142 | ) |
|
| (79,286 | ) |
|
| (55,894 | ) |
|
| (66,303 | ) |
Net income (loss) |
|
| 19,321 |
|
|
| (69,274 | ) |
|
| (51,112 | ) |
|
| (79,207 | ) |
Net income (loss) per share, basic and diluted |
| $ | 0.14 |
|
| $ | (0.50 | ) |
| $ | (0.37 | ) |
| $ | (0.58 | ) |
(1)During the second quarter of 2018, we recognized an impairment loss of $27.2 million to write down the carrying value of the Ocean Scepter to its estimated recoverable amount. See Note 3.
Item 9. Changes in and Disagreements with Accountants on Accounting and Financial Disclosure.
Not applicable.
Item 9A. Controls and Procedures
Disclosure Controls and Procedures
We maintain a system of disclosure controls and procedures that are designed to ensure information required to be disclosed by us in reports that we file or submit under the federal securities laws, including this report, is recorded, processed, summarized and reported on a timely basis. These disclosure controls and procedures include controls and procedures designed to ensure that information required to be disclosed by us under the federal securities laws is accumulated and communicated to our management on a timely basis to allow decisions regarding required disclosure.
77
Our Chief Executive Officer, or CEO, and Chief Financial Officer, or CFO, participated in an evaluation by our management of the effectiveness of our disclosure controls and procedures (as defined in Exchange Act Rules 13a-15(e) and 15d-15(e)) as of December 31, 2019. Based on their participation in that evaluation, our CEO and CFO concluded that our disclosure controls and procedures were effective as of December 31, 2019.
Internal Control Over Financial Reporting
Management’s Annual Report on Internal Control Over Financial Reporting
Our management is responsible for establishing and maintaining adequate internal control over financial reporting (as defined in Exchange Act Rules 13a-15(f) and 15d-15(f)) for Diamond Offshore Drilling, Inc. Our internal control system was designed to provide reasonable assurance to our management and Board of Directors regarding the preparation and fair presentation of published financial statements.
There are inherent limitations to the effectiveness of any control system, however well designed, including the possibility of human error or mistakes, faulty judgments in decision-making and the possible circumvention or overriding of controls. Further, the design of a control system must reflect the fact that there are resource constraints, and the benefits of controls must be considered relative to their costs. Management must make judgments with respect to the relative cost and expected benefits of any specific control measure. The design of a control system also is based in part upon assumptions and judgments made by management about the likelihood of future events, and there can be no assurance that a control will be effective under all potential future conditions. As a result, even an effective system of internal controls can provide no more than reasonable assurance with respect to the fair presentation of financial statements and the processes under which they were prepared. Because of its inherent limitations, internal control over financial reporting may not prevent or detect misstatements. Also, projections of any evaluation of effectiveness to future periods are subject to the risk that controls may become inadequate because of changes in conditions, or that the degree of compliance with the policies and procedures may deteriorate.
Our management assessed the effectiveness of our internal control over financial reporting as of December 31, 2019. In making this assessment, our management used the criteria set forth by the Committee of Sponsoring Organizations of the Treadway Commission (COSO) in Internal Control – Integrated Framework (2013). Based on this assessment our management believes that, as of December 31, 2019, our internal control over financial reporting was effective.
Deloitte & Touche LLP, the registered public accounting firm that audited our financial statements included in this Annual Report on Form 10-K, has issued an attestation report on the effectiveness of our internal control over financial reporting. The attestation report of Deloitte & Touche LLP is included at the beginning of Item 8 of this Form 10-K.
There were no changes in our internal control over financial reporting identified in connection with the foregoing evaluation that occurred during our fourth fiscal quarter of 2019 that have materially affected, or are reasonably likely to materially affect, our internal control over financial reporting.
Item 9B. Other Information.
Not applicable.
78
PART III
Item 10. Directors, Executive Officers and Corporate Governance.
Information about our executive officers is reported under the caption “Information About Our Executive Officers” in Item 1 of Part I of this Report.
| Name | Title | |
| Bernie Wolford, Jr. | President and CEO (principal executive officer) | |
| Dominic A. Savarino | Senior Vice President and Chief Financial Officer (principal financial officer and former Vice President and Chief Accounting & Tax Officer) | |
| Marc Edwards | Former President and CEO (former principal executive officer) | |
| Ronald Woll | Former Executive Vice President and Chief Operating Officer | |
| Scott L. Kornblau | Former Senior Vice President and CFO (former principal financial officer) | |
| David L. Roland | Senior Vice President, General Counsel and Secretary |