UNITED STATES
SECURITIES AND EXCHANGE COMMISSION
Washington, D.C. 20549
FORM 10-K
FORM 10-K
(Mark One)
☒ | ANNUAL REPORT PURSUANT TO SECTION 13 OR 15(d) OF THE SECURITIES EXCHANGE ACT OF 1934 |
For the fiscal year ended December 31, 20192021
OR
☐ | TRANSITION REPORT PURSUANT TO SECTION 13 OR 15(d) OF THE SECURITIES EXCHANGE ACT OF 1934 |
FOR THE TRANSITION PERIOD FROM TO
Commission File Number 001-38233
CarGurus, Inc.
(Exact name of Registrant as specified in its Charter)
Delaware | 04-3843478 | ||
(State or other jurisdiction of incorporation or organization) | (I.R.S. Employer Identification No.) | ||
|
| ||
2 Canal Park, 4th Floor Cambridge, Massachusetts | 02141 | ||
(Address of principal executive offices) | (Zip Code) |
Registrant’s telephone number, including area code: (617) (617) 354-0068
Securities registered pursuant to Section 12(b) of the Act:
Title of Each Class | Trading Symbol | Name of Exchange on Which Registered | |||
Class A Common Stock, par value $0.001 per share | CARG |
| The Nasdaq Stock Market LLC (Nasdaq Global Select Market) |
Securities registered pursuant to Section 12(g) of the Act: None
Indicate by check mark if the Registrant is a well-known seasoned issuer, as defined in Rule 405 of the Securities Act. Yes☒ No ☐
Indicate by check mark if the Registrant is not required to file reports pursuant to Section 13 or 15(d) of the Act. Yes ☐ ☐No No ☒
Indicate by check mark whether the Registrant: (1) has filed all reports required to be filed by Section 13 or 15(d) of the Securities Exchange Act of 1934 during the preceding 12 months (or for such shorter period that the Registrant was required to file such reports), and (2) has been subject to such filing requirements for the past 90 days. Yes☒ No ☐☐
Indicate by check mark whether the Registrant has submitted electronically every Interactive Data File required to be submitted pursuant to Rule 405 of Regulation S-T (§232.405 of this chapter) during the preceding 12 months (or for such shorter period that the Registrant was required to submit such files). Yes☒ No ☐☐
Indicate by check mark whether the registrant is a large accelerated filer, an accelerated filer, a non-accelerated filer, smaller reportingcompany, or an emerging growth company. See the definitions of “large accelerated filer,” “accelerated filer,” “smaller reporting company,” and“emerging “emerging growth company” in Rule 12b-2 of the Exchange Act.
Large accelerated filer |
| ☒ |
| Accelerated filer |
| ☐ |
Non-accelerated filer |
| ☐ |
| Small reporting company |
| ☐ |
Emerging growth company | ☐ |
If an emerging growth company, indicate by check mark if the registrant has elected not to use the extended transition period for complyingwith any new or revised financial accounting standards provided pursuant to Section 13(a) of the Exchange Act. ☐
Indicate by check mark whether the registrant has filed a report on and attestation to its management’s assessment of the effectiveness of its internal control over financial reporting under Section 404(b) of the Sarbanes-Oxley Act (15 U.S.C. 7262(b)) by the registered public accounting firm that prepared or issued its audit report. ☒
Indicate by check mark whether the Registrant is a shell company (as defined in Rule 12b-2 of the Exchange Act). Yes ☐ No ☒
The aggregate market value of the registrant’s Class A common stock, par value $0.001 per share, held by non-affiliates of the registrant based on the closing price of the registrant’s common stock as reported on the Nasdaq Global Market on June 30, 20192021 was $2,464,065,369. $2,546,447,011. Shares of voting and non-voting stock held by executive officers, directors and holders of more than 5%10% of the outstanding stock as of such date have been excluded from this calculation because such persons or institutions may be deemed affiliates. This determination of affiliate status is not a conclusive determination for other purposes.
As of February 6, 2020,18, 2022, the registrant had 91,983,435102,066,025 shares of Class A common stock, and 20,314,64415,999,173 shares of Class B common stock, par value $0.001 per share, outstanding.
DOCUMENTS INCORPORATED BY REFERENCE
Portions of the registrant’s definitive Proxy Statement for its 20202022 Annual Meeting of Stockholders are incorporated by reference in Part III of this Annual Report on Form 10-K. Such Proxy Statement will be filed with the U.S. Securities and Exchange Commission within 120 days after the end of the fiscal year to which this report relates. Except with respect to information specifically incorporated by reference in this Form 10-K, the Proxy Statement is not deemed to be filed as part of this Form 10-K.
Table of Contents
|
| Page |
| ||
Item 1. |
| |
Item 1A. |
| |
Item 1B. |
| |
Item 2. |
| |
Item 3. |
| |
Item 4. |
| |
|
| |
| ||
Item 5. |
| |
Item 6. | 37 | |
Item 7. | Management’s Discussion and Analysis of Financial Condition and Results of Operations |
|
Item 7A. |
| |
Item 8. |
| |
Item 9. | Changes in and Disagreements with Accountants on Accounting and Financial Disclosure | 111 |
Item 9A. | 111 | |
Item 9B. | 113 | |
Item 9C. | Disclosure Regarding Foreign Jurisdictions That Prevent Inspections | 113 |
| ||
Item 10. | 114 | |
Item 11. | 114 | |
Item 12. | Security Ownership of Certain Beneficial Owners and Management and Related Stockholder Matters | 114 |
Item 13. | Certain Relationships and Related Transactions, and Director Independence | 114 |
Item 14. | 114 | |
|
| |
| ||
Item 15. | 115 | |
Item 16. | 115 |
SPECIAL NOTE REGARDING FORWARD-LOOKING STATEMENTS
This Annual Report on Form 10-K contains forward‑looking statements within the meaning of the federal securities laws, which statements involve substantial risks and uncertainties. Forward‑looking statements generally relate to future events or our future financial or operating performance. In some cases, you can identify forward‑looking statements because they contain words such as “anticipates,” “believes,” “could,” “estimates,” “expects,” “intends,” “likely,” “may,” “might,” “plans,” “potential,” “predicts,” “projects,” “seeks,” “should,” “target,” “will,” “would,” or similar expressions and the negatives of those terms. Forward-looking statements contained in this report include, but are not limited to, statements about:
| • our future financial performance, including our expectations regarding our revenue, cost of revenue, gross profit or gross margin, operating expenses, ability to generate cash flow, and ability to achieve, and maintain, future profitability; • our growth strategies and our ability to effectively manage any growth; • the value proposition of our product offerings for dealers and consumers; • our belief that we are building the world’s most trusted and transparent automotive marketplace and creating a differentiated automotive search experience for consumers; • the ability of our combined suite of offerings to increase a dealer’s return on investment, add scale to our marketplace network, drive powerful network effects, create powerful synergies for dealers, transform the end-to-end car shopping journey for both consumers and dealers and become the marketplace for all steps of the vehicle acquisition and purchase process; • our evolution to becoming a transaction-enabled marketplace where consumers can shop, buy, seek financing, and sell their cars and dealers can source, market, and sell their vehicles; • our belief that certain of our strengths, including our trusted marketplace for consumers, our strong value proposition for dealers and our data-driven approach, among other things, will lead to an advantage over our competitors; • our ability to deliver quality leads at a high volume for our dealer customers and to provide the highest return on a dealer’s investment; • our ability to maintain and acquire new customers; • our ability to maintain and build our brand; • our efforts to continue to enhance our diversity, equity, inclusion and belonging initiatives; • our ability to realize benefits from our acquisitions and successfully implement the integration strategies in connection therewith; • our expectations regarding future share issuances and the exercise of put and call rights in connection with potentially acquiring additional equity interests in CarOffer, LLC, or CarOffer, as well as the associated valuation of redeemable noncontrolling interests; • the value proposition of the CarOffer online wholesale platform, including our belief that as dealer enrollments increase, dealers will see a corresponding increase in inventory on the platform, further enabling liquidity, selection, choice and business efficiencies; • our expectations for CarGurus Instant Max Cash Offer, as well as our digital retail offerings and continued investments; • our belief that our partnerships with automotive lending companies provides more transparency to car shoppers and delivers highly qualified car shopper leads to participating dealers; • our belief that our Area Boost offering promotes participating dealers’ delivery capabilities and increases non-local VDP views; • the impact of competition in our industry and innovation by our competitors; • the impact of accounting pronouncements; • the impact of litigation; • our ability to hire and retain necessary qualified employees to expand our operations; 1 • our ability to adequately protect our intellectual property; • our ability to stay abreast of, and effectively comply with, new or modified laws and regulations that currently apply or become applicable to our business and our beliefs regarding our compliance therewith; • our ability to overcome challenges facing the automotive industry ecosystem, including inventory supply problems, global supply chain challenges, the global semiconductor chip shortage, changes to trade policies and other macroeconomic issues; • failure to maintain an effective system of internal controls necessary to accurately report our financial results and prevent fraud; • our expectations regarding cash generation and the sufficiency of our cash to fund our operations; • the future trading prices of our Class A common stock; • our expectation that we will realize the benefits of deferred tax assets; • our expected returns on investments; • the impact of our expense reduction efforts during the second quarter of 2020; • our outlook for our Restricted Listings product; • our expectations regarding future fee reductions for customers; and • the impacts of the COVID-19 pandemic.
|
|
|
|
|
|
|
|
|
|
|
|
|
|
|
|
|
|
|
|
|
|
|
|
|
|
|
|
|
|
|
|
|
|
|
|
|
|
You should not rely upon forward‑looking statements as predictions of future events. We have based the forward‑looking statements contained in this report primarily on our current expectations and projections about future events and trends that we believe may affect our business, financial condition, operating results, and growth prospects. The outcome of the events described in these forward‑looking statements is subject to risks, uncertainties, and other factors described in the section titled “Risk Factors” and elsewhere in this report. Moreover, we operate in a very competitive and rapidly changing environment. New risks and uncertainties emerge from time to time, and it is not possible for us to predict all risks and uncertainties that could have an impact on the forward‑looking statements contained in this report. Further, our forward‑looking statements do not reflect the potential impact of any future acquisitions, mergers, dispositions or joint ventures in which we may be involved, or investments we may make. We cannot assure you that the results, events, and circumstances reflected in the forward‑looking statements will be achieved or occur, and actual results, events, or circumstances could differ materially from those described in the forward‑looking statements.
The forward‑looking statements made in this report relate only to events as of the date on which the statements are made. We undertake no obligation to update any forward‑looking statementsstatement made in this report to reflect events or circumstances after the date of this report or to reflect new information or the occurrence of unanticipated events, except as required by law.
12
PART I
Item 1. Business.
BUSINESSOverview
Overview
CarGurus, Inc. is a global,multinational, online automotive platform for buying and selling vehicles that is building upon its industry-leading listings marketplace connecting buyerswith both digital retail solutions and sellers of newthe CarOffer online wholesale platform. The CarGurus marketplace gives consumers the confidence to purchase or sell a vehicle either online or in-person, and used cars. Usingit gives dealerships the power to accurately price, effectively market, instantly acquire and quickly sell vehicles, all with a nationwide reach. CarGurus uses proprietary technology, search algorithms and innovative data analytics we believe we are buildingto bring trust, transparency and competitive pricing to the world’s most trusted and transparent automotive marketplace and creating a differentiated automotive search experience for consumers. Our trusted marketplace empowers users with unbiased third‑party validation on pricing and dealer reputation as well as other information that aids them in finding “Great Deals from Top-Rated Dealers.” Our selection of car listings provides the largest number of car listings available on any of the major U.S. online automotive marketplaces.shopping experience. In addition to the United States, we operate online marketplaces under the CarGurus brand in Canada and the United Kingdom, Germany, Italy, and Spain.Kingdom. In the United States and United Kingdom, we also operate the Autolist and PistonHeads online marketplaces, respectively, as independent brands.
CarGurus was founded upon the premise of bringing trust and transparency to the car shopping experience. Our online marketplace as an independent brand.
A core principleplatform provides ease of access to prices of vehicles and dealer ratings imperative to a consumer’s vehicle purchase. Providing car-shoppers with the tools and knowledge for their experience has enabled us to garner a large, engaged user base with whom our dealers can transact. Our ready-to-shop audience of 31.6 million average monthly visitors in the U.S. has attracted 23,860 paying dealers to list inventory on our U.S. online marketplace. Over time we identified that we could continue to be a valued partner to consumers in their car-shopping journey while at the same time innovating to further our partnership with our dealer community. We have since introduced products that expand a dealer’s geographic footprint, enable digital retail capabilities that provide consumers with a self-selected journey, and offer new sources of acquiring inventory from our expanded network. This expanded suite of offerings can help increase our dealers’ return on investment, or ROI, adding even more scale to our marketplace network. While we maintain our founding principles of trust and transparency, we are evolving to be a transaction-enabled marketplace where consumers can shop, buy, seek financing, and sell their cars and dealers can source, market, and sell their vehicles. We believe this combination of differentiated offerings will transform the end-to-end car shopping journey for both consumers and dealers.
Consumers' CarGurus Journey
Shop: A car purchase is transparency. For consumers considering used vehicles,a milestone in a consumer’s life – whether it is the first set of keys or parting from a memory-filled vehicle. However, shopping for a car can be frustrating instead of empowering. Enter CarGurus, where we provide trust and transparency to the process for consumers. As the consumer moves to purchase a vehicle, we aggregate vehicle inventory from dealers and apply our proprietary analysis to generate a Deal Rating as one of: Great Deal, Good Deal, Fair Deal, High Priced, or Overpriced. Deal Rating illustrates how competitive a listing is compared to similar cars sold in the same region in recent history. We determine Deal Rating principally on the basis of both our proprietary Instant Market Value, or IMV, algorithm, which determines the market value of a used vehicle in a local market, and Dealer Rating, a measure of a dealer’s reputation as determined by reviews of that dealer from our user community. As the only major U.S. online automotive marketplace that defaults to sorting organic search results based on a used car’s Deal Rating, we enable consumers to find the most relevant car for their needs. For new cars, we help our users understand deal quality by providing price analysis and our Dealer Rating. We also provide our users information historically not widely available, such as Price History, Time on Site, and Vehicle History.
Buy/Finance: Once a consumer has found a listing they intend to pursue, we provide an omni-channel approach to the purchase of a vehicle partially or completely online. Our digital retail products such as Area Boost and Finance in Advance provide the consumer a self-selected car-buying journey to tailor their experience to their specific needs. We believe this approach throughout the end-to-end consumer experience brings greater trust, transparency, trust, and efficiency to a consumer’s entire car research and buying process,shopping experience, leading to higher engagementhighly-engaged, more confident and satisfied shoppers.
3
Sell: According to recent consumer research, almost 60% of car-buying shoppers will trade in or sell a more informedvehicle during their car-shopping journey. Our acquisition of 51% interest in CarOffer, LLC, or CarOffer, in January 2021, with the ability to buy the remaining equity interest in the company over the next three years, enabled the launch of CarGurus Instant Max Cash Offer, or IMCO. IMCO provides the consumer with the ability to complete this part of the process entirely online through a trusted and transparent experience. Consumers who are trading-in or selling vehicles receive the most competitive offer sourced from in-network dealers. Consumers benefit from the volume of participating dealerships in the CarGurus/CarOffer network, as well as the CarOffer Buying Matrix’s 24-7 automated matching, which enables a hands-off approach to find the consumer the best deal at any time. Once the customer has accepted their offer, they can further customize their experience by arranging a location of their choice within participating states to have the vehicle picked-up and transported. With expansive dealer networks, consumers can have the confidence that they are truly finding the best deal for their vehicle instantly.
Dealers' CarGurus Journey
Source: As macroeconomic issues, including the global semiconductor chip shortage, impacted the automotive industry over the past year, obtaining vehicle inventory through in-person, time-consuming methods highlighted inefficiencies; as a result of which, inventory across dealer lots fell to historical lows during 2021.Made possible by the acquisition of CarOffer in 2021, we entered the digital wholesale space enabling dealers to acquire inventory in a convenient and efficient manner. CarOffer is better preparedan automated instant vehicle trade platform that is disrupting the traditional wholesale auction model with technology that enables dealers to bid, transact, inspect and transport vehicles seamlessly and efficiently. Any dealer, including those who are customers of the CarGurus site, can enroll on the CarOffer platform at no additional cost. CarOffer’s proprietary Buying Matrix technology allows dealers on the platform to buy and sell to other dealers using limit orders, saving dealers the time and expense of going to an auction to acquire vehicles via the traditional in-person physical auction model. Through inspections on every sale, dealers can be confident their purchase meets their expectations while they reap the benefits of focusing their resources and attention on other elements of their businesses. As CarOffer dealer enrollments continue to increase, we expect dealers will see a corresponding increase of inventory on the platform, further enabling liquidity, selection, and business efficiencies. Additionally, the CarOffer platform enabled us to launch IMCO across approximately 70% of the U.S., providing dealers access to a fresh source of trade-in inventory and ensuring liquidity amongst CarOffer’s platform. Similar to a dealer-to-dealer purchase, CarOffer handles inspections, transportation, titles, and payments in one bill of sale from the consumer. CarOffer’s platform provides a solution for a dealer looking to minimize reliance on in-person or online auctions to source their vehicle inventory while assuring they are paying a fair price, which has led to rapid growth and adoption within the dealer community.
Market: Dealers can list their inventory on CarGurus’ marketplace for free or with a subscription to one of our paid Listings packages. Non-paying dealers receive a limited number of anonymized email connections and access to a subset of tools on our Dealer Dashboard at no cost. A dealer with a paid subscription receives connections with consumers that are not anonymous and are made through a wider variety of methods, including phone calls, email, managed text and chat, links to the dealer’s website, and map directions to its dealerships. The primary objective of our traffic acquisition and site improvement efforts is to generate quality consumer leads to dealers. Leads are a subcategory of connections that we define as user inquiries via our marketplace to dealers by phone calls, email, or managed text and chat interactions. We define connections as interactions between consumers and dealers via our marketplace through phone calls, email, managed text and chat, and clicks to access the dealer’s website and map directions to the dealership.Dealers with our paid Listings packages are able to display their dealer name, address, and dealership information on their listings on our websites to gain brand recognition, which promotes walk-in traffic to the dealership. Paying dealers also have access to tools on the Dealer Dashboard as well as other product offerings such as Area Boost, which enables dealers to expand their geographic footprint to reach an increased consumer audience. Through our large ready-to-purchase consumer audience, our paying dealers ultimately have a consistent and compelling ROI through our variety of product offerings.
Our large, engaged, and predominantly mobile user base presents an attractive audience of in‑market consumers for our dealers. Sell: By presenting consumers with data such as our Deal Ratings, Price History, Time on Site, and Vehicle History, we believe our consumer audience is comprised of more informed, ready-to-purchase shoppers. By connecting dealers with more informed, ready-to-purchasesuch consumers, we believe we provide dealers with an efficient customer acquisition channel and attractive returnswith the highest-intent shoppers providing the highest ROI. Further, as consumer needs evolve to customizing aspects of their vehicle purchase, we provide dealers, through a variety of digital offerings, the means to cater to consumers on a personalized level. Consumers can choose to complete their marketing spendself-selected car-shopping journey with us. Dealers can list their inventory in our marketplace for freeas little or with a subscription to one of our paid Listings packages. Non-paying dealers receive anonymized email connections and access to a subsetas many of the tools on our Dealer Dashboard at no cost. Dealers with a paid subscription receive connections with consumers that are not anonymous and can be made through a wider variety of methods, including phone calls, email, managed text and chat, links to the dealers’ website, and map directions to dealerships. The primary objective of our traffic acquisition and site improvement efforts is to generate greater volumes of consumer leads to dealers. Leads are a subcategory of connectionsdigital offerings that we define as user inquiries viaprovide through our marketplacepartnership with dealers, enabling a personalized experience that allows consumers to dealers by phone calls, email, or managed text and chat interactions. Dealers with our paid Listings packages are able to displayreach their dealer name, address, and dealership information on their listings on our websites to gain brand recognition, which promotes walk‑in traffic to the dealer.personalized destination. We also provide paying dealers with full access to our Dealer Dashboard, including inventory pricing tools informed by real‑real time market conditions, which helps them more effectively price, merchandise, and sell their cars. With the acquisition of CarOffer, we have also integrated insights regarding wholesale pricing among the dealer community. The ability to compare wholesale pricing with retail pricing ultimately allows dealers to price a car with more accuracy, winning loyal consumers with trust and transparency. These combined offerings allow dealers to efficiently drive their business to success from all aspects of sourcing and selling. Our success in our partnership with dealers is evidenced by the number of paying dealers in our U.S. marketplace. Our U.S. marketplace had 28,990– 23,860 paying dealers as of December 31, 2019 compared to 27,534 and 25,122 as of December 31, 2018 and December 31, 2017, respectively.2021 – in our U.S. marketplace.
4
CarGurus Value Proposition
Our scaled online transaction-enabled marketplace model drives powerful network effects. The industry‑leadingcombination of digital retail, digital wholesale and listings creates powerful synergies for dealers. Dealers can acquire inventory through consumers and other dealers on both the CarOffer and CarGurus platforms. The industry-leading inventory selection offered byon the CarGurus website from our U.S. dealers attracts a large and engaged consumer audience.audience – 31.6 million average monthly U.S. unique users in 2021 – and connections – 60.0 million in the U.S. in 2021. The value of robust connections to this audience incentivizes dealers to purchase our paid Listings packages. DisplayingExpanded vehicle listings from more paying dealers and an increasing number of offers by dealers to purchase vehicles from consumers provides consumers with morediverse dealer information and methodschoice. Our industry-leading consumer audience drives value to contact them. More consumers – 36.8 million average monthly U.S. unique users in 2019 – and connections – 65.3 million in the U.S. in 2019 – drive greater valuelooking to trade-in or sell their vehicle as well as paying dealers on our platform. Driven by these network effects,platform looking to acquire and sell inventory. As we continue to amass more data, whichinnovate and progress our offerings to both consumers and dealers, we usestrive to continuouslyuphold and improve our search algorithms, the accuracy of Deal Ratings, our user experience, and, ultimately, the quality of the connections between consumers and dealers.
2
We generatedealers and become the marketplace subscription revenue fromfor all steps of the vehicle acquisition and purchase process, ultimately giving dealers through subscriptionsand consumers the power to our products, including our paid Listings packages (which include optional features and enhancements such as Delivery) and products marketed under our Real-time Performance Marketing suite, including our Dealer Display advertising and audience targeting products and our Dealer Search Engine Marketing product. We also generate advertising and other revenue from auto manufacturers and other auto‑related brand advertisers, as well as from non-dealer products such as through our consumer financing partnerships and our peer-to-peer marketplace. Our rapid revenue growth and financial performance over the last several years exemplify the strength of our marketplace. We generated revenue of$588.9 million in 2019, $454.1 million in 2018, and $316.9 million in 2017, representing year-over-year increases of 30% in 2019 and 43% in 2018. In 2019, we generated net income of $42.1 million and our Adjusted EBITDA, a non-GAAP financial measure, was $77.0 million, compared to net income of $65.2 million and Adjusted EBITDA of $49.7 million in 2018 and net income of $13.2 million and Adjusted EBITDA of $24.1 million in 2017. See “Selected Consolidated Financial Data — Adjusted EBITDA” for more information regarding our use of Adjusted EBITDA and a reconciliation of Adjusted EBITDA to our net income (loss).reach their destination.
ConsumerConsumers' Challenges
As consumers determinecomplete the end-to-end car they would like to purchase,shopping journey, the key questions they ask are:
| • Am I getting a fair price for my trade-in? • Should I purchase a vehicle with my trade-in? • What type of vehicle should I buy? • Where can I buy a car like this? • What is a fair price for this particular type of vehicle? • Have others had a good experience buying from this dealer? • How much of the purchase process can I transact online? • Can I obtain financing for this car, and at what cost? • What if this dealer is not local to my area?
|
|
|
|
|
|
|
|
In answering these questions, consumers historically had limited access to unbiasedtransparent information on specific vehicles, car pricing, and dealer reputation. Further, consumers who wanted to trade-in their vehicle or wanted to complete select elements of their car shopping journey online typically had very limited options. Every used carcar-shopping journey is a unique experience, and so for consumers searching for used cars, itembarking on this journey, there is difficult to aggregate the relevant inventory of available cars across sellers, a difficulty exacerbated by the lack of consistency in the way that dealers characterizeabsence of consistent information on pricing for both selling and purchasing vehicles. Selling a car’s attributes. Traditionally, dealers had more information about car prices thanvehicle was time-consuming and exhausting for consumers did, as consumers had limited resourcesthey travelled dealer to dealer to ensure they were receiving a fair and tools to determine an appropriate price.accurate price for their vehicle. Selecting the right dealer was also challenging for consumers as dealer reputations were historically based primarily on word‑of‑mouth.word-of-mouth. The lack of clear, unbiased, transparent information made it difficult for consumers to effectively compare vehicles, find the vehicles that best suited their needs and transact with well-regarded dealers. In addition, especially as a consequence of the COVID-19 pandemic, consumers are also increasingly interested in understanding which aspects of their buying journey they can complete online and are looking for ways to customize their journey to incorporate both online and in-person components.
Dealer5
Dealers' Challenges
Dealers have had to face a new set of challenges in the past year as a result of the worldwide semiconductor chip shortage impacting auto manufacturers' production levels. The shortage of both used and new car inventory over the past year has caused dealers to invest in additional methods to fill their lots as many physical wholesale auctions were impacted by the continued COVID-19 pandemic. Additionally, dealers have needed to remain competitive in their offers for consumer trade-ins, as consumers have increasing means to source multiple offers in this highly competitive market. The economics of dealerships depend largely on vehicle acquisition costs, sales volume, gross margin, and customer acquisition efficiency. To achieve a high return on their marketing investments, dealers must find in‑marketin-market consumers; yet because car purchases are infrequent,consumers may not frequently purchase a vehicle, only a small percentage of consumers are actively shopping for a car at any givenspecific point in time. Dealers additionally need to be strategic about selling vehicles before they are “aged inventory.” Traditional marketing channels that dealers utilize, including television, radio, and newspaper, can effectively target locally but are inefficient in targeting the relatively smallnarrow percentage of consumers who are actively in the market to buy a car. In addition, used car pricing is fluid because it is based on rapidly shifting supply and demand dynamics. Dealers need to find ways to manage constantly changing inventory and adjust pricing and purchasing strategies to adapt to frequently changing market conditions.conditions as evidenced by the previous year.
Our Strengths
We believe that our competitive advantages are based on the following key strengths:
Trusted Marketplace for Consumers.Consumers. We provide consumers with unbiasedtransparent information, intuitive search results, and other tools that empoweraid them to find “Great Dealsin their car-shopping journey. Furthermore, consumers can have confidence in the quality of the vehicles they search for in our marketplaces since less than one-third of eligible vehicle listings on CarGurus.com earn a Great Deal or Good Deal rating. We also enable bids on vehicle trade-ins and sales from Top-Rated Dealers.”the thousands of dealers in the CarGurus/CarOffer network, assuring consumers that they are receiving the best offer on their vehicle. We offer the largest online selection of new and used car listings of any major U.S. online automotive marketplace. We aggregate and analyze these listings using proprietary technology and data along with innovative data analytics to create a differentiated automotive search experience for consumers. We believe that providing a transparent consumer experience with unbiased information has instilled trust in us among our users, helping usconsumers to become the most visited online automotive marketplace in the United States according to databring them “Great Deals from Comscore.Top-Rated Dealers.” In 2019,2021, we experienced over 99.479.3 million average monthly sessions in the United States. See “Management’s Discussion and Analysis of Financial Condition and Results of Operations — Key Business Metrics” for how we define average monthly sessions. We believe this user traffic, an indicator of consumer satisfaction and engagement, is critical to our marketplace success and will continue to strengthen our market position. We attract our audience from a diverse range of acquisition channels including, but not limited to, direct navigation, mobile applications, email, organic search, paid search advertising, social media advertising, displayon-site advertising, audience targeting, and brand advertising
3
campaigns. In addition, we focus our efforts on attracting users that we believe are near a car purchasing decision, resulting in a higher quality audience to which our dealers can market. For our United States marketplace, in 2019 we generated 65.3 million connections and 38.5 million leads, compared with 62.2 million connections and 33.8 million leads in 2018. We define (i) connections as interactions between consumers and dealers via our marketplace through phone calls, email, managed text and chat, and clicks to access the dealer’s website and map directions to the dealership and (ii) leads as user inquiries via our marketplace to dealers by phone calls, email, or managed text and chat.
Proprietary Search Algorithms and Data‑DrivenData-Driven Approach. We have built an extensive repository of data on cars, prices, dealers, and the interactions between consumers and dealers that is the result of many years of data aggregation and regression modeling. Our proprietary search algorithms and data analytics allow us to use this valuable data to bring greater transparency to our platform. The primary product of this analysis is our determination of a used car’s IMV, which, together with Dealer Rating, drives our Deal Rating. We calculate IMV by applying more than 20 ranking signals and more than 100 normalization rules to tens of millions of data points, including the make, model, trim, year, features, condition, history, geographic location, and mileage of the car. With our acquisition of CarOffer in 2021, we have extended our proprietary search algorithms and data analytics to CarOffer’s Buying Matrix providing unique insights to dealers regarding their purchases in the wholesale space as well as up-to-date pricing information for the consumers they are servicing. We apply the knowledge gained from analyzing the growingsubstantial volume of connections between consumers and dealers on our platform to build new features for our consumers, IMV technology features on the Dealer Dashboard and new products for our dealers. These enhancements enable more informed consumers and dealers from the start of their car journey to the end.
6
Strong Value Proposition to Dealers. We believe that our marketplace offers an efficient customer acquisition channel for dealers, helping them achieve attractive returns on their marketing spend with us. With the acquisition of CarOffer, we have only increased efficiencies for dealers to source vehicles from both consumers and other dealers with the 24/7 online buy matrix. We provide our dealer base with connections to prospective car buyers; most of these connections have historically been for used cars.cars, and to prospective car sellers. The primary objective of our traffic acquisition and site improvements is to generate greater volumes of consumer leads to our dealers. These leads include phone calls, email, and managed text and chat interactions tofor dealers, which we believe yield the highest value engagement for dealers. Dealers are able to leverage our large consumer audience, our digital retail offerings and consumer trade-in service to provide more quality leads to their dealership, providing the highest return on their investment. We provide all dealers with tools that are informed by real‑timereal-time market conditions that help them acquire inventory, merchandise and sell their cars, and our paying dealers get access to additional valuable information from our Pricing Tool and Market Analysis tool. Additionally, with digital retail offerings we help level the online offering playing field for our dealer partners who are unable to provide these solutions to consumers on their own and/or wish to utilize our largest consumer audience to sell additional inventory with CarGurus' digital retail offerings. Our strong value proposition to the dealer community is evidenced by our 19%6% growth in quarterly average annual revenue per subscribing dealer, or AARSD,QARSD, in the United States in 2019the fourth quarter of 2021 compared to 2018.the fourth quarter of 2020.
Network Effects Driven by Scale. With the majority of dealers in the United States listing inventory on our platform and having built the most visited online automotive marketplace in the United States, according to data from Comscore, we believe that our scale creates powerful network effects that reinforce the competitive strength of our business model. Our large consumer audience increasesThis powerful network has only strengthened with our acquisition of CarOffer, as we are now able to provide dealers with opportunities to sell their inventory to other dealers. The launch of new digital offerings and IMCO has only increased our network as more consumers are attracted to our site to trade-in their vehicle or complete a portion of their car-shopping journey online, perpetuating even more leads to dealers increasing our appeal to dealers and incentivizesincentivizing more dealers to subscribe to our paid Listings packages to access the numerous benefits unavailable to non‑payingnonpaying dealers. Displaying listings from more paying dealers on our websites provides consumers with more dealer information and methods to contact those dealers. More consumers and connections drive greater value and a higher return to paying dealers’ marketing spend on our platform. Driven by these network effects, we continue to amass data points, which we use to further strengthen our traffic acquisition efforts and marketplace search algorithms, the utility of analysis complementing each listing, the quality of our user experience, the quality of our partnership with dealers to provide digital offerings, the value of connections between consumers and dealers as well as between dealers themselves, and the efficacy of our dealer digital marketing products.
Attractive Financial Model. We have a strong track record of revenue growth, profitability, and capital efficiency. We generated revenue of $588.9$951.4 million in 2019, $454.12021 compared to $551.5 million in 2018, and $316.9 million in 2017,2020, representing a year-over-year increasesincrease of 30% in 2019 and 43% in 2018. 73%. A significant portion of our revenue is recurring due to the subscription nature of our products. In 2019, 2018, and 2017,dealer marketplace subscription revenueproducts, including from our Listings packages, our Dealer DisplayReal-time Performance Marketing, or RPM, digital advertising and audience targeting products,suite, and our Dealer Search Engine Marketing product, all of which we consider to constitute recurring revenue, comprised 89% of total revenue in each year.CarOffer online wholesale platform. Furthermore, our revenue base is highly diversified due to the fragmented nature of the automotive dealer industry. We also have been able to grow and invest in our future growth while improving profitability due to the operating leverage in our business model. Our consolidated net income grew 42% in 2021 and 84% in 2020. As a percentage of revenue, our consolidated net income margin was 12% in 2021, compared with 14% in 2020. On a consolidated basis, while our revenue grew 30% in 2019 and 43% in 2018, our Adjusted EBITDA grew 55% in 20192021 and 106%109% in 2018.2020. As a percentage of revenue, our Adjusted EBITDA margin expanded to 13%was 26% in 2019 from 11%2021, compared with 29% in 2018 and from 8% in 2017.2020. In the United States, which is our most developed market, we grew our revenue by 27% in 2019 and 42% in 2018 while increasingincreased our income from operations to $73.9$158.5 million in 20192021 from $58.4$120.8 million in 20182020. See the “Management’s Discussion and $41.6 million in 2017.Analysis of Financial Condition and Results of Operations–Key Business Metrics–Adjusted EBITDA and Adjusted EBITDA Margin” section of this Annual Report on Form 10-K for more information about Adjusted EBITDA and Adjusted EBITDA margin.
Founder‑LedExperienced Management Team with Culture of Innovation. Our founder, Chief Executive OfficerChairman and Chairman of our Board of Directors, Langley Steinert, co‑founded and was previously chairman of TripAdvisor, an online marketplace for travel‑related content based on the mission of using technology and a data‑driven approach to provide transparency for consumers’ travel planning. Led by Mr. Steinert and a management team with extensive experience guiding technology companies in evolving industries – including Jason Trevisan, our Chief Executive Officer and Sam Zales, our President and Chief Operating Officer – we bring the same commitment to fostering a culture of innovation and delivering data-driven transparency to the automotive market.
47
Impacts of the COVID-19 Pandemic on our Business
The outbreak in 2020 of the novel strain of coronavirus that surfaced in Wuhan, China in December 2019 and was subsequently declared a pandemic by the World Health Organization, or COVID-19, resulted in a global slowdown of economic activity including worldwide travel restrictions, prohibitions of non-essential work activities, disruption and shutdown of businesses and uncertainty in global financial markets. Recently identified variants of COVID-19, Delta and Omicron, which appear to be more transmissible and contagious than previous COVID-19 variants, have caused an increase in the number of COVID-19 cases globally. As the COVID-19 pandemic continues to have an impact on global economic activity, the extent to which the COVID-19 pandemic will adversely impact our future business operations, financial performance and results of operations is uncertain and will depend on many factors outside of our control. For a further discussion of the risks, uncertainties and actions taken in response to the COVID-19 pandemic, refer to Item 1A “Risk Factors”.
Our Products
Transaction-Enabled Marketplace
Consumer MarketplaceExperience
We provide consumers an online automotive marketplace where they can search for new and used car listings from our dealers. With our U.S. marketplace’s peer-to-peer offering, consumers also have access to additional car listings from private sellers,dealers and are able to sell their carcars to dealers and other consumers. Through our marketplace, we provide consumers with information that helps them find the most relevant car for their needs. A user accesses our marketplace through our websites or in the U.S. and certain international markets, by using our mobile applications. Most users specify whether they are searching for used, certified pre‑owned, or new cars and then provide their desired vehicle make and model and their postal code. Our product offerings described below are available through ourfor the U.S. CarGurus marketplace; their availability internationally varies by country.on our other marketplaces varies. We also offer paid listings subscriptions for dealers and displaydealer advertising products throughfor the PistonHeads website, as well as paid listings subscriptions for dealers for the Autolist website.
Used and Certified Pre‑Owned Cars
Using our proprietary search algorithms, we immediately display the results of the consumer’s search, ranked by Deal Rating, on a search results page, or SRP. Eligible used car listings in our marketplace are assigned one of five Deal Ratings: Great Deal, Good Deal, Fair Deal, High Priced, or Overpriced. A Deal Rating illustrates how competitive a listing is compared to similar cars sold in the same region in recent history. A listing’s Deal Rating is based primarily upon the IMV of the vehicle and the Dealer Rating of the dealer.
Instant Market Value. IMV is a proprietary algorithm that determinesassesses the market value of a used vehicle in a local market and is a key input for determining a vehicle’s Deal Rating. The IMV algorithm is the product of many years of regression modeling utilizing tens of millions of used car data points. IMV takes into account a number of factors, including comparable currently listed and previously sold used cars in the local market and vehicle details including make, model, trim, year, features, condition, history, and mileage. OurThe IMV algorithm uses more than 20 ranking signals and more than 100 normalization rules that distill unstructured data from hundreds of sources across thousands of dealers.
Dealer Ratings. Dealer Ratings are derived from user‑generated content from our users’ experiences with dealers with which they have connected. To promote high‑quality reviews, we require that a user have interacted with the dealer via our marketplace to submit a review. We believe this requirement, together with additional qualification standards, results in a more valuable Dealer Rating. Dealer Rating is an important component of a listing’s Deal Rating and, as a result, can impact the organic search position of a listing.
Search Results Page. In addition to each car’s Deal Rating, our SRP provides users with other useful information, including the difference between the listing price and the IMV that we have determined for the car, mileage, Dealer Rating, and dealer location for paying dealers. We provide in‑depth search filters, including price, year, mileage, trim, color, options, condition, body style, miles per gallon, seating capacity, vehicle ownership history, usage history, seller type, and days on market, among others, which we believe deliver the most comprehensive search capability among major U.S. online automotive marketplaces. We also provide our users with additional features to aid their search, including similar vehicle recommendations, side‑by‑side vehicle comparisons, expert reviews, and user rankings. Our platform also gives users the ability to save searches and receive alerts that keep them informed of relevant developments in the market, including newly available inventory and price changes to cars they are monitoring.
Vehicle Detail Page. If a user clicks on one of the listings on the SRP, the user is taken to that listing’s vehicle detail page, or VDP. VDPs are designed to provide numerous photos and a comprehensive description of the vehicle, dealer name, address, and dealership information for paying dealers, detailed dealer reviews, methods to contact the dealer, payment calculators, and helpful information about the vehicle, including:
8
|
|
|
|
|
|
5
New Cars
Search results for new car listings are sorted by price of inventory matching the user’s search, with the lowest priced listings sorted first. Our new car VDPs include our Dealer Rating and many of the other features of our used car listings, such as Price History and Time on Site. Deal Rating is not applicable to new car listings because it utilizes data not relevant to new cars. Instead, we analyze data on manufacturers’ suggested retail prices, or MSRPs, and recent sales of similar new vehicles, accounting for trade-ins, incentives, and other factors that can affect the price of a new car, to provide users with comparative price information.
Sell My Car
We also allow our consumer usersconsumers to list their cars in both our peer-to-peer marketplaceand consumer-to-dealer marketplaces in the United States. Our peer-to-peer offering, Sell My Car, offering enables individual car owners to easily merchandise their vehicles, determine an appropriate selling price with our proprietary price guidance, and manage their listings and communications with prospective buyers from our audience. We offer services to facilitate financing, processing payment, titling, and other aspects of the private-sale transaction. We collect a fee when a consumer lists a vehicle on the peer-to-peer marketplace. See “— Wholesale and Consumer-to-Dealer” below for a description of our consumer-to-dealer offering, IMCO.
Autolist
Autolist provides consumers an online automotive marketplace through mobile applications on iOS and Android phones, as well as a website. The platform includes inventory from top automotive dealers across the sellingU.S. and gives consumers quick access to manage their search on the go with real-time alerts of newly available inventory and changes that occur on cars and saved searches they have configured. An independent editorial staff produces content to keep consumers informed on the latest vehicles and trends in the automotive market.
PistonHeads
PistonHeads is a U.K. automotive marketplace, forum, and editorial site geared towards automotive enthusiasts. The platform allows consumers to search across a broad range of dealer and private seller listings, engage with other automotive enthusiasts through forums, and stay informed about automotive news through editorial articles and expert reviews. Paying U.K. dealers who list on the CarGurus platform automatically have their inventory added to the PistonHeads site for greater consumer for these services.reach.
Dealer MarketplaceOfferings
Listings
Our marketplace connects dealers to a large audience of informed and engaged consumers. We offer multiple types of marketplace Listings subscriptions to dealers throughfor the CarGurus U.S. platform (availability varies on our platform:other marketplaces): Restricted Listings, which is free, and various levels of Listings packages, each of which requires a paid subscription. We price our paid Listings packages as a monthly, quarterly, semiannual, or annual subscription based on the dealer’s inventory size, region, and our assessment of the return on investment, or ROI our solution will provide them.
| • Restricted Listings. We allow non‑paying dealers to list their inventory in our marketplace as Restricted Listings. Restricted Listings do not display the name, address, website URL, or phone number of the relevant dealer and are subject to other limitations. Consumers can contact these dealers only through an anonymous, CarGurus‑branded email address so the dealer does not receive any of the consumer’s personal contact information from our platform. Dealers in our Restricted Listings tier are limited in the number of consumer connections they can receive in a month, with caps on lead volume based on the dealers’ inventory size. 9 • Paid Listings Subscriptions. Paying dealers are able to subscribe to one of four Listings package levels: Standard, Enhanced, Featured or Featured Priority. These paid Listings packages are designed to provide dealers with a higher volume and quality of connections and leads from consumers than our Restricted Listings option. Dealers that subscribe to a paid Listings package gain the opportunity to connect with consumers directly through email, phone, and – excluding Standard Listings subscriptions – managed text and chat, an offering by which consumers communicate via real-time chat or text message with our agents who act on behalf of dealers. Listings for all paying dealers on our websites include a link to their website, dealership branding and information such as name, address, and hours of operation, and map directions to their dealership, helping consumers easily contact or visit the dealer, which we believe results in increased local brand awareness and walk‑in traffic. A dealer that subscribes to our Featured or Featured Priority Listings package receives the same benefits of the Standard and Enhanced Listings packages, as well as opportunities for promotion of their Great Deal, Good Deal, and Fair Deal used inventory as well as their new inventory in a clearly labeled section at the top of the SRP as well as on the VDP of dealers in the Restricted Listings package. Featured Priority listings are specifically promoted in the first position of the SRP. This premium placement for Featured and Featured Priority listings generates increased connection volume relative to Standard or Enhanced Listings packages. In addition, a dealer that pays for our Enhanced, Featured or Featured Priority Listings package may subscribe to our Area Boost offering, which expands the visibility of a dealer’s inventory in the search results beyond its local market.
|
|
|
|
Dealer Dashboard and Merchandising Tools
All dealers with inventory on CarGurus may access the following Dealer Dashboard features and merchandising tools:
| • Performance Summary. Provides dealers with real‑time and historical data concerning the connections and consumer exposure they have received in our marketplace and through our digital marketing products. This enables dealers to analyze connections and SRP and VDP views at a granular level to inform the dealer’s sales and merchandising efforts. • Dealer Insights. Provides pricing analysis of the dealer’s inventory, as well as a summary of a vehicle’s missing information such as price, photos, or trim. This information helps dealers better merchandise their vehicles. • User Review Management. Allows dealers to track and manage – but not edit or manipulate – their dealer reviews from our users. Dealers can respond to users, report potentially fraudulent reviews, and publish positive reviews to social media platforms for broader exposure.
|
|
|
|
6
|
|
Dealers subscribing to a paid Listings package also have access to the following additional features and tools:
| • Pricing Tool. Helps dealers evaluate the impact of pricing changes for each used vehicle in their inventory and the resulting impact on the car’s Deal Rating, empowering dealers to make informed pricing decisions based on market data in their local area. • Market Analysis. Informs dealers of local market trends in used cars, such as the most searched makes and models in their local market. This information helps dealers align with local consumer preferences and inform strategies for increasing inventory turnover and efficient vehicle acquisition. • IMV Scan. Allows dealers to scan a vehicle identification number, or VIN, using their smartphone, and receive information on the IMV of the vehicle in order to support dealers in deciding what to pay for a vehicle at a wholesale auto auction. IMV Scan is built into the CarGurus mobile app and is currently available to U.S. dealers that pay for our Enhanced, Featured or Featured Priority Listings packages.
|
|
|
|
Dealer Digital Marketing and Customer Acquisition Products
We offer dealers subscribing to one of our Enhanced, Featured or Featured Priority Listings packages the followingaccess to additional advertising and customer acquisition products and enhancements marketed primarily under our Real-time Performance Marketing suite:
|
|
|
|
Auto ManufacturerRPM digital advertising suite. With RPM, dealers can reach our large and Other Advertiser Productsengaged automotive shopping audience through on-site advertising that appears in our CarGurus marketplace, on other sites on the internet and/or on high-converting social media platforms. RPM helps dealers build brand awareness and acquire customers to their website and dealership. Advertisements can be targeted by the user’s geography, search history, CarGurus website activity and a number of other targeting factors. This product suite allows dealers to increase their visibility with in-market consumers and drive qualified traffic to their websites.
Our10
Pricing and Packaging
We offer our Listings product suite through a tiered set of packages. Listings are priced on a monthly, quarterly, semiannual, or annual subscription basis based on the dealer’s inventory size, region, and our assessment of the ROI we expect to deliver. For improved performance, dealers can purchase higher Listings suite levels and add-ons available at an existing Listings suite level. Dealers may be renewed at higher rates commensurate with growth and updated performance expectations. RPM is also packaged in a tiered solution, and priced as a percentage of Listings while accounting for factors such as dealership characteristics and performance expectations.
Wholesale and Consumer-to-Dealer
Digital Wholesale
As the automotive industry continues to move further online, it has become even more important for dealers not only to sell their vehicles effectively at retail, but also to acquire the right inventory in the first place via wholesale transactions. In recent years, wholesale vehicle sales have begun shifting online and those trends have accelerated as a result of the COVID-19 pandemic. The industry is moving away from traditional in-person physical auction models and towards online transactions that are easier, faster, and reduce the effect of geographic constraints.
In January 2021, we completed our acquisition of a 51% ownership interest in CarOffer, a modern-day automotive inventory transaction platform that allows dealers and dealer groups to buy, sell, and trade online with automation and ease. The acquisition added wholesale vehicle acquisition and selling capabilities to our portfolio of dealer offerings, creating a powerful new digital solution for dealers to sell and acquire vehicles at both retail and wholesale. Unlike traditional vehicle auctions which require manual bidding and vehicle evaluation, CarOffer’s proprietary Buying Matrix technology enables buying dealers to create standing buy orders and provides instant offers auto manufacturers and others the abilityto selling dealers.
Consumer-to-Dealer Offering
During 2020, we conducted a pilot that enabled dealers to purchase display advertisinginventory directly from consumers who visited our site. The consumer entered their vehicle information on the Sell My Car page, and we helped facilitate the transaction with the buying dealer. We collected a transaction fee from the dealer for this service.
In 2021, our sitesCarOffer acquisition also helped facilitate our launch of an updated consumer offering, IMCO, which allows consumers in certain states to execute targeted marketing strategies:sell their vehicles to dealers entirely online. This offering provides dealers access to a fresh source of trade-in inventory and helps ensure liquidity amongst CarOffer’s platform. Through IMCO, consumers who are trading-in or selling vehicles enter easy-to-answer questions regarding their vehicle and are instantly presented with the most competitive offer sourced from in-network dealers. Once the customer has saved their offer, they can further customize their experience by arranging a location of their choice to have the vehicle picked-up and transported. In this model, CarOffer processes the transaction directly and collects transaction and other fees from the dealer.
Digital Retail In recent years, both consumer demand and dealer receptiveness to digital retail has increased, as consumers have become more comfortable transacting some or all of their car buying processes online. We are focused on addressing the needs of both consumers and dealers in this growing segment of automotive digital retail. Consumer Finance |
|
|
|
|
|
|
|
|
Consumer Financing Partnerships
Through our partnerships with automotive lending companies, we allow eligible consumers on our U.S. websitemarketplace to pre-qualify for financing on cars from dealerships that offer financing from these partners. We primarily generate revenue from these partnerships based on the number of funded loans from consumers who pre-qualify with our lending partners through our site. We believe this program both provides more transparency to car shoppers about actual payments to be offered at the dealership specific to participating lenders, as well as delivers highly qualified car shopper leads to participating dealers.
711
Area Boost
We offer the ability for dealerships to expand their VDP geographic footprint to non-local customers via dealer home delivery services. Revenue is generated through fees charged to the dealership to enable listings beyond the default geographical radius. We believe this program provides additional vehicle options to car shoppers open to home delivery services while promoting participating dealers’ delivery capabilities and increasing non-local VDP views.
Buy Online
We continue to offer consumers the ability to transact additional elements of their car buying experience through our websites as they seek to complete more of this process online. For example, our shoppers can ‘start purchase’ or ‘buy now’ from a VDP on eligible listings and utilize purchase options, including but not limited to estimating a car’s trade-in value, deciding payment options, selecting finance and insurance products, and placing a reservation deposit.
Auto Manufacturer and Other Advertiser Products
Our platform offers auto manufacturers and others the ability to purchase advertising on both our sites and third‑party websites, including social media platforms, to execute targeted marketing strategies:
International
We also facilitate high-intent consumers to engage with automotive dealers in both Canada and the U.K. Like our U.S. offerings, CarGurus provides consumers in Canada and the U.K. with a transparent shopping experience, using our proprietary algorithms to determine market specific valuations for vehicles, and ordinating our organic search results based on Deal Ratings.
In Canada, CarGurus is a leading automotive marketplace that provides consumers a transparent shopping experience whether they are looking for a new or used car. In the U.K., CarGurus is a leading marketplace for dealers’ listings of used vehicles, providing consumers with one of the broadest selections of inventory in the U.K. We also provide automotive shoppers rich expert review content, an active forum for automotive discussion, and offer privately owned inventory through the PistonHeads website.
Marketing and Brand
Consumer Marketing
Our marketing initiatives aim to drive brand awareness and engagement among consumers and dealers and to position us as a trustedCarGurus is the most visited online automotive marketplace.
Consumer Marketing
marketplace in the United States, with more than 79.3 million and 31.6 million average monthly sessions and unique users, respectively in 2021. We have built our audience on the strength of our user experience, and we remain focused on delivering an engagingindustry-leading consumer marketplace. Our intuitive search experience, combined with the largest inventory of any major U.S. online automotive marketplace and relevant content, updates, and tools provide unparalleled transparency and decision-support to consumers during their car search to help them buy with confidence. The strength of theour consumer experience that we offer is one of our most powerful marketing tools. By providing an intuitivetools, with “word of mouth” representing the second-most cited influence on consumers decision to visit CarGurus despite our substantial investments in paid marketing. This leading consumer experience also enables CarGurus to perform very well with search experience in our marketplace and relevant content, updates, and tools to consumers during theirengines, generating a significant volume of free traffic from high-intent car search, we believe that the users who comprise our large and engaged audience provide informal endorsements to other consumers, more powerful than most marketing messages.shoppers.
Historically,12
A key pillar of our consumer marketing efforts were focused primarily onis what we call algorithmic traffic acquisition. We employ a team of strategists, engineers and data scientists that optimizes our user acquisition through search engines, social media, and other digital marketing channels and has tested over 1one billion keywords on various search engines as well as sophisticated, personalized remarketing,re-marketing, to nurture consumers toward finding thetheir right car for them.car. The sophistication of our data-driven algorithmic traffic acquisition continues to advance, with an ongoing focus on increasingly data-driven campaigns that drive high return on advertising spend. We believe our expertise in this area constitutes a competitive advantage over less sophisticated competitors and those who outsource these capabilities.
In parallel with our sophisticated paid and organic traffic acquisition efforts, we invest significant resources in optimizing our site experience and retention marketing efforts, including through email and app notifications, to help consumers find the right car for them and connect with a dealer to make a purchase. Rigorous conversion rate optimization efforts help increase the ROI on our advertising spend. Our increasing focus on merchandising that drives more shoppers to connect with dealers with high subscription expansion opportunity is intended to create a virtuous cycle of improved monetization that allows for reinvestment in further improvements to our consumer experience.
We augment our performance marketing, conversion rate optimization and retention marketing efforts with brand‑building efforts. Our brand marketing efforts are primarily comprised of (i) investments in media, including television and online video, as well as ongoing efforts to convey(ii) expressing our unique brand value proposition throughout our core site experience. Theseexperience and organic social channels, and (iii) an active public relations program that allows us to gain significant, high-credibility earned media coverage. Despite a shorter tenure and lower investment in brand efforts launched more recentlymarketing than our algorithmic traffic acquisition efforts, resulting in brand awareness that remains lower than some other major U.S. online automotive marketplaces in the United States despite our large monthly audience and high user engagement. Weprimary competitors, we have made significant progress intoward closing our brand awareness gaps since launching brand marketing in 2017 and believe that we are well‑positioned to continue to strengthen our brand by continuing to invest in brand-building efforts and refining the articulation of our unique value proposition. As we close the awareness gap compared to our primary competitors, we see significant opportunity to shift our brand building efforts, particularly givenfocus from reach to driving greater understanding of and preference for our trusted product, which delivers well onbrand, further accelerating the brand promisesstrong consumer engagement and word of mouth benefits we convey.already enjoy.
Our vehicle listing data, on‑site user behavior, connections between consumers and dealers, and opinion data from our users create significant opportunities for us to develop and publish car shopping insights and information about industry trends. We consistently gain earned media coverage in national, regional, and trade press outlets as well as social channels by leveraging our proprietary data to inform newsworthy content.
Dealer Marketing
The primary goals of our dealer marketing initiatives are to acquire dealers not yet in our marketplace, convert non‑paying dealers into paying dealers, retain our existing paying dealers, and increase annual subscription revenuesproduct adoption and usage from our paying dealers. Our dealer marketing efforts aim to:
• Educate Dealers on the End-to-End Inventory Solutions We Offer, the Quality of Our Audience and Products, and Attractive ROI. We educate dealers on the increased breadth of solutions we offer, including wholesale buying and selling of inventory, marketing via our core Listings products and other tools, and our growing suite of retailing solutions. We promote the quality of our audience by touting our industry‑leading audience, our strong user engagement, and the large number of connections that we facilitate through our marketplace.We also highlight to dealers how unique features of our platform, such as our consumer financing features and proprietary IMV analytics, yield consumers that we believe are more informed and better prepared to purchase at the dealership, which can lead to a higher ROI for the dealers’ marketing spend. • Provide Thought Leadership that Educates Dealers on Industry Trends. We generate insightful content on market trends and best practices in digital advertising that are shared through webinars, dealer forums, dealer advisory councils, our websites, and our participation in industry conferences and events. From time to time, we also host thought leadership events in local markets and an automotive conference, Navigate, to continue to share our insights and help build our brand among dealerships. In light of the COVID-19 pandemic, we shifted almost all of our in-person events, including Navigate, to fully virtual events to continue to provide thought leadership to dealers during these challenging times. In particular, we helped address their challenges by sharing the latest research and data-driven insights on how shopper behavior has evolved and continues to evolve during this global pandemic. • Provide Best Practices to Assist Dealers in Becoming More Successful. We provide ongoing communications through email, webinars, white papers, testimonials, and videos, which show dealers how to use our products to position their inventory for success on our platform and beyond , as well as broader guidance on marketing, sales, operations, and other aspects of running a more profitable dealership. We maintain consistent communication with dealers via email, events and our Dealer Dashboard to ensure awareness of account performance and recent product updates, and we empower our sales and account management teams with resources to directly provide education and assistance to our dealer partners. 13 • Drive Product Engagement. We use our email marketing capabilities and other marketing channels to drive dealer engagement with our products and platforms. This can include automated, personalized marketing about how dealers can improve vehicle pricing and merchandising by using the tools in our dashboard, performance insights around the leads and connections they are receiving, and prompts to respond to reviews and manage their reputation. We also monitor dealer feedback on our products through surveys and product engagement to assess areas for further development or dealer education. Competition We face competition to attract consumers and paying dealers to our marketplaces and services and to attract advertisers to purchase our advertising products and services. Our competitors offer various marketplaces, products, and services that compete with us. Some of these competitors include: • major U.S. online automotive marketplaces: AutoTrader.com, Cars.com, and TrueCar.com; • other U.S. automotive websites, such as Edmunds.com, KBB.com and Carfax.com; • online automotive marketplaces and websites in our international markets; • online dealerships, such as Carvana and Vroom; • sites operated by individual automobile dealers; • internet search engines; • social media marketplaces; • peer-to-peer marketplaces, such as Craigslist; and • vehicle auction companies, including digital wholesale platforms. Competition for Consumers and Dealers We compete for consumer visits with other online automotive marketplaces, free listing services, general search engines, online dealerships and dealers’ websites. We compete for consumers primarily on the basis of the quality of the consumer experience and the breadth of offerings that we are able to provide. We believe we compete favorably on user experience due to the number of our vehicle listings, the transparency of the information we provide on cars, prices, and dealers, the intuitive nature of our user interface, and our mobile user experience, among other factors. We compete for dealers’ marketing spend with offline customer acquisition channels, other online automotive marketplaces, dealers’ own customer acquisition efforts on search engines and social media marketplaces, and other internet sites, online dealerships and vehicle auction companies that attract consumers and dealers searching for vehicles, as applicable. We compete primarily on the basis of the ROI that our marketplace offers and the synergies provided by the combination of our foundational listings business with digital wholesale and digital retail offerings. We believe we compete favorably due to our large user audience, high user engagement, and the volume and quality of connections we provide to well-informed consumers, which results in an attractive ROI for dealers. Competition for Advertisers We compete for a share of advertisers’ total marketing budgets against media sites, websites dedicated to helping consumers shop for cars, major internet portals, search engines, and social media sites, among others. We also compete for a share of advertisers’ overall marketing budgets with traditional media, such as television, radio, magazines, newspapers, automotive publications, billboards, and other offline advertising channels. We compete for advertising spend based on the marketing ROI that our marketplace provides. We believe we compete favorably due to our large user audience size, high user engagement, and the effectiveness and relevance of our advertising products. 14 Seasonality Across the retail automotive industry, consumer purchases are typically greatest in the first three quarters of each year, due in part to the introduction of new vehicle models from manufacturers and the seasonal nature of consumer spending. Additionally, the volume of wholesale vehicle sales can fluctuate from quarter to quarter caused by several factors, including the timing of used vehicles available for sale from selling customers, the seasonality of the retail market for used vehicles and/or inventory challenges in the automotive industry, which affect the demand side of the wholesale industry. Macroeconomic conditions, such as the global semiconductor chip shortage, can also effect the volume of wholesale vehicle sales. To date, our overall operating results have not reflected the general seasonality of the automotive industry or wholesale vehicle sales market, but this could possibly change once our business and markets mature. |
|
|
|
|
|
8
Sales
Our sales team is responsible for bringing dealers onto our marketplace, and converting non-paying dealers to paid subscriptions.subscriptions and increasing dealer participation in new products that CarGurus is bringing to market. We have built an efficient inside sales and account managementservice team of approximately 350300 employees worldwide who sell our marketplace products to franchise and independent dealers. We have built a field sales team that works with strategic franchise and national dealership groups in large metropolitan areas in the U.S., Canada, and the U.K. In addition, we have advertising sales employees based in Cambridge, Massachusetts; Detroit, Michigan; Los Angeles, California;the U.S. and certain foreign locations.Canada.
We have a comprehensive dealer account management process to assist dealers in becoming successful in our marketplace. We assign a Customer Success Associate to every new paying Listings dealer to assist with onboardingon-boarding and integration with any relevant software systems. The designated Customer Success Associate spends time educating dealers on a range of topics, including effectively using the Dealer Dashboard, tracking sales, and measuring ROI for their marketing spend. After the onboardingon-boarding period, a Dealer Relations Account Manager is designated to assist the dealer in utilizing our tools and maximizing ROI from our offerings, including optimizing inventory acquisition, effectively pricing vehicles, vehicle merchandising, and keeping inventory up to date with complete vehicle information. We believe thisour active communication with our dealers fosters customer satisfaction and increases customer retention.
People and Talent
Our investment in our greatest asset – our people – is integral to our core values, evidenced by our inclusion of employee engagement, retention targets and cultural efforts as components of our 2021 strategic and organizational initiatives. Our Board of Directors oversees our people and talent efforts and views building our culture – from employee development and retention to diversity, equity, inclusion and belonging initiatives – as key to driving long-term value for our business and helping to mitigate risks.
As of December 31, 2021, we had 1,203 full-time employees, 75 of whom were based outside the United States and 288 of whom were employed through CarOffer. None of our employees is represented by a labor union or covered by a collective bargaining agreement.
Culture, Values and EmployeesStandards
Our company culture has developed out of our data‑drivendata-driven and innovative approach to the automotive market. We leverage data to drive innovation across all facets of our business and continuously optimize our products and processes to serve our consumers, dealers, advertisers, and partners. Our approach emphasizes original thought, impact, and collaboration across our organization, and we recognize and award employees who drive positive impactresults across these constituencies. We encourage collaboration across our entire workforce and invest in creating a work environment that facilitates partnership among our employees and promotes diversity, equity, inclusion and inclusion.belonging. In that spirit, we have identified our core values as follows:
|
|
|
|
|
|
15
|
|
• |
|
|
|
We have wonintegrity. We act responsibly and consider the impact of our actions on each other, our partners and the world around us. We believe empathy, respect and fairness are essential. We set high ethical standards and expect principled leadership from our people.
Diversity, Inclusion and Belonging and Equal Employment Policy
We are an equal opportunity employer and strive to build and nurture a numberculture where inclusiveness is a reflex, not an initiative. With support from our Diversity, Inclusion and Belonging Advisory Team, we seek to foster diversity, equity, inclusion and belonging, and to build a workplace where everyone can thrive. Our commitment to these efforts helps us attract and retain the best talent, enables employees to realize their full potential and drives high performance through innovation and collaboration. In 2021, based on data from employees who chose to self-identify, we increased representation among women and non-binary employees (32.8% to 35.1%) and underrepresented racial minorities (30.0% to 30.1%) within our U.S. workforce. We also saw year-over-year increases in the U.S. among women and non-binary employees in technical (23.3% to 25.9%) and management-level roles (34.2% to 38.6%), as well as among underrepresented racial minorities in technical roles (43.6% to 45.7%).
Compensation and Benefits
The success of awards recognizing our strongbusiness is fundamentally connected to the well-being of our people. Accordingly, we provide our eligible employees with competitive wages and access to flexible and convenient medical programs intended to meet their needs and the needs of their families. In addition to standard medical coverage, we offer the following benefits to our U.S. employees (availability internationally varies): dental and vision coverage, health savings and flexible spending accounts, paid time off, flexible work schedules on a case-by-case basis, employee assistance programs, short term and long term disability insurance and term life insurance, as well as paid access to certain wellness and family care resources. In response to the COVID-19 pandemic, we implemented changes that we determined were in the best interest of our employees, as well as the communities in which we operate, and which comply with government regulations. These changes included requiring our employees to work from home.
Employee Engagement
Each year, we conduct an employee engagement survey to help our management team gain insight into and gauge employees’ feelings, attitudes, and behaviors around working at CarGurus. Our latest survey, completed in September 2021, had a participation rate of approximately 85% of our eligible employees worldwide. The survey results indicated that we excelled in areas including manager empathy, career development, belonging, as well as overall excitement about CarGurus’ future. Based on employee feedback, we also identified certain company-wide opportunity areas to improve engagement and drive long-term success. Our culture including and commitment to building a workplace where we can all thrive has been recognized externally with the following awards: Built In Boston’s “Best Places to Work” in 2019, 2020, 2021 and 2022; the Mass TLC “Tech Top 50” Company Culture in 2020; Fortune’s “Best Places to Work” in 2019, 2019; Computerworld’s “Best Places to Work in IT” in 2019 and 2020; Boston Business Journal’s “Best Places to Work” for five years in a row from 2015, to2016, 2017, 2018, 2019 and 2021; Boston Globe’s “Top Place to Work” in 2014, 2015, 2016 and 20182018; and the Mass TLC CompanyComparably’s 2021 “Best Perks & Benefits”, “Best Work-Life Balance”, and “Best CEO”.
Training and Development
Our people and talent strategy is essential for our ability to continue to develop and market innovative products and customer solutions. We continually invest in our employees’ career growth and provide employees with a wide range of the Year award in 2018.
As of December 31, 2019, we had 921 full‑time employees, 105 of whom were based outside the United States. Nonedevelopment opportunities, including mandatory quarterly compliance training courses as well as one-on-one, virtual, social and self-directed learning, mentoring, coaching, and external development. In 2021, nearly 100% of our employees is represented by a labor union or covered by a collective bargaining agreement. We have not experienced any work stoppages,participated in learning and we consider our relations with our employees to be good.development activities worldwide.
916
Technology and Product Development
We are a technology company focused on innovative, actionable data analysis. We design our mobile and web products to create an unbiased,a transparent experience for both consumers and dealers. We believe in rapid development, release frequent updates and have internal tools and automation that allow us to efficiently evolve our products. Our software is built using a combination of internally developed software, third‑partythird-party software and services, and open source software.
Our Search Technology
Our search and ranking technology is served by a proprietary in‑memory search index solution that is scalable, fast, and extensible, allowing us to expand more easily into new markets, as demonstrated by our international marketplace launches.extensible. We have highly flexible interfaces that allow dealers to automatically add their inventory to our index, enabling us to quickly integrate hundreds of inventory sources with minimal effort and easily support inventory growth.
Our Mobile Technology
We have designed our marketplace to appeal to mobile users by developing our products with a mobile‑first mindset. All of our search results pages use a single‑page application type approach to eliminate page reloads and improve responsiveness. We also use techniques to load content onto a user’s mobile device more efficiently.
Our Integrations
We make available several application program interfaces and web widgets that integrate with customer relationship management and inventory management solutions, among other platforms. These integrations allow dealers to incorporate designated data and tools into the fabric of their marketing and customer engagement strategies. For example, our Deal Rating Badges are used on dealerwebsites, which show our Deal Rating for cars that have been rated as a Great Deal, Good Deal, or Fair Deal. Our Deal Rating serves as trusted, third‑party validation on dealer websites.
Infrastructure
Our development servers and U.S. and Canadian websites are hosted at third-party data centers in the U.S. near each of Boston, Massachusetts and Dallas, Texas, as well as through third-party cloud services in the U.S. Our European websites are hosted on third-party cloud computing services near each of London, England.England and Dublin, Ireland. We use third-party content distribution networks to cache and serve many portions of our sites at locations across the globe. We monitor and test at the application, host, network, and full site levels to maintain availability and promote performance. We use third-party cloud computing services for many data processing jobs and backup/recovery services.
Competition
We face competition to attract consumers and paying dealers to our marketplace and to attract advertisers to purchase our advertising products and services. Our competitors offer various marketplaces, products, and services that compete with us. Some of these competitors include:
|
|
|
|
|
|
|
|
|
|
|
|
|
|
|
|
10
Competition for Consumers and Dealers
We compete for consumer visits with other online automotive marketplaces, free listing services, general search engines, and dealers’ websites. We compete for consumers primarily on the basis of the quality of the consumer experience. We believe we compete favorably on user experience due to the number of our vehicle listings, the unbiased transparency of the information we provide on cars, prices, and dealers, the intuitive nature of our user interface, and our mobile user experience, among other factors.
We compete for dealers’ marketing spend with offline customer acquisition channels, other online automotive marketplaces, dealers’ own customer acquisition efforts on search engines, and other internet sites that attract consumers searching for vehicles. We compete primarily on the basis of the ROI that our marketplace provides. We believe we compete favorably due to our large user audience, high user engagement, and the volume and quality of connections we provide to well‑informed consumers, which results in an attractive ROI for dealers.
Competition for Advertisers
We compete for a share of advertisers’ total marketing budgets against media sites, websites dedicated to helping consumers shop for cars, major internet portals, search engines, and social media sites, among others. We also compete for a share of advertisers’ overall marketing budgets with traditional media, such as television, radio, magazines, newspapers, automotive guide publications, billboards, and other offline advertising channels. We compete for advertising spend based on the marketing ROI that our marketplace provides. We believe we compete favorably due to our large user audience size, high user engagement, and the effectiveness and relevance of our advertising products.
Intellectual Property
We protect our intellectual property through a combination of patents, copyrights, trademarks, service marks, domain names, trade secret protections, confidentiality procedures, and contractual restrictions.
We have threeone issued U.S. patent with an expiration date of May 2034, two pending U.S. patent applications, and onetwo pending international patent application.applications. These applications cover proprietary technology that relates to various functionalities on our platform, generally in connection with pricing, ranking and detecting fraud in online listings. We intend to pursue additional patent protection to the extent we believe it would be beneficial to our competitive position.
We have a number of registered and unregistered trademarks, including “CarGurus,” the CarGurus logo, the CG logo, and related marks, which we have registered as trademarks in the United StatesU.S. and certain other jurisdictions. We pursue additional trademark registrations to the extent we believe doing so would be beneficial to our competitive position. Additionally, CarOffer has a number of registered and unregistered trademarks, including “CarOffer” and the CarOffer logo, and related marks, which CarOffer has registered as trademarks in the U.S. CarOffer pursues additional trademark registrations to the extent it believes doing so would be beneficial to its competitive position. Our and CarOffer’s registered trademarks remain enforceable in the countries in which they are registered for as long as we and CarOffer, as applicable, continue to use the marks, and pay the fees to maintain the registrations, in those countries.
We are the registered holder of several domestic and international domain names that include “CarGurus” and variations of our trade names.
17
In addition to the protection provided by our intellectual property rights, we enter into confidentiality and proprietary rights agreements with our employees and relevant consultants, contractors, and business partners. We control the use of our proprietary technology and intellectual property through provisions in contracts with our customers and partners and our general and product-specific terms of use on our websites.
Regulatory
Various aspects of our business are, may become, or may be viewed by regulators from time to time as subject, directly or indirectly, to U.S. federal, state, local and foreign laws and regulations. In particular, the advertising and sale of new or used motor vehicles is highly regulated by the states and jurisdictions in which we do business. Although we do not sell motor vehicles and we believe that vehicle listings on our sites are not themselves advertisements, regulatory authorities or third parties could take the position that some of the laws or regulations applicable to dealers or to the manner in which motor vehicles are advertised and sold generally are directly applicable to our business. These advertising laws and regulations, which often originated decades before the emergence of the internet, are frequently subject to multiple interpretations, are not uniform across jurisdictions, sometimes impose inconsistent requirements with respect to new or used motor vehicles, and the manner in which they should be applied to our business model is not always clear. Regulators or other third parties could take, and on some occasions have taken, the position that our marketplace or related products violate applicable brokering, bird‑dog,birddog, consumer protection, or advertising laws or regulations.
11Our wholesale operations through CarOffer are regulated by the states in which we operate and by the U.S. federal government. These activities may also be subject to state and local licensing requirements. Additionally, we may be subject to regulation by individual state dealer licensing authorities and state consumer protection agencies.
In order to operate in this regulated environment, we develop our products and services with a view toward appropriately managing the risk that our regulatory compliance, or the regulatory compliance of the dealers whose inventory is listed on our websites, could be challenged.
We consider applicable advertising and consumer protection laws and regulations in designing our products and services. With respect to paid advertising, other than Featured Listings, Featured Priority Listings and Dealer Display advertising and audience targeting products marketed under our Real-time Performance MarketingRPM digital advertising suite, we believe that most of the content displayed on the websites we operate does not constitute paid advertising for the sale of motor vehicles. Nevertheless, we endeavor to design theour website content in a manner that would comply with relevant advertising regulations and consumer protection laws if, and to the extent that, the content is considered to be vehicle sales advertising.
Our websites and mobile applications enable us, dealers, and users to send and receive text messages and other mobile phone communications, which requires us to comply with the Telephone Consumer Protection Act, or TCPA, in the U.S. The TCPA, as interpreted and implemented by the Federal Communications Commission, or the FCC, and federal and state courts, imposes significant restrictions on utilization of telephone calls and text messages to residential and mobile telephone numbers as a means of communication, particularly when the prior express consent of the person being contacted has not been obtained.
In addition, we are subject to numerous federal, national, state, and local laws and regulations in the United States and around the world regarding privacy and the collection, processing, storage, sharing, disclosure, use, cross-border transfer, and protection of personal information and other data. While the scope of these laws and regulations is changing and remains subject to differing interpretations, we seek to comply with industry standards and all applicable laws, policies, legal obligations, and industry codes of conduct relating to privacy and data protection. We are also subject to the terms of our privacy policies and privacy-related obligations to third parties.
Corporate Information
We were originally organized on November 10, 2005 as a Massachusetts limited liability company under the name “Nimalex LLC.” Effective July 15, 2006, we changed our name to “CarGurus LLC.” On June 26, 2015, we converted from a Delaware limited liability company into a Delaware corporation and changed our name to “CarGurus, Inc.”
Our principal executive offices are located at 2 Canal Park, 4th Floor, Cambridge, Massachusetts 02141, and our telephone number is (617) 354-0068. Our U.S. website is www.cargurus.com. Information that is contained on, or that can be accessed through, our websites is not incorporated by reference into this Annual Report on Form 10-K, and you should not consider information on our websites to be part of this Annual Report on Form 10-K.
CarGurus, the CarGurus logo, and other trademarks or service marks of CarGurus appearing in this Annual Report on Form 10-K are the property of CarGurus, Inc. Trade names, trademarks, and service marks of other companies appearing in this Annual Report on Form 10-K are the property of their respective holders. We have omitted the ® and ™ designations, as applicable, for the trademarks used in this Annual Report on Form 10-K.
18
Additional Information
The following filings are available on our investor relations website after we file them with the Securities and Exchange Commission, or the SEC: Annual Reports on Form 10-K, Quarterly Reports on Form 10-Q and Proxy Statements for our annual meetings of stockholders. These filings are also available for download free of charge on our investor relations website. Our investor relations website is located at http://investors.cargurus.com. You may obtain copies of these documents by mail from the Public Reference Section of the SEC, 100 F Street, N.E., Room 1580, Washington, D.C. 20549. The SEC also maintains a website that contains reports, proxy statements and other information about issuers, like us, that file electronically with the SEC. The address of that website is https://www.sec.gov.
We webcast our earnings calls and certain events that we participate in or host with members of the investment community on our investor relations website. Additionally, we provide news and announcements regarding our financial performance, including SEC filings, investor events, press and earnings releases, on our investor relations website. Corporate governance information, including our policies concerning business conduct and ethics, is also available on our investor relations website under the heading “Governance.” No content from any of our websites is intended to be incorporated by reference into this Annual Report on Form 10-K or in any other report or document we file with the SEC, and any reference to our websites is intended to be an inactive textual reference only.
12
19
Item 1A. Risk Factors.
Investing in our Class A common stock involves a high degree of risk. You should carefully consider carefully the risks and uncertainties described below, together with all of the other information contained in this Annual Report on Form 10-K, including “Management’s Discussion and Analysis of Financial Condition and Results of Operations” and our audited consolidated financial statements and related notes, before evaluating our business. Our business, financial condition, operating results, cash flow, and prospects could be materially and adversely affected by any of these risks or uncertainties. In that event, the trading price of our Class A common stock could decline. See “Special Note Regarding Forward‑Looking Statements.”
Risks Related to Our Business and Industry
Our business has been, and we expect it to continue to be, adversely affected by the COVID-19 pandemic.
The COVID-19 pandemic has caused an international health crisis and resulted, and may continue to result, in significant disruptions to the global economy as well as businesses and capital markets around the world. Recently identified variants of COVID-19, Delta and Omicron, which appear to be more transmissible and contagious than previous COVID-19 variants, have caused an increase in the number of COVID-19 cases globally. The impact of COVID-19 and, in particular, the Delta and Omicron variants or other variants that may emerge, cannot be predicted at this time, and could depend on a number of factors, including the availability of vaccines in different parts of the world, vaccination rates among the population, and the effectiveness of COVID-19 vaccines against the Delta and Omicron variants and any other variants that may emerge.
Our operations have been and may continue to be materially adversely affected by a range of factors related to the COVID-19 pandemic. In March 2020, we temporarily closed all of our offices and began requiring, subject to limited exceptions, all of our employees to work remotely until further notice, which has disrupted and may continue to disrupt how we operate our business. In addition, in an effort to limit the spread of COVID-19, Canada and the United Kingdom, as well as states and localities in the United States, implemented or mandated, and some continue to, or may in the future, implement or mandate, significant restrictions on travel and commerce, shelter-in-place or stay-at-home orders, and business closures, and these government responses may increase in light of the increase in the number of COVID-19 cases as a result of the Delta and Omicron variants. Fluctuation in infection rates in the regions in which we operate has resulted in periodic changes in restrictions that vary from region to region and may require rapid response to new or reinstated orders. Many of these orders resulted in, and may continue to result in, restrictions on the ability of consumers to buy and sell automobiles by restricting operations at dealerships and/or by closing or reducing the services provided by certain service providers upon which dealerships rely. In addition, these restrictions and continued concern about the spread of the disease have impacted car shopping by consumers and disrupted the operations of car dealerships, which has adversely affected and may continue to adversely affect the market for automobile purchases.
The automotive industry is also facing, and may continue to face, inventory supply problems, including for reasons attributable to the COVID-19 pandemic and other macroeconomic issues, such as the global semiconductor chip shortage. This decline in vehicle inventory has led to an increase in bids per vehicle at auction and corresponding increases to wholesale auction prices. As the price of replenishing inventory through wholesale auctions has increased, dealers have increased, and may continue to increase, the prices they charge consumers. A high volume of price increases on vehicle sales at a rapid rate could impact our proprietary IMV and distribution of Deal Ratings. In addition, if our paying dealers continue to operate at reduced inventory levels or with increased costs, they may reduce or be unwilling to increase their advertising spend with us and/or may terminate their subscriptions prior to the commencement of the applicable renewal term. Our ability to add new paying dealers or increase our fees with dealers may be impeded if dealers perceive they have less of a need for our products and services because of their limited inventory. Inventory challenges in the automotive industry have adversely impacted, and could continue to adversely impact, the amount of inventory on our websites and have contributed to higher prices and reduced lease options for new vehicles, which in turn has reduced, and may continue to reduce, consumer demand, which could contribute to a decline in the number of consumer visits to our websites and/or the number of connections between consumers and dealers through our marketplaces. These inventory-related issues resulting from the COVID-19 pandemic and other macroeconomic issues may materially and adversely impact our business, financial condition and results of operations.
As a result of the travel and commerce restrictions that have been implement or that may be implement as a result of the Delta and Omicron variants and any future variants that may emerge, and the corresponding impact on their businesses, a number of our dealer customers have, or are temporarily closed or are operating on a reduced capacity, and many dealerships are facing significant financial challenges. Such closures and circumstances led, and may in the future lead, some paying dealers to cancel their subscriptions and/or reduce their spending with us, which has had and may continue to have a material adverse effect on our revenues and on our business. Additionally, we reduced our spending on brand advertising and traffic acquisition at the beginning of the COVID-19 pandemic in response to increasing cancelations and reduced consumer demand, which has contributed to a year-over-year decline in the number of consumers using our platform for each of the years ended December 31, 2021 and 2020, which in turn has, and may continue to, materially and adversely affect our business. While we have since restored a portion of that historical consumer spend, we may not in the future fully restore prior spending levels if we elect to redirect our investments elsewhere, including in favor of new product development. If such a strategy were not to result in the benefits that we expect, our business could be harmed. Our business relies on the ability of consumers to borrow funds to acquire automobiles and banks and other financing companies may limit or restrict lending
20
to consumers as a result of the economic impacts of the COVID-19 pandemic, which may also materially and adversely affect our business.
Further, in the past, we have taken measures to help our paying dealers maintain their business health during the COVID-19 pandemic, including by proactively reducing the subscription fees for paying dealers for certain service periods, and we may decide to re-institute further billing relief as we continue to assess the effects of the COVID-19 pandemic on our paying dealers and business operations. Any further billing relief could result in a decline in our revenue and have a material adverse effect to our business. During the COVID-19 pandemic, we have also experienced, and may continue to experience, increased account delinquencies from dealer customers challenged by the COVID-19 pandemic that failed to pay us on time or at all.
These effects from the COVID-19 pandemic on our revenue caused us to implement certain cost-savings measures across our business, which previously disrupted our business and operations and, if we implement future similar cost saving measures, may affect our future business and operations and may yield unintended consequences, such as loss of key employees, increased costs in hiring new employees, undesired attrition, and the risk that we may not achieve the anticipated cost savings at the levels we expect, any of which may have a material adverse effect on our results of operations and/or financial condition.
We continue to monitor and assess the effects of the COVID-19 pandemic, including the effects of the Delta variant, the Omicron variant, and other variants that may emerge, on our commercial operations, including the impact on our revenue. However, we cannot at this time accurately predict what effects these conditions will ultimately have on our operations due to uncertainties relating to the duration of the pandemic, the extent and effectiveness of governmental responses and other preventative, treatment and containment actions or developments, including the distribution and acceptance of vaccines, shifts in behavior going forward, and the length or severity of the travel and commerce restrictions that are currently in effect and may be imposed in the future by relevant governmental authorities. Nor can we predict the adverse impact on the global economies and financial markets in which we operate, which may have a significant negative impact on our business, financial condition and results of operations.
Our business is substantially dependent on our relationships with dealers, and our subscription agreements with these dealers do not contain long-term contractual commitments.dealers. If a significant number of dealers terminate their subscription agreements with us, our business and financial results would be materially and adversely affected.
Our primary source of revenue consists of subscription fees paid to us by dealers for access to enhanced features on our automotive marketplace.marketplaces. Our subscription agreements with dealers generally may be terminated by us with 30 days’ notice and by dealers with 30 days’ notice atprior to the endcommencement of the committedapplicable renewal term. While we are transitioning many of these dealers to contracts with one-year committed terms, theThe majority of our contracts with dealers currently provide for one-month committed terms. The contractsterms and do not contain contractual obligations requiring a dealer to maintain its relationship with us beyond the committed term. Accordingly, these dealers may cancel their subscriptions with us in accordance with the terms of their subscription agreements. A dealer’s decision to cancel its subscription with us may be influenced by several factors, including national and regional dealership associations, national and local regulators, automotive manufacturers, consumer groups, and consolidated dealer groups. If any of these influential groups indicate that dealers should not enter into or maintain subscription agreements with us, this belief could become shared by dealers and we may lose a number of our paying dealers. If a significant number of our paying dealers terminate their subscriptions with us, our business and financial results would be materially and adversely affected.
If we fail to maintain or increase the number of dealers that pay subscription fees to us, or fail to maintain or increase the fees paid to us for subscriptions, our business and financial results would be materially and adversely affected.
As a result of the effects of the COVID-19 pandemic, many paying dealers cancelled their subscriptions with us (including, in some cases, with our permission prior to the end of the applicable contract term and notice period), and it is possible that additional dealers will cancel their subscriptions in the future for a variety of reasons, including as a result of the continuing effects of the COVID-19 pandemic. If paying dealers do not experiencereceive the volume of consumer connections that they expect during their subscription period, or do not experience the level of car sales they expect from those connections, or fail to attribute consumer connections or sales to our platform, they may terminate their subscriptions atprior to the conclusioncommencement of the committed term or may only be willing to renew their subscriptions at a lower level of fees. Even if dealers do experience increased consumer connections or sales, they may not attribute such increases to our platform.applicable renewal term. If we fail to maintain or expand our base of paying dealers or fail to maintain or increase the level of fees that we receive from them, our business and financial results would be materially and adversely affected.
We allow dealers to list their inventory in the CarGurus marketplacemarketplaces for free; however, we impose certain limitations on such free listings, such as excludingcapping the number of leads that non-paying dealers in the U.S. may receive, not displaying non-paying dealer identity and contact information, and these dealers do not receiveprohibiting access to the paid features of our marketplace. Inmarketplaces. We continue to adapt our free listings product, Restricted Listings, in our CarGurus marketplaces and in the future, we may decide to impose additional restrictions on free listings. ManyRestricted Listings or modify the services available to non-paying dealers. These changes to our Restricted Listings product may result in less inventory being displayed to consumers, which may impair our efforts to attract consumers, and cause paying and non-paying dealers start withto receive fewer leads and connections, which may make it more difficult for us on ato convert non-paying basis and then becomedealers to paying customers in order to take advantagedealers or maintain or expand our base of the features of our paid Listings packages.paying dealers. If dealers do not subscribe to our paid offerings at the rates we expect, or if a greater than expected number of paying dealers elect to terminate their subscriptions or reduce their fees, our business and financial results would be materially and adversely affected.
21
If we fail to continue to realize transaction synergies from our acquisition of a 51% interest in CarOffer, or if the CarOffer business fails to continue to grow at the rate we expect, our revenue and business would be harmed.
In January 2021 we completed our acquisition of a 51% interest in CarOffer, which added wholesale vehicle acquisition and selling capabilities to our portfolio of dealer offerings. A significant amount of our revenue for the year ended December 31, 2021 was derived from the wholesale sale of automobiles. Continued achievement of our transaction synergies and our ability to continue to grow the CarOffer business and the revenue associated with it depend on a number of factors, including, but not limited to, our ability to continue to: expand the number of dealers engaging on the CarOffer platform; retain existing customers and increase the share of wholesale transactions which they complete on the CarOffer platform; attract prospective customers who have historically purchased or sold vehicles through physical auctions and may choose not to transact online; and successfully compete with competitors, including other online vehicle auction companies and large, national offline vehicle auction companies that are expanding into the online channel and have launched online auctions in connection with their physical auctions. If our anticipated transaction synergies do not fully materialize and/or the CarOffer business fails to continue to grow at the rate we expect, our revenue and business would be harmed.
Industry conditions such as a significant change in vehicle retail prices or a decline in the used vehicle inventory supply coming to the wholesale market could also adversely impact CarOffer’s business and growth. For example, if retail prices for used vehicles rise relative to retail prices for new vehicles, it could make buying a new vehicle more attractive to consumers than buying a used vehicle, which could result in reduced used vehicle wholesale sales on the CarOffer platform. Used vehicle dealers may also decide to retail more of their vehicles on their own rather than selling them on the CarOffer platform, which could adversely impact the volume of vehicles offered for sale on the CarOffer platform and the demand for those used vehicles. Inventory challenges in the automotive industry, including for reasons attributable to the COVID-19 pandemic, has contributed and could continue to contribute to a decrease in the supply of vehicles coming to the wholesale market and reduce the number of vehicles sold on the CarOffer platform. An inability by CarOffer to retain customers and/or increase or find alternative sources of vehicle supply would adversely impact our revenue and business.
If dealers or other advertisers reduce their advertising spending with us and we are unable to attract new advertisers,replace the reduced advertising spending, our advertising revenue and business would be harmed.
A significant amountportion of our revenue is derived from advertising revenues generated primarily through advertising sales, including displayon-site advertising and audience targeting services, to dealers, auto manufacturers, and other auto-related brand advertisers. We compete for this advertising revenue with other online automotive marketplaces and with television, print media, and other traditional advertising channels. Our ability to attract and retain advertisers and to generate advertising revenue depends on a number of factors, including:
|
|
|
|
|
|
|
|
|
|
13
Our agreements with dealers for display advertising generally include terms ranging from one month to one year and may be terminated by us with 30 days’ notice and by dealers with 30 days’ notice atprior to the endcommencement of the committedapplicable renewal term. The contracts do not contain contractual obligations requiring an advertiser to maintain its relationship with us beyond the committed term. OurCertain of our other advertising contracts, including those with auto manufacturers, are typically for a defined period of time and do not have ongoing commitments to advertise in our marketplacemarketplaces beyond thea committed term. As a result of the effects of the COVID-19 pandemic, some advertisers cancelled or reduced their advertising with us and it is possible that advertising customers will cancel or reduce their advertising with us in the future for a variety of reasons, including as a result of the continuing effects of the COVID-19 pandemic. In addition, the year-over-year decline in the number of consumer visits to our sites as a result of the COVID-19 pandemic resulted in the delivery of fewer impressions for our advertising customers than anticipated year-over-year for the years ended December 31, 2021 and 2020, which has caused, and may continue to cause, an adverse impact on our advertising revenues. We may not succeed in capturing a greater share of our advertisers’ spending if we are unable to convince advertisers of the effectiveness or superiority of our advertising servicesofferings as compared to alternative channels. If current advertisers reduce or end their advertising spending with us and we are unable to attract new advertisers,replace such reduced advertising spending, our advertising revenue and business and financial results would be harmed.
If we are unable to provide a compelling vehicle search experience to consumers through our platform, the number of connections between consumers and dealers using our marketplacemarketplaces may decline and our business and financial results would be materially and adversely affected.
If we fail to continue to provide a compelling vehicle search experience to consumers, the number of connections between consumers and dealers through our marketplacemarketplaces could decline, which in turn could lead dealers to stopsuspend listing their inventory in our marketplace,marketplaces, cancel their subscriptions, or reduce their advertising spendspending with us. If dealers stoppause or cancel listing their inventory in our marketplace,marketplaces, we may not be able to maintain and grow ourattract a large consumer traffic,audience, which may cause other dealers to stop usingpause or cancel their use of our marketplace.marketplaces. This reduction in the number of dealers using our marketplacemarketplaces would likely materially and adversely affect our marketplacemarketplaces and our business and financial results. As consumers increasingly use their mobile devices to access the internet and our marketplace,marketplaces, our success will depend,depends, in part, on our ability to provide consumers with a robust and user-friendly experience through their mobile devices. We believe that our ability to provide a compelling vehicle search experience, both on the webdesktop computers and through
22
mobile devices, is subject to a number of factors, including:
|
|
|
|
|
|
| our ability to: maintain attractive marketplaces for consumers and dealers; continue to innovate and introduce products for our marketplaces; launch new products that are effective and have a high degree of consumer engagement; display a wide variety of automobile inventory to attract more consumers to our websites; provide mobile applications that engage consumers; maintain the compatibility of our mobile applications with operating systems, such as iOS and Android, and with popular mobile devices running such operating systems; and |
|
|
IfAny inability by us to develop new products, or achieve widespread consumer and dealer adoption of those products, could negatively impact our business and financial results.
Our success depends on our continued innovation to provide products that make our marketplaces, websites, and mobile applications useful for consumers and dealers or that otherwise provide value to consumers and dealers. For example, as we transition to a more digitally-initiated environment, during 2021 we launched IMCO, a newer offering that allows consumers in certain states to sell their vehicles to dealers entirely online. We also continue to develop digital retail offerings, including those that expand a dealer’s geographic footprint and others that bring additional elements of the car buying experience online through our websites. A failure by us to capture the benefits that we expect from our rollout of IMCO and these digital retail investments could have an adverse effect on our business and financial results.
In addition to introducing new offerings within our existing products, we anticipate that over time we may reach a point when investments in our current products are less productive and the growth of our revenue will require more focus on developing new products for consumers and dealers. These new products, in the aggregate, must be widely adopted by consumers and dealers in order for us to continue to attract consumers to our marketplaces and dealers to our products and services. Accordingly, we must continually invest resources in product, technology, and development in order to improve the attractiveness and comprehensiveness of our marketplaces and their related products and effectively incorporate new internet and mobile technologies into them. Our ability to engage in these activities may decline as a result of the continued impact of the COVID-19 pandemic and any cost-savings initiatives on our business. These product, technology, and development expenses may include costs of hiring additional personnel, engaging third-party service providers and conducting other research and development activities. There can be no assurance that innovations to our products like IMCO, or the development of future products, will increase consumer or dealer engagement, achieve market acceptance, create additional revenue or become profitable. In addition, revenue relating to new products is typically unpredictable and our new products may have lower gross margins, lower retention rates, and higher marketing and sales costs than our existing products. We are likely to continue to modify our pricing models for both existing and new products so that our prices for our offerings reflect the value those offerings are providing to consumers and dealers. Our pricing models may not effectively reflect the value of products to dealers, and, if we are unable to provide marketplaces and products that consumers and dealers want to use, they may reduce or cease the use of our marketplace, particularly on mobile devices, does not continuemarketplaces and products. Without innovative marketplaces and related products, we may be unable to grow,attract additional, unique consumers or retain current consumers, which could affect the number of dealers that become paying dealers and the number of advertisers that want to advertise in our marketplaces, as well as the amounts that they are willing to pay for our products, which could, in turn, negatively impact our business and operating results would be harmed.financial results.
We rely on internet search engines to drive traffic to our websites, and if we fail to appear prominently in the search results, our traffic would decline and our business would be adversely affected.
We depend,rely, in part, on internet search engines such as Google, Bing, and Yahoo! to drive traffic to our websites. The number of consumers we attract to our marketplacemarketplaces from search engines is due in part to how and where our websites rank in unpaid search results. These rankings can be affected by a number of factors, many of which are not under our direct control and may change frequently. For example, when a consumer searches for a vehicle in an internet search engine, we rely on a high organic search ranking of our webpages to refer the consumer to our websites. Our competitors’ internet search engine optimization efforts may result in their websites receiving higher search result rankings than ours, or internet search engines could change their methodologies in a way that would adversely affect our search result rankings. If internet search engines modify their methodologies in ways that are detrimental to us, if our efforts to improve our search engine optimization are unsuccessful or ifless successful than our competitors’ internet search engine optimization efforts, are more successful than ours, overall growth in our ability to attract a large consumer audience could diminish and traffic could slow orto our trafficmarketplaces could decline. In addition, internet search engine providers could provide dealer and pricing information directly in search results, align with our competitors, or choose to develop competing products. Search engines may also adopt aReductions in our own search advertising spend or more aggressive auction-pricing system for keywords that wouldspending by our competitors could also cause us to incur higher advertising costs and/or reduce our market visibility to prospective users. Our websites have experienced fluctuations in organic and paid search result rankings in the past, and we anticipate fluctuations in the future. Any reduction in the number of consumers directed to our websites through internet search engines could harm our business and operating results.
14
Any inability by us to develop new products, or achieve widespread consumer and dealer adoption of those products, could negatively impact our business and financial results.
Our success depends on our continued innovation to provide products and services that make our marketplace, websites, and mobile applications useful for consumers and dealers or that otherwise provide value to consumers and dealers. These new products must be widely adopted by consumers and dealers in order for us to continue to attract consumers to our marketplace and dealers to our products and services. Accordingly, we must continually invest resources in product, technology, and development in order to improve the attractiveness and comprehensiveness of our marketplace and its related products and effectively incorporate new internet and mobile technologies into them. These product, technology, and development expenses may include costs of hiring additional personnel, engaging third-party service providers and other research and development activities. In addition, revenue relating to new products is typically unpredictable and our new products may have lower gross margins, lower retention rates, and higher marketing and sales costs than our existing products. We are likely to continue to modify our pricing models for both existing and new products so that our prices for our offerings reflect the value those offerings are providing to consumers and dealers. Our pricing models may not effectively reflect the value of products to consumers and dealers, and, if we are unable to provide a marketplace and products that consumers and dealers want to use, they may become dissatisfied and instead use our competitors’ websites and mobile applications. Without an innovative marketplace and related products, we may be unable to attract additional, unique consumers or retain current consumers, which could affect the number of dealers that become paying dealers and the number of advertisers that want to advertise in our marketplace, which could, in turn, negatively impact our business and financial results.
We may be unable to maintain or grow relationships with data providers, or may experience interruptions in the data they provide, which may create a less valuable or transparent shopping experience and negatively affect our business and operating results.
We obtain data from many third-party data providers, including inventory management systems, automotive website providers, customer relationship management systems, dealer management systems, governmental entities, and third-party data licensors. Our business relies on our ability to obtain data for the benefit of consumers and dealers using our marketplace.marketplaces. For example, our success
23
in international marketseach market is dependent in part upon our ability to obtain and maintain inventory data and other vehicle information for those markets. The large amount of inventory and vehicle information available in our marketplacemarketplaces is critical to the value we provide for consumers. The loss or interruption of such inventory data or other vehicle information could decrease the number of consumers using our marketplace.marketplaces. We could experience interruptions in our data access for a number of reasons, including difficulties in renewing our agreements with data providers, changes to the software used by data providers, efforts by industry participants to restrict access to data, and increased fees we may be charged by data providers.providers and the continuing effects of the COVID-19 pandemic. Our marketplacemarketplaces could be negatively affected if any current provider terminates its relationship with us or our service from any provider is interrupted. If there is a material disruption in the data provided to us, the information that we provide to consumers and dealers using our marketplacemarketplaces may be limited. In addition, the quality, accuracy, and timeliness of this information may suffer, which may lead to a less valuable and less transparent shopping experience for consumers using our marketplacemarketplaces and could negatively affect our business and operating results.
The failure to build, maintain and protect our brandbrands would harm our ability to grow ourattract a large consumer audience and to expand the use of our marketplacemarketplaces by consumers and dealers.
While we are focused on building our brand recognition, maintaining and enhancing our brandbrands will depend largely on the success of our efforts to maintain the trust of consumers and dealers and to deliver value to each consumer and dealer using our marketplace.marketplaces. Our ability to protect our brandbrands is also impacted by the success of our efforts to optimize our significant brand spend and overcome the intense competition in brand marketing across our industry, including competitors that may imitate our messagingmessaging. In addition, we have reduced our brand spend in responsecomparison to our success.pre-COVID-19 pandemic levels, and it is possible that we may in the future decide to further suppress such spend depending on the continued impact of the COVID-19 pandemic or other macro-economic effects. If consumers were to believe that we are not focused on providing them with a better automobile shopping experience, or if we fail to overcome brand marketing competition and maintain a differentiated value proposition in consumers’ minds, our reputation and the strength of our brandbrands may be adversely affected.
Complaints or negative publicity about our business practices and culture, our management team and employees, our marketing and advertising campaigns, our compliance with applicable laws and regulations, the integrity of the data that we provide to consumers, data privacy and security issues, and other aspects of our business, irrespective of their validity, could diminish consumers’ and dealers’ confidence and participation in our marketplacemarketplaces and could adversely affect our brand.brands. There can be no assurance that we will be able to maintain or enhance our brand,brands, and failure to do so would harm our business growth prospects and operating results.
15
Portions of our platform enable consumers and dealers using our sitesmarketplaces to communicate with one another and other persons seeking information or advice on the internet. Claims of defamation or other injury could be made against us for content posted on our websites. In addition, negative publicity and user sentiment generated as a result of fraudulent or deceptive conduct by users of our marketplacemarketplaces could damage our reputation, reduce our ability to attract new users or retain our current users, and diminish the value of our brand.brands.
Our recent, rapid growth is not indicative of our future growth, and our revenue growth rate will continue to decline in the future.future is uncertain, including due to the potential impact of the COVID-19 pandemic.
Our revenue increased to $588.9$951.4 million for the year ended December 31, 20192021 from $454.1$551.5 million for the year ended December 31, 2018,2020, representing a 30%73% increase between such periods,periods. Our revenue for 2022 and increased to $454.1 millionbeyond may not grow at such a rate and could potentially be impacted by the COVID-19 pandemic, as it was for the year ended December 31, 2018 from $316.9 million for2020. In addition, we will not be able to grow as expected, or at all, if we fail to: increase the year ended December 31, 2017, representing a 43%number of consumers using our marketplaces; maintain and expand the number of dealers that subscribe to our marketplaces and maintain and increase the fees that they are paying; attract and retain advertisers placing advertisements in our marketplaces; further improve the quality of our marketplaces and introduce high quality new products; and increase the number of connections between such periods. In the future,consumers and dealers using our marketplaces and connections to paying dealers, in particular. If our revenue growth rates will continuedeclines or fails to decline as we achieve higher market penetration rates, as our revenue increases to higher levels, and as we experience increased competition. As our revenue growth rates decline,grow, investors’ perceptions of our business may be adversely affected, and the market price of our Class A common stock could decline. In addition,
We may require additional capital to pursue our business objectives and respond to business opportunities, challenges, or unforeseen circumstances. If we willare unable to generate sufficient cash flows or if capital is not available to us, our business, operating results, financial condition, and prospects could be adversely affected.
If we are unable to generate sufficient cash flows, we would require additional capital to pursue our business objectives and respond to business opportunities, challenges, or unforeseen circumstances, including the effects of the COVID-19 pandemic, as well as to make marketing expenditures to improve our brand awareness, develop new products, further improve our platform and existing products, enhance our operating infrastructure, and acquire complementary businesses and technologies. Accordingly, we may need to engage in equity or debt financings to secure additional funds. However, additional funds may not be ableavailable when we need them on terms that are acceptable to grow as expected,us or at all, if we do not accomplishall. Volatility in the following:
|
|
|
|
|
|
|
|
|
|
equity and credit markets, including due to the COVID-19 pandemic, may also have an adverse effect on our ability to obtain equity or debt financing. If we failare unable to expand effectively into new markets, both domestically and abroad,obtain adequate financing or financing on terms satisfactory to us when we require it, our revenue, business, and financial results will be harmed.
We intendability to continue to expandpursue our business objectives and to respond to business
24
opportunities, challenges, or unforeseen circumstances could be significantly limited, and our business, operating results, financial condition, and prospects could be adversely affected.
Our international operations involve risks that may differ from, or are in addition to, target new markets, both domesticallyour domestic operational risks.
In addition to the United States, we operate marketplaces in the United Kingdom and abroad, and there can be no assurance that our expansion into these new markets will be successful. Our expansion into new markets places us in unfamiliarCanada, which are less familiar competitive environments and involvesinvolve various risks, including the need to invest significant resources and the likelihood that returns on such investments will not be achieved for several years, or possibly at all. In attempting to establish a presenceWe have incurred losses in new markets, we expect, as we haveprior periods in the past, toUnited Kingdom and Canada and may incur significant losses there again in those markets andthe future. We also face various other challenges such as obtaining and maintaining access to data, competition for consumers and dealers using our products, new and different competitors, monetizing dealers and other customers, new regulatory environments and laws, different consumer behavior than we are familiar with, and our ability to expand the number of our account managers to coverin those new markets. Our current and any future expansion plans will require significant resources and management attention. Furthermore, expansion into international markets may not yield results similar to those we have achieved in the United States.
Our international operations involve risks that are different from, or in addition to, the risks we may experience as a result of our domestic operations, and our exposure to these risks will increase if we continue to expand internationally.
We may expand our international operations by continuing to enter new markets and expanding our offerings in new languages. In most international markets, we would not be the first entrant, andjurisdictions. For example, our competitors may be more established or otherwise better positioned than we are to succeed.succeed in the United Kingdom and Canada. Our competitors may offer services to dealers that make dealers dependent on them, such as hosting dealers’ websites and providing inventory feeds for dealers, which would make it difficult to attract dealers to our marketplace.marketplaces. Dealers may also be parties to agreements with other dealers and syndicates that prevent them from being able to access our marketplace. In addition, we may also face litigation from competitors in new markets.marketplaces. Any of these barriers could impede our expansion into additionaloperations in our international markets, which could affect our business and potential growth.
16
In addition to English, we have made portions of our platformmarketplaces available in French German, Italian, and Spanish, and we will need to make all or portions of our platform available in additional languages as we launch in new countries.Spanish. We may have difficulty in modifying our technology and content for use in non-English-speaking marketsmarket segments or fostering new communitiesgaining acceptance by users in non-English-speaking markets.market segments. Our ability to manage our business and conduct our operations internationally requires considerable management attention and resources, and is subject to the particular challenges of supporting a rapidly growing business in an environment of multiple languages, cultures, customs, legal and regulatory systems, alternative dispute resolution systems, and commercial infrastructures. ExpandingOperating internationally may subject us to newdifferent risks or increase our exposure in connection with current risks, including risks associated with:
| recruiting, managing |
|
|
|
|
|
|
|
|
|
|
|
|
|
|
|
|
|
|
|
|
|
|
|
|
|
|
We participate in a highly competitive market, and pressure from existingretaining qualified multilingual employees, including sales personnel; adapting our websites and new companies may adversely affect our business and operating results.
We face significantmobile applications to conform to local consumer behavior; increased competition from companies that provide listings, information, lead generation, marketing,local websites and car-buying services designed to help consumers shop for cars and to enable dealers to reach these consumers. Our competitors offer various marketplaces, products, and services that compete with us. Some of these competitors include:
|
|
|
|
|
|
|
|
|
|
|
|
|
|
|
|
17
We compete with these and other companies for a share of dealers’ overall marketing budget for online and offline media marketing spend. To the extent that dealers view alternative marketing and media strategies to be superior to our marketplace, we may not be able to maintain or grow the number of dealers subscribing to, and advertising on, our marketplace, and our business and financial results may be adversely affected.
We also expect that new competitors will continue to enter the online automotive retail industry with competing marketplaces, products, and services, or that existing competitors will expand to offer competing products or services, which could have an adverse effect on our business and financial results.
Our competitors could significantly impede our ability to expand the number of dealers using our marketplace. Our competitors may also develop and market new technologies that render our existing or future platform and associated products less competitive, unmarketable, or obsolete. In addition, if our competitors develop platforms with similar or superior functionality to ours, and our web traffic declines, we may need to decrease our subscription and advertising fees. If we are unable to maintain our current pricing structure due to competitive pressures, our revenue would likely be reduced and our financial results would be negatively affected.
Our existingmobile applications and potential competitorspreferences by local populations for local providers; compliance with applicable foreign laws and regulations, including different privacy, censorship, and liability standards and regulations, and different intellectual property laws; providing solutions in different languages and for different cultures, which may have significantly more financial, technical, marketing,require that we modify our solutions and other resources than we have,features so they are culturally relevant in different countries; the enforceability of our intellectual property rights; credit risk and higher levels of payment fraud; compliance with anti-bribery laws, including compliance with the Foreign Corrupt Practices Act and the ability to devote greater resourcesUnited Kingdom Bribery Act; currency exchange rate fluctuations; adverse changes in trade relationships among foreign countries and/or between the United States and such countries, including as related to the development, promotion, and support of their marketplaces, products, and services. They may also have more extensive automotive industry relationships than we have, longer operating histories, and greater name recognition. As a result, these competitors may be ableUnited Kingdom’s exit from the European Union, or the EU, commonly referred to respond more quickly with new technologies and to undertake more extensive marketing or promotional campaigns than we can. Additionally, to the extent that any competitor has existing relationships with dealers or auto manufacturers for marketing or data analytics solutions, those dealers and auto manufacturers may be unwilling to partner with us. If we are unable to compete with these competitors, the demand for our marketplace and related products and services could substantially decline.
In addition, if one or moreas “Brexit”; double taxation of our competitors were to mergeinternational earnings and potentially adverse tax consequences arising from the tax laws of the United States or partner with another of our competitors, the change in the competitive landscape could adversely affect our ability to compete effectively. Our competitors may also establish or strengthen cooperative relationships with our existing or future data providers, technology partners, or other parties with whom we have relationships, thereby limiting our ability to develop, improve, and promote our solutions. We may not be able to compete successfully against current or future competitors, and competitive pressures may harm our business and financial results.
Our business could be adversely affected if dealer associations or auto manufacturers were to discourage or otherwise deter dealers from subscribing to our marketplace.
Although the dealership industry is highly fragmented, a small number of interested parties have significant influence over the industry. These parties include national and regional dealership associations, national and local regulators, automotive manufacturers, consumer groups, independent dealers, and consolidated dealer groups. If and to the extent these parties believe that dealerships should not enter into or maintain subscription agreements with us, this belief could become shared by dealerships and we may lose a number of our paying dealers.
Furthermore, auto manufacturers may provide their franchise dealers with financial or other marketing support conditioned upon such dealers’ adherence to certain marketing guidelines. Auto manufacturers may determine that the mannerforeign jurisdictions in which certainwe operate; and higher costs of their franchise dealers use our platform is inconsistent with the terms of such marketing guidelines, which determination could result in potential or actual loss of the manufacturers’ financial or other marketing support to the dealers whose use of our platform is deemed objectionable. The potential or actual loss of such marketing support may cause such dealers to cease paying for our paid features, which may adversely affect our ability to maintain or grow the number of our paying dealers.doing business internationally.
Dealer closures or consolidations could reduce demand for our products, which may decrease our revenue.
In the past, the number of United States dealers has declined due to dealership closures and consolidations as a result of factors such as global economic downturns.downturns or other macroeconomic issues. When dealers consolidate, the services they previously purchased separately are often purchased by the combined entity in a lesser quantity or for a lower aggregate price than before, leading to volume compression and loss of revenue. Further dealership consolidations or closures could reduce the aggregate demand for our products and services. If dealership closures and consolidations occur in the future, our business, financial position and results of operations could be materially and adversely affected.
18
We rely on third-party service providers and strategic partners for many aspects of our business, and any failure to maintain these relationships or to successfully integrate certain third-party platforms could harm our business.
Our success will depend upon our relationships with third parties, including our payment processor, our data center hosts, our information technology providers, our data providers for inventory and vehicle information, our human resources information system provider, our billing subscription software provider, our customer relationship management software provider, our financial planning and analysis software provider, our information integration platform providers, our marketing platform providers, our business intelligence and data analytics providers, our search engine and social media advertising providers, our invoice and expense provider, our equity administration provider, and our general ledger provider, as well as our strategic partners, including consumer lenders. If these third parties experience difficulty meeting our requirements or standards, have adverse audit results, violate the terms of our relationship or applicable law, fail to obtain or maintain applicable licenses, or if the relationships we have established with such third parties expire or otherwise terminate, it could make it difficult for us to operate some aspects of our business, which could damage our business and reputation. In addition, if such third-party service providers or strategic partners were to cease operations, temporarily or permanently, face financial distress or other business disruptions, increase their fees, or if our relationships with these providers or partners deteriorate or terminate, we could suffer increased costs and we may be unable to provide consumers with content or provide similar services until an equivalent provider could be found or we could develop replacement technology or operations. In addition, if we are unsuccessful in identifying or finding high-quality partners, if we fail to negotiate cost-effective relationships with them, or if we ineffectively manage these relationships, it could have an adverse impact on our business and financial results.
Our enterprise systems require that we integrate the platforms hosted by certain third-party service providers. We are responsible for integrating these platforms and updating them to maintain proper functionality. Issues with these integrations, our failure to properly update third-party platforms or any interruptions to our internal enterprise systems could harm our business by causing delays in our ability to quote, activate service and bill new and existing customers on our platform.
If we continue to grow rapidly, we may not be able to manage our growth effectively.
We have experienced rapid growth in our headcount and operations, which places substantial demand on management and our operational infrastructure. In addition, with further growth and expansion, our employee base will continue to spread outside of our headquarters in Cambridge, Massachusetts. As we continue to grow, we must effectively integrate, develop, and motivate a large number of new employees, while maintaining the beneficial aspects of our company culture. If we do not manage the growth of our business and operations effectively, the quality of our services and efficiency of our operations could suffer, which could harm our brand, results of operations, and overall business.
We depend on key personnel to operate our business, and if we are unable to retain, attract and integrate qualified personnel, or if we experience turnover of our key personnel, our ability to develop and successfully grow our business could be materially and adversely affected.
We believe our success has depended, and continues to depend, on the efforts and talents of our executives and employees. Our future success depends on our continuing ability to attract, develop, motivate, and retain highly qualified and skilled employees. Qualified individualsSince the onset of the COVID-19 pandemic, we have encountered increased rates of turnover of our employee base and encountered intense competition for retaining and attracting qualified and skilled employees. Additionally, on September 9, 2021, President Biden announced a proposed new rule requiring all employers with at least 100 employees to ensure that their employees are in high demand,fully vaccinated or require unvaccinated workers to get a negative test at least once a week. The Department of Labor’s Occupational Safety and Health Administration, or OSHA, issued an Emergency Temporary Standard, or ETS, on November 5, 2021. The Supreme Court issued a stay of the ETS on January 13, 2022. OSHA subsequently announced that it was withdrawing the ETS effective January 26, 2022 and instead would focus on finalizing a permanent COVID-19 Healthcare Standard, which it has not yet issued. Accordingly, we have incurred, and we may continue to incur, significant costs to attract new employees and retain them. existing ones, and we may in the future become less competitive in attracting and retaining employees as a result of any expense reduction efforts that we may initiate or our compliance with any COVID-19 healthcare standards to which we may become subject.
In addition, the loss ofany unplanned turnover or our failure to develop an adequate succession plan for any of our executive officers or key employees, or the reduction in their involvement in the management of our business, could materially adversely affect our ability to execute our business plan and strategy, and we may not be able to find adequate replacements on a timely basis, or at all. Our executive
25
officers and other employees are at-will employees, which means they may terminate their employment relationships with us at any time, and their knowledge of our business and industry would be extremely difficult to replace. We cannot ensure that we will be able to retain the services of any members of our senior management or other key employees. If we do not succeed in attracting well-qualified employees or retaining and motivating existing employees, our business could be materially and adversely affected.
19
If we are unable to successfully respond to changes in the market, our business could be harmed.
While our business has grown rapidly as consumers and dealers have increasingly accessed our marketplace, we expect that our business will evolve in ways which may be difficult to predict. For example, we anticipate that over time Additionally, we may reach a point when investmentsface risks related to the transitions that occurred in new user traffic are less productiveour senior management team during 2021 and other future transitions in our leadership team, including the disruption of our operations and the continued growthdepletion of our revenue will require more focus on developing new products for consumers and dealers, expanding our marketplace into new international markets to attract new consumers and dealers, and increasing our fees for our products. It is also possible that consumers and dealers could broadly determine that they no longer believe in the value of our marketplace. Our continued success will depend on our ability to successfully adjust our strategy to meet the changing market dynamics. If we are unable to do so, our business could be harmed and our results of operations and financial condition could be materially and adversely affected.institutional knowledge base.
We may be subject to disputes regarding the accuracy of Instant Market Values, Deal Ratings, Dealer Ratings, New Car Price Guidance and other features of our marketplace.marketplaces.
We provide consumers using our marketplaceCarGurus marketplaces with our proprietary Instant Market Values, or IMV, Deal Ratings, and Dealer Ratings, as well as other features to help them evaluate vehicle listings, including price guidance for new car listings, or New Car Price Guidance. Our valuation models depend on the inventory listed on our sites as well as public information regarding automotive sales. If the inventory on our site declines significantly, or if the number of automotive sales declines significantly or used car sales prices become volatile, whether as a result of the COVID-19 pandemic or otherwise, our valuation models may not perform as expected. Revisions to or errors in our automated valuation models, or the algorithms that underlie them, may cause the IMV, the Deal Rating, New Car Price Guidance, or other features to vary from our expectations regarding the accuracy of these tools. In addition, from time to time, regulators, consumers, dealers and other industry participants may question or disagree with our IMV, Deal Rating, Dealer Rating or New Car Price Guidance. Any such questions or disagreements could result in distraction from our business or potentially harm our reputation, could result in a decline in consumers’ confidence in, or use of, our marketplacemarketplaces and could result in legal disputes.
As we acquire other companies or technologies, such activities could divert our management’s attention, result in additional dilution to our stockholders, and otherwise disrupt our operations and harm our operating results.
Our success will depend, in part, on our ability to grow our business in response to the demands of consumers, dealers, and other constituents within the automotive industry as well as competitive pressures. In some circumstances, we will do so through the acquisition of complementary businesses and technologies rather than through internal development. The identification of suitable acquisition candidates can be difficult, time-consuming, and costly, and we may not be able to successfully complete identified acquisitions. The risks we face in connection with acquisitions include:
|
|
|
|
|
|
|
|
|
|
|
|
|
|
|
|
|
|
|
|
Our failure to address these risks or other problems encountered in connection with acquisitions and investments could cause us to fail to realize the anticipated benefits of these acquisitions or investments, cause us to incur unanticipated liabilities, cause us to be reluctant to engage in future transactions, and harm our business generally. Acquisitions could
20
result in dilutive issuances of our equity securities, the incurrence of debt, contingent liabilities, amortization expense, and impairment charges associated with acquired intangible assets or goodwill, any of which could harm our financial condition. Also, the anticipated benefits of any acquisitions may not materialize.
We are subject to a complex framework of federal, state, and foreign laws and regulations, many of which are unsettled, still developing and contradictory, which have in the past, and could in the future, subject us to claims, challenge our business model, or otherwise harm our business.
Various aspects of our business are, may become, or may be viewed by regulators from time to time as subject, directly or indirectly, to United States federal, state and local laws and regulations, and to foreign laws and regulations. Failure to comply with such laws or regulations may result in the suspension or termination of our ability to do business in affected jurisdictions, the imposition of significant civil and criminal penalties, including fines or the award of significant damages against us and dealers in class action or other civil litigation, or orders or settlements requiring us to make adjustments to our marketplace and related products and services.
Local Motor Vehicle Sales, Advertising and Brokering, and Consumer Protection Laws
The advertising and sale of new and used motor vehicles is highly regulated by the jurisdictions in which we do business. Although we do not sell motor vehicles, and although we believe that vehicle listings on our sitesites are not themselves advertisements, regulatory authorities or third parties could take the position that some of the laws or regulations applicable to dealers or to the manner in which motor vehicles are advertised and sold generally are directly applicable to our business. These advertising laws and regulations are frequently subject to multiple interpretations and are not uniform from jurisdiction to jurisdiction, sometimes imposing inconsistent requirements with respect to new or used motor vehicles. If our marketplacemarketplaces and related products are determined to not comply with relevant regulatory requirements, we or dealers could be subject to significant civil and criminal penalties, including fines, or the award of significant damages in class actions or other civil litigation, as well as orders interfering with our ability to continue providing our marketplacemarketplaces and related products and services in certain states.jurisdictions. In addition, even absent such a determination, to the extent dealers are uncertain about the applicability of such laws and regulations to our business, we may lose, or have difficulty increasing the number of paying dealers, which would affect our future growth.
If regulators or other third parties take the position in the future that our marketplacemarketplaces or related products violate applicable brokering, bird-dog, consumer protection, consumer finance or advertising laws or regulations, responding to such allegations could be costly, could require us to pay significant sums in settlements, could require us to pay civil and criminal penalties, including fines, could interfere with our ability to continue providing our marketplacemarketplaces and related products in certain jurisdictions, or could require us to make adjustments to our marketplacemarketplaces and related products or the manner in which we derive revenue from dealers using our platform, any or all of which could result in substantial adverse publicity, termination of subscriptions by dealers, decreased revenues, distraction for our employees, increased expenses, and decreased profitability.
Federal Laws and Regulations
The United States Federal Trade Commission, or the FTC, has the authority to take actions to remedy or prevent acts or practices that it considers to be unfair or deceptive and that affect commerce in the United States. If the FTC takes the position in the future that any aspect of our business, including our advertising and privacy practices, constitutes an unfair or deceptive act or practice, responding to such allegations could require us to defend our practices and pay significant damages, settlements, and civil penalties, or could require us to make adjustments to our marketplacemarketplaces and related products and services, any or all of which could result in substantial adverse publicity, distraction for our employees, loss of participating dealers, lost revenues, increased expenses, and decreased profitability.
Our platform enablesplatforms enable us, dealers, and users to send and receive text messages and other mobile phone communications. The Telephone Consumer Protection Act, or the TCPA, as interpreted and implemented by the United States Federal Communications Commission, or the FCC, and federal and state courts, imposesimpose significant restrictions on utilization of telephone calls and text messages to residential and mobile telephone numbers as a means of communication, particularly if the prior express consent of the person being contacted has not been obtained. Violations of the TCPA may be enforced by the FCC, by state attorneys general, or by others through
26
litigation, including class actions. Statutory penalties for TCPA violations range from $500 to $1,500 per violation, which is often interpreted to mean per phone call or text message. Furthermore, several provisions of the TCPA, as well as applicable rules and orders, are open to multiple interpretations, and compliance may involve fact-specific analyses.
21
Any failure by us, or the third parties on which we rely, to adhere to, or successfully implement, appropriate processes and procedures in response to existing or future laws and regulations could result in legal and monetary liability, fines and penalties, or damage to our reputation in the marketplace, any of which could have a material adverse effect on our business, financial condition, and results of operations. Even if the claims are meritless, we may be required to expend resources and pay costs to defend against regulatory actions or third-party claims. Additionally, any change to the TCPAapplicable laws or its interpretationtheir interpretations that further restricts the way consumers and dealers interact through our platform,platforms, or any governmental or private enforcement actions related thereto, could adversely affect our ability to attract customers and could harm our business, financial condition, results of operations, and cash flows.
Antitrust and Other Laws
Antitrust and competition laws prohibit, among other things, any joint conduct among competitors that would lessen competition in the marketplace. We believe that we are in compliance with the legal requirements imposed by such antitrust laws. However, aA governmental or private civil action alleging the improper exchange of information, or unlawful participation in price maintenance or other unlawful or anticompetitive activity, even if unfounded, could be costly to defend and could harm our business, results of operations, financial condition, and cash flows.
Other
Claims could be made against us under both United States and foreign laws, including claims for defamation, libel, invasion of privacy, false advertising, intellectual property infringement, or claims based on other theories related to the nature and content of the materials disseminated by users of our marketplacemarketplaces and on portions of our websites. In addition, domestic and foreign legislation has been proposed that could prohibit or impose liability for the transmission over the internet of certain types of information. Our defense against any of these actions could be costly and involve significant time and attention of our management and other resources. If we become liable for information provided by our users and transmitted in our marketplace in any jurisdiction in which we operate,marketplaces, we could be directly harmed and we may be forced to implement new measures to reduce our exposure to this liability.
The foregoing description of laws and regulations to which we are or may be subject is not exhaustive, and the regulatory framework governing our operations is subject to continuous change. As we expand our operations internationally, weWe are, and we will continue to be, exposed to legal and regulatory risks including with respect to privacy, tax, law enforcement, content, intellectual property, competition, and other matters. The enactment of new laws and regulations or the interpretation of existing laws and regulations, both domestically and internationally, in an unfavorable way may affect the operation of our business, directly or indirectly, which could result in substantial regulatory compliance costs, civil or criminal penalties, including fines, adverse publicity, loss of participatingsubscribing dealers, lost revenues, increased expenses, and decreased profitability. Further, investigations by governmental agencies, including the FTC, into allegedly anticompetitive, unfair, deceptive or other business practices by us or dealers using our marketplace,marketplaces, could cause us to incur additional expenses and, if adversely concluded, could result in substantial civil or criminal penalties and significant legal liability, or orders requiring us to make adjustments to our marketplacemarketplaces and related products and services.
Our business is subject to risks related to the larger automotive industry ecosystem, including consumer demand, global supply chain challenges, trade relations between the United States and China and other macroeconomic issues, which could have a material adverse effect on our business, revenue, results of operations, and financial condition.
Decreases in consumer demand could adversely affect the market for automobile purchases and, as a result, reduce the number of consumers using our platform. Consumer purchases of new and used automobiles generally decline during recessionary periods and other periods in which disposable income is adversely affected. Purchases of new and used automobiles are typically discretionary for consumers and have been, and may continue to be, affected by negative trends in the economy, including: the effects of the COVID-19 pandemic, the cost of energy and gasoline; the availability and cost of credit; rising interest rates, which may reduce the demand for consumer credit due to the higher cost of borrowing;rates; reductions in business and consumer confidence; stock market volatility; and increased unemployment; and changing trade barriers, including increased tariff rates or custom duties. unemployment.
Further, in recent years the market for motor vehicles has experienced rapid changes in technology and consumer demands. Self-driving technology, ride sharing, transportation networks, and other fundamental changes in transportation could impact consumer demand for the purchase of automobiles. A reduction in the number of automobiles purchased by consumers could adversely affect dealers and car manufacturers and lead to a reduction in other spending by these groups, including targeted incentive programs.
22
In addition, our business has been and may continue to be negatively affected by challenges to the larger automotive industry ecosystem, including global supply chain challenges, the global semiconductor chip shortage, changes to trade policies, including tariff rates and customs duties, trade relations between the United States and China and other macroeconomic issues.issues, including the ongoing effects of the COVID-19 pandemic. These factors could have a material adverse effect on our business, revenue, results of operations, and financial condition.
The consequences we may face from the exit of the United Kingdom from the European Union could have a material adverse effect on our business, revenue, results of operations, and financial condition.
The United Kingdom’s exit from the European Union, or the EU, commonly referred to as “Brexit”, could adversely affect European and global economic or market conditions, contribute to instability in global financial markets, create uncertainty in the wider commercial, legal, and regulatory environment, and cause disruptions to our business and operations in the United Kingdom, including with respect to our customers, suppliers, and consumers in the United Kingdom. As a result of this economic uncertainty, our dealer customers in particular may be unwilling to subscribe to our websites or renew or increase their existing subscriptions, as applicable. We may also face new regulatory costs and challenges that could have an adverse effect on our operations. Brexit has created economic uncertainty and its consequences could have a material adverse effect on our business, revenue, results of operations, and financial condition.
Making decisions that we believe are in the best interests of our marketplace may cause us to forgo short-term gains in pursuit of potential but uncertain long-term growth.
In the past, we have forgone, and we will in the future continue to forgo, certain expansion or short-term revenue opportunities that we do not believe are in the long-term best interests of our marketplace, even if such decisions negatively impact our results of operations in the short term. For example, we manage the text-chat feature of our websites where consumers can message paying dealers. Our management of this feature has helped improve dealer response times to consumers, which in turn improves the consumer experience. While our management of this feature provides value to both consumers and paying dealers and could be a potential source of short-term revenue for us, we are not currently charging for this feature and are instead focusing on the potential long-term value of this feature to our marketplace and its users. However, this strategy may not result in the long-term benefits that we expect, in which case our user traffic and engagement, business, and financial results could be harmed.
A significant disruption in service on our websites or mobile applications could damage our reputation and result in a loss of consumers, which could harm our business, brand,brands, operating results, and financial condition.
Our brand,brands, reputation, and ability to attract consumers, dealers, and advertisers depend on the reliable performance of our technology infrastructure and content delivery. We have experienced, and we may in the future experience, interruptions with our systems. Interruptions in these systems, whether due to system failures, computer viruses, ransomware, physical break-ins, electronic breaches, or physical or electronic break-ins,otherwise, could affect the security or availability of our marketplacemarketplaces on our websites and mobile applications, and prevent or inhibit the ability of dealers and consumers to access our marketplace.marketplaces. For example, past disruptions have impacted our ability to
27
activate customer accounts and manage our billing activities in a timely manner. Such interruptions could alsohave resulted, and may in the future result, in third parties accessing our confidential and proprietary information, including our intellectual property. Problems with the reliability or security of our systems could harm our reputation, harm our ability to protect our confidential and proprietary information, result in a loss of consumers and dealers, and result in additional costs.
Substantially all of the communications, network, and computer hardware used to operate our platformplatforms is located in the United States near each of Boston, Massachusetts and Dallas, Texas, and internationally near each of London, England.England and Dublin, Ireland. Although we havecan host our U.S. CarGurus’ marketplace from two alternative locations in the United States and we believe our systems are redundant, there may be exceptions for certain hardware or software. In addition, we do not own or control the operation of these facilities. We also use third-party hosting services to back up some data but do not maintain redundant systems or facilities for some of the services. A disruption to one or more of these systems has caused, and may in the future cause, us to experience an extended period of system unavailability, which could negatively impact our relationship with consumers, customers and advertisers. Our systems and operations are vulnerable to damage or interruption from fire, flood, power loss, telecommunications failure, terrorist attacks, acts of war, electronic andbreaches, physical break-ins, computer viruses, earthquakes, and similar events. The occurrence of any of these events could result in damage to our systems and hardware or could cause them to fail. In addition, we may not have sufficient protection or recovery plans in certain circumstances.
Problems faced by our third-party web hosting providers could adversely affect the experience consumers have while using our marketplace.marketplaces. Our third-party web hosting providers could close their facilities without adequate notice. Any financial difficulties, up to and including bankruptcy, faced by our third-party web hosting providers or any of the service
23
providers whose services they use, which may be exacerbated as a result of the COVID-19 pandemic, may have negative effects on our business, the nature and extent of which are difficult to predict. If our third-party web hosting providers are unable to keep up with our growing capacity needs, our business could be harmed.
Any errors, defects, disruptions, or other performance or reliability problems with our network operations could cause interruptions in access to our marketplacemarketplaces as well as delays and additional expense in arranging new facilities and services and could harm our reputation, business, operating results, and financial condition.
Although we carry insurance, it may not be sufficient to compensate us for the potentially significant losses, including the potential harm to the future growth of our business, that may result from interruptions in our service as a result of system failures.
We collect, process, store, transfer, share, disclose, and use consumer information and other data, and our actual or perceived failure to protect such information and data or respect users’ privacy could damage our reputation and brandbrands and harm our business and operating results.
Some functions of our marketplacemarketplaces involve the storage and transmission of consumers’ information, such as IP addresses, contact information of users who connect with dealers and profile information of users who create accounts on our marketplace,marketplaces, as well as dealers’ information. We also process and store personal and confidential information of our vendors, partners, and employees. Some of this information may be private, and security breaches could expose us to a risk of loss or exposure of this information, which could result in potential liability, litigation, and remediation costs. For example, hackers could steal our users’ profile passwords, names, email addresses, phone numbers, and zip codes.other personal information. We rely on encryption and authentication technology licensed from third parties to effect secure transmission of such information. Like all information systems and technology, our websites, mobile applications, and information systems are subject to computer viruses, break-ins, phishing attacks, attempts to overload the systems with denial-of-service or other attacks, ransomware, and similar incidents or disruptions from unauthorized use of our computer systems, any of which could lead to interruptions, delays, or website shutdowns, and could cause loss of critical data and the unauthorized disclosure, access, acquisition, alteration, and use of personal or other confidential information. If we experience compromises to our security that result in website or mobile application performance or availability problems, the complete shutdown of our websites or mobile applications, or the loss or unauthorized disclosure, access, acquisition, alteration, or use of confidential information, consumers, customers, advertisers, partners, vendors, and employees may lose trust and confidence in us, and consumers may decrease the use of our websites or stop using our websites entirely, dealers may stop or decrease their subscriptions with us, and advertisers may decrease or stop advertising on our websites.
Further, outside parties have attempted and will likely continue to attempt to fraudulently induce employees, consumers, or advertisers to disclose sensitive information in order to gain access to our information or our consumers’, dealers’, advertisers’, and employees’ information. As cyber-attacks increase in frequency and sophistication, our cyber-security and business continuity plans may not be effective in anticipating, preventing and effectively responding to all potential cyber-risk exposures. In addition, because the techniques used to obtain unauthorized access, disable or degrade service, or sabotage systems change frequently, often are not recognized until after beinghaving been launched against a target, and may originate from less regulated and remote areas around the world, we may be unable to proactively address these techniques or to implement adequate preventative measures.
Any or all of the issues above could adversely affect our brand reputation, negatively impact our ability to attract new consumers and increase engagement by existing consumers, cause existing consumers to curtailreduce or stop the use of our marketplacemarketplaces or close their accounts, cause existing dealers and advertisers to cancel their contracts, cause employees to terminate their employment, cause
28
employment candidates to be unwilling to pursue employment opportunities or accept employment offers, and and/or subject us to governmental or third-party lawsuits, investigations, regulatory fines, or other actions or liability, thereby harming our business, results of operations, and financial condition.
There are numerous federal, national, state, and local laws and regulations in the United States and around the world regarding privacy and the collection, processing, storage, sharing, disclosure, use, cross-border transfer, and protection of personal information and other data. These laws and regulations are evolving, are subject to differing interpretations, may be costly to comply with, may result in regulatory fines or penalties, may subject us to third-party lawsuits, may be inconsistent between countries and jurisdictions, and may conflict with other requirements.
24
We seek to comply with industry standards and are subject to the terms of our privacy policies and privacy-related obligations to third parties, as well as all applicable laws policies, legal obligations, and industry codes of conductregulations relating to privacy and data protection. However, it is possible that these obligations may be interpreted and applied in new ways or in a manner that is inconsistent from one jurisdiction to another and may conflict with other rules or our practices and that new regulations could be enacted. Several proposals have recently become effective or are pending, as applicable, before federal, state, local, and foreign legislative and regulatory bodies that could significantly affect our business, including the General Data Protection Regulation in the EU, or the GDPR, which went into effect on May 25, 2018, and the California Consumer Privacy Act, or the CCPA, which went into effect on January 1, 2020. The CCPA, among other things, contains new disclosure obligations for businesses that collect personal information about2020, and the California residentsPrivacy Rights Act, or the CPRA, the Virginia Consumer Data Protection Act, or the VCDPA, each of which goes into effect on January 1, 2023, and provides California residents with additional rights relating to their personal information.the Colorado Privacy Act, or the CPA, which goes into effect on July 1, 2023. The GDPR and CCPA in particular have already required, and along with the CPRA, VCDPA, and CPA, may further require, us to change our policies and procedures and may in the future require us to make changes to our marketplacemarketplaces and other products. These and other requirements could reduce demand for our marketplacemarketplaces and other offerings, require us to take on more onerous obligations in our contracts and restrict our ability to store, transfer, and process data, which may seriously harm our business. Similarly, Brexit and the Schrems II decision of the Court of Justice of the EU, which effectively invalided the EU-U.S. Privacy Shield Framework, may require us to change our policies and procedures and, if we are not in compliance, may also seriously harm our business. We may not be entirely successful in our efforts to comply with the evolving regulations to which we are subject due to various factors within our control, such as limited internal resource allocation, or outside our control, such as a lack of vendor cooperation, new regulatory interpretations, or lack of regulatory guidance in respect of certain GDPR, CCPA, CPA, CPRA, or CCPAVCDPA requirements.
Any failure or perceived failure by us to comply with United States and international data protection laws and regulations, our privacy policies, or our privacy-related obligations to consumers, customers, employees and other third parties, or any compromise of security that results in the unauthorized release or transfer of sensitive information, which could include personal information or other user data, may result in governmental investigations, enforcement actions, regulatory fines, litigation, criminal penalties, or public statements against us by consumer advocacy groups or others, and could cause consumers and dealers to lose trust in us, which could significantly impact our brand reputation and have an adverse effect on our business. Additionally, if any third party that we share information with experiences a security breach or fails to comply with its privacy-related legal obligations or commitments to us, such matters may put employee, consumer or dealer information at risk and could in turn expose us to claims for damages or regulatory fines or penalties and harm our reputation, business, and operating results.
Our ability to attract consumers to our own websites and forto provide certain services to our advertising clientscustomers depends on the collection of consumer data from various sources, which may be restricted by consumer choice, privacy restrictions, imposed by advertising partners, web browsers or other software, and developments in laws, regulations and industry standards.
The success of our consumer marketing and the delivery of internet advertisements for our clientscustomers depends on our ability to leverage data, including data that we collect from our clients,customers, data we receive from our publisher partners and third parties, and data from our operations. Using cookies and non-cookie-based technologies, such as mobile advertising identifiers, we collect information about the interactions of users with our clients’customers’ and publishers’ digital properties (including, for example, information about the placement of advertisements and users’ shopping or other interactions with our clients’customers’ websites or advertisements). Our ability to successfully leverage such data depends on our continued ability to access and use such data, which could be restricted by a number of factors, including: increasing consumer adoption of “do not track” mechanisms as a result of legislation including GDPR, CCPA, CPA, CPRA, and VCDPA; privacy restrictions imposed by web browser developers, advertising partners or other software developers that impair our ability to understand the preferences of consumers by limiting the use of third-party cookies or other tracking technologies or data indicating or predicting consumer preferences; and new developments in, or new interpretations of, privacy laws, regulations and industry standards.
|
|
|
|
|
|
Each of these developments could materially impact our ability to collect consumer data and deliver relevant internet advertisements to attract consumers to our websites or to deliver targeted advertising for our advertising clients.customers. If we are unsuccessful in evolving our advertising and marketing strategies to adapt to and mitigate these evolving consumer data limitations, our business results could be materially impacted.
2529
We have been, and may again be, subject to intellectual property disputes, which are costly to defend and could harm our business and operating results.
We arehave been, and expect in the future to be, subject to claims and litigation by third partiesalleging that we infringe theirothers’ intellectual property rights, and we may face allegations in the future that we have infringedincluding the trademarks, copyrights, patents, and other intellectual property rights of third parties, including from our competitors or non-practicing entities. We may also learn of possible infringement to our trademarks, copyrights, patents, and other intellectual property. In addition, we could be subject to lawsuits where consumers and dealers posting content on our websites disseminate materials that infringe the intellectual property rights of third parties. We have encountered lawsuits in the past containing such allegations.
Patent and other intellectual property litigation may be protracted and expensive, and the results are difficult to predict and may result in significant settlement costs or payment of substantial damages. Many potential litigants, including patent holding companies, have the ability to dedicate substantially greater resources to enforce their intellectual property rights and to defend claims that may be brought against them. Furthermore, a successful claimant could secure a judgment that requires us to stop offering some features or prevents us from conducting our business as we have historically done or may desire to do in the future. We might also be required to seek a license and pay royalties for the use of such intellectual property, which may not be available on commercially acceptable terms, or at all. Alternatively, we may be required to modify our marketplacemarketplaces and features while we develop non-infringing substitutes, which could require significant effort and expense and may ultimately not be successful.
In addition, we use open source software in our platform and will use open source software in the future. From time to time, we may face claims from companies that incorporate open source software into their products, claiming ownership of, or demanding release of, the source code, the open source software, or derivative works that were developed using such software, or otherwise seeking to enforce the terms of the applicable open source license. These claims could also result in litigation, require us to purchase a costly license or require us to devote additional product, technology, and development resources to change our platformplatforms or services, any of which would have a negative effect on our business and operating results.
Even if these matters do not result in litigation or are resolved in our favor or without significant cash settlements, these matters, and the time and resources necessary to litigate or resolve them, could harm our business, our operating results, and our reputation.
Failure to adequately protect our intellectual property could harm our business and operating results.
Our business depends on our intellectual property, the protection of which is crucial to the success of our business. We rely on a combination of patent, trademark, trade secret, and copyright law and contractual restrictions to protect our intellectual property. In addition, we attempt to protect our intellectual property, technology, and confidential information by requiring our employees and consultants to enter into confidentiality and assignment of inventions agreements and third parties to enter into nondisclosure agreements as we deem appropriate. Despite our efforts to protect our proprietary rights, unauthorized parties may attempt to copy aspects of our platform’s features, software, and functionality or obtain and use information that we consider proprietary.
Competitors may adopt servicetrademarks or trade names similar to ours, thereby harming our ability to build brand identity and possibly leading to user confusion. In addition, there could be potential trade name or trademark infringement claims broughtasserted against us by owners of other registered or unregistered trademarks logos or slogans, for our use of registered or unregistered trademarks, logos or slogans, or third party trademarks that incorporate variations of the term “CarGurus.” If we are restricted in any way in registering our CARGURUS mark in international markets, it could impact our ability to establish and grow our business internationally. Also, while wetrademarks. We have registered the CARGURUS and CG logos, in the EUand the United Kingdom, as well as the word-mark CARGURUS, in Italy, France, Spain,the U.S., Canada, and the United KingdomKingdom. Additionally, CarOffer has a number of registered and for a subset of services, Ireland, we were not able to registerunregistered trademarks, including “CarOffer” and the word-mark CARGURUSCarOffer logo, and related marks, which CarOffer has registered as trademarks in the EU and Germany as the mark was deemed to be non-distinctive, and thus not registerable. We may be unable to register CARGURUS, the word-mark, in certain other countries in the EU. If we are unable to register the CARGURUS word-mark in any country, it may limit our ability to challenge unauthorized users of marks that are the same as or similar to CARGURUS.U.S.
We currently hold the “CarGurus.com” internet domain name and various other related domain names.names relating to our brands. The regulation of domain names is subject to change. Regulatory bodies could establish additional top-level domains, appoint additional domain name registrars, or modify the requirements for holding domain names. As a result, we may not be able to acquire or maintain all domain names that use the name CarGurus.names of our brands. In addition, third parties have created and may in the future create copycat or squatter domains to deceive consumers, which could harm our brand,brands, interfere with our ability to register domain names, and result in additional costs.
26
Confidentiality agreements with employees and others may not adequately prevent disclosure of trade secrets and other proprietary information.
In order to protect our technologies and processes, we rely in part on confidentiality agreements with our employees, independent contractors, and other advisors. These agreements may not effectively prevent disclosure of confidential information, including trade secrets, and may not provide an adequate remedy in the event of unauthorized disclosure of confidential information. Others may also independently discover our trade secrets and proprietary information, and in such cases, we may not be able to assert our trade secret rights against such parties. To the extent that our employees, contractors, or other third parties with whom we do business use intellectual property owned by others in their work for us, disputes may arise as to the rights to related or resulting know-how and inventions. The loss of confidential information or intellectual property rights, including trade secret protection, could make it easier for third parties to compete with our products. In addition, any changes in, or unexpected interpretations of, intellectual property laws may compromise our ability to enforce our trade secret and intellectual property rights. Costly and time-consuming litigation could be necessary to enforce and determine the scope of our proprietary rights, and failure to obtain or maintain protection of our trade secrets or other proprietary information could harm our business, results of operations, reputation, and competitive position.
We may be unable to halt the operations of websites that aggregate or misappropriate our data.
From time to time, third parties may misappropriate our data through website scraping, robots, or other means and aggregate this data on their websites with data from other companies.sources. In addition, copycat websites may misappropriate data in our marketplacemarketplaces and attempt to imitate our brandbrands or the functionality of our websites. If we become aware of such activities, we intend to employ technological or legal measures in an attempt to halt their operations. However, we may be unable to detect and remedy all such activities in a timely manner and, even if we could, technological and legal measures may be insufficient to halt their operations.manner. In some cases, particularly in the case of entities operating outside of the United States, our available remedies may not be adequate to protect us against the impact of the operation of such websites.operations. Regardless of whether we can successfully enforce our rights against the operators of these websites,third parties, any measures that we may take could require us to expend significant financial or other resources, which could harm our business, results of operations, and financial condition. In addition, to the extent that such activity creates confusion among consumers or advertisers, our brandbrands and business could be harmed.
We may incur losses in the future if we fail to sufficiently grow our revenue or manage our costs effectively.30
Although we have experienced significant growth in revenue on a year-over-year basis, our annual revenue growth rate is likely to continue to decline in the future as a result of a variety of factors. Our international expansion and new product launches will cause our costs to increase in future periods as we continue to expend substantial financial resources to enter into those markets and promote the new products, as applicable. If we fail to increase our revenue or manage these additional costs, we may incur losses in the future.
Complying with the laws and regulations affecting public companies has increased and may continue to increase our costs and the demands on management and could harm our operating results.
As a public company, and particularly since December 31, 2018 when we ceased being an “emerging growth company,” as defined in the Jumpstart Our Business Startups Act of 2012, or the JOBS Act, we incur significant legal, accounting,Seasonality and other expenses to comply with applicable laws and regulations. In addition, the Sarbanes-Oxley Act of 2002, or the Sarbanes-Oxley Act, and rules subsequently implemented by the SEC and the Nasdaq Stock Market, or Nasdaq, impose various requirements on public companies, including requiring certain corporate governance practices. Our management and other personnel devote and expect to continue to devote a substantial amount of time to these compliance initiatives. Moreover, these rules and regulations have increased and may continue to increase our legal, accounting, and financial compliance costs and have made and will continue to make some activities more time consuming and costly. These rules and regulations could also make it more difficult for us to attract and retain qualified persons to serve on our board of directors or our board committees or as executive officers.
In addition, the Sarbanes-Oxley Act requires, among other things, that we assess the effectiveness of our internal control over financial reporting annually and the effectiveness of our disclosure controls and procedures quarterly. In particular, as we are a large accelerated filer, our independent registered public accounting firm is required to attest to the effectiveness of our internal control over financial reporting, pursuant to Section 404 of the Sarbanes-Oxley Act, or Section 404, and we now incur the cost of our compliance with Section 404. Our compliance with applicable provisions of Section 404 requires that we incur substantial accounting expense and expend significant management time on compliance-related issues as we implement additional corporate governance practices and comply with reporting requirements.
27
We must maintain proper and effective internal controls over financial reporting and any failure to maintain the adequacy of these internal controls may adversely affect investor confidence in our company and, as a result, the value of our Class A common stock could decline.
We are required, pursuant to Section 404 and the related rules adopted by the SEC, to furnish a report by management on, among other things, the effectiveness of our internal control over financial reporting on an annual basis. This assessment includes disclosure of any material weaknesses identified by our management in our internal control over financial reporting. During the evaluation and testing process, if we identify and fail to remediate one or more material weaknesses in our internal control over financial reporting, we will be unable to assert that our internal controls are effective.
In addition, our independent registered public accounting firm must attest to the effectiveness of our internal control over financial reporting under Section 404. Our independent registered public accounting firm may issue a report that is adverse to us in the event it is not satisfied with the level at which our controls are documented, designed or operating. We may not be able to remediate any future material weaknesses, or to complete our evaluation, testing and any required remediation in a timely fashion. We are also required to disclose significant changes made to our internal control procedures on a quarterly basis. Our compliance with Section 404 requires that we incur substantial accounting expense and expend significant management efforts.
Any failure to maintain internal control over financial reporting could severely inhibit our ability to accurately report our financial condition or results of operations. If we are unable to assert that our internal control over financial reporting is effective or our independent registered public accounting firm is unable to express an opinion on the effectiveness of our internal control over financial reporting when it is required to issue such opinion, we could lose investor confidence in the accuracy and completeness of our financial reports, the market price of our Class A common stock could decline, and we could be subject to sanctions or investigations by Nasdaq, the SEC or other regulatory authorities.
Seasonalityfactors may cause fluctuations in our operating results.results and our marketing spend.
Across the retail automotive industry, consumer purchases are typically greatest in the first three quarters of each year, due in part to the introduction of new vehicle models from manufacturers and the seasonal nature of consumer spending, and our consumer-marketing spend generally fluctuates accordingly. As consumer automotive purchases slow in the fourth quarter, our rate of marketing spend typically also slows. This seasonality has not been immediately apparent historically due to the overall growth of other operating expenses. In addition, any reduction of our marketing spend in response to COVID-19-related expense management or otherwise, and shifts in demand from dealers and consumers could impact the efficiency of our marketing spend. As our growth rates begin to moderate or cease, the impact of these seasonality trends and other influences on our results of operations could become more pronounced.
We expect our results In addition, the volume of operationswholesale vehicle sales fluctuates from quarter to fluctuate on a quarterly and annual basis.
Our revenue and results of operations could vary significantly from period to period and may fail to match expectationsquarter as a result of macroeconomic issues, such as the global semiconductor chip shortage, which may have a variety of factors, some of which are outside of our control. Our results may vary as a result of fluctuations in the number of dealers subscribing to our marketplace and the size and seasonal variability of our advertisers’ marketing budgets. As a result of the potential variations in our revenue and results of operations, period-to-period comparisons may not be meaningful and the results of any one period should not be reliedcorresponding impact on as an indication of future performance. In addition, our results of operations may not meetoperations. This variability is caused by several factors including the expectationstiming of investors used vehicles available for sale from selling customers, the seasonality of the retail market for used vehicles and/or public market analysts who follow us,inventory challenges in the automotive industry, which may adversely affect the trading pricedemand side of our Class A common stock.
We may require additional capital to pursue our business objectives and respond to business opportunities, challenges, or unforeseen circumstances. If capital is not available to us, our business, operating results, financial condition, and prospects could be adversely affected.
We intend to continue to make investments to support our growth and may require additional capital to pursue our business objectives and respond to business opportunities, challenges, or unforeseen circumstances, including to increase our marketing expenditures to improve our brand awareness, develop new products, further improve our platform and existing products, enhance our operating infrastructure, expand internationally, and acquire complementary businesses and technologies. Accordingly, we may need to engage in equity or debt financings to secure additional funds. However, additional funds may not be available when we need them on terms that are acceptable to us or at all. Volatility in the credit markets may also have an adverse effect on our ability to obtain debt financing.
If we raise additional funds through further issuances of equity or convertible debt securities, our existing stockholders could suffer significant dilution, and any new equity securities we issue could have rights, preferences, and privileges superior to those of holders of our Class A common stock. If we are unable to obtain adequate financing or financing on
28
terms satisfactory to us when we require it, our ability to continue to pursue our business objectives and to respond to business opportunities, challenges, or unforeseen circumstances could be significantly limited, and our business, operating results, financial condition, and prospects could be adversely affected.wholesale industry.
We could be subject to adverse changes in applicable tax laws, regulations and interpretations, as well as challenges to our tax positions.
We are subject to taxation in the United States and certain other jurisdictions in which we operate. Changes in applicable tax laws or regulations may be proposed or enacted that could materially and adversely affect our effective tax rate, tax payments, results of operations, financial condition and cash flows.
In addition, tax laws and regulations are complex and subject to varying interpretations. For instance, on June 21, 2018, the United States Supreme Court issued its decision in South Dakota v. Wayfair, Inc., or the Wayfair Decision, which overturned prior case law that held that out-of-state merchants were not required to collect sales taxes unless they had a physical presence in the buyer’s state. Although we currently believe that the Wayfair Decision is unlikely to have a material effect on our business, it has created uncertainty over sales tax liability, and could precipitate reactions by legislators, regulators and courts that could adversely increase our tax administrative costs and tax risk, and negatively affect our overall business, results of operations, financial condition and cash flows.
We are also regularly subject to audits by tax authorities. For example, we are currently under audit by the Internal Revenue Service with respect to our 2016, 2017 and 2018 federal employment taxes.Any adverse development or outcome in connection with these tax audits, and any other audits or litigation, could materially and adversely impact our effective tax rate, tax payments, results of operations, financial condition and cash flows.
Failure to deal effectively with fraud or other illegal activity could lead to potential legal liability, harm our business, cause us to lose paying dealer customers and adversely affect our reputation, financial performance and prospects for growth.
Based on the nature of our business, we are exposed to potential fraudulent and illegal activity in our marketplace,marketplaces, including:
|
|
|
|
|
|
listings of automobiles that are not owned by the purported dealer or that the dealer has no intention of selling at the listed price; receipt of fraudulent leads that we may send to our dealers; and deceptive practices in our peer-to-peer marketplace. The measures we have in place to detect and limit the occurrence of such fraudulent and illegal activity in our marketplacemarketplaces may not always be effective or account for all types of fraudulent or other illegal activity. Further, the measures that we use to detect and limit the occurrence of fraudulent and illegal activity must be dynamic, as technologies and ways to commit fraud and illegal activity are continually evolving. Failure to limit the impact of fraudulent and illegal activity on our websites could lead to potential legal liability, harm our business, cause us to lose paying dealer customers and adversely affect our reputation, financial performance and prospects for growth.
Risks Related to Our Class A Common Stock
Our founder controls a majority of the voting power of our outstanding capital stock, and, therefore, has control over key decision-making and could control our actions in a manner that conflicts with the interests of other stockholders.
Primarily by virtue of his holdings in shares of our Class B common stock, which has a ten-to-one voting ratio compared to our Class A common stock, Langley Steinert, our founder, ChiefChairman of the Board and Executive Officer and Chairman, is able to exercise voting rights with respect to a majority of the voting power of our outstanding capital stock and therefore has the ability to control the outcome of matters submitted to our stockholders for approval, including the election of directors and any merger, consolidation, or sale of all or substantially all of our assets. This concentrated control could delay, defer, or prevent a change of control, merger, consolidation, or sale of all or substantially all of our assets that our other stockholders support, or conversely this concentrated control could result in the consummation of such a transaction that our other stockholders do not support. This concentrated control could also discourage a potential investor from acquiring our Class A common stock, which has limited voting power relative to the Class B common stock and might harm the trading price of our Class A common stock. In addition, Mr. Steinert has the ability to controlsignificant influence in the management and major strategic investments
29
of our company as a result of his positionsposition as our Chief Executive Officer and Chairman, and his ability to control the election or replacement of our directors. As a board memberChairman of the Board and officer,our Executive Chairman, Mr. Steinert owes a fiduciary duty to our stockholders and must act in good faith in a manner he reasonably believes to be in the best interests of our stockholders. If Mr. Steinert’s status as an officer and a director is terminated, his fiduciary duties to our stockholders will also terminate, but his voting power as a stockholder will not be reduced as a result of such termination unless such termination is either made voluntarily by Mr. Steinert or due to Mr. Steinert’s death, or if the sum of the number of shares of our capital stock held by Mr. Steinert, by any Family Member of Mr. Steinert, and by any Permitted Entity of Mr. Steinert (as such capitalized terms are defined in our amended and restated certificate of incorporation)incorporation attached to this Annual Report on Form 10-K as Exhibit 3.1), assuming the exercise and settlement in full of all outstanding options and convertible securities and calculated on an as-converted to Class A common stock basis, is less than 9,091,484 shares.shares. As a stockholder, even a controlling stockholder, Mr. Steinert is entitled to vote his shares in his own interests, which may not always be aligned with the interests of our other stockholders.
We believe that Mr. Steinert’s continued control of a majority of the voting power of our outstanding capital stock is beneficial to us and is in the best interests of our stockholders. In the event that Mr. Steinert no longer controls a majority of the voting power, whether as a result of the disposition of some or all his shares of Class A or Class B common stock, the conversion of the Class B common stock into Class A common stock in accordance with its terms, or otherwise, our business or the trading price of our Class A common stock may be adversely affected.
The multiple class structure of our common stock has the effect of concentrating voting control with our founder and certain other holders of our Class B common stock, which will limit or preclude the ability of our stockholders to influence corporate matters.
Our Class B common stock has ten votes per share and our Class A common stock has one vote per share. Our founder and certain of his affiliates hold a substantial number of the outstanding shares of our Class B common stock and therefore hold a substantial majority of the voting power of our outstanding capital stock. Because of the ten-to-one voting ratio between our Class B and Class A
31
common stock, the holders of our Class B common stock collectively control a majority of the combined voting power of our common stock and therefore are able to control all matters submitted to our stockholders for approval so long as the shares of Class B common stock represent at least 9.1% of all outstanding shares of our Class A and Class B common stock. This concentrated control will limit or preclude the ability of our other stockholders to influence corporate matters for the foreseeable future.
Transfers by holders of Class B common stock will generally result in those transferred shares converting into Class A common stock, subject to limited exceptions, such as certain transfers effected for estate planning or charitable purposes. The conversion of Class B common stock into Class A common stock has had and will continue to have the effect, over time, of increasing the relative voting power of those holders of Class B common stock who retain their shares in the long term.such shares. If, for example, Mr. Steinert retains a significant portion of his holdings of Class B common stock, for an extended period of time, he could in the future, continue to control a majority of the combined voting power of our outstanding capital stock.
Our status as a “controlled company” could make our Class A common stock less attractive to some investors or otherwise harm the trading price of our Class A common stock.
More than 50% of our voting power is held by Mr. Steinert. As a result, we are a “controlled company” under the corporate governance rules for Nasdaq-listed companies and may elect not to comply with certain Nasdaq corporate governance requirements. We rely and have relied on certain or all of these exemptions. Accordingly, should the interests of our controlling stockholder differ from those of other stockholders, the other stockholders may not have the same protections afforded to stockholders of companies that are subject to all of the corporate governance rules for Nasdaq-listed companies. Our status as a controlled company could make our Class A common stock less attractive to some investors or otherwise harm our stock price.
The trading price of our Class A common stock has been and may continue to be volatile and the value of our stockholders’ investment in our stock could decline.
The trading price of our Class A common stock has been and may continue to be volatile and fluctuate substantially. The trading price of our Class A common stock depends on a number of factors, including those described in this “Risk Factors” section, many of which are beyond our control and may not be related to our operating performance. Factors that could cause fluctuations in the trading price of our Class A common stock include the following:
|
|
| changes in |
|
|
|
|
|
|
|
|
30
|
|
|
|
|
|
|
|
|
|
|
|
|
|
|
|
|
|
|
|
|
|
In addition, the stock market in general, and the market for technology companies in particular, have experienced extreme price and volume fluctuations that have often been unrelated or disproportionate to the operating performance and stock market valuations of other technology companies generally, or those companies. Broadin our industry in particular; sales of shares of our Class A common stock by us or our stockholders; adverse changes to recommendations regarding our stock by securities analysts that cover us; failure of securities analysts to maintain coverage of us, changes in financial estimates by any securities analysts who follow our company, or our failure to meet these estimates or the expectations of investors; announcements by us or our competitors of new products; the public’s reaction to our issuances of earnings guidance or other public announcements and filing; real or perceived inaccuracies in our key metrics; actions of an activist stockholder; actual or anticipated changes in our operating results or fluctuations in our operating results or developments in our business, our competitors’ businesses, or the competitive landscape generally; litigation involving us or investigations by regulators into our operations or those of our competitors; developments or disputes concerning our proprietary rights; announced or completed acquisitions of businesses or technologies by us or our competitors; new laws or regulations or new interpretations of existing laws or regulations applicable to our business; changes in accounting standards, policies, or guidelines; any significant change in our management; changes in the automobile industry; and general economic conditions, including as related to the continuing effects of the COVID-19 pandemic.
General Risk Factors
We participate in a highly competitive market, and pressure from existing and new companies may adversely affect our business and operating results.
We face significant competition from companies that provide listings, car-shopping information, lead generation, marketing, wholesale, and digital car-buying and -selling services designed to help consumers and dealers shop for cars and to enable dealers to reach these consumers. Our competitors include: online automotive marketplaces and websites; internet search engines; peer-to-peer marketplaces; social media marketplaces; sites operated by automobile dealers; online dealerships; and vehicle auction companies. We compete with these and other companies for a share of dealers’ overall marketing budget for online and offline media marketing spend and we compete with these and other companies in attracting consumers to our websites. To the extent that dealers view alternative marketing and media strategies to be superior to our marketplaces, we may not be able to maintain or grow the number of dealers subscribing to, and advertising on, our marketplaces, and our business and financial results may be adversely affected. We also expect that new competitors will continue to enter the online automotive retail and wholesale industries with competing marketplaces, products, and services, and that existing competitors will expand to offer competing products or services, which could have an adverse effect on our business and financial results.
Our competitors could significantly impede our ability to expand the number of dealers using our marketplaces or could offer discounts that could significantly impede our ability to maintain our pricing structure. Our competitors may also develop and market new technologies that render our existing or future platforms and associated products less competitive, unmarketable, or obsolete. In addition, if our competitors develop platforms with similar or superior functionality to ours, or if our web traffic declines, we may need
32
to decrease our subscription and advertising fees. If we are unable to maintain our current pricing structure due to competitive pressures, our revenue would likely be reduced and our financial results would be negatively affected.
Our existing and potential competitors may have significantly more financial, technical, marketing, and other resources than we have, which may allow them to offer more competitive pricing and the ability to devote greater resources to the development, promotion, and support of their marketplaces, products, and services. They may also have more extensive automotive industry factorsrelationships than we have, longer operating histories, and greater name recognition. In addition, these competitors may seriouslybe able to respond more quickly with technological advances and to undertake more extensive marketing or promotional campaigns than we can. To the extent that any competitor has existing relationships with dealers or auto manufacturers for marketing or data analytics solutions, those dealers and auto manufacturers may be unwilling to partner with us. If we are unable to compete with these competitors, the demand for our marketplaces and related products and services could substantially decline.
We rely on third-party service providers and strategic partners for many aspects of our business, and any failure to maintain these relationships or to successfully integrate certain third-party platforms could harm our business.
Our success depends upon our relationships with third parties, including, among others: our payment processor; our data center hosts; our information technology providers; our data providers for inventory and vehicle information; and our partners for vehicle transportation, inspection and other logistics associated with our CarOffer business and IMCO. If these third parties experience difficulty meeting our requirements or standards, have adverse audit results, violate the terms of our agreements or applicable law, fail to obtain or maintain applicable licenses, or if the relationships we have established with such third parties expire or otherwise terminate, it could make it difficult for us to operate some aspects of our business, which could damage our business and reputation. In addition, if such third-party service providers or strategic partners were to cease operations, temporarily or permanently, face financial distress or other business disruptions, increase their fees, or if our relationships with these providers or partners deteriorate or terminate, whether as a result of the COVID-19 pandemic or otherwise, we could suffer increased costs and we may be unable to provide similar services until an equivalent provider could be found or we could develop replacement technology or operations. In addition, if we are unsuccessful in identifying or finding high-quality partners, if we fail to negotiate cost-effective relationships with them, or if we ineffectively manage these relationships, it could have an adverse impact on our business and financial results.
Our enterprise systems require that we integrate the platforms hosted by certain third-party service providers. We are responsible for integrating these platforms and updating them to maintain proper functionality. Issues with these integrations, our failure to properly update third-party platforms or any interruptions to our internal enterprise systems could harm our business by causing delays in our ability to quote, activate service and bill new and existing customers on our platform.
We must maintain proper and effective internal control over financial reporting and any failure to maintain the adequacy of these internal controls may adversely affect investor confidence in our company and, as a result, the value of our Class A common stock.
We are required, pursuant to Section 404 and the related rules adopted by the SEC, to furnish a report by management on, among other things, the effectiveness of our internal control over financial reporting on an annual basis. This assessment includes disclosure of any material weaknesses identified by our management in our internal control over financial reporting. During the evaluation and testing process, if we identify and fail to remediate one or more material weaknesses in our internal control over financial reporting, we will be unable to assert that our internal controls are effective.
In addition, our independent registered public accounting firm must attest to the effectiveness of our internal control over financial reporting under Section 404. Our independent registered public accounting firm may issue a report that is adverse to us in the event it is not satisfied with the level at which our controls are documented, designed or operating. We may not be able to remediate any future material weaknesses, or to complete our evaluation, testing and required remediation in a timely fashion. We are also required to disclose significant changes made to our internal control procedures on a quarterly basis. Our compliance with Section 404 requires that we incur substantial accounting expense and expend significant management efforts.
Any failure to maintain internal control over financial reporting could severely inhibit our ability to accurately report our financial condition or results of operations. If we are unable to assert that our internal control over financial reporting is effective or our independent registered public accounting firm is unable to express an opinion on the effectiveness of our internal control over financial reporting when it is required to issue such opinion, we could lose investor confidence in the accuracy and completeness of our financial reports, the market price of our Class A common stock regardless of our actual operating performance. In addition, in the past, following periods of volatility in the overall marketcould decline, and the market prices of a particular company’s securities, securities class action litigation has often been instituted against these companies. Litigation of this type, if instituted against us, could result in substantial costs and a diversion of our management’s attention and resources.
Our businesswe could be negatively affectedsubject to sanctions or investigations by Nasdaq, the SEC or other regulatory authorities.
We expect our results of operations to fluctuate on a quarterly and annual basis.
Our revenue and results of operations could vary significantly from period to period and may fail to match expectations as a result of actionsa variety of activist stockholders,factors, some of which could be disruptive and potentially costly, and such activism could impact the trading valueare outside of our common stockcontrol, including the continued effects of the COVID-19 pandemic and cause uncertainty aboutother macroeconomic issues, such as the strategic directionglobal semiconductor chip shortage. Our results may vary as a result of fluctuations in the number of dealers subscribing to our marketplaces and the size and seasonal variability of our business.
Even though we areadvertisers’ marketing budgets. As a controlled company,result of the actions of activist stockholders could nevertheless adversely affect our business. Activist stockholders may from time to time attempt to effect changespotential variations in our strategic direction,revenue and in furtherance thereof,results of operations, period-to-period comparisons may seek changes in how our company is governed. not be meaningful and the results of anyResponding to
strategic proposals by activist stockholders related to our business, strategy, management or operations, or the composition33
one period should not be relied on as an indication of our board of directors, could disrupt our operations, be costly and time-consuming, or divert the attention of our board of directors and senior management from the pursuit of business strategies.future performance. In addition, perceived uncertainties as toour results of operations may not meet the future strategic directionexpectations of our business in relation to the actions of an activist stockholder investors or public market analysts who follow us, which may be exploited by our competitors, cause concern to current or potential customers, result in the loss of potential business opportunities, make it more difficult to attract and retain qualified personnel and/oradversely affect our relationships with vendors, customers and other third parties. Actions of an activist stockholder may also cause fluctuations in the trading price of our Class A common stock based on temporary or speculative market perceptions or other factors that do not necessarily reflect the underlying fundamentals and prospects of our business.stock.
The exclusion of our Class A common stock from major stock indexesWe could adversely affect the trading market and price of our Class A common stock.
Several major stock index providers have announced they will beginbe subject to exclude, or are considering plans to exclude, from their indexes the securities of companies with unequal voting rights such as ours. Exclusion from stock indexes could make it more difficult, or impossible, for some fund managers to buy the excluded securities, particularly in the case of index tracking mutual funds and exchange traded funds. The exclusion of our Class A common stock from major stock indexes could adversely affect the trading market and price of our Class A common stock.
31
Anti-takeover provisions contained in our amended and restated certificate of incorporation and amended and restated bylaws, as well as provisions of Delaware law, could impair a takeover attempt.
The provisions of our amended and restated certificate of incorporation and amended and restated bylaws, and provisions of Delaware law, may have the effect of rendering more difficult, delaying, or preventing an acquisition deemed undesirable by our board of directors. Our corporate governance documents include provisions:
|
|
|
|
|
|
|
|
|
|
|
|
|
|
|
|
These provisions, alone or together, could delay or prevent hostile takeovers andadverse changes in control or changes in our management.
As a Delaware corporation, we are also subject to provisions of Delaware law, including Section 203 of the Delaware General Corporation law, which prevent some stockholders holding more than 15% of our outstanding common stock from engaging in certain business combinations without approval of the holders of substantially all of our outstanding common stock.
Any provision of our amendedtax laws, regulations and restated certificate of incorporation, amended and restated bylaws, or Delaware law that has the effect of delaying or deterring a change in control could limit the opportunity for our stockholders to receive a premium for their shares of our Class A common stock, and could also affect the price that some investors are willing to pay for our Class A common stock.
Our amended and restated certificate of incorporation includes a forum selection clause, which could limit our stockholders’ ability to obtain a favorable judicial forum for disputes with us.
Our amended and restated certificate of incorporation provides that, unless we consent in writing to the selection of an alternative forum, the Court of Chancery of the State of Delaware will, to the fullest extent permitted by law, be the sole and exclusive forum for any stockholder to bring: (i) any derivative action or proceeding brought on behalf of us; (ii) any action asserting a claim of breach of a fiduciary duty owed by any of our directors, officers or other employees or agents to us orinterpretations, plus challenges to our stockholders; (iii) any action asserting a claim against us arising pursuant to any provision of the Delaware General Corporation Law or our amended and restated certificate of incorporation or amended and restated bylaws; (iv) any action to interpret, apply, enforce or determine the validity of our amended and restated certificate of incorporation or our amended and restated bylaws; or (v) any action asserting a claim against us or any of our directors, officers, or other employees or agents governed by the internal affairs doctrine. Any person or entity purchasing or otherwise acquiring any interest in shares of our capital stock is deemed to have notice of and have consented to the foregoing provisions. This forum selection provision in our amended and restated certificate of incorporation may limit our stockholders’ ability to obtain a favorable judicial forum for disputes with us. It is also possible that, notwithstanding the forum selection clause included in our amended and restated certificate of incorporation, a court could rule that such a provision is inapplicable or unenforceable.
32
If securities or industry analysts do not publish, or cease publishing, research or reports about us, our business or our market, or if they change their recommendations regarding our stock adversely, the trading price and trading volume of our Class A common stock could decline.tax positions.
The trading market for our Class A common stock is influenced by the research and reports that industry or securities analysts may publish about us, our business, our market, and our competitors. If any of the analysts that covers us changes its recommendation regarding our stock adversely, or provides more favorable relative recommendations about our competitors, our stock price would likely decline. If any analyst that covers us were to cease coverage of our company or fail to regularly publish reports on us, we could lose visibility in the financial markets, which in turn could cause our stock price or trading volume to decline.
We do not intend to pay cash dividends for the foreseeable future.
We have never declared or paid cash dividends on our capital stock. We currently intend to retain any future earnings to finance the operation and expansion of our business, and we do not expect to declare or pay any cash dividends in the foreseeable future. As a result, our stockholders may only receive a return on their investment in our Class A common stock if the trading price of their shares increases.
Our status as a “controlled company” could make our Class A common stock less attractive to some investors or otherwise harm the trading price of our Class A common stock.
More than 50% of our voting power is held by Mr. Steinert. As a result, we are a “controlled company” under the corporate governance rules for Nasdaq-listed companies. Under these rules, a company of which more than 50% of the voting power is held by an individual, a group or another company is a controlled company and may elect not to comply with certain Nasdaq corporate governance requirements, including:
|
|
|
|
|
|
|
|
We rely and have relied on certain or all of these exemptions. Accordingly, should the interests of our controlling stockholder differ from those of other stockholders, the other stockholders may not have the same protections afforded to stockholders of companies that are subject to alltaxation in the United States and certain other jurisdictions in which we operate. Changes in applicable tax laws or regulations may be proposed or enacted that could materially and adversely affect our effective tax rate, tax payments, results of operations, financial condition and cash flows. In addition, tax laws and regulations are complex and subject to varying interpretations. There is also uncertainty over sales tax liability as a result of the corporate governance rulesU.S. Supreme Court’s decision in South Dakota v. Wayfair, Inc., which could precipitate reactions by legislators, regulators and courts that could adversely increase our tax administrative costs and tax risk, and negatively affect our overall business, results of operations, financial condition and cash flows. We are also regularly subject to audits by tax authorities. Any adverse development or outcome in connection with any such tax audits, and any other audits or litigation, could materially and adversely impact our effective tax rate, tax payments, results of operations, financial condition and cash flows.
Confidentiality agreements may not adequately prevent disclosure of our trade secrets and other proprietary information.
In order to protect our technologies and processes, we rely in part on confidentiality agreements with our employees, independent contractors, and other advisors. These agreements may not effectively prevent disclosure of confidential information, including trade secrets, and may not provide an adequate remedy in the event of unauthorized disclosure of confidential information. To the extent that our employees, contractors, or other third parties with whom we do business use intellectual property owned by others in their work for Nasdaq-listed companies. Our statusus, disputes may arise as a controlled companyto the rights to related or resulting know-how and inventions. In addition, any changes in, or unexpected interpretations of, intellectual property laws may compromise our ability to enforce our trade secret and intellectual property rights. Costly and time-consuming litigation could makebe necessary to enforce and determine the scope of our Class A common stock less attractiveproprietary rights, and failure to some investorsobtain or otherwisemaintain protection of our trade secrets or other proprietary information could harm our stock price.business, results of operations, reputation, and competitive position.
3334
Item 1B. Unresolved Staff Comments.
Not applicable.
Item 2. Properties.
We do not own any real property. Our principal executive offices are located in Cambridge, Massachusetts where we lease a total of approximately 163,675185,064 square feet of space in various parcels in three buildings with lease terms that expire in November 2022,2023, August 2023, January 2025, and December 2033, as applicable. We also lease office space in Addison, Texas, Dublin, Ireland, and San Francisco, California for our CarOffer, European operations. and Autolist operations, respectively. We believe that our current facilities are suitable and adequate to meet our current needs. We believe that suitable additional space or substitute space will be available in the future to accommodate our operations as needed. In 2019, we entered into (i) an amendment of an existing lease to increase our leased office space at 55 Cambridge Parkway in Cambridge, Massachusetts, which additional space we expect to occupy in 2020, and (ii) a lease for office space at 1001 Boylston Street in Boston, Massachusetts, which we expect to occupy in 2023.
Item 3. Legal Proceedings.
From time to time we may become involved in legal proceedings or be subject to claims arising in the ordinary course of our business. We are not presently subject to any pending or threatened litigation that we believe, if determined adversely to us, individually, or taken together, would reasonably be expected to have a material adverse effect on our business or financial results.
Item 4. Mine Safety Disclosures.
Not applicable.
3435
PART II
Item 5. Market for Registrant’s Common Equity, Related Stockholder Matters and Issuer Purchases of Equity Securities.
Market Information for Common Stock
Our Class A common stock has been listed on the Nasdaq Global Select Market under the symbol “CARG” since October 12, 2017. Prior to that date, there was no public trading market for our Class A common stock. Our initial public offering, or IPO, was priced at $16.00 per share on October 11, 2017.
On February 13, 2020,23, 2022, the last reported sale price of our Class A common stock on the Nasdaq Global Select Market was $34.10$31.01 per share.
Holders
Holders
As of February 6, 2020,18, 2022, we had 19seven holders of record of our Class A common stock. The actual number of stockholders is greater than this number of record holders, and includes stockholders who are beneficial owners but whose shares are held in street name by brokers and other nominees. The number of holders of record does not include stockholders whose shares may be held in trust by other entities.
Dividends
Dividends
We have never declared or paid any cash dividends on our common stock. We currently anticipate that we will retain future earnings to fund development and growth of our business, and we do not anticipate paying cash dividends in the foreseeable future.
36
Performance Graph
This performance graph shall not be deemed “soliciting material” or to be “filed” with the Securities and Exchange Commission for purposes of Section 18 of the Securities Exchange Act of 1934, as amended, or the Exchange Act, or otherwise be subject to the liabilities under that section, and shall not be deemed to be incorporated by reference into any filing of CarGurus, Inc. under the Exchange Act or the Securities Act of 1933, as amended.
35
The following graph shows a comparison from October 12, 2017 (the date our Class A common stock commenced trading on the Nasdaq Global Select Market) through December 31, 20192021 of the cumulative total return for our Class A common stock, the Nasdaq Composite Index and the S&P 500 Index. All values assume a $100 initial cash investment and data for the Nasdaq Composite Index and the S&P 500 Index assume reinvestment of dividends, if any. Such returns are based on historical results and are not intended to suggest future performance.
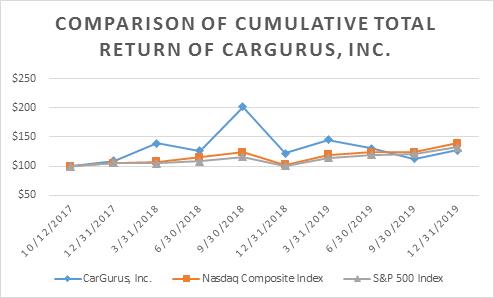
|
| 10/12/2017 |
|
| 12/31/2017 |
|
| 3/31/2018 |
|
| 6/30/2018 |
|
| 9/30/2018 |
|
| 12/31/2018 |
|
| 3/31/2019 |
|
| 6/30/2019 |
|
| 9/30/2019 |
|
| 12/31/2019 |
| ||||||||||
CARG |
|
| 100 |
|
|
| 109 |
|
|
| 139 |
|
|
| 126 |
|
|
| 202 |
|
|
| 122 |
|
|
| 145 |
|
|
| 131 |
|
|
| 112 |
|
|
| 128 |
|
S&P 500 Index |
|
| 100 |
|
|
| 105 |
|
|
| 104 |
|
|
| 108 |
|
|
| 116 |
|
|
| 101 |
|
|
| 114 |
|
|
| 119 |
|
|
| 121 |
|
|
| 132 |
|
Nasdaq Computer Index |
|
| 100 |
|
|
| 105 |
|
|
| 108 |
|
|
| 115 |
|
|
| 123 |
|
|
| 102 |
|
|
| 119 |
|
|
| 124 |
|
|
| 124 |
|
|
| 139 |
|
|
| 10/12/2017 |
|
| 12/31/2017 |
|
| 12/31/2018 |
|
| 12/31/2019 |
|
| 12/31/2020 |
|
| 12/31/2021 |
| ||||||
CARG |
|
| 100 |
|
|
| 109 |
|
|
| 122 |
|
|
| 128 |
|
|
| 115 |
|
|
| 122 |
|
S&P 500 Index |
|
| 100 |
|
|
| 105 |
|
|
| 101 |
|
|
| 132 |
|
|
| 157 |
|
|
| 202 |
|
Nasdaq Computer Index |
|
| 100 |
|
|
| 105 |
|
|
| 102 |
|
|
| 139 |
|
|
| 202 |
|
|
| 247 |
|
Recent Sales of Unregistered Securities
None.
Purchases of Equity Securities
None.
36
Item 6. Selected Consolidated Financial Data.
The following Selected Consolidated Financial Data should be read in conjunction with “Management’s Discussion and Analysis of Financial Condition and Results of Operations”, the consolidated financial statements and related notes, and other financial information included in this Annual Report on Form 10-K.Not applicable.
We derived the consolidated statements of operations data for the years ended December 31, 2019, 2018, and 2017 and the consolidated balance sheet data as of December 31, 2019 and 2018 from our audited consolidated financial statements, which are included elsewhere in this Annual Report on Form 10-K. We derived the consolidated statement of operations data for the year ended December 31, 2016 and 2015 and the consolidated balance sheet data as of December 31, 2017, 2016 and 2015 from our audited consolidated financial statements, which are not included in this Annual Report on Form 10-K. Historical results are not necessarily indicative of the results to be expected in future periods.
|
| Year Ended December 31, |
| |||||||||||||||||
|
| 2019 |
|
| 2018(4) |
|
| 2017 |
|
| 2016 |
|
| 2015 |
| |||||
|
| (in thousands, except share and per share data) |
| |||||||||||||||||
Consolidated Statements of Operations Data: |
|
|
|
|
|
|
|
|
|
|
|
|
|
|
|
|
|
|
|
|
Revenue: |
|
|
|
|
|
|
|
|
|
|
|
|
|
|
|
|
|
|
|
|
Marketplace subscription |
| $ | 526,043 |
|
| $ | 405,780 |
|
| $ | 282,664 |
|
| $ | 171,302 |
|
| $ | 75,142 |
|
Advertising and other |
|
| 62,873 |
|
|
| 48,306 |
|
|
| 34,197 |
|
|
| 26,839 |
|
|
| 23,446 |
|
Total revenue |
|
| 588,916 |
|
|
| 454,086 |
|
|
| 316,861 |
|
|
| 198,141 |
|
|
| 98,588 |
|
Cost of revenue(1) |
|
| 36,300 |
|
|
| 24,811 |
|
|
| 17,609 |
|
|
| 9,575 |
|
|
| 4,234 |
|
Gross profit |
|
| 552,616 |
|
|
| 429,275 |
|
|
| 299,252 |
|
|
| 188,566 |
|
|
| 94,354 |
|
Operating expenses: |
|
|
|
|
|
|
|
|
|
|
|
|
|
|
|
|
|
|
|
|
Sales and marketing |
|
| 393,844 |
|
|
| 315,939 |
|
|
| 236,165 |
|
|
| 154,125 |
|
|
| 81,877 |
|
Product, technology, and development |
|
| 69,462 |
|
|
| 47,866 |
|
|
| 22,470 |
|
|
| 11,453 |
|
|
| 8,235 |
|
General and administrative |
|
| 50,434 |
|
|
| 39,475 |
|
|
| 22,688 |
|
|
| 12,783 |
|
|
| 5,801 |
|
Depreciation and amortization |
|
| 4,554 |
|
|
| 2,804 |
|
|
| 2,655 |
|
|
| 1,634 |
|
|
| 969 |
|
Total operating expenses |
|
| 518,294 |
|
|
| 406,084 |
|
|
| 283,978 |
|
|
| 179,995 |
|
|
| 96,882 |
|
Income (loss) from operations |
|
| 34,322 |
|
|
| 23,191 |
|
|
| 15,274 |
|
|
| 8,571 |
|
|
| (2,528 | ) |
Other income (expense), net: |
|
|
|
|
|
|
|
|
|
|
|
|
|
|
|
|
|
|
|
|
Interest income |
|
| 2,984 |
|
|
| 2,283 |
|
|
| 869 |
|
|
| 416 |
|
|
| 1 |
|
Other income (expense), net |
|
| 1,399 |
|
|
| 10 |
|
|
| (306 | ) |
|
| (42 | ) |
|
| (13 | ) |
Total other income (expense), net |
|
| 4,383 |
|
|
| 2,293 |
|
|
| 563 |
|
|
| 374 |
|
|
| (12 | ) |
Income (loss) before income taxes |
|
| 38,705 |
|
|
| 25,484 |
|
|
| 15,837 |
|
|
| 8,945 |
|
|
| (2,540 | ) |
(Benefit from) provision for income taxes |
|
| (3,441 | ) |
|
| (39,686 | ) |
|
| 2,638 |
|
|
| 2,448 |
|
|
| (904 | ) |
Net income (loss) |
| $ | 42,146 |
|
| $ | 65,170 |
|
| $ | 13,199 |
|
| $ | 6,497 |
|
| $ | (1,636 | ) |
Net income (loss) per share attributable to common stockholders, basic and diluted:(2) |
|
|
|
|
|
|
|
|
|
|
|
|
|
|
|
|
|
|
|
|
Basic |
| $ | 0.38 |
|
| $ | 0.60 |
|
| $ | 0.13 |
|
| $ | (0.58 | ) |
| $ | (0.41 | ) |
Diluted |
| $ | 0.37 |
|
| $ | 0.57 |
|
| $ | 0.12 |
|
| $ | (0.58 | ) |
| $ | (0.41 | ) |
Weighted—average shares used to compute net income (loss) per share attributable to common stockholders:(2) |
|
|
|
|
|
|
|
|
|
|
|
|
|
|
|
|
|
|
|
|
Basic |
|
| 111,450,443 |
|
|
| 108,833,028 |
|
|
| 55,835,265 |
|
|
| 44,138,922 |
|
|
| 43,141,236 |
|
Diluted |
|
| 113,431,850 |
|
|
| 113,364,712 |
|
|
| 60,637,584 |
|
|
| 44,138,922 |
|
|
| 43,141,236 |
|
|
|
|
|
|
|
|
|
|
|
|
|
|
|
|
|
|
|
|
|
|
Other Financial Information: |
|
|
|
|
|
|
|
|
|
|
|
|
|
|
|
|
|
|
|
|
Adjusted EBITDA(3) |
| $ | 76,989 |
|
| $ | 49,658 |
|
| $ | 24,097 |
|
| $ | 10,965 |
|
| $ | (366 | ) |
|
|
37
|
|
|
|
|
|
|
| December 31, |
| |||||||||||||||||
|
| 2019(2) |
|
| 2018(1) |
|
| 2017 |
|
| 2016 |
|
| 2015 |
| |||||
|
| (in thousands) |
| |||||||||||||||||
Consolidated Balance Sheet Data: |
|
|
|
|
|
|
|
|
|
|
|
|
|
|
|
|
|
|
|
|
Cash, cash equivalents, and investments |
| $ | 171,612 |
|
| $ | 157,687 |
|
| $ | 137,709 |
|
| $ | 74,250 |
|
| $ | 61,363 |
|
Property and equipment, net |
|
| 27,950 |
|
|
| 24,269 |
|
|
| 16,563 |
|
|
| 12,780 |
|
|
| 7,147 |
|
Working capital |
|
| 145,196 |
|
|
| 131,355 |
|
|
| 114,238 |
|
|
| 56,547 |
|
|
| 52,751 |
|
Total assets |
|
| 393,623 |
|
|
| 268,290 |
|
|
| 176,594 |
|
|
| 100,331 |
|
|
| 77,781 |
|
Total liabilities |
|
| 136,768 |
|
|
| 74,179 |
|
|
| 49,569 |
|
|
| 35,605 |
|
|
| 20,534 |
|
Convertible preferred stock |
|
| — |
|
|
| — |
|
|
| — |
|
|
| 132,698 |
|
|
| 73,378 |
|
Total stockholders’ equity (deficit) |
|
| 256,855 |
|
|
| 194,111 |
|
|
| 127,025 |
|
|
| (67,972 | ) |
|
| (16,131 | ) |
|
|
|
|
Adjusted EBITDA
To provide investors with additional information regarding our financial results, we monitor and have presented within this Annual Report on Form 10-K Adjusted EBITDA, which is a non‑GAAP financial measure. This non‑GAAP financial measure is not based on any standardized methodology prescribed by U.S. generally accepted accounting principles, or GAAP, and is not necessarily comparable to similarly titled measures presented by other companies.
We define Adjusted EBITDA as net income (loss), adjusted to exclude: depreciation and amortization, stock‑based compensation expense, acquisition-related expenses, other (income) expense, net, and the (benefit from) provision for income taxes. We have presented Adjusted EBITDA in this Annual Report on Form 10-K because it is a key measure used by our management and board of directors to understand and evaluate our operating performance, generate future operating plans, and make strategic decisions regarding the allocation of capital. In particular, we believe that the exclusion of certain items in calculating Adjusted EBITDA can produce a useful measure for period‑to‑period comparisons of our business.
We use Adjusted EBITDA to evaluate our operating performance and trends and make planning decisions. We believe Adjusted EBITDA helps identify underlying trends in our business that could otherwise be masked by the effect of the expenses that we exclude. Accordingly, we believe that Adjusted EBITDA provides useful information to investors and others in understanding and evaluating our operating results, enhancing the overall understanding of our past performance and future prospects, and allowing for greater transparency with respect to key financial metrics used by our management in its financial and operational decision‑making. In addition, we evaluate our Adjusted EBITDA in relation to our revenue. We refer to this as Adjusted EBITDA margin and define it as Adjusted EBITDA divided by total revenue.
38
Our Adjusted EBITDA is not prepared in accordance with GAAP, and should not be considered in isolation of, or as an alternative to, measures prepared in accordance with GAAP. There are a number of limitations related to the use of Adjusted EBITDA rather than net income (loss), which is the most directly comparable GAAP equivalent. Some of these limitations are:
|
|
|
|
|
|
|
|
|
|
|
|
Because of these limitations, we consider, and you should consider, Adjusted EBITDA together with other operating and financial performance measures presented in accordance with GAAP.
The following table presents a reconciliation of Adjusted EBITDA to net income (loss), the most directly comparable measure calculated in accordance with GAAP, for each of the periods presented.
|
| Year Ended December 31, |
| |||||||||||||||||
|
| 2019 |
|
| 2018(2)(3) |
|
| 2017 |
|
| 2016 |
|
| 2015 |
| |||||
|
| (in thousands) |
| |||||||||||||||||
Reconciliation of Adjusted EBITDA: |
|
|
|
|
|
|
|
|
|
|
|
|
|
|
|
|
|
|
|
|
Net income (loss) |
| $ | 42,146 |
|
| $ | 65,170 |
|
| $ | 13,199 |
|
| $ | 6,497 |
|
| $ | (1,636 | ) |
Depreciation and amortization |
|
| 7,817 |
|
|
| 5,029 |
|
|
| 3,795 |
|
|
| 2,072 |
|
|
| 1,122 |
|
Stock-based compensation expense |
|
| 34,301 |
|
|
| 20,794 |
|
|
| 5,028 |
|
|
| 322 |
|
|
| 1,040 |
|
Acquisition-related expenses(1) |
|
| 549 |
|
|
| 644 |
|
|
| — |
|
|
| — |
|
|
| — |
|
Other (income) expense, net |
|
| (4,383 | ) |
|
| (2,293 | ) |
|
| (563 | ) |
|
| (374 | ) |
|
| 12 |
|
(Benefit from) provision for income taxes |
|
| (3,441 | ) |
|
| (39,686 | ) |
|
| 2,638 |
|
|
| 2,448 |
|
|
| (904 | ) |
Adjusted EBITDA |
| $ | 76,989 |
|
| $ | 49,658 |
|
| $ | 24,097 |
|
| $ | 10,965 |
|
| $ | (366 | ) |
|
|
|
|
|
|
39
Item 7. Management’s Discussion and Analysis of Financial Condition and Results of Operations.
You should read the following discussion and analysis of our financial condition and results of operations together with our consolidated financial statements and the related notes and other financial information included elsewhere in this report. Some of the information contained in this discussion and analysis or elsewhere in this report,Annual Report on Form 10-K, including information with respect to our plans and strategy for our business and our performance and future success, includes forward‑looking statements that involve risks and uncertainties. See “Special Note Regarding Forward-Looking Statements.” You should review the “Risk Factors” section of this Annual Report on Form 10-K for a discussion of important factors that could cause actual results to differ materially from the results described in or implied by the forward‑looking statements contained in the following discussion and analysis.
In this discussion, we use financial measures that are considered non‑GAAP financial measures under Securities and Exchange Commission rules. These rules regarding non-GAAP financial measures require supplemental explanation and reconciliation, which isare included elsewhere in this Annual Report on Form 10-K. Investors should not consider non‑GAAP financial measures in isolation from or in substitution for, financial information presented in compliance with U.S.United States generally accepted accounting principles, or GAAP.
This section of this Annual Report on Form 10-K discusses 2021 and 2020 items and year-to-year comparisons between 2021 and 2020. Discussions of 2019 items and year-to-year comparisons between 2020 and 2019 can be found in “Management’s Discussion and Analysis of Financial Condition and Results of Operations” in Part II, Item 7 of our Annual Report on Form 10-K for the fiscal year ended December 31, 2020. The period‑to‑period comparison of financial results is not necessarily indicative of future results.
Company Overview
CarGurus is a global,multinational, online automotive platform for buying and selling vehicles that is building upon its industry-leading listings marketplace connecting buyerswith both digital retail solutions and sellers of newthe CarOffer online wholesale platform. The CarGurus marketplace gives consumers the confidence to purchase or sell a vehicle either online or in-person, and used cars. Usingit gives dealerships the power to accurately price, effectively market, instantly acquire and quickly sell vehicles, all with a nationwide reach. We use our proprietary technology, search algorithms and innovative data analytics to bring trust, transparency and competitive pricing to the automotive shopping experience.
We are headquartered in Cambridge, Massachusetts and were incorporated in the State of Delaware on June 26, 2015.
We operate principally in the United States. In the United States, we provide informationalso operate as independent brands the Autolist online marketplace, which we wholly own, and analysis that createCarOffer digital wholesale marketplace, in which we own a differentiated automotive search experience for consumers. Our trusted marketplace empowers users with unbiased third‑party validation on pricing and dealer reputation as well as other information that aids them in finding “Great Deals from Top-Rated Dealers.”51% equity interest. In addition to the United States, we operate online marketplaces under the CarGurus brand in Canada and the United Kingdom, Germany, Italy, and Spain.Kingdom. In the United Kingdom, we also operate as an independent brand the PistonHeads online marketplace, as an independent brand.which we wholly own. We also operated online marketplaces in Germany, Italy, and Spain until we ceased the operations of each of these marketplaces in the second quarter of 2020.
We generate marketplace subscription revenue from dealers primarily through Listings, and Dealer Display subscriptions, and advertising and other revenue from automobile manufacturers and other auto‑related brand advertisers as well as partnerships with financing services companies. We generated revenue of $588.9 millionhave subsidiaries in 2019, $454.1 million in 2018,the United States, Canada, Ireland, and $316.9 million in 2017, representing year-over-year increases of 30% in 2019 and 43% in 2018.
In 2019,the United Kingdom. Additionally, we generated net income of $42.1 million and our Adjusted EBITDA was $77.0 million, compared to a net income of $65.2 million and Adjusted EBITDA of $49.7 million in 2018, and a net income of $13.2 million and Adjusted EBITDA of $24.1 million in 2017. See “Selected Consolidated Financial Data — Adjusted EBITDA” for more information regarding our use of Adjusted EBITDA, a non-GAAP financial measure, and a reconciliation of Adjusted EBITDA to our net income.
We have two reportable segments, United States and International. See Note 13 and Note 15 of our consolidated financial statements included elsewhere in Item 8this Annual Report on Form 10-K for further segment reporting and geographical information.
We generate marketplace revenue primarily from (i) dealer subscriptions to our Listings packages and Real-time Performance Marketing, or RPM, digital advertising suite, (ii) advertising revenue from auto manufacturers and other auto‑related brand advertisers and (iii) revenue from partnerships with financing services companies. We generate wholesale revenue primarily from transaction fees earned by CarOffer from facilitating the purchase and sale of vehicles between dealers. We generate product revenue primarily from aggregate proceeds received on the sale of vehicles.
For the year ended December 31, 2021, we generated revenue of $951.4 million, a 73% increase from $551.5 million of revenue in the year ended December 31, 2020.
For the year ended December 31, 2021, we generated consolidated net income of $110.4 million and Adjusted EBITDA of $249.5 million, compared to consolidated net income of $77.6 million and Adjusted EBITDA of $160.8 million for the year ended December 31, 2020.
See “Adjusted EBITDA and Adjusted EBITDA Margin” below for more information regarding our use of Adjusted EBITDA, a non-GAAP financial measure, and a reconciliation of Adjusted EBITDA to our consolidated net income.
38
COVID-19 Update
The COVID-19 pandemic has caused an international health crisis and resulted in significant disruptions to the global economy as well as businesses and capital markets around the world.
Our operations have been materially adversely affected by a range of factors related to the COVID-19 pandemic. Since March 2020, all of our offices have been temporarily closed and, subject to limited exceptions, all of our employees have worked remotely, which has disrupted how we operate our business. In addition, in an effort to limit the spread of COVID-19, Canada and the United Kingdom, as well as states and localities in the United States, implemented or mandated significant restrictions on travel and commerce, shelter-in-place or stay-at-home orders, and business closures. Fluctuation in infection rates in the regions in which we operate has resulted in periodic changes in restrictions that vary from region to region and may require rapid response to new or reinstated orders. Many of these orders resulted in restrictions on the ability of consumers to buy and sell automobiles by restricting operations at dealerships and/or by closing or reducing the services provided by certain service providers upon which dealerships rely. In addition, these restrictions and continued concern about the spread of the disease have impacted car shopping by consumers and disrupted the operations of car dealerships, which has adversely affected the market for automobile purchases.
The automotive industry is also facing inventory supply problems, including for reasons attributable to the COVID-19 pandemic and other macroeconomic issues, such as the global semiconductor chip shortage, which have adversely affected the amount of inventory on our websites.
As a result of the travel and commerce restrictions and the impact on their businesses, a number of our dealer customers have, or are temporarily closed or are operating on a reduced capacity, and many dealerships have faced significant financial challenges, which caused us to experience increased customer cancellation rates and slowed paying dealer additions during the year ended December 31, 2020. However, since the second quarter of 2020, cancellations by paying dealers have begun to stabilize, which we believe resulted primarily from the resumption of consumer activity.
Further, in the past, we have taken measures to help our paying dealers maintain their business health during the COVID-19 pandemic, including by proactively reducing the subscription fees for paying dealers for certain service periods. As a result, the level of fees we received from paying dealers materially decreased during the year ended December 31, 2020 as compared to the prior year, resulting in a material decline in our revenue on a year-over-year basis and a material adverse effect to our business. These effects on our revenue caused us to implement a cost-savings initiative during the second quarter of 2020, or the Expense Reduction Plan, that included a reduction in our workforce, a limitation in discretionary spend across our business, reduced consumer marketing across both algorithmic traffic acquisition and brand spend, and ceasing certain international operations and expansion efforts. We have since increased our consumer marketing and other expenses, though remaining short of pre-pandemic levels, as consumer activity increased, and governments implemented re-opening policies. For the year ended December 31, 2021, we also returned to normal contractual billings in all markets except for our suspension of charging subscription fees to paying dealers in the United Kingdom during the February 2021 service period. Although the fee reductions had a material adverse effect on our revenue for the year ended December 31, 2020, they did not have a material adverse impact for the year ended December 31, 2021.
We continue to monitor and assess the effects of the COVID-19 pandemic on our commercial operations, including the impact on our revenue. Recently identified variants of COVID-19, Delta and Omicron, which appear to be more transmissible and contagious than previous COVID-19 variants, have caused an increase in the number of COVID-19 cases globally. The impact of COVID-19 and, in particular, the Delta and Omicron variants or other variants that may emerge, cannot be predicted at this time, and could depend on a number of factors, including the availability of vaccines in different parts of the world, vaccination rates among the population, and the effectiveness of COVID-19 vaccines against the Delta and Omicron variants and any other variants that may emerge. Accordingly, we cannot at this time accurately predict what effects these conditions will ultimately have on our future revenue and operations. See the “Risk Factors” section of this Annual Report on Form 10-K for more information.further discussion of the impacts of the COVID-19 pandemic on our business.
39
Key Business Metrics
We regularly review a number of metrics, including the key metrics listed below, to evaluate our business, measure our performance, identify trends affecting our business, formulate financial projections, and make operating and strategic decisions. We believe it is important to evaluate these metrics for the United States and International segments. The International segment derives revenues from marketplace subscriptions, advertising services, and other revenuesrevenue from customers outside of the United States. International markets perform differently from the United States market due to a variety of factors, including our operating history in theeach market, our rate of investment, market size, market maturity, competition and other dynamics unique to each country. The metrics presented below exclude CarOffer as we believe such metrics are either not applicable for the CarOffer business or do not provide a meaningful way to evaluate the CarOffer business.
40
Monthly Unique Users
For each of our websites, we define a monthly unique user as an individual who has visited any such website within a calendar month, based on data as measured by Google Analytics. We calculate average monthly unique users as the sum of the monthly unique users of each of our websites in a given period, divided by the number of months in that period. We count a unique user the first time a computer or mobile device with a unique device identifier accesses oneany of our websites during a calendar month. If an individual accesses a website using a different device within a given month, the first access by each such device is counted as a separate unique user. If an individual uses multiple browsers on a single device and/or clears their cookies and returns to our site within a calendar month, each such visit is counted as a separate unique user. We view our average monthly unique users as a key indicator of the quality of our user experience, the effectiveness of our advertising and traffic acquisition, and the strength of our brand awareness. Measuring unique users is important to us and we believe it provides useful information to our investors because our marketplace subscription revenue depends, in part, on our ability to provide dealers with connections to our users and exposure to our marketplace audience. We define connections as interactions between consumers and dealers on our marketplace through phone calls, email, managed text and chat, and clicks to access the dealer’s website or map directions to the dealership.
|
| Year Ended December 31, |
| |||||||||
Average Monthly Unique Users |
| 2019 |
|
| 2018 |
|
| 2017 |
| |||
|
| (in thousands) |
| |||||||||
United States |
|
| 36,804 |
|
|
| 34,275 |
|
|
| 24,469 |
|
International |
|
| 10,353 |
| (1) |
| 4,280 |
|
|
| 2,451 |
|
Total |
|
| 47,157 |
|
|
| 38,555 |
|
|
| 26,920 |
|
|
| |||||||||||||||||||||||||||||||||||||||||||||||||||||||||||||||
Monthly Sessions
We define monthly sessions as the number of distinct visits to our websites that take place each month within a given time frame, as measured and defined by Google Analytics. We calculate average monthly sessions as the sum of the monthly sessions in a given period, divided by the number of months in that period. A session is defined as beginning with the first page view from a computer or mobile device and ending at the earliest of when a user closes their browser window, after 30 minutes of inactivity, or each night at midnight (i) Eastern Time for our United States and Canada websites, other than the Autolist website, (ii) Pacific Time for the Autolist website, (iii) Greenwich Mean Time for our U.K. websites, and (iii)(iv) Central European Time (or Central European Summer Time when daylight savings is observed) for our Germany, Italy, and Spain websites, as applicable.which ceased operations in the second quarter of 2020. A session can be made up of multiple page views and visitor actions, such as performing a search, visiting vehicle detail pages, and connecting with a dealer. We believe that measuring the volume of sessions in a time period, when considered in conjunction with the number of unique users in that time period, is an important indicator to us of consumer satisfaction and engagement with our marketplace, and we believe it provides useful information to our investors because the more satisfied and engaged consumers we have, the more valuable our service is to dealers.
|
| Year Ended December 31, |
|
| Year Ended December 31, |
| ||||||||||||||
Average Monthly Sessions |
| 2019 |
|
| 2018 |
|
| 2017 |
|
| 2021 |
|
| 2020 |
| |||||
|
| (in thousands) |
|
| (in thousands) |
| ||||||||||||||
United States |
|
| 99,412 |
|
|
| 91,798 |
|
|
| 64,758 |
|
| 79,316 |
|
|
| 90,909 |
| |
International |
|
| 24,955 |
| (1) |
| 9,873 |
|
|
| 5,365 |
|
|
| 17,309 |
|
|
| 19,326 |
|
Total |
|
| 124,367 |
|
|
| 101,671 |
|
|
| 70,123 |
|
| 96,625 |
|
|
| 110,235 |
| |
40 |
|
41
Number of Paying Dealers
AWe define a paying dealer isas a dealer based on a distinct associated inventory feed, that subscribes to one of ouraccount with an active, paid Listings packages or Dealer Display advertising and audience targeting productsmarketplace subscription at the end of a defined period. The number of paying dealers we have is important to us and we believe it provides valuable information to investors because it is indicative of the value proposition of our marketplace products, as well as our sales and marketing success and opportunity, including our ability to retain paying dealers and develop new dealer relationships.
|
| As of December 31, |
|
| As of December 31, |
| ||||||||||||||
Number of Paying Dealers |
| 2019 |
|
| 2018 |
|
| 2017 |
|
| 2021 |
|
| 2020 |
| |||||
United States |
|
| 28,990 |
|
|
| 27,534 |
|
|
| 25,122 |
|
| 23,860 |
|
|
| 23,934 |
| |
International |
|
| 7,125 |
| (1) |
| 3,938 |
|
|
| 2,548 |
|
|
| 6,770 |
|
|
| 6,697 |
|
Total |
|
| 36,115 |
|
|
| 31,472 |
|
|
| 27,670 |
|
| 30,630 |
|
|
| 30,631 |
| |
|
|
Quarterly Average Annual Revenue per Subscribing Dealer (AARSD)(QARSD)
We measure the average annual revenue we receive from each paying dealer. We define AARSD,QARSD, which is measured at the end of a defined period,fiscal quarter, as the total marketplace subscription revenue primarily from subscriptions to our Listings packages and RPM digital advertising suite during thethat trailing 12 monthsquarter divided by the average number of paying dealers in that marketplace during the same trailing 12-month period.quarter. We calculate the average number of paying dealers for a period by adding the number of paying dealers at the end of such period and the end of the prior period and dividing by two. This information is important to us, and we believe it provides useful information to investors, because we believe that our ability to grow AARSDQARSD is an indicator of the value proposition of our products and the return on investment, or ROI, that our paying dealers realize from our products. In addition, increases in AARSD,QARSD, which we believe reflect the value of exposure to our engaged audience in relation to subscription cost, are driven in part by our ability to grow the volume of connections to our users and the quality of those connections, which result in increased opportunity to upsell package levels and cross-sell additional products to our paying dealers.
|
| As of December 31, |
| |||||||||
Average Annual Revenue per Subscribing Dealer (AARSD) |
| 2019 |
|
| 2018 |
|
| 2017 |
| |||
United States |
| $ | 17,576 |
|
| $ | 14,819 |
|
| $ | 12,055 |
|
International |
| $ | 5,399 |
| (1) | $ | 4,778 |
|
| $ | 4,904 |
|
Consolidated |
| $ | 15,757 |
|
| $ | 13,718 |
|
| $ | 11,544 |
|
|
| ||||||||||||||||||||||||||||||||||||||||||||||||||||||
Adjusted EBITDA and Adjusted EBITDA Margin
To provide investors with additional information regarding our financial results, we monitor and have presented within this Annual Report on Form 10-K, Adjusted EBITDA and Adjusted EBITDA margin, each of which are non‑GAAP financial measures. These non‑GAAP financial measures are not based on any standardized methodology prescribed by United States generally accepted accounting principles, or GAAP, and are not necessarily comparable to similarly titled measures presented by other companies.
We define Adjusted EBITDA as consolidated net income, adjusted to exclude: depreciation and amortization, impairment of long-lived assets, stock‑based compensation expense, acquisition-related expense,expenses, restructuring expenses, other (income) expense,income, net, and the (benefit from) provision for income taxes.taxes, and net income attributable to redeemable noncontrolling interest. In addition, we evaluate our Adjusted EBITDA in relation to our revenue. We monitorrefer to this as Adjusted EBITDA margin and define it as Adjusted EBITDA divided by total revenue.
We have presented Adjusted EBITDA inand Adjusted EBITDA margin within this Annual Report on Form 10-K as a non‑GAAP financial measurebecause they are key measures used by our management and board of directors to supplementunderstand and evaluate our operating performance, generate future operating plans, and make strategic decisions regarding the financial informationallocation of capital. In particular, we present on a GAAP basis to provide investors with additional information regarding our financial results.believe that the exclusion of certain items in calculating Adjusted EBITDA as a non‑and Adjusted EBITDA margin can produce useful measures for period‑to‑period comparisons of our business.
We use Adjusted EBITDA and Adjusted EBITDA margin to evaluate our operating performance and trends and make planning decisions. We believe Adjusted EBITDA and Adjusted EBITDA margin help identify underlying trends in our business that could otherwise be masked by the effect of the expenses that we exclude. Accordingly, we believe that Adjusted EBITDA and Adjusted EBITDA margin provide useful information to investors and others in understanding and evaluating our operating results, enhancing the overall understanding of our past performance and future prospects, and allowing for greater transparency with respect to key financial metrics used by our management in its financial and operational decision‑making.
41
Our Adjusted EBITDA and Adjusted EBITDA margin are not prepared in accordance with GAAP, financial measure,and should not be considered in isolation from,of, or as an alternative to, measures prepared in accordance with GAAP. WeThere are a number of limitations related to the use of Adjusted EBITDA and Adjusted EBITDA margin rather than consolidated net income and consolidated net income margin, respectively, which are the most directly comparable GAAP equivalents. Some of these limitations are:
Because of these limitations, we consider, and you should consider, Adjusted EBITDA and Adjusted EBITDA margin together with other operating and financial performance measures presented in accordance with GAAP. Also, our non‑GAAP measure may not necessarily be comparable to similarly titled measures presented by other companies.
We believe that Adjusted EBITDA is a key indicator of our operating results. For further explanation of the usesyears ended December 31, 2021 and limitations of this measure and2020, the following table presents a reconciliation of our Adjusted EBITDAEBITDA and Adjusted EBITDA margin to consolidated net income and consolidated net income margin, respectively, the most directly comparable measures calculated in accordance with GAAP, measure, net income, please see “Selected Consolidated Financial Data —for each of the periods presented.
|
| Year Ended December 31, |
| |||||
|
| 2021 |
|
| 2020 |
| ||
|
| (in thousands) |
| |||||
Reconciliation of Adjusted EBITDA and Adjusted EBITDA Margin: |
|
|
|
|
|
| ||
Consolidated net income |
| $ | 110,373 |
|
| $ | 77,553 |
|
Depreciation and amortization |
|
| 40,476 |
|
|
| 10,191 |
|
Impairment of long-lived assets |
|
| 3,128 |
|
|
| 1,151 |
|
Stock-based compensation expense |
|
| 77,710 |
|
|
| 45,321 |
|
Acquisition-related expenses |
|
| 709 |
|
|
| 2,906 |
|
Restructuring expenses (1) |
|
| — |
|
|
| 3,514 |
|
Other income, net |
|
| (1,092 | ) |
|
| (1,354 | ) |
Provision for income taxes |
|
| 38,987 |
|
|
| 21,557 |
|
Consolidated Adjusted EBITDA |
|
| 270,291 |
|
|
| 160,839 |
|
Net income attributable to redeemable noncontrolling interest |
|
| (20,784 | ) |
|
| — |
|
Adjusted EBITDA |
| $ | 249,507 |
|
| $ | 160,839 |
|
|
|
|
|
|
|
| ||
Consolidated net income margin |
|
| 12 | % |
|
| 14 | % |
Adjusted EBITDA margin |
|
| 26 | % |
|
| 29 | % |
42
42
Components of Consolidated Income Statements of Operations
Revenue
We derive revenue from two primarythree sources: (1)(i) marketplace subscription revenue, which consists primarily of dealer subscriptions to our Listings packages and Dealer Display subscriptions, and (2)RPM digital advertising and other revenue, which consists primarily of displaysuite, advertising revenue from auto manufacturers and other auto‑related brand advertisers, as well asand revenue from partnerships with financing services companies.companies; (ii) wholesale revenue, which consists primarily of transaction fees earned by CarOffer from facilitating the purchase and sale of vehicles between dealers; and (iii) product revenue, which consists primarily of aggregate proceeds received on the sale of vehicles.
Marketplace Subscription Revenue
We offer multiple types of marketplace Listings packages to our dealers throughfor our platform:CarGurus U.S. platform (availability varies on our other marketplaces): Restricted Listings, (formerly referred to as Basic Listings), which is free; and various levels of Listings packages, which each require a paid subscription under a monthly, quarterly, semiannual, or annual subscription basis. Contractual
Our subscriptions for customers generally auto-renew on a monthly basis and are cancellable by dealers with 30 days’ advance notice atprior to the endcommencement of the committed term.applicable renewal term, although during the second quarter of 2020 we did not require 30 days’ advance notice of termination from dealers who cancelled as a result of the COVID-19 pandemic. Subscription pricing is determined based on a dealer’s inventory size, region, and our assessment of the connections and ROI the platform will provide them and is subject to discounts and/or fee reductions that we may offer from time to time. We also offer all dealers on our platform access to our Dealer Dashboard, which includes a performance summary, Dealer Insights tool, and user review management platform. DealersOnly dealers subscribing to a paid Listings package also have access to the Pricing Tool, and Market Analysis tool. The Pricing Tool and Market Analysis tool are available only to paying dealers. Subscription pricing is determined based on a dealer’s inventory size, region, and our assessment of the connections and ROI the platform will provide them.IMV Scan tool.
In addition to listingdisplaying inventory in our marketplace and providing access to the Dealer Dashboard, we offer dealers subscribing to onecertain of our Enhanced, Featured, or Featured Priority Listings packages other subscription advertising and customer acquisition products including Dealer Display, pursuant to whichand enhancements marketed under our RPM digital advertising suite. Through RPM, dealers can buy display advertising that appears in our marketplace, and on other sites on the internet and for which suchand/or on high-converting social media platforms. Such advertisements can be targeted by the user’s geography, search history, CarGurus website activity (including showing users relevant vehicles from a dealer’s inventory that they have not yet discovered on our marketplace), and a number of other targeting factors, allowing dealers to increase their visibility with in-market consumers and drive qualified traffic for dealers.
We also offer paid listingsListings packages for the Autolist website and displaypaid Listings and advertising products throughfor the PistonHeads website.
Advertising and Other Revenue
Advertising and otherMarketplace revenue also consists primarily of non-dealer display advertising revenue from auto manufacturers and other auto-related brand advertisers sold on a cost per thousand impressions, or CPM, basis. An impression is an advertisement loaded on a web page. In addition to advertising sold on a CPM basis, we also have advertising sold on a cost per click basis. Auto manufacturers and other brand advertisers can execute advertising campaigns that are targeted across a wide variety of parameters, including demographic groups, behavioral characteristics, specific auto brands, categories such as Certified Pre-Owned, and segments such as hybrid vehicles.
Advertising and otherMarketplace revenue also includes revenue from partnerships with certain financing services companies pursuant to which we enable eligible consumers on our United StatesCarGurus U.S. website to pre-qualify for financing on cars from dealerships that offer financing through such companies. Our revenuesWe primarily generate revenue from these financing partnerships are based on the number of funded loans from consumers who pre-qualify with our lending partners through our site.
We also offer non-dealer advertising products for the Autolist and PistonHeads websites.
Wholesale Revenue
Wholesale revenue includes transaction fees earned by CarOffer from facilitating the purchase and sale of vehicles between dealers, where CarOffer collects fees from both the buyer and seller. CarOffer also sells vehicles to dealers that CarOffer acquires at other marketplaces – in these instances, CarOffer collects a funded-loan basis.transaction fee from the buyer.
For43
Wholesale revenue also includes fees earned by CarOffer from performing inspection and transportation services, where CarOffer collects fees from the buyer. Inspection and transportation service revenue is inclusive of dealer to dealer transactions, other marketplace to dealer transactions, and customer to dealer transactions.
Wholesale revenue also includes fees earned by CarOffer from certain guarantees offered to dealers, where CarOffer collects fees from the buying dealer or selling dealer, as applicable.
Product Revenue
Product revenue includes the aggregate proceeds received on the sale of vehicles. This revenue relates to vehicles sold to dealers that CarOffer acquires directly from customers, inclusive of transaction fees collected from the buyer, and in limited situations across all CarOffer transactions, vehicles CarOffer resells after acquiring a description of our revenue accounting policies, see “— Critical Accounting Policiesvehicle via arbitration. Arbitration is the process by which CarOffer investigates and Significant Estimates.”resolves claims from buying dealers.
Cost of Revenue
Marketplace Cost of Revenue
Marketplace cost of revenue primarily consists of costsincludes expenses related to supporting and hosting ourdigital product offerings. These costsexpenses include personnel and related expenses for our customer support team, including salaries, benefits, incentive compensation, and stock-based compensation, for our customer support team and third-party service provider costsexpenses such as advertising, data center and networking expenses, allocated overhead costs, depreciation and amortization expense associated with our property and equipment, and amortization of developed technology, amortization of capitalized website development costs. We allocateand allocated overhead costs,expenses. The Company allocates overhead expenses, such as rent and facility costs,expenses, information technology costs,expense, and employee benefit costs,expense, to all departments based on headcount. As such, general overhead expenses are reflected in cost of revenue and each operating expense category. We expect these
Wholesale Cost of Revenue
Wholesale cost of revenue includes expenses related to increasesupporting the facilitation of the purchase and sale of vehicles between dealers, the sale by CarOffer to dealers of vehicles that it acquires at other marketplaces, and net losses on vehicles related to guarantees offered to dealers. These expenses include vehicle transportation and inspection expenses, personnel and related expenses for employees directly involved in the fulfillment and support of transactions, including salaries, benefits, incentive compensation and stock-based compensation, third-party service provider expenses, amortization of developed technology, amortization of capitalized website development and allocated overhead expenses.
Product Cost of Revenue
Product cost of revenue includes expenses related to vehicles sold to dealers that CarOffer acquires directly from consumers and in limited situations across all CarOffer transactions, in which CarOffer acquires the vehicle via arbitration. These expenses include expenses for vehicles in which CarOffer controls the vehicle and therefore acts as we continue to scale our business and introduce new products.a principal in the transaction.
43
Operating Expenses
Sales and Marketing
Sales and marketing expenses consist primarily of personnel and related expenses for our sales and marketing team, including salaries, benefits, incentive compensation, commissions, and stock-based compensation, and travel costs; costscompensation; expenses associated with consumer marketing, such as traffic acquisition, brand building, and public relations activities; costsexpenses associated with dealer marketing, such as content marketing, customer and promotional events, and industry events; amortization of internal-use software;hosting arrangements; and allocated overhead costs. For periods subsequent to the adoption of ASC 606, aexpenses. A portion of our commissions that are related to obtaining a new contract isare capitalized and amortized over the estimated benefit period of customer relationships. All other sales and marketing costsexpenses are expensed as incurred. We expect sales and marketing expenses to increase as we grow our audience and attempt to strengthen our brand awareness and, as informed by trends in our business and the competitive landscape of our market, fluctuate from quarter to quarter as we respond to the COVID-19 pandemic and changes in the macroeconomic and competitive landscapes affecting our existing dealers, consumer audience and brand awareness, which will impact our quarterlyannual results of operations.
44
Product, Technology, and Development
Product, technology, and development expenses, which include research and development costs, consist primarily of personnel and related expenses for our research and development team, including salaries, benefits, incentive compensation, stock-based compensation and allocated overhead costs.expense. Other than website development and internal-use software costs as well as other costs that qualify for capitalization,expenses, research and development costsexpenses are expensed as incurred. We expect product, technology, and development expenses to increase as we invest in additional engineering resourcing to develop new solutions and make improvements to our existing platform.
General and Administrative
General and administrative expenses consist primarily of personnel and related expenses for our executive, finance, legal, human resources,people & talent, and administrative teams, including salaries, benefits, incentive compensation, and stock-based compensation, in addition to the costsexpenses associated with professional fees for external legal, accounting and other consulting services, insurance premiums, payment processing and billing costs,expenses, and allocated overhead costs.expenses. General and administrative expenses are expensed as incurred. We expect general and administrative expenses to increase as we growcontinue to scale our business.
Depreciation and Amortization
Depreciation and amortization expenses consist of depreciation on property and equipment which includes leasehold improvements, and amortization of intangible assets.assets and internal-use software.
Other Income, Net
Other income, net consists primarily of interest income earned on our cash, cash equivalents, and investments, sublease income and net foreign exchange gains and losses.
(Benefit from) Provision for Income Taxes
We are subject to federal and state income taxes in the United States and taxes in foreign jurisdictions in which we operate. We have recognized a benefit from income taxes forFor the years ended December 31, 20192021 and 2018 as a result of stock-based compensation benefits recorded and2020, we have recognized a provision for income taxes for the year ended December 31, 2017 as a result of our consolidated taxable income position. We recognize deferred tax assets and liabilities based on temporary differences between the financial reporting and income tax bases of assets and liabilities using statutory rates. We regularly assess the need to record a valuation allowance against net deferred tax assets if, based upon the available evidence, it is more likely than not that some or all of the deferred tax assets will not be realized. OurAs of December 31, 2021 and 2020, our valuation allowanceallowances against our net deferred tax assets as of December 31, 2019 waswere both immaterial.We have not provided a valuation allowance against our net deferred tax assets at December 31, 2018 or 2017.
4445
Results of Operations
The following table sets forthFor the years ended December 31, 2021 and 2020, our selected consolidated income statements of operations data for each of the periods indicated. The period‑to‑period comparison of financial results is not necessarily indicative of future results.are as follows:
|
| Year Ended December 31, |
|
| Year Ended December 31, |
| ||||||||||||||
|
| 2019 |
|
| 2018 |
|
| 2017 |
|
| 2021 |
|
| 2020 |
| |||||
|
| (in thousands) |
|
| (dollars in thousands) |
| ||||||||||||||
Revenue: |
|
|
|
|
|
|
|
|
|
|
|
|
|
|
|
|
|
| ||
Marketplace subscription |
| $ | 526,043 |
|
| $ | 405,780 |
|
| $ | 282,664 |
| ||||||||
Advertising and other |
|
| 62,873 |
|
|
| 48,306 |
|
|
| 34,197 |
| ||||||||
Marketplace |
| $ | 636,942 |
| $ | 551,451 |
| |||||||||||||
Wholesale |
| 195,127 |
| — |
| |||||||||||||||
Product |
|
| 119,304 |
|
|
| — |
| ||||||||||||
Total revenue |
|
| 588,916 |
|
|
| 454,086 |
|
|
| 316,861 |
|
| 951,373 |
| 551,451 |
| |||
Cost of revenue |
|
| 36,300 |
|
|
| 24,811 |
|
|
| 17,609 |
| ||||||||
Cost of revenue: |
|
|
|
|
|
| ||||||||||||||
Marketplace |
| 47,689 |
| 42,706 |
| |||||||||||||||
Wholesale |
| 127,679 |
| — |
| |||||||||||||||
Product |
| 118,647 |
| — |
| |||||||||||||||
Total cost of revenue |
|
| 294,015 |
|
|
| 42,706 |
| ||||||||||||
Gross profit |
|
| 552,616 |
|
|
| 429,275 |
|
|
| 299,252 |
|
| 657,358 |
|
|
| 508,745 |
| |
Operating expenses: |
|
|
|
|
|
|
|
|
|
|
|
|
|
|
|
|
| |||
Sales and marketing |
|
| 393,844 |
|
|
| 315,939 |
|
|
| 236,165 |
|
| 290,574 |
| 256,979 |
| |||
Product, technology, and development |
|
| 69,462 |
|
|
| 47,866 |
|
|
| 22,470 |
|
| 106,423 |
|
|
| 85,726 |
| |
General and administrative |
|
| 50,434 |
|
|
| 39,475 |
|
|
| 22,688 |
|
| 97,678 |
|
|
| 62,166 |
| |
Depreciation and amortization |
|
| 4,554 |
|
|
| 2,804 |
|
|
| 2,655 |
|
|
| 14,415 |
|
|
| 6,118 |
|
Total operating expenses |
|
| 518,294 |
|
|
| 406,084 |
|
|
| 283,978 |
|
|
| 509,090 |
|
|
| 410,989 |
|
Income from operations |
|
| 34,322 |
|
|
| 23,191 |
|
|
| 15,274 |
|
| 148,268 |
|
|
| 97,756 |
| |
Other income, net: |
|
|
|
|
|
|
|
|
|
|
|
|
|
|
|
|
| |||
Interest income |
|
| 2,984 |
|
|
| 2,283 |
|
|
| 869 |
|
| 120 |
|
|
| 1,075 |
| |
Other income (expense), net |
|
| 1,399 |
|
|
| 10 |
|
|
| (306 | ) | ||||||||
Other income, net |
|
| 972 |
|
|
| 279 |
| ||||||||||||
Total other income, net |
|
| 4,383 |
|
|
| 2,293 |
|
|
| 563 |
|
| 1,092 |
|
|
| 1,354 |
| |
Income before income taxes |
|
| 38,705 |
|
|
| 25,484 |
|
|
| 15,837 |
|
| 149,360 |
|
|
| 99,110 |
| |
(Benefit from) provision for income taxes |
|
| (3,441 | ) |
|
| (39,686 | ) |
|
| 2,638 |
| ||||||||
Net income |
| $ | 42,146 |
|
| $ | 65,170 |
|
| $ | 13,199 |
| ||||||||
Provision for income taxes |
|
| 38,987 |
|
|
| 21,557 |
| ||||||||||||
Consolidated net income |
| 110,373 |
|
|
| 77,553 |
| |||||||||||||
Net income attributable to redeemable noncontrolling interest |
|
| 1,129 |
|
|
| — |
| ||||||||||||
Net income attributable to CarGurus, Inc. |
| $ | 109,244 |
|
| $ | 77,553 |
| ||||||||||||
|
| Year Ended December 31, |
|
| Year Ended December 31, |
| ||||||||||||||
|
| 2019 |
|
| 2018 |
|
| 2017 |
|
| 2021 |
|
| 2020 |
| |||||
|
| (in thousands) |
|
| (dollars in thousands) |
| ||||||||||||||
Additional Financial Data |
|
|
|
|
|
|
|
|
|
|
|
|
|
|
|
|
|
| ||
Revenue |
|
|
|
|
|
|
|
|
|
|
|
|
|
|
|
|
|
| ||
United States |
| $ | 555,007 |
|
| $ | 437,166 |
|
| $ | 307,472 |
|
| $ | 909,033 |
|
| $ | 519,835 |
|
International |
|
| 33,909 |
|
|
| 16,920 |
|
|
| 9,389 |
|
|
| 42,340 |
|
|
| 31,616 |
|
Total |
| $ | 588,916 |
|
| $ | 454,086 |
|
| $ | 316,861 |
|
| $ | 951,373 |
|
| $ | 551,451 |
|
Income (Loss) from Operations |
|
|
|
|
|
|
|
|
|
|
|
|
|
|
|
|
|
| ||
United States |
| $ | 73,872 |
|
| $ | 58,387 |
|
| $ | 41,586 |
|
| $ | 158,532 |
|
| $ | 120,836 |
|
International |
|
| (39,550 | ) |
|
| (35,196 | ) |
|
| (26,312 | ) |
|
| (10,264 | ) |
|
| (23,080 | ) |
Total |
| $ | 34,322 |
|
| $ | 23,191 |
|
| $ | 15,274 |
|
| $ | 148,268 |
|
| $ | 97,756 |
|
4546
The following table sets forthFor the years ended December 31, 2021 and 2020, our selected consolidated income statements of operations data as a percentage of revenue for each of the periods indicated.are as follows (amounts may not sum due to rounding):
|
| Year Ended December 31, |
|
| Year Ended December 31, |
| ||||||||||||||
|
| 2019 |
|
| 2018 |
|
| 2017 |
|
| 2021 |
|
| 2020 |
| |||||
Revenue: |
|
|
|
|
|
|
|
|
|
|
|
|
|
|
|
|
|
| ||
Marketplace subscription |
|
| 89 | % |
|
| 89 | % |
|
| 89 | % | ||||||||
Advertising and other |
|
| 11 |
|
|
| 11 |
|
|
| 11 |
| ||||||||
Marketplace |
| 67 | % |
|
| 100 | % | |||||||||||||
Wholesale |
| 21 |
|
|
| — |
| |||||||||||||
Product |
|
| 13 |
|
|
| — |
| ||||||||||||
Total revenue |
|
| 100 | % |
|
| 100 | % |
|
| 100 | % |
| 100 |
|
|
| 100 |
| |
Cost of revenue |
|
| 6 |
|
|
| 5 |
|
|
| 6 |
| ||||||||
Cost of revenue: |
|
|
|
|
| |||||||||||||||
Marketplace |
| 5 |
|
|
| 8 |
| |||||||||||||
Wholesale |
| 13 |
|
|
| — |
| |||||||||||||
Product |
|
| 12 |
|
|
| — |
| ||||||||||||
Total cost of revenue |
|
| 31 |
|
|
| 8 |
| ||||||||||||
Gross profit |
|
| 94 |
|
|
| 95 |
|
|
| 94 |
|
| 69 |
|
|
| 92 |
| |
Operating expenses: |
|
|
|
|
|
|
|
|
|
|
|
|
|
|
|
|
| |||
Sales and marketing |
|
| 66 |
|
|
| 69 |
|
|
| 74 |
|
| 31 |
|
|
| 47 |
| |
Product, technology, and development |
|
| 12 |
|
|
| 11 |
|
|
| 7 |
|
| 11 |
|
|
| 16 |
| |
General and administrative |
|
| 9 |
|
|
| 9 |
|
|
| 7 |
|
| 10 |
|
|
| 11 |
| |
Depreciation and amortization |
|
| 1 |
|
|
| 1 |
|
|
| 1 |
|
|
| 2 |
|
|
| 1 |
|
Total operating expenses |
|
| 88 |
|
|
| 90 |
|
|
| 89 |
|
|
| 54 |
|
|
| 75 |
|
Income from operations |
|
| 6 |
|
|
| 5 |
|
|
| 5 |
|
| 16 |
|
|
| 18 |
| |
Other income, net: |
|
|
|
|
|
|
|
|
|
|
|
|
|
|
|
|
| |||
Interest income |
|
| 0 |
|
|
| 0 |
|
|
| 0 |
|
| 0 |
|
|
| 0 |
| |
Other income (expense), net |
|
| 0 |
|
|
| 0 |
|
|
| (0 | ) | ||||||||
Other income, net |
|
| 0 |
|
|
| 0 |
| ||||||||||||
Total other income, net |
|
| 0 |
|
|
| 0 |
|
|
| 0 |
|
| 0 |
|
|
| 0 |
| |
Income before income taxes |
|
| 6 |
|
|
| 5 |
|
|
| 5 |
|
| 16 |
|
|
| 18 |
| |
(Benefit from) provision for income taxes |
|
| (1 | ) |
|
| (9 | ) |
|
| 1 |
| ||||||||
Net income |
|
| 7 | % |
|
| 14 | % |
|
| 4 | % | ||||||||
Provision for income taxes |
|
| 4 |
|
|
| 4 |
| ||||||||||||
Consolidated net income |
|
| 12 |
|
|
| 14 |
| ||||||||||||
Net income attributable to redeemable noncontrolling interest |
|
| 0 |
|
|
| 0 |
| ||||||||||||
Net income attributable to CarGurus, Inc. |
|
| 11 |
|
|
| 14 |
| ||||||||||||
|
| Year Ended December 31, |
|
| Year Ended December 31, |
| ||||||||||||||
|
| 2019 |
|
| 2018 |
|
| 2017 |
|
| 2021 |
|
| 2020 |
| |||||
Additional Financial Data |
|
|
|
|
|
|
|
|
|
|
|
|
|
|
|
|
|
| ||
Revenue |
|
|
|
|
|
|
|
|
|
|
|
|
|
|
|
|
|
| ||
United States |
|
| 94 | % |
|
| 96 | % |
|
| 97 | % |
| 96 | % |
|
| 94 | % | |
International |
|
| 6 |
|
|
| 4 |
|
|
| 3 |
|
|
| 4 |
|
|
| 6 |
|
Total |
|
| 100 | % |
|
| 100 | % |
|
| 100 | % |
|
| 100 | % |
|
| 100 | % |
Income (Loss) from Operations |
|
|
|
|
|
|
|
|
|
|
|
|
|
|
|
|
|
| ||
United States |
|
| 13 | % |
|
| 13 | % |
|
| 13 | % |
| 17 | % |
|
| 22 | % | |
International |
|
| (7 | ) |
|
| (8 | ) |
|
| (8 | ) |
|
| (1 | ) |
|
| (4 | ) |
Total |
|
| 6 | % |
|
| 5 | % |
|
| 5 | % |
|
| 16 | % |
|
| 18 | % |
47
Year Ended December 31, 20192021 Compared to Year Ended December 31, 20182020
Revenue
Revenue by Source
|
| Year Ended December 31, |
|
| Change |
|
| Year Ended December 31, |
|
| Change |
| ||||||||||||||||||||
|
| 2019 |
|
| 2018 |
|
| Amount |
|
| % |
|
| 2021 |
|
| 2020 |
|
| Amount |
|
| % |
| ||||||||
|
| (dollars in thousands) |
|
| (dollars in thousands) |
| ||||||||||||||||||||||||||
Revenue |
|
|
|
|
|
|
|
|
|
|
|
|
|
|
|
|
|
|
|
|
|
|
|
|
| |||||||
Marketplace subscription |
| $ | 526,043 |
|
| $ | 405,780 |
|
| $ | 120,263 |
|
|
| 30 | % | ||||||||||||||||
Advertising and other |
|
| 62,873 |
|
|
| 48,306 |
|
|
| 14,567 |
|
|
| 30 |
| ||||||||||||||||
Marketplace |
| $ | 636,942 |
| $ | 551,451 |
| $ | 85,491 |
| 16 | % | ||||||||||||||||||||
Wholesale |
| 195,127 |
| — |
| 195,127 |
| NM |
| |||||||||||||||||||||||
Product |
|
| 119,304 |
|
|
| — |
|
|
| 119,304 |
|
| NM |
| |||||||||||||||||
Total |
| $ | 588,916 |
|
| $ | 454,086 |
|
| $ | 134,830 |
|
|
| 30 | % |
| $ | 951,373 |
|
| $ | 551,451 |
|
| $ | 399,922 |
|
|
| 73 | % |
Percentage of total revenue: |
|
|
|
|
|
|
|
|
|
|
|
|
|
|
|
|
|
|
|
|
|
|
|
|
|
|
|
| ||||
Marketplace subscription |
|
| 89 | % |
|
| 89 | % |
|
|
|
|
|
|
|
| ||||||||||||||||
Advertising and other |
|
| 11 |
|
|
| 11 |
|
|
|
|
|
|
|
|
| ||||||||||||||||
Marketplace |
| 67 | % |
| 100 | % |
|
|
|
|
|
| ||||||||||||||||||||
Wholesale |
| 21 |
| — |
|
|
|
|
|
| ||||||||||||||||||||||
Product |
|
| 13 |
|
|
| — |
|
|
|
|
|
|
| ||||||||||||||||||
Total |
|
| 100 | % |
|
| 100 | % |
|
|
|
|
|
|
|
|
|
| 100 | % |
|
| 100 | % |
|
|
|
|
|
| ||
NM - Not Meaningful
46
Overall revenue increased $134.8$399.9 million, or 30%73%, in the year ended December 31, 20192021 compared to the year ended December 31, 2018. Both marketplace subscription revenue and advertising and other2020.
Marketplace revenue increased by 30%.$85.5 million, or 16%, in the year ended December 31, 2021 compared to the year ended December 31, 2020 and represented 67% of total revenue for the year ended December 31, 2021 and 100% of total revenue for the year ended December 31, 2020. This increase was due primarily to the approximately $50 million impact of fee reductions that we provided to our paying dealers during the second quarter of 2020 in response to the COVID-19 pandemic, of which approximately $47 million resulted in revenue reductions during such quarter, with the remaining impact spread over the life of the contract term. The increase was also due in part to product upgrades for existing dealers and signing on new dealers with higher average monthly recurring revenue.
Marketplace subscriptionWholesale revenue increased $120.3$195.1 million in the year ended December 31, 20192021 compared to the year ended December 31, 20182020 and represented 89%21% of total revenue in both 2019 and 2018. This increase in marketplace subscription revenue was attributable primarily to a 19% growth in our AARSD for United States dealers to $17,576 as of the year ended December 31, 2019 from $14,819 as2021 and 0% of total revenue for the year ended December 31, 2018 and to a 15% growth in the number of United States and International paying dealers, to 36,115 as of December 31, 2019 from 31,472 as of December 31, 2018. 2020. The increase was due to our acquisition of a 51% interest in our AARSD for United States dealers was driven by new products, unit pricing and packaging as well as the investments made in building our brand and growing our audience, which resulted in growth in volume of connections.CarOffer. The increase in paying dealers was driven by the effortsprimarily due to dealer to dealer transactions, inclusive of our salestransaction, transportation and marketing teams to subscribe dealers to our Listings packages as well as by the acquisition of PistonHeads.inspection fees.
Advertising and otherProduct revenue increased $14.6$119.3 million in the year ended December 31, 20192021 compared to the year ended December 31, 20182020 and represented 11%13% of the total revenue for the year ended December 31, 2021 and 0% of total revenue in both 2019 and 2018. The increase in advertising and other revenue was driven by a 31% increase infor the number of impressions delivered, which was partially offset by a 12% decline in the average price per thousand impressions over the same period.year ended December 31, 2020. The increase was also attributabledue to our acquisition of a 51% interest in CarOffer and launch of our consumer-to-dealer offering. The increase was primarily due to a $5.0$84.2 million increase in revenue earnedproceeds received on the sale of vehicles acquired by CarOffer directly from partnerships with financing services companies.customers and a $35.1 million increase in proceeds received from the sale of vehicles acquired via arbitration.
Revenue by Segment
|
| Year Ended December 31, |
|
| Change |
|
| Year Ended December 31, |
|
| Change |
| ||||||||||||||||||||
|
| 2019 |
|
| 2018 |
|
| Amount |
|
| % |
|
| 2021 |
|
| 2020 |
|
| Amount |
|
| % |
| ||||||||
|
| (dollars in thousands) |
|
| (dollars in thousands) |
| ||||||||||||||||||||||||||
Revenue |
|
|
|
|
|
|
|
|
|
|
|
|
|
|
|
|
|
|
|
|
|
|
|
|
|
|
|
| ||||
United States |
| $ | 555,007 |
|
| $ | 437,166 |
|
| $ | 117,841 |
|
|
| 27 | % |
| $ | 909,033 |
|
| $ | 519,835 |
| $ | 389,198 |
| 75 | % | |||
International |
|
| 33,909 |
|
|
| 16,920 |
|
|
| 16,989 |
|
|
| 100 |
|
|
| 42,340 |
|
|
| 31,616 |
|
|
| 10,724 |
|
|
| 34 |
|
Total |
| $ | 588,916 |
|
| $ | 454,086 |
|
| $ | 134,830 |
|
|
| 30 | % |
| $ | 951,373 |
|
| $ | 551,451 |
|
| $ | 399,922 |
|
|
| 73 | % |
Percentage of total revenue: |
|
|
|
|
|
|
|
|
|
|
|
|
|
|
|
|
|
|
|
|
|
|
|
|
|
|
|
| ||||
United States |
|
| 94 | % |
|
| 96 | % |
|
|
|
|
|
|
|
|
| 96 | % |
|
| 94 | % |
|
|
|
|
|
| |||
International |
|
| 6 |
|
|
| 4 |
|
|
|
|
|
|
|
|
|
|
| 4 |
|
|
| 6 |
|
|
|
|
|
|
| ||
Total |
|
| 100 | % |
|
| 100 | % |
|
|
|
|
|
|
|
|
|
| 100 | % |
|
| 100 | % |
|
|
|
|
|
| ||
48
United States revenue increased $117.8$389.2 million, or 27%75%, in the year ended December 31, 20192021 compared to the year ended December 31, 2018,2020.The increase was primarily due primarily to a 19%$314.4 million increase in AARSD for United States dealerswholesale and product revenue due to our acquisition of a 5%51% interest in CarOffer and launch of our consumer-to-dealer offering. Additionally, the increase was due to approximately $44 million in revenue reductions during the numbersecond quarter of 2020 as a result of the impact of fee reductions that we provided to our United States paying dealers.dealers during such quarter in response to the COVID-19 pandemic. The increase was also due in part to product upgrades for existing dealers and signing on new dealers with higher average monthly recurring revenue.
International revenue increased $17.0$10.7 million, or 100%34%, in the year ended December 31, 20192021 compared to the year ended December 31, 2018,2020. The increase was due primarily to an 81%approximately $3 million in revenue reductions during the second quarter of 2020 as a result of the impact of fee reductions that we provided to our international paying dealers during such quarter in response to the COVID-19 pandemic. The increase was also due in part to product upgrades for existing dealers and signing on new dealers with higher average monthly recurring revenue. The increase in international revenue was also attributable to a 1% increase in the number of Internationalinternational paying dealers and a 13% increase in AARSD for International dealers.The increase in International revenue was also partially attributable to revenue from PistonHeads, which was acquired in January 2019.
Cost of Revenue
|
| Year Ended December 31, |
|
| Change |
|
| Year Ended December 31, |
|
| Change |
| ||||||||||||||||||||
|
| 2019 |
|
| 2018 |
|
| Amount |
|
| % |
|
| 2021 |
|
| 2020 |
|
| Amount |
|
| % |
| ||||||||
|
| (dollars in thousands) |
|
| (dollars in thousands) |
| ||||||||||||||||||||||||||
Cost of revenue |
| $ | 36,300 |
|
| $ | 24,811 |
|
| $ | 11,489 |
|
|
| 46 | % |
|
|
|
|
|
|
|
|
|
|
|
| ||||
Percentage of total revenue |
|
| 6 | % |
|
| 5 | % |
|
|
|
|
|
|
|
| ||||||||||||||||
Marketplace |
| $ | 47,689 |
| $ | 42,706 |
| $ | 4,983 |
| 12 | % | ||||||||||||||||||||
Wholesale |
| 127,679 |
| — |
| 127,679 |
| NM |
| |||||||||||||||||||||||
Product |
|
| 118,647 |
|
|
| — |
|
|
| 118,647 |
|
| NM |
| |||||||||||||||||
Total |
| $ | 294,015 |
|
| $ | 42,706 |
|
| $ | 251,309 |
|
|
| 588 | % | ||||||||||||||||
Percentage of total revenue: |
|
|
|
|
|
|
|
|
|
|
|
| ||||||||||||||||||||
Marketplace |
| 5 | % |
| 8 | % |
|
|
|
|
|
| ||||||||||||||||||||
Wholesale |
| 13 |
| — |
|
|
|
|
|
| ||||||||||||||||||||||
Product |
|
| 12 |
|
|
| — |
|
|
|
|
|
|
| ||||||||||||||||||
Total |
|
| 31 | % |
|
| 8 | % |
|
|
|
|
|
| ||||||||||||||||||
NM - Not Meaningful
CostOverall cost of revenue increased $11.5$251.3 million, or 46%588%, in the year ended December 31, 20192021 compared to the year ended December 31, 2018. 2020.
Marketplace cost of revenue increased $5.0 million, or 12%, in the year ended December 31, 2021 compared to the year ended December 31, 2020 and represented 5% of total revenue for the year ended December 31, 2021 and 8% of total revenue for the year ended December 31, 2020. The increase was due primarily to a $4.4$5.3 million increase in fees related to provisioning advertising campaigns on our websites and a $3.1$0.9 million increase in data center and hosting costs, offset in part by a $1.9$1.2 million decrease in salaries and employee-related expense due primarily to a 29% decrease in average CarGurus customer support team headcount primarily in connection with the Expense Reduction Plan.
Wholesale cost of revenue increased $127.7 million, in the year ended December 31, 2021 compared to the year ended December 31, 2020 and represented 13% of total revenue for the year ended December 31, 2021 and 0% of total revenue for the year ended December 31, 2020. The increase was due to our acquisition of a 51% interest in CarOffer. The increase was primarily due to expenses for dealer to dealer transactions, inclusive of transportation expenses, amortization of developed technology, salaries and employee-related expenses, and inspection expenses.
Product cost of revenue increased $118.6 million, in the year ended December 31, 2021 compared to the year ended December 31, 2020 and represented 12% of the total revenue for the year ended December 31, 2021 and 0% of total revenue for the year ended December 31, 2020. The increase was due to our acquisition of a 51% interest in CarOffer and launch of our consumer-to-dealer offering. The increase was primarily due to a $78.4 million increase in costsexpenses related to connecting consumers with dealers throughvehicles acquired by CarOffer directly from customers and a variety of methods, including phone calls, email, and managed text and chat, a $1.0$40.2 million increase in costsexpenses related to improve the content on our websites and a $1.0 million increase in amortization and depreciation.vehicles acquired via arbitration.
4749
Operating Expenses
Sales and Marketing Expenses
|
| Year Ended December 31, |
|
| Change |
|
| Year Ended December 31, |
|
| Change |
| ||||||||||||||||||||
|
| 2019 |
|
| 2018 |
|
| Amount |
|
| % |
|
| 2021 |
|
| 2020 |
|
| Amount |
|
| % |
| ||||||||
|
| (dollars in thousands) |
|
| (dollars in thousands) |
| ||||||||||||||||||||||||||
Sales and marketing |
| $ | 393,844 |
|
| $ | 315,939 |
|
| $ | 77,905 |
|
|
| 25 | % |
| $ | 290,574 |
|
| $ | 256,979 |
| $ | 33,595 |
| 13 | % | |||
Percentage of total revenue |
|
| 66 | % |
|
| 69 | % |
|
|
|
|
|
|
|
|
| 31 | % |
|
| 47 | % |
|
|
|
|
|
| |||
Sales and marketing expenses increased $77.9$33.6 million, or 25%13%, in the year ended December 31, 20192021 compared to the year ended December 31, 2018. This2020. The increase was due primarily to ana $6.9 million increase in advertising and search engine marketing costs of $48.5 million as well as an increase of $11.6 million in salaries and employee-related costs,expense, exclusive of stock-based compensation expense and commissions expense, which increased $4.9 million and $4.5 million, respectively.$22.5 million. The increase in salaries and employee-related costs, stock-based compensation expense and commissions expense was due primarily to a 25%33% increase in headcount. Thisheadcount due primarily to our acquisition of a 51% interest in CarOffer and an increase forin expected bonus attainment in comparison to the year ended December 31, 2019 2020 due to improved performance since the outset of the COVID-19 pandemic. The increase in commissions expense was due to the increase in headcount, marketplace sales growth and a decrease in capitalizable costs to obtain contracts. The increase in sales and marketing expenses was also due in part to a $2.4 million increase in marketing events and market research due to efforts to increase brand awareness, a $1.9$2.3 million increase in consulting fees,expense and a $1.6$2.1 million increase in software subscriptions, and a $0.9 million increase in lease costs due to new office facilities at 121 First St. in Cambridge, Massachusetts. The increase for the year ended December 31, 2019 was also partially attributable to sales and marketing expenses associated with the acquisition of PistonHeads.subscription expense.
Product, Technology, and Development Expenses
|
| Year Ended December 31, |
|
| Change |
| ||||||||||
|
| 2019 |
|
| 2018 |
|
| Amount |
|
| % |
| ||||
|
| (dollars in thousands) |
| |||||||||||||
Product, technology, and development |
| $ | 69,462 |
|
| $ | 47,866 |
|
| $ | 21,596 |
|
|
| 45 | % |
Percentage of total revenue |
|
| 12 | % |
|
| 11 | % |
|
|
|
|
|
|
|
|
|
| Year Ended December 31, |
|
| Change |
| ||||||||||
|
| 2021 |
|
| 2020 |
|
| Amount |
|
| % |
| ||||
|
| (dollars in thousands) |
| |||||||||||||
Product, technology, and development |
| $ | 106,423 |
|
| $ | 85,726 |
|
| $ | 20,697 |
|
|
| 24 | % |
Percentage of total revenue |
|
| 11 | % |
|
| 16 | % |
|
|
|
|
|
| ||
Product, technology, and development expenses increased $21.6$20.7 million, or 45%24%, in the year ended December 31, 20192021 compared to the year ended December 31, 2018. 2020. The increase was due primarily to a $13.7$15.7 million increase in salaries and employee-related costs,expense, exclusive of stock-based compensation expense, which increased $5.3$1.5 million. The increase in salaries and employee-related costsexpense was due primarily to a 37% increase in headcount and an increase in expected bonus attainment in comparison to the year ended December 31, 2020 due to improved performance since the outset of the COVID-19 pandemic. The increase in stock-based compensation expense was due to the revaluation of certain liability-based stock awards and the increase in headcount. The increase in product, technology, and development expenses was also due in part to a $1.9 million increase in consulting expenses and a $1.0 million increase in rent expense.
General and Administrative Expenses
|
| Year Ended December 31, |
|
| Change |
| ||||||||||
|
| 2021 |
|
| 2020 |
|
| Amount |
|
| % |
| ||||
|
| (dollars in thousands) |
| |||||||||||||
General and administrative |
| $ | 97,678 |
|
| $ | 62,166 |
|
| $ | 35,512 |
|
|
| 57 | % |
Percentage of total revenue |
|
| 10 | % |
|
| 11 | % |
|
|
|
|
|
| ||
General and administrative expenses increased $35.5 million, or 57%, in the year ended December 31, 2021 compared to the year ended December 31, 2020. The increase was due primarily to a $5.2 million increase in salaries and employee-related expense, exclusive of stock-based compensation expense, which increased $28.5 million. The increase in salaries and employee-related expense was due primarily to a 33% increase in headcount due primarily to our acquisition of a 51% interest in CarOffer and an increase in expected bonus attainment in comparison to the year ended December 31, 2020 due to improved performance since the outset of the COVID-19 pandemic. The increase in stock-based compensation expense was due primarily to a 32%the revaluation of certain liability-based stock awards and annual retention grant. The increase in headcount to support our growthgeneral and product innovations. This increase for the year ended December 31, 2019administrative expenses was also due in part to a $1.2$1.3 million increase in lease costs due to new office facilities at 121 First St. in Cambridge, Massachusetts,insurance expenses.
50
Depreciation and a $0.9 million increase in software subscriptions. The increase for the year ended December 31, 2019 was also partially attributable to product, technology,Amortization Expenses
|
| Year Ended December 31, |
|
| Change |
| ||||||||||
|
| 2021 |
|
| 2020 |
|
| Amount |
|
| % |
| ||||
|
| (dollars in thousands) |
| |||||||||||||
Depreciation and amortization |
| $ | 14,415 |
|
| $ | 6,118 |
|
| $ | 8,297 |
|
|
| 136 | % |
Percentage of total revenue |
|
| 2 | % |
|
| 1 | % |
|
|
|
|
|
| ||
Depreciation and development expenses associated with the acquisition of PistonHeads.
General and Administrative Expenses
|
| Year Ended December 31, |
|
| Change |
| ||||||||||
|
| 2019 |
|
| 2018 |
|
| Amount |
|
| % |
| ||||
|
| (dollars in thousands) |
| |||||||||||||
General and administrative |
| $ | 50,434 |
|
| $ | 39,475 |
|
| $ | 10,959 |
|
|
| 28 | % |
Percentage of total revenue |
|
| 9 | % |
|
| 9 | % |
|
|
|
|
|
|
|
|
General and administrativeamortization expenses increased $11.0$8.3 million, or 28%136%, in the year ended December 31, 20192021 compared to the year ended December 31, 2018. The increase was due to a $3.7 million increase in salaries and employee-related costs, exclusive of stock-based compensation expense, which increased $3.3 million. The increase in salaries and employee-related costs and stock-based compensation expense was2020, due primarily to a 30% increase in headcount to support our expanded operations as we continue to grow our business. This increase for the year ended December 31, 2019 was also due in part to a $2.1 million increase in payment processing and billing costs due to increased customer transactions driven by an increase in numberamortization of paying dealers, a $1.3 million increase in recruiting, insurance, and professional service fees, a $0.7 million increase in software subscriptions, and a $0.5 million increase in lease costs dueintangible assets related to new office facilities at 121 First St. in Cambridge, Massachusetts, offset by a $0.6 million decrease in bad debt expense due to improved collections and focus on reducing churn.
48
Depreciation and Amortization Expensesthe acquired intangible assets from CarOffer.
|
| Year Ended December 31, |
|
| Change |
| ||||||||||
|
| 2019 |
|
| 2018 |
|
| Amount |
|
| % |
| ||||
|
| (dollars in thousands) |
| |||||||||||||
Depreciation and amortization |
| $ | 4,554 |
|
| $ | 2,804 |
|
| $ | 1,750 |
|
|
| 62 | % |
Percentage of total revenue |
|
| 1 | % |
|
| 1 | % |
|
|
|
|
|
|
|
|
Other Income, net
Depreciation and amortization expenses increased $1.8
|
| Year Ended December 31, |
|
| Change |
| ||||||||||
|
| 2021 |
|
| 2020 |
|
| Amount |
|
| % |
| ||||
|
| (dollars in thousands) |
| |||||||||||||
Other income, net |
|
|
|
|
|
|
|
|
|
|
|
| ||||
Interest income |
| $ | 120 |
|
| $ | 1,075 |
|
| $ | (955 | ) |
|
| (89 | )% |
Other income |
|
| 972 |
|
|
| 279 |
|
|
| 693 |
|
|
| 248 |
|
Total other income, net |
| $ | 1,092 |
|
| $ | 1,354 |
|
| $ | (262 | ) |
|
| (19 | )% |
Percentage of total revenue: |
|
|
|
|
|
|
|
|
|
|
|
| ||||
Interest income |
|
| 0 | % |
|
| 0 | % |
|
|
|
|
|
| ||
Other income |
|
| 0 |
|
|
| 0 |
|
|
|
|
|
|
| ||
Total other income, net |
|
| 0 | % |
|
| 0 | % |
|
|
|
|
|
| ||
Other income, net decreased $0.3 million, or 62%19%, in the year ended December 31, 20192021 compared to the year ended December 31, 2018,2020. The $1.0 million decrease in interest income was due primarily to an increasedecreases in depreciation related to the additional leasehold improvements required for new office facilities at 121 First St.investments in Cambridge, Massachusettscertificates of deposit as well as amortizationa decline in interest rates associated with our certificates of intangible assets.
Other Income, net
|
| Year Ended December 31, |
|
| Change |
| ||||||||||
|
| 2019 |
|
| 2018 |
|
| Amount |
|
| % |
| ||||
|
| (dollars in thousands) |
| |||||||||||||
Other income, net |
|
|
|
|
|
|
|
|
|
|
|
|
|
|
|
|
Interest income |
| $ | 2,984 |
|
| $ | 2,283 |
|
| $ | 701 |
|
|
| 31 | % |
Other income |
|
| 1,399 |
|
|
| 10 |
|
|
| 1,389 |
|
| NM |
| |
Total other income, net |
| $ | 4,383 |
|
| $ | 2,293 |
|
| $ | 2,090 |
|
|
| 91 | % |
Percentage of total revenue: |
|
|
|
|
|
|
|
|
|
|
|
|
|
|
|
|
Interest income |
|
| 0 | % |
|
| 0 | % |
|
|
|
|
|
|
|
|
Other income |
|
| 0 |
|
|
| 0 |
|
|
|
|
|
|
|
|
|
Total other income, net |
|
| 0 | % |
|
| 0 | % |
|
|
|
|
|
|
|
|
NM — Not Meaningful
Other income, net increased $2.1 million, or 91%, indeposit investments during the year ended December 31, 2019 compared to the year ended December 31, 2018.2021. The $0.7 million increase in interest income is primarily due to the higher monthly average of investment of cash in certificates of deposit and money market funds over the course of 2019 arising from our increased cash from operations. The $1.4 million increase in other income, net was primarily due to $0.8 million of sublease income, as well as a $0.6$0.5 million increase in realized foreign currency gain mainly resulting from the settlement of an intercompany note payable in connection with the PistonHeads acquisitionother income related to CarOffer during the year ended December 31, 2019.2021.
Benefit fromProvision for Income Taxes
|
| Year Ended December 31, |
|
| Change |
| ||||||||||||||||||||||||||
|
| 2019 |
|
| 2018 |
|
| Amount |
|
| % |
|
| Year Ended December 31, |
|
| Change |
| ||||||||||||||
|
| (dollars in thousands) |
|
| 2021 |
|
| 2020 |
|
| Amount |
|
| % |
| |||||||||||||||||
Benefit from income taxes |
| $ | (3,441 | ) |
| $ | (39,686 | ) |
| $ | (36,245 | ) |
|
| (91 | )% | ||||||||||||||||
|
| (dollars in thousands) |
| |||||||||||||||||||||||||||||
Provision for income taxes |
| $ | 38,987 |
| $ | 21,557 |
| $ | 17,430 |
| 81 | % | ||||||||||||||||||||
Percentage of total revenue |
|
| (1 | )% |
|
| (9 | )% |
|
|
|
|
|
|
|
|
| 4 | % |
| 4 | % |
|
|
|
|
|
| ||||
The difference in benefit fromProvision for income taxes recorded during the yearsincreased $17.4 million, or 81% in year ended December 31, 2019 and 2018, was principally due2021 compared to $40.8 million of tax benefits related to excess stock-based compensation benefits recordedthe year ended December 31, 2020. The increase in provision for income taxes recognized during the year ended December 31, 2018, as compared2021 was principally due to $10.9 millionincreased profitability in excess of tax benefitsattributes available to offset. Additionally, there was $0.4 million tax expense related to excess stock-based compensation benefits recordeddeductions recognized during 2019, as well as an increase in federal and state research and development tax credits during 2019 as2021, compared to 2018.the insignificant amount of tax benefit recognized during 2020. Furthermore, a $2.0 million tax expense was recognized during 2021 in connection with the Section 162(m) excess officer compensation limitation, which became applicable in May 2021 upon the expiration of the transition period permitted following our IPO.
4951
Income (Loss) from Operations by Segment
|
| Year Ended December 31, |
|
| Change |
|
| Year Ended December 31, |
|
| Change |
| ||||||||||||||||||||
|
| 2019 |
|
| 2018 |
|
| Amount |
|
| % |
|
| 2021 |
|
| 2020 |
|
| Amount |
|
| % |
| ||||||||
|
| (dollars in thousands) |
|
| (dollars in thousands) |
| ||||||||||||||||||||||||||
United States |
| $ | 73,872 |
|
| $ | 58,387 |
|
| $ | 15,485 |
|
|
| 27 | % |
| $ | 158,532 |
|
| $ | 120,836 |
| $ | 37,696 |
| 31 | % | |||
International |
|
| (39,550 | ) |
|
| (35,196 | ) |
|
| (4,354 | ) |
|
| (12 | ) |
|
| (10,264 | ) |
|
| (23,080 | ) |
|
| 12,816 |
|
|
| 56 |
|
Total |
| $ | 34,322 |
|
| $ | 23,191 |
|
| $ | 11,131 |
|
|
| 48 | % |
| $ | 148,268 |
|
| $ | 97,756 |
|
| $ | 50,512 |
|
|
| 52 | % |
Percentage of segment revenue: |
|
|
|
|
|
|
|
|
|
|
|
|
|
|
|
|
|
|
|
|
|
|
|
|
|
|
|
| ||||
United States |
|
| 13 | % |
|
| 13 | % |
|
|
|
|
|
|
|
|
| 17 | % |
|
| 23 | % |
|
|
|
|
|
| |||
International |
| NM |
|
| NM |
|
|
|
|
|
|
|
|
|
| (24 | )% |
|
| (73 | )% |
|
|
|
|
|
| |||||
NM — Not Meaningful
United States income from operations increased $15.5$37.7 million, or 27%31%, in the year ended December 31, 20192021 compared to the year ended December 31, 2018.2020. This increase was due to an increaseincreases in revenue of $117.8$389.2 million, offset by increases in part by thecost of revenue of $253.7 million and increases in operating expenses of $92.5 million and cost of revenue of $9.8$97.8 million.
International loss from operations increased $4.4decreased $12.8 million, or 12%56% in the year ended December 31, 20192021 compared to the year ended December 31, 2018. The increase in International loss from operations reflects our continued investment into international markets.
Year Ended December 31, 2018 Compared to Year Ended December 31, 2017
Revenue
Revenue by Source
|
| Year Ended December 31, |
|
| Change |
| ||||||||||
|
| 2018 |
|
| 2017 |
|
| Amount |
|
| % |
| ||||
|
| (dollars in thousands) |
| |||||||||||||
Revenue |
|
|
|
|
|
|
|
|
|
|
|
|
|
|
|
|
Marketplace subscription |
| $ | 405,780 |
|
| $ | 282,664 |
|
| $ | 123,116 |
|
|
| 44 | % |
Advertising and other |
|
| 48,306 |
|
|
| 34,197 |
|
|
| 14,109 |
|
|
| 41 |
|
Total |
| $ | 454,086 |
|
| $ | 316,861 |
|
| $ | 137,225 |
|
|
| 43 | % |
Percentage of total revenue: |
|
|
|
|
|
|
|
|
|
|
|
|
|
|
|
|
Marketplace subscription |
|
| 89 | % |
|
| 89 | % |
|
|
|
|
|
|
|
|
Advertising and other |
|
| 11 |
|
|
| 11 |
|
|
|
|
|
|
|
|
|
Total |
|
| 100 | % |
|
| 100 | % |
|
|
|
|
|
|
|
|
Overall revenue increased $137.2 million, or 43%, in the year ended December 31, 2018 compared to the year ended December 31, 2017. Marketplace subscription revenue increased by 44% while advertising and other revenue grew by 41%.
Marketplace subscription revenue increased $123.1 million in the year ended December 31, 2018 compared to the year ended December 31, 2017, and represented 89% of total revenue in both 2018 and 2017. This increase in marketplace subscription revenue was attributable primarily to a 14% growth in the number of United States and International paying dealers, to 31,4722020. as of December 31, 2018 from 27,670 as of December 31, 2017, and to a 23% growth in our AARSD for United States dealers to $14,819 as of December 31, 2018 from $12,055 as of December 31, 2017. The increase in paying dealers was driven by the efforts of our sales and marketing teams to subscribe dealers to our Listings packages. The increase in our AARSD for United States dealers was driven by the investments made in building our brand and growing our audience which resulted in growth in volume of connections.
Advertising and other revenue increased $14.1 million in the year ended December 31, 2018 compared to the year ended December 31, 2017, and represented 11% of total revenue in 2018 and 2017. The increase in advertising and other revenue was due primarily to a 70% increase in the number of impressions, which was partially offset by a 17% decrease in the average price per thousand impressions, in 2018 compared to 2017.
50
Revenue by Segment
|
| Year Ended December 31, |
|
| Change |
| ||||||||||
|
| 2018 |
|
| 2017 |
|
| Amount |
|
| % |
| ||||
|
| (dollars in thousands) |
| |||||||||||||
Revenue |
|
|
|
|
|
|
|
|
|
|
|
|
|
|
|
|
United States |
| $ | 437,166 |
|
| $ | 307,472 |
|
| $ | 129,694 |
|
|
| 42 | % |
International |
|
| 16,920 |
|
|
| 9,389 |
|
|
| 7,531 |
|
|
| 80 |
|
Total |
| $ | 454,086 |
|
| $ | 316,861 |
|
| $ | 137,225 |
|
|
| 43 | % |
Percentage of total revenue: |
|
|
|
|
|
|
|
|
|
|
|
|
|
|
|
|
United States |
|
| 96 | % |
|
| 97 | % |
|
|
|
|
|
|
|
|
International |
|
| 4 |
|
|
| 3 |
|
|
|
|
|
|
|
|
|
Total |
|
| 100 | % |
|
| 100 | % |
|
|
|
|
|
|
|
|
United States revenue increased $129.7 million, or 42%, in the year ended December 31, 2018 compared to the year ended December 31, 2017, due primarily to a 10% increase in the number of United States paying dealers and a 23% increase in AARSD for United States dealers.
International revenue increased $7.5 million, or 80%, in the year ended December 31, 2018 compared to the year ended December 31, 2017, due primarily to a 55% increase in the number of International paying dealers. International paying dealers grew to 3,938 at December 31, 2018 from 2,548 at December 31, 2017.
Cost of Revenue
|
| Year Ended December 31, |
|
| Change |
| ||||||||||
|
| 2018 |
|
| 2017 |
|
| Amount |
|
| % |
| ||||
|
| (dollars in thousands) |
| |||||||||||||
Cost of revenue |
| $ | 24,811 |
|
| $ | 17,609 |
|
| $ | 7,202 |
|
|
| 41 | % |
Percentage of total revenue |
|
| 5 | % |
|
| 6 | % |
|
|
|
|
|
|
|
|
Cost of revenue increased $7.2 million, or 41%, in the year ended December 31, 2018 compared to the year ended December 31, 2017. The increase was due primarily to a $2.7 million increase in costs related to connecting consumers with dealers through a variety of methods, including phone calls, email, and managed text and chat, a $1.7 million increase in fees related to provisioning advertising campaigns on our websites, a $1.4 million increase in data center and hosting costs, and a $1.2 million increase in amortization and depreciation.
Operating Expenses
Sales and Marketing Expenses
|
| Year Ended December 31, |
|
| Change |
| ||||||||||
|
| 2018 |
|
| 2017 |
|
| Amount |
|
| % |
| ||||
|
| (dollars in thousands) |
| |||||||||||||
Sales and marketing |
| $ | 315,939 |
|
| $ | 236,165 |
|
| $ | 79,774 |
|
|
| 34 | % |
Percentage of total revenue |
|
| 69 | % |
|
| 74 | % |
|
|
|
|
|
|
|
|
Sales and marketing expenses increased $79.8 million, or 34%, in the year ended December 31, 2018 compared to the year ended December 31, 2017. The increase was due primarily to an increase in advertising costs of $65.5 million as well as an increase of $8.1 million in salaries and employee-related costs (excluding commission expense) resulting from a 25% increase in headcount and payroll taxes of $0.9 million driven by the employer portion of FICA taxes on the exercise of stock awards and vesting of restricted stock units, or RSUs. This increase for the year ended December 31, 2018 was also due in part to a $3.2 million increase in stock-based compensation expense related to RSUs resulting from the increase in headcount, a $1.7 million increase in marketing events and market research due to efforts to increase brand awareness, a $0.8 million increase in rent due to a new office building in Cambridge and rent increase in Ireland, and a $0.8 million increase in
51
software subscriptions. These increases were partially offset by a $2.7 million decrease in commission expense driven by our adoption of Accounting Standards Codification, or ASC, Topic 606, Revenue from Contracts with Customers, or ASC 606, during the year ended December 31, 2018.
Product, Technology, and Development Expenses
|
| Year Ended December 31, |
|
| Change |
| ||||||||||
|
| 2018 |
|
| 2017 |
|
| Amount |
|
| % |
| ||||
|
| (dollars in thousands) |
| |||||||||||||
Product, technology, and development |
| $ | 47,866 |
|
| $ | 22,470 |
|
| $ | 25,396 |
|
|
| 113 | % |
Percentage of total revenue |
|
| 11 | % |
|
| 7 | % |
|
|
|
|
|
|
|
|
Product, technology, and development expenses increased $25.4 million, or 113%, in the year ended December 31, 2018 compared to the year ended December 31, 2017. The increase was due primarily to a $13.8 million increase in salaries and employee-related costs resulting from a 59% increase in headcount and payroll taxes of $1.2 million driven by the employer portion of FICA taxes on the exercise of stock awards and vesting of RSUs. This increase for the year ended December 31, 2018 was also due in part to an $8.1 million increase in stock-based compensation expense related to RSUs resulting from the increase in headcount, $0.8 million increase in rent due to a new office building in Cambridge, a $0.5 million increase in software subscriptions and a $0.5 million increase in consulting fees.
General and Administrative Expenses
|
| Year Ended December 31, |
|
| Change |
| ||||||||||
|
| 2018 |
|
| 2017 |
|
| Amount |
|
| % |
| ||||
|
| (dollars in thousands) |
| |||||||||||||
General and administrative |
| $ | 39,475 |
|
| $ | 22,688 |
|
| $ | 16,787 |
|
|
| 74 | % |
Percentage of total revenue |
|
| 9 | % |
|
| 7 | % |
|
|
|
|
|
|
|
|
General and administrative expenses increased $16.8 million, or 74%, in the year ended December 31, 2018 compared to the year ended December 31, 2017. The increase was due primarily to an increase of $4.7 million of insurance, legal, consulting and external reporting fees driven by costs incurred to comply with public company requirements as well as an increase of $4.4 million in salaries and employee-related costs resulting from a 45% increase in headcount and payroll taxes of $0.3 million driven by the employer portion of FICA taxes on the exercise of stock awards and vesting of RSUs. This increase for the year ended December 31, 2018 was also due in part to a $4.1 million increase in stock-based compensation expense related to RSUs due to the increase in headcount, a $1.8 million increase in payment processing and billing costs due to increased customer transactions with higher billings resulting from revenue growth and a $0.6 million increase in bad debt expense.
Depreciation and Amortization Expenses
|
| Year Ended December 31, |
|
| Change |
| ||||||||||
|
| 2018 |
|
| 2017 |
|
| Amount |
|
| % |
| ||||
|
| (dollars in thousands) |
| |||||||||||||
Depreciation and amortization |
| $ | 2,804 |
|
| $ | 2,655 |
|
| $ | 149 |
|
|
| 6 | % |
Percentage of total revenue |
|
| 1 | % |
|
| 1 | % |
|
|
|
|
|
|
|
|
Depreciation and amortization expenses increased $0.1 million, or 6%, in the year ended December 31, 2018 compared to the year ended December 31, 2017.
52
Other Income, net
|
| Year Ended December 31, |
|
| Change |
| ||||||||||
|
| 2018 |
|
| 2017 |
|
| Amount |
|
| % |
| ||||
|
| (dollars in thousands) |
| |||||||||||||
Other income, net |
|
|
|
|
|
|
|
|
|
|
|
|
|
|
|
|
Interest income |
| $ | 2,283 |
|
| $ | 869 |
|
| $ | 1,414 |
|
|
| 163 | % |
Other income (expense) |
|
| 10 |
|
|
| (306 | ) |
|
| 316 |
|
|
| 103 |
|
Total other income, net |
| $ | 2,293 |
|
| $ | 563 |
|
| $ | 1,730 |
|
|
| 307 | % |
Percentage of total revenue: |
|
|
|
|
|
|
|
|
|
|
|
|
|
|
|
|
Interest income |
|
| 0 | % |
|
| 0 | % |
|
|
|
|
|
|
|
|
Other income (expense) |
|
| 0 |
|
|
| (0 | ) |
|
|
|
|
|
|
|
|
Total other income, net |
|
| 0 | % |
|
| 0 | % |
|
|
|
|
|
|
|
|
Other income, net increased $1.7 million, or 307%, in the year ended December 31, 2018 compared to the year ended December 31, 2017. The $1.4 million increase in interest income is primarily due to the investment of cash in certificates of deposit, money market funds arising from our increased cash from operations, and an increase in interest rates. The $0.3 million increase in other income (expense) is primarily due the Euro strengthening against the U.S. Dollar in 2017 and remaining relatively flat in 2018.
(Benefit from) Provision for Income Taxes
|
| Year Ended December 31, |
|
| Change | |||||||||
|
| 2018 |
|
| 2017 |
|
| Amount |
|
| % | |||
|
| (dollars in thousands) | ||||||||||||
(Benefit from) provision for income taxes |
| $ | (39,686 | ) |
| $ | 2,638 |
|
| $ | (42,324 | ) |
| NM |
Percentage of total revenue |
|
| (9 | )% |
|
| 1 | % |
|
|
|
|
|
|
NM — Not Meaningful
The benefit from income taxes recorded during the year ended December 31, 2018, as compared to the provision for income taxes recorded during the year ended December 31, 2017, was principally due to $40.8 million in stock-based compensation benefits recorded during the year ended December 31, 2018, as well as an increase in federal and state research and development tax credits and a lower federal statutory tax rate due to The Tax Cuts and Jobs Act, or the TCJA, as compared to year ended December 31, 2017.
Income (Loss) from Operations by Segment
|
| Year Ended December 31, |
|
| Change |
| ||||||||||
|
| 2018 |
|
| 2017 |
|
| Amount |
|
| % |
| ||||
|
| (dollars in thousands) |
| |||||||||||||
United States |
| $ | 58,387 |
|
| $ | 41,586 |
|
| $ | 16,801 |
|
|
| 40 | % |
International |
|
| (35,196 | ) |
|
| (26,312 | ) |
|
| (8,884 | ) |
|
| (34 | ) |
Total |
| $ | 23,191 |
|
| $ | 15,274 |
|
| $ | 7,917 |
|
|
| 52 | % |
Percentage of segment revenue: |
|
|
|
|
|
|
|
|
|
|
|
|
|
|
|
|
United States |
|
| 13 | % |
|
| 14 | % |
|
|
|
|
|
|
|
|
International |
| NM |
|
| NM |
|
|
|
|
|
|
|
|
| ||
NM — Not Meaningful
United States income from operations increased $16.8 million, or 40%, in the year ended December 31, 2018 compared to the year ended December 31, 2017. This increase was due to an increaseincreases in revenue of $129.7$10.7 million offset in part by the increasesand decreases in cost of revenue of $6.8$2.4 million, andoffset by increases in operating expenses of $106.1$0.3 million.
53
International loss from operations increased $8.9 million, or 34% in the year ended December 31, 2018 compared to the year ended December 31, 2017. The increase in International loss from operations reflects our continued investment into international markets and expansion into new countries.
Liquidity and Capital Resources
Cash, Cash Equivalents and Investments
AtAs of December 31, 20192021 and 2018,2020, our principal sources of liquidity were cash and cash equivalents of $59.9$231.9 million and $34.9$190.3 million, respectively, and investments in certificates of deposit with terms of greater than 90 days but less than one year of $111.7$90.0 million and $122.8$100.0 million, respectively.
Sources and Uses of Cash
OurDuring the years ended December 31, 2021 and 2020, our cash flows from operating, investing, and financing activities, as reflected in the Consolidated Statementsconsolidated statements of Cash Flows,cash flows, are summarized in the following table:as follows:
|
| Year Ended December 31, |
|
| Year Ended December 31, |
| ||||||||||||||
|
| 2019 |
|
| 2018 |
|
| 2017 |
|
| 2021 |
|
| 2020 |
| |||||
|
| (in thousands) |
|
| (in thousands) |
| ||||||||||||||
Net cash provided by operating activities |
| $ | 70,116 |
|
| $ | 51,723 |
|
| $ | 25,691 |
|
| $ | 98,292 |
|
| $ | 156,743 |
|
Net cash used in investing activities |
|
| (22,257 | ) |
|
| (80,278 | ) |
|
| (12,598 | ) |
| (68,149 | ) |
|
| (16,895 | ) | |
Net cash (used in) provided by financing activities |
|
| (14,693 | ) |
|
| (23,395 | ) |
|
| 44,780 |
| ||||||||
Net cash provided by (used in) financing activities |
| 17,808 |
|
|
| (10,085 | ) | |||||||||||||
Impact of foreign currency on cash |
|
| (1 | ) |
|
| (44 | ) |
|
| 159 |
|
|
| (597 | ) |
|
| 440 |
|
Net increase (decrease) in cash, cash equivalents, and restricted cash |
| $ | 33,165 |
|
| $ | (51,994 | ) |
| $ | 58,032 |
| ||||||||
Net increase in cash, cash equivalents, and restricted cash |
| $ | 47,354 |
|
| $ | 130,203 |
| ||||||||||||
Our operations have been financed primarily from operating activitiesactivities. During the years ended December 31, 2021 and our IPO. We2020, we generated cash from operating activities of $70.1$98.3 million during 2019, $51.7and $156.7 million, during 2018, and $25.7 million during 2017, and we expect to generate cash from operations for the foreseeable future.respectively.
52
We believe that our existing sources of liquidity will be sufficient to fund our operations for at least the next 12 months from the date of the filing of this Annual Report on Form 10-K. However, ourOur future capital requirements will depend on many factors, includingincluding: the further impact of the COVID-19 pandemic; our rate of revenue growth, the expansion ofrevenue; expenses associated with our sales and marketing activities and the support of our product, technology, and development efforts,efforts; expenses associated with our facilities build out under our 1001 Boylston Street lease, other than those which qualify for landlord reimbursement; payments received in advance from a third-party payment processor; our investments in international markets; and the timingpotential exercise of call rights in the second half of 2022, or the 2022 Call Right, exercisable in our sole discretion, to acquire up to twenty-five percent (25%) of the fully diluted outstanding capitalization of CarOffer at an implied value equal to seven (7) times CarOffer’s trailing twelve months gross profit as of June 30, 2022 (as calculated in accordance with the defined terms and extentsubject to the adjustments set forth in the CarOffer Operating Agreement (as defined in Note 4 of the consolidated financial statements included elsewhere in this Annual Report on Form 10-K)). If the 2022 Call Right is exercised, the consideration to be paid will be in the form of cash and/or shares of our investmentClass A common stock, as determined in international marketsour sole discretion. A cash payment made in connection with the 2022 Call Right is reasonably likely to reduce our net cash in future quarters. Cash from operations could also be affected by various risks and mergersuncertainties, including, but not limited to, the effects of the COVID-19 pandemic and acquisitions. other risks detailed in the “Risk Factors” section of this Annual Report on Form 10-K.
To the extent that existing cash, cash equivalents, and investments and cash from operations are insufficient to fund our future activities, we may need to raise additional funds through a public or private equity or debt financing. Additional funds may not be available on terms favorable to us, or at all.
Operating Activities
Cash provided by operating activities of $70.1$98.3 million during 2019 the year ended December 31, 2021 was due primarily to consolidated net income of $42.1 $110.4 million, adjusted for $34.3$53.5 million of stock-based compensation expense, $8.4$40.5 million of depreciation and amortization, $12.7 million of amortization of deferred contract costs, and $7.8 million of depreciation and amortization, partially offset by $3.7$6.2 million of deferred taxes.taxes, $3.1 million of impairment of long-lived assets, and $1.0 million of provision for doubtful accounts. Cash provided by operating activities was also attributable to a $4.3 million increase in accounts payable, a $2.2$35.8 million increase in accrued expenses, accrued income taxes, and other current liabilities, and a $1.2$35.4 million increase in accounts payable, a $3.7 million increase in deferred revenue, and a $1.0 million increase in lease obligations. The increases in cash flow from operations were partially offset by a $16.0 million increase in deferred contract costs, a $9.6$174.8 million increase in accounts receivable, net due primarily to the acquisition of a 51% interest in CarOffer, a $17.3 million increase in inventory, a $7.7 million increase in gross deferred contract costs, and a $1.5$5.1 million decreaseincrease in lease obligations.prepaid expenses, prepaid income taxes, and other assets.
Cash provided by operating activities of $51.7$156.7 million during 2018the year ended December 31, 2020 was due primarily to consolidated net income of $65.2$77.6 million, adjusted for $20.8$45.1 million of stock-based compensation expense, $5.0$22.2 million of depreciation and amortization and $3.7deferred taxes, $11.6 million of amortization of deferred contract costs, partially offset by $39.0$10.2 million of deferred taxes.depreciation and amortization, $1.9 million of provision for doubtful accounts, and $1.2 million of impairment of long-lived assets. Cash provided by operating activities was also attributable to a $9.3 million increase in accounts payable, a $4.5 million increase in deferred revenue, a $4.3 million increase in lease obligations, a $2.7$7.5 million increase in accrued expenses, accrued income taxes, and other current liabilities, partially offset by a $13.0$3.9 million increase in deferred contract costs, and an $11.8 million increase prepaid expenses, prepaid income taxes, and other assets.
54
Cash provided by operating activities of $25.7 million during 2017 was due primarily to net income of $13.2 million, adjusted for $5.0 million of stock-based compensation expense and $3.8 million of depreciation and amortization, partially offset by $1.1 million of deferred taxes. Cash provided by operating activities was also attributable to a $6.2 million increase in accounts payable and a $5.2 million increase in accrued expenses, accrued income taxes and other current liabilities, partially offset by a $7.0 million increasedecrease in accounts receivable, and a $2.3$3.5 million increasedecrease in prepaid expenses, prepaid income taxes, and other assets.assets. The increases in cash flow from operations were partially offset by a $15.1 million decrease in accounts payable, and a $11.4 million increase in gross deferred contract costs.
Investing Activities
Cash used in investing activities of $22.3$68.1 million during 2019 the year ended December 31, 2021 was due to $19.2$64.3 million of acquisition cash payments, $11.2net of cash acquired, $7.7 million of purchases of property and equipment, and $3.0$6.2 million related to the capitalization of website development costs. This wascosts, offset in part by $188.9$130.0 million of maturities ofin certificates of deposit, net of investments in certificates of deposit of $177.8$120.0 million.
Cash used in investing activities of $80.3$16.9 million during 2018the year ended December 31, 2020 was due to $212.8$21.1 million of investments in certificates of deposit,acquisition cash payments, net of maturities of $140.0 million, $6.0 million of purchases of property and equipment, and $1.5cash acquired, $4.6 million related to the capitalization of website development costs.
Cash usedcosts, and $3.0 million of purchases of property and equipment, offset in investing activitiespart by $111.7 million of $12.6 million during 2017 was due to $50.0 millionmaturities in certificates of deposit, net of investments in certificates of deposit net of maturities of $44.8$100.0 million $5.2 million of purchases of property and equipment., and $2.2 million related to the capitalization of website development costs.
Financing Activities
Cash used inprovided by financing activities of $14.7$17.8 million during 2019 the year ended December 31, 2021 was due primarily to the$46.8 million related to payments received in advance from a third-party payment of withholding taxesprocessor and option costs on net share settlements of restricted stock units and stock options of $16.5 million, partially offset by $1.8$0.7 million related to the proceeds from the issuance of common stock related to the exercise of vested stock options.
Cash used in financing activities of $23.4 million during 2018 reflects $25.9 million ofoptions, partially offset by payment of withholding taxes on net share settlements of restricted stock units, or RSUs, of $15.4 million and CarOffer's repayment of a $1.1line of credit of $14.3 million.
53
Cash used in financing activities of $10.1 million during the year ended December 31, 2020 was due primarily to the payment of IPO costs,withholding taxes on net share settlements of RSUs of $11.2 million, partially offset by $3.6$1.1 million related to the proceeds from the exerciseissuance of common stock options.
Cash provided by financing activities of $44.8 million during 2017 primarily reflects $44.4 million of IPO proceeds, net of offering costs, and $0.4 million related to the proceeds from the exercise of vested stock options.
Contractual Obligations and Known Future Cash Requirements
Our operating lease obligations consist of various leases for office space in: Boston, Massachusetts; Cambridge, Massachusetts; Detroit, Michigan; Los Angeles, California; Dublin, Ireland;Contractual Obligations and London, United Kingdom with various lease terms expected to continue through 2038. The terms of our Massachusetts lease agreements provide for rental payments that increase on an annual basis. We recognize rent expense on a straight‑line basis over the lease period.Commitments
We do not have any debt or material finance obligations asAs of December 31, 2019. All2021, all of our property, equipment, and internal-use software have been purchased with cash, with the exception of $0.6 million ofamounts related to unpaid property and equipment, capitalized website development, capitalized internal-use software and immaterialhosting arrangements and amounts related to obligations under one finance leaseleases as disclosed in the consolidated statements of December 31, 2019.cash flows. We have no material long‑term purchase obligations outstanding with any vendors or third parties.
Set forth below is information concerningLeases
Our primary operating lease obligations consist of various leases for office space in: Boston, Massachusetts; Cambridge, Massachusetts; San Francisco, California; Addison, Texas; and Dublin, Ireland. We also have an operating lease obligation for data center space in Needham, Massachusetts.
Our leases have various lease terms expected to continue through 2038. The terms of our Massachusetts, California, and Texas lease agreements provide for rental payments that increase on an annual basis. The leases in Boston, Massachusetts, Cambridge, Massachusetts and San Francisco, California have associated letters of credit, which are recognized as restricted cash within the consolidated balance sheets. As of December 31, 2021 and 2020, restricted cash was $16.3 million and $10.6 million, respectively, and primarily related to cash held at a financial institution in an interest-bearing cash account as collateral for the letters of credit related to the contractual provisions for our building leases and pass-through payments from customers related to the Company’s wholesale business. As of December 31, 2021 and 2020, portions of restricted cash were classified as short-term assets and long-term assets, as disclosed in the consolidated balance sheets.
As of December 31, 2021, known contractual obligations at December 31, 2019 that are fixed and determinable.determinable are as follows:
|
| Total |
|
| Less than 1 year |
|
| 1 to 3 years |
|
| 3 to 5 years |
|
| More than 5 years |
| |||||
|
| (in thousands) |
| |||||||||||||||||
Operating lease obligations |
| $ | 409,257 |
|
| $ | 13,150 |
|
| $ | 30,521 |
|
| $ | 44,981 |
|
| $ | 320,605 |
|
Total contractual obligations |
| $ | 409,257 |
|
| $ | 13,150 |
|
| $ | 30,521 |
|
| $ | 44,981 |
|
| $ | 320,605 |
|
|
| Total |
|
| Less than |
|
| 1 to 3 years |
|
| 3 to 5 years |
|
| More than |
| |||||
|
| (in thousands) |
| |||||||||||||||||
Operating lease obligations |
| $ | 345,547 |
|
| $ | 16,573 |
|
| $ | 44,770 |
|
| $ | 43,689 |
|
| $ | 240,515 |
|
Total contractual obligations |
| $ | 345,547 |
|
| $ | 16,573 |
|
| $ | 44,770 |
|
| $ | 43,689 |
|
| $ | 240,515 |
|
The table above includes leases signed but not yet commenced as of December 31, 20192021 and is based on expected contractual commencement dates.
Acquisitions
55
On January 16, 202014, 2021 we completed the acquisition of a 51% interest in CarOffer, LLC, an automated instant vehicle trade platform based in Addison, Texas, with the option to acquire portions of the remaining equity in the future. Details of this acquisition which isare more fully described in Note 164 of our consolidated financial statements included in Item 8 of this Annual Report on Form 10-K.
Off‑Balance Sheet ArrangementsGuarantees
CarOffer provides certain guarantees to dealers through its 45-Day Guaranteed Bid and OfferGuard product offerings, which are accounted for under Accounting Standards Codifications, or ASC, Topic 460, Guarantees, or ASC 460.
45-Day Guaranteed Bid is an arrangement through which a selling dealer lists a car on the CarOffer platform, and CarOffer provides an offer to purchase the vehicle listed at a specified price at any time over a 45-day period. This provides the seller with a put option, where they have the right, but not the obligation, to require CarOffer to purchase the vehicle during this window. OfferGuard is an arrangement through which a buying dealer purchases a car on the CarOffer platform, and CarOffer provides an offer to purchase the vehicle at a specified price between days 1 and 3, and days 42 and 45 if the dealer is not able to sell the vehicle after 42 days.
54
As of December 31, 20192021, the maximum potential amount of future payments that CarOffer could be required to make under these guarantees was $76.1 million. Of the maximum potential amount of future payments, none are considered probable. The exercise of guarantees has historically been infrequent and 2018,even when such exercises did occur the losses were immaterial. As such, as of December 31, 2021, CarOffer had no contingent loss liabilities.
As of December 31, 2020, we did not have any guarantees.
Off‑Balance Sheet Arrangements
As of December 31, 2021 and 2020, we did not have any off‑balance sheet arrangements other than those entered into prior to the adoption of ASC 842 andor material leases that are less than twelve months in duration, other than leases signed but not commenced, that have or are reasonably likely to have a current or future material effect on our financial condition, changes in financial condition, revenues or expenses, results of operations, liquidity, capital expenditures, or capital resources.
Critical Accounting Policies and Significant Estimates
In preparing ourThe preparation of the consolidated financial statements in accordanceconformity with GAAP we are requiredrequires us to make estimates and assumptions that affect the reported amounts of assets and liabilities, revenue, costs and expenses, andthe disclosure of contingent assets and liabilities at the date of the financial statements, and the reported amounts of revenue and expenses during the reporting period.
Although we regularly assess these estimates, actual results could differ materially from these estimates. We base our estimates on historical experience and various other assumptions that we believe to be reasonable under the circumstances. Actual results may differ from our estimates if these results differ from historical experience, or other assumptions do not turn out to be substantially accurate, even if such assumptions are reportedreasonable when made. Changes in estimates are recognized in the period in which they become known.
Critical estimates relied upon in preparing the consolidated financial statements include the determination of sales allowance and accompanying disclosures. We evaluatevariable consideration in our estimatesrevenue recognition, allowance for doubtful accounts, the expensing and assumptions on an ongoing basis. Our actual results may differ fromcapitalization of product, technology, and development costs for website development and internal-use software, the valuation and recoverability of goodwill, intangible assets and other long-lived assets, the valuation of redeemable noncontrolling interest, the recoverability of our net deferred tax assets and related valuation allowance and the valuation of equity and liability-classified compensation awards under ASC Topic 718, Stock-based Compensation, or ASC 718. Accordingly, we consider these estimates.
Weto be our critical accounting policies and believe that of our significant accounting policies, which are described in Note 2 to the notes to our consolidated financial statements included elsewhere in this Annual Report on Form 10-K, the following accountingthese policies involve a greaterthe greatest degree of judgment and complexity. Accordingly, these are the policies we believe are the most critical to aid in fully understanding and evaluating our consolidated financial condition and results
Revenue Recognition
Sources of our operations.Revenue
Revenue Recognition
We derive revenue from two primarythree sources: (1)(i) marketplace subscription revenue, which consists primarily of dealer subscriptions to our Listings packages and Dealer Display subscriptions, and (2)RPM digital advertising and other revenue, which consists primarily of displaysuite, advertising revenue from auto manufacturers and other auto‑related brand advertisers, as well asand revenue from partnerships with financing services companies.companies; (ii) wholesale revenue, which consists primarily of transaction fees earned by CarOffer from facilitating the purchase and sale of vehicles between dealers; and (iii) product revenue, which consists primarily of aggregate proceeds received on the sale of vehicles.
Revenue Recognition
ASC Topic 606, Revenue from Contracts with Customers, or ASC 606, outlines a comprehensive five-step revenue recognition model based on the principle that an entity should recognize revenue to depict the transfer of promised goods or services to customers in an amount that reflects the consideration to which the entity expects to be entitled in exchange for those goods or services. To achieve this core principle, we apply the following five steps:
1) Identify the contract with a customer
2) Identify the performance obligations in the contract
3) Determine the transaction price
4) Allocate the transaction price to performance obligations in the contract
55
5) Recognize revenue when or as we satisfy a performance obligation
Marketplace Subscription Revenue - Description
We offer multiple types of marketplace Listings packages to our dealers through our platform:CarGurus U.S. platform (availability varies on our other marketplaces): Restricted Listings, (formerly referred to as Basic Listings), which is free; and various levels of Listings packages, which each require a paid subscription under a monthly, quarterly, semiannual, or annual subscription basis. Contractual
Our subscriptions for customers generally auto-renew on a monthly basis and are cancellable by dealers with 30 days’ advance notice atprior to the endcommencement of the committed term.applicable renewal term, although during the second quarter of 2020 we did not require 30 days’ advance notice of termination from dealers who cancelled as a result of the COVID-19 pandemic. Subscription pricing is determined based on a dealer’s inventory size, region, and our assessment of the connections and ROI the platform will provide them and is subject to discounts and/or fee reductions that we may offer from time to time. We also offer all dealers on our platform access to our Dealer Dashboard, which includes a performance summary, Dealer Insights tool, and user review management platform. DealersOnly dealers subscribing to a paid Listings package also have access to the Pricing Tool, and Market Analysis tool. The Pricing Tool and Market Analysis tool are available only to paying dealers. Subscription pricing is determined based on a dealer’s inventory size, region, and our assessment of the connections and ROI the platform will provide them.IMV Scan tool.
CustomersDealer customers do not have the right to take possession of our software.
In addition to listingdisplaying inventory in our marketplace and providing access to the Dealer Dashboard, we offer dealers subscribing to onecertain of our Enhanced, Featured, or Featured Priority Listings packages other subscription advertising and customer acquisition products including Dealer Display, pursuant to whichand enhancements marketed under our RPM digital advertising suite. Through RPM, dealers can buy display advertising that appears in our marketplace, and on other sites on the internet and for which suchand/or on high- converting social media platforms. Such advertisements can be targeted by the user’s geography, search history, CarGurus website activity (including showing users relevant vehicles from a dealer’s inventory that they have not yet discovered on our marketplace), and a number of other targeting factors, allowing dealers to increase their visibility with in-market consumers and drive qualified traffic for dealers.dealers.
Payment is typically due on the first day of each calendar month and is recordedrecognized as accounts receivable or short-term deferred revenue when payment is received in advance of services being delivered to the customers.
56
Advertising and Other Revenue
AdvertisingWe also offer paid Listings packages for the Autolist website and otherpaid Listings and advertising products for the PistonHeads website.
Marketplace revenue also consists primarily of non-dealer display advertising revenue from auto manufacturers and other auto-related brand advertisers sold on a cost per thousand impressions, or CPM, basis. An impression is an advertisement loaded on a web page. In addition to advertising sold on a CPM basis, we also have advertising sold on a cost per click basis. Auto manufacturers and other brand advertisers can execute advertising campaigns that are targeted across a wide variety of parameters, including demographic groups, behavioral characteristics, specific auto brands, categories such as Certified Pre-Owned, and segments such as hybrid vehicles. We do not provide minimum impression guarantees or other types of minimum guarantees in our contracts with customers. Pricing is primarily based on advertisement size and position on our websites and mobile applications, and fees are billed monthly in arrears. Unbilled accounts receivablesreceivable generally relate to services rendered in the current period, but generally not invoiced until the subsequent period.
We sell advertising directly to auto manufacturers and other auto related brand advertisers, as well as indirectly through revenue sharing arrangements with advertising exchange partners. Company-sold advertising is not subject to revenue sharing arrangements. Company-sold advertising revenue is recognized based on the gross amount charged to the advertiser. Partner-sold advertising revenue is recognized based on the net amount of revenue received from the content partners.
Revenue from advertising sold directly by us is recordedrecognized on a gross basis because we are the principal in the arrangement, control the ad placement and timing of the campaign, and establish the selling price. We enter into contractual arrangements directly with advertisers and are directly responsible for the fulfillment of the contractual terms including any remedy for issues with such fulfillment.
Advertising revenue subject to revenue sharing agreements between us and advertising exchange partners is recognized based on the net amount of revenue received from the partner. The advertising partner is responsible for fulfillment, including the acceptability of the services delivered. In partner-sold advertising arrangements, the advertising partner has a direct contractual relationship with the advertiser. There is no contractual relationship between us and the advertiser for partner-sold transactions. When an advertising exchange partner sells advertisements, the partner is responsible for fulfilling the advertisements, and accordingly, we have determined the advertising partner is the principal in the arrangement. Additionally, for auction-based partner agreements, we have latitude in establishing the floor price, but the final price established by the exchange server is at market rates.
56
Customers are billed monthly in arrears and payment terms are generally thirty to sixty days from the date invoiced.
Advertising and otherMarketplace revenue also includes revenue from partnerships with certain financing services companies pursuant to which we enable eligible consumers on our United StatesCarGurus U.S. website to pre-qualify for financing on cars from dealerships that offer financing through such companies. Our revenuesWe primarily generate revenue from these financing partnerships are based on a funded-loan basis.
Prior to adoption of ASC 606
We recognize revenue when all of the following conditions are satisfied: (1) there is persuasive evidence of an arrangement; (2) the service has been provided to the customer; (3) the collection of fees is reasonably assured; and (4) the amount of fees to be paid by the customer is fixed or determinable.
We recognize marketplace subscription revenue on a monthly basis as revenue is earned and advertising and other revenue as impressions are delivered. Revenue is presented net of any taxes collected from customers.
We assess arrangements with multiple deliverables under ASU No. 2009‑13, Revenue Recognition (Topic 605), Multiple‑Deliverable Revenue Arrangements — a Consensus of the FASB Emerging Issues Task Force. Pursuant to ASU 2009‑13, in order to treat deliverables in a multiple‑element arrangement as separate units of accounting, the deliverables must have stand‑alone value upon delivery. If the deliverables have stand‑alone value upon delivery, we account for each deliverable separately. We have concluded that each element in the arrangement has stand‑alone value as the individual services can be sold separately. In addition, there is no right of refund once a service has been delivered. Therefore, we have concluded that each element of the arrangement is a separate unit of accounting. While these arrangements are considered multiple element‑arrangements, the recognition of the units of accounting follow a consistent ratable recognition given the pattern over which services are provided.
57
We establish sales allowances at the time of revenue recognition based on our history of adjustments and credits provided to our customers. Sales allowances relate primarily to credits issued for service interruption. In assessing the adequacy of the sales allowance, we evaluate our history of adjustments and credits made through the date of the issuance of the financial statements. Estimated sales adjustments and credits and ultimate losses may vary from actual results which could be material to the financial statements; however, to date, actual sales allowances have been materially consistent with our estimates. Sales allowances are recorded as a reduction to revenue in the consolidated statements of operations.
Following adoption of ASC 606
In May 2014, the Financial Accounting Standards Board, or FASB, issued ASU No. 2014-09, Revenue from Contracts with Customers (Topic 606), which modifies how all entities recognize revenue, and consolidates revenue recognition guidance into one ASC Topic (ASC Topic 606, Revenue from Contracts with Customers). Since we ceased to be an emerging growth company as of December 31, 2018, we adopted the standard during the fourth quarter of 2018 and applied the modified retrospective method of adoption with a cumulative catch-up adjustment to the opening balance of retained earnings at January 1, 2018. Under this method, we applied the revised guidance for the year of adoption and applied ASC Topic 605, Revenue Recognition, in the prior years. As a result, we applied ASC 606 only to contracts that were not yet completed as of January 1, 2018. We recognized a cumulative catch-up adjustment to the opening balance of retained earnings at the effective date for contracts that still required performance by us on January 1, 2018. For contracts that were modified before the effective date, we exercised the use of the practical expedient and reflected the aggregate effect of all modifications when identifying performance obligations, determining the transaction price and allocating transaction price, which did not have a material effect on the adjustment to retained earnings.
ASC 606 outlines a comprehensive five-step revenue recognition model based on the principle that an entity should recognize revenue to depict the transfernumber of promised goods or services to customers in an amount that reflects the consideration to which the entity expects to be entitled in exchange for those goods or services. To achieve this core principle, we apply the following five steps:
|
|
|
|
|
|
|
|
|
|
Disaggregation of Revenue
The following table summarizes revenue from contracts with customers by revenue sourceWe also offer non-dealer advertising products for the years ended December 31, 2019, 2018Autolist and 2017.PistonHeads websites.
|
| 2019 |
|
| 2018 |
|
| 2017 |
| |||
Revenue by Revenue Stream |
|
|
|
|
|
|
|
|
|
|
|
|
Marketplace subscription revenue |
| $ | 526,043 |
|
| $ | 405,780 |
|
| $ | 282,664 |
|
Advertising and other revenue |
|
| 62,873 |
|
|
| 48,306 |
|
|
| 34,197 |
|
Total |
| $ | 588,916 |
|
| $ | 454,086 |
|
| $ | 316,861 |
|
Marketplace Revenue - Revenue Recognition
We provide disaggregation of revenue based on the marketplace subscription versus advertising and other revenue classification in the table above and based on geographic region (see Note 13) as we believe these categories best depict how the nature, amount, timing and uncertainty of revenue and cash flows are affected by economic factors.
Marketplace Subscription Revenue
For dealer listings, we provide a single similar service each day for a period of time. Each time increment (i.e., one day), rather than the underlying activities, is distinct and substantially the same and therefore our performance obligation is to provide a series of daily activities over the contract term. Similar to the dealer listings, the dealer display advertising is considered a promise to provide a single similar service each day. Each time increment is distinct and substantially the same and therefore our performance obligation is to provide a series of daily activities over the contract term.
58
Total consideration for marketplace subscription revenue is stated within the contracts. There are no contractual cash refund rights, but credits may be issued to a customer at our sole discretion. At an individual contractthe portfolio level, there is also no variable consideration, such as sales allowance, that needs to be included in the transaction price. However, at a portfolio level, weVariable consideration consists of sales allowances, usage fees, and concessions that change the transaction price of the unsatisfied or partially unsatisfied performance obligation. We recognize that there are times when there is a customer satisfaction issue or other circumstance that will lead to a credit. Due to the known possibility of future credits, a monthly sales allowance review is performed to defer revenue at a portfolio level for such future adjustments in the period of incurrence. We establish sales allowances at the time of revenue recognition based on our history of adjustments and credits provided to our customers. In assessing the adequacy of the sales allowance, we evaluate our history of adjustments and credits made through the date of the issuance of the financial statements. Estimated sales adjustments, credits and losses may vary from actual results which could lead to material adjustments to the financial statements. To date, actual sales allowances have been materially consistent with our estimates. Sales allowances are recordedrecognized as a reduction to revenue in the consolidated statements of operations.income statements.
Performance obligations are satisfied over time as the customer simultaneously receives and consumes the benefit of the service. Revenue is recognized ratably over the subscription period beginning on the date we start providing services to the customer under the contract. Revenue is presented net of any taxes collected from customers.
Advertising and Other Revenue
For advertising revenue, the performance obligation is to publish the agreed upon campaign on our websites and load the related impressions.
Advertising contracts state the transaction price within the agreement with payment generally being based on the number of clicks or impressions delivered on our websites. Total consideration is based on output and deemed variable consideration constrained by an agreed upon delivery schedule. Additionally, there are generally no contractual cash refund rights. Certain contracts do contain the right for credits in situations in which impressions are not displayed in compliance with contractual specifications. At an individual contract level, we may give a credit for a customer satisfaction issue or other circumstance. Due to the known possibility of future credits, a monthly review is performed to defer revenue at an individual contract level for such future adjustments in the period of incurrence.
As consideration is driven by the number of impressions delivered on the CarGurusour websites, the consideration for each period is allocated to the period in which the service was rendered.
Performance obligations for company-sold advertising revenue and partner-sold advertising revenue are satisfied over time as impressions are delivered. Revenue is recognized based on the total number of impressions delivered within the specified period. Revenue from advertising sold directly by us is recognized based on the gross amount charged to the advertiser and advertising revenue sold by partners is recognized based on the net amount of revenue received from the content partners. Revenue is presented net of any taxes collected from customers.
OtherMarketplace revenue includes revenue from contracts for which the performance obligation is a series of distinct services with the same level of effort daily. For these contracts, we estimate the value of the variable consideration in determining the transaction price and allocatesallocate it to the performance obligation. Revenue is estimated and recognized on a ratable basis over the contractual term. We reassess the estimate of variable consideration at each reporting period.
57
Wholesale Revenue - Description
Wholesale revenue includes transaction fees earned by CarOffer from facilitating the purchase and sale of vehicles between dealers, where CarOffer collects fees from both the buyer and seller. CarOffer also sells vehicles to dealers that CarOffer acquires at other marketplaces – in these instances, CarOffer collects a transaction fee from the buyer.
Wholesale revenue also includes fees earned by CarOffer from performing inspection and transportation services, where CarOffer collects fees from the buyer. Inspection and transportation service revenue is inclusive of dealer to dealer transactions, other marketplace to dealer transactions, and customer to dealer transactions.
Wholesale revenue also includes fees earned by CarOffer from certain guarantees offered to dealers, where CarOffer collects fees from the buying dealer or selling dealer, as applicable. Guarantee revenue is not accounted for under ASC 606 and is accounted for under ASC 460 as discussed further in Note 2 of the consolidated financial statements included elsewhere in this Annual Report on Form 10-K.
Wholesale Revenue - Revenue Recognition
When facilitating the purchase and sale of vehicles between dealers and for vehicles sold to dealers that are acquired at other marketplaces, CarOffer does not control the vehicle and therefore acts as an agent in the transaction. Revenue earned from the fees for facilitating these transactions is recognized at a point in time when the vehicle is sold on a net basis.
For inspection and transportation services, CarOffer leverages a network of third-party inspection service providers and transportation carriers. CarOffer controls both inspection and transportation services as it is primarily responsible for fulfillment and therefore acts as a principal in the transaction. Revenue from fees for inspection services is recognized at the point in time when the inspection is performed and revenue from fees for transportation services is recognized over time as delivery is completed. Revenue from both inspection and transportation services is recognized on a gross basis. Unearned revenue related to unsatisfied performance obligations is recognized as deferred revenue.
Wholesale revenue also includes arbitration in which, in the majority of instances, the vehicle is rematched to a new buyer and not acquired by CarOffer. Arbitration is the process by which CarOffer investigates and resolves claims from buying dealers. In these situations, CarOffer does not control the vehicle and therefore acts as an agent in the transaction.
Within wholesale transactions, there are no contractual cash refund rights, but credits may be issued to a customer at our sole discretion. At the portfolio level, there is also variable consideration, that needs to be included in the transaction price. Variable consideration consists of sales allowances and concessions that change the transaction price of the unsatisfied or partially unsatisfied performance obligation. We recognize that there are times when there is a customer satisfaction issue or other circumstance that will lead to a credit or arbitration. Due to the known possibility of future credits, a monthly sales allowance review is performed to defer revenue at a portfolio level for such future adjustments in the period of incurrence. We establish sales allowances at the time of revenue recognition based on our history of adjustments and credits provided to our customers. In assessing the adequacy of the sales allowance, we evaluate our history of adjustments and credits made through the date of the issuance of the financial statements. Estimated sales adjustments, credits and losses may vary from actual results which could lead to material adjustments to the financial statements. Sales allowances are recognized as a reduction to revenue in the consolidated income statements.
Wholesale revenue is presented net of any taxes collected from customers.
Product Revenue - Description
Product revenue includes the aggregate proceeds received on the sale of vehicles. This revenue relates to vehicles sold to dealers that CarOffer acquires directly from customers, inclusive of transaction fees collected from the buyer, and in limited situations across all CarOffer transactions, vehicles CarOffer resells after acquiring a vehicle via arbitration.
Product - Revenue Recognition
For vehicles sold to dealers that are acquired directly from consumers, CarOffer controls the vehicle and therefore acts as a principal in the transaction. Revenue earned from the fees for facilitating these transactions is recognized at a point in time when the vehicle is sold on a gross basis.
58
In limited situations across all CarOffer transactions, during an arbitration process, CarOffer acquires vehicles in transactions in which it controls the vehicle and therefore acts as a principal in the transaction. Revenue earned from the sale of the vehicle in these transactions is recognized at a point in time on a gross basis.
Contracts with Multiple Performance Obligations
We periodically enter into arrangements that include Listings and Dealer Displayand/or dealer advertising product subscriptions within marketplace subscription revenue. These contracts include multiple promises that we evaluate to determine if the promises are separate performance obligations. Performance obligations are identified based on services to be transferred to a customer that are distinct within the context of the contractual terms. Once the performance obligations have been identified, we determine the transaction price, which includes estimating the amount of variable consideration to be included in the transaction price, if any. If required, the transaction price is allocated to each performance obligation in the contract based on a relative standalone selling price (“SSP”) method as the performance obligation is being satisfied. For our arrangements that include Listings and Dealer Display,and/or dealer advertising product subscriptions, the performance obligations were satisfied over a consistent period of time and therefore the allocations did not impact the revenue recognized.
59For CarOffer's arrangements that include multiple performance obligations, we allocate revenue based on fair value. Vehicle and inspection revenues are recognized at a point in time and transportation revenue is recognized over time.
Costs to Obtain a Contract
Commissions paid to sales representatives and payroll taxes are considered costs to obtain a contract. Under ASC 606, the costs to obtain a contract require capitalization and amortization of those costs over the period of benefit. Although the guidance specifies the accounting for an individual contract with a customer, as a practical expedient, we have opted to apply the guidance to a portfolio of contracts with similar characteristics. We have opted to apply another practical expedient to immediately expense the incremental cost of obtaining a contract when the underlying related asset would have been amortized over one year or less. As such, we applied this practical expedient to advertising contracts as the term is one year or less and these contracts do not renew automatically. The practical expedient is not applicable to marketplace subscription contracts as the period of benefit including renewals is anticipated to be greater than one year as commissions paid on contract renewals are not commensurate with the commissions paid on the initial contract.year. The assets are periodically assessed for impairment.
For marketplace subscription customers, the commissions paid on contracts with new customers, in addition to any commission amount related to incremental sales, are capitalized and amortized over the estimated benefit period of the customer relationship taking into account factors such as peer estimates of technology lives and customer lives as well as our own historical data. Commissions paid that are not directly related to obtaining a new contract are expensed as incurred.
Additionally, we allocate employer payroll tax expense to the commission expense in proportion to the overall payroll taxes paid during the respective period. As such, capitalized payroll taxes are amortized in the same manner as the underlying capitalized commissions.
TheAs of December 31, 2021 and 2020, assets associated with costs to obtain a contract were $14.9 million and $20.0 million, respectively. This decrease in assets recognized for costs to obtain a contract were $3.2 million, $12.5 million and $20.1 million as of January 1, 2018, December 31, 2018 and December 31, 2019, respectively. Amortization expense recognized duringwas due to amortization from prior periods’ assets being greater than the capitalizable costs to obtain a contract in current period. For the years ended December 31, 20192021 and 2018 related to2020, amortization expense associated with costs to obtain a contract was $8.4$12.7 million and $3.7$11.6 million, respectively.
Accounts Receivable and Allowance for Doubtful Accounts
Accounts receivable are recorded based on the amount due from the customer and a third-party payment processor. Accounts receivable do not bear interest.
We are exposed to credit losses primarily through our trade accounts receivable, which includes receivables in transit from a third-party payment processor. The third-party payment processor collects customer payments on our behalf and remits them to us. Customer payments received, but not remitted as of period end are deemed to be receivables in transit. Additionally, the third-party payment processer provides payments in advance for certain customers to us. If the third-party payment processor does not receive customer payments related to the payments in advance, the balance is deducted from future remittances to us.
We offset gross trade accounts receivable with payments received in advance from a third-party payment processor as we have the right of offset. As of December 31, 2021, gross trade accounts receivable from receivables in transit from the third-party payment processor was $18.7 million, offset by payments received in advance of $46.8 million, which resulted in a net liability of $28.1 million recognized within accrued expenses, accrued income taxes, and other current liabilities in the consolidated balance sheets. Payments
59
received in advance are deductible from future payments from the third-party payment processor if the third-party payment processor does not receive the payment from the customer. Payments received in advance are presented as cash flows from financing activities in the consolidated statements of cash flows. As of December 31, 2020, we did not have any gross trade accounts receivable from receivables in transit from the third-party payment processor.
We also are exposed to credit losses primarily through our trade accounts receivable. We offset gross trade accounts receivable with an allowance for doubtful accounts. The allowance for doubtful accounts is our best estimate of the amount of probable credit losses in our existing accounts receivable and is based upon historical loss trends, the number of days that billings are past due, an evaluation of the potential risk of loss associated with specific accounts, current conditions, and reasonable and supportable forecasts of economic conditions. We also consider current economic trends when evaluating the adequacy of the allowance for doubtful accounts. If circumstances relating to specific customers change, or unanticipated changes occur in the general business environment, particularly as it affects auto dealers, our estimates of the recoverability of receivables could be further adjusted.
Provisions for allowances for doubtful accounts are recognized within general and administrative expense in the consolidated income statements. Amounts are charged against the allowance after all means of collection have been exhausted, the potential for recovery is considered remote and when it is determined that expected credit losses may occur. We do not have any off‑balance sheet credit exposure related to our customers. Unbilled accounts receivable generally relate to services rendered in the current period, but not invoiced until the subsequent period.
As of December 31, 2021 and 2020, changes in our allowance for doubtful accounts are as follows:
|
| Balance at |
|
| Provision |
|
| Write–offs, |
|
| Balance at |
| ||||
Year ended December 31, 2021 |
| $ | 616 |
|
| $ | 999 |
|
| $ | (1,195 | ) |
| $ | 420 |
|
Year ended December 31, 2020 |
|
| 240 |
|
|
| 1,930 |
|
|
| (1,554 | ) |
|
| 616 |
|
Impairment of Long‑Lived Assets
We evaluate the recoverability of long‑lived assets, such as property and equipment and intangible assets, for impairment at least annually and whenever events or changes in circumstances indicate that the carrying value of an asset may not be recoverable. During this review, we re‑evaluate the significant assumptions used in determining the original cost and estimated lives of long‑lived assets. Although the assumptions may vary from asset to asset, they generally include operating results, changes in the use of the asset, cash flows, and other indicators of value. Management then determines whether the remaining useful life continues to be appropriate, or whether there has been an impairment of long‑lived assets based primarily upon whether expected future undiscounted cash flows are sufficient to support the assets’ recovery. Recoverability of these assets is measured by comparison of the carrying amount of the asset to the future undiscounted cash flows the asset is expected to generate. If the asset is considered to be impaired, the amount of any impairment is measured as the difference between the carrying value and the fair value of the impaired asset.
For the year ended December 31, 2021, we wrote off $2.5 million of U.S. capitalized website development costs within operating expense in the consolidated income statements and $0.6 million in intangible assets within cost of revenue in the consolidated income statements related to certain developed technology in which we have decided to cease investment. For the year ended December 31, 2020, we wrote off $1.2 million in capitalized website development costs, of which $0.8 million related to the exit of certain international markets in connection with the Expense Reduction Plan.
Capitalized Website Development and Capitalized Internal-Use Software Costs
We capitalize certain costs associated with the development of our websites and internal‑use software products after the preliminary project stage is complete and until the website development or software is ready for its intended use. Research and development costs incurred during the preliminary project stage or costs incurred for data conversion activities, training, maintenance, and general and administrative or overhead costs are expensed as incurred. Capitalization begins when the preliminary project stage is complete, management authorizes and commits to the funding of the software project with the required authority, it is probable the project will be completed, the website development or software will be used to perform the functions intended and certain functional and quality standards have been met. Qualified costs incurred during the operating stage of our website development or software applications relating to upgrades and enhancements are capitalized to the extent it is probable that they will result in added functionality, while costs that cannot be separated between maintenance of, and minor upgrades and enhancements to, websites and internal‑use software are expensed as incurred.
Capitalized website development and capitalized internal-use software costs are recognized within property and equipment, net in the consolidated balance sheets.
60
Capitalized website development and capitalized internal-use software costs are amortized on a straight‑line basis over their estimated useful life of three years beginning with the time when itthe product is ready for intended use. Capitalized website development costs related amortization expenses are recognized within cost of revenue in the consolidated income statements. Capitalized internal-use software costs related amortization expenses are recognized within depreciation and amortization in the consolidated income statements. We evaluate the useful lives of these assets on an annual basis and tests for impairment whenever events or changes in circumstances occur that could impact the recoverability of these assets.
During the year ended December 31, 2021 and 2020, capitalized website development costs were $8.2 million and $6.4 million, respectively. During the year ended December 31, 2021, capitalized internal-use software costs were $2.9 million. During the year ended December 31, 2020, no capitalized internal-use software costs were recognized.
For the years ended December 31, 2021 and 2020, amortization expense associated with capitalized website development costs was $3.7 million and $3.3 million, respectively. For the year ended December 31, 2021, amortization expense associated with capitalized internal-use software costs was $0.3 million. For the year ended December 31, 2020, no amortization expense associated with capitalized internal-use software costs was recognized.
Capitalized Hosting Arrangements
Hosting arrangement capitalized implementation costs are amortized on a straight‑line basis over theiran estimated useful life of the term of the hosting arrangement, taking into consideration several other factors such as, but not limited to, options to extend the hosting arrangement or options to terminate the hosting arrangement, beginning with the time when itthe software is ready for intended use. Amounts amortized
Hosting arrangements costs are presented through operatingrecognized within the same line item in the consolidated income statements as the expense rather than depreciation or amortization.for fees for the associated hosting arrangement. Management evaluates the useful lives of these assets on an annual basis and tests for impairment whenever events or changes in circumstances occur that could impact the recoverability of these assets.
During the years ended December 31, 2021, 2020, and 2019 and 2018, we capitalized $4.2 million and $2.0 millionlaunched separate initiatives designed to enhance our hosting arrangements related to our enterprise applications, each of website development costs, respectively. We recorded amortization expense associated with our capitalized website development costs of $1.6 million, $1.5 million and $0.8 million for the years ended December 31, 2019, 2018, and 2017, respectively.
which are ongoing. During the year ended December 31, 2019, we capitalized $2.62021 and 2020, implementation costs were $3.8 million and $0.6$0.3 million, of internal-use software inrespectively, and recognized within other non-current assets and inwithin prepaid expenses, and prepaid income taxes respectively. We recordedand other current assets, respectively, in the consolidated balance sheets.
For the years ended December 31, 2021 and 2020, amortization expense associated with its internal-use software of $0.1our hosting arrangements was $1.8 million forand $0.7 million, respectively, and recognized within operating expense in the year ended December 31, 2019.consolidated income statements.
60
Business Combinations
Valuation of Acquired Assets and Liabilities
We measure all consideration transferred in a business combination at its acquisition-date fair value. Consideration transferred is determined by the acquisition-date fair value of assets transferred, liabilities assumed, including contingent consideration obligations, as applicable. We measure goodwill as the excess of the consideration transferred over the net of the acquisition-date amounts of assets acquired less liabilities assumed.
We make significant assumptions and estimates in determining the fair value of the acquired assets and liabilities as of the acquisition date, especially the valuation of intangible assets and certain tax positions. We record estimates as of the acquisition date and reassess the estimates at each reporting period up to one year after the acquisition date. Changes in estimates made prior to finalization of purchase accounting are recorded torecognized within goodwill.
Intangible Assets
Intangible assets are recordedrecognized at their estimated fair value at the date of acquisition. We amortize intangible assets over their estimated useful lives on a straight-line basis. Amortization is recordedrecognized over the relevant estimated useful lives ranging from three to eleven years.
61
We evaluate the useful lives of these assets on an annual basis and test for impairment whenever events or changes in circumstances occur that could impact the recoverability of these assets.basis. If the estimate of an intangible asset’s remaining useful life is changed, we amortize the remaining carrying value of the intangible asset prospectively over the revised remaining useful life.
For We monitor our long-lived assets for impairment indicators on an ongoing basis in accordance with GAAP, and test for impairment whenever events or changes in circumstances occur that could impact the year ended December 31, 2019,recoverability of these assets. If impairment indicators exist, we did not identify anyperform the required impairment of our intangible assets. We did not have intangibleanalysis by comparing the undiscounted cash flows expected to be generated from the long-lived assets prior to the closing of the PistonHeads acquisition on January 8, 2019.related net book values.
Goodwill
Goodwill is recordedrecognized when consideration paid in a purchase acquisition exceeds the fair value of the net assets acquired. Goodwill is not amortized, but rather is tested for impairment annually or more frequently if facts and circumstances warrant a review. Conditions that could trigger a more frequent impairment assessment include, but are not limited to, a significant adverse change in certain agreements, significant underperformance relative to historical or projected future operating results, an economic downturn affecting automotive marketplaces, increased competition, a significant reduction in our stock price for a sustained period or a reduction of our market capitalization relative to net book value.
We have determined that we have two reporting units, United States and International, asAs of and for the year ended December 31, 2019.2021, we have determined that we have three reporting units, United States, International, and CarOffer. We elected to bypass the optional qualitative test for impairment and proceed to Step 1 which is a quantitative impairment test. We evaluate impairment annually on October 1 by comparing the estimated fair value of each reporting unit to its carrying value. We estimate fair value using a discounted cash flow modelmarket approach, based on our most recent forecast atmarket multiples derived from public companies that we identify as peers. In 2021, we calculated the timefair value of our annual impairment test.reporting units using the market approach, which required us to estimate the forecasted revenue and estimate revenue market multiples using publicly available information for each of our reporting units. Developing these assumptions required the use of significant judgment and estimates. Actual results may differ from these forecasts.
For the yearyears ended December 31, 2019,2021 and 2020, we did not recognize anidentify any impairment charge. We did not have goodwill priorof our goodwill.
Redeemable Noncontrolling Interest
In connection with our acquisition of a 51% interest in CarOffer on January 14, 2021, we became a party with the noncontrolling equity holders of CarOffer to the closingCarOffer Operating Agreement, which, among other matters, sets forth certain put and call rights described in Note 4 of the PistonHeadsconsolidated financial statements included elsewhere in this Annual Report on Form 10-K. The CarOffer Operating Agreement provides us with the right to purchase, and the noncontrolling equity holders with the right to sell to us, the noncontrolling CarOffer equity holders’ equity interests in CarOffer at a contractually defined formulaic purchase price, which is based on a multiple of earnings. As the purchase is contingently redeemable at the option of the noncontrolling equity holders, we classify the carrying amount of the redeemable noncontrolling interests within the mezzanine section in the consolidated balance sheet, which is presented above the equity section and below the liabilities section. As of the date of Closing (as defined in Note 4 of the consolidated financial statements included elsewhere in this Annual Report on Form 10-K), the noncontrolling interest was recognized at fair value computed using the Least Square Monte Carlo Simulation approach. Significant inputs to the model include market price of risk, volatility, correlation and risk-free rate.
Subsequent to our acquisition of the 51% interest on January 8, 2019.14, 2021, the redeemable noncontrolling interest is measured at the greater of the amount that would be paid if settlement occurred as of the balance sheet date based on the contractually defined redemption value and its carrying amount adjusted for net income (loss) attributable to the noncontrolling interest. Adjustments to the carrying value of the redeemable noncontrolling interest resulting from changes in the redemption value are recognized within retained earnings in the consolidated balance sheets.
Income Taxes
We account for income taxes in accordance with the liability method. Under this method, deferred tax assets and liabilities are recognized based on temporary differences between the financial reporting and income tax bases of assets and liabilities using statutory rates. In addition, this method requires a valuation allowance against net deferred tax assets if, based upon the available evidence, it is more likely than not that some or all of the deferred tax assets will not be realized.
We account for uncertain tax positions recognized in the consolidated financial statements by prescribing a more‑likely‑than‑not threshold for financial statement recognition and measurement of a tax position taken or expected to be taken in a tax return. Interest and penalties, if applicable, related to uncertain tax positions would be recognized as a component of income tax expense. WeAs of December 31, 2021 and 2020, we have no recordedrecognized liabilities for uncertain tax positions as of December 31, 2019 or 2018.positions.
6162
The Tax Cuts and Jobs Act subjects a U.S. shareholder to tax on global intangible low-taxed income, or GILTI, earned by certain foreign subsidiaries. An entity can make an accounting policy election, per the FASB Staff Q&A, Topic 740, No. 5, Accounting for Global Intangible Low-Taxed Income, either to recognize deferred taxes for temporary basis differences expected to reverse as GILTI in future years or to provide for the tax expense related to GILTI in the year the tax is incurred as a period expense only. We elected to account for GILTI as a period cost in the year the tax is incurred.
Stock‑Based Compensation
For stock-basedstock‑based awards issuedgranted under our stock-basedstock‑based compensation plans, the fair value of each award is determined on the date of grant.
For RSUs granted subject to service-based vesting conditions, the fair value is determined on the date of grant using the closing price of our Class A common stock, par value $0.001 per share, as reported on the Nasdaq Global Select Market. RSUs granted subject to service-based vesting conditions generally vest over a four-year requisite service period.
For RSUs granted subject to market-based vesting conditions, the fair value is determined on the date of grant using the Monte Carlo simulation lattice model. The determination of the fair value using this model is affected by our stock price performance relative to the companies listed on the S&P 500 as of December 31, 2021 and 2020 and a number of assumptions including volatility, correlation coefficient, risk-free interest rate and expected dividends. RSUs granted subject to market-based vesting conditions vest upon achievement of specified levels of market conditions.
For stock options granted, the fair value is determined on the date of grant using the Black‑Scholes option‑pricing model. The determination of the fair value is affected by our stock price and a number of assumptions including volatility, term, risk-free interest rate and dividend yield. Stock options granted generally have a term of ten years from the date of grant and generally vest over a four-year requisite service period.
The weighted average assumptions utilized to determine the fair value of options granted during the year ended December 31, 2021 are as follows:
Year Ended December 31, | ||||
2021 | ||||
Expected dividend yield | — | |||
Expected volatility | 50.95 | % | ||
Risk–free interest rate | 0.69 | % | ||
Expected term (in years) | 6.06 | |||
During the years ended December 31, 2020 and 2019, no options were granted.
In connection with our acquisition of a 51% interest in CarOffer, the then-outstanding unvested incentive units, or CO Incentive Units, of CarOffer and unvested Class CO CarOffer units, or the Subject Units, remained outstanding and will vest over the requisite service periods as discussed below.
Grants of the CO Incentive Units are subject to the CarOffer 2020 Equity Incentive Plan, adopted effective November 24, 2020, or the 2020 CO Plan, the applicable award agreement, and the CarOffer Operating Agreement. Following the Company’s acquisition of the 51% interest in CarOffer on January 14, 2021, remaining unvested CO Incentive Units will vest over a period of three (3) years, with one third having vested on January 14, 2022 and one third vesting on each of January 14, 2023 and January 14, 2024, provided that a grantee’s continuous service to CarOffer has not terminated on the applicable vesting date. Under the terms of the grants, vesting of unvested CO Incentive Units is accelerated in the event of (i) a change of control of CarOffer (which, for the avoidance of doubt, does not include the Company’s acquisition of the 51% interest on January 14, 2021), (ii) the death or disability of the grantee, (iii) termination of the grantee’s employment with CarOffer without cause, or (iv) termination of grantee’s employment by the grantee for good reason. Upon termination of a grantee’s continuous service to CarOffer voluntarily by the grantee (other than for good reason) or by CarOffer for cause, all of such grantee’s unvested CO Incentive Units are forfeited. In addition, if a grantee’s continuous service terminates, then CarOffer has the option to repurchase any outstanding CO Incentive Units from the grantee.
63
In addition to the 2020 CO Plan, on December 9, 2020 CarOffer entered into a Vesting Agreement, or the Vesting Agreement, regarding the vesting of Subject Units beneficially owned by Bruce Thompson, the founder and CEO of CarOffer, and certain affiliated persons, or, collectively, the T5 Holders, in connection with the our then-anticipated acquisition of a 51% interest in CarOffer. Pursuant to the Vesting Agreement, 432,592 Subject Units beneficially owned by the T5 Holders vest in three (3) approximately equal installments, with one third having vested on January 14, 2022 and one third vesting on each of January 14, 2023 and January 14, 2024, subject to the terms of the Vesting Agreement. As more particularly described in the Vesting Agreement, unvested Subject Units are subject to forfeiture in the event that Mr. Thompson’s relationship with CarOffer terminates other than in the event of a termination without cause (as defined in the Vesting Agreement) or due to Mr. Thompson’s death or disability. The Vesting Agreement also provides for acceleration of any unvested Subject Units in the event of the termination of Mr. Thompson’s employment with CarOffer without cause, Mr. Thompson’s death or disability, or the consummation of an eligible liquidity event (as defined in the Vesting Agreement).
In connection with the Closing, CarOffer reserved 228,571 incentive units, or the 2021 Incentive Units, for purposes of establishing an employee incentive equity plan. Thereafter, CarOffer formed CarOffer Incentive Equity, LLC, or CIE, a Delaware manager-managed limited liability company managed by us, and established the CIE 2021 Equity Incentive Plan, or the 2021 CO Plan. The 2021 CO Plan and related documentation, including the applicable award agreement, a vesting agreement between CarOffer and CIE, and the CarOffer Operating Agreement, provide for an incentive equity grant structure whereby 2021 Incentive Units will be granted to CIE and 2021 CO Plan grantees will receive an associated equity interest in CIE, or the CIE Interest, with back-to-back vesting between the 2021 Incentive Units and the associated CIE Interest. Subject to any modifications as may be approved by the CarOffer Board of Managers in its discretion, grants under the 2021 CO Plan will vest over a period of three (3) years from the grant date, one third each on the first, second, and third anniversaries of the applicable grant date, provided that a grantee’s continuous service to CarOffer has not terminated on the applicable grant date. Upon termination of a grantee’s continuous service to CarOffer, all of such grantee’s unvested 2021 Incentive Units are forfeited. As of December 31, 2021, there had not been any grants of 2021 Incentive Units under the 2021 CO Plan.
CO Incentive Units, Subject Units and 2021 Incentive Units are liability-classified awards because the awards can be put to us at a formula price such that the holders do not bear the risks and rewards associated with equity ownership. For liability-classified awards, the fair value is determined on the date of issuance using a Least Square Monte Carlo simulation model. The determination of the fair value is affected by CarOffer’s equity value, EBITDA, Excess Parent Capital (as defined in the CarOffer Operating Agreement), and revenue forecasts that drive the exercise price of future call/put rights, as well as a number of assumptions including market price of risk, volatility, correlation, and risk-free interest rate. Liability-classified awards are remeasured to fair value each period until settlement.
We issue shares of Class A common stock upon the vesting of RSUs and the exercise of stock options out of our shares available for issuance. We issue CO Incentive Units and Subject Units out of CarOffer’s units available for issuance. We account for forfeitures when they occur.
We recognize compensation expense for service-based awards on a straight-line basis over the requisite service period for each separate vesting portion of the award, with the amount of compensation expense recognized at any date at least equaling the portion of the grant-date fair value of the award that is vested at that date.
Certain awards granted prior to the IPO were subject to service‑based vesting conditions and a performance‑based vesting condition achieved upon a liquidity event, defined as either a change of control or an initial public offering. The SEC’s declaration of effectiveness of the registration statement on Form S-1 on October 11, 2017 satisfied the liquidity event performance condition. Upon the achievement of the liquidity event, we recorded previously unrecognized cumulative stock-based compensation expense of $2.5 million related to these awards.Although the performance-based vesting condition was satisfied, under the terms of the awards, the settlement of such vested RSUs and the issuance of common stock with respect to such vested RSUs, occurred on April 10, 2018, one hundred eighty-one days after the satisfaction of the performance condition.
Given the absence of an active market for our common stock prior to the IPO, our board of directors was required to estimate the fair value of our stock at the time of each grant of a stock‑based award. We believe that the members of our board of directors at all relevant times had sufficient business, finance or venture capital experience to make such estimates. We and our board of directors utilized various valuation methodologies in accordance with the framework of the American Institute of Certified Public Accountants’ Technical Practice Aid, Valuation of Privately‑Held Company Equity Securities Issued as Compensation, to estimate the fair value of our common stock. Each valuation methodology includes estimates and assumptions that required judgment. These estimates and assumptions include a number of objective and subjective factors used to determine the value of our common stock at each grant date, including the following factors: (1) prices paid for our convertible preferred stock, which we had sold to outside investors in arm’s‑length transactions, and the rights, preferences, and privileges of our convertible preferred stock and common stock; (2) valuations performed by an independent valuation specialist; (3) our stage of development and revenue growth; (4) the fact that the grants of stock‑based awards involved illiquid securities in a private company; and (5) the likelihood of achieving a liquidity event for the common stock underlying the stock‑based awards, such as an IPO or sale of the Company, given prevailing market conditions.
We believe this methodology was reasonable based upon our internal peer company analyses, and further supported by arm’s‑length transactions involving our convertible preferred stock. As our common stock was not actively traded, the determination of fair value involved assumptions, judgments, and estimates. If different assumptions had been made, stock‑based compensation expense, consolidated net income, and consolidated net income per share could have been significantly different.
For RSUs issued under the stock-based compensation plans prior to the IPO, the fair value of each grant was calculated based on the estimated fair value of our common stock on the date of grant. We estimated the fair value of most stock option awards on the date of grant using the Black-Scholes option-pricing model.
For RSUs granted subsequent to the IPO, the fair value is determined based on the closing price of our Class A common stock as reported on the Nasdaq Global Select Market on the date of grant.
We issue shares for stock option exercises and RSUs out of our shares available for issuance. No options were granted during the years ended December 31, 2019, 2018, and 2017.
We account for forfeitures when they occur. The tax effect of differences between tax deductions related to stock compensation and the corresponding financial statement expense compensation are recorded torecognized within tax expense. Excess tax benefits recognized on stock‑based compensation expense are classified as an operating activity in the consolidated statements of cash flows.
62
During 2019, 2018 and 2017, we recordedAs of December 31, 2021, tax benefits of $11.1 million, $40.8 million and $0.7 million, respectively,demerits related to differences betweenstock-based compensation were $1.2 million. As of December 31, 2020, tax deductionsdemerits related to stockstock-based compensation and the corresponding financial statement expense compensation.were immaterial.
Recently Issued Accounting Pronouncements
Information concerning recently issued accounting pronouncements may be found in Note 2 to our consolidated financial statements appearing elsewhere in this Annual Report on Form 10-K.
6364
Item 7A. Quantitative and Qualitative Disclosures about Market Risk.
Market risk represents the risk of loss that may affect our financial position due to adverse changes in financial market prices and rates. We are exposed to market risks as described below.
Interest Rate Risk
WeAs of December 31, 2021 and 2020, we did not have any long‑term borrowings asborrowings.
As of December 31, 2019 or 2018.
We2021 and 2020, we had cash, cash equivalents, and investments of $171.6$321.9 million and $157.7$290.3 million, at December 31, 2019 and 2018, respectively, which consistconsisted of bank deposits, money market funds and certificates of deposit with maturity dates ranging from six to nine months.
Such interest‑earninginterest-earning instruments carry a degree of interest rate risk. Given recent changes in the interest rate environment and in an effort to ensure liquidity, we expect lower returns from our investments for the foreseeable future. To date, fluctuations in interest income have not been material to the operations of the business.
We do not enter into investments for trading or speculative purposes and have not used any derivative financial instruments to manage our interest rate risk exposure.
Inflation Risk
We do not believe that inflation has had a material effect on our business, financial condition, or results of operations to date. However, if our costs were to become subject to significant inflationary pressures, we may not be able to fully offset such higher costs through price increases. Our inability or failure to do so could harm our business, operating results, and financial condition.
Foreign Currency Exchange Risk
Historically, because our operations and sales have been primarily in the United States, we have not faced any significant foreign currency risk. As of December 31, 20192021 and 2018,2020, we havehad foreign currency exposures in the British pound, the Euro and the Canadian dollar, although such exposure is not significant. During the year ended December 31, 2019, our foreign currency exposure increased due to an intercompany note payable in connection with the PistonHeads acquisition. The intercompany note payable was settled during the year ended December 31, 2019.
Our foreign subsidiaries have intercompany accountstransactions that are eliminated upon consolidation, and these accountstransactions expose us to foreign currency exchange rate fluctuations. Exchange rate fluctuations on short‑term intercompany accountstransactions are recordedrecognized within other income, net in our consolidated statements of operations under the headingincome statements. Exchange rate fluctuations on long-term intercompany transactions are recognized within accumulated other comprehensive (loss) income (expense), net. Long-term intercompany accounts are recorded at their historical rates.in our consolidated balance sheets.
As we expand internationally,seek to grow our international operations in Canada and the United Kingdom, our risks associated with fluctuation in currency rates willmay become greater, and we will continue to reassess our approach to managing these risks.
6465
Item 8. Financial Statements and Supplementary Data.
CarGurus, Inc.
Index to Consolidated Financial Statements
|
| Page No. |
Report of Independent Registered Public Accounting Firm (PCAOB ID: 42) |
|
|
Consolidated Balance Sheets as of December 31, |
| 70 |
| 71 | |
| 72 | |
| 73 | |
| 74 | |
| 75 |
6566
Report of Independent Registered Public Accounting Firm
To the Stockholders and the Board of Directors of CarGurus, Inc.
Opinion on the Financial Statements
We have audited the accompanying consolidated balance sheets of CarGurus, Inc. (the Company) as of December 31, 20192021 and 2018,2020, the related consolidated statements of operations,income, comprehensive income, convertible preferred stock and stockholders' equity (deficit) and cash flows for each of the three years in the period ended December 31, 2019,2021, and the related notes (collectively referred to as the “consolidated financial statements”). In our opinion, the consolidated financial statements present fairly, in all material respects, the financial position of the Company at December 31, 20192021 and 2018,2020, and the results of its operations and its cash flows for each of the three years in the period ended December 31, 2019,2021, in conformity with U.S. generally accepted accounting principles.
We also have audited, in accordance with the standards of the Public Company Accounting Oversight Board (United States) (PCAOB), the Company's internal control over financial reporting as of December 31, 2019,2021, based on criteria established in Internal Control-Integrated Framework issued by the Committee of Sponsoring Organizations of the Treadway Commission (2013 framework) and our report dated February 14, 202024, 2022 expressed an unqualified opinion thereon.
Adoption of New Accounting Standards
As discussed in Note 2 to the consolidated financial statements, the Company changed its method of accounting for leases in 2019 due to the adoption of Accounting Standards Update (ASU) No. 2016-02, Leases (Topic 842), and the related amendments.
As discussed in Note 2 to the consolidated financial statements, the Company changed its method of accounting for revenue and the capitalization and amortization of certain contract acquisition costs in 2018 due to the adoption of Accounting Standards Update (ASU) No. 2014-09, Revenue from Contracts with Customers (Topic 606), and the related amendments.
Basis for Opinion
These financial statements are the responsibility of the Company's management. Our responsibility is to express an opinion on the Company’s financial statements based on our audits. We are a public accounting firm registered with the PCAOB and are required to be independent with respect to the Company in accordance with the U.S. federal securities laws and the applicable rules and regulations of the Securities and Exchange Commission and the PCAOB.
We conducted our audits in accordance with the standards of the PCAOB. Those standards require that we plan and perform the audit to obtain reasonable assurance about whether the financial statements are free of material misstatement, whether due to error or fraud. Our audits included performing procedures to assess the risks of material misstatement of the financial statements, whether due to error or fraud, and performing procedures that respond to those risks. Such procedures included examining, on a test basis, evidence regarding the amounts and disclosures in the financial statements. Our audits also included evaluating the accounting principles used and significant estimates made by management, as well as evaluating the overall presentation of the financial statements. We believe that our audits provide a reasonable basis for our opinion.
66
Critical Audit Matters
The critical audit matters communicated below are matters arising from the current period audit of the financial statements that were communicated or required to be communicated to the audit committee and that: (1) relate to accounts or disclosures that are material to the financial statements and (2) involved our especially challenging, subjective or complex judgments. The communication of critical audit matters does not alter in any way our opinion on the consolidated financial statements, taken as a whole, and we are not, by communicating the critical audit matters below, providing separate opinions on the critical audit matters or on the accounts or disclosures to which they relate.
|
| Revenue Recognition |
Description of the Matter |
| For the year ended December 31,
Auditing management’s recognition of revenue was challenging because of the higher extent of audit effort and because the amounts are material to the consolidated financial statements and related disclosures. During our risk assessment process, we identified a higher inherent risk related to revenue primarily due to the size of the account and the volume of activity, as well as the focus on revenue from readers of the financial statements.
|
67
How We Addressed the Matter in Our Audit |
| We obtained an understanding, evaluated the design and tested the operating effectiveness of controls over the Company’s revenue recognition process, including controls designed to mitigate the risk of override of controls. This included testing controls over management’s review of manual journal entries and revenue related account reconciliations.
We substantively tested the Company’s revenue recognized for the year ended December 31,
|
|
|
|
Description of the Matter |
| As
|
67
|
|
| ||
|
Auditing the Company's accounting for its acquisition of
| |
How We Addressed the Matter in Our Audit |
| We obtained an understanding, evaluated the design and tested the operating effectiveness of controls over the Company’s valuation of acquired intangible
Our audit procedures to test the estimated fair value of the acquired intangible assets and redeemable noncontrolling interest included, among others, evaluating the Company’s valuation methodology used to estimate the fair value of the developed technology, brand, |
68
Fair Value Measurement of Liability-Classified Awards | ||
Description of the Matter | As described in Note 2 and Note 4 to the consolidated financial statements CarOffer has issued incentive units that are liability-classified awards because the awards can be put to the Company at a contractually defined formulaic purchase price such that the holders do not bear the risks and rewards associated with equity ownership. Auditing the Company's accounting for these liability-classified awards was complex due to the significant estimation uncertainty in the Company’s determination of the fair value of the awards of $21.1 million at December 31, 2021. The significant estimation uncertainty was primarily due to the complexity of the valuation models prepared by management to measure the fair value of the awards and the sensitivity of the respective fair values to the significant underlying assumptions. The Company used the Least Square Monte Carlo Simulation approach to value the liability-classified awards. The significant assumptions used to estimate the fair value of the liability classified awards include the discount rates and certain calculated market inputs such as MPR, volatility, correlation, risk-free rate, and certain assumptions that form the basis of the CarOffer equity value (e.g., revenue growth rates, gross profit, EBITDA). These significant assumptions are especially challenging to audit as they are forward looking and could be affected by future economic and market conditions. | |
How We Addressed the Matter in Our Audit | We obtained an understanding, evaluated the design and tested the operating effectiveness of controls over the Company’s valuation of these liability-classified awards. This included testing controls over the Company’s estimation process supporting the recognition and measurement of liability-classified awards, as well as controls over management’s judgments and evaluation of underlying assumptions regarding the valuation. Our audit procedures to test the estimated fair value included, among others, evaluating the Company’s valuation methodology used to estimate the fair value of the liability-classified awards. We involved our valuation professionals to assist with our evaluation of the methodology used by the Company and certain assumptions included in the fair value estimates. For example, our valuation professionals evaluated the Company's use of a Least Square Monte Carlo Simulation model, developed an independent Monte Carlo Simulation model, and performed independent comparative calculations to estimate the fair value of the liability classified awards, the discount rates, MPR, volatility, correlation and risk-free rate market input assumptions. Additionally, we evaluated the significant assumptions used by the Company, primarily consisting of projected financial information of the acquired entity (e.g., revenue growth rates, gross profit, and EBITDA margins), and evaluated the completeness and accuracy of the underlying data supporting the significant assumptions and estimates. Specifically, when evaluating the assumptions related to the forecasted results and changes in the business that would drive these results, we compared the assumptions to historical results of the acquired entity and current industry and economic trends. We also performed a sensitivity analysis of the significant assumptions to evaluate the change in the fair values that would result from changes in the assumptions. |
/s/ Ernst & Young LLP
We have served as the Company’s auditor since 2016.
Boston, Massachusetts
February 14, 202024, 2022
69
CarGurus, Inc.
Consolidated Balance Sheets
(in thousands, except share and per share data)
|
| At December 31, |
|
| As of December 31, |
| ||||||||||
|
| 2019 |
|
| 2018 |
|
| 2021 |
|
| 2020 |
| ||||
Assets |
|
|
|
|
|
|
|
|
|
|
|
|
|
| ||
Current assets: |
|
|
|
|
|
|
|
|
|
|
|
|
|
| ||
Cash and cash equivalents |
| $ | 59,920 |
|
| $ | 34,887 |
|
| $ | 231,944 |
| $ | 190,299 |
| |
Investments |
|
| 111,692 |
|
|
| 122,800 |
|
| 90,000 |
| 100,000 |
| |||
Accounts receivable, net of allowance for doubtful accounts of $240 and $479, respectively |
|
| 22,124 |
|
|
| 13,614 |
| ||||||||
Prepaid expenses and prepaid income taxes |
|
| 10,452 |
|
|
| 10,144 |
| ||||||||
Accounts receivable, net of allowance for doubtful accounts of $420 and |
| 189,324 |
| 18,235 |
| |||||||||||
Inventory |
| 19,656 |
| — |
| |||||||||||
Prepaid expenses, prepaid income taxes and other current assets |
| 16,430 |
| 12,385 |
| |||||||||||
Deferred contract costs |
|
| 9,544 |
|
|
| 5,253 |
|
| 9,045 |
| 10,807 |
| |||
Other current assets |
|
| 4,972 |
|
|
| 7,410 |
| ||||||||
Restricted cash |
|
| 250 |
|
|
| 750 |
|
|
| 6,709 |
|
|
| 250 |
|
Total current assets |
|
| 218,954 |
|
|
| 194,858 |
|
| 563,108 |
| 331,976 |
| |||
Property and equipment, net |
|
| 27,950 |
|
|
| 24,269 |
|
| 32,210 |
| 27,483 |
| |||
Intangible assets |
|
| 3,920 |
|
|
| — |
| ||||||||
Intangible assets, net |
| 83,915 |
| 10,862 |
| |||||||||||
Goodwill |
|
| 15,207 |
|
|
| — |
|
| 158,287 |
| 29,129 |
| |||
Operating lease right-of-use assets |
|
| 59,986 |
|
|
| — |
|
| 60,609 |
| 60,835 |
| |||
Restricted cash |
|
| 10,553 |
|
|
| 1,921 |
|
| 9,627 |
| 10,377 |
| |||
Deferred tax assets |
|
| 42,713 |
|
|
| 38,886 |
|
| 13,378 |
| 19,774 |
| |||
Deferred contract costs, net of current portion |
|
| 10,514 |
|
|
| 7,252 |
|
| 5,867 |
| 9,189 |
| |||
Other non-current assets |
|
| 3,826 |
|
|
| 1,104 |
|
|
| 4,573 |
|
|
| 2,673 |
|
Total assets |
| $ | 393,623 |
|
| $ | 268,290 |
|
| $ | 931,574 |
|
| $ | 502,298 |
|
Liabilities and stockholders’ equity |
|
|
|
|
|
|
|
| ||||||||
Liabilities, redeemable noncontrolling interest and stockholders’ equity |
|
|
|
|
|
| ||||||||||
Current liabilities: |
|
|
|
|
|
|
|
|
|
|
|
|
|
| ||
Accounts payable |
| $ | 36,731 |
|
| $ | 34,345 |
|
| $ | 66,153 |
| $ | 21,563 |
| |
Accrued expenses, accrued income taxes and other current liabilities |
|
| 18,262 |
|
|
| 18,654 |
|
| 78,586 |
| 24,751 |
| |||
Deferred revenue |
|
| 9,984 |
|
|
| 8,811 |
|
| 12,784 |
| 9,137 |
| |||
Deferred rent |
|
| — |
|
|
| 1,693 |
| ||||||||
Operating lease liabilities |
|
| 8,781 |
|
|
| — |
|
|
| 13,186 |
|
|
| 11,085 |
|
Total current liabilities |
|
| 73,758 |
|
|
| 63,503 |
|
| 170,709 |
| 66,536 |
| |||
Deferred rent |
|
| — |
|
|
| 9,395 |
| ||||||||
Operating lease liabilities |
|
| 60,818 |
|
|
| — |
|
| 57,519 |
| 58,810 |
| |||
Deferred tax liabilities |
|
| 284 |
|
|
| — |
|
| 58 |
| 291 |
| |||
Other non–current liabilities |
|
| 1,908 |
|
|
| 1,281 |
|
|
| 23,639 |
|
|
| 3,075 |
|
Total liabilities |
|
| 136,768 |
|
|
| 74,179 |
|
| 251,925 |
| 128,712 |
| |||
Commitments and contingencies (Note 8) |
|
|
|
|
|
|
|
| ||||||||
Commitments and contingencies (Note 9) |
|
|
|
|
| |||||||||||
Redeemable noncontrolling interest |
| 162,808 |
|
|
| — |
| |||||||||
Stockholders’ equity: |
|
|
|
|
|
|
|
|
|
|
|
|
|
| ||
Preferred stock, $0.001 par value; 10,000,000 shares authorized; 0 shares issued and outstanding |
|
| — |
|
|
| — |
| ||||||||
Class A common stock, $0.001 par value; 500,000,000 shares authorized; 91,819,649 and 89,728,223 shares issued and outstanding at December 31, 2019 and 2018, respectively |
|
| 92 |
|
|
| 90 |
| ||||||||
Class B common stock, $0.001 par value; 100,000,000 shares authorized; 20,314,644 and 20,702,084 shares issued and outstanding at December 31, 2019 and 2018, respectively |
|
| 20 |
|
|
| 21 |
| ||||||||
Preferred stock, $0.001 par value; 10,000,000 shares authorized; |
| — |
|
|
| — |
| |||||||||
Class A common stock, $0.001 par value; 500,000,000 shares authorized; |
| 102 |
| 94 |
| |||||||||||
Class B common stock, $0.001 par value; 100,000,000 shares authorized; |
| 16 |
| 19 |
| |||||||||||
Additional paid–in capital |
|
| 205,234 |
|
|
| 184,216 |
|
| 387,868 |
| 242,181 |
| |||
Retained earnings |
|
| 51,859 |
|
|
| 9,713 |
|
| 129,258 |
| 129,412 |
| |||
Accumulated other comprehensive (loss) income |
|
| (350 | ) |
|
| 71 |
|
|
| (403 | ) |
|
| 1,880 |
|
Total stockholders’ equity |
|
| 256,855 |
|
|
| 194,111 |
|
|
| 516,841 |
|
|
| 373,586 |
|
Total liabilities and stockholders’ equity |
| $ | 393,623 |
|
| $ | 268,290 |
|
| $ | 931,574 |
|
| $ | 502,298 |
|
The accompanying notes are an integral part of these consolidated financial statements.
70
CarGurus, Inc.
Consolidated Income Statements of Operations
(in thousands, except share and per share data)
|
| Year Ended December 31, |
| |||||||||
|
| 2021 |
|
| 2020 |
|
| 2019 |
| |||
Revenue |
|
|
|
|
|
|
|
|
| |||
Marketplace |
| $ | 636,942 |
|
| $ | 551,451 |
|
| $ | 588,916 |
|
Wholesale |
|
| 195,127 |
|
|
| — |
|
|
| — |
|
Product |
|
| 119,304 |
|
|
| — |
|
|
| — |
|
Total revenue |
|
| 951,373 |
|
|
| 551,451 |
|
|
| 588,916 |
|
Cost of revenue(1) |
|
|
|
|
|
|
|
|
| |||
Marketplace |
|
| 47,689 |
|
|
| 42,706 |
|
|
| 36,300 |
|
Wholesale |
|
| 127,679 |
|
|
| — |
|
|
| — |
|
Product |
|
| 118,647 |
|
|
| — |
|
|
| — |
|
Total cost of revenue |
|
| 294,015 |
|
|
| 42,706 |
|
|
| 36,300 |
|
Gross profit |
|
| 657,358 |
|
|
| 508,745 |
|
|
| 552,616 |
|
Operating expenses: |
|
|
|
|
|
|
|
|
| |||
Sales and marketing |
|
| 290,574 |
|
|
| 256,979 |
|
|
| 393,844 |
|
Product, technology, and development |
|
| 106,423 |
|
|
| 85,726 |
|
|
| 69,462 |
|
General and administrative |
|
| 97,678 |
|
|
| 62,166 |
|
|
| 50,434 |
|
Depreciation and amortization |
|
| 14,415 |
|
|
| 6,118 |
|
|
| 4,554 |
|
Total operating expenses |
|
| 509,090 |
|
|
| 410,989 |
|
|
| 518,294 |
|
Income from operations |
|
| 148,268 |
|
|
| 97,756 |
|
|
| 34,322 |
|
Other income, net: |
|
|
|
|
|
|
|
|
| |||
Interest income |
|
| 120 |
|
|
| 1,075 |
|
|
| 2,984 |
|
Other income, net |
|
| 972 |
|
|
| 279 |
|
|
| 1,399 |
|
Total other income, net |
|
| 1,092 |
|
|
| 1,354 |
|
|
| 4,383 |
|
Income before income taxes |
|
| 149,360 |
|
|
| 99,110 |
|
|
| 38,705 |
|
Provision for (benefit from) income taxes |
|
| 38,987 |
|
|
| 21,557 |
|
|
| (3,441 | ) |
Consolidated net income |
|
| 110,373 |
|
|
| 77,553 |
|
|
| 42,146 |
|
Net income attributable to redeemable noncontrolling interest |
|
| 1,129 |
|
|
| — |
|
|
| — |
|
Net income attributable to CarGurus, Inc. |
| $ | 109,244 |
|
| $ | 77,553 |
|
| $ | 42,146 |
|
Accretion of redeemable noncontrolling interest to redemption value |
|
| 109,398 |
|
|
| — |
|
|
| — |
|
Net (loss) income attributable to common stockholders |
| $ | (154 | ) |
| $ | 77,553 |
|
| $ | 42,146 |
|
Net (loss) income per share attributable to common stockholders: (Note 11) |
|
|
|
|
|
|
|
|
| |||
Basic |
| $ | (0.00 | ) |
| $ | 0.69 |
|
| $ | 0.38 |
|
Diluted |
| $ | (0.00 | ) |
| $ | 0.68 |
|
| $ | 0.37 |
|
Weighted–average number of shares of common stock used in |
|
|
|
|
|
|
|
|
| |||
Basic |
|
| 117,142,062 |
|
|
| 112,854,524 |
|
|
| 111,450,443 |
|
Diluted |
|
| 117,142,062 |
|
|
| 113,849,815 |
|
|
| 113,431,850 |
|
|
| Year Ended December 31, |
| |||||||||
|
| 2019 |
|
| 2018 |
|
| 2017 |
| |||
Revenue |
| $ | 588,916 |
|
| $ | 454,086 |
|
| $ | 316,861 |
|
Cost of revenue(1) |
|
| 36,300 |
|
|
| 24,811 |
|
|
| 17,609 |
|
Gross profit |
|
| 552,616 |
|
|
| 429,275 |
|
|
| 299,252 |
|
Operating expenses: |
|
|
|
|
|
|
|
|
|
|
|
|
Sales and marketing |
|
| 393,844 |
|
|
| 315,939 |
|
|
| 236,165 |
|
Product, technology, and development |
|
| 69,462 |
|
|
| 47,866 |
|
|
| 22,470 |
|
General and administrative |
|
| 50,434 |
|
|
| 39,475 |
|
|
| 22,688 |
|
Depreciation and amortization |
|
| 4,554 |
|
|
| 2,804 |
|
|
| 2,655 |
|
Total operating expenses |
|
| 518,294 |
|
|
| 406,084 |
|
|
| 283,978 |
|
Income from operations |
|
| 34,322 |
|
|
| 23,191 |
|
|
| 15,274 |
|
Other income, net: |
|
|
|
|
|
|
|
|
|
|
|
|
Interest income |
|
| 2,984 |
|
|
| 2,283 |
|
|
| 869 |
|
Other income (expense), net |
|
| 1,399 |
|
|
| 10 |
|
|
| (306 | ) |
Total other income, net |
|
| 4,383 |
|
|
| 2,293 |
|
|
| 563 |
|
Income before income taxes |
|
| 38,705 |
|
|
| 25,484 |
|
|
| 15,837 |
|
(Benefit from) provision for income taxes |
|
| (3,441 | ) |
|
| (39,686 | ) |
|
| 2,638 |
|
Net income |
| $ | 42,146 |
|
| $ | 65,170 |
|
| $ | 13,199 |
|
Reconciliation of net income to net income attributable to common stockholders: |
|
|
|
|
|
|
|
|
|
|
|
|
Net income |
| $ | 42,146 |
|
| $ | 65,170 |
|
| $ | 13,199 |
|
Net income attributable to participating securities |
|
| — |
|
|
| — |
|
|
| (6,098 | ) |
Net income attributable to common stockholders — basic |
| $ | 42,146 |
|
| $ | 65,170 |
|
| $ | 7,101 |
|
Net income |
| $ | 42,146 |
|
| $ | 65,170 |
|
| $ | 13,199 |
|
Net income attributable to participating securities |
|
| — |
|
|
| — |
|
|
| (5,829 | ) |
Net income attributable to common stockholders — diluted |
| $ | 42,146 |
|
| $ | 65,170 |
|
| $ | 7,370 |
|
Net income per share attributable to common stockholders: (Note 11) |
|
|
|
|
|
|
|
|
|
|
|
|
Basic |
| $ | 0.38 |
|
| $ | 0.60 |
|
| $ | 0.13 |
|
Diluted |
| $ | 0.37 |
|
| $ | 0.57 |
|
| $ | 0.12 |
|
Weighted–average number of shares of common stock used in computing net income per share attributable to common stockholders: |
|
|
|
|
|
|
|
|
|
|
|
|
Basic |
|
| 111,450,443 |
|
|
| 108,833,028 |
|
|
| 55,835,265 |
|
Diluted |
|
| 113,431,850 |
|
|
| 113,364,712 |
|
|
| 60,637,584 |
|
|
|
The accompanying notes are an integral part of these consolidated financial statements.
71
CarGurus, Inc.
Consolidated Statements of Comprehensive Income
(in thousands)
|
| Year Ended December 31, |
| |||||||||
|
| 2019 |
|
| 2018 |
|
| 2017 |
| |||
Net income |
| $ | 42,146 |
|
| $ | 65,170 |
|
| $ | 13,199 |
|
Other comprehensive (loss) income: |
|
|
|
|
|
|
|
|
|
|
|
|
Foreign currency translation adjustment |
|
| (421 | ) |
|
| (157 | ) |
|
| 258 |
|
Comprehensive income |
| $ | 41,725 |
|
| $ | 65,013 |
|
| $ | 13,457 |
|
|
| Year Ended December 31, |
| |||||||||
|
| 2021 |
|
| 2020 |
|
| 2019 |
| |||
Consolidated net income |
| $ | 110,373 |
|
| $ | 77,553 |
|
| $ | 42,146 |
|
Other comprehensive income: |
|
|
|
|
|
|
|
|
| |||
Foreign currency translation adjustment |
|
| (2,283 | ) |
|
| 2,230 |
|
|
| (421 | ) |
Consolidated comprehensive income |
|
| 108,090 |
|
|
| 79,783 |
|
|
| 41,725 |
|
Comprehensive income attributable to redeemable noncontrolling |
|
| 1,129 |
|
|
| — |
|
|
| — |
|
Comprehensive income attributable to CarGurus, Inc. |
| $ | 106,961 |
|
| $ | 79,783 |
|
| $ | 41,725 |
|
The accompanying notes are an integral part of these consolidated financial statements.
72
CarGurus, Inc.
Consolidated Statements of Convertible Preferred Stock and Stockholders’ Equity (Deficit)
(in thousands, except share data)
| Series A Preferred Stock |
| Series B Preferred Stock |
| Series C Preferred Stock |
| Series D Preferred Stock |
| Series E Preferred Stock |
|
|
| Class A Common Stock |
| Class B Common Stock |
| Additional Paid–in |
| Accumulated Other Comprehensive |
| Retained Earnings (Accumulated |
| Total Stockholders’ |
| ||||||||||||||||||||||||||||||||
| Shares |
| Amount |
| Shares |
| Amount |
| Shares |
| Amount |
| Shares |
| Amount |
| Shares |
| Amount |
|
|
| Shares |
| Amount |
| Shares |
| Amount |
| Capital |
| (Loss) Income |
| Deficit) |
| Equity |
| ||||||||||||||||||
Balance at December 31, 2017 |
| 2,824,703 |
| $ | 1,483 |
|
| 2,938,486 |
| $ | 2,295 |
|
| 1,550,612 |
| $ | 1,316 |
|
| 1,673,105 |
| $ | 67,872 |
|
| 1,107,202 |
| $ | 59,732 |
|
|
|
| 14,022,132 |
| $ | 14 |
|
| 28,044,264 |
| $ | 28 |
| $ | 3,714 |
| $ | (30 | ) | $ | (71,698 | ) | $ | (67,972 | ) |
Net income |
| — |
|
| — |
|
| — |
|
| — |
|
| — |
|
| — |
|
| — |
|
| — |
|
| — |
|
| — |
|
|
|
| — |
|
| — |
|
| — |
|
| — |
|
| — |
|
| — |
|
| 13,199 |
|
| 13,199 |
|
Stock–based compensation expense |
| — |
|
| — |
|
| — |
|
| — |
|
| — |
|
| — |
|
| — |
|
| — |
|
| — |
|
| — |
|
|
|
| — |
|
| — |
|
| — |
|
| — |
|
| 5,204 |
|
| — |
|
| — |
|
| 5,204 |
|
Issuance of common stock upon exercise of stock options |
| — |
|
| — |
|
| — |
|
| — |
|
| — |
|
| — |
|
| — |
|
| — |
|
| — |
|
| — |
|
|
|
| 92,944 |
|
| — |
|
| 181,840 |
|
| — |
|
| 398 |
|
| — |
|
| — |
|
| 398 |
|
Issuance of common stock from public offering, net of offering costs |
| — |
|
| — |
|
| — |
|
| — |
|
| — |
|
| — |
|
| — |
|
| — |
|
| — |
|
| — |
|
|
|
| 3,205,000 |
|
| 3 |
|
| — |
|
| — |
|
| 43,237 |
|
| — |
|
| — |
|
| 43,240 |
|
Conversion of preferred stock |
| (2,824,703 | ) |
| (1,483 | ) |
| (2,938,486 | ) |
| (2,295 | ) |
| (1,550,612 | ) |
| (1,316 | ) |
| (1,673,105 | ) |
| (67,872 | ) |
| (1,107,202 | ) |
| (59,732 | ) |
|
|
| 60,564,678 |
|
| 61 |
|
| — |
|
| — |
|
| 132,637 |
|
| — |
|
| — |
|
| 132,698 |
|
Foreign currency translation adjustment |
| — |
|
| — |
|
| — |
|
| — |
|
| — |
|
| — |
|
| — |
|
| — |
|
| — |
|
| — |
|
|
|
| — |
|
| — |
|
| — |
|
| — |
|
| — |
|
| 258 |
|
| — |
|
| 258 |
|
Balance at December 31, 2017 |
| — |
|
| — |
|
| — |
|
| — |
|
| — |
|
| — |
|
| — |
|
| — |
|
| — |
|
| — |
|
|
|
| 77,884,754 |
|
| 78 |
|
| 28,226,104 |
|
| 28 |
|
| 185,190 |
|
| 228 |
|
| (58,499 | ) |
| 127,025 |
|
Net income |
| — |
|
| — |
|
| — |
|
| — |
|
| — |
|
| — |
|
| — |
|
| — |
|
| — |
|
| — |
|
|
|
| — |
|
| — |
|
| — |
|
| — |
|
| — |
|
| — |
|
| 65,170 |
|
| 65,170 |
|
Stock–based compensation expense |
| — |
|
| — |
|
| — |
|
| — |
|
| — |
|
| — |
|
| — |
|
| — |
|
| — |
|
| — |
|
|
|
| — |
|
| — |
|
| — |
|
| — |
|
| 21,284 |
|
| — |
|
| — |
|
| 21,284 |
|
Issuance of common stock upon exercise of stock options |
| — |
|
| — |
|
| — |
|
| — |
|
| — |
|
| — |
|
| — |
|
| — |
|
| — |
|
| — |
|
|
|
| 3,186,489 |
|
| 3 |
|
| 10,690 |
|
| — |
|
| 3,629 |
|
| — |
|
| — |
|
| 3,632 |
|
Issuance of common stock upon vesting of restricted stock units |
|
|
|
|
|
|
|
|
|
|
|
|
|
|
|
|
|
|
|
|
|
|
|
|
|
|
|
|
|
|
|
|
| 1,781,201 |
|
| 2 |
|
| — |
|
| — |
|
| (2 | ) |
| — |
|
| — |
|
| — |
|
Payment of withholding taxes on net share settlements of equity awards |
| — |
|
| — |
|
| — |
|
| — |
|
| — |
|
| — |
|
| — |
|
| — |
|
| — |
|
| — |
|
|
|
| (658,931 | ) |
| — |
|
| — |
|
| — |
|
| (25,885 | ) |
| — |
|
| — |
|
| (25,885 | ) |
Cumulative adjustment from adoption of revenue recognition standard |
|
|
|
|
|
|
|
|
|
|
|
|
|
|
|
|
|
|
|
|
|
|
|
|
|
|
|
|
|
|
|
|
| — |
|
| — |
|
| — |
|
| — |
|
| — |
|
| — |
|
| 3,042 |
|
| 3,042 |
|
Conversion of common stock |
| — |
|
| — |
|
| — |
|
| — |
|
| — |
|
| — |
|
| — |
|
| — |
|
| — |
|
| — |
|
|
|
| 7,534,710 |
|
| 7 |
|
| (7,534,710 | ) |
| (7 | ) |
| — |
|
| — |
|
| — |
|
| — |
|
Foreign currency translation adjustment |
| — |
|
| — |
|
| — |
|
| — |
|
| — |
|
| — |
|
| — |
|
| — |
|
| — |
|
| — |
|
|
|
| — |
|
| — |
|
| — |
|
| — |
|
| — |
|
| (157 | ) |
| — |
|
| (157 | ) |
Balance at December 31, 2018 |
| — |
|
| — |
|
| — |
|
| — |
|
| — |
|
| — |
|
| — |
|
| — |
|
| — |
|
| — |
|
|
|
| 89,728,223 |
|
| 90 |
|
| 20,702,084 |
|
| 21 |
|
| 184,216 |
|
| 71 |
|
| 9,713 |
|
| 194,111 |
|
Net income |
| — |
|
| — |
|
| — |
|
| — |
|
| — |
|
| — |
|
| — |
|
| — |
|
| — |
|
| — |
|
|
|
| — |
|
| — |
|
| — |
|
| — |
|
| — |
|
| — |
|
| 42,146 |
|
| 42,146 |
|
Stock–based compensation expense |
| — |
|
| — |
|
| — |
|
| — |
|
| — |
|
| — |
|
| — |
|
| — |
|
| — |
|
| — |
|
|
|
| — |
|
| — |
|
| — |
|
| — |
|
| 35,682 |
|
| — |
|
| — |
|
| 35,682 |
|
Issuance of common stock upon exercise of stock options |
| — |
|
| — |
|
| — |
|
| — |
|
| — |
|
| — |
|
| — |
|
| — |
|
| — |
|
| — |
|
|
|
| 838,928 |
|
| — |
|
| — |
|
| — |
|
| 1,807 |
|
| — |
|
| — |
|
| 1,807 |
|
Issuance of common stock upon vesting of restricted stock units |
| — |
|
| — |
|
| — |
|
| — |
|
| — |
|
| — |
|
| — |
|
| — |
|
| — |
|
| — |
|
|
|
| 1,317,736 |
|
| 1 |
|
| — |
|
| — |
|
| (1 | ) |
| — |
|
| — |
|
| — |
|
Payment of withholding taxes and option costs on net share settlement of restricted stock units and stock options |
| — |
|
| — |
|
| — |
|
| — |
|
| — |
|
| — |
|
| — |
|
| — |
|
| — |
|
| — |
|
|
|
| (452,678 | ) |
| — |
|
| — |
|
| — |
|
| (16,470 | ) |
| — |
|
| — |
|
| (16,470 | ) |
Conversion of common stock |
| — |
|
| — |
|
| — |
|
| — |
|
| — |
|
| — |
|
| — |
|
| — |
|
| — |
|
| — |
|
|
|
| 387,440 |
|
| 1 |
|
| (387,440 | ) |
| (1 | ) |
| — |
|
| — |
|
| — |
|
| — |
|
Foreign currency translation adjustment |
| — |
|
| — |
|
| — |
|
| — |
|
| — |
|
| — |
|
| — |
|
| — |
|
| — |
|
| — |
|
|
|
| — |
|
| — |
|
| — |
|
| — |
|
| — |
|
| (421 | ) |
| — |
|
| (421 | ) |
Balance at December 31, 2019 |
| — |
| $ | — |
|
| — |
| $ | — |
|
| — |
| $ | — |
|
| — |
| $ | — |
|
| — |
| $ | — |
|
|
|
| 91,819,649 |
| $ | 92 |
|
| 20,314,644 |
| $ | 20 |
| $ | 205,234 |
| $ | (350 | ) | $ | 51,859 |
| $ | 256,855 |
|
|
| Redeemable |
|
| Class A |
|
| Class B |
|
| Additional |
|
| Retained |
|
| Accumulated |
|
| Total |
| |||||||||||||||
|
| Interest |
|
| Shares |
|
| Amount |
|
| Shares |
|
| Amount |
|
| Capital |
|
| Earnings |
|
| Income (Loss) |
|
| Equity |
| |||||||||
Balance as of December 31, 2018 |
| $ | — |
|
|
| 89,728,223 |
|
| $ | 90 |
|
|
| 20,702,084 |
|
| $ | 21 |
|
| $ | 184,216 |
|
| $ | 9,713 |
|
| $ | 71 |
|
|
| 194,111 |
|
Net income |
|
| — |
|
|
| — |
|
|
| — |
|
|
| — |
|
|
| — |
|
|
| — |
|
|
| 42,146 |
|
|
| — |
|
|
| 42,146 |
|
Stock–based compensation expense |
|
| — |
|
|
| — |
|
|
| — |
|
|
| — |
|
|
| — |
|
|
| 35,682 |
|
|
| — |
|
|
| — |
|
|
| 35,682 |
|
Issuance of common stock upon exercise of stock options |
|
| — |
|
|
| 838,928 |
|
|
| — |
|
|
| — |
|
|
| — |
|
|
| 1,807 |
|
|
| — |
|
|
| — |
|
|
| 1,807 |
|
Issuance of common stock upon vesting of restricted stock units |
|
| — |
|
|
| 1,317,736 |
|
|
| 1 |
|
|
| — |
|
|
| — |
|
|
| (1 | ) |
|
| — |
|
|
| — |
|
|
| — |
|
Payment of withholding taxes on net share settlements of equity |
|
| — |
|
|
| (452,678 | ) |
|
| — |
|
|
| — |
|
|
| — |
|
|
| (16,470 | ) |
|
| — |
|
|
| — |
|
|
| (16,470 | ) |
Conversion of common stock |
|
| — |
|
|
| 387,440 |
|
|
| 1 |
|
|
| (387,440 | ) |
|
| (1 | ) |
|
| — |
|
|
| — |
|
|
| — |
|
|
| — |
|
Foreign currency translation adjustment |
|
| — |
|
|
| — |
|
|
| — |
|
|
| — |
|
|
| — |
|
|
| — |
|
|
| — |
|
|
| (421 | ) |
|
| (421 | ) |
Balance as of December 31, 2019 |
|
| — |
|
|
| 91,819,649 |
|
|
| 92 |
|
|
| 20,314,644 |
|
|
| 20 |
|
|
| 205,234 |
|
|
| 51,859 |
|
|
| (350 | ) |
|
| 256,855 |
|
Net income |
|
| — |
|
|
| — |
|
|
| — |
|
|
| — |
|
|
| — |
|
|
| — |
|
|
| 77,553 |
|
|
| — |
|
|
| 77,553 |
|
Stock–based compensation expense |
|
| — |
|
|
| — |
|
|
| — |
|
|
| — |
|
|
| — |
|
|
| 46,996 |
|
|
| — |
|
|
| — |
|
|
| 46,996 |
|
Issuance of common stock upon exercise of stock options |
|
| — |
|
|
| 352,212 |
|
|
| — |
|
|
| — |
|
|
| — |
|
|
| 1,136 |
|
|
| — |
|
|
| — |
|
|
| 1,136 |
|
Issuance of common stock upon vesting of restricted stock units |
|
| — |
|
|
| 1,347,464 |
|
|
| 1 |
|
|
| — |
|
|
| — |
|
|
| (1 | ) |
|
| — |
|
|
| — |
|
|
| — |
|
Payment of withholding taxes and option costs on net share |
|
| — |
|
|
| (447,160 | ) |
|
| — |
|
|
| — |
|
|
| — |
|
|
| (11,184 | ) |
|
| — |
|
|
| — |
|
|
| (11,184 | ) |
Conversion of common stock |
|
| — |
|
|
| 1,238,144 |
|
|
| 1 |
|
|
| (1,238,144 | ) |
|
| (1 | ) |
|
| — |
|
|
| — |
|
|
| — |
|
|
| — |
|
Foreign currency translation adjustment |
|
| — |
|
|
| — |
|
|
| — |
|
|
| — |
|
|
| — |
|
|
| — |
|
|
| — |
|
|
| 2,230 |
|
|
| 2,230 |
|
Balance as of December 31, 2020 |
|
| — |
|
|
| 94,310,309 |
|
|
| 94 |
|
|
| 19,076,500 |
|
|
| 19 |
|
|
| 242,181 |
|
|
| 129,412 |
|
|
| 1,880 |
|
|
| 373,586 |
|
Net income |
|
| 1,129 |
|
|
| — |
|
|
| — |
|
|
| — |
|
|
| — |
|
|
| — |
|
|
| 109,244 |
|
|
| — |
|
|
| 109,244 |
|
Stock–based compensation expense |
|
| — |
|
|
| — |
|
|
| — |
|
|
| — |
|
|
| — |
|
|
| 56,772 |
|
|
| — |
|
|
| — |
|
|
| 56,772 |
|
Issuance of common stock upon exercise of stock options |
|
| — |
|
|
| 222,147 |
|
|
| — |
|
|
| — |
|
|
| — |
|
|
| 663 |
|
|
| — |
|
|
| — |
|
|
| 663 |
|
Issuance of common stock upon vesting of restricted stock units |
|
| — |
|
|
| 1,575,206 |
|
|
| 2 |
|
|
| — |
|
|
| — |
|
|
| (2 | ) |
|
| — |
|
|
| — |
|
|
| — |
|
Payment of withholding taxes on net share settlements of equity |
|
| — |
|
|
| (527,237 | ) |
|
| — |
|
|
| — |
|
|
| — |
|
|
| (15,388 | ) |
|
| — |
|
|
| — |
|
|
| (15,388 | ) |
Conversion of common stock |
|
| — |
|
|
| 3,077,327 |
|
|
| 3 |
|
|
| (3,077,327 | ) |
|
| (3 | ) |
|
| — |
|
|
| — |
|
|
| — |
|
|
| — |
|
Issuance of common stock upon for acquisition |
|
| — |
|
|
| 3,115,282 |
|
|
| 3 |
|
|
| — |
|
|
| — |
|
|
| 103,642 |
|
|
| — |
|
|
| — |
|
|
| 103,645 |
|
Acquisition of a 51% interest in CarOffer, LLC |
|
| 60,982 |
|
|
| — |
|
|
| — |
|
|
| — |
|
|
| — |
|
|
| — |
|
|
| — |
|
|
| — |
|
|
| — |
|
Accretion of redeemable noncontrolling interest to redemption value |
|
| 109,398 |
|
|
| — |
|
|
| — |
|
|
| — |
|
|
| — |
|
|
| — |
|
|
| (109,398 | ) |
|
| — |
|
|
| (109,398 | ) |
Distributions to redeemable noncontrolling interest holders |
|
| (8,701 | ) |
|
| — |
|
|
| — |
|
|
| — |
|
|
| — |
|
|
| — |
|
|
| — |
|
|
| — |
|
|
| — |
|
Foreign currency translation adjustment |
|
| — |
|
|
| — |
|
|
| — |
|
|
| — |
|
|
| — |
|
|
| — |
|
|
| — |
|
|
| (2,283 | ) |
|
| (2,283 | ) |
Balance as of December 31, 2021 |
| $ | 162,808 |
|
|
| 101,773,034 |
|
| $ | 102 |
|
|
| 15,999,173 |
|
| $ | 16 |
|
| $ | 387,868 |
|
| $ | 129,258 |
|
| $ | (403 | ) |
| $ | 516,841 |
|
The accompanying notes are an integral part of these consolidated financial statements.
73
CarGurus, Inc.
Consolidated Statements of Cash Flows
(in thousands)
|
| Year Ended December 31, |
| |||||||||
|
| 2021 |
|
| 2020 |
|
| 2019 |
| |||
Operating Activities |
|
|
|
|
|
|
|
|
| |||
Consolidated net income |
| $ | 110,373 |
|
| $ | 77,553 |
|
| $ | 42,146 |
|
Adjustments to reconcile consolidated net income to net cash provided |
|
|
|
|
|
|
|
|
| |||
Depreciation and amortization |
|
| 40,476 |
|
|
| 10,191 |
|
|
| 7,817 |
|
Currency (gain) loss on foreign denominated transactions |
|
| (70 | ) |
|
| 23 |
|
|
| (690 | ) |
Deferred taxes |
|
| 6,163 |
|
|
| 22,235 |
|
|
| (3,734 | ) |
Provision for doubtful accounts |
|
| 999 |
|
|
| 1,930 |
|
|
| 1,091 |
|
Stock-based compensation expense |
|
| 53,525 |
|
|
| 45,090 |
|
|
| 34,301 |
|
Amortization of deferred contract costs |
|
| 12,653 |
|
|
| 11,605 |
|
|
| 8,416 |
|
Impairment of long-lived assets |
|
| 3,128 |
|
|
| 1,151 |
|
|
| — |
|
Changes in operating assets and liabilities: |
|
|
|
|
|
|
|
|
| |||
Accounts receivable, net |
|
| (174,771 | ) |
|
| 3,889 |
|
|
| (9,608 | ) |
Inventory |
|
| (17,318 | ) |
|
| — |
|
|
| — |
|
Prepaid expenses, prepaid income taxes, and other assets |
|
| (5,068 | ) |
|
| 3,484 |
|
|
| (378 | ) |
Deferred contract costs |
|
| (7,714 | ) |
|
| (11,378 | ) |
|
| (15,979 | ) |
Accounts payable |
|
| 35,397 |
|
|
| (15,077 | ) |
|
| 4,268 |
|
Accrued expenses, accrued income taxes, and other liabilities |
|
| 35,817 |
|
|
| 7,450 |
|
|
| 2,760 |
|
Deferred revenue |
|
| 3,661 |
|
|
| (861 | ) |
|
| 1,174 |
|
Lease obligations |
|
| 1,041 |
|
|
| (542 | ) |
|
| (1,468 | ) |
Net cash provided by operating activities |
|
| 98,292 |
|
|
| 156,743 |
|
|
| 70,116 |
|
Investing Activities |
|
|
|
|
|
|
|
|
| |||
Purchases of property and equipment |
|
| (7,713 | ) |
|
| (2,952 | ) |
|
| (11,205 | ) |
Capitalization of website development costs |
|
| (6,163 | ) |
|
| (4,579 | ) |
|
| (3,021 | ) |
Cash paid for acquisitions, net of cash acquired |
|
| (64,273 | ) |
|
| (21,056 | ) |
|
| (19,139 | ) |
Investments in certificates of deposit |
|
| (120,000 | ) |
|
| (100,000 | ) |
|
| (177,808 | ) |
Maturities of certificates of deposit |
|
| 130,000 |
|
|
| 111,692 |
|
|
| 188,916 |
|
Net cash used in investing activities |
|
| (68,149 | ) |
|
| (16,895 | ) |
|
| (22,257 | ) |
Financing Activities |
|
|
|
|
|
|
|
|
| |||
Proceeds from exercise of stock options |
|
| 663 |
|
|
| 1,136 |
|
|
| 1,807 |
|
Payment of finance lease obligations |
|
| (39 | ) |
|
| (37 | ) |
|
| (30 | ) |
Payment of withholding taxes and option costs on net share settlement of |
|
| (15,388 | ) |
|
| (11,184 | ) |
|
| (16,470 | ) |
Repayment of line of credit |
|
| (14,250 | ) |
|
| — |
|
|
| — |
|
Payments received in advance from third-party payment processor |
|
| 46,822 |
|
|
| — |
|
|
| — |
|
Net cash provided by (used in) financing activities |
|
| 17,808 |
|
|
| (10,085 | ) |
|
| (14,693 | ) |
Impact of foreign currency on cash, cash equivalents, and restricted cash |
|
| (597 | ) |
|
| 440 |
|
|
| (1 | ) |
Net increase in cash, cash equivalents, and restricted cash |
|
| 47,354 |
|
|
| 130,203 |
|
|
| 33,165 |
|
Cash, cash equivalents, and restricted cash at beginning of period |
|
| 200,926 |
|
|
| 70,723 |
|
|
| 37,558 |
|
Cash, cash equivalents, and restricted cash at end of period |
| $ | 248,280 |
|
| $ | 200,926 |
|
| $ | 70,723 |
|
Supplemental cash disclosure of cash flow information: |
|
|
|
|
|
|
|
|
| |||
Cash paid for income taxes |
| $ | 27,520 |
|
| $ | 2,831 |
|
| $ | 300 |
|
Cash paid for operating lease liabilities |
| $ | 16,168 |
|
| $ | 14,941 |
|
|
| 10,906 |
|
Supplemental noncash disclosure of cash flow information: |
|
|
|
|
|
|
|
|
| |||
Unpaid purchases of property and equipment, capitalized website |
| $ | 478 |
|
| $ | 136 |
|
| $ | 647 |
|
Capitalized stock-based compensation expense in website development and |
| $ | 3,247 |
|
| $ | 1,906 |
|
| $ | 1,381 |
|
Obtaining a right-of-use asset in exchange for a finance lease liability |
| $ | 664 |
|
| $ | — |
|
| $ | — |
|
Obtaining a right-of-use asset in exchange for an operating lease liability |
| $ | 12,336 |
|
| $ | — |
|
| $ | — |
|
Issuance of stock for acquisition |
| $ | 103,645 |
|
| $ | — |
|
| $ | — |
|
Accretion of redeemable noncontrolling interest to redemption value |
| $ | 109,398 |
|
| $ | — |
|
| $ | — |
|
Distributions to redeemable noncontrolling interest holders |
| $ | 8,701 |
|
| $ | — |
|
| $ | — |
|
|
| Year Ended December 31, |
| |||||||||
|
| 2019 |
|
| 2018 |
|
| 2017 |
| |||
Operating Activities |
|
|
|
|
|
|
|
|
|
|
|
|
Net income |
| $ | 42,146 |
|
| $ | 65,170 |
|
| $ | 13,199 |
|
Adjustments to reconcile net income to net cash provided by operating activities: |
|
|
|
|
|
|
|
|
|
|
|
|
Depreciation and amortization |
|
| 7,817 |
|
|
| 5,029 |
|
|
| 3,795 |
|
Currency (gain) loss on foreign denominated transactions |
|
| (690 | ) |
|
| (190 | ) |
|
| 128 |
|
Deferred taxes |
|
| (3,734 | ) |
|
| (39,040 | ) |
|
| (1,117 | ) |
Provision for doubtful accounts |
|
| 1,091 |
|
|
| 1,680 |
|
|
| 1,117 |
|
Stock–based compensation expense |
|
| 34,301 |
|
|
| 20,794 |
|
|
| 5,028 |
|
Amortization of deferred contract costs |
|
| 8,416 |
|
|
| 3,689 |
|
|
| — |
|
Changes in operating assets and liabilities: |
|
|
|
|
|
|
|
|
|
|
|
|
Accounts receivable, net |
|
| (9,608 | ) |
|
| (1,911 | ) |
|
| (7,039 | ) |
Prepaid expenses, prepaid income taxes, and other assets |
|
| (378 | ) |
|
| (11,753 | ) |
|
| (2,287 | ) |
Deferred contracts costs |
|
| (15,979 | ) |
|
| (12,987 | ) |
|
| — |
|
Accounts payable |
|
| 4,268 |
|
|
| 9,345 |
|
|
| 6,244 |
|
Accrued expenses, accrued income taxes and other current liabilities |
|
| 2,151 |
|
|
| 2,695 |
|
|
| 5,191 |
|
Deferred revenue |
|
| 1,174 |
|
|
| 4,508 |
|
|
| 962 |
|
Deferred rent |
|
| — |
|
|
| 4,289 |
|
|
| 227 |
|
Lease obligations |
|
| (1,468 | ) |
|
| — |
|
|
| — |
|
Other non–current liabilities |
|
| 609 |
|
|
| 405 |
|
|
| 243 |
|
Net cash provided by operating activities |
|
| 70,116 |
|
|
| 51,723 |
|
|
| 25,691 |
|
Investing Activities |
|
|
|
|
|
|
|
|
|
|
|
|
Purchases of property and equipment |
|
| (11,205 | ) |
|
| (5,956 | ) |
|
| (5,157 | ) |
Capitalization of website development costs |
|
| (3,021 | ) |
|
| (1,522 | ) |
|
| (2,215 | ) |
Cash paid for acquisition |
|
| (19,139 | ) |
|
| — |
|
|
| — |
|
Investments in certificates of deposit |
|
| (177,808 | ) |
|
| (212,800 | ) |
|
| (50,000 | ) |
Maturities of certificates of deposit |
|
| 188,916 |
|
|
| 140,000 |
|
|
| 44,774 |
|
Net cash used in investing activities |
|
| (22,257 | ) |
|
| (80,278 | ) |
|
| (12,598 | ) |
Financing Activities |
|
|
|
|
|
|
|
|
|
|
|
|
Initial public offering proceeds |
|
| — |
|
|
| — |
|
|
| 47,690 |
|
Payment of initial public offering costs |
|
| — |
|
|
| (1,142 | ) |
|
| (3,308 | ) |
Proceeds from exercise of stock options |
|
| 1,807 |
|
|
| 3,632 |
|
|
| 398 |
|
Financing cash flows from finance leases |
|
| (30 | ) |
|
| — |
|
|
| — |
|
Payment of withholding taxes and option costs on net share settlement of restricted stock units and stock options |
|
| (16,470 | ) |
|
| (25,885 | ) |
|
| — |
|
Net cash (used in) provided by financing activities |
|
| (14,693 | ) |
|
| (23,395 | ) |
|
| 44,780 |
|
Impact of foreign currency on cash, cash equivalents, and restricted cash |
|
| (1 | ) |
|
| (44 | ) |
|
| 159 |
|
Net increase (decrease) in cash, cash equivalents, and restricted cash |
|
| 33,165 |
|
|
| (51,994 | ) |
|
| 58,032 |
|
Cash, cash equivalents, and restricted cash at beginning of period |
|
| 37,558 |
|
|
| 89,552 |
|
|
| 31,520 |
|
Cash, cash equivalents, and restricted cash at end of period |
| $ | 70,723 |
|
| $ | 37,558 |
|
| $ | 89,552 |
|
Supplemental disclosure of cash flow information: |
|
|
|
|
|
|
|
|
|
|
|
|
Cash paid for income taxes |
| $ | 300 |
|
| $ | 2,308 |
|
| $ | 4,393 |
|
Unpaid purchases of property and equipment |
| $ | 647 |
|
| $ | 5,287 |
|
| $ | 510 |
|
Unpaid initial public offering costs |
| $ | — |
|
| $ | — |
|
| $ | 1,142 |
|
Capitalized stock-based compensation expense in website development and internal-use software costs |
| $ | 1,381 |
|
| $ | 490 |
|
| $ | 176 |
|
Cash paid for operating lease liabilities |
| $ | 10,906 |
|
|
| — |
|
|
| — |
|
The accompanying notes are an integral part of these consolidated financial statements.
74
��
CarGurus, Inc.
Notes to Consolidated Financial Statements
(dollars in thousands, except share and per share data, unless otherwise noted)
1. Organization and Business Description
CarGurus, Inc. (the “Company”), is a global,multinational, online automotive platform for buying and selling vehicles that is building upon its industry-leading listings marketplace connecting buyerswith both digital retail solutions and sellers of newthe CarOffer online wholesale platform. The CarGurus marketplace gives consumers the confidence to purchase or sell a vehicle either online or in-person, and used cars. Usingit gives dealerships the power to accurately price, effectively market, instantly acquire and quickly sell vehicles, all with a nationwide reach. The Company uses proprietary technology, search algorithms and innovative data analytics to bring trust, transparency and competitive pricing to the Company provides information and analysis that create a differentiated automotive search experience for consumers. The Company’s marketplace empowers users worldwide with unbiased third-party validation on pricing and dealer reputation, as well as other useful information that aids them in finding “Great Deals from Top-Rated Dealers.”shopping experience.
The Company is headquartered in Cambridge, Massachusetts and was incorporated in the State of Delaware on June 26, 2015. 2015.
The Company operates principally in the United States. In the United States, it also operates as independent brands the Autolist online marketplace, which it wholly owns, and the CarOffer, LLC (“CarOffer”) digital wholesale marketplace, in which it has also launcheda 51% interest. In addition to the United States, the Company operates online marketplaces under the CarGurus brand in Canada and the United Kingdom. In the United Kingdom, it also operates as an independent brand the PistonHeads online marketplace, which it wholly owns. The Company also operated online marketplaces in Germany, Italy, and Spain. Spain until it ceased the operations of each of these marketplaces in the second quarter of 2020.
The Company has subsidiaries in the United States, Canada, Ireland, and the United Kingdom. In theAdditionally, it has 2 reportable segments, United Kingdom, the Company also operates the PistonHeads online marketplace as an independent brand.States and International. See Note 13 and Note 15 of these consolidated financial statements for further segment reporting and geographical information.
On October 16, 2017, the Company completed its initial public offering (“IPO”), in which the Company issued and sold 3,205,000 shares of its Class A common stock, including the full exercise by the underwriters of their option to purchase 705,000 shares of Class A common stock, at a public offering price of $16.00 per share for aggregate gross proceeds of $51.3 million. The Company received $43.2 million in net proceeds after deducting $3.6 million of underwriting discounts and commissions and $4.5 million in offering costs. In addition to shares of Class A common stock issued and sold by the Company, certain selling stockholders sold an aggregate of 7,605,000 shares of Class A common stock, including the full exercise by the underwriters of their option to purchase 705,000 shares of Class A common stock, as part of the IPO. Upon the closing of the IPO, all of the outstanding shares of convertible preferred stock automatically converted into 20,188,226 shares of Class A common stock and 40,376,452 shares of Class B common stock. The 40,376,452 shares of Class B common stock subsequently converted into 40,376,452 shares of Class A common stock resulting in a total conversion of all outstanding shares of convertible preferred stock into 60,564,678 shares of Class A common stock. Subsequent to the closing of the IPO, there were 0 shares of convertible preferred stock outstanding.
The Company is subject to a number of risks and uncertainties common to companies in its and similar industries and stages of development including, but not limited to, rapid technological changes, competition from substitute products and services from larger companies, management of international activities, protection of proprietary rights, patent litigation, and dependence on key individuals.
2. Summary of Significant Accounting Policies
The accompanying consolidated financial statements reflect the application of certain significant accounting policies as described below and elsewhere in these notes to the consolidated financial statements. The Company believes that a significant accounting policy is one that is both important to the portrayal of the Company’s financial condition and results, and requires management’s most difficult, subjective, or complex judgments, often as the result of the need to make estimates about the effect of matters that are inherently uncertain.
Basis of Presentation
The accompanying consolidated financial statements have been prepared in conformity with accounting principles generally accepted in the United States of America (“GAAP”). Any reference in these notes to applicable guidance is meant to refer to the authoritative U.S. generally accepted accounting principlesGAAP as found in the Accounting Standards Codification (“ASC”) and Accounting Standards Update (“ASU”) of the Financial Accounting Standards Board (“FASB”).
Due toWhile the adoption of ASC Topic 606, Revenue from Contracts with Customers (“ASC 606”), which is discussed furtherCompany disclosed total revenue in this Note 2, the consolidated balance sheets andincome statements in the consolidated statements of operations, comprehensive income, convertible preferred stock and stockholders’ equity (deficit), and cash flowsCompany's Annual Report on Form 10-K for the years ended December 31, 2020 and 2019, filed with the SEC on February 12, 2021 and 2018 are not comparativeFebruary 14, 2020, respectively, the accompanying consolidated income statements for the years ended December 2020 and 2019 present revenues disaggregated into marketplace, wholesale, and product revenues to prior years.
Dueconform to the adoptioncurrent year presentation, as a result of ASC Topic 842, the acquisition of a Leases51 (“ASC 842”), which is discussed further% interest in this Note 2,CarOffer.
While the Company disclosed other non-current liabilities separately in the consolidated balance sheetstatements of cash flows in the Company's Annual Report on Form 10-K for the year ended December 31, 2019, isfiled with the SEC on February 14, 2020, the accompanying consolidated statements of cash flows for the year ended December 31, 2019 present other non-current liabilities with accrued expenses, accrued income taxes and other current liabilities to conform to the current year presentation, as other non-current liabilities did not comparativemeet the threshold for separate disclosure.
75
While the Company disclosed impairment of long-lived assets within depreciation and amortization in the consolidated statements of cash flows in the Company's Annual Report on Form 10-K for the year ended December 31, 2020 filed with the SEC on February 12, 2021, the accompanying consolidated statements of cash flows for the year ended December 31, 2020 present impairment of long-lived assets separately to prior years.conform to the current year presentation, as impairments of long-lived assets are material in the current year.
Principles of Consolidation
The accompanying consolidated financial statements include the accounts of the Company and its subsidiaries. All intercompany balances and transactions have been eliminated in consolidation.
Subsequent Event Considerations
The Company considers events or transactions that occur after the balance sheet date but prior to the issuance of the financial statements to provide additional evidence for certain estimates or to identify matters that require additional disclosure. Subsequent events have been evaluated as required. The Company has evaluated all subsequent events and determined that there are no material recognized or unrecognized subsequent events requiring disclosure, other than those disclosed in Note 1615 of these consolidated financial statements.
Use of Estimates
The preparation of the consolidated financial statements in conformity with GAAP requires management to make estimates and assumptions that affect the reported amounts of assets and liabilities, disclosuresand the disclosure of contingent assets and liabilities at the date of the financial statements, and the reported amounts of revenue and expenses during the reporting period.
Significant estimates relied upon in preparing these consolidated financial statements include revenue recognition and sales allowances, variable consideration, the valuation of goodwill and intangible assets, the expensing and capitalization of product, technology, and development costs for website development and internal‑use software, and the recoverability of the Company’s net deferred tax assets and related valuation allowance.
Although the Company regularly assesses these estimates, actual results could differ materially from these estimates. Changes in estimates are recorded in the period in which they become known. The Company bases its estimates on historical experience and various other assumptions that it believes to be reasonable under the circumstances. Actual results may differ from management’s estimates if these results differ from historical experience, or other assumptions do not turn out to be substantially accurate, even if such assumptions are reasonable when made.
Revenue Recognition
The Company derives its revenue from two primary sources: (1) marketplace subscription revenue, which consists primarily of Listings, and Dealer Display subscriptions, and (2) advertising and other revenue, which consists primarily of display advertising revenue from auto manufacturers and other auto‑related brand advertisers as well as partnerships with financing services companies.
Marketplace Subscription Revenue
The Company offers multiple types of marketplace Listings packages to its dealers through its platform: Restricted Listings (formerly referred to as Basic Listings), which is free; and various levels of Listings packages, which each require a paid subscription under a monthly, quarterly, semiannual, or annual subscription basis. Contractual subscriptions for customers generally auto-renew on a monthly basis and Changes in estimates are cancellable by dealers with 30 days’ advance notice at the end of the committed term. The Company also offers all dealers on the its platform access to a Dealer Dashboard, which includes a performance summary, Dealer Insights tool, and user review management platform. Dealers subscribing to a paid Listings package also have access to the Pricing Tool and Market Analysis tool. The Pricing Tool and Market Analysis tool are available only to paying dealers. Subscription pricing is determined based on a dealer’s inventory size, region, and the Company’s assessment of the connections and Return on Investment (“ROI”) the platform will provide them.
Customers do not have the right to take possession of the Company’s software.
In addition to listing inventoryrecognized in the Company’s marketplace and providing access to the Dealer Dashboard, the Company offers dealers subscribing to one of its Enhanced, Featured, or Featured Priority Listings packages other subscription advertising and customer acquisition products, including Dealer Display, pursuant to which dealers can buy display advertising that appears in the Company’s marketplace, and on other sites on the internet, and for which such advertisements can be targeted by the user’s geography, search history, CarGurus website activity (including showing users relevant vehicles from a dealer’s inventory that they have not yet discovered on the Company’s marketplace), and a number of other targeting factors, allowing dealers to increase their visibility with in-market consumers and drive qualified traffic for dealers.
Payment is typically due on first day of each calendar month and is recorded as accounts receivable or short-term deferred revenue when payment is received in advance of services being delivered to the customers.
Advertising and Other Revenue
Advertising and other revenue consists primarily of non-dealer display advertising revenue from auto manufacturers and other auto-related brand advertisers sold on a cost per thousand impressions (“CPM”) basis. An impression is an advertisement loaded on a web page. In addition to advertising sold on a CPM basis, the Company also has advertising sold on a cost per click basis. Auto manufacturers and other brand advertisers can execute advertising campaigns that are targeted across a wide variety of parameters, including demographic groups, behavioral characteristics, specific auto brands, categories such as Certified Pre-Owned, and segments such as hybrid vehicles. The Company does not provide minimum impression guarantees or other types of minimum guarantees in its contracts with customers. Pricing is primarily based on advertisement size and position on the Company’s websites and mobile applications, and fees are billed monthly in arrears. Unbilled accounts receivables relate to services rendered in the current period, but generally not invoiced until the subsequent period.
The Company sells advertising directly to auto manufacturers and other auto related brand advertisers, as well as indirectly through revenue sharing arrangements with advertising exchange partners. Company-sold advertising is not subject to revenue sharing arrangements. Company-sold advertising revenue is recognized based on the gross amount charged to the advertiser. Partner-sold advertising revenue is recognized based on the net amount of revenue received from the content partners.
Revenue from advertising sold directly by the Company is recorded on a gross basis because the Company is the principal in the arrangement, controls the ad placement and timing of the campaign, and establishes the selling price. The Company enters into contractual arrangements directly with advertisers and is directly responsible for the fulfillment of the contractual terms including any remedy for issues with such fulfillment.
Advertising revenue subject to revenue sharing agreements between the Company and advertising exchange partners is recognized based on the net amount of revenue received from the partner. The advertising partner is responsible for fulfillment, including the acceptability of the services delivered. In partner-sold advertising arrangements, the advertising partner has a direct contractual relationship with the advertiser. There is no contractual relationship between the Company and the advertiser for partner-sold transactions. When an advertising exchange partner sells advertisements, the partner is responsible for fulfilling the advertisements, and accordingly, the Company has determined the advertising partner is the principal in the arrangement. Additionally, for auction-based partner agreements, the Company has latitude in establishing the floor price, but the final price established by the exchange server is at market rates.
Customers are billed monthly in arrears and payment terms are generally thirty to sixty days from the date invoiced.
Advertising and other revenue also includes revenue from partnerships with certain financing services companies pursuant to which the Company enables eligible consumers on the Company’s United States website to pre-qualify for financing on cars from dealerships that offer financing through such companies. The Company’s revenues from these financing partnerships are based on a funded-loan basis.
Prior to adoption of ASC 606
The Company recognizes revenue when all of the following conditions are satisfied: (1) there is persuasive evidence of an arrangement; (2) the service has been provided to the customer; (3) the collection of fees is reasonably assured; and (4) the amount of fees to be paid by the customer is fixed or determinable.
The Company recognizes marketplace subscription revenue on a monthly basis as revenue is earned and advertising and other revenue as impressions are delivered. Revenue is presented net of any taxes collected from customers.
The Company assesses arrangements with multiple deliverables under ASU No. 2009‑13, Revenue Recognition (Topic 605), Multiple‑Deliverable Revenue Arrangements — a Consensus of the FASB Emerging Issues Task Force. Pursuant to ASU 2009‑13, in order to treat deliverables in a multiple‑element arrangement as separate units of accounting, the deliverables must have stand‑alone value upon delivery. If the deliverables have stand‑alone value upon delivery, the Company accounts for each deliverable separately. The Company has concluded that each element in the arrangement has stand‑alone value as the individual services can be sold separately. In addition, there is no right of refund once a service has been delivered. Therefore, the Company has concluded that each element of the arrangement is a separate unit of accounting. While these arrangements are considered multiple element‑arrangements, the recognition of the units of accounting follow a consistent ratable recognition given the pattern over which services are provided.
The Company establishes sales allowances at the time of revenue recognition based on its history of adjustments and credits provided to its customers. Sales allowances relate primarily to credits issued for service interruption. In assessing the adequacy of the sales allowance, the Company evaluates its history of adjustments and credits made through the date of the issuance of the financial statements. Estimated sales adjustments and credits and ultimate losses may vary from actual results which could be material to the financial statements; however, to date, actual sales allowances have been materially consistent with the Company’s estimates. Sales allowances are recorded as a reduction to revenue in the consolidated statements of operations.
Following adoption of ASC 606
In May 2014, the FASB issued ASU No. 2014-09, Revenue from Contracts with Customers (Topic 606), which modifies how all entities recognize revenue, and consolidates revenue recognition guidance into one ASC Topic (ASC Topic 606, Revenue from Contracts with Customers) (“ASC 606”). Since the Company ceased to be an emerging growth company as of December 31, 2018, the Company adopted the standard during the fourth quarter of 2018 and applied the modified retrospective method of adoption with a cumulative catch-up adjustment to the opening balance of retained earnings at January 1, 2018. Under this method, the Company applied the revised guidance for the year of adoption and applied ASC Topic 605, Revenue Recognition (“ASC 605”), in the prior years. As a result, the Company applied ASC 606 only to contracts that were not yet completed as of January 1, 2018. The Company recognized a cumulative catch-up adjustment to the opening balance of retained earnings at the effective date for contracts that still required performance by the Company at January 1, 2018. For contracts that were modified before the effective date, the Company exercised the use of the practical expedient and reflected the aggregate effect of all modifications when identifying performance obligations, determining the transaction price and allocating transaction price, which did not have a material effect on the adjustment to retained earnings.
ASC 606 outlines a comprehensive five-step revenue recognition model based on the principle that an entity should recognize revenue to depict the transfer of promised goods or services to customers in an amount that reflects the consideration to which the entity expects to be entitled in exchange for those goods or services. To achieve this core principle, the Company applies the following five steps:
|
|
|
|
|
|
|
|
|
|
Disaggregation of Revenue
The following table summarizes revenue from contracts with customers by revenue source for the years ended December 31, 2019, 2018 and 2017.
|
| 2019 |
|
| 2018 |
|
| 2017 |
| |||
Revenue by Revenue Stream |
|
|
|
|
|
|
|
|
|
|
|
|
Marketplace subscription revenue |
| $ | 526,043 |
|
| $ | 405,780 |
|
| $ | 282,664 |
|
Advertising and other revenue |
|
| 62,873 |
|
|
| 48,306 |
|
|
| 34,197 |
|
Total |
| $ | 588,916 |
|
| $ | 454,086 |
|
| $ | 316,861 |
|
The Company provides disaggregation of revenue based on the marketplace subscription versus advertising and other revenue classification in the table above and based on geographic region (see Note 13) as it believes these categories best depict how the nature, amount, timing and uncertainty of revenue and cash flows are affected by economic factors.
Marketplace Subscription Revenue
For dealer listings, the Company provides a single similar service each day for a period of time. Each time increment (i.e. day), rather than the underlying activities, is distinct and substantially the same and therefore the performance obligation of the Company is to provide a series of daily activities over the contract term. Similar to the dealer listings, the dealer display advertising is considered a promise to provide a single similar service each day. Each time increment is distinct and substantially the same and therefore the performance obligation of the Company is to provide a series of daily activities over the contract term.
Total consideration for marketplace subscription revenue is stated within the contracts. There are no contractual cash refund rights, but credits may be issued to a customer at the sole discretion of the Company. At an individual contract level, there is also no variable consideration, such as sales allowance, that needs to be included in the transaction price. However, at a portfolio level, the Company recognizes that there are times when there is a customer satisfaction issue or other circumstance that will lead to a credit. Due to the known possibility of future credits, a monthly sales allowance review is performed to defer revenue at a portfolio level for such future adjustments in the period of incurrence. The Company establishes sales allowances at the time of revenue recognition based on its history of adjustments and credits provided to its customers. In assessing the adequacy of the sales allowance, the Company evaluates its history of adjustments and credits made through the date of the issuance of the financial statements. Estimated sales adjustments, credits and losses may vary from actual results which could lead to material adjustments to the financial statements. To date, actual sales allowances have been materially consistent with the Company’s estimates. Sales allowances are recorded as a reduction to revenue in the consolidated statements of operations.
Performance obligations are satisfied over time as the customer simultaneously receives and consumes the benefit of the service. Revenue is recognized ratably over the subscription period beginning on the date the Company starts providing services to the customer under the contract. Revenue is presented net of any taxes collected from customers.
Advertising and Other Revenue
For advertising revenue, the performance obligation is to publish the agreed upon campaign on the Company’s websites and load the related impressions.
Advertising contracts state the transaction price within the agreement with payment being based on the number of clicks or impressions delivered on the Company’s websites. Total consideration is based on output and deemed variable consideration constrained by an agreed upon delivery schedule. Additionally, there are generally no contractual cash refund rights. Certain contracts do contain the right for credits in situations in which impressions are not displayed in compliance with contractual specifications. At an individual contract level, the Company may give a credit for a customer satisfaction issue or other circumstance. Due to the known possibility of future credits, a monthly review is performed to defer revenue at an individual contract level for such future adjustments in the period of incurrence.
As consideration is driven by the number of impressions delivered on the CarGurus websites, the consideration for each period is allocated to the period in which the service was rendered.
Performance obligations for company-sold advertising revenue and partner-sold advertising revenue are satisfied over time as impressions are delivered. Revenue is recognized based on the total number of impressions delivered within the specified period. Revenue from advertising sold directly by the Company is recognized based on the gross amount charged to the advertiser and advertising revenue sold by partners is recognized based on the net amount of revenue received from the content partners. Revenue is presented net of any taxes collected from customers. they become known.
Other revenue includes revenue from contracts for whichCritical estimates relied upon in preparing the performance obligation is a seriesconsolidated financial statements include the determination of distinct services with the same level of effort daily. For these contracts, the Company estimates the value of thesales allowance and variable consideration in determining the transaction price and allocates it to the performance obligation. Revenue is estimated and recognized on a ratable basis over the contractual term. The Company reassesses the estimate of variable consideration at each reporting period.
Contracts with Multiple Performance Obligations
The Company periodically enters into arrangements that include Listings and Dealer Display within marketplace subscription revenue. These contracts include multiple promises that the Company evaluates to determine if the promises are separate performance obligations. Performance obligations are identified based on services to be transferred to a customer that are distinct within the context of the contractual terms. Once the performance obligations have been identified, the Company determines the transaction price, which includes estimating the amount of variable consideration to be included in the transaction price, if any. If required, the transaction price is allocated to each performance obligation in the contract based on a relative standalone selling price (“SSP”) method as the performance obligation is being satisfied. For the Company’s arrangements that include Listingsrevenue recognition, allowance for doubtful accounts, the expensing and Dealer Display,capitalization of product, technology, and development costs for website development and internal‑use software, the performance obligations were satisfied over a consistent periodvaluation and recoverability of timegoodwill, intangible assets and thereforeother long-lived assets, the allocations did not impactvaluation of redeemable noncontrolling interest, the revenue recognized.
Costs to Obtain a Contract
Commissions paid to sales representatives and payroll taxes are considered costs to obtain a contract. Under ASC 606, the costs to obtain a contract require capitalization and amortizationrecoverability of those costs over the period of benefit. Although the guidance specifies the accounting for an individual contract with a customer, as a practical expedient, the Company has opted to apply the guidance to a portfolio of contracts with similar characteristics. The Company has opted to apply another practical expedient to immediately expense the incremental cost of obtaining a contract when the underlying related asset would have been amortized over one year or less. As such, the Company applied this practical expedient to advertising contracts as the term is one year or less and these contracts do not renew automatically. The practical expedient is not applicable to marketplace subscription contracts as the period of benefit including renewals is anticipated to be greater than one year as commissions paid on contract renewals are not commensurate with the commissions paid on the initial contract. The assets are periodically assessed for impairment.
For marketplace subscription customers, the commissions paid on contracts with new customers, in addition to any commission amount related to incremental sales, are capitalized and amortized over the estimated benefit period of the customer relationship taking into account factors such as peer estimates of technology lives and customer lives as well as the Company's own historical data. Commissions paid that are not directly related to obtaining a new contract are expensed as incurred.
Additionally, the Company allocates employer payroll tax expense to the commission expense in proportion to the overall payroll taxes paid during the respective period. As such, capitalized payroll taxes are amortized in the same manner as the underlying capitalized commissions.
The assets recognized for costs to obtain a contract were $3,207, $12,505 and $20,058 as of January 1, 2018, December 31, 2018 and December 31, 2019, respectively. Amortization expense recognized during the years ended December 31, 2019 and 2018 related to costs to obtain a contract was $8,416 and $3,689, respectively.
Financial Statement Impact of Adopting ASC 606
The cumulative effect of applying the new guidance to all contracts with customers that were not completed as of January 1, 2018 was recorded as an adjustment to accumulated deficit as of the adoption date. As a result of applying the modified retrospective method to adopt the new revenue guidance, the following adjustments were made on the consolidated balance sheet as of January 1, 2018.
|
| As Reported |
|
| Adjustments |
|
| As Adjusted |
| |||||||
|
| December 31, 2017 |
|
| Marketplace Subscription Revenue |
|
| Costs to Obtain a Contract |
|
| January 1, 2018 |
| ||||
Assets |
|
|
|
|
|
|
|
|
|
|
|
|
|
|
|
|
Current assets: |
|
|
|
|
|
|
|
|
|
|
|
|
|
|
|
|
Cash and cash equivalents |
| $ | 87,709 |
|
|
|
|
|
|
|
|
|
| $ | 87,709 |
|
Investments |
|
| 50,000 |
|
|
|
|
|
|
|
|
|
|
| 50,000 |
|
Accounts receivable, net |
|
| 12,577 |
|
|
| 813 |
|
|
|
|
|
|
| 13,390 |
|
Prepaid expenses and prepaid income taxes |
|
| 5,313 |
|
|
|
|
|
|
|
|
|
|
| 5,313 |
|
Deferred contract costs |
|
| — |
|
|
|
|
|
|
| 1,424 |
|
|
| 1,424 |
|
Other current assets |
|
| 1,605 |
|
|
|
|
|
|
|
|
|
|
| 1,605 |
|
Restricted cash |
|
| — |
|
|
|
|
|
|
|
|
|
|
| — |
|
Total current assets |
|
| 157,204 |
|
|
| 813 |
|
|
| 1,424 |
|
|
| 159,441 |
|
Property and equipment, net |
|
| 16,563 |
|
|
|
|
|
|
|
|
|
|
| 16,563 |
|
Restricted cash |
|
| 1,843 |
|
|
|
|
|
|
|
|
|
|
| 1,843 |
|
Deferred tax assets |
|
| 825 |
|
|
| (190 | ) |
|
| (635 | ) |
|
| — |
|
Deferred contract costs, net of current portion |
|
| — |
|
|
|
|
|
|
| 1,783 |
|
|
| 1,783 |
|
Other long–term assets |
|
| 159 |
|
|
|
|
|
|
|
|
|
|
| 159 |
|
Total assets |
| $ | 176,594 |
|
| $ | 623 |
|
| $ | 2,572 |
|
| $ | 179,789 |
|
Liabilities and stockholders’ equity |
|
|
|
|
|
|
|
|
|
|
|
|
|
|
|
|
Current liabilities: |
|
|
|
|
|
|
|
|
|
|
|
|
|
|
|
|
Accounts payable |
| $ | 23,908 |
|
|
|
|
|
|
|
|
|
| $ | 23,908 |
|
Accrued expenses, accrued income taxes and other current liabilities |
|
| 13,588 |
|
|
|
|
|
|
|
|
|
|
| 13,588 |
|
Deferred revenue |
|
| 4,305 |
|
|
|
|
|
|
|
|
|
|
| 4,305 |
|
Deferred tax liabilities |
|
| — |
|
|
|
|
|
|
| 153 |
|
|
| 153 |
|
Deferred rent |
|
| 1,165 |
|
|
|
|
|
|
|
|
|
|
| 1,165 |
|
Total current liabilities |
|
| 42,966 |
|
|
| — |
|
|
| 153 |
|
|
| 43,119 |
|
Deferred rent, net of current portion |
|
| 5,648 |
|
|
|
|
|
|
|
|
|
|
| 5,648 |
|
Other non–current liabilities |
|
| 955 |
|
|
|
|
|
|
|
|
|
|
| 955 |
|
Total liabilities |
|
| 49,569 |
|
|
| — |
|
|
| 153 |
|
|
| 49,722 |
|
Commitments and contingencies |
|
|
|
|
|
|
|
|
|
|
|
|
|
|
|
|
Stockholders’ equity: |
|
|
|
|
|
|
|
|
|
|
|
|
|
|
|
|
Preferred stock |
|
| — |
|
|
|
|
|
|
|
|
|
|
| — |
|
Class A common stock |
|
| 78 |
|
|
|
|
|
|
|
|
|
|
| 78 |
|
Class B common stock |
|
| 28 |
|
|
|
|
|
|
|
|
|
|
| 28 |
|
Additional paid–in capital |
|
| 185,190 |
|
|
|
|
|
|
|
|
|
|
| 185,190 |
|
Accumulated deficit |
|
| (58,499 | ) |
|
| 623 |
|
|
| 2,419 |
|
|
| (55,457 | ) |
Accumulated other comprehensive income |
|
| 228 |
|
|
|
|
|
|
|
|
|
|
| 228 |
|
Total stockholders’ equity |
|
| 127,025 |
|
|
| 623 |
|
|
| 2,419 |
|
|
| 130,067 |
|
Total liabilities and stockholders’ equity |
| $ | 176,594 |
|
| $ | 623 |
|
| $ | 2,572 |
|
| $ | 179,789 |
|
Marketplace Subscription Revenue
Under ASC 606, the Company’s accounting for contracts containing discounts resulted in accelerated revenue recognition. The cumulative impact of this change to the Company’s accounts receivable on January 1, 2018 was $813.
Costs to Obtain a Contract
As described above, under the new guidance, the capitalized commission expense is amortized over the estimated customer relationship period. The net impact of this change resulted in a $3,207 reduction to accumulated deficit for contracts that still require performance by the Company at the date of adoption.
Income Taxes
The adoption of ASC 606 primarily resulted in an acceleration of revenue and the reduction of expense, which in turn generated additional deferred tax liabilities that ultimately reduced the Company’s net deferred tax asset position. The cumulative impact resulted in a reduction to deferred tax assets and related valuation allowance and the valuation of $978 which putequity and liability-classified compensation awards under ASC Topic 718, Stock-based Compensation ("ASC 718"). Accordingly, the Company in a net deferred tax liability position on January 1, 2018.
Impact of New Revenue Guidance on Financial Statement Line Items
The following tables compare the reported consolidated balance sheet, statement of operationsconsiders these to be its critical accounting policies, and cash flows, as of and for the year ended December 31, 2018, to the pro-forma amounts had the previous guidance been in effect.
|
| As of December 31, 2018 |
| |||||||||||||
Balance Sheet |
| As Reported |
|
| Marketplace Subscription Revenue |
|
| Costs to Obtain a Contract |
|
| Pro forma as if the previous accounting guidance was in effect |
| ||||
Assets |
|
|
|
|
|
|
|
|
|
|
|
|
|
|
|
|
Current assets: |
|
|
|
|
|
|
|
|
|
|
|
|
|
|
|
|
Cash and cash equivalents |
| $ | 34,887 |
|
|
|
|
|
|
|
|
|
| $ | 34,887 |
|
Investments |
|
| 122,800 |
|
|
|
|
|
|
|
|
|
|
| 122,800 |
|
Accounts receivable, net |
|
| 13,614 |
|
|
| 939 |
|
|
|
|
|
|
| 12,675 |
|
Prepaid income taxes and prepaid income taxes |
|
| 10,144 |
|
|
|
|
|
|
|
|
|
|
| 10,144 |
|
Deferred contract costs |
|
| 5,253 |
|
|
|
|
|
|
| 5,253 |
|
|
| — |
|
Other current assets |
|
| 7,410 |
|
|
|
|
|
|
|
|
|
|
| 7,410 |
|
Restricted cash |
|
| 750 |
|
|
|
|
|
|
|
|
|
|
| 750 |
|
Total current assets |
|
| 194,858 |
|
|
| 939 |
|
|
| 5,253 |
|
|
| 188,666 |
|
Property and equipment, net |
|
| 24,269 |
|
|
|
|
|
|
|
|
|
|
| 24,269 |
|
Restricted cash |
|
| 1,921 |
|
|
|
|
|
|
|
|
|
|
| 1,921 |
|
Deferred tax assets |
|
| 38,886 |
|
|
| (227 | ) |
|
| (3,187 | ) |
|
| 42,300 |
|
Deferred contract costs, net of current portion |
|
| 7,252 |
|
|
|
|
|
|
| 7,252 |
|
|
| — |
|
Other long–term assets |
|
| 1,104 |
|
|
|
|
|
|
|
|
|
|
| 1,104 |
|
Total assets |
| $ | 268,290 |
|
| $ | 712 |
|
| $ | 9,318 |
|
| $ | 258,260 |
|
Liabilities and stockholders’ equity |
|
|
|
|
|
|
|
|
|
|
|
|
|
|
|
|
Current liabilities: |
|
|
|
|
|
|
|
|
|
|
|
|
|
|
|
|
Accounts payable |
| $ | 34,345 |
|
|
|
|
|
|
|
|
|
| $ | 34,345 |
|
Accrued expenses, accrued income taxes and other current liabilities |
|
| 18,654 |
|
|
|
|
|
|
|
|
|
|
| 18,654 |
|
Deferred revenue |
|
| 8,811 |
|
|
|
|
|
|
|
|
|
|
| 8,811 |
|
Deferred rent |
|
| 1,693 |
|
|
|
|
|
|
|
|
|
|
| 1,693 |
|
Total current liabilities |
|
| 63,503 |
|
|
| — |
|
|
| — |
|
|
| 63,503 |
|
Deferred rent, net of current portion |
|
| 9,395 |
|
|
|
|
|
|
|
|
|
|
| 9,395 |
|
Other non–current liabilities |
|
| 1,281 |
|
|
|
|
|
|
|
|
|
|
| 1,281 |
|
Total liabilities |
|
| 74,179 |
|
|
| — |
|
|
| — |
|
|
| 74,179 |
|
Commitments and contingencies |
|
|
|
|
|
|
|
|
|
|
|
|
|
|
|
|
Stockholders’ equity: |
|
|
|
|
|
|
|
|
|
|
|
|
|
|
|
|
Preferred stock |
|
| — |
|
|
|
|
|
|
|
|
|
|
| — |
|
Class A common stock |
|
| 90 |
|
|
|
|
|
|
|
|
|
|
| 90 |
|
Class B common stock |
|
| 21 |
|
|
|
|
|
|
|
|
|
|
| 21 |
|
Additional paid–in capital |
|
| 184,216 |
|
|
|
|
|
|
|
|
|
|
| 184,216 |
|
Retained earnings (accumulated deficit) |
|
| 9,713 |
|
|
| 712 |
|
|
| 9,318 |
|
|
| (317 | ) |
Accumulated other comprehensive income |
|
| 71 |
|
|
|
|
|
|
|
|
|
|
| 71 |
|
Total stockholders’ equity |
|
| 194,111 |
|
|
| 712 |
|
|
| 9,318 |
|
|
| 184,081 |
|
Total liabilities and stockholders’ equity |
| $ | 268,290 |
|
| $ | 712 |
|
| $ | 9,318 |
|
| $ | 258,260 |
|
Total reported assets were $10,030 greater than the pro-forma balance sheet, which assumes the previous guidance remained in effect as of December 31, 2018. This was largely due to the impact of $12,505 related to costs to obtain a contract.
There were 0 changes to liabilities as of December 31, 2018 as a resultbelieves that of the adoptionCompany’s significant accounting policies, these policies involve the greatest degree of ASC 606.judgment and complexity.
The following summarizes the significant changes on the Company’s consolidated statement of operations for the year ended December 31, 2018 as a result of the adoption of ASC 606 on January 1, 2018 compared to the pro-forma amounts had the Company continued to recognize revenue under ASC 605.
|
| Year Ended December 31, 2018 |
| |||||||||||||
Statement of Operations |
| As Reported |
|
| Marketplace Subscription Revenue |
|
| Costs to Obtain a Contract |
|
| Pro forma as if the previous accounting guidance was in effect |
| ||||
Revenue |
| $ | 454,086 |
|
| $ | 126 |
|
|
|
|
|
| $ | 453,960 |
|
Cost of revenue |
|
| 24,811 |
|
|
|
|
|
|
|
|
|
|
| 24,811 |
|
Gross profit |
|
| 429,275 |
|
|
| 126 |
|
|
| — |
|
|
| 429,149 |
|
Operating expenses: |
|
|
|
|
|
|
|
|
|
|
|
|
|
|
|
|
Sales and marketing |
|
| 315,939 |
|
|
|
|
|
|
| (9,298 | ) |
|
| 325,237 |
|
Product, technology, and development |
|
| 47,866 |
|
|
|
|
|
|
|
|
|
|
| 47,866 |
|
General and administrative |
|
| 39,475 |
|
|
|
|
|
|
|
|
|
|
| 39,475 |
|
Depreciation and amortization |
|
| 2,804 |
|
|
|
|
|
|
|
|
|
|
| 2,804 |
|
Total operating expenses |
|
| 406,084 |
|
|
| — |
|
|
| (9,298 | ) |
|
| 415,382 |
|
Income from operations |
|
| 23,191 |
|
|
| 126 |
|
|
| 9,298 |
|
|
| 13,767 |
|
Other income, net: |
|
|
|
|
|
|
|
|
|
|
|
|
|
|
|
|
Interest income |
|
| 2,283 |
|
|
|
|
|
|
|
|
|
|
| 2,283 |
|
Other income (expense) |
|
| 10 |
|
|
|
|
|
|
|
|
|
|
| 10 |
|
Total other income, net |
|
| 2,293 |
|
|
| — |
|
|
| — |
|
|
| 2,293 |
|
Income before income taxes |
|
| 25,484 |
|
|
| 126 |
|
|
| 9,298 |
|
|
| 16,060 |
|
Provision for (Benefit from) income taxes |
|
| (39,686 | ) |
|
| 37 |
|
|
| 2,399 |
|
|
| (42,122 | ) |
Net income |
| $ | 65,170 |
|
| $ | 89 |
|
| $ | 6,899 |
|
| $ | 58,182 |
|
Basic |
| $ | 0.60 |
|
| $ | — |
|
| $ | 0.07 |
|
| $ | 0.53 |
|
Diluted |
| $ | 0.57 |
|
| $ | — |
|
| $ | 0.06 |
|
| $ | 0.51 |
|
The adoption of ASC 606 resulted in an increase to revenue of $126 during the year ended December 31, 2018 due to accelerated revenue recognition for contracts containing discounts. The adoption of ASC 606 also resulted in a $9,298 reduction in sales and marketing expense during the year ended December 31, 2018 as a result of capitalizing a portion of commission expense, which was previously expensed under the previous guidance. During the year ended December 31, 2018, the cumulative impact of these changes was a $9,424 increase in income from operations which resulted in a $2,436 reduction to the benefit from income taxes. Additionally, the adoption of ASC 606 resulted in the Company’s basic and diluted EPS for the year ended December 31, 2018 increasing $0.07 and $0.06, respectively.
The following summarizes the significant changes on the Company’s consolidated statement of cash flows for the year ended December 31, 2018 as a result of the adoption of ASC 606 on January 1, 2018 compared to the pro-forma amounts had the Company continued to recognize revenue under ASC 605.
|
| Year Ended December 31, 2018 |
| |||||||||||||
Statement of Cash Flows |
| As Reported |
|
| Marketplace Subscription Revenue |
|
| Costs to Obtain a Contract |
|
| Pro forma as if the previous accounting guidance was in effect |
| ||||
Operating Activities |
|
|
|
|
|
|
|
|
|
|
|
|
|
|
|
|
Net income |
| $ | 65,170 |
|
| $ | 89 |
|
| $ | 6,899 |
|
| $ | 58,182 |
|
Adjustments to reconcile net income to net cash provided by operating activities: |
|
|
|
|
|
|
|
|
|
|
|
|
|
|
|
|
Depreciation and amortization |
|
| 5,029 |
|
|
|
|
|
|
|
|
|
|
| 5,029 |
|
Currency (gain) loss on foreign denominated transactions |
|
| (190 | ) |
|
|
|
|
|
|
|
|
|
| (190 | ) |
Deferred taxes |
|
| (39,040 | ) |
|
| 37 |
|
|
| 2,399 |
|
|
| (41,476 | ) |
Provision for doubtful accounts |
|
| 1,680 |
|
|
|
|
|
|
|
|
|
|
| 1,680 |
|
Stock–based compensation expense |
|
| 20,794 |
|
|
|
|
|
|
|
|
|
|
| 20,794 |
|
Amortization of deferred contract costs |
|
| 3,689 |
|
|
|
|
|
|
| 3,689 |
|
|
| — |
|
Changes in operating assets and liabilities: |
|
|
|
|
|
|
|
|
|
|
|
|
|
|
|
|
Accounts receivable, net |
|
| (1,911 | ) |
|
| (126 | ) |
|
|
|
|
|
| (1,785 | ) |
Prepaid expenses, prepaid income taxes, and other assets |
|
| (11,753 | ) |
|
|
|
|
|
|
|
|
|
| (11,753 | ) |
Deferred contracts costs |
|
| (12,987 | ) |
|
|
|
|
|
| (12,987 | ) |
|
| — |
|
Accounts payable |
|
| 9,345 |
|
|
|
|
|
|
|
|
|
|
| 9,345 |
|
Accrued expenses, accrued income taxes and other current liabilities |
|
| 2,695 |
|
|
|
|
|
|
|
|
|
|
| 2,695 |
|
Deferred revenue |
|
| 4,508 |
|
|
|
|
|
|
|
|
|
|
| 4,508 |
|
Deferred rent |
|
| 4,289 |
|
|
|
|
|
|
|
|
|
|
| 4,289 |
|
Other non–current liabilities |
|
| 405 |
|
|
|
|
|
|
|
|
|
|
| 405 |
|
Net cash provided by operating activities |
| $ | 51,723 |
|
| $ | — |
|
| $ | — |
|
| $ | 51,723 |
|
The adoption of ASC 606 had no impact on the Company’s cash flows from operations. The aforementioned impacts resulted in offsetting shifts in cash flows between net income and various working capital balances.
Contract Balances
The following tables summarize the opening and closing balances of receivables and contract assets from contracts with customers as of January 1, 2018, December 31, 2018 and December 31, 2019.
|
| Accounts Receivable, net |
|
| Contract Assets (current) |
|
| Contract Assets (non-current) |
| |||
Balance at January 1, 2018 |
| $ | 13,390 |
|
| $ | 1,424 |
|
| $ | 1,782 |
|
Balance at December 31, 2018 |
|
| 13,614 |
|
|
| 5,253 |
|
|
| 7,252 |
|
Balance at December 31, 2019 |
|
| 22,124 |
|
|
| 9,544 |
|
|
| 10,514 |
|
Revenue recognized during the year ended December 31, 2019 and 2018 from amounts included in deferred revenue at the beginning of the period was approximately $8,811 and $4,305, respectively.
Transaction Price Allocated to Future Performance Obligations
Topic 606 requires that the Company disclose the aggregate amount of transaction price that is allocated to performance obligations that have not yet been satisfied as of December 31, 2019.
For contracts with an original expected duration greater than one year, the aggregate amount of the transaction price allocated to the performance obligations that were unsatisfied as of December 31, 2019 is approximately $35.0 million, which the Company expects to recognize over the next twelve months.
For contracts with an original expected duration of one year or less, the Company has applied the practical expedient available under Topic 606 to not disclose the amount of transaction price allocated to unsatisfied performance obligations as of December 31, 2019. For performance obligations not satisfied as of December 31, 2019, and to which this expedient applies, the nature of the performance obligations, the variable consideration and any consideration from contracts with customers not included in the transaction price is consistent with performance obligations satisfied as of December 31, 2019. The remaining duration is less than one year.
From time to time, the Company may enter into contracts that include variable consideration, for which the Company estimates the value of the variable consideration in determining the transaction price and allocates it to the appropriate performance obligation(s). The Company reassesses any estimates of variable consideration at each reporting period.
Deferred Revenue
Deferred revenue primarily consists of payments received in advance of revenue recognition from the Company’s marketplace revenue and is recognized as the revenue recognition criteria are met. The Company generally invoices its customers monthly. Accordingly, the deferred revenue balances do not represent the total contract value of annual or multiyear subscription agreements. Deferred revenue that is expected to be recognized during the succeeding 12‑month period is recorded as current deferred revenue and the remaining portion is recorded as noncurrent in the consolidated balance sheets. All deferred revenue was recorded as current for all periods presented.
Cost of Revenue
Cost of revenue primarily consists of costs related to supporting and hosting the Company’s product offerings. These costs include salaries, benefits, incentive compensation and stock‑based compensation for the Company’s customer support team, and third‑party service provider costs such as data center and networking expenses, allocated overhead costs, depreciation and amortization expense associated with the Company’s property and equipment, and amortization of capitalized website development costs.
Concentration of Credit Risk
The Company has no significant off‑balance sheet risk, such as foreign exchange contracts, option contracts, or other foreign hedging arrangements. Financial instruments that potentially expose the Company to concentrations of credit risk consist primarily of cash, cash equivalents, investments, and trade accounts receivable.
The Company maintains its cash, cash equivalents, and investments principally with accredited financial institutions of high credit standing. Although the Company deposits its cash, cash equivalents, and investments with multiple financial institutions, its deposits at times, may often exceed governmental insured limits.
Credit risk with respect to accounts receivable is dispersed due to the large number of customers. The Company routinely assesses the creditworthiness of its customers. The Company generally has not experienced any material losses related to receivables from individual customers, or groups of customers. The Company does not require collateral. Due to these factors, no additional credit risk beyond amounts provided for collection losses is believed by management to be probable in the Company’s accounts receivable.
76
The majority of the Company's accounts receivable results from the acquisition of a 51% interest in CarOffer, which uses a third-party payment vendor for wholesale revenue transactions. An increase in wholesale revenue transactions as a result of the acquisition resulted in the increase in accounts receivable, net. The Company has had no material losses related to CarOffer receivables, as it does not release the title until successfully collecting funds from the buying dealer.
For the years ended December 31, 2021, 2020, and 2019, 2018 and 2017, 0 individual customer accounted for more than 10% of total revenue.
As of December 31, 2019, 1 customer accounted for 18% of net accounts receivable. As of December 31, 2018, 2021, 2 customers accounted for 21%47% and 14%18% of net accounts receivable, respectively. No other individualAs of December 31, 2020, 1 customer accounted for more than 10%approximately 10% of net accounts receivable atreceivable.
As of December 31, 2019 or 2018.
Included2021 and 2020, included in net accounts receivable at December 31, 2019was $7,356 and 2018, is $8,880 and $5,814$7,426, respectively, of unbilled accounts receivables relatedreceivable relating primarily to advertising customers billed within a quarterinvoiced in the subsequent period to services rendered.
Cash, Cash Equivalents, and Investments
Cash and cash equivalents primarily consist of cash on deposit with banks, and amounts held in interest‑bearing money market accounts. Cash equivalents are carried at cost, which approximates their fair market value.
The Company considers all highly liquid investments with an original maturity of three months90 days or less at the date of purchase to be cash equivalents. Investments not classified as cash equivalents with maturities less than one year from the balance sheet date are classified as short‑term investments, while investments with maturities in excess of one year from the balance sheet date are classified as long‑term investments. Management determines the appropriate classification of investments at the time of purchase, and re‑evaluates such determination at each balance sheet date.
Cash and cash equivalents primarily consist of cash on deposit with banks, and amounts held in interest‑bearing money market accounts. Cash equivalents are carried at cost, which approximates their fair market value.
The Company’s investment policy, which was approved by the Audit Committee of the Company’s board of directors (the “Board”), permits investments in fixed income securities, including U.S. government and agency securities, non‑U.S. government securities, money market instruments, commercial paper, certificates of deposit, corporate bonds, and asset‑backed securities.
As of December 31, 20192021 and 2018,2020, investments consisted of U.S. certificates of deposit (“CDs”) with remaining maturities of less than twelve months.months. The Company classifies CDs with readily determinable market values as held‑to‑maturity, because it is the Company’s intention to hold such investments until they mature. As such, as of December 31, 2021 and 2020, investments were recordedrecognized at amortized cost at December 31, 2019 and 2018.cost. The Company adjusts the cost of investments for amortization of premiums and accretion of discounts to maturity, if any. For the years ended December 31, 2019, 20182021, 2020, and 2017,2019, the Company did 0t0t have any premiums or discounts.
Realized gains and losses from sales of the Company’s investments are included inwithin other income, (expense), net. Therenet in the consolidated income statements. For the years ended December 31, 2021, 2020 or 2019, there were 0 realized gains or losses on investments for the years ended December 31, 2019, 2018 or 2017.investments.
The Company reviews investments for other‑than‑temporary impairment whenever the fair value of an investment is less than the amortized cost and evidence indicates that an investment’s carrying amount is not recoverable within a reasonable period of time. Other‑than‑temporary impairments of investments are recognized in the consolidated income statements of operations if the Company has experienced a credit loss has the intent to sell the investment, or if it is more likely than not that the Company will be required to sell the investment before recovery of the amortized cost basis. Evidence considered in this assessment includes reasons for the impairment, compliance with the Company’s investment policy, the severity and duration of the impairment, and changes in value subsequent to the end of the period. As of December 31, 20192021 and 2018,2020, the Company determined that 0 other‑than‑temporary impairments were required to be recognized in the consolidated statements of operations.income statements.
Restricted Cash
AtAs of December 31, 20192021 and 2018,2020, restricted cash was $10,803$16,336 and $2,671,$10,627, respectively, and primarily related to cash held at a financial institution in an interest‑bearinginterest-bearing cash account as collateral for fourthe letters of credit in 2019 and three letters of credit in 2018 related to the contractual provisions for the Company’s building leases.leases and pass-through payments from customers related to the Company’s wholesale business. As of December 31, 2021 and 2020, portions of restricted cash were classified as short-term assets and long-term assets, as disclosed in the consolidated balance sheets.
77
Accounts Receivable and Allowance for Doubtful Accounts
Accounts receivable are recorded based on the amount due from the customer and a third-party payment processor. Accounts receivable do not generally bear interest.
The Company is exposed to credit losses primarily through its trade accounts receivable, which includes receivables in transit from a third-party payment processor. The third-party payment processor collects customer payments on the Company's behalf and remits them to the Company. Customer payments received, but not remitted as of period end are deemed to be receivables in transit. Additionally, the third-party payment processer provides payments in advance for certain customers to the Company. If the third-party payment processor does not receive customer payments related to the payments in advance, the balance is deducted from future remittances to the Company.
The Company offsets gross trade accounts receivable with payments received in advance from a third-party payment processer as it has the right of offset. As of December 31, 2021, gross trade accounts receivable from receivables in transit from the third-party payment processor was $18,747, offset by payments received in advance of $46,822, which resulted a net liability of $28,075 recognized within accrued expenses, accrued income taxes and other current liabilities in the consolidated balance sheets. Payments received in advance are deductible from future payments from the third-party payment processor if the third-party payment processor does not receive the payment from the customer. Payments received in advance are presented as cash flows from financing activities in the consolidated statements of cash flows. As of December 31, 2020, the Company did 0t have any gross trade accounts receivable from receivables in transit from the third-party payment processor.
The Company also is exposed to credit losses primarily through its trade accounts receivable. The Company offsets gross trade accounts receivable with an allowance for doubtful accounts. The allowance for doubtful accounts is the Company’s best estimate of the amount of probable credit losses in the Company’s existing accounts receivable and is based upon historical loss patterns,trends, the number of days that billings are past due, and an evaluation of the potential risk of loss associated with specific accounts. Account balances are charged against the allowance after all meansaccounts, current conditions, and reasonable and supportable forecasts of collection have been exhausted and the potential for recovery is considered remote.economic conditions. The Company does not have any off‑balance sheet credit exposure related to its customers. Provisions for allowances for doubtful accounts are recorded in general and administrative expense.
Unbilled accounts receivables are recorded for services rendered in the current period, but generally not invoiced until the subsequent period.
The Companyalso considers current economic trends when evaluating the adequacy of the allowance for doubtful accounts. If circumstances relating to specific customers change, or unanticipated changes occur in the general business environment, particularly as it affects auto dealers, the Company’s estimates of the recoverability of receivables could be further adjusted.
BelowProvisions for allowances for doubtful accounts are recognized within general and administrative expense in the consolidated income statements. Amounts are charged against the allowance after all means of collection have been exhausted, the potential for recovery is a summaryconsidered remote and when it is determined that expected credit losses may occur. The Company does not have any off‑balance sheet credit exposure related to its customers. Unbilled accounts receivable generally relate to services rendered in the current period, but not invoiced until the subsequent period.
As of theDecember 31, 2021 and 2020, changes in the Company’s allowance for doubtful accounts for the years ended December 31, 2019, 2018, and 2017:
are as follows:
|
| Balance at Beginning of Period |
|
| Provision |
|
| Write–offs, net of recoveries |
|
| Balance at End of Period |
| ||||
Year ended December 31, 2019 |
| $ | 479 |
|
| $ | 1,091 |
|
| $ | (1,330 | ) |
| $ | 240 |
|
Year ended December 31, 2018 |
|
| 494 |
|
|
| 1,680 |
|
|
| (1,695 | ) |
|
| 479 |
|
Year ended December 31, 2017 |
|
| 164 |
|
|
| 1,117 |
|
|
| (787 | ) |
|
| 494 |
|
|
| Balance at |
|
| Provision |
|
| Write–offs, |
|
| Balance at |
| ||||
Year ended December 31, 2021 |
| $ | 616 |
|
| $ | 999 |
|
| $ | (1,195 | ) |
| $ | 420 |
|
Year ended December 31, 2020 |
|
| 240 |
|
|
| 1,930 |
|
|
| (1,554 | ) |
|
| 616 |
|
Property and Equipment
Property and equipment are stated at cost less accumulated depreciation and amortization using the straight‑line method over the estimated useful lives of the assets. Leasehold improvements and right-of-use assets are amortized over the shorter of the lease term, or the estimated useful life of the related asset. asset, if shorter. The estimated useful lives of the Company’s property and equipment are as follows:
78
Estimated Useful Life
| |||
|
| ||
| Server and computer equipment | 3 | |
Capitalized | internal-use software | 3 | |
| Capitalized website development |
| 3 |
|
| ||
Right-of-use assets | Lease term, or asset life if shorter | ||
Leasehold improvements | Lease term, or |
Expenditures for repairs and maintenance are charged to expense as incurred, whereas major betterments are capitalized as additions to property and equipment.
Impairment of Long‑Lived Assets
The Company evaluates the recoverability of long‑lived assets, such as property and equipment and intangible assets, for impairment at least annually and whenever events or changes in circumstances indicate that the carrying value of an asset may not be recoverable. During this review, the Company re‑evaluates the significant assumptions used in determining the original cost and estimated lives of long‑lived assets. Although the assumptions may vary from asset to asset, they generally include operating results, changes in the use of the asset, cash flows, and other indicators of value. Management then determines whether the remaining useful life continues to be appropriate, or whether there has been an impairment of long‑lived assets based primarily upon whether expected future undiscounted cash flows are sufficient to support the assets’ recovery. Recoverability of these assets is measured by comparison of the carrying amount of the asset to the future undiscounted cash flows the asset is expected to generate. If the asset is considered to be impaired, the amount of any impairment is measured as the difference between the carrying value and the fair value of the impaired asset.
For the year ended December 31, 2021, the Company wrote off $2,481 of U.S. capitalized website development costs within operating expense in the consolidated income statements and $647 of U.S. intangible assets within cost of revenue in the consolidated income statements related to certain developed technology in which the Company has decided to cease investment. For the year ended December 31, 2020, the Company wrote off $1,151 of capitalized website development costs, of which $844 related to the exit of certain international markets in connection with the cost-savings initiative by the Company during the second quarter of 2020 (the "Expense Reduction Plan"). For the year ended December 31, 2019, the Company did 0t identify any impairment of long‑lived assets.
Capitalized Website Development and Capitalized Internal-Use Software Costs
The Company capitalizes certain costs associated with the development of its websites and internal‑use software after the preliminary project stage is complete and until the website development or software is ready for its intended use. Research and development costs incurred during the preliminary project stage or costs incurred for data conversion activities, training, maintenance, and general and administrative or overhead costs are expensed as incurred. Capitalization begins when the preliminary project stage is complete, management authorizes and commits to the funding of the project with the required authority, it is probable the project will be completed, the website development or software will be used to perform the functions intended and certain functional and quality standards have been met. Qualified costs incurred during the operating stage of our website development or software relating to upgrades and enhancements are capitalized to the extent it is probable that they will result in added functionality, while costs that cannot be separated between maintenance of, and minor upgrades and enhancements to, websites and internal‑use software are expensed as incurred. Capitalized website development and capitalized internal-use software costs are recognized within property and equipment, net in the consolidated balance sheets.
Capitalized website development and capitalized internal-use software costs are amortized on a straight‑line basis over their estimated useful life of three years beginning with the time when the product is ready for intended use. Capitalized website development costs related amortization expenses are recognized within cost of revenue in the consolidated income statements. Capitalized internal-use software costs related amortization expenses are recognized within depreciation and amortization in the consolidated income statements. The Company evaluates the useful lives of these assets on an annual basis and tests for impairment whenever events or changes in circumstances occur that could impact the recoverability of these assets.
During the year ended December 31, 2021 and 2020, capitalized website development costs were $8,190 and $6,396, respectively. During the year ended December 31, 2021, capitalized internal-use software costs were $2,892. During the year ended December 31, 2020, 0 capitalized internal-use software costs were recognized.
79
For the year ended December 31, 2021, 2020, and 2019, amortization expense associated with its capitalized website development costs were $3,705, $3,324 and $1,643, respectively. For the year ended December 31, 2021, amortization expense associated with capitalized internal-use software costs was $272. For the years ended December 31, 2020 and 2019, 2018,0 amortization expense associated with its capitalized internal-use software costs was recognized.
Capitalized Hosting Arrangements
Hosting arrangement capitalized implementation costs are amortized on a straight‑line basis over an estimated useful life of the term of the hosting arrangement, taking into consideration several other factors such as, but not limited to, options to extend the hosting arrangement or options to terminate the hosting arrangement, beginning with the time when the software is ready for intended use.
Hosting arrangements costs are recognized within the same line item in the consolidated income statements as the expense for fees for the associated hosting arrangement. Management evaluates the useful lives of these assets on an annual basis and 2017,tests for impairment whenever events or changes in circumstances occur that could impact the recoverability of these assets.
During the years ended December 31, 2021, 2020, and 2019, the Company did 0t identify any impairmentlaunched separate initiatives designed to enhance its hosting arrangements related to its enterprise applications, each of which are ongoing. During the years ended December 31, 2021 and 2020, implementation costs were $3,842 and $332, respectively, and recognized within other non-current assets and within prepaid expenses, prepaid income taxes and other current assets, respectively, in the consolidated balance sheets.
For the years ended December 31, 2021, 2020, and 2019, amortization expense associated with its long‑lived assets.hosting arrangements was $1,761, $690, and $132, respectively, and recognized within operating expense in the consolidated income statements.
Business Combinations
Valuation of Acquired Assets and Liabilities
The Company measures all consideration transferred in a business combination at its acquisition-date fair value. Consideration transferred is determined by the acquisition-date fair value of assets transferred, liabilities assumed, including contingent consideration obligations, as applicable. The Company measures goodwill as the excess of the consideration transferred over the net of the acquisition-date amounts of assets acquired less liabilities assumed.
The Company makes significant assumptions and estimates in determining the fair value of the acquired assets and liabilities as of the acquisition date, especially the valuation of intangible assets and certain tax positions. The Company records estimates as of the acquisition date and reassess the estimates at each reporting period up to one year after the acquisition date. Changes in estimates made prior to finalization of purchase accounting are recorded torecognized within goodwill.
Intangible Assets
Intangible assets are recordedrecognized at their estimated fair value at the date of acquisition. The Company amortizes intangible assets over their estimated useful lives on a straight-line basis. Amortization is recordedrecognized over the relevant estimated useful lives ranging from three to eleven years. years.
The Company evaluates the useful lives of these assets on an annual basis and tests for impairment whenever events or changes in circumstances occur that could impact the recoverability of these assets.basis. If the estimate of an intangible asset’s remaining useful life is changed, the Company amortizes the remaining carrying value of the intangible asset prospectively over the revised remaining useful life. The Company monitors its long-lived assets for impairment indicators on an ongoing basis in accordance with GAAP, and tests for impairment whenever events or changes in circumstances occur that could impact the recoverability of these assets. If impairment indicators exist, the Company performs the required impairment analysis by comparing the undiscounted cash flows expected to be generated from the long-lived assets to the related net book values.
80
Goodwill
Goodwill
Goodwill is recordedrecognized when consideration paid in a purchase acquisition exceeds the fair value of the net assets acquired. Goodwill is not amortized, but rather is tested for impairment annually or more frequently if facts and circumstances warrant a review. Conditions that could trigger a more frequent impairment assessment include, but are not limited to, a significant adverse change in certain agreements, significant underperformance relative to historical or projected future operating results, an economic downturn affecting automotive marketplaces, increased competition, a significant reduction in our stock price for a sustained period or a reduction of our market capitalization relative to net book value.
The Company has determined that it had 2 reporting units, United States and International, asAs of and for the year ended December 31, 2019.2021, the Company has determined that it had 3 reporting units, United States, International, and CarOffer. The Company elected to bypass the optional qualitative test for impairment and proceed to Step 1, which is a quantitative impairment test. The Company evaluates impairment annually on October 1 by comparing the estimated fair value of each reporting unit to its carrying value. The Company estimates fair value using a discounted cash flow modelmarket approach, based on our most recent forecast atmarket multiples derived from public companies that are identified as peers. In 2021, the timeCompany calculated the fair value of its annual impairment test.reporting units using the market approach, which required the Company to estimate the forecasted revenue and estimate revenue market multiples using publicly available information for each of their reporting units. Developing these assumptions required the use of significant judgment and estimates. Actual results may differ from these forecasts.
Capitalized Website Development and Internal-Use Software Costs
The Company capitalizes certain costs associated with the development of its websites and internal‑use software products after the preliminary project stage is complete and until the software is ready for its intended use. Research and development costs incurred during the preliminary project stage or costs incurred for data conversion activities, training, maintenance, and general and administrative or overhead costs are expensed as incurred. Capitalization begins when the preliminary project stage is complete, management authorizes and commits to the funding of the software project with the required authority, it is probable the project will be completed, the software will be used to perform the functions intended and certain functional and quality standards have been met. Qualified costs incurred during the operating stage of our software applications relating to upgrades and enhancements are capitalized to the extent it is probable that they will result in added functionality, while costs that cannot be separated between maintenance of, and minor upgrades and enhancements to, internal‑use software are expensed as incurred.
Capitalized website and software development costs are amortized on a straight‑line basis over their estimated useful life of three years beginning with the time when it is ready for intended use. Capitalized internal-use software costs are amortized on a straight‑line basis over their estimated useful life of the term of the hosting arrangement, taking into consideration several other factors such as, but not limited to, options to extend the hosting arrangement or options to terminate the hosting arrangement, beginning with the time when it is ready for intended use. Amounts amortized are presented through operating expense, rather than depreciation or amortization. Management evaluates the useful lives of these assets on an annual basis and tests for impairment whenever events or changes in circumstances occur that could impact the recoverability of these assets.
DuringFor the years ended December 31, 20192021 and 2018,2020, the Company capitalized $4,176did 0t identify any impairment of its goodwill.
Redeemable Noncontrolling Interest
In connection with the Company’s acquisition of a 51% interest in CarOffer on January 14, 2021, the Company became a party with the noncontrolling equity holders of CarOffer to the CarOffer Operating Agreement (as defined in Note 4 of these consolidated financial statements), which, among other matters, sets forth certain put and $2,012call rights described in Note 4 of website development costs, respectively.these consolidated financial statements. The CarOffer Operating Agreement provides the Company with the right to purchase, and the noncontrolling equity holders with the right to sell to the Company, the noncontrolling CarOffer equity holders’ equity interests in CarOffer at a contractually defined formulaic purchase price, which is based on a multiple of earnings. As the purchase is contingently redeemable at the option of the noncontrolling equity holders, the Company classifies the carrying amount of the redeemable noncontrolling interests within the mezzanine section in the consolidated balance sheet, which is presented above the equity section and below the liabilities section. As of the date of Closing (as defined in Note 4 of these consolidated financial statements), the noncontrolling interest was recognized at fair value computed using the Least Square Monte Carlo Simulation approach. Significant inputs to the model include market price of risk, volatility, correlation and risk-free rate.
Subsequent to the Company’s acquisition of the 51% interest on January 14, 2021, the redeemable noncontrolling interest is measured at the greater of the amount that would be paid if settlement occurred as of the balance sheet date based on the contractually defined redemption value and its carrying amount adjusted for net income (loss) attributable to the noncontrolling interest. Adjustments to the carrying value of the redeemable noncontrolling interest resulting from changes in the redemption value are recognized within retained earnings in the consolidated balance sheets.
Leases
In February 2016, the FASB issued ASC Topic 842, Leases (“ASC 842”), which requires a lessee to recognize most leases in the consolidated balance sheet but recognize expenses in the consolidated income statement in a manner similar to pre-existing practice, on a straight-line basis. The update states that a lessee will recognize a lease liability for the obligation to make lease payments and a right-of-use asset for the right to use the underlying assets for the lease term. The Company recorded amortizationadopted ASC 842 as of January 1, 2019.
The Company reviews all material contracts for embedded leases to determine if they have a right-of-use asset. The Company made an accounting policy election to not separate lease components from non-lease components for all leases.
The Company recognizes rent expense associatedon a straight-line basis over the lease period. The depreciable life of assets and leasehold improvements are limited by the expected lease term, unless there is a transfer of title or purchase option reasonably certain of exercise. The Company allocates lease costs across all departments based on headcount in the respective location.
81
Variable lease payments that depend on an index or a rate are included in the lease payments and are measured using the prevailing index or rate at the measurement date. Variable lease payments not based on an index or a rate are excluded from lease payments and are expensed as incurred.
The Company made an accounting policy election to not recognize a lease liability or right-of-use asset on its consolidated balance sheet for leases with its capitalized website development costsan initial term of $1,643, $1,508twelve months or less, and $812 forinstead to recognize lease payments in the consolidated income statement on a straight-line basis over the lease term and variable lease payments that do not depend on an index or rate as expense in the period in which the achievement of the specified target that triggers the variable lease payments becomes probable.
The Company recognizes sublease income on a straight-line basis over the sublease period. The Company recognizes sublease income net as rent expense within operating expenses in the consolidated income statements as subleasing is not a primary business activity of the Company and is meant to offset occupancy costs. For the year ended December 31, 2021, the Company did 0t recognize any sublease income. For the years ended December 31, 2019, 2018,2020 and 2017, respectively.
During the year ended December 31, 2019, the Company capitalized $2,615 and $616 of internal-use softwarerecognized sublease income within other income in other non-current assets and in prepaid expenses and prepaidthe consolidated income taxes, respectively. statements for an immaterial amount.
Contingent Liabilities
The Company recorded amortization expense associated with its internal-use softwarehas certain contingent liabilities that arise in the ordinary course of $132business activities. The Company accrues for loss contingencies when losses become probable and can be reasonably estimated. If the year ended December 31, 2019.
Foreign Currency Translation
The reporting currencyreasonable estimate of the Companyloss is a range and no amount within the U.S. dollar. The functional currencyrange is a better estimate, the minimum amount of the Company’s foreign subsidiariesrange is the local currency of each subsidiary. All assets and liabilities in the balance sheets of entities whose functional currency is a currency other than the U.S. dollar are translated into U.S. dollar equivalents at exchange rates as follows: (1) asset and liability accounts at period‑end rates; (2) income statement accounts at weighted‑average exchange rates for the period; and (3) stockholders’ equity accounts at historical exchange rates. The resulting translation adjustments are excluded from net income and reflectedrecognized as a separate component of stockholders’ equity (deficit). Foreign currency transaction gains and losses are included in net income for the period.liability. The Company may periodically have certain intercompany foreign currency transactionsdoes not accrue for contingent losses that, in its judgment, are deemedconsidered to be reasonably possible, but not probable; however, it discloses the range of a long‑term investment nature; exchange adjustments related to those transactions are made directly to a separate component of stockholders’ equity (deficit).such reasonably possible losses.
Income Taxes
The Company accounts for income taxes in accordance with the asset and liability method. Under this method, deferred tax assets and liabilities are recognized based on temporary differences between the financial reporting and income tax bases of assets and liabilities using statutory rates. In addition, this method requires a valuation allowance against net deferred tax assets if, based upon the available evidence, it is more likely than not that some or all of the deferred tax assets will not be realized.
The Company accounts for uncertain tax positions recognized in the consolidated financial statements by prescribing a more‑likely‑than‑not threshold for financial statement recognition and measurement of a tax position taken or expected to be taken in a tax return. Interest and penalties, if applicable, related to uncertain tax positions would be recognized as a component of income tax expense. TheAs of December 31, 2021 and 2020, the Company has 0 recorded recognized liabilities for uncertain tax positions as of December 31, 2019 and 2018. positions.
The Tax Cuts and Jobs Act subjects a U.S. shareholder to tax on global intangible low-taxed income (“GILTI”) earned by certain foreign subsidiaries. An entity can make an accounting policy election, per the FASB Staff Q&A, Topic 740, No. 5, Accounting for Global Intangible Low-Taxed Income (“ASC 740”), either to recognize deferred taxes for temporary basis differences expected to reverse as GILTI in future years or to provide for the tax expense related to GILTI in the year the tax is incurred as a period expense only. The Company has elected to account for GILTI as a period cost in the year the tax is incurred.
Disclosure of Fair Value of Financial Instruments
The carrying amountsCompany measures eligible assets and liabilities at fair value with changes in value recognized in earnings. As of December 31, 2021 and 2020, there were no liabilities that were measured at fair value. Fair value treatment may be elected either upon initial recognition of an eligible asset or liability or, for an existing asset or liability, if an event triggers a new basis of accounting. During the years ended December 31, 2021 and 2020, the Company did not elect to remeasure any of its existing financial assets and did not elect the fair value option for any financial assets transacted.
82
ASC Topic 820, Fair Value Measurements and Disclosures ("ASC 820"), establishes a three‑level valuation hierarchy for instruments measured at fair value that distinguishes between assumptions based on market data (observable inputs) and the Company’s own assumptions (unobservable inputs). Observable inputs are inputs that market participants would use in pricing the asset or liability based on market data obtained from sources independent of the Company. Unobservable inputs are inputs that reflect the Company’s financialassumptions about the inputs that market participants would use in pricing the asset or liability, and are developed based on the best information available in the circumstances.
ASC 820 identifies fair value as the exchange price, or exit price, representing the price that would be received to sell an asset or paid to transfer a liability in an orderly transaction between market participants based on the highest and best use of the asset or liability. As such, fair value is a market‑based measurement that should be determined based on assumptions that market participants would use in pricing an asset or liability. The Company uses valuation techniques to measure fair value that maximize the use of observable inputs and minimize the use of unobservable inputs. These inputs are prioritized as follows:
Level 1 — Quoted unadjusted prices for identical instruments in active markets.
Level 2 — Quoted prices for similar instruments in active markets, quoted prices for identical or similar instruments in markets that are not active, and model‑derived valuations in which include cashall observable inputs and cash equivalents, investments, accounts receivable, accounts payable, and accrued expenses, approximated their fair values at December 31, 2019 and 2018 due tosignificant value drivers are observable in active markets.
Level 3 — Model‑derived valuations in which one or more significant inputs or significant value drivers are unobservable, including assumptions developed by the short‑term nature of these instruments.Company.
The Company has evaluated the estimated fair value of financial instruments using available market information. The use of different market assumptions, estimation methodologies, or both, could have a significant effect on the estimated fair value amounts. See
As of December 31, 2021 and 2020, the carrying amounts of the Company’s financial instruments, which include cash and cash equivalents, investments, accounts receivable, accounts payable, and accrued expenses approximated their fair values due to the short‑term nature of these instruments.
Foreign Currency Translation
The reporting currency of the Company is the U.S. dollar. The functional currency of the Company’s foreign subsidiaries is the local currency of each subsidiary. All assets and liabilities in the balance sheets of entities whose functional currency is a currency other than the U.S. dollar are translated into U.S. dollar equivalents at exchange rates as follows: (i) asset and liability accounts at period‑end rates; (ii) income statement accounts at weighted‑average exchange rates for the period; and (iii) stockholders’ equity accounts at historical exchange rates. The resulting translation adjustments are excluded from consolidated net income and are recognized within accumulated other comprehensive (loss) income in our consolidated balance sheets.
Foreign currency transaction gains and losses are included in consolidated net income for the period. The Company's foreign subsidiaries have intercompany transactions that are eliminated upon consolidation, and these transactions expose the Company to foreign currency exchange rate fluctuations. Exchange rate fluctuations on short‑term intercompany transactions are recognized in other income, net in our consolidated income statements. Exchange rate fluctuations on long-term intercompany transactions are recognized within accumulated other comprehensive (loss) income in our consolidated balance sheets.
Revenue Recognition
Sources of Revenue
The Company derives its revenue from three sources: (i) marketplace revenue, which consists primarily of dealer subscriptions to the Company's Listings packages and Real-time Performance Marketing ("RPM") digital advertising suite, advertising revenue from auto manufacturers and other auto‑related brand advertisers, and revenue from partnerships with financing services companies; (ii) wholesale revenue, which consists primarily of transaction fees earned by CarOffer from facilitating the purchase and sale of vehicles between dealers; and (iii) product revenue, which consists primarily of aggregate proceeds received on the sale of vehicles.
83
Revenue Recognition
ASC Topic 606, Revenue from Contracts with Customers ("ASC 606"), outlines a comprehensive five-step revenue recognition model based on the principle that an entity should recognize revenue to depict the transfer of promised goods or services to customers in an amount that reflects the consideration to which the entity expects to be entitled in exchange for those goods or services. To achieve this core principle, the Company applies the following five steps:
1) Identify the contract with a customer
2) Identify the performance obligations in the contract
3) Determine the transaction price
4) Allocate the transaction price to performance obligations in the contract
5) Recognize revenue when or as the Company satisfies a performance obligation
Marketplace Revenue - Description
The Company offers multiple types of marketplace Listings packages to its dealers for its CarGurus U.S. platform (availability varies on the Company's other marketplaces): Restricted Listings, which is free; and various levels of Listings packages, which each require a paid subscription under a monthly, quarterly, semiannual, or annual subscription basis.
The Company’s subscriptions for customers generally auto-renew on a monthly basis and are cancellable by dealers with 30 days’ advance notice prior to the commencement of the applicable renewal term, although during the second quarter of 2020 the Company did not require 30 days’ advance notice of termination from dealers who cancelled as a result of the COVID-19 pandemic. Subscription pricing is determined based on a dealer’s inventory size, region, and the Company's assessment of the connections and return on investment ("ROI") the platform will provide them and is subject to discounts and/or fee reductions that the Company may offer from time to time. The Company also offers all dealers on the platform access to its Dealer Dashboard, which includes a performance summary, Dealer Insights tool, and user review management platform. Only dealers subscribing to a paid Listings package have access to the Pricing Tool, Market Analysis tool and IMV Scan tool.
Dealer customers do not have the right to take possession of the Company’s software.
In addition to displaying inventory in the Company's marketplace and providing access to the Dealer Dashboard, the Company offers dealers subscribing to certain of its Listings packages other subscription advertising and customer acquisition products and enhancements marketed under the Company's RPM digital advertising suite. Through RPM, dealers can buy advertising that appears in the Company's marketplace, on other sites on the internet, and/or on high-converting social media platforms. Such advertisements can be targeted by the user’s geography, search history, CarGurus website activity and a number of other targeting factors, allowing dealers to increase their visibility with in-market consumers and drive qualified traffic for dealers.
Payment is typically due on the first day of each calendar month and is recognized as accounts receivable or short-term deferred revenue when payment is received in advance of services being delivered to the customers.
The Company also offers paid Listings packages for the Autolist website and paid Listings and advertising products for the PistonHeads website.
Marketplace revenue also consists of non-dealer advertising revenue from auto manufacturers and other auto-related brand advertisers sold on a cost per thousand impressions ("CPM") basis. An impression is an advertisement loaded on a web page. In addition to advertising sold on a CPM basis, the Company also has advertising sold on a cost per click basis. Auto manufacturers and other brand advertisers can execute advertising campaigns that are targeted across a wide variety of parameters, including demographic groups, behavioral characteristics, specific auto brands, categories such as Certified Pre-Owned, and segments such as hybrid vehicles. The Company does not provide minimum impression guarantees or other types of minimum guarantees in its contracts with customers. Pricing is primarily based on advertisement size and position on the Company’s websites and mobile applications, and fees are billed monthly in arrears. Unbilled accounts receivable generally relate to services rendered in the current period, but not invoiced until the subsequent period.
84
The Company sells advertising directly to auto manufacturers and other auto related brand advertisers, as well as indirectly through revenue sharing arrangements with advertising exchange partners. Company-sold advertising is not subject to revenue sharing arrangements. Company-sold advertising revenue is recognized based on the gross amount charged to the advertiser. Partner-sold advertising revenue is recognized based on the net amount of revenue received from the content partners.
Revenue from advertising sold directly by the Company is recognized on a gross basis because the Company is the principal in the arrangement, controls the ad placement and timing of the campaign, and establishes the selling price. The Company enters into contractual arrangements directly with advertisers and is directly responsible for the fulfillment of the contractual terms including any remedy for issues with such fulfillment.
Advertising revenue subject to revenue sharing agreements between the Company and advertising exchange partners is recognized based on the net amount of revenue received from the partner. The advertising partner is responsible for fulfillment, including the acceptability of the services delivered. In partner-sold advertising arrangements, the advertising partner has a direct contractual relationship with the advertiser. There is no contractual relationship between the Company and the advertiser for partner-sold transactions. When an advertising exchange partner sells advertisements, the partner is responsible for fulfilling the advertisements, and accordingly, the Company has determined the advertising partner is the principal in the arrangement. Additionally, for auction-based partner agreements, the Company has latitude in establishing the floor price, but the final price established by the exchange server is at market rates.
Customers are billed monthly in arrears and payment terms are generally thirty to sixty days from the date invoiced.
Marketplace revenue also includes revenue from partnerships with certain financing services companies pursuant to which the Company enables eligible consumers on the Company's CarGurus U.S. website to pre-qualify for financing on cars from dealerships that offer financing through such companies. The Company primarily generates revenue from these partnerships based on the number of funded loans from consumers who pre-qualify with its lending partners through its site.
The Company also offers non-dealer advertising products for the Autolist and PistonHeads websites.
Marketplace Revenue - Revenue Recognition
For dealer listings, the Company provides a single similar service each day for a period of time. Each time increment (i.e., one day), rather than the underlying activities, is distinct and substantially the same and therefore the performance obligation of the Company is to provide a series of daily activities over the contract term. Similar to the dealer listings, the dealer advertising is considered a promise to provide a single similar service each day. Each time increment is distinct and substantially the same and therefore the performance obligation of the Company is to provide a series of daily activities over the contract term.
Total consideration for marketplace revenue is stated within the contracts. There are no contractual cash refund rights, but credits may be issued to a customer at the sole discretion of the Company. At the portfolio level, there is also variable consideration that needs to be included in the transaction price. Variable consideration consists of sales allowances, usage fees, and concessions that change the transaction price of the unsatisfied or partially unsatisfied performance obligation. The Company recognizes that there are times when there is a customer satisfaction issue or other circumstance that will lead to a credit. Due to the known possibility of future credits, a monthly sales allowance review is performed to defer revenue at a portfolio level for such future adjustments in the period of incurrence. The Company establishes sales allowances at the time of revenue recognition based on its history of adjustments and credits provided to its customers. In assessing the adequacy of the sales allowance, the Company evaluates its history of adjustments and credits made through the date of the issuance of the financial statements. Estimated sales adjustments, credits and losses may vary from actual results which could lead to material adjustments to the financial statements. Sales allowances are recognized as a reduction to revenue in the consolidated income statements.
Performance obligations are satisfied over time as the customer simultaneously receives and consumes the benefit of the service. Revenue is recognized ratably over the subscription period beginning on the date the Company starts providing services to the customer under the contract. Revenue is presented net of any taxes collected from customers.
For advertising revenue, the performance obligation is to publish the agreed upon campaign on the Company’s websites and load the related impressions.
85
Advertising contracts state the transaction price within the agreement with payment generally being based on the number of clicks or impressions delivered on the Company’s websites. Total consideration is based on output and deemed variable consideration constrained by an agreed upon delivery schedule. Additionally, there are generally no contractual cash refund rights. Certain contracts do contain the right for credits in situations in which impressions are not displayed in compliance with contractual specifications. At an individual contract level, the Company may give a credit for a customer satisfaction issue or other circumstance. Due to the known possibility of future credits, a monthly review is performed to defer revenue at an individual contract level for such future adjustments in the period of incurrence.
As consideration is driven by the number of impressions delivered on the CarGurus websites, the consideration for each period is allocated to the period in which the service was rendered.
Performance obligations for company-sold advertising revenue and partner-sold advertising revenue are satisfied over time as impressions are delivered. Revenue is recognized based on the total number of impressions delivered within the specified period. Revenue from advertising sold directly by the Company is recognized based on the gross amount charged to the advertiser and advertising revenue sold by partners is recognized based on the net amount of revenue received from the content partners. Revenue is presented net of any taxes collected from customers.
Marketplace revenue includes revenue from contracts for which the performance obligation is a series of distinct services with the same level of effort daily. For these contracts, the Company estimates the value of the variable consideration in determining the transaction price and allocates it to the performance obligation. Revenue is estimated and recognized on a ratable basis over the contractual term. The Company reassesses the estimate of variable consideration at each reporting period.
Wholesale Revenue - Description
Wholesale revenue includes transaction fees earned by CarOffer from facilitating the purchase and sale of vehicles between dealers, where CarOffer collects fees from both the buyer and seller. CarOffer also sells vehicles to dealers that CarOffer acquires at other marketplaces – in these instances, CarOffer collects a transaction fee from the buyer.
Wholesale revenue also includes fees earned by CarOffer from performing inspection and transportation services, where CarOffer collects fees from the buyer. Inspection and transportation service revenue is inclusive of dealer to dealer transactions, other marketplace to dealer transactions, and customer to dealer transactions.
Wholesale revenue also includes fees earned by CarOffer from certain guarantees offered to dealers, where CarOffer collects fees from the buying dealer or selling dealer, as applicable. Guarantee revenue is not accounted for under ASC 606 and is accounted for under ASC 460 as discussed further in Note 42 of these consolidated financial statements.
Wholesale Revenue - Revenue Recognition
When facilitating the purchase and sale of vehicles between dealers and for further discussion.vehicles sold to dealers that are acquired at other marketplaces, CarOffer does not control the vehicle and therefore acts as an agent in the transaction. Revenue earned from the fees for facilitating these transactions is recognized at a point in time when the vehicle is sold on a net basis.
For inspection and transportation services, CarOffer leverages a network of third-party inspection service providers and transportation carriers. CarOffer controls both inspection and transportation services as it is primarily responsible for fulfillment and therefore acts as a principal in the transaction. Revenue from fees for inspection services is recognized at the point in time when the inspection is performed and revenue from fees for transportation services is recognized over time as delivery is completed. Revenue from both inspection and transportation services is recognized on a gross basis. Unearned revenue related to unsatisfied performance obligations is recognized as deferred revenue.
Wholesale revenue also includes arbitration in which, in the majority of instances, the vehicle is rematched to a new buyer and not acquired by CarOffer. Arbitration is the process by which CarOffer investigates and resolves claims from buying dealers. In these situations, CarOffer does not control the vehicle and therefore acts as an agent in the transaction.
86
Within wholesale transactions, there are no contractual cash refund rights, but credits may be issued to a customer at the sole discretion of the Company. At the portfolio level, there is also variable consideration that needs to be included in the transaction price. Variable consideration consists of sales allowances and concessions that change the transaction price of the unsatisfied or partially unsatisfied performance obligation. The Company recognizes that there are times when there is a customer satisfaction issue or other circumstance that will lead to a credit or arbitration. Due to the known possibility of future credits, a monthly sales allowance review is performed to defer revenue at a portfolio level for such future adjustments in the period of incurrence. The Company establishes sales allowances at the time of revenue recognition based on its history of adjustments and credits provided to its customers. In assessing the adequacy of the sales allowance, the Company evaluates its history of adjustments and credits made through the date of the issuance of the financial statements. Estimated sales adjustments, credits and losses may vary from actual results which could lead to material adjustments to the financial statements. Sales allowances are recognized as a reduction to revenue in the consolidated income statements.
Wholesale revenue is presented net of any taxes collected from customers.
Product Revenue - Description
Product revenue includes the aggregate proceeds received on the sale of vehicles. This revenue relates to vehicles sold to dealers that CarOffer acquires directly from customers, inclusive of transaction fees collected from the buyer, and in limited situations across all CarOffer transactions, vehicles CarOffer resells after acquiring a vehicle via arbitration.
Product - Revenue Recognition
For vehicles sold to dealers that are acquired directly from consumers, CarOffer controls the vehicle and therefore acts as a principal in the transaction. Revenue earned from the fees for facilitating these transactions is recognized at a point in time when the vehicle is sold on a gross basis.
In limited situations across all CarOffer transactions, during an arbitration process, CarOffer acquires vehicles in transactions in which it controls the vehicle and therefore acts as a principal in the transaction. Revenue earned from the sale of the vehicle in these transactions is recognized at a point in time on a gross basis.
Contracts with Multiple Performance Obligations
The Company periodically enters into arrangements that include Listings and/or dealer advertising product subscriptions within marketplace revenue. These contracts include multiple promises that the Company evaluates to determine if the promises are separate performance obligations. Performance obligations are identified based on services to be transferred to a customer that are distinct within the context of the contractual terms. Once the performance obligations have been identified, the Company determines the transaction price, which includes estimating the amount of variable consideration to be included in the transaction price, if any. If required, the transaction price is allocated to each performance obligation in the contract based on a relative standalone selling price method as the performance obligation is being satisfied. For the Company’s arrangements that include Listings and/or dealer advertising product subscriptions, the performance obligations were satisfied over a consistent period of time and therefore the allocations did not impact the revenue recognized.
For CarOffer's arrangements that include multiple performance obligations, the Company allocates revenue based on fair value. Vehicle and inspection revenues are recognized at a point in time and transportation revenue is recognized over time.
Costs to Obtain a Contract
Commissions paid to sales representatives and payroll taxes are considered costs to obtain a contract. Under ASC 606, the costs to obtain a contract require capitalization and amortization of those costs over the period of benefit. Although the guidance specifies the accounting for an individual contract with a customer, as a practical expedient, the Company has opted to apply the guidance to a portfolio of contracts with similar characteristics. The Company has opted to apply another practical expedient to immediately expense the incremental cost of obtaining a contract when the underlying related asset would have been amortized over one year or less. As such, the Company applied this practical expedient to advertising contracts as the term is one year or less and these contracts do not renew automatically. The practical expedient is not applicable to marketplace subscription contracts as the period of benefit including renewals is anticipated to be greater than one year. The assets are periodically assessed for impairment.
87
For marketplace subscription customers, the commissions paid on contracts with new customers, in addition to any commission amount related to incremental sales, are capitalized and amortized over the estimated benefit period of the customer relationship taking into account factors such as peer estimates of technology lives and customer lives as well as the Company's own historical data. Commissions paid that are not directly related to obtaining a new contract are expensed as incurred.
Additionally, the Company allocates employer payroll tax expense to the commission expense in proportion to the overall payroll taxes paid during the respective period. As such, capitalized payroll taxes are amortized in the same manner as the underlying capitalized commissions.
As of December 31, 2021 and 2020, assets associated with costs to obtain a contract were $14,912 and $19,996, respectively. This decrease in assets recognized for costs to obtain a contract was due to amortization from prior periods’ assets being greater than the capitalizable costs to obtain a contract in current period. For the years ended December 31, 2021, 2020, and 2019, amortization expense associated with costs to obtain a contract was $12,653, $11,605, and $8,416, respectively.
Deferred Revenue
Deferred revenue primarily consists of payments received in advance of revenue recognition from the Company’s marketplace revenue and is recognized as the revenue recognition criteria are met. The Company generally invoices its customers monthly. Accordingly, the deferred revenue balances do not represent the total contract value of annual or multiyear subscription agreements. Deferred revenue that is expected to be recognized during the succeeding 12‑month period is recognized as current deferred revenue and the remaining portion is recognized as noncurrent in the consolidated balance sheets. All deferred revenue was recognized as current for all periods presented.
Marketplace Cost of Revenue
Marketplace cost of revenue includes expenses related to supporting and hosting digital product offerings. These expenses include personnel and related expenses for our customer support team, including salaries, benefits, incentive compensation, and stock-based compensation, third-party service provider expenses such as advertising, data center and networking expenses, depreciation expense associated with our property and equipment, amortization of developed technology, amortization of capitalized website development and allocated overhead expenses. The Company allocates overhead expenses, such as rent and facility expenses, information technology expense, and employee benefit expense, to all departments based on headcount. As such, general overhead expenses are reflected in cost of revenue and each operating expense category.
Wholesale Cost of Revenue
Wholesale cost of revenue includes expenses related to supporting the facilitation of the purchase and sale of vehicles between dealers, the sale by CarOffer to dealers of vehicles that it acquires at other marketplaces, and net losses on vehicles related to guarantees offered to dealers. These expenses include vehicle transportation and inspection expenses, personnel and related expenses for employees directly involved in the fulfillment and support of transactions, including salaries, benefits, incentive compensation and stock-based compensation, third-party service provider expenses, amortization of developed technology, amortization of capitalized website development and allocated overhead expenses.
Product Cost of Revenue
Product cost of revenue includes expenses related to vehicles sold to dealers that CarOffer acquires directly from consumers and in limited situations across all CarOffer transactions, in which CarOffer acquires the vehicle via arbitration. These expenses include expenses for vehicles in which CarOffer controls the vehicle and therefore acts as a principal in the transaction.
Guarantees
CarOffer provides certain guarantees to dealers through its 45-Day Guaranteed Bid and OfferGuard product offerings, which are accounted for under ASC Topic 460, Guarantees ("ASC 460").
88
45-Day Guaranteed Bid is an arrangement through which a selling dealer lists a car on the CarOffer platform, and CarOffer provides an offer to purchase the vehicle listed at a specified price at any time over a 45-day period. This provides the seller with a put option, where they have the right, but not the obligation, to require CarOffer to purchase the vehicle during this window. OfferGuard is an arrangement through which a buying dealer purchases a car on the CarOffer platform, and CarOffer provides an offer to purchase the vehicle at a specified price between days 1 and 3, and days 42 and 45 if the dealer is not able to sell the vehicle after 42 days.
A guarantee liability is initially measured using the amount of consideration received from the dealer for the purchase of the guarantee. The initial liability is released, and guarantee income is recognized, upon the earliest of the following: the vehicle sells during the guarantee period, the seller exercises it’s put option during the guarantee period, or the option expires unexercised at the end of the guarantee period. Guarantee income is recognized within wholesale revenue in the consolidated income statements. When it is probable and reasonably estimable that CarOffer will incur a loss on a vehicle that it is required to purchase, a liability, and a corresponding charge to cost of sales will be recognized for the amount of the loss in the consolidated balance sheets. Gains and losses resulting from the dealers exercise of guarantees are recognized within cost of sales in the consolidated balance sheets.
For the year ended December 31, 2021, income for guarantees purchased by dealers was $5,537. For the year ended December 31, 2021, the net loss resulting from the dealer's exercise of guarantees was immaterial.
As of December 31, 2021, the maximum potential amount of future payments that CarOffer could be required to make under these guarantees was $76,075. Of the maximum potential amount of future payments, none are considered probable. The exercise of guarantees has historically been infrequent and even when such exercises did occur the losses were immaterial. As such, as of December 31, 2021, CarOffer had 0 contingent loss liabilities.
As of December 31, 2020, the Company did 0t have any guarantees.
Inventory
The Company’s inventory consists of inventory acquired directly from consumers, at other marketplaces, or in limited situations across all CarOffer transactions, during arbitrations. The inventory is recognized on the balance sheet and is valued at the lower of cost or net realizable value. Cost is determined based on specific identification.
Stock‑Based Compensation
For stock‑based awards issuedgranted under the Company’s stock‑based compensation plans, which are more fully described in Note 10, the fair value of each award is determined on the date of grant.
For restricted stock units (“RSUs”) granted subject to service-based vesting conditions, the fair value is determined on the date of grant using the closing price of the Company’s Class A common stock, par value $0.001 per share (the “Class A common stock”), as reported on the Nasdaq Global Select Market. RSUs granted subject to service-based vesting conditions generally vest over a four-year requisite service period.
For RSUs granted subject to market-based vesting conditions, the fair value is determined on the date of grant using the Monte Carlo simulation lattice model. The determination of the fair value using this model is affected by the Company’s stock price performance relative to the companies listed on the S&P 500 as of December 31, 2021 and 2020 and a number of assumptions including volatility, correlation coefficient, risk-free interest rate and expected dividends. RSUs granted subject to market-based vesting conditions vest upon achievement of specified levels of market conditions.
For stock options granted, the fair value is determined on the date of grant using the Black‑Scholes option‑pricing model. The determination of the fair value is affected by the Company’s stock price and a number of assumptions including volatility, term, risk-free interest rate and dividend yield. Stock options granted generally have a term of ten years from the date of grant and generally vest over a four-year requisite service period.
89
The weighted average assumptions utilized to determine the fair value of options granted during the year ended December 31, 2021 are as follows:
Year Ended December 31, | ||||
2021 | ||||
Expected dividend yield | — | |||
Expected volatility | 50.95 | % | ||
Risk–free interest rate | 0.69 | % | ||
Expected term (in years) | 6.06 | |||
During the years ended December 31, 2020 and 2019, 0 options were granted.
In connection with the Company’s acquisition of a 51% interest in CarOffer, the then-outstanding unvested incentive units (“CO Incentive Units”) of CarOffer and unvested Class CO CarOffer units (the "Subject Units”) remained outstanding and will vest over the requisite service periods as discussed below.
Grants of the CO Incentive Units are subject to the CarOffer 2020 Equity Incentive Plan, adopted effective November 24, 2020 (the “2020 CO Plan”), the applicable award agreement, and the CarOffer Operating Agreement. Following the Company’s acquisition of the 51% interest in CarOffer on January 14, 2021, remaining unvested CO Incentive Units will vest over a period of three (3) years, with one third having vested on January 14, 2022 and one third vesting on each of January 14, 2023 and January 14, 2024, provided that a grantee’s continuous service to CarOffer has not terminated on the applicable vesting date. Under the terms of the grants, vesting of unvested CO Incentive Units is accelerated in the event of (i) a change of control of CarOffer (which, for the avoidance of doubt, does not include the Company’s acquisition of the 51% interest on January 14, 2021), (ii) the death or disability of the grantee, (iii) termination of the grantee’s employment with CarOffer without cause, or (iv) termination of grantee’s employment by the grantee for good reason. Upon termination of a grantee’s continuous service to CarOffer voluntarily by the grantee (other than for good reason) or by CarOffer for cause, all of such grantee’s unvested CO Incentive Units are forfeited. In addition, if a grantee’s continuous service terminates, then CarOffer has the option to repurchase any outstanding CO Incentive Units from the grantee.
In addition to the 2020 CO Plan, on December 9, 2020 CarOffer entered into a Vesting Agreement (the “Vesting Agreement”) regarding the vesting of Subject Units beneficially owned by Bruce Thompson, the founder and CEO of CarOffer, and certain affiliated persons (collectively, the “T5 Holders”) in connection with the Company’s then-anticipated acquisition of a 51% interest in CarOffer. Pursuant to the Vesting Agreement, 432,592 Subject Units beneficially owned by the T5 Holders vest in 3 (3) approximately equal installments, with one third having vested on January 14, 2022 and one third vesting on each of January 14, 2023 and January 14, 2024, subject to the terms of the Vesting Agreement. As more particularly described in the Vesting Agreement, unvested Subject Units are subject to forfeiture in the event that Mr. Thompson’s relationship with CarOffer terminates other than in the event of a termination without cause (as defined in the Vesting Agreement) or due to Mr. Thompson’s death or disability. The Vesting Agreement also provides for acceleration of any unvested Subject Units in the event of the termination of Mr. Thompson’s employment with CarOffer without cause, Mr. Thompson’s death or disability, or the consummation of an eligible liquidity event (as defined in the Vesting Agreement).
In connection with the Closing, CarOffer reserved 228,571 incentive units (the "2021 Incentive Units") for purposes of establishing an employee incentive equity plan. Thereafter, CarOffer formed CarOffer Incentive Equity, LLC (“CIE”), a Delaware manager-managed limited liability company managed by the Company, and established the CIE 2021 Equity Incentive Plan (the “2021 CO Plan). The 2021 CO Plan and related documentation, including the applicable award agreement, a vesting agreement between CarOffer and CIE, and the CarOffer Operating Agreement, provide for an incentive equity grant structure whereby 2021 Incentive Units will be granted to CIE and 2021 CO Plan grantees will receive an associated equity interest in CIE (the “CIE Interest”), with back-to-back vesting between the 2021 Incentive Units and the associated CIE Interest. Subject to any modifications as may be approved by the CarOffer Board of Managers in its discretion, grants under the 2021 CO Plan will vest over a period of three (3) years from the grant date, one third each on the first, second, and third anniversaries of the applicable grant date, provided that a grantee’s continuous service to CarOffer has not terminated on the applicable grant date. Upon termination of a grantee’s continuous service to CarOffer, all of such grantee’s unvested 2021 Incentive Units are forfeited. As of December 31, 2021, there had not been any grants of 2021 Incentive Units under the 2021 CO Plan.
90
CO Incentive Units, Subject Units and 2021 Incentive Units are liability-classified awards because the awards can be put to the Company at a formula price such that the holders do not bear the risks and rewards associated with equity ownership. For liability-classified awards, the fair value is determined on the date of issuance using a Least Square Monte Carlo simulation model. The determination of the fair value is affected by CarOffer’s equity value, EBITDA, Excess Parent Capital (as defined in the CarOffer Operating Agreement), and revenue forecasts that drive the exercise price of future call/put rights, as well as a number of assumptions including market price of risk, volatility, correlation, and risk-free interest rate. Liability-classified awards are remeasured to fair value each period until settlement.
The Company issues shares of Class A common stock upon the vesting of RSUs and the exercise of stock options out of its shares available for issuance. The Company issues CO Incentive Units and Subject Units out of CarOffer’s units available for issuance. The Company accounts for forfeitures when they occur.
The Company recognizes compensation expense for service-based awards on a straight-line basis over the requisite service period for each separate vesting portion of the award, with the amount of compensation expense recognized at any date at least equaling the portion of the grant-date fair value of the award that is vested at that date.
Certain awards granted by the Company prior to the IPO were subject to service‑based vesting conditions and a performance‑based vesting condition achieved upon a liquidity event, defined as either a change of control or an initial public offering. The Securities and Exchange Commission’s declaration of effectiveness of the Company’s registration statement on Form S-1 on October 11, 2017 satisfied the liquidity event performance condition. Upon the achievement of the liquidity
event, the Company recorded previously unrecognized cumulative stock-based compensation expense of $2.5 million related to these awards.Although the performance-based vesting condition was satisfied, under the terms of the awards, the settlement of such vested RSUs and the issuance of common stock with respect to such vested RSUs occurred on April 10, 2018, one hundred eighty-one days after the satisfaction of the performance condition.
Given the absence of an active market for the Company’s common stock prior to the IPO, the Board was required to estimate the fair value of the Company’s common stock at the time of each grant of a stock‑based award. The Company believes that the members of its Board at all relevant times had sufficient business, finance or venture capital experience to make such estimates. The Company and the Board utilized various valuation methodologies in accordance with the framework of the American Institute of Certified Public Accountants’ Technical Practice Aid, Valuation of Privately‑Held Company Equity Securities Issued as Compensation, to estimate the fair value of its common stock. Each valuation methodology includes estimates and assumptions that required judgment. These estimates and assumptions include a number of objective and subjective factors used to determine the value of the Company’s common stock at each grant date, including the following factors: (1) prices paid for the Company’s convertible preferred stock, which the Company had sold to outside investors in arm’s‑length transactions, and the rights, preferences, and privileges of the Company’s convertible preferred stock and common stock; (2) valuations performed by an independent valuation specialist; (3) the Company’s stage of development and revenue growth; (4) the fact that the grants of stock‑based awards involved illiquid securities in a private company; and (5) the likelihood of achieving a liquidity event for the common stock underlying the stock‑based awards, such as an IPO or sale of the Company, given prevailing market conditions.
The Company believes this methodology was reasonable based upon the Company’s internal peer company analyses, and further supported by arm’s‑length transactions involving the Company’s convertible preferred stock. As the Company’s common stock was not actively traded, the determination of fair value involved assumptions, judgments, and estimates. If different assumptions had been made, stock‑based compensation expense, consolidated net income, and consolidated net income per share could have been significantly different.
For RSUs issued under the Company’s stock‑based compensation plans prior to the IPO, the fair value of each grant was calculated based on the estimated fair value of the Company’s common stock on the date of grant. The Company estimated the fair value of most stock option awards on the date of grant using the Black‑Scholes option‑pricing model.
For RSUs granted subsequent to the IPO, the fair value is determined based on the closing price of the Company’s Class A common stock as reported on the Nasdaq Global Select Market on the date of grant.
The Company issues shares for stock option exercises and RSUs out of its shares available for issuance. NaN options were granted during the years ended December 31, 2019, 2018, and 2017.
The Company accounts for forfeitures when they occur. The tax effect of differences between tax deductions related to stock compensation and the corresponding financial statement expense compensation are recorded torecognized within tax expense. Excess tax benefits recognized on stock‑based compensation expense are classified as an operating activity in the consolidated statements of cash flows.flows.
During 2019, 2018 and 2017,the year ended December 31, 2021, the Company recordedrecognized $1,179 of tax demerits related to stock-based compensation as compared to immaterial tax demerits during the year ended December 31, 2020 and excess tax benefits of $11,115, $40,765 and $681, respectively, related to differences between tax deductions related to stock compensation and$11,115 recognized during the corresponding financial statement expense compensation.year ended December 31, 2019.
See Note 10 of these consolidated financial statements for a summary of the stock option, RSU and RSUCO Incentive Unit activity for the year ended December 31, 2019.2021.
Advertising Costs
Advertising costs are expensed as incurred. Advertising expense, which is includedincurred and recognized within sales and marketing expense in the consolidated statements of operations, was $287,107, $238,640, and $173,186 forincome statements. For the years ended December 31, 2021, 2020, and 2019, 2018,advertising expense was $151,457, $155,580, and 2017,$287,107, respectively.
Comprehensive Income
Comprehensive income is defined as the change in stockholders’ equity (deficit) of a business enterprise during a period from transactions and other events and circumstances from non‑owner sources. Comprehensive income consists of consolidated net income and other comprehensive income (loss) income,, which includes certain changes in equity that are excluded from consolidated net income. Specifically, cumulative foreign currency translation adjustments are included in accumulated other comprehensive (loss) income. As of December 31, 20192021 and 20182020, accumulated other comprehensive (loss) income is presented separately onin the consolidated balance sheets and consists entirely of cumulative foreign currency translation adjustments.
Recent Accounting Pronouncements Adopted
ContingentIncome Taxes
In December 2019, the FASB issued ASU 2019-12, Income Taxes – Simplifying the Accounting for Income Taxes (“ASU 2019-12”). ASU 2019-12 simplifies the accounting for income taxes by removing several exceptions in the current standard and adding guidance to reduce complexity in certain areas, such as requiring that an entity reflect the effect of an enacted change in tax laws or rates in the annual effective tax rate computation in the interim period that includes the enactment date. The standard is effective for fiscal years, and interim periods within those fiscal years, beginning after December 15, 2020, with early adoption permitted. The Company adopted the guidance on January 1, 2021. The adoption did not have an impact in the consolidated financial statements.
91
Recent Accounting Pronouncements Not Yet Adopted
From time to time, new accounting pronouncements are issued by the FASB or other standard-setting bodies and adopted by the Company on or prior to the specified effective date. Unless otherwise discussed, the Company believes that the impact of recently issued standards that are not yet effective will not have a material impact on its financial position or results of operations upon adoption. As of December 31, 2021, there are no new accounting pronouncements that the Company is considering adopting.
3. Revenue Recognition
The Company provides disaggregation of revenue based on marketplace, wholesale and product revenue classification on the face of its consolidated income statements and based on geographic region in Note 13 of these consolidated financial statements. The Company believes these categories best depict how the nature, amount, timing and uncertainty of revenue and cash flows are affected by economic factors.
ASC Topic 606, Revenue from Contracts with Customers (“ASC 606”) requires that the Company disclose the aggregate amount of transaction price that is allocated to performance obligations that have not yet been satisfied as of the relevant year end.
For contracts with an original expected duration greater than one year, the aggregate amount of the transaction price allocated to the performance obligations that were unsatisfied as of December 31, 2021 was approximately $9.2 million, which the Company expects to recognize over the next twelve months.
For contracts with an original expected duration of one year or less, the Company has applied the practical expedient available under ASC 606 to not disclose the amount of transaction price allocated to unsatisfied performance obligations as of December 31, 2021. For performance obligations not satisfied as of December 31, 2021, and to which this expedient applies, the nature of the performance obligations, the variable consideration and any consideration from contracts with customers not included in the transaction price is consistent with performance obligations satisfied as of December 31, 2021.
For the year ended December 31, 2021 and 2020, revenue recognized from amounts included in deferred revenue at the beginning of the period was $9,137 and $9,984, respectively.
In response to the COVID-19 pandemic, the Company reduced the subscription fees for paying dealers by at least 50% on all marketplace subscriptions for the April and May 2020 service periods, as well as provided a fee reduction on all June 2020 marketplace subscriptions of 20% for paying dealers in the United States and Canada and 50% for paying dealers in the United Kingdom. These fee reductions resulted in a modification to contracts with initial contractual periods greater than one month. For any contract modified, the Company calculated the remaining transaction price and allocated the consideration over the remaining performance obligations. These fee reductions materially and adversely impacted revenue for the year ended December 31, 2020, resulting in an approximately $50 million decrease in marketplace revenue. These fee reductions did not materially impact revenue for the year ended December 31, 2021. During the December 2020 and February 2021 service periods, the Company also suspended charging subscription fees for subscribing dealers in the United Kingdom. These fee reductions are included in the Company’s variable consideration assessment. These fee reductions did not materially impact revenue for the years ended December 31, 2021 and 2020.
4. Acquisitions
On January 14, 2021, the Company acquired a 51% interest in CarOffer, which provides an automated instant vehicle trade platform and is based in Addison, Texas, pursuant to the terms of a Membership Interest Purchase Agreement (the “Purchase Agreement”) dated as of December 9, 2020 (the “Agreement Date”), as amended, by and among the Company, CarOffer, CarOffer Investors Holding, LLC, a Delaware limited liability company (“TopCo”), each of the Members of TopCo (the “Members”), and Bruce T. Thompson, an individual residing in Texas (the “Members’ Representative”). This acquisition (the “CarOffer Acquisition”) is intended to add wholesale vehicle purchasing and selling capabilities to CarGurus’ portfolio of dealer offerings and create a complete and efficient digital solution for dealers to sell and acquire vehicles at both retail and wholesale.
92
Upon consummation of the transactions contemplated by the Purchase Agreement (the “Closing”), the Company acquired a 51% interest in CarOffer for an aggregate consideration of $173,155 (the “Total Consideration”), such Total Consideration consisting of (a) shares of Class A common stock in the aggregate amount of $103,645 (the “Stock Consideration”) and (b) $69,510 in cash (the “Cash Consideration”). The number of shares of Class A common stock issued following the Closing in connection with the Stock Consideration was 3,115,282, which was calculated by reference to a value of $22.51 per share, which equals the volume-weighted average closing price per share of Class A common stock on the Nasdaq Stock Market for the 28 consecutive trading days ending on the third Business Day (as defined in the Purchase Agreement) preceding the Agreement Date. Pursuant to the Purchase Agreement, the remaining equity in CarOffer (the “Remaining Equity”) is being retained by the then-current equity holders of CarOffer and subject to certain call and put arrangements discussed below.
Pursuant to the Purchase Agreement, the Company established a retention pool in an aggregate amount of $8,000 in the form of RSUs to be issued pursuant to the Company’s standard form of RSU agreement under the 2017 Plan, (i) $6,000 of which was granted to certain CarOffer employees following the Closing in accordance with the terms of the Purchase Agreement and (ii) $2,000 of which is available for issuance to future CarOffer employees in accordance with the terms of the Purchase Agreement. RSUs issued from the retention pool will be subject to vesting based on rendering of future services.
As of December 31, 2021, the Company incurred total acquisition-related costs of $2,647 related to the CarOffer Acquisition, of which $709 was incurred for the year ended December 31, 2021 and recognized within general and administrative operating expenses in the consolidated income statements. Acquisition-related costs were excluded from the purchase price allocation as they were primarily comprised of legal, professional and consulting expenses.
Total consideration transferred consists of the following:
|
| Consideration Transferred |
| |
Cash paid, net of cash acquired |
| $ | 64,273 |
|
Cash acquired |
|
| 5,237 |
|
Cash consideration |
|
| 69,510 |
|
Stock consideration |
|
| 103,645 |
|
Total consideration transferred |
| $ | 173,155 |
|
The CarOffer Acquisition has been accounted for as a business combination under the acquisition method and, accordingly, the total consideration is allocated to the acquired assets and assumed liabilities. The Company’s 51% interest in CarOffer represents a controlling financial interest in the entity as the minority interest holders only have protective rights such that CarOffer is consolidated as of the date of Closing. The following table presents the purchase price allocation recognized in the Company’s consolidated balance sheet as of the date of Closing:
|
| Adjusted Fair Value at Date of Acquisition |
| |
Cash and cash equivalents |
| $ | 5,237 |
|
Accounts receivable |
|
| 16,119 |
|
Inventory |
|
| 2,338 |
|
Prepaid expenses, prepaid income taxes and other current assets |
|
| 95 |
|
Property and equipment, net |
|
| 198 |
|
Intangible assets (1) |
|
| 104,100 |
|
Goodwill (2)(4) |
|
| 130,451 |
|
Operating lease right-of-use assets |
|
| 709 |
|
Accounts payable |
|
| (8,888 | ) |
Accrued expenses, accrued income taxes, and other current liabilities |
|
| (15,513 | ) |
Operating lease liabilities - current |
|
| (230 | ) |
Operating lease liabilities - non-current |
|
| (479 | ) |
Redeemable noncontrolling interest (3)(4) |
|
| (60,982 | ) |
Total purchase price |
| $ | 173,155 |
|
93
In addition, the Company, TopCo, each Member and CarOffer MidCo, LLC, a Delaware limited liability company, entered into the Second Amended and Restated Limited Liability Company Agreement, dated as of December 9, 2020 (the “CarOffer Operating Agreement”), pursuant to which, among other matters, the Company secured the right to appoint a majority of the members of the Board of Managers of CarOffer, other rights customary for a transaction of this nature and the put and call rights described below. On November 23, 2021, the CarOffer Operating Agreement was amended and restated for administrative purposes, including principally to recapitalize certain of the membership units thereunder without changing overall consideration payable by the Company thereunder.
In the second half of 2022, the Company will have a call right (the “2022 Call Right”), exercisable in its sole discretion, to acquire a portion of the Remaining Equity representing up to twenty-five percent (25%) of the fully diluted capitalization of CarOffer (such acquired Remaining Equity, the “2022 Acquired Remaining Equity”) at an implied CarOffer value (the “2022 Call Right Value”) of seven (7) times CarOffer’s trailing twelve months gross profit as of June 30, 2022 (calculated in accordance with the defined terms and subject to the adjustments set forth in the CarOffer Operating Agreement). If the 2022 Call Right is exercised by the Company, the 2022 Acquired Remaining Equity will be purchased ratably across all of the holders of CarOffer equity securities other than the Company. The consideration to be paid by the Company in connection with the exercise of the 2022 Call Right will be in the form of cash and/or shares of Class A common stock, as determined by the Company in its sole discretion.
In the second half of 2024, (a) the Company will have a call right (the “2024 Call Right”), exercisable in its sole discretion, to acquire all, and not less than all, of the Remaining Equity that it has not acquired pursuant to the 2022 Call Right and the Closing, at the greater of (i) (x) one hundred million dollars ($100,000,000), and (y) the 2022 Call Right Value, whichever is less, and (ii) an implied CarOffer value of twelve (12) times CarOffer’s trailing twelve months EBITDA as of June 30, 2024 (in each case calculated in accordance with the defined terms and subject to the adjustments set forth in the CarOffer Operating Agreement), and (b) the representative of the holders of the Remaining Equity will have a put right (the “2024 Put Right”), exercisable in his, her or their sole discretion, to have the holders of the Remaining Equity sell to the Company, all, and not less than all, of the Remaining Equity at an implied CarOffer value of twelve (12) times CarOffer’s trailing twelve months EBITDA as of June 30, 2024 (calculated in accordance with the defined terms and subject to the adjustments set forth in the CarOffer Operating Agreement). The determination of whether the 2024 Call Right or the 2024 Put Right is ultimately exercised is as set forth in the CarOffer Operating Agreement. The consideration to be paid by the Company in connection with the exercise of either the 2024 Call Right or the 2024 Put Right, as applicable, will be in the form of cash and/or shares of Class A common stock, as determined by the Company in its sole discretion.
The foregoing summary of the Purchase Agreement, the CarOffer Operating Agreement and the transactions contemplated thereby does not purport to be complete and is subject to, and qualified in their entirety by, the full text of the Purchase Agreement and the CarOffer Operating Agreement, which are filed as exhibits 2.1 and 10.27 to this Annual Report on Form 10-K, respectively.
94
The following unaudited pro forma consolidated financial information combines the unaudited results of the Company for the years ended December 31, 2021 and 2020 and the unaudited results of CarOffer for the year ended December 31, 2021 and 2020, and assumes that the CarOffer Acquisition, which closed on January 14, 2021, was completed on January 1, 2020 (the first day of fiscal year 2020). The pro forma consolidated financial information has been calculated after applying the Company’s accounting policies and includes adjustments for amortization expense of acquired intangible assets, transaction-related costs, and compensation expense for ongoing share-based compensation arrangements replaced, together with the consequential tax effects. These pro forma results have been prepared for comparative purposes only and do not purport to be indicative of the operating results of the Company that would have been achieved had the CarOffer Acquisition actually taken place on January 1, 2020. In addition, these results are not intended to be a projection of future results and do not reflect events that may occur after December 31, 2021, including, but not limited to revenue enhancements, cost savings or operating synergies that the combined Company may achieve as a result of the CarOffer Acquisition.
|
| Unaudited |
| |||||||||||||
|
| Three Months Ended December 31 |
|
| Year Ended December 31 |
| ||||||||||
|
| 2021 |
|
| 2020 |
|
| 2021 |
|
| 2020 |
| ||||
Revenue |
| $ | 339,342 |
|
| $ | 161,443 |
|
| $ | 954,312 |
|
| $ | 582,777 |
|
Consolidated net income (1) |
| $ | 34,158 |
|
| $ | 6,626 |
|
| $ | 110,055 |
|
| $ | 28,415 |
|
$314,430 of revenue and $2,960 of net income attributable to CarOffer is included in our consolidated income statement from the Closing date of January 14, 2021 to December 31, 2021.
5. Fair Value of Financial Instruments Including Cash Equivalents and Investments
As of December 31, 2021 and 2020, assets measured at fair value on a recurring basis consist of the following:
|
| As of December 31, 2021 |
| |||||||||||||
|
| Quoted Prices |
|
| Significant |
|
| Significant |
|
| Total |
| ||||
Cash equivalents: |
|
|
|
|
|
|
|
|
|
|
|
| ||||
Money market funds |
| $ | 157,525 |
|
| $ | — |
|
| $ | — |
|
| $ | 157,525 |
|
Investments: |
|
|
|
|
|
|
|
|
|
|
|
| ||||
Certificates of deposit |
|
| — |
|
|
| 90,000 |
|
|
| — |
|
|
| 90,000 |
|
Total |
| $ | 157,525 |
|
| $ | 90,000 |
|
| $ | — |
|
| $ | 247,525 |
|
95
|
| As of December 31, 2020 |
| |||||||||||||
|
| Quoted Prices |
|
| Significant |
|
| Significant |
|
| Total |
| ||||
Cash equivalents: |
|
|
|
|
|
|
|
|
|
|
|
| ||||
Money market funds |
| $ | 112,431 |
|
| $ | — |
|
| $ | — |
|
| $ | 112,431 |
|
Investments: |
|
|
|
|
|
|
|
|
|
|
|
| ||||
Certificates of deposit |
|
| — |
|
|
| 100,000 |
|
|
| — |
|
|
| 100,000 |
|
Total |
| $ | 112,431 |
|
| $ | 100,000 |
|
| $ | — |
|
| $ | 212,431 |
|
As of December 31, 2021 and 2020, investments consist of the following:
|
| As of December 31, 2021 |
| |||||||||||||
|
| Amortized |
|
| Gross |
|
| Gross |
|
| Estimated |
| ||||
Investments: |
|
|
|
|
|
|
|
|
|
|
|
| ||||
Certificates of deposit due in one year or less |
| $ | 90,000 |
|
| $ | — |
|
| $ | — |
|
| $ | 90,000 |
|
Total |
| $ | 90,000 |
|
| $ | — |
|
| $ | — |
|
| $ | 90,000 |
|
|
| As of December 31, 2020 |
| |||||||||||||
|
| Amortized |
|
| Gross |
|
| Gross |
|
| Estimated |
| ||||
Investments: |
|
|
|
|
|
|
|
|
|
|
|
| ||||
Certificates of deposit due in one year or less |
| $ | 100,000 |
|
| $ | — |
|
| $ | — |
|
| $ | 100,000 |
|
Total |
| $ | 100,000 |
|
| $ | — |
|
| $ | — |
|
| $ | 100,000 |
|
6. Property and Equipment, Net
As of December 31, 2021 and 2020, property and equipment, net consist of the following:
|
| As of December 31, |
| |||||
|
| 2021 |
|
| 2020 |
| ||
Server and computer equipment |
| $ | 8,349 |
|
| $ | 8,108 |
|
Capitalized internal-use software |
|
| 3,041 |
|
|
| 149 |
|
Capitalized website development |
|
| 22,037 |
|
|
| 16,328 |
|
Furniture and fixtures |
|
| 8,615 |
|
|
| 7,320 |
|
Leasehold improvements |
|
| 24,082 |
|
|
| 20,507 |
|
Construction in progress |
|
| 854 |
|
|
| 1,024 |
|
Finance lease right-of-use assets |
|
| 556 |
|
|
| 41 |
|
|
|
| 67,534 |
|
|
| 53,477 |
|
Less accumulated depreciation and amortization |
|
| (35,324 | ) |
|
| (25,994 | ) |
Property and equipment, net |
| $ | 32,210 |
|
| $ | 27,483 |
|
For the year ended December 31, 2021, 2020, and 2019, depreciation and amortization expense, excluding amortization of intangible assets, amortization of capitalized hosting arrangements, and write offs, was $10,324, $8,198 and $7,168, respectively.
96
For the year ended December 31, 2021, the Company wrote off $2,481 of U.S. capitalized website development costs within operating expense in the consolidated income statements related to certain developed technology in which the Company has decided to cease investment. For the year ended December 31, 2020, the Company wrote off $1,151 of capitalized website development costs, of which $844 related to the exit of certain international markets in connection with the Expense Reduction Plan.
Capitalized website development costs increased $5,709 due to continued investment in our product offerings. Leasehold improvements costs increased $3,575 due to the costs associated with the additional leased space in 55 Cambridge Parkway, as discussed further in Note 9 of these consolidated financial statements. Capitalized internal-use software costs increased $2,892 due to additions related to internal engineering and development tools.
7. Goodwill and Other Intangible Assets
Goodwill
As of December 31, 2021, changes in the carrying value of goodwill are as follows:
|
| United States |
|
| International |
|
| Total |
| |||
Balance as of December 31, 2020 |
| $ | 12,477 |
|
| $ | 16,652 |
|
| $ | 29,129 |
|
CarOffer acquisition (1) |
|
| 130,451 |
|
|
| — |
|
|
| 130,451 |
|
Foreign currency translation adjustment |
|
| — |
|
|
| (1,293 | ) |
|
| (1,293 | ) |
Balance as of December 31, 2021 |
| $ | 142,928 |
|
| $ | 15,359 |
|
| $ | 158,287 |
|
The Company assessed its goodwill for impairment and did 0t identify any impairment as of December 31, 2021.
Other Intangible Assets
As of December 31, 2021 and 2020, intangible assets consist of the following:
|
| As of December 31, 2021 |
| |||||||||||||||||
|
| Weighted |
|
| Gross |
|
| Accumulated |
|
| Impairment |
|
| Net Carrying |
| |||||
Brand |
|
| 9.4 |
|
| $ | 32,274 |
|
| $ | 4,206 |
|
| $ | — |
|
| $ | 28,068 |
|
Customer relationships |
|
| 2.0 |
|
|
| 19,870 |
|
|
| 7,314 |
|
|
| — |
|
|
| 12,556 |
|
Developed technology |
|
| 2.0 |
|
|
| 65,212 |
|
|
| 21,274 |
|
|
| 647 |
|
|
| 43,291 |
|
Total |
|
|
|
| $ | 117,356 |
|
| $ | 32,794 |
|
| $ | 647 |
|
| $ | 83,915 |
| |
|
| As of December 31, 2020 |
| |||||||||||||||||
|
| Weighted |
|
| Gross |
|
| Accumulated |
|
| Impairment |
|
| Net Carrying |
| |||||
Brand |
|
| 8.4 |
|
| $ | 9,405 |
|
| $ | 1,235 |
|
| $ | — |
|
| $ | 8,170 |
|
Customer relationships |
|
| 1.6 |
|
|
| 1,886 |
|
|
| 938 |
|
|
| — |
|
|
| 948 |
|
Developed technology |
|
| 2.4 |
|
|
| 2,213 |
|
|
| 469 |
|
|
| — |
|
|
| 1,744 |
|
Total |
|
|
|
| $ | 13,504 |
|
| $ | 2,642 |
|
| $ | — |
|
| $ | 10,862 |
| |
For the year ended December 31, 2021, 2020, and 2019, amortization of intangible assets was $30,152, $1,993, and $649, respectively.
97
For the year ended December 31, 2021, the Company wrote off $647 of U.S. intangible assets within cost of revenue in the consolidated income statements related to certain developed technology which the Company has decided to cease investment.
As of December 31, 2021, estimated amortization expense of intangible assets for future periods is as follows:
Year Ending December 31, |
| Amortization |
| |
2022 |
|
| 30,782 |
|
2023 |
|
| 30,118 |
|
2024 |
|
| 4,082 |
|
2025 |
|
| 3,045 |
|
2026 |
|
| 3,045 |
|
Thereafter |
|
| 12,843 |
|
Total |
| $ | 83,915 |
|
8. Accrued Expenses, Accrued Income Taxes and Other Current Liabilities and Other Non-Current Liabilities
As of December 31, 2021 and 2020, accrued expenses, accrued income taxes and other current liabilities consist of the following:
|
| As of December 31, |
| |||||
|
| 2021 |
|
| 2020 |
| ||
Accrued bonus |
| $ | 11,777 |
|
| $ | 10,845 |
|
Accrued commissions |
|
| 2,293 |
|
|
| 3,941 |
|
Accrued income taxes |
|
| 6,344 |
|
|
| 233 |
|
Accrued advertising costs |
|
| 5,583 |
|
|
| — |
|
Accrued distributions to redeemable noncontrolling interest holders |
|
| 8,701 |
|
|
| — |
|
Payments received in advance from third-party payment processor |
|
| 28,075 |
|
|
| — |
|
Other accrued expenses, accrued income taxes and other current liabilities |
|
| 15,813 |
|
|
| 9,732 |
|
Total |
| $ | 78,586 |
|
| $ | 24,751 |
|
Accrued distributions to redeemable noncontrolling interest holders relate to mandatory tax distributions to non-controlling interest members for the estimated tax liability on their respective taxable income. Payments received in advance from third-party payment processor relate to payments received in advance of $46,822, offset by receivables in transit from the third-party payment processor of $18,747.
As of December 31, 2021 and 2020, other non-current liabilities consist of the following:
|
| As of December 31, |
| |||||
|
| 2021 |
|
| 2020 |
| ||
CO Incentive Unit and Subject Unit liability-classified awards |
| $ | 21,095 |
|
| $ | — |
|
Other non-current liabilities |
|
| 2,544 |
|
|
| 3,075 |
|
Total |
| $ | 23,639 |
|
| $ | 3,075 |
|
CO Incentive Unit and Subject Unit liability-classified awards related to liability-classified awards that were recognized in connection with the Company’s acquisition of a 51% interest in CarOffer, as discussed further in Note 2 and Note 10 of these consolidated financial statements.
98
9. Commitments and Contingencies
Contractual Obligations and Commitments
As of December 31, 2021, all of the Company’s property, equipment, and internal-use software have been purchased with cash with the exception of amounts related to unpaid property and equipment, capitalized website development, capitalized internal-use software and hosting arrangements and amounts related to obligations under finance leases as disclosed in the consolidated statements of cash flows. The Company has certain contingent liabilities that arise in the ordinary course of business activities. The Company accrues for loss contingencies when losses become probable and are reasonably estimable. If the reasonable estimate of the loss is a range and no amount within the range is a better estimate, the minimum amount of the range is recorded as a liability. The Company does not accrue for contingent losses that, in its judgment, are considered to be reasonably possible, but not probable; however, it discloses the range of such reasonably possible losses.
Recent Adopted Accounting Pronouncements
Lease Accounting
In February 2016, the FASB issued ASC 842, which requires a lessee to recognize most leases on the consolidated balance sheet but recognize expenses on the consolidated income statement in a manner similar to current practice. The update states that a lessee will recognize a lease liability for the obligation to make lease payments and a right-of-use asset for the right to use the underlying assets for the lease term. The Company adopted ASC 842 as of January 1, 2019, using the additional transition method offered through ASU No. 2018-11. This approach provides a method for recording existing leases at the adoption date and recognizing a cumulative-effect adjustment to the opening balance of retained earnings in the period of adoption.material long-term purchase obligations outstanding with any vendor or third party.
Lease OverviewLeases
The Company’s primary operating lease obligations consist of various leases for office space in: Boston, Massachusetts; Cambridge, Massachusetts; Detroit, Michigan; Los Angeles,San Francisco, California; Addison, Texas; and Dublin, Ireland; and London, United Kingdom. The Detroit, Los Angeles and London leases are immaterial to the Company.Ireland. The Company also has an operating lease obligation for data center space in Needham, Massachusetts.
On December 19, 2019, the CompanyJanuary 25, 2021, CarOffer entered into an operating leasea sublease in Addison, Texas at 15601 Dallas Parkway for the lease of 273,595approximately 61,826 square feet of office space with a non-cancellable lease term through 2030. The sublease commenced on March 1, 2021. CarOffer’s monthly base rent for the premises is payable from January 1, 2022.The lease provides for annual rent increases through the term of the lease. In connection with the sublease, CarOffer entered into a financing lease arrangement for furniture and fixtures used in connection with its operations. The term of the financing lease is for the entire period of the sublease. The monthly rent for the furniture and fixtures is included in the sublease monthly rent, with ownership of the furniture and fixtures transferring to CarOffer at the expiration of the lease term. Monthly rent payments are allocated based upon the relative fair value of the office space and furniture of 95% and 5%, respectively.
On June 12, 2020, the Company amended its operating lease agreement in Boston, Massachusetts at 1001 Boylston Street.Street, which was originally entered into on December 19, 2019 for the lease of 273,595 square feet of office space (the “Original Boston Lease Agreement”). Pursuant to this amendment, the Company exercised its right to reduce the amount of office space agreed to under the lease to 225,428 square feet, and the parties agreed to certain other changes to the lease as set forth in the amendment. The Company is expecting to move into the office space in 2023. As the lease has been signed but the lease term has not commenced, there is no impact to the consolidated financial statements.
The Original Boston Lease Agreement provides for leasehold improvement incentives and provides for annual rent increases through the term of the lease. lease, and provides for variable payments related to management fees. The “Commencement Date” of the lease term is the earlier to occur of (i) the date that is twelve months following the Delivery Date (as defined in the lease) and (ii) the date that the Company first occupies the premises for the normal conduct of business for the Permitted Use (as defined in the lease). The initial term will commence on the Commencement Date and expire on the date that is one hundred and eighty full calendar months after the Commencement Date (plus the partial month, if any, immediately following the Commencement Date). The lease provides for the option to terminate early under certain circumstances including if there is a material delay in construction (subject to the terms and conditions of the lease), and contains two Company options to extend the lease term (including for a portion of the office space thereunder) for an additional period of five years.
On August 30, 2019, the Company amended its operating lease agreement in Cambridge, Massachusetts at 55 Cambridge Parkway, which was originally entered into on March 11, 2016 and subsequently amended on July 30, 2016, for the lease of 51,923 square feet of office space. The 2019 amendment granted the Company an additional 36,689 square feet of office space and extended the non-cancellable lease term through 2025 for the office space currently occupied. The Company accounted for the additional 36,689 square feet of office space as a new lease as it provides an additional right-of-use asset that is not included in the original lease and the additional lease payments were determined to be commensurate with the standalone price of the additional space. The non-cancellable lease term of the additional space ends in 2025, with a portion ending in 2023. The term extension of the existing 51,923 square feet of office space was recordedrecognized as a lease modification withinin the consolidated balance sheet as of December 31, 2019. The lease, as amended, provides for (i) an option to extend the lease term with respect to a portion of the office space for an additional period of five years, (ii) leasehold improvement incentives and (iii) annual rent increases through the term of the lease.
On May 1, 2019, the Company entered into an operating lease in Needham, Massachusetts for the lease of data center space with a non-cancellable term through 2022 with automatic renewal for one yearthereafter if not terminated.terminated. The lease provides for annual rent increases through the term of the lease.
99
On January 10, 2019, Auto List, Inc., which the Company acquired on January 16, 2020, entered into an operating lease in San Francisco, California at 332 Pine St. for the lease of 6,345 square feet of office space with a non-cancellable lease term through 2024. The lease provides for annual rent increases through the term of the lease.
On June 19, 2018, the Company entered into an operating lease in Cambridge, Massachusetts at 121 First Street for the lease of 48,393 square feet of office space with a non-cancellable lease term through 2033 with an option to extend the lease term for two additional periods of five years each. The lease providedprovides for leasehold improvement incentives and provides for annual rent increases through the term of the lease. The Company subleasessubleased the fifth floor to another party and recordsrecognized the sublease income inwithin other income, (expense), net withinin the consolidated income statement. The sublease income is immaterial asexpired in August 2020. As of December 31, 2019.2020 and 2019, sublease income was immaterial. The Company entered into a noncancelable agreement to sublease the second and third floors and a portion of the first floor to another party on December 23, 2021. The sublease provides for annual rent increases throughout the three-and-a-half-year term of the sublease. The sublease contains a sublessee option to extend the term of the sublease for three additional years, and it includes a sublessee option to expand the sublease to the fourth and fifth floors of the building. The sublease contains both lease and non-lease components in the contract. Non-lease components relate to parking and operating and utilities expenses. As a result of the practical expedient elected under ASC 842, the Company combines the lease and these non-lease components. As the sublease has not yet commenced, there is no impact to the consolidated financial statements. The sublease commenced in January 2022.
On September 26, 2017, the Company assumed an operating lease, which was entered into by the original lessee on August 12, 2013, for the lease of 13,345 square feet of office space in Dublin, Ireland at Styne House, Upper Hatch Street with a non-cancellable term through 2023. The lease provided for a rent increase at the end of year five of the original lease term.
On October 8, 2014, the Company entered into an operating lease in Cambridge, Massachusetts at 2 Canal Park for the lease of 48,059 square feet of office space with a non-cancellable lease term through 2022 with an option to extend the lease term for one additional period of five years. The lease providedprovides for leasehold improvement incentives and provides for annual rent increases through the term of the lease. On October 6, 2021, the Company entered into a one-year non-cancellable sublease for the same 48,059 square feet of office space that will commence on December 1, 2022, after the expiration of the current lease term from another party, with an option to extend the sublease term for an additional period of five years. The sublease is treated as a separate contract from the current lease as the contract was separately negotiated with a new Landlord.As the lease term is 12 months, 0 additional right-of-use asset will be recognized in line with the Company’s policy in Note 2 of these consolidated financial statements. As the sublease has not yet commenced, there is no impact to the consolidated financial statements.
The Company’s financing lease obligations consist of a lease for furniture and office equipment and are immaterial.
The leases in Boston, Massachusetts, and Cambridge, Massachusetts and San Francisco, California have associated letters of credit, which are recorded asrecognized within restricted cash withinin the consolidated balance sheet. Atsheets. As of December 31, 20192021 and 2018,2020, restricted cash was $10,803$16,336 and $2,671,$10,627, respectively, and primarily related to cash held at a financial institution in an interest-bearing cash account as collateral for the letters of credit related to the contractual provisions for the Company’s building leases. Atleases and pass-through payments from customers related to the Company's wholesale business. As December 31, 20192021 and 2018,2020, portions of restricted cash were classified as a short-term asset and long-term asset. Additionally, the 121 First Street lease agreement has an associated security deposit, which is recordedasset, as disclosed in other non-current assets, net within the consolidated balance sheet.sheets.
Prior to adoption of ASC 842
Prior to the adoption of ASC 842, the Company categorized leases at their inception as either operating or capital leases. On certain lease arrangements, the Company may have received rent holidays or other incentives. The Company recognized lease costs on a straight‑line basis once it achieved control of the space, without regard to deferred payment terms, such as rent holidays, that deferred the commencement date of required payments or escalating payment amounts. The Company recorded the difference between required lease payments and rent expense as deferred rent. Additionally, incentives received were treated as a reduction of costs over the term of the agreement, as they were considered an inseparable part of the lease agreement.
As of December 31, 2018, the Company had deferred rent and rent incentives of $11,088, of which $1,693 and $9,395, respectively, are classified as a short‑term liability and a long‑term liability in the corresponding consolidated balance sheet. Rent expense related to the operating leases forFor the years ended December 31, 20182021, 2020, and 2017 was $7,711 and $5,994, respectively.
Following adoption of ASC 842
Upon adoption of ASC 842, the Company elected the transition relief package, permitted within the standard, pursuant to which the Company did not reassess the classification of existing leases, whether any expired or existing contracts contain a lease, and whether existing leases have any initial direct costs. The Company also elected the practical expedient of not separating lease components from non-lease components for all leases. There was 0 cumulative-effective adjustment to the opening balance of retained earnings. The Company reviews all material contracts for embedded leases to determine if they have a right-of-use asset.
The Company recognizes rent expense on a straight-line basis over the lease period. The depreciable life of assets and leasehold improvement are limited by the expected lease term, unless there is a transfer of title or purchase option reasonably certain of exercise.
Variable lease payments that depend on an index or a rate are included in the lease payments and are measured using the prevailing index or rate at the measurement date. Variable lease payments not based on an index or a rate are excluded from lease payments and are expensed as incurred.
The Company also made an accounting policy election to not recognize a lease liability or right-of-use asset on its consolidated balance sheet for leases with an initial term of twelve months or less, and instead to recognize lease payments on the consolidated income statement on a straight-line basis over the lease term and variable lease payments that do not depend on an index or rate as expense in the period in which the achievement of the specified target that triggers the variable lease payments becomes probable.
Adoption of the new standard resulted in the recording of net lease assets and lease liabilities of $52,334 and $63,280, respectively, as of January 1, 2019. The standard did not materially impact the consolidated statement of cash flows and had no impact on the consolidated income statement.
During the years ended December 31, 2019, and 2018, the Company recognized $10,260$15,844, $14,157, and $7,711,$10,260, respectively, of lease costs for leases that have commenced. The Company allocates lease costs across all departments based on headcount in the respective location.
For leases commenced, asAs of December 31, 2019,2021 and 2020, for leases that have commenced the weighted average remaining lease term was 8.87.6 years and 7.7 years, respectively, and the weighted average discount rate was 5.2%.5.3% and 5.3%, respectively. As most of the Company’s leases do not provide an implicit rate, the Company uses an estimated incremental borrowing rate based on the information available at lease commencement in determining the present value of lease payments. The Company estimated the incremental borrowing rate based on the rate of interest the Company would have to pay to borrow a similar amount on a collateralized basis over a similar term. The Company has no historical debt transactions and a collateralized rate is estimated based on a group of peer companies. The Company used the incremental borrowing rate on January 1, 2019 for leases that commenced prior to that date.
Future100
As of December 31, 2021, future minimum lease payments as of December 31, 2019 are as follows:
Year Ending December 31, |
| Operating Lease Commitments |
| |
2020 |
| $ | 12,201 |
|
2021 |
|
| 13,088 |
|
2022 |
|
| 13,016 |
|
2023 |
|
| 9,858 |
|
2024 |
|
| 8,835 |
|
Thereafter |
|
| 34,423 |
|
Total lease payments |
|
| 91,421 |
|
Less imputed interest |
|
| (21,822 | ) |
Total |
| $ | 69,599 |
|
Year Ending December 31, |
| Operating |
| |
2022 |
| $ | 16,573 |
|
2023 |
|
| 14,736 |
|
2024 |
|
| 13,122 |
|
2025 |
|
| 6,091 |
|
2026 |
|
| 5,540 |
|
Thereafter |
|
| 32,965 |
|
Total lease payments |
|
| 89,027 |
|
Less imputed interest |
|
| (18,322 | ) |
Total |
| $ | 70,705 |
|
The chart above does not include options to extend lease terms that are not reasonably certain of being exercised or leases signed but not yet commenced as of December 31, 2019. Total2021. As of December 31, 2021, total estimated future minimum lease payments for leases signed but not yet commenced, aswhich consists only of December 31, 2019, which includesthe sublease for 2 Canal Park and the 1001 Boylston Street and portions of 55 Cambridge Parkway, are estimated to be $317,837lease and have expected commencement dates ranging from February 2020 to January 2022.
Stock-Based Compensation
In June 2018, the FASB issued ASU 2018-07, Compensation—Stock Compensation (Topic 718) (“ASU 2018-07”). ASU 2018-07 expands the scope of Topic 718, Compensation—Stock Compensation, to include share-based payment transactions for acquiring goodsin December 2022 and services from non-employees. The amendments in this update state that an entity should apply the requirements of Topic 718 to non-employee awards except for specific guidance on inputs to an option pricing model and the attribution of cost (that is, the period of time over which share-based payment awards vest and the pattern of cost recognition over that period). The amendments specify that Topic 718 applies to all share-based payment transactions in which a grantor acquires goods or services2023, respectively, are estimated to be used or consumed in a grantor’s own operations by issuing share-based payment awards. The amendments also clarify that Topic 718 does not apply to share-based payments used to effectively provide (1) financing to the issuer or (2) awards granted in conjunction with selling goods or services to customers as part of$256,525.
a contract accounted for under Topic 606. The amendments in this update are effective for public business entities for fiscal years beginning after December 15, 2018, including interim periods within that fiscal year. For all other entities, the amendments are effective for fiscal years beginning after December 15, 2019, and interim periods within fiscal years beginning after December 15, 2020. Early adoption is permitted, but no earlier than an entity’s adoption date of Topic 606. The Company has assessed the impact of this guidance on its consolidated financial statements and does not deem it to be material. The Company adopted the guidance on January 1, 2019 prospectively.
Internal-Use Software
In August 2018, the FASB issued ASU 2018-15, Intangibles—Goodwill and Other—Internal-Use Software (Subtopic 350-40) Customer’s Accounting for Implementation Costs Incurred in a Cloud Computing Arrangement That Is a Service Contract. This update aligns the requirements for capitalizing implementation costs incurred in a hosting arrangement that is a service contract with the requirements for capitalizing implementation costs incurred to develop or obtain internal-use software. This new standard requires companies to amortize the capitalized implementation costs over the term of the hosting arrangement. Amounts amortized would be presented through operating expense, rather than depreciation or amortization. Accounting for the service component of a hosting arrangement remains unchanged. The new standard is effective for fiscal years, and interim periods within those fiscal years, beginning after December 15, 2019. Early adoption is permitted and an entity can elect to apply the new guidance on a prospective or retrospective basis. The Company adopted this standard effective January 1, 2019 and applied the guidance using a prospective transition method for each period presented.
Recent Accounting Pronouncements Not Yet Adopted
From time to time, new accounting pronouncements are issued by the FASB or other standard-setting bodies and adopted by the Company on or prior to the specified effective date. Unless otherwise discussed, the Company believes that the impact of recently issued standards that are not yet effective will not have a material impact on its financial position or results of operations upon adoption.
In December 2019, the FASB issued ASU 2019-12, Income Taxes – Simplifying the Accounting for Income Taxes. The new guidance simplifies the accounting for income taxes by removing several exceptions in the current standard and adding guidance to reduce complexity in certain areas, such as requiring that an entity reflect the effect of an enacted change in tax laws or rates in the annual effective tax rate computation in the interim period that includes the enactment date. The new standard is effective for fiscal years, and interim periods within those fiscal years, beginning after December 15, 2020, with early adoption permitted. The Company is currently assessing the impact that adopting this guidance will have on its consolidated financial statements.
In January 2017, the FASB issued ASU 2017-04, Intangibles – Goodwill and Other (Topic 350): Simplifying the Test for Goodwill Impairment. The new guidance simplifies the accounting for goodwill impairment by eliminating Step 2 of the goodwill impairment test. Under current guidance, Step 2 of the goodwill impairment test requires entities to calculate the implied fair value of goodwill in the same manner as the amount of goodwill recognized in a business combination by assigning the fair value of a reporting unit to all of the assets and liabilities of the reporting unit. The carrying value in excess of the implied fair value is recognized as goodwill impairment. Under the new standard, goodwill impairment is recognized based on Step 1 of the current guidance, which calculates the carrying value in excess of the reporting unit’s fair value. The new standard is effective beginning in January 2020, with early adoption permitted. The Company does not expect the impact of adopting this guidance to be material to its consolidated financial statements.
In June 2016, the FASB issued ASU 2016-13, Financial Instruments-Credit Losses (Topic 326): Measurement of Credit Losses on Financial Instruments. ASU 2016-13 and its subsequent related updates establish a new forward-looking “expected loss model” that requires entities to estimate current expected credit losses on accounts receivable and financial instruments by using all practical and relevant information. The new standard and its subsequent related updates are effective for fiscal years beginning after December 15, 2019, including interim periods within those fiscal years, with early adoption permitted. The Company is currently assessing the impact that adopting this guidance will have on its consolidated financial statements, but does not expect it to be material.
3. Acquisitions
On January 8, 2019, the Company, through CarGurus U.K. Limited, a company incorporated in England & Wales and a wholly owned subsidiary of CarGurus Ireland Limited, a company incorporated in Ireland and a wholly owned subsidiary of the Company (the “Purchaser”), completed its acquisition of PistonHeads, a U.K.-based automotive website (“PistonHeads”), by acquiring the entire issued share capital of Haymarket New4 Ltd., a company incorporated in England & Wales and now known as PistonHeads Holdco Limited (“NewCo”), from Haymarket Media Group Ltd., a company incorporated in England & Wales (the “Seller”), on the terms and subject to the conditions set forth in the Put and Call Option Agreement dated December 3, 2018, by and among the Purchaser, the Seller and Haymarket Group Limited, a company incorporated in England & Wales. The PistonHeads website hosts used car classifieds, articles and user forums. The Purchaser paid an aggregate of 15,000 GBP, or approximately $19,139, to acquire the business, inclusive of 1,000 GBP, or approximately $1,276, being held in escrow to secure post-closing claims, subject to the terms and conditions of an escrow agreement among the escrow agents, the Purchaser and the Seller. Upon completion of the acquisition, NewCo became a wholly owned subsidiary of the Purchaser. The business combination was intended to expand the Company’s consumer audience in the U.K. As of December 31, 2019, the Company has incurred total acquisition-related costs of $779 related to the transaction.
The acquisition has been accounted for2021, future minimum lease income payments are as a business combination under the acquisition method and, accordingly, the total purchase price is allocated to the intangible assets and goodwill. Acquired tangible assets and assumed liabilities are immaterial. The following table presents the purchase price allocation recorded in the Company's consolidated balance sheet as of the acquisition date, which was finalized as of December 31, 2019:
|
| Estimated Fair Value at Date of Acquisition |
|
| Adjustment |
|
| Adjusted Fair Value at Date of Acquisition |
| |||
Intangible assets (1) |
| $ | 4,466 |
|
| $ | — |
|
| $ | 4,466 |
|
Goodwill (2) |
|
| 15,521 |
|
|
| (655 | ) |
|
| 14,866 |
|
Deferred tax liabilities (3) |
|
| (848 | ) |
|
| 655 |
|
|
| (193 | ) |
Total purchase price |
| $ | 19,139 |
|
| $ | — |
|
| $ | 19,139 |
|
|
|
|
|
|
|
Actual and pro forma results for this acquisition have not been presented as the financial impact to the Company’s consolidated financial statements is not material.
4. Fair Value of Financial Instruments Including Cash, Cash Equivalents and Investments
ASC 820, Fair Value Measurements and Disclosures, establishes a three‑level valuation hierarchy for instruments measured at fair value that distinguishes between assumptions based on market data (observable inputs) and the Company’s own assumptions (unobservable inputs). Observable inputs are inputs that market participants would use in pricing the asset or liability based on market data obtained from sources independent of the Company. Unobservable inputs are inputs that reflect the Company’s assumptions about the inputs that market participants would use in pricing the asset or liability, and are developed based on the best information available in the circumstances.
ASC 820 identifies fair value as the exchange price, or exit price, representing the price that would be received to sell an asset or paid to transfer a liability in an orderly transaction between market participants based on the highest and best use of the asset or liability. As such, fair value is a market‑based measurement that should be determined based on assumptions that market participants would use in pricing an asset or liability. The Company uses valuation techniques to measure fair value that maximize the use of observable inputs and minimize the use of unobservable inputs. These inputs are prioritized as follows:
Level 1 — Quoted unadjusted prices for identical instruments in active markets.
Level 2 — Quoted prices for similar instruments in active markets, quoted prices for identical or similar instruments in markets that are not active, and model‑derived valuations in which all observable inputs and significant value drivers are observable in active markets.
Level 3 — Model‑derived valuations in which one or more significant inputs or significant value drivers are unobservable, including assumptions developed by the Company.
The following tables present, for each of the fair value levels, the Company’s assets that are measured at fair value on a recurring basis at December 31, 2019 and 2018:
|
| December 31, 2019 |
| |||||||||||||
|
| Quoted Prices in Active Markets for Identical Assets (Level 1 Inputs) |
|
| Significant Other Observable Inputs (Level 2 Inputs) |
|
| Significant Unobservable Inputs (Level 3 Inputs) |
|
| Total |
| ||||
Cash equivalents: |
|
|
|
|
|
|
|
|
|
|
|
|
|
|
|
|
Money market funds |
| $ | 29,196 |
|
| $ | — |
|
| $ | — |
|
| $ | 29,196 |
|
Investments: |
|
|
|
|
|
|
|
|
|
|
|
|
|
|
|
|
Certificates of deposit |
|
| — |
|
|
| 111,692 |
|
|
| — |
|
|
| 111,692 |
|
Total |
| $ | 29,196 |
|
| $ | 111,692 |
|
| $ | — |
|
| $ | 140,888 |
|
|
| December 31, 2018 |
| |||||||||||||
|
| Quoted Prices in Active Markets for Identical Assets (Level 1 Inputs) |
|
| Significant Other Observable Inputs (Level 2 Inputs) |
|
| Significant Unobservable Inputs (Level 3 Inputs) |
|
| Total |
| ||||
Cash equivalents: |
|
|
|
|
|
|
|
|
|
|
|
|
|
|
|
|
Money market funds |
| $ | 24 |
|
| $ | — |
|
| $ | — |
|
| $ | 24 |
|
Investments: |
|
|
|
|
|
|
|
|
|
|
|
|
|
|
|
|
Certificates of deposit |
|
| — |
|
|
| 122,800 |
|
|
| — |
|
|
| 122,800 |
|
Total |
| $ | 24 |
|
| $ | 122,800 |
|
| $ | — |
|
| $ | 122,824 |
|
The Company measures eligible assets and liabilities at fair value with changes in value recognized in earnings. There were 0 liabilities that were measured at fair value as of December 31, 2019 and 2018. Fair value treatment may be elected either upon initial recognition of an eligible asset or liability or, for an existing asset or liability, if an event triggers a new basis of accounting. The Company did not elect to remeasure any of its existing financial assets and did not elect the fair value option for any financial assets transacted during the year ended December 31, 2019 or the year ended December 31, 2018.
The following is a summary of cash, cash equivalents, and investments as of December 31, 2019 and 2018.
|
| Amortized Cost |
|
| Gross Unrealized Gains |
|
| Gross Unrealized Losses |
|
| Estimated Fair Value |
| ||||
December 31, 2019: |
|
|
|
|
|
|
|
|
|
|
|
|
|
|
|
|
Cash and cash equivalents due in 90 days or less |
| $ | 59,920 |
|
| $ | — |
|
| $ | — |
|
| $ | 59,920 |
|
Investments: |
|
|
|
|
|
|
|
|
|
|
|
|
|
|
|
|
Certificates of deposit due in one year or less |
|
| 111,692 |
|
|
| — |
|
|
| — |
|
|
| 111,692 |
|
Total cash, cash equivalents, and investments |
| $ | 171,612 |
|
| $ | — |
|
| $ | — |
|
| $ | 171,612 |
|
|
| Amortized Cost |
|
| Gross Unrealized Gains |
|
| Gross Unrealized Losses |
|
| Estimated Fair Value |
| ||||
December 31, 2018: |
|
|
|
|
|
|
|
|
|
|
|
|
|
|
|
|
Cash and cash equivalents due in 90 days or less |
| $ | 34,887 |
|
| $ | — |
|
| $ | — |
|
| $ | 34,887 |
|
Investments: |
|
|
|
|
|
|
|
|
|
|
|
|
|
|
|
|
Certificates of deposit due in one year or less |
|
| 122,800 |
|
|
| — |
|
|
| — |
|
|
| 122,800 |
|
Total cash, cash equivalents, and investments |
| $ | 157,687 |
|
| $ | — |
|
| $ | — |
|
| $ | 157,687 |
|
5. Property and Equipment, Net
Property and equipment, net consists of the following:
|
| At December 31, |
| |||||
|
| 2019 |
|
| 2018 |
| ||
Capitalized equipment |
| $ | 7,923 |
|
| $ | 4,208 |
|
Capitalized software |
|
| 181 |
|
|
| 252 |
|
Capitalized website development costs |
|
| 11,083 |
|
|
| 6,907 |
|
Furniture and fixtures |
|
| 6,809 |
|
|
| 4,584 |
|
Leasehold improvements |
|
| 19,507 |
|
|
| 10,821 |
|
Construction in progress |
|
| 524 |
|
|
| 8,971 |
|
Finance lease right-of-use assets |
|
| 78 |
|
|
| - |
|
|
|
| 46,105 |
|
|
| 35,743 |
|
Less accumulated depreciation and amortization |
|
| (18,155 | ) |
|
| (11,474 | ) |
Property and equipment, net |
| $ | 27,950 |
|
| $ | 24,269 |
|
Depreciation and amortization expense, excluding amortization of intangible assets, was $7,168, $5,029, and $3,795 for the years ended December 31, 2019, 2018, and 2017, respectively. The increase of $8,686 in leasehold improvements and the decrease of $8,447 in construction in progress at December 31, 2019 was primarily due to costs incurred to build out the Company’s new leased facility at 121 First Street in Cambridge, Massachusetts. The facility became occupied subsequent to December 31, 2018, at which time the assets ceased to be classified as construction in progress and became classified as leasehold improvement.
6. Goodwill and other intangible assets
Goodwill
The changes in the carrying value of goodwill were as follows:
Balance at December 31, 2018 |
| $ | — |
|
Initial value of PistonHeads acquisition |
|
| 15,521 |
|
Foreign currency translation adjustment |
|
| 341 |
|
Purchase price adjustment (1) |
|
| (655 | ) |
Balance at December 31, 2019 |
| $ | 15,207 |
|
|
|
The Company did not have a goodwill balance prior to the closing of the PistonHeads acquisition on January 8, 2019. The Company tests goodwill for impairment at least annually or whenever events or changes in circumstances indicate that the carrying value may not be recoverable. The Company evaluated goodwill for impairment on October 1, 2019 and did 0t recognize an impairment charge.
Other Intangible Assets
Intangible assets as of December 31, 2019 consist of the following:
|
| Weighted Average Remaining Useful Life (years) |
|
| Gross Carrying Amount |
|
| Accumulated Amortization |
|
| Net Carrying Amount |
| ||||
Brand |
|
| 10.0 |
|
| $ | 3,524 |
|
| $ | 313 |
|
| $ | 3,211 |
|
Customer relationships |
|
| 2.0 |
|
|
| 1,045 |
|
|
| 336 |
|
|
| 709 |
|
Total |
|
|
|
|
| $ | 4,569 |
|
| $ | 649 |
|
| $ | 3,920 |
|
The Company did not have intangible assets prior to the closing of the PistonHeads acquisition on January 8, 2019. The Company recorded amortization expense related to intangible assets of $649 for the year ended December 31, 2019.
Year Ending December 31, |
| Sublease |
| |
2022 |
| $ | 882 |
|
2023 |
|
| 1,876 |
|
2024 |
|
| 1,923 |
|
2025 |
|
| 1,021 |
|
2026 |
|
| — |
|
Thereafter |
|
| — |
|
Total |
| $ | 5,702 |
|
Acquisitions
The estimated useful lifeOn January 14, 2021 the Company completed the acquisition of brand and customer relationships is 11 years and 3 years, respectively. The Company evaluatesa 51% interest in CarOffer, an automated instant vehicle trade platform based in Addison, Texas, with the useful livesoption to acquire portions of the remaining equity in the future. Details of this acquisition are more fully described in Note 4 of these assets on an annual basis and tests for impairment whenever events or changes in circumstances occur that could impact the recoverability of these assets.consolidated financial statements.
Estimated amortization expense of intangible assets for future periods as of December 31, 2019, is as follows:
Year Ending December 31, |
| Amortization Expense |
| |
2020 |
| $ | 671 |
|
2021 |
|
| 671 |
|
2022 |
|
| 328 |
|
2023 |
|
| 320 |
|
2024 |
|
| 320 |
|
2025 and thereafter |
|
| 1,610 |
|
Total |
| $ | 3,920 |
|
7. Accrued expenses, accrued income taxes and other current liabilities
Accrued expenses, accrued income taxes and other current liabilities consist of the following:
|
| At December 31, |
| |||||
|
| 2019 |
|
| 2018 |
| ||
Accrued bonus |
| $ | 8,637 |
|
| $ | 8,266 |
|
Other accrued expenses, accrued income taxes and other current liabilities |
|
| 9,625 |
|
|
| 10,388 |
|
Total |
| $ | 18,262 |
|
| $ | 18,654 |
|
8. Commitments and Contingencies
Contractual Obligations and Commitments
The Company’s operating lease obligations are discussed in Note 2. All of the Company’s property, equipment, and internal-use software have been purchased with cash with the exception of $647 of unpaid property and equipment and immaterial amounts related to obligations under one finance lease as of December 31, 2019. The Company has no material long-term purchase obligations outstanding with any vendors or third parties.
Legal Matters
From time to time the Company may become involved in legal proceedings or be subject to claims arising in the ordinary course of its business. The Company is not presently subject to any pending or threatened litigation that it believes, if determined adversely to the Company, individually, or taken together, would reasonably be expected to have a material adverse effect on its business or financial results.
Guarantees and Indemnification Obligations
In the ordinary course of business, the Company enters into agreements with its customers, partners and service providers that include commercial provisions with respect to licensing, infringement, guarantees, indemnification, and other common provisions. The Company does not, in the ordinary course, agree
CarOffer provides certain guarantees to indemnification obligationsdealers through its 45-Day Guaranteed Bid and OfferGuard product offerings, which are accounted for the Company under its contracts with customers. Based on historical experience and information known at December 31, 2019 and 2018, the Company has not incurred any costs for guarantees or indemnities.ASC 460.
9. Convertible Preferred Stock and Stockholders’ Equity101
On June 21, 2017,45-Day Guaranteed Bid is an arrangement through which a selling dealer lists a car on the Company amendedCarOffer platform, and restated its Certificate of Incorporation pursuant to the Third Amended and Restated Certificate of Incorporation. Under the Third Amended and Restated Certificate of Incorporation, the total number of shares of all classes of stock which the Company had authority to issue was (i) 120,020,700 shares of Class A common stock, par value $0.001 per share, (ii) 80,013,800 shares of Class B common stock, par value $0.001 per share, and (iii) 11,091,782 shares of Preferred Stock, par value $0.001 per share, of which 3,333,000 shares were designated Series A Preferred Stock, 3,329,497 shares were designated Series B Preferred Stock, 1,648,978 shares were designated Series C Preferred Stock, 1,673,105 shares were designated Series D Preferred Stock, and 1,107,202 shares were designated Series E Preferred Stock. The Series A Preferred Stock, Series B Preferred Stock, Series C Preferred Stock, Series D Preferred Stock, and Series E Preferred Stock are referred to collectively as the Preferred Stock.
Upon the effectiveness of the Third Amended and Restated Certificate of Incorporation, (i) each share of Class A common stock issued and outstanding was recapitalized, reclassified, and reconstituted into 2 fully paid and non‑assessable shares of outstanding Class A common stock and 4 fully paid and non‑assessable shares of outstanding Class B common stock, and (ii) each share of Class B common stock of the Company issued and outstanding was recapitalized, reclassified, and reconstituted into 2 fully paid and non‑assessable shares of outstanding Class A common stock and 4 fully paid and non‑assessable shares of outstanding Class B common stock.
Further, upon the effectiveness of the Third Amended and Restated Certificate of Incorporation, the number of shares of common stock as to which each outstanding optionCarOffer provides an offer to purchase common stock was exercisable for and each outstanding RSU was convertible into was adjusted such that upon exercise of outstanding stock options or vesting of outstanding RSUs, each holder would receive 2 fully paid and non‑assessable shares of Class A common stock and 4 fully paid and non‑assessable shares of Class B common stock in respect of each share of common stock previously underlying such option or RSU. The exercisethe vehicle listed at a specified price per share of common stock underlying each outstanding option was adjusted uponat any time over a 45-day period. This provides the effectiveness of the Third Amended and Restated Certificate of Incorporation to be one‑sixth of the exercise price per share in effect immediately prior to such adjustment and the fair market value per share of common stock issuable upon settlement of such RSU was adjusted to be one‑sixth of the fair market value per share in effect immediately prior to the recapitalization.
All share and per share data shown in the accompanying consolidated financial statements and related notes have been retroactively revised to reflect the share recapitalization.
On October 16, 2017, in connection with the closing of the IPO, all of the outstanding shares of Preferred Stock automatically converted into 20,188,226 shares of Class A common stock and 40,376,452 shares of Class B common stock. The 40,376,452 shares of Class B common stock subsequently converted into 40,376,452 shares of Class A common stock resulting in a total conversion of all outstanding shares of Preferred Stock into 60,564,678 shares of Class A common stock. Subsequent to the closing of the IPO, there were 0 shares of Preferred Stock outstanding.
Immediately following such conversion, the Company’s Fourth Amended and Restated Certificate of Incorporation became effective. Pursuant to the Fourth Amended and Restated Certificate of Incorporation, the Company is authorized to issue up to 500,000,000 shares of Class A common stock, 100,000,000 shares of Class B common stock, and 10,000,000 shares of Preferred Stock, allseller with a par value of $0.001 per share. put option, where they have the right, but not the obligation, to require CarOffer to purchase the vehicle during this window. OfferGuard is an arrangement through which a buying dealer purchases a car on the CarOffer platform, and CarOffer provides an offer to purchase the vehicle at a specified price between days 1 and 3, and days 42 and 45 if the dealer is not able to sell the vehicle after 42 days.
As of December 31, 2019,2021, the Preferred Stock is undesignatedmaximum potential amount of future payments that CarOffer could be required to make under these guarantees was $76,075. Of the maximum potential amount of future payments, none are considered probable . The exercise of guarantees has historically been infrequent and even when such exercises did occur the losses were immaterial. As such, as of December 31, 2021, CarOffer had 0 Preferred Stock is outstanding. contingent loss liabilities.
In addition, pursuant to the Fourth Amended and Restated CertificateAs of Incorporation, all shares of Class B common stock will automatically convert into shares of Class A common stock, on a share for share basis, upon the date falling after the first to occur of (1) the death of Langley Steinert, the Company’s Chief Executive Officer and Chairman, (2) his voluntary termination of all employment withDecember 31, 2020, the Company and service on the Company’s board of directors, or (3) the sum of the number of shares of capital stock held by Langley Steinert, bydid 0t have any Family Member of Langley Steinert, and by any Permitted Entity of Langley Steinert (as such terms are defined in the Fourth Amended and Restated Certificate of Incorporation), assuming the exercise and settlement in full of all outstanding options and convertible securities and calculated on an as-converted to Class Aguarantees.
common stock basis, being less than 9,091,484. Shares of Class B common stock will not automatically convert into shares of Class A common stock upon the termination of Mr. Steinert's status as an officer and director, unless such termination is either made voluntarily by Mr. Steinert or due to Mr. Steinert's death. Once converted into Class A common stock, the converted shares of Class B common stock will not be reissued. In addition, if all shares of Class B common stock are converted into Class A common stock, then any outstanding options or convertible securities with the right to purchase or acquire shares of Class B common stock shall become a right to purchase or acquire shares of Class A common stock.
Common Stock
Each share of Class A common stock entitles the holder to 1 vote for each share on all matters submitted to a vote of the Company’s stockholders at all meetings of stockholders and written actions in lieu of meetings. Each share of Class B common stock entitles the holder to 10 votes for each share on all matters submitted to a vote of the Company’s stockholders at all meetings of stockholders and written actions in lieu of meetings.
Holders of common stock are entitled to receive dividends, when and if declared by the Board.
At December 31, 2019, each share of Class B common stock was convertible into 1 share of Class A common stock at the option of the holder at any time. Automatic conversion of each share of Class B common stock will occur upon the occurrence of certain events, as described in the Fourth Amended and Restated Certificate of Incorporation.
Upon the effectiveness of the Company’s Fourth Amended and Restated Certificate of Incorporation, additional terms of conversion and transfer were implemented as discussed above.
Preferred Stock
Prior to the Company’s IPO, at which time all shares of Preferred Stock were converted into shares of common stock, the Company’s Preferred Stock consisted of the following:
|
| Original Issue Price Per Share |
|
| Shares Authorized |
|
| Outstanding |
|
| Liquidation Amount |
|
| Carrying Value |
| |||||
Series A Preferred Stock |
| $ | 0.525053 |
|
|
| 3,333,000 |
|
|
| 2,824,703 |
|
| $ | 1,483 |
|
| $ | 1,483 |
|
Series B Preferred Stock |
| $ | 0.780899 |
|
|
| 3,329,497 |
|
|
| 2,938,486 |
|
|
| 2,295 |
|
|
| 2,295 |
|
Series C Preferred Stock |
| $ | 0.849012 |
|
|
| 1,648,978 |
|
|
| 1,550,612 |
|
|
| 1,316 |
|
|
| 1,316 |
|
Series D Preferred Stock |
| $ | 40.642989 |
|
|
| 1,673,105 |
|
|
| 1,673,105 |
|
|
| 68,000 |
|
|
| 67,872 |
|
Series E Preferred Stock |
| $ | 54.190650 |
|
|
| 1,107,202 |
|
|
| 1,107,202 |
|
|
| 60,000 |
|
|
| 59,732 |
|
|
|
|
|
|
|
| 11,091,782 |
|
|
| 10,094,108 |
|
| $ | 133,094 |
|
| $ | 132,698 |
|
The holders of the Company’s Preferred Stock had certain voting and dividend rights, as well as liquidation preferences and conversion privileges. All rights, preferences, and privileges associated with the Preferred Stock were terminated at the time of the Company’s IPO in conjunction with the conversion of all outstanding shares of Preferred Stock into shares of common stock.
10. Stock‑based Compensation
CarGurus Equity Incentive Plans
The Company’s Amended and Restated 2006 Equity Incentive Plan (the “2006 Plan”) provided for the issuance of non-qualified stock options, restricted stock and stock awards to the Company’s employees, officers, directors and consultants. The 2006 Plan authorized up to an aggregate of 3,444,668 shares of the Company's Class B common stock for such issuances. In conjunction with the effectiveness of the Company’s 2015 Equity Incentive Plan (the “2015 Plan”), the Board voted that 0 further stock options or other equity-based awards may be granted under the 2006 Plan.
In 2015, the Board first adopted the 2015 Plan, which became effective on June 26, 2015. The 2015 Plan provided for the issuance of incentive stock options, non-qualified stock options, restricted stock, stock awards and restricted stock units (“RSUs”)stock-based incentives to employees, consultants and non-employee directors. As of the effective date of the 2015 Plan, up to 603,436 shares of common stock were authorized for issuance under the 2015 Plan. The 2015 Plan was amended and restated effective August 6, 2015 to permit the granting of RSUsrestricted stock units (“RSUs”) under the 2015 Plan, to remove Class B common stock from the pool
of shares available for issuance under the 2015 Plan and to make certain other desired changes. The 2015 Plan was further amended and restated at October 15, 2015 to add a ten-year term and to make certain other desired changes.
The 2015 Plan was further amended and restated effective August 22, 2016 to merge the 2006 Plan into the 2015 Plan, to increase the number of shares of Class A common stock that may be issued under the 2015 Plan, and to lengthen the term of the 2015 Plan to expire on August 21, 2026.2026. In addition, pursuant to this amendment and restatement of the 2015 Plan, prior to giving effect to the recapitalization that occurred on June 21, 2017, there were (i) 618,691 shares of Class A common stock, plus (ii) 802,562 shares of Class B common stock authorized under the 2015 Plan; provided, however, that (1) the number of shares of Class A common stock was increased, on a share for share basis, by the number of shares of Class B common stock that were (a) subject to outstanding options granted under the 2006 Plan that expired, terminated, or were cancelled for any reason without having been exercised, (b) surrendered in payment of the exercise price of outstanding options granted under the 2006 Plan or (c) withheld in satisfaction of tax withholding upon exercise of outstanding options granted under the 2006 Plan, and the number of shares of Class B common stock reserved under the amended and restated 2015 Plan was decreased, on a corresponding share for share basis, (2) no new awards of Class B common stock could be granted under the amended and restated 2015 Plan, and (3) except with respect to outstanding options granted under the 2006 Plan that were exercised on or after the date of the amendment and restatement, no Class B common stock could be issued under the 2015 Plan.
In connection with the recapitalization that occurred on June 21, 2017, the 2015 Plan was further amended and restated to account for each outstanding common stock option being adjusted such that each share of common stock underlying such option became 2 shares of Class A common stock and 4 shares of Class B common stock underlying such option, and each outstanding RSU being adjusted such that each share of common stock issuable upon settlement of such RSU became 2 shares of Class A common stock and 4 shares of Class B common stock issuable upon settlement of such RSU. Pursuant to the 2015 Plan as further amended in connection with the recapitalization, there were (i) 3,181,740 shares of Class A common stock and (ii) 5,161,644 shares of Class B common stock authorized for issuance under the 2015 Plan.
102
In connection with the IPO,Company's initial public offering ("IPO"), in October 2017, the Board adopted, and the Company’s stockholders approved, the Omnibus EquityIncentive Compensation Plan (the “2017 Plan”) for the purpose of granting incentive stock options, non-qualified stock options, stock awards, stock units, other share-based awards and cash awards to employees, advisors and consultants to the Company and its subsidiaries and non-employee members of the Company’s board of directors.Board. The 2017 Plan is the successor to the 2015 Plan. The 2017 Plan authorizes the issuance or transfer of the sum of: (i) 7,800,000 shares of the Company’s Class A common stock, plus (ii) the number of shares of our Class A common stock (up to 4,500,000 shares) equal to the sum of (x) the number of shares of Class A common stock and Class B common stock of the Company subject to outstanding awards under the 2015 Plan as of October 10, 2017 that terminate, expire or are cancelled, forfeited, exchanged, or surrendered on or after October 10, 2017 without having been exercised, vested, or paid prior to October 10, 2017, including shares tendered or withheld to satisfy tax withholding obligations with respect to outstanding grants under the Prior 2015 Plan, plus (y) the number of shares of Class A common stock reserved for issuance under the 2015 Plan that remain available for grant under the 2015 Plan as of the October 10, 2017. The aggregate number of shares of Class A common stock that may be issued or transferred under the 2017 Plan pursuant to incentive stock options will not exceed 12,300,000 shares of Class A common stock. Unless determined otherwise by the Compensation Committee of the Board, as of the first trading day of January of each calendar year during the term of the 2017 Plan (excluding any extensions), eligible beginning with calendar year 2019, an additional number of shares of Class A common stock will be added to the number of shares of the Company’s Class A common stock authorized to be issued or transferred under the 2017 Plan and the number of shares authorized to be issued or transferred pursuant to incentive stock options, equal to 4%4% of the total number of shares of our Class A common stock outstanding on the last trading day in December of the immediately preceding calendar year, or 6,000,000 shares, whichever is less, or such lesser amount as determined by the Board (the “Evergreen Increase”). The Compensation Committee of the Board determined to not effectuate the Evergreen Increase that was otherwise scheduled to have occurred on each of January 2, 2019, January 2, 2020 and January 2, 2020. 4, 2021. On January 3, 2022, an additional 4,070,921 shares of the Company's Class A Common Stock was authorized to be issued or transferred under the 2017 Plan pursuant to the Evergreen Increase. In conjunction with the adoption of the 2017 Plan, options and RSUs outstanding under the 2015 Plan will remain outstanding but no additional grants will be made from the 2015 Plan.
AtAs of December 31, 2019, 5,889,9292021, 2,609,854 shares of Class A common stock were available for issuance under the 2017 Plan.
Stock Options
CarOffer Equity Incentive Plans
The following is a summary2020 CO Plan provides for the issuance of CO Incentive Units to CarOffer’s employees, officers, managers, and consultants. The 2020 CO Plan authorized up to an aggregate of 485,714 CO Incentive Units for such issuances, all of which were issued prior to the close of the stock option activitytransaction.
At the time of close, 142,857 CO Incentive Units were accelerated and redeemed. The compensation relating to these CO Incentive Units was deemed to be outside of consideration transferred. Therefore, for all stock‑based compensation plans during the year ended December 31, 2019:
|
| Common Stock |
|
| Weighted- Average Exercise Price for Equity |
|
| Weighted- Average Remaining Contractual Life (In Years) |
|
| Aggregate Intrinsic Value(1) |
| ||||
Outstanding, December 31, 2018 |
|
| 1,807,515 |
|
| $ | 2.35 |
|
| 5.9 |
|
| $ | 56,716 |
| |
Granted |
|
| — |
|
|
| — |
|
|
|
|
|
|
|
|
|
Exercised |
|
| (838,928 | ) |
| 2.16 |
|
|
|
|
|
|
| 28,902 |
| |
Forfeited and cancelled |
|
| (25,702 | ) |
| 5.09 |
|
|
|
|
|
|
|
|
| |
Outstanding, December 31, 2019 |
|
| 942,885 |
|
| $ | 2.45 |
|
|
| 5.0 |
|
| $ | 30,859 |
|
Options exercisable at December 31, 2019 |
|
| 913,197 |
|
| $ | 2.31 |
|
|
| 5.0 |
|
| $ | 30,016 |
|
|
|
There were 0 options granted in2021, the years ended December 31, 2019, 2018 and 2017.
Company recognized an additional $The aggregate intrinsic value for options exercised during the years ended December 31, 2018 and 2017 was $111,227 and $2,238, respectively.1,229
of stock-based compensation expense. As of December 31, 2019, there2021, the remaining 342,857 CO Inventive Units were unvested. There was $16$18,640 of unrecognized stock‑based compensation expense related to unvested stock options, whichCO Incentive Units that is expected to be recognized over a weighted‑average period of 0.32.5 years. These CO Incentive Units are accounted for within other non-current liabilities in the consolidated balance sheets.
As of December 31, 2021, there were 0 CO Incentive Units available for issuance under the 2020 CO Plan.
Restricted Stock Units
The following is a summaryVesting Agreement provides for the vesting of the RSU activity duringSubject Units beneficially owned by the T5 Holders, which vest in accordance with the terms described in Note 2 of these consolidated financial statements. As of December 31, 2021, there were 432,592 Subject Units issued and unvested. There was $29,507 of unrecognized stock‑based compensation expense related to unvested Subject Units that is expected to be recognized over a weighted‑average period of 2.0 years. These Subject Units are accounted for within other non-current liabilities in the consolidated balance sheets.
As of December 31, 2021, there were 0 Subject Units available for issuance under the Vesting Agreement.
The 2021 CO Plan provides for an incentive equity grant structure whereby 2021 Incentive Units will be granted to CIE and 2021 CO Plan grantees will receive an associated CIE Interest, with back-to-back vesting between the 2021 Incentive Units and the associated CIE Interest. The 2021 CO Plan authorized up to an aggregate of 228,571 2021 Incentive Units for such issuances.
As of December 31, 2021, 228,571 2021 Incentive Units were available for issuance under the 2021 CO Plan.
103
Stock Options
During the year ended December 31, 2019:2021, stock option activity is as follows:
|
| Common |
|
| Weighted- |
|
| Weighted- |
|
| Aggregate |
| ||||
Outstanding, December 31, 2020 |
|
| 590,397 |
|
| $ | 1.99 |
|
|
| 4.0 |
|
| $ | 17,560 |
|
Granted |
|
| 619,618 |
|
|
| 35.75 |
|
|
|
|
|
|
| ||
Exercised |
|
| (222,147 | ) |
|
| 2.98 |
|
|
|
|
|
| 6,027 |
| |
Forfeited |
|
| (38,561 | ) |
|
| 35.61 |
|
|
|
|
|
|
| ||
Outstanding, December 31, 2021 |
|
| 949,307 |
|
|
| 22.42 |
|
|
| 6.7 |
|
| $ | 11,877 |
|
Options exercisable as of December 31, |
|
| 478,588 |
|
|
| 9.28 |
|
|
| 4.3 |
|
| $ | 11,877 |
|
During the years ended December 31, 2020 and 2019, there were 0 options granted.
During the years ended December 31, 2020 and 2019, the aggregate intrinsic value for options exercised was $8,401 and $28,902, respectively.
As of December 31, 2021, there was $7,507 unrecognized stock‑based compensation expense related to unvested stock options that is expected to be recognized over a weighted‑average period of 3.2 years.
Restricted Stock Units
|
| Number of Shares |
|
| Weighted- Average Grant Date Fair Value |
|
| Aggregate Intrinsic Value |
| |||
Unvested outstanding, December 31, 2018 |
|
| 2,973,002 |
|
| $ | 26.06 |
|
| $ | 100,279 |
|
Granted |
|
| 1,811,208 |
|
|
| 39.07 |
|
|
|
|
|
Vested |
|
| (1,317,736 | ) |
|
| 23.93 |
|
|
|
|
|
Forfeited |
|
| (383,173 | ) |
|
| 31.70 |
|
|
|
|
|
Unvested outstanding, December 31, 2019 |
|
| 3,083,301 |
|
| $ | 33.89 |
|
| $ | 108,471 |
|
During the year ended December 31, 2021, RSU activity is as follows:
|
| Number of |
|
| Weighted- |
|
| Aggregate |
| |||
Unvested outstanding, December 31, 2020 |
|
| 3,483,816 |
|
| $ | 32.52 |
|
| $ | 110,538 |
|
Granted |
|
| 2,969,187 |
|
|
| 33.83 |
|
|
|
| |
Vested |
|
| (1,575,206 | ) |
|
| 33.28 |
|
|
|
| |
Forfeited |
|
| (1,043,475 | ) |
|
| 33.23 |
|
|
|
| |
Unvested outstanding, December 31, 2021 |
|
| 3,834,322 |
|
|
| 33.02 |
|
| $ | 128,987 |
|
TheDuring the years ended December 31, 2020 and 2019, the weighted-average grant-date fair value of RSUs granted was $35.79$28.47 and $16.99$39.07 per share, in 2018respectively.
During the years ended December 31, 2020 and 2017, respectively.
2019, RSUs that vested and settled duringtotaled 1,347,464 and 1,317,736, respectively.
During the yearyears ended December 31, 2018 totaled 1,781,201, which included 1,087,2792020 and 693,922 RSUs that vested in 2018 and 2017, respectively. RSUs that vested prior to April 10, 2018 did not settle until2019, the expiration of shareholder lock-up agreements on such date.
The total fair value of RSUs vested was $31,533, $15,994,$40,613 and $2,505 in the years ended December 31, 2019, 2018 and 2017,$31,533 respectively.
As of December 31, 2019,2021, there was $92,700$106,888 of unrecognized stock‑based compensation expense related to unvested RSUs that is expected to be recognized over a weighted‑average period of 2.8 years.
104
Stock-based Compensation Expense
For the yearsyear ended December 31, 2021, 2020, and 2019, 2018, and 2017, total stock‑based compensation expense was $34,301, $20,794, and $5,028, respectively. The following two tables show stockstock-based compensation expense by award type and where the stock compensation expense is recordedwas recognized in the Company’s consolidated income statements of operationsis as follows:
|
| Year Ended December 31, |
| |||||||||
|
| 2019 |
|
| 2018 |
|
| 2017 |
| |||
Options |
| $ | 155 |
|
| $ | 247 |
|
| $ | 281 |
|
RSUs |
|
| 34,146 |
|
|
| 20,547 |
|
|
| 4,747 |
|
Total stock-based compensation expense |
| $ | 34,301 |
|
| $ | 20,794 |
|
| $ | 5,028 |
|
|
| Year Ended December 31, |
| |||||||||
|
| 2021 |
|
| 2020 |
|
| 2019 |
| |||
Options |
| $ | 2,471 |
|
| $ | 17 |
|
| $ | 155 |
|
Restricted Stock Units |
|
| 52,916 |
|
|
| 45,304 |
|
|
| 34,146 |
|
CO Incentive Units and Subject Units |
|
| 22,323 |
|
|
| — |
|
|
| — |
|
Total stock-based compensation expense |
| $ | 77,710 |
|
| $ | 45,321 |
|
| $ | 34,301 |
|
|
| Year Ended December 31, |
| |||||||||
|
| 2021 |
|
| 2020 |
|
| 2019 |
| |||
Cost of revenue |
| $ | 417 |
|
| $ | 293 |
|
| $ | 354 |
|
Sales and marketing expense |
|
| 12,801 |
|
|
| 10,564 |
|
|
| 9,989 |
|
Product, technology, and development expense |
|
| 22,289 |
|
|
| 20,741 |
|
|
| 15,159 |
|
General and administrative expense |
|
| 42,203 |
|
|
| 13,723 |
|
|
| 8,799 |
|
Total stock-based compensation expense |
| $ | 77,710 |
|
| $ | 45,321 |
|
| $ | 34,301 |
|
|
| Year Ended December 31, |
| |||||||||
|
| 2019 |
|
| 2018 |
|
| 2017 |
| |||
Cost of revenue |
| $ | 354 |
|
| $ | 354 |
|
| $ | 151 |
|
Sales and marketing expense |
|
| 9,989 |
|
|
| 5,111 |
|
|
| 1,911 |
|
Product, technology, and development expense |
|
| 15,159 |
|
|
| 9,865 |
|
|
| 1,637 |
|
General and administrative expense |
|
| 8,799 |
|
|
| 5,464 |
|
|
| 1,329 |
|
Total stock-based compensation expense |
| $ | 34,301 |
|
| $ | 20,794 |
|
| $ | 5,028 |
|
ExcludedFor the years ended December 31, 2021, 2020, and 2019, excluded from stock-based compensation expense is $1,381, $490,$3,247, $1,906, and $176$1,381 of capitalized softwarewebsite development costs and capitalized internal-use software costs, inrespectively.
For the years ended December 31, 2021, 2020, and 2019, 2018 and 2017, respectively.
Thethe income tax benefit from stock-based compensation expense was $2,953, $1,945,$5,301, $4,796, and $1,301 in the years ended December 31, 2019, 2018, and 2017,$2,953, respectively.
During the years ended December 31, 20192021, 2020, and 2018,2019, the Company withheld 452,678,527,237, 447,160, and 658,931452,678 shares of Class A common stock, respectively, to satisfy employee tax withholding requirements and for option exercise costs due to net share settlements. NaN shares were withheld during the year ended December 31, 2017.settlements and cashless exercises of options, as applicable. The shares withheld return to the authorized, but unissued, pool under the 2017 Plan and can be reissued by the Company. TotalFor the years ended December 31, 2021, 2020, and 2019, total payments for the employees’to satisfy employee tax obligations to the taxing authoritieswithholding requirements and for option exercise costs due to net share settlements and cashless exercises of options, were $16,470$15,388, $11,184, and $25,885 for the years ended December 31, 2019 and 2018,$16,470, respectively, and are reflected as a financing activity withinin the consolidated statements of cash flows.
Common Stock Reserved for Future Issuance
AtAs of December 31, 2019,2021, the Company had reserved the following shares of votingClass A common stock for future issuance:
Common stock options outstanding |
| |||
Restricted stock units outstanding |
| |||
Shares available for issuance under the 2017 Plan |
| |||
Total shares of authorized common stock reserved for future issuance |
|
11. Earnings Per Share
NetThe Company has two classes of common stock authorized: Class A common stock and Class B common stock. The rights of the holders of Class A and Class B common stock are identical, except with respect to voting and conversion. Each share of Class A common stock is entitled to 1 vote per share and each share of Class B common stock is entitled to 10 votes per share. Each share of Class B common stock is convertible into 1 share of Class A common stock at the option of the holder at any time or automatically upon certain events described in the Company’s amended and restated certificate of incorporation, including upon either the death or voluntary termination of the Company’s Executive Chairman. The Company allocates undistributed earnings attributable to common stock between the common stock classes on a one‑to‑one basis when computing net income per share. As a result, basic and diluted net income per share forof Class A common stock and per share of Class B common stock are equivalent.
105
During the years ended December 31, 2021, 2020, and 2019, holders of Class B common stock converted 3,077,327 shares, 1,238,144 shares and 2018 was387,440 shares, respectively, of Class B common stock to Class A common stock.
Basic net income per share (“Basic EPS”) is computed by dividing net (loss) income attributable to common stockholders and adjusted to reflect changes in the redemption value of the redeemable noncontrolling interest, if applicable, by the weighted-average number of common shares outstanding during the reporting period. The Company computes the weighted-average number of common shares outstanding during the reporting period using the total number of shares of Class A common stock and Class B common stock outstanding as of the last day of the previous year end reporting period plus the weighted-average of any additional shares issued and outstanding during the reporting period.
Net income per share for the year ended December 31, 2017 was computed using the two-class method, which includes the weighted‑average number of shares of common stock outstanding during the period and other securities that participate in dividends (a participating security). For periods during the year ended December 31, 2017, the Company had convertible Preferred Stock outstanding. The Company considered the convertible Preferred Stock to be participating securities because they included rights to participate in dividends with the common stock. On October 16, 2017, in connection with the closing
of the IPO, all of the outstanding shares of convertible Preferred Stock automatically converted into 20,188,226 shares of Class A common stock and 40,376,452 shares of Class B common stock, the latter of which subsequently converted in full into shares of Class A common stock. As a result, there were 0 shares of Preferred Stock outstanding at the closing of the IPO and the Company has not issued any new shares of Preferred Stock since such closing.
Under the two‑class method, basic net income per share attributable to common stockholders is computed by dividing the net income attributable to common stockholders by the weighted‑average number of shares of common stock outstanding during the period. Diluted net income per share attributable to common stockholders is computed using the more dilutive of (1) the two‑class method or (2) the if‑converted method. The Company allocated net income first to preferred stockholders based on dividend rights under the Company’s certificate of incorporation that was in effect prior to the closing of the IPO and then to preferred and common stockholders based on ownership interests. Net losses are not allocated to preferred stockholders as they do not have an obligation to share in the Company’s net losses.
The Company has two classes of common stock authorized: Class A common stock and Class B common stock. The rights of the holders of Class A and Class B common stock are identical, except with respect to voting and conversion. Each share of Class A common stock is entitled to 1 vote per share and each share of Class B common stock is entitled to 10 votes per share. Each share of Class B common stock is convertible into 1 share of Class A common stock at the option of the holder at any time or automatically upon certain events described in the Company’s amended and restated certificate of incorporation, including on either the death or voluntary termination of the Company’s Chief Executive Officer.The Company allocates undistributed earnings attributable to common stock between the common stock classes on a one‑to‑one basis when computing net income per share. As a result, basic and diluted net income per share of Class A common stock and per share of Class B common stock are equivalent.
During the years ended December 31, 2019 and 2018, holders of Class B common stock converted 387,440 shares and 7,534,710 shares, respectively, of Class B common stock to Class A common stock.
(“Diluted net income per shareEPS”) gives effect to all potentially dilutive securities. Potential diluted securities Diluted EPS is computed by dividing net (loss) incomeattributable to common stockholders and adjusted to reflect adjustments for net income (loss) attributable to the years ended December 31, 2019, 2018noncontrolling interest and 2017 consistredemption adjustments to redeemable noncontrolling interest, if applicable and dilutive, by the weighted-average number of common shares outstanding during the reporting period using (i) the number of shares of common stock issuableused in the Basic EPS calculation as indicated above, (ii) if dilutive, the incremental weighted-average common stock that the Company would issue upon the exercise of stock options and shares of common stock issuable upon the vesting of RSUs. PotentialRSUs, (iii) if dilutive, securities formarket-based performance awards based on the year ended December 31, 2017 also includednumber of shares of common stockthat would be issuable upon the conversionas of the outstanding Preferred Stock.end of the reporting period assuming the end of the reporting period was also the end of the contingency period. The dilutive effect of these common stock equivalents is reflected in diluted earnings per share by application of the treasury stock method. The if-converted method is used to calculate the number of shares issuable upon exercise of the 2024 Put Right, inclusive of CarOffer noncontrolling interest and incentive units, that would be issuable as of the end of the reporting period assuming the end of the reporting period was also the end of the contingency period.
For the years ended December 31, 20192021, 2020, and 2018, dilutive net income per share was calculated by dividing net income by the weighted-average number of shares of common stock outstanding during the period plus the dilutive impact of stock options and shares of common stock issuable upon the vesting of RSUs. For the year ended December 31, 2017, the two‑class method was used in the computation of diluted net income per share, which was equally as dilutive as the if-converted method.
The following table presents2019, a reconciliation of the numerator and denominator used in the calculation of basic and diluted net income per share:share is as follows:
|
| Year Ended December 31, |
| |||||||||
|
| 2019 |
|
| 2018 |
|
| 2017 |
| |||
Numerator: |
|
|
|
|
|
|
|
|
|
|
|
|
Net income |
| $ | 42,146 |
|
| $ | 65,170 |
|
| $ | 13,199 |
|
Net income attributable to participating securities |
|
| — |
|
|
| — |
|
|
| (6,098 | ) |
Net income attributable to common stockholders — basic |
| $ | 42,146 |
|
| $ | 65,170 |
|
| $ | 7,101 |
|
Net income |
| $ | 42,146 |
|
| $ | 65,170 |
|
| $ | 13,199 |
|
Net income attributable to participating securities |
|
| — |
|
|
| — |
|
|
| (5,829 | ) |
Net income attributable to common stockholders — diluted |
| $ | 42,146 |
|
| $ | 65,170 |
|
| $ | 7,370 |
|
Denominator: |
|
|
|
|
|
|
|
|
|
|
|
|
Weighted–average number of shares of common stock used in computing net income per share attributable to common stockholders — basic |
|
| 111,450,443 |
|
|
| 108,833,028 |
|
|
| 55,835,265 |
|
Dilutive effect of share equivalents resulting from stock options |
|
| 1,155,906 |
|
|
| 3,009,748 |
|
|
| 4,290,362 |
|
Dilutive effect of share equivalents resulting from unvested restricted stock units |
|
| 825,501 |
|
|
| 1,521,936 |
|
|
| 511,957 |
|
Weighted–average number of shares of common stock used in computing net income per share — diluted |
|
| 113,431,850 |
|
|
| 113,364,712 |
|
|
| 60,637,584 |
|
Net income per share attributable to common stockholders: |
|
|
|
|
|
|
|
|
|
|
|
|
Basic |
| $ | 0.38 |
|
| $ | 0.60 |
|
| $ | 0.13 |
|
Diluted |
| $ | 0.37 |
|
| $ | 0.57 |
|
| $ | 0.12 |
|
|
| Year Ended December 31, |
| |||||||||
|
| 2021 |
|
| 2020 |
|
| 2019 |
| |||
Numerator: |
|
|
|
|
|
|
|
|
| |||
Consolidated net income |
| $ | 110,373 |
|
| $ | 77,553 |
|
| $ | 42,146 |
|
Net income attributable to redeemable noncontrolling |
|
| 1,129 |
|
|
| — |
|
|
| — |
|
Accretion of redeemable noncontrolling interest to |
|
| 109,398 |
|
|
| — |
|
|
| — |
|
Net (loss) income attributable to common stockholders |
| $ | (154 | ) |
| $ | 77,553 |
|
| $ | 42,146 |
|
Denominator: |
|
|
|
|
|
|
|
|
| |||
Weighted-average number of shares of common stock used |
|
| 117,142,062 |
|
|
| 112,854,524 |
|
|
| 111,450,443 |
|
Dilutive effect of share equivalents resulting from stock |
|
| — |
|
|
| 674,018 |
|
|
| 1,155,906 |
|
Dilutive effect of share equivalents resulting from |
|
| — |
|
|
| 321,273 |
|
|
| 825,501 |
|
Weighted-average number of shares of common stock |
|
| 117,142,062 |
|
|
| 113,849,815 |
|
|
| 113,431,850 |
|
Net (loss) income per share attributable to common |
|
|
|
|
|
|
|
|
| |||
Basic |
| $ | (0.00 | ) |
| $ | 0.69 |
|
| $ | 0.38 |
|
Diluted |
| $ | (0.00 | ) |
| $ | 0.68 |
|
| $ | 0.37 |
|
The following106
For the years ended December 31, 2021, 2020, and 2019, potentially dilutive common stock equivalents that have been excluded from the calculation of diluted weighted‑average shares outstanding for the years ended December 31, 2019, 2018, and 2017, as their effect would have been anti‑dilutive are as follows:
|
| Year Ended December 31, |
| |||||||||
|
| 2021 |
|
| 2020 |
|
| 2019 |
| |||
Stock options outstanding |
|
| 617,504 |
|
|
| — |
|
|
| — |
|
Restricted stock units outstanding |
|
| 2,867,330 |
|
|
| 2,722,226 |
|
|
| 1,144,287 |
|
CO Incentive Units, Subject Units and noncontrolling |
|
| 1,509,750 |
|
|
| — |
|
|
| — |
|
In addition, shares of Class A common stock potentially issuable under market-based performance awards of approximately 14,682 RSUs were excluded from the calculation of weighted average shares used to compute Diluted EPS for the periods presented:year ended December 31, 2021 as the performance period began subsequent to the reporting period end date and as such there were zero contingently issuable shares.
|
| Year Ended December 31, |
| |||||||||
|
| 2019 |
|
| 2018 |
|
| 2017 |
| |||
Restricted stock units outstanding |
|
| 1,144,287 |
|
|
| 126,816 |
|
|
| 829 |
|
12. Income Taxes
The domestic and foreign components of income before income taxes are as follows:
|
| Year Ended December 31, |
| |||||||||
|
| 2021 |
|
| 2020 |
|
| 2019 |
| |||
United States |
| $ | 148,037 |
|
| $ | 97,120 |
|
| $ | 37,476 |
|
Foreign |
|
| 1,323 |
|
|
| 1,990 |
|
|
| 1,229 |
|
Income before income taxes |
| $ | 149,360 |
|
| $ | 99,110 |
|
| $ | 38,705 |
|
|
| Year Ended December 31, |
| |||||||||
|
| 2019 |
|
| 2018 |
|
| 2017 |
| |||
United States |
| $ | 37,476 |
|
| $ | 24,426 |
|
| $ | 15,543 |
|
Foreign |
|
| 1,229 |
|
|
| 1,058 |
|
|
| 294 |
|
Income before income taxes |
| $ | 38,705 |
|
| $ | 25,484 |
|
| $ | 15,837 |
|
The provision for (benefit from) provision for income taxes contained the following components:
|
| Year Ended December 31, |
| |||||||||
|
| 2021 |
|
| 2020 |
|
| 2019 |
| |||
Current provision (benefit): |
|
|
|
|
|
|
|
|
| |||
Federal |
| $ | 22,133 |
|
| $ | (3,733 | ) |
| $ | — |
|
State |
|
| 10,438 |
|
|
| 2,288 |
|
|
| (220 | ) |
Foreign |
|
| 253 |
|
|
| 767 |
|
|
| 513 |
|
|
|
| 32,824 |
|
|
| (678 | ) |
|
| 293 |
|
Deferred provision (benefit): |
|
|
|
|
|
|
|
|
| |||
Federal |
|
| 5,698 |
|
|
| 19,539 |
|
|
| (2,377 | ) |
State |
|
| 669 |
|
|
| 2,734 |
|
|
| (1,306 | ) |
Foreign |
|
| (204 | ) |
|
| (38 | ) |
|
| (51 | ) |
|
|
| 6,163 |
|
|
| 22,235 |
|
|
| (3,734 | ) |
Income tax provision (benefit) |
| $ | 38,987 |
|
| $ | 21,557 |
|
| $ | (3,441 | ) |
|
| Year Ended December 31, |
| |||||||||
|
| 2019 |
|
| 2018 |
|
| 2017 |
| |||
Current (benefit) provision: |
|
|
|
|
|
|
|
|
|
|
|
|
Federal |
| $ | — |
|
| $ | (860 | ) |
| $ | 3,262 |
|
State |
|
| (220 | ) |
|
| 92 |
|
|
| 431 |
|
Foreign |
|
| 513 |
|
|
| 122 |
|
|
| 62 |
|
|
|
| 293 |
|
|
| (646 | ) |
|
| 3,755 |
|
Deferred (benefit) provision: |
|
|
|
|
|
|
|
|
|
|
|
|
Federal |
|
| (2,377 | ) |
|
| (27,675 | ) |
|
| (755 | ) |
State |
|
| (1,306 | ) |
|
| (11,499 | ) |
|
| (343 | ) |
Foreign |
|
| (51 | ) |
|
| 134 |
|
|
| (19 | ) |
|
|
| (3,734 | ) |
|
| (39,040 | ) |
|
| (1,117 | ) |
Income tax (benefit) provision |
| $ | (3,441 | ) |
| $ | (39,686 | ) |
| $ | 2,638 |
|
The Company's effective tax ratesrate, calculated using income before income taxes adjusted for the years ending December 31, 2019 and 2018 are lessnet income attributable to redeemable noncontrolling interest, is 26.3%, greater than the U.S. federal statutory rate primarily due to excess tax deductions related to stock-basedstate and local income taxes, shortfalls on the taxable compensation of share-based awards and the Section 162(m) excess officer compensation limitation, which became applicable in May 2021 upon the expiration of the transition period permitted following the IPO, partially offset by federal and state research and development tax credits. The Company’s effective tax raterates for the year ending December 31, 20172020 is greater than the U.S. federal statutory rate primarily due to state and local income taxes with partial offset by the benefits from the U.S. federal and state research and development credits and the Coronavirus Aid, Relief, and Economic Security Act (the “CARES Act”). The Company’s effective tax rates for the year ending December 31, 2019 is less than the U.S. federal statutory rate primarily due to federal and state research and development credits and excess tax deductions related to stock-based compensation awards,awards.
107
|
| Year Ended December 31, |
| |||||||||
|
| 2021 |
|
| 2020 |
|
| 2019 |
| |||
U.S. federal taxes at statutory rate |
|
| 21.0 | % |
|
| 21.0 | % |
|
| 21.0 | % |
State taxes, net of federal benefit |
|
| 7.5 |
|
|
| 6.2 |
|
|
| 0.2 |
|
Nondeductible expenses |
|
| 0.3 |
|
|
| 0.4 |
|
|
| 2.9 |
|
Stock compensation |
|
| 0.3 |
|
|
| 0.2 |
|
|
| (22.0 | ) |
Foreign rate differential |
|
| (0.2 | ) |
|
| (0.2 | ) |
|
| (0.3 | ) |
Federal and state credits |
|
| (2.6 | ) |
|
| (3.2 | ) |
|
| (10.3 | ) |
CARES Act |
|
| — |
|
|
| (2.4 | ) |
|
| — |
|
Disallowed officer compensation |
|
| 1.0 |
|
|
| — |
|
|
| — |
|
Investment in partnership |
|
| (0.3 | ) |
|
| — |
|
|
| — |
|
Federal, state, and foreign provision to return differences |
|
| (0.7 | ) |
|
| — |
|
|
| — |
|
Other |
|
| (0.2 | ) |
|
| (0.2 | ) |
|
| (0.2 | ) |
Consolidated effective tax rate |
|
| 26.1 | % |
|
| 21.8 | % |
|
| (8.7 | )% |
Effective tax rate attributable to redeemable noncontrolling |
|
| 0.2 |
|
|
| — |
|
|
| — |
|
Effective tax rate attributable to CarGurus, Inc. |
|
| 26.3 | % |
|
| 21.8 | % |
|
| (8.7 | )% |
As of December 31, 2021 and tax deductions for fees incurred during the IPO process.
|
| Year Ended December 31, |
| |||||||||
|
| 2019 |
|
| 2018 |
|
| 2017 |
| |||
U.S. federal taxes at statutory rate |
|
| 21.0 | % |
|
| 21.0 | % |
|
| 35.0 | % |
State taxes, net of federal benefit |
|
| 0.2 |
|
|
| (25.6 | ) |
|
| 3.1 |
|
Nondeductible expenses |
|
| 2.9 |
|
|
| 4.1 |
|
|
| 1.2 |
|
Tax deductible IPO costs |
|
| — |
|
|
| — |
|
|
| (9.3 | ) |
Stock compensation |
|
| (22.0 | ) |
|
| (127.2 | ) |
|
| (4.4 | ) |
Foreign rate differential |
|
| (0.3 | ) |
|
| (0.4 | ) |
|
| (0.4 | ) |
Credits |
|
| (10.3 | ) |
|
| (28.4 | ) |
|
| (9.0 | ) |
Other |
|
| (0.2 | ) |
|
| 0.7 |
|
|
| 0.5 |
|
Total |
|
| (8.7 | )% |
|
| (155.8 | )% |
|
| 16.7 | % |
The2020, the approximate income tax effect of each type of temporary difference and carryforward as of December 31, 2019 and 2018 is as follows:
|
| As of December 31, |
| |||||
|
| 2019 |
|
| 2018 |
| ||
Deferred tax assets: |
|
|
|
|
|
|
|
|
Net operating loss carryforwards |
| $ | 35,977 |
|
| $ | 34,450 |
|
Credit carryforwards |
|
| 10,472 |
|
|
| 6,562 |
|
Stock-based compensation |
|
| 2,953 |
|
|
| 1,945 |
|
Landlord allowance on leasehold improvements |
|
| — |
|
|
| 1,908 |
|
Lease liability |
|
| 17,965 |
|
|
| — |
|
Intangible Assets |
|
| 62 |
|
|
| — |
|
Deferred rent |
|
| — |
|
|
| 873 |
|
Accruals and reserves |
|
| 1,185 |
|
|
| 1,074 |
|
|
|
| 68,614 |
|
|
| 46,812 |
|
Valuation Allowance |
|
| (62 | ) |
|
| — |
|
|
|
| 68,552 |
|
|
| 46,812 |
|
Deferred tax liabilities: |
|
|
|
|
|
|
|
|
Prepaid expenses |
|
| (1,523 | ) |
|
| (931 | ) |
Deferred commissions |
|
| (5,100 | ) |
|
| (3,187 | ) |
Right of use assets |
|
| (15,270 | ) |
|
| — |
|
Unbilled revenue |
|
| — |
|
|
| (227 | ) |
Fixed assets |
|
| (4,230 | ) |
|
| (3,581 | ) |
|
|
| (26,123 | ) |
|
| (7,926 | ) |
Net deferred tax assets |
| $ | 42,429 |
|
| $ | 38,886 |
|
|
| As of December 31, |
| |||||
|
| 2021 |
|
| 2020 |
| ||
Deferred tax assets: |
|
|
|
|
|
| ||
Net operating loss carryforwards |
| $ | 1,429 |
|
| $ | 3,735 |
|
Credit carryforwards |
|
| 4,241 |
|
|
| 17,572 |
|
Stock-based compensation |
|
| 5,301 |
|
|
| 4,796 |
|
Lease liability |
|
| 15,640 |
|
|
| 18,671 |
|
Investment in partnership |
|
| 6,709 |
|
|
| — |
|
Accruals and reserves |
|
| 5,942 |
|
|
| 3,249 |
|
|
|
| 39,262 |
|
|
| 48,023 |
|
Valuation Allowance |
|
| (229 | ) |
|
| (158 | ) |
|
|
| 39,033 |
|
|
| 47,865 |
|
Deferred tax liabilities: |
|
|
|
|
|
| ||
Prepaid expenses |
|
| (1,850 | ) |
|
| (1,482 | ) |
Deferred commissions |
|
| (3,508 | ) |
|
| (5,144 | ) |
Right of use assets |
|
| (12,955 | ) |
|
| (15,920 | ) |
Intangible assets |
|
| (1,111 | ) |
|
| (1,025 | ) |
Fixed assets |
|
| (6,289 | ) |
|
| (4,811 | ) |
|
|
| (25,713 | ) |
|
| (28,382 | ) |
Net deferred tax assets |
| $ | 13,320 |
|
| $ | 19,483 |
|
The Company uses the asset and liability method to accountaccounts for income taxes in accordance with ASC 740, Income Taxes.the liability method. Under this method, deferred income taxes are recognized for the future tax consequences of differences between the tax and financial accounting bases of assets and liabilities at each reporting period. Deferred income taxes are based on enacted tax laws and statutory tax rates applicable to the period in which these differences are expected to affect taxable income. A valuation allowance is established when necessary to reduce deferred tax assets to the amounts expected to be realized.
TheAs of December 31, 2021 and 2020, the Company has provided an immaterial valuation allowance against its net deferred tax assets at December 31, 2019, but did not provided a valuation allowance against its net deferred tax assets at December 31, 2018.assets. Based upon the level of historical U.S. earnings and future projections over the period in which the net deferred tax assets are deductible, at this time, management believes it is more likely than not that the Company will realize the benefits of these deductible differences, with the exception of the deferred tax asset related to intangible assets in Ireland. TheFor the years ended December 31, 2021 and 2020, the change in the valuation allowance for the year ended December 31, 2019 was $62.$71 and $96, respectively.
108
As of December 31, 2019,2021, the Company has federal and state net operating loss (“NOL”) carryforwards of $136,771$1,160 and $114,459,$17,105, respectively. ThePrior to the enactment of the CARES Act on March 27, 2020, federal net operating lossesNOLs would generally carryforward indefinitely, subject to an annual limitation of 80%80% of taxable income. The CARES Act temporarily removed the 80% limitation on NOLs to offset taxable income for tax years prior to 2021. The 80% annual taxable income limitation will resume for tax years 2021 and on. The federal NOL carryforward does not expire and the state net operating losses,NOL carryforwards, excluding Florida and GeorgiaSouth Carolina which carryforwardcarryforwards indefinitely, expire at various dates beginning in 2028.through 2040. As of December 31, 2019,2021, the Company has federal and state tax credit carryforwards of $6,507$673 and $5,018,$4,516, respectively, available to reduce future tax liabilities that, excluding California which carryforwards indefinitely, expire at various dates through 2039.
2040. Utilization of the net operating lossesNOL and tax credit carryforwards, respectively, may be subject to an annual limitation due to ownership change limitations that have occurred previously or that could occur in the future, as provided by Section 382 of the Internal Revenue Code or (“Section 382,382”), as well as similar state provisions. Ownership changes may limit the amount of net operating lossesNOL or tax credit carryforwards that can be utilized annually to offset future taxable income and tax, respectively. In general, an ownership change, as defined by Section 382, results from transactions that increase the ownership of 5 percent-percent stockholders in the stock of a corporation by more than 50%50 percent in the aggregate over a three-year period.
AtThe Company previously adopted the provision for uncertain tax positions under ASC 740. As of December 31, 20192021 and 2018,2020, the Company had 0 recorded recognized liabilities for uncertain tax positions and had 0 accrued interest or penalties related to uncertain tax positions.
The Company permanently reinvests the earnings, if any, of its foreign subsidiaries and, therefore, does not provide for U.S. income taxes that could result from the distribution of those earnings to the U.S. parent.Company. As of December 31, 2019,2021 and December 31, 2020, the amount of unrecognized deferred U.S. taxes on these earnings would be immaterial.de minimis.
The Company and its subsidiaries are subject to various U.S. federal, state, and foreign income taxes.tax examinations. The Company is currently not subject to income tax examination under the statute of limitations by the Internal Revenue Service and state jurisdictions for the tax years of 20152017 and prior.prior as a result of applicable statute of limitations of the Internal Revenue Service (“IRS”) and state jurisdictions. The Company is currently open to examination in its foreign jurisdictions for tax years 20172019 and after. In 2018, the Internal Revenue Service commenced a federal income tax audit with respect to the Company’s 2016 tax year, which was concluded in October 2019 for an immaterial amount. In 2019, the Internal Revenue Service commenced a federal employment tax audit with respect to the 2018, 2017 and 2016 calendar years, which is still open.
13. Segment and Geographic Information
The Company has 2 reportable segments, United States and International. Segment information is presented in the same manner as the Company’s chief operating decision maker, or CODM,(the “CODM”), reviews the Company’s operating results in assessing performance and allocating resources. The CODM reviews revenue and operating income (loss) for each reportable segment as a proxy for the operating performance of the Company’s United States and International operations. The Company’s Chief Executive Officer is the CODM on behalf of both reportable segments.
The United States segment derives revenues from marketplace, subscriptions, advertising services,wholesale and otherproduct revenues from customers within the United States. The International segment derives revenues from marketplace subscriptions, advertising services, and other revenues from customers outside of the United States. A majority of the Company’s operational overhead expenses, including technology and personnel costs, and other general and administrative costs associated with running the Company’s business, are incurred in the United States and not allocated to the International segment. AssetsRevenue and costs discretely incurred by reportable segments, including depreciation and amortization, are included in the calculation of reportable segment income (loss) from operations. Segment operating income (loss) does not reflect the transfer pricing adjustments related to the Company’s foreign subsidiaries, which are recordedrecognized for statutory reporting purposes. Asset information is assessed and reviewed on a global basis.
InformationFor the years ended December 31, 2021, 2020, and 2019, information regarding the Company’s operations by segment and geographical area is presented as follows:
|
| Year Ended December 31, |
| |||||||||
|
| 2021 |
|
| 2020 |
|
| 2019 |
| |||
Segment revenue: |
|
|
|
|
|
|
|
|
| |||
United States |
| $ | 909,033 |
|
| $ | 519,835 |
|
| $ | 555,007 |
|
International |
|
| 42,340 |
|
|
| 31,616 |
|
|
| 33,909 |
|
Total revenue |
| $ | 951,373 |
|
| $ | 551,451 |
|
| $ | 588,916 |
|
109
|
| Year Ended December 31, |
| |||||||||
|
| 2019 |
|
| 2018 |
|
| 2017 |
| |||
Segment revenue: |
|
|
|
|
|
|
|
|
|
|
|
|
United States |
| $ | 555,007 |
|
| $ | 437,166 |
|
| $ | 307,472 |
|
International |
|
| 33,909 |
|
|
| 16,920 |
|
|
| 9,389 |
|
Total revenue |
| $ | 588,916 |
|
| $ | 454,086 |
|
| $ | 316,861 |
|
|
| Year Ended December 31, |
| |||||||||
|
| 2021 |
|
| 2020 |
|
| 2019 |
| |||
Segment income (loss) from operations: |
|
|
|
|
|
|
|
|
| |||
United States |
| $ | 158,532 |
|
| $ | 120,836 |
|
| $ | 73,872 |
|
International |
|
| (10,264 | ) |
|
| (23,080 | ) |
|
| (39,550 | ) |
Total income from operations |
| $ | 148,268 |
|
| $ | 97,756 |
|
| $ | 34,322 |
|
|
| Year Ended December 31, |
| |||||||||
|
| 2019 |
|
| 2018 |
|
| 2017 |
| |||
Segment income (loss) from operations: |
|
|
|
|
|
|
|
|
|
|
|
|
United States |
| $ | 73,872 |
|
| $ | 58,387 |
|
| $ | 41,586 |
|
International |
|
| (39,550 | ) |
|
| (35,196 | ) |
|
| (26,312 | ) |
Total income from operations |
| $ | 34,322 |
|
| $ | 23,191 |
|
| $ | 15,274 |
|
The Company ceased the operations of the International segment online marketplaces in Germany, Italy, and Spain in the second quarter of 2020 in connection with the Expense Reduction Plan.
As of December 31, 2021, total assets held outside of the United States were $35,521, primarily attributable to $15,359 of goodwill. As of December 31, 20192020, total assets held outside of the United States were $32,528,$32,012, primarily attributable to $15,207$16,652 of goodwill and $3,920 of intangible assets. As of December 31, 2018, total assets held outside the United States were not material.goodwill.
14. Employee Benefit Plans
The Company maintains a defined contribution savings plan for all eligible U.S. employees under Section 401(k) of the Internal Revenue Code. Effective July 1, 2017, the Company implemented a matching policy, under which the Company matches 50%50% of an employee’s annual contributions to the 401(k) plan, up to a maximum of the lesser of (i) 6%6% of the employee’s base salary, bonus and commissions paid during the year or (ii) $5,000.$5,000. Matching contributions are subject to vesting based on the employee’s start date and length of service. Employees can designate the investment of their 401(k) accounts into several mutual funds. The Company does not allow investment in its common stock through the 401(k) plan.
During the year ended December 31, 2017, the Company began matching employee 401(k) contributions up to a set limit. Total employer contributions were $2,708, $1,953, and $724 duringFor the years ended December 31, 2021, 2020, and 2019, 2018total employer contributions to the 401(k) plan were $2,960, $2,675, and 2017,$2,708, respectively.
15. Quarterly Financial Results (unaudited)
The following table presents certain unaudited quarterly financial information for the eight quarters in the period ended December 31, 2019. This information has been prepared on the same basis as the audited financial statements and includes all adjustments (consisting only of normal recurring adjustments) necessary to present fairly the unaudited quarterly results of operations set forth herein.
|
| Fourth Quarter |
|
| Third Quarter |
|
| Second Quarter |
|
| First Quarter |
| ||||
Year ended December 31, 2019 |
|
|
|
|
|
|
|
|
|
|
|
|
|
|
|
|
Revenue |
| $ | 158,153 |
|
| $ | 150,462 |
|
| $ | 145,031 |
|
| $ | 135,270 |
|
Cost of revenue |
|
| 10,560 |
|
|
| 9,392 |
|
|
| 8,628 |
|
|
| 7,720 |
|
Gross profit |
|
| 147,593 |
|
|
| 141,070 |
|
|
| 136,403 |
|
|
| 127,550 |
|
Income from operations |
|
| 13,635 |
|
|
| 9,704 |
|
|
| 3,548 |
|
|
| 7,435 |
|
Net income |
|
| 13,171 |
|
|
| 10,384 |
|
|
| 6,007 |
|
|
| 12,584 |
|
Basic net income per share (1) |
| $ | 0.12 |
|
| $ | 0.09 |
|
| $ | 0.05 |
|
| $ | 0.11 |
|
Diluted net income per share (1) |
| $ | 0.12 |
|
| $ | 0.09 |
|
| $ | 0.05 |
|
| $ | 0.11 |
|
Year Ended December 31, 2018 |
|
|
|
|
|
|
|
|
|
|
|
|
|
|
|
|
Revenue |
| $ | 126,090 |
|
| $ | 119,125 |
|
| $ | 110,296 |
|
| $ | 98,575 |
|
Cost of revenue |
|
| 6,871 |
|
|
| 6,412 |
|
|
| 5,959 |
|
|
| 5,569 |
|
Gross profit |
|
| 119,219 |
|
|
| 112,713 |
|
|
| 104,337 |
|
|
| 93,006 |
|
Income from operations |
|
| 6,902 |
|
|
| 5,877 |
|
|
| 3,953 |
|
|
| 6,459 |
|
Net income |
|
| 12,450 |
|
|
| 13,882 |
|
|
| 33,343 |
|
|
| 5,495 |
|
Basic net income per share (1) |
| $ | 0.11 |
|
| $ | 0.13 |
|
| $ | 0.31 |
|
| $ | 0.05 |
|
Diluted net income per share (1) |
| $ | 0.11 |
|
| $ | 0.12 |
|
| $ | 0.29 |
|
| $ | 0.05 |
|
|
|
16. Subsequent Events
On January 16, 2020,Effective the first quarter of 2022, the Company acquired Autolist, an automotive shopping platform based in San Francisco, California, pursuant to an Agreement and Plan of Merger by and among the Company, Alpine Merger Sub, Inc., a Delaware corporation and wholly-owned subsidiary of the Company (“Merger Sub”), Auto List, Inc., a Delaware corporation (“Target”), and the stockholder representative(s) named therein, pursuant to which, among other things, the Company acquired Target through the merger of Merger Sub with and into Target (the “Merger”), with Target surviving as a wholly owned subsidiary of the Company. The Company paid an aggregate of approximately $22.0 million to consummate the Merger, inclusive of $2.2 million that is held in escrow to secure post-closing claims. The Merger is intended to both expand the Company’s consumer audience in therevised its segment reporting from 2 reportable segments, United States and enhance its value proposition for subscribing dealers. DuringInternational, to 1 reportable segment. The change in segment reporting was made to align with changes made in the year ended December 31, 2019,manner the Company incurred total acquisition-related costsCODM reviews the Company’s operating results in assessing performance and allocating resources. The CODM now assesses the Company's performance as a whole rather than by geographical location as a result of $0.4 million relatedthe international segment becoming less significant relative to the transaction. Asoverall business due to growth in wholesale revenue. The change in segment reporting does not impact the transaction occurred subsequent to period-end, the Company is still evaluating the purchase price allocation of the transaction but expects the primary assets acquired to be intangible assets and goodwill. Acquired tangible assets and assumed liabilities are expected to be immaterial. The allocation is expected to be finalized during the first half of 2020.Company’s consolidated financial statements.
110
Item 9. Changes in and Disagreements with Accountants on Accounting and Financial Disclosure.
None.
Item 9A. Controls and Procedures.
Evaluation of Disclosure Controls and Procedures
Our management, with the participation of our principal executive officer and principal financial officer, has evaluated the effectiveness of our disclosure controls and procedures (as defined in Rules 13a- 15(e) and 15d- 15(e) under the Securities Exchange Act of 1934, as amended, as of the end of the period covered by this Annual Report on Form 10-K. Based on such evaluation, our principal executive officer and principal financial officer have concluded that as of December 31, 2019,2021, our disclosure controls and procedures were effective.
Management’s Annual Report on Internal Control Over Financial Reporting
Our management is responsible for establishing and maintaining adequate internal control over financial reporting as defined in Rule 13a-15(f) or 15d-15(f) of the Exchange Act. Internal control over financial reporting is a process designed to provide reasonable assurance regarding the reliability of financial reporting and the preparation of financial statements for external purposes in accordance with generally accepted accounting principles, and includes those policies and procedures that:
| (i) pertain to the maintenance of records that, in reasonable detail, accurately and fairly reflect the transactions and dispositions of our assets; (ii) provide reasonable assurance that transactions are recorded as necessary to permit preparation of financial statements in accordance with generally accepted accounting principles, and that our receipts and expenditures are being made only in accordance with authorizations of our management and directors; and (iii) provide reasonable assurance regarding prevention or timely detection of unauthorized acquisition, use or disposition of our assets that could have a material effect on our financial statements.
|
|
|
|
|
|
Because of its inherent limitations, internal control over financial reporting may not prevent or detect misstatements. Also, projections of any evaluation of effectiveness to future periods are subject to the risk that controls may become inadequate because of changes in conditions, or that the degree of compliance with the policies or procedures may deteriorate.
Our management assessed the effectiveness of our internal control over financial reporting as of December 31, 2019,2021, using the criteria set forth by the Committee of Sponsoring Organizations of the Treadway Commission (COSO) in its Internal Control-Integrated Framework (2013).
Our assessment of and conclusion on the effectiveness of internal control over financial reporting did not include the internal controls of CarOffer, LLC, which is included in the consolidated financial statements. As of December 31, 2021, CarOffer, LLC constituted 25% and 20% of total and net assets, respectively. For the year ended December 31, 2021, CarOffer, LLC constituted 33% and 2% of revenues and consolidated net income, respectively.
Based on this assessment and those criteria, management concluded that our internal control over financial reporting was effective as of December 31, 2019.2021.
The effectiveness of our internal control over financial reporting as of December 31, 2019,2021, has been audited by Ernst & Young LLP, an independent registered public accounting firm, as stated in their report which is included herein.
Changes in Internal Control over Financial Reporting
There was no change in our internal control over financial reporting (as defined in Rules 13a-15(f) and 15d-15(f) under the Exchange Act) that occurred during the fourth quarter ended December 31, 20192021 that has materially affected, or is reasonably likely to materially affect, our internal control over financial reporting.
111
Report of Independent Registered Public Accounting Firm
To the Stockholders and the Board of Directors of CarGurus, Inc.
Opinion on Internal Control overOver Financial Reporting
We have audited CarGurus, Inc.’s internal control over financial reporting as of December 31, 2019,2021, based on criteria established in Internal Control—Integrated Framework issued by the Committee of Sponsoring Organizations of the Treadway Commission (2013 framework) (the COSO criteria). In our opinion, CarGurus, Inc. (the Company) maintained, in all material respects, effective internal control over financial reporting as of December 31, 2019,2021, based on the COSO criteria.
As indicated in the accompanying Management’s Annual Report on Internal Control Over Financial Reporting, management’s assessment of and conclusion on the effectiveness of internal control over financial reporting did not include the internal controls of CarOffer, LLC, which is included in the 2021 consolidated financial statements of the Company and constituted 25% and 20% of total and net assets, respectively, as of December 31, 2021 and 33% and 2% of revenues and net income, respectively, for the year then ended. Our audit of internal control over financial reporting of the Company also did not include an evaluation of the internal control over financial reporting of CarOffer, LLC.
We also have audited, in accordance with the standards of the Public Company Accounting Oversight Board (United States) (PCAOB), the 20192021 consolidated financial statements of the Company and our report dated February 14, 202024, 2022 expressed an unqualified opinion thereon.
Basis for Opinion
The Company’s management is responsible for maintaining effective internal control over financial reporting and for its assessment of the effectiveness of internal control over financial reporting included in the accompanying Management’s Annual Report on Internal Control Over Financial Reporting. Our responsibility is to express an opinion on the Company’s internal control over financial reporting based on our audit. We are a public accounting firm registered with the PCAOB and are required to be independent with respect to the Company in accordance with the U.S. federal securities laws and the applicable rules and regulations of the Securities and Exchange Commission and the PCAOB.
We conducted our audit in accordance with the standards of the PCAOB. Those standards require that we plan and perform the audit to obtain reasonable assurance about whether effective internal control over financial reporting was maintained in all material respects.
Our audit included obtaining an understanding of internal control over financial reporting, assessing the risk that a material weakness exists, testing and evaluating the design and operating effectiveness of internal control based on the assessed risk, and performing such other procedures as we considered necessary in the circumstances. We believe that our audit provides a reasonable basis for our opinion.
Definition and Limitations of Internal Control Over Financial Reporting
A company’s internal control over financial reporting is a process designed to provide reasonable assurance regarding the reliability of financial reporting and the preparation of financial statements for external purposes in accordance with generally accepted accounting principles. A company’s internal control over financial reporting includes those policies and procedures that (1) pertain to the maintenance of records that, in reasonable detail, accurately and fairly reflect the transactions and dispositions of the assets of the company; (2) provide reasonable assurance that transactions are recorded as necessary to permit preparation of financial statements in accordance with generally accepted accounting principles, and that receipts and expenditures of the company are being made only in accordance with authorizations of management and directors of the company; and (3) provide reasonable assurance regarding prevention or timely detection of unauthorized acquisition, use, or disposition of the company’s assets that could have a material effect on the financial statements.
Because of its inherent limitations, internal control over financial reporting may not prevent or detect misstatements. Also, projections of any evaluation of effectiveness to future periods are subject to the risk that controls may become inadequate because of changes in conditions, or that the degree of compliance with the policies or procedures may deteriorate.
/s/ Ernst & Young LLP
Boston, Massachusetts
February 14, 202024, 2022
112
Item 9B. Other Information.
None.
Item 9C. Disclosure Regarding Foreign Jurisdictions That Prevent Inspections.
Not Applicable.
113
PART III
Item 10. Directors, Executive Officers and Corporate Governance.
The information required by this Item is incorporated herein by reference from the information in our Proxy Statement for our 20202022 Annual Meeting of Stockholders, which we will file with the SEC within 120 days of the end of the fiscal year to which this Annual Report on Form 10-K relates.
Item 11. Executive Compensation.
The information required by this Item is incorporated herein by reference from the information in our Proxy Statement for our 20202022 Annual Meeting of Stockholders, which we will file with the SEC within 120 days of the end of the fiscal year to which this Annual Report on Form 10-K relates.
Item 12. Security Ownership of Certain Beneficial Owners and Management and Related Stockholder Matters.
The information required by this Item is incorporated herein by reference from the information in our Proxy Statement for our 20202022 Annual Meeting of Stockholders, which we will file with the SEC within 120 days of the end of the fiscal year to which this Annual Report on Form 10-K relates.
The information required by this Item is incorporated herein by reference from the information in our Proxy Statement for our 20202022 Annual Meeting of Stockholders, which we will file with the SEC within 120 days of the end of the fiscal year to which this Annual Report on Form 10-K relates.
Item 14. Principal Accountant Fees and Services.
The information required by this Item is incorporated herein by reference from the information in our Proxy Statement for our 20202022 Annual Meeting of Stockholders, which we will file with the SEC within 120 days of the end of the fiscal year to which this Annual Report on Form 10-K relates.
114
PART IV
Item 15. Exhibits, Financial Statement Schedules.
(a) Documents filed as a part of this Report:
(1) Financial Statements
The financial statements of CarGurus, Inc. are included in Item 8 of this Annual Report on Form 10-K.
(2) Financial Statement Schedules
All financial statements schedules are omitted as they are either not required or the information is otherwise included in the consolidated financial statements and related notes.
(3) Index to Exhibits
The documents listed in the Exhibit Index immediately preceding the signature page of this Annual Report on Form 10-K are incorporated by reference or are filed or furnished with this Annual Report on Form 10-K, in each case as indicated therein (numbered in accordance with Item 601 of Regulation S-K).
Item 16. Form 10-K Summary.
Not applicable.
115
EXHIBIT INDEX
|
|
|
| Incorporated by Reference |
|
| ||||||
Exhibit Number |
| Exhibit Description |
| Form |
| File Number |
| Filing Date |
| Exhibit Number |
| Filed Herewith |
3.1 |
| Amended and Restated Certificate of Incorporation of the Registrant. |
| 8-K |
| 001-38233 |
| October 16, 2017 |
| 3.1 |
|
|
3.2 |
|
| 8-K |
| 001-38233 |
| October 16, 2017 |
| 3.2 |
|
| |
4.1 |
| Specimen Class A common stock certificate of the Registrant. |
| S-1/A |
| 333-220495 |
| September 29, 2017 |
| 4.1 |
|
|
4.2 |
|
| S-1 |
| 333-220495 |
| September 15, 2017 |
| 4.2 |
|
| |
4.3 |
|
|
|
|
|
|
|
|
|
| X | |
10.1 |
|
| S-1 |
| 333-220495 |
| September 15, 2017 |
| 10.1 |
|
| |
10.2# |
|
| S-1 |
| 333-220495 |
| September 15, 2017 |
| 10.2 |
|
| |
10.3# |
| Amended and Restated 2015 Equity Incentive Plan and forms of agreements thereunder. |
| S-1/A |
| 333-220495 |
| September 29, 2017 |
| 10.3 |
|
|
10.4# |
| Omnibus Incentive Compensation Plan and forms of agreements thereunder. |
| S-1/A |
| 333-220495 |
| September 29, 2017 |
| 10.4 |
|
|
10.5# |
| Offer Letter, dated March 17, 2006, by and between the Registrant and Langley Steinert. |
| S-1 |
| 333-220495 |
| September 15, 2017 |
| 10.5 |
|
|
10.6# |
| Offer Letter, dated August 10, 2015, by and between the Registrant and Jason Trevisan. |
| S-1 |
| 333-220495 |
| September 15, 2017 |
| 10.6 |
|
|
10.7# |
| Offer Letter, dated October 24, 2014, by and between the Registrant and Samuel Zales. |
| S-1 |
| 333-220495 |
| September 15, 2017 |
| 10.7 |
|
|
10.8# |
| Offer Letter, dated November 18, 2016, by and between the Registrant and Thomas Caputo. |
| 10-K |
| 001-38233 |
| February 28, 2019 |
| 10.8 |
|
|
10.9# |
| Offer Letter, dated August 2, 2017, by and between the Registrant and Kathleen Patton. |
| 10-K |
| 001-38233 |
| February 28, 2019 |
| 10.9 |
|
|
10.10# |
| Offer Letter, dated March 7, 2008, by and between the Registrant and Oliver Chrzan. |
| 10-K |
| 001-38233 |
| February 28, 2019 |
| 10.10 |
|
|
10.11 |
|
| S-1 |
| 333-220495 |
| September 15, 2017 |
| 10.8 |
|
| |
10.12 |
|
| S-1 |
| 333-220495 |
| September 15, 2017 |
| 10.9 |
|
| |
10.13 |
|
| S-1 |
| 333-220495 |
| September 15, 2017 |
| 10.10 |
|
| |
10.14# |
| Form of Non-Employee Director Restricted Stock Unit Agreement. |
| 8-K |
| 001-38233 |
| March 26, 2018 |
| 10.1 |
|
|
10.15# |
|
| 8-K/A |
| 001-38233 |
| April 6, 2018 |
| 10.1 |
|
| |
10.16# |
|
| 10-Q |
| 001-38233 |
| May 3, 2018 |
| 10.3 |
|
| |
10.17 |
| Lease Agreement, dated as of June 19, 2018, by and between US Parcel A, LLC and the Registrant. |
| 8-K |
| 001-38233 |
| June 20, 2018 |
| 10.1 |
|
|
10.18# |
| Consulting Agreement, dated April 1, 2019, by and between the Registrant and Oliver Chrzan. |
| 10-Q |
| 001-38233 |
| August 6, 2019 |
| 10.1 |
|
|
|
|
|
| Incorporated by Reference |
|
| ||||||
Exhibit Number |
| Exhibit Description |
| Form |
| File Number |
| Filing Date |
| Exhibit Number |
| Filed Herewith |
10.19 |
|
| 10-Q |
| 001-38233 |
| November 5, 2019 |
| 10.1 |
|
| |
10.20 |
| Indenture of Lease between S&A P-12 Property LLC and the Registrant, dated as of December 19, 2019. |
| 8-K |
| 001-38233 |
| December 20, 2019 |
| 10.1 |
|
|
21.1 |
|
|
|
|
|
|
|
|
|
| X | |
23.1 |
| Consent of Ernst & Young LLP, Independent Registered Public Accounting Firm. |
|
|
|
|
|
|
|
|
| X |
31.1 |
|
|
|
|
|
|
|
|
|
| X | |
31.2 |
|
|
|
|
|
|
|
|
|
| X | |
32.1* |
|
|
|
|
|
|
|
|
|
| X | |
32.2* |
|
|
|
|
|
|
|
|
|
| X | |
101.INS |
| Inline XBRL Instance Document- the instance document does not appear in the Interactive Data File because its XBRL tags are embedded within the Inline XBRL document. |
|
|
|
|
|
|
|
|
| X |
101.SCH |
| Inline XBRL Taxonomy Extension Schema Document. |
|
|
|
|
|
|
|
|
| X |
101.CAL |
| Inline XBRL Taxonomy Extension Calculation Linkbase Document. |
|
|
|
|
|
|
|
|
| X |
101.DEF |
| Inline XBRL Taxonomy Extension Definition Linkbase Document. |
|
|
|
|
|
|
|
|
| X |
101.LAB |
| Inline XBRL Taxonomy Extension Label Linkbase Document. |
|
|
|
|
|
|
|
|
| X |
101.PRE |
| Inline XBRL Taxonomy Extension Presentation Linkbase Document. |
|
|
|
|
|
|
|
|
| X |
104 |
| The cover page from the Company’s Annual Report on Form 10-K for the year ended December 31, 2019 has been formatted in Inline XBRL. |
|
|
|
|
|
|
|
|
| X |
116
117
|
|
|
| X | ||||||||||
31.1 | X | |||||||||||
31.2 | X | |||||||||||
32.1* | X | |||||||||||
32.2* | X | |||||||||||
101.INS | Inline XBRL Instance Document- the instance document does not appear in the Interactive Data File because its XBRL tags are embedded within the Inline XBRL document. | X | ||||||||||
101.SCH | Inline XBRL Taxonomy Extension Schema Document. | X | ||||||||||
101.CAL | Inline XBRL Taxonomy Extension Calculation Linkbase Document. | X | ||||||||||
101.DEF | Inline XBRL Taxonomy Extension Definition Linkbase Document. | X | ||||||||||
101.LAB | Inline XBRL Taxonomy Extension Label Linkbase Document. | X | ||||||||||
101.PRE | Inline XBRL Taxonomy Extension Presentation Linkbase Document. | X | ||||||||||
104 | The cover page from the Company’s Annual Report on Form 10-K for the year ended December 31, 2021 has been formatted in Inline XBRL. | X |
SIGNATURES
# Indicates a management contract or compensatory plan.
* The certifications furnished in Exhibit 32.1 and Exhibit 32.2 hereto are deemed to accompany this Annual Report on Form 10-K and will not be deemed “filed” for purposes of Section 18 of the Securities Exchange Act of 1934, as amended, except to the extent that the Registrant specifically incorporates it by reference.
118
SIGNATURES
Pursuant to the requirements of Section 13 or 15(d) of the Securities Exchange Act of 1934, as amended, the registrant has duly caused this report to be signed on its behalf by the undersigned, thereunto duly authorized.
| CarGurus, Inc. | ||
|
|
|
|
Date: February |
| By: | /s/ |
|
|
|
Chief Executive Officer |
|
|
| |
POWER OF ATTORNEY
Each person whose individual signature appears below hereby constitutes and appoints Langley SteinertJason Trevisan and Jason Trevisan,Scot Fredo, and each of them, with full power of substitution and resubstitution and full power to act without the other, as his or her true and lawful attorney-in-fact and agent to act in his or her name, place and stead and to execute in the name and on behalf of each person, individually and in each capacity stated below, and to file any and all amendments to this Annual Report on Form 10-K, and to file the same, with all exhibits thereto, and other documents in connection therewith, with the Securities and Exchange Commission, granting unto said attorneys-in-fact and agents, and each of them, full power and authority to do and perform each and every act and thing, ratifying and confirming all that said attorneys-in-fact and agents or any of them or their or his substitute or substitutes may lawfully do or cause to be done by virtue thereof.
Pursuant to the requirements of the Securities Exchange Act of 1934, as amended, this report has been signed below by the following persons on behalf of the registrant in the capacities and on the dates indicated.
Name |
| Title |
| Date |
|
|
|
|
|
/s/ |
| Chief Executive Officer and (Principal Executive Officer) |
| February |
|
|
|
|
|
|
|
|
|
|
/s/ |
| Chief Financial Officer (Principal Financial |
| February |
|
|
|
|
|
|
|
|
|
|
/s/ Yann Gellot | Senior Vice President, Finance (Principal Accounting Officer) | February 24, 2022 | ||
Yann Gellot | ||||
/s/ Langley Steinert | Executive Chairman and Chairman of the Board of Directors | February 24, 2022 | ||
Langley Steinert | ||||
/s/ Steven Conine | Director | February 24, 2022 | ||
Steven Conine |
|
|
|
|
|
|
|
|
|
/s/ Yvonne Hao |
| Director |
| February 24, 2022 |
Yvonne Hao | ||||
/s/ Lori Hickok |
| Director |
| February |
Lori Hickok |
|
|
|
|
|
|
|
|
|
/s/ Stephen Kaufer |
| Director |
| February |
Stephen Kaufer |
|
|
|
|
|
|
|
|
|
/s/ |
| Director |
| February |
|
|
|
|
|
|
|
|
|
|
/s/ |
| Director |
| February |
|
|
|
|
|
|
|
| ||
|
118119