

UNITED STATES
SECURITIES AND EXCHANGE COMMISSION
Washington, D.C. 20549
FORM 10-K
FORM 10-K
(Mark One)
☒ | ANNUAL REPORT PURSUANT TO SECTION 13 OR 15(d) OF THE SECURITIES EXCHANGE ACT OF 1934 |
For the fiscal year ended December 31, 20192022
OR
☐ | TRANSITION REPORT PURSUANT TO SECTION 13 OR 15(d) OF THE SECURITIES EXCHANGE ACT OF 1934 FOR THE TRANSITION PERIOD FROM TO |
Commission File Number 001-37869
Cars.com Inc.
(Exact name of Registrant as specified in its Charter)
Delaware | 81-3693660 |
(State or other jurisdiction of incorporation or organization) | (I.R.S. Employer |
300 S. Riverside Plaza, Suite 1000 Chicago, IL | 60606 |
(Address of principal executive offices) | (Zip Code) |
Registrant’s telephone number, including area code: (312) (312) 601-5000
Securities registered pursuant to Section 12(b) of the Act:
Title of each class | Trading Symbol | Name of each exchange on which registered | ||
Common Stock, Par Value $0.01 Per Share | CARS | The New York Stock Exchange |
Securities registered pursuant to Section 12(g) of the Act: None
Indicate by check mark if the Registrant is a well-known seasoned issuer, as defined in Rule 405 of the Securities Act. Yes ☐ ☐No No ☒
Indicate by check mark if the Registrant is not required to file reports pursuant to Section 13 or 15(d) of the Act. Yes ☐ ☐No No ☒
Indicate by check mark whether the Registrant: (1) has filed all reports required to be filed by Section 13 or 15(d) of the Securities Exchange Act of 1934 during the preceding 12 months (or for such shorter period that the Registrant was required to file such reports), and (2) has been subject to such filing requirements for the past 90 days. Yes Yes☒ No ☐☐
Indicate by check mark whether the Registrant has submitted electronically every Interactive Data File required to be submitted pursuant to Rule 405 of Regulation S-T (§232.405 of this chapter) during the preceding 12 months (or for such shorter period that the Registrant was required to submit such files). Yes☒ No ☐☐
Indicate by check mark whether the registrant is a large accelerated filer, an accelerated filer, a non-accelerated filer, smaller reporting company, or an emerging growth company. See the definitions of “large accelerated filer,” “accelerated filer,” “smaller reporting company,” and “emerging growth company” in Rule 12b-2 of the Exchange Act.
Large accelerated filer | ☒ | Accelerated filer | ☐ | |||
Non-accelerated filer | ☐ | Smaller reporting company | ☐ | |||
Emerging growth company | ☐ | |||||
If an emerging growth company, indicate by check mark if the registrant has elected not to use the extended transition period for complying with any new or revised financial accounting standards provided pursuant to Section 13(a) of the Exchange Act. ☐
Indicate by check mark whether the registrant has filed a report on and attestation to its management’s assessment of the effectiveness of its internal control over financial reporting under Section 404(b) of the Sarbanes-Oxley Act (15 U.S.C. 7262(b)) by the registered public accounting firm that prepared or issued its audit report. ☒
Indicate by check mark whether the Registrant is a shell company (as defined in Rule 12b-2 of the Exchange Act). Yes ☐ No ☒
At June 30, 2019,2022, the last business day of the Registrant’s most recently completed second fiscal quarter, the aggregate market value of common stock held by non-affiliates was $1,314,771,840$643,540,920 based on the closing sale price of common stock on such date of $19.72$9.43 per share on the New York Stock Exchange.
The number of shares of Registrant’s Common Stock outstanding as of February 19, 202016, 2023 was 66,810,957.66,153,878.
DOCUMENTS INCORPORATED BY REFERENCE
Portions of the Registrant’s Definitive Proxy Statement relating to the Annual Meeting of Stockholders, scheduled to be held on May 14, 2020,or about June 7, 2023, are incorporated by reference into Part III of this Report.
Table of Contents
Page | ||
PART I | ||
Item 1. | 1 | |
Item 1A. |
| |
Item 1B. |
| |
Item 2. |
| |
Item 3. |
| |
Item 4. |
| |
PART II | ||
Item 5. |
| |
Item 6. |
| |
Item 7. | Management’s Discussion and Analysis of Financial Condition and Results of Operations |
|
Item 7A. |
| |
Item 8. |
| |
Item 9. | Changes in and Disagreements With Accountants on Accounting and Financial Disclosure |
|
Item 9A. |
| |
Item 9B. |
| |
Item 9C. | Disclosure Regarding Foreign Jurisdictions that Prevent Inspections | 62 |
| ||
PART III | ||
Item 10. |
| |
Item 11. |
| |
Item 12. | Security Ownership of Certain Beneficial Owners and Management and Related Stockholder Matters |
|
Item 13. | Certain Relationships and Related Transactions, and Director Independence |
|
Item 14. |
| |
PART IV | ||
Item 15. |
| |
Item 16. |
| |
iii
PART I
Note AboutForward-Looking Statements. This report contains “forward-looking statements” within the meaning of the federal securities laws. All statements other than statements of historical facts are forward-looking statements. Forward-looking statements include information concerning our business strategies, strategic alternatives review process, plans and objectives, market potential, outlook, trends, future financial performance, planned operational and product improvements, potential strategic transactions, liquidity and other matters and involve known and unknown risks that are difficult to predict. As a result, our actual financial results, performance, achievements, strategic actions or prospects may differ materially from those expressed or implied by these forward-looking statements. These statements often includeuse words such as “believe,” “expect,” “project,” “anticipate,” “outlook,” “intend,” “strategy,” “plan,” “estimate,” “target,” “seek,” “will,” “may,” “would,” “should,” “could,” “forecasts,” “mission,” “strive,” “more,” “goal” or similar expressions. Forward-looking statements are based on our current expectations, beliefs, strategies, estimates, projections and assumptions, based on our experience in the industry as well as our perceptions of historical trends, current conditions, expected future developments, continuing developments regarding the COVID-19 pandemic, global supply chain shortages, fluctuating fuel prices, rising interest rates, inflation and other factors we think are appropriate. Such forward-looking statements are necessarily based uponon estimates and assumptions that, while considered reasonable by the Company and its management based on their knowledge and understanding of the business and industry, are inherently uncertain. YouWhile the Company and its management make such statements in good faith and believe such judgments are reasonable, you should understand that these statements are not guarantees of future strategic action, performance or results. Our actual results, performance, achievements, strategic actions or prospects could differ materially from those expressed in theor implied by these forward-looking statements. Given these uncertainties, forward-looking statementsyou should not be reliedrely on forward-looking statements in making investment decisions. ComparisonsWhen we make comparisons of results between current and prior periods, arewe do not intendedintend to express any future trends, or indications of future performance, unless expressed as such, and you should only be viewedview such comparisons as historical data. Whether or not any such forward-looking statement is in fact achieved will depend on future events, some of which are beyond our control.
Forward-looking statements are subject to a number of risks, uncertainties and other important factors, many of which are beyond our control, that could cause our actual results and strategic actions to differ materially from those expressed in the forward-looking statements contained in this report. For a detailed discussion of many of these and other risks and uncertainties, see “PartPart I, Item 1A., Risk Factors”Factors and “PartPart II, Item 7., Management’s Discussion and Analysis of Financial Condition and Results of Operations”Operations of this report. All forward-looking statements contained in this report are qualified by these cautionary statements. You should evaluate all forward-looking statements made in this report in the context of these risks and uncertainties. The forward-lookingForward-looking statements contained in this report are based only on information currently available to us and speak only as of the date of this report. Wethey are made, and we do not undertake noany obligation, other than as may be required by law, to update or revise any forward-looking or cautionary statements to reflect changes in assumptions, the occurrence of events, unanticipated or otherwise, or changes in future operating results over time or otherwise.statement. The forward-looking statements in this report are intended to be subject to the safe harbor protection provided by the federal securities laws.
Item 1. Business. Cars.com Inc., a Delaware corporation, and its consolidated subsidiaries are referred to here as “CARS,” the “Company,” “our,” “us” or “we,” unless the context indicates otherwise. CARS conducts all of its operations through its wholly owned subsidiaries.
Overview. We are a leading automotive marketplace platform that provides a robust set of digital marketplace and solutions provider for the automotive industry that connectsconnect car shoppers with sellers and original equipment manufacturers (“OEM”s). Our marketplace empowerssellers. We empower shoppers with the data, resources and informationdigital tools needed to make confident carinformed buying decisions whileand seamlessly connect with automotive retailers. In a rapidly changing market, we enable dealers and automotive manufacturers (“OEMs”), with innovative technical solutions and data-driven intelligence, to better reach and influence ready-to-buy shoppers, acquire vehicles, provide financing tools with instant online loan screening and approvals, increase inventory turn, improve operating efficiency and gain market share.
In addition to Cars.com™, our brands include Dealer Inspire®, a website and digital solutions provider enabling dealers to be more efficient through connected digital experiences; FUEL™, an advertising solution providing dealers and OEMs the benefit of leveraging targeted digital video and display marketing to Cars.com’s audience of in-market car shoppers; DealerRater®, a leading car dealer review and reputation management technology platform helps sellers improve operational efficiency, profitabilitysolution; CreditIQ®, a digital financing technology and sales.Accu-Trade™, a vehicle valuation and appraisal technology. Our portfolio of brands also includes Cars.com, Dealer Inspire and DealerRater, in addition to Auto.com, NewCars.com and PickupTrucks.com.NewCars.com®.
Marketplace.Our Business
Attracting ready-to-buy car shoppers to our marketplace is crucial to meeting the needs of our customers. Driven by the strength of the Cars.com brand name and our extensive trusted editorial content, during 2022, we attracted over an average of 26 million monthly unique visitors, the majority coming to us organically. Approximately 85% of consumers who visit Cars.com intend to purchase a vehicle within the next six months, and we believe Cars.com has the category’s strongest site engagement according to a recent Cars.com survey.
Our marketplace is core to our business, and we have built on this strength to increase our value to customers by providing additional digital solutions and technology. Cars.com is a leading automotive marketplace, through in-house innovations and targeted acquisitions we now provide a full suite of integrated platform capabilities.
For Customers. Our primary customers are car dealers, OEMs, other national advertisers and lenders. For the year ended December 31, 2022, 89% of our revenue was generated from dealers, 9% related to OEMs and other national advertisers and 2% was generated from other customers.
1
For Shoppers.Buying a car is one of life’s most significant and researched decisions. According to Cars.com’s Q4 2022 Consumer Metrics Study, 41% of shoppers are extending their purchase timelines to find the right vehicle at the right price. Numerous product options with opaque, yet negotiable prices, and gaps in the online-to-offline shopping experience add complexity to an already overwhelming decision-making process. Shoppers want a streamlined, simplified automotive retail experience. CARS helps car shoppers cut through the clutter and support shoppers with tools designed to alleviate friction from search to signature. Dealers and OEMs value our marketplace consistsfor the chance to connect with our high-intent and engaged, in-market audience, and to improve their marketing and operational efficiency with our suite of solutions.
Our marketplace functions as a fully-responsive website that is accessible on a user’s devicedefinitive resource for car buyers. We are known for our scale and depth with over 2.5 million vehicle listings and over 12 million consumer reviews as of choiceDecember 31, 2022, as well as the No. 1 downloadedour expert editorial reviews and rated mobile application in our category. It features a database of 4.5 million new and used vehicle listings, more than eight million consumer and expert reviews, a significant news and research section, consisting of original editorial content from a team of automotive experts,publications that help shoppers along their purchase journey. Our consumer experience is focused on reducing friction, improving speed and delivering powerful results through several pricing, comparison, research and researchcommunication tools that empower buyers. We also provide shoppers with solutions ranging from instant vehicle financing to help guide shoppers on their path to purchase. Recently launched shopper solutions include:vehicle appraisals that include instant cash offers.
|
|
|
|
|
|
Digital Solutions & Technology Platform. As we expand beyond an inventory listings provider to a full-service digital solutions provider, bolstered by our acquisitions of Dealer Inspire and DealerRater, our offerings and value proposition for both shoppers and sellers has strengthened. Dealer Inspire, acquired in 2018, is an automotive technology leader that provides market-leading websites, technologyFor Sellers. solutions and advertising services to dealers across the United States and Canada. DealerRater, acquired in 2016, is one of the nation’s leading sources of user-generated reviews of both automobile dealers and dealership salespeople. Through DealerRater, we help dealerships establish and manage their reputations. DealerRater’s six million reviews are syndicated across a variety of platforms (including Cars.com), reaching more than 40 million consumers, digitally, each month.
Digital Advertising. We offer local dealers, OEMs, dealer groups and manufacturersauto-adjacent companies a variety of digital advertising servicesproducts and solutions. We generate revenue primarily through the sale of our marketplace subscription products to dealer customers which provide access to our monthly audience of 26 million high-quality, in-market car shoppers. We complement our marketplace products with digital solutions includingand media offerings, which have become a key area of growth and are critical to our core inventory listings package, display advertising, social media advertising, video marketing, paid searchplatform strategy. Through our acquisitions of CreditIQ and email marketing.Accu-Trade, we now are able to provide dealers with advanced digital financing technology, as well as vehicle valuation and appraisal technology.
History.CARS Cars.com was established in 1998 as part of a joint venture formed by a number of leading newspaper and broadcast companies that realized their historic classified advertising businesses were being eroded as advertising began to move to the Internet. In 2014, one of the joint ventures,venturers, Gannett Co., Inc. (“Gannett”) acquired the interests of the other joint venturers, and we became a wholly-ownedwholly owned subsidiary of Gannett. On May 31, 2017, Gannett, which had changed its name to TEGNA Inc. (“TEGNA”), effected a spin-off of Cars.com along with the DealerRater business that it had acquired in 2016 (the “Spin”), creating Cars.com Inc. and distributingdistributed 100% of our common stock to TEGNA’s shareholders. On June 1, 2017, our common stock began trading on the New York Stock Exchange (the “NYSE”NYSE under the ticker symbol “CARS”). In February 2018, we acquired the stock of privately held Dealer Inspire Inc., which provides website and other technology solutions, and substantially all the assets of Launch Digital Marketing LLC, which provided the digital marketing services now offered by Dealer Inspire. In November 2021, we acquired the stock of CreditIQ, Inc., a privately held, automotive fintech platform that provides instant online loan screening and approvals to facilitate online car buying. In March 2022, we acquired certain assets and assumed certain liabilities of Accu-Trade, LLC; Accu-Trade Canada, LLC; Galves Market Data; and Headstart Logistics, LLC d/b/a MADE Logistics (collectively, “Accu-Trade”), which includes real-time, VIN-specific appraisal and valuation data, instant guaranteed offer capabilities and logistics technology. By investing in technology, organically and through acquisitions like CreditIQ and Accu-Trade, we strive to provide the best end-to-end car shopping experience for both buyers and sellers.
Industry Dynamics. CARS operates in the large and growing automotive advertising and technology solutions market. AccordingPrior to the Borrell Associates’ 2018 Automotive Outlook report, approximately 67%COVID-19 pandemic and the subsequent and sustained vehicle inventory shortages, dealers were experiencing margin compression, decreased OEM support and growing consumer expectations around service and support. However in 2022, limited inventory of new vehicles coupled with strong consumer demand has supported higher dealer profit margins for both new and used vehicles. It has also brought higher consumer expectations on what portion of the $34 billion U.S. auto advertising industry is spent on digital marketing. Overpurchase journey they can complete prior to visiting the next five years, advertising for the automotive industry is expected to grow to approximately $37 billion, with digital advertising expected to reach 74% of the overall market spend over the same period. Furthermore,dealership. As a result, dealers spend three times more on solutions than marketing, according to the same report.
Automotive dealers are facing increasing market pressures to become more competitive in attracting car buyers. Margins are compressing while consumer expectations are growing. Dealers are investing more onin their websites and technology solutions, embracing technology solutions that help drive operational efficiency, and supporting shoppers in their first-party platforms (their own websites)preferred channels (i.e., online, offline or both). CARS isThose dealers that invest in and leverage technology are building a sustainable margin advantage. We believe we are the only combinedfirst truly integrated marketplace and solutions provider in the market today. Moving beyond a pure marketplace modeltoday, and that we are well-positioned to asupport dealers with our comprehensive, multi-faceted, sales-oriented suite of tools and solutions.
Products. Our core products for sellers include:
Marketplace products.
2
Digital Solutions.
For shoppers, buying a car is one of life’s most significant and researched decisions. Accordingretail in the dealer's market, sending to auction, selling directly to a nearby dealer, or liquidating with our offer guarantee. Additionally, through Accu-Trade, we provide technology that gives consumers instant and transparent cash offers for their exact VINs via our dealer websites, as well as Cars.com.
Media.
3
Our strengths and competitive advantages. Our vision is to become the largest digital automotive platform powering innovative digital and media solutions to create frictionless shopping experience add complexityexperiences for shoppers and sellers. We are pursuing a product first growth strategy to an already overwhelming decision-making process. Consumers want an improved shopping experience. Automotive marketplaces helpcement our position as the destination for car shoppers research and facilitatesellers. We believe our success is driven by our industry leading brand, high quality audience, differentiated technology solutions and customer centricity, which delivers sustainable revenue growth and cash flow from operations.
A powerful family of brands delivering integrated digital and media solutions that enable our platform strategy. Our family of brands includes a suite of integrated digital and media solutions that define our platform strategy. Our solutions seamlessly connect buyers and sellers wherever they are in their vehicle shopping journey. Our platform helps sellers expand their consumer influence and engagement across the entire purchasing journey, ultimately increasing sales, creating operational efficiencies and improving profitability.
Cars.com, our flagship brand, is synonymous with car purchase. Accordingshopping. Among our core competitors selling new and used vehicles, we rank No. 1 in brand awareness according to the 2018 Car Buyer Journey study conducted by IHS Markit, nearly 80% of car shoppers utilize third-party sites such as Cars.comQualtrics, a customer insights platform. We are a trusted and spend more than 60% of their research time on these sites.
We see an opportunity to continue to address pain-pointsreliable partner for both car shoppers and sellers. CARS makes shopping easier by providingAmong automotive marketplaces, we believe we are a first mover in successfully extending our focus to automotive solutions.
In addition to Cars.com, our robust portfolio of solutions is an important component of our strategy and a key differentiator relative to our competitors; it includes the toolsfollowing customer facing brands:
Our Business
Customers. Our core customers are car dealerships and automotive manufacturers. 84.3% of our revenue is generated from car dealerships, while 13.3% comes from manufacturers and national advertisers and 2.4% is generated from customers within peer industries. provides dealers with higher quality leads with efficiencies including reduced time to close.
|
|
|
|
ShoppersA high-quality audience, at scale, enables our industry-leading platform. Attracting ready-to-buyWe have made strategic investments in technology and marketing to deliver what we believe is the industry’s most qualified car shoppersshopping audience. Our audience not only powers our marketplace advertising packages, it also drives our integrated platform strategy. It is key to our ability to efficiently grow and scale our media solutions that allow customers to target in-market shoppers and strengthens our digital solutions.
In 2022, we had 26 million average monthly unique visitors that visited our marketplace is crucial to meetingnearly 600 million times. We generate the needs of our automotive customers. We believe we are the category leaders in organic traffic and the vast majority of our traffic organically. Our organic strength is organic. Eight outdriven by our high-quality content, which includes editorial and consumer reviews, trust that comes from our years in the market, and suite of ten consumers who visit Cars.com intendeasy to use consumer facing tools like Best Match. Over the past 20 years, we have made more than half a billion connections between car shoppers and sellers.
According to a recent CARS survey, approximately 85% of our audience is in-market to buy a car, compared to a fraction of the general population. The average time to purchase a vehicle,car is approximately two months, while approximately 50% of our audience plans to buy within 30 days.
Resilient business model with an attractive cash flow financial profile and we believe we have some of the category’s strongest site engagement. strong balance sheet.
Solutions. We generate nearly 90% of our revenue primarily through the salevia subscription, creating a dependable recurring revenue stream across our diversified mix of onlinemarketplace subscription advertising products to car dealer customers, which enable dealers access to our high-quality, in-market audience of car shoppers through their vehicle inventory listing. The growth of our solutions business has become a core focus for us. Some of our corepackages, digital solutions, and technology productsmedia. Customer concentration is also limited and we generate an average monthly revenue of $2,329 from each of our nearly 20,000 dealers per month.
Our asset-light business model drives significant net operating cash flow, in excess of $125.0 million in each of the last three years, resulting in substantial liquidity and financial flexibility, which enables us to invest in innovation, pursue strategic growth opportunities and maintain a healthy balance sheet with modest leverage.
4
Strong, experienced management team. Our management team has deep marketplace and industry knowledge and a demonstrated track record of delivering results. The team also brings unique experience driving innovation and digital transformation and unlocking value for customers include:while modernizing established industries.
|
|
|
|
|
|
|
|
|
|
|
|
|
|
|
|
Key Differentiators. Business Strategy. Our vision is to become the largest digital automotive platform powering innovative digital and media solutions to create frictionless shopping experiences for buyers and sellers. We are pursuing a product-first growth strategy to cement our position as the destination for car shoppers and sellers. Our success is driven by our industry leading brand, high quality audience, differentiated technology solutions and customer centricity, which we believe will deliver sustainable high growth revenue, earnings, and cash flow.
Our Long-Term Growth Strategy. Our strategy is to drive efficienciescontinue to invest in our key strengths:
Competition. We face competition to attract consumers and paying dealers to our marketplace and to attract advertisers to purchase our advertising products and services, including our website creation and hosting services. Our competitors offer various marketplaces, solutions and media products that compete with us. Some of these competitors include:
Competition for Consumers and Dealers. We compete for consumer visits with other online automotive marketplaces, OEM websites, free listing services, general search engines, social media and dealer websites. We compete for shopper traffic primarily on the basis of the quality of our user experience. We believe our user experience compares favorably due to the scale of our vehicle listings, the content and unbiased transparency of the information we provide on vehicles, pricing and dealers, as well as the intuitive nature of our user interface, sophisticated search tools and algorithms and our mobile user experience, among other factors.
We compete for dealers’ marketing budget with offline customer acquisition channels, software and solutions spend, other online automotive marketplaces, dealers’ own customer acquisition efforts on search engines and other internet sites that attract consumers searching for vehicles. We compete primarily on the basis of the return on investment to the customer that our business has many competitive advantages, including:marketplace provides.
5
We believe we are in a favorable market position due to our highly engaged, large, in-market consumer audience and the resulting volume and quality of connections we provide to dealers, resulting in an attractive ROI. Competition for Advertisers. We compete for a share of advertisers’ total marketing budgets against media sites, websites dedicated to helping consumers shop for cars, search engines and social media sites, among others. We also compete for a share of advertisers’ overall marketing budgets with traditional media, such as television, radio, magazines, newspapers, automotive guide publications, billboards and other offline advertising channels. We compete for advertising spend based on the marketing ROI that our products provide. We believe we are in a favorable market position due to our large in-market consumer audience, high consumer engagement and the effectiveness and relevance of our advertising products.
|
|
|
|
|
|
|
|
|
Intellectual Property
. WeIn addition to the protection provided by our intellectual property rights, we enter into confidentiality and proprietary rights agreements with our employees, consultants, contractors and business partners. Our employees and contractors are also subject to invention assignment provisions. In addition, we control the use of our proprietary technology and intellectual property through provisions in both our general and product-specific terms of use on our mobile applications and websites.
Regulatory Matters. Various aspects of our business and the solutions we offer are or may be subject to a continually expanding and evolving range of local, state, federal and international regulation.
In particular, theregulations. The advertising and sale of new or used vehicles is highly regulated by the states in which we do business. Although we do not sell motor vehicles,automobiles, the dealers from which we derive a significant portion of our revenue do sell them.them and are subject to significant regulation. Moreover, state regulatory authorities or other third parties could take and, on some occasions, have taken the position that some of the regulations applicable to dealers or to the manner in which motor vehiclesautomobiles are advertised and sold generally are directly applicable to our business model.
By providing a medium through which users can post content and communicate with one another using text messages and other mobile phone communications, Additionally, our business is directly subject to laws, regulations, and standards covering marketing and advertising activities conducted by telephone, email, mobile devices, and the internet, such as limited to the Telephone Consumer Protection Act, the CAN-SPAM Act, and similar state consumer protection laws.
Our digital solutions products may also be subject to laws governing accessibility, intellectual property ownership, obscenity, libel and privacy, among other issues.
In addition, we are subject to numerous federal, national, state, and local laws and regulations in the United States and internationally regarding privacy and the collection, processing, storage, sharing, disclosure, use and protection of personal information and other data, such as the Gramm-Leach-Bliley Act or the California Consumer Privacy Act. or the California Privacy Rights Act. While the scope of these laws and regulations is changing, and remains subject to differing interpretations, we seek to comply with industry standards and all applicable laws, policies, legal obligations and industry codes of conduct relating to privacy and data protection. We are also subject to the terms of our privacy policies and privacy-related obligations to third parties.
To operate in this highly regulated environment, we have developed our products and services with a view toward appropriately managing the risk that our regulatory compliance or the regulatory compliance of our dealer customers could be challenged.compliance. If, and to the extent that, our products and services fail to satisfy relevant regulatory requirements, we could be subject to significant civil and criminal penalties, including fines, or the award of significant damages in class action or other civil litigation, as well as orders interfering with our ability to continue providing our products and services in certain states.
Employees. Human Capital. CARS is committed to the highest standards of integrity, inclusion and responsible business practices. Our commitment to build a culture and business that cares about our employees, customers, industry and communities is a part of who we are – it’s in our DNA.
We believe our highly innovative and effective teams are one of our biggest differentiators and the most important investment we can make at CARS. We promote and foster an environment that encourages constant learning and curiosity, including offering all of our employees additional learning and development opportunities. We provide individual training and certifications, across thousands of topics and interests, to ensure our teams continue developing the needed skills to grow in their careers at CARS and deliver their very best every day. Leadership development programs are also available to provide in-depth training courses to help managers build successful teams focused on innovating in our business and the ever-changing automotive and technology industries. The courses develop skills of influence, time management, coaching, feedback, conflict management, empathy and overall leadership.
At CARS, we believe we offer competitive and equitable compensation and benefits that include:
6
We also closely monitor employee satisfaction and engagement, conducting semi-annual, anonymous, company-wide surveys that are studied by our executive management team and shared with our Board of Directors. These surveys are an important way for us to identify areas where we can improve. We encourage employee participation in the surveys, with participation rates typically greater than 80%, which allows us to gather valuable insight into employee satisfaction.
We believe that a diverse workforce enhances the value of the Company for all stakeholders. We undertake many initiatives to ensure that CARS is an inclusive place to work for people of all backgrounds, genders, nationalities, ethnicities, sexual orientations and beliefs. We incorporate diversity considerations into all aspects of our employment journey, from targeted recruitment to fostering diversity affinity groups through our Employee Resource Groups. We also offer regular Unconscious Bias training to encourage and uncover opportunities to create a more inclusive and open workplace. Our diversity initiatives are managed directly by our executive management team, underscoring our commitment to this important principle across all levels of the organization. At CARS we have solidified our commitment to diversity, equity and inclusion by monitoring and measuring diversity in talent acquisition and retention and by tying executive incentive compensation to performance in this area.
We have a variety of active Employee Resource Groups at CARS, focused on serving as enterprise-wide champions for diversity, equity, and inclusion, helping us to identify areas in which we can become even more inclusive. These groups also allow for the open sharing of ideas and cultural awareness among our teams while providing civic engagement within our communities, leadership development, and improving overall cultural competence.
As of December 31, 2019, we2022, CARS had approximately 1,5001,700 full-time employees. We also engage contractors to support our operations. None of our employees are represented by a labor union or are subject to a collective bargaining agreement. We have not experienced any work stoppages, and we consider our relations with our employees to be good.
Available Information. We file periodicOur Annual Report on Form 10-K, quarterly reports (Formson Form 10-Q, and 10-K) and current reports (Form 8-K)on Form 8-K, proxy statements, and other information withamendments to those reports filed or furnished pursuant to Section 13(a) or 15(d) of the Securities and Exchange Commission (“SEC”). Our filings with the SECAct are available to the public on the SEC’s websitefree of charge at www.sec.gov. Our filings are also available to the public on, or accessible through, our corporate website for free via the “Investor Relations” section at http:https://investor.cars.com as soon as reasonably practicable after they are filedwe file such material with, or furnish it to, the U.S. Securities and Exchange Commission (SEC). In addition, the SEC maintains a website (http://www.sec.gov) that contains information we electronically file with, or furnish to, the SEC. The information we file with the SEC or containedInformation on or accessible through, our corporate website or any other website that we may maintain is not incorporated by reference herein and is not part of this report. We may from timeor any other report we file with, or furnish to, time provide important disclosures to investors by posting them in the investor relations section of our website, as allowed by SEC rules.SEC.
Item 1A. Risk Factors.
The following risk factors should be considered carefully, together with all of the other information contained in this report, including “Selected Financial Data,” “Management’s Discussion and Analysis of Financial Condition and Results of Operations” and our financial statements and related notes, when evaluating our business and any forward-looking statementsor other statements we or our representatives make from time to time. Any of the following risks could materially and adversely affect our business, results of operations, financial condition and the actual outcome of matters as to which statements are made. The risks and uncertainties described in this report are not the only ones we face. Other risks or uncertainties, which are not currently known to us or that we believe are immaterial, also may adversely affect our business, operating results, and financial condition.
Risks Related to Our Business
Our business is subject to risks related to the larger automotive ecosystem, including consumer demand, direct-to-consumer sales models, and other macroeconomic issues.
A number of economic and market conditions drive changes in automobile sales, including disruptions in the new automobile supply chain, the availability and prices of new and used automobiles, levels of unemployment and inflation, availability of affordable financing, fluctuations in the cost of fuel, consumer confidence and demand for vehicles, political unrest or uncertainty, the occurrence of contagious disease or illness, including COVID-19, barriers to trade and other global economic conditions. Decreases in consumer demand could adversely affect the market for automobile purchases and, as a result, reduce the number of consumers using our platform.
Consumer purchases of new and used automobiles generally decline during recessionary periods and other periods in which disposable income is adversely affected. Purchases of new and used automobiles are typically discretionary for consumers and have been, and may continue to be, affected by negative trends in the economy, including an economic recession or downturn, increases in the cost of energy and gasoline, the availability and cost of credit, reductions in business and consumer confidence, stock market volatility, rising interest
7
rates, inflation, tariffs, health or similar issues, such as pandemic or epidemic, and increased unemployment. An increase in interest rates can have a significant impact on automobile purchases and affordability due to the direct relationship between interest rates and monthly loan payments, a critical factor for many consumers, and the impact interest rates have on consumers’ borrowing capacity and disposable income. Interest rates could negatively affect the number of vehicles purchased by consumers, and any reduction in purchases could adversely affect dealers and OEMs and lead to a reduction in spending on our solutions. Further, if OEMs continue to transition to e-commerce and direct-to-consumer sales models to grow their market penetration, consumer demand for our platform could be materially affected with users shifting from our platform to an OEM-based platform.
In addition, a decline in market demand due to a shift to remote and virtual work and the use of ride-sharing and the development of autonomousride sharing vehicles could erode the demand for new and used automobiles. A reduction in the number of automobiles purchased by consumers could adversely affect automobile dealers and car manufacturers and consequently lead to a reduction in otherreduced spending by these constituents.on our digital marketing services and solution offerings. Further, OEM production shortages, supply chain disruptions and inventory shortfalls could adversely impact automobile dealers and also reduce spending on our digital marketing services and solution offerings. Though our current customer bases, revenue sources and operations are substantially limited to the United States, our business may be negatively affected by challenges toin the global automotive ecosystem and other macroeconomic issues.
Market acceptance of and influence over certain of our products and services is concentrated with a limited number of automobile OEMs and dealership associations, and we may not be able to maintain or grow these relationships.
Although the automotive retail industry is fragmented, a relatively small number of OEMs, dealership associations, and their program administrators exert significant influence over the market acceptance of certain automotive products and services due to their concentrated purchasing activity, the visibility of their endorsement or recommendation of specific products and services, their provision of co-operative advertising money to dealers, and their ability to define technical standards and certifications and marketing guidelines. For example, many of our website solutions are provided pursuant to OEM-designated endorsements or preferred vendor programs. While automotive dealers are generally free to purchase the solutions of their choosing, if an OEM has endorsed or certified a provider of products or services to its associated franchised dealers and if our solutions lack such certification or endorsement, adoption or retention of our products and services could be materially impaired.
Dealer closures or consolidation among dealers or OEMs could reduce demand for, and negatively affect the pricing of, our marketing and solutions offerings, thereby leading to decreased earnings.
When dealers consolidate, the services they previously purchased separately are often purchased by the combined entity in a lesser quantity than before, leading to volume compression and loss of revenue across the automotive marketplace sector. In the past, dealers were more likely to close or consolidate when conditions in the automotive industry and/or general economic conditions were poor. Despite our market position, consolidation or closures of automobile dealers could reduce the aggregate demand for our services in the future and limit the amounts we earn from our solutions. In addition, advertising purchased by OEMs accounts for a meaningful portion of our revenue. There are a limited number of OEMs, and financial difficulties or consolidation among OEMs could similarly lead to volume compression and loss of revenue.
Our business depends on our strong brand recognition, and any failure to maintain, protect and enhance our brands could hurt our ability to retain or expand our base of consumers, dealers and advertisers, and our ability to increase the frequency with which consumers, dealers and advertisers use our services.
We believe that maintaining and increasing the strong recognition of the CARS brand is critical to our future success. Our brand drives traffic to our websites and applications. Our brand attracts a large base of in-market car shoppers by offering credible and easy-to-understand information from consumers and experts and new and used vehicle listings. In addition, OEMs, dealers and other advertisers rely on our innovative digital marketing services and solution offerings to drive results in their businesses. To grow our business, we must maintain, protect and enhance our brands. Otherwise, we may be unable to expand our base of consumers, customers and advertisers, or increase the frequency with which such constituents use or purchase our solutions. Expanding the business will depend, in part, on our ability to maintain the trust that consumers, customers and advertisers place in our solutions and services and the quality and integrity of the listings and other content found on the CARS sites and mobile applications. In addition, any negative publicity about us, including our solutions, technologies, sales practices, personnel or customer service, could diminish confidence in and the use of our services. If we experience negative publicity, or if consumers perceive that content on the CARS sites or mobile applications is not reliable, our reputation, the value of our brands and traffic to our sites and mobile applications could decline.
The COVID-19 pandemic and related restrictions have materially and adversely affected, and could continue to materially and adversely affect, our business, financial condition, liquidity and results of operations.
8
Since March 2020, the COVID-19 pandemic and the measures implemented by governmental authorities around the country to contain the virus have adversely affected businesses, economies and financial markets worldwide, and have caused significant volatility in U.S. and international debt and equity markets. To varying degrees and at different points over the past three years, the COVID-19 pandemic has adversely affected, and may continue to adversely affect our business, financial condition, liquidity and operating results. To the extent to which the COVID-19 pandemic ultimately impacts our business depends on future developments, which are highly uncertain and cannot be predicted, such as the severity and duration of the pandemic, the continued transmission of the virus, further actions taken by federal, state, and local governments and third parties in response to the pandemic, the effectiveness of actions taken to contain the virus, the emergence of new variant strains, and the availability and effectiveness of vaccines. Future epidemics, pandemics, and other outbreaks could also adversely affect our business, results of operations, and financial condition.
Substantially all of our revenue is generated from subscription services offered to automotive dealers and our national advertising offerings to OEMs and other advertisers in or adjacent to the automotive industry and our business may be negatively affected during times of low automobile sales, low dealer inventory due to production shortages or delays and high unemployment. To the extent a weakened economy impacts our customers’ ability or willingness to pay for our services or our vendors’ ability to provide services to us, our operations, liquidity and financial condition could be negatively impacted. As a result, in order to respond to changes in our revenue, we may be required to implement expense-reduction measures or amend our debt instruments in the future, which could further adversely impact our operations, liquidity and financial condition.
Although the initial impact from the COVID-19 pandemic to our business has stabilized, we may continue to experience adverse effects to our business as a result of its economic impact, including an economic recession or downturn, the impact of such a recession or downturn on unemployment levels, consumer confidence, levels of personal discretionary spending, credit availability, the availability and cost to access the capital markets and the effect on our customers’ demand for and ability to pay for our services.
We rely in part on Internet search engines and mobile application stores to drive traffic to the CARS sites and increase downloads of our mobile applications. If the CARS sites and mobile applications fail to appear prominently in these search results, traffic to the CARS sites and mobile applications would decline and our business, results of operations or financial condition may be materially and adversely affected.
We depend, in part, on Internet search engines such as Google to drive traffic to the CARS sites. For example, when a user searches for the make and model of a specific automobile or a generic phrase, such as “automobile prices,” using an Internet search engine, we rely on a high organic search ranking of the CARS sites in these search results to drive consumer traffic. However, our ability to maintain these high search result rankings is not fully within our control. For example, our competitors’ search engine optimization efforts may result in their websites receiving a higher search result page ranking than us, or Internet search engines could revise their methodologies in a way that would adversely affect our search result rankings. In addition, Internet search engines could provide automobile dealer and pricing information directly in search results or choose to align with our competitors or develop competing services. The CARS sites have experienced both positive and negative fluctuations in search result rankings in the past, and it is anticipated that similar fluctuations will occur in the future.
Additionally, we depend in part on mobile application download stores such as the Apple App Store and Google Play to direct consumers to download CARS’ mobile applications. When a mobile device user searches in a mobile application store for “car buying app” or a similar phrase, we rely on both a high search ranking and consumer brand awareness to drive consumers to select and download CARS’ mobile applications instead of those of our competitors. However, our ability to maintain high, non-paid search result rankings in mobile application stores is not fully within our control. Our competitors’ mobile application store search optimization efforts may result in their mobile applications receiving a higher result ranking than that of Cars.com, or mobile application download stores could revise their methodologies in a way that would adversely affect our search result rankings.
If Internet search engines or mobile application download stores modify their search algorithms in ways that negatively impact traffic to the CARS sites or CARS mobile applications, or if the search engine or mobile application store optimization efforts of our competitors are more successful than our own efforts, overall growth in our user base could slow or the user base could decline.
We rely on in-house content creation and development to drive organic traffic to the CARS sites and mobile applications.
We rely on our in-house editorial content team to continually develop content that is useful and of interest to consumers to drive organic traffic to the CARS sites and mobile applications. Our editorial content team tests, reviews and photographs a large number of different
9
car makes and models every year to support our creation of independent and unbiased automotive industry coverage. Our internally developed content focuses primarily on consumer automotive purchasing, ownership advice and analysis of ownership trends. If we are unable to continue to develop our in-house content, we may be required to rely more heavily on third-party content providers, which could lead to less distinctive content on our sites and increased operating costs, including increased traffic acquisition costs. Additionally, if we are unable to continue providing the same level of high-quality, unique consumer content, organic traffic across the CARS sites and mobile applications could decrease. Such a decrease may lead to dealers receiving fewer indications of consumer interest through leads generated by the CARS sites and mobile applications and recognizing less value for their digital advertising spend. As a result, dealers may decide not to continue to list their vehicles on the CARS sites and mobile applications. Similarly, decreased organic traffic due to a reduction in unique content may cause national advertisers such as OEMs to shift their digital advertising spend to sites with higher traffic. Further, decreased traffic from in-house content could result in increased spend in paid channels, which would result in higher sales and marketing expenses. Any of the foregoing could materially and adversely affect our business, results of operations or financial condition.
Certain of our third-party service providers are highly regulated financial institutions, and the federal and state laws related to financial services could have a direct or indirect materially adverse effect on our business.
In November 2021, we acquired the stock of CreditIQ, Inc., a privately held, cutting edge automotive fintech platform that provides instant online loan screening and approvals to facilitate online car buying. Although we do not provide financial products, we have entered into agreements with partners to provide automobile financing products to our users, including products that may involve a credit application or access to consumer credit scores. Our partners may be subject to extensive federal and state laws and regulations related to the provision of financial services. We cannot guarantee that relevant regulatory authorities or third parties will not take the position that some of the regulations applicable to financial product providers, or to the manner in which such products are advertised or sold, apply to our platforms or business. If our products or services are determined to fall within the scope of those laws or regulations, we or our partners may be required to implement new measures to comply with these laws and regulations, which could be costly, or be required to discontinue or limit the offering of certain products or services in affected jurisdictions. Additionally, if our products or services are determined not to comply with relevant regulatory requirements, we or our partners could be subject to possibly significant civil and criminal penalties, including fines, or the award of significant damages in class action or civil litigation, as well as orders interfering with our ability to continue providing our products and services in certain jurisdictions. Even without a determination that our products or services fall within the scope of these laws or regulations, if any of our current or prospective partners is uncertain about the applicability of those laws and regulations to our business, the partners may terminate their business with us, or we could have difficulty attracting new partners, which would adversely affect our future growth. Any or all of these adverse effects could result in substantial negative publicity, increased regulatory scrutiny, decreased revenues, increased expenses and decreased profitability.
Risks Related to Environmental Laws and Climate Change Impacts
Our business may be affected by climate change, including physical risks and regulatory changes that may increase our operating costs and impact our ability to deliver services to our customers.
Climate change poses both physical and transitional risks to CARS, which may affect our operations, financial performance, and reputation. CARS conducted a climate risk assessment to better understand the types of climate-related risks that are most salient for our business. This assessment reviewed our exposure to these risks as well as the systems in place to manage these risks. During the climate risk assessment, we identified a series of climate-related challenges that may pose material, financial risks to our business operations and financial performance. These include physical risks from extreme weather events such as floods, droughts, and storms, which can damage our assets and disrupt our operations. Regulatory risks resulting from changes in laws and regulations on climate change may increase our compliance costs and limit our ability to operate. Additionally, transition risks include the shift to a low-carbon economy which may affect the demand for our products and services. Finally, reputational risks also exist related to the increased public scrutiny of our environmental impact and our response to climate change at the enterprise level.
Expectations relating to environmental, social and governance considerations expose the Company to potential liabilities, increased costs, reputational harm and other adverse effects on the Company’s business.
Many governments, regulators, investors, employees, customers and other stakeholders are increasingly focused on environmental, social and governance considerations relating to businesses, including climate change and greenhouse gas (“GHG”) emissions, human capital and diversity, equity and inclusion. The Company makes statements about its environmental, social and governance goals and initiatives through information provided on its website, press releases and other communications. Responding to these environmental,
10
social and governance considerations and implementation of these goals and initiatives involves risks and uncertainties, requires investments, and are impacted by factors that may be outside the Company’s control. In addition, some stakeholders may disagree with the Company’s goals and initiatives and the focus of stakeholders may change and evolve over time. Stakeholders also may have very different views on where environmental, social and governance focus should be placed, including differing views of regulators in various jurisdictions in which we operate. Any failure, or perceived failure, by the Company to achieve its goals, further its initiatives, adhere to its public statements, comply with federal, state or international environmental, social and governance laws and regulations, or meet evolving and varied stakeholder expectations and standards could result in legal and regulatory proceedings against the Company and materially adversely affect the Company’s business, reputation, results of operations, financial condition and stock price.
Strategic and Competitive Risks
We participate in a highly competitive market, and pressure from existing and new competitors may materially and adversely affect our business, results of operations or financial condition.
We face significant competition to attract consumers, customers, and advertisers from companies that provide listings, information, lead generation, websites, automotive appraisals, online loan screening and approvals, marketing and car-buying services designed to reach consumers and enable dealers to reach these consumers. Our competitors offer various products and services that compete with us, including:
|
|
|
|
|
|
|
|
We also compete with many of the above-mentioned companies and other companiesour competitors for a share of a car dealer’s overall marketing budget. To the extent that car dealers view alternative marketing and media strategies to be superior, we may not be able to maintain or grow the number of dealers in our network. In addition, new competitors may enter the online automotive retail industry with competing products and services.
Our competitors could significantly impede our ability to expand our network of dealers and to reach consumers.consumer reach. Our competitors may also develop and market new technologies that render our existing or future products and services less competitive, unmarketable or obsolete. In addition, if competitors develop products or services with similar or superior functionality to our solutions, we may need to decrease prices for our solutions to remain competitive. If we are unable to maintain our current pricing structure due to competitive pressures, our revenue may be reduced, and our operating results may be negatively affected.
Some of our larger competitors may be better able to respond more quickly with new technologies and to undertake more extensive marketing or promotional campaigns. In addition, to the extent that any of our competitors have existing relationships with dealers or automobile manufacturersOEMs for marketing or data analytics solutions, those dealers and automobile manufacturers may be unwilling to partner or continue to partner with us.
In addition, if any of our competitors were to merge or partner with another of our competitors, the change in the competitive landscape could materially and adversely affect our ability to compete effectively. Our competitors may also establish or strengthen cooperative relationships with our current or future third-party data providers, technology partners, or other parties with whom we have relationships, thereby limiting our ability to develop, improve and promote our solutions. We may not be able to compete successfully against current or future competitors, and competitive pressures may materially and adversely affect our business, results of operations or financial condition.
If we fail to maintain or increase our base of subscribing dealers that purchase our solutions or to increase our revenue from subscribing dealers, our business, results of operations or financial condition may be materially and adversely affected.
Our revenue model generally employs a base package subscription fee with the opportunity for dealer customers to purchase product enhancements or short-term premium services. The higher-priced product enhancements and short-term premium services offer more features than what is included in the standard packages. Our ability to increase revenue from currently subscribing dealers depends, in part, on the ability of our sales force to demonstrate the value and benefits of the additional features of our product enhancements and short-term premium services to our subscribing dealers and to persuade them to purchase the higher-priced enhancements and services. Subscribing dealers do not have long-term obligations to purchase or renew subscriptions or product enhancements and premium services. Consequently, if subscribing dealers do not renew their subscriptions or continue to purchase product enhancements and premium services, or if we experience significant attrition of subscribing dealers or are unable to attract new dealers in numbers greater than the number of subscribing dealers that we lose, our revenue will decrease and our business, results of operations or financial condition may be materially and adversely affected.
We compete with other consumer automotive websites and mobile applications and other digital content providers for share of automotive-related digital display advertising spending and may be unable to maintain or grow our base of advertising customers or increase our revenue from existing advertisers.
In addition to revenue from marketplace subscriptions, we generate significant revenue from third-party national advertising. In 2019, 2018 and 2017, 13%, 16% and 18%, respectively, of our revenue was generated by the sale of national advertising and the sale of leads to OEMs.
Although the shift in advertising spending away from traditional advertising methods to digital advertising methods provides greater opportunity for us, competition to capture share of the total digital automotive advertising spend has increased and may continue to increase due to the attractive projected growth of digital automotive advertising spend, and low barriers to entry in the online automotive classifieds and related digital automotive advertising markets.
We may face significant challenges in convincing our advertising customers, including brandnational advertisers and OEMs, to expand their advertising on our sites and mobile applications in the face of growing competition, which could hurt our ability to grow our third-party advertising revenue. For example, there are a limited number of OEMs, most of which already advertise on our sites. To grow our advertising revenue from these OEMs, we may need to increase thecapture a greater portion of such OEMs’ digital advertising budgets that we currently receive. If the rate of renewal for our advertising customers decreases, OEMs or other national advertisers reduce their marketing spend,budgets. In addition, if we experience a significant decrease in advertising spending the number of advertising impressions on our sitesby OEMs or mobile applications declinesother national advertisers for any reason, we are unable to attract new advertisers in numbers greater than the number of advertisers we lose or we are not able to raise rates or to increase our share of advertising revenue from dealers and other advertisers, our revenue will decrease and our business, results of operations or financial condition may be materially and adversely affected.
Market acceptance11
If we do not adapt to automated buying strategies, our display advertising revenue could be adversely affected.
The majority of the display advertising purchased by our national, regional and influence over certain ofrelated advertisers (e.g., insurance advertisers and finance advertisers) is still done manually via insertion orders. However, recently advertisers have shifted away from buying media directly from premium publishers and increasingly buying their target audiences via the ad exchanges across the broader Internet. While we have grown our programmatic revenue, are developing new programmatic ad products, and services is concentrated in a limited number of automobile OEMs and dealership associations, andare redesigning our ad delivery technology stack, we may not be ableadapt quickly enough and may lose display advertising revenue as a result. Due to maintain or grow these relationships.
Although the automotive retail industry is fragmented, a relatively smallconcentrated number of OEMs, dealership associations,national advertisers, our national advertising business can be materially impacted by shifts in media strategy, marketing strategies, agency changes, and their program administrators exert significant influence overfinancial results of our clients. These changes may occur independent of the market acceptance of automotive products and services duevalue we are providing to their concentrated purchasing activity, their endorsementthose advertisers. In addition, the increasing use of ad blockers may reduce the quantity or recommendationtypes of specific productsdisplay ads and services, their provision co-operative advertising moneycookies collected to dealers, and/or their ability to define technical standards and certifications or marketing guidelines. For example, many of our website solutions are provided pursuant to OEM-designated endorsement or preferred vendor programs. While automotive dealers are generally free to purchase the solutions of their choosing, when an OEM has endorsed or certified a provider of products or services to its associated franchised dealers and if our solutions lack such certification or endorsement, adoption or retention of our products and services among the franchised dealers of such OEM could be materially impaired.serve ads.
We may face difficulties in transitioning from a marketplace platform to a full-service solutions providerdeveloping and launching new solution offerings or growing our complementary offerings that helpshelp automotive brands and dealers create enduring customer relationships.
We continue to expand, enhance and improve the nature and scope of our solution offerings to our customers and have expanded our service offerings to incorporate digital solutions that use social, mobile and web-based technologies.technologies, and to enter into complementary markets. Our ability to effectively offer a wide breadthrange of end-to-end business solutions depends on our ability to attract existing or new clients to our new service offerings. The market for end-to-end solutions is highly competitive. We cannot be certain that our new service offerings will effectively meet client needs or that we will be able to attract clients to these service offerings. The inherent difficulty of developing or implementing new service offerings and significant competition in the markets for these end-to-end services may affect our ability to market these services successfully.
Our growth strategy will also increase demands on our management, operational and financial information systems and other resources. To accommodate our growth, we will need to continue to implement operational and financial information systems and controls, and expand, train, manage and motivate our employees. Our personnel, information systems, procedures or controls may not adequately support our growth strategy or our operations in the future. Failure to recruit and retain strong management, implement operational and financial information systems and controls, or expand, train, manage or motivate our workforce, could lead to delays in developing and achieving expected operating results for these new offerings.
Strategic acquisitions, investments and partnerships could pose various risks, including integration risks, increase our leverage, dilute existing stockholders and significantly impact our ability to expand our overall profitability.
One of our key operating strategies is to pursue targeted acquisitions that enhance our platform strategy. These acquisitions involve inherent risks, such as potentially increasing leverage and debt service requirements and combining company cultures and facilities, which could have a material and adverse effect on our business, results of operations or financial condition and could strain our human capital resources. We may also be unable to successfully implement effective cost controls or achieve expected synergies as a result of an acquisition. Acquisitions may result in our assumption of unexpected liabilities, the integration of separate organizations, the unanticipated incompatibility of systems and operating methods, negative impacts on employee morale and performance as a result of job changes and reassignments, unforeseen difficulties in operating businesses we have not operated before and the diversion of management’s attention from the operation of our core business. Acquisitions may also result in greater exposure to the industry risks of the businesses underlying the acquisition and possible tax costs and inefficiencies. Strategic investments and partnerships with other companies expose us to the risk that we may not be able to control the operations of our investee or partnership, which could decrease the value of benefits we realize from a particular relationship. We are also exposed to the risk that our partners in strategic investments and infrastructure may encounter financial difficulties that could lead to disruption of investee or partnership activities, or impairment of assets acquired, which could adversely affect future reported results of operations and stockholders’ equity. Acquisitions may subject us to new or different regulations or tax consequences which could have an adverse effect on our operations.
In addition, we may not be able to successfully integrate acquired businesses, which may result in an inability to realize the anticipated benefits of our acquisitions. In November 2021, we acquired the stock of CreditIQ, Inc., a privately held, cutting edge automotive fintech platform that provides instant online loan screening and approvals to facilitate online car buying. In March 2022 we completed the acquisition of certain assets and assumed certain liabilities of Accu-Trade, Galves Market Data and MADE Logistics (collectively, “Accu-Trade”), which added real-time, VIN-specific appraisal and valuation data, instant guaranteed offer capabilities, and logistics technology to our portfolio of dealer offerings. Continued achievement of our transaction synergies and our ability to grow the Accu-Trade and CreditIQ businesses and the revenue associated with it depend on a number of factors, including, but not limited to our ability to: (1) successfully integrate Accu-Trade and CreditIQ into the CARS platform and solution offerings, (2) expanding dealer and
12
consumer adoption, (3) securing lenders who will pay for lead generation, and (4) dealers honoring pre-approved loans. If our anticipated transaction synergies do not fully materialize and/or the Accu-Trade or CreditIQ businesses fails to continue to grow at the rate we expect, our revenue and business would be harmed.
We may also be unable to obtain financing necessary to complete acquisitions on attractive terms or at all. If we raise additional funds through future issuances of equity or convertible debt securities, our existing stockholders could suffer significant dilution, and any new equity securities we issue could have rights, preferences and privileges superior to those of holders of our common stock. Future equity financings could also decrease our earnings per share and the benefits derived from such new ventures or acquisitions might not outweigh or exceed their dilutive effect. Any additional debt financing we secure could involve restrictive covenants relating to our capital raising activities and other financial and operational matters, which may make it more difficult for us to obtain additional capital or to pursue business opportunities.
Risks Related to Technology
The value of our assets or operations may be diminished if our information technology systems fail to perform adequately.
Our information technology systems are critically important to operating our business efficiently and effectively. Our brand, reputation and ability to attract consumers and advertisers depend on the reliability of our technology platforms and the ability to continuously deliver content. Interruptions in our information technology systems, whether due to system failures, computer viruses, physical or digital break-ins, capacity constraints, power outages, local or widespread Internet outages, telecommunication breakdowns or other uncontrollable events, could affect the security or availability of products on our sites or our mobile applications or prevent or inhibit the ability of consumers to access our marketplace, websites or other products. The failure of our information technology systems to perform as anticipated could disrupt our business and result in transaction errors, processing inefficiencies, decreased use of our sites or mobile applications and loss of traffic, customers and revenue. Moreover, we continually upgrade and enhance our technology. The failure to complete an upgrade or enhancement as planned, or an unexpected result of a technology upgrade, could affect the security or availability of our products and services and could lead to loss of traffic, customers and revenue.
Our business is dependent on keeping pace with advances in technology. If we are unable to keep pace with advances in technology, consumers may stop using our services and our revenue may decrease.
The Internet and electronic commerce are characterized by rapid technological change, changes in user and customer requirements and expectations, frequent new service and product introductions incorporating new technologies, including mobile applications, and the emergence of new industry standards and practices that could render our existing sites, mobile applications and technology obsolete. These market characteristics are intensified by the emerging nature of the market and the fact that many companies are expected to introduce new Internet products and services in the near future. If we are unable to adapt to changing technologies, our business, results of operations or financial condition may be materially and adversely affected.
We rely on third-party service providers for many aspects of our business, including automobile pricinginventory information and othersales of our product through social media, and interruptions in the services or data andthey provide or any failure to maintain these relationships could harm our business.
Our business relies on the collection, use and analysis of third-party data, including large amounts of inventory, vehicle and consumer information, and integrations with third-party systems, such as inventory management systems, customer relationship management systems and dealer management systems, for the benefit of our car buying consumers, dealer customers and advertisers. We use information about automobiles, inventory, ownership history and pricing from third parties, including OEMs, dealers and others, in various aspects of our business. In addition,We also partner with social media platforms, such as Facebook and Instagram, to leverage our abilityvaluable audience data to grow our user base depends, in part, on the availabilityserve native advertisements and quality of data relatingdisplay real-time inventory for both dealers and OEMs to potential users of our platform.in-market car shoppers. If the third parties on which we depend are unable or unwilling to provide data or services, restrict our use of data, experience difficulty meeting our requirements or standards, or revoke or fail to renew our licenses for such data,or partnerships, we could have difficulty operating key aspects of our business. In addition, if these third-party service providers were to cease operations, temporarily or permanently, face financial distress or other business disruption or increase their fees, or if our relationship with these providers were to deteriorate, we could suffer increased costs and delays in our ability to provide our products to consumers and dealer customers until an equivalenta comparable provider could be foundis identified or until we develop replacement technology or operations.
13
We rely on in-house content creationthird-party services to track and developmentcalculate certain of our key metrics, including unique visitors and traffic and any errors or interruptions in the services or data they provide or any failure to drive traffic tomaintain these relationships could harm our business.
Certain of our key metrics, such as the CARS sites and mobile applications.
We rely on our in-house editorial content team to continually develop content of use and interest to consumers in order to drive traffic to the CARS sites and mobile applications. Our editorial content team tests, reviews and photographs a large number of different car makesour unique visitors and models every yearour traffic, are measured with third-party tools. While these numbers are based on what we believe to facilitatebe reasonable calculations for the applicable periods of measurement, measurement methodologies exhibit a level of accuracy risk because of a variety of factors. For example, we have discovered that portions of our creation of independent and unbiased coverage of the automotive landscape. Our internally developed content focuses primarily on consumer purchasing and ownership advice and analysis of consumer automotive purchasing and ownership trends. If we are unabletraffic have been attributable to non-human traffic. Because this non-human traffic generally exhibits detectable anomalous patterns, our reported traffic metrics for impacted periods reflects an adjustment to remove non-human traffic. We expect to continue to developmake similar adjustments in the future if we determine that our in-house content,traffic metrics are materially impacted by invalid traffic.
There are also inherent challenges in measuring usage across our large user base. For example, because these metrics are based on users with unique cookies, an individual who accesses our website from multiple devices with different cookies may be counted as multiple unique visitors, and multiple individuals who access our website from a shared device with a single cookie may be counted as a single unique visitor. In addition, although we use technology designed to block low quality traffic, we may not be requiredable to rely more
heavily on third-party content providers,prevent all such traffic, and such technology may have the effect of blocking some valid traffic. Further, users may have the ability to change privacy settings and opt-out of certain features, which would lead to less distinctive content oncould reduce the quality of data we receive. For these and other reasons, our sitestraffic and increased operating costs. Additionally, if we are unable to continue providing the same level of high-quality, unique consumer content, consumer traffic across the CARS sites and mobile applications could decrease. Such a decrease may lead to dealers receiving fewer indications of consumer interest through leads generated by the CARS sites and mobile applications, and recognizing less value for their digital advertising spend. As a result, dealersvisitor metrics may not continueaccurately reflect the number of people actually using our platform.
Our measures of traffic and other key metrics may differ from estimates published by third parties (other than those whose data we use to listcalculate our key metrics) or from similar metrics of our competitors. We continually seek to improve our ability to measure these key metrics, and regularly review our processes to assess potential improvements to their vehicles onaccuracy. However, the CARS sitesimprovement of our tools and mobile applications. Similarly, decreased traffic due to a failure to continue developing unique content in-house maymethodologies could cause national advertisers suchinconsistency between current data and previously reported data.
Additionally, as OEMs to shift their digital advertising spend to sites with higher traffic. Any ofboth the foregoing could materially and adversely affect our business, results of operations or financial condition.
We relyindustry in part on Internet search engines and mobile application download stores to drive traffic to the CARS sites and mobile applications. If the CARS sites and mobile applications fail to appear prominently in these search results, traffic to the CARS sites and mobile applications would declinewhich we operate and our business resultscontinue to evolve, so too might the metrics by which we evaluate our business. We may revise or cease reporting metrics if we determine such metrics are no longer accurate or appropriate measures of operationsour performance. If our audience, customers and stockholders do not perceive our metrics to be accurate representations, or financial conditionif we discover material inaccuracies in our metrics, our reputation may be materiallyharmed.
Risks Related to Data Privacy and adversely affected.Security
We depend, in part, on Internet search engines such as Google to drive traffic to the CARS sites. For example, when a user types the make and model of a specific automobile or a generic phrase, such as “automobile prices,” into an Internet search engine, we rely on a high organic search ranking of the CARS sites in these search results to drive user traffic. However, our ability to maintain these high search result rankings is not fully within our control. For example, our competitors’ search engine optimization efforts may result in their websites receiving a higher search result page ranking than us, or Internet search engines could revise their methodologies in a way that would adversely affect our search result rankings. In addition, Internet search engines could provide automobile dealer and pricing information directly in search results or choose to align with our competitors or develop competing services. The CARS sites have experienced fluctuations in search result rankings in the past, and it is anticipated that similar fluctuations will occur in the future.
Additionally, we depend in part on mobile application download stores such as the Apple App Store and Google Play to direct traffic towards CARS’ mobile applications. When a mobile device user searches in a mobile application download store for “car buying app” or a similar phrase, we rely on both a high search ranking and consumer brand awareness to drive consumers to select and download CARS mobile applications instead of those of our competitors. However, our ability to maintain high, nonpaid search result rankings in mobile application download stores is not fully within our control. Our competitors’ mobile application download store search optimization efforts may result in their mobile applications receiving a higher result ranking than that of Cars.com, or mobile application download stores could revise their methodologies in a way that would adversely affect our search result rankings.
If Internet search engines or mobile application download stores modify their search algorithms in ways that negatively impact traffic to the CARS sites or CARS mobile apps, or if the search engine or mobile application download store optimization efforts of our competitors are more successful than our own efforts, overall growth in our user base could slow or the user base could decline.
The value of our assets or operations may be diminished if our information technology systems fail to perform adequately.
Our information technology systems are critically important to operating our business efficiently and effectively. Our brand, reputation and ability to attract consumers and advertisers depend on the reliability of our technology platforms and the ability to continuously deliver content. Interruptions in our information technology systems, whether due to system failures, computer viruses, physical or electronic break-ins, capacity constraints, power outages, local or widespread Internet outages, telecommunications breakdowns or other uncontrollable events, could affect the security or availability of products on our sites or our mobile applications or prevent or inhibit the ability of consumers to access our products. The failure of our information technology systems to perform as anticipated could disrupt our business and result in transaction errors, processing inefficiencies, decreased use of our sites or mobile applications and loss of sales and customers. Moreover, we continually upgrade and enhance our technology. The failure to complete an upgrade or enhancement as planned, or an unexpected result of a technology upgrade, could affect the security or availability of our products and services and could lead to loss of consumer visits and customers.
We rely on technology systems’ availability and ability to prevent unauthorized access. If our security and resiliency measures fail to prevent incidents, it could result in damage to our reputation, incur costs and create liabilities.
Like other technology-based businesses, our solutions may be subject to attacks from computer viruses, break-ins, phishing attacks, ransomware attacks, unauthorized use, attempts to overload services with denial-of-service and other attacks. Any attack or disruption could negatively impact our ability to attract new consumers, dealers or advertisers and could deter current consumers, dealers or advertisers from using our solutions, or subject us to lawsuits, regulatory fines or other action or liability.
| • Availability: We rely on technology systems’ availability to deliver services to consumers, dealers, OEMs, employees and partners. If we experience a disruption that results in performance or availability degradation, up to and including the complete shutdown of our sites or mobile applications, revenue could be impacted and consumers, dealers or advertisers may lose trust and confidence in us, decrease their use of our solutions or stop using our solutions entirely. • Data Protection (Consumers/Dealers/OEMs): We collect, process, store, share, disclose and use limited personal information and other data provided by consumers, dealers and OEMs, and sometimes that data includes names, addresses and certain location information used in geo-fencing. Failure to protect customer data or to provide customers with appropriate notice of our privacy practices, could subject us to liabilities imposed by U.S. federal and state regulatory agencies or courts. In addition, we could be subject to evolving laws and regulatory standards that impose data use obligations, data breach notification requirements, specific data security obligations, restrictions on solicitation or other consumer privacy-related requirements. • Data Protection (Internal): We develop, create and acquire internal information that may be considered sensitive or valuable intellectual property in the normal operations of human resources, finance, legal, marketing, software development, product management, mergers and acquisitions and other business functions. Failure to protect sensitive internal information or intellectual property may result in loss of competitive advantage, reputation damage, direct and indirect costs and other liabilities. Failure to protect material financial information including financial performance and merger and acquisition data could also subject us to liabilities imposed by U.S. federal and state regulatory agencies or courts. 14
|
|
|
|
|
|
|
We rely on, among other security measures, firewalls, anti-malware, intrusion prevention systems, distributed denial-of-service mitigation services, web content filtering, encryption and authentication technology licensed from third parties. We also depend on the security of our networks and partially on the security of our third-party service providers.
Although we believe that our resiliency planning and security controls are appropriate to our exposures to system outages, service interruptions, security incidents and breaches, there is no guarantee that these plans and controls will prevent all such incidents. Techniques used to disable or degrade service or gain unauthorized access to systems or data change frequently and may not be recognized until damage is detected. We maintain cyber risk insurance, but this insurance may not be sufficient to cover all losses from any future disruption, security incident or breach.
Our businessability to attract and retain customers depends on strong brand recognition, and any failure to maintain, protect and enhance our brands could hurt our ability to retaincollect and use data and develop tools to enable us to effectively deliver and accurately measure advertisements on our platform.
Most customers rely on tools that measure the effectiveness of their ad campaigns in order to allocate their advertising spend among various formats and platforms. If we are unable to measure the effectiveness of advertising on our platform or expandare unable to convince customers that our baseplatform should be part of consumers, customers and advertisers, anda larger advertising budget, our ability to increase the frequencydemand and pricing of our advertising products and maintain or scale our revenue may be limited. Our tools may be less developed than those of other platforms with which consumers, dealerswe compete for advertising spend. Therefore, our ability to develop and advertisers useoffer tools that accurately measure the effectiveness of a campaign on our services.
We believe that maintaining and increasing the strong recognition of the CARS brandsplatform is critical to the Company’s future success. We are known for attracting a large base of in-market car shoppers by offering credible and easy-to-understand information from consumers and experts and an unrivaled set of new and used vehicle listings for consumers to view. In addition, OEMs, dealers and other advertisers rely on our innovative digital marketing services to drive results in their businesses. To grow our business, we must maintain, protect and enhance our brands. Otherwise, we may be unable to expand our base of consumers, customers and advertisers, or to increase the frequency with which such constituents use or purchase our services. Expanding the business will depend, in part, on our ability to maintain the trust that consumers,attract new customers and advertisers place inretain and increase spend from our servicesexisting customers.
We are continually developing and the qualityimproving these tools and integrity of the listingssuch efforts have required and other content found on the CARS sites and mobile applications. In addition, any negative publicity about us, including about our solutions, technologies, sales practices, personnel or customer service, could diminish confidence in and the use of our services. If we experience persistent negative publicity, or if consumers otherwise perceive that content on the CARS sites or mobile applications is not reliable, our reputation, the value of our brands and traffic to our sites and mobile applications could decline.
We cannot assure you that we will be ableare likely to continue to successfully develop and launch new products or grow our complementary product offerings.
Our future success will depend, in part, upon our ability to continue to enhance and improve the value of our products and services through the development of new products and services and new value-added features for existing products and services, as well as our ability to leverage our brand recognition and existing operations to enter into new complementary markets successfully. Historically, we have been successful in increasing revenue through the launch of new products, services and value-added features and in entering complementary markets through the launch of new products and services. However, such historical success does not assure that we will continue to be successful in developing or introducing new products, services and value-added features, or that these new products, services and features will achieve market acceptance, enhance the value of our brand or permit us to enter new, complementary markets successfully. Further, the development of new products and services in response to evolving customer demands and competitive pressures requiresrequire significant time and resources and there can be no assurance thatadditional investment, and in some cases we have relied on and may in the future rely on third parties to provide data and technology needed to provide certain measurement data to our development efforts will be effective in permitting uscustomers. If we cannot continue to maintain or growdevelop and improve our market share or to enter new marketsadvertising tools in a cost-effective manner,timely fashion, those tools are unreliable, or at all.
Our business is dependent on keeping pacethe measurement results are inconsistent with advances in technology. If we are unable to keep pace with advances in technology, consumers may stop usingadvertiser goals, our services and our revenue may decrease.
The Internet and electronic commerce markets are characterized by rapid technological change, changes in user and customer requirements and expectations, frequent new service and product introductions embodying new technologies, including mobile
applications, and the emergence of new industry standards and practices that could render our existing sites, mobile applications and technology obsolete. These market characteristics are intensified by the emerging nature of the market and the fact that many companies are expected to introduce new Internet products and services in the near future. If we are unable to adapt to changing technologies, our business, results of operations or financial condition may be materially and adversely affected.
If we do not adapt to automated buying strategies quickly, our display advertising revenue could be adversely affected.
The majority
In addition, web and mobile browser developers, such as Apple, Microsoft or Google, have implemented and may continue to implement changes that include requiring additional user permissions in their browser or device operating system that impair our ability to measure and improve the effectiveness of advertising on our platform. Such changes include, limiting the use of first-party and third-party cookies and related tracking technologies, such as mobile advertising identifiers, and other changes that limit our ability to collect information which allows us to attribute user actions on customers’ websites to the effectiveness of advertising campaigns that are run on our platform or may limit our ability to communicate with or understand the identity of our consumers. For example, Apple launched its Intelligent Tracking Prevention (“ITP”) feature in its Safari browser. ITP blocks some or all third-party cookies by default on mobile and desktop devices and ITP has become increasingly restrictive over time. Apple's related Privacy-Preserving Ad Click attribution (PPAC), intended to preserve some of the displayfunctionality lost with ITP, would limit cross-site and cross-device attribution, prevent measurement outside a narrowly-defined attribution window, and prevent ad re-targeting and optimization. Similarly, in January 2020, Google announced plans to phase out third-party cookies on Chrome, the most-used desktop browser, in 2022. In July 2022, Google announced that these plans would be delayed until 2024 as Google continues to work to identify new technologies to replace third-party cookies. Other web browsers have begun implementing certain cookie-blocking measures. Further, in April 2021, Apple released a new iOS functionality called App Tracking Transparency that limits the ability of mobile applications to request an iOS device’s advertising purchased byidentifier and may also affect our national, regionalability to track user actions off our platform and near endemic advertisers (e.g. insurance advertisers, finance advertisers)connect their interactions with on-platform advertising. The shift to a “cookieless” future is still done manually, via insertion orders. Recently however, advertiserschanging how we market and engage with our consumers and future changes and restrictions in browser or device functionality that limit the use of all kinds have been shifting from buying media directlycookies, or that limit our ability to communicate with premium publishers likeor understand the identity of our consumers.
These restrictions make it more difficult for us to buying their target audiences viaprovide the ad exchanges acrossmost relevant ads to our consumers, measure the broader Internet. While we have growneffectiveness of and re-target and optimize advertising on our programmatic revenue and are developing new, programmatic ad products and are redesigningplatform. Developers may release additional technology that further inhibits our ad delivery technology stack, we may not adapt fast enough and may lose displayability to collect data that allows us to measure the effectiveness of advertising revenue as a result. Due to the concentrated number of national advertisers,on our National advertising business can be materially impactedplatform. Any other restriction, whether by shifts in media strategy, marketing strategies, agency changes, and financial results of our clients. These changes may occur independent of the products and value we are providing to those advertisers. In addition, the increasing use of ad blockers may reduce the quantitylaw, regulation, policy (including third-party policies) or types of display ads and cookies collected to serve ads.
If our mobile applications do not continue to meet consumer demands or we are unable to successfully monetize our mobile advertising solutions, our business, results of operations or financial condition may be materially and adversely affected.
Our future success will depend, in part,otherwise, on our ability to keep pacecollect and share data which our customers find useful, our ability to use or benefit from tracking and measurement technologies, including cookies, or that further reduce our ability to measure the effectiveness of advertising on our platform would impede our ability to attract, grow and retain customers. Customers and other third parties who provide data that helps us deliver personalized, relevant advertising may restrict or stop sharing this data. If they stop sharing this data with consumer technology trends and to ensure we grow our share of the mobile application market so that total advertising impressions across our sites and mobile applications continue to increase. Among other things, weus, it may not be ablepossible for us to successfully introduce new products and servicescollect this data within the product or from another source.
We rely heavily on our mobile application platforms, consumersability to collect and dealers may believe thatshare data and metrics for our customers to help new and existing customers understand the mobile applications and product featuresperformance of advertising campaigns. If customers do not perceive our metrics to be accurate representations of our competitors are superior,user base and user engagement or if we discover inaccuracies in our mobile applications could become incompatible with future operating systems for mobile devicesmetrics, they may be less willing to allocate their budgets or new mobile device technology. Additionally, in the event that consumer trends lead to market demand for separate digital advertising pricing models for sites and mobile applications, the monetization of mobile advertising could present challengesresources to our business due to, among other things, lower rates, decreased consumer attention and display advertising design constraints on mobile applications. If use of our mobile applications stagnates or declines, we are not able to successfully monetize mobile application advertising or we cannot adapt our products and services to another form of data viewing, whether on new mobile devices or otherwise, in a timely and cost-effective manner or at all,platform, which could harm our business, results of operations or financial condition could be materially and adversely affected. In addition, our growth prospects could be materially and adversely affected.
Dealer closures or consolidation among dealers or OEMs could reduce demand for, and the pricing of, our marketing and solutions offerings, thereby leading to decreased earnings.
When dealers consolidate, the services they previously purchased separately are often purchased by the combined entity in a lesser quantity than before, leading to volume compression and loss of revenue across the automotive marketplace sector. In the past, dealers have been more likely to close or consolidate when general economic conditions and/or conditions in the automotive industry are poor. Despite our market position, consolidation or closures of automobile dealers could reduce the aggregate demand for our services in the future and limit the amounts we earn for our solutions. In addition, advertising purchased by OEMs accounts for a meaningful portion of our revenue. There are a limited number of OEMs, and financial difficulties or consolidation among OEMs could similarly lead to volume compression and loss of revenue.results.
If growth in the online and mobile automotive advertising market stagnates or declines, our business, results of operations or financial condition could be materially and adversely affected.
We believe that future growth in the online and mobile automotive advertising market will be driven, in part, by dealers and brand advertisers increasingly shifting their advertising spending away from traditional media such as newspapers, radio and television, and toward online and mobile advertising. To the extent that overall automotive related advertising does not continue to shift online or to mobile applications, our business, results of operations or financial condition could be materially and adversely affected.15
Uncertainty exists in the application and interpretation of various laws and regulations related to our business, including privacy laws such as the California Consumer Privacy Act and new tax laws and interpretations.laws. New privacy concerns or laws or regulations applicable to our business, or the expansion or interpretation of existing laws and regulations tothat apply to our business, could reduce the effectiveness of our offerings or subject us to use restrictions, licensing requirements, claims, judgments and remedies including sales and use taxes, other monetary liabilities and limitations on our business practices, and could increase administrative costs.
We operate in a regulatory climate in which there is uncertainty as to the applicability of various laws and regulations related to our business. Our business could be significantly affected by different interpretations or applications of existing laws or regulations, future laws or
regulations, including changes to the corporate tax rate or actions or rulings by judicial or regulatory authorities. For example, the Inflation Reduction Act of 2022 (the “IRA”) introduced a 15% alternative minimum tax on the “adjusted financial statement income” of certain large corporations and a 1% excise tax on certain actual and deemed stock repurchases, both of which become effective in 2023. We do not expect to be an applicable corporation that is subject to the alternative minimum tax, however we expect to be a covered corporation that could be subject to the 1% excise tax.
Our operations may be subjectedsubject to adoption, expansion or interpretation of various laws and regulations, and compliance with these laws and regulations may require us to obtain licenses at an undeterminable and possibly significant initial and annual expense. Similarly, state tax authorities could take aggressive positions as to whether certain of our products are subject to sales and use taxes, leading to increased tax exposure. These additional expenditures may materially and adversely affect our future results of operations, whether directly through increasing future overhead or indirectly by forcing us to pass on these additional costs to our customers, making our solutions less competitive. There can be no assurances that future laws or regulations or interpretations or expansions of existing laws or regulations will not impose requirements on Internet commerce that could substantially impair the growth of e-commerce and adversely affect our business, results of operations or financial condition. The adoption of additional laws or regulations may decrease the popularity or impede the expansionefficacy of e-commerce and Internet marketing,our offerings, restrict our present business practices, require us to implement costly compliance procedures or expose us and/or our customers to potential liability.
We may be considered to “operate” or “do business” in states where our customers conduct their businesses, resulting in possible regulatory action. If any state licensing laws were determined to be applicable to us and if we are required to be licensed and are unable to do so or are otherwise unable to comply with laws or regulations, we could be subject to fines or other penalties or be compelled to discontinue operations in those states. If any state’s regulatory requirements impose state-specific requirements on us or include us within an industry-specific regulatory scheme, we may be required to modify our marketing programs in that state in a manner that may undermine such program’s attractiveness to consumers, customers or advertisers. Alternatively, if we determine that the licensing and related requirements are overly burdensome, we may elect to terminate operations in that state.
All states comprehensively regulate vehicle sales and lease transactions includingand include strict licensure requirements for dealers (and, in some states, brokers) and vehicle advertising. We believe that most of these laws and regulations specifically apply only to traditional vehicle purchase and lease transactions, not Internet-based lead referral programs like ours. If we determine that the licensing or other regulatory requirements in a given state are applicable to us or to a particular marketing services program, we may elect to obtain the required licenses and comply with applicable regulatory requirements. However, if licensing or other regulatory requirements are overly burdensome, we may elect to terminate operations or particular marketing services programs in that state or elect to not introduce particular marketing services programs in that state. As we introduce new services, we may need to incur additional costs associated with additional licensing regulations and regulatory requirements.
Strategic acquisitions, investments and partnerships could pose various risks, increase our leverage, dilute existing stockholders and significantly impact our ability to expand our overall profitability.
Acquisitions involve inherent risks, such as potentially increasing leverage and debt service requirements and combining company cultures and facilities, which could have a material and adverse effect on our business, results of operations or financial condition and could strain our human resources. We may be unable to successfully implement effective cost controls or achieve expected synergies as a result of an acquisition. Acquisitions may result in our assumption of unexpected liabilities and the diversion of management’s attention from the operation of our core business. Acquisitions may also result in our having greater exposure to the industry risks of the businesses underlying the acquisition. Strategic investments and partnerships with other companies expose us to the risk that we may not be able to control the operations of our investee or partnership, which could decrease the amount of benefits we realize from a particular relationship. We are also exposed to the risk that our partners in strategic investments and infrastructure may encounter financial difficulties that could lead to disruption of investee or partnership activities, or impairment of assets acquired, which could adversely affect future reported results of operations and stockholders’ equity. Acquisitions may subject us to new or different regulations or tax consequences which could have an adverse effect on our operations.
In addition, we may be unable to obtain the financing necessary to complete acquisitions on attractive terms or at all. If we raise additional funds through future issuances of equity or convertible debt securities, our existing stockholders could suffer significant dilution, and any new equity securities we issue could have rights, preferences and privileges superior to those of holders of our common stock. Future equity financings would also decrease our earnings per share and the benefits derived from such new ventures or acquisitions might not outweigh or exceed their dilutive effect. Any additional debt financing we secure could involve restrictive covenants relating to our capital raising activities and other financial and operational matters, which may make it more difficult for us to obtain additional capital or to pursue business opportunities.
The value of our existing goodwill and intangible assets may become impaired, depending upon future operating results.
Our goodwill and other intangible assets were approximately $1.8 billion as of December 31, 2019, representing approximately 91% of our total assets. We evaluate our goodwill and other intangible assets to determine whether all or a portion of their carrying values may no longer be recoverable, in which case a charge to earnings may be necessary. Any future evaluations requiring an asset impairment charge for goodwill or other intangible assets would adversely affect future reported results of operations and stockholders’ equity, although such charges would not affect our cash flow.
Adverse results from litigation or governmental investigations could impact our business practices and operating results.
We face potential liability and expense for legal claims relating to the information that we publish on our sites and mobile applications, including claims for defamation, libel, negligence and copyright or trademark infringement, among others. We may be subject to claims based on our advertising of our business. Although we have not historically been the subject of any such claims that were material, any such claims that we face in the future could divert management time and attention away from our business and result in significant costs to investigate and defend, regardless of the merits of the claims. In some instances, we may elect or be compelled to remove content or may be forced to pay substantial damages if we are unsuccessful in our efforts to defend against these claims. If we elect or are compelled to remove valuable content from our sites or mobile applications, our platforms may become less useful to consumers and our traffic may decline.
Misappropriation or infringement of our intellectual property and proprietary rights, enforcement actions to protect our intellectual property and claims from third parties relating to intellectual property could materially and adversely affect our business, results of operations or financial condition.
Litigation regarding intellectual property rights is common in the Internet and technology industries. We expect that Internet technologies and software products and services may be increasingly subject to third-party infringement claims as the number of competitors in our industry segment grows and the functionality of products in different industry segments overlaps. Our ability to compete depends upon our proprietary systems and technology. While we rely on intellectual property laws, confidentiality agreements and technical measures to protect our proprietary rights, we believe that the technical and creative skills of our personnel, continued development of our proprietary systems and technology, brand name recognition and reliable website maintenance are essential in establishing and maintaining a leadership position and strengthening our brands. Despite our efforts to protect our proprietary rights, unauthorized parties may attempt to copy aspects of our services or to obtain and use information that we regard as proprietary. Policing unauthorized use of our proprietary rights is difficult and may be expensive. We can provide no assurance that the steps we take will prevent misappropriation of technology or that the agreements entered into for that purpose will be enforceable. Effective trademark, service mark, patent, copyright and trade secret protection may not be available when our products and services are made available online. In addition, if litigation becomes necessary to enforce or protect our intellectual property rights or to defend against claims of
16
infringement or invalidity, such litigation, even if successful, could result in substantial costs and diversion of resources and management attention. We also cannot provide any assurance that our products and services do not infringe on the intellectual property rights of third parties. Claims of infringement, even if unsuccessful, could result in substantial costs and diversion of resources and management attention. If unsuccessful, we may be subject to preliminary and permanent injunctive relief and monetary damages, which may be trebled in the case of willful infringements.
If we expand into new geographic markets, we may be prevented from using our brands in such markets.
If we expand our business into foreign geographic markets, we may not have the ability to adopt trademarks or domain names that are identical or similar to the trademarks and domain names that we use in the United States and Canada. We may face opposition from third parties over the use of our trademarks and applications to register key trademarks in foreign jurisdictions in which we may expand our presence. Third parties may have already adopted identical or similar trademarks to the ones that we use for our services. If we are unsuccessful in defending against these oppositions, our trademark applications may be denied. We could be forced to pay significant settlement costs or cease the use of our trademarks and associated elements of our brands in those or other jurisdictions. Consequently, international expansion may require us to adopt and promote new trademarks, which may be expensive and place us at a competitive disadvantage.General Risks
Our ability to operate effectively could be impaired if we fail to attract and retain our key employees.
Our success depends, in part, upon the continuing contributions of our executive officers, particularly our Chief Executive Officer, and other key employees and our continuing ability to attract, develop, motivate and retain highly qualified and skilled personnel.personnel, such as individuals with technical skills in a rapidly changing technological environment. Additionally, as the workforce landscape changes due to the shift to remote and virtual work, we must compete to attract and retain employees. We do not have employment agreements with any of our executive officers or other operational personnel, and, therefore, they could terminate their employment with us at any time. We do not maintain key person life insurance policies on any of our employees. The loss of the services of any of our key employees or the failure to attract or replace qualified personnel may have a material and adverse effect on our business.
Seasonality
Adverse results from litigation or governmental investigations could impact our business practices and operating results.
We face potential liability and expense for legal claims relating to the information that we publish on our sites and mobile applications, including claims for defamation, libel, negligence and copyright or trademark infringement, among others. We may cause fluctuationsbe subject to claims based on the advertising of our business. Although we have not historically been the subject of any such claims that were material, any such claims that we face in the future could divert management time and attention away from our business and result in significant costs to investigate and defend, regardless of the merits of the claims. In some instances, we may elect or be compelled to remove content or may be forced to pay substantial damages if we are unsuccessful in our revenueefforts to defend against these claims. If we elect or are compelled to remove valuable content from our sites or mobile applications, our platforms may become less useful to consumers and operating results.our traffic may decline.
Our revenue trends are a reflection
The value of our dealer base throughoutexisting goodwill and intangible assets may become impaired depending upon future operating results.
Our goodwill and other intangible assets were approximately $809.9 million as of December 31, 2022, representing approximately 79% of our total assets. We evaluate our goodwill and other intangible assets to determine whether all or a portion of their carrying values may no longer be recoverable, in which case a charge to earnings may be necessary. Any future evaluations requiring an asset impairment charge for goodwill or other intangible assets would adversely affect future reported results of operations and stockholders’ equity, although such charges would not affect our cash flow.
Risks Relating to our Common Stock
We cannot assure our stockholders that our share repurchase program will enhance long-term stockholder value and stock repurchases, if any, could increase the yearvolatility of the price of our common stock and will diminish our cash reserves.
In February 2022, our Board of Directors authorized a share repurchase program to acquire up to $200 million of our common stock over a three-year period. Under the share repurchase program, the Company can repurchase shares from time to time in open market transactions or through privately negotiated transactions in accordance with applicable federal securities laws and regulations. The timing and amounts of any purchases under the share repurchase program is dependent upon a variety of factors, including market conditions, price, regulatory requirements and other corporate considerations, as new customers purchase subscription advertising packagesdetermined by the Company’s Board of Directors and existing customers purchasemanagement. The share repurchase program may be extended, suspended or cancel product enhancements. Our display advertisingdiscontinued at any time.
Any purchases under the share repurchase program could affect our stock price and increase its volatility. The existence of a share repurchase program could also cause our stock price to be higher than it would be in the absence of such a program and could potentially reduce the market liquidity for our stock. Additionally, repurchases under our share repurchase program will diminish our cash reserves, which could strain our liquidity, could impact our ability to pursue possible future strategic opportunities and acquisitions and could result in lower overall returns on our cash balances. There can be no assurance that any further stock repurchases will enhance stockholder value because the market price of our common stock may decline below the levels at which we repurchased shares of stock.
17
Although our share repurchase program is intended to enhance long-term stockholder value, short-term stock price fluctuations could reduce the program’s effectiveness.
We do not expect to pay any cash dividends for the foreseeable future.
We intend to retain future earnings to finance and grow our business targetedor fund share repurchases. As a result, we do not expect to OEMs, experiences some seasonalitypay any cash dividends for the foreseeable future. All decisions regarding the payment of dividends will be made by our Board of Directors from time to time in accordance with applicable law. There can be no assurance that we will have sufficient surplus under Delaware law to be able to pay any dividends at any time in the future.
Your percentage of ownership in the Company may be diluted in the future.
In the future, your percentage ownership in the Company may be diluted because of equity awards that we will be granting to our directors, officers and employees or otherwise as a result of consumers’ car buying patternsequity issuances for acquisitions or capital market transactions. Such awards will have a dilutive effect on our earnings per share, which could adversely affect the market price of our common stock.
In addition, our Amended and Restated Certificate of Incorporation authorizes us to issue, without the introductionapproval of new vehicle modelsour stockholders, one or more classes or series of preferred stock that have such designation, powers, preferences and other relative, participating, optional and special rights, including preferences over our common stock with respect to dividends and distributions, as our Board of Directors generally may determine. The terms of one or more classes or series of preferred stock could dilute the voting power or reduce the value of our common stock. Similarly, the repurchase or redemption rights or liquidation preferences we could assign to holders of preferred stock could affect the residual value of the common stock.
Certain provisions of our Amended and Restated Certificate of Incorporation, By-laws, and Delaware law may discourage takeovers and limit our ability to use, acquire, or develop certain competing businesses.
Our Amended and Restated Certificate of Incorporation and Amended and Restated By-laws contain certain provisions that may discourage, delay or prevent a change in our management or control over the Company. For example, our Amended and Restated Certificate of Incorporation and Amended and Restated By-laws, collectively:
These provisions could discourage potential acquisition proposals and could delay or prevent a change in control, even though a majority of stockholders may consider such proposal, if effected, desirable. Such provisions could also make it more difficult for third parties to remove and replace the members of our Board of Directors. Moreover, these provisions may inhibit increases in the first quartertrading price of our common stock that may result from takeover attempts or speculation.
Our Amended and Restated Certificate of Incorporation designates the state courts of the calendar year,State of Delaware, or, if no state court located in the State of Delaware has jurisdiction, the federal court for the District of Delaware, as the sole and we expect this trend to continue. In addition to these seasonal effects, our revenueexclusive forum for certain types of actions and operationsproceedings that may be affectedinitiated by macroeconomic conditionsour stockholders, which could discourage lawsuits against us and our directors and officers.
Our Amended and Restated Certificate of Incorporation provides that, unless our Board of Directors otherwise determines, the state courts of the State of Delaware, or, if no state court located in the automotive sector.State of Delaware has jurisdiction, the federal court for the District of Delaware, will be the sole and exclusive forum for any derivative action or proceeding brought on our behalf; any action asserting a claim for or based on a breach of a fiduciary duty owed by any of our current or former directors or officers to us or to our stockholders, including a claim alleging the aiding and abetting of such a breach of fiduciary duty; any action asserting a claim against us or any of our current or former directors or officers arising pursuant to any provision of the Delaware General Corporation Law (the “DGCL”) or
18
our Amended and Restated Certificate of Incorporation or Bylaws; any action asserting a claim relating to or involving us that is governed by the internal affairs doctrine; or any action asserting an “internal corporate claim” as such term is defined in the DGCL. This exclusive forum provision may limit the ability of our stockholders to bring a claim in a judicial forum that such stockholders find favorable for disputes with the Company or our current or former directors or officers, which may discourage such lawsuits. Alternatively, if a court outside of Delaware were to find this exclusive forum provision inapplicable to, or unenforceable in respect of, one or more of the specified types of actions or proceedings described above, we may incur additional costs associated with resolving such matters in other jurisdictions.
Our business could be negatively affected as a result of actions of activist stockholders, and such activism could impact the trading value of our common stock.
Stockholders may from time to time attempt to effectaffect changes, engage in proxy solicitations or advance stockholder proposals. Activist stockholders may make strategic proposals related to our business, strategy, management or operations or may request changes to the composition of our Board of Directors. We cannot predict, and no assurances can be given as to, the outcome or timing of any such matters. In the event of a proxy contest, our business could be adversely affected. Responding to a proxy contest can be costly, time-consuming and disruptive, and can divert the attention of our management and employees from the operation of our business and execution of our strategic plan. Additionally, if individuals are elected to our Board of Directors with a specific agenda, it may adversely affect our ability to effectively implement our strategic plan and create additional value for our stockholders. Further, perceived uncertainties as to our future direction, including uncertainties related to the composition of our Board of Directors, may lead to the perception of instability or a change in the direction of our business, which may be exploited by our competitors, cause concern to current or potential customers, result in the loss of potential business opportunities, make it more difficult to attract and retain qualified personnel and/or affect our relationships with vendors, customers and other third parties. Moreover, a proxy contest could cause significant fluctuations in the price of our common stock based on temporary or speculative market perceptions or other factors that do not necessarily reflect the underlying fundamentals and prospects of our business.
Risks Relating to our Debt Agreements
Our debt agreements contain restrictions that may limit our flexibility in operating our business.
Our debt agreements contain various covenants that limit our flexibility in operating our businesses, including our ability to engage in specifiedrestrictions on certain types of transactions and requiresa requirement that a portion of our cash flow from operations be used to service this debt, which reduces cash flow available for other corporate purposes, including capital expenditures and acquisitions. Subject to certain exceptions, these covenants restrict our ability and the ability of our subsidiaries to, among other things:
| • permit liens on current or future assets, • enter into certain corporate transactions, • incur additional indebtedness, • make certain payments or distributions, • dispose of certain property, • prepay or amend the terms of other indebtedness, and • enter into transactions with affiliates.
|
|
|
|
|
|
|
|
|
|
|
|
|
|
Increases in interest rates could increase interest payable under our variable rate indebtedness.
53.7%
Approximately 16.9% of our outstanding indebtedness as of December 31, 20192022 includes variable rate indebtedness under our financing arrangements. As a result of this indebtedness, we are subject to interest rate risk. Our interest rates are based on a floating rate index, and changes in interest rates could increase the amount of our interest payments and thus negatively impact our future earnings and cash flows. Although we have entered into interest rate swap agreements on our term loan facility to reduce interest rate volatility, weWe cannot assure you we will be able to enter into interest rate swap agreements in the future on acceptable terms or that such swaps or the swaps we have in place now will be effective. If we do not have sufficient cash flow to make interest payments, we may be required to refinance all or part of our outstanding debt, sell assets, borrow additional money or sell securities, none of which we can guarantee we would be able to complete on acceptable terms or at all.
Uncertainty relating to the LIBOR calculation process and potential phasing out of LIBOR after 2021 may adversely affect the market value of our current or future debt obligations, including our long-term debt instruments and our bank credit facilities.
Regulators and law enforcement agencies in the United Kingdom and elsewhere are conducting civil and criminal investigations into whether the banks that contributed to the British Bankers’ Association (the “BBA”) in connection with the calculation of daily LIBOR may have been under-reporting or otherwise manipulating or attempting to manipulate LIBOR. A number of BBA member banks have entered into settlements with their regulators and law enforcement agencies with respect to this alleged manipulation of LIBOR. Actions by the BBA or any other administrator of LIBOR, regulators or law enforcement agencies may result in changes to the manner in which LIBOR is determined, the phasing out of LIBOR or the establishment of alternative reference rates. For example, on July 27, 2017, the U.K. Financial Conduct Authority announced that it intends to stop persuading or compelling banks to submit LIBOR rates after 2021. As a result, LIBOR may be discontinued by 2021. As a response to the phase out of LIBOR, the Federal Reserve Board and the Federal Reserve Bank of New York organized the Alternative Reference Rates Committee (“ARRC”), which identified the Secured Overnight Financing Rate (“SOFR”) as its preferred alternative to U.S. dollar-LIBOR in derivatives and other financial contracts. The Company is not able to predict when LIBOR will cease to be available or when there will be sufficient liquidity in the SOFR markets. At this time, it is not possible to predict whether any such changes will occur, whether LIBOR will be
phased out or when there will be sufficient liquidity in the SOFR markets or the effect that any such changes, phase out, alternative reference rates or other reforms, if they occur, would have on the amount of interest paid on, or the market value of, our current or future debt obligations and interest-rate swaps, including our long-term debt instruments and our bank credit facilities. Uncertainty as to the nature of such potential changes, phase out, alternative reference rates or other reforms may materially adversely affect the trading market for LIBOR-based securities, including our long-term debt instruments, our interest-rate swaps and our bank credit facilities. Reform of, or the replacement or phasing out of, LIBOR and proposed regulation of LIBOR and other “benchmarks” may materially adversely affect the market value of, the applicable interest rate on and the amount of interest paid on our current or future debt obligations and our interest-rate swaps, including our long-term debt instruments and our bank credit facilities.
Risks Relating to our Common Stock
We do not expect to pay any cash dividends for the foreseeable future.
We intend to retain future earnings to finance and grow our business. As a result, we do not expect to pay any cash dividends for the foreseeable future. All decisions regarding the payment of dividends will be made in the sole discretion of our Board of Directors from time to time in accordance with applicable law. There can be no assurance that we will have sufficient surplus under Delaware law to be able to pay any dividends at any time in the future. This may result from lower revenue, extraordinary cash expenses, actual costs exceeding contemplated costs, funding of capital expenditures or increases in reserves.
Your percentage of ownership in the Company may be diluted in the future.
In the future, your percentage ownership in the Company may be diluted because of equity awards that we will be granting to our directors, officers and employees or otherwise as a result of equity issuances for acquisitions or capital market transactions. Such awards will have a dilutive effect on our earnings per share, which could adversely affect the market price of our common stock. From time to time, we will issue additional stock-based awards to our employees under our employee benefits plans.
In addition, our amended and restated certificate of incorporation authorizes us to issue, without the approval of our stockholders, one or more classes or series of preferred stock that have such designation, powers, preferences and relative, participating, optional and other special rights, including preferences over our common stock with respect to dividends and distributions, as our Board of Directors generally may determine. The terms of one or more classes or series of preferred stock could dilute the voting power or reduce the value of our common stock. Similarly, the repurchase or redemption rights or liquidation preferences we could assign to holders of preferred stock could affect the residual value of the common stock.
Certain provisions of our certificate of incorporation, by-laws, and Delaware law may discourage takeovers and limit our ability to use, acquire, or develop certain competing businesses.
Our amended and restated certificate of incorporation and amended and restated by-laws contain certain provisions that may discourage, delay or prevent a change in our management or control over us. For example, our amended and restated certificate of incorporation and amended and restated by-laws, collectively:
|
|
|
|
|
|
|
|
|
|
These provisions could discourage potential acquisition proposals and could delay or prevent a change in control, even though a majority of stockholders may consider such proposal, if effected, desirable. Such provisions could also make it more difficult for third parties to remove and replace the members of our Board of Directors. Moreover, these provisions may inhibit increases in the trading price of our common stock that may result from takeover attempts or speculation.
Our amended and restated certificate of incorporation designates the state courts of the State of Delaware, or, if no state court located in the State of Delaware has jurisdiction, the federal court for the District of Delaware, as the sole and exclusive forum for certain types of actions and proceedings that may be initiated by our stockholders, which could discourage lawsuits against us and our directors and officers.
Our amended and restated certificate of incorporation provides that, unless our board of directors otherwise determines, the state courts of the State of Delaware, or, if no state court located in the State of Delaware has jurisdiction, the federal court for the District of Delaware, will be the sole and exclusive forum for any derivative action or proceeding brought on our behalf, any action asserting a claim for or based on a breach of a fiduciary duty owed by any of our current or former directors or officers to us or to our stockholders, including a claim alleging the aiding and abetting of such a breach of fiduciary duty; any action asserting a claim against us or any of our current or former directors or officers arising pursuant to any provision of the Delaware General Corporation Law (the “DGCL”) or our amended and restated certificate of incorporation or bylaws; any action asserting a claim relating to or involving us that is governed by the internal affairs doctrine; or any action asserting an “internal corporate claim” as such term is defined in the DGCL. This exclusive forum provision may limit the ability of our stockholders to bring a claim in a judicial forum that such stockholders find favorable for disputes with us or our current or former directors or officers, which may discourage such lawsuits against us and our current or former directors and officers. Alternatively, if a court outside of Delaware were to find this exclusive forum provision inapplicable to, or unenforceable in respect of, one or more of the specified types of actions or proceedings described above, we may incur additional costs associated with resolving such matters in other jurisdictions.
Item 1B. Unresolved Staff Comments.None.
Item 2. Properties. We maintain administrative offices and other facilities to support our operations. We have leases for our principal executive office in Chicago, Illinois and other offices located in Naperville, Illinois; Waltham, Massachusetts; Appleton, Wisconsin; and Santa Monica, California. We believe that our facilities are adequate to meet our needs for the immediate future, and that should it be needed, we will be able to secure additional space to accommodate any such expansion of our operations.Illinois.
19
Item 3. Legal Proceedings. From time to time, we may be party to various claims and legal actions arising in the ordinary course of our business. We do not believe that we have any pending litigation that, separately or in the aggregate, would have a material adverse effect on our results of operations, financial condition or cash flows. We hereby incorporate by reference Note 10 (Commitments and Contingencies) to the Consolidated and Combined Financial Statements included in Part II, Item 8., “Financial Statements and Supplementary Data” of this Annual Report on Form 10-K.
Item 4. Mine Safety Disclosures. None.
20
PART II
Item 5. Market for Registrant’s Common Equity, Related Stockholder Matters and Issuer Purchases of Equity Securities. Our common stock is listed on the NYSE under the symbol “CARS.” “When issued” trading of our common stock commenced on the NYSE on May 15, 2017. “Regular way” trading began on June 1, 2017, the day of the Separation. Based on reports by our transfer agent for our common stock, as of February 19, 2020,16, 2023, there were 5,1204,384 holders of record of our common stock.
Cumulative Stockholder Return Graph. The following graph shows the cumulative total stockholder return for our common stock duringfor each of the period from May 18, 2017 tolast five fiscal years ended December 31, 2019.2022. The graph also shows the cumulative returns of Standard and Poor’s (“S&P”) MidCap 400SmallCap 600 Index and Research Data Group’s (“RDG”) Internet Composite Index.Index, both of which we are a member. The comparison assumes $100 was invested on May 18,December 31, 2017 in CARS common stock. The cumulative stockholder return graph for the year ended December 31, 2017, included in the 2017 Annual Report on Form 10-K, utilized the S&P MidCap 400 Internet Software & Services Index, which was discontinued as of September 30, 2018.stock and each index.

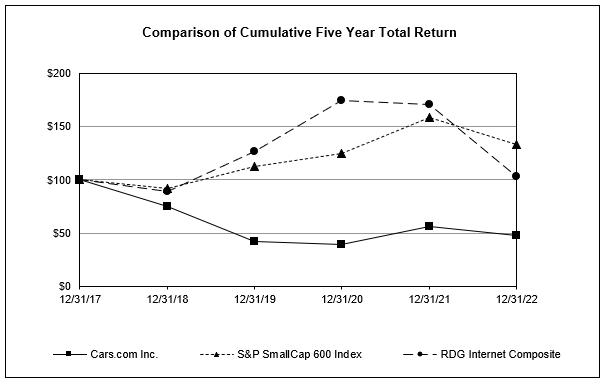
Purchases of Equity Securities by Issuer. Our share repurchase activity for the three months ended December 31, 20192022 is as follows:
Period | Total Number of Shares Purchased (1) |
| Average Price Paid per Share (1) |
| Total Number of Shares Purchased as Part of Publicly Announced Plans or Programs (2) |
| Maximum Dollar Value of Shares that May Yet Be Purchased Under the Plans or Programs (in thousands) (3) |
| ||||
October 1 through October 31, 2022 |
| 431,028 |
| $ | 12.52 |
|
| 431,028 |
| $ | 154,615 |
|
November 1 through November 30, 2022 |
| 248,788 |
|
| 14.46 |
|
| 248,788 |
|
| 151,017 |
|
December 1 through December 31, 2022 |
| — |
|
| — |
|
| — |
|
| 151,017 |
|
|
| 679,816 |
|
|
|
| 679,816 |
|
|
| ||
Period |
| Total Number of Shares Purchased (1) |
|
| Average Price Paid per Share (1) |
|
| Total Number of Shares Purchased as Part of Publicly Announced Plans or Programs (2) |
|
| Maximum Dollar Value of Shares that May Yet Be Purchased Under the Plans or Programs (3) (in thousands) |
| ||||
October 1 through October 31, 2019 |
|
| — |
|
| $ | — |
|
|
| — |
|
| $ | 62,810 |
|
November 1 through November 30, 2019 |
|
| — |
|
|
| — |
|
|
| — |
|
|
| 62,810 |
|
December 1 through December 31, 2019 |
|
| — |
|
|
| — |
|
|
| — |
|
|
| 62,810 |
|
Total |
|
| — |
|
|
|
|
|
|
| — |
|
|
|
|
|
Dividends. We have never declared or paid any cash dividends on our capital stock, and we do not currently intend to pay any cash dividends for the foreseeable future. Any future determination to pay dividends on our common stock will be made by the Board of Directors and will depend upon, among other factors, our financial condition, operating results, current and anticipated cash needs, plans 21 for expansion and other factors that the Board of Directors may deem relevant. In addition, the terms of our credit facilities contain restrictions on our ability to declare and pay cash dividends on our capital stock. |
|
|
|
|
|
Recent Sales of Unregistered Securities. None.
Use of Proceeds from Registered Securities. None.
Item 6. Selected Financial Data. We derived the Consolidated and Combined Statements of (Loss) Income data for the years ended December 31, 2019, 2018 and 2017 and the Consolidated Balance Sheet data as of December 31, 2019 and 2018 from our audited Consolidated and Combined Financial Statements, which are included elsewhere in this Annual Report on Form 10-K. We derived the Consolidated and Combined Statement of (Loss) Income data for the years ended December 31, 2016 and 2015 and the Consolidated and Combined Balance Sheet data as of December 31, 2017, 2016 and 2015 from our audited Consolidated and Combined Financial Statements, which are not included in this Annual Report on Form 10-K. The selected financial data is not necessarily indicative of the results of future operations and should be read in conjunction with “Management’s Discussion and Analysis of Financial Condition and Results of Operations” and our Consolidated and Combined Financial Statements and the related notes included elsewhere in this Annual Report on Form 10-K.[Reserved]
22
|
| Year Ended December 31, |
| |||||||||||||||||
(In thousands, except per share amounts) |
| 2019 |
|
| 2018 |
|
| 2017 |
|
| 2016 |
|
| 2015 |
| |||||
Statement of (Loss) Income Data |
|
|
|
|
|
|
|
|
|
|
|
|
|
|
|
|
|
|
|
|
Total revenue |
| $ | 606,682 |
|
| $ | 662,127 |
|
| $ | 626,262 |
|
| $ | 633,106 |
|
| $ | 596,510 |
|
Operating (loss) income (1) (2) (3) |
|
| (446,060 | ) |
|
| 83,924 |
|
|
| 134,256 |
|
|
| 176,650 |
|
|
| 157,733 |
|
Net (loss) income (4) |
|
| (445,324 | ) |
|
| 38,809 |
|
|
| 224,443 |
|
|
| 176,370 |
|
|
| 157,838 |
|
(Loss) Earnings per Common Share and Other Data |
|
|
|
|
|
|
|
|
|
|
|
|
|
|
|
|
| |||
(Loss) earnings per share, basic (5) |
| $ | (6.65 | ) |
| $ | 0.55 |
|
| $ | 3.13 |
|
| $ | 2.46 |
|
| $ | 2.20 |
|
(Loss) earnings per share, diluted (5) |
|
| (6.65 | ) |
|
| 0.55 |
|
|
| 3.13 |
|
|
| 2.46 |
|
|
| 2.20 |
|
Weighted average number of common shares outstanding, basic |
|
| 66,995 |
|
|
| 70,318 |
|
|
| 71,661 |
|
|
| 71,588 |
|
|
| 71,588 |
|
Weighted average number of common shares outstanding, diluted |
|
| 66,995 |
|
|
| 70,547 |
|
|
| 71,727 |
|
|
| 71,588 |
|
|
| 71,588 |
|
Dividends declared per share |
| $ | — |
|
| $ | — |
|
| $ | — |
|
| $ | — |
|
| $ | — |
|
Balance Sheet Data |
|
|
|
|
|
|
|
|
|
|
|
|
|
|
|
|
|
|
|
|
Cash and cash equivalents |
| $ | 13,549 |
|
| $ | 25,463 |
|
| $ | 20,563 |
|
| $ | 8,896 |
|
| $ | 100 |
|
Total assets |
|
| 2,027,991 |
|
|
| 2,600,549 |
|
|
| 2,511,039 |
|
|
| 2,547,266 |
|
|
| 2,473,667 |
|
Long-term debt (6) |
|
| 642,668 |
|
|
| 692,159 |
|
|
| 578,352 |
|
|
| — |
|
|
| — |
|
|
|
|
|
|
|
|
|
|
|
|
|
Item 7. Management’s Discussion and Analysis of Financial Condition and Results of Operations. The following discussion and analysis of our business, financial condition, results of operations and quantitative and qualitative disclosures should be read in conjunction with our Consolidated and Combined Financial Statements and related notes included elsewhere in this Annual Report on Form 10-K. This discussion and analysis also contains forward-looking statements and should also be read in conjunction with the disclosures and information contained in “Note About Forward-Looking Statements” and “Risk Factors” in this Annual Report on Form 10-K. The financial information discussed below and included elsewhere in this Annual Report on Form 10-K may not necessarily reflect what our financial condition, results of operations and cash flows would have been had we been a stand-alone company during the applicable periods presented or what our financial condition, results of operations and cash flows may be in the future.
References in this discussion and analysis to “CARS”, “we,” “us,” “our” and similar terms refer to Cars.com Inc. and its subsidiaries, collectively, unless the context indicates otherwise.
Business Overview. We are a leading automotive marketplace platform that provides a robust set of digital marketplace and solutions provider for the automotive industry that connectsconnect car shoppers with sellers and original equipment manufacturers (“OEM”s). Our marketplace empowerssellers. We empower shoppers with the data, resources and informationdigital tools needed to make confident carinformed buying decisions whileand seamlessly connect with automotive retailers, automotive manufacturers (“OEMs”), other national advertisers and lenders. In a rapidly changing market, we enable dealers and OEMs with innovative technical solutions and data-driven intelligence, to better reach and influence ready-to-buy shoppers, increase inventory turn and operating efficiencies and gain market share.
In addition to Cars.com™, our brands include Dealer Inspire®, a website and digital solutions provider enabling dealers to be more efficient through connected digital experiences; FUEL™, an advertising solution providing dealers and OEMs the benefit of leveraging targeted digital video and display marketing to Cars.com’s audience of in-market car shoppers; DealerRater®, a leading car dealer review and reputation management technology platform help sellers improve operational efficiency, profitabilitysolution; CreditIQ®, a digital financing technology; and sales.Accu-Trade™, vehicle valuation and appraisal technology. Our portfolio of brands also includes Cars.com,NewCars.com®.
Overview of Results.
|
| Year Ended December 31, |
| |||||||||
(In thousands) |
| 2022 |
|
| 2021 |
|
| 2020 |
| |||
Revenue |
| $ | 653,876 |
|
| $ | 623,683 |
|
| $ | 547,503 |
|
Net income (loss) (1) |
|
| 17,206 |
|
|
| 10,791 |
|
|
| (789,106 | ) |
2022 Highlights and Recent Trends.
Accu-Trade Acquisition. In March 2022, we acquired certain assets and assumed certain liabilities of Accu-Trade, LLC; Accu-Trade Canada, LLC; Galves Market Data; and Headstart Logistics, LLC d/b/a MADE Logistics (collectively, “Accu-Trade”), which includes real-time, VIN-specific vehicle appraisal and valuation data, instant guaranteed offer capabilities and logistics technology (the “Accu-Trade Acquisition”). Consideration for the transaction was composed of $64.7 million of cash and $5.3 million in other consideration. As part of the transaction, upon achievement of certain financial targets, we may be required to pay additional cash and stock consideration to the former owners. Together with our marketplace and Dealer Inspire websites, we have packaged this technology into a product called Accu-Trade Connected which we began rolling out in mid-2022. We continue to sell and DealerRater, in addition to Auto.com, PickupTrucks.com and NewCars.com. onboard dealers onto our Accu-Trade Connected product.
CreditIQ Acquisition.In May 2017,November 2021, we separated from our former parent company, TEGNA Inc. (“TEGNA”) by means of a spin-off of a newly formed company, Cars.com Inc., which now owns TEGNA’s former digital automotive marketplace business (the “Separation”). Our common stock began trading “regular way” on the New York Stock Exchange on June 1, 2017. In February 2018, the Company acquired all of the outstanding stock of Dealer Inspire,CreditIQ, Inc. (the "CIQ Acquisition"), an automotive fintech platform that provides instant online loan screening and substantially allapprovals to facilitate online car buying. Through the CIQ Acquisition, we provide dealers and consumers with access to advanced digital financing technology across the CARS platform. Using cash on hand, we paid $30.0 million at the closing excluding transaction fees and expenses. As part of the net assets of Launch Digital Marketing LLC (the “DI Acquisition”).
Overview of Results.
|
| Year Ended December 31, |
| |||||||||
(In thousands, except percentages) |
| 2019 |
|
| 2018 |
|
| 2017 |
| |||
Revenue |
| $ | 606,682 |
|
| $ | 662,127 |
|
| $ | 626,262 |
|
Net (loss) income (1) (2) (3) |
|
| (445,324 | ) |
|
| 38,809 |
|
|
| 224,443 |
|
Retail revenue as % of total revenue |
|
| 94 | % |
|
| 87 | % |
|
| 74 | % |
Wholesale revenue as % of total revenue |
|
| 6 | % |
|
| 13 | % |
|
| 26 | % |
|
|
|
|
|
|
2019 and Recent Highlights.
Fourth Quarter Dealer Count Growth. In the fourth quarter of 2019, dealer customers grew by almost 200 to 18,834 as of December 31, 2019, as compared with 18,635 as of September 30, 2019. This increase was a result of improved retention rates as well as growth in new dealer customers added during the fourth quarter. We experienced growth in both local dealer customers and our solutions-only customers.
Increases in Traffic.Traffic is critical to our business. Traffic to the CARS network of websites and mobile apps provides value to our advertisers in terms of audience, awareness, consideration and conversion. Traffic provides an indication of our consumer reach. Although our consumer reach does not directly result in revenue, we believe our ability to reach in-market car shoppers is attractive to our dealers and national advertisers. We have been diligently focused on growing our audience, the fundamental deliverable of any marketplace business.
In 2019, we had record SEO Traffic growth. During this period, we achieved 24% growth in Traffic and 21% growth in Average Monthly Unique Visitors. Driven by our product innovations and investments in and efficiencies gained in search engine optimization,
brand awareness and paid channels, we have experienced consistent year-over-year Traffic growth since January 2018, and in August 2019 we recorded the highest-trafficked month in our history and subsequently broke that record in January 2020. In addition, we have been increasing our share of unique visitors throughout 2019.
New OEM Agreement. In 2019, we were selected as a preferred website provider to General Motors (“GM”). This allowed us to begin selling our website solutions to more than 4,100 GM dealers. This program is non-exclusive and provides GM dealers a choice in provider for the first time in 15 years. Currently in the pilot phase, we expect to launch websites for GM customers in 2020. This new agreement provides us with the opportunity to substantially increase our current website customer base, which was approximately 3,200 as of December 31, 2019.
Affiliate Conversions. As of October 1, 2019, we have successfully converted all affiliates to our direct control. We amended five of our affiliate agreements (Gannett, the McClatchy Company (“McClatchy”), TEGNA, tronc, Inc. (“tronc”), and the Washington Post). The Belo affiliate agreement expired on October 1, 2019. We now have a direct relationship with all dealer customers and recognize the revenue associated with converted dealers as Retail revenue, rather than Wholesale revenue, in the Consolidated and Combined Statements of (Loss) Income. Beginning July 2020, upon the expiration of the affiliate agreements, we will realize incremental Free Cash Flow, as we will no longermay be required to make any further paymentspay additional cash consideration based on future performance over a three-year period. CreditIQ was rolled out nationwide to dealers in September 2022, and approximately 2,300 dealers are leveraging the affiliates under these agreements. Free Cash Flow is defined as net cash provided by operating activities less capital expenditures, including purchases of property and equipment and capitalization of internal-use software and website development costs. For information related to the Unfavorable contracts liability, see Note 7 (Unfavorable Contracts Liability) to the accompanying Consolidated and Combined Financial Statements included in Part II, Item 8., “Financial Statements and Supplementary Data” of this Annual Report on Form 10-K.technology.
Credit Agreement Amendment. In October 2019, we entered into an amendment to our Credit Agreement to increase the total net leverage covenant during the remaining term of the Credit Agreement while preserving the favorable pricing structure from the original agreement. The amendment increases our maximum total net leverage ratio from 3.75x to 4.50x with incremental step downs through maturity on May 31, 2022.
Completion of Strategic Alternatives Review. Share Repurchase Program.In August 2019, we announced the conclusion of the strategic alternatives review process first announced on January 16, 2019. The strategic alternatives review process was public, comprehensive and deliberate, lasting ten months. After extensive negotiations and discussions, no actionable proposals for a sale were available to us. As a result,February 2022, our Board of Directors unanimously concluded that the best interests of our stockholders are served by continuingauthorized a three-year share repurchase program to focus on the execution of our strategic plan and opportunitiesacquire up to drive growth and stockholder returns as an independent public company. We remain open to all potential value-creating opportunities.
Technology Transformation. In February 2019, we announced a restructuring$200 million of the productCompany's common stock. We intend to fund the share repurchase program principally with cash from operations. During the year ended December 31, 2022, we repurchased and technology teams (the “Technology Transformation”). This restructuring is primarily focused on shifting our technology spend towards innovation to improve our speedsubsequently retired 4.2 million shares for $49.0 million at an average price paid per share of product delivery, to enable integration across current and future systems, and to migrate our systems to the cloud. In connection with the Technology Transformation, we have aligned our product and technology teams with our long-term growth strategy to expand beyond listings to a digital solutions marketplace. As part of this process, we have streamlined the existing teams as we modernize our technology platform and invest in a more efficient cloud-based infrastructure focused on machine learning, product innovation and growth. Further, we expect to achieve cost efficiencies upon completion of the Technology Transformation.$11.75.
Sales Transformation. In December 2018, we restructured the sales team (the “Sales Transformation”), with the primary goal of better serving our customers. We reorganized the sales force into teams designed to provide the full range of enhanced services to current customers and a more tailored structure to win new customers. These changes reflect the expansion of our business beyond car listings to include value-added digital solutions such as innovations from Dealer Inspire and DealerRater. The Sales Transformation also reflects a realignment of territories following the conversion of the affiliate agreements.
Key Operating Metrics. We regularly review a number of key metrics to evaluate our business, measure our performance, identify trends affecting our business, formulate financial projections and make operating and strategic decisions. InformationAnnual information regarding Traffic, Average Monthly Unique Visitors and Direct Monthly Average Revenue Per Dealer ("ARPD") is as follows:follows (in thousands, except for ARPD and percentages):
|
| Year Ended December 31, |
|
|
|
|
| |||||
|
| 2019 |
|
| 2018 |
|
| % Change |
| |||
Traffic (Visits) |
|
| 553,660,000 |
|
|
| 445,282,000 |
|
|
| 24 | % |
Average Monthly Unique Visitors |
|
| 22,629,000 |
|
|
| 18,778,000 |
|
|
| 21 | % |
Direct Monthly Average Revenue Per Dealer (1) |
| $ | 2,179 |
|
| $ | 2,098 |
|
|
| 4 | % |
|
|
23
|
| Year Ended December 31, |
|
|
|
| ||||||
|
| 2022 |
|
| 2021 |
|
| % Change |
| |||
Traffic |
|
| 587,388 |
|
|
| 591,499 |
|
|
| (1 | )% |
Average Monthly Unique Visitors |
|
| 26,400 |
|
|
| 25,064 |
|
|
| 5 | % |
ARPD - Annual |
| $ | 2,329 |
|
| $ | 2,309 |
|
|
| 1 | % |
Information regarding our Dealer Customers and quarterly ARPD is as follows:
|
| As of December 31, |
|
|
|
|
| |||||
|
| 2019 |
|
| 2018 |
|
| % Change |
| |||
Dealer Customers |
|
| 18,834 |
|
|
| 19,921 |
|
|
| (5 | )% |
|
| December 31, 2022 |
|
| December 31, 2021 |
|
| YoY % |
|
| September 30, 2022 |
|
| QoQ % |
| |||||
Dealer Customers |
|
| 19,506 |
|
|
| 19,179 |
|
|
| 2 | % |
|
| 19,585 |
|
|
| 0 | % |
ARPD - Quarterly |
| $ | 2,361 |
|
| $ | 2,333 |
|
|
| 1 | % |
| $ | 2,334 |
|
|
| 1 | % |
Average Monthly Unique Visitors (“UVs”) and Traffic (Visits)("Visits"). UVs and Traffic is criticalare fundamental to our business. Traffic to the CARS network of websites and mobile apps provides value to our advertisers in terms of audience, awareness, consideration and conversion. In addition to tracking traffic volume and sources, we monitor activity on our properties, allowing us to innovate and refine our consumer-facing offerings. Traffic is defined as the number of visits to CARS desktop and mobile properties (responsive sites and mobile apps), using Adobe Analytics. Traffic does not include traffic to Dealer Inspire websites. Visits refers to the number of times visitors accessed CARS properties during the period, no matter how many visitors make up those visits. Traffic provides an indicationThey are indicative of our consumer reach. reach and the level of engagement they have with our platform.
Although our consumer reachengagement does not directly result in revenue, we believe our ability to reach in-market car shoppers is attractive to our dealer customersdealers, OEMs and national advertisers.advertisers and a primary reason they do business with us. We have achieved audience scale as measured by UVs and drive increased Traffic through a combination of continued growth in UVs and higher repeat visitation and engagement. Traffic increases can result in increased impressions, clicks and other lead events that we can ultimately monetize through our products and services.
The growth in Traffic was driven by our product innovations and investments in and efficiencies gained in search engine optimization, brand awareness and paid channels. ForUVs for the yearsyear ended December 31, 20192022 is driven by efficiencies gained and user acquisition strategy shifts in 2022. This growth may be affected by the recent changes in browser and data privacy policies which have made it more difficult to resolve users across multiple visits. The decrease in Traffic relative to the increase in UVs for the year ended December 31, 2018, mobile traffic accounted for 72% and 67% of total Traffic, respectively.2022 was primarily due to continued lower vehicle inventory levels, which we believe are resulting in users purchasing cars with fewer visits.
Average Monthly Unique Visitors (“UVs”). Growth in unique visitors and consumer traffic to our network of websites and mobile apps increases the number of impressions, clicks, leads and other events we can monetize to generate revenue. We define UVs in a given month as the number of distinct visitors that engage with our platform during that month. Visitors are identified when a user first visits an individual CARS property on an individual device/browser combination or installs one of our mobile apps on an individual device. If a visitor accesses more than one of our web properties or apps or uses more than one device or browser, each of those unique property/browser/app/device combinations counts towardstoward the number of UVs. Traffic is defined as the number of visits to CARS desktop and mobile properties (responsive sites and mobile apps). We measure UVs and Traffic via Adobe Analytics. These metrics do not include traffic to Dealer Inspire UVs. We measure UVs using Adobe Analytics.websites.
The growth in UVs was driven by the same factors as our traffic growth, our product innovations and investments in and efficiencies gained in search engine optimization, brand awareness and paid channels.
Monthly Average Revenue Per Dealer (“ARPD”). We believe that our ability to grow ARPD is an indicator of the value proposition of our products.platform. We define ARPD as Direct retailDealer revenue, excluding digital advertising services, during the period divided by the monthly average number of direct Dealer Customers during the same period. Beginning with the first quarter of 2019, this key operatingthree months ended June 30, 2022, Accu-Trade is included in our ARPD metric, includes revenue from dealer websiteswhich had an immaterial impact on ARPD for the annual and related digital solutions. ARPDquarterly periods. No prior to the first quarter of 2019period has not been recast to include Dealer Inspire as it would be impracticable to do so.
ARPD decreased 2% from September 30, 2019,for the fourth quarter of 2022 increased compared to the same period of the prior year and compared to the third quarter of 2022, primarily driven by upsell cancellations and dealer churn.growth in digital solutions, offset by a reduction in FUEL revenue.
ARPD for the annual period increased 4% from December 31, 2018,compared to the same period of the prior year, primarily driven by the addition of dealer websites and relatedgrowth in digital solutions, as 2018 ARPD did not include these revenue sources. ARPD excluding revenue from dealer websites and related digital solutions was $2,070, down 1% from the prior year.offset by a reduction in FUEL revenue.
Dealer Customers. Dealer Customers represent dealerships using our products as of the end of each reporting period. Each physical or virtual dealership location is counted separately, whether it is a single-location proprietorship or part of a large, consolidated dealer group. Multi-franchise dealerships at a single location are counted as one dealer. Beginning June 30, 2022, this key operating metric includes Accu-Trade; however, no prior period has been recast as it would be impracticable to do so.
Total Dealer Customers was essentially flat as compared to September 30, 2022.
Dealer Customers increased 1% from September 30, 2019. Dealer Customers increased, primarily due to growth in direct local dealer customers, reflecting improved retention rates and a stabilization in cancellation rates.
Total Dealer Customers declined 5%2% from December 31, 2018.2021, driven by sustained high retention rates with traditional dealers, new sales to Dealer Customers, decreased, primarily due to higher cancellationsas well as the inclusion of marketplace customers, in particular in the first half of 2019,Accu-Trade only dealers, partially offset by growth inelevated cancellations from digital solutions customers.dealers.
Factors Affecting Our Performance. Our business is impacted by changes in the ever-changing larger automotive environment,ecosystem, including consumer demandinventory supply and other macroeconomic factors, supply chain disruptions, semiconductor shortages, vehicle acquisition cost, electric vehicle adoption, employee retention
24
and changes related to automotive digital advertising, solutions. We have observed softnessamong other macroeconomic factors. Changes in new carvehicle sales volumes in the United States and reduced dealer profitability, which has impactedalso influence OEMs’ and dealerships’ willingness to increase spend withinvestments in technology solutions and automotive marketplaces like Cars.com. Cars.com and could impact our pricing strategies and/or revenue mix.
Our long-term success will depend in part on our ability to continue to transform our business toward a multi-faceted suite of digital solutions that complement our mediaonline marketplace offerings. We believe our core strategic strengths, including our powerful family of brands, growing high-quality audience and suite of digital solutions for advertisers, will assist us as we navigate a rapidly changing automotive environment. Additionally, we are adaptingfocused on equipping our go-to-market salescustomers with digital solutions to enable them to compete in an environment in which an increasing number of car-buying customers are shopping online. These solutions include virtual showrooms, online chat, vehicle financing, appraisal and valuation, instant guaranteed offer capabilities, logistics technology infrastructure, as described in the Sales and Technology Transformations discussions above,our FUEL product, which allows dealers to support the execution of our strategy.target in-market buyers on streaming platforms. The foundation of our continued success is the value we deliver to customers, and we believe that our large and growing audience of in-market, undecided car shoppers and innovative solutions deliver significant value to our customers.
Results of Operations.For both comparative tables below,
Year Ended December 31, 2022 Compared to Year Ended December 31, 2021
|
|
|
|
|
|
|
|
|
| |||||||
(In thousands, except percentages) |
| 2022 |
|
| 2021 |
|
| $ Change |
|
| % Change |
| ||||
Revenue: |
|
|
|
|
|
|
|
|
|
|
|
| ||||
Dealer |
| $ | 579,222 |
|
| $ | 549,923 |
|
| $ | 29,299 |
|
|
| 5 | % |
OEM and National |
|
| 58,557 |
|
|
| 65,085 |
|
|
| (6,528 | ) |
|
| (10 | )% |
Other |
|
| 16,097 |
|
|
| 8,675 |
|
|
| 7,422 |
|
|
| 86 | % |
Total revenue |
|
| 653,876 |
|
|
| 623,683 |
|
|
| 30,193 |
|
|
| 5 | % |
Operating expenses: |
|
|
|
|
|
|
|
|
|
|
|
| ||||
Cost of revenue and operations |
|
| 114,959 |
|
|
| 114,200 |
|
|
| 759 |
|
|
| 1 | % |
Product and technology |
|
| 89,015 |
|
|
| 77,316 |
|
|
| 11,699 |
|
|
| 15 | % |
Marketing and sales |
|
| 221,879 |
|
|
| 208,335 |
|
|
| 13,544 |
|
|
| 7 | % |
General and administrative |
|
| 67,593 |
|
|
| 73,562 |
|
|
| (5,969 | ) |
|
| (8 | )% |
Depreciation and amortization |
|
| 94,394 |
|
|
| 101,932 |
|
|
| (7,538 | ) |
|
| (7 | )% |
Total operating expenses |
|
| 587,840 |
|
|
| 575,345 |
|
|
| 12,495 |
|
|
| 2 | % |
Operating income |
|
| 66,036 |
|
|
| 48,338 |
|
|
| 17,698 |
|
|
| 37 | % |
Nonoperating expense: |
|
|
|
|
|
|
|
|
|
|
|
| ||||
Interest expense, net |
|
| (35,320 | ) |
|
| (38,729 | ) |
|
| 3,409 |
|
|
| (9 | )% |
Other expense, net |
|
| (8,140 | ) |
|
| (126 | ) |
|
| (8,014 | ) |
| *** |
| |
Total nonoperating expense, net |
|
| (43,460 | ) |
|
| (38,855 | ) |
|
| (4,605 | ) |
|
| 12 | % |
Income before income taxes |
|
| 22,576 |
|
|
| 9,483 |
|
|
| 13,093 |
|
| *** |
| |
Income tax expense (benefit) |
|
| 5,370 |
|
|
| (1,308 | ) |
|
| 6,678 |
|
| *** |
| |
Net income |
| $ | 17,206 |
|
| $ | 10,791 |
|
| $ | 6,415 |
|
|
| 59 | % |
*** Not meaningful
Dealer revenue. Dealer revenue consists of marketplace, digital solutions including Accu-Trade and media products sold to dealer customers. Dealer revenue is our largest revenue stream, representing 88.6% and 88.2% of total revenue for the yearyears ended December 31, 2018 has been reclassified to conform2022 and 2021, respectively, and increased by $29.3 million, or 5%, compared to the currentprior year, presentation. There is no changedriven primarily by an increase in dealer customers, digital solutions and growth in digital advertising revenue from December 31, 2021.
OEM and National revenue. OEM and National revenue consists of display advertising and other solutions sold to Operating (loss) income as a resultOEMs, advertising agencies, automotive dealer associations and auto adjacent businesses. OEM and National revenue represents 9.0% and 10.4% of these reclassifications. No such adjustments were requiredtotal revenue for the yearyears ended December 31, 2017.2022 and 2021, respectively. OEM and National revenue decreased 10%, primarily due to pullbacks in certain OEM spending associated with production delays and shortages, both driven by supply-chain disruptions.
Other revenue. Other revenue primarily consists of revenue related to the Accu-Trade license agreement and vehicle listing data sold to third parties, as well as pay per lead. Other revenue represents 2.4% and 1.4% of total revenue for the years ended December 31, 2022 and 2021, respectively. Other revenue increased $7.4 million or 86%, primarily due to the Accu-Trade license agreement, as well as other Accu-Trade revenue. For furthermore information, see Note 2 (Significant Accounting Policies)3 (Business Combinations) to the accompanying Consolidated and Combined Financial Statements included in Part II, Item 8., “Financial Statements and Supplementary Data” of this Annual Report on Form 10-K.
Year Ended December 31, 2019 Compared To Year Ended December 31, 2018
|
|
|
|
| Increase |
|
|
|
|
| ||||||
(In thousands, except percentages) |
| 2019 |
|
| 2018 |
|
| (Decrease) |
|
| % Change |
| ||||
Revenue: |
|
|
|
|
|
|
|
|
|
|
|
|
|
|
|
|
Direct |
| $ | 477,095 |
|
| $ | 457,651 |
|
| $ | 19,444 |
|
|
| 4 | % |
National advertising |
|
| 80,774 |
|
|
| 105,381 |
|
|
| (24,607 | ) |
|
| (23 | )% |
Other |
|
| 14,442 |
|
|
| 16,156 |
|
|
| (1,714 | ) |
|
| (11 | )% |
Retail |
|
| 572,311 |
|
|
| 579,188 |
|
|
| (6,877 | ) |
|
| (1 | )% |
Wholesale |
|
| 34,371 |
|
|
| 82,939 |
|
|
| (48,568 | ) |
|
| (59 | )% |
Total revenue |
|
| 606,682 |
|
|
| 662,127 |
|
|
| (55,445 | ) |
|
| (8 | )% |
Operating expenses: |
|
|
|
|
|
|
|
|
|
|
|
|
|
|
|
|
Cost of revenue and operations |
|
| 99,549 |
|
|
| 90,433 |
|
|
| 9,116 |
|
|
| 10 | % |
Product and technology |
|
| 62,859 |
|
|
| 68,789 |
|
|
| (5,930 | ) |
|
| (9 | )% |
Marketing and sales |
|
| 217,432 |
|
|
| 226,740 |
|
|
| (9,308 | ) |
|
| (4 | )% |
General and administrative |
|
| 73,772 |
|
|
| 72,943 |
|
|
| 829 |
|
|
| 1 | % |
Affiliate revenue share |
|
| 20,790 |
|
|
| 15,488 |
|
|
| 5,302 |
|
|
| 34 | % |
Depreciation and amortization |
|
| 116,877 |
|
|
| 103,810 |
|
|
| 13,067 |
|
|
| 13 | % |
Goodwill and intangible asset impairment |
|
| 461,463 |
|
|
| — |
|
|
| 461,463 |
|
| *** |
| |
Total operating expenses |
|
| 1,052,742 |
|
|
| 578,203 |
|
|
| 474,539 |
|
|
| 82 | % |
Operating (loss) income |
|
| (446,060 | ) |
|
| 83,924 |
|
|
| (529,984 | ) |
| *** |
| |
Nonoperating (expense) income: |
|
|
|
|
|
|
|
|
|
|
|
|
|
|
|
|
Interest expense, net |
|
| (30,774 | ) |
|
| (27,717 | ) |
|
| (3,057 | ) |
|
| 11 | % |
Other income, net |
|
| 1,555 |
|
|
| 722 |
|
|
| 833 |
|
|
| 115 | % |
Total nonoperating expense, net |
|
| (29,219 | ) |
|
| (26,995 | ) |
|
| (2,224 | ) |
|
| 8 | % |
(Loss) income before income taxes |
|
| (475,279 | ) |
|
| 56,929 |
|
|
| (532,208 | ) |
| *** |
| |
Income tax (benefit) expense |
|
| (29,955 | ) |
|
| 18,120 |
|
|
| (48,075 | ) |
| *** |
| |
Net (loss) income |
| $ | (445,324 | ) |
| $ | 38,809 |
|
| $ | (484,133 | ) |
| *** |
| |
***Not meaningful
Retail Revenue—Direct. Direct revenue consists of marketplace and digital solutions sold to dealer customers. Direct revenue is our largest revenue stream, representing 78.6% and 69.1% of total revenue for the years ended December 31, 2019 and 2018, respectively. Direct revenue increased by $19.4 million, or 4%, compared to the prior year. As of October 1, 2019, we have successfully converted all affiliates to our direct control, and will no longer have wholesale revenue. We amended five of our affiliate agreements (Gannett,25
McClatchy, TEGNA, tronc, and the Washington Post). The Belo affiliate agreement expired on October 1, 2019. We now have a direct relationship with all dealer customers and recognize the revenue associated with converted dealer customers as Retail revenue, rather than Wholesale revenue, in the Consolidated and Combined Statements of (Loss) Income. During the year ended December 31, 2019, the affiliate market conversions contributed an incremental $52.5 million to Direct revenue measured at the month of each of the conversions, while reducing Wholesale revenue by $39.2 million (of which $5.1 million relates to the Unfavorable contracts liability amortization). For information related to the affiliate market conversions, see Note 7 (Unfavorable Contracts Liability) to the accompanying Consolidated and Combined Financial Statements included in Part II, Item 8., “Financial Statements and Supplementary Data” of this Annual Report on Form 10-K.
Also included in Retail Revenue – Direct is dealer websites and related digital solutions and digital marketing services, which grew 45% year over year or 25% on a pro forma basis, for the year ended December 31, 2019, as compared to the year ended December 31, 2018.
These increases were partially offset by a 5% decline in direct dealer customers from December 31, 2018.
Retail Revenue—National Advertising. National advertising revenue consists of display advertising and other solutions sold to OEMs, advertising agencies and automotive adjacencies. National advertising revenue represents 13.3% and 15.9% of total revenue for the years ended December 31, 2019 and 2018, respectively. National advertising revenue declined 23%, as OEMs reduced their full year 2019 upfront commitments, reduced their advertising budgets and shifted their spending to programmatic. Incremental sales to OEMs have been lower in volume and rate.
Wholesale Revenue. Wholesale revenue represents the fees we charge for marketplace and digital solutions sold to dealer customers by affiliates. The fees represent approximately 60% of the retail value for the same marketplace subscription advertising sold by our direct sales team. Wholesale revenue represents 5.7% and 12.5% of total revenue for the years ended December 31, 2019 and 2018, respectively. Wholesale revenue decreased 59%, primarily due to affiliate market conversions from Wholesale revenue ($39.2 million, which includes $5.1 million of Unfavorable contracts liability amortization) to Direct revenue ($52.5 million). Excluding the affiliate market conversions, Wholesale revenue was impacted by a 17% decline in affiliate dealer customers. As of October 1, 2019, we have successfully converted all affiliates to our direct control and going forward, we will no longer record Wholesale revenue. For information related to the affiliate market conversions, see Note 7 (Unfavorable Contracts Liability) to the accompanying Consolidated and Combined Financial Statements included in Part II, Item 8., “Financial Statements and Supplementary Data” of this Annual Report on Form 10-K.
Cost of revenue and operations. Cost of revenue and operations expense primarily consists of expensescosts related to our pay-per-leadprocessing dealer vehicle inventory, product fulfillment, pay per lead products third-partyand compensation costs for the product fulfillment and dealer vehicle inventory processing, and compensation costs.customer service teams. Cost of revenue and operations expense represents 16.4%17.6% and 13.7%18.3% of total revenue for the years ended December 31, 20192022 and 2018,2021, respectively. Cost of revenue and operations expense increased $9.1 million,at a slower pace than revenue, primarily due to higher compensation costs, partially offset by lower third-party costs and compensation, principally due to growth in dealer websites and related digital solutions and socialassociated with certain products driven by product offerings,mix.
which have an inherently higher cost of revenue.
Product and technology. The product team creates and manages consumer and dealer-facing innovation manages consumerand user experience and includes the costs associated with our editorial, SEO and data strategy teams.experience. The technology team develops and supports our products, websites and websites.mobile apps. Product and technology expense includes compensation costs, as well as license fees for vehicle specifications, search engine optimization, hardware/consulting costs, hardware and software maintenance, software licenses, data center and other infrastructure costs. Product and technology expense represents 10.4%13.6% and 12.4% of total revenue for the years ended December 31, 20192022 and 2018.2021, respectively. Product and technology expense decreased $5.9 million,increased, primarily due to cost efficiencies as a result ofcontinued investment in the Technology Transformation.business through our recent acquisitions, talent acquisition and retention, and other licenses and fees.
Marketing and sales. Marketing and sales expense primarily consists of traffic and lead acquisition costs (including search engine and other online marketing), TV and digital display/display, video advertising, and creative production, market research, trade events, and compensation costs and travel for the marketing, sales and sales support teams.teams, as well as bad debt expense related to the allowance for doubtful accounts. Marketing and sales expense represents 35.8%33.9% and 34.2%33.4% of total revenue for the years ended December 31, 20192022 and 2018,2021, respectively. Marketing and sales expense decreased $9.3 million,increased, primarily due to lower personnel-related costscontinued investment in marketing in 2022, including a return to in-person industry events that had been curtailed due to COVID-19, as a result of the Sales Transformation, partially offset by strategic marketing investments aimed at consumer acquisitions, consumer engagement and brand awareness.well as higher compensation costs.
General and administrative. General and administrative expense primarily consists of compensation costs for certain of the executive, finance, legal, human resources, facilities and other administrative employees. In addition, general and administrative expense includes office space rent, legal, and accounting services,and other professional services, as well astransaction-related costs, severance, transformation and other exit costs, costs associated with stockholder activist campaign, and transaction-related costs and costs related to the write-off and loss on assets, excluding the goodwill and intangible asset impairment discussed below.assets. General and administrative expense represents 12.2%10.3% and 11.0%11.8% of total revenue for the years ended December 31, 20192022 and 2018,2021, respectively. General and administrative expenses increased
$0.8 million and 1% versus the prior year. During the years ended December 31, 2019 and 2018, General and administrative expense included the following costs (in thousands):
|
| Year Ended December 31, |
| |||||
|
| 2019 |
|
| 2018 |
| ||
Severance, transformation and other exit costs |
| $ | 10,588 |
|
| $ | 5,771 |
|
Costs associated with stockholder activist campaign |
|
| 8,825 |
|
|
| 9,806 |
|
Transaction-related costs (1) |
|
| 5,582 |
|
|
| 13,182 |
|
Total |
| $ | 24,995 |
|
| $ | 28,759 |
|
|
|
Excluding these costs, General and administrative expense increased $4.6 million or 10%,decreased, primarily due to compensation.
Affiliate revenue share. Affiliate revenue share$9.6 million of compensation expense represents payments made to affiliates pursuant to our affiliate agreements and amortizationrecorded in 2021 recognized as part of the Unfavorable contracts liability related toupfront purchase consideration associated with the markets converted prior to the contractual date. Affiliate revenue share expense increased $5.3 million, primarily due toCreditIQ Acquisition. This was partially offset by an increase in payments to the affiliates due to an increase in the number of affiliate markets converted as well as a decrease in the amortization of the Unfavorable contract liability due to the liability becoming fully amortized on October 1, 2019. This amortization is recorded as a reduction of Affiliate revenue share expense, rather than Wholesale revenue for the markets that were converted early. During the years ended December 31, 2019professional fees and 2018, the impact of this amortization is the following (in thousands):
| Year Ended December 31, |
| |||||
| 2019 |
|
| 2018 |
| ||
Affiliate revenue share expense, gross | $ | 38,317 |
|
| $ | 34,231 |
|
Less: Amortization of the Unfavorable contracts liability |
| (17,527 | ) |
|
| (18,743 | ) |
Affiliate revenue share expense, as reported | $ | 20,790 |
|
| $ | 15,488 |
|
other transaction costs. For more information related to the affiliate market conversions,CreditIQ Acquisition, see Note 7 (Unfavorable Contracts Liability)3 (Business Combinations) to the accompanying Consolidated and Combined Financial Statements included in Part II, Item 8., “Financial Statements and Supplementary Data” of this Annual Report on Form 10-K.
Depreciation and amortization. Depreciation and amortization expense decreased, primarily due to certain assets being fully depreciated and amortized as compared to the prior year period, partially offset by depreciation and amortization on additional assets acquired.
Interest expense, net. Interest expense, net decreased by $3.4 million compared to the prior year period, primarily due to the maturity of the interest rate swap. For information related to our Term and Revolving Loans, senior unsecured notes and interest rate swap, see Note 7 (Debt) and Note 8 (Interest Rate Swap) to the accompanying Consolidated Financial Statements included in Part II, Item 8., “Financial Statements and Supplementary Data” of this Annual Report on Form 10-K.
Other expense, net. Other expense, net increased 13%primarily due to the change in the fair value of contingent consideration associated with the CreditIQ and Accu-Trade acquisitions. For more information related to contingent consideration, see Note 3 (Business Combinations) and Note 4 (Fair Value Measurements) to the accompanying Consolidated Financial Statements included in Part II, Item 8., “Financial Statements and Supplementary Data” of this Annual Report on Form 10-K.
Income tax expense (benefit). The effective income tax rate, expressed by calculating the income tax expense (benefit) as a percentage of Income before income tax, was 23.8% for the year ended December 31, 2022 and differed from the U.S. federal statutory rate of 21%, primarily due to the reduction of the useful lives of certain assets related to the Technology Transformation and the full year impact of the DI Acquisition.
Goodwillreturn to provision adjustments and intangible asset impairment. Asnondeductible executive compensation, partially offset by the tax benefits realized from a partial release of September 1, 2019, we determined thereour uncertain tax positions and the impact of nondeductible transaction expenses. The effective income tax rate was (13.8)% for the year ended December 31, 2021 and differed from the U.S. federal statutory rate of 21%, primarily due to the tax benefit realized from a triggering event, primarily causedpartial release of the valuation allowance, stock-based compensation and tax credits, partially offset by a sustained decreasethe impact of nondeductible transaction expenses, an increase in our stock price afteruncertain tax positions and the completionimpact of the strategic alternatives review process, and performed an interim quantitative impairment test. The results of the goodwill and indefinite-lived intangible asset impairment tests indicated that the carrying values exceeded the estimated fair values and thus, we recorded an impairment of $379.2 million and $82.3 million, respectively in the third quarter of 2019.nondeductible executive compensation. For information related to the impairment,income taxes, see Note 6 (Goodwill and Other Intangible Assets)14 (Income Taxes) to the accompanying Consolidated and Combined Financial Statements included in Part II, Item 8., “Financial Statements and Supplementary Data” of this Annual Report on Form 10-K.
26
InterestYear Ended December 31, 2021 Compared to Year Ended December 31, 2020
The comparison of the 2021 results with 2020 can be found under the heading “Year Ended December 31, 2021 Compared to Year Ended December 31, 2020” in “Part II, Item 7., Management’s Discussion and Analysis of Financial Condition and Results of Operations” section of our 2021 Form 10-K, which comparison is incorporated by reference herein.
During the first quarter of 2022, we identified a $30.8 million overstatement of the valuation allowance recorded against deferred tax assets that originated in 2020. In addition, we adjusted 2020 to reflect an immaterial income tax adjustment related to this same period. We have concluded that these items are not material to the previously issued Consolidated Financial Statements and have therefore corrected these prior period amounts as presented in the Consolidated Financial Statements for the year ended December 31, 2022. The line items impacted on the Consolidated Statements of Income (Loss) include Income tax expense net. In order to manage(benefit), Net income (loss) and Earnings (loss) per share. We have not included a full updated commentary on the risk associated with changes in interest rates on our borrowing under the Term Loan, we entered into an interest rate Swap (the “Swap”) effective December 31, 2018. Interestnew Income tax expense net increased, primarily due to additional interest expense associated with(benefit) since the higher fixed rateschange is not material. See Note 2 (Significant Accounting Policies) and the full year impact of interest relatedNote 14 (Income Taxes) to the borrowing utilized to fund the DI Acquisition. For information related to our Term and Revolving Loans and interest rate swap, see Note 8 (Debt) to the accompanying Consolidated and Combined Financial Statements included in Part II, Item 8., “Financial Statements and Supplementary Data” of this Annual Report on Form 10-K.
Income10-K for more information regarding the correction of certain amounts relating to previously issued financial statements and the corrected income tax (benefit) expense. The effectiveprovision reconciliation to the statutory federal income tax rate, expressedrespectively.
Liquidity and Capital Resources
Overview. Our primary sources of liquidity are cash flows from operations, available cash reserves and borrowing capacity available under our credit facilities. Our positive operating cash flow, along with our Revolving Loan described below, provide adequate liquidity to meet our business needs, including those for investments, debt service, share repurchases and strategic acquisitions. However, our ability to maintain adequate liquidity in the future is dependent upon a number of factors, including our revenue, our ability to contain costs, including capital expenditures, and to collect accounts receivable, and various other macroeconomic factors, many of which are beyond our direct control.
As discussed below, we are subject to certain financial and other covenants contained in our debt agreements, as amended, including by calculating the income tax (benefit) expensethird amendment to the Credit Agreement (the "Third Amendment"). For information related to the Credit Amendment, as a percentageamended, see Note 7 (Debt) in Part II, Item 8., “Financial Statements and Supplementary Data”, of Income (Loss) before income tax,this Annual Report on Form 10-K.
We may also seek to raise funds through debt or equity financing in the future to fund operations, significant investments or acquisitions that are consistent with our strategy. If we need to access the capital markets, there can be no assurance that financing may be available on attractive terms, if at all. As of December 31, 2022, Cash and cash equivalents were $31.7 million and including our undrawn Revolving Loan, our total liquidity was 6% for$246.7 million.
Indebtedness. As of December 31, 2022, the outstanding aggregate principal amount of our indebtedness was $481.3 million, at an effective interest rate of 6.4%, including $400.0 million of outstanding principal under the bonds, which carries an interest rate of 6.375%, $66.3 million of outstanding principal under the Term Loan which had an interest rate of 6.7% at December 31, 2022, and $15.0 million of outstanding principal under the Revolving Loan which had an interest rate of 6.4% at December 31, 2022.
During the year ended December 31, 20192022, we made $11.3 million in mandatory Term Loan payments, we borrowed $45.0 million on our Revolving Loan and differed fromwe repaid $30.0 million on our Revolving Loan. As of December 31, 2022, $215.0 million was available to borrow under the U.S. federal statutory rateRevolving Loan. Our borrowings are limited by our Senior Secured Leverage Ratio and Interest Coverage Ratio, calculated in accordance with our Credit Agreement, which were 0.4x and 5.7x as of 21%, primarily dueDecember 31, 2022, respectively. For further information, see Note 7 (Debt) to the impairment of goodwill. For information related to income taxes, see Note 14 (Income Taxes) to theaccompanying Consolidated and Combined Financial Statements included in Part II, Item 8., “Financial Statements and Supplementary Data” of this Annual Report on Form 10-K.
Year Ended December 31, 2018 Compared To Year Ended December 31, 2017
|
|
|
|
| Increase |
|
|
|
|
| ||||||
(In thousands, except percentages) |
| 2018 |
|
| 2017 |
|
| (Decrease) |
|
| % Change |
| ||||
Revenue: |
|
|
|
|
|
|
|
|
|
|
|
|
|
|
|
|
Direct |
| $ | 457,651 |
|
| $ | 333,248 |
|
| $ | 124,403 |
|
|
| 37 | % |
National advertising |
|
| 105,381 |
|
|
| 114,178 |
|
|
| (8,797 | ) |
|
| (8 | )% |
Other |
|
| 16,156 |
|
|
| 15,854 |
|
|
| 302 |
|
|
| 2 | % |
Retail |
|
| 579,188 |
|
|
| 463,280 |
|
|
| 115,908 |
|
|
| 25 | % |
Wholesale |
|
| 82,939 |
|
|
| 162,982 |
|
|
| (80,043 | ) |
|
| (49 | )% |
Total revenue |
|
| 662,127 |
|
|
| 626,262 |
|
|
| 35,865 |
|
|
| 6 | % |
Operating expenses: |
|
|
|
|
|
|
|
|
|
|
|
|
|
|
|
|
Cost of revenue and operations |
|
| 90,433 |
|
|
| 65,541 |
|
|
| 24,892 |
|
|
| 38 | % |
Product and technology |
|
| 68,789 |
|
|
| 74,162 |
|
|
| (5,373 | ) |
|
| (7 | )% |
Marketing and sales |
|
| 226,740 |
|
|
| 209,813 |
|
|
| 16,927 |
|
|
| 8 | % |
General and administrative |
|
| 72,943 |
|
|
| 44,903 |
|
|
| 28,040 |
|
|
| 62 | % |
Affiliate revenue share |
|
| 15,488 |
|
|
| 8,948 |
|
|
| 6,540 |
|
|
| 73 | % |
Depreciation and amortization |
|
| 103,810 |
|
|
| 88,639 |
|
|
| 15,171 |
|
|
| 17 | % |
Total operating expenses |
|
| 578,203 |
|
|
| 492,006 |
|
|
| 86,197 |
|
|
| 18 | % |
Operating income |
|
| 83,924 |
|
|
| 134,256 |
|
|
| (50,332 | ) |
|
| (37 | )% |
Nonoperating (expense) income: |
|
|
|
|
|
|
|
|
|
|
|
|
|
|
|
|
Interest expense, net |
|
| (27,717 | ) |
|
| (12,371 | ) |
|
| (15,346 | ) |
| *** |
| |
Other income, net |
|
| 722 |
|
|
| 277 |
|
|
| 445 |
|
|
| 161 | % |
Total nonoperating expense, net |
|
| (26,995 | ) |
|
| (12,094 | ) |
|
| (14,901 | ) |
| *** |
| |
Income before income taxes |
|
| 56,929 |
|
|
| 122,162 |
|
|
| (65,233 | ) |
|
| (53 | )% |
Income tax expense (benefit) |
|
| 18,120 |
|
|
| (102,281 | ) |
|
| 120,401 |
|
| *** |
| |
Net income |
| $ | 38,809 |
|
| $ | 224,443 |
|
| $ | (185,634 | ) |
|
| (83 | )% |
***Not meaningful
Retail Revenue—Direct. Direct revenue grew by $124.4 million, or 37%, compared to the prior year. The addition of Dealer Inspire’s business since the date of the DI Acquisition contributed $53.1 million to the Direct revenue increase. Excluding Dealer Inspire, Direct revenue grew $71.3 million, or 21%, from 2017 to 2018 driven by an 11% increase in dealer customers and a 6% increase in ARPD. The affiliate market conversions contributed $88.9 million to Direct revenue measured at the time of each of the conversions, while reducing Wholesale revenue by $78.8 million (of which $18.7 million relates to the Unfavorable contracts liability amortization). Excluding Dealer Inspire and affiliate market conversions, Direct revenue declined $16.5 million, primarily due to a 10% decline in Dealer customers.
Retail Revenue—National Advertising. National advertising revenue decreased 8% from 2017 to 2018, as OEMs reduced their spending mostly due to the cyclical nature of the auto industry. The majority of the decline relates to reductions by three OEM customers.
Wholesale Revenue. Wholesale revenue decreased primarily due to the affiliate market conversions from Wholesale revenue ($78.8 million, which includes $18.7 million of unfavorable contracts liability amortization) to Direct revenue ($88.9 million). Excluding the affiliate market conversions, Wholesale revenue declined due to a 13% decline in Dealer customers.
Cost of revenue and operations.Cost of revenue and operations expense represents 13.7% and 10.5% of total revenue for the years ended December 31, 2018 and 2017, respectively. The addition of Dealer Inspire’s business contributed $22.2 million to the overall increase. Excluding Dealer Inspire, Cost of revenue and operations expense increased $2.7 million, primarily due to higher third-party costs related to new product offerings, partially offset by reduced compensation costs associated with lower headcount.
Product and technology. Product and technology expense represents 10.4% and 11.8% of total revenue for the years ended December 31, 2018 and 2017, respectively. Product and technology expense decreased $5.4 million, primarily due to reduced compensation costs associated with lower headcount and lower third-party costs, partially offset by the addition of Dealer Inspire’s business.
Marketing and sales.Marketing and sales expense represents 34.2% and 33.5% of total revenue for the years ended December 31, 2018 and 2017, respectively. The addition of Dealer Inspire’s business contributed $13.6 million to the overall increase, as we expanded our salesforce to support our new product offerings and the additional affiliate markets. Excluding Dealer Inspire,
Marketing and sales expense increased $3.3 million, primarily due to planned strategic marketing investments aimed at consumer acquisition, consumer engagement, brand awareness amongst auto shopping audiences and search engine optimization. Sales compensation costs decreased despite serving approximately 3,500 incremental dealer customers from converted markets.
General and administrative. General and administrative expense increased $28.0 million and 62%, primarily due to $9.8 million in consulting services and other costs incurred as part of our settlement agreement with our stockholder activist; $7.6 million in incremental transaction costs, primarily related to the DI Acquisition and the process to explore strategic alternatives to enhance stockholder value; $6.8 million in incremental stock-based compensation and $3.8 million in costs associated with the Separation of certain employees.
Affiliate revenue share. Affiliate revenue share expense increased 73%, primarily due to an increase in costs associated with the early conversions of the McClatchy, tronc and Washington Post markets, partially offset by amortization of the Unfavorable contracts liability.
Depreciation and amortization. Depreciation and amortization expense increased 17%, primarily due to the incremental amortization expense related to the DI Acquisition.
Interest expense, net. Interest expense, net increased due to interest associated with the Credit Agreement principally utilized to fund the Separation and the DI Acquisition. Prior to the Separation, the Company had no debt. For additional information, see Note 8 (Debt) to the Consolidated and Combined Financial Statements included in Part II, Item 8., “Financial Statements and Supplementary Data” of this Annual Report on Form 10-K.
Income tax expense (benefit).Effective with the Separation in May 2017, we established a corporate legal entity structure that is subject to U.S. federal corporate income tax on a stand-alone basis post-Separation. The effective income tax rate, expressed by calculating the income tax expense as a percentage of Income before income taxes, was 31.8% for the year ended December 31, 2018 and differed from the U.S. federal statutory rate of 21%, primarily due to changes in apportionment factors upon the finalization of the post-Spin 2017 state tax returns in the fourth quarter of 2018. The income tax benefit for the year ended December 31, 2017 is based upon seven months of Cars.com, LLC information and twelve months of DealerRater information. For information related to income taxes, see Note 14 (Income Taxes) to the Consolidated and Combined Financial Statements included in Part II, Item 8., “Financial Statements and Supplementary Data” of this Annual Report on Form 10-K.
Liquidity and Capital Resources
Overview. Our primary sources of liquidity are cash flows from operations, available cash reserves and debt capacity available under our credit facilities. Our operations have generated positive operating cash flows in 2019 and 2018 which, along with our Term and Revolving Loans described below, provides adequate liquidity to meet our business needs, including those for investments and strategic acquisitions. In addition, we may raise additional funds through other public or private debt or equity financings. See Part I, Item 1A., “Risk Factors” of this Annual Report on Form 10-K.
Affiliate Agreements. As of October 1, 2019, we have successfully converted all affiliates to our direct control. We amended five of our affiliate agreements (Gannett, the McClatchy Company (“McClatchy”), TEGNA, tronc, Inc. (“tronc”), and the Washington Post). The Belo affiliate agreement expired on October 1, 2019. We now have a direct relationship with all dealer customers and recognize the revenue associated with converted dealers as Retail revenue, rather than Wholesale revenue, in the Consolidated and Combined Statements of (Loss) Income. Beginning July 2020, upon the expiration of the affiliate agreements, we will realize incremental Free Cash Flow, as we will no longer be required to make any further payments to the affiliates under these agreements.
Term Loan and Revolving Loan. As of December 31, 2019, the outstanding principal amount was $648.1 million, at an effective interest rate of 4.2%, including $388.1 million of outstanding principal under the Term Loan, with an effective interest rate of 4.5%, including the impact of the interest rate swap, and outstanding borrowings under the Revolving Loan of $260.0 million, at an effective interest rate of 3.7%. During the year ended December 31, 2019, we made $28.1 million in mandatory Term Loan payments and $20.0 million in voluntary Revolving Loan payments, net of borrowings. As of December 31, 2019, $190.0 million was available to borrow under the Revolving Loan. Our borrowings are limited by our total net leverage ratio, which is calculated in accordance with our Credit Agreement, and was 3.8x as of December 31, 2019. The Credit Agreement requires a total maximum total net leverage of 4.5x with incremental step downs through the maturities of the Term Loan and the Revolving Loan on May 31, 2022. For further information, see Note 8 (Debt) to the accompanying Consolidated and Combined Financial Statements included in Part II, Item 8., “Financial Statements and Supplementary Data” of this Annual Report on Form 10-K.
Interest Rate Swap. The interest rate on borrowings under our Term Loan and Revolving Loan is floating and, therefore, subject to fluctuations. As a result, 53.7% of our interest rates are variable as of December 31, 2019. Under the terms of the Swap, we are locked into a fixed rate of interest of 2.96% plus an applicable margin, as defined in our Credit Agreement, on a notional amount of $300
million. As of December 31, 2019, the fair value of the Swap was an unrealized loss of $10.2 million. The Swap is designated as a cash flow hedge of interest rate risk and recorded at fair value in Other accrued liabilities and Other noncurrent liabilities on the Consolidated Balance Sheets. Any gains or losses, net of tax on the Swap are reported as a component of Accumulated other comprehensive loss until reclassed to Interest expense, net in the same period the hedge transaction impacts earnings. For further information, see “Derivative Financial Instrument” under Note 2 (Significant Accounting Polices) to the accompanying Consolidated and Combined Financial Statements included in Part II, Item 8., “Financial Statements and Supplementary Data” of this Annual Report on Form 10-K.
Share Repurchase Program. In March 2018,February 2022, our Board of Directors authorized a three-year share repurchase program to acquire up to $200 million of our common stock over a two-year period.stock. We may repurchase shares from time to time in open market transactions or through privately negotiated transactions in accordance with applicable federal securities laws. The timinglaws and amounts of any purchases underother applicable legal requirements, and subject to our blackout periods. We intend to fund the share repurchase program will be based on market conditions and other factors including price. The repurchase program does not require the purchase of any minimum number of shares and may be suspended, modified or discontinued at any time without prior notice.with cash from operations. During the yearsyear ended December 31, 2019 and 2018,2022, we repurchased and subsequently retired 1.74.2 million shares for $40.0$49.0 million and 3.8 million shares for $97.2 million, respectively.at an average price per share of $11.75.
Contingent Consideration. The fair value as of December 31, 2022 for the contingent consideration related to the CIQ and Accu-Trade Acquisitions was $55.9 million. Within the next twelve months, we expect to pay $10.0 million of the potential contingent consideration amounts discussed below.
As part of the Accu-Trade Acquisition, we may be required to pay additional consideration to the former owners based on achievement of an earnings-related metric. For the Accu-Trade contingent consideration, we have the option to pay consideration in cash or certain
27
amounts in stock, which may result in a variable number of shares being issued. The actual amount to be paid will be based on the acquired business’ future performance to be attained over a three-year performance period through February 2025.
As part of the CIQ Acquisition, we may be required to pay additional cash consideration to the former owners based on two earn-out achievement objectives, including an earnings-related metric and lender market share. The actual amount to be paid will be based on the acquired business’ future performance to be attained over a three-year performance period through December 2024. For information related to the contingent consideration, see Note 3 (Business Combination) and Note 4 (Fair Value Measurements) in Part II, Item 8., “Financial Statements and Supplementary Data”, of this Annual Report on Form 10-K.
Cash Flows. Details of our cash flows are as follows (in thousands):
|
| Year Ended December 31, |
|
|
|
|
|
| Year Ended December 31, |
|
|
|
| |||||||||||
|
| 2019 |
|
| 2018 |
|
| Change |
|
| 2022 |
|
| 2021 |
|
| Change |
| ||||||
Net cash provided by (used in): |
|
|
|
|
|
|
|
|
|
|
|
|
|
|
|
|
|
|
| |||||
Operating activities |
| $ | 101,484 |
|
| $ | 163,548 |
|
| $ | (62,064 | ) |
| $ | 128,511 |
|
| $ | 138,003 |
|
| $ | (9,492 | ) |
Investing activities |
|
| (21,856 | ) |
|
| (171,375 | ) |
|
| 149,519 |
|
|
| (84,377 | ) |
|
| (39,450 | ) |
|
| (44,927 | ) |
Financing activities |
|
| (91,542 | ) |
|
| 12,727 |
|
|
| (104,269 | ) |
|
| (51,488 | ) |
|
| (127,203 | ) |
|
| 75,715 |
|
Net change in cash and cash equivalents |
| $ | (11,914 | ) |
| $ | 4,900 |
|
| $ | (16,814 | ) |
| $ | (7,354 | ) |
| $ | (28,650 | ) |
| $ | 21,296 |
|
Operating Activities. The decrease in cash provided by operating activities was primarily related to the reduction of net income, excluding the impact of non-cash items, partially offset by changes in operating assets and liabilities. In addition, the net loss forliabilities, including fluctuations in working capital during the year ended December 31, 20192022, principallythe receipt of a $9.1 million tax refund related to the carryback of federal and state income tax net operating loss as a result of the net income forCARES Act during the year ended December 31, 2018 was impacted by the following costs (in thousands):2021.
|
| Year Ended December 31, |
| |||||
|
| 2019 |
|
| 2018 |
| ||
Severance, transformation and other exit costs |
| $ | 10,588 |
|
| $ | 5,771 |
|
Costs associated with stockholder activist campaign |
|
| 8,825 |
|
|
| 9,806 |
|
Transaction-related costs (1) |
|
| 5,582 |
|
|
| 13,182 |
|
Total |
| $ | 24,995 |
|
| $ | 28,759 |
|
|
|
Investing Activities. The decrease in cash used in investing activities isin 2022 was primarily duerelated to the DIAccu-Trade Acquisition and purchases of property and equipment. The cash used in February 2018, partially offset by an increaseinvesting activities in 2021 was primarily related to the CIQ Acquisition and purchases of property and equipment.
Financing Activities. During the year ended December 31, 2019,2022, cash used in financing activities iswas primarily related to $48.1repurchases of common stock and payments on our long-term debt, partially offset by $45.0 million of loan repayments, net ofproceeds from Revolving Loan borrowings of which $30.0 million was voluntarily paid and $40.0 million in share repurchase.related to the Accu-Trade Acquisition. During the year ended December 31, 2018,2021, cash provided byused in financing activities iswas primarily due to net revolving loan borrowings of $135.0 million, principally related to the DI Acquisition in February 2018, partially offset by $97.2$120.0 million in share repurchases.of debt repayments, of which $110.0 million were voluntary pre-payments. For further information related to our debt and repurchases of our common stock, see Note 87 (Debt) and Note 11 (Stockholders' Equity) to the accompanying Consolidated and Combined Financial Statements included in Part II, Item 8., “Financial Statements and Supplementary Data” of this Annual Report on Form 10-K.
Contractual Obligations. As of December 31, 2019,2022, we had the following obligations and commitments to make future payments under contracts, contractual obligations and commercial commitments (in thousands):
|
|
|
|
| Payments due by Period |
| ||||||||||||||||||||||
Contractual Obligations |
| Total |
|
| 2023 |
|
| 2024 |
|
| 2025 |
|
| 2026 |
|
| 2027 |
|
| Thereafter |
| |||||||
Long-term debt (1) |
| $ | 481,250 |
|
| $ | 16,250 |
|
| $ | 20,000 |
|
| $ | 45,000 |
|
| $ | — |
|
| $ | — |
|
| $ | 400,000 |
|
Interest on debt (2) |
|
| 164,767 |
|
|
| 31,246 |
|
|
| 30,059 |
|
|
| 26,962 |
|
|
| 25,500 |
|
|
| 25,500 |
|
|
| 25,500 |
|
Operating leases |
|
| 39,191 |
|
|
| 4,042 |
|
|
| 4,154 |
|
|
| 4,570 |
|
|
| 4,684 |
|
|
| 3,991 |
|
|
| 17,750 |
|
Other obligations (3) |
|
| 26,619 |
|
|
| 13,952 |
|
|
| 10,780 |
|
|
| 1,887 |
|
|
| — |
|
|
| — |
|
|
| — |
|
Total |
| $ | 711,827 |
|
| $ | 65,490 |
|
| $ | 64,993 |
|
| $ | 78,419 |
|
| $ | 30,184 |
|
| $ | 29,491 |
|
| $ | 443,250 |
|
28
|
|
|
|
|
| Payments due by Period |
| |||||||||||||||||||||
Contractual Obligations |
| Total |
|
| 2020 |
|
| 2021 |
|
| 2022 |
|
| 2023 |
|
| 2024 |
|
| Thereafter |
| |||||||
Operating leases (1) |
| $ | 51,100 |
|
| $ | 4,368 |
|
| $ | 4,013 |
|
| $ | 3,751 |
|
| $ | 3,850 |
|
| $ | 4,122 |
|
| $ | 30,996 |
|
Long-term debt (2) |
|
| 648,125 |
|
|
| 33,750 |
|
|
| 39,375 |
|
|
| 575,000 |
|
|
| — |
|
|
| — |
|
|
| — |
|
Interest on debt (3) |
|
| 64,002 |
|
|
| 27,479 |
|
|
| 26,157 |
|
|
| 10,366 |
|
|
| — |
|
|
| — |
|
|
| — |
|
Other obligations (4) |
|
| 9,054 |
|
|
| 6,954 |
|
|
| 2,100 |
|
|
| — |
|
|
| — |
|
|
| — |
|
|
| — |
|
Total |
| $ | 772,281 |
|
| $ | 72,551 |
|
| $ | 71,645 |
|
| $ | 589,117 |
|
| $ | 3,850 |
|
| $ | 4,122 |
|
| $ | 30,996 |
|
|
|
|
|
|
|
|
|
Commitments and Contingencies. For further information, see Note 10 (Commitments and Contingencies) to the accompanying Consolidated and Combined Financial Statements included in Part II, Item 8., “Financial Statements and Supplementary Data” of this Annual Report on Form 10-K.
Off-Balance Sheet Arrangements. We do not have any material off-balance sheet arrangements.
Critical Accounting Policies and Estimates. The preparation of financial statements in conformity with accounting principles generally accepted in the United States of America requires management to make estimates and assumptions about future events that affect the amounts reported in the financial statements and accompanying notes. Actual results could differ significantly from those estimates. We believe the following discussion addresses our most critical accounting policies, which are those that are important to the presentation of our financial condition and results of operations and require management’s most subjective and complex judgments.
Revenue Recognition. We account for a customer arrangement when we and the customer have an approved contract that specifies the rights and obligations of each party and the payment terms, and we believe it is probable we will collect substantially all of the consideration to which we will be entitled in exchange for the services that will be provided to the customer. We periodically enter into arrangements that include multiple promises that we evaluate to determine whether the promises are separate performance obligations. We identify performance obligations based on services to be transferred to a customer that are distinct within the context of the contractual terms. We allocate the contractual transaction price to each distinct performance obligation and recognize revenue when it satisfies a performance obligation by providing a service to a customer. Revenue is primarily generated through our direct sales force (Retail revenue) and affiliate sales channels (Wholesale revenue).force.
Marketplace Subscription Advertising Revenue. Our primary source of Retail revenue and Wholesale revenue areis through the sale of marketplace subscription advertising packages to dealer customers through varying levels of subscription packages.customers. Our subscription packages provide theallow dealer customer’s availablecustomers and OEMs to showcase their new and used vehicle inventory to in-market shoppers on the Cars.com website. The subscription packages are generally a fixed price arrangement with avarying contract termterms, typically ranging from three to six months, that isare automatically renewed, typically on a month-to monthmonth-to-month basis. We recognize subscription package revenue ratably as the service is provided over the contract term. Marketplace subscription advertising and services revenue is recorded in Retail revenue and WholesaleDealer revenue in the Consolidated and Combined Statements of Income (Loss) Income..
We also offer our customers several add-on products to the subscription packages.packages, as well as FUEL. Add-on products include premium advertising products that can be uniquely tailored to an individual dealer customer’s current needs. Substantially all of our add-on products, as well as FUEL, are not sold separately from the subscription packages as the customer cannot benefit from add-on products on their own. Therefore, the subscription packages and add-on products are combined as a single performance obligation, and we recognize the related revenue ratably as the services are provided over the contract term.
We also provide services, including hosting related to flexible, custom designedcustom-designed website platforms supporting highly personalized digital marketing campaigns, digital retailing and messaging platform products. In addition, we also provide dealers with vehicle valuation and appraisal services through Accu-Trade. We recognize revenue related to these services ratably as the service is provided over the contract term. The related revenue is recorded in RetailDealer revenue in the Consolidated and Combined Statements of Income (Loss) Income..
Prior to October 2019, our affiliates also sold marketplace subscription advertising to dealer customers, and we earned Wholesale revenue through our affiliate agreements. Affiliates were assigned certain sales territories in which they sold our products. Under these agreements, we charged the affiliates 60% of the corresponding Cars.com retail rate for products sold to affiliate dealer customers. We recognized Wholesale revenue ratably as the service is provided over the contract term. In situations where our direct sales force sold our products within an affiliate’s assigned territory, we paid the affiliate a revenue share which was classified as Affiliate revenue share in the Consolidated and Combined Statements of (Loss) Income. Wholesale revenue also includes the amortization of the Unfavorable contracts liability. For information related to the Unfavorable contracts liability, see Note 7 (Unfavorable Contracts Liability) to the accompanying Consolidated and Combined Financial Statements included in Part II, Item 8., “Financial Statements and Supplementary Data” of this Annual Report on Form 10-K.
Display Advertising Products and Services Revenue. We also earn revenue through the sale of display advertising on our website to dealers, OEMs and other national advertisers, pursuant to transaction-based contracts, which are billed for impressions delivered or click-throughs on their advertisements. An impression is the display of an advertisement to an end-user on the website and is a measure of volume. A click-through occurs when an end-user clicks on an impression. We recognize revenue as the impressions or click-throughs are delivered. If the impressions or click-throughs delivered are less than the amount invoiced to the customer, the difference is recorded as deferred revenue and recognized as revenue when earned. We recognize revenue related to these services at the point in time the service is provided. Display advertising products revenue sold to OEMs and national advertisers is recorded in OEM and National revenue in the Consolidated Statements of Income (Loss). We also provide services related to customized digital marketing and customer acquisition services, including paid, organic, social and creative services to dealer customers. We recognize revenue related to these services at the point in time the service is provided. Display advertising products revenue sold to dealer customersdealers is recorded in RetailDealer revenue in the Consolidated and Combined Statements of Income (Loss) Income..
Pay Per Lead Revenue. We also sell leads, which are connections from consumers to dealer customers in the form of phone calls, emails and text messages, to dealer customers, OEMs and third-party resellers. We recognize pay per lead revenue primarily on a per-lead basis at the point in time in which the lead has been delivered. Revenue related to pay per lead is recorded in RetailDealer revenue, OEM and WholesaleNational revenue or Other revenue, depending on the customer who is purchasing this product, in the Consolidated and Combined Statements of Income (Loss) Income..
Other Revenue. Other revenue primarily includes revenue related to vehicle listing data sold to third-parties and peer-to-peer vehicle advertising.third parties. We recognize other revenue either ratably as the services are provided or at the point in time the services have been performed. In connection with the Accu-Trade
29
Acquisition, the Company entered into an agreement to provide one of the former owners with a one-year license to a certain product. The recognition of revenue associated with the license fee is recorded in Other revenue. Other revenue is recorded in RetailOther revenue in the Consolidated and Combined Statements of Income (Loss) Income..
Goodwill. Goodwill representsBusiness Combinations.
Intangible Assets. Intangible assets are recorded at their estimated fair value at the date of acquisition. The fair values assigned to the intangible assets acquired were determined based on management’s estimates and assumptions, as well as other information compiled by management, including third-party valuations that utilize customary valuation procedures and techniques, such as the multi-period excess earnings and the relief of acquisition costroyalty methods. These preliminary fair values are subject to change within the one-year measurement period. We amortize intangible assets over their estimated useful lives on a straight-line basis. Amortization is recorded over the fair valuerelevant estimated useful lives ranging from five to ten years.
We evaluate the useful lives of these assets acquired, including identifiable intangible assets, net of liabilities assumed. Goodwill is tested for impairment on at least an annual basis or between annual tests if events occur or circumstances change that would more likely than not reduce the fair value of a reporting unit below its carrying amount. Our goodwill is testedand test for impairment at a level referred to as the reporting unit. The level at which we test goodwill for impairment requires us to determine whether the operations below the business segment level constitute a business for which discrete financial information is available and segment management regularly reviews the operating results. We have determinedwhenever events or changes in circumstances occur that CARS operates as a single reporting unit.
The process of estimating the fair value of goodwill is subjective and requires us to make estimates that may significantlycould impact the outcomerecoverability of these assets. If the analysis. A qualitative assessmentestimate of an intangible asset’s remaining useful life is performed at least annually and considers events and circumstances such as macroeconomic conditions, industry and market conditions, cost factors and overall financial performance, as well as company specifications. If after performing this assessment,changed, we conclude it is more likely than not thatamortize the fairremaining carrying value of the reporting unit is less than its carrying amount, then we performintangible asset prospectively over the quantitative test.
Under the quantitative test, a goodwillrevised remaining useful life. If an impairment is identified, by comparing the fair value of the reporting unit to the carrying amount, including goodwill. If the carrying amount of the reporting unit exceeds the fair value of the reporting unit, goodwill is considered impaired and an impairment charge is recognized in an amount equal to the excess, not to exceed the carrying amount of goodwill.
We estimated the fair value of the reporting unit with an income approach using the discounted cash flow (“DCF”) analysis and we also considered a market-based valuation methodology using comparable public company trading values. Determining fair value requires the exercise of significant judgments, including the amount and timing of expected future cash flows, long-term growth rates, the discount rate and relevant comparable public company earnings multiples. The cash flows employed in the DCF analysis are based on our best estimate of future sales, earnings and cash flows after considering factors such as general market conditions and recent operating performance. The discount rate utilized in the DCF analysis is based on the reporting unit’s weighted-average cost of
capital, which takes into account the relative weights of each component of capital structure (equity and debt) and represents the expected cost of new capital, adjusted as appropriate to consider the risk inherent in future cash flows of our reporting unit.
Impairment assessment inherently involves management judgments regarding a number of assumptions described above. The reporting unit fair value also depends on the future strength of the U.S. economy. New and developing competition as well as technological change could also adversely affect future fair value estimates. Due to the many variables inherent in the estimation of a reporting unit’s fair value and the relative size of our recorded goodwill, differences in assumptions could have a material effect on the estimated fair values.
For information related to the goodwill impairment recorded during the year ended December 31, 2019, see Note 6 (Goodwill and Other Intangible Assets) to the accompanying Consolidated and Combined Financial Statements included in Part II, Item 8., “Financial Statements and Supplementary Data” of this Annual Report on Form 10-K.
Indefinite-Lived Intangible Asset. In connection with our acquisition by TEGNA, we recorded an intangible asset with an indefinite life associated with the Cars.com trade name. The indefinite-lived intangible asset is tested annually, or more often if circumstances dictate, for impairment and is written down to fair value as required.
CreditIQ Contingent Consideration.As part of the CIQ Acquisition, we may be required to pay up to an additional $50.0 million in cash consideration to the former owners based on two different earn-out achievement objectives, including an earnings-related metric and lender market share. The estimate ofactual amount to be paid will be based on the acquired business’s future performance to be attained over a three-year performance period. The contingent consideration is classified as Level 3 in the fair value hierarchy and the fair value is determined usingmeasured based on a Monte Carlo simulation or a scenario-based method, depending on the “relief from royalty” methodology, which is a variationearn-out achievement objective, utilizing projections about future performance. Significant inputs include volatility and projected financial information.
Accu-Trade Contingent Consideration.As part of the income approach. The discount rate assumption isAccu-Trade Acquisition, we may be required to pay additional consideration to the former owners based on achievement of an assessmentearnings-related metric. We have the option to pay consideration in cash or certain amounts in stock, which would result in a variable number of shares being issued. The amount to be paid will be determined by the risk inherentacquired business’ future performance to be attained over a three-year performance period; based on certain tiered performance metrics the maximum amount to be paid is $63.0 million, with additional upside for performance that exceeds the tiered performance metrics. The contingent consideration is classified as Level 3 in the fair value hierarchy and the fair value is measured based on a Monte Carlo simulation. Significant inputs include volatility and projected future cash flows generated by the trade name intangible asset.financial information.
For information related
Contingent Consideration. Our contingent consideration obligations are from arrangements resulting from acquisitions that involve potential future payment of consideration that is contingent upon the achievement of certain financial metrics or lender market share. Contingent consideration is recognized at its estimated fair value at the date of acquisition based on our expected future payment, discounted using accepted valuation methodologies.
We review and re-assess the estimated fair value of contingent consideration liabilities at each reporting period and the updated fair value could differ materially from the initial estimates. We measure contingent consideration recognized in connection with acquisitions at fair value on a recurring basis using significant unobservable inputs classified as Level 3 inputs. The fair value is measured based on a Monte Carlo simulation or a scenario-based method, depending on the earnout objective. The fair value measurement includes the following significant inputs: volatility and projected financial information. Significant increases or decreases to the intangible asset impairment recorded during the year ended December 31, 2019, see Note 6 (Goodwill and Other Intangible Assets) to the accompanying Consolidated and Combined Financial Statements included in Part II, Item 8., “Financial Statements and Supplementary Data” of this Annual Report on Form 10-K.
Definite Lived Amortizable Intangible Assets. Our amortizable intangible assets consist mainly of customer relationships and acquired software. These asset values are amortized systematically over their estimated useful lives. An impairment testany of these assets would be triggered if the undiscounted cash flows from the related asset group (business unit) were to be less than the asset carrying value. Changesinputs in circumstances, such as technological advances or changes to our business model or capital strategy,isolation could result in actual useful lives differing from our estimates. If an impairment indicator is present, we review our amortizable intangible assets for potential impairment ata significantly higher or lower liability. Ultimately, the asset group level by comparingliability will be equivalent to the carryingamount paid, and the difference between the fair value of such assets withestimate on the expected undiscounted cash flows toacquisition date and each reporting period and the amount paid will be generated by the asset group.recognized in earnings.
Recent Accounting Pronouncements. For information related toThere are no recent accounting pronouncements see Note 3 (Recent Accounting Pronouncements) to the Consolidated and Combined Financial Statements included in Part II, Item 8., “Financial Statements and Supplementary Data”that materially impact our financial statements as of this Annual Report on Form 10-K.December 31, 2022.
30
Item 7A. Quantitative and Qualitative Disclosures About Market Risk. Market risk represents the risk of loss that may affect our financial position due to adverse changes in financial market prices and rates. We are exposed to market risks related to changes in interest rates and foreign currency exchange risk.
Interest Rate Risk. The interest rate on borrowings under our Term Loan and Revolving LoanCredit Facility is floating and, therefore, subject to fluctuations. In order to manageAs of December 31, 2022, the risk associated with changes inoutstanding aggregate principal amount of our indebtedness was $481.3 million, at an effective interest rates on our borrowingrate of 6.4%, including $400.0 million of outstanding principal under the bonds, which carries a fixed interest rate of 6.375%, $66.3 million of outstanding principal under the Term Loan we entered intowhich carried an interest rate swap (the “Swap”) effective December 31, 2018. As a result, 53.7% of our interest rates are fixed as of December 31, 2019. Under the terms of the Swap, we are locked into a fixed rate of interest of 2.96% plus an applicable margin, as defined in the Credit Agreement, on a notional amount of $300 million. As of December 31, 2019, the fair value of the Swap was an unrealized loss of $10.2 million. The Swap is designated as a cash flow hedge of interest rate risk and recorded at fair value in Other accrued liabilities and Other noncurrent liabilities on the Consolidated Balance Sheets. Any gains or losses on the Swap will be reported as a component of Accumulated other comprehensive loss until reclassed to Interest expense, net in the same period the hedge transaction impacts earnings. Based on the value of our unhedged indebtedness6.7% at December 31, 2019, a 100 basis point increase in2022, and $15.0 million of outstanding principal under the Revolving Loan which carried an interest rates would result in a corresponding increase in our interest expenserate of $6.5 million annually.6.4% at December 31, 2022.
Foreign Currency Exchange Risk. Historically, as our operations and sales have been primarily in the United States, we have not faced any significant foreign currency risk. With the acquisitions of DealerRater in August 2016, and Dealer Inspire in February 2018 and Accu-Trade in March 2022, we acquired a limited number of Canadian dealer customers, some of which are billed in Canadian dollars. Any foreign currency exchange rate fluctuations have been and are anticipated to be immaterial. If we plan for additional international expansion, our risks associated with fluctuation in currency rates will become greater, and we will continue to reassess our approach to managing this risk.
Item 8. Financial Statements and Supplementary Data.
Report of Independent Registered Public Accounting Firm
To the Stockholders and the Board of Directors of Cars.com Inc.
Opinion on the Financial Statements
We have audited the accompanying Consolidated Balance Sheets of Cars.com Inc. (the Company) as of December 31, 20192022 and 2018,2021, the related Consolidated and Combined Statements of (Loss) Income (Loss), Comprehensive Income (Loss) Income,, Stockholders’ Equity and Cash Flows for each of the three years in the period ended December 31, 2019,2022, and the related notes and financial statement schedule listed in the indexIndex at Item 15(a)(2) (collectively referred to as the “Consolidated and Combined Financial Statements”). In our opinion, the Consolidated and Combined Financial Statements present fairly, in all material respects, the financial position of the Company at December 31, 20192022 and 2018,2021, and the results of its operations and its cash flows for each of the three years in the period ended December 31, 2019,2022, in conformity with U.S. generally accepted accounting principles.
We also have audited, in accordance with the standards of the Public Company Accounting Oversight Board (United States) (PCAOB), the Company’s internal control over financial reporting as of December 31, 2019,2022, based on criteria established in Internal Control – Integrated Framework issued by the Committee of Sponsoring Organizations of the Treadway Commission (2013 framework) and our report dated February 26, 202023, 2023 expressed an unqualified opinion thereon.
Basis for Opinion
These financial statements are the responsibility of the Company’s management. Our responsibility is to express an opinion on the Company’s financial statements based on our audits. We are a public accounting firm registered with the PCAOB and are required to be independent with respect to the Company in accordance with the U.S. federal securities laws and the applicable rules and regulations of the Securities and Exchange Commission and the PCAOB.
We conducted our audits in accordance with the standards of the PCAOB. Those standards require that we plan and perform the audit to obtain reasonable assurance about whether the financial statements are free of material misstatement, whether due to error or fraud. Our audits included performing procedures to assess the risks of material misstatement of the financial statements, whether due to error or fraud, and performing procedures that respond to those risks. Such procedures include examining, on a test basis, evidence regarding the amounts and disclosures in the financial statements. Our audits also included evaluating the accounting principles used and significant estimates made by management, as well as evaluating the overall presentation of the financial statements. We believe that our audits provide a reasonable basis for our opinion.
Critical Audit Matters
31
The critical audit matters communicated below are matters arising from the current period audit of the Consolidated Financial Statements that were communicated or required to be communicated to the audit committee and that: (1) relate to accounts or disclosures that are material to the Consolidated Financial Statements and (2) involved our especially challenging, subjective or complex judgments. The communication of the critical audit matters does not alter in any way our opinion on the Consolidated and Combined Financial Statements, taken as a whole, and we are not, by communicating the critical audit matters below, providing separate opinions on the critical audit matters or on the accounts or disclosures to which they relate.
|
Description of the Matter |
Auditing the Company’s | |
How We Addressed the Matter in Our Audit | We obtained an understanding, evaluated the design and tested the operating effectiveness of controls over the Company’s To test the |
| ||
Description of the Matter |
Auditing the | |
How We Addressed the Matter in Our Audit | We obtained an understanding, evaluated the design and tested the operating effectiveness of controls over the Company’s
|
32
management in determining its assumptions and, where necessary, included an evaluation of available information that either corroborated or |
Valuation of Contingent Consideration | ||
Description of the Matter | As described in Note 2 and Note 4 to the Consolidated Financial Statement, the Company Auditing the Company's valuation of contingent consideration liabilities was complex and required significant auditor judgment due to the use of a Monte Carlo simulation model and the subjectivity in evaluating certain assumptions required to estimate the fair value of contingent consideration payments. The significant assumptions used in the Monte Carlo simulation included volatility and projected financial information. These significant assumptions are forward looking and could be affected by future economic and market conditions. | |
How We Addressed the Matter in Our Audit | We obtained an understanding, evaluated the design and tested the operating effectiveness of controls over the Company’s valuation of contingent consideration liabilities. For example, we tested controls over management’s review of the significant assumptions and other inputs used in the determination of fair value.
|
/s/ Ernst & Young LLP
We have served as the Company’s auditor since 2016.
/s/ Ernst & Young LLP
Chicago, Illinois
February 26, 202023, 2023
33
Cars.com Inc.
Consolidated Balance Sheets
(In thousands, except per share data)
|
| December 31, |
|
| December 31, |
| ||||||||||
|
| 2019 |
|
| 2018 |
|
| 2022 |
|
| 2021 |
| ||||
Assets: |
|
|
|
|
|
|
|
|
|
|
|
|
|
| ||
Current assets: |
|
|
|
|
|
|
|
|
|
|
|
|
|
| ||
Cash and cash equivalents |
| $ | 13,549 |
|
| $ | 25,463 |
|
| $ | 31,715 |
|
| $ | 39,069 |
|
Accounts receivable, net |
|
| 101,762 |
|
|
| 108,921 |
|
|
| 107,930 |
|
|
| 98,893 |
|
Prepaid expenses |
|
| 6,526 |
|
|
| 9,264 |
|
|
| 8,377 |
|
|
| 7,810 |
|
Other current assets |
|
| 603 |
|
|
| 10,289 |
|
|
| 605 |
|
|
| 1,665 |
|
Total current assets |
|
| 122,440 |
|
|
| 153,937 |
|
|
| 148,627 |
|
|
| 147,437 |
|
Property and equipment, net |
|
| 43,696 |
|
|
| 41,482 |
|
|
| 45,218 |
|
|
| 43,005 |
|
Goodwill |
|
| 505,885 |
|
|
| 884,449 |
|
|
| 102,856 |
|
|
| 26,227 |
|
Intangible assets, net |
|
| 1,329,499 |
|
|
| 1,510,410 |
|
|
| 707,088 |
|
|
| 769,424 |
|
Investments and other assets |
|
| 26,471 |
|
|
| 10,271 |
| ||||||||
Investments and other assets, net |
|
| 21,081 |
|
|
| 21,112 |
| ||||||||
Total assets |
| $ | 2,027,991 |
|
| $ | 2,600,549 |
|
| $ | 1,024,870 |
|
| $ | 1,007,205 |
|
Liabilities and stockholders' equity: |
|
|
|
|
|
|
|
|
|
|
|
|
|
| ||
Current liabilities: |
|
|
|
|
|
|
|
|
|
|
|
|
|
| ||
Accounts payable |
| $ | 12,431 |
|
| $ | 11,631 |
|
| $ | 18,230 |
|
| $ | 15,420 |
|
Accrued compensation |
|
| 16,738 |
|
|
| 16,821 |
|
|
| 19,316 |
|
|
| 23,612 |
|
Unfavorable contracts liability |
|
| — |
|
|
| 18,885 |
| ||||||||
Current portion of long-term debt |
|
| 31,391 |
|
|
| 26,853 |
| ||||||||
Current portion of long-term debt, net |
|
| 14,134 |
|
|
| 8,941 |
| ||||||||
Other accrued liabilities |
|
| 38,246 |
|
|
| 36,520 |
|
|
| 54,332 |
|
|
| 46,317 |
|
Total current liabilities |
|
| 98,806 |
|
|
| 110,710 |
|
|
| 106,012 |
|
|
| 94,290 |
|
Noncurrent liabilities: |
|
|
|
|
|
|
|
|
|
|
|
|
|
| ||
Long-term debt |
|
| 611,277 |
|
|
| 665,306 |
| ||||||||
Deferred tax liability |
|
| 132,996 |
|
|
| 177,916 |
| ||||||||
Long-term debt, net |
|
| 458,249 |
|
|
| 457,383 |
| ||||||||
Other noncurrent liabilities |
|
| 43,844 |
|
|
| 19,694 |
|
|
| 76,179 |
|
|
| 57,512 |
|
Total noncurrent liabilities |
|
| 788,117 |
|
|
| 862,916 |
|
|
| 534,428 |
|
|
| 514,895 |
|
Total liabilities |
|
| 886,923 |
|
|
| 973,626 |
|
|
| 640,440 |
|
|
| 609,185 |
|
Commitments and contingencies |
|
|
|
|
|
|
|
|
|
|
|
|
|
| ||
Stockholders' equity: |
|
|
|
|
|
|
|
|
|
|
|
|
|
| ||
Preferred Stock at par, $0.01 par value; 5,000 shares authorized; 0 shares issued and outstanding as of December 31, 2019 and December 31, 2018, respectively |
|
| — |
|
|
| — |
| ||||||||
Common Stock at par, $0.01 par value; 300,000 shares authorized; 66,764 and 68,262 shares issued and outstanding as of December 31, 2019 and December 31, 2018, respectively |
|
| 668 |
|
|
| 683 |
| ||||||||
Preferred Stock at par, $0.01 par value; 5,000 shares authorized; no shares |
|
| — |
|
|
| — |
| ||||||||
Common Stock at par, $0.01 par value; 300,000 shares authorized; 66,287 and |
|
| 662 |
|
|
| 692 |
| ||||||||
Additional paid-in capital |
|
| 1,515,109 |
|
|
| 1,508,001 |
|
|
| 1,511,944 |
|
|
| 1,544,712 |
|
(Accumulated deficit) retained earnings |
|
| (367,067 | ) |
|
| 118,239 |
| ||||||||
Accumulated deficit |
|
| (1,128,176 | ) |
|
| (1,145,382 | ) | ||||||||
Accumulated other comprehensive loss |
|
| (7,642 | ) |
|
| — |
|
|
| — |
|
|
| (2,002 | ) |
Total stockholders' equity |
|
| 1,141,068 |
|
|
| 1,626,923 |
|
|
| 384,430 |
|
|
| 398,020 |
|
Total liabilities and stockholders' equity |
| $ | 2,027,991 |
|
| $ | 2,600,549 |
|
| $ | 1,024,870 |
|
| $ | 1,007,205 |
|
The accompanying notes are an integral part of these Consolidated and Combined Financial Statements.
34
Cars.com Inc.
Consolidated and Combined Statements of Income (Loss) Income
(In thousands, except per share data)
|
| Year Ended December 31, |
|
| Year Ended December 31, |
| ||||||||||||||||||
|
| 2019 |
|
| 2018 |
|
| 2017 |
|
| 2022 |
|
| 2021 |
|
| 2020 |
| ||||||
Revenue: |
|
|
|
|
|
|
|
|
|
|
|
|
|
|
|
|
|
|
|
|
| |||
Retail |
| $ | 572,311 |
|
| $ | 579,188 |
|
| $ | 463,280 |
| ||||||||||||
Wholesale (1) |
|
| 34,371 |
|
|
| 82,939 |
|
|
| 162,982 |
| ||||||||||||
Dealer |
| $ | 579,222 |
|
| $ | 549,923 |
|
| $ | 463,018 |
| ||||||||||||
OEM and National |
|
| 58,557 |
|
|
| 65,085 |
|
|
| 73,176 |
| ||||||||||||
Other |
|
| 16,097 |
|
|
| 8,675 |
|
|
| 11,309 |
| ||||||||||||
Total revenue |
|
| 606,682 |
|
|
| 662,127 |
|
|
| 626,262 |
|
|
| 653,876 |
|
|
| 623,683 |
|
|
| 547,503 |
|
Operating expenses: |
|
|
|
|
|
|
|
|
|
|
|
|
|
|
|
|
|
|
|
|
| |||
Cost of revenue and operations |
|
| 99,549 |
|
|
| 90,433 |
|
|
| 65,541 |
|
|
| 114,959 |
|
|
| 114,200 |
|
|
| 101,536 |
|
Product and technology |
|
| 62,859 |
|
|
| 68,789 |
|
|
| 74,162 |
|
|
| 89,015 |
|
|
| 77,316 |
|
|
| 60,664 |
|
Marketing and sales |
|
| 217,432 |
|
|
| 226,740 |
|
|
| 209,813 |
|
|
| 221,879 |
|
|
| 208,335 |
|
|
| 183,448 |
|
General and administrative |
|
| 73,772 |
|
|
| 72,943 |
|
|
| 44,903 |
|
|
| 67,593 |
|
|
| 73,562 |
|
|
| 59,051 |
|
Affiliate revenue share |
|
| 20,790 |
|
|
| 15,488 |
|
|
| 8,948 |
|
|
| — |
|
|
| — |
|
|
| 10,970 |
|
Depreciation and amortization |
|
| 116,877 |
|
|
| 103,810 |
|
|
| 88,639 |
|
|
| 94,394 |
|
|
| 101,932 |
|
|
| 113,276 |
|
Goodwill and intangible asset impairment |
|
| 461,463 |
|
|
| — |
|
|
| — |
|
|
| — |
|
|
| — |
|
|
| 905,885 |
|
Total operating expenses |
|
| 1,052,742 |
|
|
| 578,203 |
|
|
| 492,006 |
|
|
| 587,840 |
|
|
| 575,345 |
|
|
| 1,434,830 |
|
Operating (loss) income |
|
| (446,060 | ) |
|
| 83,924 |
|
|
| 134,256 |
| ||||||||||||
Nonoperating (expense) income: |
|
|
|
|
|
|
|
|
|
|
|
| ||||||||||||
Operating income (loss) |
|
| 66,036 |
|
|
| 48,338 |
|
|
| (887,327 | ) | ||||||||||||
Nonoperating expense: |
|
|
|
|
|
|
|
|
| |||||||||||||||
Interest expense, net |
|
| (30,774 | ) |
|
| (27,717 | ) |
|
| (12,371 | ) |
|
| (35,320 | ) |
|
| (38,729 | ) |
|
| (37,856 | ) |
Other income, net |
|
| 1,555 |
|
|
| 722 |
|
|
| 277 |
| ||||||||||||
Other expense, net |
|
| (8,140 | ) |
|
| (126 | ) |
|
| (11,226 | ) | ||||||||||||
Total nonoperating expense, net |
|
| (29,219 | ) |
|
| (26,995 | ) |
|
| (12,094 | ) |
|
| (43,460 | ) |
|
| (38,855 | ) |
|
| (49,082 | ) |
(Loss) income before income taxes |
|
| (475,279 | ) |
|
| 56,929 |
|
|
| 122,162 |
| ||||||||||||
Income tax (benefit) expense |
|
| (29,955 | ) |
|
| 18,120 |
|
|
| (102,281 | ) | ||||||||||||
Net (loss) income |
| $ | (445,324 | ) |
| $ | 38,809 |
|
| $ | 224,443 |
| ||||||||||||
Income (loss) before income taxes |
|
| 22,576 |
|
|
| 9,483 |
|
|
| (936,409 | ) | ||||||||||||
Income tax expense (benefit) |
|
| 5,370 |
|
|
| (1,308 | ) |
|
| (147,303 | ) | ||||||||||||
Net income (loss) |
| $ | 17,206 |
|
| $ | 10,791 |
|
| $ | (789,106 | ) | ||||||||||||
Weighted-average common shares outstanding: |
|
|
|
|
|
|
|
|
|
|
|
|
|
|
|
|
|
|
| |||||
Basic |
|
| 66,995 |
|
|
| 70,318 |
|
|
| 71,661 |
|
|
| 68,215 |
|
|
| 68,727 |
|
|
| 67,241 |
|
Diluted |
|
| 66,995 |
|
|
| 70,547 |
|
|
| 71,727 |
|
|
| 69,649 |
|
|
| 71,337 |
|
|
| 67,241 |
|
(Loss) earnings per share: |
|
|
|
|
|
|
|
|
|
|
|
| ||||||||||||
Earnings (loss) per share: |
|
|
|
|
|
|
| |||||||||||||||||
Basic |
| $ | (6.65 | ) |
| $ | 0.55 |
|
| $ | 3.13 |
|
| $ | 0.25 |
|
| $ | 0.16 |
|
| $ | (11.74 | ) |
Diluted |
|
| (6.65 | ) |
|
| 0.55 |
|
|
| 3.13 |
|
|
| 0.25 |
|
|
| 0.15 |
|
|
| (11.74 | ) |
The accompanying notes are an integral part of these Consolidated and Combined Financial Statements.
35 |
|
|
Cars.com Inc.
Consolidated and Combined Statements of Comprehensive Income (Loss) Income
(In thousands)
| Year Ended December 31, |
| |||||||||
| 2019 |
|
| 2018 |
|
| 2017 |
| |||
Net (loss) income | $ | (445,324 | ) |
| $ | 38,809 |
|
| $ | 224,443 |
|
Other comprehensive loss, net of tax: |
|
|
|
|
|
|
|
|
|
|
|
Interest rate swap |
| (7,642 | ) |
|
| — |
|
|
| — |
|
Total other comprehensive loss |
| (7,642 | ) |
|
| — |
|
|
| — |
|
Comprehensive (loss) income | $ | (452,966 | ) |
| $ | 38,809 |
|
| $ | 224,443 |
|
| Year Ended December 31, |
| |||||||||
| 2022 |
|
| 2021 |
|
| 2020 |
| |||
Net income (loss) | $ | 17,206 |
|
| $ | 10,791 |
|
| $ | (789,106 | ) |
Other comprehensive income (loss), net of tax: |
|
|
|
|
|
|
|
| |||
Interest rate swap |
| — |
|
|
| — |
|
|
| (8,910 | ) |
Reclassification of Accumulated other comprehensive loss on interest rate swap into Net income (loss) |
| 2,002 |
|
|
| 4,802 |
|
|
| 9,748 |
|
Total other comprehensive income |
| 2,002 |
|
|
| 4,802 |
|
|
| 838 |
|
Comprehensive income (loss) | $ | 19,208 |
|
| $ | 15,593 |
|
| $ | (788,268 | ) |
The accompanying notes are an integral part of these Consolidated and Combined Financial Statements.
36
Cars.com Inc.
Consolidated and Combined Statements of Stockholders’ Equity
(In thousands)
| Preferred Stock |
|
| Common Stock |
|
| Additional Paid-In |
|
| TEGNA's Investment, |
|
| (Accumulated Deficit) Retained |
|
| Accumulated Other Comprehensive |
|
| Stockholders' |
| |||||||||||||||
| Shares |
|
| Amount |
|
| Shares |
|
| Amount |
|
| Capital |
|
| net |
|
| Earnings |
|
| Loss |
|
| Equity |
| |||||||||
Balance at December 31, 2016 |
| — |
|
| $ | — |
|
|
| — |
|
| $ | — |
|
| $ | — |
|
| $ | 2,417,285 |
|
| $ | — |
|
| $ | — |
|
| $ | 2,417,285 |
|
Net income |
| — |
|
|
| — |
|
|
| — |
|
|
| — |
|
|
| — |
|
|
| 47,861 |
|
|
| 176,582 |
|
|
| — |
|
|
| 224,443 |
|
Cash distribution to TEGNA related to Separation |
| — |
|
|
| — |
|
|
| — |
|
|
| — |
|
|
| — |
|
|
| (650,000 | ) |
|
| — |
|
|
| — |
|
|
| (650,000 | ) |
Deferred taxes related to Separation |
| — |
|
|
| — |
|
|
| — |
|
|
| — |
|
|
| — |
|
|
| (246,197 | ) |
|
| — |
|
|
| — |
|
|
| (246,197 | ) |
Distribution by TEGNA |
| — |
|
|
| — |
|
|
| 71,588 |
|
|
| 716 |
|
|
| 1,499,203 |
|
|
| (1,499,919 | ) |
|
| — |
|
|
| — |
|
|
| — |
|
Shares issued in connection with stock-based compensation plans, net |
| — |
|
|
| — |
|
|
| 40 |
|
|
| — |
|
|
| — |
|
|
| — |
|
|
| — |
|
|
| — |
|
|
| — |
|
Stock-based compensation |
| — |
|
|
| — |
|
|
| — |
|
|
| — |
|
|
| 2,627 |
|
|
| — |
|
|
| — |
|
|
| — |
|
|
| 2,627 |
|
Transactions with TEGNA, net (1) |
| — |
|
|
| — |
|
|
| — |
|
|
| — |
|
|
| — |
|
|
| (69,030 | ) |
|
| — |
|
|
| — |
|
|
| (69,030 | ) |
Balance at December 31, 2017 |
| — |
|
| $ | — |
|
|
| 71,628 |
|
| $ | 716 |
|
| $ | 1,501,830 |
|
| $ | — |
|
| $ | 176,582 |
|
| $ | — |
|
| $ | 1,679,128 |
|
Net income |
| — |
|
|
| — |
|
|
| — |
|
|
| — |
|
|
| — |
|
|
| — |
|
|
| 38,809 |
|
|
| — |
|
|
| 38,809 |
|
Repurchases of common stock |
| — |
|
|
| — |
|
|
| (3,789 | ) |
|
| (38 | ) |
|
| — |
|
|
| — |
|
|
| (97,152 | ) |
|
| — |
|
|
| (97,190 | ) |
Shares issued in connection with stock-based compensation plans, net |
| — |
|
|
| — |
|
|
| 160 |
|
|
| 2 |
|
|
| 375 |
|
|
| — |
|
|
| — |
|
|
| — |
|
|
| 377 |
|
Stock-based compensation |
| — |
|
|
| — |
|
|
| — |
|
|
| — |
|
|
| 9,423 |
|
|
| — |
|
|
| — |
|
|
| — |
|
|
| 9,423 |
|
Transactions with TEGNA, net (1) |
| — |
|
|
| — |
|
|
| 263 |
|
|
| 3 |
|
|
| (3,627 | ) |
|
| — |
|
|
| — |
|
|
| — |
|
|
| (3,624 | ) |
Balance at December 31, 2018 |
| — |
|
| $ | — |
|
|
| 68,262 |
|
| $ | 683 |
|
| $ | 1,508,001 |
|
| $ | — |
|
| $ | 118,239 |
|
| $ | — |
|
| $ | 1,626,923 |
|
Net loss |
| — |
|
|
| — |
|
|
| — |
|
|
| — |
|
|
| — |
|
|
| — |
|
|
| (445,324 | ) |
|
| — |
|
|
| (445,324 | ) |
Other comprehensive loss, net |
| — |
|
|
| — |
|
|
| — |
|
|
| — |
|
|
| — |
|
|
| — |
|
|
| — |
|
|
| (7,642 | ) |
|
| (7,642 | ) |
Repurchases of common stock |
| — |
|
|
| — |
|
|
| (1,750 | ) |
|
| (18 | ) |
|
| — |
|
|
| — |
|
|
| (39,982 | ) |
|
| — |
|
|
| (40,000 | ) |
Shares issued in connection with stock-based compensation plans, net |
| — |
|
|
| — |
|
|
| 238 |
|
|
| 2 |
|
|
| (288 | ) |
|
| — |
|
|
| — |
|
|
| — |
|
|
| (286 | ) |
Stock-based compensation |
| — |
|
|
| — |
|
|
| — |
|
|
| — |
|
|
| 7,588 |
|
|
| — |
|
|
| — |
|
|
| — |
|
|
| 7,588 |
|
Transactions with TEGNA, net (1) |
| — |
|
|
| — |
|
|
| 14 |
|
|
| 1 |
|
|
| (192 | ) |
|
| — |
|
|
| — |
|
|
| — |
|
|
| (191 | ) |
Balance at December 31, 2019 |
| — |
|
| $ | — |
|
|
| 66,764 |
|
| $ | 668 |
|
| $ | 1,515,109 |
|
| $ | — |
|
| $ | (367,067 | ) |
| $ | (7,642 | ) |
| $ | 1,141,068 |
|
| Preferred Stock |
|
| Common Stock |
|
| Additional |
|
| Accumulated |
|
| Accumulated Other |
|
| Stockholders' |
| ||||||||||||||
| Shares |
|
| Amount |
|
| Shares |
|
| Amount |
|
| Capital |
|
| Deficit |
|
| Comprehensive Loss |
|
| Equity |
| ||||||||
Balance at December 31, 2019 |
| — |
|
| $ | — |
|
|
| 66,764 |
|
| $ | 668 |
|
| $ | 1,515,109 |
|
| $ | (367,067 | ) |
| $ | (7,642 | ) |
| $ | 1,141,068 |
|
Net loss |
| — |
|
|
| — |
|
|
| — |
|
|
| — |
|
|
| — |
|
|
| (789,106 | ) |
|
| — |
|
|
| (789,106 | ) |
Other comprehensive income, net of tax |
| — |
|
|
| — |
|
|
| — |
|
|
| — |
|
|
| — |
|
|
| — |
|
|
| 838 |
|
|
| 838 |
|
Shares issued in connection with |
| — |
|
|
| — |
|
|
| 623 |
|
|
| 6 |
|
|
| 229 |
|
|
| — |
|
|
| — |
|
|
| 235 |
|
Stock-based compensation |
| — |
|
|
| — |
|
|
| — |
|
|
| — |
|
|
| 15,155 |
|
|
| — |
|
|
| — |
|
|
| 15,155 |
|
Balance at December 31, 2020 |
| — |
|
| $ | — |
|
|
| 67,387 |
|
| $ | 674 |
|
| $ | 1,530,493 |
|
| $ | (1,156,173 | ) |
| $ | (6,804 | ) |
| $ | 368,190 |
|
Net income |
| — |
|
|
| — |
|
|
| — |
|
|
| — |
|
|
| — |
|
|
| 10,791 |
|
|
| — |
|
|
| 10,791 |
|
Other comprehensive income, net of tax |
| — |
|
|
| — |
|
|
| — |
|
|
| — |
|
|
| — |
|
|
| — |
|
|
| 4,802 |
|
|
| 4,802 |
|
Shares issued in connection with |
| — |
|
|
| — |
|
|
| 1,783 |
|
|
| 18 |
|
|
| (7,212 | ) |
|
| — |
|
|
| — |
|
|
| (7,194 | ) |
Stock-based compensation |
| — |
|
|
| — |
|
|
| — |
|
|
| — |
|
|
| 21,431 |
|
|
| — |
|
|
| — |
|
|
| 21,431 |
|
Balance at December 31, 2021 |
| — |
|
| $ | — |
|
|
| 69,170 |
|
| $ | 692 |
|
| $ | 1,544,712 |
|
| $ | (1,145,382 | ) |
| $ | (2,002 | ) |
| $ | 398,020 |
|
Net income |
| — |
|
|
| — |
|
|
| — |
|
|
| — |
|
|
| — |
|
|
| 17,206 |
|
|
| — |
|
|
| 17,206 |
|
Other comprehensive income, net of tax |
| — |
|
|
| — |
|
|
| — |
|
|
| — |
|
|
| — |
|
|
| — |
|
|
| 2,002 |
|
|
| 2,002 |
|
Repurchases of common stock |
| — |
|
|
| — |
|
|
| (4,168 | ) |
|
| (41 | ) |
|
| (48,941 | ) |
|
| — |
|
|
| — |
|
|
| (48,982 | ) |
Shares issued in connection with |
| — |
|
|
| — |
|
|
| 1,285 |
|
|
| 11 |
|
|
| (6,267 | ) |
|
| — |
|
|
| — |
|
|
| (6,256 | ) |
Stock-based compensation |
| — |
|
|
| — |
|
|
| — |
|
|
| — |
|
|
| 22,440 |
|
|
| — |
|
|
| — |
|
|
| 22,440 |
|
Balance at December 31, 2022 |
| — |
|
| $ | — |
|
|
| 66,287 |
|
| $ | 662 |
|
| $ | 1,511,944 |
|
| $ | (1,128,176 | ) |
| $ | — |
|
| $ | 384,430 |
|
The accompanying notes are an integral part of these Consolidated and Combined Financial Statements.
(1)37For information related to related party transactions, see Note 16 (Related Party).
Cars.com Inc.
Consolidated and Combined Statements of Cash Flows
(In thousands)
|
| Year Ended December 31, |
|
| Year Ended December 31, |
| ||||||||||||||||||
|
| 2019 |
|
| 2018 |
|
| 2017 |
|
| 2022 |
|
| 2021 |
|
| 2020 |
| ||||||
Cash flows from operating activities: |
|
|
|
|
|
|
|
|
|
|
|
|
|
|
|
|
|
|
|
|
| |||
Net (loss) income |
| $ | (445,324 | ) |
| $ | 38,809 |
|
| $ | 224,443 |
| ||||||||||||
Adjustments to reconcile Net (loss) income to Net cash provided by operating activities: |
|
|
|
|
|
|
|
|
|
|
|
| ||||||||||||
Net income (loss) |
| $ | 17,206 |
|
| $ | 10,791 |
|
| $ | (789,106 | ) | ||||||||||||
Adjustments to reconcile Net income (loss) to Net cash provided by |
|
|
|
|
|
|
|
|
| |||||||||||||||
Depreciation |
|
| 18,266 |
|
|
| 12,820 |
|
|
| 10,770 |
|
|
| 16,380 |
|
|
| 16,290 |
|
|
| 18,943 |
|
Amortization of intangible assets |
|
| 98,611 |
|
|
| 90,990 |
|
|
| 77,869 |
|
|
| 78,014 |
|
|
| 85,642 |
|
|
| 94,333 |
|
Amortization of unfavorable contracts liability |
|
| (18,885 | ) |
|
| (25,200 | ) |
|
| (25,200 | ) | ||||||||||||
Goodwill and intangible asset impairment |
|
| 461,463 |
|
|
| — |
|
|
| — |
|
|
| — |
|
|
| — |
|
|
| 905,885 |
|
Impairment of non-marketable security |
|
| — |
|
|
| — |
|
|
| 9,447 |
| ||||||||||||
Amortization of Accumulated other comprehensive loss on interest rate swap |
|
| 2,362 |
|
|
| 5,670 |
|
|
| 8,623 |
| ||||||||||||
Changes in fair value of contingent consideration |
|
| 8,130 |
|
|
| — |
|
|
| — |
| ||||||||||||
Stock-based compensation |
|
| 7,588 |
|
|
| 9,423 |
|
|
| 2,627 |
|
|
| 22,342 |
|
|
| 21,431 |
|
|
| 15,155 |
|
Deferred income taxes |
|
| (44,920 | ) |
|
| 16,693 |
|
|
| (108,845 | ) |
|
| 1,283 |
|
|
| (2,927 | ) |
|
| (134,383 | ) |
Provision for doubtful accounts |
|
| 4,897 |
|
|
| 4,391 |
|
|
| 2,452 |
|
|
| 1,888 |
|
|
| 164 |
|
|
| 4,380 |
|
Amortization of debt issuance costs |
|
| 1,573 |
|
|
| 1,307 |
|
|
| 810 |
|
|
| 3,235 |
|
|
| 3,360 |
|
|
| 5,108 |
|
Amortization of deferred revenue related to Accu-Trade Acquisition |
|
| (4,417 | ) |
|
| — |
|
|
| — |
| ||||||||||||
Other, net |
|
| 496 |
|
|
| 1,053 |
|
|
| 1,618 |
|
|
| 1,202 |
|
|
| 1,416 |
|
|
| 181 |
|
Changes in operating assets and liabilities, net of DI Acquisition: |
|
|
|
|
|
|
|
|
|
|
|
| ||||||||||||
Changes in operating assets and liabilities, net of acquisitions: |
|
|
|
|
|
|
|
|
| |||||||||||||||
Accounts receivable |
|
| 2,262 |
|
|
| (1,164 | ) |
|
| (5,006 | ) |
|
| (9,337 | ) |
|
| (5,352 | ) |
|
| 3,733 |
|
Prepaid expenses |
|
| 2,738 |
|
|
| 2,464 |
|
|
| (8 | ) | ||||||||||||
Other current assets |
|
| 9,835 |
|
|
| (552 | ) |
|
| (8,593 | ) | ||||||||||||
Other assets |
|
| (16,201 | ) |
|
| 782 |
|
|
| 734 |
| ||||||||||||
Prepaid expenses and other assets |
|
| (423 | ) |
|
| 6,141 |
|
|
| (9,514 | ) | ||||||||||||
Accounts payable |
|
| 874 |
|
|
| 2,512 |
|
|
| (432 | ) |
|
| 2,611 |
|
|
| (1,099 | ) |
|
| 3,993 |
|
Accrued compensation |
|
| (83 | ) |
|
| 2,569 |
|
|
| (6,946 | ) |
|
| (4,296 | ) |
|
| 5,293 |
|
|
| 1,581 |
|
Other accrued liabilities |
|
| (1,378 | ) |
|
| 8,358 |
|
|
| 6,021 |
| ||||||||||||
Other noncurrent liabilities |
|
| 19,672 |
|
|
| (1,707 | ) |
|
| (2,173 | ) | ||||||||||||
Cash received from lessor for lease incentives |
|
| — |
|
|
| — |
|
|
| 15,788 |
| ||||||||||||
Other liabilities |
|
| (7,669 | ) |
|
| (8,817 | ) |
|
| 257 |
| ||||||||||||
Net cash provided by operating activities |
|
| 101,484 |
|
|
| 163,548 |
|
|
| 185,929 |
|
|
| 128,511 |
|
|
| 138,003 |
|
|
| 138,616 |
|
Cash flows from investing activities: |
|
|
|
|
|
|
|
|
|
|
|
|
|
|
|
|
|
|
|
|
| |||
Payments for acquisitions, net of cash acquired |
|
| (64,663 | ) |
|
| (20,258 | ) |
|
| — |
| ||||||||||||
Purchase of property and equipment |
|
| (21,257 | ) |
|
| (14,233 | ) |
|
| (32,774 | ) |
|
| (19,714 | ) |
|
| (19,192 | ) |
|
| (16,712 | ) |
Payment for DI Acquisition, net |
|
| — |
|
|
| (157,153 | ) |
|
| — |
| ||||||||||||
Other, net |
|
| (599 | ) |
|
| 11 |
|
|
| — |
| ||||||||||||
Net cash used in investing activities |
|
| (21,856 | ) |
|
| (171,375 | ) |
|
| (32,774 | ) |
|
| (84,377 | ) |
|
| (39,450 | ) |
|
| (16,712 | ) |
Cash flows from financing activities: |
|
|
|
|
|
|
|
|
|
|
|
|
|
|
|
|
|
|
|
|
| |||
Proceeds from issuance of long-term debt |
|
| 10,000 |
|
|
| 195,000 |
|
|
| 675,000 |
| ||||||||||||
Proceeds from Revolving Loan borrowings and issuance of long-term debt |
|
| 45,000 |
|
|
| — |
|
|
| 565,000 |
| ||||||||||||
Payments of long-term debt |
|
| (41,250 | ) |
|
| (120,000 | ) |
|
| (615,625 | ) | ||||||||||||
Payments for stock-based compensation plans, net |
|
| (6,256 | ) |
|
| (7,194 | ) |
|
| 235 |
| ||||||||||||
Repurchases of common stock |
|
| (48,982 | ) |
|
| — |
|
|
| — |
| ||||||||||||
Payments of debt issuance costs and other fees |
|
| (2,940 | ) |
|
| — |
|
|
| (6,208 | ) |
|
| — |
|
|
| (9 | ) |
|
| (17,344 | ) |
Payments of long-term debt |
|
| (58,125 | ) |
|
| (82,500 | ) |
|
| (91,250 | ) | ||||||||||||
Stock-based compensations plans, net |
|
| (286 | ) |
|
| 377 |
|
|
| — |
| ||||||||||||
Repurchases of common stock |
|
| (40,000 | ) |
|
| (97,190 | ) |
|
| — |
| ||||||||||||
Cash distribution to TEGNA related to Separation |
|
| — |
|
|
| — |
|
|
| (650,000 | ) | ||||||||||||
Transactions with TEGNA, net |
|
| (191 | ) |
|
| (2,960 | ) |
|
| (69,030 | ) | ||||||||||||
Net cash (used in) provided by financing activities |
|
| (91,542 | ) |
|
| 12,727 |
|
|
| (141,488 | ) | ||||||||||||
Net cash used in financing activities |
|
| (51,488 | ) |
|
| (127,203 | ) |
|
| (67,734 | ) | ||||||||||||
Net (decrease) increase in cash and cash equivalents |
|
| (11,914 | ) |
|
| 4,900 |
|
|
| 11,667 |
|
|
| (7,354 | ) |
|
| (28,650 | ) |
|
| 54,170 |
|
Cash and cash equivalents at beginning of period |
|
| 25,463 |
|
|
| 20,563 |
|
|
| 8,896 |
|
|
| 39,069 |
|
|
| 67,719 |
|
|
| 13,549 |
|
Cash and cash equivalents at end of period |
| $ | 13,549 |
|
| $ | 25,463 |
|
| $ | 20,563 |
|
| $ | 31,715 |
|
| $ | 39,069 |
|
| $ | 67,719 |
|
Supplemental cash flow information: |
|
|
|
|
|
|
|
|
|
|
|
|
|
|
|
|
|
|
|
|
| |||
Cash paid for income taxes, net of refunds |
| $ | 1,740 |
|
| $ | 7 |
|
| $ | 11,531 |
| ||||||||||||
Cash paid for interest |
|
| 29,654 |
|
|
| 26,780 |
|
|
| 11,761 |
| ||||||||||||
Cash paid (received) for income taxes |
| $ | 545 |
|
| $ | (7,992 | ) |
| $ | 805 |
| ||||||||||||
Cash paid for interest and swap |
|
| 33,370 |
|
|
| 38,342 |
|
|
| 26,433 |
| ||||||||||||
The accompanying notes are an integral part of these Consolidated and Combined Financial Statements.
3638
Cars.com Inc.
Notes to Consolidated and Combined Financial Statements
Note 1. Description of business, company history and basis of presentationBusiness
Description of business. Business. Cars.com Inc., (the “Company” or CARS)“CARS”) is a leading automotive marketplace platform that provides a robust set of digital marketplace and solutions provider for the automotive industry that connectsconnect car shoppers with sellers and original equipment manufacturers (“OEM”s).sellers. The Company’s marketplaceCompany empowers shoppers with the data, resources and informationdigital tools needed to make confident carinformed buying decisions while ourand seamlessly connect with automotive retailers. In a rapidly changing market, CARS enables dealers and automotive manufacturers (“OEMs”), with innovative technical solutions and data-driven intelligence, to better reach and influence ready-to-buy shoppers, increase inventory turn and gain market share.
In addition to Cars.com™, the Company’s brands include Dealer Inspire®, a website and digital solutions provider enabling dealers to be more efficient through connected digital experiences; FUEL™, an advertising solution providing dealers and OEMs the benefit of leveraging targeted digital video and display marketing to Cars.com’s audience of in-market car shoppers; DealerRater®, a leading car dealer review and reputation management technology platform help sellers improve operational efficiency, profitabilitysolution; CreditIQ®, digital financing technology and sales.Accu-Trade™, vehicle valuation and appraisal technology. The Company’sCompany's portfolio of brands also includes Cars.com, Dealer Inspire and DealerRater, in addition to Auto.com, PickupTrucks.com and NewCars.com. PickupTrucks.com™.
Company History. In May 2017, the Company separated from its former parent company, TEGNA Inc. (“TEGNA”) by means of a spin-off of a newly formed company, Cars.com Inc. (the “Spin”), which now owns TEGNA’s former digital automotive marketplace business (the “Separation”). The Company filed a Registration Statement with the United States (“U.S.”) Securities and Exchange Commission (the “SEC”) on Form 10 relating to the Separation, which was declared effective on May 15, 2017. On May 31, 2017, the Company made a $650.0 million cash transfer to TEGNA and TEGNA completed the Separation through a pro rata distribution to its stockholders of all of the outstanding shares of the Company’s common stock. The Company’s common stock began trading “regular way” on the New York Stock Exchange on June 1, 2017.
In February 2018, the Company acquired all of the outstanding stock of Dealer Inspire, Inc. and substantially all of the net assets of Launch Digital Marketing LLC (the “DI Acquisition”) in 2018. The post-DI Acquisition business related to Dealer Inspire, Inc. and Launch Digital Marketing LLC is referred to collectively as “Dealer Inspire.” For additional information, see Note 4 (Business Combination).
Basis of Presentation. These accompanying Consolidated and Combined Financial Statements have been prepared in conformity with accounting principles generally accepted in the United States of America (“U.S. GAAP”) and the rules and regulations of the SEC. The Consolidated and Combined Financial Statements include the accounts of CARS and its 100% owned subsidiaries. All intercompany transactions and accounts have been eliminated in consolidation.
Prior to the Separation, the Company’s financial statements were derived from the historical accounting records of TEGNA and reflect the Company’s financial results as if the Company were a separate entity. The historical financial statements include allocations of certain TEGNA corporate overhead expenses and totaled $2.5 million for the year ended December 31, 2017.
All significant intercompany transactions between either (i) the Company and TEGNA or (ii) the Company and TEGNA affiliates have been included within the Consolidated and Combined Financial Statements and are considered to be effectively settled through equity contributions or distributions at the time the transactions were recorded. The accumulated net effect of intercompany and certain post-Separation transactions, between either (i) the Company and TEGNA or (ii) the Company and TEGNA affiliates are included in “Transactions with TEGNA, net.” The total net effect of these intercompany or certain post-Separation transactions is reflected in the Consolidated and Combined Statements of Cash Flows as financing activities.
Note 2. Significant Accounting Policies
Basis of Presentation. These accompanying Consolidated Financial Statements have been prepared in conformity with accounting principles generally accepted in the United States of America (“U.S. GAAP”) and the rules and regulations of the SEC. The Consolidated Financial Statements include the accounts of CARS and its 100% owned subsidiaries. All intercompany transactions and accounts have been eliminated in consolidation.
Use of EstimatesEstimates.. The preparation of the accompanying Consolidated and Combined Financial Statements in accordance with U.S. GAAP requires management to make estimates and assumptions that affect amounts reported in the Consolidated and Combined Financial Statements and accompanying disclosures. Although these estimates are based on management’s best knowledge of current events and actions that the Company may undertake in the future, actual results may differ from those estimatesestimates..
Reclassifications. Certain prior year balances have been reclassified to conform to the current year presentation. Historically, certain costs related to severance, transformation and other exit costs; costs associated with a stockholder activist campaign; transaction-related costs; and the write-off of long-lived assets were reflected in various operating expense line items in the Consolidated and Combined Statements of (Loss) Income. Beginning on January 1, 2019, these costs are reflected within General and administrative expenses and certain prior year balances have been reclassified to conform to the current year presentationpresentation.
Correction of Certain Amounts Relating to Previously Issued Financial Statements. During the first quarter of 2022, the Company identified a $30.8 million overstatement of the valuation allowance recorded against deferred tax assets that originated in 2020. In addition, the Company adjusted 2020 to reflect an immaterial income tax adjustment related to this same period. The Company has concluded that these items are not material to the previously issued Consolidated Financial Statements and are summarizedhas therefore corrected these prior period amounts as presented in the table below (in thousands). There is no change to Operating (loss) income as a result of these reclassifications. No such adjustments were requiredConsolidated Financial Statements for the year ended December 31, 2017.2022.
The impact of correcting the items on the related financial statement line items for the year ended December 31, 2021 is as follows (in thousands, except per share data):
37
39
Cars.com Inc.
Notes to Consolidated and Combined Financial Statements (Continued)
Consolidated Balance Sheet and Consolidated Statement of Stockholders' Equity, as applicable |
| ||||||||||
| As of December 31, 2021 |
| |||||||||
Financial statement line item | As reported |
|
| Adjustment |
|
| As adjusted |
| |||
Deferred tax liability | $ | 31,086 |
|
| $ | (31,086 | ) |
| $ | — |
|
Total noncurrent liabilities |
| 545,981 |
|
|
| (31,086 | ) |
|
| 514,895 |
|
Total liabilities |
| 640,271 |
|
|
| (31,086 | ) |
|
| 609,185 |
|
Accumulated deficit |
| (1,176,468 | ) |
|
| 31,086 |
|
|
| (1,145,382 | ) |
Total stockholders' equity |
| 366,934 |
|
|
| 31,086 |
|
|
| 398,020 |
|
|
|
|
|
|
|
|
|
| |||
Consolidated Statements of Income (Loss), Comprehensive Income (Loss) and Consolidated Statement of Stockholders' Equity, as applicable |
| ||||||||||
| Year ended December 31, 2021 |
| |||||||||
Financial statement line item | As reported |
|
| Adjustment |
|
| As adjusted |
| |||
Income tax expense (benefit) | $ | 1,764 |
|
| $ | (3,072 | ) |
| $ | (1,308 | ) |
Net income (loss) |
| 7,719 |
|
|
| 3,072 |
|
|
| 10,791 |
|
Comprehensive income (loss) |
| 12,521 |
|
|
| 3,072 |
|
|
| 15,593 |
|
Basic Earnings (loss) per share |
| 0.11 |
|
|
| 0.05 |
|
|
| 0.16 |
|
Diluted Earnings (loss) per share |
| 0.11 |
|
|
| 0.04 |
|
|
| 0.15 |
|
|
|
|
|
|
|
|
|
| |||
Consolidated Statements of Cash Flows |
| ||||||||||
| Year ended December 31, 2021 |
| |||||||||
Financial statement line item | As reported |
|
| Adjustment |
|
| As adjusted |
| |||
Net income (loss) | $ | 7,719 |
|
| $ | 3,072 |
|
| $ | 10,791 |
|
Deferred income taxes |
| (2,641 | ) |
|
| (286 | ) |
|
| (2,927 | ) |
Other liabilities |
| (6,031 | ) |
|
| (2,786 | ) |
|
| (8,817 | ) |
The impact of correcting the misstatements on the related financial statement line items for the year ended December 31, 2020 is as follows (in thousands, except per share data):
Consolidated Statements of Income (Loss) and Comprehensive Income (Loss) |
| ||||||||||
| Year ended December 31, 2020 |
| |||||||||
Financial statement line item | As reported |
|
| Adjustment |
|
| As adjusted |
| |||
Income tax expense (benefit) | $ | (119,289 | ) |
| $ | (28,014 | ) |
| $ | (147,303 | ) |
Net income (loss) |
| (817,120 | ) |
|
| 28,014 |
|
|
| (789,106 | ) |
Comprehensive income (loss) |
| (816,282 | ) |
|
| 28,014 |
|
|
| (788,268 | ) |
Basic and Diluted Earnings (loss) per share |
| (12.15 | ) |
|
| 0.41 |
|
|
| (11.74 | ) |
|
|
|
|
|
|
|
|
| |||
Consolidated Statement of Stockholders' Equity |
| ||||||||||
| Year ended December 31, 2020 |
| |||||||||
Financial statement line item | As reported |
|
| Adjustment |
|
| As adjusted |
| |||
Net income (loss) | $ | (817,120 | ) |
| $ | 28,014 |
|
| $ | (789,106 | ) |
Accumulated deficit |
| (1,184,187 | ) |
|
| 28,014 |
|
|
| (1,156,173 | ) |
Total stockholders' equity |
| 340,176 |
|
|
| 28,014 |
|
|
| 368,190 |
|
|
|
|
|
|
|
|
|
| |||
Consolidated Statements of Cash Flows |
| ||||||||||
| Year ended December 31, 2020 |
| |||||||||
Financial statement line item | As reported |
|
| Adjustment |
|
| As adjusted |
| |||
Net income (loss) | $ | (817,120 | ) |
| $ | 28,014 |
|
| $ | (789,106 | ) |
Deferred income taxes |
| (103,582 | ) |
|
| (30,801 | ) |
|
| (134,383 | ) |
Other liabilities |
| (2,530 | ) |
|
| 2,787 |
|
|
| 257 |
|
|
| Year Ended December 31, 2018 |
| |||||||||
|
| As Reported |
|
| Adjustments |
|
| As Adjusted |
| |||
Cost of revenue and operations |
| $ | 92,367 |
|
| $ | (1,934 | ) |
| $ | 90,433 |
|
Product and technology |
|
| 73,970 |
|
|
| (5,181 | ) |
|
| 68,789 |
|
Marketing and sales |
|
| 232,884 |
|
|
| (6,144 | ) |
|
| 226,740 |
|
General and administrative |
|
| 59,684 |
|
|
| 13,259 |
|
|
| 72,943 |
|
Affiliate revenue share |
|
| 15,488 |
|
|
| — |
|
|
| 15,488 |
|
Depreciation and amortization |
|
| 103,810 |
|
|
| — |
|
|
| 103,810 |
|
Total operating expenses |
| $ | 578,203 |
|
| $ | — |
|
| $ | 578,203 |
|
Revenue. The Company accounts for a customer arrangement when the Company and the customer have an approved contract that specifies the rights and obligations of each party and the payment terms, and the Company believes it is probable that the Company will collect substantially all of the consideration to which the Company will be entitled in exchange for the services that will be provided to the customer. The Company periodically enters into arrangements that include multiple promises that the Company evaluates to determine whether the promises are separate performance obligations. The Company identifies performance obligations based on services to be transferred to a customer that are distinct within the context of the contractual terms. The Company allocates the contractual transaction price to each distinct performance obligation based on the relative standalone selling price and recognizes revenue when it satisfies a performance obligation by providing a service to a customer. Revenue is primarily generated through the Company’s direct sales force (Retail revenue) and affiliate sales channels (Wholesale revenue).force.
40
Cars.com Inc.
Notes to Consolidated Financial Statements (Continued)
Marketplace Subscription Advertising Revenue. The Company’s primary source of Retail revenue and Wholesale revenue areis through the sale of marketplace subscription advertising packages to dealer customers through varying levels of subscription packages. The Company’scustomers. Our subscription packages provide theallow dealer customer’s availablecustomers and OEMs to showcase their new and used vehicle inventory to in-market shoppers on the Cars.com website. The subscription packages are generally a fixed price arrangement with avarying contract term generallyterms, typically ranging from three to six months, that isare automatically renewed, typically on a month-to monthmonth-to-month basis. The Company recognizes subscription package revenue ratably as the service is provided over the contract term. Marketplace subscription advertising revenue is recorded in Retail revenue and WholesaleDealer revenue in the Consolidated and Combined Statements of Income (Loss) Income..
The Company also offers its customers several add-on products to the subscription packages.packages, as well as FUEL. Add-on products include premium advertising products that can be uniquely tailored to an individual dealer customer’s current needs. Substantially all of the Company’s add-on products, as well as FUEL, are not sold separately from the subscription packages as the customer cannot benefit from add-on products on their own. Therefore, the subscription packages and add-on products are combined as a single performance obligation, and the Company recognizes the related revenue ratably as the services are provided over the contract term.
The Company also provides services, including hosting related to flexible, custom designedcustom-designed website platforms supporting highly personalized digital marketing campaigns, digital retailing and messaging platform products. In addition, the Company also provides dealers with vehicle valuation and appraisal services through Accu-Trade. The Company recognizes revenue related to these services ratably as the service is provided over the contract term. The related revenue is recorded in RetailDealer revenue in the Consolidated and Combined Statements of Income (Loss) Income..
Prior to October 2019, the Company’s affiliates also sold marketplace subscription advertising to dealer customers, and the Company earned Wholesale revenue through its affiliate agreements. Affiliates were assigned certain sales territories in which they sold the Company’s products. Under these agreements, the Company charged the affiliates 60% of the corresponding Cars.com retail rate for products sold to affiliate dealer customers. The Company recognized Wholesale revenue ratably as the service is provided over the contract term. In situations where the Company’s direct sales force sold the Company’s products within an affiliate’s assigned territory, the Company paid the affiliate a revenue share which was classified as Affiliate revenue share in the Consolidated and Combined Statements of (Loss) Income. Wholesale revenue also includes the amortization of the Unfavorable contracts liability.
Display Advertising Products and Services Revenue. The Company also earns revenue through the sale of display advertising on the Company’s website to dealers, OEMs and other national advertisers, pursuant to transaction-based contracts, which are billed for impressions delivered or click-throughs on their advertisements. An impression is the display of an advertisement to an end-user on the website and is a measure of volume. A click-through occurs when an end-user clicks on an impression. The Company recognizes revenue as the impressions or click-throughs are delivered. If the impressions or click-throughs delivered are less than the amount invoiced to the customer, the difference is recorded as deferred revenue and recognized as revenue when earned. The Company recognizes revenue related to these services at the point in time the service is provided. Display advertising products revenue sold to OEMs and other national advertisers is recorded in OEM and National revenue in the Consolidated Statements of Income (Loss). The Company also provides services related to customized digital marketing and customer acquisition services, including paid, organic, social and creative services to dealer customers. The Company recognizes revenue related to these services at the point in time the service is provided. Display advertising products revenue sold to dealer customersdealers is recorded in RetailDealer revenue in the Consolidated and Combined Statements of Income (Loss) Income..
38
Cars.com Inc.
Notes to Consolidated and Combined Financial Statements (Continued)
Pay Per Lead Revenue. The Company also sells leads, which are connections from consumers to dealer customers in the form of phone calls, emails and text messages, to dealer customers, OEMs and third-party resellers. The Company recognizes pay per lead revenue primarily on a per-lead basis at the point in time in which the lead has been delivered. Revenue related to pay per lead is recorded in RetailDealer revenue, OEM and WholesaleNational revenue or Other revenue depending on the customer who is purchasing this product, in the Consolidated and Combined Statements of Income (Loss) Income..
Other Revenue. Other revenue primarily includes revenue related to vehicle listing data sold to third-parties and peer-to-peer vehicle advertising.third parties. The Company recognizes other revenue either ratably as the services are provided or at the point in time the services have been performed. In connection with the Accu-Trade Acquisition, the Company entered into an agreement to provide one of the former owners with a one-year license to a certain product. The recognition of revenue associated with the license fee is recorded in Other revenue. Other revenue is recorded in RetailOther revenue in the Consolidated and Combined Statements of Income (Loss) Income..
Cash and Cash Equivalents. All cash balances and liquid investments with original maturities of three months or less on their acquisition date are classified as cash and cash equivalents.
Accounts Receivable and Allowance for Doubtful Accounts. Accounts receivable are primarily derived from sales to dealer customers and OEMs and recorded at invoiced amounts. The allowance for doubtful accounts reflects the Company’s estimate of credit exposure, determined principally on the basis of its collection experience, aging of its receivables, expected losses and any specific reserves needed for certain customers based on their credit risk. Bad debt expense for the years ended December 31, 2019, 2018 and 2017 was $4.9 million, $4.4 million and $2.5 million, respectively, and is included in Marketing and sales in the Consolidated and Combined Statements of Income (Loss) Income.. The allowance for doubtful accounts was $1.9 million and $1.7 million as of December 31, 2022 and 2021, respectively.
Concentrations of Credit Risk. The Company’s financial instruments, consisting primarily of cash and cash equivalents and customer receivables, are exposed to concentrations of credit risk. The Company invests its cash and cash equivalents with highly-ratedhighly rated financial institutions.
41
Cars.com Inc.
Notes to Consolidated Financial Statements (Continued)
Investments. Investments in non-marketable equity securities are measured at fair value with changes in fair value recognized in Net income (loss) income.. The Company utilizes the measurement alternative for equity investments without readily determinable fair values and revalues these investments upon the occurrence of an observable price change for similar investments.The non-marketable investments recorded within Investments and other assets on the Consolidated Balance Sheets were $9.4 million as of December 31, 2019 and 2018. On at least an annual basis, the Company assesses its investments to determine whether any events have occurred, or circumstances have changed, which might have a significant adverse effect on their fair value and which may be indicative of impairment. There were 0 impairmentsIn the first quarter of 2020, the Company recorded a full impairment of $9.4 million, triggered by the novel coronavirus disease 2019 (“COVID-19”) pandemic and the related restrictions, for the periods presentedyear ended December 31, 2020. The impairment was included in the Other expense, net in the Consolidated and Combined Statements of Income (Loss) Income.. The non-marketable investments recorded within Investments and other assets, net on the Consolidated Balance Sheets were zero as of December 31, 2022 and 2021. For further information on the triggering event, see Note 6 (Goodwill and Other Intangible Assets, net).
Property and Equipment. Property and equipment are recorded at cost and depreciated on a straight-line basis over the estimated useful lives as follows (in thousands):
|
| December 31, |
|
|
|
| December 31, |
|
| |||||||||||
Asset |
| 2019 |
|
| 2018 |
|
| Estimated Useful Life |
| 2022 |
|
| 2021 |
|
| Estimated Useful Life | ||||
Computer software |
| $ | 46,636 |
|
| $ | 29,300 |
|
| 18 months - 5 years |
| $ | 79,682 |
|
| $ | 65,461 |
|
| 18 months - 5 years |
Computer hardware |
|
| 19,429 |
|
|
| 19,461 |
|
| 3 - 5 years |
|
| 12,550 |
|
|
| 11,998 |
|
| 3 years - 5 years |
Leasehold improvements |
|
| 18,581 |
|
|
| 18,656 |
|
| Lesser of useful life or lease term | ||||||||||
Furniture and fixtures |
|
| 4,757 |
|
|
| 4,970 |
|
| 10 years |
|
| 4,140 |
|
|
| 4,293 |
|
| 10 years |
Leasehold improvements |
|
| 19,151 |
|
|
| 18,594 |
|
| Lesser of useful life or lease term | ||||||||||
Property and equipment, gross |
|
| 89,973 |
|
|
| 72,325 |
|
|
|
|
| 114,953 |
|
|
| 100,408 |
|
| |
Less: Accumulated depreciation |
|
| (46,277 | ) |
|
| (30,843 | ) |
|
|
|
| (69,735 | ) |
|
| (57,403 | ) |
| |
Property and equipment, net |
| $ | 43,696 |
|
| $ | 41,482 |
|
|
|
| $ | 45,218 |
|
| $ | 43,005 |
|
| |
Depreciation expense for the years ended December 31, 2019, 2018 and 2017 was $18.3 million, $12.8 million and $10.8 million, respectively. Normal repairs and maintenance are expensed as incurred. Any resulting gain or loss from the disposition of thosefixed assets is included in General and administrative expense on the Consolidated and Combined Statements of Income (Loss) Income..
Internally Developed Technology. The Company capitalizes costs associated with customized internal-use software systems and website development that have reached the application development stage. Such capitalized costs include external direct costs utilized in developing or obtaining the applications and payroll and payroll-related expenses for employees who are directly associated with the applications. Capitalization of such costs begins when the preliminary project stage is complete and ceases at the point in which the project is substantially complete and ready for its intended purpose. The Company reviews the carrying amount of internally developed technology for impairment and useful lives whenever events or changes in circumstances indicate that the carrying amount may not be recoverable. Capitalized software costs, excluding cloud computing arrangements, for the years ended December 31, 2019, 20182022, 2021 and 20172020 were $19.8$18.1 million, $11.5$
39
Cars.com Inc.
Notes to Consolidated and Combined Financial Statements (Continued)
17.9million and $6.9$16.3 million, respectively. Capitalized costs, excluding those for cloud computing arrangements, are included in Property and equipment, net on the Consolidated Balance Sheets. Research and development costs are expensed as incurred.
Cloud Computing Arrangements. TheCompany capitalizes costs associated with the development of cloud computing arrangements in a manner consistent with internally developed technology. Any amortization is recorded in the same manner on the Consolidated Statements of Income (Loss) as the expense associated with the underlying host arrangement. These capitalized costs as of December 31, 2022 were $1.0 million and $4.7 million in Prepaid expenses and Investments and other assets, net on the Consolidated Balance Sheets, respectively. These capitalized costs as of December 31, 2021 were $0.6 million and $2.6 million in Prepaid expenses and Investments and other assets, net on the Consolidated Balance Sheets, respectively. Research and development costs are expensed as incurred.
Goodwill and Other Intangible Assets. Goodwill represents the excess of acquisition cost over the fair value of assets acquired, including identifiable intangible assets, net of liabilities assumed. As of December 31, 2019, the Company had $505.9 million of goodwill which resulted from TEGNA’s acquisition of Cars.com in 2014, the acquisition of DealerRater.com in 2016 and the DI Acquisition in 2018.
Goodwill is tested for impairment on an annual basis or between annual tests if events occur or circumstances change that would more likely than not reduce the fair value of a reporting unit below its carrying amount. The Company’s goodwill is tested for impairment annually as of November 1 and at a level referred to as the reporting unit. The level at which the Company teststested goodwill for impairment requires the Company to determine whether the operations below the business segment level constitute a business for which discrete financial information is available and segment management regularly reviews the operating results. The Company has determined that CARS operatesit operated as a single reporting unit.
The process of estimating the fair value of goodwill is subjective and requiresrequired the Company to make estimates that may significantly impact the outcome of the analysis. A qualitative assessment is performed at least annually and considers events and circumstances such as macroeconomic conditions,
42
Cars.com Inc.
Notes to Consolidated Financial Statements (Continued)
industry and market conditions, cost factors and overall financial performance, as well as company specifications. If after performing this assessment, the Company concludesconcluded it is more likely than not that the fair value of the reporting unit is less than its carrying amount, then the Company performsperformed the quantitative test.
Under the quantitative test, a goodwill impairment is identified by comparing the fair value of the reporting unit to the carrying amount, including goodwill. If the carrying amount of the reporting unit exceeds the fair value of the reporting unit, goodwill is considered impaired and an impairment charge is recognized in an amount equal to the excess, not to exceed the carrying amount of goodwill.
The
If a quantitative test is performed, the Company estimatedestimates the fair value of the reporting unit by utilizingwith an income approach which uses ausing the discounted cash flow (“DCF”) analysis and the Company also consideredconsiders a market-based valuation methodology using comparable public company trading values.values and the Company’s market capitalization. Determining fair value requires the exercise of significant judgments, including the amount and timing of expected future cash flows, long-term growth rates, the discount rate and relevant comparable public company earnings multiples. The cash flows employed in the DCF analysis are based on the Company’s best estimate of future sales, earnings and cash flows after considering factors such as general market conditions and recent operating performance. The discount rate utilized in the DCF analysis is based on the reporting unit’s weighted-average cost of capital, which takes into account the relative weights of each component of capital structure (equity and debt) and represents the expected cost of new capital, adjusted as appropriate to consider the risk inherent in future cash flows of the Company’s reporting unit.
Impairment assessment inherently involves management judgments regarding a number of assumptions described above. The reporting unit fair value also depends on the future strength of the U.S. economy. New and developing competition as well as technological change could also adversely affect future fair value estimates. Due to the many variables inherent in the estimation of a reporting unit’s fair value and the relative size of the Company’s recorded goodwill, differences in assumptions could have a material effect on the estimated fair values. For further information, see Note 6 (Goodwill and Other Intangible Assets)Assets, net).
In connection with the
The Company’s acquisition by TEGNA, the Company recorded anindefinite-lived intangible asset with an indefinite life associated withrelates to the Cars.com trade name. The indefinite-lived intangible asset isIntangible assets with indefinite lives are tested for impairment annually, or more often if circumstances dictate, for impairment and is written down to fair value as required. The estimateestimates of fair value isare determined using the “relief from royalty” methodology, which is a variation of the income approach. The discount rate assumption is based on an assessment of the risk inherent in the projected future cash flows generated by the trade name intangible asset.
Amortizable intangible assets are amortized on a straight-line basis over the estimated useful lives as follows:
Intangible Asset | Estimated Useful Life | |
Acquired software | 2 - 7 years | |
|
| |
|
| |
|
| |
Other trade names | 10 - 12 years |
40
Cars.com Inc.
Notes to Consolidated and Combined Financial Statements (Continued)
Valuation of Long-Lived Assets. The Company reviews the carrying amount of long-lived assets for impairment whenever events or changes in circumstances indicate that the carrying amount may not be recoverable. Once an indicator of potential impairment has occurred, the impairment test is based on whether the intent is to hold the asset for continued use or to hold the asset for sale. If the intent is to hold the asset for continued use, the impairment test first requires a comparison of projected undiscounted future cash flows against the carrying amount of the asset group. If the carrying value of the asset group exceeds the estimated undiscounted future cash flows, the asset group would be deemed to be potentially impaired. The impairment, if any, would be measured based on the amount by which the carrying amount exceeds the fair value. Fair value is determined primarily using the projected future undiscounted cash flows. Losses on long-lived assets to be disposed of are determined in a similar manner, except that fair values are reduced for the cost to dispose. NaNNo material impairment losses for long-lived assets were recognized for the periods presented in the Consolidated and Combined Statements of Income (Loss) Income..
Fair Value of Financial Instruments. Fair value is the price that would be received upon sale of an asset or paid upon transfer of a liability in an orderly transaction between market participants at the measurement date and in the principal or most advantageous market for that asset or liability. The fair value should be calculated based on assumptions that market participants would use in pricing the asset or liability, not on assumptions specific to the entity. The three-level hierarchy of fair value measurements is based on whether the inputs to those measurements are observable or unobservable. Observable inputs reflect market data obtained from independent sources, while unobservable inputs reflect our market assumptions. The fair-value hierarchy requires the use of observable market data when available and consists of the following levels:
43
Cars.com Inc.
Notes to Consolidated Financial Statements (Continued)
The Company’s financial instruments include marketable securities heldthe contingent consideration related to our acquisitions and, before the year ended December 31, 2022, the interest rate swap (the “Swap”), both recorded at fair value. Financial instruments also include accounts receivable, accounts payable debt and other liabilities. The carrying values of these instruments approximate their fair values.
The Company’s debt is classified as Level 2 in the fair value hierarchy and the fair value is measured based on comparable trading prices, ratings, sectors, coupons and maturities of similar instruments. Level 2 assets and liabilities are based on observable inputs other than quoted prices, such as quoted prices for similar assets and liabilities in active markets, quoted prices for identical or similar assets and liabilities in markets that are not active, or other inputs that are observable or can be corroborated by observable market data. As of December 31, 2022, the fair value of the outstanding indebtedness was approximately $435.4 million, compared to the carrying value of $481.3 million. As of December 31, 2021, the fair value of the outstanding indebtedness was approximately $502.7 million, compared to the carrying value of $477.5 million.
The contingent consideration is classified as Level 3 in the fair value hierarchy and the fair value is measured based on a Monte Carlo simulation or a scenario-based method, depending on the earn-out achievement objective, utilizing projections about future performance. Significant inputs include volatility and projected financial information.
Contingent Consideration. The Company's contingent consideration obligations are from arrangements resulting from acquisitions that involve potential future payment of consideration that is contingent upon the achievement of certain financial metrics or lender market share. Contingent consideration was recognized at its estimated fair value at the date of acquisition based on our expected future payment, discounted using a weighted average cost of capital in accordance with accepted valuation methodologies.
The Company reviews and reassesses the estimated fair value of contingent consideration liabilities at each reporting period and the updated fair value could differ materially from the initial estimates. The Company measures contingent consideration recognized in connection with acquisitions at fair value on a recurring basis using significant unobservable inputs classified as Level 3 inputs. The fair value is measured based on a Monte Carlo simulation or a scenario-based method, depending on the earnout objective. The fair value measurement includes the following significant inputs: volatility and projected financial information. Significant increases or decreases to any of these inputs in isolation could result in a significantly higher or lower liability. Ultimately, the liability will be equivalent to the amount paid, and the difference between the fair value estimate on the acquisition date and each reporting period and the amount paid will be recognized in earnings.
Derivative Financial Instrument. The interest rate on borrowings under the Company’s Term Loan is floating and, therefore, subject to fluctuations. In order to manage the risk associated with changes in interest rates on its borrowing under the Term Loan, the Company entered into an interest rate swap (the “Swap”)the Swap effective December 31, 2018. Under the terms of the Swap, the Company is locked into a fixed rate of interest of 2.96% plus an applicable margin,2.96%, as defined in the Credit Agreement, principally utilized to fund the Separation and the DI Acquisition, on a notional amount of $300$300 million.
The Swap is designatedamendment entered into in June 2020 (the “Second Amendment”) resulted in the loss of hedge accounting. For further information, see Note 8 (Interest Rate Swap). As a result, as a cash flow hedge of interest rate risk and recorded at fair value in Other accrued liabilities and Other noncurrent liabilities on the Consolidated Balance Sheets. Any gains or losses ondate of the Swap are reported as a component ofSecond Amendment, the unrealized loss included within Accumulated other comprehensive loss untilwas ratably reclassified into Net income (loss) over the remaining life of the Swap. Each period, a portion of the unrealized loss was recorded to Interest expense, net inand Income tax expense (benefit) within the same periodConsolidated Statements of Income (Loss). Subsequent to the hedge transaction impacts earnings. As of December 31, 2019,Second Amendment, any changes in the fair value of the Swap was an unrealized losswere recorded within Other expense, net on the Consolidated Statements of $Income (Loss).10.2
million,
A third amendment was entered into in October 2020 (the “Third Amendment”), which resulted in the partial extinguishment of which $the existing debt at the time of the amendment. Due to the reduction in value of the underlying Term Loan upon the Third Amendment as compared to the notional amount of the Swap, a proportional amount of the frozen Accumulated other comprehensive loss balance was immediately reclassified into Interest expense, net. The Swap expired on May 31, 2022 and, as such, is no longer recorded on the4.2
44
Cars.com Inc.
Notes to Consolidated Financial Statements (Continued)
million and $
6.0 million is recorded inConsolidated Balance Sheets. As of December 31, 2021 the Swap was recognized within Other accrued liabilities and Other noncurrent liabilities, respectively, on the Consolidated Balance Sheets. During the year ended December 31, 2019, $2.0Sheets at fair value. million was reclassified from Accumulated other comprehensive loss into Interest expense, net.
Income Taxes. Income taxes are presented on the Consolidated and Combined Financial Statements using the asset and liability method, under which deferred tax assets and liabilities are recognized based on the future tax consequences attributable to temporary differences that exist between the financial statement carrying amount of assets and liabilities and their respective tax basis, as well as from operating loss and tax credit carry-forwards.carryforwards. Deferred income taxes reflect expected future tax benefits (i.e. assets) and future tax costs (i.e. liabilities). The Company measures deferred tax assets and liabilities using the enacted tax rate expected to apply to taxable income in the years in which those temporary differences are expected to be recoverable or settled. The Company recognizes the effect on deferred taxes of a change in tax rates in income in the period that includes the enactment date. Valuation allowances are established if, based upon the weight of available evidence, management determines it is “more likely than not” that some portion or all of the deferred tax asset will not be realized.
The Company recognizes the tax benefit from an uncertain tax position only if it is more likely than not that the tax position will be sustained on examination by the taxing authorities, based on the technical merits of the position. The tax benefits recognized in the financial statements from such a position are measured based on the largest benefit that has a greater than 50% likelihood of being realized upon ultimate resolution. The Company’s uncertain tax position reserves are reviewed periodically and are adjusted as events occur that affect its estimates, such as the availability of new information, the lapsing of applicable statutes of limitation, the conclusion of tax audits, the measurement of additional estimated liability, the identification of new tax matters, the release of administrative tax guidance affecting its estimates of tax liabilities or the rendering of relevant court decisions. Uncertain tax positions that relate to deferred tax assets are recorded against deferred tax assets; otherwise, uncertain tax positions are recorded as either a current or noncurrent liability in the Consolidated Balance Sheets. The Company records penalties and interest relating to uncertain tax positions in Income tax expense (benefit) expense in the Consolidated and Combined Statements of Income (Loss) Income. The Company has not recorded any material expense or liabilities related to interest or penalties in its Consolidated and Combined Financial Statements. . For further information, see Note 14 (Income Taxes).
Stock-Based Compensation. Stock-based compensation expense is recognized on a straight-line basis over the vesting period. Forfeitures are recorded at the time the forfeiture event occurs. For further information, see Note 12 (Stock-Based Compensation).
Advertising Costs. The Company expenses all advertising costs as they are incurred and are included in Marketing and sales in the Consolidated and Combined Statements of Income (Loss) Income.. Advertising expense for the years ended December 31, 2019, 20182022, 2021 and 20172020 was $115.8$107.1 million, $109.2$104.4 million and $104.6$80.4 million, respectively.
Cost of Revenue and Operations. Cost of revenue and operations consistexpense primarily consists of expensescosts related to the pay-per-lead products, third-party costs such as processing of dealer vehicle inventory, pay per lead products, product fulfillment and compensation costs for the product fulfillment and customer service teams.
Affiliate Revenue Share Expense. In connection with the October 2014 acquisition of CARS by the Company’s former parent, the Company entered into affiliate agreements with the former owners of CARS. The Company amended five of its affiliate agreements (Gannett, McClatchy, TEGNA, tronc, and related compensation costs.the Washington Post) and as a result, had a direct relationship with these dealer customers before the original contractual conversion date specified. As part of the amendments to the affiliate agreements, Gannett, McClatchy, TEGNA, tronc, and the Washington Post agreed to perform certain marketing support and transition services through varying dates, the latest of which was June 29, 2020. The fees the Company incurred associated with the amended affiliate agreements were recorded as Affiliate revenue share expense within Operating expenses in the Consolidated Statements of Income (Loss). As of June 30, 2020, the Company no longer incurs affiliate revenue share expense.
41
Cars.com Inc.
Notes to Consolidated and Combined Financial Statements (Continued)
Defined Contribution Plans. The Company’s employees are eligible to participate in a defined contribution plan. Participants are eligible on the first day of the quarter following thetheir date of hire after one month of service and are allowed to make tax-deferred contributions up to 100%90% of annual compensation, subject to limitations specified by the Internal Revenue Code of 1986, as amended. Employer contributions consist of matching contributions and/or non-elective employer contributions. The Company provides a maximum match for 4%4% of the employee’s salary and contributions are immediately fully vested. As part of the cost reduction efforts in response to the COVID-19 pandemic and related restrictions, beginning in the second quarter of 2020, the Company temporarily suspended the employer match of employees’ defined contribution plans for a portion of the year ended December 31, 2020. As of December 31, 2020, the Company’s match was fully reinstated. The Company’s contributions to its defined contribution plans for the years ended December 31, 2019, 20182022, 2021 and 20172020 were $4.3$5.5 million, $4.4$5.0 million and $4.1$2.4 million, respectively.
Note 3. Recent Accounting Pronouncements
Recently Issued Accounting Pronouncements
Financial Instruments – Credit Losses. In June 2016, the Financial Accounting Standards Board (“FASB”) issued Accounting Standards Update (“ASU”) No. 2016-13, Financial Instruments—Credit Losses changing the way credit losses on accounts receivable are estimated. Under current U.S. GAAP, credit losses on trade accounts receivable are recognized once it is probable that such losses will occur. Under this ASU, the Company will be required to estimate credit losses based on the expected amount of future collections which may result in earlier recognition of allowance for doubtful accounts. This ASU will be effective in the first quarter of 2020 and will be adopted using a modified retrospective approach. The Company has evaluated this new guidance and it will not have a material impact on its Consolidated and Combined Financial Statements and related disclosures.
Cloud Computing Arrangements.In August 2018, the FASB issued ASU 2018-15, Customer’s Accounting for Implementation Costs Incurred in a Cloud Computing Arrangement That Is a Service Contract, aligning the requirements for capitalizing implementation costs incurred in a hosting arrangement that is a service contract with the requirements for capitalizing implementation costs for internal-use software. This ASU will be effective in the first quarter of 2020 and will be adopted on a prospective basis.The Company has evaluated this new guidance and it will not have a material impact on its Consolidated and Combined Financial Statements and related disclosures.
Recently Adopted Accounting Pronouncements
Revenue Recognition. The FASB amended the FASB Accounting Standards Codification (“ASC”) and created Topic 606, Revenue from Contracts with Customers (“ASC 606”). Under ASC 606, revenue recognition occurs when a customer obtains control of promised goods or services in an amount that reflects the consideration which the Company expects to receive in exchange for those goods or services. In addition, ASC 606 requires additional disclosures about the nature, amount, timing and uncertainty of revenue and cash flows arising from contracts with customers. The Company’s primary source of revenue is the sale of marketplace subscription advertising to car dealerships, which will continue to be recognized ratably over the contract term as the service is provided to the customer. Effective January 1, 2018, the Company adopted ASC 606 using the modified retrospective method. The adoption did not have a material impact on its Consolidated and Combined Financial Statements and related disclosures. For further information, see Note 5 (Revenue).
Leases. In February 2016, the FASB issued ASU 2016-02, Leases (ASU 2016-02)in order to increase transparency and comparability among organizations by recognizing lease assets and lease liabilities on the balance sheet for those leases classified as operating leases under current U.S. GAAP. The new guidance requires a lessee to recognize a liability to make lease payments (the “lease liability”) and a right-of-use asset representing its right to use the underlying asset for the lease term on the balance sheet. ASU 2016-02 is effective for fiscal years beginning after December 15, 2018 (including interim periods within those periods) using a modified retrospective approach and early adoption is permitted. The Company adopted ASU 2016-02 in the first quarter of 2019 utilizing the modified retrospective transition approach for leases existing at, or entered into after, the beginning of the first quarter of 2019 and did not recast the comparative periods presented in the Consolidated and Combined Financial Statements upon adoption. The Company elected the ‘package of practical expedients’ and did not reassess its prior conclusions about lease identification, lease classification and initial direct costs. The Company also elected the short-term lease recognition exemption for all leases that qualify and did not recognize right-of-use assets or lease liabilities for those leases. The Company’s lease agreements are principally related to real estate. The adoption of ASU 2016-02 resulted in the recognition of operating lease assets of $18.2 million and $35.0 million in operating lease liabilities on its Consolidated Balance Sheets. The difference between the operating lease assets and the operating lease liabilities relates to the derecognition of the Company’s deferred rent obligation, which included the impact of a lease incentive received in 2017 related to the 300 South Riverside Lease in Chicago, Illinois and was already recorded on the Consolidated Balance Sheets at the time of the adoption.
42
Cars.com Inc.
Notes to Consolidated and Combined Financial Statements (Continued)
Note 3. Business Combinations
Note 4. Business Combination
Accu-Trade Acquisition.On February 21, 2018,March 1, 2022, the Company acquired allcertain of the outstanding stockassets and assumed certain liabilities of Dealer InspireAccu-Trade, LLC; Accu-Trade Canada, LLC; Galves Market Data; and Headstart Logistics, LLC d/b/a/ MADE Logistics (collectively,
45
Cars.com Inc.
Notes to Consolidated Financial Statements (Continued)
“Accu-Trade”), an innovativewhich provides dealers with VIN-specific vehicle valuation and appraisal data, instant offer capabilities and logistics technology leader providing progressive dealer websites, digital retailing and messaging platform products, and substantially all of the net assets of Launch Digital Marketing LLC, a provider of digital marketing services, including paid, organic, social and creative services. Dealer Inspire consists of proprietary solutions that are complementary extensions of the Company’s online marketplace platform and current suite of dealer solutions.(the “Accu-Trade Acquisition”).
The Company expensed as incurred total acquisition costs of $4.9$2.0 million, of which $4.3$1.0 million waswere recorded during the twelve monthsyear ended December 31, 2018.2022. These costs were recorded in General and administrative expenses in the Consolidated and Combined Statements of Income (Loss) Income. In connection with the DI Acquisition, Dealer Inspire’s unvested equity awards were cash settled for a total of $5.7 million. The fair value of these awards was based on the price paid per common share to the owners of the acquired businesses and recognized immediately after the DI Acquisition as compensation expense in the Company’s Consolidated and Combined Statements of (Loss) Income..
Preliminary Purchase Price Allocation.The preliminary fair values assigned to the tangible and intangible assets acquired and liabilities assumed were determined based on management’s estimates and assumptions, as well as other information compiled by management, including third-party valuations that utilize customary valuation procedures and techniques, such as the income approach. multi-period excess earnings and the relief of royalty methods. These preliminary fair values are subject to change within the one-year measurement period. The DIAccu-Trade Acquisition purchase price allocation is as follows (in thousands):
|
| Acquisition-date Fair Value |
| |
Cash consideration (1) |
| $ | 164,333 |
|
Contingent consideration (2) |
|
| 2,200 |
|
Cash settlement of DI Acquisition's unvested equity awards (3) |
|
| (5,700 | ) |
Total consideration |
| $ | 160,833 |
|
|
|
|
|
|
Cash |
| $ | 1,480 |
|
Accounts receivable |
|
| 11,291 |
|
Property and equipment |
|
| 1,215 |
|
Other assets |
|
| 320 |
|
Identified intangible assets (4) |
|
| 71,900 |
|
Total assets acquired |
|
| 86,206 |
|
Accounts payable |
|
| (2,514 | ) |
Deferred tax liability |
|
| (14,741 | ) |
Other liabilities |
|
| (4,460 | ) |
Total liabilities assumed |
|
| (21,715 | ) |
Net identifiable assets |
|
| 64,491 |
|
Goodwill |
|
| 96,342 |
|
Total consideration |
| $ | 160,833 |
|
|
| Preliminary |
| |
Cash consideration |
| $ | 64,663 |
|
Other consideration (1) |
|
| 5,300 |
|
Contingent consideration (2) |
|
| 23,936 |
|
Total purchase consideration |
| $ | 93,899 |
|
|
|
|
| |
Assets acquired (3) |
| $ | 1,595 |
|
Identified intangible assets (4) |
|
| 15,679 |
|
Total assets acquired |
|
| 17,274 |
|
Total liabilities assumed (5) |
|
| (235 | ) |
Net identifiable assets |
|
| 17,039 |
|
Goodwill |
|
| 76,860 |
|
Total purchase consideration |
| $ | 93,899 |
|
(1) In connection with the Accu-Trade Acquisition, the Company entered into an agreement to provide one of the former owners with a one-year license to a certain product. The preliminary fair value of the license was determined to be $6.5 million, of which the Company received $1.2 million in cash upon the close of the Accu-Trade Acquisition. The $5.3 million difference between the fair value of $6.5 million and the $1.2 million in cash was recorded as non-cash consideration and the $6.5 million license fee was recorded in Other accrued liabilities as a contract liability on the Consolidated Balance Sheets and is being amortized into Other revenue on the Consolidated Statements of Income (Loss) over the one-year contract term. The current period revenue related to the non-cash consideration of $5.3 million is a non-cash reconciling item titled Amortization of deferred revenue related to Accu-Trade Acquisition on the Consolidated Statements of Cash Flows. |
|
Cash consideration |
| $ | 164,333 |
|
Less: Cash settlement of DI Acquisition's unvested equity awards (3) |
|
| (5,700 | ) |
Less: Cash acquired |
|
| (1,480 | ) |
Payment for DI Acquisition, net |
| $ | 157,153 |
|
|
|
43
Cars.com Inc.
Notes to Consolidated and Combined Financial Statements (Continued)
|
|
|
|
|
| DI Acquisition-Date Fair Value (in thousands) |
|
| Weighted-Average Amortization Period (in years) | |
Acquired software |
| $ | 39,500 |
|
| 4 |
Customer relationships |
|
| 18,300 |
|
| 4 |
Trade names |
|
| 14,100 |
|
| 10 |
Total |
| $ | 71,900 |
|
|
|
In addition to the total consideration of $160.8 million, the Company granted stock-based compensation awards, worth up to $25.5 million, to certain employees. These awards require continued employee service and are based on Dealer Inspire’s future performance related to certain revenue targets to be attained over a three-year performance period.period; based on certain tiered performance metrics the maximum amount to be paid is $63.0 million, of which a maximum of $15.0 million could be in stock, with additional upside for performance that exceeds the tiered performance metrics. The contingent consideration is classified as Level 3 in the fair value hierarchy. The fair value is measured based on a Monte Carlo simulation. This amount represents the estimated fair value at the time of the acquisition. For furthermore information seeon the fair value of the Accu-Trade contingent consideration, see Note 12 (Stock-Based Compensation)4 (Fair Value Measurements).
|
| Acquisition-Date |
|
| Amortization Period | |
Acquired software |
| $ | 12,926 |
|
| 5 |
Trade name |
|
| 1,446 |
|
| 10 |
Customer relationships |
|
| 1,307 |
|
| 7 |
Total |
| $ | 15,679 |
|
|
|
46
Cars.com Inc.
Goodwill. Notes to Consolidated Financial Statements (Continued)
In connection with the DIAccu-Trade Acquisition, the Company recorded goodwill in the amount of $96.3$76.9 million, which is primarily attributable to sales growth from existing and future technology, product offerings, and customers and the value of the acquired assembled workforce. OfAll of the total goodwill recorded in connection with the DI Acquisition, approximately $15.0 million wasis considered deductible for income tax purposes.
Pro forma Financial Information (unaudited). The unaudited pro forma revenue and net income of the Company and Dealer Inspire are $669.8 million and $46.1 million as of December 31, 2018, respectively. This information gives effect to pro forma events that are factually supportable and directly attributable to the transaction. The unaudited pro forma results reflect adjustments for compensation expense related to the cash settlement of Dealer Inspire’s unvested equity awards; acquisition and integration costs; incremental intangible assets amortization basedAccu-Trade Acquisition would have had an immaterial impact on the fair values of each identifiable intangible asset; certain other compensation related costs, including retention bonuses and stock-based compensation; and interest expense on the borrowings under the revolving loan to fund the DI Acquisition. Pro forma adjustments were tax-affected at the Company’s corporate blended statutory tax rate applicable during the respective periods presented.
This unaudited pro forma information is presented for informational purposes only and may not be indicative of the historical results of operations that would have been obtained if the DI Acquisition had taken place on January 1, 2018, nor the results that may be obtained in the future. The unaudited pro forma information does not reflect future synergies or other such costs or savings.
From the date of the DI Acquisition, the Company included Dealer Inspire’sConsolidated financial results in its Consolidated and Combined Statements of (Loss) Incomestatements for the year ended December 31, 2018. Dealer Inspire contributed revenue2021 and 2020.
CreditIQ Acquisition.On November 5, 2021, the Company acquired all of $53.1the outstanding stock of CreditIQ, (the “CIQ Acquisition”) an automotive fintech platform that provides instant online loan screening and approvals to facilitate online car buying. Through the CIQ Acquisition, the Company now provides dealers with access to advanced digital financing technology across the CARS platform.
The Company expensed as incurred total acquisition costs of $1.3 million during the year ended December 31, 2021. These costs were recorded in General and a net lossadministrative in the Consolidated Statements of $11.3 million.The net loss includes $14.0 million of incremental intangible asset amortization and $8.2 million of costs related toIncome (Loss). In connection with the DICIQ Acquisition, primarily related to the cash settlement of Dealer Inspire’sCreditIQ’s unvested equity awards were cash settled for a total of $9.6 million. The fair value of these awards was based on the price paid per common share to the owners of the acquired business and acquisition-related costs, bothrecognized immediately after the CIQ Acquisition as compensation expense in the Company’s Consolidated Statements of which are on a pre-tax basis.Income (Loss).
44Purchase Price Allocation.The fair values assigned to the tangible and intangible assets acquired and liabilities assumed were determined based on management’s final estimates and assumptions, as well as other information compiled by management, including third-party valuations that utilize customary valuation procedures and techniques, such as the multi-period excess earnings and the relief of royalty methods. The CIQ Acquisition purchase price allocation is as follows (in thousands):
|
| Acquisition-date |
| |
Cash consideration (1) |
| $ | 29,965 |
|
Contingent consideration (2) |
|
| 23,805 |
|
Cash settlement of CIQ Acquisition's unvested equity awards (3) |
|
| (9,626 | ) |
Total purchase consideration |
| $ | 44,144 |
|
|
|
|
| |
Assets acquired (4) |
| $ | 193 |
|
Identified intangible assets (5) |
|
| 19,900 |
|
Total assets acquired |
|
| 20,093 |
|
Total liabilities assumed (6) (7) |
|
| (1,945 | ) |
Net identifiable assets |
|
| 18,148 |
|
Goodwill (7) |
|
| 25,996 |
|
Total purchase consideration |
| $ | 44,144 |
|
Cash consideration |
| $ | 29,965 |
|
Less: Cash settlement of CIQ Acquisition's unvested equity awards (3) |
|
| (9,626 | ) |
Less: Cash acquired |
|
| (81 | ) |
Payments for CIQ Acquisition, net of cash acquired |
| $ | 20,258 |
|
47
Cars.com Inc.
Notes to Consolidated and Combined Financial Statements (Continued)
|
| Acquisition-Date |
|
| Weighted-Average | |
Trade name |
| $ | 900 |
|
| 10 |
Acquired software |
|
| 19,000 |
|
| 5 |
Total |
| $ | 19,900 |
|
|
|
In connection with the CIQ Acquisition, the Company recorded goodwill in the amount of $26.0 million, which is primarily attributable to sales growth from existing and future technology, product offerings, customers and the value of the acquired assembled workforce. All of the goodwill is considered non-deductible for income tax purposes.
The CIQ Acquisition would have had an immaterial impact on the Company’s Consolidated financial statements for the year ended December 31, 2021 and 2020.
Note 4. Fair Value Measurements
The Company's contingent consideration measured at fair value on a recurring basis consisted of the following (in thousands):
|
|
|
| Fair value measurement at reporting date |
| ||||||||||
| Total as of |
|
| Level 1 |
|
| Level 2 |
|
| Level 3 |
| ||||
Contingent consideration | $ | 55,871 |
|
| $ | — |
|
| $ | — |
|
| $ | 55,871 |
|
Total | $ | 55,871 |
|
| $ | — |
|
| $ | — |
|
| $ | 55,871 |
|
|
|
|
| Fair value measurement at reporting date |
| ||||||||||
| Total as of |
|
| Level 1 |
|
| Level 2 |
|
| Level 3 |
| ||||
Contingent consideration | $ | 23,805 |
|
| $ | — |
|
| $ | — |
|
| $ | 23,805 |
|
Total | $ | 23,805 |
|
| $ | — |
|
| $ | — |
|
| $ | 23,805 |
|
The rollforward of the Level 3 contingent consideration from December 31, 2021 is as follows (in thousands):
| As of |
|
| Addition Related to |
|
| Fair Value |
|
| As of |
| ||||
Contingent consideration | $ | 23,805 |
|
| $ | 23,936 |
|
| $ | 8,130 |
|
| $ | 55,871 |
|
The contingent consideration is classified on the Consolidated Balance Sheets based on expected payment dates. As of December 31, 2022, $9.4 million and $46.5 million were included within Other accrued liabilities and Other noncurrent liabilities on the Consolidated
48
Cars.com Inc.
Notes to Consolidated Financial Statements (Continued)
Balance Sheets. As of December 31, 2021, $23.8 million was included within Other noncurrent liabilities on the Consolidated Balance Sheets.
The significant inputs and assumptions that were used in the contingent consideration valuations as of December 31, 2022 related to volatility ranged from 25% to 49%.
We expect to make payments on the contingent consideration in 2023, 2024 and 2025. For more information relating to contingent consideration, see Note 3 (Business Combinations).
Note 5. Revenue
Revenue Summary. In the table below (in thousands), revenue is disaggregated by sales channel and major products and services. The Company only has 1one reportable segment; therefore, further disaggregation is not applicable at this time.
|
| Year Ended December 31, |
| |||||||||
Major products and services |
| 2022 |
|
| 2021 |
|
| 2020 |
| |||
Subscription advertising and digital solutions |
| $ | 540,829 |
|
| $ | 518,270 |
|
| $ | 436,441 |
|
Display advertising |
|
| 88,397 |
|
|
| 85,169 |
|
|
| 84,630 |
|
Pay per lead |
|
| 9,351 |
|
|
| 12,346 |
|
|
| 18,557 |
|
Other |
|
| 15,299 |
|
|
| 7,898 |
|
|
| 7,875 |
|
Total revenue |
| $ | 653,876 |
|
| $ | 623,683 |
|
| $ | 547,503 |
|
|
| Year Ended December 31, |
| |||||||||
Sales channel |
| 2019 |
|
| 2018 |
|
| 2017 |
| |||
Direct |
| $ | 477,095 |
|
| $ | 457,651 |
|
| $ | 333,248 |
|
National advertising |
|
| 80,774 |
|
|
| 105,381 |
|
|
| 114,178 |
|
Other |
|
| 14,442 |
|
|
| 16,156 |
|
|
| 15,854 |
|
Retail |
|
| 572,311 |
|
|
| 579,188 |
|
|
| 463,280 |
|
Wholesale |
|
| 34,371 |
|
|
| 82,939 |
|
|
| 162,982 |
|
Total revenue |
| $ | 606,682 |
|
| $ | 662,127 |
|
| $ | 626,262 |
|
|
|
|
|
|
|
|
|
|
|
|
|
|
Major products and services |
|
|
|
|
|
|
|
|
|
|
|
|
Marketplace subscription advertising |
| $ | 475,960 |
|
| $ | 507,993 |
|
| $ | 483,026 |
|
Display advertising |
|
| 91,935 |
|
|
| 112,792 |
|
|
| 102,183 |
|
Pay per lead |
|
| 26,907 |
|
|
| 30,757 |
|
|
| 31,727 |
|
Other |
|
| 11,880 |
|
|
| 10,585 |
|
|
| 9,326 |
|
Total revenue |
| $ | 606,682 |
|
| $ | 662,127 |
|
| $ | 626,262 |
|
Note 6. Goodwill and Other Intangible Assets, net
Goodwill and Indefinite-Lived Intangible Asset Summary. The changes in the carrying amount of goodwill and indefinite-lived intangible asset are as follows (in thousands):
|
| Goodwill |
|
| Cars.com |
| ||
December 31, 2020 |
| $ | — |
|
| $ | 390,020 |
|
Additions (1) |
|
| 26,227 |
|
|
| — |
|
December 31, 2021 |
| $ | 26,227 |
|
| $ | 390,020 |
|
Additions (1) |
|
| 76,860 |
|
|
| — |
|
Adjustments (2) |
|
| (231 | ) |
|
| — |
|
December 31, 2022 |
| $ | 102,856 |
|
| $ | 390,020 |
|
Goodwill and Indefinite-Lived Intangible Asset 2020 Impairments. On September 1, 2019, In March 2020, the Company determined there was a triggering event, primarily caused by the economic impacts of the COVID-19 pandemic and related restrictions. In March 2020, the World Health Organization categorized COVID-19 as a sustained decreasepandemic, and it has since spread throughout the United States and the rest of the world with different geographical locations impacted more than others. The pandemic resulted in governmental authorities around the country implementing numerous measures to contain the virus, such as quarantines, shelter-in-place orders and business shutdowns (the “related restrictions”). The related restrictions have had, and the Company expects they will continue to have, a negative impact on regional and national economies and the automotive industry for an uncertain duration.
During the first quarter of 2020, the COVID-19 pandemic and related restrictions caused a widespread increase in unemployment and resulted in reduced consumer spending and an economic recession. As a result of overall uncertainty related to the automotive industry, in the Company's stock price aftersecond half of March 2020, the completionCompany’s customers began to adjust, reduce or suspend their operating and marketing activities. This resulted in decreased subscription revenue and reduced demand for the Company’s services. The effects of the strategic alternatives review process,COVID-19 pandemic, particularly reduced consumer spending and the discounts that the Company provided its dealer customers in the second quarter of 2020, negatively impacted its results of operations, cash flows and financial position. Thus, the amount and timing of future
49
Cars.com Inc.
Notes to Consolidated Financial Statements (Continued)
cash flows, used in the valuation models to estimate the fair value of the Company’s assets, were significantly and negatively impacted by the COVID-19 pandemic.
The Company performed interim quantitative impairment tests.tests as of March 31, 2020. The results of the goodwill and indefinite-lived intangible asset impairment tests indicated that the carrying values exceeded the estimated fair values. Thus, during the third quarter of 2019,values and thus, the Company recorded an impairment of $379.2$505.9 million and $82.3$400.0 million related to its goodwill and indefinite-lived intangible asset, respectively. InThis impairment charge reduced the fourth quarter of 2019, tgoodwill balance to zero at March 31, 2020.
2021 and 2022 Goodwill and Indefinite-Lived Intangible Asset Impairment Test. heThe Company performed an updated quantitative impairment analysis of itstests for goodwill and the indefinite-lived intangible assetasset. The Company performed a qualitative assessment that considers events and circumstances such as macroeconomic conditions, industry and market conditions, cost factors and overall financial performance, as well as company specifications. After performing this assessment, the resultsCompany concluded there were no indicators of those tests indicated thatimpairment and therefore, the estimated fair value exceededCompany did not perform a quantitative test and did not record an impairment to goodwill or thecarrying value as of December 31, 2019. For further information, see Note 2 (Significant Accounting Polices).
The changes in the carrying amount of goodwill and indefinite-lived intangible asset are as follows (in thousands):asset.
|
| Goodwill |
|
| Cars.com Trade name |
| ||
December 31, 2017 |
| $ | 788,107 |
|
| $ | 872,320 |
|
Additions |
|
| 96,342 |
|
|
| — |
|
December 31, 2018 |
| $ | 884,449 |
|
| $ | 872,320 |
|
Impairment |
|
| (379,163 | ) |
|
| (82,300 | ) |
Other |
|
| 599 |
|
|
| — |
|
December 31, 2019 |
| $ | 505,885 |
|
| $ | 790,020 |
|
Definite Lived Intangible Assets. The Company’s definite-lived intangible assets by major asset class are as follows (in thousands):
|
| December 31, 2022 |
|
| December 31, 2021 |
| ||||||||||||||||||
|
| Gross |
|
| Accumulated |
|
| Net |
|
| Gross |
|
| Accumulated |
|
| Net |
| ||||||
Customer relationships |
| $ | 833,847 |
|
| $ | (556,053 | ) |
| $ | 277,794 |
|
| $ | 832,540 |
|
| $ | (487,782 | ) |
| $ | 344,758 |
|
Acquired software |
|
| 73,626 |
|
|
| (48,288 | ) |
|
| 25,338 |
|
|
| 60,700 |
|
|
| (40,981 | ) |
|
| 19,719 |
|
Other trade names |
|
| 26,246 |
|
|
| (12,310 | ) |
|
| 13,936 |
|
|
| 24,800 |
|
|
| (9,873 | ) |
|
| 14,927 |
|
Content library |
|
| 2,100 |
|
|
| (2,100 | ) |
|
| — |
|
|
| 2,100 |
|
|
| (2,100 | ) |
|
| — |
|
Total |
| $ | 935,819 |
|
| $ | (618,751 | ) |
| $ | 317,068 |
|
| $ | 920,140 |
|
| $ | (540,736 | ) |
| $ | 379,404 |
|
|
| December 31, 2019 |
|
| December 31, 2018 |
| ||||||||||||||||||
|
| Gross Carrying Amount |
|
| Accumulated Amortization |
|
| Net Carrying Amount |
|
| Gross Carrying Amount |
|
| Accumulated Amortization |
|
| Net Carrying Amount |
| ||||||
Customer relationships |
| $ | 832,540 |
|
| $ | (343,925 | ) |
| $ | 488,615 |
|
| $ | 832,540 |
|
| $ | (273,799 | ) |
| $ | 558,741 |
|
Acquired software |
|
| 111,200 |
|
|
| (78,831 | ) |
|
| 32,369 |
|
|
| 111,200 |
|
|
| (53,002 | ) |
|
| 58,198 |
|
Other trade names |
|
| 23,900 |
|
|
| (5,405 | ) |
|
| 18,495 |
|
|
| 23,900 |
|
|
| (3,178 | ) |
|
| 20,722 |
|
Non-compete agreements |
|
| 2,860 |
|
|
| (2,860 | ) |
|
| — |
|
|
| 2,860 |
|
|
| (2,431 | ) |
|
| 429 |
|
Content library |
|
| 2,100 |
|
|
| (2,100 | ) |
|
| — |
|
|
| 2,100 |
|
|
| (2,100 | ) |
|
| — |
|
Total |
| $ | 972,600 |
|
| $ | (433,121 | ) |
| $ | 539,479 |
|
| $ | 972,600 |
|
| $ | (334,510 | ) |
| $ | 638,090 |
|
45
Cars.com Inc.
Notes to Consolidated and Combined Financial Statements (Continued)
Amortization for the years endedAs of December 31, 2019, 2018 and 2017 is $98.6 million, $91.0 million and $77.9 million, respectively. Projected2022, projected annual amortization expense for amortizable intangible assets is as follows (in thousands):
2020 |
| $ | 94,333 |
|
2021 |
|
| 84,994 |
|
2022 |
|
| 71,694 |
|
2023 |
|
| 69,828 |
|
2024 |
|
| 67,222 |
|
Thereafter |
|
| 151,408 |
|
Total |
| $ | 539,479 |
|
2023 |
| $ | 76,634 |
|
2024 |
|
| 74,028 |
|
2025 |
|
| 59,285 |
|
2026 |
|
| 37,876 |
|
2027 |
|
| 31,619 |
|
Thereafter |
|
| 37,626 |
|
Total |
| $ | 317,068 |
|
Note 7. Unfavorable Contracts LiabilityDebt
In connection with the October 2014 acquisition of CARS by TEGNA, the Company entered into affiliate agreements with the former owners of CARS. Under the affiliate agreements, affiliates have the exclusive right to sell and price the Company’s products and services in their local territories, paying the Company a wholesale rate for the Company’s products. The Company charged the affiliates 60% of the corresponding Cars.com’s retail rate for products sold to affiliate dealer customers and recognized revenue generated from these agreements as Wholesale revenue in the Consolidated and Combined Statements of (Loss) Income. The Unfavorable contracts liability was established as a result of these below market-rate unfavorable affiliate agreements that the Company entered into as part of TEGNA’s acquisition of the Company in 2014.
Prior to the affiliate conversions discussed below, over the annual contract period, the Company recognized $25.2 million of Wholesale revenue with a corresponding reduction of the Unfavorable contracts liability. The Unfavorable contracts liability was fully amortized as of September 30, 2019 and as of December 31, 2019 and 2018, the Unfavorable contracts liability on the Consolidated Balance Sheets was 0 and $18.9 million within Current liabilities, respectively.
The Company has amended five of its affiliate agreements (Gannett, McClatchy, TEGNA, tronc, and the Washington Post) and as a result, has a direct relationship with these dealer customers before the original contractual conversion date specified. As a result, we recognize the revenue associated with converted dealer customers as Retail revenue, rather than Wholesale revenue, in the Consolidated and Combined Statements of (Loss) Income. On October 1, 2019, the Belo affiliate agreement expired and the Company now directly serves all dealer customers.
As part of the amendments to the affiliate agreements, Gannett, McClatchy, TEGNA, tronc, and the Washington Post have agreed to perform certain marketing support and transition services through varying dates, the latest of which is June 29, 2020. The fees the Company pays associated with the amended affiliate agreements are recorded as Affiliate revenue share expense within Operating expenses in the Consolidated and Combined Statements of (Loss) Income.
The Company no longer records the amortization of the Unfavorable contracts liability associated with the converted markets to revenue as the Company is recognizing this direct revenue at retail rates. The amortization of the Unfavorable contracts liability was recorded as a reduction of Affiliate revenue share within Operating expenses in the Consolidated and Combined Statements of (Loss) Income. As of December 31, 2019, the Unfavorable contracts liability has been fully amortized.
During the year ended December 31, 2019, the Company recorded $17.5 million as a reduction to Affiliate revenue share, rather than Wholesale revenue, in the Consolidated and Combined Statements of (Loss) Income. The reduction to Affiliate revenue share was partially offset by the fees associated with the marketing support and transition services.
The Company’s Unfavorable contracts liability activity for the year ended December 31, 2019 is as follows (in thousands):
December 31, 2018 |
| $ | 18,885 |
|
Amortization into Wholesale revenue (1) |
|
| (1,358 | ) |
Amortization into Affiliate revenue share (2) |
|
| (17,527 | ) |
December 31, 2019 |
| $ | — |
|
|
|
46
Cars.com Inc.
Notes to Consolidated and Combined Financial Statements (Continued)
|
|
Note 8. Debt
Credit Agreement. On May 31, 2017, the Company and certain of its domestic wholly-owned subsidiaries (collectively, the “Guarantors”) entered into what was originally a $900 million Credit Agreement (the “Credit Agreement”) with the lenders named therein. In October 2019, weSubsequent to the initial Credit Agreement, the Company has entered into an amendment to the Company’s Credit Agreement to increase the total net leverage covenant during the remaining term of the Credit Agreement while preserving the favorable pricing structure from the original agreement. three amendments.
The Credit Agreement matures on Agreement’s initial maturity was May 31, 2022 and includesoriginally included (a) revolving loan commitments in an aggregate principal amount of up to $450$450 million (of which up to $25$25 million may be in the form of letters of credit at its request) and (b) term loans in an aggregate principal amount of $450$450 million. Interest on the borrowings under the Credit Agreement is payable based on either (i) the London Interbank Offered Rate (“LIBOR”) or (ii) the Alternate Base Rate (“ABR”), as defined in the Credit Agreement, in either case plus an applicable margin and fees which, after the second full fiscal quarter following the closing date, iswas based upon its total net leverage ratio. The ABR is the greater of (a) the prime rate, (b) the New York Fed Bank Rate plus 50 basis points or (c) adjusted LIBOR, which is computed as the LIBOR Screen Rate at 11:00 AM on such day. The applicable margin varies between 1.25% to 2.0% for LIBOR borrowings and 0.25% to 1.0% for ABR borrowings, depending on the Company’s net leverage ratio.Total Net Leverage Ratio. The Credit Agreement requiresrequired a total maximum total net leverageTotal Net Leverage Ratio of 4.50x4.25x with an incremental step down to 3.75x on or after May 31, 2019 and a minimum Interest Coverage Ratio of 3.0x (each as defined in the Credit Agreement). The Credit Agreement allowed for with a temporary step up to the maximum Total Net Leverage Ratio for material permitted acquisitions.
First Amendment. In October 2019, the Company entered into an amendment to its Credit Agreement to increase the maximum Total Net Leverage Ratio to 4.50x for periods ending on or after December 31, 2019, with step downs through maturity, while preserving the maturitiesfavorable pricing structure from the original agreement.
50
Cars.com Inc.
Notes to Consolidated Financial Statements (Continued)
Second Amendment. In June 2020, the Company entered into an amendment to provide flexibility during the uncertain COVID-19 period which provided for a waiver with respect to the Total Net Leverage Ratio and Consolidated Interest Coverage Ratio financial covenants for the covenant testing periods through December 31, 2020 (the “Covenant Adjustment Period”). The Second Amendment also included the following:
Third Amendment. On October 30, 2020, the Company entered into the Third Amendment to its Credit Agreement in connection with a broader refinancing, in which the Company reduced the size of the outstanding borrowings under the Credit Agreement to an aggregate principal amount of $430.0 million, comprised of a $230.0 million Revolving Credit Facility and a $200.0 million Term Loan, and extended the maturity date to May 31, 2025. The Third Amendment also included the following:
Term Loan. As of December 31, 2022, the outstanding principal amount under the Term Loan was $66.3 million and the revolving loan.interest rate in effect was 6.7%. During the year ended December 31, 2022, the Company made $11.3 million in Term Loan payments.
On MayRevolving Loan. As of December 31, 2017,2022, the outstanding borrowings under the Revolving Loan were $15.0 million and the interest rate in effect was 6.4%. During the twelve months ended December 31, 2022, the Company borrowed $675$45.0 million and made $30.0 million in Revolving Loan payments. As of December 31, 2022, $215.0 million was available to fund a $650borrow under the Revolving Loan. The Company’s borrowings are limited by its Senior Secured Leverage Ratio and Consolidated Interest Coverage Ratio, which are calculated in accordance with our Credit Agreement, and were 0.4x and 5.7x as of December 31, 2022, respectively.
Senior Unsecured Notes. In October 2020, the Company issued $400.0 million cash payment to TEGNA immediately prior toaggregate principal amount of 6.375% senior unsecured notes due 2028. Interest on the distribution, to pay feesnotes is due semi-annually on May 1 and expensesNovember 1.
Debt Issuance Costs. Debt issuance costs related to the Separationvarious amendments and to fund working capital. The term loan requires quarterly amortization payments which commenced on September 30, 2017. Debt issuance costsissuances were $5.5$11.1 million and $4.1$14.3 million atas of December 31, 20192022 and December 31, 2018,2021, respectively. TheseDepending on the nature of the debt issuance costs and the underlying debt to which it relates, they are recorded as either a reduction of debt and the debt is accreted using the effective interest method or as a deferred asset and accreted using the straight-line method with the amortization recorded in Interest expense, net on the Consolidated and Combined Statements of Income (Loss).
Debt Extinguishment. The Third Amendment resulted in a partial extinguishment of $1.8 million of the previously capitalized debt issuance costs which is included in Other expense, net in the Consolidated Statements of Income (Loss) Income.for the year ended December 31, 2020.
Debt Guarantors, Collateral, Covenants and Restrictions. The obligations under the Credit Agreementdebt agreements are guaranteed by the GuarantorsCompany and the Company.its subsidiary guarantors. The Guarantors secured their respective obligations under the Credit Agreementdebt agreements by granting liens in favor of the agent on substantially all of their assets. The terms of the Credit Agreementdebt agreement include representations and warranties, affirmative and
51
Cars.com Inc.
Notes to Consolidated Financial Statements (Continued)
negative covenants (including certain financial covenants) and events of default that are customary for credit facilities of this nature. The negative covenants place restrictions and limitations on the Company’s ability to incur additional indebtedness, make distributions or other restricted payments, create liens, make certain equity or debt investments, engage in mergers or consolidations and engage in certain transactions with affiliates.As of December 31, 2019,2022, the Company is in compliance with the covenants under its various creditdebt agreements.
Term Loan. As of December 31, 2019, the outstanding borrowings under the Term Loan were $388.1 million and the interest rate in effect was 4.5%. During the year ended December 31, 2019, the Company made $28.1 million in quarterly Term Loan payments.
Revolving Loan. As of December 31, 2019, the outstanding borrowings under the Revolving Loan were $260.0 million and the interest rate in effect was 3.7%. During the year ended December 31, 2018, the Company borrowed $165.0 million to fund the DI Acquisition and $30.0 million to fund share repurchases. The Company also made $30.0 million in voluntary Revolving Loan payments during the year ended December 31, 2019. As of December 31, 2019, the Company was permitted to borrow an additional $190.0 million under the Revolving Loan. The Company’s borrowings are limited by its net leverage ratio, which was 3.8 to 1.0 as of December 31, 2019.
Fair Value. The Company’s debt is classified as Level 2 in the fair value hierarchy and the fair value is measured based on comparable trading prices, ratings, sectors, coupons and maturities of similar instruments. Level 2 assets and liabilities are based on observable inputs other than quoted prices, such as quoted prices for similar assets and liabilities in active markets, quoted prices for identical or similar assets and liabilities in markets that are not active, or other inputs that are observable or can be corroborated by observable market data.
47
Cars.com Inc.
Notes to Consolidated and Combined Financial Statements (Continued)
Long-term Debt Maturities. Long-term debt includes future principal payments on long-term borrowings through scheduled maturity dates. Excluded from these amounts are the amortization of debt issuance and other costs related to indebtedness. TheAs of December 31, 2022, the Company’s contractual payments at December 31, 2019 under then-outstanding long-term debt agreements in each of the next five calendar years and thereafter are as follows (in thousands):
2023 |
| $ | 16,250 |
|
2024 |
|
| 20,000 |
|
2025 |
|
| 45,000 |
|
2026 |
|
| — |
|
2027 |
|
| — |
|
Thereafter |
|
| 400,000 |
|
Total |
| $ | 481,250 |
|
Note 8. Interest Rate Swap
The interest rate on borrowings under the Company’s Term Loan is floating and, therefore, subject to fluctuations. In order to manage the risk associated with changes in interest rates on its borrowing under the initial Term Loan, the Company entered into an interest rate swap (the “Swap”) effective December 31, 2018. Under the terms of the Swap, the Company is locked into a fixed rate of interest of 2.96%, on a notional amount of $300 million until May 31, 2022. The Swap was initially designated as a cash flow hedge of interest rate risk.
During the second quarter of 2020, the Company entered into the second amendment to the Credit Agreement, which triggered a quantitative hedge effectiveness test that resulted in the loss of hedge accounting. As a result, as of the date of the second amendment, the unrealized loss included within Accumulated other comprehensive loss was frozen and then was ratably reclassified into Net income (loss) over the remaining life of the Swap through Interest expense, net and Income tax expense (benefit) within the Consolidated Statements of Income (Loss). Subsequent to the second amendment, any changes in the fair value of the Swap were recorded within Other expense, net on the Consolidated Statements of Income (Loss).
During the fourth quarter of 2020, the Company entered into the third amendment to the Credit Agreement, which triggered a partial debt extinguishment, including a partial extinguishment of the underlying Term Loan. Due to the reduction in the Term Loan as compared to the notional amount of the Swap, the Company wrote-off a proportional amount of the frozen Accumulated other comprehensive loss balance as of the date of the partial extinguishment proportional to the reduction in the underlying notional amount of Term Loan. The Company will continue to amortize the remaining Accumulated other comprehensive loss to Interest expense, net and Income tax expense (benefit) within the Consolidated Statements of Income (Loss) through the remainder of the term of the Swap. Any changes in the fair value of the Swap will continue to be recorded within Other expense, net on the Consolidated Statements of Income (Loss).
The Swap expired on May 31, 2022 and, as such, is no longer recorded on the Consolidated Balance Sheets. As of December 31, 2021, the fair value of the Swap was an unrealized loss of $3.5 million, which is recorded in Other accrued liabilities on the Consolidated Balance Sheets. During the years ended December 31, 2022, 2021 and 2020, $2.4 million, $5.7 million and $11.1 million was reclassified from Accumulated other comprehensive loss and recorded in Interest expense, net, respectively. During the years ended December 31, 2022, 2021 and 2020 the Company made payments of $3.3 million, $8.6 million and $7.0 million related to the Swap. During the years ended December 31, 2022, 2021 and 2020, $0.4 million, $0.9 million and $1.3 million was reclassified as a tax benefit from Accumulated other comprehensive loss into Income tax expense (benefit) on the Consolidated Statements of Income (Loss).
52
Cars.com Inc.
Notes to Consolidated Financial Statements (Continued)
2020 |
| $ | 33,750 |
|
2021 |
|
| 39,375 |
|
2022 |
|
| 575,000 |
|
2023 |
|
| — |
|
2024 |
|
| — |
|
Total |
| $ | 648,125 |
|
Note 9. Leases
Leases. The Company is obligated as a lessee under certain non-cancelable operating leases for office space, and is also obligated to pay insurance, maintenance and other executory costs associated with the leases. In May 2016, the Company entered into a new lease of office space in Chicago, Illinois.Illinois, which is our most material lease. The lease extends through June 2031 and monthly rental payments under the lease escalate by 2.5%2.5% each year throughout the lease.
As of December 31, 2019,2022, the Company’s scheduled future minimum lease payments under operating leases having initial noncancelable lease terms of more than one year, wereis as follows (in thousands):
2023 |
| $ | 4,042 |
|
2024 |
|
| 4,154 |
|
2025 |
|
| 4,570 |
|
2026 |
|
| 4,684 |
|
2027 |
|
| 3,991 |
|
Thereafter |
|
| 17,750 |
|
Total minimum lease payments |
|
| 39,191 |
|
Less: Imputed interest (1) |
|
| (10,652 | ) |
Present value of the minimum lease payments |
|
| 28,539 |
|
Less: Current maturities of lease obligations |
|
| (1,984 | ) |
Long-term lease obligations |
| $ | 26,555 |
|
2020 |
| $ | 4,368 |
|
2021 |
|
| 4,013 |
|
2022 |
|
| 3,751 |
|
2023 |
|
| 3,850 |
|
2024 |
|
| 4,122 |
|
Thereafter |
|
| 30,996 |
|
Total minimum lease payments |
|
| 51,100 |
|
Less: Imputed interest (1) |
|
| (17,527 | ) |
Present value of the minimum lease payments |
|
| 33,573 |
|
Less: Current maturities of lease obligations |
|
| (1,951 | ) |
Long-term lease obligations |
| $ | 31,622 |
|
|
|
As of December 31, 2019,2022 and 2021, the Company’s operating lease assets, included in Investments and other assets, net, were $16.913.7 million and $14.6 million, respectively, and operating lease liabilities were $33.628.5 million and $30.8 million, respectively, the current maturities of which is included in Other accrued liabilities and the long-term portion of which is included in Other noncurrent liabilities.liabilities. The difference between the operating lease assets and the operating lease liabilities is primarily due to a lease incentive received in 2017 related to the 300 South Riverside Leaselease in Chicago, IllinoisIllinois..
48
Cars.com Inc.
Notes to Consolidated and Combined Financial Statements (Continued)
Other information related to the Company’s operating leases for the yearyears ended December 31, 20192022, 2021 and 2020 is as follows (in thousands, except months and percentage)percentages):
|
| Year Ended December 31, |
| |||||||||
Income statement information: |
| 2022 |
|
| 2021 |
|
| 2020 |
| |||
Operating lease cost |
| $ | 2,993 |
|
| $ | 3,541 |
|
| $ | 3,848 |
|
Short-term lease cost |
|
| 137 |
|
|
| 600 |
|
|
| 856 |
|
Variable lease cost |
|
| 3,443 |
|
|
| 3,034 |
|
|
| 2,834 |
|
Total lease cost |
| $ | 6,573 |
|
| $ | 7,175 |
|
| $ | 7,538 |
|
|
|
|
|
|
|
|
|
|
| |||
Other information: |
|
|
|
|
|
|
|
|
| |||
Cash paid for operating leases |
| $ | 4,470 |
|
| $ | 4,856 |
|
| $ | 3,320 |
|
Weighted-average remaining lease term (in months) |
|
| 101 |
|
|
| 112 |
|
|
| 122 |
|
Weighted-average discount rate as of December 31, |
|
| 7.5 | % |
|
| 7.4 | % |
|
| 7.4 | % |
|
|
|
|
|
Income statement information: |
| Year Ended December 31, 2019 |
| |
Operating lease cost |
| $ | 3,877 |
|
Short-term lease cost |
|
| 1,202 |
|
Variable lease cost |
|
| 2,565 |
|
Total lease cost |
| $ | 7,644 |
|
|
|
|
|
|
Other information: |
|
|
|
|
Cash paid for operating leases for the year ended December 31, 2019 |
| $ | 3,627 |
|
Weighted-average remaining lease term (in months) as of December 31, 2019 |
|
| 132 |
|
Weighted-average discount rate as of December 31, 2019 |
|
| 7.4 | % |
Rental expense in 2018 and 2017 was $8.2 million and $7.3 million, respectively.
Note 10. Commitments and Contingencies
TheFrom time to time, the Company and its subsidiaries are parties from time to time in legal and administrative proceedings involving matters incidental to its business. These matters, whether pending, threatened or unasserted, if decided adversely to the Company or settled, may result in liabilities material to its financial position, results of operations or cash flows. The Company records a liability when it believes that it is both probable that a loss will be incurred and the amount of loss can be reasonably estimated. The Company evaluates, at least quarterly, developments in its legal matters that could affect the amount of liability that has been previously accrued and makes adjustments as appropriate. Significant judgment is required to determine both the probability and the estimated amount.
Note 11. StockholdersStockholders' Equity
53
Cars.com Inc.
Notes to Consolidated Financial Statements (Continued)
In March 2018,February 2022, the Company’sCompany's Board of Directors authorized athree-year share repurchase program to acquire up to $200$200 million of the Company’sCompany's common stock. The Company may repurchase shares from time to time in open market transactions or through privately negotiated transactions in accordance with applicable federal securities laws.laws and other applicable legal requirements and subject to the Company's blackout periods. The timing and amounts of any purchases under the share repurchase program will be based on market conditions and other factors, including price. The repurchase program has a two-year duration, does not require the purchase of any minimum number of shares and may be suspended modified or discontinued at any time without prior notice.and does not obligate the Company to repurchase any dollar amount or particular amount of shares. The Company intends to fundfunds the share repurchase program principally with cash from operations. During the year ended December December 31, 2019,2022, the Company repurchased and subsequently retired 1.74.2 million shares for $40 million.$49.0 million at an average price per share of $11.75.
Note 12. Stock-Based Compensation
Omnibus Plan. In May 2017, the Company’s Board of Directors approved the Cars.com Inc. Omnibus Incentive Compensation Plan (the “Omnibus Plan”), which provides for the granting of stock options, stock appreciation rights, restricted stock, restricted stock units, performance shares and other stock-based and cash-based awards. A maximum of 1818.0 million common stock shares may be issued under the Omnibus Plan. As of December 31, 2019,2022, there were 15.16.8 million common stock shares available for future grants. The Company issues new shares of CARS common stock for shares delivered under the Omnibus Plan.
49
Cars.com Inc.
Notes to Consolidated and Combined Financial Statements (Continued)
Prior to the Separation and distribution from TEGNA, certain CARS current and former employees received TEGNA restricted share units based on TEGNA common stock. Due to the spin-off from TEGNA, all outstanding TEGNA restricted share units held by certain CARS current and former employees following the Separation were converted into an award denominated in shares of CARS common stock, with the number of shares subject to the award adjusted in a manner intended to preserve the aggregate intrinsic value of the original TEGNA restricted share units award as measured immediately before and after the Separation. Stock-based compensation expense relates to awards issued in connection with and after the Separation.
Information related to stock-based compensation expense is as follows (in thousands):
|
| Year Ended December 31, |
| |||||||||
|
| 2022 |
|
| 2021 |
|
| 2020 |
| |||
Stock-based compensation expense |
| $ | 22,342 |
|
| $ | 21,431 |
|
| $ | 15,155 |
|
Income tax benefit related to stock-based |
|
| — |
|
|
| — |
|
|
| — |
|
Stock-based compensation expense by financial statement line item on the Company’s Consolidated Statements of Income (Loss) is as follows (in thousands):
|
| Year Ended December 31, |
| |||||||||
|
| 2019 |
|
| 2018 |
|
| 2017 |
| |||
Stock-based compensation expense |
| $ | 7,588 |
|
| $ | 9,423 |
|
| $ | 2,627 |
|
Income tax benefit related to stock-based compensation expense |
|
| 2,840 |
|
|
| 1,222 |
|
| 643 |
| |
|
| Year Ended December 31, |
| |||||||||
|
| 2022 |
|
| 2021 |
|
| 2020 |
| |||
Cost of revenue and operations |
| $ | 955 |
|
| $ | 876 |
|
| $ | 593 |
|
Product and technology |
|
| 6,647 |
|
|
| 5,455 |
|
|
| 3,314 |
|
Marketing and sales |
|
| 4,921 |
|
|
| 5,202 |
|
|
| 3,612 |
|
General and administrative |
|
| 9,819 |
|
|
| 9,898 |
|
|
| 7,636 |
|
Total |
| $ | 22,342 |
|
| $ | 21,431 |
|
| $ | 15,155 |
|
For the years ended December 31, 2022 excluded from stock-based compensation expense is $0.1 million of capitalized internally developed technology costs.
Information related to outstanding stock-based compensation awards as of December 31, 20192022 for restricted share units (“RSUs”), performance share units (“PSUs”), stock options and the Cars.com Employee Stock Purchase Plan (“ESPP”) is as follows (in thousands, except for weighted-average remaining period):
|
| Unearned Compensation |
|
| Weighted-Average Remaining Period (in years) |
|
| Unearned |
|
| Weighted-Average |
| ||||
RSUs |
| $ | 14,708 |
|
|
| 2.0 |
|
| $ | 29,099 |
|
|
| 2.0 |
|
PSUs |
|
| 518 |
|
|
| 2.2 |
|
|
| 533 |
|
|
| 2.2 |
|
Stock Options |
|
| 2,993 |
|
|
| 1.7 |
| ||||||||
ESPP |
|
| 161 |
|
|
| 0.3 |
|
|
| 251 |
|
|
| 0.3 |
|
Total |
| $ | 15,387 |
|
|
| 2.0 |
|
| $ | 32,876 |
|
|
|
| |
Restricted Share Units.Units ("RSUs"). RSUs represent the right to receive unrestricted shares of the Company’s common stock at the time of vesting, subject to any restrictions as specified in the individual holder’s award agreement. RSU’sRSUs are subject to graded vesting, generally ranging between one and four years and the fair value of the RSUs is equal to the Company’sCompany's common stock price on the date
54
Cars.com Inc.
Notes to Consolidated Financial Statements (Continued)
of grant.RSU activity for the year ended December 31, 20192022 is as follows (in thousands, except for weighted-average grant date fair value):
|
| Number |
|
| Weighted-Average |
| ||
Outstanding as of December 31, 2021 |
|
| 3,683 |
|
| $ | 10.95 |
|
Granted |
|
| 2,526 |
|
|
| 14.21 |
|
Vested and delivered |
|
| (1,598 | ) |
|
| 10.65 |
|
Forfeited |
|
| (840 | ) |
|
| 12.68 |
|
Outstanding as of December 31, 2022 (1) |
|
| 3,771 |
|
|
| 12.88 |
|
|
| Number of RSUs |
|
| Weighted-Average Grant Date Fair Value |
| ||
Outstanding as of December 31, 2018 |
|
| 769 |
|
| $ | 26.20 |
|
Granted |
|
| 582 |
|
|
| 23.51 |
|
Vested and delivered |
|
| (241 | ) |
|
| 26.00 |
|
Forfeited |
|
| (167 | ) |
|
| 25.23 |
|
Outstanding as of December 31, 2019 (1) |
|
| 943 |
|
|
| 24.68 |
|
|
|
The weighted-average grant-date fair value of RSUs granted during the years ended December 31, 20192021 and 20182020 was $23.51$14.94 and $26.63,$5.87, respectively. The total grant-date fair value of RSUs that vested during the years ended December 31, 20192022, 2021 and 20182020 was $7.1$16.9 million, $14.7 million and $3.7$8.9 million, respectively.
50
Cars.com Inc.
Notes to Consolidated and Combined Financial Statements (Continued)
Performance Share Units. PSUs represent the right to receive unrestricted shares of the Company’s common stock at the time of vesting, subject to any restrictions as specified in the individual holder’s award agreement.vesting. The fair value of the PSUs is equal to the Company’s common stock price on the date of grant. PSU activity forExpense related to PSUs is recognized when the year ended December 31, 2019 is as follows (in thousands, except for weighted-average grant date fair value):
|
| Number of PSUs |
|
| Weighted-Average Grant Date Fair Value |
| ||
Outstanding as of December 31, 2018 |
|
| 766 |
|
| $ | 27.37 |
|
Granted |
|
| 212 |
|
|
| 23.99 |
|
Vested and delivered |
|
| — |
|
|
| — |
|
Forfeited |
|
| (25 | ) |
|
| 26.27 |
|
Outstanding as of December 31, 2019 |
|
| 953 |
|
|
| 26.60 |
|
The PSUs granted during the years ended December 31, 2019 and the remaining PSUs granted during the year ended December 31, 2018 require continued employee service.performance conditions are probable of being achieved. The percentage of these PSUs that shall vest will range from 0%0% to 200%200% of the number of PSUs granted based on the Company’s future performance related to certain revenue and adjusted earnings before interest, income taxes, depreciation and amortization targets over a three-year performance period. These PSUs are subject to cliff vesting over three years.
Duringafter the end of the respective performance period. PSU activity for the year ended December 31, 2018,2022 is as follows (in thousands, except for weighted-average grant date fair value):
|
| Number |
|
| Weighted-Average |
| ||
Outstanding as of December 31, 2021 |
|
| 142 |
|
| $ | 23.98 |
|
Granted |
|
| 305 |
|
|
| 14.84 |
|
Vested and delivered |
|
| (142 | ) |
|
| 23.98 |
|
Forfeited |
|
| (60 | ) |
|
| 15.07 |
|
Outstanding as of December 31, 2022 |
|
| 245 |
|
|
| 14.78 |
|
Stock Options. Stock options represent the Company granted 632,000right to certain employees in connection with the DI Acquisition and require continued employee service. The percentage of PSUs that shall vest will range from 0% to 150%purchase shares of the numberCompany’s common stock at the time of PSUs granted based on Dealer Inspire’s future performance relatedvesting, subject to certain revenue targets over a three-year performance period. These PSUsany restrictions as specified in the individual holder’s award agreement. Stock options are subject to gradedthree-year cliff vesting over three years.and expire 10 years from the grant date. Stock option activity for the year ended December 31, 2022 is as follows (in thousands, except for weighted-average grant date fair value and weighted-average remaining contractual term):
|
| Number |
|
| Weighted-Average |
|
| Weighted-Average |
|
| Aggregate |
| ||||
Outstanding as of December 31, 2021 |
|
| 804 |
|
| $ | 5.27 |
|
|
| 8.58 |
|
| $ | 5,754 |
|
Granted |
|
| 263 |
|
|
| 9.39 |
|
|
| — |
|
|
| — |
|
Exercised |
|
| — |
|
|
| — |
|
|
| — |
|
|
| — |
|
Forfeited |
|
| — |
|
|
| — |
|
|
| — |
|
|
| — |
|
Outstanding as of December 31, 2022 |
|
| 1,067 |
|
|
| 6.28 |
|
|
| 7.98 |
|
|
| 4,296 |
|
Exercisable as of December 31, 2022 |
|
| — |
|
|
| — |
|
|
| — |
|
|
| — |
|
The fair value of the stock options granted during the years ended December 31, 2022, 2021 and 2020 are estimated on the grant date using the Black-Scholes option pricing model, using the following assumptions:
Employee Stock Purchase Plan. On September 19, 2017, the Company’s Board of Directors approved the 55
Cars.com Inc.
Notes to Consolidated Financial Statements (Continued)
| 2022 |
|
| 2021 |
|
| 2020 |
| |||
Risk-free interest rate |
| 2.21 | % |
|
| 1.15 | % |
|
| 1.01 | % |
Weighted-average volatility |
| 65.22 | % |
|
| 69.00 | % |
|
| 53.08 | % |
Dividend yield |
| 0 | % |
|
| 0 | % |
|
| 0 | % |
Expected years until exercise |
| 6.5 |
|
|
| 6.5 |
|
|
| 6.5 |
|
Employee Stock Purchase Plan (the “ESPP”("ESPP"). Eligible employees may authorize payroll deductions of up to 10%10% of the employee’s base earnings with a maximum of $10,000$10,000 per every six-month offering period to purchase CARS common stock at a purchase price per share equal to 85%85% of the lower of (i) the closing market price per share of CARS at the beginning of the offering period or (ii) the closing market price per share at the end of the offering period. A maximum of 3three million shares are available for issuance under the ESPP. As of December 31, 2019, 2.82022, 2.1 million shares were available for issuance under the ESPP. The Company issued 0.10.2 million, 0.2 million and 0.3 million shares related to the ESPP for the years ended December 31, 2019 and 2018. The Company recorded $0.5$0.6 million, $0.7 million and $0.4$0.7 million of stock-based compensation expense related to the ESPP for the years ended December 31, 20192022, 2021 and 2018,2020, respectively.
Note 13. Earnings (Loss) Earnings Per Share
Basic earnings (loss) earnings per share is calculated by dividing Net income (loss) income by the weighted-average number of shares of common stock outstanding. Diluted earnings (loss) earnings per share is similarly calculated, except that the calculation includes the dilutive effect of the assumed issuance of shares under stock-based compensation plans, unless the inclusion of such shares would have an anti-dilutive impact. As part of the Accu-Trade Acquisition, the Company may pay up to $15.0 million of the contingent consideration in stock at a future date. Those potential shares have been excluded from the computations below because they are contingently issuable shares, and the contingency to which the issuance relates was not met at the end of the reporting period. The computations of the Company’s basic and diluted earnings (loss) earnings per share are set forth belowis as follows (in thousands, except per share amounts):
|
| Year Ended December 31, |
| |||||||||
|
| 2022 |
|
| 2021 |
|
| 2020 |
| |||
Net income (loss) |
| $ | 17,206 |
|
| $ | 10,791 |
|
| $ | (789,106 | ) |
Basic weighted-average common shares outstanding |
|
| 68,215 |
|
|
| 68,727 |
|
|
| 67,241 |
|
Effect of dilutive stock-based compensation awards (1) |
|
| 1,434 |
|
|
| 2,610 |
|
|
| — |
|
Diluted weighted-average common shares outstanding |
|
| 69,649 |
|
|
| 71,337 |
|
|
| 67,241 |
|
Earnings (loss) per share, basic |
| $ | 0.25 |
|
| $ | 0.16 |
|
| $ | (11.74 | ) |
Earnings (loss) per share, diluted |
|
| 0.25 |
|
|
| 0.15 |
|
|
| (11.74 | ) |
|
| Year Ended December 31, |
| |||||||||
|
| 2019 |
|
| 2018 |
|
| 2017 (1) |
| |||
Net (loss) income |
| $ | (445,324 | ) |
| $ | 38,809 |
|
| $ | 224,443 |
|
Basic weighted-average common shares outstanding |
|
| 66,995 |
|
|
| 70,318 |
|
|
| 71,661 |
|
Effect of dilutive stock-based compensation awards (2) |
|
| — |
|
|
| 229 |
|
|
| 66 |
|
Diluted weighted-average common shares outstanding |
|
| 66,995 |
|
|
| 70,547 |
|
|
| 71,727 |
|
(Loss) earnings per share, basic |
| $ | (6.65 | ) |
| $ | 0.55 |
|
| $ | 3.13 |
|
(Loss) earnings per share, diluted |
|
| (6.65 | ) |
|
| 0.55 |
|
|
| 3.13 |
|
|
|
|
|
51
Cars.com Inc.
Notes to ConsolidatedThere were 2,033, 1,304 and Combined Financial Statements (Continued)
As of2,727 potential common shares excluded from diluted weighted-average common shares outstanding for the years ended December 31, 2019, the Company has two classes of stock which consist of common stock2022, 2021 and preferred stock. As of December 31, 2019, the Company has only issued common stock at a par value of $0.01.2020 respectively, as their inclusion would have had an anti-dilutive effect.
Note 14. Income Taxes
Selected Information Related to Income Taxes. Significant components of Income (Loss) Income before income taxes are as follows (in thousands):
|
| Year Ended December 31, |
| |||||||||
|
| 2019 |
|
| 2018 |
|
| 2017 |
| |||
U.S. |
| $ | (476,925 | ) |
| $ | 56,114 |
|
| $ | 122,162 |
|
Non-U.S. |
|
| 1,646 |
|
|
| 815 |
|
|
| — |
|
(Loss) income before income taxes |
| $ | (475,279 | ) |
| $ | 56,929 |
|
| $ | 122,162 |
|
|
| Year Ended December 31, |
| |||||||||
|
| 2019 |
|
| 2018 |
|
| 2017 |
| |||
Current: |
|
|
|
|
|
|
|
|
|
|
|
|
U.S. federal |
| $ | 1,501 |
|
| $ | 254 |
|
| $ | 5,966 |
|
U.S. state and local |
|
| 427 |
|
|
| 953 |
|
|
| 598 |
|
Non-U.S. |
|
| 448 |
|
|
| 220 |
|
|
| — |
|
Total current income tax expense |
|
| 2,376 |
|
|
| 1,427 |
|
|
| 6,564 |
|
Deferred: |
|
|
|
|
|
|
|
|
|
|
|
|
U.S. federal |
|
| (27,692 | ) |
|
| 11,133 |
|
|
| (110,361 | ) |
U.S. state and local |
|
| (4,636 | ) |
|
| 5,560 |
|
|
| 1,516 |
|
Non-U.S. |
|
| (3 | ) |
|
| — |
|
|
| — |
|
Total deferred income tax (benefit) expense |
|
| (32,331 | ) |
|
| 16,693 |
|
|
| (108,845 | ) |
Income tax (benefit) expense |
| $ | (29,955 | ) |
| $ | 18,120 |
|
| $ | (102,281 | ) |
|
| Year Ended December 31, |
| |||||||||
|
| 2022 |
|
| 2021 |
|
| 2020 |
| |||
U.S. |
| $ | 22,533 |
|
| $ | 9,444 |
|
| $ | (938,248 | ) |
Non-U.S. |
|
| 43 |
|
|
| 39 |
|
|
| 1,839 |
|
Income (loss) before income taxes |
| $ | 22,576 |
|
| $ | 9,483 |
|
| $ | (936,409 | ) |
56
Cars.com Inc.
Notes to Consolidated Financial Statements (Continued)
|
| Year Ended December 31, |
| |||||||||
|
| 2022 |
|
| 2021 |
|
| 2020 |
| |||
Current: |
|
|
|
|
|
|
|
|
| |||
U.S. federal |
| $ | 2,991 |
|
| $ | 516 |
|
| $ | (13,799 | ) |
U.S. state and local |
|
| 1,122 |
|
|
| 1,267 |
|
|
| 715 |
|
Non-U.S. |
|
| (26 | ) |
|
| (164 | ) |
|
| 164 |
|
Total current income tax expense (benefit) |
|
| 4,087 |
|
|
| 1,619 |
|
|
| (12,920 | ) |
Deferred: |
|
|
|
|
|
|
|
|
| |||
U.S. federal |
|
| 579 |
|
|
| (2,599 | ) |
|
| (100,211 | ) |
U.S. state and local |
|
| 671 |
|
|
| (332 | ) |
|
| (34,181 | ) |
Non-U.S. |
|
| 33 |
|
|
| 4 |
|
|
| 9 |
|
Total deferred income tax expense (benefit) |
|
| 1,283 |
|
|
| (2,927 | ) |
|
| (134,383 | ) |
Income tax expense (benefit) |
| $ | 5,370 |
|
| $ | (1,308 | ) |
| $ | (147,303 | ) |
The income tax provision differed from amounts computed at the statutory federal income tax rate, as follows (in thousands, except percentage)percentages):
|
| Year Ended December 31, |
|
| |||||||||||||||||||||||
|
| 2019 |
|
|
| 2018 |
|
|
| 2017 (1) (2) |
|
| |||||||||||||||
|
| $ |
|
| % |
|
|
| $ |
|
| % |
|
|
| $ |
|
| % |
|
| ||||||
Income tax provision at statutory rate |
| $ | (99,808 | ) |
|
| 21.0 |
| % |
| $ | 11,955 |
|
|
| 21.0 |
| % |
| $ | 42,757 |
|
|
| 35.0 |
| % |
Tax effect of pre-Separation earnings |
|
| — |
|
|
| — |
|
|
|
| — |
|
|
| — |
|
|
|
| (16,210 | ) |
|
| (13.3 | ) |
|
State income taxes, net of federal income tax benefit |
|
| (5,374 | ) |
|
| 1.1 |
|
|
|
| 2,668 |
|
|
| 4.7 |
|
|
|
| 2,294 |
|
|
| 1.9 |
|
|
Book impairment and other permanent differences |
|
| 71,650 |
|
|
| (15.1 | ) |
|
|
| — |
|
|
| — |
|
|
|
| — |
|
|
| — |
|
|
Effect of change in apportionment factors (3) |
|
| 928 |
|
|
| (0.2 | ) |
|
|
| 3,467 |
|
|
| 6.1 |
|
|
|
| — |
|
|
| — |
|
|
Write-off of permanent outside basis difference |
|
| — |
|
|
| — |
|
|
|
| — |
|
|
| — |
|
|
|
| (50,687 | ) |
|
| (41.5 | ) |
|
Effect of U.S. federal tax rate change (4) |
|
| — |
|
|
| — |
|
|
|
| — |
|
|
| — |
|
|
|
| (80,298 | ) |
|
| (65.7 | ) |
|
Other, net |
|
| 2,649 |
|
|
| (0.5 | ) |
|
|
| 30 |
|
|
| — |
|
|
|
| (137 | ) |
|
| (0.1 | ) |
|
Income tax (benefit) expense |
| $ | (29,955 | ) |
|
| 6.3 |
| % |
| $ | 18,120 |
|
|
| 31.8 |
| % |
| $ | (102,281 | ) |
|
| (83.7 | ) | % |
|
| Year Ended December 31, |
|
| |||||||||||||||||||||||
|
| 2022 |
|
|
| 2021 |
|
|
| 2020 |
|
| |||||||||||||||
|
| $ |
|
| % |
|
|
| $ |
|
| % |
|
|
| $ |
|
| % |
|
| ||||||
Income tax provision (benefit) at statutory rate |
| $ | 4,743 |
|
|
| 21.0 |
| % |
| $ | 1,994 |
|
|
| 21.0 |
| % |
| $ | (196,646 | ) |
|
| 21.0 |
| % |
State income taxes, net of federal income tax expense (benefit) |
|
| 1,122 |
|
|
| 5.0 |
|
|
|
| 378 |
|
|
| 4.0 |
|
|
|
| (37,566 | ) |
|
| 4.0 |
|
|
Nondeductible executive compensation |
|
| 1,974 |
|
|
| 8.7 |
|
|
|
| 1,365 |
|
|
| 14.4 |
|
|
|
| 625 |
|
|
| (0.1 | ) |
|
Nondeductible transaction expenses |
|
| (2,608 | ) |
|
| (11.6 | ) |
|
|
| 2,638 |
|
|
| 27.8 |
|
|
|
| — |
|
|
| — |
|
|
Tax credits |
|
| (1,455 | ) |
|
| (6.4 | ) |
|
|
| (2,379 | ) |
|
| (25.1 | ) |
|
|
| (2,375 | ) |
|
| 0.3 |
|
|
Goodwill impairment |
|
| — |
|
|
| — |
|
|
|
| — |
|
|
| — |
|
|
|
| (13,683 | ) |
|
| 1.5 |
|
|
Effect of change in apportionment factors |
|
| — |
|
|
| — |
|
|
|
| — |
|
|
| — |
|
|
|
| (2,228 | ) |
|
| 0.2 |
|
|
NOL carrybacks rate differential |
|
| — |
|
|
| — |
|
|
|
| — |
|
|
| — |
|
|
|
| (3,270 | ) |
|
| 0.3 |
|
|
Stock-based compensation |
|
| (1,432 | ) |
|
| (6.3 | ) |
|
|
| (3,010 | ) |
|
| (31.7 | ) |
|
|
| 1,062 |
|
|
| (0.1 | ) |
|
Return to provision adjustments |
|
| 4,627 |
|
|
| 20.5 |
|
|
|
| (453 | ) |
|
| (4.8 | ) |
|
|
| (289 | ) |
|
| — |
|
|
Uncertain tax positions |
|
| (4,042 | ) |
|
| (17.9 | ) |
|
|
| 1,551 |
|
|
| 16.4 |
|
|
|
| 1,317 |
|
|
| (0.1 | ) |
|
Valuation allowance |
|
| 1,194 |
|
|
| 5.3 |
|
|
|
| (3,943 | ) |
|
| (41.6 | ) |
|
|
| 106,042 |
|
|
| (11.3 | ) |
|
Other, net |
|
| 1,247 |
|
|
| 5.5 |
|
|
|
| 551 |
|
|
| 5.8 |
|
|
|
| (292 | ) |
|
| — |
|
|
Income tax expense (benefit) |
| $ | 5,370 |
|
|
| 23.8 |
| % |
| $ | (1,308 | ) |
|
| (13.8 | ) | % |
| $ | (147,303 | ) |
|
| 15.7 |
| % |
52
Cars.com Inc.
Notes to Consolidated and Combined Financial Statements (Continued)
��
|
|
|
|
|
|
|
|
The Company’s effective tax rate for the year ended December 31, 2019 differed from the federal statutory rate of 21%, primarily due to the tax impact of the goodwill and intangible asset impairment and other permanent differences.
The Company’s effective tax rate for the year ended December 31, 2018 differed from the federal statutory rate of 21%, primarily due to unfavorable changes in the apportionment factors upon the finalization of the post-Spin 2017 state tax returns in the fourth quarter of 2018 and state income tax expenses.
The Company’s effective tax rate for the year ended December 31, 2017 differed from the federal statutory rate of 35%, primarily due to the non-cash income tax benefits of $16 million, $51 million and $80 million related to pre-Separation earnings, of which the payments were the responsibility of TEGNA, the write-off of the permanent outside basis difference resulting from the change in the tax status of the Cars.com, LLC flow-through entity and the reduction in the corporate federal income tax rate, respectively.
Deferred Tax Assets and Liabilities. As part of the implementation of the post-Separation legal entity structure, the Company was required to record deferred tax assets and liabilities for temporary differences between financial accounting and tax reporting. Accordingly, in 2017, the Company recorded $246 million of net deferred tax liabilities associated with the outside basis difference in the Cars.com, LLC flow-through entity, with the offset recorded in TEGNA’s investment net.
In October 2017, Cars.com, LLC prospectively changed its corporate structure to convert from being taxed as a partnership to being taxed as a C corporation. As a result of the change in corporate structure, Cars.com, LLC was also required to change its reporting of deferred tax assets and liabilities. During the period, the Company recorded a $51 million non-cash write-off of the permanent outside basis difference resulting from this reporting change.
The Company has recorded deferred tax assets related to federal and state income tax net operating loss (“NOL”) carryforwards of approximately $7.1$2.5 million and $1.5$10.6 million as of December 31, 2022, and 2021, respectively. The federal NOL, and the majoritya small portion of the state NOLs, can be carried forward indefinitely.indefinitely, although certain jurisdictions, including federal and numerous states, limit NOL carryforwards to a percentage of current year taxable income.
The Company also has recorded deferred tax assets related to federal and Illinoisstate research and development (“R&D”) tax credit carryforwards of $1.8$1.2 million and $0.8$4.2 million, net of uncertain tax positions, as of December 31, 2022, and 2021, respectively. The federal and state R&D tax credits generally may be carried forward 20 years and 5 years, respectively.
The Company expectsTax Cuts and Jobs Act enacted in December 2017, amended Internal Revenue Code Section 174 to fully utilize all NOLrequire that specific research and tax credit carryforwards beforeexperimental expenditures be capitalized and amortized over five years (15 years for non-U.S. R&D expenditures) beginning in the expiration of any carryforward period. Company’s 2022 fiscal year.
5357
Cars.com Inc.
Notes to Consolidated and Combined Financial Statements (Continued)
Significant components of the deferred tax assets and liabilities are as follows (in thousands):
|
| December 31, |
| |||||
|
| 2022 |
|
| 2021 |
| ||
Deferred income tax liabilities: |
|
|
|
|
|
| ||
Definite lived intangibles |
| $ | — |
|
| $ | (16,973 | ) |
Depreciation |
|
| (5,787 | ) |
|
| (8,428 | ) |
Indefinite lived intangibles |
|
| (4,237 | ) |
|
| — |
|
Right of use assets |
|
| (3,445 | ) |
|
| (3,687 | ) |
Other |
|
| (2,833 | ) |
|
| (1,708 | ) |
Total deferred tax liabilities |
| $ | (16,302 | ) |
| $ | (30,796 | ) |
Deferred income tax assets: |
|
|
|
|
|
| ||
Accrued compensation |
| $ | 8,748 |
|
| $ | 10,613 |
|
Capitalized research and development costs |
|
| 15,242 |
|
|
| — |
|
Definite lived intangibles |
|
| 239 |
|
|
| — |
|
Goodwill |
|
| 79,994 |
|
|
| 91,756 |
|
Indefinite lived intangibles |
|
| — |
|
|
| 5,734 |
|
Lease obligations |
|
| 7,161 |
|
|
| 7,762 |
|
NOL and tax credit carryforwards |
|
| 3,688 |
|
|
| 14,804 |
|
Other |
|
| 3,171 |
|
|
| 2,286 |
|
Total deferred tax assets |
| $ | 118,243 |
|
| $ | 132,955 |
|
Less: Valuation allowance |
|
| (103,294 | ) |
|
| (102,099 | ) |
Net deferred tax (liability) asset |
| $ | (1,353 | ) |
| $ | 60 |
|
|
| December 31, |
| |||||
|
| 2019 |
|
| 2018 |
| ||
Deferred income tax liabilities: |
|
|
|
|
|
|
|
|
Depreciation |
| $ | (4,459 | ) |
| $ | (4,629 | ) |
Intangibles |
|
| (150,090 | ) |
|
| (183,632 | ) |
Lease obligations |
|
| (3,893 | ) |
|
| — |
|
Other |
|
| (1,420 | ) |
|
| (1,217 | ) |
Total deferred tax liabilities |
| $ | (159,862 | ) |
| $ | (189,478 | ) |
Deferred income tax assets: |
|
|
|
|
|
|
|
|
Accrued compensation |
| $ | 5,742 |
|
| $ | 4,098 |
|
Right of use assets |
|
| 3,793 |
|
|
| — |
|
Unfavorable contracts liability |
|
| — |
|
|
| 4,739 |
|
NOL and tax credit carryforwards |
|
| 11,152 |
|
|
| — |
|
Other |
|
| 6,179 |
|
|
| 2,725 |
|
Total deferred tax assets |
| $ | 26,866 |
|
| $ | 11,562 |
|
Less: Valuation allowance |
|
| — |
|
|
| — |
|
Net deferred tax liability |
| $ | (132,996 | ) |
| $ | (177,916 | ) |
The deferred tax assets and liabilities recognized in the Company’s Consolidated Balance Sheets as of December 31, 2022 and 2021 were as follows (in thousands):
|
| December 31, |
| |||||
|
| 2022 |
|
| 2021 |
| ||
Investments and other assets, net |
| $ | 48 |
|
| $ | 60 |
|
Other noncurrent liabilities |
|
| (1,401 | ) |
|
| — |
|
Net deferred tax (liability) asset |
| $ | (1,353 | ) |
| $ | 60 |
|
Uncertain Tax Positions. Judgment is required in evaluating tax positions and determining the provision for income taxes. The Company establishes reserves for tax-related uncertainties based on estimates of whether, and the extent to which, additional taxes will be due. These reserves are established when the Company believes that certain positions might be challenged despite the Company’s belief that the tax return positions are fully supportable. The Company adjusts these reserves in light of changing facts and circumstances. The provision for income taxes includes the impact of reserve provisions and changes to reserves that are considered appropriate.
A summary of the Company’s uncertain tax positions is as follows (in thousands):
|
| Year Ended December 31, |
| |||||
|
| 2022 |
|
| 2021 |
| ||
Balance as of January 1 |
| $ | 9,851 |
|
| $ | 8,788 |
|
Additions based on tax positions related to the current year |
|
| 382 |
|
|
| 550 |
|
Additions for tax positions of prior years |
|
| 294 |
|
|
| 862 |
|
Reductions for tax positions of prior years |
|
| (7,974 | ) |
|
| (349 | ) |
Balance as of December 31 |
| $ | 2,553 |
|
| $ | 9,851 |
|
|
| Year Ended December 31, |
| |||||
|
| 2019 |
|
| 2018 |
| ||
Balance as of January 1 |
| $ | 595 |
|
| $ | — |
|
Additions for tax positions of prior years |
|
| 906 |
|
|
| 595 |
|
Income before income taxes |
| $ | 1,501 |
|
| $ | 595 |
|
AtThe Company believes it is reasonably possible that within the next twelve months the amount of the Company's uncertain tax positions may be decreased by approximately $0.4 million. The Company has recorded its best estimate of the potential exposure for these issues. As of December 31, 20192022, 2021 and 2018, there are $1.52020, the Company had $0.3 million, $2.6 million, and $0.6$1.6 million, respectively, of unrecognizeduncertain tax benefitspositions that if recognized, would affect the annual tax rate.
The Company recognizes accrued interest and penalties related to unrecognized tax benefits in income tax expense. During the years ended December 31, 2019, 2018 and 2017, amounts paid and amounts accrued for the payment of interest and penalties accrued was immaterial.
The Company files a consolidated U.S. federal income tax return as well as income tax returns in various state and local jurisdictions. The Company's tax returns are routinely audited by federal and state tax authorities and these tax audits are at various stages of completion at any given time. Generally, theThe Company’s tax returns open to examination by a federal or state taxing authority are for years beginning on or after December 31, 2016.January 1, 2017.
Note 15. Segment Information
Operating segments are components of an enterprise where separate financial information is available that is evaluated regularly by the chief operating decision maker (the “CODM”), or decision-making group, in deciding how to allocate resources and in assessing
58
Cars.com Inc.
Notes to Consolidated Financial Statements (Continued)
performance. The Company’s CODM is the CARS President and Chief Executive Officer. The CODM makes resource allocation decisions to maximize the Company’s consolidated financial results.
For the year ended December 31, 2019, the Company had 1 operating and reportable segment that generates revenue through two sales channels (Retail and Wholesale) which are presented on the Consolidated and Combined Statements of (Loss) Income. As of
54
Cars.com Inc.
Notes to Consolidated and Combined Financial Statements (Continued)
October 2019, the Company now has a direct relationship with all dealer customers and recognizes revenue associated with converted dealers as Retail revenue, rather than Wholesale revenue.
For the years ended December 31, 2019, 20182022, 2021 and 2017,2020, the Company had one operating and reportable segment. For the years ended December 31, 2022, 2021 and 2020, the Company did not have any one customer that generated greater than 10% of total revenue. Substantially all revenue and long-lived assets were generated and located within the U.S.
Note 16. Related Party
The Company was party to a commercial agreement with TEGNA, who was considered a related party through the Separation date of May 31, 2017. Related party revenue earned from this agreement was 0 for the years ended December 31, 2019 and 2018 and $3.4 million for the year ended December 31, 2017. The commercial agreement with TEGNA is effective until June 29, 2020.
Prior to the Separation, TEGNA utilized a centralized approach to cash management and the financing of its operations, providing funds to its subsidiaries as needed. These transactions were recorded in “TEGNA’s investment, net” when advanced. Accordingly, none of TEGNA’s cash and cash equivalents were assigned to the Company in TEGNA’s financial statements. Cash and cash equivalents in the Company’s Consolidated Balance Sheets represent cash held directly by the Company.
Equity in the Consolidated Balance Sheets represents the accumulated balance of transactions between the Company and TEGNA, the Company’s paid-in-capital and TEGNA’s interest in the Company’s accumulated deficit, and are presented within “TEGNA’s investment, net.” The amounts comprising the accumulated balance of transactions between the Company and TEGNA and TEGNA affiliates include (1) the cumulative net assets attributed to the Company by TEGNA and TEGNA affiliates; (2) the cumulative net advances to TEGNA representing the Company’s cumulative funds swept (net of funding provided by TEGNA and TEGNA affiliates to the Company) as part of the centralized cash management program; and (3) certain post-Separation transactions.
Note 17. Selected Quarterly Financial Data (Unaudited)
|
| Quarter Ended |
| |||||||||||||
(In thousands, except per share amounts) |
| March 31 |
|
| June 30 |
|
| September 30 |
|
| December 31 |
| ||||
2019 |
|
|
|
|
|
|
|
|
|
|
|
|
|
|
|
|
Revenue |
| $ | 154,198 |
|
| $ | 148,207 |
|
| $ | 152,090 |
|
| $ | 152,187 |
|
Cost of revenue and operations |
|
| 25,579 |
|
|
| 24,319 |
|
|
| 25,089 |
|
|
| 24,562 |
|
Operating (loss) income |
|
| (4,054 | ) |
|
| 1,004 |
|
|
| (447,716 | ) |
|
| 4,706 |
|
Net loss |
|
| (9,031 | ) |
|
| (6,026 | ) |
|
| (426,157 | ) |
|
| (4,110 | ) |
Loss per share, basic |
|
| (0.13 | ) |
|
| (0.09 | ) |
|
| (6.38 | ) |
|
| (0.06 | ) |
Loss per share, diluted |
|
| (0.13 | ) |
|
| (0.09 | ) |
|
| (6.38 | ) |
|
| (0.06 | ) |
|
|
|
|
|
|
|
|
|
|
|
|
|
|
|
|
|
2018 |
|
|
|
|
|
|
|
|
|
|
|
|
|
|
|
|
Revenue |
| $ | 159,957 |
|
| $ | 168,512 |
|
| $ | 169,312 |
|
| $ | 164,346 |
|
Cost of revenue and operations |
|
| 17,985 |
|
|
| 22,500 |
|
|
| 23,808 |
|
|
| 26,140 |
|
Operating income |
|
| 7,166 |
|
|
| 24,557 |
|
|
| 28,331 |
|
|
| 23,870 |
|
Net income |
|
| 929 |
|
|
| 12,726 |
|
|
| 15,797 |
|
|
| 9,357 |
|
Earnings per share, basic |
|
| 0.01 |
|
|
| 0.18 |
|
|
| 0.23 |
|
|
| 0.14 |
|
Earnings per share, diluted |
|
| 0.01 |
|
|
| 0.18 |
|
|
| 0.23 |
|
|
| 0.14 |
|
59
Item 9. Changes in and Disagreements With Accountants on Accounting and Financial Disclosure.
None.
Item 9A. Controls and Procedures.
Management’s Evaluation of Disclosure Controls and Procedures
Management, with the participation of our Chief Executive Officer andChief Financial Officer, evaluated the effectiveness of our disclosure controls and procedures (as defined in Rules 13a-15(e) and 15d-15(e) under the Exchange Act) as of the end of the period covered by this report. Based upon that evaluation, our Chief Executive Officer and Chief Financial Officer concluded that, as of such date, our disclosure controls and procedures were effective to provide reasonable assurance that information required to be disclosed in the reports that we file or submit under the Exchange Act is recorded, processed, summarized and reported within the time periods specified by the rules and forms of the Exchange Act, and that such information is accumulated and communicated to management, including our Chief Executive Officer and Chief Financial Officer, as appropriate, to allow timely decisions regarding required disclosure.
Management recognizes that any controls and procedures, no matter how well designed and operated, can provide only reasonable assurance of achieving their objectives, and management necessarily applies its judgment in evaluating the benefits of possible controls and procedures relative to their costs.
Management’s Report on Internal Control over Financial Reporting
Management is responsible for establishing and maintaining adequate internal control over our financial reporting (as defined in Rules 13a-15(f) and 15d-15(f) under the Exchange Act). Our internal control system is designed to provide reasonable assurance regarding the reliability of financial reporting and the preparation and fair presentation of published financial statements.
In evaluating the effectiveness of our internal control over financial reporting as of December 31, 2019,2022, management used the framework set forth by the Committee of Sponsoring Organizations of the Treadway Commission in Internal Control - Integrated Framework (2013). Based on such evaluation, management concluded that our internal control over financial reporting was effective as of December 31, 2019.2022. Management reviewed the results of its assessment with the Audit Committee of our Board of Directors.
Because of its inherent limitations, internal control over financial reporting may not prevent or detect misstatements. Also, projections of any evaluation of effectiveness to future periods are subject to the risk that controls may become inadequate because of changes in conditions or that the degree of compliance with the policies or procedures may deteriorate. Ernst & Young LLP, our independent registered public accounting firm, issued an attestation report on the effectiveness of our internal control over financial reporting as of December 31, 20192022 included herein.
Changes in Internal Control over Financial Reporting
During the period covered by this report, there were no changes in our internal control over financial reporting that materially affected, or are reasonably likely to materially affect, our internal control over financial reporting (as defined in Rules 13a-15(f) and 15d-15(f) under the Exchange Act).
60
Report of Independent Registered Public Accounting Firm
To the Stockholders and the Board of Directors of Cars.com Inc.
Opinion on Internal Control over Financial Reporting
We have audited Cars.com Inc.’s internal control over financial reporting as of December 31, 2019,2022, based on criteria established in Internal Control – Integrated Framework issued by the Committee of Sponsoring Organizations of the Treadway Commission (2013 framework) (the COSO criteria). In our opinion, Cars.com Inc. (the Company) maintained, in all material respects, effective internal control over financial reporting as of December 31, 2019,2022, based on the COSO criteria.
We also have audited, in accordance with the standards of the Public Company Accounting Oversight Board (United States) (PCAOB), the Consolidated Balance Sheets of Cars.com Inc. as of December 31, 20192022 and 2018,2021, the related Consolidated and Combined Statements of (Loss) Income (Loss), Comprehensive Income (Loss) Income,, Stockholders’ Equity and Cash Flows for each of the three years in the period ended December 31, 2019,2022, and the related notes and financial statement schedule listed in the index at Item 15(a)(2) and our report dated February 26, 202023, 2023 expressed an unqualified opinion thereon.
Basis for Opinion
The Company’s management is responsible for maintaining effective internal control over financial reporting and for its assessment of the effectiveness of internal control over financial reporting included in the accompanying Management’s Report on Internal Control over Financial Reporting. Our responsibility is to express an opinion on the Company’s internal control over financial reporting based on our audit. We are a public accounting firm registered with the PCAOB and are required to be independent with respect to the Company in accordance with the U.S. federal securities laws and the applicable rules and regulations of the Securities and Exchange Commission and the PCAOB.
We conducted our audit in accordance with the standards of the PCAOB. Those standards require that we plan and perform the audit to obtain reasonable assurance about whether effective internal control over financial reporting was maintained in all material respects.
Our audit included obtaining an understanding of internal control over financial reporting, assessing the risk that a material weakness exists, testing and evaluating the design and operating effectiveness of internal control based on the assessed risk, and performing such other procedures as we consider necessary in the circumstances. We believe that our audit provides a reasonable basis for our opinion.
Definition and Limitations of Internal Control over Financial Reporting
A company’s internal control over financial reporting is a process designed to provide reasonable assurance regarding the reliability of financial reporting and the preparation of financial statements for external purposes in accordance with generally accepted accounting principles. A company’s internal control over financial reporting includes those policies and procedures that (1) pertain to the maintenance of records that, in reasonable detail, accurately and fairly reflect the transactions and dispositions of the assets of the company; (2) provide reasonable assurance that transactions are recorded as necessary to permit preparation of financial statements in accordance with generally accepted accounting principles, and that receipts and expenditures of the company are being made only in accordance with authorizationauthorizations of management and directors of the company; and (3) provide reasonable assurance regarding prevention or timely detection of unauthorized acquisition, use, or disposition of the company’s assets that could have a material effect on the financial statements.
Because of its inherent limitations, internal control over financial reporting may not prevent or detect misstatements. Also, projections of any evaluation of effectiveness to future periods are subject to the risk that controls may become inadequate because of changes in conditions, or that the degree of compliance with the policies or procedures may deteriorate.
/s/ Ernst & Young LLP
Chicago, Illinois
February 26, 202023, 2023
61
Item 9B. Other Information.
On February 11, 2020, the Board of Directors establishedNone.
Item 9C. Disclosure Regarding Foreign Jurisdictions that the Company’s 2020 Annual Meeting of Stockholders (the “2020 Annual Meeting”) will be held on Thursday, May 14, 2020 at 9:00 a.m., Central Time. The record date for the determination of stockholders of the Company entitled to receive notice of and to vote at the 2020 Annual Meeting is the close of business on Monday, March 16, 2020. The Company announced the date of the 2020 Annual Meeting, the record date for the 2020 Annual Meeting date and following information regarding stockholder nominations and proposals on a Current Report on Form 8-K, dated February 11, 2020, filed with the SEC.Prevent Inspections.
To be considered for inclusion in this year’s proxy materials for the 2020 Annual Meeting, stockholder proposals must have been submitted in writing by February 21, 2020. In addition to complying with this deadline, stockholder proposals intended to be considered for inclusion in the Company’s proxy materials for the 2020 Annual Meeting must also comply with the Bylaws and all applicable rules and regulations promulgated by the SEC under the Exchange Act. Additionally, any stockholder who intended to submit a proposal regarding a director nomination or who intended to submit a proposal regarding any other matter of business at the 2020 Annual Meeting to be included in the Company’s proxy materials for the 2020 Annual Meeting must have also ensured that notice of any such nomination or proposal (including any additional information specified in the Bylaws) was received by the Corporate Secretary at the Company’s principal executive offices on or before the close of business on February 21, 2020. The February 21, 2020 deadline also applies in determining whether notice of a stockholder proposal is timely for purposes of exercising discretionary voting authority with respect to proxies under Rule 14a-4(c)(1) of the Exchange Act.Not applicable.
62
PART III
Item 10. Directors, Executive Officers and Corporate Governance. The information required by this item will be included in the Company’s definitive proxy statement, forto be filed with the 2020SEC within 120 days after the end of the Company's fiscal year ended December 31, 2022 in connection with the 2023 Annual Meeting of Stockholders and is incorporated herein by reference.
Item 11. Executive Compensation. The information required by this item will be included in the Company’s definitive proxy statement, forto be filed with the 2020SEC within 120 days after the end of the Company's fiscal year ended December 31, 2022 in connection with the 2023 Annual Meeting of Stockholders and is incorporated herein by reference.
Item 12. Security Ownership of Certain Beneficial Owners and Management and Related Stockholder Matters. The information required by this item will be included in the Company’s definitive proxy statement, forto be filed with the 2020SEC within 120 days after the end of the Company's fiscal year ended December 31, 2022 in connection with the 2023 Annual Meeting of Stockholders and is incorporated herein by reference.
Item 13. Certain Relationships and Related Transactions, and Director Independence. The information required by this item will be included in the Company’s definitive proxy statement, forto be filed with the 2020SEC within 120 days after the end of the Company's fiscal year ended December 31, 2022 in connection with the 2023 Annual Meeting of Stockholders and is incorporated herein by reference.
Item 14. Principal Accounting Fees and Services. The information requiredInformation about aggregate fees billed to us by this itemour principal accountant, Ernst & Young LLP (PCAOB ID No. 42) will be included under the caption “Independent Auditor Fees” in the Company’s definitive proxy statement, forto be filed with the 2020SEC within 120 days after the end of the Company's fiscal year ended December 31, 2022 in connection with the 2023 Annual Meeting of Stockholders and is incorporated herein by referencereference..
63
PART IV
Item 15. Exhibits, Financial Statement Schedules.
(a) (1) Financial Statements. The financial statements required by this item are listed in Part II, Item 8., “Financial Statements and Supplementary Data” herein.
| (2) Financial Statement Schedules. The financial statement schedule required by this item is listed below and included in this report after the signature page hereto.
|
|
|
|
Schedule II-Valuation and Qualifying Accounts for the years ended December 31, 2019, 20182022, 2021 and 2017.2020.
All other schedules are omitted because they are not applicable, not required or the required information is shown in the Consolidated and Combined Financial Statements or notes thereto.
64
EXHIBIT INDEX
Number |
|
EXHIBIT INDEX
| Exhibit Description | |
| ||
| ||
3.2** | ||
4.1** | ||
|
| |
4.3** | ||
| ||
| ||
| ||
| ||
| ||
10.4** | ||
10.5**^ | ||
| ||
| ||
| ||
| ||
| ||
65
| ||
| ||
|
|
| |
10.14**^ | ||
| ||
| ||
| ||
10.17**^ | ||
10.18**^ | ||
10.19**^ | ||
| ||
| ||
| ||
| ||
10.22**^ | ||
10.23**^ | ||
10.24**^ | ||
21.1* | ||
23.1* | ||
31.1* | ||
31.2* | ||
66
32.1* | ||
32.2* | ||
101.INS | Inline XBRL Instance Document – the instance document does not appear in the Interactive Data File because XBRL tags are embedded within the Inline XBRL document. | |
101.SCH | Inline XBRL Taxonomy Extension Schema Document | |
101.CAL | Inline XBRL Taxonomy Extension Calculation Linkbase Document | |
101.DEF | Inline XBRL Taxonomy Extension Definition Linkbase Document | |
101.LAB | Inline XBRL Taxonomy Extension Label Linkbase Document | |
101.PRE | Inline XBRL Taxonomy Extension Presentation Linkbase Document | |
104 | Cover Page Interactive Data File (embedded within the Inline XBRL document) | |
|
|
|
|
|
| |
** Previously filed.
^ Management contract or compensatory plan or arrangement.
67
Item 16. Form 10-K Summary. None.
SIGNATURES68
SIGNATURES
Pursuant to the requirements of Section 13 or 15(d) of the Securities Exchange Act of 1934, as amended, the Registrant has duly caused this Report to be signed on its behalf by the undersigned, thereunto duly authorized.
Cars.com Inc. | |||
Date: February | By: | /s/ T. Alex Vetter | |
T. Alex Vetter | |||
| |||
Date: February | By: | /s/ | |
| |||
Chief Financial Officer | |||
Pursuant to the requirements of the Securities Exchange Act of 1934, as amended, this Report has been signed below by the following persons on behalf of the Registrant in the capacities and on the dates indicated.
Signature | Title | Date | ||
/s/ T. Alex Vetter |
| February | ||
T. Alex Vetter | (Principal Executive Officer) | |||
/s/ | Chief Financial Officer | February | ||
| (Principal Financial Officer and Principal Accounting Officer) | |||
/s/ Scott Forbes | Chairman of the Board | February | ||
Scott Forbes | ||||
/s/ Jerri DeVard | Director | February | ||
Jerri DeVard | ||||
/s/ Jill Greenthal | Director | February | ||
Jill Greenthal | ||||
/s/ Thomas Hale | Director | February | ||
Thomas Hale | ||||
/s/ Michael Kelly | Director | February | ||
Michael Kelly | ||||
/s/ Donald A. McGovern, Jr. | Director | February | ||
Donald A. McGovern, Jr. | ||||
/s/ Greg Revelle | Director | February | ||
Greg Revelle | ||||
/s/ Jenell Ross | Director | February 23, 2023 | ||
Jenell Ross | ||||
/s/ Bala Subramanian | Director | February | ||
Bala Subramanian | ||||
/s/ Bryan Wiener | Director | February | ||
Bryan Wiener |
69
Schedule II
Valuation and Qualifying Accounts
For the Years Ended December 31, 2019, 20182022, 2021 and 20172020
(In thousands)
Description |
| Balance at Beginning of Period |
|
| Additions Charged to Costs and Expenses |
|
| Write-offs |
|
| Recoveries |
|
| Balance at End of Period |
| |||||
Allowance for doubtful accounts: |
|
|
|
|
|
|
|
|
|
|
|
|
|
|
|
|
|
|
|
|
2019 |
| $ | 4,441 |
|
| $ | 4,897 |
|
| $ | (4,638 | ) |
| $ | 345 |
|
| $ | 5,045 |
|
2018 |
|
| 2,616 |
|
|
| 4,391 |
|
|
| (3,383 | ) |
|
| 817 |
|
|
| 4,441 |
|
2017 |
|
| 3,527 |
|
|
| 2,452 |
|
|
| (4,037 | ) |
|
| 674 |
|
|
| 2,616 |
|
Description |
| Balance at |
|
| Additions |
|
| Write-offs |
|
| Recoveries |
|
| Balance at |
| |||||
Allowance for doubtful accounts: |
|
|
|
|
|
|
|
|
|
|
|
|
|
|
| |||||
2022 |
| $ | 1,665 |
|
| $ | 1,888 |
|
| $ | (2,314 | ) |
| $ | 651 |
|
| $ | 1,890 |
|
2021 |
|
| 4,364 |
|
|
| 164 |
|
|
| (3,268 | ) |
|
| 405 |
|
|
| 1,665 |
|
2020 |
|
| 5,045 |
|
|
| 4,380 |
|
|
| (5,330 | ) |
|
| 269 |
|
|
| 4,364 |
|
6570