

UNITED STATES
SECURITIES AND EXCHANGE COMMISSION
Washington, D.C. 20549
FORM 10-K
(Mark One)
☒ |
|
For the fiscal year ended December 31, 20192022
orOR
☐ |
|
For the transition period from to Commission File Number 001-34279
GULF ISLAND FABRICATION, INC.
(Exact name of registrantRegistrant as specified in its charter)Charter)
Louisiana | 72-1147390 | |
(State or other jurisdiction of
| (I.R.S. Employer Identification | |
2170 Buckthorne Place, Suite 420 The Woodlands, Texas | 77380 | |
|
| |
(Address of principal executive offices) | (Zip |
(713) 714-6100
(Registrant’s telephone number, including area code)code: (713) 714-6100
Securities registered pursuant to Section 12(b) of the Act:
Title of each class |
| Trading Symbol(s) | Name of each exchange on which registered | |
Common Stock |
| GIFI | NASDAQ |
Securities registered pursuant to Section 12(g) of the Act: None
None
Indicate by check mark if the registrantRegistrant is a well-known seasoned issuer, as defined in Rule 405 of the Securities Act. Yes ☐No☒
Indicate by check mark if the registrantRegistrant is not required to file reports pursuant to Section 13 or Section 15(d) of the Act. Yes ☐No☒
Indicate by check mark whether the registrantRegistrant: (1) has filed all reports required to be filed by Section 13 or 15(d) of the Securities Exchange Act of 1934 during the preceding 12 months (or for such shorter period that the registrantRegistrant was required to file such reports), and (2) has been subject to such filing requirements for the past 90 days. Yes☒ No ☐
Indicate by check mark whether the registrantRegistrant has submitted electronically every Interactive Data File required to be submitted pursuant to Rule 405 of Regulation S-T (§232.405 of this chapter) during the preceding twelve12 months (or for such shorter period that the registrantRegistrant was required to submit such files). Yes☒ No ☐
Indicate by check mark whether the registrant is a large accelerated filer, an accelerated filer, a non-accelerated filer, or a smaller reporting company, or an emerging growth company. See the definitions of “large accelerated filer,” “accelerated filer”filer,” “smaller reporting company,” and “smaller reporting“emerging growth company” in Rule 12b-2 of the Exchange Act.
Large accelerated filer |
| ☐ | Accelerated filer |
| ☐ | |||
|
|
|
| |||||
Non-accelerated filer | ☒ | Smaller reporting company | ☒ | |||||
Emerging growth company | ☐ | |||||||
If an emerging growth company, indicate by check mark if the registrant has elected not to use the extended transition period for complying with any new or revised financial accounting standards provided pursuant to Section 13(a) of the Exchange Act Act. ☐
Indicate by check mark whether the registrant has filed a report on and attestation to its management’s assessment of the effectiveness of its internal control over financial reporting under Section 404(b) of the Sarbanes-Oxley Act (15 U.S.C. 7262(b)) by the registered public accounting firm that prepared or issued its audit
report. ☐
Indicate by check mark whether the Registrant is a shell company (as defined in Rule 12b-2 of the Exchange Act). Yes ☐ No ☒
The aggregate market value of the voting and non-voting common equity held by non-affiliates of the registrant atRegistrant, based on the closing price of the shares of common stock on The NASDAQ Stock Market on June 30, 2019,2022 was approximately $94,818,654.$38,842,000.
The number of shares of the registrant’s common stock, no par value per share,Registrant’s Common Stock outstanding as of March 5, 2020,February 28, 2023, was 15,291,776.15,972,533.
DOCUMENTS INCORPORATED BY REFERENCE
Portions of the registrant’s definitive Proxy Statementproxy statement to be prepared for use in connection with the registrant’s 2020 Annual Meeting2023 annual meeting of Shareholdersshareholders have been
incorporated by reference into Part III of this Annual Report on Form 10-K.
ANNUAL REPORT ON FORM 10-K FOR
THE FISCAL YEAR ENDED DECEMBER 31, 20192022
TABLE OF CONTENTS
i
As used in this report filed on form 10-K for the year ended December 31, 2019 ("20192022 (“2022 Annual Report"Report” or "this Report"“this Report”), the following abbreviations and terms have the meanings listed below. In addition, the terms “Gulf Island,” “the Company,” “we,” “us” and “our” refer to Gulf Island Fabrication, Inc. and its consolidated subsidiaries, unless the context clearly indicates otherwise. Certain terms defined below may be redefined separately within this Report when we believe providing a definition upon the first use of the term will assist users of this Report. Unless and as otherwise stated, any references in this Report to any agreement means such agreement and all schedules, exhibits and attachments in each case as amended, restated, supplemented or otherwise modified to the date of filing this Report.
|
| Our Financial Statements for the year ended December 31, 2021 and related notes, filed with the SEC on Form 10-K on March 22, 2022. |
| The closing date of the DSS Acquisition of December 1, 2021. | |
Active Retained Shipyard Contracts | Contracts and related obligations for our seventy-vehicle ferry and two forty-vehicle ferry projects that were under construction as of the Transaction Date, which were excluded from the Shipyard Transaction. The Active Retained Shipyard Contracts do not include the contracts and related obligations for the two MPSV projects that are subject to our MPSV Litigation (which were retained but are not active contracts). | |
ASC | Accounting Standards Codification. | |
ASU | Accounting Standards Update. | |
Balance Sheet | Our Consolidated Balance Sheets, as filed in this Report. | |
| Bollinger Houma Shipyards, L.L.C. and Bollinger Shipyards Lockport, L.L.C. | |
Broussard Facility | Our leased facility located in Broussard, Louisiana that supports our Services Division. | |
Cash-Settled RSUs | RSUs settled in cash. | |
CARES Act | The Coronavirus Aid, Relief and Economic Security Act, as amended. | |
contract assets | Costs and estimated earnings recognized to date in excess of cumulative billings. | |
contract liabilities | Cumulative billings in excess of costs and estimated earnings recognized to date and accrued contract losses. | |
|
| Work is performed and billed to the customer at cost plus a profit margin or other variable fee arrangements which can include a mark-up. |
| The global coronavirus pandemic. | |
deck | The component of a platform on which drilling, production, separating, gathering, piping, compression, well support, crew quartering and other functions related to offshore oil and gas development are conducted. | |
|
| Contracts and related obligations for our three research vessel projects and five towing, salvage and rescue ship projects, which were included in the |
| The acquisition of the DSS Business from Dynamic on December 1, 2021. | |
DSS Business | The services and industrial staffing businesses of Dynamic, which were acquired in connection with the DSS Acquisition. | |
DTA(s) | Deferred Tax Asset(s). | |
|
| Dynamic Industries, Inc. |
|
| Engineering, Procurement and Construction. |
ESG | Environmental, Social and Governance. | |
Exchange Act | Securities Exchange Act of 1934, as amended. | |
| Our Fabrication reportable segment. | |
Facilities | Our Houma Facilities, Broussard Facility, Harvey Facility, Ingleside Facility and other facilities that support our operations. | |
ii
FASB | Financial Accounting Standards Board. | |
Financial Statements | Our Consolidated Financial Statements, including comparative consolidated Balance Sheets, Statements of Operations, Statements of Changes in Shareholders' Equity and Statements of Cash Flows, as filed in this Report. | |
GAAP | Generally Accepted Accounting Principles in the U.S. | |
| Gulf | |
| Gulf of Mexico. | |
Gulf Coast | Along the coast of the Gulf of Mexico. | |
| Our | |
Harvey Option | Purchase option entered into in connection with the DSS Acquisition that provided us with a right to buy the Harvey Option Facility prior to December 2, 2022 for a nominal amount. The option was sold to a third-party in the third quarter 2022. | |
Harvey Option Facility | Our former leased facility located in Harvey, Louisiana subject to the Harvey Option, a lease for which was entered into in connection with the DSS Acquisition. The lease was terminated in connection with the sale of the Harvey Option and we replaced the facility capacity with the Harvey Facility. | |
Hornbeck | Hornbeck Offshore Services, | |
Houma Facilities | Our owned facilities located in Houma, | |
Incentive Plans | Long-term incentive plans under which equity or cash-based awards may be made to eligible employees and non-employee directors. | |
| Our owned facility located in Ingleside, Texas that supports our Services Division, which was acquired in connection with the DSS Acquisition. | |
inland | Typically, | |
| Short-term finance arrangement for insurance premiums associated with our property and equipment insurance coverages. | |
ISO | International Standard Organization based in Geneva, Switzerland. | |
jacket | A component of a fixed platform consisting of a tubular steel braced structure extending from the mudline of the seabed to a point above the water surface. The jacket is anchored with tubular steel | |
Jennings | Our | |
labor hours | Hours worked by employees directly involved in the production of our products or delivery of our services. | |
Lake Charles | Our | |
|
| Our $20.0 million letter of credit facility with Whitney Bank maturing June 30, 2023, as amended. |
LNG |
| Liquefied Natural Gas. |
Mortgage Agreement | Multiple indebtedness mortgage arrangement with one of our Sureties, to secure our obligations and liabilities under our general indemnity agreement with such Surety associated with outstanding surety bonds for certain contracts, which encumbers the real estate associated with our Houma Facilities and includes certain covenants and events of default. | |
iiiii
Fabricated structures that include structural steel, piping, valves, fittings, storage vessels and other equipment that are incorporated into a refining, petrochemical, LNG or industrial system. | ||
| Multi-Purpose | |
| The lawsuit filed in the Twenty-Second Judicial District Court for the Parish of St. Tammany, State of Louisiana and is styled Gulf Island Shipyards, LLC v. Hornbeck Offshore Services, LLC, bearing docket number 2018-14861. | |
NOL(s) | Net operating loss(es) that are available to offset future taxable income, subject to certain limitations. | |
offshore | In unprotected waters outside coastlines. | |
onshore | Inside the coastline on land. | |
|
| |
| Organization of the Petroleum Exporting Countries. | |
| Occupational Safety and Health Administration. | |
Performance Bonds | The performance bonds issued by the Surety in connection with the construction of two MPSVs that are subject to our MPSV Litigation, for which the face amount of the bonds total $50.0 million. | |
performance obligation | A contractual obligation to construct and transfer a distinct good or service to a customer. It is the unit of account in Topic 606. The transaction price of a contract is allocated to each distinct performance obligation and recognized as revenue when, or as, the performance obligation is satisfied. | |
piles | Rigid tubular pipes that are driven into the seabed to | |
platform | A structure from which offshore oil and gas development drilling and production are conducted. | |
| Percentage-of-completion. | |
PPP | Paycheck Protection Program administered by the SBA under the CARES Act. | |
PPP Loan | Our previous $10.0 million loan from Whitney Bank forgiven pursuant to the PPP. | |
Pro Forma Information | The condensed combined financial information that gives effect to the DSS Acquisition as if it had occurred on January 1, 2020 (the earliest period presented in our 2021 Financial Statements). | |
Purchase Price | The purchase price of $7.6 million associated with the DSS Acquisition. | |
Restrictive Covenant Agreement | Restrictive covenant arrangement with one of our Sureties, to secure our obligations and liabilities under our general indemnity agreement with such Surety associated with its outstanding surety bonds for certain contracts, which precludes us from paying dividends or repurchasing shares of our common stock. | |
Retained Shipyard Contracts | Contracts and related obligations for the Active Retained Shipyard Contracts and two MPSV projects that are subject to our MPSV Litigation, which were excluded from the Shipyard Transaction. | |
RSUs | Restricted Stock Units. | |
SAB | Staff Accounting Bulletin. | |
SBA | Small Business Administration. | |
SEC | U.S. Securities and Exchange Commission. | |
|
| Our Services reportable segment. |
| Our | |
|
| Our formerly owned facility located in Houma, Louisiana that previously supported our Shipyard Division and was sold in connection with the Shipyard Transaction. |
| The sale of our Shipyard Division’s operating assets and certain construction contracts on April 19, 2021, which included the Divested Shipyard Contracts and our Shipyard Facility. | |
Spud barge | Construction barge rigged with vertical tubular or square lengths of steel pipes that are lowered to anchor the vessel. | |
Statement of Cash Flows | Our Consolidated Statements of Cash Flows, as filed in this Report. |
iv
Statement of Operations | Our Consolidated Statements of Operations, as filed in this Report. | |
| Our Consolidated Statements of Changes in Shareholders’ Equity, as filed in this Report. | |
Surety or Sureties | A financial institution that issues bonds to customers on behalf of the Company for the purpose of providing third-party financial assurance related to the performance of our contracts. Payments by the Surety pursuant to the bond in the event of non-performance are subject to reimbursement to the Surety by us under a general indemnity agreement. | |
T&M | Time and materials. Work is performed and billed to the customer | |
|
| |
|
| |
| The revenue recognition criteria prescribed under ASU 2014-09, “Revenue from Contracts with | |
| The closing date of the Shipyard Transaction of April 19, 2021. | |
Transaction Price | The Company’s base sales price of $28.6 million associated with the Shipyard Transaction. | |
U.S. | The United States of America. | |
USL&H | United States Longshoreman and Harbor Workers Act. | |
VA(s) | Valuation Allowance(s). | |
Whitney Bank | Hancock Whitney Bank. | |
Working Capital True-Up | The $7.8 million received in 2021 in connection with the Shipyard Transaction associated with changes in working capital for the Divested Shipyard Contracts from December 31, 2020 through the Transaction Date. | |
iiiv
Cautionary Statement on Forward-Looking Information
This Report contains forward-looking statements in which we discuss our potential future performance. Forward-looking statements, within the meaning of the safe harbor provisions of the U.S. Private Securities Litigation Reform Act of 1995, are all statements other than statements of historical facts, such as projections or expectations relating to timing of delivery of vessels related to the Active Retained Shipyard Contracts and subsequent wind down of our Shipyard Division operations; expected exposure in the event of an adverse outcome in the MPSV Litigation; diversification and entry into new end markets; improvement of risk profile; industry outlook; oil and gas prices, operatingprices; timing of investment decisions and new project awards; cash flows and cash balance; capital expenditures, liquidityexpenditures; liquidity; and tax rates. The words “anticipates,” “may,” “can,” “plans,” “believes,” “estimates,” “expects,” “projects,” “targets,” “intends,” “likely,” “will,” “should,” “to be,” “potential” and any similar expressions are intended to identify those assertions as forward-looking statements.
We caution readers that forward-looking statements are not guarantees of future performance and actual results may differ materially from those anticipated, projected or assumed in the forward-looking statements. Important factors that can cause our actual results to differ materially from those anticipated in the forward-looking statements includeinclude: supply chain disruptions (including global shipping and logistics challenges), inflationary pressures, economic slowdowns and recessions, natural disasters, public health crises (such as COVID-19), labor costs and geopolitical conflicts (such as the conflict in Ukraine), and the related volatility in oil and gas prices and other factors impacting the global economy; the cyclical nature of the oil and gas industry; outcome of the MPSV Litigation and our ability to resolve any other material legal proceedings; competition; reliance on significant customers; competitive pricing and cost overruns on our projects; performance of subcontractors and dependence on suppliers; timing and our ability to secure and commence execution of new project awards, including fabrication projects for refining, petrochemical, LNG, industrial and industrial facilitiessustainable energy end markets, and offshore wind developments,the resumption of our suspended large fabrication project; our ability to maintain and further improve project execution, the cyclical nature of the oil and gas industry, competition, consolidation of our customers, timing and award of new contracts, reliance on significant customers, financial ability and credit worthiness of our customers,execution; nature of our contract terms competitive pricing and cost overruns on our projects, adjustmentscustomer adherence to previously reported profits or losses under the percentage-of-completion method, weather conditions, changes in backlog estimates,such terms; suspension or termination of projects,projects; changes in contract estimates; customer or subcontractor disputes; operating dangers, weather events and limits on insurance coverage; the operability and adequacy of our major equipment; the final assessment of damage at our Houma Facilities and the related recovery of any insurance proceeds; our ability to raise additional capital,capital; our ability to amend or obtain new debt financing or credit facilities on favorable terms, ability to remain in compliance withterms; our covenants contained in our Credit Agreement, ability to generate sufficient cash flow,flow; our ability to sell certain assets,obtain letters of credit or surety bonds and ability to meet any future asset impairments,indemnification obligations thereunder; consolidation of our customers; financial ability and credit worthiness of our customers; adjustments to previously reported profits or losses under the percentage-of-completion method; our ability to employ a skilled workforce; loss of key personnel; utilization of facilities or closure or consolidation of facilities, customer or subcontractor disputes, ability to resolve the dispute with a customer relating to the purported terminationsfacilities; failure of contracts to build two MPSVs, operating dangers and limits on insurance coverage,our safety assurance program; barriers to entry into new lines of business, abilitybusiness; weather impacts to employ skilled workers, loss of key personnel, performance of subcontractors and dependence on suppliers,operations; any future asset impairments; changes in trade policies of the U.S. and other countries,countries; compliance with regulatory and environmental laws,laws; lack of navigability of canals and rivers, shutdowns of the U.S. government,rivers; systems and information technology interruption or failure and data security breaches,breaches; performance of partners in any future joint ventures and other strategic alliances,alliances; shareholder activism,activism; focus on environmental, social and governance factors by institutional investors and regulators; and other factors described under “Risk Factors”in Part I, Item 1A "Risk Factors" inof this Report and as may be further updated by subsequent filings with the SEC.
InvestorsAdditional factors or risks that we currently deem immaterial, that are not presently known to us or that arise in the future could also cause our actual results to differ materially from our expected results. Given these uncertainties, investors are cautioned that many of the assumptions upon which our forward-looking statements are based are likely to change after the date the forward-looking statements are made, which we cannot control. Further, we may make changes to our business plans that could affect our results. We caution investors that we do not intendundertake no obligation to publicly update or revise any forward-looking statements, more frequently than quarterlywhich speak only as of the date made, for any reason, whether as a result of new information, future events or developments, changed circumstances, or otherwise, and notwithstanding any changes in our assumptions, changes in business plans, actual experience or other changes, and we undertake no obligation to update any forward-looking statements.changes.
1
PART I
Items 11. and 2. Business and Properties
Certain terms are defined in the “Glossary of Terms” beginning on page ii. References to “Notes” relate to the Notes to our Consolidated Financial Statements (“Financial Statements”) in Item 8.
Description of our Operations
Gulf Island Fabrication, Inc. (together with its subsidiaries, "Gulf“Gulf Island,"” “the Company," "we," "us"” “we,” “us” and "our"“our”) is a Louisiana corporation incorporated in 1985. We are a leading fabricator of complex steel structures and modules and marine vessels, and a provider of specialty services, including project management, hookup, commissioning, repair, maintenance, andscaffolding, coatings, welding enclosures, civil construction services.and staffing services to the industrial and energy sectors. Our customers include United States ("U.S.") and, to a lesser extent, international energy producers; refining, petrochemical, LNG, industrial and power operators; and marine operators; EPC companies; and certain agencies of the U.S. government.companies. Our corporate headquarters is located in Houston,The Woodlands, Texas withand our primary operating facilities are located in Houma, Jennings and Lake Charles, Louisiana.Louisiana (“Houma Facilities”). See "Overview"“Overview” section in Item 7 for discussion of our current business and outlookoutlook.
During 2021, we operated and Note 3managed our business through two operating divisions (“Fabrication & Services” and “Shipyard”) and one non-operating division (“Corporate”), which represented our reportable segments. In the first quarter 2022, we realigned our operating divisions due to the DSS Acquisition (discussed below) and related changes in our management structure and oversight of our Consolidated Financial Statements ("Financial Statements") in Item 8 for discussionvarious lines of our anticipated closure of the Jennings Yard.
Webusiness. As a result, we currently operate and manage our business through three operating divisions ("Fabrication"(“Services”, "Shipyard"“Fabrication” and "Services"“Shipyard”) and one non-operating division ("Corporate"(“Corporate”), which represent our reportable segments. DuringAccordingly, financial information (including the first quarter 2019, our former EPC Division was operationally combined witheffects of eliminations) for our Fabrication Division, and accordingly, the segment results for the EPC& Services Division for 2018 and 2017 were combined with the Fabrication Division2021 has been recast to conform to the presentation of our reportable segments for 2019.2022. Our three operating divisions and Corporate Division are discussed below.
Services Division –Our Services Division provides maintenance, repair, construction, scaffolding, coatings, welding enclosures and other specialty services on offshore platforms and inland structures and at industrial facilities; provides services required to connect production equipment and service modules and equipment on offshore platforms; provides project management and commissioning services; provides industrial staffing services; and performs municipal and drainage projects, including pump stations, levee reinforcement, bulkheads and other public works. Our services activities are managed from our various Facilities and include the services and industrial staffing businesses (“DSS Business”) of Dynamic Industries, Inc. (“Dynamic”), which was acquired on December 1, 2021 (“DSS Acquisition”). See “Results of Operations” in Item 7 and Note 10 of our Financial Statements in Item 84 for segment financial information by division and further discussion of our realigned operating divisions for 2019, and see “Overview” in Item 7 for discussion of anticipated changes to our operating divisions for 2020.the DSS Acquisition.
Fabrication Division - – Our Fabrication Division fabricates modules, skids and piping systems for onshore refining, petrochemical, LNG and industrial facilities and offshore facilities; fabricates foundations, secondary steel components and support structures for alternative energy developments and coastal mooring facilities; fabricates offshore production platforms and associated structures, including jacket foundations, piles and topsides for fixed production and utility platforms, as well as hulls and topsides for floating production and utility platforms; and fabricates other complex steel structures and components. TheseOur fabrication activities are performed at our facility in Houma Louisiana.Facilities.
Shipyard Division - – Our Shipyard Division fabricatespreviously fabricated newbuild marine vessels including OSVs, MPSVs, research vessels, tugboats, salvage vessels, towboats, barges, drydocks, anchor handling vessels and lift boats; providesprovided marine repair and maintenance services, including steel repair, blasting and painting services, electrical systems repair, machinery and piping system repairs, and propeller, shaft, and rudder reconditioning; and performs conversion projects to lengthen vessels and modify vessels to permit their use for a different type of activity or enhance their capacity or functionality. Theseservices. The activities arewere performed at our Shipyard Facility. However, on April 19, 2021, we sold our Shipyard Division operating assets and certain construction contracts (“Shipyard Transaction”), which included the Divested Shipyard Contracts and our Shipyard Facility. We determined that the assets, liabilities and operations associated with the Shipyard Transaction, and certain previously closed facilities, were discontinued operations in 2021. The assets, liabilities and operating results attributable to the Retained Shipyard Contracts and remaining assets and liabilities of our Shipyard Division operations that were excluded from the Shipyard Transaction, and are not associated with the previously closed facilities, represent our Shipyard Division and are classified as continuing operations on our Balance Sheet and Statement of Operations. The Active Retained Shipyard Contracts are being completed at our Houma JenningsFacilities and Lake Charles, Louisiana.we intend to wind down our Shipyard Division operations (which excludes the projects that are subject to our MPSV Litigation) by the second quarter 2023 (previously the first quarter 2023, but delayed and subject to the potential schedule impacts discussed in Note 2). Unless otherwise noted, the discussion and amounts presented below relate to our continuing operations. See Note 3 for further discussion of the Shipyard Transaction and our Financial Statements in Item 8discontinued operations and Note 9 for further discussion of our anticipated closure of the Jennings Yard.MPSV Litigation.
Services Division - Our Services Division provides services on offshore platforms, including welding, interconnect piping and other services required to connect production equipment and service modules and equipment on a platform; provides on-site construction and maintenance services on inland platforms and structures and industrial facilities; performs municipal and drainage projects, including pump stations, levee reinforcement, bulkheads and other public works; and fabricates skid units, modules and piping systems. These activities are performed at customer facilities or at our facility in Houma, Louisiana.
Corporate Division - and Allocations–Our Corporate Division includes costs that do not directly relate to our three operating divisions. Such costs include, but are not limited to, costs of maintaining our corporate office, executive management salaries and incentives, board of directors'directors’ fees, litigation relatedcertain insurance costs and costs associated with overall corporate governance and beingreporting requirements for a publicly traded company. Costs incurred by our Corporate Division on behalf of ourShared resources and costs that benefit more than one operating division are allocated amongst the operating divisions are allocated tobased on each operating division’s estimated share of the operating divisions.benefit received. Such costs include, but are not limited to, human resources, insurance, sales and marketing, information technology, accounting, business development and accounting.certain division leadership.
2
Facilities and Equipment
HoumaFacilities – Our fabrication and primary administrative and operating facilities are located in Houma, Jennings and Lake Charles, Louisiana. In the first quarter 2020, we announced our intent to close the Jennings Yard upon completion of our harbor tug projects, which is forecast to occur during the third quarter 2020. See Note 3 of our Financial Statements in Item 8 for further discussion of our anticipated closure of the Jennings Yard.
Although our divisional operations are managed separately and represent separate reportable segments, we may move labor, resources and projects among our divisions and facilities to ensure we have the proper labor, resources and facilities dedicated to our projects and to maximize our utilization. The following summarizes the facilities and equipment that are significant to our business.
Houma Facilities - Our Fabrication, Shipyard and Services Divisions operate from our owned facilities in Houma, Louisiana (“Houma Yards”Facilities”). The Houma Yards include:
163 on approximately 226 acres located on the east bank of the Houma Navigation Canal and on a slip adjacent to the Houma Navigation Canal, approximately 30 miles from the GOM. This yardGulf of Mexico (“GOM”). The facility includes 54,000approximately 85,000 square feet of administrative and operations facilities, 267,000320,000 square feet of covered fabrication facilities, 52,300140,000 square feet of warehouse facilities, and 8,00020,000 square feet of trainingblasting and medicalcoating facilities. This yardIt also has 4,6505,970 linear feet of water frontage, including 1,880 feet of steel bulkheads that permit docking of vessels and the load out of heavy structures. This yard is primarily used by our Fabrication Division.
437 acres located on the west bank of the Houma Navigation Canal, of which 283 acres is unimproved land that is available for expansion. This yard includes 8,000 square feet of administrative and operations facilities, 164,600 square feet of covered fabrication facilities and 21,000 square feet of warehouse facilities. This yard has 6,750 linear feet of water frontage, including 2,3502,535 feet of steel bulkheads. This yard is primarily used by our Shipyard Division.
63 acres located on a channel adjacent to the Houma Navigation Canal approximately a quarter of a mile from our yard on the east bank of the Houma Navigation Canal. This yard has 14,500 square feet of administrative and operations facilities, 40,800 square feet of covered fabrication facilities, 29,600 square feet of warehouse facilities and a 10,000 square foot blasting and coating facility. This yard has 1,320 linear feet of water frontage, including 660 feet of steel bulkheads. This yard is primarily used by our Services Division.
Significant facilitiesBuildings and equipment in thethat are significant to our Houma YardsFacilities include:
large assembly building with two 125’ by 350’ baysbuildings equipped with ten 20-ton overhead cranes for large modular section fabrication;
assembly shop equipped with four 20-ton gantry cranesfabrication and various equipment for pipe fitting and welding;
twoprefabrication shops equipped with overhead cranes, cutting tables, coping machines, sub-arc welding stations, hydraulic iron workers, and various other equipment for fabricating steel structures and components;
a blastalloy and coating shop that enables under roof blast and paint services;
acarbon steel pipe fabrication shopand spooling shops equipped with three 2.5-ton gantryoverhead cranes, two CNC multi-axis pipe benders, one CNC Plasma multi-axis pipe cutter,cutters, pipe spooling and welding stations, and various equipment for pipe fitting and welding;
two pipe spoolingblasting and coating shops equipped with oxy fuelthat enable under roof blast and plasma cutting capabilities, pipe spooling and welding stations, and various equipmentpaint services;
a prefabrication shop equipped with three 10-ton gantry cranes, a 750-ton press brake for forming plate, multiple hydraulic iron workers, and various equipment for pipe fitting and welding;
an automated panel line shop equipped with a CNC plasma cutting table, a one-sided plate welder with magnetic holding system, two 20-ton gantry cranes, one 15-ton gantry crane and various equipment for pipe fitting and welding;
a shop equipped with a hydraulic plate shear, a hydraulic press brake, a computerized numeric controlled plasma-arc cutting system, and various other equipment needed to fabricate steel structures and components;
a shop equipped with computerized Vernon brace coping machines;
21 crawler cranes which each range in tonnage capacity from 60 to 500 tons;
18and rubber-tired hydraulic modular transporters with a 200-ton individual weight capacitytransporters;
a 400’ by 160’ floating drydock with a 15,000-ton lift capacity used for repairtruckable tug and conversion of vessels; and
three spud barges with cranage for use in inshoremarine construction activities, which are each equipped with a crane that has a lifting capacity of 60 to 100-tons.
Jennings Facility - Our Shipyard Division also operates from our leased facility near Jennings, Louisiana (“Jennings Yard”).
The Jennings Yard includes 180 acres located five miles east of Jennings onWe have a Mortgage Agreement associated with the west bankreal estate of the Mermentau RiverHouma Facilities that secures our obligations with one of our Sureties related to outstanding bonds with such Surety. See “Liquidity and Capital Resources” in Item 7 and Note 6 for further discussion of our Mortgage Agreement.
Other Facilities – Our other administrative and operating facilities include:
a pipe fabrication shop equipped with one 5-ton gantry crane, one CNC plasma multi-axis pipe cutter, pipe spooling and welding stations, and various equipment for pipe fitting and welding;
a multi-bay fabrication shop equipped with a 500-ton press brake for forming plate, one hydraulic iron worker, one CNC plasma cutting table, two 10-ton gantry cranes, three 5-ton gantry cranes, four 20-ton gantry cranes and various equipment for pipe fitting and welding; and
two 235-ton crawler cranes, one 230-ton crawler crane and one 200-ton module mover.
Lake Charles Facility - Our Shipyard Division also operates from our subleased facility near Lake Charles,Broussard, Louisiana (“Lake Charles Yard”Broussard Facility”). The Lake Charles Yard includes 10 paved acres near Lake Charles located 17 miles from the GOM on the Calcasieu River and one mile from the main ship channel and the Intracoastal Waterway. This yard includes 1,100 linear consisting of approximately 10,000 square feet of bulkhead water frontage with a water depth of 40 feet.buildings on approximately 2.5 acres.
one 200’ by 96’ floating drydock with a 4,200-ton lift capacity, one 300’ by 74’ floating drydock with a 3,000-ton lift capacityWoodlands, Texas and one 150’ by 74’ floating drydock with a 1,500-ton lift capacity; and
two 200-ton crawler cranes and various equipment for pipe fitting, welding and repair work.
Materials and Supplies
The principal materials and supplies used in our operations across all our divisions include standard steel shapes, steel plate, steel pipe, welding gases, welding wire, fuel, oil and paint, all of which are currently available from many sources. We do not depend upon any single supplier or source for our materials and supplies. We anticipate being able to obtain these materials for the foreseeable future; however, the pricing, availability and schedules offered by our suppliers may vary significantly from year to year due to various factors, including supply chain disruptions, labor shortages, wage pressures, rising inflation and potential economic slowdown or recession, public health crises (such as COVID-19), geopolitical conflicts (such as the conflict in Ukraine), foreign currency exchange rate fluctuations, supplier consolidations, supplier raw material shortages, costs and surcharges, supplier capacity, customer demand, market conditions, and any duties and tariffs imposed on the materials or other import restrictions. In 2022, we experienced increased costs of materials and supplies due to inflation and continued supply chain delays and shortages, due in part to COVID-19 and Russia’s invasion of Ukraine in February 2022 (and the related European energy crisis). While pricing and availability of materials and supplies did not significantly impact our results in 2022, these issues may continue in 2023 and may become material. See “Risk Factors” in Item 1A for further discussion of our use of raw materials and supplies and the impact of global macroeconomic conditions, COVID-19 and Russia’s invasion of Ukraine on our operations.
3
The majority of the steel plate used in our operations arrives at our yards as steel plate,facilities in bulk, which iswe then cut and rolled into the form needed or roll into tubular sections atin our rolling mill. Tubular sections (which vary in diameter up to 23 feet) can be welded together in long straight tubes to become legs or into shorter tubes to become part of thea network of bracing. Various cuts and welds in the fabrication process are performed by computer-controlled equipment. We procure steel from both domestic and foreign mills. Delivery from domestic steel mills can take weeks or months for as-rolled steel and longer for heat treated steel. Delivery from foreign steel mills, including transit time, can take several months. Additionally, the U.S. sometimes imposes tariffs on certain imported steel which can result in higher cost for foreign steel. To mitigate the risk of increasing cost of materials during the life of a contract, we often negotiate escalation clauses in our customer contracts for steel pricing adjustments tied to changes in relevant indexes.indices.
In addition to the materials and supplies described above used in our fabrication process, we also use third-party manufacturers for engineered and manufactured equipment added to the structures modules and vesselsmodules that we fabricate. Such manufactured equipment includes, but is not limited to valves, fittings, propulsion systems (such as engines), cranes, pumps, electrical and communications systems and other technologically advanced equipment. To mitigate our risk of increasing costs, we often negotiate and purchase such equipment from the manufacturer at a fixed price. Additionally, we may use subcontractors when their use enables us to meet customer requirements for resources, schedule, cost or technical expertise. Subcontractors may range from small local entities to companies with global capabilities, some of which may be utilized on a repetitive or preferred basis.
Human Capital Management
Our employees are our most important assets and serve as the foundation for our ability to achieve our financial and strategic objectives.
Employee Statistics – Our workforce varies based on our level of activity at any particular time. At December 31, 2022, we had 874 full-time employees, compared to 960 full-time employees at December 31, 2021, and one part-time employee compared to none at December 31, 2021. In addition, due to limitations in the availability of skilled craft labor and increased demand for our services in 2022, we increased our use of independent contract labor and will continue to do so, as necessary, to supplement our workforce. None of our employees are employed pursuant to a collective bargaining agreement and we believe our relationship with our employees is favorable. Labor hours worked during 2022 and 2021 were 1.7 million and 1.0 million, respectively. The increase in labor hours was primarily due to the DSS Acquisition on December 1, 2021. See "We depend on third parties to provide services to perform our contractual obligations and supply raw materials" “Risk Factors”in Item 1A for further discussion of our use of raw materialscontract labor.
Recruitment, Training and supplies.Workforce Development –Our success depends on our ability to attract, develop, motivate and retain a highly-skilled workforce that includes craft labor as well as supervision and project management. To support the development of our workforce, we offer supervision and other training programs to educate and elevate the skillsets of our front-line leaders. We also provide internal hands-on technical fitting and welding training programs and instruction to further develop our craft labor and maintain high standards of quality. We have also created a succession plan for all senior leadership positions. During 2022, we were awarded a Texas Workforce Commission Skills Development grant. These funds enhance our ability to deliver on-demand technical training to help develop the next generation of skilled craft professionals in pipe fitting, welding, scaffold building, painting/blasting, equipment operation, and rigging in our rapidly growing industry. The grant enabled us to train 284 employees in 2022. During 2022 and 2021, we were also awarded an Incumbent Worker Training Program grant through the Louisiana Workforce Commission. This program provides supplemental funding for, among other things, skills, safety and environmental training through third-party providers for craft personnel and leadership. The grant enabled us to train approximately 91 and 285 employees in 2022 and 2021, respectively.
SafetyEmployee Benefits – Our compensation programs are designed to attract, motivate and retain our employees. We provide competitive base wages and salaries that are consistent with employee positions, skills and experience levels, and geographic locations. Employees are eligible to receive paid and unpaid leave and participate in our health insurance and life, disability and accident insurance programs. We also offer retirement benefits through our 401(k) plan, which includes discretionary Company-matching contributions. During 2022 and 2021, we conducted annual employee benefits surveys to gain a deeper understanding of how our various benefit programs are valued by our employees. The employee feedback indicated a desire for additional medical plan options, a preference for smartphone and email communication, and a health advocate that can provide plan education. As a result, we included a new high-deductible health plan option and health savings account option in our benefit program offerings for 2022, along with an identity theft benefit offering, and we continued building on the mobile app launched in 2021.
Employee Engagement – During 2022 and 2021, we incorporated feedback from our employees into our training programs and employee benefit program offerings. The feedback was gathered from our employee satisfaction survey performed during 2021 and our annual employee benefits survey conducted in 2022 and 2021, which provided employee perspectives on working for the Company and suggestions for improvements.
4
Diversity and Inclusion – Our commitment to diversity extends across all divisions and disciplines of our business. We leverage multiple platforms to expand our reach for diverse talent and also use recruiting sites focused on veterans and individuals with disabilities. At December 31, 2022, approximately 51% of our workforce were women or minorities. During 2022, we conducted our annual leadership workshop for approximately 150 front-line leaders that consisted of a two-day interactive training on leading the “younger generations” and prevention of sexual harassment. During 2021, we also launched a supervisor program that provided additional education to our leaders on respect in the workplace and included an emphasis on the prevention of sexual harassment.
See “Risk Factors” in Item 1A for further discussion of our ability to attract and retain qualified employees.
Safety
We are committed to the safety and health of our employees and subcontractors. Wecontractors and believe that a strong safety culture is a critical element of our success. We continue to improve and maintain a stringentcomprehensive safety assurance programmanagement system designed to ensure the safety of our employees and subcontractorscontractors and allow us to remain in compliance with all applicable federal and state mandated safety regulations. We are committed to maintaining a well-trained workforce and providing timely instruction to ensure our employees have the knowledge and skills to perform their work safely while maintaining the highest standards of quality. We provide continuous safety education and training to employees and subcontractorscontractors on a variety of topics to ensure they are ready for the challenges inherent in all our projects. Our employees commence training on their first day of employment with a comprehensive orientation class that addresses Company policies and procedures and provides clear expectations for working safely. During 2022, our health, safety and environmental training system was audited and accredited by a third-party compliance organization.
During 2022 and 2021, we completed supervisor safety workshops that were delivered to leadership, including our front-line supervisors. The focus of these workshops is to drive a strong safety culture, incorporate human performance and risk tolerance principles, and emphasize the supervisor’s role in safety coaching and mentoring. During 2022 and 2021, we successfully trained approximately 98% and 90%, respectively, of our front-line supervision. We also successfully trained and implemented the “execution diamond”, a new tool to drive our employees and contractors to plan, stop and think before engaging in an activity, perform appropriate risk assessments, and emphasize their “stop work” authority. Our total recordable incident rate improved from a 0.61 in 2021 to 0.38 in 2022.
We have a zero-tolerance policy for drugs and alcohol use in the workplace. We support this policy through the application of a comprehensive drug and alcohol screening program that includes initial screenings for all employees during our hiring process and periodic random screenings throughout employment. Additionally, we require our subcontractorscontractors to follow alcohol and drug screening policies substantially the same as ours.
Our employees are given opportunities to be a part of a dedicated safety committee which is comprised of peer-elected craft employees and members of management to assist in supporting our efforts to continuously improve safety performance. A safety component is also included in our annual incentive program guidelines for our executive officers and other key employees. See "Our employees and subcontractors work on projects that are inherently dangerous. If we fail to maintain safe work sites, we can be exposed to significant financial losses and reputational harm" “Risk Factors” in Item 1A for further discussion of our safety.
We continue to take actions to mitigate the impacts of COVID-19 on our operations and maintain a safe work environment for our workforce, including maintaining protocols for handling employees who have tested positive for COVID-19 or have come in contact with individuals that have tested positive for COVID-19. In addition, we have protocols for employees to return to work that test positive for COVID-19, including requiring a negative COVID-19 antigen test prior to returning to work. See “Risk Factors” in Item 1A for further discussion of the potential impact of public health crises on our operations.
Environmental
Our commitment to protecting the environment continues to be a strong principal that governs our work. We continuously look for ways to reduce our environmental impact, including a focus on protecting the land, water, and wildlife habitats in our surrounding communities, with an emphasis on spill prevention, water and waste management, air emissions and other natural resource conservation. We are further focused on energy efficiency and reducing our carbon footprint within our daily operations. During 2022, we continued our efforts in managing and monitoring our air emissions, water discharges, energy consumptions and greenhouse gases. This monitoring will allow us to establish baseline emission matrices based on the various types of fabrication projects we perform. We also conducted hazardous waste minimization and pollution prevention training for our employees. During 2021, we implemented a program to replace our facility lighting with LED bulbs, which reduced our energy consumption and improved our workplace conditions by providing better and more efficient lighting for our employees.
5
We are also focused on managing and monitoring our air emissions related to all facets of our painting and blasting operations to ensure compliance with our Louisiana Department of Environmental Quality operating air permits. We monitor and report criteria pollutants and toxic air pollutants, which includes daily tracking of our paint, thinner and cleaning solvents usage. We have also implemented abrasive blasting management best practices to reduce particulate matter emissions and reduce offsite impacts to surrounding communities from our abrasive blasting activities. This includes routine inspections, record keeping and personnel training.
During 2021, we certified our environmental management system to ISO 14001:2015, which represents internationally recognized standards for environmental management overseen by the International Standard Organization (“ISO”) based in Geneva, Switzerland. Achieving this certification helps our management and employees ensure we are measuring and improving our environmental impact by improving the efficiency of our resources, consistently addressing environmental obligations and reducing waste and environmental risks. The certification helps us maintain our commitment to protecting the environment as a leader in the fabrication industry. The certification is based on a review of our programs and procedures and is subject to annual review and full recertification every three years. The last audit of our certification occurred in March 2022.
Quality Assurance
We use modern welding and fabrication technology, and all of our fabrication projects are executed in accordance with industry standards, specifications and regulations, including those published by the American Petroleum Institute, the American Welding Society, the American Society of Mechanical Engineers, the American Bureau of Shipping, the U.S. Coast Guard the U.S. Navy and customer specifications. We maintain training programs for technical fitting and welding instruction in order to prepare and upgrade our skilled labor workforce, and to maintain high standards of quality. In addition, we maintain on-site facilities for the non-destructive testing of all welds, a process performed by an independent contractor.third-parties.
OurDuring 2021, our quality management systems are certifiedwere recertified as ISO 9001-2015, programs. ISO 9001-2015 is anwhich represents internationally recognized verification systemstandards for quality management overseen by the International Standard Organization based in Geneva, Switzerland. Themanagement. Similar to our environmental certification, this certification is based on a review of our programs and procedures designed to maintain and enhance quality production and is subject to annual review and full recertification every three years. The last audit of our certification occurred in March 2022. Our quality management systems are also certified by the American Society of Mechanical Engineers and American Institute of Steel Construction. The certifications are valid through March 2025.
Customers
Our principal customers include U.S. and, to a lesser extent, international energy producers; refining, petrochemical, LNG, industrial and power operators; and marine operators; EPC companies; and certain agencies of the U.S. government.companies. A large portion of our revenue in any given year may be generated by only a few customers, although not necessarily the same customers from year to year. For 2019, four2022, two customers accounted for 48% of our consolidated revenue, which related to offshore services for our Services Division and small-scale fabrication for our Fabrication Division. For 2021, two customers accounted for 54% of our consolidated revenue, which related to the construction of three research vesselsoffshore services for our Services Division and three towing, salvage and rescue shipssmall-scale fabrication for two customers within our Shipyard Division, the expansion of a paddle wheel riverboat for a customer within our Fabrication Division, and offshore hook-up and installation servicesour seventy-vehicle ferry project for a customer within our Services Division. For 2018, three customers accounted for 44% of our consolidated revenue, which related to the construction of ten harbor tug vessels for two customers within our Shipyard Division and offshore hook-up and installation services for a customer within our Services Division. For 2017, two customers accounted for 39% of our consolidated revenue, which related to the fabrication of petrochemical modules for a customer within our Fabrication Division and offshore hook-up and installation work for a customer within our Services Division.
See "We depend on significant customers for our revenue" in Item 1A and "Overview" and "New Awards and Backlog" in Item 7 for further discussion of our backlog by significant customer.Contracting
Contracting
Our revenue is derived from customer contracts and agreements that are awarded on a competitively bid and negotiated basis using a range of contracting options, including fixed-price, unit-rate, time and materials (“T&M.&M”) and cost-reimbursable, or a combination thereof. Our contracts primarily relate to the fabrication of steel structures modules and marine vessels,modules, and certain service arrangements. Such contracts vary in lengthduration depending on the size and complexity of the project.
Revenue for our fixed-price and unit-ratelong-term contracts is recognized using the percentage-of-completion method, based on contract costs incurred to date compared to total estimated contract costs. Contract costs include direct costs, such as materials and labor, and indirect costs attributable to contract activity. Material costs that are significant to a contract and do not reflect an accurate measure of project completion are excluded from the determination of our contract progress. Revenue for such materials is only recognized to the extent of costs incurred.
Revenue for our T&Mshort-term contracts and contracts that do not satisfy the criteria for revenue recognition over time is recognized at contracted rates when the work is performed or when control of the asset is transferred, the related costs are incurred and collection is reasonably assured. Our T&M contracts provide for labor and materials to be billed at rates specified within the contract. The consideration from the customer directly corresponds to the value of our performance completed at the time of invoicing. See "The nature of our contracting terms for our contracts could adversely affect our operating results" and "Our method of accounting for revenue using the percentage-of-completion method could have a negative impact on our results of operations" “Risk Factors” in Item 1A, "“Critical Accounting Policies"Policies” in Item 7, and Note 1 and Note 2 of our Financial Statements in Item 8 for further discussion of our contracting and revenue recognition.
6
New Project Awards and Backlog
New project awards represent expected revenue values of commitments received during a given period, including scope growth on existing commitments. A commitment represents authorization from our customer to begin work or purchase materials pursuant to a written agreement, letter of intent or other form of authorization. Backlog represents the unrecognized revenue for our new project awards and may differ fromat December 31, 2022, was consistent with the value of futureremaining performance obligations for our contracts required to be disclosed under Topic 606 and presented in Note 2 of our Financial Statements in Item 8.2. In general, a performance obligation is a contractual obligation to construct and/or transfer a distinct good or service to a customer. The transaction price of a contract is allocated to each distinct performance obligation and recognized as revenue when, or as, the performance obligation is satisfied. Backlog includes our performance obligations at December 31, 2019, plus signed contracts that are temporarily suspended or under protest that may not meet the criteria to be reported as future performance obligations under Topic 606 but represent future work that we believe will be performed. We believe that backlog, a non-GAAP financial measure, provides useful information to investors.investors as it represents work that we are obligated to perform under our current contracts. New project awards and backlog may vary significantly each reporting period based on the timing of our major new contract commitments.
Projects in our backlog are generally subject to delay, suspension, termination, or an increase or reduction in scope at the option of the customer, althoughcustomer; however, the customer is required to pay us for work performed and materials purchased through the date of termination, suspension, or reductiondecrease in scope. Depending on the size of the project, the delay, suspension, termination or increase or reductiondecrease in scope of any one contract could significantly impact our backlog and change the expected amount and timing of revenue recognized. See Note 2Certain of our Financial Statementscontracts in Item 8backlog were, and bidding activities for several new project opportunities have been delayed, as a reconciliationresult of COVID-19. In February 2023, we received direction from our future performance obligations under Topic 606 (the most comparable GAAP measure)customer to suspend all activities on our reported backlog.
At December 31, 2019 and 2018,offshore jackets project for our backlog was $437.3 million and $356.5 million, respectively. Backlog for both periods includes $21.9 million of remaining backlog subject to purported notices of termination from a customer related to the construction of two MPSVs. We dispute the purported terminations and disagree with the customer’s reasons for the same. We can provide no assurances that we will reach a favorable resolution with the customer for completionFabrication Division. No duration of the MPSVs. Approximately 52%suspension or timing of our December 31, 2019 backlog is anticipated to be recognized as revenue beyond 2020.potential recommencement of the project was provided. See "New
Seasonality
Our operations may be subject to seasonal variations due to weather conditions, including any seasonal weather conditions that may increasingly arise due to the effects of climate change, and available daylight hours. Although we have large, covered fabrication facilities, a significant amount of our construction activities continue to take place outdoors, and accordingly, the number of labor hours worked may decline during the winter months due to unfavorable weather conditions and a decrease in daylight hours. In addition, the seasonality of oil and gas industry activity in the Gulf Coast region may also affectaffects our operations. Our offshore oil and gas customers often schedule the completion of their projects during the summer months in order to take advantage of more favorable weather during such months. Further, rainy weather, tropical storms, hurricanes and other storms prevalent in the GOM and along the Gulf Coast may also affect our operations. See "We are susceptible to adverse weather conditions in our market areas" “Risk Factors” in Item 1A for further discussion of the seasonal impacts to our operations.
Competition
We operate within highly competitive markets which are significantly impacted by oil and gas prices and government spending.prices. Declines in oil and gas prices and limits on government spending can create excess capacity and underutilizationunder-utilization of our competitor'scompetitor’s facilities, resulting in more intense competition in the bidding process for new project awards. Previous decreases in oil and gas prices have led many companies, including us, to reduce their skilled workforce. These reductions, with a subsequent increase in oil and gas prices, has created a competitive labor market, resulting in higher costs of labor, including increases in wage rates and the costs of recruiting and training to attract and retain qualified personnel. In addition, we expect to face increased competition as we seek fabrication opportunities related to rapidly growing energy transition initiatives, including in support of our customers who are making energy transitions away from fossil fuels, opportunities related to offshore wind developments and future onshore infrastructure projects where modular designed steel structures are core to the execution strategy. Further, there are numerous regional, national and global competitors that offer similar services to those offered by each of our operating divisions. These competitors may be larger than us with more resources and facilities in both the U.S. and abroad. Competition with foreign competitors can also be challenging as such competitors often have lower operating costs and lower wage rates, and foreign governments often use subsidies and incentives to create local jobs and impose import duties and fees on products and tax foreign operators.products. In addition, as a result of recent technological innovations decreasedhave lowered transportation costs incurred by our customersand increased the competitiveness of foreign competitors when exporting structures from foreign locations to the GOM orand Gulf Coast, which may hinder our ability to successfully bid against foreign competitorssecure new awards for large projects.projects destined for the GOM and Gulf Coast. Uncertainties with respect to tariffs on materials and fluctuations in the value of the U.S. dollar and other factors, may also impact our ability to compete effectively.
Although we believe price and the contractor’s ability to meet a customer’s delivery schedule and project requirements are principal factors in determining which contractor is awarded a project, customers also consider, among other things, a contractor’s past project experience, the availability of technically capable personnel, facility capacity and location, production efficiency, condition of equipment, reputation, safety record, customer relations and customer relations.financial strength. We believe that our strategic location, competitive pricing, expertise in fabricating and servicing onshore and offshore structures and vessels,facilities, and the certification of our facilities as ISO 9001-2015 will enable us to continue to compete effectively for projects. See "We operate in an industry that is highly competitive" “Risk Factors” in Item 1A for further discussion of our competitive landscape.
7
Government and Environmental Regulation
Our operations and properties are subject to a wide variety of increasingly complex and stringent foreign, federal, state and local environmental laws and other regulations, including those governing discharges into the air and water, the handling and disposal of solid and hazardous wastes, and the remediation of soil and groundwater contaminated by hazardous substances. Compliance with many of these laws is becoming increasingly complex, stringent and expensive. These laws may impose “strict liability” for damages to natural resources and threats to public health and safety, rendering a party liable for the environmental damage without regard to negligence or fault on the part of such party.
Our operations are also governed by laws and regulations relating to the health and safety of our employees, primarily the Occupational Safety and Health Act and regulations promulgated thereunder. Various governmental and quasi-governmental agencies require certain permits, licenses and certificates with respect to our operations. We believe that we have all material permits, licenses and certificates necessary for the conduct of our existing business.
Our employees may engage in certain activities, including interconnect piping and other service activities conducted on offshore platforms, activities performed on the spud barges owned or chartered by us, and marine vessel fabrication and repair activities performed at our facilities and barges owned by us, that are covered in either the provisions of the Jones Act or U.S. Longshoreman and Harbor Workers Act (“USL&H”). These laws make the liability limits established under state workers’ compensation laws inapplicable to these employees and permit them or their representatives to pursue actions against us for damages or job-related injuries, with generally no limitations on our potential liability.
Many aspects of our operations and properties are materially affected by federal, state and local regulations, as well as certain international conventions and private industry organizations. The exploration and development of oil and gas properties located on the outer continental shelf of the U.S. is regulated primarily by the Bureau of Ocean Energy Management and Enforcement of the Department of Interior, which is responsible for the administration of federal regulations under the Outer Continental Shelf Lands Act requiring the construction of offshore platforms located on the outer continental shelf to meet stringent engineering and construction specifications. Violations of these regulations and related laws can result in substantial civil and criminal penalties as well as injunctions curtailing operations. We believe that our operations are in compliance with these and all other regulations affecting the fabrication of platforms for delivery to the outer continental shelf of the U.S. In addition, demand for our services from the oil and gas and marine industriesindustry can be affected by changes in taxes, price controls and other laws and regulations affecting these industries.this industry. It is also possible that the current administration and Congress will impose additional environmental regulations that will restrict federal oil and gas leasing, permitting or drilling practices on public lands and waters. Offshore construction and drilling in certain areas has also been opposed by environmental groups and, in certain areas, has been restricted. To the extent laws are enacted or other governmental actions are taken that prohibit or restrict offshore construction and drilling or impose environmental protection requirements that result in increased costs to the oil and gas industry in general and the offshore construction industry in particular, our business and prospects could be adversely affected. We cannot determine to what extent future operations and earnings may be affected by new legislation, new regulations or changes in existing regulations.
TheIn addition, we could be affected by future laws or regulations, including those imposed in response to concerns over climate change, other aspects of the environment, or natural resources. Due to concerns that carbon dioxide, methane and certain other greenhouse gases may produce climate changes that have significant impacts on public health and the environment, various governmental authorities have considered and are continuing to consider the adoption of regulatory strategies and controls designed to reduce the emission of greenhouse gases resulting from regulated activities, which if adopted in areas where we conduct business, could require us or our customers to incur additional compliance costs, may result in delays in the pursuit of regulated activities, prevent customers’ projects from going forward and could adversely affect demand for the oil and natural gas that some of our customers produce, thereby potentially limiting demand for our services. For example, the recently adopted Inflation Reduction Act of 2022 imposes a federal fee on the emission of greenhouse gases.
We are also subject to the Comprehensive Environmental Response, Compensation, and Liability Act of 1980, as amended and similar laws which provide for responses to and liability for releases of hazardous substances into the environment. Additionally, the Clean Air Act, the Clean Water Act, the Resource Conservation and Recovery Act, the Safe Drinking Water Act, the Emergency Planning and Community Right to Know Act, each as amended, and similar foreign, state or local counterparts to these federal laws, regulate air emissions, water discharges, hazardous substances and wastes, and require public disclosure related to the use of various hazardous substances. Compliance with such environmental laws and regulations may require the acquisition of permits or other authorizations for certain activities and compliance with various standards or procedural requirements. We believe that our facilities are in substantial compliance with current regulatory standards.
8
In addition, our operations are subject to extensive government regulation by the U.S. Coast Guard, as well as various private industry organizations such as the American Petroleum Institute, American Society of Mechanical Engineers, American Welding Society and the American Bureau of Shipping.
Our compliance with these laws and regulations has entailed certain additional expenses and changes in operating procedures; however, we believe that compliance efforts have not resulted in a material adverse effect on our business or financial condition. However, future events, such as changes in existing laws and regulations or their interpretation, more vigorous enforcement policies of regulatory agencies, or stricter or different interpretations of existing laws and regulations, may require additional expenditures by us. See "The nature of our industry subjects us to compliance with regulatory and environmental laws" and "Our business is highly dependent on our ability to utilize the navigation canals adjacent to our facilities" “Risk Factors” in Item 1A for further discussion of government and environmental regulations impacting our business.
Insurance
We maintain insurance coverage for property damage caused by fire, flood, explosionvarious aspects of our business and similar catastrophic events thatoperations. However, we may result in physical damage or destructionbe exposed to our facilities. All policies are subjectfuture losses due to deductiblescoverage limitations and other coverage limitations. We also maintain builder’s risk, general liability and maritime employer’s liability insurance, which are also subject to deductibles and coverage limitations. We are further self-insured for workers’ compensation and USL&H claims through our use of deductibles and self-insured retentions upfor our exposures related to per occurrence threshold amounts. See "The limits on our insurance coverage could expose us to potentially significantlyproperty and equipment damage, builder’s risk, third-party liability, and costs" worker’ compensation and USL&H. See “Risk Factors” in Item 1A for further discussion of our insurance.
Employees
Our workforce varies based on the level of ongoing fabrication and services activity at any particular time. At December 31, 2019 and 2018, we had approximately 944 and 875 employees, respectively, all of which were full-time employees. Nonelimitations of our employees are employed pursuant to a collective bargaining agreement and we believe our relationship with our employees is good. Labor hours worked during 2019, 2018 and 2017, were 2.4 million, 1.9 million, and 1.9 million, respectively. See "We may be unable to employ a sufficient number of skilled personnel to execute our projects" and "Our success is dependent on key personnel" in Item 1A for further discussion of our ability to attract and retain qualified employees.insurance coverage.
We make available our annual reports on Form 10-K, quarterly reports on Form 10-Q, current reports on Form 8-K and amendments to those reports, free of charge through our Internet website at www.gulfisland.com as soon as reasonably practicable after such materials are electronically filed with or furnished to the U.S. Securities and Exchange Commission (the “SEC”). The SEC also maintains an Internet website at www.sec.gov that contains periodic reports, proxy and information statements, and other information regarding issuers that file electronically with the SEC. Our website and the information contained therein or connected thereto are not intended to be incorporated into this Report.
The following discussion of risk factors contains forward-looking statements (see "Cautionary“Cautionary Statement on Forward-Looking Information"Information”). These risk factors are important to understanding other statements in this Report. The following information should be read in conjunction with Item 7 “Management’s Discussion and Analysis of Financial Condition and Results of Operations” and Item 8 “Financial Statements and Supplementary Data” found elsewhere in this Report.Report, which may include additional factors that could adversely affect our business. References to “Notes” relate to the Notes to our Consolidated Financial Statements (“Financial Statements”) in Item 8.
Our business, prospects, financial condition, operating results, cash flows, liquidity and stock price may be affected materially and adversely, in whole or in part, by a number of factors, whether currently known or unknown, including but not limited to those described below, any one or more of which could, directly or indirectly, cause our actual financial condition, operating results, liquidity and cash flows to vary materially from historical results or those anticipated, projected or assumed in our forward-looking statements. OurFurther, new risks emerge from time to time. In addition, our business, prospects, financial condition, operating results, cash flows, liquidity and stock price could also be affected by additional factors that apply to all companies generally which are not specifically mentioned below.
Business and Industry Risks
Our revenue and profitability maycontinues to be impacted bydependent on the cyclical nature of theoffshore oil and gas industry, and other energy-related industries.which is a historically cyclical industry.
Our business iscontinues to be significantly dependent on the level of capital expenditures by (i) oil and gas producers, processors and their contractors, (ii)as well as alternative energy companies and (iii) marine companies, operating in the GOM and along the Gulf Coast. The level of activitycapital expenditures by these companies can be volatile and is significantly impacted by fluctuations in oil and gas and associated commodity prices. Oil and gas prices continue to be depressed and have not increased to a level that supports a recovery in offshore exploration and production spending. In addition torecent years, the price of oil and gas has experienced significant volatility, which resulted in reductions in capital spending and drilling activities from our traditional offshore oil and gas customer base. Consequently, our operating results and cash flows were negatively impacted from reductions in revenue, lower margins due to competitive pricing, and under-utilization of our operating facilities and resources. Although oil and gas prices have recovered from the historic lows seen in 2020, due in part to the conflict in Ukraine and related European energy crisis, there are no assurances that the increase in prices will be sustained or that our business will benefit from such increase in prices.
9
In addition to commodity prices, the levels of our customers’ capital expenditures are influenced by, among other things:
availability and cost of capital;
the ability of oil and gas companies to generate capital;
the sale and expiration dates of offshore leases in the U.S. and overseas;
the discovery rate, size and location of new oil and gas reserves;
demand for energy, including hydrocarbon production, which is affected by worldwide economic activity and uncertainty and population growth;
the ability of the Organization of the Petroleum Exporting Countries (“OPEC”) to set and maintain production levels for oil and the level of production by non-OPEC countries;
local, federal and international military, political and economic events and conditions, including economic uncertainty, socio-political unrest, andany government shutdown, instability or hostilities;
demand for, availability of and technological viability of, alternative sources of energy;
technological advances affecting energy exploration, production, transportation and consumption; and
weather conditions, natural disasters, and global or regional public health crises (such as COVID-19) and other catastrophic events; and
The above factors have not favored increased capital spending by offshore oil and gas companies in recent years. Further, although a reduction in gas prices has benefited capital spending for petrochemical and other facilities, the timing of, and our ability to secure, new project awards for this end market continues to be uncertain. As a result, there are fewer project awards in our traditional oil and gas markets to replace completed projects, and pricing of new contracts remains increasingly competitive. This creates challenges with respect to our ability to operate our fabrication facilities at desired utilization levels and may result in decreased revenue, lower margins, and losses during periods of lower capital spending. Should industry conditions not improve, we may continue to suffer such decreased revenue, lower margins, and losses in future quarters. In addition, we believe that the downturn in the oil and gas industry has also adversely impacted many of our customers' businesses.
We are unable to predict future oil and gas prices or the level of oil and gas industry activity for the products and services we provide. Further, an increasethe current relative stabilization in oil and gas prices and increase in bidding activity may not necessarily translate into immediate or long- termlong-term increased activity, and evenactivity. Even during periods of relatively high oil and gas prices, our customers may cancel or curtail programs, or reduce their levels of capital expendituresexpenditure programs for exploration and production.production and repair and maintenance of their offshore assets due to uncertainty regarding oil and gas prices and other priorities for cash flows, including investment in energy transition projects. Advances in onshore exploration and development technologies, particularly with respect to large, onshore shale production areas, or energy transition projects could result in our historical customers allocating a higher percentage of their capital expenditure budgets to onshore exploration and productionsuch activities and we may not be successful securing new project awards related to these onshore activities. AnSee risk factor below titled “Our efforts to strategically reposition the Company to diversify our service offerings and customer base may not result in increased shareholder value.” In addition, an increase in gas prices could also negatively impact future investments in petrochemical and other facilities that benefit from lower gas prices. These factors could cause our revenue and margins to remain depressed and limit our future growth opportunities. See “Overview” in Item 7 for further discussion of the impacts of oil and gas price volatility.
The impacts on our business of the volatility of oil and gas prices and other factors that have influenced our customers’ capital spending have included, or may continue to include, among other things, reduced bidding activity; suspension or termination of backlog; deterioration of customer financial condition; and unanticipated project costs and schedule delays due to supply chain disruptions, labor and material price increases, lower labor productivity, increased employee and contractor absenteeism and turnover, craft labor hiring challenges, increased safety incidents, lack of performance by subcontractors and suppliers, and contract disputes. For example, in February 2023, we received direction from our customer to suspend all activities on our offshore jackets project. No duration of the suspension or timing of potential recommencement of the project was provided. See Note 2 and “New Project Awards and Backlog” in Item 7 for further discussion of the project suspension.
We operate in an industryservice industries that isare highly competitive.competitive among service providers.
The onshore refining, petrochemical, LNG and industrial fabrication industries and the offshore oil and gas fabrication industry and the marine fabricationservices industry are highly competitive and influenced by events largely outside of our control. In addition, as we seek fabrication opportunities related to rapidly growing energy transition initiatives, including in support of our customers who are making energy transitions away from fossil fuels, opportunities related to offshore wind developments and potential future onshore support structures to provide electricity from renewable and green sources, we expect to face increased competition. Contracts for our fabrication and services projects are often awarded on a competitively bid basis, and our customers consider many factors when awarding a project. These factors include price, ability to meet the customer’s schedule, the availability and capacity of personnel, equipment and facilities, and the reputation, experience, and safety record of the contractor. Although we believe we have an excellent reputation for safety and quality, weWe can provide no assurances that we will be able to maintain our current competitive position.position or that we will be able to successfully compete with other companies as the green energy transition progresses. In addition, we often compete with companies that have greater resources, which may make them more competitive for certain projects.
10
Competition with foreign competitorsfabricators can also be challenging as such competitors often have lower operating costs and lower wage rates, and foreign governments often use subsidies and incentives to create local jobs and impose import duties and fees on products, and tax foreign operators.products. In addition, as a result of technological innovations decreasedhave lowered transportation costs, incurred by our customersincreasing the competitiveness of foreign competitors when exporting structures from foreign locations to the GOM and Gulf Coast, which may hinder our ability to successfully bidsecure new awards for projects destined for the GOM and Gulf Coast againstfrom foreign competitors.locations. See "Competition"“Competition” within Item 1 for further discussion of the competitive nature of our industry.
A small number of customers may represent a significant portion of our revenue.
Our primaryWe derive a significant amount of our revenue from a small number of customers in any given year. For our Services Division, our services for such customers are facinggenerally subject to master services agreements, and accordingly, such customers tend to be consistent each year; however, the amount of revenue may vary between years because the level of services that we may provide depends on, among other things, the amount of that customer’s capital expenditure budget, our labor availability and our ability to meet the customer’s schedule requirements. For our Fabrication Division, our services for such customers are generally project specific, and accordingly, may account for a significant challenges andportion of our revenue in one year, but represent a periodsmaller or even immaterial portion of consolidation within their industry.
The oil and gas industry is facingour revenue in subsequent years, or vice-versa. We define significant challenges due to a prolonged period of depressed oil and gas prices. This has also negatively impacted the marine industrycustomers as those that supports offshore exploration and production. Accordingly, many companies are unable to compete and, in some cases, are unable to pay their liabilities as they become due. This has resulted in many companies within the oil and gas and marine industries seeking bankruptcy protection or pursuing consolidation through mergers with, or acquisition by, other companies. We expect these trends to continue.
The consolidation of oneindividually comprise 10% or more of our primaryconsolidated revenue. For 2022, we had two customers the acquisition of one or morethat accounted for 48% of our primaryconsolidated revenue, and for 2021, we had two customers bythat accounted for 54% of our consolidated revenue. The loss of a companysignificant customer in any given year for any reason, including a sustained decline in that is not a customer,customer’s capital expenditure budget or a primary customer’s acquisition of another company that provides services similar to those provided by us,competitive factors, could result in a reductionsubstantial loss of revenue. See “Customers” in such customers’ capital spendingItem 1 for further discussion of our customers.
Competitive pricing common in the industries we serve could negatively impact our operating results.
The industries we serve are highly competitive, and as a decreaseresult, we have not always been successful in thefully recovering our project and overhead costs or realizing a profit, even when industry conditions are favorable. While we have recently experienced an increase in bidding activity for fabrication projects and demand for our products and services. In addition,services remains high, this trend may not continue. Additionally, as it relates to our fabrication business, during periods of increased market demand, new fabrication service capacity may enter the liquidation of one or moremarket, which could place pressure on the pricing of our primary customers could decrease the demandfabrication projects. Furthermore, during periods of declining pricing for our productsfabrication projects and services. We can provide no assurances thatservices, we willmay not be able to maintainreduce our level of revenue with a customer that has consolidated or replace lost revenue. We are unable to predict what effect consolidations in the industry may have on contract pricing, capital spending by our customers, our selling strategies, our competitive position,costs accordingly, which could impact our ability to retain customers or our ability to negotiate favorable agreements with our customers.compete.
Operational Risks
We dependOur business depends on the award of new contracts and the timing and execution of those awards.
It is difficult to predict whether or when we will be awarded a new contractcontracts due to complex bidding and selection processes, changes in existing or forecast market conditions, governmental regulations, permitting and environmental matters. BecauseIn the case of our revenue is derived fromFabrication Division, while we have seen an increase in bidding activities and we secured a large new project awards, ouraward for offshore jacket foundations in 2022, we can provide no assurances that the higher level of bidding activity will continue during 2023 and beyond or that we will be successful in securing any additional large project awards. Our results of operations and cash flows can fluctuate materially from period to period as contracts are typically awardedbased on a project-by-project basis.
The timing ofour success in securing new project awards
Our short-term profitability may reduce our short-term profitabilitybe affected from time to time as we balance our current capacity with expectations of future project awards and the timing of execution of new project awards. If an expected new project award is delayed or not received, or project execution is delayed subsequent to an award, we may incur costs to maintain an idle workforce and facilities, or alternatively, we may determine that our long-term interests are best served by reducing our workforce and incurring increased costs associated with termination benefits. For example, in February 2023, we received direction from our customer to suspend all activities on our offshore jackets project. No duration of the suspension or timing of potential recommencement of the project was provided. See Note 2 and “New Project Awards and Backlog” in Item 7 for further discussion of the project suspension. A reduction in our workforce could also impact our results of operations if customers are hesitant to award new contracts based upon our staffing levels or if we are unable to adequately increase our labor force and staff projects that are awarded subsequent tofollowing our workforce reductions.
We depend on significant customers for our revenue.
We derive a significant amount of our revenue from a small number of customers, including U.S. and, to a lesser extent, international energy producers; refining, petrochemical, LNG, industrial, power, and marine operators; EPC companies; and certain agencies of the U.S. government. Because the level of services that we may provide to any customer depends, among other things, on the amount of that customer’s capital expenditure budget and our ability to meet the customer’s delivery schedule, customers that account for a significant portion of our revenue in one year may represent an immaterial portion of revenue in subsequentreductions over recent years. We define significant customers as those that individually comprise 10% or more of our consolidated revenue. For 2019, four customers accounted for 54% of our consolidated revenue. For 2018, three customers accounted for 44% of our consolidated revenue. For 2017, two customers accounted for 39% of our consolidated revenue. The loss of a significant customer in any given year for any reason, including a sustained decline in that customer’s capital expenditure budget or competitive factors, could result in a substantial loss of revenue. See"Customers" in Item 1 for further discussion of our customers.
We are exposed to the credit risks of our customers, including nonpayment and nonperformance by our customers.
The concentration of our customers in the oil and gas and marine industries may impact our overall exposure to credit risk as customers may be similarly affected by prolonged changes in economic and industry conditions. We believe certain of our customers finance their activities through cash flows from operations and debt or equity financing. Many of these customers are facing significant challenges within the current oil and gas market and are experiencing decreased cash flows, reductions in borrowing capacity, the inability to access capital or credit markets, and reductions in liquidity, which may impact their ability to pay or otherwise perform on their obligations to us. Accordingly, our operations could be impacted due to nonpayment or nonperformance by our customers. We perform ongoing credit evaluations of our customers and do not generally require collateral in support of our trade receivables. While we maintain reserves for potential credit losses, we can provide no assurances that such reserves will be sufficient to cover uncollectible receivable amounts or that our losses from such receivables will be consistent with our expectations.
Furthermore, some of our customers may be highly leveraged and subject to their own operating and regulatory risks, which increases the risk that they may default on their obligations to us. To the extent one or more of our key customers is in financial distress or commences bankruptcy proceedings, contracts with, or obligations from, these customers may be subject to renegotiation or rejection under applicable provisions of the U.S. Bankruptcy Code and similar international laws.
The nature of our contracting terms for our contracts could adversely affect our operating results.
As is common in the fabrication and marine construction industries, a substantial number of our projects are performed on a fixed-price or unit-rate basis. Under fixed-price contracts, our contract price is fixed, and is generally only subject to adjustment for changes in scope by the customer. Accordingly, we retain cost savings realized on a project but are also responsible for cost overruns. Under unit rate contracts, material items or labor tasks are assigned unit rates of measure. The unit rates of measure will generally be a reimbursable value per ton, per foot or square foot or per item installed. A typical unit rate contract can contain hundreds to thousands of unit rates of measure. Profit margins are incorporated into the unit rates and, similar to a fixed-price contract, we retain cost savings realized on a project but are also responsible for cost overruns. In many cases, our fixed-price and unit rate contracts involve complex design and engineering, significant procurement of materials and equipment, and extensive project management. In addition, as projects increase or decrease in scope, the resulting changes in contract price or unit rates could be less than the actual costs incurred associated with such changes in scope. We employ our best efforts to properly estimate the costs to complete our projects; however, our actual costs incurred to complete our projects could materially exceed our estimates. The revenue, costs and profit realized on a contract will often vary from the estimated amounts on which such contract was originally estimated due to the following:
failure to properly estimate costs of engineering, materials, components, equipment, labor or subcontractors;
unanticipated changes in the costs of engineering, materials, components, equipment, labor or subcontractors;
failure to properly estimate the impact of engineering delays or errors on the construction of a project, including productivity, schedule and rework;
difficulties in engaging third-party subcontractors, equipment manufacturers or materials suppliers, or failures by third-party subcontractors, equipment manufacturers or materials suppliers to perform, resulting in project delays and additional costs;
late delivery of materials by our vendors or the inability of subcontractors to deliver contracted services on schedule or at the agreed upon price;
increased costs due to poor project execution or productivity and/or weather conditions;
unanticipated costs or claims, including costs for project modifications, delays, errors or changes in specifications or designs, regulatory changes or contract termination;
unrecoverable costs associated with customer changes in scope and schedule;
payment of liquidated damages due to a failure to meet contracted delivery dates;
termination, temporary suspension or significant reduction in scope of our projects by our customers;
unanticipated technical problems with the structures, equipment or systems we supply;
under-utilization of our facilities and an idle labor force; and
changes in general economic conditions.
These variations and risks are inherent within our industry and may result in revenue and profit that differ from amounts originally estimated or result in losses on projects. Depending on the size of a project, variations from estimated contract performance can have a significant impact on our operating results. In addition, substantially all of our contracts require us to continue work in accordance with the contractually agreed schedule (and thus, continue to incur expenses for labor and materials) notwithstanding the occurrence of a disagreement with a customer over changes in scope, increased pricing and/or unresolved change orders or claims.
Competitive pricing common in the fabrication and marine construction industry could negatively impact our operating results.
Even when industry conditions are favorable, we operate in a very competitive industry, and as a result, we are not always successful in fully recovering our project costs or realizing a profit. Additionally, during periods of increased market demand, a significant amount of new service capacity may enter the market, which also places pressure on the pricing of our services. Furthermore, during periods of declining pricing for our services, we may not be able to reduce our costs accordingly, which could further affect our profitability.
Our method of accounting for revenue using the percentage-of-completion method could have a negative impact on our results of operations.
Revenue for our fixed-price and unit-rate contracts is recognized using the percentage-of-completion method, based on contract costs incurred to date compared to total estimated contract costs. Contract costs include direct costs, such as materials and labor, and indirect costs attributable to contract activity. Material costs that are significant to a contract and do not reflect an accurate measure of project completion are excluded from the determination of our contract progress. Revenue for such materials is only recognized to the extent of costs incurred. Revenue and gross profit for contracts accounted for using the percentage-of-completion method can be significantly affected by changes in estimated cost to complete such contracts. Significant estimates impacting the cost to complete a contract include: costs of engineering, materials, components, equipment, labor and subcontracts; labor productivity; schedule durations, including subcontractor and supplier progress; contract disputes, including claims; achievement of contractual performance requirements; and contingency, among others. The cumulative impact of revisions in total cost estimates during the progress of work is reflected in the period in which these changes become known, including, to the extent required, the reversal of profit recognized in prior periods and the recognition of losses expected to be incurred on contracts. Due to the various estimates inherent in our contract accounting, actual results could differ from those estimates, which could result in material changes to our Financial Statements and related disclosures.
We are susceptible to adverse weather conditions in our market areas.
Our operations may be subject to seasonal variations due to weather conditions and daylight hours. Although we have large covered fabrication facilities, a significant amount of our construction activities continues to take place outdoors, and accordingly, the number of labor hours worked may decline during the winter months due to unfavorable weather conditions and a decrease in daylight hours. In addition, the seasonality of oil and gas industry activity in the Gulf Coast region also affects our operations. Our offshore oil and gas customers often schedule the completion of their projects during the summer months in order to take advantage of more favorable weather during such months. Further, rainy weather, tropical storms, hurricanes and other storms prevalent in the GOM and along the Gulf Coast may also affect our operations. Repercussions of severe weather conditions or natural disasters may include disruption of our workforce, curtailment of services, weather-related damage to facilities and equipment, resulting in suspension of operations, inability to deliver equipment, personnel and products to job sites in accordance with contract schedules, and loss of productivity. Our suppliers and subcontractors are also subject to severe weather and natural or environmental disasters that could affect their ability to deliver products or services or otherwise perform under their contracts. Furthermore, our customers’ operations may be materially and adversely affected by severe weather and seasonal weather conditions, resulting in reduced demand for services. Accordingly, our operating results may vary from quarter to quarter, depending on factors outside of our control. As a result, full year results are not likely to be a direct multiple of any quarter or combination of quarters. We believe that we maintain adequate insurance coverage related to potential damage from weather. See "Executive Overview and Summary" in Item 7 for further discussion.
Our backlog is subject to change as a result of delay, suspension, termination or an increase or decrease in scope for projects currently in backlog.
New project awards represent expected revenue values of commitments received during a given period, including scope growth on existing commitments. A commitment represents authorization from our customer to begin work or purchase materials pursuant to a written agreement, letter of intent or other form of authorization. Backlog represents the unrecognized revenue for our new project awards and includes signed contracts that are temporarily suspended or under protest but represent future work that we believe will be performed. The revenue projected in our backlog may not be realized or, if realized, may not be profitable.
Projects included in our backlog are generally subject to delay, suspension, termination, or an increase or decrease in scope at the option of the customer; however, the customer is required to pay us for work performed and materials purchased through the date of termination, suspension, or decrease in scope. Depending on the size of the project, the delay, suspension, termination, increase or decrease in scope of any project could significantly impact our backlog and change the expected amount and timing of revenue recognized. Further, for certain projects we may be at greater risk of delays, suspensions and cancellations in the current low oil and gas price environment. In addition, where a project proceeds as scheduled, it is possible that the customer may default by failing to pay amounts owed to us. Accordingly, our backlog as of any date is an uncertain indicator of future results of operations.
We may need to obtain debt financing or new credit facilities or raise equity capital in the future for working capital, capital expenditures, contract commitments and/or acquisitions, and we may not be able to do so or do so on favorable terms, which would impair our ability to operate our business or execute our strategy.
If our existing cash, cash equivalents, scheduled maturities of our short-term investments and cash flows from operating activities are not sufficient to fund our working capital requirements, capital expenditures, contract commitments, and/or acquisition opportunities, we would be required to reduce our capital expenditures and/or forego certain contracts and/or acquisition opportunities, or we would be required to fund such needs through debt or equity issuances or through other financing alternatives, including the sale of assets.
factor below titled “We may be requiredunable to make capital investments in our existing or new facilities and increase our working capital to support our backlog or new project awards, including potential additional projects for the U.S. Navy and potential offshore wind projects. The capital outlays and working capital required by usemploy a sufficient number of skilled personnel to execute such projects could exceed the availability under our Credit Agreement, and we may not be able to obtain alternative debt financing or new credit facilities to fund any capital investment or working capital requirements.
Our ability to successfully obtain debt financing or new credit facilities or raise equity capital in the future will depend in part upon prevailing capital market conditions, as well as conditions in our business and our operating results, and those factors may affect our efforts to obtain additional capital on terms that are satisfactory to us. If adequate capital is not available, or not available on beneficial terms, we may not be able to make future investments, take advantage of acquisitions or other investment opportunities, or respond to competitive challenges. This could limit our ability to bid on new project opportunities, thereby limiting our potential growth and profitability.
We may not be able to further amend our Credit Agreement or obtain debt financing or new credit facilities if and when needed on favorable terms, if at all.
Our primary sources of liquidity are our cash, cash equivalents, scheduled maturities of our short-term investments, and availability under our $40.0 million revolving credit facility with Hancock Whitney Bank (“Credit Agreement”). Our available liquidity is impacted by changes in our working capital (excluding cash, cash equivalents and short-term investments) and our capital expenditure requirements. At December 31, 2019, our cash, cash equivalents and short-term investments totaled $69.6 million and we had $29.8 million of available capacity under our Credit Agreement.
There are a number of potential negative consequences for the energy sector that may result if oil and gas prices remain depressed or decline or if oil and gas companies continue to de-prioritize investments in exploration, development and production, including the continued or worsening of outflow of credit and capital from the energy sector and/or energy focused companies, further efforts by lenders to reduce their exposure to the energy sector, the imposition of increased lending standards for the energy sector, higher borrowing costs and collateral requirements, or a refusal to extend new credit or amend existing credit facilities in the energy sector. These potential negative consequences may be exacerbated by the pressure exerted on financial institutions by regulatory agencies to respond quickly and decisively to credit risk that develops in distressed industries. All these factors may complicate our ability to achieve a favorable outcome in obtaining debt financing, negotiating new credit facilities or amending or extending our Credit Agreement.
In order to extend our Credit Agreement or secure debt financing or new credit facilities, if available, we may be required to provide collateral, pay higher interest rates and otherwise agree to more restrictive terms. Collateral requirements and higher borrowing costs may limit our long- and short-term financial flexibility, and any failure to obtain amendments to our Credit Agreement or to secure debt financing or new credit facilities on terms that are acceptable to us could jeopardize our ability to fund, among other things, capital expenditures and general working capital needs or meet our other financial commitments.
We may obtain letters of credit under our Credit Agreement (which will reduce our availability under our Credit Agreement) or surety bonds from financial institutions to provide to our customers in order to secure advance payments or guarantee performance under our contracts, or in lieu of retention being withheld on our contracts. With respect to a letter of credit under our Credit Agreement, any advance in the event of non-performance under a contract would become a borrowing under our Credit Agreement and thus a direct obligation. With respect to a surety bond, any advance payment in the event of non-performance is subject to indemnification of the surety by us, which may require us to borrow under our Credit Agreement. When a contract is complete, the contingent obligation terminates, and letters of credit or surety bonds are returned. Because our bonding capacity is uncommitted, we can provide no assurances that necessary bonding capacity will be available to support our future bonding requirements. See Note 5 of our Financial Statements in Item 8 and "Liquidity and Capital Resources" in Item 7 for further discussion of our Credit Agreement and surety bonds.
Our Credit Agreement contains operating and financial restrictions and covenants that may restrict our financial and operating flexibility.
Operating and financial restrictions and covenants in our Credit Agreement could restrict our ability to finance future operations or capital needs or to engage, expand or pursue our business activities. For example, our Credit Agreement restricts our ability to: (i) grant liens; (ii) make certain loans or investments; (iii) incur additional indebtedness or guarantee other indebtedness in excess of specified levels; (iv) make any material change to the nature of our business or undergo a fundamental change; (v) make any material dispositions; (vi) acquire another company or all or substantially all of its assets; (vii) enter into a merger, consolidation, or sale leaseback transaction; or (viii) declare and pay dividends if any potential default or event of default occurs.
Our ability to comply with the covenants and restrictions contained in our Credit Agreement may be affected by events beyond our control, including prevailing economic, financial and industry conditions. If market or other economic conditions deteriorate, our ability to comply with these covenants may be impaired. If we breach any of our covenants under our Credit Agreement, repayment of any amounts borrowed at the time could be accelerated when we may not have the liquidity to do so and our credit capacity for the issuance of letters of credit may be terminated. If this were to happen, we could be required to seek additional debt financing or new credit facilities at higher capital costs, significantly curtail our operations, defer execution of our strategy, sell assets at discounted prices, or a combination of any of the aforementioned. In addition, our obligations under our Credit Agreement are secured by substantially all of our assets (with a negative pledge on our real property), and if we are unable to repay any indebtedness under our Credit Agreement, our lender could seek to foreclose on such assets. See Note 5 of our Financial Statements in Item 8 and "Liquidity and Capital Resources" in Item 7 for further discussion of our Credit Agreement, including our amendment to the Credit Agreement.
In addition, if we were to borrow under our Credit Agreement it could have a significant impact on our operations, including:
increasing our vulnerability to adverse economic or industry conditions;
limiting our flexibility in operating our business;
requiring us to dedicate a portion of our cash flow from operations to payments on any debt, thereby reducing the availability of our cash flow to fund working capital, capital expenditures, strategic initiatives and general corporate purposes;
making it more difficult for us to satisfy our obligations under our Credit Agreement and increasing the risk that we may default on our Credit Agreement;
limiting our ability to obtain debt financing or new credit facilities for working capital, capital expenditures, acquisitions, general corporate purposes and other activities;
placing us at a competitive disadvantage against less leveraged competitors; and
making us vulnerable to increases in interest rates, as borrowings under our Credit Agreement are subject to variable interest rates.
We may not be able to generate sufficient cash flow to meet our obligations.
Our ability to fund operations depends on our ability to generate future cash flows from operations. This, to a large extent, is subject to conditions in the oil and gas industry, including commodity prices, demand for our services and the prices we are able to charge for our services, general economic and financial conditions, competition in the markets in which we operate, the impact of legislative and regulatory actions on how we conduct our business and other factors, all of which are beyond our control. During 2019, we experienced negative cash flows from operations, and this trend could continue if conditions in our industry continue or worsen or if we were to experience losses on our projects. See "Liquidity and Capital Resources" in Item 7 for further discussion of our business outlook.
”
Our strategy to monetize underutilized assets, including the sale of assets held for sale, and rationalize underutilized facilities to improve our facility utilization, could result in future losses or impairments and may not produce our desired results.
We are taking actions to monetize underutilized assets. At December 31, 2019, our assets held for sale totaled $9.0 million and primarily consisted of three 660-ton crawler cranes, a deck barge and two plate bending roll machines. Further, our ongoing evaluation of underutilized assets could result in the identification of additional assets for sale. During 2019, we recorded impairments of our assets held for sale. We can provide no assurances that we will successfully sell our assets held for sale, that we will be able to do so in accordance with our expected timeline or that we will recover the carrying value of the assets, which could result in additional impairments or losses. Additionally, any decisions made regarding our deployment or use of any sales proceeds we receive in any sale involves risks and uncertainties. As a result, our decisions with respect to such proceeds may not lead to increased long-term shareholder value. See Note 3 of our Financial Statements in Item 8 for further discussion of our assets held for sale.
We are also taking actions to rationalize underutilized facilities to improve our facility and personnel utilization. Such actions may include the closure or consolidation of one or more of our facilities and the termination of facility employees. During the first quarter 2020, we announced our intent to close the Jennings Yard upon completion of our harbor tug projects, which is forecast to occur during the third quarter 2020. In connection therewith, during 2019, we recorded impairments of certain assets associated with the Jennings Yard. See Note 3 of our Financial Statements in Item 8 for further discussion of our anticipated closure of the Jennings Yard. A facility closure or consolidation could result in future impairments of facility assets and other restructuring or exits costs, including retention, severance or other costs associated with terminated personnel. Further, we can provide no assurances that any facility closure or consolidation will result in an improvement in our overall utilization or that the costs of doing so will not exceed the benefits expected to be gained from the closure or consolidation of a facility.
If we are unable to maintain satisfactory utilization of our facilities or personnel, our results of operations and financial condition would be adversely affected.
Given the high fixed costs of our operations, the utilization of our facilities and personnel can have a significant effect on our business and profitability. If current or future facility and personnel capacity fails to match current or future customer demands for our services, our facilities would be underutilized, and we would not fully recover our fixed overhead costs, which could result in less profitable operations or losses from our operations.
We may be unable to successfully defend against claims made against us by customers, subcontractors or subcontractors,other parties, or recover claims made by us against customers, subcontractors or subcontractors.other parties.
We are, and may in the future become, involved in various legal proceedings and subject to other contingencies that have arisen or may arise in the ordinary course of our business. Our projects are generally complex, and we may encounter difficulties in design, engineering, schedule changes and other factors, some of which may be beyond our control, that affect our ability to complete projects in accordance with contractedcontractual delivery schedulesdates or to otherwise meet contractual performance obligations.
11
We may bring claims against customers for additional costs incurred by us as a result ofresulting from customer-caused delays or changes in project scope initiated by our customers that are not part of the original contract scope. In addition, claims may be brought against us by customers relating to, among other things, alleged defective or incomplete work, breaches of warranty and/or late completion of work. We may also incur claimshave disputes with our subcontractors that are similarand other parties, related to, those described above.among other things, indemnification obligations. These claims may be subject to lengthy and/or expensive litigation or arbitration proceedings and may require us to invest significant working capital in projects to cover cost increases pending resolution of the claims.
Our employees The outcome of litigation is inherently uncertain and subcontractors workadverse developments or outcomes can result in significant monetary damages, penalties, other sanctions or injunctive relief against us, limitations on projectsour property rights, or regulatory interpretations that are inherently dangerous. If we fail to maintain safe work sites, we can be exposed to significant financial losses and reputational harm.
We work on projects with large mechanized equipment, moving vehicles, and dangerous processes, which can place our employees and subcontractors in challenging environments. We maintain a safety assurance program designed to ensure the safety of our employees and subcontractors and allow us to remain in compliance with all applicable federal and state mandated safety regulations. If our safety assurance program fails, our employees, subcontractors and others may become injured, disabled or lose their lives, and our projects may be delayed, causing exposure to litigation or investigations by regulators.
Unsafe conditions at project work sites also have the potential to increase employee turnover, increase project costs and increase our operating costs. In addition, our customers require that we meet certain safety criteria for eligibility to bid for contracts. Our failure to maintain adequate safety standards,A material adverse outcome in any uninsured litigation could result in lostour liabilities exceeding our assets. See “Legal Proceedings” in Item 3 and Note 9 for discussion of our MPSV Litigation.
We have certain continuing obligations in connection with the Shipyard Transaction. If there were any indemnification or other claims arising out of the Shipyard Transaction that are not resolved in our favor, we may not realize the full economic value we expect to derive from the Shipyard Transaction.
Regardless of the merit of particular claims, defending against litigation or responding to investigations can be expensive, time-consuming, disruptive to our operations and distracting to management. In recognition of these considerations, we may enter into agreements or other arrangements to settle litigation and resolve such challenges. There can be no assurance such agreements can be obtained on acceptable terms or that litigation will not occur or that we will not incur charges resulting from any such agreements or settlements.
The nature of our contracting terms for our contracts could adversely affect our operating results.
A substantial number of our projects are performed on a fixed-price or unit-rate basis in any given year. Under fixed-price contracts, our contract price is fixed, and is generally only subject to adjustment for changes in scope by the customer. Accordingly, we retain cost savings realized on a project but are also responsible for cost overruns. Under unit-rate contracts, material items or labor tasks are assigned unit rates of measure. The unit rates of measure will generally be a reimbursable value per ton, per foot or square foot or per item installed. A typical unit-rate contract can contain hundreds to thousands of unit rates of measure. Profit margins are incorporated into the unit-rates and, similar to a fixed-price contract, we retain cost savings realized on a project but are also responsible for cost overruns. In many cases, our fixed-price and unit-rate contracts involve complex design and engineering, significant procurement of materials and equipment, and extensive project management. In addition, as projects increase or decrease in scope, the resulting changes in contract price or unit-rates could be less than the actual costs incurred associated with such changes in scope. We employ our best efforts to properly estimate the cost to complete our projects; however, our actual costs incurred could materially exceed our estimates. The revenue, costs and profit realized on a contract will often vary from the estimated amounts on which such contract was originally estimated due to the following:
12
These variations and risks are inherent within our industry and may result in revenue and profit that differ from amounts originally estimated or result in losses on projects. Depending on the size and duration of a project, variations from estimated contract performance can have a significant impact on our operating results. In addition, substantially all of our contracts require us to continue work in accordance with the contractually agreed schedule, and thus, continue to incur expenses for labor and materials, notwithstanding the occurrence of a disagreement with a customer over changes in scope, increased pricing and/or unresolved change orders or claims.
Our backlog is subject to change as a result of delay, suspension, termination or an increase or decrease in scope for projects currently in backlog.
The revenue projected in our backlog may not be realized or, if realized, may not be profitable. Projects included in our backlog are generally subject to delay, suspension, termination, or an increase or decrease in scope at the option of the customer. Depending on the size of the project, the delay, suspension, termination, increase or decrease in scope of any project could significantly impact our backlog and change the expected amount and timing of revenue recognized. Further, for certain projects we may be at greater risk of delays (or further delays, as applicable), suspensions and cancellations in light of the current global macroeconomics, including the conflict in the Ukraine and resulting European energy crisis. In addition, whether a project proceeds as scheduled, is suspended or terminated, it is possible that the customer may default by failing to pay amounts owed to us, including reimbursement to us for third-party costs we have committed or incurred on the customer’s behalf. For example, in February 2023, we received direction from our customer to suspend all activities on our offshore jackets project. No duration of the suspension or timing of potential recommencement of the project was provided. Accordingly, our backlog as of any date is an uncertain indicator of future results of operations. See Note 2 and “New Project Awards and Backlog” in Item 7 for further discussion of our new project awards and customersbacklog and the project suspension.
We depend on third parties to provide services and supply raw materials, equipment and components necessary to perform our contractual obligations, and any increase in the price or preclude usconstraints on the supply of such raw materials, equipment or components could negatively affect our profitability.
The price and availability of the raw materials required to execute our projects are subject to volatility and disruptions caused by global economic factors that are beyond our control, including, but not limited to, supply chain disruptions, labor shortages, wage pressures, rising inflation and potential economic slowdown or recession, increases in fuel and energy costs, the impact of natural disasters, public health crises (such as COVID-19), geopolitical conflicts (such as the conflict in Ukraine), foreign currency exchange rate fluctuations, and other matters that have or could impact the global economy.
We rely on third parties to provide raw materials, equipment and components, and depend upon subcontractors for a variety of reasons, including performing work we would otherwise perform with our employees but are unable to do so as a result of scheduling demands, performing certain aspects of a contract more efficiently considering the conditions of the contract, and performing certain services that we are unable to do or which we believe can be performed at a lower cost by subcontractors. Recently, supplier and subcontractor delays negatively affected our completion of certain of our Active Retained Shipyard Contracts, thus prolonging the wind down of our Shipyard Division operations and resulting in losses in excess of our previous estimates for the Active Retained Shipyard Contracts. See Note 2 for further discussion of the impacts of supplier and subcontractor delays on our projects.
Ensuring continuity of supply of such raw materials to our operations is critical to our business. We also rely on the availability of equipment and components for key equipment from tendering future bids.
These risksour suppliers, which may be greater should we acquire companies thatimpacted by competition demands as well as the availability of input materials in the creation of such equipment and components for key equipment. Failure of suppliers and subcontractors to deliver raw materials, equipment and components and provide services, or perform under their contracts on a timely basis, or at all, has had and may continue to have poor safety performance, requiring corrective actionsan adverse impact on our operations. The impact of global macroeconomics on our suppliers and subcontractors has resulted in, and may continue to result in, scheduling delays and higher costs, including as a result of inflation, for subcontracted services and raw materials, equipment and components. For example, certain deliverables from third-party engineering firms supporting our projects have been delayed. Further, there continue to be global shipping and logistics challenges, which began during the integration process. This mayCOVID-19 pandemic.
A supplier’s failure to supply raw materials, equipment or components in a timely manner or to meet our quality, quantity or cost requirements or technical specifications, or our inability to obtain alternative sources of raw materials, equipment or components on a timely basis or on terms acceptable to us, could adversely affect our operations. The inability of our suppliers or subcontractors to perform could result in liabilities beforethe need to transition to alternative suppliers or subcontractors, which could result in significant incremental costs and delay, or the need for us to provide other supplemental means to support our existing suppliers and subcontractors. Disruptions and performance problems caused by our suppliers and subcontractors, or a misalignment between our contractual obligations to our customers and our agreements with our subcontractors and suppliers, could have an adverse effect on our ability to meet our commitments to customers.
13
We may be protected from increases in material costs through cost escalation provisions in some of our contracts. However, the difference between our actual material costs and these escalation provisions may expose us to cost uncertainty. In addition, we may experience significant delays in deliveries of key raw materials, which may occur as a result of availability or price, including higher costs due to inflation. While delays and shortages of raw materials, equipment and components did not significantly impact our results in 2022, these issues may continue in 2023 and such corrective actions are implemented.shortages and delays may become material.
The limits on our insurance coverage could expose us to potentially significant liability and costs.
The fabrication of structures and the services we provide involves operating hazards that can cause accidents resulting in personal injury or loss of life, severe damage to and destruction of property and equipment, and suspension of operations. In addition, due to the proximity to the GOM, our facilities are subject to the possibility of physical damage caused by hurricanes or flooding. For example, in 2021, Hurricane Ida damaged our buildings, equipment and vessels under construction and in our possession, at our Houma Facilities, which resulted in repair and replacement costs in excess of our deductible amounts. We may incur additional costs beyond such amounts if damages are determined to be in excess of insurance coverage amounts or if costs we believed to be covered by our insurance coverages are ultimately not covered. See the risk factor below titled “We are susceptible to adverse weather conditions in our market areas” for further discussion of the impacts of adverse weather conditions to our operations.
In addition,Further, our employees may engage in certain activities that are covered by the provisions of the Jones Act or USL&H, including interconnect piping and other service activitiesservices conducted on offshore platforms, activitiesservices performed on barges owned or chartered by us, and construction activities associated with marine vessel fabrication and repair activitiesvessels that are performed at our facilities, that are covered in either the provisions of the Jones Act or USL&H.facilities. These laws make the liability limits established under state workers’ compensation laws inapplicable to these employees and, instead, permit them or their representatives to pursue actions against us for damages or job-related injuries, with generally no limitations on our potential liability. Our ownership and operation of vessels and our fabrication and repair of customer vessels can also give rise to large and varied liability risks, such as risks of collisions with other vessels or structures, sinking, fires and other marine casualties, which can result in significant claims for damages against both us and third parties. Litigation arising from any such occurrences may result in our being named as a defendant in lawsuits asserting large claims.
We may be exposed to future losses through our use of deductibles and self-insured retentions for our exposures related to third partythird-party liability and workers'workers’ compensation. We expect liabilities in excess of any deductible to be covered by insurance. Although we believe that our insurance coverage iscoverages are adequate, there can be no assurance that we will be able to maintain adequate insurance at rates we consider reasonable or that our insurance coveragecoverages will be adequate to cover claims that may arise. To the extent we are self-insured, reserves are recorded based upon our estimates, with input from legal and insurance advisors. Changes in assumptions, as well as changes in actual experience, could cause these estimates to change.
Changes in the insurance industry have generally led to higher insurance costs and decreased availability of coverage. The availability of insurance that covers risks we typically insure against may decrease, and the insurance that we are able to obtain may have higher deductibles, higher premiums and more restrictive policy terms.
Our efforts to strategically reposition the Company to diversify For example, in 2022, our service offeringsproperty and customer base may not result inequipment insurance premiums increased shareholder value.
Our operations have historically been focused on fabricationsignificantly following Hurricane Ida and servicescould increase further, particularly following any future major storm event. See Note 2 for the offshore oil and gas industry. We have diversified our business through the pursuit of onshore fabrication opportunities, the pursuit of marine vessel opportunities outsidefurther discussion of the oilimpacts of Hurricane Ida.
Our project execution and gas industry and the pursuit of offshore wind opportunities and other projects that are not related to our traditional offshore oil and gas markets. We may pursue additional markets or lines of business to expand our service offerings and further diversify our customer base. Entry into, or further development of, new lines of business may expose us to risks that are different from those we have experienced historically. We may not be able to effectively manage these additional risks or implement successful business strategies. Additionally, our competitors in these expanded lines of business may possess greater operational knowledge, resources and experience than we do. These diversification initiatives may not increase shareholder value and could result in a reduction in shareholder value depending upon our required capital investment and success.
Weoperations may be unable to employ a sufficient numbernegatively affected if our equipment is not operable or does not adequately function.
Our project execution and operations are heavily dependent on the use of skilled personnel to executeowned and leased equipment. Accordingly, equipment that is not operable or that does not adequately function could negatively impact our projects.
Our operationsproject execution and operations. As our equipment ages, the costs associated with maintaining such equipment typically increases, and in some instances, such equipment may require personnel with specialized skills and experience.full replacement. In recent years we have reduced our skilled workforcenot made significant investments in response to decreasesnew equipment or the refurbishment of owned equipment, and accordingly, future repair or replacement costs could be significantly higher than those recently experienced. Further, equipment that becomes non-operable or that does not properly function may result in the utilizationtemporary suspension of our facilities. Our productivityoperations until the equipment is repaired or replaced, and profitability are significantly dependent upon our ability to attractsuch impacts may be compounded by limitations on the availability and retain skilled construction supervision and craft labor, primarily welders, pipe fitters andtimely receipt of replacement equipment operators. Reductions in our labor force may make it more difficult to increase our labor force to desirable levels during periods of expanding customer demand and increases in our backlog. Our ability to expand our operations to support growth in our backlog is highly dependent on our ability to increase our labor force when necessary with an appropriate skilled construction workforce.
In periods of increased demand for construction labor,or component parts. See the supply of such labor becomes increasingly limited resulting in higher costs of labor, including increases in wage rates and the costs of recruiting or training to attract and retain qualified employees. Further, during times of higher demand for our services, if qualified personnel become scarce, it could also increase our use of contract labor, which may have a higher cost and lower levels of productivity. In addition, if we fail to attract and retain qualified personnel, we could incur difficulties performing our contracts and attracting new project awards. Moreover, any shortage of qualified personnel or the inability to obtain and retain qualified personnel could negatively affect the quality, safety and timeliness of our operations.
Our success is dependent on key personnel.
Our success is dependent upon the abilities of our executives, management, and other key employees who have significant experience within our industry. Our success also depends on our ability to attract, retain and motivate highly-skilled personnel in various areas, including engineering, construction supervision, project management, procurement, project controls and finance. The loss of one or more key personnel or our inability to attract, retain and motivate necessary personnel could impact our operations. In addition, we may not be able to retain key employees assumed in an acquisition, which may impact our ability to successfully integrate or operate the business acquired.
risk factor above titled “We depend on third parties to provide services to perform our contractual obligations and supply raw materials.
We relymaterials and components and any increase in the price or constraints on third parties to providethe supply of raw materials and majoror components and to perform certain services required bycould negatively affect our contracts. Disruptions and performance problems caused by our suppliers and subcontractors, or a misalignment between our contractual obligations to our customers and our agreements with our subcontractors and suppliers, could have an adverse effect on our ability to meet our commitments to customers. Our ability to perform our obligations on a timely basis could be adversely affected if one or more of our suppliers or subcontractors are unable to provide the agreed-upon products or materials or perform the agreed-upon services in a timely, compliant and cost-effective manner or otherwise fail to satisfy contractual requirements. The inability of our suppliers or subcontractors to perform could also result in the need to transition to alternate suppliers or subcontractors, which could result in significant incremental cost and delay, or the needprofitability” for us to provide other supplemental means to support our existing suppliers and subcontractors.
We depend upon subcontractors for a variety of reasons, including: (i) to perform work we would otherwise perform with our employees but are unable to do so as a result of scheduling demands; (ii) to supervise and/or perform certain aspectsdiscussion of the contract more efficiently considering the conditionsavailability of the contract;equipment and (iii) to perform certain services that we are unable to do or which we believe can be performed at a lower cost by subcontractors.component parts.
14
We work closely with these subcontractors to monitor progress and address our customer requirements. However, the inability of our subcontractors to perform under the terms of their contracts could cause us to incur additional costs that reduce profitability or result in losses on projects.
We may be protected from increases in material costs through cost escalation provisions in some of our contracts. However, the difference between our actual material costs and these escalation provisions may expose us to cost uncertainty. In addition, we may experience significant delays in deliveries of key raw materials, which may occur as a result of availability or price.
Any changes in U.S. trade policies and retaliatory responses from other countries may significantly increase the costs or limit supplies of materials and products used in our fabrication projects.
The federal government has imposed new or increased tariffs or duties on an array of imported materials and goods that are used in connection with our fabrication business, including steel, raising our costs for these items (or products made with them), and has threatened to impose further tariffs, duties and/or trade restrictions on imports. Foreign governments, including China and Canada, and trading blocs, such as the European Union, have responded by imposing or increasing tariffs, duties and/or trade restrictions on U.S. goods, and are reportedly considering other measures. These trading conflicts and related escalating governmental actions that result in additional tariffs, duties and/or trade restrictions could increase our costs, cause disruptions or shortages in our supply chains and/or negatively impact the U.S., regional or local economies.
The nature of our industry subjects us to compliance with regulatory and environmental laws.
Our operations and properties are subject to a wide variety of existing foreign, federal, state and local laws and other regulations, including those governing discharges into the air and water, the handling and disposal of solid and hazardous wastes, the remediation of soil and groundwater contaminated by hazardous substances and the health and safety of employees. In addition, we could be affected by future laws or regulations, including those imposed in response to concerns over climate change, other aspects of the environment, or natural resources. For example, because of concerns that carbon dioxide, methane and certain other greenhouse gases may produce climate changes that have significant impacts on public health and the environment, various governmental authorities have considered and are continuing to consider the adoption of regulatory strategies and controls designed to reduce the emission of greenhouse gases resulting from regulated activities, which if adopted in areas where we conduct business, could require us or our customers to incur additional compliance costs, may result in delays in pursuit of regulated activities and could adversely affect demand for the oil and natural gas that some of our customers produce, thereby potentially limiting demand for our services.
Compliance with many of these laws is becoming increasingly complex, stringent and expensive. These laws may impose “strict liability” for damages to natural resources or threats to public health and safety, rendering a party liable for the environmental damage without regard to its negligence or fault. Certain environmental laws provide for strict, joint and several liability for remediation of spills and other releases of hazardous substances, as well as damage to natural resources. In addition, we could be subject to claims alleging personal injury or property damage as a result of alleged exposure to hazardous substances. Such laws and regulations may also expose us to liability for the conduct of others or conditions caused by others, or acts for which we were in compliance with applicable laws at the time such acts were performed. We believe that our present operations materially comply with applicable federal and state pollution control and environmental protection laws and regulations. We also believe that compliance with such laws has not resulted in a material adverse effect on our operations. However, such environmental laws are changed frequently. Sanctions for noncompliance may include revocation of permits, corrective action orders, administrative or civil penalties and criminal prosecution. We are unable to predict whether environmental laws will have a material adverse effect on our future operations and financial results. See “Government and Environmental Regulation” in Item 1 for further discussion.
The demand for our services is also affected by changing taxes, price controls and other laws and regulations related to the oil and gas, chemicals, commodities, marine and alternative energy industries. We may not be able to pass any potential increases in taxes on to our customers.
Offshore construction and drilling in certain areas is opposed by many environmental groups and, in certain areas, has been restricted. To the extent laws are enacted or other governmental actions are taken that prohibit or restrict offshore construction and drilling or impose environmental protection requirements that result in increased costs to the oil and gas industry in general and the offshore construction industry, our business and prospects could be adversely affected. We cannot determine to what extent future operations and results of operations may be affected by new legislation, new regulations or changes in existing regulations.
Our business is highly dependent on our ability to utilize the navigation canals adjacent to our facilities.
Our facilities in Houma, Louisiana are located on the Houma Navigation Canal approximately 30 miles from the GOM and on a slip adjacent to the Houma Navigation Canal. The Houma Navigation Canal provides the shortest and least restrictive means of access from our facilities to open waters. Our facility near Jennings, Louisiana, is located on the west bank of the Mermentau River approximately 25 miles north of the U.S. Intracoastal Waterway and our facility near Lake Charles, Louisiana is located 17 miles from the GOM on the Calcasieu River. All of these waterways are navigable waterways of the U.S. and, as such, are protected by federal law from unauthorized obstructions that would hinder water-borne traffic. Federal law also authorizes maintenance of these waterways by the U.S. Army Corps of Engineers. These waterways are dredged from time to time to maintain water depth and, while federal funding for dredging has historically been provided, there is no assurance that Congressional appropriations sufficient for adequate dredging and other maintenance of these waterways will be continued. If funding were not appropriated for that purpose, some or all of these waterways could become impassable by barges or other vessels required to transport many of our products.
Any government shutdowns may adversely affect our business.
A government shutdown could impact inspections, regulatory review and certifications, grants or approvals. In addition, our backlog includes a contract for the construction of three towing, salvage and rescue ships for the U.S. Navy with customer options for five additional vessels. A government shutdown could result in a delay or cancellation of these projects or result in our incurring substantial labor or other costs without reimbursement from the government.
Systems and information technology interruption or failure and data security breaches could adversely impact our ability to operate or expose us to significant financial losses and reputational harm.
We rely heavily on computer information, communications technology and related systems in order to properly operate our business. From time to time, we experience occasional system interruptions and delays. In the event we are unable to deploy software and hardware, effectively upgrade our systems and network infrastructure, and take other steps to maintain or improve the efficiency and efficacy of our systems, the operation of such systems could be interrupted or result in the loss, corruption or release of data. In addition, our computer and communications systems and operations could be damaged or interrupted by natural disasters, force majeure events, telecommunications failures, power loss, acts of war or terrorism, physical or electronic security breaches, intentional or inadvertent user misuse or error, or similar events or disruptions. Any of these or other events could cause interruptions, delays, loss of critical and/or sensitive data or similar effects.
In addition, we face the threat to our computer systems of unauthorized access, computer hackers, computer viruses, malicious code, organized cyber-attacks and other security problems and system disruptions. If we were to be subject to a cyber incident or attack, it could result in the disclosure of confidential or proprietary customer information, theft, loss, corruption or misappropriation of intellectual property, damage to our reputation with our customers and the market, failure to meet customer requirements or customer dissatisfaction, theft, exposure to litigation, damage to equipment and other financial costs and losses. We rely on industry accepted security measures and technology to securely maintain all confidential and proprietary information on our computer systems, but these systems are still vulnerable to thesesuch threats. In addition, as cybersecurity threats continue to evolve, we may be required to expend significant resources to protect against the threat of these system disruptions and security breaches or to alleviate problems caused by these disruptions and breaches.
We may conduct a portion of our operations through joint ventures and strategic alliances over which we may have limited control, and our partners in such arrangements may not perform.
We may conduct a portion of our operations through joint ventures and strategic alliances with business partners. In any such arrangement, differences in views among the participants may result in delayed decisions or in failures to reach agreement on certain matters, or to do so in a timely manner. In any joint venture or strategic alliance in which we hold a non-controlling interest, we may have limited control over many decisions relating to joint venture operations and internal controls relating to operations. We also cannot control the actions of our partners, including any non-performance, default, or bankruptcy of our partners, and we would likely share liability or have joint and/or several liability with our partners for joint venture matters.
Major public health crises, including the COVID-19 pandemic,may have a negative impact on our operations.
Pandemics, epidemics, widespread illness or other health crises, such as the COVID-19 pandemic (including any new variants), that interfere with the ability of our employees, suppliers, customers, financing sources or others to conduct business have and could adversely affect the global economy and our operations and business, including our backlog and bidding activities. See the risk factors above titled “Our revenue and profitability continues to be dependent on the offshore oil and gas industry, which is a historically cyclical industry” and “We depend on third parties to provide services to perform our contractual obligations and supply raw materials and any increase in the price or constraints on supply of raw materials could negatively affect our profitability” for further discussion of the impacts of major public health crises on our operations.
Our business and results of operations could be adversely affected if significant portions of our workforce are unable to work effectively, including because of illness, quarantines, government actions or other restrictions. For example, our operations (as well as the operations of our customers, subcontractors and other counterparties) were negatively impacted by the physical distancing, quarantine and isolation measures recommended by national, state and local authorities on large portions of the population, and mandatory business closures that were enacted in an attempt to control the spread of COVID-19, and which could be reenacted in response to any future major public health crisis (including any new and emerging strains and variants of COVID-19).
15
Financial Risks
We may need additional capital in the future for working capital, capital expenditures, contract commitments and/or acquisitions, and we may not be able to obtain or raise such capital (whether debt or equity) or do so on favorable terms, which would impair our ability to operate our business or execute our strategy.
Our primary sources of liquidity are our cash, cash equivalents and scheduled maturities of short-term investments. If such amounts and cash flows from operating activities are not sufficient to fund our working capital requirements, capital expenditures, contract commitments and obligations, and/or acquisition opportunities, we would be required to reduce our capital expenditures and/or forego certain contracts and/or acquisition opportunities, or we would be required to fund such needs through debt or equity issuances or through other financing alternatives, including the sale of assets. See risk factor below titled “We may not be able to obtain letters of credit or surety bonds if and when needed on favorable terms, if at all, and we may not have sufficient liquidity to satisfy any indemnification obligations owed to a surety should the surety have to make payments under the performance bonds to the beneficiary thereof” for further discussion of the impacts that potential indemnification obligations may have on our liquidity.
We may be required to make capital investments in our existing or new facilities and increase our working capital to support our backlog or new project awards. The capital outlays and working capital required by us to execute such projects could exceed our existing, cash, cash equivalents, scheduled maturities of short-term investments and cash flows from operating activities, and we may not be able to obtain debt financing or credit facilities to fund any such capital investment or working capital requirements.
Our ability to successfully obtain debt financing or credit facilities or raise equity capital in the future will depend in part upon prevailing capital market conditions, as well as conditions in our business and our operating results, and those factors may affect our efforts to obtain additional capital on terms that are satisfactory to us. There are a number of potential negative consequences for the energy sector that may result if oil and gas prices remain volatile (which has been exacerbated by the conflict in Ukraine and related European energy crisis) or decline or if oil and gas companies continue to de-prioritize investments in exploration, development and production, including the continued or worsening of outflow of credit and capital from the energy sector and/or energy focused companies and further efforts by lenders to reduce their exposure to the energy sector, including the imposition of increased lending standards for the energy sector, higher borrowing costs and collateral requirements, or a refusal to extend new credit or amend existing credit facilities in the energy sector. These potential negative consequences may be exacerbated by the pressure exerted on financial institutions by regulatory agencies to respond quickly and decisively to credit risk that develops in distressed industries. All of these factors may complicate our ability to achieve a favorable outcome in obtaining debt financing or credit facilities.
In order to secure debt financing or credit facilities with borrowing capacity, if available, we may be required to provide significant collateral, pay high interest rates and otherwise agree to restrictive terms. Collateral requirements and higher borrowing costs may limit our long- and short-term financial flexibility, and any failure to secure debt financing or credit facilities on terms that are acceptable to us could jeopardize our ability to fund, among other things, capital expenditures and general working capital needs or meet our other financial commitments. For example, in 2021, we entered into a multiple indebtedness mortgage (“Mortgage Agreement”) and a restrictive covenant arrangement (“Restrictive Covenant Agreement”) with one of our Sureties to secure our obligations and liabilities under our general indemnity agreement with such Surety associated with its outstanding surety bond obligations for our MPSV projects and two forty-vehicle ferry projects. We could be required to provide additional collateral to such Surety in support of these performance bonds or other performance bonds issued by such Surety or other Sureties. See “Liquidity and Capital Resources” in Item 7 and Note 6 for further discussion of our Mortgage Agreement and Restrictive Covenant Agreement.
If adequate capital is not available, or not available on beneficial terms, we may not be able to make future investments, take advantage of acquisitions or other investment opportunities, or respond to competitive challenges. This could limit our ability to bid on new project opportunities, thereby limiting our potential growth and profitability.
We may not be able to generate sufficient cash flow to meet our obligations.
Our ability to fund operations depends on our ability to generate future cash flows from operations. This, to a large extent, is subject to conditions in the oil and gas industry, including commodity prices, demand for our services and the prices we are able to charge for our services, general economic and financial conditions, competition in the markets in which we operate, the impact of legislative and regulatory actions on how we conduct our business and other factors, all of which are beyond our control. During 2022 and 2021, we experienced negative cash flows from operations, and this trend could continue if global macroeconomic conditions continue or worsen or oil and gas prices decline significantly resulting in delayed or suspended capital expenditures by customers, or if we were to experience losses on our projects or in any pending litigation. See “Liquidity and Capital Resources” in Item 7 for further discussion of our business outlook.
16
We may not be able to obtain letters of credit or surety bonds if and when needed on favorable terms, if at all, and we may not have sufficient liquidity to satisfy any indemnification obligations owed to a surety should the surety have to make payments under the performance bonds to the beneficiary thereof.
Certain of our projects require that we issue letters of credit or surety bonds to our customers in order to secure advance payments or guarantee performance under our contracts. Our LC Facility currently provides for letters of credit, which are subject to cash securitization. With respect to letters of credit under our LC Facility, any advance in the event of non-performance under a contract would become a direct obligation and reduction in our cash. With respect to surety bonds, including the construction contracts associated with our MPSV Litigation, payments by the Surety pursuant to a bond in the event of non-performance are subject to reimbursement to the Surety by us under a general indemnity agreement. Such indemnification obligations may include the face amount of the surety bond, or portions thereof, as well as other reimbursable items such as interest and certain investigative expenses and legal fees of the Surety. Such indemnification obligations would require us to use our cash, cash equivalents or short-term investments, and we may not have sufficient liquidity to satisfy such indemnification obligations. When a contract is complete, the contingent obligation terminates, and letters of credit or surety bonds are returned. It has been increasingly difficult to obtain letters of credit and bonding capacity and identify potential financing sources, due to, among other things, losses from our operations in recent years, including charges on projects within our Shipyard Division and discontinued operations. We can provide no assurances that necessary letters of credit or bonding capacity will be available to support future project requirements or that we will have sufficient liquidity to satisfy any future indemnification obligations. See “Liquidity and Capital Resources” in Item 7 and Note 6 for further discussion of our LC Facility and surety bonds, and “Legal Proceedings” in Item 3 and Note 9 for further discussion of our MPSV Litigation.
We are exposed to the credit risks of our customers, including nonpayment and nonperformance by our customers.
The oil and gas industry continues to face significant challenges due to the prolonged period of depressed and/or volatile oil and gas prices from 2014 to 2018 and subsequent ongoing volatility in oil and gas prices, which have been impacted by the conflict in Ukraine and related European energy crisis.
The concentration of our customers in the oil and gas industry may impact our overall exposure to credit risk as customers may be similarly affected by negative changes in industry conditions. We believe certain of our customers finance their activities through cash flows from operations and debt or equity financing. Many of these customers have faced significant challenges since 2008 due to the volatility in the price of oil and gas, including decreased cash flows, reductions in borrowing capacity, the inability to access capital or credit markets, and reductions in liquidity. While the prices of oil and gas have recently increased, the price remains volatile, due in part to the conflict in the Ukraine and related European energy crisis. If the price of oil and gas significantly declined or the returns on capital investments by our customers are insufficient, our operations could be impacted due to nonpayment or nonperformance by our customers. We perform ongoing credit evaluations of our customers and do not generally require collateral in support of our trade receivables. While we maintain reserves for potential credit losses, we can provide no assurances that such reserves will be sufficient to cover uncollectible receivable amounts or that our losses from such receivables will be consistent with our expectations.
Furthermore, some of our customers may be highly leveraged and subject to their own operating and regulatory risks, which increases the risk that they may default on their obligations to us. To the extent one or more of our key customers is in financial distress or commences bankruptcy proceedings, contracts with, or obligations from, these customers may be subject to renegotiation or rejection under applicable provisions of the U.S. Bankruptcy Code and similar international laws. During 2021, Hornbeck emerged from Chapter 11 bankruptcy; however, our MPSV Litigation is ongoing. See “Legal Proceedings” in Item 3 and Note 9 for further discussion of our MPSV Litigation.
Our method of accounting for revenue using the percentage-of-completion method could have a negative impact on our results of operations.
Revenue and gross profit for contracts accounted for using the percentage-of-completion method can be significantly affected by changes in estimated cost to complete such contracts. Significant estimates impacting the cost to complete a contract include: forecast costs of engineering, materials, equipment and subcontracts; forecast costs of labor and labor productivity; schedule durations, including subcontractor and supplier progress; contract disputes, including claims; achievement of contractual performance requirements; and contingency, among others. The cumulative impact of revisions in total cost estimates during the progress of work is reflected in the period in which these changes become known, including, to the extent required, the reversal of profit recognized in prior periods and the recognition of losses expected to be incurred on contracts. Due to the various estimates inherent in our contract accounting, actual results could differ from those estimates, which could result in material changes to our Financial Statements and related disclosures.
Further, our time and materials (“T&M”), cost-reimbursable and unit-rate contracts generally have more variability in the scope of work than fixed-price contracts and provide our customers with greater influence over the timing of when we perform our work. Accordingly, such contracts often result in less predictability with respect to the timing of when our revenue is recognized. See “Critical Accounting Policies” in Item 7 and Note 2 for further discussion of our contracting and revenue recognition.
17
Disruptions at the regional bank in which we deposit our funds could have an adverse impact on our business and financial condition.
We hold substantially all of our cash deposits with a single regional bank and we rely on our deposits with the bank to fund our operations. Any disruption in the bank’s ability to process payments or maintain our deposits would significantly disrupt our business and could materially affect our operations. In addition, we currently have cash and cash equivalents deposited in excess of federally insured levels with the bank, and if the bank were to fail, we could lose our deposits in excess of insured levels. Recently, federal governmental agencies have taken action to protect uninsured deposits at certain U.S. banks; however, if the regional bank in which we hold funds for operations were to fail, we cannot provide any assurances that such governmental agencies will take similar actions.
Workforce Risks
We may be unable to employ a sufficient number of skilled personnel to execute our projects.
Our productivity and profitability are significantly dependent upon our ability to attract and retain skilled construction supervision and craft labor, primarily welders, pipe fitters and equipment operators. The fabrication and services industries have lost a significant number of experienced professionals over the years due to the aging of the workforce and the cyclical nature of the oil and gas industry, which is attributable, among other reasons, to the volatility of oil and gas prices and a more generalized concern about the overall future prospects of the oil and gas industry. See risk factor above titled “Our revenue and profitability continues to be dependent on the offshore oil and gas industry, which is a historically cyclical industry.” Many companies, including us, have reduced their skilled workforce in response to decreases in utilization. However, with the current increase in oil and gas prices, we have experienced an increase in bidding activity. The current competitive labor market may make it more difficult to increase our labor force to desirable levels based on our expanding customer demand and increases in our backlog. We cannot be certain that we will be able to attract and retain the qualified labor force required to meet current or future needs at a reasonable cost, or at all.
With the recent increased demand for construction and services labor, the supply of skilled labor has become increasingly limited resulting in higher costs of labor, including increases in wage rates and the costs of recruiting or training to attract and retain qualified personnel, which could have a materially adverse impact on our business, financial condition and results of operations. Further, due to the higher demand for our services, if we cannot employ the necessary skilled labor to execute our backlog, we have had, and may have to continue, to increase our use of contract labor, which may have a higher cost and lower levels of productivity.
If we are unable to hire and retain necessary skilled labor, we may be unable to secure new project awards, execute our backlog and expand our operations. Further, any shortage of skilled labor or ongoing challenges hiring and retaining skilled labor could negatively affect the quality, safety, timeliness and profitability of our projects.
Our success is dependent on key personnel.
Our success is dependent upon the abilities of our executives, management, and other key employees who have significant and relevant industry experience. Our success also depends on our ability to attract, retain and motivate highly-skilled personnel in various areas, including construction supervision, project management, procurement, project controls and finance. The loss of one or more key personnel or our inability to attract, retain and motivate necessary personnel could impact our operations.
If we continue to have insufficient utilization levels for our facilities or personnel, our results of operations and financial condition would be adversely affected.
In recent years we have experienced an under-utilization of our facilities and personnel and have not fully recovered our overhead costs, due in part to the high fixed costs of our operations and the impact of the COVID-19 pandemic and volatile oil and gas prices. This has resulted in losses from our operations. If current or future facility and personnel capacity fails to match current or future customer demands for our services, our facilities would continue to be under-utilized, which could result in less profitable operations or ongoing losses from our operations.
Our employees and subcontractors work on projects that are inherently dangerous. If we fail to maintain safe work sites, we can be exposed to significant financial losses and reputational harm.
We work on projects with large, mechanized equipment, moving vehicles, and dangerous processes, which can place our employees and subcontractors in challenging environments. We maintain a safety assurance program designed to ensure the safety of our employees and subcontractors and to ensure that we remain in compliance with all applicable federal and state mandated safety regulations. If our safety assurance program fails, our employees, subcontractors and others may become injured, disabled or lose their lives, and our projects may be delayed, causing exposure to litigation or investigations by regulators.
18
Unsafe conditions at project work sites also have the potential to increase employee turnover, increase project costs and increase our operating costs. In addition, our customers often require that we meet certain safety criteria to be eligible to bid contracts. Our failure to maintain adequate safety standards could result in lost project awards and customers or preclude us from tendering future bids.
Strategic Risks
Our efforts to strategically reposition the Company to diversify our service offerings and customer base may not result in increased shareholder value.
Our operations have historically been focused on fabrication and services for the offshore oil and gas industry. We have begun to diversify our business through the pursuit of onshore fabrication opportunities and sustainable energy and other projects that are not related to our traditional offshore oil and gas markets. While the sale of our Shipyard Division assets and a majority of our long-term construction contracts resulted in a less diversified business portfolio such that we have a greater dependency on the performance of our remaining operations for our financial results, during 2021, we expanded our offshore services offerings and further diversified our offshore customer base through the DSS Acquisition. In addition, during 2022, we made capital and other investments to expand our offshore services offering to include welding enclosures, which provides a safe environment for welding, cutting and burning without the need to shut down operations. Entry into, or further development of, new lines of business may expose us to risks that are different from those we have experienced historically. We may not be able to effectively manage these additional risks or implement successful business strategies and our cash flows derived from any new lines of business may not be consistent with our expectations or be insufficient to fully recover our investment. Additionally, our competitors in these expanded lines of business may possess greater operational knowledge, resources and experience than we do. These diversification initiatives may not increase shareholder value and could result in a reduction in shareholder value depending upon our required capital investment and success.
Any future rationalization of under-utilized assets or facilities to improve our asset or facility utilization could result in future losses or impairments and may not produce our desired results.
We may take actions to relocate assets, consolidate operations and rationalize under-utilized assets and facilities to improve our utilization. Such actions may include the sale of assets or the closure or consolidation of one or more of our facilities and the termination of facility employees. During 2022, we sold the Harvey Option associated with the Harvey Option Facility, and during 2021, we sold our Shipyard Facility in connection with the Shipyard Transaction and consolidated certain operations within our Houma Facilities. In connection therewith, during 2021 we recorded impairments of certain assets and recorded losses on the sale of certain assets and on the Shipyard Transaction. A future sale of assets or facility closure or consolidation could result in further impairments of facility assets and other restructuring or exits costs, including retention, severance or other costs associated with terminated personnel. Further, we can provide no assurances that any asset sales or facility closure or consolidation will result in an improvement in our overall utilization or that the costs of doing so will not exceed the benefits expected to be gained from the asset sales or closure or consolidation of a facility. In addition, any decisions made regarding our deployment or use of any sales proceeds we receive involves risks and uncertainties. As a result, our decisions with respect to such proceeds may not lead to increased long-term shareholder value. See Note 3 for further discussion of the Shipyard Transaction and Note 4 for further discussion of the sale of the Harvey Option.
Legal, Regulatory and Environmental Risks
Any changes in U.S. trade policies and retaliatory responses from other countries may significantly increase the costs or limit supplies of materials and products used in our fabrication projects.
In the past few years, the federal government has imposed new or increased tariffs or duties on an array of imported materials and products used in connection with our fabrication business, which raised our costs for these items (or products made with them), and threatened to impose further tariffs, duties and/or trade restrictions on imports. Foreign governments, including China and Canada, and trading blocs, such as the European Union, responded by imposing or increasing tariffs, duties and/or trade restrictions on U.S. goods. For example, in response to Russia’s invasion of Ukraine, the U.S. and other countries have imposed sanctions and/or other restrictive actions against Russia. These developments have caused global economic disruptions, including increases in energy prices and the related European energy crisis. Any trading conflicts and related escalating governmental actions that result in additional tariffs, duties and/or trade restrictions could increase our costs, cause disruptions or shortages in our supply chains and/or negatively impact the U.S., regional or local economies.
19
We are susceptible to adverse weather conditions in our market areas.
Our operations may be subject to seasonal variations due to weather conditions and daylight hours, and to the extent climate change results in an increase in extreme adverse weather conditions, the likelihood of a negative impact on our operations may increase. Although we have large covered fabrication facilities, a significant amount of our fabrication activities continues to take place outdoors, and accordingly, the number of labor hours worked may decline during the winter months due to unfavorable weather conditions and a decrease in daylight hours. In addition, the seasonality of oil and gas industry activity in the GOM also affects our operations. Our offshore oil and gas customers often schedule the completion of their projects during the summer months in order to take advantage of more favorable weather during such months. Further, rainy weather, tropical storms, hurricanes and other storms prevalent in the GOM and along the Gulf Coast may also affect our operations. For example, in 2021, we experienced damage to our Houma Facilities due to Hurricane Ida, which made landfall as high-end Category 4 hurricane. Beyond financial and regulatory impacts, climate change poses potential physical risks. Scientific studies forecast that these risks include increases in sea levels, stresses on water supply, rising average temperatures and other changes in weather conditions, such as increases in precipitation and extreme weather events, such as floods, heat waves, hurricanes and other tropical storms and cyclones. The projected physical effects of climate change have the potential to directly affect the operations we conduct for customers and result in increased costs related to our operations. However, because the nature and timing of changes in extreme weather events (such as increased frequency, duration, and severity) are uncertain, it is not possible for us to estimate reliably the future financial risk to our operations caused by these potential physical risks. The impact of severe weather conditions or natural disasters has included and may continue to include the disruption of our workforce; curtailment of services; weather-related damage to our facilities and equipment, including impacts from infrastructure challenges in the surrounding areas, resulting in suspension of operations; inability to deliver equipment, personnel and products to project sites in accordance with contract schedules; and loss of productivity. Our suppliers and subcontractors are also subject to severe weather and natural or environmental disasters that have in the past and could in the future affect their ability to deliver products or services or otherwise perform under their contracts. Furthermore, our customers’ operations have been and in the future may be materially and adversely affected by severe weather and seasonal weather conditions, including Hurricane Ida, resulting in reduced demand for our services. See “Overview” in Item 7 and Note 2 for further discussion of the impacts of adverse weather conditions to our operations.
The nature of the industries that we serve subjects us to compliance with regulatory and environmental laws.
Our operations and properties are subject to a wide variety of existing foreign, federal, state and local laws and other regulations. See “Government and Environmental Regulation” in Item 1 for further discussion. Compliance with many of these laws is becoming increasingly complex, stringent and expensive. These laws may impose “strict liability” for damages to natural resources or threats to public health and safety, rendering a party liable for the environmental damage without regard to its negligence or fault. Certain environmental laws provide for strict, joint and several liability for remediation of spills and other releases of hazardous substances, as well as damage to natural resources. In addition, we could be subject to claims alleging personal injury or property damage as a result of alleged exposure to hazardous substances. Such laws and regulations may also expose us to liability for the conduct of others or conditions caused by others, or acts for which we were in compliance with applicable laws at the time such acts were performed. To date, compliance with such laws has not resulted in a material adverse effect on our operations. However, we cannot predict when and whether any new or additional regulations may become effective, such as the regulatory response to climate change, and what their effect will be on us or our customers.
The demand for our services may be impacted by the regulatory response to climate change. Due to concern over the risk of climate change, several countries have adopted, or are considering the adoption of, regulatory frameworks to reduce the emission of carbon dioxide, methane and other gases (greenhouse gas emissions). These regulations include adoption of cap and trade regimes, carbon taxes, restrictive permitting, increased efficiency standards, and incentives or mandates for renewable energy. For example, the recently adopted Inflation Reduction Act of 2022 imposes a federal fee on the emission of greenhouse gases. Existing and future regulatory response to climate change may potentially result in delays or prevent customers’ projects from going forward and could adversely affect demand for the oil and natural gas that some of our customers produce, thereby potentially limiting demand for our services. The demand for our services is also affected by changing taxes, price controls and other laws and regulations related to the oil and gas, chemicals, commodities and alternative energy industries. We may not be able to pass any resulting cost increases on to our customers.
Offshore construction and drilling in certain areas is opposed by many environmental groups and, in certain areas, has been restricted. To the extent laws are enacted or other governmental actions are taken that prohibit or restrict offshore construction and drilling or impose environmental protection requirements that result in increased costs to the oil and gas industry in general and the offshore construction industry, our business and prospects could be adversely affected. We cannot determine to what extent future operations and results of operations may be affected by new legislation, new regulations or changes in existing regulations.
20
Actions of activist shareholders could create uncertainty about our future strategic direction, be costly and divert the attention of our management and board. In addition, some institutional investors may be discouraged from investing in the industries that we service.
In recent years, activist shareholders have placed increasing pressure on publicly-traded companies to effect changes to corporate governance practices, executive compensation practices or social and environmental practices, or to undertake certain corporate actions or reorganizations. There can be no assurances that activist shareholders will not publicly advocate for us to make additional corporate governance changes or engage in certain corporate actions. Responding to challenges from activist shareholders, such as proxy contests, media campaigns or other public or private means, could be costly and time consuming and could have an adverse effect on our reputation and divert the attention and resources of management and our board, which could have an adverse effect on our business and operational results. Additionally, shareholder activism could create uncertainty about our leadership or our future strategic direction, resulting in loss of future business opportunities, which could adversely affect our business, future operations, profitability and our ability to attract and retain qualified personnel. As of December 31, 2019,2022, based on our review of public filings with the SEC, we believe over halfone-third of our stock is held by a combination of institutional investors, pooled investment funds, and certain other investors with a history of shareholder activism. ThreeOne such investors haveinvestor has a Schedule 13Ds13D on file with the SEC that reserve theirreserves that investor’s rights to pursue corporate governance changes, board structure changes, changes to capitalization, potential business combinations or dispositions involving the Company or certain of itsour businesses, or suggestions for improving the Company’s financial and/or operational performance. We have a Cooperation Agreement in place with our largest shareholder that is set to expire at the 2021 annual meeting, if not terminated sooner.
In addition to risks associated with activist shareholders, some institutional investors are increasingly focused on environmental, social and governance (“ESG”) factors when allocating their capital. These investors may be seeking enhanced ESG disclosures and actions or may implement policies that discourage investment in certain of the industries, including the oil and gas industry, that we service. To the extent that certain institutional investors implement policies that discourage investments in industries that we service, it could have an adverse effect on our financing costs and access to sources of capital. Further, we may not succeed in implementing or communicating an ESG message that is well understood or received. As a result, we may experience diminished reputation or sentiment, reduced access to sources of capital, an inability to attract and retain qualified personnel and loss of customers, suppliers or subcontractors.
Our business is highly dependent on our ability to utilize the navigation canals adjacent to our facilities.
Our Houma Facilities are located on the Houma Navigation Canal approximately 30 miles from the GOM and on a slip adjacent to the Houma Navigation Canal. The Houma Navigation Canal provides the shortest and least restrictive means of access from our facilities to open waters. These waterways are navigable waterways of the U.S. and, as such, are protected by federal law from unauthorized obstructions that would hinder water-borne traffic. Federal law also authorizes maintenance of these waterways by the U.S. Army Corps of Engineers. These waterways are dredged from time to time to maintain water depth and, while federal funding for dredging has historically been provided, there is no assurance that Congressional appropriations sufficient for adequate dredging and other maintenance of these waterways will be continued. If funding were not appropriated for that purpose, some or all of these waterways could become impassable by barges or other vessels required to transport many of our products.
Item 1B. Unresolved Staff Comments
None.
None.
We are subject to various routine legal proceedings in the normal conduct of our business, primarily involving commercial disputes and claims, workers’ compensation claims, and claims for personal injury under general maritime laws of the U.S. and the Jones Act. While the outcome of these lawsuits, legal proceedings and claims cannot be predicted with certainty, we believe that the outcome of any such proceedings, even if determined adversely, would not have a material adverse effect on our financial position, results of operations or cash flows.
On October 2, 2018, we filed a lawsuit against our customer to enforce our rights and remedies under the applicable construction contracts for two MPSVs. The lawsuit was filed in the Twenty-Second Judicial District Court for the Parish of St. Tammany, State of Louisiana and is styled Gulf Island Shipyards, LLC v. Hornbeck Offshore Services, LLC. The customer responded to our lawsuit by denying many of the allegations in the lawsuit and asserting a counterclaim against us. We filed a response to the counterclaim denying all the customer's claims. The customer subsequently filed an amendment to its counterclaim to add claims by the customer against the Surety. The customer also filed a motion for partial summary judgment with the trial court seeking, among other things, to obtain possession of the vessels. A hearing on the motion was held on May 28, 2019, and the customer's request to obtain possession of the vessels was denied by the trial court. The customer subsequently filed a second motion for partial summary judgment re-urging its previously denied request to obtain possession of the vessels. A hearing on the second motion was held on November 9, 2019, and the customer’s request to obtain possession of the vessels was again denied by the trial court. Thereafter, the customer requested that the appellate court exercise its discretion and review the trial court’s denial of the customer’s second motion. We have opposed the discretionary appellate review request of the customer and the appellate matter is pending. Discovery in connection with the lawsuit is ongoing. See Note 89 of our Financial Statements in Item 8 for further discussion of this litigation.our legal proceedings, including our MPSV Litigation, which is incorporated herein by reference.
Item 4. Mine Safety Disclosures
Not applicable.
21
PART II
Item 5. Market for Registrant'sRegistrant’s Common Equity, Related Shareholder Matters and Issuer Purchases of Equity Securities
Our common stock is traded on the Nasdaq Global Select Market, under the symbol “GIFI.” At February 19, 2020,21, 2023, there were 2,40952 registered holders of record of our common stock, (including 93 registeredwhich does not include beneficial holders on the books and records of our transfer agent (excluding CEDE & Co.(also known as “street holders”) and 2,136 accounts ofwhose shares are held by banks, brokers, trustees orand other nominees participating in the DTC system that hold shares of our common stock beneficially owned by others).financial institutions.
Issuer Purchases of Equity Securities
We had no repurchases of securities during the fourth quarter 2019.2022. Information as to the securities authorized for issuance under our equity compensation plans is incorporated herein by reference to Item 12.
Stock Performance Graph
The following graph compares the cumulative total shareholder return on our common stock for the five-year period ended December 31, 2019, with the cumulative total return of the Standard & Poor’s SmallCap 600 Index and the Standard & Poor’s SmallCap 600 Oil & Gas Equipment & Services Index for the same period. We believe that the Standard & Poor’s SmallCap 600 Index and the Standard & Poor’s SmallCap 600 Oil & Gas Equipment & Services Index are more appropriate indexes than the Standard & Poor’s 500 Index and Standard & Poor’s 500 Oil & Gas Equipment & Services Index as they more appropriately reflect the size, markets and capitalization of the Company. The returns are based on an assumed investment of $100 on January 1, 2015, at closing prices on December 31, 2014, in our common stock and in each of the indexes and on the assumption that dividends were re-invested.
Total Return to Shareholders
(includes reinvestment of dividends)
|
|
|
|
| ANNUAL RETURN PERCENTAGE Years Ending |
| ||||||||||||||||||
Company / Index |
|
|
|
|
| Dec 15 |
|
| Dec 16 |
|
| Dec 17 |
|
| Dec 18 |
|
| Dec 19 |
| |||||
Gulf Island |
|
|
|
|
|
| (44.3 | )% |
|
| 14.3 | % |
|
| 13.2 | % |
|
| (46.2 | )% |
|
| (29.8 | )% |
S&P SmallCap 600 Index |
|
|
|
|
|
| (2.0 | ) |
|
| 26.6 |
|
|
| 13.2 |
|
|
| (8.5 | ) |
|
| 22.8 |
|
S&P SmallCap 600 Oil & Gas Equipment & Services |
|
|
|
|
|
| (48.0 | ) |
|
| 39.5 |
|
|
| (26.2 | ) |
|
| (46.1 | ) |
|
| (1.5 | ) |
|
|
|
|
|
|
|
|
|
|
|
|
|
|
|
|
|
|
|
|
|
|
|
|
|
|
| Base Period |
|
| INDEXED RETURNS ($'s) Years Ending |
| ||||||||||||||||||
Company / Index |
| Dec 14 |
|
| Dec 15 |
|
| Dec 16 |
|
| Dec 17 |
|
| Dec 18 |
|
| Dec 19 |
| ||||||
Gulf Island |
| $ | 100.00 |
|
| $ | 55.67 |
|
| $ | 63.63 |
|
| $ | 72.04 |
|
| $ | 38.75 |
|
| $ | 27.21 |
|
S&P SmallCap 600 Index |
|
| 100.00 |
|
|
| 98.03 |
|
|
| 124.06 |
|
|
| 140.48 |
|
|
| 128.56 |
|
|
| 157.85 |
|
S&P SmallCap 600 Oil & Gas Equipment & Services |
|
| 100.00 |
|
|
| 51.99 |
|
|
| 72.52 |
|
|
| 53.51 |
|
|
| 28.85 |
|
|
| 28.42 |
|
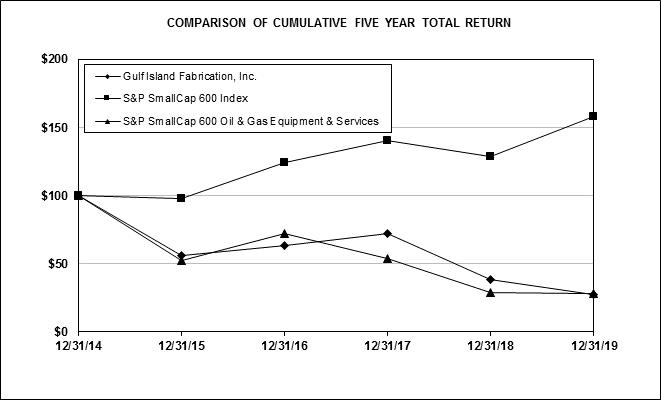
Item 6. Selected Financial Data
The following table presents selected historical financial data as of the dates and for the periods indicated. The historical financial data for each year in the five-year period ended December 31, 2019, is derived from our audited financial statements. The following information should be read in conjunction with “Management’sNot applicable.
22
Item 7. Management’s Discussion and Analysis of Financial Condition and Results of Operations” and our Financial Statements and notes thereto included elsewhere in this 2019 Annual Report.Operations
|
| Years Ended December 31, |
| |||||||||||||||||
|
| 2019 |
|
| 2018 |
|
| 2017 |
|
| 2016 |
|
| 2015 |
| |||||
|
| (in thousands, except per share data) |
| |||||||||||||||||
Statement of Operations Data: |
|
|
|
|
|
|
|
|
|
|
|
|
|
|
|
|
|
|
|
|
Revenue |
| $ | 303,308 |
|
| $ | 221,247 |
|
| $ | 171,022 |
|
| $ | 286,326 |
|
| $ | 306,120 |
|
Cost of revenue |
|
| 320,307 |
|
|
| 228,443 |
|
|
| 213,947 |
|
|
| 261,473 |
|
|
| 321,276 |
|
Gross profit (loss) (1) (3) (5) (7) |
|
| (16,999 | ) |
|
| (7,196 | ) |
|
| (42,925 | ) |
|
| 24,853 |
|
|
| (15,156 | ) |
General and administrative expense |
|
| 15,628 |
|
|
| 19,015 |
|
|
| 17,800 |
|
|
| 19,670 |
|
|
| 16,256 |
|
Impairments and (gain) loss on assets held for sale (2) (4) (6) (8) |
|
| 17,528 |
|
|
| (6,850 | ) |
|
| 7,931 |
|
|
| — |
|
|
| 7,202 |
|
Other (income) expense, net |
|
| (134 | ) |
|
| 304 |
|
|
| (46 | ) |
|
| (681 | ) |
|
| (20 | ) |
Operating income (loss) |
|
| (50,021 | ) |
|
| (19,665 | ) |
|
| (68,610 | ) |
|
| 5,864 |
|
|
| (38,594 | ) |
Interest income (expense), net |
|
| 531 |
|
|
| (142 | ) |
|
| (349 | ) |
|
| (308 | ) |
|
| (139 | ) |
Income (loss) before income taxes |
|
| (49,490 | ) |
|
| (19,807 | ) |
|
| (68,959 | ) |
|
| 5,556 |
|
|
| (38,733 | ) |
Income tax (expense) benefit |
|
| 96 |
|
|
| (571 | ) |
|
| 24,193 |
|
|
| (2,041 | ) |
|
| 13,369 |
|
Net income (loss) |
| $ | (49,394 | ) |
| $ | (20,378 | ) |
| $ | (44,766 | ) |
| $ | 3,515 |
|
| $ | (25,364 | ) |
Basic and diluted income (loss) per common share |
| $ | (3.24 | ) |
| $ | (1.36 | ) |
| $ | (3.02 | ) |
| $ | 0.24 |
|
| $ | (1.75 | ) |
Basic and diluted weighted-average common shares |
|
| 15,227 |
|
|
| 15,032 |
|
|
| 14,838 |
|
|
| 14,631 |
|
|
| 14,546 |
|
Cash dividends per common share |
| $ | — |
|
| $ | — |
|
| $ | 0.40 |
|
| $ | 0.40 |
|
| $ | 0.40 |
|
|
|
|
|
|
|
|
|
|
|
|
|
|
|
|
|
|
| December 31, |
| |||||||||||||||||
|
| 2019 |
|
| 2018 |
|
| 2017 |
|
| 2016 |
|
| 2015 |
| |||||
|
|
|
|
|
|
|
|
|
| (in thousands) |
|
|
|
|
|
|
|
|
| |
Balance Sheet Data: |
|
|
|
|
|
|
|
|
|
|
|
|
|
|
|
|
|
|
|
|
Working capital |
| $ | 65,630 |
|
| $ | 103,854 |
|
| $ | 130,499 |
|
| $ | 78,012 |
|
| $ | 77,968 |
|
Property, plant and equipment, net |
|
| 70,484 |
|
|
| 79,930 |
|
|
| 88,899 |
|
|
| 206,222 |
|
|
| 200,384 |
|
Total assets |
|
| 252,777 |
|
|
| 258,290 |
|
|
| 270,840 |
|
|
| 322,408 |
|
|
| 316,923 |
|
Debt |
|
| — |
|
|
| — |
|
|
| — |
|
|
| — |
|
|
| — |
|
Cash Flow Data: |
|
|
|
|
|
|
|
|
|
|
|
|
|
|
|
|
|
|
|
|
Net cash provided by (used in) operating activities |
| $ | (7,140 | ) |
| $ | (20,392 | ) |
| $ | (39,385 | ) |
| $ | 14,568 |
|
| $ | 10,694 |
|
Net cash provided by (used in) investing activities |
|
| (12,771 | ) |
|
| 82,718 |
|
|
| (1,135 | ) |
|
| 2,698 |
|
|
| (6,007 | ) |
Net cash used in financing activities |
|
| (843 | ) |
|
| (852 | ) |
|
| (1,664 | ) |
|
| (927 | ) |
|
| (5,944 | ) |
Operating Data: |
|
|
|
|
|
|
|
|
|
|
|
|
|
|
|
|
|
|
|
|
Labor hours worked for the year ended December 31, (1) |
|
| 2,376 |
|
|
| 1,947 |
|
|
| 1,926 |
|
|
| 2,784 |
|
|
| 2,655 |
|
Backlog at December 31, (2) |
|
|
|
|
|
|
|
|
|
|
|
|
|
|
|
|
|
|
|
|
Labor hours |
|
| 3,137 |
|
|
| 2,224 |
|
|
| 1,544 |
|
|
| 1,265 |
|
|
| 1,914 |
|
Dollars |
| $ | 437,326 |
|
| $ | 356,460 |
|
| $ | 222,617 |
|
| $ | 132,972 |
|
| $ | 232,411 |
|
|
|
|
|
Item 7. Management’s Discussion and Analysis of Financial Condition and Results of Operations
The following “Management’s“Management’s Discussion and Analysis of Financial Condition and Results of Operations” is provided to assist readers in understanding our financial performance during the periods presented and significant trends that may impact our future performance. The results of operations reported and summarized below are not necessarily indicative of future operating results (refer to “Cautionary Statement on Forward-Looking Information” for further discussion). This discussion should be read in conjunction with our Financial Statements and the related notes thereto.
Overview
References to “Notes” relate to the Notes to our Financial Statements in Item 8. Certain terms are defined in the “Glossary of Terms” beginning on page ii.
Overview
We are a leading fabricator of complex steel structures and modules and marine vessels, and a provider of specialty services, including project management, hookup, commissioning, repair, maintenance, andscaffolding, coatings, welding enclosures, civil construction services.and staffing services to the industrial and energy sectors. Our customers include United States ("U.S.") and, to a lesser extent, international energy producers; refining, petrochemical, LNG, industrial and power operators; and marine operators; EPC companies; and certain agencies of the U.S. Government.
companies. We currently operate and manage our business through three operating divisions ("Fabrication"(“Services”, "Shipyard"“Fabrication” and "Services"“Shipyard”) and one non-operating division ("Corporate"(“Corporate”), which represent our reportable segments. During the first quarter 2019, our former EPC Division was operationally combined with our Fabrication Division, and accordingly, the segment results for the EPC Division for 2018 and 2017 were combined with the Fabrication Division to conform to the presentation of our reportable segments for 2019. Our corporate headquarters is located in Houston,The Woodlands, Texas withand our primary operating facilities for all our operating divisionsare located in Houma, Louisiana (“Houma Facilities”). See “Description of Operations” in Item 1 and additional facilitiesNote 11 for discussion of our realigned reportable segments.
On April 19, 2021, we sold our Shipyard Division locatedoperating assets and certain construction contracts (“Shipyard Transaction”) and intend to wind down our remaining Shipyard Division operations (which excludes the projects that are subject to our MPSV Litigation) by the second quarter 2023 (previously the first quarter 2023, but delayed and subject to the potential schedule impacts discussed in JenningsNote 2). We determined that the Shipyard Division operations associated with the Shipyard Transaction and Lake Charles, Louisiana.certain previously closed Shipyard Division facilities were discontinued operations in 2021. Accordingly, the financial information for 2021 reflects discontinued operations presentation. See Note 10 of our Financial Statements in Item 83 for further discussion of the Shipyard Transaction and our realigned operating divisions for 2019discontinued operations and see below for discussion of anticipated changes to our operating divisions for 2020. See Note 3 of our Financial Statements in Item 8 and below9 for discussion of our anticipated closureMPSV Litigation.
On December 1, 2021, we acquired (“DSS Acquisition”) the services and industrial staffing businesses (“DSS Business”) of Dynamic Industries, Inc. (“Dynamic”). The operating results of the Jennings Yard.DSS Business are included within our Services Division. See Note 4 for further discussion of the DSS Acquisition.
Beginning in late 2014, a decline inImpacts of Oil and Gas Price Volatility and Macroeconomic Conditions on Operations
Since 2008, the prices of oil and gas have experienced significant volatility, including depressed prices led to a significant and sustained reductionover extended periods, resulting in reductions in capital spending and drilling activities from our traditional offshore oil and gas customer base. Consequently, our operating results and cash flows were negatively impacted as we experienced reductions in revenue, lower margins due to competitive pricing and a significant underutilizationunder-utilization of our operating facilities and resources. Beginning in 2020, the global coronavirus pandemic (“COVID-19”) added another layer of pressure and uncertainty on oil and gas prices (with oil prices reaching a twenty-year low and gas prices reaching a four-year low), which further negatively impacted certain of our Fabricationend markets during 2021 and Shipyard Divisions. the first quarter 2022. This volatility in oil and gas prices has been compounded by Russia’s invasion of Ukraine in February 2022 (and the related European energy crisis), and the U.S. and other countries actions in response (with oil prices reaching an eight-year high and gas prices reaching a fourteen-year high), which has and may continue to positively impact certain of our end markets; however, the duration and broader consequences of this conflict continue to be difficult to predict.
In recent years weaddition, global economic factors that are beyond our control, have also experienced lossesand could continue to impact our operations, including, but are not limited to, supply chain disruptions (including global shipping and logistics challenges that began in 2020), inflationary pressures, economic slowdowns and recessions, natural disasters, public health crises (such as COVID-19), and geopolitical conflicts (such as the conflict in Ukraine).
The ultimate business and financial impacts of oil and gas price volatility and macroeconomic conditions on certain projects, primarilyour business and results of operations continues to be uncertain, but the impacts have included, or may continue to include, among other things, reduced bidding activity; suspension or termination of backlog; deterioration of customer financial condition; and unanticipated project costs and schedule delays due to supply chain disruptions, labor and material price increases, lower labor productivity, increased employee and contractor absenteeism and turnover, craft labor hiring challenges, increased safety incidents, lack of performance by subcontractors and suppliers, and contract disputes. We continue to monitor the impacts of oil and gas price volatility and macroeconomic conditions on our operations, and our estimates in future periods will be revised for any events and changes in circumstances arising after the date of this Report. See Note 1 and “Risk Factors” in Item 1A for further discussion of the impacts of oil and gas price volatility and macroeconomic conditions and Note 2 for further discussion of the impacts of the aforementioned on our Fabricationprojects.
23
Other Impacts to Operations
Hurricane Ida – During 2021, our operations were impacted by Hurricane Ida, which made landfall near Houma, Louisiana as a high-end Category 4 hurricane, with high winds, heavy rains and Shipyard Divisions,storm surge causing significant damage and power outages throughout the region, including project charges of $17.2 million during 2019.damage to our buildings and equipment at our Houma Facilities. See Note 2 for further discussion of the impacts of Hurricane Ida.
Ferry Projects – During 2022 and 2021, we experienced construction challenges and cost increases on our Financial Statements in Item 8seventy-vehicle ferry project and “Results of Operations” belowour remaining forty-vehicle ferry project. See Note 2 for further discussion of our project chargesimpacts.
Initiatives to Improve Operating Results and losses on projects. Given the aforementionedGenerate Stable, Profitable Growth
During 2020, we outlined a strategy to address our operational, market and economic challenges and project charges, we implementedposition the Company to generate stable, profitable growth. Underpinning the first phase of our strategic transformation was a strategy focusedfocus on the following initiatives:
ImproveMitigate the impacts of COVID-19 on our operations and maintain our liquidity through cost reduction efforts and the sale of underutilized assets;
Reduce our reliance on the fabrication of structuresrisk profile;
|
|
|
|
|
|
|
|
Improve our competitiveness and project execution by enhancing our proposal, estimatingexecution; and operations resources, processes and procedures; and
Review alternative strategies for the Company.
Summarized below is our progress and current status with respect to the aforementioned initiatives.
Efforts to preserve and improve our liquidity – We continue to take actions to preserve and improve our liquidity. At December 31, 2019, our cash and short-term investments totaled $69.6 million, and our total available liquidity, including our Credit Agreement, totaled $99.4 million. Our liquidity reflects our cost reduction initiatives (including reducing the compensation of our directors and executive officers), the sale of underutilized assets and facilities, and an improved overall cash flow position on our projects in backlog. In addition to our cash and short-term investments, at December 31, 2019, our assets held for sale totaled $9.0 million, and in February 2020, we reached a $10.0 million settlement related to disputed change orders for a completed project and received payment from the customer in February 2020. See Note 3 of our Financial Statements in Item 8 for further discussion of our assets held for sale and recent sales of underutilized assets and facilities and Note 12 for further discussion of our change order settlement.
Efforts to reduceReduce our reliance on the offshore oil and gas construction sector – We are pursuing several initiatives to reduce our reliance on the fabrication of structures and marine vessels associated with the offshore oil and gas sector.
Fabrication of onshore modules, piping systems and structures - We continue to focus our business development efforts on the fabrication ofFabricating modules, piping systems and other structures for onshore refining, petrochemical, LNG and industrial fabrication facilities. We have experienced success with several smaller project opportunities,facilities in our core Gulf Coast region, and our volume of bidding activity for onshore modules, piping systems and structures remains high; however, our pursuit of large project opportunities has been negatively affected by the competitive market environment and the timing and delay of certain opportunities. We continue to believe that our strategic location in Houma, Louisiana and our successful fabrication and timely delivery of four large petrochemical modules in 2018, position us well to compete in the onshore fabrication market; however, we do not expect large project opportunities to be awarded by customers until late 2020 or early 2021. In the interim, we continue to strengthen our relationships with key customers and enhance our resources as discussed further below.
Fabrication of newbuild marine vessels for the government and other non-oil and gas related customers - We continue to pursue newbuild marine vessel opportunities for customers unrelated to the offshore oil and gas sector. At December 31, 2019, the vast majority of our backlog within our Shipyard Division was attributable to government and other customers unrelated to the offshore oil and gas sector, including the construction of three research vessels and three towing, salvage and rescue ships, with customer options for five additional vessels. See Note 2 of our Financial Statements in Item 8 for discussion of a construction delay associated with our three research vessel projects.
Fabrication of offshore wind foundations, secondary steel components and support structures -We continue to believe that future requirements to provide electricity from renewable and green sources will result in growth of offshore wind projects. Furthermore, we believe that we possess the expertise to fabricateFabricating foundations, secondary steel components and support structures for offshore wind developments.
With the significant progress achieved on these objectives, during 2021, we shifted our focus to the next phase of our strategic transformation, which is focused on generating stable, profitable growth. Underpinning this emerging market. Thisstrategy is demonstrateda focus on the following initiatives:
Progress on our Strategic Transformation Initiatives
Efforts to mitigate the impacts of COVID-19 on our operations and workforce – We continue to take actions to mitigate the impacts of COVID-19 on our operations and maintain a safe work environment for our workforce, including maintaining protocols for handling employees who have tested positive for COVID-19 or have come in contact with individuals that have tested positive for COVID-19. In addition, we have protocols for employees to return to work that test positive for COVID-19, including requiring a negative COVID-19 antigen test prior to returning to work.
Efforts to reduce our risk profile – The completion of the Shipyard Transaction improved our risk profile by removing potential future risks associated with the Divested Shipyard Contracts that represented approximately 90% of our fabricationbacklog with durations that extended through 2024. We are completing construction of the Active Retained Shipyard Contracts within our Houma Facilities and are winding down our Shipyard Division operations, which is anticipated to occur by the second quarter 2023 (subject to the potential schedule impacts further discussed in Note 2). The wind turbine foundationsdown of our Shipyard Division operations does not include our contracts for the first offshoreconstruction of the MPSVs that are subject to our MPSV Litigation. See Note 3 for further discussion of the Shipyard Transaction and our discontinued operations and Note 9 for further discussion of our MPSV Litigation.
24
Efforts to preserve and improve our liquidity – We continue to take actions to preserve and improve our liquidity, including cost reduction initiatives, monetization of under-utilized assets and facilities (including the sale of our Harvey Option in 2022 and certain assets held for sale in 2021) and an ongoing focus on project cash flow management. In addition, as a result of the Shipyard Transaction and anticipated wind project indown of the U.S. during 2015,Shipyard Division operations (which exclude the projects that are subject to our MPSV Litigation), our bonding, letters of credit and working capital requirements related to the fabricationDivested Shipyard Contracts and ongoing Shipyard Division operations have been significantly reduced. See Note 4 for further discussion of a meteorological towerour Harvey Option, Note 6 for further discussion of our outstanding bonds and platformletters of credit, Note 3 for an offshore wind project during 2018. While we believe we havefurther discussion of the capability to participate in this emerging market, we do not expect any meaningful opportunities until 2021.
Shipyard Transaction and our discontinued operations and Note 9 for further discussion of our MPSV Litigation.
Efforts to improve our resource utilization and centralize our key project resources – We are also improvinghave improved our resource utilization and centralizing ourcentralized key project resources through the rationalization and integration of our facilities and operations.
ClosureConsolidation of Jennings Yard -our fabrication activities – In the first quarter 2020,2022, we announcedrealigned our intent to close the Jennings Yard upon completionoperating divisions, which included combining all of our harbor tug projects, which is forecastfabrication activities within our Fabrication Division to occur during the third quarter 2020. The closure will consolidate our new build marine vessel construction activities in our Houma Yards, enabling us to maximize theimprove utilization of our resources by reducing our overhead costs, combine our management and supervision talent in a single location, and improve our project execution.operational efficiency. See Note 3 of our Financial Statements in Item 811 for further discussion of our anticipated closurerealigned reportable segments.
Combinationwind down of our FabricationShipyard Division and Services Division – Inoperations discussed further below. During the first quarter 2020,2022, we announcedentered into a sublease arrangement with a third-party for the Jennings Facility, which will recover our intent to combine our Fabrication Division and Services Division to form an integrated new division called Fabrication & Services. The integration will enable us to capitalize onlease costs for the best practices and experience offacility for the combined new division, maximize the utilizationduration of our resources, including reducinglease. Further, during the third quarter 2022, we terminated our overhead costs,lease for the Lake Charles Facility, which eliminated our future lease obligations for the facility.
Efforts to improve our competitiveness, and project execution and bidding discipline – In recent years weWe have encountered operational challenges as we repositioned the Company away from our traditional reliance on the fabrication of structurestaken, and marine vessels associated with the offshore oil and gas sector. Although our facilities are well-suitedcontinue to support multiple end-markets and the fabrication of a variety of structures, we embarked on this repositioning during a competitive market in which we bid work at low margins, including break-even, to successfully secure backlog to mitigate the under-utilization of our resources and gain traction in the new markets we were pursuing. As discussed below, we encountered challenges as we bid and executed new project awards, including difficulties associated with transitioning our workforce to the fabrication of new and varied structures. These workforce challenges were compounded by the need to replace much of our workforce in a competitive labor environment. The cumulative effect of these factors, among others specifically addressed in Note 2 of our Financial Statements in Item 8, was unanticipated changes in estimates on a majority of the projects in our backlog. We believe the experience gained during this transition period will prove to be an important foundation to our future success as it has provided key insights into the improvements necessary to achieve such success. To that end, we are takingtake, actions to improve our competitiveness and project execution by enhancing our proposal, estimating and operations resources, processes and procedures. SuchOur actions include strategic changes in certain management and functional leadership, the hiring of additional key personnel, the addition of functional expertise, project management training, development of a formal “lessons learned” program, and other measures designed to strengthen our personnel, processes and procedures. Further, we are taking a more disciplined approach to pursuing and bidding project opportunities, putting more rigor around our bid estimates to provide greater confidence that our estimates are achievable, increasing accountability and providing incentives for the execution of projects in line with our original estimates and subsequent forecasts, and incorporating recent lessons learnedprevious experience into the bidding and execution of future projects.
Review alternative strategies for Additionally, we are focused on managing the Companyrisks associated with long-term fixed price contracts given the unpredictability of labor availability and labor and material costs, with a priority on increasing the mix of T&M contracts in our backlog.
Efforts to expand our skilled workforce – On November 4, 2019,We are focused on ways to improve retention and enhance and add to our skilled, craft personnel, as we announcedbelieve a strong workforce will be a key differentiator in pursuing new project awards given the completionscarcity of our previously announced review of alternative strategies that beganavailable skilled labor. The DSS Acquisition in the secondfourth quarter 2019.2021 nearly doubled our skilled workforce and expanded our geographic footprint for skilled labor, which we believe will contribute to the retention and recruitment of personnel. We have successfully maintained our headcount levels and have opportunistically looked to shift our workforce to higher margin opportunities given the industry-wide labor constraints.
25
Efforts to diversify our offshore services customer base, increase our offshore services offerings and expand our services business to include onshore facilities along the Gulf Coast – We believe diversifying and expanding our services business will deliver a more stable revenue stream while providing underpinning work to recruit, develop and retain our craft professionals. The review was designedDSS Acquisition in the fourth quarter 2021 accelerated our progress in this initiative and provides a stronger platform to objectively evaluate alternative strategiescontinue such progress. Further, in the third quarter 2022, we made capital and other investments to expand our offshore services offering to include welding enclosures, which provides a safe environment for welding, cutting and burning without the Company, including possible merger or sale transactions, among other things. Based on this process,need to shut down operations. We are also pursuing opportunities to partner with original equipment manufacturers to provide critical services to our Board of Directors determined thatcustomers along the interests ofGulf Coast and strategic partnership opportunities with engineering companies to provide turnkey solutions.
Efforts to pursue opportunities in our shareholders were best served if the Company remains independent and the Board focuses on executing our existing business plan, which includes the efforts referenced above, among other things.
Operating Outlook
traditional offshore fabrication markets – We continue to respondfabricate structures associated with our traditional offshore markets, including subsea and associated structures. During the third quarter 2022, we were awarded a large contract for the fabrication of jacket foundations for an offshore project.
Efforts to reduce our reliance on the competitive environment withinoffshore oil and gas construction sector, pursue new growth end markets and increase our industryT&M versus fixed price revenue mix – While we continue to pursue opportunities in our traditional offshore markets, we are pursuing initiatives to grow our business and activelydiversify our revenue mix.
26
Operating Outlook
Our focus remains on securing profitable new project awards and backlog in the near-term and generating operating income and cash flows, inwhile ensuring the longer-term. However,safety and well-being of our workforce. Our success, including achieving the aforementioned initiatives, will be determined by, among other things:
Our ability to hire, develop, motivate and retain key personnel and craft labor to execute our projects in light of industry-wide labor constraints, and maintain our expected project margins if such constraints result in labor cost increases that cannot be recovered from our customers;
The leveloutcome of new build marine vessel activity within,our MPSV Litigation, for which an unfavorable outcome could have a material adverse effect on our financial condition, results of operations and outsideliquidity. See “Legal Proceedings” in Part I, Item 3 and Note 9 for further discussion of our MPSV Litigation;
Our ability to secure new project awards through competitive bidding and/or alliance and partnering arrangements;
Our ability to execute projects within our cost estimates and successfully manage them through completion;
Our ability to hire and retain key personnel and craft labor to execute our projects;
The successful integration of our Fabrication Division and Services Division and closure of our Jennings Yard; and
Our ability to resolve our dispute with a customer related to the construction of two MPSVs (see Note 8 of our Financial Statements in Item 8 and “Legal Proceedings” in Item 3 for further discussion of the dispute).
In addition, although we have recently experienced improved utilization of our facilities, in the near-term: (i) the utilizationwind down of our Shipyard Division will be impacted by delays in construction activitiesoperations;
In addition, the closure of our Jennings Yard, and (ii) thenear-term utilization of our newly integrated Fabrication & Services Division will be impacted by the delay in timing of new project awards.awards and their execution, and the suspension of our offshore jackets project, and our operations may continue to be impacted by inefficiencies and disruptions associated with employee turnover, craft labor hiring challenges, engineering delays, and supplier and subcontractor disruptions. Our near-term results may also be impactedadversely affected by (i) costs associated with the retention of certain personnel that may be temporarily under-utilized as we evaluate our resource requirements to support our future operations, (ii) investments in key personnel and process improvement efforts to support our aforementioned initiatives. In addition, our gross profit for both divisions will be impacted in the near-term as certain projects within our backlog are in a loss positioninitiatives, and a majority(iii) higher costs and availability of our remaining backlog is at, or near, break-even gross profit. Specifically,craft labor due to previous new project awards bid at competitive pricing and the project charges in 2019, approximately 15% of our backlog is in a loss position and 70% of our backlog is at, or near, break-even (including our three research vessel projects and three towing, salvage and rescue ship projects). Accordingly, this backlog will result in future revenue with no gross profit.industry labor constraints. See Note 21 for further discussion of our Financial Statements in Item 8the impacts of oil and gas price volatility and macroeconomic conditions, “Results of Operations” below and Note 2 for further discussion of our project chargesimpacts, and losses on projects.
“New Project Awards and BacklogBacklog” below and Note 2 for further discussion of the project suspension.
27
New Project Awards and Backlog
New project awards represent expected revenue values of commitments received during a given period, including scope growth on existing commitments. A commitment represents authorization from our customer to begin work or purchase materials pursuant to a written agreement, letter of intent or other form of authorization. Backlog represents the unrecognized revenue for our new project awards and may differ fromat December 31, 2022, was consistent with the value of futureremaining performance obligations for our contracts required to be disclosed under Topic 606 and presented in Note 2 of our Financial Statements in Item 8.2. In general, a performance obligation is a contractual obligation to construct and/or transfer a distinct good or service to a customer. The transaction price of a contract is allocated to each distinct performance obligation and recognized as revenue when, or as, the performance obligation is satisfied. Backlog includes our performance obligations at December 31, 2019, plus signed contracts that are temporarily suspended or under protest that may not meet the criteria to be reported as future performance obligations under Topic 606 but represent future work that we believe will be performed. We believe that backlog, a non-GAAP financial measure, provides useful information to investors.investors as it represents work that we are obligated to perform under our current contracts. New project awards and backlog may vary significantly each reporting period based on the timing of our major new contract commitments.
Projects in our backlog are generally subject to delay, suspension, termination, or an increase or decrease in scope at the option of the customer; however, the customer is required to pay us for work performed and materials purchased through the date of termination, suspension, or decrease in scope. Depending on the size of the project, the delay, suspension, termination or increase or reductiondecrease in scope of any one contract could significantly impact our backlog and change the expected amount and timing of revenue recognized.
A reconciliation of our remaining performance obligations under Topic 606 (the most comparable GAAP measure New project awards by operating segment for 2022 and 2021, are as presented in Note 2 of our Financial Statements in Item 8) to our reported backlog is provided belowfollows (in thousands).:
|
| December 31, 2019 |
| |||||||||||||
|
| Fabrication |
|
| Shipyard |
|
| Services |
|
| Consolidated |
| ||||
Remaining performance obligations under Topic 606 |
| $ | 50,145 |
|
| $ | 352,081 |
|
| $ | 13,212 |
|
| $ | 415,438 |
|
Contracts under purported termination (1) |
|
| — |
|
|
| 21,888 |
|
|
| — |
|
|
| 21,888 |
|
Total Backlog (2) |
| $ | 50,145 |
|
| $ | 373,969 |
|
| $ | 13,212 |
|
| $ | 437,326 |
|
|
| Years Ended December 31, |
| |||||
|
| 2022 |
|
| 2021 |
| ||
Services |
| $ | 85,846 |
|
| $ | 38,230 |
|
Fabrication |
|
| 154,239 |
|
|
| 29,581 |
|
Shipyard |
|
| 834 |
|
|
| - |
|
Eliminations |
|
| (672 | ) |
|
| (1,323 | ) |
Total |
| $ | 240,247 |
|
| $ | 66,488 |
|
Backlog by Divisionoperating segment at December 31, 20192022 and 2018,2021, is as follows (in thousands):
|
| December 31, |
| |||||||||||||
|
| 2022 |
|
| 2021 |
| ||||||||||
|
| Amount |
|
| Labor hours |
|
| Amount |
|
| Labor hours |
| ||||
Services |
| $ | 1,322 |
|
|
| 20 |
|
| $ | 2,499 |
|
|
| 32 |
|
Fabrication |
|
| 110,287 |
|
|
| 613 |
|
|
| 4,348 |
|
|
| 41 |
|
Shipyard |
|
| 3,272 |
|
|
| 22 |
|
|
| 10,223 |
|
|
| 106 |
|
Total (1), (2) |
| $ | 114,881 |
|
|
| 655 |
|
| $ | 17,070 |
|
|
| 179 |
|
|
| December 31, |
| |||||||||||||
|
| 2019 |
|
| 2018 |
| ||||||||||
Division |
| Amount |
|
| Labor hours |
|
| Amount |
|
| Labor hours |
| ||||
Fabrication |
| $ | 50,145 |
|
|
| 413 |
|
| $ | 63,883 |
|
|
| 369 |
|
Shipyard |
|
| 373,969 |
|
|
| 2,507 |
|
|
| 281,531 |
|
|
| 1,684 |
|
Services |
|
| 13,212 |
|
|
| 217 |
|
|
| 11,046 |
|
|
| 171 |
|
Total Backlog (2) |
| $ | 437,326 |
|
|
| 3,137 |
|
| $ | 356,460 |
|
|
| 2,224 |
|
Backlog(1)
Year (3) |
| Total |
|
| Percentage |
| ||
2020 |
| $ | 211,310 |
|
|
| 48.3 | % |
2021 |
|
| 130,140 |
|
|
| 29.8 | % |
Thereafter |
|
| 95,876 |
|
|
| 21.9 | % |
Total Backlog |
| $ | 437,326 |
|
|
| 100.0 | % |
|
|
|
|
|
|
|
Fabrication of jacket foundations for an offshore project for our Fabrication Division that is being performed primarily on a T&M and cost-reimbursable basis. In February 2023, we received direction from |
|
|
|
|
|
|
|
|
|
|
|
|
|
|
|
|
|
|
|
|
Our contracts for the construction of three towing, salvage and rescue ships contain options which grant our customer (the U.S. Navy)to suspend all activities on the right, if exercised, forproject. No duration of the constructionsuspension or timing of five additional vessels at contracted prices. We do not include options in our backlog. If all options under our current contracts were exercised by such customer, our backlog would increase by approximately $333.0 million. We have not received any commitments from such customer relatedpotential recommencement of the project was provided. Prior to the exercisesuspension, we estimated completion of these options, and we can provide no assurances that any optionsthe structures in the first quarter 2024; however, such estimate will be exercised. We believe disclosing these options provides investors with useful information to evaluate additional potential work that we wouldimpacted by the timing of recommencement of project activities and the start of fabrication, if at all, the ultimate scope of the project, and the duration of the project, which may be contractually obligated to perform under our current contracts as well asimpacted by, among other things, the potential significancestatus of these options, if exercised.engineering and size of the structures, timing and availability of materials, and availability and productivity of labor.
28
Critical Accounting Policies
Our Financial Statements are prepared in accordance with generally accepted accounting principles in the U.S. ("GAAP"(“GAAP”) which require us to make estimates and judgments that affect the reported amounts of assets, liabilities, revenue and expenses and related disclosure of contingent assets and liabilities. We continually evaluate our estimates and judgments based on historical experience and various other assumptions that we believe to be reasonable under the circumstances. We also discuss the development and selection of our critical accounting policies with the Audit Committee of our Board of Directors. We believe the following critical accounting policies affect our more significant judgments and estimates used in the preparation of our Financial Statements.
Revenue Recognition
General – Our revenue is derived from customer contracts and agreements that are awarded on a competitively bid and negotiated basis using a range of contracting options, including fixed-price, unit-rate, T&M and T&M.cost-reimbursable, or a combination thereof. Our contracts primarily relate to the fabrication and construction of steel structures and modules, and marine vessels, and project management services and othercertain service arrangements. We recognize revenue forfrom our contracts in accordance with Accounting Standards Update ("ASU"(“ASU”) 2014-09, Topic 606 “Revenue“Revenue from Contracts with Customers” (" (“Topic 606"606”),.
Topic 606 requires entities to recognize revenue in a way that depicts the transfer of promised goods or services to customers in an amount that reflects the consideration to which was adopted by us on January 1, 2018, and supersedes previous revenue recognition guidance, including industry-specific guidance. Accordingly, the reported resultsentity expects to be entitled in exchange for 2019 and 2018 reflect the applicationthose goods or services. Additionally, provisions of Topic 606 guidance, whilespecify which goods and services are distinct and represent separate performance obligations (representing the comparable resultsunit of account in Topic 606) within a contract and which goods and services (which could include multiple contracts or agreements) should be aggregated. In general, a performance obligation is a contractual obligation to construct and/or transfer a distinct good or service to a customer. The transaction price of a contract is allocated to each distinct performance obligation and recognized as revenue when, or as, the performance obligation is satisfied. Revenue for 2017 were prepared under previous revenueperformance obligations satisfied over time are recognized as the work progresses. Revenue for performance obligations that do not meet the criteria for over time recognition guidance.are recognized at a point-in-time when a performance obligation is complete and a customer has obtained control of a promised asset.
Fixed-Price and Unit-RateLong-term Contracts - Satisfied Over Time –Revenue for our fixed-price and unit-ratelong-term contracts is recognized using the percentage-of-completionPOC method (an input method), based on contract costs incurred to date compared to total estimated contract costs.costs (an input method). Fixed-price contracts, or contracts with a more significant fixed-price component, generally provide us with greater control over project schedule and the timing of when work is performed and costs are incurred, and accordingly, when revenue is recognized. Unit-rate, T&M and cost-reimbursable contracts generally have more variability in the scope of work and provide our customers with greater influence over the timing of when we perform our work, and accordingly, such contracts often result in less predictability with respect to the timing of when revenue is recognized. Contract costs include direct costs, such as materials and labor, and indirect costs attributable to contract activity. Material costs that are significant to a contract and do not reflect an accurate measure of project completion are excluded from the determination of our contract progress. Revenue for such materials is only recognized to the extent of costs incurred. Prior to our adoption of Topic 606, revenue for our fixed-price and unit-rate contracts was recognized using the percentage-of-completion method, based on the percentage of direct labor hours incurred to date compared to total estimated direct labor hours, and revenue for materials was recognized only to the extent of costs incurred. Revenue and gross profit or loss for contracts accounted for using the percentage-of-completionPOC method can be significantly affected by changes in estimated cost to complete such contracts. Significant estimates impacting the cost to complete a contract include: forecast costs of engineering, materials, components, equipment and subcontracts; forecast costs of labor and subcontracts; labor productivity; schedule durations, including subcontractor and supplier progress; contract disputes, including claimsclaims; achievement of contractual performance requirements,requirements; and contingency, among others. Although our customers retain the right and ability to change, modify or discontinue further work at any stage of a contract, in the event our customers discontinue work, they are required to compensate us for the work performed to date. The cumulative impact of revisions in total cost estimates during the progress of work is reflected in the period in which these changes become known, including, to the extent required, the reversal of profit recognized in prior periods and the recognition of losses expected to be incurred on contracts. Due to the various estimates inherent in our contract accounting, actual results could differ from those estimates, which could result in material changes to our Financial Statements and related disclosures. See Note 2 of our Financial Statements in Item 8 for discussion of projects with significant changes in estimated margins during 2019, 2018
Short-term Contracts and 2017, including projects inContracts Satisfied at a significant loss position at December 31, 2019.
T&M Contracts -Point In Time – Revenue for our T&Mshort-term contracts (which includes revenue associated with our master services arrangements) and contracts that do not satisfy the criteria for revenue recognition over time is recognized at contracted rates when the work is performed or when control of the asset is transferred, the related costs are incurred and collection is reasonably assured. Our T&M contracts provide for labor and materials to be billed at rates specified within the contract. The consideration from the customer directly corresponds to the value of our performance completed at the time of invoicing. Our current revenue recognition method for T&M contracts is consistent with the method used prior to adoption of Topic 606.
Variable Consideration - – Revenue and gross profit or loss for contracts can be significantly affected by variable consideration, which can be in the form of unapproved change orders, claims (including amounts arising from disputes with customers), incentives and liquidated damages that may not be resolved until the later stages of the contract or after the contract has been completed and delivery occurs.completed. Variable consideration can also include revenue associated with work performed on a unit-rate, T&M or cost-reimbursable basis that is recognized using the POC method. We estimate variable consideration based on the amount we expect to be entitled and include estimated amounts in transaction price to the extent it is probable that a significant future reversal of cumulative revenue recognized will not occur or when we conclude that any significant uncertainty associated with the variable consideration is resolved.
29
See Note 1 and Note 2 of our Financial Statements in Item 8 for further discussion of our adoption of Topic 606 and our revenue recognition policy.policy and Note 2 for further discussion of projects with significant changes in estimated margins during 2022 and 2021 and discussion of unapproved change orders, claims, incentives and liquidated damages for our projects.
Acquisition-Related Purchase Price Allocation
The Purchase Price associated with the DSS Acquisition was allocated to the major categories of assets and liabilities acquired based upon estimates of their fair values at the Acquisition Date, which were based, in part, upon outside appraisals for certain assets, including property and equipment and specifically-identifiable intangible assets. The excess of the Purchase Price over the estimated fair value of the net tangible and identifiable intangible assets acquired was recorded as goodwill. See Note 4 for further discussion of the DSS Acquisition.
Long-Lived Assets
Goodwill –Goodwill (associated with the DSS Acquisition) is not amortized, but instead is reviewed for impairment at least annually at a reporting unit level, absent any indicators of impairment or when other actions require an impairment assessment (such as a change in reporting units). We depreciateperform our annual impairment assessment during the fourth quarter of each year based upon balances as of October 1. In evaluating goodwill for impairment, we have the option to first assess qualitative factors to determine whether it is more likely than not that the fair value of our reporting unit is greater than its carrying value. If we determine that it is more likely than not that the carrying value of the reporting unit is greater than its fair value, we perform a quantitative impairment test by calculating the fair value of the reporting unit and comparing it to the carrying value of the reporting unit, and we recognize an impairment charge to the extent its carrying value exceeds its fair value. To determine the fair value of our reporting unit and test for impairment, we utilize an income approach (discounted cash flow method) as we believe this is the most direct approach to incorporate the specific economic attributes and risk profile of our reporting unit into our valuation model. If, based on future assessments, our goodwill is deemed to be impaired, the impairment would result in a charge to our operating results in the period of impairment. See Note 4 for further discussion of the DSS Acquisition and related goodwill impairment assessment.
Other Long-Lived Assets –Our property, plant and equipment, on a straight-line basis over estimated useful lives ranging from three to 25 years, absent any indicators of impairment. We review long-lived assets, which include property plant and equipment and our lease assets included(included within other noncurrent assets) and finite-lived intangible assets (associated with the DSS Acquisition) are reviewed for impairment when events or changes in circumstances indicate that the carrying amount may not be recoverable. If a recoverability assessment is required, we compare the estimated future undiscounted cash flow associated with the assets or asset groups are compared to their respective carrying amounts to determine if an impairment exists. An impairment loss is measured by comparing the fair value of the asset or asset group to its carrying amount and recording the excess of the carrying amount of the asset or asset group over its fair value asto determine if an impairment charge.exists. An asset group constitutes the minimum level for which identifiable cash flows are principally independent of the cash flows of other assets or asset groups. An impairment loss is measured by comparing the fair value of the asset or asset group to its carrying amount and the excess of the carrying amount of the asset or asset group over its fair value is recorded as an impairment charge. Fair value is determined based on discounted cash flows, appraised values or third-party indications of value, as appropriate. We had no indicators of impairment during 2022. See Note 3 of our Financial Statements in Item 82 for discussion of our long-lived asset impairments associated with Hurricane Ida, Note 3 for discussion of our long-lived assets.
Assets Held for Sale
Assets held for sale are measured at the lower of their carrying amount or fair value less cost to sell. Seeasset impairments within discontinued operations, Note 3 of our Financial Statements in Item 84 for discussion of impairmentsthe DSS Acquisition and related long-lived assets impairment assessment, and Note 5 for further discussion of our assets held for sale.corporate office lease asset impairment.
Income Taxes
Income taxes have been provided for using the liability method. Deferred income taxes reflect the net tax effects of temporary differences between the carrying amounts of assets and liabilities for financial reporting purposes and the amounts used for income tax purposes using enacted rates expected to be in effect during the year in which the differences are expected to reverse. Due to changingstate income tax laws significantrelated to the apportionment of revenue for our projects, judgment is required to estimate the effective tax rate expected to apply to tax differences that are expected to reverse in the future.
A valuation allowance is provided to reserve for deferred tax assets ("(“DTA(s)"”) if, based upon the available evidence, it is more likely than not that some or all of the DTAs will not be realized. The realization of our DTAs depends on our ability to generate sufficient taxable income of the appropriate character and in the appropriate jurisdictions.
Reserves for uncertain tax positions are recognized when we consider it more likely than not that additional tax will be due in excess of amounts reflected in our income tax returns, irrespective of whether or not we have received tax assessments. Interest and penalties on uncertain tax positions are recorded within income tax expense. Tax returns subject to examination by the U.S. Internal Revenue Service are open for years 2015 and after. At December 31, 2019 and 2018, we had no material reserves for uncertain tax positions. See Note 6 of our Financial Statements in Item 87 for further discussion of our income taxes, DTAs, and valuation allowance.
30
Stock-Based Compensation
Awards under our stock-based compensation plans are calculated using a fair value-based measurement method. We use the straight-line methodand graded vesting methods to recognize share-based compensation expense over the requisite service period of the award. We recognize the excess tax benefit or tax deficiency resulting from the difference between the deduction we receive for tax purposes and the stock-based compensation expense we recognize for financial reporting purposes created when common stock vests, as an income tax benefit or expense in our Statement of Operations. See Note 7 of our Financial Statements in Item 8 for further discussion of our stock-based and other compensation plans.
Insurance
We maintain insurance coverage for various aspects of our business and operations. However, we may be exposed to future losses throughdue to coverage limitations and our use of deductibles and self-insured retentions for our exposures related to third partyproperty and equipment damage, builders’ risk, third-party liability, and workers' compensation.workers’ compensation and USL&H claims. We expect liabilities in excess of any deductibles and self-insured retentions to be covered by insurance.insurance; however, because we do not have an offset right, we have recorded a liability for estimated amounts in excess of our deductibles, and have recorded a corresponding asset related to estimated insurance recoveries, on our Balance Sheet. To the extent we are self-insured, reserves are recorded based upon our estimates, with input from legal and insurance advisors. Changes in assumptions, as well as changes in actual experience, could cause these estimates to change. See Note 2 for discussion of insurance deductibles incurred during 2022 and 2021 associated with damage caused by Hurricanes Ida.
Fair Value Measurements
Our fair value determinations for financial assets and liabilities are based on the particular facts and circumstances. Financial instruments are required to be categorized within a valuation hierarchy based upon the lowest level of input that is significant to the fair value measurement. The three levels of the valuation hierarchy are as follows:
Level 1 -– inputs are based upon quoted prices for identical instruments traded in active markets.
Level 2 -– inputs are based upon quoted prices for similar instruments in active markets and model-based valuation techniques for which all significant assumptions are observable in the market.
Level 3 -– inputs are based upon model-based valuation techniques for which significant assumptions are generally not observable in the market and typically reflect estimates and assumptions that we believe market participants would use in pricing the asset or liability. These include discounted cash flow models and similar valuation techniques.
See Note 1 in Item 8 for further discussion of our fair value measurements.
31
Results of Operations
– Comparison of 20192022 and 2018 2021 (in thousands, except for percentages):
InWe determined the comparative tables below, percentage changes that are not considered meaningful (generally whenShipyard Division operations associated with the 2018 period amount is immaterial or whenShipyard Transaction, and associated with certain previously closed Shipyard Division facilities, to be discontinued operations in 2021. Accordingly, such consolidated and segment operating results for 2021 have been classified as discontinued operations. We had no material operating results of discontinued operations for 2022. See Note 3 for further discussion of the percentage change is significantly greater than 100%) are shown below as "nm" (not meaningful).Shipyard Transaction and our discontinued operations.
Consolidated
|
| Years Ended December 31, |
|
| Favorable |
| ||||||
|
| 2022 |
|
| 2021 |
|
| Change |
| |||
New project awards |
| $ | 240,247 |
|
| $ | 66,488 |
|
| $ | 173,759 |
|
|
|
|
|
|
|
|
|
|
| |||
Revenue |
| $ | 142,320 |
|
| $ | 93,452 |
|
| $ | 48,868 |
|
Cost of revenue |
|
| 134,425 |
|
|
| 91,788 |
|
|
| (42,637 | ) |
Gross profit |
|
| 7,895 |
|
|
| 1,664 |
|
|
| 6,231 |
|
Gross profit percentage |
|
| 5.5 | % |
|
| 1.8 | % |
|
|
| |
General and administrative expense |
|
| 18,214 |
|
|
| 11,848 |
|
|
| (6,366 | ) |
Other (income) expense, net |
|
| (6,904 | ) |
|
| 3,300 |
|
|
| 10,204 |
|
Operating loss |
|
| (3,415 | ) |
|
| (13,484 | ) |
|
| 10,069 |
|
Gain on extinguishment of debt |
|
| — |
|
|
| 9,061 |
|
|
| (9,061 | ) |
Interest (expense) income, net |
|
| 86 |
|
|
| (397 | ) |
|
| 483 |
|
Loss before income taxes |
|
| (3,329 | ) |
|
| (4,820 | ) |
|
| 1,491 |
|
Income tax (expense) benefit |
|
| (23 | ) |
|
| 24 |
|
|
| (47 | ) |
Loss from continuing operations |
|
| (3,352 | ) |
|
| (4,796 | ) |
|
| 1,444 |
|
Loss from discontinued operations, net of taxes |
|
| — |
|
|
| (17,372 | ) |
|
| 17,372 |
|
Net loss |
| $ | (3,352 | ) |
| $ | (22,168 | ) |
| $ | 18,816 |
|
Consolidated operating results for 2021 include the results of the DSS Business beginning on December 1, 2021, the Acquisition Date of the DSS Business. See Note 4 for further discussion of the DSS Acquisition.
New project awards – New project awards for 2022 and 2021 were $240.2 million and $66.5 million, respectively. New project awards for 2022 were primarily related to:
|
| Years Ended December 31, |
|
| Favorable (Unfavorable) Change |
| ||||||||||
|
| 2019 |
|
| 2018 |
|
| Amount |
|
| Percent |
| ||||
Revenue |
| $ | 303,308 |
|
| $ | 221,247 |
|
| $ | 82,061 |
|
|
| 37.1 | % |
Cost of revenue |
|
| 320,307 |
|
|
| 228,443 |
|
|
| (91,864 | ) |
|
| (40.2 | )% |
Gross loss |
|
| (16,999 | ) |
|
| (7,196 | ) |
|
| (9,803 | ) |
|
| (136.2 | )% |
Gross loss percentage |
|
| (5.6 | )% |
|
| (3.3 | )% |
|
|
|
|
|
|
|
|
General and administrative expense |
|
| 15,628 |
|
|
| 19,015 |
|
|
| 3,387 |
|
|
| 17.8 | % |
Impairments and (gain) loss on assets held for sale |
|
| 17,528 |
|
|
| (6,850 | ) |
|
| (24,378 | ) |
| nm |
| |
Other (income) expense, net |
|
| (134 | ) |
|
| 304 |
|
|
| 438 |
|
| nm |
| |
Operating loss |
|
| (50,021 | ) |
|
| (19,665 | ) |
|
| (30,356 | ) |
|
| (154.4 | )% |
Interest (expense) income, net |
|
| 531 |
|
|
| (142 | ) |
|
| 673 |
|
|
| 473.9 | % |
Net loss before income taxes |
|
| (49,490 | ) |
|
| (19,807 | ) |
|
| (29,683 | ) |
|
| (149.9 | )% |
Income tax (expense) benefit |
|
| 96 |
|
|
| (571 | ) |
|
| 667 |
|
|
| 116.8 | % |
Net loss |
| $ | (49,394 | ) |
| $ | (20,378 | ) |
| $ | (29,016 | ) |
|
| (142.4 | )% |
New project awards for 2021 were primarily related to offshore services work for our Services Division and small-scale fabrication work for our Fabrication Division.
Revenue - – Revenue for 20192022 and 20182021 was $303.3$142.3 million and $221.2$93.5 million, respectively, representing an increase of 37.1%52.3%. The increase was primarily due to:
Higher revenue for our Services Division of $46.5 million, primarily attributable to:
Higher revenue for our Fabrication Division of $7.0 million, primarily attributable to:
Lower revenue for our Shipyard Division of $62.8$5.2 million, primarily due to progress on our research vessel projects and towing, salvage and rescue ship projects, offset partially by lowerattributable to:
Increased revenue32
Gross profit – Gross profit for 2022 and 2021 was $7.9 million (5.5% of revenue) and $1.7 million (1.8% of revenue), respectively. Gross profit for 2022 was primarily impacted by:
Decreased revenuefacilities and resources for our ServicesFabrication Division, of $6.5 million, primarily due to lower fabricated products and construction services revenue, offset partially by higher onshore maintenance revenue.
See Note 8 of our Financial Statements within Item 8 for further discussion of our MPSV dispute.
Gross loss - Gross loss for 2019 and 2018 was $17.0 million (5.6% of revenue) and $7.2 million (3.3% of revenue), respectively. The gross loss for 2019 was primarily due to:
Project charges of $8.4$2.0 million $7.2 million, and $1.6 million, within our Fabrication, Shipyard and Services Divisions, respectively;
The under recovery of overhead costs (primarily associated with the underutilization of our facilities within our Fabrication Division, and to a lesser extent withinfor our Shipyard Division);Division, and
Holding costs of $1.2$0.8 million related to the two MPSV vessels whichMPSVs that remain in our possession and are subject to dispute.
The increase in gross lossprofit for 2022 relative to the 2018 period2021 was primarily due to:
The aforementioned project charges of $17.2 million;
A lower margin mixHigher revenue for our ShipyardServices Division (including incremental revenue associated with the DSS Business) and Services Divisions (excluding the aforementioned project charges); offset partially by,
A higher margin mix relative to 2021 for our Services Division (excluding the DSS Business),
Higher revenue and increased recoveriesunder-recovery of overhead costs due to higher activity; and
The 2018 period including project charges of $2.4 million withinfor our Fabrication Division, and
See “Operating Segments” below and Note 2 of our Financial Statements in Item 8 for further discussion of our project charges and losses on projects.impacts.
General and administrative expense - – General and administrative expense for 20192022 and 20182021 was $15.6$18.2 million (5.2% of revenue) and $19.0$11.8 million, (8.6% of revenue), respectively, representing a decreasean increase of 17.8%53.7%. The decreaseincrease was primarily due to:
Lower incentive plan costs, board of director compensation costs, andHigher legal and advisory fees related to customer disputes and shareholder matters; offset partially by,
Higher professional fees and otherIncremental administrative costs associated with the evaluationDSS Business, including amortization of strategic alternativesintangible assets, for our Services Division,
The customer disputes relate primarily to the pursuit of claims against a customer for disputed change orders for a completed project,General and our MPSV projects which are subject to purported termination and for which construction has been suspended. Legaladministrative expense included legal and advisory fees related to such disputes totaled $1.4of $4.5 million and $1.7$0.9 million for 20192022 and 2018, respectively. See Note 12 of2021, respectively, associated with our Financial Statements in Item 8 for discussion of our settlement of the change order dispute.
Impairments and (gain) loss on assets held for sale – Impairments and (gain) loss on assets held for sale for 2019 and 2018 was a loss of $17.5 million and a gain of $6.9 million, respectively.
The loss for 2019 was primarily due to:
Impairments of $9.0 million for assets held for sale and assets removed from held for sale, offset partially by a gain of $0.4 million from the sale of assets held for sale within our Fabrication Division;
Impairments of $4.6 million for lease assets and fixed assets attributable to our Jennings YardMPSV Litigation, which are reflected within our Shipyard Division;
Impairments of $3.0 million for lease assets and fixed assets (primarily drydocks) attributable to our Lake Charles Yard within our Shipyard Division; and
Impairment of $0.3 million for an asset that was held for sale and sold within our Shipyard Division and an impairment of $0.3 million for inventory within our Services Division.
The gain for 2018 was primarily due to:
A gain of $3.9 million from the sale of our Texas South Yard and a gain of $4.1 million from the sale of our Texas North Yard within our Fabrication Division; and
A gain of $3.6 million from the settlement of an insurance claim related to Hurricane Harvey damage at our South Texas Properties incurred during 2017 within our Fabrication Division; offset partially by,
Impairments of $4.4 million and a loss of $0.3 million related to inventory and assets held for sale and/or sold within our Fabrication and Shipyard Divisions.
See "Overview" above and Note 3 of our Financial Statements in Item 89 for further discussion of our impairments.MPSV Litigation.
33
Other (income) expense, net - – Other (income) expense, net for 20192022 and 20182021 was income of $6.9 million and expense of $0.1 million and income of $0.3$3.3 million, respectively. Other (income) expense, net generally represents (recoveries)recoveries or provisions for bad debts, (gains)gains or losses associated with the sale or disposition of property and equipment, other than assets held for sale, and (income)income or expense associated with certain nonrecurring items. The expense for 2019 andOther income for 20182022 was primarily due to:
Other expense for 2021 was primarily due to:
See Note 2 for further discussion of the impacts of Hurricane Ida.
Gain from extinguishment of debt – Gain from extinguishment of debt for 2021 was $9.1 million and was related to the SBA’s forgiveness of $8.9 million of our PPP Loan, plus accrued interest. See “Liquidity and Capital Resources” below and Note 6 for further discussion of our PPP Loan forgiveness.
Interest (expense) income, net - – Interest (expense) income, net for 20192022 and 20182021 was income of $0.5$0.1 million and expense of $0.1$0.4 million, respectively. TheInterest (expense) income, net interest income for 2019 was primarily due toboth periods included the net impact of interest earned on our cash and short-term investment balances offset partially byand interest amortization associatedincurred on the unused portion of our LC Facility. The 2022 period also included interest incurred on our Insurance Finance Arrangement, and the 2021 period included interest incurred on our PPP Loan and the write-off of deferred financing costs in connection with an amendment to our long-term lease liability.LC Facility. The net interestincome for 2022 relative to expense for 20182021 was primarily due to borrowings underhigher interest earned on our Credit Agreement during 2018.cash and short-term investment balances for the 2022 period and the additional expense items for the 2021 period. See “Liquidity and Capital Resources” below and Note 6 for further discussion of our Insurance Finance Arrangement, LC Facility and PPP Loan.
Income tax (expense) benefit - – Income tax (expense) benefit for 20192022 and 2018 was a benefit of $0.1 million and expense of $0.6 million, respectively. The tax benefit for 2019 and expense for 2018 represent2021 represents state income taxes. No federal income tax benefit was recorded for our losses during 2019 or 2018for either period as a full valuation allowance was recorded against our net deferred tax assets generated during the periods.
34
Operating Segments
Services Division
|
| Years Ended December 31, |
|
| Favorable |
| ||||||
|
| 2022 |
|
| 2021 |
|
| Change |
| |||
New project awards |
| $ | 85,846 |
|
| $ | 38,230 |
|
| $ | 47,616 |
|
|
|
|
|
|
|
|
|
|
| |||
Revenue |
| $ | 87,022 |
|
| $ | 40,558 |
|
| $ | 46,464 |
|
Gross profit |
|
| 11,227 |
|
|
| 5,692 |
|
|
| 5,535 |
|
Gross profit percentage |
|
| 12.9 | % |
|
| 14.0 | % |
|
|
| |
General and administrative expense |
|
| 2,997 |
|
|
| 1,379 |
|
|
| (1,618 | ) |
Other (income) expense, net |
|
| 106 |
|
|
| 815 |
|
|
| 709 |
|
Operating income |
|
| 8,124 |
|
|
| 3,498 |
|
|
| 4,626 |
|
Operating results for our Services Division for 2021 include the results of the DSS Business beginning on December 1, 2021, the Acquisition Date of the DSS Business. See Note 6 of our Financial Statements in Item 84 for further discussion of our NOLs, deferred tax assetsthe DSS Acquisition.
New project awards – New project awards for 2022 and valuation allowance.
Operating Segments2021 were $85.8 million and $38.2 million, respectively, and were primarily related to offshore services work, with the increase due to incremental new project awards associated with the DSS Business and increased offshore services activity.
Fabrication Division
|
| Years Ended December 31, |
|
| Favorable (Unfavorable) Change |
| ||||||||||
|
| 2019 |
|
| 2018 |
|
| Amount |
|
| Percent |
| ||||
Revenue |
| $ | 70,052 |
|
| $ | 40,420 |
|
| $ | 29,632 |
|
|
| 73.3 | % |
Gross loss |
|
| (11,249 | ) |
|
| (7,840 | ) |
|
| (3,409 | ) |
|
| (43.5 | )% |
Gross loss percentage |
|
| (16.1 | )% |
|
| (19.4 | )% |
|
|
|
|
|
|
|
|
General and administrative expense |
|
| 2,353 |
|
|
| 4,951 |
|
|
| 2,598 |
|
|
| 52.5 | % |
Impairments and (gain) loss on assets held for sale |
|
| 8,651 |
|
|
| (7,896 | ) |
|
| (16,547 | ) |
|
| (209.6 | )% |
Other (income) expense, net |
|
| (152 | ) |
|
| (82 | ) |
|
| 70 |
|
| nm |
| |
Operating loss |
|
| (22,101 | ) |
|
| (4,813 | ) |
|
| (17,288 | ) |
|
| (359.2 | )% |
Revenue - – Revenue for 20192022 and 20182021 was $70.1$87.0 million and $40.4$40.6 million, respectively, representing an increase of 73.3%114.6%. The increase was primarily due to:
Progress on our paddle wheel riverboat project, forty-vehicle ferry projects and jacket and deck project; offset partially by,
The 2018 period includingIncremental revenue associated with the DSS Business, and
Gross profit – Gross profit for 2022 and 2021 was $11.2 million (12.9% of revenue) and $5.7 million (14.0% of revenue), respectively. The increase in gross profit for 2022 relative to 2021 was primarily due to:
General and administrative expense – General and administrative expense for 2022 and 2021 was $3.0 million and $1.4 million, respectively, representing an increase of 117.3%. The increase was primarily due to incremental administrative costs associated with the DSS Business, including amortization of intangible assets, and higher incentive plan costs.
Other (income) expense, net – Other (income) expense, net for 2022 and 2021 was expense of $0.1 million and $0.8 million, respectively. Other expense for 2021 was primarily due to:
35
Fabrication Division
|
| Years Ended December 31, |
|
| Favorable |
| ||||||
|
| 2022 |
|
| 2021 |
|
| Change |
| |||
New project awards |
| $ | 154,239 |
|
| $ | 29,581 |
|
| $ | 124,658 |
|
|
|
|
|
|
|
|
|
|
| |||
Revenue |
| $ | 48,299 |
|
| $ | 41,339 |
|
| $ | 6,960 |
|
Gross profit (loss) |
|
| (274 | ) |
|
| 497 |
|
|
| (771 | ) |
Gross profit (loss) percentage |
|
| (0.6 | )% |
|
| 1.2 | % |
|
|
| |
General and administrative expense |
|
| 2,306 |
|
|
| 1,843 |
|
|
| (463 | ) |
Other (income) expense, net |
|
| (7,454 | ) |
|
| 1,891 |
|
|
| 9,345 |
|
Operating income (loss) |
|
| 4,874 |
|
|
| (3,237 | ) |
|
| 8,111 |
|
New project thatawards – New project awards for 2022 and 2021 were $154.2 million and $29.6 million, respectively, and were primarily related to the fabrication of jacket foundations for an offshore project and small-scale fabrication work.
Revenue – Revenue for 2022 and 2021 was $48.3 million and $41.3 million, respectively, representing an increase of 16.8%. The increase was primarily due to:
Gross loss -profit (loss) – Gross loss for 2019 and 20182022 was $11.2$0.3 million (16.1%(0.6% of revenue) and $7.8gross profit for 2021 was $0.5 million (19.4%(1.2% of revenue). The gross loss for 2022 was primarily due to:
The gross loss for 2022 relative to gross profit for 2021 was primarily due to:
The Fabrication Division utilization for 2022 and 2021 benefited by $0.7 million and $1.0 million, respectively, from providing resources and facilities to our Shipyard Division for our seventy-vehicle ferry and two forty-vehicle ferry projects. See Note 2 for further discussion of our project impacts.
General and administrative expense – General and administrative expense for 2022 and 2021 was $2.3 million and $1.8 million, respectively, representing an increase of 25.1%. The increase was primarily due to higher business development and incentive plan costs.
Other (income) expense, net – Other (income) expense, net for 2022 and 2021 was income of $7.5 million and expense of $1.9 million, respectively. Other income for 2022 was primarily due to gains of $7.5 million from insurance recoveries associated with damage previously caused by Hurricane Ida to buildings and equipment at our Houma Facilities. Other expense for 2021 was primarily due to:
See Note 2 for further discussion of the impacts of Hurricane Ida.
36
Shipyard Division
|
| Years Ended December 31, |
|
| Favorable |
| ||||||
|
| 2022 |
|
| 2021 |
|
| Change |
| |||
New project awards |
| $ | 834 |
|
| $ | — |
|
| $ | 834 |
|
|
|
|
|
|
|
|
|
|
| |||
Revenue |
| $ | 7,671 |
|
| $ | 12,878 |
|
| $ | (5,207 | ) |
Gross loss |
|
| (3,058 | ) |
|
| (4,242 | ) |
|
| 1,184 |
|
Gross loss percentage |
|
| (39.9 | )% |
|
| (32.9 | )% |
|
|
| |
General and administrative expense |
|
| 4,469 |
|
|
| 934 |
|
|
| (3,535 | ) |
Other (income) expense, net |
|
| 27 |
|
|
| 593 |
|
|
| 566 |
|
Operating loss |
|
| (7,554 | ) |
|
| (5,769 | ) |
|
| (1,785 | ) |
New project awards – New project awards for 2022 were $0.8 million and were due to the net impact of change orders and liquidated damages for our seventy-vehicle ferry and two forty-vehicle ferry projects.
Revenue – Revenue for 2022 and 2021 was $7.7 million and $12.9 million, respectively, representing a decrease of 40.4%. The decrease was primarily due to:
Gross loss –Gross loss for 2022 and 2021 was $3.1 million (39.9% of revenue) and $4.2 million (32.9% of revenue), respectively. The gross loss for 20192022 was primarily due to:
Holding costs of $0.8 million related to the two MPSVs that remain in our possession and are subject to our MPSV Litigation,
The under recovery of overhead costs.
The increase in gross loss relative to the 2018 period was primarily due to:
|
|
A higher margin mix (excluding the aforementioned project charges);
Higher revenue and increased recoveries of overhead costs due to higher activity; and
The 2018 period including project charges of $2.4 million on our petrochemical module project.
See Note 2 of our Financial Statements in Item 8 for further discussion of our project charges and losses on projects.
General and administrative expense - General and administrative expense for 2019 and 2018 was $2.4 million (3.4% of revenue) and $5.0 million (12.2% of revenue), respectively, representing a decrease of 52.5%. The decrease was primarily due to:
Lower costs associated with our former EPC Division; and
Lower legal and advisory fees related to a customer dispute as the costs are reflected within the Corporate Division in 2019.
Impairments and (gain) loss on assets held for sale - Impairments and (gain) loss on assets held for sale for 2019 and 2018 was a loss of $8.7 million and a gain of $7.9 million, respectively. The loss for 2019 was primarily due:
Impairments of $9.0 million for assets held for sale and assets removed from held for sale; offset partially by,
A gain of $0.4 million from the sale of assets held for sale.
The gain for 2018 was primarily due to:
A gain of $3.9 million from the sale of our Texas South Yard and a gain of $4.1 million from the sale of our Texas North Yard; and
A gain of $3.6 million from the settlement of an insurance claim related to Hurricane Harvey damage at our South Texas Properties incurred during 2017; offset partially by,
Impairments of $3.4 million and a loss of $0.3 million related to inventory and assets held for sale and/or sold.
See Note 3 of our Financial Statements in Item 8 for further discussion of our impairments.
|
| Years Ended December 31, |
|
| Favorable (Unfavorable) Change |
| ||||||||||
|
| 2019 |
|
| 2018 |
|
| Amount |
|
| Percent |
| ||||
Revenue |
| $ | 159,217 |
|
| $ | 96,424 |
|
| $ | 62,793 |
|
|
| 65.1 | % |
Gross loss |
|
| (10,949 | ) |
|
| (10,472 | ) |
|
| (477 | ) |
|
| (4.6 | )% |
Gross loss percentage |
|
| (6.9 | )% |
|
| (10.9 | )% |
|
|
|
|
|
|
|
|
General and administrative expense |
|
| 2,445 |
|
|
| 2,801 |
|
|
| 356 |
|
|
| 12.7 | % |
Impairments and (gain) loss on assets held for sale |
|
| 7,920 |
|
|
| 964 |
|
|
| (6,956 | ) |
|
| (721.6 | )% |
Other (income) expense, net |
|
| 38 |
|
|
| 159 |
|
|
| 121 |
|
| nm |
| |
Operating loss |
|
| (21,352 | ) |
|
| (14,396 | ) |
|
| (6,956 | ) |
|
| (48.3 | )% |
Revenue - Revenue for 2019 and 2018 was $159.2 million and $96.4 million, respectively, representing an increase of 65.1%. The increase was primarily due to:
Progress on our research vessel projects and towing, salvage and rescue ship projects; offset partially by,
Lower revenue for our harbor tug projects and the 2018 period including revenue on our two MPSV contracts which were suspended during the first quarter 2018.
See Note 8 of our Financial Statements within Item 8 for further discussion of our MPSV dispute.
Gross loss - Gross loss for 2019 and 2018 was $10.9 million (6.9% of revenue) and $10.5 million (10.9% of revenue), respectively. The gross loss for 2019 was primarily due to:
Project charges of $4.9$0.9 million related to forecast cost increases and liquidated damages on our harbor tug projects, $1.5 million related to forecast cost increases on our ice-breaker tug project, and $0.8 million related to the reversal of gross profit recognized prior to 2019 on our research vessel projects;
Holding costs of $1.2 million related to the two MPSV vessels which remain in our possession and are subject to dispute; and
The under recovery of overhead costs.
The increasedecrease in gross loss for 2022 relative to the 2018 period2021 was primarily due to:
Project charges of $4.1 million for 2021 on our seventy-vehicle ferry project, offset partially by,
See Note 2 for further discussion of our project impacts.
General and administrative expense – General and administrative expense for 2022 and 2021 was $4.5 million and $0.9 million, respectively, representing an increase of 378.5%. General and administrative expense relates to legal and advisory fees associated with our MPSV Litigation. See Note 9 for further discussion of our MPSV Litigation.
Other (income) expense, net – Other (income) expense, net for 2022 and 2021 was expense of less than $0.1 million and $0.6 million, respectively. Other expense for 2022 was primarily due to:
A lower margin mix as gross profit recognized onOther expense for 2021 was primarily due to:
37
Corporate Division
|
| Years Ended December 31, |
|
| Favorable |
| ||||||
|
| 2022 |
|
| 2021 |
|
| Change |
| |||
New project awards (eliminations) |
| $ | (672 | ) |
| $ | (1,323 | ) |
| $ | 651 |
|
|
|
|
|
|
|
|
|
|
| |||
Revenue (eliminations) |
| $ | (672 | ) |
| $ | (1,323 | ) |
| $ | 651 |
|
Gross loss |
|
| — |
|
|
| (283 | ) |
|
| 283 |
|
General and administrative expense |
|
| 8,442 |
|
|
| 7,692 |
|
|
| (750 | ) |
Other (income) expense, net |
|
| 417 |
|
|
| 1 |
|
|
| (416 | ) |
Operating loss |
|
| (8,859 | ) |
|
| (7,976 | ) |
|
| (883 | ) |
Gross loss – Gross loss for 2021 was $0.3 million and was primarily due to certain operating division support costs that are reflected within our Services Division and Fabrication Division for 2022.
General and administrative expense – General and administrative expense for 2022 and 2021 was $8.4 million and $7.7 million, respectively, representing an increase of 9.8%. The increase was primarily due to:
Other (income) expense, net – Other (income) expense, net for 2022 was expense of $0.4 million and was primarily due to an impairment charge of $0.5 million associated with the underlying right-of-use asset for our corporate office lease, resulting from a sublease arrangement with a third-party. See Note 5 for further discussion of our corporate office lease asset impairment.
Discontinued Operations
|
| Years Ended December 31, |
|
| Favorable |
| ||||||
|
| 2022 |
|
| 2021 |
|
| Change |
| |||
Revenue |
| $ | — |
|
| $ | 41,637 |
|
| $ | (41,637 | ) |
Gross profit |
|
| — |
|
|
| 7,725 |
|
|
| (7,725 | ) |
Gross profit percentage |
|
| — |
|
|
| 18.6 | % |
|
|
| |
General and administrative expense |
|
| — |
|
|
| 413 |
|
|
| 413 |
|
Impairments and (gain) loss on assets held for sale, net |
|
| — |
|
|
| 25,331 |
|
|
| 25,331 |
|
Other (income) expense, net |
|
| — |
|
|
| (647 | ) |
|
| (647 | ) |
Operating loss |
|
| — |
|
|
| (17,372 | ) |
|
| 17,372 |
|
Our Shipyard Transaction was completed in April 2021. There were no operating results from discontinued operations for 2022.
Revenue – Revenue for 2021 was $41.6 million and was primarily related to:
Gross profit –Gross profit for 2021 was not material as$7.7 million (18.6% of revenue) and was primarily impacted by:
HigherA backlog for our discontinued operations that was generally at, or near, break-even or in a loss position, and accordingly, resulted in revenue with low or no gross profit, and increased recoveries
The 2018 period including project charges of $6.7 million on our harbor tug projects.
See Note 2 of our Financial Statements in Item 83 for further discussion of our project charges and losses on projects.impacts attributable to discontinued operations.
General and administrative expense - – General and administrative expense for 2019 and 20182021 was $2.4 million (1.5% of revenue) and $2.8 million (2.9% of revenue), respectively, representing a decrease of 12.7%. The decrease was primarily due to lower legal and advisory fees related to a customer dispute as the costs are reflected within the Corporate Division in 2019.$0.4 million.
Impairments and (gain) loss on assets held for sale– 38
Impairments and (gain) loss on assets held for sale, for 2019 and 2018 was a loss of $7.9 million and $1.0 million, respectively. The loss for 2019 was primarily due to:
Impairments of $4.6 million for lease assets and fixed assets attributable to our Jennings Yard;
Impairments of $3.0 million for lease assets and fixed assets (primarily drydocks) attributable to our Lake Charles Yard; and
Impairment of $0.3 million for an asset that was held for sale and sold.
The loss for 2018 was primarily due to impairments of assets held for sale and/or sold. See Note 3 of our Financial Statements in Item 8 for further discussion of our impairments.
|
| Years Ended December 31, |
|
| Favorable (Unfavorable) Change |
| ||||||||||
|
| 2019 |
|
| 2018 |
|
| Amount |
|
| Percent |
| ||||
Revenue |
| $ | 81,706 |
|
| $ | 88,230 |
|
| $ | (6,524 | ) |
|
| (7.4 | )% |
Gross profit |
|
| 5,516 |
|
|
| 12,447 |
|
|
| (6,931 | ) |
|
| (55.7 | )% |
Gross profit percentage |
|
| 6.8 | % |
|
| 14.1 | % |
|
|
|
|
|
|
|
|
General and administrative expense |
|
| 1,955 |
|
|
| 3,022 |
|
|
| 1,067 |
|
|
| 35.3 | % |
Impairments and (gain) loss on assets held for sale |
|
| 282 |
|
|
| 82 |
|
|
| (200 | ) |
|
| (243.9 | )% |
Other (income) expense, net |
|
| (50 | ) |
|
| (28 | ) |
|
| 22 |
|
| nm |
| |
Operating income |
|
| 3,329 |
|
|
| 9,371 |
|
|
| (6,042 | ) |
|
| (64.5 | )% |
Revenue - Revenue for 2019 and 2018 was $81.7 million and $88.2 million, respectively, representing a decrease of 7.4%. The decrease was primarily due to lower fabricated products and construction services revenue, offset partially by higher onshore maintenance revenue.
Gross profit - Gross profit for 2019 and 2018 was $5.5 million (6.8% of revenue) and $12.4 million (14.1% of revenue), respectively. Gross profit for 2019 was impacted by project charges of $1.6 million related to forecast cost increases and liquidated damages on a subsea components fabrication project. The decrease in gross profit relative to the 2018 period was primarily due to the aforementioned project charges, lower revenue and a lower margin mix (excluding the aforementioned project charges). See Note 2 of our Financial Statements in Item 8 for further discussion of our project charges and losses on projects.
General and administrative expense - General and administrative expense for 2019 and 2018 was $2.0 million (2.4% of revenue) and $3.0 million (3.4% of revenue), respectively, representing a decrease of 35.3%. The decrease was due primarily due to lower incentive plan costs and other cost reductions.
net – Impairments and (gain) loss on assets held for sale, – Impairments and (gain) loss on assets heldnet for sale for 2019 and 20182021 was a loss of $0.3$25.3 million, and $0.1of which $22.8 million respectively, primarily related to the impairmentsimpairment of inventory.
Corporate Division
|
| Years Ended December 31, |
|
| Favorable (Unfavorable) Change |
| ||||||||||
|
| 2019 |
|
| 2018 |
|
| Amount |
|
| Percent |
| ||||
Revenue (eliminations) |
| $ | (7,667 | ) |
| $ | (3,827 | ) |
| $ | (3,840 | ) |
|
| (100.3 | )% |
Gross loss |
|
| (317 | ) |
|
| (1,331 | ) |
|
| 1,014 |
|
|
| 76.2 | % |
Gross loss percentage |
| n/a |
|
| n/a |
|
|
|
|
|
|
|
|
| ||
General and administrative expense |
|
| 8,875 |
|
|
| 8,241 |
|
|
| (634 | ) |
|
| (7.7 | )% |
Impairments and (gain) loss on assets held for sale |
|
| 675 |
|
|
| - |
|
|
| (675 | ) |
| nm |
| |
Other (income) expense, net |
|
| 30 |
|
|
| 255 |
|
|
| 225 |
|
| nm |
| |
Operating loss |
|
| (9,897 | ) |
|
| (9,827 | ) |
|
| (70 | ) |
|
| (0.7 | )% |
Gross loss - Gross loss for 2019our Shipyard Division’s long-lived assets and 2018 was $0.3$2.6 million related to transaction and $1.3 million, respectively. The decrease in gross loss relative to the 2018 period was primarily due to lowerother costs associated with supporting our former EPC Division.
General and administrative expense - General and administrative expense for 2019 and 2018 was $8.9 million (2.9% of consolidated revenue) and $8.2 million (3.7% of consolidated revenue), respectively, representing an increase of 7.7%. The increase was primarily due to:
Increased legal and advisory fees related to customer disputes as the costs were reflected within the operating divisions in 2018; and
Higher professional fees and other cost associated with the evaluation of strategic alternatives and initiatives to diversify and enhance our business; offset partially by,
Lower incentive plan costs and board of director compensation costs.
The customer disputes relate primarily to the pursuit of claims against a customer for disputed change orders for a completed project, and our MPSV projects which are subject to a purported termination and for which construction has been suspended.Shipyard Transaction. See Note 12 of our Financial Statements in Item 8 for discussion of our settlement of the change order dispute.
Impairments and (gain) loss on assets held for sale – Impairments and (gain) loss on assets held for sale for 2019 was a loss of $0.7 million, primarily related to $0.5 million of amounts payable to our former chief executive officer in connection with his retirement during the fourth quarter 2019. Such amounts are payable in twelve equal monthly installments during 2020 and do not require any future service.
Comparison of 2018 and 2017 (in thousands, except for percentages):
In the comparative tables below, percentage changes that are not considered meaningful (generally when the 2017 period amount is immaterial or when the percentage change is significantly greater than 100%) are shown below as "nm" (not meaningful).
Consolidated
|
| Years Ended December 31, |
|
| Favorable (Unfavorable) Change |
| ||||||||||
|
| 2018 |
|
| 2017 |
|
| Amount |
|
| Percent |
| ||||
Revenue |
| $ | 221,247 |
|
| $ | 171,022 |
|
| $ | 50,225 |
|
|
| 29.4 | % |
Cost of revenue |
|
| 228,443 |
|
|
| 213,947 |
|
|
| (14,496 | ) |
|
| (6.8 | )% |
Gross loss |
|
| (7,196 | ) |
|
| (42,925 | ) |
|
| 35,729 |
|
|
| 83.2 | % |
Gross loss percentage |
|
| (3.3 | )% |
|
| (25.1 | )% |
|
|
|
|
|
|
|
|
General and administrative expense |
|
| 19,015 |
|
|
| 17,800 |
|
|
| (1,215 | ) |
|
| (6.8 | )% |
Impairments and (gain) loss on assets held for sale |
|
| (6,850 | ) |
|
| 7,931 |
|
|
| 14,781 |
|
| nm |
| |
Other (income) expense, net |
|
| 304 |
|
|
| (46 | ) |
|
| (350 | ) |
| nm |
| |
Operating loss |
|
| (19,665 | ) |
|
| (68,610 | ) |
|
| 48,945 |
|
|
| 71.3 | % |
Interest (expense) income, net |
|
| (142 | ) |
|
| (349 | ) |
|
| 207 |
|
|
| 59.3 | % |
Net loss before income taxes |
|
| (19,807 | ) |
|
| (68,959 | ) |
|
| 49,152 |
|
|
| 71.3 | % |
Income tax (expense) benefit |
|
| (571 | ) |
|
| 24,193 |
|
|
| (24,764 | ) |
|
| (102.4 | )% |
Net loss |
| $ | (20,378 | ) |
| $ | (44,766 | ) |
| $ | 24,388 |
|
|
| 54.5 | % |
Revenue - Revenue for 2018 and 2017 was $221.2 million and $171.0 million, respectively, representing an increase of 29.4%. The increase was primarily due to:
Increased revenue for our Services Division of $22.8 million, primarily due to additional demand for both onshore and offshore services; and
Increased revenue for our Shipyard Division of $43.7 million, primarily due to progress on our ten harbor tug projects, two research vessel projects and an ice-breaker tug project that was not under construction during the 2017 period, offset partially by lower revenue from our two MPSV contracts that were suspended during the first quarter 2018; offset partially by,
Decreased revenue for our Fabrication Division of $17.7 million, primarily due to the completion of our petrochemical module project during the second quarter 2018 with no other significant projects under construction for the division until the fourth quarter 2018.
See Note 8 of our Financial Statements in Item 83 for further discussion of our MPSV dispute.the Shipyard Transaction.
Gross loss - Gross loss for 2018 and 2017 was $7.2 million (3.3% of revenue) and $42.9 million (25.1% of revenue), respectively. The gross loss for 2018 was primarily due to:
The under recovery of overhead costs (primarily associated with the underutilization of our facilities within our Shipyard and Fabrication Divisions, including holding costs for our South Texas Properties of $2.1 million);
A lower margin project mix for our Shipyard Division related to previous project awards bid during a period of competitive pricing; and
Project charges and losses on projects within our Fabrication and Shipyard Divisions (see below).
The decrease in gross loss relative to the 2017 period was primarily due to:
Decreased gross loss of $34.4 million for our Shipyard Division, primarily due to increased revenue, reductions in overhead costs and improved recoveries of overhead costs, and the 2017 period including project losses of $34.5 million related to cost increases and liquidated damages on the construction of two MPSVs which are in dispute and for which construction has been suspended; offset partially by project charges and losses in the 2018 period on our harbor tug projects of $6.7 million; and
Increased gross profit of $7.9 million for our Services Division, primarily due to increased revenue and improved recovery of our overhead costs; offset partially by,
Increased gross loss of $5.9 million for our Fabrication Division, primarily due to decreased revenue and project charges and losses on our petrochemical module project of $2.4 million, offset partially by reductions in overhead costs and improved recoveries of overhead costs.
See Note 2 of our Financial Statements in Item 8 for further discussion of our project charges and losses on projects.
General and administrative expense - General and administrative expense for 2018 and 2017 was $19.0 million (8.6% of revenue) and $17.8 million (10.4% of revenue), respectively, representing an increase of 6.8%. The increase was primarily due to:
Higher legal and advisory fees related to customer disputes and shareholder matters;
Professional fees associated with the evaluation of strategic alternatives and initiatives to diversify our business; and
The addition of administrative personnel for our newly created EPC Division; offset partially by,
Headcount reductions, lower incentive plan costs, executive management salary reductions and other cost saving initiatives.
Impairments and (gain) loss on assets held for sale - Impairments and (gain) loss on assets held for sale for 2018 and 2017 was a gain of $6.9 million and a loss of $7.9 million, respectively. The gain for 2018 was primarily due to:
A gain of $3.9 million from the sale of our Texas South Yard and a gain of $4.1 million from the sale of our Texas North Yard; and
A gain of $3.6 million from the settlement of an insurance claim related to Hurricane Harvey damage at our South Texas Properties incurred during 2017; offset partially by,
Impairments of $4.4 million and a loss of $0.3 million related to inventory and assets held for sale and/or sold within our Fabrication and Shipyard Divisions.
The loss for 2017 was primarily due to:
Impairments of $6.7 million associated with inventory within our Fabrication Division; and
Impairments of $1.0 million and a loss of $0.3 million related to assets held for sale and/or sold within our Shipyard Division.
See "Overview" above and Note 3 of our Financial Statements in Item 8 for further discussion of our impairments.
Other (income) expense, net - – Other (income) expense, net for 2018 and 20172021 was expenseincome of $0.3$0.6 million and income of $46,000, respectively. Other (income) expense, net generally represents (recoveries) provisions for bad debts, (gains) losses associated with the sale or disposition of property and equipment other than assets held for sale, and (income) expense associated with certain nonrecurring items. The expense for 2018 and income for 2017 was primarily due to net losses and net gains, respectively, on the sales of equipment.
Interest (expense) income, net - Interest (expense) income, net for 2018 and 2017 was expense of $0.1 million and $0.3 million, respectively. The decrease in expense for the 2018 period primarily due to interest earned on higher cash equivalents and short-term investment balances.
Income tax (expense) benefit - Income tax (expense) benefit for 2018 and 2017 was expense of $0.6 million and a benefit of $24.2 million, respectively. Tax expense for 2018 represents state income taxes. No federal tax benefit was recorded during 2018 as a full valuation allowance was recorded against our deferred tax assets generated during the period. See Note 6 of our Financial Statements in Item 8 for further discussion of our NOLs, deferred tax assets and valuation allowance.
Operating Segments
Fabrication Division
|
| Years Ended December 31, |
|
| Favorable (Unfavorable) Change |
| ||||||||||
|
| 2018 |
|
| 2017 |
|
| Amount |
|
| Percent |
| ||||
Revenue |
| $ | 40,420 |
|
| $ | 58,078 |
|
| $ | (17,658 | ) |
|
| (30.4 | )% |
Gross loss profit |
|
| (7,840 | ) |
|
| (1,900 | ) |
|
| (5,940 | ) |
|
| (312.6 | )% |
Gross loss percentage |
|
| (19.4 | )% |
|
| (3.3 | )% |
|
|
|
|
|
|
|
|
General and administrative expense |
|
| 4,951 |
|
|
| 3,416 |
|
|
| (1,535 | ) |
|
| (44.9 | )% |
Impairments and (gain) loss on assets held for sale |
|
| (7,896 | ) |
|
| 6,683 |
|
|
| 14,579 |
|
|
| 218.2 | % |
Other (income) expense, net |
|
| (82 | ) |
|
| (30 | ) |
|
| 52 |
|
| nm |
| |
Operating loss |
|
| (4,813 | ) |
|
| (11,969 | ) |
|
| 7,156 |
|
|
| 59.8 | % |
Revenue - Revenue for 2018 and 2017 was $40.4 million and $58.1 million, respectively, representing a decrease of 30.4%. The decrease was primarily due to the completion of our petrochemical module project during the second quarter 2018 with no other significant projects under construction for the division until the fourth quarter 2018 when the paddle wheel riverboat construction commenced.
Gross loss - Gross loss for 2018 and 2017 was $7.8 million (19.4% of revenue) and $1.9 million (3.3% of revenue), respectively. The gross loss for 2018 was primarily due to:
The under recovery of overhead costs (including holding costs for our South Texas Properties of $2.1 million); and
Project charges and losses on our petrochemical module project of $2.4 million.
The increase in gross loss relative to the 2017 period was primarily due to:
Decreased revenue related to the completion of our petrochemical module project and charges on the project; offset partially by,
Reductions in overhead costs and lower depreciation expense for our South Texas Properties as these assets were classified as held for sale during all of 2018; and
Reductions in overhead costs and improvedgain from insurance recoveries of overhead costs.
See Note 2 of our Financial Statements in Item 8 for further discussion of our project charges and losses on projects.
General and administrative expense - General and administrative expense for 2018 and 2017 was $5.0 million (12.2% of revenue) and $3.4 million (5.9% of revenue), respectively, representing an increase of 44.9%. The increase was primarily due to:
The addition of administrative personnel and other costs associated with our former EPC division; and
Higher legal and advisory fees relateddamage previously caused by Hurricane Laura to the pursuit of claims against a customer for disputed change orders for a project completed prior to 2017, offset partially by,
Headcount reductions and lower incentive plan costs.
Impairments and (gain) loss on assets held for sale – Impairments and (gain) loss on assets held for sale for 2018 and 2017 was a gain of $7.9 million and a loss of $6.7 million, respectively. The gain for 2018 was primarily due to:
A gain of $3.9 million from the sale of our Texas South Yard and a gain of $4.1 million from the sale of our Texas North Yard; and
A gain of $3.6 million from the settlement of an insurance claim related to Hurricane Harvey damage at our South Texas Properties during 2017; offset partially by,
Impairments of $3.4 million and a loss of $0.3 million related to inventory and assets held for sale and/or sold.
The loss for 2017 was primarily due to impairments of $6.7 million related to inventory. See Note 3 of our Financial Statements in Item 8 for further discussion of our impairments.
Shipyard Division
|
| Years Ended December 31, |
|
| Favorable (Unfavorable) Change |
| ||||||||||
|
| 2018 |
|
| 2017 |
|
| Amount |
|
| Percent |
| ||||
Revenue |
| $ | 96,424 |
|
| $ | 52,699 |
|
| $ | 43,725 |
|
|
| 83.0 | % |
Gross loss |
|
| (10,472 | ) |
|
| (44,870 | ) |
|
| 34,398 |
|
|
| 76.7 | % |
Gross loss percentage |
|
| (10.9 | )% |
|
| (85.1 | )% |
|
|
|
|
|
|
|
|
General and administrative expense |
|
| 2,801 |
|
|
| 3,926 |
|
|
| 1,125 |
|
|
| 28.7 | % |
Impairments and (gain) loss on assets held for sale |
|
| 964 |
|
|
| 1,248 |
|
|
| 284 |
|
|
| 22.8 | % |
Other (income) expense, net |
|
| 159 |
|
|
| — |
|
|
| (159 | ) |
| nm |
| |
Operating loss |
|
| (14,396 | ) |
|
| (50,044 | ) |
|
| 35,648 |
|
|
| 71.2 | % |
Revenue - Revenue for 2018 and 2017 was $96.4 million and $52.7 million, respectively, representing an increase of 83.0%. The increase was primarily due to:
Progress on our ten harbor tug projects (including the completion of one vessel in the fourth quarter 2018), two research vessel projects and our ice-breaker tug projectdrydock that was not under construction during the 2017 period; offset partially by,
|
|
See Note 8 of our Financial Statementssold in Item 8 for further discussion of our MPSV dispute.
Gross loss - Gross loss for 2018 and 2017 was $10.5 million (10.9% of revenue) and $44.9 million (85.1% of revenue), respectively. The gross loss for 2018 was primarily due to the under recovery of overhead costs and project charges and losses on our harbor tug projects (see below).
The decrease in gross loss relative to the 2017 period was primarily due to:
Increased revenue related to our harbor tug projects, two research vessel projects and our ice-breaker tug project;
Reductions in overhead costs and improved recoveries of overhead costs; and
The 2017 period including project losses of $34.5 million related to cost increases and the recording of liquidated damages on the construction of two MPSVs which are in dispute and for which construction has been suspended; offset partially by,
The 2018 period including charges and losses on our harbor tug projects of $6.7 million.
See Note 2 of our Financial Statements in Item 8 for further discussion of our project charges and losses on projects.
General and administrative expense - General and administrative expense for 2018 and 2017 was $2.8 million (2.9% of revenue) and $3.9 million (7.4% of revenue), respectively, representing a decrease of 28.7%. The decrease was primarily due to:
Headcount reductions and lower incentive plan costs; offset partially by,
Higher legal and advisory fees related to customer disputes.
Impairments and (gain) loss on assets held for sale – Impairments and (gain) loss on assets held for sale for 2018 and 2017 was a loss of $1.0 million and $1.2 million, respectively. The impairments were related to assets held for sale and/or sold. See Note 3 of our Financial Statements in Item 8 for further discussion of our impairments.
Services Division
|
| Years Ended December 31, |
|
| Favorable (Unfavorable) Change |
| ||||||||||
|
| 2018 |
|
| 2017 |
|
| Amount |
|
| Percent |
| ||||
Revenue |
| $ | 88,230 |
|
| $ | 65,445 |
|
| $ | 22,785 |
|
|
| 34.8 | % |
Gross profit |
|
| 12,447 |
|
|
| 4,575 |
|
|
| 7,872 |
|
|
| 172.1 | % |
Gross profit percentage |
|
| 14.1 | % |
|
| 7.0 | % |
|
|
|
|
|
|
|
|
General and administrative expense |
|
| 3,022 |
|
|
| 2,701 |
|
|
| (321 | ) |
|
| (11.9 | )% |
Impairments and (gain) loss on assets held for sale |
|
| 82 |
|
|
| — |
|
|
| (82 | ) |
| nm |
| |
Other (income) expense, net |
|
| (28 | ) |
|
| — |
|
|
| 28 |
|
| nm |
| |
Operating income |
|
| 9,371 |
|
|
| 1,874 |
|
|
| 7,497 |
|
| nm |
| |
Revenue - Revenue for 2018 and 2017 was $88.2 million and $65.4 million, respectively, representing an increase of 34.8%. The increase was due to an overall increase in activity resulting from higher demand for our onshore and offshore services.
Gross profit - Gross profit for 2018 and 2017 was $12.4 million (14.1% of revenue) and $4.6 million (7.0% of revenue), respectively. The increase in gross profit relative to the 2017 period was primarily due to higher revenue and improved recoveries of overhead costs.
General and administrative expense - General and administrative expense for 2018 and 2017 was $3.0 million (3.4% of revenue) and $2.7 million (4.1% of revenue), respectively, representing an increase of 11.9%. The increase was due to additional costs to support higher activity and increased incentive plan costs.
Corporate Division
|
| Years Ended December 31, |
|
| Favorable (Unfavorable) Change |
| ||||||||||
|
| 2018 |
|
| 2017 |
|
| Amount |
|
| Percent |
| ||||
Revenue (eliminations) |
| $ | (3,827 | ) |
| $ | (5,200 | ) |
| $ | 1,373 |
|
|
| 26.4 | % |
Gross loss |
|
| (1,331 | ) |
|
| (730 | ) |
|
| (601 | ) |
|
| (82.3 | )% |
Gross loss percentage |
| n/a |
|
| n/a |
|
|
|
|
|
|
|
|
| ||
General and administrative expense |
|
| 8,241 |
|
|
| 7,757 |
|
|
| (484 | ) |
|
| (6.2 | )% |
Other (income) expense, net |
|
| 255 |
|
|
| (16 | ) |
|
| (271 | ) |
| nm |
| |
Operating loss |
|
| (9,827 | ) |
|
| (8,471 | ) |
|
| (1,356 | ) |
|
| (16.0 | )% |
Gross loss - Gross loss for 2018 and 2017 was $1.3 million and $0.7 million, respectively. The increase in gross loss relative to the 2017 period was primarily due to higher costs to support our strategic initiatives and former EPC Division.
General and administrative expense - General and administrative expense for 2018 and 2017 was $8.2 million (3.7% of consolidated revenue) and $7.8 million (4.5% of consolidated revenue), respectively, representing an increase of 6.2%. The increase was primarily due to:
Increased legal and advisory fees related to customer disputes and shareholder matters; and
Professional fees associatedconnection with the evaluation of strategic alternatives and initiatives to diversify our business; offset partially by,Shipyard Transaction.
Lower incentive plan costs, executive management salary reductions and other cost saving initiatives.
Liquidity and Capital Resources
Available Liquidity
Our primary sources of liquidity are our cash, and cash equivalents and scheduled maturities of our short-term investments, and availability under our Credit Agreement (discussed below).investments. At December 31, 2019,2022, our cash, cash equivalents, restricted cash and short-term investments totaled $69.6$44.7 million and our immediately available liquidity was as follows (in thousands):
|
| December 31, |
| |
Cash and cash equivalents |
| $ | 33,221 |
|
Short-term investments (1) |
|
| 9,905 |
|
Total cash, cash equivalents and short-term investments |
|
| 43,126 |
|
Restricted cash, current |
|
| 1,603 |
|
Total cash, cash equivalents, restricted cash and short-term investments |
| $ | 44,729 |
|
Available Liquidity |
| Total |
| |
Cash and cash equivalents |
| $ | 49,703 |
|
Short-term investments (1) |
|
| 19,918 |
|
Total cash, cash equivalents and short-term investments |
|
| 69,621 |
|
Credit Agreement total capacity |
|
| 40,000 |
|
Outstanding letters of credit |
|
| (10,234 | ) |
Credit Agreement available capacity |
|
| 29,766 |
|
Total available liquidity |
| $ | 99,387 |
|
|
|
Working Capital
Our available liquidity is impacted by changes in our working capital and our capital expenditure requirements. At December 31, 2019, our working capital was $65.6 million and included $69.6 million of cash, cash equivalents and short-term investments and $9.0 million of assets held for sale. Excluding cash, cash equivalents, short-term investments and assets held for sale, our working capital at December 31, 2019 was negative $13.0 million, and consisted of net contract assets and contract liabilities (collectively, "Contracts in Progress") of $25.9 million; contracts receivable and retainage of $26.1 million; inventory, prepaid expenses and other assets of $6.6 million; and accounts payable, accrued expenses and other liabilities of $71.6 million. The components of our working capital (excluding cash, cash equivalents, short-term investments and assets held for sale) at December 31, 2019 and 2018, and changes in such amounts during 2019 and 2018, was as follows (in thousands):
|
| December 31, |
|
| Change During the Period(3) |
| ||||||||||
|
| 2019 |
|
| 2018 |
|
| 2019 |
|
| 2018 |
| ||||
Contract assets |
| $ | 52,128 |
|
| $ | 29,982 |
|
| $ | (22,146 | ) |
| $ | (1,609 | ) |
Contract liabilities(1) |
|
| (26,271 | ) |
|
| (16,845 | ) |
|
| 9,426 |
|
|
| 4,091 |
|
Contracts in progress, net(2) |
|
| 25,857 |
|
|
| 13,137 |
|
|
| (12,720 | ) |
|
| 2,482 |
|
Contracts receivable and retainage, net |
|
| 26,095 |
|
|
| 22,505 |
|
|
| (3,590 | ) |
|
| 5,961 |
|
Inventory, prepaid expenses and other assets |
|
| 6,624 |
|
|
| 9,356 |
|
|
| 2,732 |
|
|
| (590 | ) |
Accounts payable, accrued expenses and other liabilities |
|
| (71,573 | ) |
|
| (39,256 | ) |
|
| 32,317 |
|
|
| 8,021 |
|
Total |
| $ | (12,997 | ) |
| $ | 5,742 |
|
| $ | 18,739 |
|
| $ | 15,874 |
|
|
|
|
|
|
|
Fluctuations in our working capital, and its components, are not unusual in our business and are impacted by the size of our projects and the mix of our backlog. Our working capital is particularly impacted by the timing of new project awards and related payments in advance of performing work, and the subsequent achievement of billing milestones or project progress on backlog. Working capital is also impacted at period-end by the timing of contracts receivablecontract receivables collections and accounts payable payments on our projects.
At December 31, 2022, our working capital was $56.3 million and included $44.7 million of cash, cash equivalents, short-term investments and restricted cash. Excluding cash, cash equivalents, short-term investments and restricted cash, our working capital at December 31, 2022 was $11.6 million, and consisted of net contract assets and contract liabilities of negative $3.4 million; contract receivables and retainage of $29.4 million; inventory, prepaid expenses and other assets of $8.1 million; and accounts payable, accrued expenses and other liabilities of $22.6 million. The components of our working capital (excluding cash, cash equivalents, short-term investments and restricted cash) at December 31, 2022 and 2021, and changes in such amounts during 2022, were as follows (in thousands):
|
| December 31, |
|
|
|
| ||||||
|
| 2022 |
|
| 2021 |
|
| Change (3) |
| |||
Contract assets |
| $ | 4,839 |
|
| $ | 4,759 |
|
| $ | (80 | ) |
Contract liabilities (1) |
|
| (8,196 | ) |
|
| (6,648 | ) |
|
| 1,548 |
|
Contracts in progress, net (2) |
|
| (3,357 | ) |
|
| (1,889 | ) |
|
| 1,468 |
|
Contract receivables and retainage, net |
|
| 29,427 |
|
|
| 15,986 |
|
|
| (13,441 | ) |
Inventory, prepaid expenses and other assets |
|
| 8,074 |
|
|
| 8,750 |
|
|
| 676 |
|
Accounts payable, accrued expenses and other liabilities |
|
| (22,593 | ) |
|
| (23,306 | ) |
|
| (713 | ) |
Total |
| $ | 11,551 |
|
| $ | (459 | ) |
| $ | (12,010 | ) |
Cash Flow Activity (in thousands):
|
| December 31, |
|
| Years Ended December 31, |
| ||||||||||
|
| 2019 |
|
| 2018 |
|
| 2022 |
|
| 2021 |
| ||||
Net cash used in operating activities |
| $ | (7,140 | ) |
| $ | (20,392 | ) |
| $ | (8,923 | ) |
| $ | (24,814 | ) |
Net cash provided by (used in) investing activities |
| $ | (12,771 | ) |
| $ | 82,718 |
|
| $ | (8,870 | ) |
| $ | 37,402 |
|
Net cash used in financing activities |
| $ | (843 | ) |
| $ | (852 | ) |
| $ | (1,972 | ) |
| $ | (1,158 | ) |
Operating Activities – Cash used in operating activities for 20192022 and 20182021 was $7.1$8.9 million and $20.4$24.8 million, respectively, and was primarily due to the net impacts of the following:
20192022 Activity
Operating losses, excluding net gains on assets heldNet loss adjusted for sale of $0.4 million, gains on the sale of fixed and other assets of $0.6 million, depreciation and amortization expense of $9.6$5.1 million, non-cash asset impairments of $17.2$0.5 million, gain on insurance recoveries of $1.2 million, and stock-based compensation expense of $1.8$2.3 million;
Increase in contract assets of $22.1$0.1 million related to the timing of billings on projects, primarily due to increased unbilled positions on various projects for our Fabrication Division and our two forty-vehicle ferry projects for our Shipyard Division, offset partially by decreased unbilled positions on our seventy-vehicle ferry project;
Increase in contract liabilities of $9.4 million, primarily due to advance payments on a project in our Shipyard Division (for our third towing, salvage and rescue ship project) and three projects in our Fabrication Division, and an increase in our accrued contract losses offset partially byand the unwind of advance payments on a project in our Fabrication Division.
Increase in contracts receivablecontract receivables and retainage of $3.7$13.4 million related to the timing of billings and collections on our projects, primarily due to an increase in billingsincreased receivable positions on twovarious projects infor our Services Division (including projects associated with our DSS Business) and Fabrication Division;
Decrease in prepaid expenses, inventory and other assets of $2.6$2.2 million, primarily due to decreased inventory for our Services Division;
IncreaseDecrease in accounts payable, and accrued expenses and other current liabilities of $29.9$1.6 million, primarily due to increased project activity and the timing of payments and decreased accounts payable positions on various projects for projects inour Fabrication Division and our seventy-vehicle ferry project for our Shipyard Division, (primarilyoffset partially by increased accounts payable positions on various projects for our three regional class research vessel projectsServices Division. The change differs from the table above primarily due to the Insurance Finance Arrangement discussed further in Note 6; and three towing, salvage and rescue ship projects); and
Change in noncurrent assets and liabilities, net of $1.5$0.9 million.
20182021 Activity
Operating losses, excluding net gains on assets heldloss adjusted for sale and insurance recoveries of $11.3 million, loss on the sale of fixed assets and other assets of $0.3 million, depreciation and amortization expense of $10.4$5.4 million, non-cash asset impairments of $4.4$22.8 million, loss on the Shipyard Transaction of $2.6 million, gain on extinguishment of debt of $9.1 million, and stock-based compensation expense of $2.8$1.7 million;
Increase in contract assets of $6.9 million related to the timing of billings on projects, primarily due to increased unbilled positions on our Divested Shipyard Contracts and various projects for our Fabrication Division, offset partially by decreased unbilled positions on our seventy-vehicle ferry project for our Shipyard Division;
Decrease in contracts receivable and retainage of $6.0 million. The decrease reflects a $3.0 million reclassification of retainage to other noncurrent assets during the period as we do not anticipate collection within the next twelve months. Excluding the reclassification, contracts receivable and retainage decreased by $3.0 million, primarily due to collections on a completed project in our Fabrication Division;
IncreaseDecrease in prepaid expenses, inventory and other assets of $0.6$1.9 million, primarily due to increased inventory for our Services Division;
Decrease in deferred revenueaccounts payable, accrued expenses and other current liabilities of $4.7 million. The decreases reflects a $3.8 million reclassification of deferred revenue to other noncurrent assets, which was netted with the contract in progress reclassification discussed above. Excluding the reclassification, deferred revenue decreased by $0.8$12.7 million, primarily due to project progress; and
Increase in accounts payable and accrued expenses of $8.0 million, primarily due to increased activity and the timing of payments and decreased accounts payable positions on our Divested Shipyard Contracts, seventy-vehicle ferry project for projects in our Shipyard Division.
Cash used in operating activities for 2021 included approximately $7.8 million associated with changes in working capital for the Divested Shipyard Contracts from December 31, 2020 through the Transaction Date, which was separately recovered through the Working Capital True-Up in connection with the Shipyard Transaction. See Note 3 for further discussion of the Shipyard Transaction.
Investing Activities – Cash used in investing activities for 20192022 was $12.8$8.9 million and cash provided by investing activities for 2021 was $37.4 million. Cash used in investing activities for 2022 was primarily due to the net purchasepurchases of short-term investments of $11.2$9.9 million and capital expenditures of $3.8$3.1 million, offset partially by proceeds from the Shipyard Transaction of $0.9 million, recoveries from insurance claims of $1.2 million, and the sale of assets of $2.0 million. Cash provided by investing activities for 2021 was primarily due to net proceeds from the Shipyard Transaction of $33.0 million, proceeds from the sale of fixed assets and assets held for sale of $2.2 million.
Cash provided by investing activities for 2018 was $82.7$4.5 million, and was primarily due to proceeds from the sale of our South Texas Properties and other fixed assets of $85.2 million, insurance proceeds of $9.4 million from the final settlement of hurricane damage to our South Texas Properties, offset partially by capital expenditures of $3.5 million and the net purchasematurities of short-term investments of $8.4 million. The sale of our South Texas Properties consisted of the following:
The sale of our Texas South Yard for $55.0 million, less selling costs of $1.2 million, for total net proceeds of $53.8$8.0 million and a gainrecoveries from insurance claims of $3.9 million; and
The sale$1.0 million, offset partially by the Purchase Price associated with the DSS Acquisition of our Texas North Yard for $28.0 million, less selling cost of $0.6 million, for total net proceeds of $27.4$7.6 million and a gaincapital expenditures of $4.1$1.5 million.
Financing Activities - – Cash used in financing activities for 20192022 and 20182021 was $0.8$2.0 million and $0.9$1.2 million, respectively, andrespectively. Cash used in financing activities for 2022 was primarily due to tax payments made on behalfour Insurance Finance Arrangement of employees from vested stock withholdings.
Credit Facilities
Credit Agreement - We have a $40.0$1.7 million. Cash used in financing activities for 2021 was primarily due to repayment of $1.1 million revolving credit facility with Hancock Whitney Bank ("Credit Agreement") that can be used for borrowings or letters of credit that matures June 9, 2021. On February 28, 2020, we amended our Credit Agreement to amend our financial covenants. Our amended quarterly financial covenants at December 31, 2019, and for the remaining term of the Credit Agreement, are as follows:
Ratio of current assets to current liabilities of not less than 1.25:1.00;
Minimum tangible net worth of at least the sum of $130.0 million, plus 100%PPP Loan. See Note 6 for further discussion of the proceeds from any issuance of stock or other equity after deducting of any fees, commissions, expensesPPP Loan and other costs incurred in such offering;Insurance Finance Arrangement.
Minimum cash, cash equivalents and short-term investments of $40.0 million; and
Ratio of funded debt to tangible net worth of not more than 0.50:1.00.
Our Credit Agreement also includes restrictions regarding our ability to: (i) grant liens; (ii) make certain loans or investments; (iii) incur additional indebtedness or guarantee other indebtedness in excess of specified levels; (iv) make any material change to the natureFacilities
See Note 6 for discussion of our business or undergo a fundamental change; (v) make any material dispositions; (vi) acquire another company or all or substantially all of its assets; (vii) enter into a merger, consolidation, or sale leaseback transaction; or (viii) declare and pay dividends if any potential default or event of default occurs.
Interest on borrowings under the CreditLC Facility, Surety Bonds, Insurance Finance Arrangement, Loan Agreement, may be designated, at our option, as either the Wall Street Journal published Prime Rate (4.75% at December 31, 2019) or LIBOR (1.76% at December 31, 2019) plus 2.0% per annum. Commitment fees on the unused portion of the Credit Agreement are 0.4% per annum and interest on outstanding letters of credit is 2.0% per annum. The Credit Agreement is secured by substantially all of our assets (with a negative pledge on our real property).
At December 31, 2019, we had no outstanding borrowings under our CreditMortgage Agreement and $10.2 million of outstanding letters of credit to support our projects, providing $29.8 million of available capacity. At December 31, 2019, we were in compliance with all of our amended financial covenants, with a tangible net worth of $153.4 million (as defined by the Credit Agreement); total cash, cash equivalents and short-term investments of $69.6 million; a ratio of current assets to current liabilities of 1.67 to 1.0; and a ratio of funded debt to tangible net worth of 0.07:1.00.Restrictive Covenant Agreement.
Surety Bonds - We issue surety bonds in the ordinary course of business to support our projects. At December 31, 2019, we had $409.9 million of outstanding surety bonds. Although we believe there is sufficient bonding capacity available to us from one or more financial institutions, such capacity is uncommitted, and accordingly, we can provide no assurances that necessary bonding capacity will be available to support our future bonding requirements.
Registration Statement
We have a shelf registration statement that is effective with the SEC that expires on November 27, 2020.2023. The shelf registration statement enables us to issue up to $200.0 million in either debt or equity securities, or a combination thereof, from time to time subsequent to the filing of a prospectus supplement, which among other things, identifies the salesunderwriter, dealer or agent, specifies the number and value of securities that may be sold, and provides a time frame over which the securities may be offered.
As discussed in our Overview, we continue to focus on securing profitable new project awards and backlog in the near-term and generating operating income and cash flows in the longer-term. We have made significant progress in our efforts to preserve and improve our liquidity, including cost reductions, (including reducing the compensation of our directors and executive officers), the sale of underutilizedunder-utilized assets and facilities (including the sale of our Harvey Option in 2022 and certain assets held for sale in 2021), an improved overall cashflowcash flow position on our projects in backlog. In addition, at December 31, 2019, we continue to have $9.0 millionbacklog and the completion of assets held for sale; however, we can provide no assurances that we will successfully sell these assets or that we will recover their carrying value. Further, in February 2020, we reached a $10.0 million settlement related to disputed change orders for a completed project and received payment from the customer in February 2020.Shipyard Transaction. The primary uses of our liquidity for 20202022 and the foreseeable future are to fund:
Overhead costs associated with the underutilizationunder-utilization of our facilities and resources within our Fabrication & Services Division and Shipyard Division until we secure and/orand begin to execute sufficient backlog to fully recover our overhead costs;
Capital expenditures, (including enhancementsincluding expenditures to our Shipyard Division facilities to execute our backlog);
Accrued contract losses recorded at December 31, 2019;
Working capital requirements for our projects, (includingincluding the unwind of advance payments and potential additional projects for the U.S. Navy if the aforementioned options are exercised); and
Remaining liabilities of the Shipyard Division operations that were excluded from the Shipyard Transaction;
We anticipate capital expenditures of $10.0$3.0 million to $15.0$5.0 million for 2020, of which approximately $8.5 million represents2023, excluding any future expenditures for deductibles and uninsured losses, if any, associated with damage caused by Hurricane Ida, that may be determined to be capital investments required by our contracts for the construction of our three towing, salvage and rescue ships. The expenditures relate to the construction of vessel erection sites and a warehouse for storage. While the capital investment is required by the contracts, the assets will benefit our construction operations going forward, including supporting our execution of any further towing, salvage and rescue ships if our customer exercises its options for additional vessels as discussed in “New Awards and Backlog��� above.items. Further investments in facilities may be required to win and execute potential new project awards, which are not included in these estimates.
41
We believe that our cash, cash equivalents and short-term investments at December 31, 2019, and availability under our Credit Agreement,2022, will be sufficient to enable us to fund our operating expenses, meet our working capital and capital expenditure requirements, and satisfy any debt service obligations or other funding requirements, for at least twelve months from the date of this Report. Our evaluation of the sufficiency of our cash and liquidity is primarily based on our financial forecast for 20202023 and 2021,2024, which is impacted by our existing backlog and estimates of future new project awards.awards and may be further impacted by the ongoing effects of oil and gas price volatility and macroeconomic conditions, as well as the outcome of our MPSV Litigation and any related indemnification obligations to the Surety. We can provide no assurances that our financial forecast will be achieved or that we will have sufficient cash or availability under our Credit Agreementand short-term investments to meet planned operating expenses and other unforeseen cash requirements. Accordingly, we may be required to obtain new or additional credit facilities, sell additional assets or conduct equity or debt offerings at a time when it is not beneficial to do so.
Off-Balance Sheet Arrangements
We are not a party to any contract or other obligation not included on our Balance Sheet that has, or is reasonably likely to have, a current or future effect on our financial condition, changes in financial condition, revenues or expenses, results of operations, liquidity, capital expenditures or capital resources.
Other MattersItem 7A. Quantitative and Qualitative Disclosures About Market Risk
Not applicable.
Item 8. Financial Statements and Supplementary Data
In this Report our Financial Statements and the accompanying notes appear on pages F-1 through F-25F-30 and are incorporated herein by reference. See Index to Financial Statements on Page 49page 44.
Item 9. Changes in and Disagreements with Accountants on Accounting and Financial Disclosure
None.
Item 9A. Controls and Procedures
Evaluation of Disclosure Controls and Procedures
We maintain disclosure controls and procedures that are designed to ensure that information required to be disclosed in the reports that we file or submit under the Securities Exchange Act of 1934 is recorded, processed, summarized and reported within the time periods specified in the SEC rules and forms, and that such information is communicated to management, including our Chief Executive Officer and Chief Financial Officer, as appropriate, to allow timely decisions regarding required disclosure. Management, with the participation of our Chief Executive Officer and Chief Financial Officer, has evaluated the effectiveness of our disclosure controls and procedures (as defined in Rule 13a-15(e) under the Securities Exchange Act of 1934) as of the end of the period covered by this report. Based on this evaluation, our Chief Executive Officer and Chief Financial Officer have concluded that the design and operation of our disclosure controls and procedures were effective as of the end of the period covered by this Report.
Management’s Report on Internal Control Over Financial Reporting
Management is responsible for establishing and maintaining adequate internal control over financial reporting, as such term is defined in Exchange Act Rule 13a-15(f). Under the supervision and with the participation of management, including our Chief Executive Officer and Chief Financial Officer, we conducted an evaluation of the effectiveness of our internal control over financial reporting based on the framework in Internal Control – Integrated Framework issued by the Committee of Sponsoring Organizations of the Treadway Commission (2013 framework). Based on our evaluation under the framework in Internal Control – Integrated Framework, our management concluded that our internal control over financial reporting was effective as of December 31, 2019.2022.
Attestation Report of the Independent Registered Public Accounting Firm
The effectiveness of our internal control over financial reporting as of December 31, 2019, has been audited by Ernst & Young LLP, an independent registered public accounting firm, as indicated in their report dated March 5, 2020, which is included herein.
Changes in Internal Controls Over Financial Reporting
There were no changes in our internal control over financial reporting that occurred during the fourth quarter 2019,2022, that have materially affected, or are reasonably likely to materially affect, our internal control over financial reporting.
Report of Independent Registered Public Accounting Firm
To the Shareholders and Board of Directors of Gulf Island Fabrication, Inc.
Opinion on Internal Control over Financial Reporting42
We have audited Gulf Island Fabrication, Inc.’s internal control over financial reporting as of December 31, 2019, based on criteria established in Internal Control-Integrated Framework issued by the Committee of Sponsoring Organizations of the Treadway Commission (2013 Framework) (the COSO criteria). In our opinion, Gulf Island Fabrication, Inc. (the Company) maintained, in all material respects, effective internal control over financial reporting as of December 31, 2019, based on the COSO criteria.
We also have audited, in accordance with the standards of the Public Company Accounting Oversight Board (United States) (PCAOB), the consolidated balance sheets of the Company as of December 31, 2019 and 2018, the related consolidated statements of operations, changes in shareholders’ equity, and cash flows for each of the three years in the period ended December 31, 2019, and the related notes and our report dated March 5, 2020, expressed an unqualified opinion thereon.
Basis for Opinion
The Company’s management is responsible for maintaining effective internal control over financial reporting and for its assessment of the effectiveness of internal control over financial reporting included in the accompanying Management’s Report on Internal Control Over Financial Reporting. Our responsibility is to express an opinion on the Company’s internal control over financial reporting based on our audit. We are a public accounting firm registered with the PCAOB and are required to be independent with respect to the Company in accordance with the U.S. federal securities laws and the applicable rules and regulations of the Securities and Exchange Commission and the PCAOB.
We conducted our audit in accordance with the standards of the PCAOB. Those standards require that we plan and perform the audit to obtain reasonable assurance about whether effective internal control over financial reporting was maintained in all material respects.
Our audit included obtaining an understanding of internal control over financial reporting, assessing the risk that a material weakness exists, testing and evaluating the design and operating effectiveness of internal control based on the assessed risk, and performing such other procedures as we considered necessary in the circumstances. We believe that our audit provides a reasonable basis for our opinion.
Definitions and Limitations of Internal Control over Financial Reporting
A company’s internal control over financial reporting is a process designed to provide reasonable assurance regarding the reliability of financial reporting and the preparation of financial statements for external purposes in accordance with generally accepted accounting principles. A company’s internal control over financial reporting includes those policies and procedures that (1) pertain to the maintenance of records that, in reasonable detail, accurately and fairly reflect the transactions and dispositions of the assets of the company; (2) provide reasonable assurance that transactions are recorded as necessary to permit preparation of financial statements in accordance with generally accepted accounting principles, and that receipts and expenditures of the company are being made only in accordance with authorizations of management and directors of the company; and (3) provide reasonable assurance regarding prevention or timely detection of unauthorized acquisition, use, or disposition of the company’s assets that could have a material effect on the financial statements.
Because of its inherent limitations, internal control over financial reporting may not prevent or detect misstatements. Also, projections of any evaluation of effectiveness to future periods are subject to the risk that controls may become inadequate because of changes in conditions, or that the degree of compliance with the policies or procedures may deteriorate.
/s/ Ernst & Young LLP
New Orleans, Louisiana
March 5, 2020
On February 28, 2020, we entered into our Fifth Amendment to our Credit Agreement. The Fifth Amendment lowers (i) the ratio of current assets to current liabilities covenant from 2.00:1.00 to 1.25:1.00, and (ii) the base tangible net worth requirement for the minimum tangible net worth covenant from $170.0 million to $130.0 million. In addition, the Fifth Amended adds a new minimum cash, cash equivalents and short-term investments financial covenant of $40.0 million. The Fifth Amendment provides for no other changes. See Note 5 of our Financial Statements in Not applicable.
Item 8 for further discussion of our amendment.9C. Disclosure Regarding Foreign Jurisdiction That Prevent Inspections
On March 3, 2020, the Compensation Committee of the Company’s Board of Directors approved a special retention bonus program (the “Program”) for certain of the Company’s executive officers and senior managers, including Mr. Heo, our President and Chief Executive Officer, and Mr. Stockton, our Executive Vice President, Chief Financial Officer, Treasurer and Secretary. Participants in the Program will receive retention bonuses payable in cash conditioned on their continued employment with the Company through the payment date, payable in either one or two installments during 2020. Mr. Heo’s aggregate retention award is $200,000, and is payable in one installment on December 31, 2020, and Mr. Stockton’s aggregate retention award is $150,000, payable in installments of $50,000 and $100,000 on June 30, 2020 and December 31, 2020, respectively. The foregoing summary is qualified in its entirety by reference to the form of Notice of Retention Bonus Program, which will be filed as an exhibit to the Company’s Quarterly Report on Form 10-Q for the quarter ending March 31, 2020.Not applicable.
Item 10. Directors, Executive Officers and Corporate Governance
The information regarding executive officers called for by this item may be found following Item 4 of this Report under the caption “Information about our Executive Officers” and is incorporated herein by reference.
We have adopted a Code of Ethics for the Chief Executive Officer, the Chief Financial Officer, and the Chief Accounting Officer and persons performing similar functions (the “Code of Ethics”) and a Code of Business Conduct and Ethics, which applies to all employees and directors, including the Chief Executive Officer, the Chief Financial Officer, the Chief Accounting Officer and persons performing similar functions. These codes are available to the public on our Internet website at www.gulfisland.com. Any substantive amendments to the Code of Ethics or any waivers granted under the Code of Ethics will be disclosed within four business days of such event on our website. Such information will remain available on our website for at least 12twelve months.
The remaining information called for by this item may be found in our definitive proxy statement prepared in connection with our 20202023 annual meeting of shareholders and is incorporated herein by reference.
Item 11. Executive Compensation
Information called for by this item may be found in our definitive proxy statement prepared in connection with our 20202023 annual meeting of shareholders and is incorporated herein by reference.
Item 12. Security Ownership of Certain Beneficial Owners and Management and Related Stockholders Matters
Information regarding security ownership of certain beneficial owners and management called for by this item may be found in our definitive proxy statement prepared in connection with our 20202023 annual meeting of shareholders and is incorporated herein by reference.
Equity Compensation Plan Information
The following table provides information about our shares of common stock that may be issued upon the exercise of options, warrants and rights under all of our existing equity compensation plans as of December 31, 2019.
Plan Category |
| Number of securities to be issued upon exercise of outstanding options, warrants and rights |
|
| Weighted- average exercise price of outstanding options, warrants and rights |
| Number of securities remaining available for future issuance under equity compensation plans (excluding securities reflected in column 1) |
|
| ||
Equity compensation plans approved by security holders |
|
| 286,148 |
|
| N/A |
|
| 611,887 |
|
|
Equity compensation plans not approved by security holders |
|
| — |
|
|
|
|
| — |
|
|
Total |
|
| 286,148 |
| (1) |
|
|
| 611,887 |
| (2) |
|
|
|
|
Information called for by this item may be found in our definitive proxy statement prepared in connection with our 20202023 annual meeting of shareholders and is incorporated herein by reference.
Item 14. Principal Accounting Fees and Services
Information called for by this item may be found in our definitive proxy statement prepared in connection with our 20202023 annual meeting of shareholders and is incorporated herein by reference.
PART IV
Item 15. Exhibits, Financial Statement Schedules
The followingOur required financial statements,statement schedules and exhibits are filed as part of this Report:Report as detailed in our Exhibit Index on page E-1.
(i) Financial Statements
(ii) Schedules
Other schedules have not been included because they are not required, not applicable, immaterial, or the information required has been included elsewhere herein.
(iii) Exhibits
See Exhibit Index on page E-1. We will furnish to any eligible shareholder, upon written request, a copy of any exhibit listed upon payment of a reasonable fee equal to the Company’s expenses in furnishing such exhibit. Such requests should be addressed to:
Investor Relations
Gulf Island Fabrication, Inc.
16225 Park Ten2170 Buckthorne Place, Suite 300420
Houston,The Woodlands, Texas 7708477380
None.
Report of Independent RegisteredRegistered Public Accounting Firm
To the Shareholders and Board of Directors of Gulf Island Fabrication, Inc.
Opinion on the Financial Statements
We have audited the accompanying consolidated balance sheets of Gulf Island Fabrication, Inc. (the Company) as of December 31, 20192022 and 2018,2021, the related consolidated statements of operations, changes in shareholders’shareholders' equity and cash flows for each of the threetwo years in the period ended December 31, 2019,2022, and the related notes (collectively referred to as the “consolidated financial statements”). In our opinion, the consolidated financial statements present fairly, in all material respects, the financial position of the Company at December 31, 20192022 and 2018,2021, and the results of its operations and its cash flows for each of the threetwo years in the period ended December 31, 2019,2022, in conformity with U.S. generally accepted accounting principles.
We have also audited, in accordance with the standards of the Public Company Accounting Oversight Board (United States) (PCAOB), the Company's internal control over financial reporting as of December 31, 2019, based on criteria established in Internal Control-Integrated Framework issued by the Committee of Sponsoring Organizations of the Treadway Commission (2013 framework), and our report dated March 5, 2020, expressed an unqualified opinion thereon.
Basis for Opinion
These financial statements are the responsibility of the Company‘sCompany's management. Our responsibility is to express an opinion on the Company'sCompany’s financial statements based on our audits. We are a public accounting firm registered with the PCAOBPublic Company Accounting Oversight Board (United States) (PCAOB) and are required to be independent with respect to the Company in accordance with the U.S. federal securities laws and the applicable rules and regulations of the Securities and Exchange Commission and the PCAOB.
We conducted our audits in accordance with the standards of the PCAOB. Those standards require that we plan and perform the audit to obtain reasonable assurance about whether the financial statements are free of material misstatement, whether due to error or fraud. The Company is not required to have, nor were we engaged to perform, an audit of its internal control over financial reporting. As part of our audits we are required to obtain an understanding of internal control over financial reporting but not for the purpose of expressing an opinion on the effectiveness of the Company's internal control over financial reporting. Accordingly, we express no such opinion.
Our audits included performing procedures to assess the risks of material misstatement of the financial statements, whether due to error or fraud, and performing procedures that respond to those risks. Such procedures included examining, on a test basis, evidence regarding the amounts and disclosures in the financial statements. Our audits also included evaluating the accounting principles used and significant estimates made by management, as well as evaluating the overall presentation of the financial statements. We believe that our audits provide a reasonable basis for our opinion.
Critical Audit Matter
The critical audit matter communicated below is a matter arising from the current period audit of the financial statements that was communicated or required to be communicated to the audit committee and that: (1) relates to accounts or disclosures that are material to the financial statements and (2) involved our especially challenging, subjective or complex judgments. The communication of the critical audit matter does not alter in any way our opinion on the consolidated financial statements, taken as a whole, and we are not, by communicating the critical audit matter below, providing a separate opinion on the critical audit matter or on the accounts or disclosures to which it relates.
Revenue recognition for long-term contracts | |||
Description of the Matter | As described in Note 1 to the consolidated financial statements, the Company recognizes revenue for long-term contracts over time using the percentage-of-completion method based on contract costs incurred to date compared to total estimated contract costs (an input method). Under this approach, the determination of the progress towards completion requires management to prepare estimates of the costs to complete the contracts. These estimates are subject to considerable judgment and could be impacted by such items as changes to the project schedule; the cost of labor, material, and subcontractors; and productivity. In addition, management must also estimate the total contract revenue the Company expects to receive for the Company’s contracts that include variable consideration, such as increases to transaction prices for approved and unapproved change orders, claims, incentives and bonuses, and reductions to transaction price for liquidated damages and penalties. Auditing management’s estimate of the progress towards completion of long-term contracts was complex and subjective because of the judgment required to evaluate management’s determination of the estimated costs to complete such contracts. Further, auditing the Company’s measurement of variable consideration was also complex and judgmental as increases to transaction prices for approved and unapproved change orders, claims, bonuses, incentives and reduction to transaction price for liquidated damages or penalties can have a material effect on the amount of revenue recognized and may require significant estimation by management regarding various possible outcomes. |
F-1
How We Addressed the Matter in Our Audit | To test the Company’s estimated costs to complete long-term contracts, our audit procedures included, among others, evaluating the significant estimates used to develop the estimated costs to complete and testing the completeness and accuracy of the underlying data. To evaluate the significant estimates, we performed audit procedures that included, among others, comparing amounts to supporting documentation, conducting interviews with project personnel, inspecting support for estimates of project contingencies, and performing lookback analyses by comparing historical actual costs to previous estimates. To test the estimated variable consideration, we performed audit procedures that included, among others, obtaining and reviewing executed contracts including any significant amendments, change orders or claims; evaluating management’s estimates related to pending change orders, claims, liquidated damages or penalties by obtaining and recalculating management’s probability assessments; corroborating key data points to contractual language; and assessing the reasonableness of management’s assumptions by comparing to objective data points used. |
/s/ Ernst & Young LLP
We have served as the Company's auditor since 1997.
New Orleans, Louisiana
Houston, Texas
March 5, 202028, 2023
F-2
GULF ISLAND FABRICATION, INC.
(in thousands)
|
| December 31, |
| |||||
|
| 2022 |
|
| 2021 |
| ||
ASSETS |
|
|
|
|
|
| ||
Current assets: |
|
|
|
|
|
| ||
Cash and cash equivalents |
| $ | 33,221 |
|
| $ | 52,886 |
|
Restricted cash, current |
|
| 1,603 |
|
|
| 1,297 |
|
Short-term investments |
|
| 9,905 |
|
|
| — |
|
Contract receivables and retainage, net |
|
| 29,427 |
|
|
| 15,986 |
|
Contract assets |
|
| 4,839 |
|
|
| 4,759 |
|
Prepaid expenses and other assets |
|
| 6,475 |
|
|
| 6,971 |
|
Inventory |
|
| 1,599 |
|
|
| 1,779 |
|
Total current assets |
|
| 87,069 |
|
|
| 83,678 |
|
Restricted cash, noncurrent |
|
| — |
|
|
| 406 |
|
Property, plant and equipment, net |
|
| 31,154 |
|
|
| 34,666 |
|
Goodwill |
|
| 2,217 |
|
|
| 2,217 |
|
Other intangibles, net |
|
| 842 |
|
|
| 984 |
|
Other noncurrent assets |
|
| 13,584 |
|
|
| 13,322 |
|
Total assets |
| $ | 134,866 |
|
| $ | 135,273 |
|
LIABILITIES AND SHAREHOLDERS’ EQUITY |
|
|
|
|
|
| ||
Current liabilities: |
|
|
|
|
|
| ||
Accounts payable |
| $ | 8,310 |
|
| $ | 9,280 |
|
Contract liabilities |
|
| 8,196 |
|
|
| 6,648 |
|
Accrued expenses and other liabilities |
|
| 14,283 |
|
|
| 14,026 |
|
Total current liabilities |
|
| 30,789 |
|
|
| 29,954 |
|
Other noncurrent liabilities |
|
| 1,453 |
|
|
| 1,411 |
|
Total liabilities |
|
| 32,242 |
|
|
| 31,365 |
|
Shareholders’ equity: |
|
|
|
|
|
| ||
Preferred stock, no par value, 5,000 shares authorized, no shares |
|
| — |
|
|
| — |
|
Common stock, no par value, 30,000 shares authorized, 15,973 issued and |
|
| 11,591 |
|
|
| 11,384 |
|
Additional paid-in capital |
|
| 107,372 |
|
|
| 105,511 |
|
Accumulated deficit |
|
| (16,339 | ) |
|
| (12,987 | ) |
Total shareholders’ equity |
|
| 102,624 |
|
|
| 103,908 |
|
Total liabilities and shareholders’ equity |
| $ | 134,866 |
|
| $ | 135,273 |
|
|
| December 31, |
| |||||
|
| 2019 |
|
| 2018 |
| ||
ASSETS |
|
|
|
|
|
|
|
|
Current assets: |
|
|
|
|
|
|
|
|
Cash and cash equivalents |
| $ | 49,703 |
|
| $ | 70,457 |
|
Short-term investments |
|
| 19,918 |
|
|
| 8,720 |
|
Contracts receivable and retainage, net |
|
| 26,095 |
|
|
| 22,505 |
|
Contract assets |
|
| 52,128 |
|
|
| 29,982 |
|
Prepaid expenses and other assets |
|
| 3,948 |
|
|
| 3,268 |
|
Inventory |
|
| 2,676 |
|
|
| 6,088 |
|
Assets held for sale |
|
| 9,006 |
|
|
| 18,935 |
|
Total current assets |
|
| 163,474 |
|
|
| 159,955 |
|
Property, plant and equipment, net |
|
| 70,484 |
|
|
| 79,930 |
|
Other noncurrent assets |
|
| 18,819 |
|
|
| 18,405 |
|
Total assets |
| $ | 252,777 |
|
| $ | 258,290 |
|
LIABILITIES AND SHAREHOLDERS’ EQUITY |
|
|
|
|
|
|
|
|
Current liabilities: |
|
|
|
|
|
|
|
|
Accounts payable |
| $ | 61,542 |
|
| $ | 28,969 |
|
Contract liabilities |
|
| 26,271 |
|
|
| 16,845 |
|
Accrued expenses and other liabilities |
|
| 10,031 |
|
|
| 10,287 |
|
Total current liabilities |
|
| 97,844 |
|
|
| 56,101 |
|
Other noncurrent liabilities |
|
| 2,248 |
|
|
| 1,089 |
|
Total liabilities |
|
| 100,092 |
|
|
| 57,190 |
|
Shareholders’ equity: |
|
|
|
|
|
|
|
|
Preferred stock, no par value, 5,000 shares authorized, no shares issued and outstanding |
|
| — |
|
|
| — |
|
Common stock, no par value, 30,000 shares authorized, 15,263 issued and outstanding at December 31, 2019 and 15,090 at December 31, 2018 |
|
| 11,119 |
|
|
| 11,021 |
|
Additional paid-in capital |
|
| 103,124 |
|
|
| 102,243 |
|
Retained earnings |
|
| 38,442 |
|
|
| 87,836 |
|
Total shareholders’ equity |
|
| 152,685 |
|
|
| 201,100 |
|
Total liabilities and shareholders’ equity |
| $ | 252,777 |
|
| $ | 258,290 |
|
The accompanying notes are an integral part of these financial statements.
F-3
CONSOLIDATED STATEMENTS OF OPERATIONS
(in thousands, except per share data)
|
| Years Ended December 31, |
|
| Years Ended December 31, |
| ||||||||||||||
|
| 2019 |
|
| 2018 |
|
| 2017 |
|
| 2022 |
|
| 2021 |
| |||||
Revenue |
| $ | 303,308 |
|
| $ | 221,247 |
|
| $ | 171,022 |
|
| $ | 142,320 |
|
| $ | 93,452 |
|
Cost of revenue |
|
| 320,307 |
|
|
| 228,443 |
|
|
| 213,947 |
|
|
| 134,425 |
|
|
| 91,788 |
|
Gross loss |
|
| (16,999 | ) |
|
| (7,196 | ) |
|
| (42,925 | ) | ||||||||
Gross profit |
|
| 7,895 |
|
|
| 1,664 |
| ||||||||||||
General and administrative expense |
|
| 15,628 |
|
|
| 19,015 |
|
|
| 17,800 |
|
|
| 18,214 |
|
|
| 11,848 |
|
Impairments and (gain) loss on assets held for sale |
|
| 17,528 |
|
|
| (6,850 | ) |
|
| 7,931 |
| ||||||||
Other (income) expense, net |
|
| (134 | ) |
|
| 304 |
|
|
| (46 | ) |
|
| (6,904 | ) |
|
| 3,300 |
|
Operating loss |
|
| (50,021 | ) |
|
| (19,665 | ) |
|
| (68,610 | ) |
|
| (3,415 | ) |
|
| (13,484 | ) |
Gain on extinguishment of debt |
|
| — |
|
|
| 9,061 |
| ||||||||||||
Interest (expense) income, net |
|
| 531 |
|
|
| (142 | ) |
|
| (349 | ) |
|
| 86 |
|
|
| (397 | ) |
Net loss before income taxes |
|
| (49,490 | ) |
|
| (19,807 | ) |
|
| (68,959 | ) | ||||||||
Loss before income taxes |
|
| (3,329 | ) |
|
| (4,820 | ) | ||||||||||||
Income tax (expense) benefit |
|
| 96 |
|
|
| (571 | ) |
|
| 24,193 |
|
|
| (23 | ) |
|
| 24 |
|
Loss from continuing operations |
|
| (3,352 | ) |
|
| (4,796 | ) | ||||||||||||
Loss from discontinued operations, net of taxes |
|
| — |
|
|
| (17,372 | ) | ||||||||||||
Net loss |
| $ | (49,394 | ) |
| $ | (20,378 | ) |
| $ | (44,766 | ) |
| $ | (3,352 | ) |
| $ | (22,168 | ) |
Per share data: |
|
|
|
|
|
|
|
|
|
|
|
|
|
|
|
|
| |||
Basic and diluted loss per common share |
| $ | (3.24 | ) |
| $ | (1.36 | ) |
| $ | (3.02 | ) | ||||||||
Cash dividends per common share |
| $ | — |
|
| $ | — |
|
| $ | 0.04 |
| ||||||||
Basic and diluted loss from continuing operations |
| $ | (0.21 | ) |
| $ | (0.31 | ) | ||||||||||||
Basic and diluted loss from discontinued operations |
|
| — |
|
|
| (1.12 | ) | ||||||||||||
Basic and diluted loss per share |
| $ | (0.21 | ) |
| $ | (1.43 | ) | ||||||||||||
The accompanying notes are an integral part of these financial statements.
F-4
(in thousands)
|
| Common Stock |
|
| Additional Paid-In |
|
| Retained |
|
| Total Shareholders' |
| ||||||||||||||||||||||||||||
|
| Shares |
|
| Amount |
|
| Capital |
|
| Earnings |
|
| Equity |
|
| Common Stock |
|
| Additional |
| Retained Earnings |
| Total |
| |||||||||||||||
Balance at January 1, 2017 |
|
| 14,695 |
|
| $ | 10,641 |
|
| $ | 98,813 |
|
| $ | 153,578 |
|
| $ | 263,032 |
| ||||||||||||||||||||
|
| Shares |
|
| Amount |
|
| Capital |
|
| Deficit) |
|
| Equity |
| |||||||||||||||||||||||||
Balance at January 1, 2021 |
|
| 15,359 |
|
| $ | 11,223 |
|
| $ | 104,072 |
|
| $ | 9,181 |
|
| $ | 124,476 |
| ||||||||||||||||||||
Net loss |
|
| — |
|
|
| — |
|
|
| — |
|
|
| (44,766 | ) |
|
| (44,766 | ) |
|
| — |
|
|
| — |
|
|
| — |
|
|
| (22,168 | ) |
|
| (22,168 | ) |
Vesting of restricted stock |
|
| 215 |
|
|
| (92 | ) |
|
| (824 | ) |
|
| — |
|
|
| (916 | ) |
|
| 263 |
|
|
| (10 | ) |
|
| (98 | ) |
|
| — |
|
|
| (108 | ) |
Stock-based compensation expense |
|
| — |
|
|
| 274 |
|
|
| 2,467 |
|
|
| — |
|
|
| 2,741 |
|
|
| — |
|
|
| 171 |
|
|
| 1,537 |
|
|
| — |
|
|
| 1,708 |
|
Dividends on common stock |
|
| — |
|
|
| — |
|
|
| — |
|
|
| (598 | ) |
|
| (598 | ) | ||||||||||||||||||||
Balance at December 31, 2017 |
|
| 14,910 |
|
| $ | 10,823 |
|
| $ | 100,456 |
|
| $ | 108,214 |
|
| $ | 219,493 |
| ||||||||||||||||||||
Balance at December 31, 2021 |
|
| 15,622 |
|
|
| 11,384 |
|
|
| 105,511 |
|
|
| (12,987 | ) |
|
| 103,908 |
| ||||||||||||||||||||
Net loss |
|
| — |
|
|
| — |
|
|
| — |
|
|
| (20,378 | ) |
|
| (20,378 | ) |
|
| — |
|
|
| — |
|
|
| — |
|
|
| (3,352 | ) |
|
| (3,352 | ) |
Vesting of restricted stock |
|
| 180 |
|
|
| (81 | ) |
|
| (729 | ) |
|
| — |
|
|
| (810 | ) |
|
| 351 |
|
|
| (23 | ) |
|
| (211 | ) |
|
| — |
|
|
| (234 | ) |
Stock-based compensation expense |
|
| — |
|
|
| 279 |
|
|
| 2,516 |
|
|
| — |
|
|
| 2,795 |
|
|
| — |
|
|
| 230 |
|
|
| 2,072 |
|
|
| — |
|
|
| 2,302 |
|
Balance at December 31, 2018 |
|
| 15,090 |
|
| $ | 11,021 |
|
| $ | 102,243 |
|
| $ | 87,836 |
|
| $ | 201,100 |
| ||||||||||||||||||||
Net loss |
|
| — |
|
|
| — |
|
|
| — |
|
|
| (49,394 | ) |
|
| (49,394 | ) | ||||||||||||||||||||
Vesting of restricted stock |
|
| 173 |
|
|
| (79 | ) |
|
| (716 | ) |
|
| — |
|
|
| (795 | ) | ||||||||||||||||||||
Stock-based compensation expense |
|
| — |
|
|
| 177 |
|
|
| 1,597 |
|
|
| — |
|
|
| 1,774 |
| ||||||||||||||||||||
Balance at December 31, 2019 |
|
| 15,263 |
|
| $ | 11,119 |
|
| $ | 103,124 |
|
| $ | 38,442 |
|
| $ | 152,685 |
| ||||||||||||||||||||
Balance at December 31, 2022 |
|
| 15,973 |
|
| $ | 11,591 |
|
| $ | 107,372 |
|
| $ | (16,339 | ) |
| $ | 102,624 |
| ||||||||||||||||||||
The accompanying notes are an integral part of these financial statements.
F-5
GULF ISLAND FABRICATION, INC.
CONSOLIDATED STATEMENTS OF CASH FLOWS
(in thousands)
|
| Years Ended December 31, |
|
| Years Ended December 31, |
| ||||||||||||||
|
| 2019 |
|
| 2018 |
|
| 2017 |
|
| 2022 |
|
| 2021 |
| |||||
Cash flows from operating activities: |
|
|
|
|
|
|
|
|
|
|
|
|
|
|
|
|
| |||
Net loss |
| $ | (49,394 | ) |
| $ | (20,378 | ) |
| $ | (44,766 | ) |
| $ | (3,352 | ) |
| $ | (22,168 | ) |
Adjustments to reconcile net loss to net cash used in operating activities: |
|
|
|
|
|
|
|
|
|
|
|
|
|
|
|
|
| |||
Depreciation and lease asset amortization |
|
| 9,564 |
|
|
| 10,350 |
|
|
| 12,745 |
| ||||||||
Other amortization, net |
|
| 50 |
|
|
| 80 |
|
|
| (1,844 | ) | ||||||||
Bad debt expense |
|
| 59 |
|
|
| 30 |
|
|
| 21 |
| ||||||||
Depreciation and amortization |
|
| 5,098 |
|
|
| 5,386 |
| ||||||||||||
Asset impairments |
|
| 17,223 |
|
|
| 4,445 |
|
|
| 7,672 |
|
|
| 484 |
|
|
| 22,750 |
|
(Gain) loss on assets held for sale, net |
|
| (369 | ) |
|
| (7,724 | ) |
|
| 259 |
| ||||||||
Loss on Shipyard Transaction |
|
| — |
|
|
| 2,581 |
| ||||||||||||
Loss on sale or disposal of fixed assets, net |
|
| 19 |
|
|
| 33 |
| ||||||||||||
Gain on extinguishment of debt |
|
| — |
|
|
| (9,061 | ) | ||||||||||||
Gain on insurance recoveries |
|
| — |
|
|
| (3,571 | ) |
| — |
|
|
| (1,200 | ) |
|
| — |
| |
(Gain) loss on sale of fixed assets and other assets, net |
|
| (584 | ) |
|
| 268 |
|
|
| (35 | ) | ||||||||
Deferred income taxes |
|
| (10 | ) |
|
| 200 |
|
|
| (23,234 | ) | ||||||||
Stock-based compensation expense |
|
| 1,774 |
|
|
| 2,795 |
|
|
| 2,741 |
|
|
| 2,302 |
|
|
| 1,708 |
|
Changes in operating assets and liabilities: |
|
|
|
|
|
|
|
|
|
|
|
|
|
|
|
|
| |||
Contracts receivable and retainage, net |
|
| (3,650 | ) |
|
| 2,962 |
|
|
| (8,319 | ) | ||||||||
Contract receivables and retainage, net |
|
| (13,441 | ) |
|
| (593 | ) | ||||||||||||
Contract assets |
|
| (22,145 | ) |
|
| (26,932 | ) |
|
| (1,544 | ) |
|
| (80 | ) |
|
| (6,949 | ) |
Prepaid expenses, inventory and other current assets |
|
| 2,556 |
|
|
| (3,162 | ) |
|
| 782 |
|
|
| 2,224 |
|
|
| 1,895 |
|
Accounts payable |
|
| 30,950 |
|
|
| 10,515 |
|
|
| 9,354 |
|
|
| (1,088 | ) |
|
| (11,491 | ) |
Contract liabilities |
|
| 9,425 |
|
|
| 12,371 |
|
|
| 8,390 |
|
|
| 1,548 |
|
|
| (6,882 | ) |
Accrued expenses and other liabilities |
|
| (1,099 | ) |
|
| (3,352 | ) |
|
| (3,177 | ) | ||||||||
Noncurrent assets and liabilities, net (including long-term retainage) |
|
| (1,490 | ) |
|
| 711 |
|
|
| 1,570 |
| ||||||||
Accrued expenses and other current liabilities |
|
| (561 | ) |
|
| (1,257 | ) | ||||||||||||
Noncurrent assets and liabilities, net |
|
| (876 | ) |
|
| (766 | ) | ||||||||||||
Net cash used in operating activities |
|
| (7,140 | ) |
|
| (20,392 | ) |
|
| (39,385 | ) |
|
| (8,923 | ) |
|
| (24,814 | ) |
Cash flows from investing activities: |
|
|
|
|
|
|
|
|
|
|
|
|
|
|
|
|
| |||
Capital expenditures |
|
| (3,086 | ) |
|
| (1,483 | ) | ||||||||||||
Proceeds from Shipyard Transaction, net of transaction costs |
|
| 886 |
|
|
| 32,992 |
| ||||||||||||
DSS Acquisition |
|
| — |
|
|
| (7,573 | ) | ||||||||||||
Proceeds from sale of property and equipment |
|
| 2,035 |
|
|
| 4,466 |
| ||||||||||||
Recoveries from insurance claims |
|
| 1,200 |
|
|
| 1,000 |
| ||||||||||||
Purchases of short-term investments |
|
| (65,284 | ) |
|
| (9,610 | ) |
|
| — |
|
|
| (9,905 | ) |
|
| — |
|
Maturities of short-term investments |
|
| 54,086 |
|
|
| 1,200 |
|
|
| — |
|
|
| — |
|
|
| 8,000 |
|
Capital expenditures |
|
| (3,790 | ) |
|
| (3,481 | ) |
|
| (4,834 | ) | ||||||||
Proceeds from sale of property, plant and equipment |
|
| 2,217 |
|
|
| 85,247 |
|
|
| 2,155 |
| ||||||||
Recoveries from insurance claims |
|
| — |
|
|
| 9,362 |
|
|
| 1,544 |
| ||||||||
Net cash provided by (used in) investing activities |
|
| (12,771 | ) |
|
| 82,718 |
|
|
| (1,135 | ) |
|
| (8,870 | ) |
|
| 37,402 |
|
Cash flows from financing activities: |
|
|
|
|
|
|
|
|
|
|
|
|
|
|
|
|
| |||
Proceeds from borrowings under Credit Agreement |
|
| — |
|
|
| 15,000 |
|
|
| 2,000 |
| ||||||||
Repayment of borrowings under Credit Agreement |
|
| — |
|
|
| (15,000 | ) |
|
| (2,000 | ) | ||||||||
Payment of financing cost |
|
| (48 | ) |
|
| (42 | ) |
|
| (150 | ) | ||||||||
Repayment of borrowings |
|
| — |
|
|
| (1,050 | ) | ||||||||||||
Payments on Insurance Finance Arrangement |
|
| (1,738 | ) |
|
| — |
| ||||||||||||
Tax payments for vested stock withholdings |
|
| (795 | ) |
|
| (810 | ) |
|
| (916 | ) |
|
| (234 | ) |
|
| (108 | ) |
Payments of dividends on common stock |
|
| — |
|
|
| — |
|
|
| (598 | ) | ||||||||
Net cash used in financing activities |
|
| (843 | ) |
|
| (852 | ) |
|
| (1,664 | ) |
|
| (1,972 | ) |
|
| (1,158 | ) |
Net increase (decrease) in cash and cash equivalents |
|
| (20,754 | ) |
|
| 61,474 |
|
|
| (42,184 | ) | ||||||||
Cash and cash equivalents, beginning of period |
|
| 70,457 |
|
|
| 8,983 |
|
|
| 51,167 |
| ||||||||
Cash and cash equivalents, end of period |
| $ | 49,703 |
|
| $ | 70,457 |
|
| $ | 8,983 |
| ||||||||
Net increase (decrease) in cash, cash equivalents and restricted cash |
|
| (19,765 | ) |
|
| 11,430 |
| ||||||||||||
Cash, cash equivalents and restricted cash, beginning of period |
|
| 54,589 |
|
|
| 43,159 |
| ||||||||||||
Cash, cash equivalents and restricted cash, end of period |
| $ | 34,824 |
|
| $ | 54,589 |
| ||||||||||||
Supplemental cash flow information: |
|
|
|
|
|
|
|
|
|
|
|
|
|
|
|
|
| |||
Remaining Transaction Price receivable from Shipyard Transaction |
| $ | — |
|
| $ | 886 |
| ||||||||||||
Forgiveness of principal and interest of PPP Loan |
| $ | — |
|
| $ | 9,061 |
| ||||||||||||
Interest paid |
| $ | 470 |
|
| $ | 352 |
|
| $ | 349 |
|
| $ | 149 |
|
| $ | 264 |
|
Income taxes paid (refunds received), net |
| $ | 63 |
|
| $ | 6 |
|
| $ | 189 |
|
| $ | — |
|
| $ | — |
|
Reclassification of property, plant and equipment to assets held for sale |
| $ | 294 |
|
| $ | — |
|
| $ | 109,488 |
| ||||||||
Reclassification of assets held for sale to property, plant and equipment |
| $ | 1,162 |
|
| $ | 866 |
|
| $ | — |
| ||||||||
Reclassification of accrued expenses to assets held for sale |
| $ | — |
|
| $ | 3,245 |
|
| $ | — |
| ||||||||
Accounts payable excluded from capital expenditures |
| $ | 217 |
|
| $ | 98 |
| ||||||||||||
The accompanying notes are an integral part of these financial statements.
F-5F-6
GULF ISLAND FABRICATION, INC.
NOTES TO CONSOLIDATED FINANCIAL STATEMENTS
DECEMBER 31, 20192022
1. ORGANIZATION AND SUMMARY OF SIGNIFICANT ACCOUNTING POLICIES
Nature of Operations
Gulf Island Fabrication, Inc. (together with its subsidiaries, “Gulf Island,” "the“the Company," "we," "us"” “we,” “us” and "our"“our”) is a leading fabricator of complex steel structures modules and marine vessels,modules and a provider of specialty services, including project management, hookup, commissioning, repair, maintenance, andscaffolding, coatings, welding enclosures, civil construction services.and staffing services to the industrial and energy sectors. Our customers include United States ("U.S.") and, to a lesser extent, international energy producers; refining, petrochemical, LNG, industrial and power operators; and marine operators; EPC companies; and certain agencies of the U.S. government.companies. We currently operate and manage our business through three operating divisions ("Fabrication"(“Services”, "Shipyard"“Fabrication” and "Services"“Shipyard”) and one non-operating division ("Corporate"(“Corporate”), which represent our reportable segments. Our corporate headquarters is located in Houston,The Woodlands, Texas withand our primary operating facilities are located in Houma, Jennings and Lake Charles, Louisiana.Louisiana (“Houma Facilities”). See Note 311 for discussion of our anticipated closurerealigned reportable segments.
On April 19, 2021, we sold our Shipyard Division operating assets and certain construction contracts (“Shipyard Transaction”) and intend to wind down our remaining Shipyard Division operations (which exclude the projects that are subject to our MPSV Litigation) by the second quarter 2023 (previously the first quarter 2023, but delayed and subject to the potential schedule impacts discussed in Note 2). See “Basis of Presentation” below and Note 3 for further discussion of the Jennings Yard.Shipyard Transaction and Note 9 for discussion of our MPSV Litigation.
Significant projects in our backlog includeOn December 1, 2021, we acquired (“DSS Acquisition”) the expansionservices and industrial staffing businesses (“DSS Business”) of a paddle wheel riverboat; the fabrication of an offshore jacket and deck and modules for an offshore facility; material supply for an offshore jacket and deck; and construction of four harbor tug vessels, three regional class research vessels, three vehicle ferries, an ice-breaker tug, and three towing, salvage and rescue ships. Projects completed in recent years include the fabrication of petrochemical modules and a meteorological tower and platform for an offshore wind project and construction of two technologically-advanced OSVs, six harbor tug vessels and two towboats. Other completed projects include the fabrication of wind turbine foundations for the first offshore wind project in the U.S., and construction of twoDynamic Industries, Inc. (“Dynamic”). The operating results of the largest liftboats servicing the Gulf of Mexico ("GOM"), oneDSS Business are included within our Services Division. See Note 4 for further discussion of the deepest production jackets in the GOM, and the first single point anchor reservoir ("SPAR") hull fabricated in the U.S.DSS Acquisition.
Basis of Presentation
The accompanying Consolidated Financial Statements ("(“Financial Statements"Statements”) reflect all wholly owned subsidiaries. Intercompany balances and transactions have been eliminated in consolidation. The Financial Statements have been prepared in accordance with the rules and regulations of the U.S. Securities and Exchange Commission (the "SEC"“SEC”) and accounting principles generally accepted in the U.S. ("GAAP"(“GAAP”).
Liquidity Outlook
In recent years our operating resultsWe determined that the Shipyard Division assets, liabilities and cash flows have been impacted by lower margins due to competitive pricing, a significant underutilization of our facilities and losses on certain projects. As a result, we implemented initiatives to improve and maintain our liquidity, reduce our reliance on the fabrication of structures and marine vesselsoperations associated with the offshore oilShipyard Transaction, and gas sector, improvecertain previously closed Shipyard Division facilities, were discontinued operations in 2021. Accordingly, such operating results for 2021 have been classified as discontinued operations on our resource utilizationConsolidated Statements of Operations (“Statement of Operations”). We had no material operating results of discontinued operations for 2022, and centralizehad no material assets or liabilities of discontinued operations at December 31, 2022 or 2021. Discontinued operations are not presented separately on our key project resources,Consolidated Statements of Cash Flows (“Statement of Cash Flows”) or our Consolidated Statements of Changes in Shareholders’ Equity (“Statement of Shareholders’ Equity”). Unless otherwise noted, the amounts presented throughout the notes to our Financial Statements relate to our continuing operations. See Note 3 for further discussion of the Shipyard Transaction and improve our competitiveness and project execution. These initiatives are ongoing, and while we can provide no assurances that the initiatives will achieve our desired results, we believe our cash, cash equivalents, short-term investments and availability under our Credit Agreement (defined in Note 5), will be sufficient to enable us to fund our operating expenses, meet our working capital and capital expenditure requirements, and satisfy any debt service obligations or other funding requirements, for at least twelve months from the filing date of this Report.discontinued operations.
Operating Cycle
The durationsduration of our contracts vary, but typicallymay extend beyond twelve months from the date of contract award. Consistent with industry practice, assets and liabilities have been classified as current under the operating cycle concept whereby all contract-related items are classified as current regardless of whether cash will be received or paid within a twelve-month period. Assets and liabilities classified as current, which may not be received or paid within the next twelve months, include contract retainage, contract assets deferred revenue and contract liabilities. Variations from normal contract terms may result in the classification of assets and liabilities as long-term.
F-6F-7
GULF ISLAND FABRICATION, INC.
NOTES TO CONSOLIDATED FINANCIAL STATEMENTS-(Continued)
General –The preparation of our Financial Statements in conformity with GAAP requires us to make estimates and judgments that affect the reported amounts of assets, liabilities, revenue and expenses and related disclosures of contingent assets and liabilities. We believe our most significant estimates and judgments are associated with with:
If the underlying estimates and assumptions upon which our Financial Statements are based change in the future, actual amounts may differ materially from those included in the Financial Statements.
LossOil and Gas Price Volatility and Macroeconomic Conditions – Since 2008, the prices of oil and gas have experienced significant volatility, including depressed prices over extended periods, resulting in reductions in capital spending and drilling activities from our traditional offshore oil and gas customer base. Consequently, our operating results and cash flows were negatively impacted as we experienced reductions in revenue, lower margins due to competitive pricing and under-utilization of our operating facilities and resources. Beginning in 2020, the global coronavirus pandemic (“COVID-19”) added another layer of pressure and uncertainty on oil and gas prices (with oil prices reaching a twenty-year low and gas prices reaching a four-year low), which further negatively impacted certain of our end markets during 2021 and the first quarter 2022. This volatility in oil and gas prices has been compounded by Russia’s invasion of Ukraine in February 2022 (and the related European energy crisis), and the U.S. and other countries actions in response (with oil prices reaching an eight-year high and gas prices reaching a fourteen-year high), which has and may continue to positively impact certain of our end markets; however, the duration and broader consequences of this conflict continue to be difficult to predict.
In addition, global economic factors that are beyond our control, have and could continue to impact our operations, including, but are not limited to, supply chain disruptions (including global shipping and logistics challenges that began in 2020), inflationary pressures, economic slowdowns and recessions, natural disasters, public health crises (such as COVID-19), and geopolitical conflicts (such as the conflict in Ukraine).
The ultimate business and financial impacts of oil and gas price volatility and macroeconomic conditions on our business and results of operations continues to be uncertain, but the impacts have included, or may continue to include, among other things, reduced bidding activity; suspension or termination of backlog; deterioration of customer financial condition; and unanticipated project costs and schedule delays due to supply chain disruptions, labor and material price increases, lower labor productivity, increased employee and contractor absenteeism and turnover, craft labor hiring challenges, increased safety incidents, lack of performance by subcontractors and suppliers, and contract disputes. We continue to monitor the impacts of oil and gas price volatility and macroeconomic conditions on our operations, and our estimates in future periods will be revised for any events and changes in circumstances arising after the date of this Report.
Income (Loss) Per Share
Basic lossincome (loss) per share ("EPS") is calculated by dividing net income or loss by the weighted average number of common shares outstanding for the period. Diluted EPSincome (loss) per share reflects the assumed conversion of dilutive securities.securities in periods in which income is reported. See Note 910 for calculations of our basic and diluted EPS.income (loss) per share.
F-8
GULF ISLAND FABRICATION, INC.
NOTES TO CONSOLIDATED FINANCIAL STATEMENTS-(Continued)
Cash Equivalents and Short-term Investments
Cash Equivalents - –We consider investments with original maturities of three months or less when purchased to be cash equivalents. We hold substantially all of our cash deposits with Hancock Whitney Bank (“Whitney Bank”).
Restricted Cash – At December 31, 2022 and 2021, we had $1.6 million and $1.7 million, respectively, of restricted cash as security for letters of credit issued under our letter of credit facility (“LC Facility”) with Whitney Bank. Our restricted cash is held in an interest-bearing money market account with Whitney Bank. The classification of the restricted cash as current and noncurrent is determined by the contractual maturity dates of the letters of credit being secured, with letters of credit having maturity dates of twelve months or less from the balance sheet date classified as current, and letters of credit having maturity dates of longer than twelve months from the balance sheet date classified as noncurrent. See Note 6 for further discussion of our cash security requirements under our LC Facility.
Short-term Investments -– We consider investments with original maturities of more than three months but less than twelve months to be short-term investments. At December 31, 2019,2022, our short-term investments includeincluded U.S. Treasuries with original maturities of less than six months. We intend to hold these investments until maturity and it is not more likely than not that we wouldwill be required to sell the investments prior to their maturity. The investments are stated at amortized costs, which approximates fair value due to their near-term maturities. All short-term investments are traded on active markets with quoted prices and represent levelLevel 1 fair value measurements. We had no short-term investments at December 31, 2021.
Inventory
Inventory
Inventory is recorded at the lower of cost or net realizable value determined using the first-in-first-out basis. The cost of inventory includes acquisition costs, production or conversion costs, and other costs incurred to bring the inventory to a current location and condition. Net realizable value is our estimated selling price in the normal course of business, less reasonably predictable costs of completion, disposal and transportation. An allowance for excess or inactive inventory is recorded based on an analysis that considers current inventory levels, historical usage patterns, estimates of future sales and salvage value. See Note 3 for further discussion of our inventory impairments.
Allowance for Doubtful Accounts
In the normal course of business, we extend credit to our customers on a short-term basis and contract receivables are generally not collateralized; however, we typically have the right to place liens on our projects in the event of nonpayment by our customers. We routinely review individual contract receivable balances for collectibilitycollectability and make provisions for probable uncollectible amounts as necessary. Among the factors considered in our review are the financial condition of our customer and its access to financing, underlying disputes with the customer, the age and value of the receivable balance, and economic conditions in general. See Note 2 for further discussion of our allowance for doubtful accounts.
Stock-Based Compensation
Awards under our stock-based compensation plans are calculated using a fair value-based measurement method. We use the straight-line methodand graded vesting methods to recognize share-based compensation expense over the requisite service period of the award. We recognize the excess tax benefit or tax deficiency resulting from the difference between the deduction we receive for tax purposes and the stock-based compensation expense we recognize for financial reporting purposes created when common stock vests, as an income tax benefit or expense on our Consolidated Statements of Operations (“Statement of Operations”). See Note 7 for further discussion of our stock-based and other compensation plans.
Operations. Tax payments made on behalf of employees to taxing authorities in order to satisfy employee income tax withholding obligations from the vesting of shares under our stock-based compensation plans are classified as a financing activity on our Consolidated Statements of Cash Flows ("Statement of Cash Flows").
F-7
GULF ISLAND FABRICATION, INC.
NOTES TO CONSOLIDATED FINANCIAL STATEMENTS-(Continued)
Assets held for sale are measured at the lower of their carrying amount or fair value less cost to sell.Flows. See Note 38 for further discussion of our assets held for sale.stock-based and other compensation plans.
Depreciation and Amortization Expense
Depreciation Expense
We depreciate property,Property, plant and equipment are depreciated on a straight-line basis over estimated useful lives ranging from three to 25 years.years. Ordinary maintenance and repairs, which do not extend the physical or economic lives of the plant or equipment, are charged to expense as incurred. Intangible assets are amortized on a straight-line basis over seven years and amortization expense is reflected within general and administrative expense on our Statement of Operations. See Note 45 for further discussion of our property, plant and equipment.equipment and Note 4 for further discussion of our intangible assets.
F-9
GULF ISLAND FABRICATION, INC.
NOTES TO CONSOLIDATED FINANCIAL STATEMENTS-(Continued)
Long-Lived Assets
We review long-lived assetsGoodwill –Goodwill (associated with the DSS Acquisition) is not amortized, but instead is reviewed for impairment which includeat least annually at a reporting unit level, absent any indicators of impairment or when other actions require an impairment assessment (such as a change in reporting units). We perform our annual impairment assessment during the fourth quarter of each year based upon balances as of October 1. In evaluating goodwill for impairment, we have the option to first assess qualitative factors to determine whether it is more likely than not that the fair value of our reporting unit is greater than its carrying value. If we determine that it is more likely than not that the carrying value of the reporting unit is greater than its fair value, we perform a quantitative impairment test by calculating the fair value of the reporting unit and comparing it to the carrying value of the reporting unit, and we recognize an impairment charge to the extent its carrying value exceeds its fair value. To determine the fair value of our reporting unit and test for impairment, we utilize an income approach (discounted cash flow method) as we believe this is the most direct approach to incorporate the specific economic attributes and risk profile of our reporting unit into our valuation model. If, based on future assessments, our goodwill is deemed to be impaired, the impairment would result in a charge to our operating results in the period of impairment. See Note 4 for further discussion of the DSS Acquisition and related goodwill impairment assessment.
Other Long-Lived Assets –Our property, plant and equipment, and our lease assets included(included within other noncurrent assets) and finite-lived intangible assets (associated with the DSS Acquisition) are reviewed for impairment when events or changes in circumstances indicate that the carrying amount may not be recoverable. If a recoverability assessment is required, we compare the estimated future undiscounted cash flow associated with the asset or asset group is compared to its carrying amount to determine if an impairment exists. An asset group constitutes the minimum level for which identifiable cash flows are principally independent of the cash flows of other assets or asset groups. An impairment loss is measured by comparing the fair value of the asset or asset group to its carrying amount and recording the excess of the carrying amount of the asset or asset group over its fair value is recorded as an impairment charge. Fair value is determined based on discounted cash flows, appraised values or third-party indications of value, as appropriate. We had no indicators of impairment during 2022. See Note 2 for discussion of our long-lived asset impairments associated with Hurricane Ida, Note 3 for discussion of our long-lived asset impairments within discontinued operations, Note 4 for discussion of long-lived assets associated with the DSS Acquisition and Note 5 for further discussion of impairmentsour corporate office lease impairment.
Leases
We record a right-of-use asset and an offsetting lease liability on our Balance Sheet equal to the present value of our long-lived assets.lease payments for leases with an original term of longer than twelve months. We do not record an asset or liability for leases with an original term of twelve months or less and we do not separate lease and non-lease components for our leases. Our lease assets are reflected within other noncurrent assets, and the current and noncurrent portions of our lease liabilities are reflected within accrued expenses and other liabilities, and other noncurrent liabilities, respectively, on our Consolidated Balance Sheets (“Balance Sheet”). For leases with escalations over the life of the lease, we recognize expense on a straight-line basis. See Note 5 for further discussion of our lease assets and liabilities.
Fair Value Measurements
Our fairFair value determinations for financial assets and liabilities are based on the particular facts and circumstances. Financial instruments are required to be categorized within a valuation hierarchy based upon the lowest level of input that is significant to the fair value measurement. The three levels of the valuation hierarchy are as follows:
Level 1 -– inputs are based upon quoted prices for identical instruments traded in active markets.
Level 2 -– inputs are based upon quoted prices for similar instruments in active markets and model-based valuation techniques for which all significant assumptions are observable in the market.
Level 3 -– inputs are based upon model-based valuation techniques for which significant assumptions are generally not observable in the market and typically reflect estimates and assumptions that we believe market participants would use in pricing the asset or liability. These include discounted cash flow models and similar valuation techniques.
The carrying amounts of our financial instruments, including cash and cash equivalents, short-term investments, accounts receivable and accounts payable approximate their fair values. See Note 3Our fair value assessments for discussion ofdetermining the impairments of ourgoodwill, inventory, long-lived assets and assets-held-forassets held for sale, are non-recurring fair value measurements that fall within Level 3 of the fair value hierarchy. See Note 4 for discussion of the fair value measurements associated with the DSS Acquisition and Note 5 for further discussion of our previous assets held for sale.
F-10
GULF ISLAND FABRICATION, INC.
NOTES TO CONSOLIDATED FINANCIAL STATEMENTS-(Continued)
Revenue Recognition
General - – Our revenue is derived from customer contracts and agreements that are awarded on a competitively bid and negotiated basis using a range of contracting options, including fixed-price, unit-rate, time and materials (“T&M.&M”) and cost-reimbursable, or a combination thereof. Our contracts primarily relate to the fabrication and construction of steel structures and modules, and marine vessels, and project management services and othercertain service arrangements.
We recognize revenue forfrom our contracts in accordance with Accounting Standards Update ("ASU"(“ASU”) 2014-09, Topic 606 “Revenue“Revenue from Contracts with Customers” (" (“Topic 606"606”), which was adopted by us on January 1, 2018, and supersedes previous revenue recognition guidance, including industry-specific guidance. Accordingly, the reported results for 2019 and 2018 reflect the application of Topic 606 guidance, while the comparable results for 2017 were prepared under previous revenue recognition guidance. The impact of our adoption of Topic 606 was not material to our Financial Statements. Accordingly, no cumulative effect adjustment to retained earnings as of January 1, 2018 was recorded (based on the application of the modified retrospective method under Topic 606).
Topic 606 requires entities to recognize revenue in a way that depicts the transfer of promised goods or services to customers in an amount that reflects the consideration to which the entity expects to be entitled in exchange for those goods or services. Additionally, provisions of Topic 606 specify which goods and services are distinct and represent separate performance obligations (representing the unit of account in Topic 606) within a contract and which goods and services (which could include multiple contracts or agreements) should be aggregated. In general, a performance obligation is a contractual obligation to construct and/or transfer a distinct good or service to a customer. The transaction price of a contract is allocated to each distinct performance obligation and recognized as revenue when, or as, the performance obligation is satisfied. Revenue for performance obligations satisfied over time are recognized as the work progresses. Revenue for performance obligations that do not meet the criteria for over time recognition are recognized at a point-in-time when a performance obligation is complete and a customer has obtained control of a promised asset.
F-8
GULF ISLAND FABRICATION, INC.
NOTES TO CONSOLIDATED FINANCIAL STATEMENTS-(Continued)
Fixed-Price and Unit-RateLong-term Contracts - Satisfied Over Time –Revenue for our fixed-price and unit-ratelong-term contracts is recognized using the percentage-of-completionPOC method based on contract costs incurred to date compared to total estimated contract costs (an input method). Fixed-price contracts, or contracts with a more significant fixed-price component, generally provide us with greater control over project schedule and the timing of when work is performed and costs are incurred, and accordingly, when revenue is recognized. Unit-rate, T&M and cost-reimbursable contracts generally have more variability in the scope of work and provide our customers with greater influence over the timing of when we perform our work, and accordingly, such contracts often result in less predictability with respect to the timing of when revenue is recognized. Contract costs include direct costs, such as materials and labor, and indirect costs attributable to contract activity. Material costs that are significant to a contract and do not reflect an accurate measure of project completion are excluded from the determination of our contract progress. Revenue for such materials is only recognized to the extent of costs incurred. Prior to our adoption of Topic 606, revenue for our fixed-price and unit-rate contracts was recognized using the percentage-of-completion method, based on the percentage of direct labor hours incurred to date compared to total estimated direct labor hours, and revenue for materials was recognized only to the extent of costs incurred. Revenue and gross profit or loss for contracts accounted for using the percentage-of-completionPOC method can be significantly affected by changes in estimated cost to complete such contracts. Significant estimates impacting the cost to complete a contract include: forecast costs of engineering, materials, components, equipment and subcontracts; forecast costs of labor and subcontracts; labor productivity; schedule durations, including subcontractor and supplier progress; contract disputes, including claims; achievement of contractual performance requirements; and contingency, among others. Although our customers retain the right and ability to change, modify or discontinue further work at any stage of a contract, in the event our customers discontinue work, they are required to compensate us for the work performed to date. The cumulative impact of revisions in total cost estimates during the progress of work is reflected in the period in which these changes become known, including, to the extent required, the reversal of profit recognized in prior periods and the recognition of losses expected to be incurred on contracts. Due to the various estimates inherent in our contract accounting, actual results could differ from those estimates, which could result in material changes to our Financial Statements and related disclosures. See Note 2 for further discussion of projects with significant changes in estimated margins during 2019, 20182022 and 2017, including projects in2021.
Short-term Contracts and Contracts Satisfied at a significant loss position at December 31, 2019.
T&M Contracts -Point In Time – Revenue for our T&Mshort-term contracts (which includes revenue associated with our master services arrangements) and contracts that do not satisfy the criteria for revenue recognition over time is recognized at contracted rates when the work is performed or when control of the asset is transferred, the related costs are incurred and collection is reasonably assured. Our T&M contracts provide for labor and materials to be billed at rates specified within the contract. The consideration from the customer directly corresponds to the value of our performance completed at the time of invoicing. Our current revenue recognition method for T&M contracts is consistent with the method used prior to adoption of Topic 606.
Variable Consideration - – Revenue and gross profit or loss for contracts can be significantly affected by variable consideration, which can be in the form of unapproved change orders, claims (including amounts arising from disputes with customers), incentives and liquidated damages that may not be resolved until the later stages of the contract or after the contract has been completed. Variable consideration can also include revenue associated with work performed on a unit-rate, T&M or cost-reimbursable basis that is recognized using the POC method. We estimate variable consideration based on the amount we expect to be entitled and include estimated amounts in transaction price to the extent it is probable that a significant future reversal of cumulative revenue recognized will not occur or when we conclude that any significant uncertainty associated with the variable consideration is resolved. See Note 2 for further discussion of our unapproved change orders, claims, incentives and liquidated damages.
Additional Disclosures - – Topic 606 also requires enhanced disclosures regarding the nature, amount, timing and uncertainty of revenues and cash flows from contracts with customers. See Note 2 for required disclosures under Topic 606.
F-11
GULF ISLAND FABRICATION, INC.
NOTES TO CONSOLIDATED FINANCIAL STATEMENTS-(Continued)
Pre-Contract Costs
Pre-contract costs are generally charged to cost of revenue as incurred, but in certain cases their recognition may be deferred if specific probability criteria are met. At December 31, 20192022 and 2018,2021, we had no deferred pre-contract costs.
Other (Income) Expense, Net
Other (income) expense, net, generally represents (recoveries)recoveries or provisions for bad debts, (gains)gains or losses associated with the sale or disposition of property and equipment, other than assets held for sale, and (income)income or expense associated with certain nonrecurring items. For 2022 and 2021, other (income) expense, net included gains of $7.3 million and charges of $3.8 million, respectively, related to the net impact of insurance recoveries and costs associated with damage previously caused by Hurricane Ida. For 2021, other (income) expense also included transaction costs of $0.5 million associated with the DSS Acquisition. See Note 2 for further discussion of the impacts of Hurricane Ida and Note 4 for further discussion of the DSS Acquisition.
Income Taxes
Income taxes have been provided for using the liability method. Deferred income taxes reflect the net tax effects of temporary differences between the carrying amounts of assets and liabilities for financial reporting purposes and the amounts used for income tax purposes using enacted rates expected to be in effect during the year in which the differences are expected to reverse. Due to changingstate income tax laws significantrelated to the apportionment of revenue for our projects, judgment is required to estimate the effective tax rate expected to apply to tax differences that are expectedanticipated to reverse in the future.
A valuation allowance is provided to reserve for deferred tax assets ("(“DTA(s)"”) if, based upon the available evidence, it is more likely than not that some or all of the DTAs will not be realized. The realization of our DTAs depends on our ability to generate sufficient taxable income of the appropriate character and in the appropriate jurisdictions.
F-9
GULF ISLAND FABRICATION, INC.
NOTES TO CONSOLIDATED FINANCIAL STATEMENTS-(Continued)
Reserves for uncertain tax positions are recognized when we consider it more likely than not that additional tax will be due in excess of amounts reflected in our income tax returns, irrespective of whether or not we have received tax assessments. Interest and penalties on uncertain tax positions are recorded within income tax expense. See Note 67 for further discussion of our income taxes and DTAs.
New Accounting Standards
Leases - In the first quarter 2019, we adopted ASU 2016-02, “Leases,” which required us to record a lease liability on our Consolidated Balance Sheets (“Balance Sheet”) as of January 1, 2019 equal to the present value of our lease payments for leased assets, and record a lease asset on our Balance Sheet representing our right to use the underlying leased assets for all leases having an original term of longer than twelve months. In our adoption we elected the modified retrospective transition method, and accordingly, prior periods have not been restated and continue to be reported under the lease standard in effect during such periods. We also elected certain practical expedients provided by the new standard, including not recording an asset or liability for leases having a term of twelve months or less and not separating lease and non-lease components for our leases. Upon adoption of the standard we recorded operating lease assets and lease liabilities at January 1, 2019 associated with our long-term leases. The lease asset is reflected within other noncurrent assets, and the current and noncurrent portions of the lease liability are reflected within accrued expenses and other liabilities, and other noncurrent liabilities, respectively, on our Balance Sheet. For leases with escalations over the life of the lease, we recognize expense on a straight-line basis. See Note 4 for further discussion of our adoption of this standard and our lease assets and liabilities.
Stock-based grants - In the first quarter 2019, we adopted ASU 2018-07, "Improvements to Non-employee Share-Based Payment Accounting," which simplifies the accounting for share-based payments granted to non-employees for goods and services. Under the new standard, most of the guidance for such payments to non-employees is now aligned with the requirements for share-based payments to employees. The adoption of the new standard did not have a material impact on our financial position, results of operations or related disclosures.
Financial instruments -– In June 2016, the FASB issued ASU 2016-13, “Financial Instruments - Credit Losses - Measurement of Credit Losses on Financial Instruments,” which changes the way companies evaluate credit losses for most financial assets and certain other instruments. For trade and other receivables, short-term investments, loans and other instruments, entities will be required to use a new forward-looking “expected loss” model to evaluate impairment, potentially resulting in earlier recognition of allowances for losses. The new standard also requires enhanced disclosures, including the requirement to disclose the information used to track credit quality by year of origination for most financing receivables. ASU 2016-13, and its subsequent amendments, will be effective for us in the first quarter 2023. Early adoption of the new standard is permitted; however, we have not elected to early adopt the standard. The new standard is required to be applied using a cumulative-effect transition method. We are currently evaluating the effectdo not believe that the new standard will have a material effect on our financial position, results of operations andor related disclosures.
Income taxes -Business Combinations – In December 2019,November 2021, the FASB issued ASU 2019-12 to simplify2021-08, “Business Combinations - Accounting for Contract Assets and Contract Liabilities from Contracts with Customers,” which changes the accounting for income taxes by removing certain exceptionsway companies measure contract assets and contract liabilities from contracts with customers acquired in a business combination and creates an exception to the general principlesrecognition and simplify areas such as franchise taxes, step-up in tax basis goodwill, separate entity financial statements and interim recognitionmeasurement principle of enacted tax laws or rate changes. The new standardASC 805. ASU 2021-08 will be effective for us in the first quarter 2021.2023. Early adoption of the new standard is permitted; however, we have not elected to early adopt the standard. We are currently evaluating the effectdo not believe that the new standard will have a material effect on our financial position, results of operations andor related disclosures.
F-12
GULF ISLAND FABRICATION, INC.
NOTES TO CONSOLIDATED FINANCIAL STATEMENTS-(Continued)
2. REVENUE, CONTRACT ASSETS AND LIABILITIES AND OTHER CONTRACT MATTERS
As discussed in Note 1, we recognize revenue for our contracts in accordance with Topic 606. Summarized below are required disclosures under Topic 606 and other relevant guidance.
Disaggregation of Revenue
The following tables summarize revenue for each of our operating segments, disaggregated by contract type and duration, for 2019, 20182022 and 20172021 (in thousands):
|
| 2019 |
| |||||||||||||||||||||||||||||||||||||
|
| Fabrication |
|
| Shipyard |
|
| Services |
|
| Eliminations |
|
| Total |
|
| Year ended December 31, 2022 |
| ||||||||||||||||||||||
Contract Type |
|
|
|
|
|
|
|
|
|
|
|
|
|
|
|
|
|
|
|
| ||||||||||||||||||||
|
| Services |
|
| Fabrication |
|
| Shipyard |
|
| Eliminations |
|
| Total |
| |||||||||||||||||||||||||
Fixed-price and unit-rate |
| $ | 70,052 |
|
| $ | 152,590 |
|
| $ | 30,147 |
|
| $ | (5,169 | ) |
| $ | 247,620 |
|
| $ | 5,035 |
|
| $ | 36,127 |
|
| $ | 7,671 |
|
| $ | (7 | ) |
| $ | 48,826 |
|
T&M (2) |
|
| — |
|
|
| 6,627 |
|
|
| 41,014 |
|
|
| — |
|
|
| 47,641 |
| ||||||||||||||||||||
T&M and cost-reimbursable |
|
| 79,426 |
|
|
| 9,526 |
|
|
| — |
|
|
| — |
|
|
| 88,952 |
| ||||||||||||||||||||
Other |
|
| — |
|
|
| — |
|
|
| 10,545 |
|
|
| (2,498 | ) |
|
| 8,047 |
|
|
| 2,561 |
|
|
| 2,646 |
|
|
| — |
|
|
| (665 | ) |
|
| 4,542 |
|
Total |
| $ | 70,052 |
|
| $ | 159,217 |
|
| $ | 81,706 |
|
| $ | (7,667 | ) |
| $ | 303,308 |
|
| $ | 87,022 |
|
| $ | 48,299 |
|
| $ | 7,671 |
|
| $ | (672 | ) |
| $ | 142,320 |
|
|
|
|
|
|
|
|
|
|
|
|
| |||||||||||||||||||||||||||||
Long-term |
| $ | 5,035 |
|
| $ | 43,037 |
|
| $ | 7,671 |
|
| $ | — |
|
| $ | 55,743 |
| ||||||||||||||||||||
Short-term |
|
| 81,987 |
|
|
| 5,262 |
|
|
| — |
|
|
| (672 | ) |
|
| 86,577 |
| ||||||||||||||||||||
Total |
| $ | 87,022 |
|
| $ | 48,299 |
|
| $ | 7,671 |
|
| $ | (672 | ) |
| $ | 142,320 |
| ||||||||||||||||||||
|
| Year ended December 31, 2021 |
| |||||||||||||||||
|
| Services |
|
| Fabrication |
|
| Shipyard |
|
| Eliminations |
|
| Total |
| |||||
Fixed-price and unit-rate |
| $ | 1,293 |
|
| $ | 39,187 |
|
| $ | 12,778 |
|
| $ | (8 | ) |
| $ | 53,250 |
|
T&M and cost-reimbursable |
|
| 34,470 |
|
|
| 2,152 |
|
|
| 100 |
|
|
| (67 | ) |
|
| 36,655 |
|
Other |
|
| 4,795 |
|
|
| — |
|
|
| — |
|
|
| (1,248 | ) |
|
| 3,547 |
|
Total |
| $ | 40,558 |
|
| $ | 41,339 |
|
| $ | 12,878 |
|
| $ | (1,323 | ) |
| $ | 93,452 |
|
|
|
|
|
|
|
|
|
|
|
|
|
|
|
|
| |||||
Long-term |
| $ | 1,293 |
|
| $ | 39,187 |
|
| $ | 12,778 |
|
| $ | (8 | ) |
| $ | 53,250 |
|
Short-term |
|
| 39,265 |
|
|
| 2,152 |
|
|
| 100 |
|
|
| (1,315 | ) |
|
| 40,202 |
|
Total |
| $ | 40,558 |
|
| $ | 41,339 |
|
| $ | 12,878 |
|
| $ | (1,323 | ) |
| $ | 93,452 |
|
F-10
GULF ISLAND FABRICATION, INC.
NOTES TO CONSOLIDATED FINANCIAL STATEMENTS-(Continued)
|
| 2018 |
| |||||||||||||||||
|
| Fabrication |
|
| Shipyard |
|
| Services |
|
| Eliminations |
|
| Total |
| |||||
Contract Type |
|
|
|
|
|
|
|
|
|
|
|
|
|
|
|
|
|
|
|
|
Fixed-price and unit-rate (1) |
| $ | 40,420 |
|
| $ | 88,887 |
|
| $ | 38,612 |
|
| $ | (2,414 | ) |
| $ | 165,505 |
|
T&M (2) |
|
| — |
|
|
| 7,537 |
|
|
| 43,481 |
|
|
| — |
|
|
| 51,018 |
|
Other |
|
| — |
|
|
| — |
|
|
| 6,137 |
|
|
| (1,413 | ) |
|
| 4,724 |
|
Total |
| $ | 40,420 |
|
| $ | 96,424 |
|
| $ | 88,230 |
|
| $ | (3,827 | ) |
| $ | 221,247 |
|
|
| 2017 |
| |||||||||||||||||
|
| Fabrication |
|
| Shipyard |
|
| Services |
|
| Eliminations |
|
| Total |
| |||||
Contract Type |
|
|
|
|
|
|
|
|
|
|
|
|
|
|
|
|
|
|
|
|
Fixed-price and unit-rate (1) |
| $ | 58,078 |
|
| $ | 47,787 |
|
| $ | 28,465 |
|
| $ | (5,096 | ) |
| $ | 129,234 |
|
T&M (2) |
|
| — |
|
|
| 4,912 |
|
|
| 35,180 |
|
|
| — |
|
|
| 40,092 |
|
Other |
|
| — |
|
|
| — |
|
|
| 1,800 |
|
|
| (104 | ) |
|
| 1,696 |
|
Total |
| $ | 58,078 |
|
| $ | 52,699 |
|
| $ | 65,445 |
|
| $ | (5,200 | ) |
| $ | 171,022 |
|
|
|
|
|
Future Performance Obligations Required Under Contracts
The following table summarizes our remaining performance obligations, disaggregated by operating segment and contract type, at December 31, 20192022 (in thousands).:
| December 31, 2022 |
| |||||||||||||
| Services |
|
| Fabrication |
|
| Shipyard |
|
| Total |
| ||||
Fixed-price and unit-rate | $ | 1,322 |
|
| $ | 11,314 |
|
| $ | 3,272 |
|
| $ | 15,908 |
|
T&M and cost-reimbursable (1) |
| — |
|
|
| 98,973 |
|
|
| — |
|
|
| 98,973 |
|
Total (2) | $ | 1,322 |
|
| $ | 110,287 |
|
| $ | 3,272 |
|
| $ | 114,881 |
|
Segment |
| Performance Obligations |
| |
Fabrication |
| $ | 50,145 |
|
Shipyard (1) |
|
| 352,081 |
|
Services |
|
| 13,212 |
|
Total |
| $ | 415,438 |
|
|
|
(2)
Year |
| Total |
| |
2020 |
| $ | 211,310 |
|
2021 |
|
| 108,252 |
|
2022 and beyond |
|
| 95,876 |
|
Total |
| $ | 415,438 |
|
F-11F-13
GULF ISLAND FABRICATION, INC.
NOTES TO CONSOLIDATED FINANCIAL STATEMENTS-(Continued)
Contracts Assets and Liabilities
Revenue recognition andThe timing of customer invoicing for our fixed-price and unit-rate contractsrecognition of revenue using the POC method may occur at different times. Revenue recognition is based upon our estimated percentage-of-completion as discussed in Note 1; however, customerCustomer invoicing is generally dependent upon predeterminedcontractual billing terms, which could provide for customer payments in advance of performing the work, milestone billings based on the completion of certain phases of the work, or billings when services are provided. Revenue recognized in excess of amounts billed is reflected as contract assets on our Balance Sheet, or to the extent we have an unconditional right to the consideration, is reflected as contract receivables on our Balance Sheet. Amounts billed in excess of revenue recognized, and accrued contract losses, are reflected as contract liabilities on our Balance Sheet. Information with respect to uncompleted contracts that were incomplete at December 31, 20192022 and 20182021, is as follows (in thousands):
|
| December 31, |
| |||||
|
| 2022 |
|
| 2021 |
| ||
Costs incurred on uncompleted contracts |
| $ | 112,693 |
|
| $ | 103,315 |
|
Estimated loss incurred to date |
|
| (12,610 | ) |
|
| (7,807 | ) |
Sub-total |
|
| 100,083 |
|
|
| 95,508 |
|
Billings to date |
|
| (103,440 | ) |
|
| (97,397 | ) |
Total |
| $ | (3,357 | ) |
| $ | (1,889 | ) |
|
| December 31, |
| |||||
|
| 2019 |
|
| 2018 |
| ||
Costs incurred on uncompleted contracts |
| $ | 386,932 |
|
| $ | 256,239 |
|
Estimated loss incurred to date |
|
| (48,895 | ) |
|
| (35,470 | ) |
Sub-total |
|
| 338,037 |
|
|
| 220,769 |
|
Billings to date |
|
| (295,136 | ) |
|
| (190,588 | ) |
Deferred revenue (1) |
|
| (4,592 | ) |
|
| (4,592 | ) |
Total |
| $ | 38,309 |
|
| $ | 25,589 |
|
|
|
The above amounts are included within the following captions inon our Balance Sheet at December 31, 20192022 and 20182021 (in thousands):
|
| December 31, |
| |||||
|
| 2022 |
|
| 2021 |
| ||
Contract assets (1), (2) |
| $ | 4,839 |
|
| $ | 4,759 |
|
Contract liabilities (3), (4), (5) |
|
| (8,196 | ) |
|
| (6,648 | ) |
Total |
| $ | (3,357 | ) |
| $ | (1,889 | ) |
|
| December 31, |
| |||||
|
| 2019 |
|
| 2018 |
| ||
Contract assets |
| $ | 52,128 |
|
| $ | 29,982 |
|
Contract liabilities (1), (2), (3) |
|
| (26,271 | ) |
|
| (16,845 | ) |
Sub-total |
|
| 25,857 |
|
|
| 13,137 |
|
Contract assets, noncurrent (1) |
|
| 12,452 |
|
|
| 12,452 |
|
Total |
| $ | 38,309 |
|
| $ | 25,589 |
|
|
Contract assets at December 31, 2022 and 2021, excluded $3.6 million and $2.3 million, respectively, associated with revenue recognized in excess of amounts billed for which we have an unconditional right to the consideration. Such amounts are reflected within contract receivables. The increase compared to December 31, 2021, was primarily due to a customer for our Services Division. (3) The increase in contract liabilities compared to December 31, 2021, was primarily due to |
|
|
|
|
Significant Customers
We are not dependent on any one customer, and the unwind of advance payments on our two forty-vehicle ferry projects for our Shipyard Division.
F-14
GULF ISLAND FABRICATION, INC.
NOTES TO CONSOLIDATED FINANCIAL STATEMENTS-(Continued)
Significant Customers
The following table summarizes revenue derived from each customer varies from year to year based on new project awards for each customer. However, for 2019, 2018 and 2017, certain customers individuallythat accounted for 10% or more of our consolidated revenue as followsfor 2022 and 2021 (in thousands):
Customer |
| 2019 |
|
| 2018 |
|
| 2017 |
| |||
A |
| $ | 52,310 |
|
| * |
|
| * |
| ||
B |
|
| 39,897 |
|
| * |
|
| * |
| ||
C |
|
| 36,175 |
|
|
| 49,123 |
|
|
| 21,781 |
|
D |
|
| 34,448 |
|
| * |
|
| * |
| ||
E |
| * |
|
|
| 25,873 |
|
| * |
| ||
F |
| * |
|
|
| 23,279 |
|
| * |
| ||
G |
| * |
|
| * |
|
|
| 44,724 |
| ||
|
| Years Ended December 31, |
| |||||
|
| 2022 |
|
| 2021 |
| ||
Customer A |
| $ | 54,257 |
|
| $ | 41,057 |
|
Customer B |
|
| 14,635 |
|
| * |
| |
Customer C |
| * |
|
|
| 9,576 |
| |
* The customer revenue was less than 10% of consolidated revenue for the year.
|
|
F-12
GULF ISLAND FABRICATION, INC.
NOTES TO CONSOLIDATED FINANCIAL STATEMENTS-(Continued)
Allowance for Doubtful Accounts
For 2019, 2018 and 2017, our provision for bad debts was $59,000, $30,000 and $21,000, respectively. Our provision for bad debts is included in other (income) expense, net on our Statement of Operations. Our provision for bad debts for 2022 and 2021, and our allowance for doubtful accounts at December 31, 20192022 and 2018 was $15,0002021, were not significant.
Variable Consideration
For 2022 and $0.4 million, respectively.
Variable Consideration
For 2019, 2018 and 2017,2021, we had no material amounts in revenue related to unapproved change orders, claims or incentives. However, at December 31, 20192022 and 2018,2021, certain active projects within our Shipyard Division reflected a reduction into our estimated contract price for liquidated damages of $12.9$1.4 million and $11.2$1.2 million, of which $11.2 million was recorded during 2017.respectively.
Changes in Project Estimates
We determine the impact of changes in estimated margins on projects for a given period by calculating the amount of revenue recognized in the period that would have been recognized in a prior period had such estimated margins been forecasted in the prior period. The total impact of changes in estimated margins for a project as disclosed on a quarterly basis may be different from the applicable year-to-date impact due to the application of the POC method and the changing progress of the project at each period end. Such impacts may also be different when a project is commenced and completed within the applicable year-to-date period but spans multiple quarters.
Changes in Estimates for 2019 -2022 – For 2019,2022, significant changes in estimated margins on projects negatively impacted our operating results for our Shipyard Division by $17.2$2.0 million. The changes in estimates were associated with the following:
Shipyard Division
|
|
|
|
|
|
F-13
GULF ISLAND FABRICATION, INC.
NOTES TO CONSOLIDATED FINANCIAL STATEMENTS-(Continued)
We are currently working collaboratively with the customer, must be replaced or modified with metal consoles.
At December 31, 2022, the vessel was approximately 95% complete and is forecast to identify opportunities to commence construction activitiesbe completed in advance of full completion of production engineering to minimize the schedule impacts to the projects. Based on our current forecast cost to complete the projects, the change order and collaborative nature of our discussions with the customer, we are not forecasting losses on the projects. However, due to uncertainties with respect to the timing of completion of production engineering and the potential impacts on our construction schedules and costs, as well as ongoing discussions with the customer, we are unable to reasonably estimate the amount of gross profit, if any, that will ultimately be realized on the projects. Accordingly, duringsecond quarter 2023 (previously the fourth quarter 2019 we reversed all previously recognized gross profit on the projects (including the reversal of $2.5 million of gross profit that was recognized prior2022, but delayed due to the fourth quarter 2019)aforementioned impacts). The project was in a loss position at December 31, 2022 and intend to only recognize revenue equal to costs on the projects until we are able to reasonably estimate the amount of gross profit, if any, expected to be realized on the projects. We anticipate being able to make such an estimate upon substantial completion of production engineering.our reserve for estimated losses was $0.3 million. If the projects experience further delays associated with production engineeringfuture subcontractor availability or other matters, we are unable to achieve our progress estimates, our schedules are further extended, the projects incur schedule liquidated damages, future craft labor productivity and subcontractor costs differ from our current estimates or we are unable to recover the costs of anyachieve our progress estimates, our schedule is further extended or we incur additional schedule liquidated damages, we experience challenges during sea trials, commissioning or delivery of the aforementioned from our customer,vessel, or we incur additional costs or delays associated with the projectsconsole replacement or modification, the project would experience further delays and losses.
Fabrication DivisionF-15
GULF ISLAND FABRICATION, INC.
NOTES TO CONSOLIDATED FINANCIAL STATEMENTS-(Continued)
Forty-Vehicle Ferry Projects: Increased forecast costs – During the fourth quarter 2022, we substantially completed and forecast liquidated damagesdelivered one of $5.1our two forty-vehicle ferries that were under construction. While we received conditional customer acceptance of the vessel in January 2023, final acceptance has been delayed as we work with the customer to address an equipment issue associated with vessel design deficiencies (discussed further below). In addition, changes in estimates had a negative impact for 2022 of $1.1 million for our two,remaining forty-vehicle ferry projects within our Fabrication Division,project, resulting primarily associated withfrom increased craft labor, subcontracted services and materials costs.craft labor costs and duration related costs due to extensions of schedule, including forecast liquidated damages. The impacts were primarily due to greater than anticipatedstructural design deficiencies for the vessel (discussed further below), which resulted in deflection issues within the plating of the vessel.
As discussed in our 2021 Financial Statements and subsequent quarterly filings, we have experienced rework, lower than anticipated productivity experienced primarilyconstruction and commissioning challenges on the two ferries, resulting in previous forecast cost increases and liquidated damages and the need to fabricate a new hull for the vessel that is still under construction. Accordingly, during 2021 we submitted claims to our customer, and subsequently filed a lawsuit, to extend our project schedules and recover the cost impacts of the design deficiencies. The customer denied all liability. Further, during the fourth quarter 2019,2022 and early 2023, we received correspondence from our expectationscustomer indicating that the new hull for the remaining ferry under construction is exhibiting deformation issues that are potentially beyond the customer’s desired tolerance levels. Our subsequent evaluation does not support the customer’s conclusions and we are continuing construction of future labor productivity. The revised forecasts incorporate actual results realized to date on the first vehicle ferry and actual results realized on similar projects in backlog. vessel as designed.
At December 31, 2019, the projects were approximately 28% and 53% complete and are forecast to be completed in the fourth quarter 2020. The projects were in a loss position at December 31, 2019 and our reserve for estimated losses was $3.0 million. If future craft labor productivity and subcontractor costs differ from our current estimates, we are unable to achieve our progress estimates, our schedules are further extended or the projects incur additional schedule liquidated damages, the projects would experience further losses.
Paddle Wheel River Boat Project: Increased forecast costs of $1.3 million for our paddle wheel river boat project within our Fabrication Division, primarily associated with increased craft labor costs. The impacts were primarily due to difficulties encountered in commissioning2022, the vessel and the need to accelerate our schedule, including performing out of sequence work scopes, to enable subcontracted works scopes to commence and mitigate the schedule and cost impacts of delaying the subcontracted work scopes. At December 31, 2019, the project was approximately 88%87% complete and is forecast to be completed in the second quarter 2023 (previously the first quarter 2020.2023, but delayed due to the aforementioned impacts). The project was in a loss position at December 31, 20192022 and our reserve for estimated losses was $0.2$1.2 million. Our forecast costs and scheduled completion date for the remaining vessel is based on the current vessel design and reflect our best estimates; however, such estimates may be impacted by any future challenges with the vessel design deficiencies, including the final resolution of the aforementioned design and deformation issues in dispute. If future craft labor productivity andor subcontractor availability or costs differ from our current estimates or we are unable to achieve our progress estimates, our schedule is further extended or the project incurswe incur additional schedule liquidated damages, we experience challenges during sea trials, commissioning or delivery of the projectremaining vessel, or other challenges associated with the design deficiencies, including unanticipated warranty costs for either vessel, and are unable to recover associated costs from our customer, the projects would experience further losses.
Jacketdelays and Deck Project: Increased forecast costs and forecast liquidated damages of $2.0 million for our jacket and deck project within our Fabrication Division, primarily associated with increased subcontracted services costs and extensions of schedule. The impacts were primarily due to higher than anticipated cost estimates from our commissioning subcontractors and delays associated with customer related directives. We are disputing the scope of the commissioning responsibility with the customer and we believe the extensions of schedule and associated forecast liquidated damages are the result of the customer related directives. Accordingly, we are pursuing change orders from the customer to recover the increased forecast commissioning costs and to extend the schedule date for determination of liquidated damages. However, the customer is disputing the change orders, and accordingly, our forecastlosses. Our forecasts at December 31, 2019 does2022 do not reflect potential future benefits, if any, from anythe favorable resolution of the change orders. At December 31, 2019, the project was approximately 46% completeaforementioned lawsuit and is forecast towe can provide no assurance that we will be completed in the third quarter 2020. The project was in a loss position at December 31, 2019 and our reserve for estimated losses was $1.1 million. If future craft labor productivity and subcontractor costs differ from our current estimates, we are unable to achieve our progress estimates, our schedules are further extended or the project incurs additional schedule liquidated damages, the project would experience further losses.
successful recovering previously incurred costs.
Services Division
Subsea Components Project: Increased forecast costs and liquidated damages of $1.6 million for our subsea components project within our Services Division, primarily associated with increased craft labor, subcontracted services and materials costs and extensions of schedule. The impacts were primarily due to stringent welding procedure requirements and customer specifications which resulted in additional materials, craft labor, and subcontracted services and support. At December 31, 2019, the project was approximately 86% complete and is forecast to be completed in the first quarter 2020. The project was in a loss position at December 31, 2019 and our reserve for estimated losses was $0.2 million. If we continue to experience difficulties with the procedure requirements and specifications for the project or the schedule is further extended, the project would experience further losses.
F-14
GULF ISLAND FABRICATION, INC.
NOTES TO CONSOLIDATED FINANCIAL STATEMENTS-(Continued)
Changes in estimatesEstimates for 2018 -2021 – For 2018,2021, significant changes in estimated margins on projects positively impacted operating results for our Fabrication Division by $3.3 million and negatively impacted our operating results for our Shipyard Division by $9.1 million.$3.8 million, respectively. The changes in estimates were associated with the following:
Fabrication Division
PetrochemicalMarine Docking Structures, Offshore Modules Project: Increased forecast costsand Material Supply Projects – Positive impact for 2021 of $2.4$3.3 million for our petrochemical module project within our Fabrication Division,marine docking structures, offshore modules and material supply projects, resulting primarily from increased contract price and reduced craft labor and subcontracted services costs and reduced contingency associated with schedule related liquidated damages. The impacts were primarily due to better than anticipated labor productivity and progress on the projects and favorable resolution of change orders with the customers. At December 31, 2022, the projects were complete.
Shipyard Division
Harbor Tug Projects: Increased forecast costs and liquidated damagesfavorable resolution of $6.7 million for our harbor tug projects within our Shipyard Division, primarilyinsurance claims associated with craft labor costs and extensions of schedule. The impacts were primarily duedamage to lower than anticipated craft labor productivity related to pipe installation and testing. The projects werethe vessel hull that occurred in a loss position at December 31, 2019 and 2018.2020. See further discussion above for associated impacts for 2019.
“Changes in estimatesEstimates for 2017 - For 2017, significant changes in estimated margins on projects negatively impacted our operating results by $34.5 million. The changes in estimates were associated with the following:
MPSV Projects: Increased forecast costs and liquidated damages for our two multi-purpose service vessels (“MPSV”) within our Shipyard Division. The impacts were primarily due to complexities related to the installation of the power and communications systems and reductions in price of $11.2 million for liquidated damages (representing the maximum amount of liquidated damages under the contracts) which are in dispute. The projects were in a loss position at December 31, 2019 and 2018. We are currently in a dispute with the customer regarding the two MPSV projects. As a result of our dispute and uncertainty with respect to the timing of resolution, all contract assets, accrued contract losses, and deferred revenue balances associated with the projects have been classified within other noncurrent assets, resulting in a net contract asset balance of $12.5 million for these projects within other noncurrent assets on our Balance Sheet at December 31, 2019 and 2018. See Note 82022” above for further discussion of the dispute.
Other Project Matters
Project Tariffs - Certain imported materials used, or forecast to be used, for our projects are currently subject to existing, new or increased tariffs or duties. We believe such amounts, if incurred, are recoverable from our customers under the contractual provisions of our contracts; however, we can provide no assurances that we will successfully recover such amounts.
Other - At December 31, 2019 and 2018, other noncurrent assets on our Balance Sheet included $3.0 million of retention for a previously completed project in our Fabrication Division for the fabrication of petrochemical modules. This retention is billable to the customer upon expiration of the contractual warranty period, which is expected to occur in the second quarter 2020. In January 2020, the customer entered into a restructuring transaction through a prepackaged Chapter 11 process that is intended to enable the customer to fulfill its commitments to suppliers, including payment of our retention. However, the restructuring transaction, which is subject to court approval, could delay the timing of collection of the retention.
3. IMPAIRMENTS AND (GAIN) LOSS ON ASSETS HELD FOR SALE
Impairments and (gain) loss on assets held for sale – Impairments and (gain) loss on assets held for sale (“AHFS”) generally represents asset impairments, (gains) losses on the sale of assets held for sale and certain nonrecurring items. A summary for 2019, 2018 and 2017 is below:
|
| 2019 |
| |||||||||||||||||
Impairments and (gain) loss on assets held for sale |
| Fabrication |
|
| Shipyard |
|
| Services |
|
| Corporate |
|
| Total |
| |||||
Impairments of AHFS |
| $ | 7,842 |
|
| $ | 324 |
|
| $ | — |
|
| $ | — |
|
| $ | 8,166 |
|
Impairments of assets removed from AHFS |
|
| 1,060 |
|
|
| — |
|
|
| — |
|
|
| — |
|
|
| 1,060 |
|
Impairments of Jennings Yard assets |
|
| — |
|
|
| 4,578 |
|
|
| — |
|
|
| — |
|
|
| 4,578 |
|
Impairments of Lake Charles Yard assets |
|
| — |
|
|
| 2,998 |
|
|
| — |
|
|
| — |
|
|
| 2,998 |
|
Impairments of inventory and other assets |
|
| 118 |
|
|
| — |
|
|
| 282 |
|
|
| 21 |
|
|
| 421 |
|
(Gain) loss on AHFS and other |
|
| (369 | ) |
|
| 20 |
|
|
| — |
|
|
| 654 |
|
|
| 305 |
|
Total |
| $ | 8,651 |
|
| $ | 7,920 |
|
| $ | 282 |
|
| $ | 675 |
|
| $ | 17,528 |
|
F-15F-16
GULF ISLAND FABRICATION, INC.
NOTES TO CONSOLIDATED FINANCIAL STATEMENTS-(Continued)
Other Operating and Project Matters
Hurricane Ida – On August 29, 2021, Hurricane Ida made landfall near Houma, Louisiana as a high-end Category 4 hurricane, with high winds, heavy rains and storm surge causing significant damage and power outages throughout the region, including our Houma Facilities and operations. Our Houma Facilities did not experience significant flood damage; however, the high winds and heavy rain damaged multiple buildings and equipment and resulted in significant debris throughout the facility. Our insurance coverages in effect at the time of the storm generally specify coverage amounts for each of our buildings (including contents) and major equipment.
During 2022 and 2021, we received insurance payments of $13.1 million and $1.0 million, respectively, from our insurance carriers associated with interruptions to our operations and damage to buildings and equipment. Such payments are nonrefundable, and with respect to our buildings, represent the insurance carriers’ estimate of the damage to each building based on the estimated depreciated value of such buildings plus repair costs incurred by us in excess of such estimates for certain buildings. To the extent we incur further repair costs for a building in excess of the amounts received, we may receive additional insurance proceeds up to the limits of our insurance coverage for such building. The classification of insurance proceeds within our Statement of Cash Flows is based on our use or intended use of the proceeds. Proceeds used or intended to be used for repairs that are not deemed to be capital in nature, and proceeds associated with interruptions to our operations, are reflected within operating activities. Proceeds used or intended to be used for repairs that are deemed capital in nature, or proceeds in excess of anticipated repair costs, are reflected within investing activities.
The timing of payments from our insurance carriers have, and may continue to, differ from when we incur the applicable repair and cleanup costs, and accordingly, we have accounted for such differences in timing as follows:
ImpairmentsTo the extent we incurred repair costs in excess of AHFS – At December 31, 2019,insurance proceeds received to date, we recorded an insurance receivable when we believe such amounts are probable of recovery under our insurance policies.
Based on the above, during 2022 and 2021, we recorded gains of $7.5 million (including $3.7 million related to interruptions to our operations) and charges of $3.2 million, respectively, related to the net impact of insurance recoveries and costs associated with damage to buildings and equipment. The gains and charges are included in other (income) expense, net on our Statement of Operations and are reflected within our Fabrication Division assets held for sale totaled $9.0and Services Division. In addition, at December 31, 2022, we had total insurance receivables on our Balance Sheet of $1.1 million. We are continuing to assess our restoration plans and repair efforts are ongoing. We expect to incur future repair costs of approximately $0.5 million and primarily consisted of three 660-ton crawler cranes, two plate bending roll machines and a deck barge. The deck barge was classified as held for sale during the fourth quarter 2019. The crawler cranes and plate bending roll machines were classified as held for sale for all of 2019. During the fourth quarter 2019, we revised our estimates of fair value for the crawler cranes based on updated broker opinions of value and revised our estimates of fair value for the plate bending roll machines based on third party indications of value. Our revised estimates of fair value for these assets were lower than our previous estimates due to current market conditions, the limited interest received in the assets during the last twelve months, the specific use nature of the assets (and the size of the assets in the case of the cranes), and our expectation of a shorter marketing period due to concerns regarding future deterioration of the assets. As a result of the aforementioned, during 2019 we recorded impairments of $7.8 million for the crawler cranes and plate bending roll machines. During 2019, we also recorded impairments of $0.3$1.0 million associated with a drydockpreviously received insurance payments for certain buildings and equipment. Further, we expect to incur future repair costs in excess of previously received insurance payments for certain buildings and equipment; however, we believe that recovery of insurance proceeds for such costs is probable.
In addition to damage to our Houma Facilities, the storm resulted in damage to one of our forty-vehicle ferry projects, the multi-purpose supply vessels (“MPSV(s)”) and associated equipment that are in our Shipyard Divisionpossession and subject to our MPSV Litigation, and certain bulkheads where the vessels were moored. We are continuing to assess the extent of the storm damage and are evaluating the extent to which any damage was the result of third-party vessels that was held-for-sale and soldbroke free from their mooring during the fourth quarter 2019 for proceedsstorm and struck the ferry, MPSVs and bulkheads. During 2022 and 2021, we recorded charges of $0.6 million.
Impairments of assets removed from AHFS – During the fourth quarter 2019, we determined that we no longer intended$0.2 million and $0.6 million, respectively, related to sell a deck barge (separateactual costs incurred, without giving consideration to potential recoveries from the aforementioned deck barge) and panel line equipment that was previously classifiedthird-parties related to damage caused by their vessels, as held for sale, and the assets were reclassified as property, plant and equipment. In connection therewith, the assets were recorded at the lower of their fair value orwe expect our deductibles associated with our insurance coverages will apply absent such recoveries. The charges are included in other (income) expense, net book value as if they had been depreciated while being classified as held for sale, which resulted impairments of $1.1 million during 2019.
Impairments of Jennings Yard assets – During the fourth quarter 2019, we reassessed our previous estimates of the future cashflows expected to be generated by our leased Jennings Yard. Our revised forecast gave consideration to recent operating losses experienced on our harbor tug projects in the Jennings YardStatement of Operations and our intention to close the facility upon completion of the harbor tug projects, which is forecast to occur during the third quarter 2020. Based on our revised forecast, we determined that the net book value of the Jennings Yard assets exceeded our estimates of future cashflows, which indicated that the assets were impaired. Our Jennings Yard assets primarily consist of a lease asset, non-moveable facility improvements and certain moveable equipment. We based our impairments of the lease asset and non-moveable facility improvements on our current expectation to abandon the facility upon completion of the harbor tugs, and we based our impairments of the moveable equipment on broker opinions of value for such assets. As a result of the aforementioned, we fully impaired the lease asset and non-moveable facility improvements and partially impaired the moveable equipment, which resulted in impairments of $4.6 million during 2019. We do not believe the anticipated closure of the Jennings Yard will impact our ability to operateare reflected within our Shipyard Division and it does not qualify for discontinued operations presentation as we will continue to operate our Shipyard Division from our Lake Charles Yard and Houma Yards.Division. See Note 49 for further discussion of our Jennings Yard lease.MPSV Litigation.
F-17
GULF ISLAND FABRICATION, INC.
NOTES TO CONSOLIDATED FINANCIAL STATEMENTS-(Continued)
3. SHIPYARD TRANSACTION AND DISCONTINUED OPERATIONS
Shipyard Transaction
Transaction Summary – On April 19, 2021 (“Transaction Date”), we entered into a definitive agreement and sold our Shipyard Division operating assets and certain construction contracts (“Shipyard Transaction”) to Bollinger Houma Shipyards, L.L.C. and Bollinger Shipyards Lockport, L.L.C. (collectively, “Bollinger”) for approximately $28.6 million (“Transaction Price”) ($26.1 million, net of transaction and other costs). We received $27.7 million of the Transaction Price during 2021 and the remaining $0.9 million was received during 2022, subsequent to Bollinger’s collection of certain customer payments associated with the Divested Shipyard Contracts (defined below). We also received $7.8 million during 2021 associated with changes in working capital for the Divested Shipyard Contracts from December 31, 2020 through the Transaction Date (“Working Capital True-Up”).
Included in the Shipyard Transaction were the Shipyard Division’s:
ImpairmentsContracts and related obligations for our three research vessel projects and five towing, salvage and rescue ship projects (collectively, the “Divested Shipyard Contracts”);
Bollinger offered employment to most of the employees of our Shipyard Division associated with the Divested Shipyard Contracts.
Excluded from the Shipyard Transaction were the Shipyard Division’s:
We retained those employees of our Shipyard Division associated with the Active Retained Shipyard Contracts.
Impairment and Transaction Loss – During the first quarter 2021, events and changes in circumstances indicated that the carrying amount of our Shipyard Division’s long-lived assets may not be recoverable. These changes in circumstances were primarily attributable to a reassessment of our asset groups within our Shipyard Division as well as revisions to our probability assessment of net future cashflows expected to be generated by our leased Lake Charles Yard. Our revised forecast gave consideration to previous and current under-utilizationcash flows of the facility, our expectationsapplicable asset group based on the likelihood, that existed as of future work forMarch 31, 2021, of the facility and the required future capital investment in the facility and its assets.Shipyard Transaction occurring. Based on our revised forecast,these assessments, we determined that an impairment of our Shipyard Division’s property, plant and equipment had occurred during the net book valuefirst quarter 2021. We measured the impairment by comparing the carrying amount of the Lake Charles Yard assets exceeded our estimatesapplicable asset group at March 31, 2021 to an estimate of future cashflows, which indicated that the assets were impaired. Our Lake Charles Yard assets primarily consistits fair value (which represented a Level 3 fair value measurement), resulting in an impairment charge of a lease asset, non-moveable facility improvements, three drydocks and certain moveable equipment.$22.8 million during 2021. We based our impairmentsfair value estimate on the Transaction Price, inclusive of an estimate of the lease assetWorking Capital True-Up, associated with the Shipyard Transaction. In addition, we incurred transaction and non-moveable facility improvementsother costs of $2.6 million during 2021 associated with the Shipyard Transaction.
Other – At December 31, 2022 and 2021, the net operating liabilities on our anticipated cashflows from such assets,Balance Sheet associated with the Retained Shipyard Contracts and we based our impairmentsother retained Shipyard Division operations totaled $2.7 million and $8.7 million, respectively. We are completing construction of the drydocksActive Retained Shipyard Contracts within our Houma Facilities and moveable equipment on broker opinionsare winding down our Shipyard Division operations, which is anticipated to occur by the second quarter 2023 (previously the first quarter 2023, but delayed and subject to the potential schedule impacts discussed in Note 2). The wind down of valueour Shipyard Division operations does not include our contracts for such assets. As a resultthe construction of the aforementioned, we fully impaired the non-moveable facility improvements and partially impaired the lease asset, drydocks and moveable equipment, which resulted in impairments of $3.0 million during 2019.MPSVs that are subject to our MPSV Litigation. See Note 49 for further discussion of our Lake Charles Yard lease.
Impairments of inventory and other assets - During the fourth quarter 2019, we abandoned certain inventory and fixed assets and recorded impairments of such assets. We determined our impairments of the assets based on scrap value estimates of fair value. As a result of the aforementioned, we recorded partial impairments of the inventory and fixed assets, which resulted in impairments of $0.4 million during 2019.
MPSV Litigation.
|
| 2018 |
| |||||||||||||||||
Impairments and (gain) loss on assets held for sale |
| Fabrication |
|
| Shipyard |
|
| Services |
|
| Corporate |
|
| Total |
| |||||
Gain on sale of South Texas Properties, net |
| $ | (7,724 | ) |
| $ | — |
|
| $ | — |
|
| $ | — |
|
| $ | (7,724 | ) |
Impairments of AHFS |
|
| 1,387 |
|
|
| 964 |
|
|
| — |
|
|
| — |
|
|
| 2,351 |
|
Impairments of inventory and other assets |
|
| 2,012 |
|
|
| — |
|
|
| 82 |
|
|
| — |
|
|
| 2,094 |
|
Gain from insurance proceeds |
|
| (3,571 | ) |
|
| — |
|
|
| — |
|
|
| — |
|
|
| (3,571 | ) |
Total |
| $ | (7,896 | ) |
| $ | 964 |
|
| $ | 82 |
|
| $ | — |
|
| $ | (6,850 | ) |
F-16F-18
GULF ISLAND FABRICATION, INC.
NOTES TO CONSOLIDATED FINANCIAL STATEMENTS-(Continued)
Discontinued Operations
|
|
|
|
|
|
Remaining equipment from the Texas North Yard totaling $18.8 million was not included infourth quarter 2020 closures of our leased Lake Charles Facility and Jennings Facility, represented the Texas North Yard sale,disposal and closure of which $0.8 million was placed back in usea substantial portion of our Shipyard Division operations and reclassified to property, plantthe culmination of a strategic shift that will have a major effect on our ongoing operations and equipment, netfinancial results. Therefore, we determined the assets, liabilities and $18.0 million continuedoperations associated with the Shipyard Transaction, and associated with the previously closed Shipyard Division facilities, to be helddiscontinued operations in 2021. Accordingly, such operating results for sale by2021 have been classified as discontinued operations on our Fabrication DivisionStatement of Operations. We had no material operating results of discontinued operations for 2022, and no material assets or liabilities of discontinued operations at December 31, 2018.2022 or 2021. The assets, held for sale primarily consistedliabilities and operating results attributable to the Retained Shipyard Contracts and remaining assets and liabilities of three 660-ton crawler cranes, a deck barge, two plate bending roll machinesour Shipyard Division operations that were excluded from the Shipyard Transaction, and panel line equipment, which were relocated to our facility in Houma, Louisiana.
Impairments of AHFS - During 2018, we recorded impairments of $1.4 million for certain equipment previouslyare not associated with the South Texas Properties priorpreviously closed facilities, represent our Shipyard Division and are classified as continuing operations on our Statement of Operations. Discontinued operations are presented separately from continuing operations on our Statement of Operations; however, they are not presented separately on our Statement of Cash Flows or Statement of Shareholders’ Equity.
A summary of the operating results and cash flows from discontinued operations for 2021, is as follows (in thousands):
|
| Year ended |
| |
Revenue |
| $ | 41,637 |
|
Cost of revenue |
|
| 33,912 |
|
Gross profit (1) |
|
| 7,725 |
|
General and administrative expense |
|
| 413 |
|
Impairments and (gain) loss on assets held for sale, net (2) |
|
| 25,331 |
|
Other (income) expense, net |
|
| (647 | ) |
Operating loss |
|
| (17,372 | ) |
Income tax (expense) benefit (3) |
|
| — |
|
Loss from discontinued operations, net of taxes |
| $ | (17,372 | ) |
|
| Year ended |
| |
Operating cash flows from discontinued operations |
| $ | (9,443 | ) |
Investing cash flows from discontinued operations |
| $ | 32,739 |
|
F-19
GULF ISLAND FABRICATION, INC.
NOTES TO CONSOLIDATED FINANCIAL STATEMENTS-(Continued)
4. ACQUISITION
Acquisition Summary – On December 1, 2021 (“Acquisition Date”), we entered into a definitive agreement and acquired (“DSS Acquisition”) the services and industrial staffing businesses (“DSS Business”) of Dynamic Industries, Inc. (“Dynamic”) for $7.6 million (“Purchase Price”). We also hired substantially all of the employees of the DSS Business. In connection with the Texas South Yard or Texas North Yard transactions. In addition,DSS Acquisition, during 20182021 we recorded an impairmentincurred transaction costs of $1.0$0.5 million, for a drydock thatwhich are included in other (income) expense, net on our Statement of Operations and are reflected within our Services Division.
Purchase Price Allocation – The Purchase Price was held for sale by our Shipyard Divisionallocated to the major categories of assets and liabilities acquired based upon estimates of their fair values at December 31, 2017. Our impairmentsthe Acquisition Date, which were based, on our best estimatein part, upon outside appraisals for certain assets, including property, machinery and equipment and specifically-identifiable intangible assets. The excess of the Purchase Price over the estimated fair value of the assets.net tangible and identifiable intangible assets acquired was recorded as goodwill. The factors contributing to the goodwill (which is all deductible for tax purposes) include the acquired established workforce, estimated future cost savings and revenue synergies associated with the DSS Business. The following table summarizes our purchase price allocation at the Acquisition Date (in thousands):
Tangible assets and liabilities: |
|
|
| |
Land and buildings (1) |
| $ | 475 |
|
Machinery and equipment (2) |
|
| 2,557 |
|
Right-of-use asset (3) |
|
| 2,000 |
|
Accrued expenses and other liabilities |
|
| (672 | ) |
Net tangible assets and liabilities |
|
| 4,360 |
|
Intangible assets - customer relationships (4) |
|
| 996 |
|
Goodwill |
|
| 2,217 |
|
Purchase Price (5) |
| $ | 7,573 |
|
ImpairmentsRepresents acquired machinery, equipment and vehicles. The fair values of inventorythe assets were estimated based on third-party appraisals.
Gain from insurance proceeds - During 2017, buildingsexisting underlying customer relationships with estimated lives of seven years. The fair value was estimated based on a multi-period excess earnings method which incorporated Level 3 inputs. The significant assumptions used in estimating fair value included revenue and equipment located at our South Texas Properties were damaged by Hurricane Harvey,income projections for the DSS Business and in connection therewith, during 2017 we received $6.0 millionthe estimated discount rate that reflects the level of insurance proceeds as an initial payment from our insurance carriers. During 2018, we agreed to a global settlement with our insurance carriers for total insurance payments of $15.4 million (inclusive of the $6.0 million received during 2017), of which $9.4 million was received during 2018. We allocated the insurance recoveries as follows:
|
|
|
|
|
|
|
|
|
| 2017 |
| |||||||||||||||||
Impairments and (gain) loss on assets held for sale |
| Fabrication |
|
| Shipyard |
|
| Services |
|
| Corporate |
|
| Total |
| |||||
Impairments of AHFS |
| $ | — |
|
| $ | 989 |
|
| $ | — |
|
| $ | — |
|
| $ | 989 |
|
Impairments of inventory and other assets |
|
| 6,683 |
|
|
| — |
|
|
| — |
|
|
| — |
|
|
| 6,683 |
|
Other |
|
| — |
|
|
| 259 |
|
|
| — |
|
|
| — |
|
|
| 259 |
|
Total |
| $ | 6,683 |
|
| $ | 1,248 |
|
| $ | — |
|
| $ | — |
|
| $ | 7,931 |
|
Impairments of AHFS – During 2017, we recorded impairments of $1.0 millionrisk associated with three drydocks in Shipyard Division. Two of the drydocks were sold during 2017 (further discussed below),receiving future cash flows. Amortization expense for our intangible assets was $0.1 million for 2022 and the remaining drydock was heldnot material for sale at2021. At December 31, 2017 and sold during 2019.
Impairments of inventory and other assets - During 2017, we recorded an impairment of $3.7 million related to inventory in2022, our Fabrication Division that was originally received in connection with a settlement with a vendor in 2014. The inventory consisted of specialty and high-grade copper nickel and steel materials as well as lower-grade carbon steel pipe and valve fittings. During 2017, we performed our annual inspection of this inventory and determined that the high-grade stainless steel and copper nickel components remained in good condition; however; much of the lower-grade carbon steel pipe and valve fittings had deteriorated significantly due to exposure to the elements. As a result, we reduced the carrying value of the lower-grade inventory to scrap value and reduced the carrying value of the high-grade inventory to its estimated net realizable value based on its good condition. In addition, we recorded an impairment of $3.0 million related to inventory in our Fabrication Division that was originally received in connection with a settlement with a customer in 2013 related to a deepwater construction project. The inventory consisted of specialty piping and valves for which demand for the inventory was negatively impacted by a lack of offshore construction activity. As a result, we recorded an impairment to reduce the carrying value of the inventory to scrap value.
Other – During 2017, we sold two drydocks in our Shipyard Division for proceeds of $2.0intangible asset balance totaled $0.8 million and amortization expense is estimated to be $0.1million to $0.2million for each of 2023, 2024, 2025, 2026, 2027 and 2028.
F-17F-20
GULF ISLAND FABRICATION, INC.
NOTES TO CONSOLIDATED FINANCIAL STATEMENTS-(Continued)
Supplemental Pro Forma Financial Information – The following unaudited pro forma condensed combined financial information (“Pro Forma Information”) gives effect to the DSS Acquisition, accounted for as a business combination using the purchase method of accounting. The Pro Forma Information reflects the DSS Acquisition and related events as if they occurred on January 1, 2020 (the earliest period presented in our 2021 Financial Statements), and gives effect to pro forma events that are directly attributable to the DSS Acquisition, factually supportable and expected to have a continuing impact on the combined results of the Company and the DSS Business following the DSS Acquisition. The Pro Forma Information for 2021 includes adjustments to: (1) remove acquisition costs of $0.5 million, (2) include incremental intangibles amortization and depreciation expense of $0.3 million associated with fair value adjustments related to the DSS Acquisition, and (3) include the historical results of the DSS Business. Revenue and net income attributable to the DSS Business for 2021 prior to the Acquisition Date was $44.9 million and $2.4 million, respectively. Revenue and net loss attributable to the DSS Business for 2021 subsequent to the Acquisition Date was $3.2 million and $0.5 million (including acquisition costs of $0.5 million), respectively. The Pro Forma Information has been presented for illustrative purposes only and is not necessarily indicative of the operating results that would have been achieved had the pro forma events taken place on the dates indicated. Further, the Pro Forma Information does not purport to project the future operating results of the combined company following the DSS Acquisition. The following table presents the Pro Forma Information for 2021 (in thousands, except per share data):
|
| Year ended |
| |
Pro forma revenue from continuing operations |
| $ | 138,330 |
|
Pro forma net loss from continuing operations |
|
| (1,947 | ) |
Per share data: |
|
|
| |
Basic and diluted loss from continuing operations |
| $ | (0.13 | ) |
Assets held for sale -Goodwill Impairment Assessment – As discussed above,in Note 1, goodwill is not amortized, but instead is reviewed for impairment at December 31, 2019,least annually at reporting level, absent any indicators of impairment or when other actions require an impairment assessment (such as a change in reporting units). We perform our annual impairment assessment during the fourth quarter of each year based on balances as of October 1. At October 1, 2022, our DSS Business within our Services Division represented our only reporting unit associated with our goodwill related to the DSS Acquisition. However, during the fourth quarter 2022, we completed the integration of the DSS Business with our legacy businesses within our Services Division. In connection therewith, we reevaluated our reporting units and determined that the Services Division, as a whole, was our reporting unit. Accordingly, we performed a quantitative assessment of goodwill for our reporting units as of October 1, 2022, both before and after the change in reporting units, and the fair value of each reporting unit exceeded the respective net book values of the reporting unit by a substantial amount (due in part to a reduction in the net assets heldof the DSS Business resulting from the sale of the Harvey Option discussed above). See Note 1 for sale primarily consisted of three 660-ton crawler cranes, two plate bending roll machines and a deck barge. A summaryfurther discussion of our assets held for sale at December 31, 2019 and 2018, is as follows (in thousands):goodwill.
|
| December 31, |
| |||||
Assets |
| 2019 |
|
| 2018 |
| ||
Machinery and equipment |
| $ | 17,618 |
|
| $ | 27,104 |
|
Accumulated depreciation |
|
| (8,612 | ) |
|
| (8,169 | ) |
Total assets held for sale |
| $ | 9,006 |
|
| $ | 18,935 |
|
4.5. PROPERTY, PLANT AND EQUIPMENT AND LEASED FACILITIES AND EQUIPMENT
Property, plant and equipment
Property, plant and equipment consisted of the following at December 31, 20192022 and 20182021 (in thousands):
|
| Estimated |
| December 31, |
| |||||
|
| Useful Life |
| 2022 |
|
| 2021 |
| ||
|
| (in Years) |
|
|
|
|
|
| ||
Land |
| — |
| $ | 4,376 |
|
| $ | 4,416 |
|
Buildings |
| 10 to 25 |
|
| 25,584 |
|
|
| 25,742 |
|
Machinery and equipment |
| 3 to 15 |
|
| 67,851 |
|
|
| 70,212 |
|
Furniture and fixtures |
| 3 to 5 |
|
| 994 |
|
|
| 1,276 |
|
Transportation equipment |
| 2 to 5 |
|
| 2,361 |
|
|
| 2,363 |
|
Improvements |
| 15 |
|
| 23,246 |
|
|
| 23,404 |
|
Construction in progress |
| — |
|
| 2,881 |
|
|
| 705 |
|
Right-of-use asset (1) |
| 15 |
|
| — |
|
|
| 2,000 |
|
Total property, plant and equipment |
|
|
|
| 127,293 |
|
|
| 130,118 |
|
Accumulated depreciation |
|
|
|
| (96,139 | ) |
|
| (95,452 | ) |
Property, plant and equipment, net |
|
|
| $ | 31,154 |
|
| $ | 34,666 |
|
|
| Estimated |
|
| December 31, |
| ||||||
|
| Useful Life |
|
| 2019 |
|
| 2018 |
| |||
|
| (in Years) |
|
|
|
|
|
|
|
|
| |
Land |
|
| — |
|
| $ | 4,972 |
|
| $ | 4,972 |
|
Buildings |
|
| 25 |
|
|
| 35,580 |
|
|
| 34,696 |
|
Machinery and equipment |
| 3 to 25 |
|
|
| 126,622 |
|
|
| 132,155 |
| |
Furniture and fixtures |
| 3 to 5 |
|
|
| 2,288 |
|
|
| 2,497 |
| |
Transportation equipment |
| 3 to 5 |
|
|
| 2,521 |
|
|
| 2,627 |
| |
Improvements |
|
| 15 |
|
|
| 40,377 |
|
|
| 42,182 |
|
Construction in progress |
|
| — |
|
|
| 2,636 |
|
|
| 1,944 |
|
Total property, plant and equipment |
|
|
|
|
|
| 214,996 |
|
|
| 221,073 |
|
Accumulated depreciation |
|
|
|
|
|
| (144,512 | ) |
|
| (141,143 | ) |
Property, plant and equipment, net |
|
|
|
|
| $ | 70,484 |
|
| $ | 79,930 |
|
Depreciation expense for 2019, 2018continuing operations for 2022 and 20172021 was $9.6 million, $10.4$4.7 million and $12.7 million, respectively. The decrease in depreciation expense for 2019 was due to assets becoming fully depreciated. The decrease in expense for 2018 was due to classifying our South Texas Properties as assets held for sale during the first quarter of 2017 and suspending the recognition of depreciation expense for those assets.
Leased Facilities and Equipment
As discussed further in Note 1, in the first quarter 2019, we adopted ASU 2016-02, “Leases.” Upon adoption, we recorded operating lease assets and lease liabilities of approximately $7.1 million and $5.2$4.1 million, respectively, at January 1, 2019. Included in our lease asset was an intangible asset of $1.9 million associated with two favorable lease obligations recorded in connection with a former acquisition, which was reclassified as a lease asset under ASU 2016-02. At December 31, 2019, our significant leases subjectthe increase due primarily to long-term agreements were as follows:
Corporate office in Houston, Texas consisting of approximately 17,000 square feet of office space. The lease expires in May 2025.
Jennings Yard located five miles east of Jennings, Louisiana, consisting of a 180-acre yard on the west bank of the Mermentau River approximately 25 miles north of the U.S. Intracoastal Waterway. The lease expires in January 2025 with two, ten-year renewal options that would extend the lease through January 2045. See Note 3 for discussion of our anticipated closure of the Jennings Yard.
Lake Charles Yard located near Lake Charles, Louisiana, consisting of a 10-acre yard, 17 miles from the GOM on the Calcasieu River, that we sublease from a third party. The sublease expires in July 2023 with three, five-year renewal options (subject to sublessor renewals) that would extend the lease through July 2038.
During the fourth quarter 2019, we determined that it was no longer reasonably certain that we would exercise the renewal options for our Jennings Yard and Lake Charles Yard, and accordingly, we remeasured our lease obligations for these facilities to exclude the lease renewal options, which resulted in a reduction to our operating lease assets and lease liabilities of $2.5 million. At December 31, 2019, our lease asset, current lease liability and long-term lease liability were $1.9 million, $0.5 million and $2.1 million, respectively. See Note 3 for discussion of our lease asset impairments recorded during 2019.DSS Acquisition.
F-18
F-21
GULF ISLAND FABRICATION, INC.
NOTES TO CONSOLIDATED FINANCIAL STATEMENTS-(Continued)
Leased Facilities and Equipment
We lease certain office, warehouse and operating facilities under long-term lease arrangements that expire at various dates through October 2027, some of which include renewal options ranging from one to 20 years. At December 31, 2022, our lease asset, current lease liability and long-term lease liability were $1.1 million, $0.7 million and $1.4 million, respectively. Our lease obligations include any renewal options that we intend to exercise. Future minimum payments under leases having initial terms of more than twelve months are as follows (in thousands):
|
| Minimum Payments |
| |
2020 |
| $ | 660 |
|
2021 |
|
| 668 |
|
2022 |
|
| 677 |
|
2023 |
|
| 583 |
|
2024 |
|
| 488 |
|
Total lease payments |
|
| 3,076 |
|
Less: interest |
|
| (481 | ) |
Present value of lease liabilities |
| $ | 2,595 |
|
|
| Minimum |
| |
2023 |
| $ | 869 |
|
2024 |
|
| 884 |
|
2025 |
|
| 424 |
|
2026 |
|
| 76 |
|
2027 |
|
| 64 |
|
Total lease payments |
|
| 2,317 |
|
Less: interest |
|
| (221 | ) |
Present value of lease liabilities (1) |
| $ | 2,096 |
|
Total lease expense to includefor our leased facilities and equipment, which includes lease asset amortization expense and expense for leases with original terms that are twelve months or less, for 2019, 20182022 and 2017,2021, was $1.8 million, $1.9$1.6 million and $2.0$1.0 million, respectively, related to our leased facilities and equipment.respectively. Cash paid for interestleases for 2022 and lease2021 was $2.0 million and $1.5 million, respectively. Certain of our leases are subject to subleases with third parties. Sublease income for 2022 was $0.4 million and is included in other (income) expense, net on our Statement of Operations. Sublease income for 20192021 was $2.0 million.not material.
The discount rate used to determine the present value of our lease liabilities was based on the interest rate on our Credit AgreementLC Facility adjusted for terms similar to that of our leased properties. At December 31, 2019,2022, our weighted-average remaining lease term was approximately 4.62.8 years and the weighted-average discount rate used to derive our lease liability was 6.75%6.9%.
5.Assets Held for Sale
During 2021, we received proceeds of $4.5 million ($4.4 million, net of transaction and other costs) from the sale of two cranes that were held for sale by our Fabrication Division. No significant gain or loss was recognized on the assets sold as the net proceeds received approximated the carrying values of the assets. In addition, at December 31, 2021, our assets held for sale consisted of one remaining crane for our Fabrication Division. However, as a result of the significant increase in our performance obligations for the Fabrication Division during 2022, we determined that the crane was necessary to support our future operations. Accordingly, during 2022 the crane was placed back into service and was reclassified as property, plant and equipment on our Balance Sheet at December 31, 2022. In connection therewith, the crane was recorded at the lower of its fair value or carrying value as if it had been depreciated while it was classified as held for sale, which resulted in no impairment. Our Balance Sheet at December 31, 2021 has been recast to classify the crane as property, plant and equipment.
F-22
GULF ISLAND FABRICATION, INC.
NOTES TO CONSOLIDATED FINANCIAL STATEMENTS-(Continued)
6. CREDIT FACILITIES
LC Facility
Credit Agreement
We have a $40.0 million revolvingletter of credit facility with Hancock Whitney Bank ("Credit Agreement") that can be usedprovides for borrowings orup to $20.0 million of letters of credit that matures June 9, 2021. On February 28, 2020, we amended(“LC Facility”), subject to our Credit Agreement to amend our financial covenants. Our amended quarterly financial covenants at December 31, 2019, and for the remaining termcash securitization of the Credit Agreement, are as follows:
Ratioletters of current assets to current liabilitiescredit, with a maturity date of not less than 1.25:1.00;
Minimum tangible net worth of at least the sum of $130.0 million, plus 100% of the proceeds from any issuance of stock or other equity after deducting of any fees, commissions, expenses and other costs incurred in such offering;
Minimum cash, cash equivalents and short-term investments of $40.0 million; and
Ratio of funded debt to tangible net worth of not more than 0.50:1.00.
Our Credit Agreement also includes restrictions regarding our ability to: (i) grant liens; (ii) make certain loans or investments; (iii) incur additional indebtedness or guarantee other indebtedness in excess of specified levels; (iv) make any material change to the nature of our business or undergo a fundamental change; (v) make any material dispositions; (vi) acquire another company or all or substantially all of its assets; (vii) enter into a merger, consolidation, or sale leaseback transaction; or (viii) declare and pay dividends if any potential default or event of default occurs.
Interest on borrowings under the Credit Agreement may be designated, at our option, as either the Wall Street Journal published Prime Rate (4.75% at December 31, 2019) or LIBOR (1.76% at December 31, 2019) plus 2.0% per annum.June 30, 2023. Commitment fees on the unused portion of the Credit AgreementLC Facility are 0.4%0.4% per annum and interest on outstanding letters of credit is 2.0%1.5% per annum. The Credit Agreement is secured by substantially all of our assets (with a negative pledge on our real property).
At December 31, 2019,2022, we had no outstanding borrowings under our Credit Agreement and $10.2$1.6 million of outstanding letters of credit to support our projects, providing $29.8 million of available capacity. At December 31, 2019, we were in compliance with allunder the LC Facility. See Note 9 for further discussion of our amended financial covenants, with a tangible net worthletters of $153.4 million (as defined by the Credit Agreement); total cash, cash equivalentscredit and short-term investments of $69.6 million; a ratio of current assets to current liabilities of 1.67 to 1.0; and a ratio of funded debt to tangible net worth of 0.07:1.00.associated security obligations.
Surety Bonds
We issue surety bonds in the ordinary course of business to support our projects. At December 31, 2019,2022, we had $409.9$121.1 million of outstanding surety bonds.bonds, of which $50.0 million relates to our MPSV projects that are subject to our MPSV Litigation, $55.8 million relates to our Active Retained Shipyard Contracts, and $15.3 million relates to our Fabrication Division contracts and certain of our insurance coverages. See Note 9 for discussion of our surety bonds and related indemnification obligations and our MPSV Litigation.
F-19
Insurance Finance Arrangement
In connection with the renewal of our property and equipment insurance coverages, during 2022 we entered into a short-term premium finance arrangement (“Insurance Finance Arrangement”) totaling $2.4 million, payable in ten equal monthly installments and accruing interest at a fixed rate of 4.3% per annum. We consider the transaction to be a non-cash financing activity, with the initial financed amount reflected within accrued expenses and other liabilities on our Balance Sheet, and a corresponding asset reflected within prepaid expenses and other assets on our Balance Sheet. We have reflected principal payments of $1.7 million for 2022, as a financing activity on our Statement of Cash Flows, and at December 31, 2022, our remaining principal balance was $0.7 million.
Loan Agreement
On April 17, 2020, we entered into an unsecured loan in the aggregate amount of $10.0 million (“PPP Loan”) with Whitney Bank pursuant to the Paycheck Protection Program (“PPP”) under the Coronavirus Aid, Relief, and Economic Security Act, as amended (“CARES Act”). The PPP Loan, and accrued interest, were eligible to be forgiven partially or in full, if certain conditions were met. Following the approval of our application for forgiveness by the Small Business Administration (“SBA”), on July 28, 2021, Whitney Bank received $9.1 million from the SBA, which was the amount of loan forgiveness requested, plus accrued interest. The forgiveness of the PPP Loan and accrued interest resulted in a gain of $9.1 million during 2021, and is reflected within gain on extinguishment of debt on our Statement of Operations. On July 29, 2021, we repaid Whitney Bank the remaining balance of the PPP Loan, together with accrued interest.
Because the amount borrowed exceeded $2.0 million, we are required by the SBA to retain all records relating to the PPP Loan for six years from the date the loan was forgiven and permit authorized representatives of the SBA to access such records upon request. While we believe we are a qualifying business and have met the eligibility requirements of the PPP Loan, and believe we have used the loan proceeds only for expenses which may be paid using proceeds from the PPP Loan, we can provide no assurances that any potential SBA review or audit will verify the amount forgiven, in whole or in part, and we could be required to repay all or part of the forgiven amount.
Mortgage Agreement and Restrictive Covenant Agreement
On April 19, 2021, and in connection with the receipt of a consent for the Shipyard Transaction from one of our Sureties, we entered into a multiple indebtedness mortgage (“Mortgage Agreement”) and a restrictive covenant arrangement (“Restrictive Covenant Agreement”) with such Surety to secure our obligations for our MPSV projects and two forty-vehicle ferry projects. The Mortgage Agreement encumbers all remaining real estate that was not sold in connection with the Shipyard Transaction and includes certain covenants and events of default. Further, the Restrictive Covenant Agreement precludes us from paying dividends or repurchasing shares of our common stock. The Mortgage Agreement and Restrictive Covenant Agreement will terminate when the obligations and liabilities of the Surety associated with the outstanding surety bonds are discharged, or any judgment against us or the Surety arising out of litigation related to such contracts is satisfied by us. See Note 3 for further discussion of the Shipyard Transaction.
F-23
GULF ISLAND FABRICATION, INC.
NOTES TO CONSOLIDATED FINANCIAL STATEMENTS-(Continued)
Income Tax (Expense) Benefit
A reconciliation of the U.S. federal statutory tax rate to our income tax (expense) benefit from continuing operations for 2019, 20182022 and 2017,2021, is as follows (in thousands):
|
| Years Ended December 31, |
| |||||
|
| 2022 |
|
| 2021 |
| ||
U.S. statutory rate |
|
| 21.0 | % |
|
| 21.0 | % |
Increase (decrease) resulting from: |
|
|
|
|
|
| ||
Permanent differences |
|
| (5.1 | )% |
|
| (3.1 | )% |
State income taxes |
|
| 5.7 | % |
|
| 0.5 | % |
Other |
|
| — |
|
|
| (0.1 | )% |
Discrete items |
|
|
|
|
|
| ||
Vesting of common stock |
|
| (1.0 | )% |
|
| (1.4 | )% |
Change in valuation allowance |
|
| (23.1 | )% |
|
| (44.3 | )% |
PPP Loan forgiveness |
|
| — |
|
|
| 39.5 | % |
Return to provision and other |
|
| 1.8 | % |
|
| (11.6 | )% |
Income tax (expense) benefit |
|
| (0.7 | )% |
|
| 0.5 | % |
|
| 2019 |
|
| 2018 |
|
| 2017 |
| |||||||||||||||
|
| Amount |
|
| % |
|
| Amount |
|
| % |
|
| Amount |
|
| % |
| ||||||
U.S. statutory rate |
| $ | 10,393 |
|
|
| 21.0 | % |
| $ | 4,159 |
|
|
| 21.0 | % |
| $ | 24,136 |
|
|
| 35.0 | % |
Increase (decrease) resulting from: |
|
|
|
|
|
|
|
|
|
|
|
|
|
|
|
|
|
|
|
|
|
|
|
|
Permanent differences |
|
| (85 | ) |
|
| (0.2 | )% |
|
| (206 | ) |
|
| (1.0 | )% |
|
| (330 | ) |
|
| 0.5 | % |
State income taxes |
|
| 173 |
|
|
| 0.4 | % |
|
| (571 | ) |
|
| (2.9 | )% |
|
| 366 |
|
|
| (0.5 | )% |
Other |
|
| (13 | ) |
|
| — |
|
|
| 374 |
|
|
| 1.9 | % |
|
| (118 | ) |
|
| 0.2 | % |
Discrete items |
|
|
|
|
|
|
|
|
|
|
|
|
|
|
|
|
|
|
|
|
|
|
|
|
Vesting of common stock |
|
| 13 |
|
|
| — |
|
|
| (19 | ) |
|
| (0.1 | )% |
|
| (253 | ) |
|
| 0.4 | % |
Change in valuation allowance |
|
| (10,385 | ) |
|
| (21.0 | )% |
|
| (4,308 | ) |
|
| (21.7 | )% |
|
| 392 |
|
|
| (0.5 | )% |
Income tax (expense) benefit |
| $ | 96 |
|
|
| 0.2 | % |
| $ | (571 | ) |
|
| (2.8 | )% |
| $ | 24,193 |
|
|
| 35.1 | % |
Income Tax (Expense) Benefit - Significant components of our income tax (expense) benefit from continuing operations for 2019, 20182022 and 2017,2021, were as follows (in thousands):
|
| Years Ended December 31, |
| |||||||||||||||||
|
| 2019 |
|
| 2018 |
|
| 2017 |
|
| 2022 |
|
| 2021 |
| |||||
Current |
|
|
|
|
|
|
|
|
|
|
|
|
|
|
|
|
|
| ||
Federal |
| $ | — |
|
| $ | — |
|
| $ | — |
|
| $ | — |
|
| $ | — |
|
State |
|
| 86 |
|
|
| (317 | ) |
|
| (83 | ) |
|
| — |
|
|
| — |
|
Total current |
|
| 86 |
|
|
| (317 | ) |
|
| (83 | ) |
|
| — |
|
|
| — |
|
Deferred |
|
|
|
|
|
|
|
|
|
|
|
|
|
|
|
|
|
| ||
Federal |
|
| 10,308 |
|
|
| 3,410 |
|
|
| 24,219 |
|
|
| 556 |
|
|
| 2,185 |
|
State |
|
| 87 |
|
|
| 644 |
|
|
| 449 |
|
|
| 166 |
|
|
| (20 | ) |
Valuation allowance |
|
| (10,385 | ) |
|
| (4,308 | ) |
|
| (392 | ) |
|
| (745 | ) |
|
| (2,141 | ) |
Total deferred |
|
| 10 |
|
|
| (254 | ) |
|
| 24,276 |
|
|
| (23 | ) |
|
| 24 |
|
Income tax (expense) benefit |
| $ | 96 |
|
| $ | (571 | ) |
| $ | 24,193 |
|
| $ | (23 | ) |
| $ | 24 |
|
F-20
GULF ISLAND FABRICATION, INC.
NOTES TO CONSOLIDATED FINANCIAL STATEMENTS-(Continued)
Significant components of our deferred tax assets and liabilities at December 31, 20192022 and 2018,2021, were as follows (in thousands):
|
| December 31, |
|
| December 31, |
| ||||||||||
|
| 2019 |
|
| 2018 |
|
| 2022 |
|
| 2021 |
| ||||
Deferred tax assets |
|
|
|
|
|
|
|
|
|
|
|
|
|
| ||
Impairments of intangible assets and inventory |
| $ | 644 |
|
| $ | 1,217 |
| ||||||||
Leases |
| $ | 221 |
|
| $ | 233 |
| ||||||||
Employee benefits |
|
| 724 |
|
|
| 758 |
|
|
| 1,465 |
|
|
| 1,208 |
|
Accrued losses on uncompleted contracts |
|
| 3,335 |
|
|
| 2,380 |
|
|
| 2,076 |
|
|
| 2,572 |
|
Stock based compensation expense |
|
| 312 |
|
|
| 266 |
|
|
| 351 |
|
|
| 247 |
|
Allowance for doubtful accounts |
|
| 11 |
|
|
| 84 |
| ||||||||
Long-term incentive awards |
|
| - |
|
|
| 150 |
| ||||||||
Federal net operating losses |
|
| 14,885 |
|
|
| 9,962 |
|
|
| 22,444 |
|
|
| 21,724 |
|
State net operating losses |
|
| 1,678 |
|
|
| 1,155 |
|
|
| 3,493 |
|
|
| 3,299 |
|
R&D and other tax credits |
|
| 806 |
|
|
| - |
|
|
| 1,013 |
|
|
| 938 |
|
Other |
|
| 426 |
|
|
| 395 |
|
|
| 481 |
|
|
| 545 |
|
Total deferred tax assets |
|
| 22,821 |
|
|
| 16,367 |
|
|
| 31,544 |
|
|
| 30,766 |
|
Deferred tax liabilities |
|
|
|
|
|
|
|
|
|
|
|
|
|
| ||
Property, plant and equipment and AHFS |
|
| (7,523 | ) |
|
| (11,416 | ) | ||||||||
Property, plant and equipment |
|
| (1,051 | ) |
|
| (1,285 | ) | ||||||||
Prepaid insurance |
|
| (402 | ) |
|
| (450 | ) |
|
| (497 | ) |
|
| (231 | ) |
Total deferred tax liabilities |
|
| (7,925 | ) |
|
| (11,866 | ) |
|
| (1,548 | ) |
|
| (1,516 | ) |
Net deferred tax assets |
|
| 14,896 |
|
|
| 4,501 |
|
|
| 29,996 |
|
|
| 29,250 |
|
Valuation allowance |
|
| (15,086 | ) |
|
| (4,701 | ) |
|
| (30,100 | ) |
|
| (29,331 | ) |
Net deferred taxes (1) |
| $ | (190 | ) |
| $ | (200 | ) |
| $ | (104 | ) |
| $ | (81 | ) |
(1) Amounts are included in other noncurrent liabilities on our Balance Sheet.
F-24
|
|
GULF ISLAND FABRICATION, INC.
NOTES TO CONSOLIDATED FINANCIAL STATEMENTS-(Continued)
At December 31, 20192022 and 2018,2021, we had total DTAs of $22.8$31.5 million and $16.4$30.8 million, respectively (including U.S. federal net operating loss(es) ("losses (“NOL(s)"”) DTAs of $14.9$22.4 million and $10.0$21.7 million, respectively). On a periodic and ongoing basis, we evaluate our DTAs (including our NOL DTAs) and assess the appropriateness of our valuation allowance(s) ("(“VA(s)"”). In assessing the need for a VA, we consider both positive and negative evidence related to the likelihood of realizing our DTAs. If, based upon the available evidence, our assessment indicates that it is more likely than not that some or all of the DTAs will not be realized, we record a VA. Our assessments include, among other things, the amount of taxable temporary differences that will result in future taxable income, the value and quality of our backlog, evaluations of existing and anticipated market conditions, analysis of recent and historical operating results (including cumulative losses over multiple periods) and projections of future results and strategic plans, as well as asset expiration dates. As a result of our assessment and due to cumulative losses for the three years ended December 31, 2019,2022, we believe the negative evidence outweighs the positive evidence with respect to our ability to realize our U.S. federal NOL DTAs, and accordingly, at December 31, 20192022 and 2018,2021, we had VAs of $15.1$30.1 million and $4.7$29.3 million, respectively, offsetting our total DTAs.
At December 31, 2019,2022, we had gross U.S. federal NOL carryforwards (excluding VAs) of $70.9$106.9 million, of which $42.3$62.7 million will expire in from 2035 through 2037 with the remaining U.S. federal NOL carryforwards eligible to be carried forward indefinitely, subject to an 80%80% limitation on taxable income in each year. We At December 31, 2022, we had gross state NOL carryforwards (excluding VAs) of $65.1$46.3 million, which will expire from 2035 through 2039.2041.
Uncertain Tax Positions-
Reserves for uncertain tax positions are recognized when we consider it more likely than not that additional tax will be due in excess of amounts reflected in our income tax returns, irrespective of whether or not we have received tax assessments. Interest and penalties on uncertain tax positions are recorded within income tax expense. At December 31, 2022 and 2021, we had no material reserves for uncertain tax positions. Tax returns subject to examination by the U.S. Internal Revenue Service are open for years 2015 and after. At December 31, 2019 and 2018, we had no material reserves for uncertain tax positions.after 2018.
Tax Cuts and Jobs Act - In December 2017, the Tax Cuts and Jobs Act was signed into law which, among other things, reduced the U.S. federal corporate income tax rate from a maximum of 35.0% to 21.0% (effective January 1, 2018).
7.8. RETIREMENT AND LONG-TERM INCENTIVE PLANS
Defined Contribution Plan
We sponsor a defined contribution plan for eligible employees that is qualified under Section 401(k) of the Internal Revenue Code, which includes voluntary employee pre-tax contributions and a Company matching contribution,Company-matching contributions, with potential additional discretionary
F-21
GULF ISLAND FABRICATION, INC.
NOTES TO CONSOLIDATED FINANCIAL STATEMENTS-(Continued)
contributions determined by theour Board of Directors. Effective April 1, 2016, we temporarily suspended our matching contribution, but reinstated it effective May 1, 2019. For 2019,2022 and 2021, we contributed $0.8$0.7 million and $0.4 million, respectively, to the plan.
Long-Term Incentive Plans
Under our long-term incentive plans ("(“Incentive Plans"Plans”), the Compensation Committee of our Board of Directors may grant cash-based awards and equity-based awards to eligible employees and non-employee directors, including restricted stock unit (“RSU”) awards (both time-based and restrictedperformance-based), stock units, stock optionsoption awards and stock-basedcash-based performance awards. The Compensation Committee determines the numbervalue of shares or stock options subject to each award, as well as the terms, conditions, performance measures and other provisions of the award. A summary ofUnder our Incentive Plans, and the maximum number of shares of our common stock that may be issued under each plan,granted to any one officer or employee during any single calendar year is as follows:
Long-Term Incentive Plan (approved on February 13, 1997) - 1,000,000 shares;
2002 Long-Term Incentive Plan (approved on April 24, 2002, and amended on April 26, 2006) - 500,000 shares;
2011 Stock Incentive Plan (approved on April 28, 2011) - 500,000 shares; and
2015Stock Incentive Plan (approved on April 23,2015) - 1,000,000 shares.
250,000. At December 31, 2019,2022, we had 611,887 aggregate697,726 authorized shares available for future issuance under our Incentive Plans.
Restricted Stock and Stock OptionF-25
GULF ISLAND FABRICATION, INC.
NOTES TO CONSOLIDATED FINANCIAL STATEMENTS-(Continued)
RSU Awards - Restricted–An RSU represents the right to receive one share of our common stock awards include shares of restricted stock and restricted stock units andupon vesting, or the equivalent cash value on the vesting date if the award is cash-settled. RSUs are subject to transfer restrictions, forfeiture provisions and other terms and conditions of the Incentive Plans. Restricted stockPlans and applicable award agreements. Forfeitures are recognized as they occur.
A summary of activity for our restricted stockRSU awards (excluding Cash-Settled RSUs) for 2019, 20182022 and 20172021 is as follows:
|
| 2019 |
|
| 2018 |
|
| 2017 |
| |||||||||||||||||||||||||||||||
|
| Number of Shares |
|
| Weighted- Average Grant-Date Fair Value Per Share |
|
| Number of Shares |
|
| Weighted- Average Grant-Date Fair Value Per Share |
|
| Number of Shares |
|
| Weighted- Average Grant-Date Fair Value Per Share |
|
| 2022 |
|
| 2021 |
| ||||||||||||||||
Restricted shares, beginning of period |
|
| 526,438 |
|
| $ | 11.56 |
|
|
| 445,126 |
|
| $ | 12.83 |
|
|
| 370,565 |
|
| $ | 12.99 |
| ||||||||||||||||
|
| Number |
|
| Weighted- |
|
| Number |
|
| Weighted- |
| ||||||||||||||||||||||||||||
RSUs, beginning of period |
|
| 842,558 |
|
| $ | 4.47 |
|
|
| 613,044 |
|
| $ | 4.59 |
| ||||||||||||||||||||||||
Granted |
|
| 170,936 |
|
|
| 6.09 |
|
|
| 440,185 |
|
|
| 11.16 |
|
|
| 383,121 |
|
|
| 13.02 |
|
|
| 463,600 |
|
|
| 4.24 |
|
|
| 547,250 |
|
|
| 4.71 |
|
Vested |
|
| (255,449 | ) |
|
| 11.41 |
|
|
| (250,219 | ) |
|
| 10.93 |
|
|
| (215,478 | ) |
|
| 12.52 |
|
|
| (403,559 | ) |
|
| 4.46 |
|
|
| (285,416 | ) |
|
| 5.19 |
|
Forfeited |
|
| (155,777 | ) |
|
| 11.81 |
|
|
| (108,654 | ) |
|
| 12.01 |
|
|
| (93,082 | ) |
|
| 12.53 |
|
|
| (64,332 | ) |
|
| 4.49 |
|
|
| (32,320 | ) |
|
| 4.40 |
|
Restricted shares, end of period |
|
| 286,148 |
|
|
| 8.30 |
|
|
| 526,438 |
|
|
| 11.56 |
|
|
| 445,126 |
|
|
| 12.83 |
| ||||||||||||||||
RSUs, end of period |
|
| 838,267 |
|
|
| 4.34 |
|
|
| 842,558 |
|
|
| 4.47 |
| ||||||||||||||||||||||||
Compensation expense for our restricted stockRSU awards was $1.8 million, $2.8$2.3 million and $2.7$1.7 million for 2019, 20182022 and 2017, respectively. The total income tax benefit (expense) recognized for2021, respectively, and is reflected within general and administrative expense and cost of revenue, as applicable, on our share-based compensation arrangements was benefitStatement of $13,000 for 2019 and a expense of $19,000 and $0.3 million for 2018 and 2017, respectively.Operations. At December 31, 2019,2022, we had $1.6$2.0 million of unrecognized compensation expense related to our restricted stockRSU awards. This cost is expected to be recognized over a weighted-average period of two1.6 years. The total fair value of restricted stockRSU awards granted during 20192022 and 2021 was $1.0$2.0 million and $2.6 million, respectively, and the total fair value of restricted stockRSU awards that vested during 20192022 and 2021 was $2.9 million. $1.6 million and $1.2 million, respectively. The income tax benefit (expense) associated with our share-based compensation arrangements was not significant for 2022 or 2021. Share and expense amounts associated with our stock-based compensation relate only to our continuing operations, and accordingly, may be different from the amounts reflected on our Statement of Cash Flows and Statement of Shareholders’ Equity. See Note 3 for further discussion of our discontinued operations.
Stock Option Awards and Cash-based Performance Awards – At December 31, 2019,2022, we had no outstanding stock option awards or cash-based performance awards and no stock option such awards were made during 2019, 20182022 or 2017.2021.
Stock-Based Performance Awards – Stock-based performance awards represent awards payable in cash for which the amount payable is determined based upon our total shareholder return during the performance period compared to an industry peer group as determined by our Compensation Committee. The cash payment occurs in the period immediately following the completion of the performance period. The fair value of the awards is calculated each reporting period using a Monte Carlo simulation model and is expensed on a straight-line basis over the applicable performance period, with cumulative adjustments for changes in the fair value between reporting periods. During 2018 and 2017, stock-based performance awards were granted with a three-year performance period ending December 31, 2020 and 2019, respectively.
During 2019 we recognized a benefit of $1.7 million (due to the reversal of previously recognized expense), and during 2018 and 2017 we recognized compensation expense of $1.1 million and $1.5 million, respectively, related to our stock-based performance awards. At December 31, 2019, we had no amounts accrued for these awards as the minimum target for the stock-based performance award granted in 2017 was not achieved, and the Monte Carlo simulation model projects that no payout will be earned for the stock-based performance award granted in 2018. The total fair value of stock-based performance awards granted during 2018 and 2017 was $3.8 million and $4.7 million, respectively.
F-22F-26
GULF ISLAND FABRICATION, INC.
NOTES TO CONSOLIDATED FINANCIAL STATEMENTS-(Continued)
Cash-Based Performance Awards – Cash-based performance awards represent awards payable in cash based on the achievement of annual income targets. The cash payment occurs in the period immediately following the completion of the performance period. During 2019, cash-based performance awards were granted with a three-year performance period ending December 31, 2021. One-third of the award is earned each year in the performance period, provided the applicable annual income target is achieved, or is forfeited if the applicable annual income target is not achieved. During 2019, we recognized no compensation expense related to cash-based performance awards as the minimum income target for 2019 was not achieved. Target amounts payable associated with the 2020 and 2021 performance periods are $0.5 million for each performance period if the target income metrics are achieved.
8.9. COMMITMENTS AND CONTINGENCIES
Routine Legal Proceedings
We are subject to various routine legal proceedings in the normal conduct of our business, primarily involving commercial disputes and claims, workers’ compensation claims, and claims for personal injury under general maritime laws of the U.S. and the Jones Act. While the outcome of these lawsuits, legal proceedings and claims cannot be predicted with certainty, we believe that the outcome of any such proceedings, even if determined adversely, would not have a material adverse effect on our financial position, results of operations or cash flows.liquidity.
MPSV Termination LetterLitigation
During the first quarterOn March 19, 2018, weour subsidiary, Gulf Island Shipyards, LLC (“GIS”), received termination notices of terminationfrom its customer, Hornbeck Offshore Services, LLC (“Hornbeck”), of the contracts for the construction of two MPSVs from one of our Shipyard Division customers. We dispute MPSVs. GIS disputed the purported terminations and disagreedisagreed with the customer’sHornbeck’s reasons for such terminations. Pending the resolutionAfter receipt of the dispute, we havesuch notices, GIS ceased all work and the partially completed vessels and associated equipment and materials remain at our facilityin its possession in Houma, Louisiana. The customerGIS continues to hold first priority security interests and possessory liens against the MPSVs securing the obligations GIS believes it is owed by Hornbeck under the construction contracts. Hornbeck also made claims underagainst the performance bonds issued by the Surety in connection with the construction of the vessels. We have discussed withvessels, for which the Surety our disagreement withface amount of the customer's purported terminations and its claims and continue to confer with the Surety regarding the dispute with the customer.bonds total $50.0 million (“Performance Bonds”).
On October 2, 2018, weGIS filed a lawsuit against the customerHornbeck to enforce ourits rights and remedies under the applicable construction contracts. Ourcontracts for the two MPSVs. The lawsuit disputeswas filed in the proprietyTwenty-Second Judicial District Court for the Parish of the customer’s purported terminationsSt. Tammany, State of the construction contractsLouisiana and seeksis styled Gulf Island Shipyards, LLC v. Hornbeck Offshore Services, LLC, bearing docket number 2018-14861 (“MPSV Litigation”). Hornbeck responded to recover damages associated with the customer’s actions. The customer filed its response to our lawsuit denying many of theGIS’s allegations in the lawsuit and assertingasserted a counterclaim against usGIS seeking among other things, declaratory judgment as to the validity of the customer’s purported terminations of the construction contracts and other purported claims for which the customer is seeking damages in an unspecified amount. We havedamages. GIS filed a response to the counterclaim denying all of the customer’sHornbeck’s claims. The customerHornbeck subsequently filed an amendment toamended its counterclaim to add claims by the customer against the Surety. The customer alsoSurety and additional claims against GIS.
Following previously disclosed developments in the litigation, on November 16, 2022, Hornbeck filed a motionmotions for partial summary judgment withagainst GIS seeking the dismissal of GIS’s claim that Hornbeck wrongfully terminated the vessel construction contracts. On January 31, 2023, the trial court seeking, among other things, to obtain possession of the vessels. A hearinggranted Hornbeck’s motions. GIS appealed such decision, and on the motion was held on May 28, 2019, and the customer's request to obtain possession of the vessels was denied by the trial court. The customer subsequently filed a second motion for partial summary judgment re-urging its previously denied request to obtain possession of the vessels. A hearing on the second motion was held on November 5, 2019, and the customer’s request to obtain possession of the vessels was again denied by the trial court. Thereafter, the customer requested thatMarch 2, 2023, the appellate court exercise its discretion and reviewreversed the trial court’s denialdecision, thereby reinstating GIS’s wrongful termination claim. As a result of the customer’s second motion. We have opposedappellate court’s ruling, the discretionary appellate review requesttrial, previously scheduled to begin on March 6, 2023, has been rescheduled to begin on October 16, 2023.
GIS continues to believe that Hornbeck wrongfully terminated the construction contracts and is liable to GIS for damages, including amounts due to GIS for unpaid work. However, Hornbeck is seeking damages against GIS based on Hornbeck’s estimates of the customercost to complete the vessels and its claims for lost profits (all of which are disputed by GIS) that together significantly exceed the face amount of the Performance Bonds. GIS believes that Hornbeck will only be entitled to recover damages if it is determined that Hornbeck rightfully terminated the construction contracts and if Hornbeck can prove it incurred damages. Further, GIS believes that Hornbeck is only entitled to recover damages for lost profits if GIS is found to have breached the construction contracts in bad faith and if the waiver of consequential damages that is included in the construction contracts is found to be ineffective. GIS also believes that Hornbeck has significantly overstated its damages, a belief that is supported by GIS and the appellate matterSurety’s expert evaluations.
Due to inherent uncertainties of litigation, there is pending. Discovery in connection with the lawsuit is ongoing.
We are unable to estimate the probabilitya range of apotential favorable or unfavorable outcomeoutcomes with respect to the dispute or estimatedisputed claims, and the amount of GIS’s potential recovery or loss, if any, related to this matter.or the timing of payment thereof, are uncertain. We can provide no assurances that weGIS will not incur additional costs as we pursue ourit pursues its rights and remedies under the construction contracts and defenddefends against Hornbeck’s claims. An unfavorable outcome to GIS in the customer’s claims. litigation could have a material adverse effect on our financial condition, results of operations and liquidity and would be accounted for as a reversal of previously recognized revenue with respect to the construction contracts to the extent of any loss.
At both December 31, 20192022 and 2018,2021, other noncurrent assets on our Balance Sheet included a net contract asset of $12.5$12.5 million, which consistedrepresenting GIS’s net receivable amount (after giving effect to purported liquidated damages of our contract asset, accrued contract losses, and deferred revenue balances$11.2 million) at the time of the customer'sHornbeck’s purported terminations of the contracts.construction contracts; however, an unfavorable outcome in the litigation could result in a loss from the write-off of the contract asset, or portions thereof.
InsuranceF-27
GULF ISLAND FABRICATION, INC.
NOTES TO CONSOLIDATED FINANCIAL STATEMENTS-(Continued)
Insurance
We maintain insurance coverage for various aspects of our business and operations. However, we may be exposed to future losses throughdue to coverage limitations and our use of deductibles and self-insured retentions for our exposures related to third partyproperty and equipment damage, builders’ risk, third-party liability, and workers' compensation.compensation and USL&H claims. We expect liabilities in excess of any deductibles and self-insured retentions to be covered by insurance.insurance; however, because we do not have an offset right, we have recorded a liability for estimated amounts in excess of our deductibles, and have recorded a corresponding asset related to estimated insurance recoveries, on our Balance Sheet. To the extent we are self-insured, reserves are recorded based upon our estimates, with input from legal and insurance advisors. Changes in assumptions, as well as changes in actual experience, could cause these estimates to change. See Note 2 for discussion of insurance deductibles incurred during 2022 and 2021 associated with damage caused by Hurricanes Ida.
Letters of Credit and Surety Bonds
We obtain letters of credit under our Credit AgreementLC Facility or surety bonds from financial institutions to provide to our customers in order to secure advance payments or guarantee performance under our contracts, or in lieu of retention being withheld on our contracts. With respect to a letterLetters of credit under our Credit Agreement, any payment inLC Facility are subject to cash securitization of the full amount of the outstanding letters of credit. In the event of non-performance under a contract, our cash securitization with respect to the letter of credit supporting such contract would become a borrowing under our Credit Agreement and thus a direct obligation.property of Whitney Bank. With respect to surety bonds, including the construction contracts associated with our MPSV Litigation, payments by the Surety pursuant to a surety bond any payment in the event of non-performance isare subject to indemnification ofreimbursement to the Surety by us whichunder a general indemnity agreement. Such indemnification obligations may include the face amount of the surety bond, or portions thereof, as well as other reimbursable items such as interest and certain investigative expenses and legal fees of the Surety. Such indemnification obligations would require us to borrow underuse our Credit Agreement.cash, cash equivalents or short-term investments, and we may not have sufficient liquidity to satisfy such indemnification obligations. When a contract is complete, the contingent obligation terminates, and letters of credit or surety bonds are returned. See Note 56 for further discussion of our Credit AgreementLC Facility and surety bonds.
F-23
GULF ISLAND FABRICATION, INC.
NOTES TO CONSOLIDATED FINANCIAL STATEMENTS-(Continued)
Our operations are subject to extensive and changing U.S. federal, state and local laws and regulations, as well as the laws of other countries, that establish health and environmental quality standards. These standards, among others, relate to air and water pollutants and the management and disposal of hazardous substances and wastes. We are exposed to potential liability for personal injury or property damage caused by any release, spill, exposure or other accident involving such pollutants, substances or wastes. In connection with the historical operation of our facilities, including those associated with acquired operations, substances which currently are or might be considered hazardous were used or disposed of at some sites that will or may require us to make expenditures for remediation. We believe we are in compliance, in all material respects, with environmental laws and regulations and maintain insurance coverage to mitigate exposure to environmental liabilities. We do not believe any environmental matters will have a material adverse effect on our financial condition, results of operations or cash flow.
Leases
We maintain operating leases for our corporate office and certain operating facilities and equipment. See Note 45 for further discussion of our leases.
9. LOSS10. INCOME (LOSS) PER SHARE
The following table presents the computation of basic and diluted loss per share for 2019, 20182022 and 20172021 (in thousands, except per share data):
|
| 2019 |
|
| 2018 |
|
| 2017 |
| |||
Net loss |
| $ | (49,394 | ) |
| $ | (20,378 | ) |
| $ | (44,766 | ) |
Less: distributed dividends from unvested restricted stock |
|
| — |
|
|
| — |
|
|
| 3 |
|
Net loss attributable to common shareholders |
| $ | (49,394 | ) |
| $ | (20,378 | ) |
| $ | (44,769 | ) |
Weighted average shares (1) |
|
| 15,227 |
|
|
| 15,032 |
|
|
| 14,838 |
|
Basic and diluted loss per common share |
| $ | (3.24 | ) |
| $ | (1.36 | ) |
| $ | (3.02 | ) |
|
| Years Ended December 31, |
| |||||
|
| 2022 |
|
| 2021 |
| ||
Loss from continuing operations |
| $ | (3,352 | ) |
| $ | (4,796 | ) |
Loss from discontinued operations, net of taxes |
|
| — |
|
|
| (17,372 | ) |
Net loss |
| $ | (3,352 | ) |
| $ | (22,168 | ) |
|
|
|
|
|
|
| ||
Basic and diluted loss from continuing operations |
| $ | (0.21 | ) |
| $ | (0.31 | ) |
Basic and diluted loss from discontinued operations |
|
| — |
|
|
| (1.12 | ) |
Basic and diluted loss per common share |
| $ | (0.21 | ) |
| $ | (1.43 | ) |
|
|
|
|
|
|
| ||
Weighted average shares |
|
| 15,840 |
|
|
| 15,510 |
|
|
|
10.F-28
GULF ISLAND FABRICATION, INC.
NOTES TO CONSOLIDATED FINANCIAL STATEMENTS-(Continued)
11. OPERATING SEGMENTS
During 2018,2021, we operated and managed our business through fourtwo operating divisions ("Fabrication", "Shipyard", "Services"(“Fabrication & Services” and "EPC"“Shipyard”) and one non-operating division ("Corporate"(“Corporate”), which represented our reportable segments. DuringIn the first quarter 2019,2022, we realigned our EPC Division was operationally combined withoperating divisions due to the DSS Acquisition and related changes in our Fabrication Division. Our EPC Division was previously created to support the pursuit of a specific EPC projectmanagement structure and other projects that require project management of EPC activities. Our operational combination of the EPC Division with the Fabrication Division is the resultoversight of our reduced emphasis on EPC project management opportunities and greater focus on onshore modular fabrication opportunities.various lines of business. As a result, of the aforementioned, we currently operate and manage our business through three operating divisions ("Fabrication"(“Services”, "Shipyard"“Fabrication” and "Services"“Shipyard”) and one non-operating division ("Corporate"(“Corporate”), which represent our reportable segments. Accordingly, financial information (including the segment resultseffects of eliminations) for the EPCour Fabrication & Services Division for 2018 and 2017 were combined with the Fabrication Division2021 has been recast to conform to the presentationspresentation of our reportable segments for 2019. We believe that our operating divisions meet the criteria of reportable segments under GAAP.2022. Our three operating divisions and Corporate Division are discussed below:
Services Division –Our Services Division provides maintenance, repair, construction, scaffolding, coatings, welding enclosures and other specialty services on offshore platforms and inland structures and at industrial facilities; provides services required to connect production equipment and service modules and equipment on offshore platforms; provides project management and commissioning services; provides industrial staffing services; and performs municipal and drainage projects, including pump stations, levee reinforcement, bulkheads and other public works. Our services activities are managed from our various Facilities and include the DSS Business acquired in connection with the DSS Acquisition. See Note 4 for further discussion of the DSS Acquisition.
Fabrication Division - –Our Fabrication Division fabricates modules, skids and piping systems for onshore refining, petrochemical, LNG and industrial facilities and offshore facilities; fabricates foundations, secondary steel components and support structures for alternative energy developments and coastal mooring facilities; fabricates offshore production platforms and associated structures, including jacket foundations, piles and topsides for fixed production and utility platforms, as well as hulls and topsides for floating production and utility platforms; and fabricates other complex steel structures and components. TheseOur fabrication activities are performed at our facility in Houma Louisiana.Facilities.
Shipyard Division - –Our Shipyard Division fabricatespreviously fabricated newbuild marine vessels including OSVs, MPSVs, research vessels, tugboats, salvage vessels, towboats, barges, drydocks, anchor handling vessels, and lift boats; providesprovided marine repair and maintenance services, including steel repair, blasting and painting services, electrical systems repair, machinery and piping system repairs, and propeller, shaft, and rudder reconditioning; and performs conversion projects to lengthen vessels and modify vessels to permit their use for a different type of activity or enhance their capacity or functionality. Theseservices. The activities arewere performed at our Shipyard Facility. However, on April 19, 2021, we completed the Shipyard Transaction, which included the Divested Shipyard Contracts and our Shipyard Facility. We determined that the assets, liabilities and operations associated with the Shipyard Transaction, and certain previously closed facilities, were discontinued operations in 2021. Accordingly, such operating results for 2021 have been classified as discontinued operations on our Statement of Operations. The assets, liabilities and operating results attributable to the Retained Shipyard Contracts and remaining assets and liabilities of our Shipyard Division operations that were excluded from the Shipyard Transaction, and are not associated with the previously closed facilities, represent our Shipyard Division and are classified as continuing operations on our Balance Sheet and Statement of Operations. The Active Retained Shipyard Contracts are being completed at our Houma JenningsFacilities and Lake Charles, Louisiana.we intend to wind down our Shipyard Division operations (which exclude the MPSV projects that are subject to our MPSV Litigation) by the second quarter 2023 (previously the first quarter 2023, but delayed and subject to the potential schedule impacts discussed in Note 2). See Note 3 for further discussion of the Shipyard Transaction and our discontinued operations and Note 9 for further discussion of our anticipated closure of the Jennings Yard.MPSV Litigation.
F-24
GULF ISLAND FABRICATION, INC.
NOTES TO CONSOLIDATED FINANCIAL STATEMENTS-(Continued)
Services Division- Our Services Division provides services on offshore platforms, including welding, interconnect piping and other services required to connect production equipment and service modules and equipment on a platform; provides on-site construction and maintenance services on inland platforms and structures and industrial facilities; performs municipal and drainage projects, including pump stations, levee reinforcement, bulkheads and other public works; and fabricates skid units, modules and piping systems. These activities are performed at customer facilities or at our facility in Houma, Louisiana.
Corporate Division - and Allocations –Our Corporate Division includes costs that do not directly relate to our three operating divisions. Such costs include, but are not limited to, costs of maintaining our corporate office, executive management salaries and incentives, board of directors' fees, litigation relatedcertain insurance costs and costs associated with overall corporate governance and beingreporting requirements for a publicly traded company. Costs incurred by our Corporate Division on behalf of ourShared resources and costs that benefit more than one operating division are allocated amongst the operating divisions are allocated tobased on each operating division’s estimated share of the operating divisions.benefit received. Such costs include, but are not limited to, human resources, insurance, sales and marketing, information technology, accounting, business development and accounting.certain division leadership.
F-29
GULF ISLAND FABRICATION, INC.
NOTES TO CONSOLIDATED FINANCIAL STATEMENTS-(Continued)
Segment Results– We generally evaluate the performance of, and allocate resources to, our divisions based upon gross profit (loss)or loss and operating income (loss).or loss. Segment assets are comprised of all assets attributable to each division. Intersegment revenues are priced at the estimated fair value of work performed. Summarized financial information for our segments as of and for the three-yeartwo-year period ended December 31, 2019,2022, is as follows (in thousands):
|
| 2019 |
| |||||||||||||||||||||||||||||||||||||
|
| Fabrication |
|
| Shipyard |
|
| Services |
|
| Corporate |
|
| Consolidated |
|
| Year Ended December 31, 2022 |
| ||||||||||||||||||||||
Revenue |
| $ | 70,052 |
|
| $ | 159,217 |
|
| $ | 81,706 |
|
| $ | (7,667 | ) |
| $ | 303,308 |
| ||||||||||||||||||||
|
| Services |
|
| Fabrication |
|
| Shipyard |
|
| Corporate |
|
| Total |
| |||||||||||||||||||||||||
Revenue (eliminations) |
| $ | 87,022 |
|
| $ | 48,299 |
|
| $ | 7,671 |
|
| $ | (672 | ) |
| $ | 142,320 |
| ||||||||||||||||||||
Gross profit (loss) (1) |
|
| (11,249 | ) |
|
| (10,949 | ) |
|
| 5,516 |
|
|
| (317 | ) |
|
| (16,999 | ) |
|
| 11,227 |
|
|
| (274 | ) |
|
| (3,058 | ) |
|
| — |
|
|
| 7,895 |
|
Operating income (loss) |
|
| (22,101 | ) |
|
| (21,352 | ) |
|
| 3,329 |
|
|
| (9,897 | ) |
|
| (50,021 | ) | ||||||||||||||||||||
Operating income (loss) (1) |
|
| 8,124 |
|
|
| 4,874 |
|
|
| (7,554 | ) |
|
| (8,859 | ) |
|
| (3,415 | ) | ||||||||||||||||||||
Depreciation and amortization expense |
|
| 3,534 |
|
|
| 4,167 |
|
|
| 1,450 |
|
|
| 413 |
|
|
| 9,564 |
|
|
| 1,496 |
|
|
| 3,343 |
|
|
| — |
|
|
| 259 |
|
|
| 5,098 |
|
Capital expenditures |
|
| 810 |
|
|
| 1,827 |
|
|
| 1,153 |
|
|
| 0 |
|
|
| 3,790 |
|
|
| 2,326 |
|
|
| 633 |
|
|
| — |
|
|
| 127 |
|
|
| 3,086 |
|
Total Assets |
|
| 55,066 |
|
|
| 97,409 |
|
|
| 28,336 |
|
|
| 71,966 |
|
|
| 252,777 |
| ||||||||||||||||||||
Total assets (3) |
|
| 28,016 |
|
|
| 40,531 |
|
|
| 16,330 |
|
|
| 49,989 |
|
|
| 134,866 |
| ||||||||||||||||||||
|
| Year Ended December 31, 2021 |
| |||||||||||||||||
|
| Services |
|
| Fabrication |
|
| Shipyard |
|
| Corporate |
|
| Total |
| |||||
Revenue (eliminations) |
| $ | 40,558 |
|
| $ | 41,339 |
|
| $ | 12,878 |
|
| $ | (1,323 | ) |
| $ | 93,452 |
|
Gross profit (loss) (2) |
|
| 5,692 |
|
|
| 497 |
|
|
| (4,242 | ) |
|
| (283 | ) |
|
| 1,664 |
|
Operating income (loss) (2) |
|
| 3,498 |
|
|
| (3,237 | ) |
|
| (5,769 | ) |
|
| (7,976 | ) |
|
| (13,484 | ) |
Depreciation and amortization expense |
|
| 641 |
|
|
| 3,360 |
|
|
| — |
|
|
| 319 |
|
|
| 4,320 |
|
Capital expenditures |
|
| 1,092 |
|
|
| 49 |
|
|
| — |
|
|
| — |
|
|
| 1,141 |
|
Total assets (3) |
|
| 21,745 |
|
|
| 37,310 |
|
|
| 16,222 |
|
|
| 59,996 |
|
|
| 135,273 |
|
|
| 2018 |
| |||||||||||||||||
|
| Fabrication |
|
| Shipyard |
|
| Services |
|
| Corporate |
|
| Consolidated |
| |||||
Revenue |
| $ | 40,420 |
|
| $ | 96,424 |
|
| $ | 88,230 |
|
| $ | (3,827 | ) |
| $ | 221,247 |
|
Gross profit (loss) (2) |
|
| (7,840 | ) |
|
| (10,472 | ) |
|
| 12,447 |
|
|
| (1,331 | ) |
|
| (7,196 | ) |
Operating income (loss) |
|
| (4,813 | ) |
|
| (14,396 | ) |
|
| 9,371 |
|
|
| (9,827 | ) |
|
| (19,665 | ) |
Depreciation and amortization expense |
|
| 4,315 |
|
|
| 4,229 |
|
|
| 1,511 |
|
|
| 295 |
|
|
| 10,350 |
|
Capital expenditures |
|
| 216 |
|
|
| 2,003 |
|
|
| 1,244 |
|
|
| 18 |
|
|
| 3,481 |
|
Total Assets (3) |
|
| 64,076 |
|
|
| 97,197 |
|
|
| 38,643 |
|
|
| 58,374 |
|
|
| 258,290 |
|
|
| 2017 |
| |||||||||||||||||
|
| Fabrication |
|
| Shipyard |
|
| Services |
|
| Corporate |
|
| Consolidated |
| |||||
Revenue |
| $ | 58,078 |
|
| $ | 52,699 |
|
| $ | 65,445 |
|
| $ | (5,200 | ) |
| $ | 171,022 |
|
Gross profit (loss) (4) |
|
| (1,900 | ) |
|
| (44,870 | ) |
|
| 4,575 |
|
|
| (730 | ) |
|
| (42,925 | ) |
Operating income (loss) |
|
| (11,969 | ) |
|
| (50,044 | ) |
|
| 1,874 |
|
|
| (8,471 | ) |
|
| (68,610 | ) |
Depreciation and amortization expense |
|
| 6,592 |
|
|
| 4,073 |
|
|
| 1,676 |
|
|
| 404 |
|
|
| 12,745 |
|
Capital expenditures |
|
| 2,395 |
|
|
| 1,909 |
|
|
| 403 |
|
|
| 127 |
|
|
| 4,834 |
|
Total Assets (3) |
|
| 155,929 |
|
|
| 74,516 |
|
|
| 32,487 |
|
|
| 7,908 |
|
|
| 270,840 |
|
|
|
|
|
|
|
|
|
F-25
GULF ISLAND FABRICATION, INC.
NOTES TO CONSOLIDATED FINANCIAL STATEMENTS-(Continued)
11. QUARTERLY OPERATING RESULTS (UNAUDITED)
The following table presents selected unaudited consolidated financial information on a quarterly basisGross profit (loss) and operating income (loss) for 20192022 includes project charges of $2.0 million for our Shipyard Division. Operating income (loss) for 2022 also includes gains of $7.5 million from the net impact of insurance recoveries and 2018 (in thousands, except per share data):
|
| March 31, 2019 |
|
| June 30, 2019 |
|
| September 30, 2019 |
|
| December 31, 2019 (1) |
| ||||
Revenue |
| $ | 67,605 |
|
| $ | 80,456 |
|
| $ | 75,802 |
|
| $ | 79,445 |
|
Gross profit (loss) |
|
| 553 |
|
|
| (1,598 | ) |
|
| (2,685 | ) |
|
| (13,269 | ) |
Net loss |
|
| (3,042 | ) |
|
| (5,248 | ) |
|
| (6,779 | ) |
|
| (34,325 | ) |
Basic and diluted loss per share |
|
| (0.20 | ) |
|
| (0.34 | ) |
|
| (0.44 | ) |
|
| (2.26 | ) |
|
| March 31, 2018 |
|
| June 30, 2018 |
|
| September 30, 2018 |
|
| December 31, 2018 (2) |
| ||||
Revenue |
| $ | 57,290 |
|
| $ | 54,014 |
|
| $ | 49,712 |
|
| $ | 60,231 |
|
Gross profit (loss) |
|
| 679 |
|
|
| (699 | ) |
|
| (3,212 | ) |
|
| (3,964 | ) |
Net income (loss) |
|
| (5,296 | ) |
|
| 549 |
|
|
| (10,949 | ) |
|
| (4,682 | ) |
Basic and diluted loss per share |
|
| (0.36 | ) |
|
| 0.04 |
|
|
| (0.73 | ) |
|
| (0.31 | ) |
|
|
12. SUBSEQUENT EVENTS
Credit Agreement Amendment – On February 28, 2020, we amended our Credit Agreement. See Note 5 for further discussion of our amendment.
Customer Change Order Settlement – On February 28, 2020, we reached a $10.0corporate office lease asset impairment.
F-30
EXHIBIT
| ||
2.1 | ||
| ||
3.1 | ||
3.2 | ||
| ||
4.1 | ||
| ||
4.2 | ||
| ||
10.1 | ||
| ||
10.2 | ||
| ||
10.3 | ||
| ||
10.4 | ||
| ||
10.5 | ||
| ||
10. 6 | ||
10.7 | ||
10.8 | ||
10.9 | ||
| Form of | |
|
| |
| ||
10.10 | ||
| ||
10.11 | ||
| ||
| ||
10.12 | ||
| ||
| ||
10.13 | ||
|
E-1
EXHIBIT | ||
10.14 | ||
| ||
10.15 | ||
| ||
10.16 | ||
| ||
10.17 | ||
| ||
10.18 | ||
10.19 | ||
10.20 | ||
10.21 |
| ||
10.22 | ||
| ||
10.23 | ||
| ||
21 | ||
| Subsidiaries of the Company - The | |
22 | Subsidiary guarantors and issuers of guaranteed securities – From time to time, the Company may issue debt securities under a registration statement on Form S-3 filed with the SEC that are fully and unconditionally guaranteed by Gulf Island, L.L.C., Gulf Island Shipyards, LLC and Gulf Island Services, L.L.C., each a wholly-owned subsidiary of the Company. | |
23.1 | ||
31.1 | ||
| CEO Certifications pursuant to Rule 13a-14 under the Securities Exchange Act of 1934.* | |
31.2 | ||
| CFO Certifications pursuant to Rule 13a-14 under the Securities Exchange Act of 1934.* | |
32 | ||
| Section 906 Certifications furnished pursuant to 18 U.S.C. Section 1350.* | |
101 INS | Inline XBRL Instance Document – the instance document does not appear in the Interactive Data File because its XBRL tags are embedded within the Inline XBRL document. | |
|
| |
101.CAL |
|
E-2
|
| |
101.DEF | Inline XBRL Taxonomy Extension Definition Linkbase Document. | |
101.LAB | Inline XBRL Taxonomy Extension Label Linkbase Document. | |
101.PRE | Inline XBRL Taxonomy Extension Presentation Linkbase Document. | |
104 | The cover page for the Company’s Annual Report on Form 10-K for the fiscal year ended December 31, 2022, has been formatted in Inline XBRL and is contained in Exhibit 101. |
|
|
|
|
† Management Contract or Compensatory Plan.
^ SEC File Number 000-22303.
E-3
SIGNATURES
Pursuant to the requirements of Section 13 or 15(d) of the Securities Exchange Act of 1934, the registrant has duly caused this report to be signed on its behalf by the undersigned, thereunto duly authorized, on March 5, 2020.28, 2023.
GULF ISLAND FABRICATION, INC. (Registrant) | |
By: | /S/ RICHARD W. HEO |
Richard W. Heo | |
President and Chief Executive Officer | |
Pursuant to the requirements of the Securities Exchange Act of 1934, this report has been signed below by the following persons on behalf of the registrant and in the capacities indicated on March 5, 2020.28, 2023.
Signature | Title | |
/S/ RICHARD W. HEO | President, Chief Executive Officer and Director (Principal Executive Officer) | |
Richard W. Heo | ||
/S/ WESTLEY S. STOCKTON | Executive Vice President, Chief Financial Officer, Treasurer and Secretary (Principal Financial Officer and Principal Accounting Officer) | |
Westley S. Stockton | ||
|
| |
| ||
/S/ ROBERT M. AVERICK | Director | |
Robert M. Averick | ||
/S/ MURRAY W. BURNS | Director | |
Murray W. Burns | ||
/S/ WILLIAM E. CHILES |
| |
William E. Chiles | ||
|
| |
| ||
|
| |
| ||
|
| |
| ||
/S/ MICHAEL J. KEEFFE | Director | |
Michael J. Keeffe | ||
|
| |
| ||
/S/ CHERYL D. RICHARD | Director | |
Cheryl D. Richard | ||
S-1