TABLE OF CONTENTS
| QUICKLOGIC CORPORATION | ||||
| TABLE OF CONTENTS | ||||
|
| Page | ||
| ||||
| ||||
|
| |||
|
| |||
|
| |||
|
| |||
|
| |||
| ||||
|
| |||
|
| |||
| Management’s Discussion and Analysis of Financial Condition and Results of Operations |
| ||
|
| |||
|
| |||
| Changes in and Disagreements with Accountants on Accounting and Financial Disclosure |
| ||
|
| |||
|
| |||
| ITEM 9C. | Disclosure Regarding Foreign Jurisdictions that Prevent Inspections | 58 | ||
| ||||
|
| |||
|
| |||
| Security Ownership of Certain Beneficial Owners and Management and Related Stockholder Matters |
| ||
| Certain Relationships, Related Transactions, and Director Independence |
| ||
|
| |||
| ||||
|
| |||
| ITEM 16. | Form 10-K Summary | 61 | ||
|
| |||
FORWARD-LOOKING STATEMENT AND RISK FACTOR SUMMARY
Forward-Looking Statements
This Annual Report on Form 10-K, including the information contained in "Management’s Discussion and Analysis of Financial Condition and Results of Operations", as well as information contained in “Risk Factors” in Item 1A and elsewhere in this Annual Report on Form 10-K, contains “forward-looking statements” within the meaning of Section 27A of the Securities Act of 1933 and Section 21E of the Securities Exchange Act of 1934.1934 regarding our business, financial condition, results of operations and prospectus. We intend that these forward-looking statements be subject to the safe harbors created by those provisions. Forward-looking statements are generally written in the future tense and/or are preceded by words such as “will,” “may,” “should,” “forecast,” “could,” “expect,” “suggest,” “believe,” “anticipate,” “intend,” “plan,” "future," "potential," "target," "seek," "continue," "if" or other similar words. Forward-looking statements include statements regarding (1) our revenue levels, including the commercial success of our solutions, and new products, (2) the conversion of our design opportunities into revenue, (3) our liquidity, (4) our gross profit and breakeven revenue level and factors that affect gross profit and the breakeven revenue level, (5) our level of operating expenses, (6) our research and development efforts, (7) our partners and suppliers, (8) industry and market trends, (9) our manufacturing and product development strategies and (10) our competitive position.
The forward-looking statements contained in this Annual Report involve a number of risks and uncertainties, many of which are outside of our control. Factors that could cause actual results to differ materially from projected results include, but are not limited to, risks associated with (i) the conversion of our design opportunities into revenue; (ii) the commercial and technical success of our new products and our successful introduction of products and solutions incorporating emerging technologies or standards; (iii) our dependence on our relationships with third parties to manufacture our products and solutions; (iv) our dependence upon single suppliers to fabricate and assemble our products; (v) the liquidity required to support our future operating and capital requirements; (vi) our ability to accurately estimate quarterly revenue; (vii) our expectations about market and product trends; (viii) our future plans for partnerships and collaborations; (ix) our dependence upon a few customers for a significant portion of our total revenue; (x) our ability to forecast demand for our products; (xi) our dependence on our international business operations; (xii) our ability to attract and retain key personnel; (xiii) our ability to remain competitive in our industry; (xiv) our ability to achieve the expected benefits from our acquisition of SensiML Corporation; (xv) our ability to protect our intellectual property rights; (xvi)(xv) our ability to prevent cyberattacks and protect our data; and (xvii)(xvi) our ability to handle natural disasters and epidemics, such as the recent outbreak of the COVID-19 virus. Although we believe that the assumptions underlying the forward-looking statements contained in this Annual Report are reasonable, any of the assumptions could be inaccurate, and therefore there can be no assurance that such statements will be accurate. The risks, uncertainties and assumptions referred to above that could cause our results to differ materially from the results expressed or implied by such forward-looking statements include, but are not limited to, those discussed under the heading “Risk Factors” in Part I, Item 1A hereto and the risks, uncertainties and assumptions discussed from time to time in our other public filings and public announcements. All forward-looking statements included in this document are based on information available to us as of the date hereof. In light of the significant uncertainties inherent in the forward-looking statements included herein, the inclusion of such information should not be regarded as a representation by us or any other person that the results or conditions described in such statements or our objectives and plans will be achieved. Furthermore, past performance in operations and share price is not necessarily indicative of future performance. We disclaim any intention or obligation to update or revise any forward-looking statements, whether as a result of new information, future events or otherwise.
As used herein, "QuickLogic", the "Company", "we", "our" and similar terms include QuickLogic Corporation and its subsidiaries, unless the context indicates otherwise.
(a) General Development of Business
QuickLogic Corporation (the "Company") was founded in 1988 and reincorporated in Delaware in 1999.General
(b) Financial Information About Segments
See Item 8, "Financial Statements and Supplementary Data - Note 14 - Information Concerning Product Lines, Geographic Information, Accounts Receivable and Revenue Concentration.”
Overview
QuickLogic Corporation was founded in 1988 and reincorporated in Delaware in 1999. Our vision is to transform the way people and deviceshardware products interact with each other and their surroundings. Our mission is to provide innovative silicon and software platforms to successfully enable our customers to develop hardware products that fundamentally change the end-user experience. Specifically, we are a fabless semiconductor company that develops a full stack platform for artificial intelligence or AI, voice and sensor processing. The platform is based on our embedded FPGA or eFPGA,("eFPGA") intellectual property or IP,("IP"), low power, multi-core semiconductor system-on-chips or SoCs,("SoCs"), discrete FPGAs, and AI software. Our customers can use our eFPGA IP for hardware acceleration and pre-processing in their own custom semiconductor hardware products, our SoCs to run our customer’s software and build their hardware around.around, and our discrete FPGAs to implement their custom functionality. The Analytics Toolkit from SensiML Corporation or SensiML,("SensiML"), our wholly-owned subsidiary, provides an end-to-end Artificial Intelligence / Machine Learning solution with accurate sensor algorithms using AI technology. The full range of platforms, software tools and eFPGA IP enables the practical and efficient adoption of AI, voice and sensor processing across mobile, wearable, hearable, consumer, industrial, edgeConsumer/Industrial IoT, Consumer Electronics, Military, Aerospace and endpoint IoT.Defense markets.
Our new products include our ArcticPro™, EOS™, QuickAI™, SensiML Analytics Studio,Toolkit, ArcticLink® III, PolarPro®3, PolarPro II, PolarPro, and Eclipse II products (which together comprise our new product category). Our mature products include primarily FPGA families named pASIC®3 and QuickRAM® as well as programming hardware and design software.products. In addition to delivering our own semiconductor solutions, we have anour new products category includes our IP business that licenses our eFPGA technology for use in other semiconductor companies SoCs. We began delivering ourSoCs and provides professional services, consisting of development and integration of eFPGA IP product ArcticPro™ in 2017, which is included in the new product revenue category. Through the acquisition oftechnology into bespoke semiconductor solutions. SensiML we now haveprovides an AI software platform that includesfor products which include Software-as-a-Service (SaaS) subscriptions for development, per unit license fees when deployed in production, and proof-of-concept services, all of which are also included in the new productproducts revenue category. Our mature products include primarily FPGA families named pASIC®3 and QuickRAM® as well as programming hardware and design software.
Our solutions typically fall into one of threefour categories: Hardware products consisting of Sensor Processing, Display Smart Connectivity, and Visual Enhancement,eFPGA intellectual property and Smart Connectivity.its associated Tools. Our solutions include a unique combination of our silicon platforms, IP cores, software drivers, and in some cases, firmware and application software. All of our silicon platforms are standard deviceshardware products and must be programmed to be effective in a system. Our IP that enables always-on context-aware sensor applications includes our Flexible Fusion Engine, our Sensor Manager and Communications Manager technologies as well as IP that (i) improves multimedia content, such as our Visual Enhancement Engine, or VEE, technology, and Display Power Optimizer, or DPO, technology; and (ii) implements commonly used mobile system interfaces, such as Low Voltage Differential Signaling, or LVDS, Mobile Industry Processor Interface, or MIPI, and Secure Digital Input Output, or SDIO.
Through the acquisition of SensiML in January 2019, our core IP also includesexpanded to include the SensiML Analytics Toolkit that enables OEMsOriginal Equipment Manufacturers ("OEMs") to develop AI software for a broad array of resource-constrained time-series sensor endpoint applications. These include a wide range of consumer and industrial sensing applications.
We collaborate with multiple partners on reference designs, and in some cases, co-marketing and/or co-selling initiatives. QuickLogic also workworks with mobile processor manufacturers, sensor manufacturers, and voice recognition, sensor fusion and context awareness algorithm developers, and embedded systems companies in the development of reference designs. Through reference designs that incorporate our solutions, we believe mobile processor manufacturers, sensor manufacturers, and sensor and voice algorithm companies can expand the available market for their respective products. Furthermore, should a solution developed for a processor manufacturer or sensor and/or sensor algorithm company be applicable to a set of
common OEMs or Original Design Manufacturers or ODMs,("ODMs") we can amortize our Research and Development or ("R&D,&D") investment over that set of OEMs or ODMs.OEMs. There may also be cases when platform providers that intend to use always-on voice recognition will dictate certain performance requirements for the combined software/hardware solution before the platform provider certifies and/or qualifies our product for use by end customers.
SensiML collaborates with several microcontroller and sensors manufacturers to integrate the microcontroller and/or sensor manufacturers’ development kits with SensiML’s Analytics Toolkit in order to showcase combined solutions for AI/ML applications. Currently, these collaborations include Infineon Technologies, On Semiconductor Corp., Microchip Technology Inc., Silicon Laboratories, Inc., STMicroelectronics N.V., Arduino, NXP Semiconductors N.V., Raspberry Pi, and Nordic Semiconductor.
We have changed our manufacturing strategies to reduce the cost of our silicon solution platforms to enable their use in high volume, mass customization products. Our EOS S3, EOS S3AI, QuickAI and ArcticLink III silicon platforms combine mixed signal physical functions and hard-wired logic alongside programmable logic. Our EOS S3, EOS S3AI and ArcticLink III solution platforms are manufactured on an advanced process node where we can benefit from smaller die sizes. We typically implement sophisticated logic blocks and mixed signal functions in hard-wired logic because it is very cost-effective and energy efficient. We use small form factor packages, which are less expensive to manufacture and include smaller pin counts. Reduced pin counts result in lower costs for our customer’s printed circuit board space and routing. Furthermore, our SRAM reprogrammable silicon platforms can be programmed in-system by our customers, and therefore we do not incur programming cost, lowering the overall cost of ownership to our customers. We expect to continue to invest in silicon solution platforms and manufacturing technologies that make us costcompetitive for the variety of markets and power consumption effective for high-volume, battery-powered applications.applications that programmable logic serves.
In addition to working directly with our customers, we partner with other companies that are experts in certain technologies to develop additional IP, reference platforms and system software to provide application solutions, particularly in the area of hardware acceleration for AI-type applications. We also work with mobile processor and communications semiconductor device manufacturers and companies that supply sensor, algorithms and applications. For our sensor processing solutions, we collaborate with sensor manufacturers to ensure interface compatibility. We also collaborate with sensor and voice/audio software companies, helping them optimize their software technology on our silicon platforms in terms of performance, power consumption and user experience.
Our ArcticPro eFPGA IP are currently developed on 250nm, 130nm, 90nm, 65nm, 40nm, 28nm and 22nm process nodes. The licensable IP is generated by aan automated compiler tool, called Australis™, that enables licenseesour engineers to create an eFPGA blockIP for our licensees that they can then integrate into their SoC without significant involvement by QuickLogic. We believe this flow enables a scalable development and support model for QuickLogic. For our eFPGA strategy, we typically work with semiconductor manufacturing partners prior to ensure our eFPGAthis IP is proven for a given foundry and process node before it isbeing licensed to a SoC company.
In order to grow our revenue from its current level, we depend upon increased revenue from our new products including existing new product platforms eFPGA IP and platforms currently in development. We expect our business growth to be driven mainly by our silicon solutions, eFPGA IP and SensiML AI Software. Therefore, our revenue growth needs to be strong enough to enable us to sustain profitability while we continue to invest in the development, sales and marketing of our new solution platforms, IP and software.
Recent Developments
Supply Chain Disruptions
Global, supply chain constraints have not had a material impact on our business. While we have experienced some volatilities with input material costs and supplier costs in accordance with domestic and global economic conditions, none of these have had a material impact to our business during our Fiscal 2022 year. We do not expect material increases in costs over the next twelve months. However, we expect to be subject to continued, broader-based inflationary, labor, and supplier costs increases in alignment with domestic and global economic conditions. We expect any increases in costs to be dilutive to our gross profit; and we may be limited in our ability to offset any increased costs with price increases to customers. This may have a negative impact to our results from operations and cash flows.
2023 Cybersecurity Incident
On November 26, 2019, shareholdersJanuary 20, 2023, the Company detected a ransomware infection affecting a limited number of IT systems, including systems that contained personal information of our employees. Upon detection of the incident, the Company approvedpromptly began an amendmentassessment of all Company IT systems, notified law enforcement, and engaged legal counsel and other incident response professionals. The Company continued its business operations during this incident and successfully restored all of its critical operational data. The Company has also taken steps to further secure its IT systems. Based on the ongoing investigation and information currently known at this time, the Company believes the incident has not had nor will have a material impact on its business, operations, ability to serve its customers, or financial results. See Note 15 to the consolidated financial statements for additional information.
Impact of COVID-19 and Global Economic Environment on our Business
The COVID-19 pandemic, increased financial market volatility, inflationary pressure, rising interest rates, recessionary concerns and geopolitical tension continue to impact business globally and may impact our operations by causing disruption to our Amendedlabor markets and Restated Certificatesupply chains. We continue to monitor the global impacts of IncorporationCOVID-19 and take steps to effect a reverse stock splitmitigate the potential risks to us posed by its spread and related circumstances and impacts. These efforts will continue as requirements change, new risks are identified and infections impact us. The spread and resurgence of COVID-19 from new variants in countries where we operate may make our outstanding sharesability to mitigate the impacts of common stock, at a reverse stock split ratio from 1-for-5the spread of the virus on our productivity more challenging.
The conflict between Russia and Ukraine has negatively impacted the global economy and led to 1-for-15 (the “Reverse Stock Split”), as determinedvarious economic sanctions being imposed by the Board of Directors. On December 6, 2019. our Board of Directors approvedU.S., United Kingdom, European Union and other countries against Russia. While the implementationimpacts of the Reverse Stock Split at a ratio of 1-for-14. The Reverse Stock Split was intended to bring the Company into compliance with the $1.00 minimum average closing share price requirement for continued listing (“Bid Pricing Rule”)conflict have not been material on the Nasdaq Capital Market (the “Nasdaq”). On January 9, 2020,Company's results of operations, as we do not have operations or material customers or suppliers in either country, it is not possible to predict the Company received a letter from Nasdaq Stock Market LLC stating thatbroader consequences of this ongoing conflict. Changing U.S. Government export regulations, particularly relating to advanced semiconductors may limit the Company had regained complianceability to provide customers with certain goods and services in China.
See the Bid Price Rulesection entitled “Risk Factors” in Item 1A of Part I of this report for further information about related risks and it considered the matter closed.
On January 24, 2020, the Company’s Board of Directors approved a restructuring plan to lower the annual operating expenses. The Company expects that the majority of the cost savings will come from personnel reductions, which were implemented across all parts of the Company and geographies. This restructuring plan will result in a reduction of about 33% of the Company's global workforce.uncertainties.
In conjunction with this restructuring plan, the Company estimates it will incur approximately $500,000 to $600,000 of restructuring expenses, which will result in total cash expenditures of approximately $500,000, with the majority coming in the first quarter of fiscal 2020.
Available Information
Our corporate headquarters are located at 2220 Lundy Avenue, San Jose, California 95131. We can be reached at (408) 990-4000, and our website address is www.quicklogic.com. The information on our website is not incorporated herein by reference and is not a part of this Form 10-K. Our common stock trades on the Nasdaq under the symbol “QUIK.” Our annual reports on Form 10-K, quarterly reports on Form 10-Q, current reports on Form 8-K and amendments to such reports are available, free of charge, on our website home page as soon as reasonably practicable after we electronically file such materials with, or furnish them to, the Securities and Exchange Commission, or SEC. Copies of the materials filed by the Company with the SEC are also available at the Public Reference Room at 100 F Street, N.E., Washington, D.C., 20549. Information regarding the operation of the Public Reference Room is available by calling the SEC at 1-800-SEC-0330. Reports, proxy and information statements and other information regarding issues that we file electronically with the SEC are also available on the SEC’s website at www.sec.gov. A copy of our Code of Conduct and Ethics is posted on our website at https://ir.quicklogic.com/governance-docs. Any changes to or waiver from this Code of Conduct and Ethics will be posted to this page on our website.
Fiscal Year
Our fiscal year ends on the Sunday closest to December 31. References to fiscal years 2019, 2018Fiscal Years 2022, 2021, and 20172020 refer to the fiscal yearsFiscal Years ended December 29, 2019, December 30, 2018January 1, 2023, January 2, 2022, and December 31, 2017,January 3, 2021, respectively.
Industry Background
Consumer Electronics, or CE,
Internet-of-Things ("IoT") products are a strong growth market for semiconductor products, programmable logic, and sensorAI/ML software, algorithms, and the needs of this market bring a unique set of requirements. Three important trends in this market are (i) toward mobile devices, either handheld or worn onproliferation of hardware products at the body,edge of the network connected via a wireless network, (ii) an increasing adoption of sensors, and (iii) devices with wireless connectivitydesire to the cloud. Important industry trends affecting the large market for mobile devices include the need for high bandwidth that enables the same user experience consumers are accustomedincrease processing efficiency as a means to on the personal computer, or PC, such as internet browsing, social networkinglower power consumption and streaming video, product miniaturization and the need to increase battery life. Increased local computingThe trends to add more sensors to these connected hardware products is driven from the desire to enable more intelligence in these hardware products so that they can operate without continuously sending raw data back to a cloud-based infrastructure; sending metadata in lieu of raw data is more efficient for cost and power consumption and is generally viewed as more secure. Creating metadata from raw data requires more processing capability in mobile devices, coupled withthe sensor-enabled hardware as well as sophisticated software.
Historically, processing capability was built using a homogenous architecture, meaning, one that consisted of the use of only one type of technology. This could be one or more ubiquitous wireless access toinstances of a single processor type, or only programmable logic. More recently, there is a general trend in the cloud and lower cost sensors has been enablingsemiconductor market that enhanced processing capability can come from the developmentadoption of more intelligent software applications and consumer use cases. Manyheterogeneous architectures. Examples of these product requirements were, and continue to be, driven by innovations fromthis trend are the Smartphone, Wearables and Hearables solutions that OEMs are launchinginclusion of one or more general purpose processor cores (e.g. Arm or RISC-V) in conjunction with Google Android and Real-Time operatingprogrammable logic. This type of architecture enables the end user to partition their application workloads across the heterogeneous cores so that the most appropriate core is used for a given workload, often concurrently. Generally, this is viewed as the most optimal way to design systems as well as Apple iPhone, Apple iPad, Apple Watch and Apple Airpods.that need to optimize for performance or battery life.
While advances in cost-effective cloud storage and power-efficient wireless technology have enabled consumer device manufacturers to enhance device connectivity and offload some processing to the cloud, there continues to be a trend for feature-rich mobile devices to suffer from shorter battery lives. This challenge places a burden on the designers and manufacturers of these mobile CE products as they try to tailor multiple products with limited engineering resources. Lastly, the fast pace at which consumer taste for these features changes exacerbates the development challenges and risks in launching successful products to the marketplace.
Another important trend is shrinking product life cycles. This drives a need for faster and lower risk product development. There is intense pressure on the bill of materials or BOM,("BOM") cost of these devices,hardware products, including per unit component costs and non-recurring development costs. As more people experience the advantages of a mobile lifestyle at home, they demand the same advantages in their professional lives. We believe that the trend toward mobile, handheldbattery-powered products that have a PC-like and cloud user experience,provide more intelligent insights from onboard sensors, small form factor and maximize battery
life will be prominent in the computing, industrial, medical and military markets. One such example is the trend
We believe these industry trends are shifting the demand among different classes of core silicon. The following are the four main classes of non-memory core silicon:
Microcontrollers, or MCUs, are typically small, low-power devices on a single integrated circuit that contain a processor core, memory and a number of peripherals. They are designed to be programmed with software for embedded applications;
• | Microcontrollers ("MCUs") are typically small, low-power hardware products on a single integrated circuit that contain a processor core, memory and a number of peripherals. They are designed to be programmed with software for embedded applications; | |
• | Application Specific Standard Products ("ASSPs") other than processors, are fixed function hardware products designed to address a relatively narrow set of applications. These hardware products typically integrate a number of common peripherals or functions and the functionality of these hardware products is fixed prior to wafer fabrication; | |
• | Programmable Logic Devices ("PLDs") are general-purpose hardware products, which can be used by a variety of electronic systems manufacturers and are customized after purchase for a specific application. FPGAs are a subset of PLDs and are typically used to implement complex system functions; and | |
• | Application Specific Integrated Circuits ("ASICs") are custom hardware products designed and fabricated to meet the needs of one specific application for one end-customer. Structured ASICs, a sub-category of ASICs, provide a limited amount of custom content to broaden the applicability of a device for additional applications. |
Application Specific Standard Products, or ASSPs, other than processors, are fixed function devices designed to address a relatively narrow set of applications. These devices typically integrate a number of common peripherals or functions and the functionality of these devices is fixed prior to wafer fabrication;
Programmable Logic Devices, or PLDs, are general-purpose devices, which can be used by a variety of electronic systems manufacturers and are customized after purchase for a specific application. FPGAs are a subset of PLDs and are typically used to implement complex system functions; and
Application Specific Integrated Circuits, or ASICs, are custom devices designed and fabricated to meet the needs of one specific application for one end-customer. Structured ASICs, a sub-category of ASICs, provide a limited amount of custom content to broaden the applicability of a device for additional applications.
ASSPs are offered broadly to the market, making it challenging for a system designer to create differentiated products from these deviceshardware products alone. In many situations, the available ASSPs may not directly implement the desired function and the system designer is required to use a combination of ASSPs to achieve the desired result at the expense of increased cost, product size and power consumption. As standards evolve or new standards are developed, ASSPs may not be available to implement desired functions.
System designers can customize their products using programmable logic ASICs or MCUs. The competitive dynamic between these classes of core silicon are well understood. High development risks, development costs and opportunity costs are incurred when using ASICs to produce custom deviceshardware products with very low unit production cost. Suppliers of programmable logic devices,hardware products, which have lower development and market risks and development costs relative to ASICs, have aggressively reduced the unit cost of their products over time, making programmable logic deviceshardware products the solution of choice for custom products unless the volume is very high. These cost reduction efforts have significantly increased the volume required to justify the total cost of an ASIC.
IoT hardware products (both Consumer devicesand Industrial) incorporate complex, rapidly changing technology, require rapid product proliferation, and have shortvarying product life and development cycles. Therefore, most mobileIoT designers design their products from a base platform, or reference design, provided to them by the vendor of the processor they have selected for their design. To differentiate their products from their competition, OEMs and ODMs may require some level of customization at either the hardware or software level. Designers have only a few viable options to modify the base platform for their needs. Since mobileIoT system designers often require very low power consumption to maximize battery life in their applications, the high powerhigh-power consumption of conventional FPGAs is incompatible with their design goals. This effectively limits the average mobilebattery-powered system designer to ASSPs, small PLDs, mobile-oriented FPGAs, and MCUs to create a virtual level playing field among mobilebattery-powered system designers and makes product proliferation and differentiation extremely hard to achieve. ASICs with their long development cycles, long lead times and high non-recurring development costs are only used in very high volumehigh-volume mainstream consumer products.
The traditional militarydefense and industrial markets are well served by existing core silicon.silicon or custom ASIC development. Much of this marketmarket's uses complex ASSPs sinceare generally not as price, power and size are not particularly critical design considerations.sensitive. When there is a strong need for a custom solution in high volume applications, designers turn to an ASIC and, in low to medium volume applications, they use FPGAs. QuickLogic FPGAs have a loyal following in certain segments of these markets, particularly when instant-on, energy efficiency, high reliability or intellectual property security is
important. These markets are expected to follow a typical mature product trend, as comparedQuickLogic has also entered into eFPGA-related agreements with the predicted growth in our businesscustomers in the consumer market.defense market and expects to continue to do so in the future. Historically, the defense market has followed QuickLogic's mature products revenue trend, but recent advancements in QuickLogic's Australis IP generator tool and participation in the DARPA Toolbox, have enabled renewed interest from customers in this area. Consequently, QuickLogic expects these trends to result in higher growth.
Markets and Product Technology
We market our solutions primarily to consumer and industrialIoT device OEMs and ODMs.ODMs, defense contractors, and U.S. Government entities. We have complete solutions incorporating our silicon platforms, IPs, software drivers, SensiML Analytics Toolkit and our system architecture expertise. A solution can be based on our programmable technology, which enables customized designs, low power, flexibility, rapid time-to-market, longer time-in-market and lower total cost of ownership. We are capable of providing complete solutions because of our investment in developing the low power IP and software required to implement specific functions, along with sensor software algorithms optimized for our architecture. In some cases, we develop the IPs and either software or firmware ourselves and, in other cases, we utilize third parties to develop the mixed signal physical layers, logic and/or software.
We market our solutions to OEMs and ODMs offering differentiated mobileIoT products, to processor vendors wishing to expand their served available market, and to sensor manufacturers and sensor processing software companies wishing to expand their ecosystems. Our target mobile markets include Tablets, Wearables, Hearables, Smartphones,Consumer/Industrial IoT, Consumer Electronics, Military, Aerospace and Consumer/Industrial IoT.Defense. Our solutions typically fall into one of threefour categories: Sensor Processing, DisplayeFPGA IP and Visual Enhancement,its associated Tools, Display or Smart Connectivity.
By using our silicon platforms, our IPs, our software, and our in-depth architecture knowledge, we can deliver energy efficient custom solutions that blend the benefits of traditional ASSPs with the flexibility, product proliferation, differentiation and low total cost of ownership advantages of programmable logic.
Our product technology consists of five major elements:
First, our programmable logic allows us to hardware customize our platforms. We have two distinct types of programmable logic. We have an SRAM-reprogrammable logic architecture that utilizes a standard CMOS-logic process to meet the specific needs of the sensor and I/O subsystems of mobile devices:IoT hardware products: very low standby power, low dynamic power, and in-system reprogrammable technology. Our SRAM-reprogrammable logic is the basis of our ArcticPro eFPGA IP LicensingLicense initiative, and is the logic used in our EOS S3, EOS S3 LV, and EOS S3AI products.
We also have our ViaLink programmable logic that uses proprietary and patented technology to meet the specific smart connectivity needs when the characteristics of non-volatility and instant-on, very low standby power, low dynamic power, small form factor, single chip solutions that power cycle easily and quickly are required. Hardware customization gives our deviceshardware products the ability to execute key actions faster than software implementations, and at lower power.
Second, our ArcticLink and EOS S3, EOS S3 LV, and EOS S3AI platforms combine mixed signal physical functions, hard-wired logic and programmable logic on one device. Mixed signal capability supports the trend toward serial connectivity in mobileIoT applications, where designers benefit from lower pin counts, simplified printed circuit board, or PCB, layouts, simplified PCB interconnect and reduced signal noise. Adding hard-wired IP enables us to deliver more logic at lower cost and lower power while the programmable logic allows us to provide solutions that can be rapidly customized to differentiate products, add features and reduce system development costs. This combination of mixed signal, hard-wired logic and programmable logic enables us to deliver low cost, small form factor solutions that can be customized for particular customer or market requirements while lowering the total cost of ownership.
Third, we develop and integrate innovative IP cores, intelligent data processing IP cores, or standard interfaces used in mobileIoT products. In addition to standards-based IP, we also offer proprietary IP such as:
Sensor Processing IPs such as Flexible Fusion Engine, or FFE, Sensor Manager, or Communications Manager;
Fourth, we develop and optimize a software framework for use in conjunction with our sensor processing silicon platforms.
Fifth, through SensiML, we develop and optimize an end-to-end software suite that provides developers a practical means for developing IoT sensor algorithms using AI. Each component of the software suite handles specific steps to progress from initial raw sensor data collection using prototype hardware to optimized firmware code generation, validation and testing, and post-ship algorithm updates and continuous learning enhancements. SensiML Data Capture Lab is a full-featured client tool that enables rapid, efficient, and collaborative multi-user data collection, cleansing, labeling, and metadata annotation of custom application datasets. SensiML Analytics Studio is a cloud service component that uses labeled datasets to deliver device-optimized firmware for a chosen endpoint product. SensiML Test App is used to quickly and efficiently validate final device firmware and test for the proper behavior, accuracy, and performance of the algorithm empirically on actual endpoint hardware. Lastly, the SensiML Application Programmer’s Interface (API)("API") is a simplified interface to extend the SensiML algorithms and manage advanced features like edge model tuning and continuous learning updates to the cloud.
Marketing, Sales and Customers
We are a sub-system integrator that monetizes solutionsmonetize our technology through siliconhardware product sales, and eFPGA IP licensinglicenses, with any necessary corresponding work delivered via professional engineering services, and SensiML Analytics Toolkit subscriptions and per unit royalties. We specialize in enhancing the user experience in leading edge mobile devices andIoT hardware products. For our customers, we enable hardware and sensor algorithmic differentiation quickly, cost-effectively and at low power. For our partners, we expand their reach into new segments and new use cases thereby expanding the served available market for their existing devices.hardware products.
Our vision is to transform the way people and deviceshardware products interact with each other and their surroundings. Our mission is to provide innovative platforms to successfully enable our customers to develop products that fundamentally change the end-user experience. Specifically, we develop low power SoCs, FPGAs, embedded FPGA intellectual property and the SensiML Analytics Toolkit for AI Software. QuickLogic’s products enable smartphone, wearable, hearbles, tablet,Consumer/Industrial IoT, Consumer Electronics, Military, and Consumer/Industrial IoT device OEMsAerospace and Defense customers. to deliver highly differentiated immersive user experiences and longproducts with longer battery life for their customers.life.
Our multi-core sensor processing products such as ArcticLink 3 S1, ArcticLink 3 S2, EOS 3, EOS S3 LV, and EOS S3AI accomplish this result with general purpose and targeted cores, which provide an extremely power-efficient approach for real-time multi-modal (vision, motion, voice, location, biometric and environmental) sensor processing independently of the cloud. Our embedded FPGA technology gives SoC developers targeting IoT endpoint applications the flexibility to make design changes post productionpost-production while keeping power consumption low. Our SensiML Analytics Toolkit is cutting-edge software that enables ultra-low power IoT endpoints that implement AI to transform raw sensor data into meaningful insight at the device itself. The Toolkit also provides an end-to-end development platform spanning data collection, labeling, algorithm and firmware auto generation, and testing.
Market leading companies need to deliver new products quickly and cost-effectively. We believe our programmable technology allows us to deliver customizable solutions with low power consumption and high IP security, while meeting system performance and BOM cost requirements. We believe our solutions allow OEMs and ODMs to rapidly bring new and differentiated products to market quickly and cost-effectively. Our solutions enable energy and cost-efficient solutions on design platforms from which a range of products can be introduced.
We recognize that our markets require a range of solutions, and we intend to work with market leading companies to combine silicon solution platforms, packaging technology, sensor software algorithms, software drivers and firmware, to meet the product proliferation, high bandwidth, time-to-market, time-in-market and form factor requirements of mobileIoT device manufacturers. We expect solutions to range from devices that include mixed signal and visual enhancement capability to devices that provide off-load engines from the host processor to save power and extend system battery life. We intend to continue to define and implement compelling solutions for our target customers and partners.
Our business model is two-fold. Fortargeted on ensuring our products are easy-to-use for the consumerbroad electronics market, it includes a focused customer strategy in which we target market-leading customers, who primarily serve the market for differentiated mobile products. Our belief is
that a large majority of our revenue will continue to come from less than 100 consumer customers as we transition to this business model. For the consumer customers, we have identified and plan to continue to identify the customers we want to serve with our solutions, and are currently in different stages of engagement with a number of these customers. The other half of the business model is targeted at the IoT customersparticularly ones that are deployingfocused on enabling their products with AI solutions. This go-to-market strategy focuses on a broader sales and marketing approach. Unlike the consumer market, theThe IoT market for AI solutions is made up of hundreds, if not thousands, of individual customers. We have identified reference designs, evaluation systems and evaluation software kits that we can enable our channel sales partners to sell to these customers. We believe our solutions are resonating with our target customers who value the differentiated user experience, lower power consumption, platform design capability, rapid time-to-market, longer time-in-market and low total cost of ownership available through the use of our solutions.
We sell our products through a network of sales managers in North America, Europe and Asia. In addition to our corporate headquarters in San Jose, California, we have international sales operations in China, Japan, Taiwan, South Korea and the United Kingdom. Our sales personnel and independent sales representatives are responsible for sales and application support for a given region, focusing on major strategic accounts, and managing our channel sales partners such as distributors.
Our customers
Customers typically order our products through our distributors.distributors. Currently, we have twoseven distributors in North America and a network of seventeentwenty-three distributors and sales representative throughout EuropeEurope and Asia to support our international business. eFPGA IP customers and SensiML SaaS subscribers typically enter into licensing agreements directly with QuickLogic and SensiML, respectively.
We also have a military, industrial and mobileIoT product customer base that purchases our mature silicon products. We expect to continue to offer silicon deviceshardware products to these customers.customers, as well as new eFPGA IP for when these customers choose to implement their own silicon platform solution.
Two of our
Three customers represented 13%approximately 20%, 16% and 10%12% of our total revenue for the year ended December 29, 2019January 1, 2023. Three customers represented 16%, 14%, and three10% of our customers represented 12%, 10% and 10% fortotal revenue for the year ended December 30, 2018, respectively.January 2, 2022. In addition, a significant portion of our revenue comes from sales to customers located outside of the United States. See Note 1413 to the Consolidated Financial Statementsconsolidated financial statements for information on our revenue by geography, market segment and key customers.additional information.
In the past, there has not been a predictable seasonal pattern to our business. However, we may experience seasonal patterns in the future due to global economic conditions, the overall volatility of the semiconductor industry and the inherent seasonality of the mobile and consumer markets.
Backlog
We do not believe that backlog as of any particular date is indicative of future results. AThe majority of our quarterly shipments are typically are booked during the quarter. Our sales are made primarily pursuant to standard purchase orders issued by OEM customers and distributors.
Competition
A number of companies offer products that compete with one or more of our semiconductor products and solutions. Our semiconductor competitors include: (i) suppliers of ASSPs such as DSP Group;Synaptics; (ii) suppliers of mobile and/or application processors; (iii) suppliers of ASICs; (iv) suppliers of mobile-orientedlow density FPGAs such as Lattice;Lattice Semiconductor Corp. and Microsemi Corp. (a subsidiary of Microchip Technology Inc.); and (v) suppliers of low power microcontrollers such as Atmel (a subsidiary of Microchip Technology), ST MicroelectronicsSTMicroelectronics N.V. and NXP.NXP Semiconductors N.V. Our existing competitors for conventional FPGAs include suppliers of low power CPLDscomplex programmable logic devices ("CPLD") and FPGAs such as Lattice Semiconductor Corp., Xilinx Intel and MicroSemiInc. (a subsidiary of Microchip Technology).Advanced Micro Devices, Inc.), Intel Corp., and Microsemi Corp.
ASSPs offer proven functionality which reduces development time, risk and cost, but it is difficult to offer a differentiated product using standard devices,hardware products, and ASSPs that meet the system design objectives are not always available. Conventional programmable logic may be used to create custom functions that provide product differentiation or make up for deficiencies in available ASSPs. PLDs require more designer input since the designer has to develop and integrate the IP and may have to develop the software to drive the IP. PLDs are more expensive and consume more power than ASSPs or ASICs, but they offer fast time-to-market and are typically
reprogrammable. OEMs have adopted mobile-oriented FPGAs in the mobileIoT product market but offer very little in terms of hard logic blocks that may decrease power consumption or selling price to the OEM. ASICs have a large development cost and risk and a long time to market. As a result, ASICs are generally only used for single designs with very high volumes. MCUs offer extensive software flexibility, but often do not offer sensor software algorithms, the lowest power, nor any hardware flexibility. Our solutions enable custom functions and system designs with fast time-to-market and longer time-in-market since they are customized by us using our solution platforms that contain programmable logic. In addition, because they are complete solutions, they reduce the system development cost and risk.
Since the AI software market is nascent, particularly for the edge and endpoint applications, there are no direct competitors to the SensiML analytics software platform at this point.
competitors tend to be venture-backed startups such as Edge Impulse. Competitors for our eFPGA IP licensinglicense product include a few of startup companies.
Research and Development
We are focused on developing our solutions and platforms. Our solutions combine our silicon platforms with our IPs,IP, software drivers, and other system software, and may include SensiML software for AI applications. Our future success will depend largely on our ability to rapidly develop, enhance and introduce our platform solutions that meet emerging industry standards and satisfy changing customer requirements. We have made and expect to continue to make substantial investments in researchR&D. Our R&D expenses were $5.0 million, or 31% of revenue, $6.9 million, or 55% of revenue, and development. Our research and development expenses$7.5 million, or 87% of revenue for the years ended December 29, 2019, December 30, 2018January 1, 2023, January 2, 2022 and December 31, 2017 were $12.4 million (120% of revenue), $9.9 million (79% of revenue), and $9.6 million (79% of revenue),January 3, 2021, respectively. Our researchResearch and development expenses for the year ended December 29, 2019 includedJanuary 1, 2023 reflect reductions due to the allocation of research and development expenses to cost of our newly acquired SensiML Corporation.revenues in support of eFPGA IP revenue.
As of December 29, 2019,January 1, 2023, our research and development staff consistconsists of 41eighteen employees located in California, India,Oregon and Oregon.Taiwan.
• Our system software group creates the drivers and other system code required to connect our silicon deviceshardware products to Application Processors, drivers and microcode to support our sensor hubs.
• Our platform engineering group develops low power programmable deviceshardware products and system IP that can be used in standalone solution platforms such as PolarPro 3E or combined in solution platforms such as EOS S3.
• Our EDAelectronic design and automation software group developscollaborates with the open source software community to ensure the design libraries, interface routines and place and route software that allow our engineerscustomer to use third party design environmentstake their own designs and target them to develop designs that are incorporated into our programmable devices,hardware products and develops the design tools that support algorithm development for our sensor hubs.
• Our hardware group develops and verifies IP Blocks that can be programmed into our programmable logic and develops primarily open source hardware reference designs to showcase and verify our solutions.
• Our product engineering group oversees product manufacturing and process development with our third partythird-party foundries and is involved in ongoing process improvements to increase yields and optimize device characteristics.
• The Officeoffice of the CTO investigates future trends and requirements in order to define the next generation of solutions and platforms.
• Our SensiML group develops and maintains all software with respect to the SensiML Analytics Software Suite.
Manufacturing
We have close relationships with third-party manufacturers for our customer commercial products for wafer fabrication, package assembly, and testing requirements to help us ensure stability in the supply of our products and to allow us to focus our internal efforts on product and solution design and sales.
We currently
In connection with commercial customers, we outsource ourcommercial products wafer manufacturing, primarily to GLOBALFOUNDRIESGlobalFoundries and Taiwan Semiconductor Manufacturing Company Limited or TSMC.("TSMC"). We outsource our commercial product packaging primarily to Amkor Technology, Inc. Integra Specialty Products, JCET Group Co. Ltd., and STATS-ChipPAC. GLOBALFOUNDRIESGolden Altos Corp. GlobalFoundries manufactures our EOS S3, EOS S3 LV, and EOS S3AI Sensor Platform in a 40 nm CMOS process, and PolarPro 3E, ArcticLink III VX and BX, and ArcticLink 3 S2 Sensor Hub, in a 65 nm CMOS process. TSMC manufactures our pASIC 3, QuickRAM and certain QuickPCI products, using a 0.35 micron complementary metal oxide semiconductor, or CMOS,("CMOS"), process. TSMC also manufactures our Eclipse products on 0.25 micron CMOS process, and other mature products using a 65nm CMOS process on twelve-inch wafers. We purchase products from GLOBALFOUNDRIES,GlobalFoundries, and TSMC on a purchase order basis.
Outsourcing of commercial wafer manufacturing enables us to take advantage of the high volume economies of scale offered by these suppliers. We may establish additional commercial foundry relationships as such arrangements become economically useful or technically necessary.
Employees
On December 29, 2019,In connection with U.S. Government end-user customers, we are required to procure wafer fabrication, package assembly, and testing from sources that maintain Defense Microelectronics Activity accreditation from the U.S. Department of Defense and maintain certain intellectual property security standards. We outsource wafer manufacturing, package packaging and testing services to certified U.S.-owned and continental U.S.-based suppliers.
Employees and Human Capital
As of January 1, 2023, we had 81forty-five employees worldwide.worldwide of which forty employees are located in the United States. We believe ourour future success depends in part on our continued ability to attract, hire and retain qualified personnel. None of our employees are represented by a labor union and we believe our employee relations are favorable. We recognize that in order to drive innovation and operational excellence, we must attract, develop, motivate and retain highly qualified talent. The well-being of employees is a key priority and includes a dynamic and welcoming workplace that promotes inclusive diversity, fosters collaboration and encourages employees to bring their best ideas to work every day, and promotes work-life balance. The principal purposes of our equity and cash incentive plans are to attract, retain and reward personnel through the granting of stock-based and cash-based compensation awards, in order to increase shareholder value and the success of our company by motivating such individuals to perform to the best of their abilities and achieve our objectives.
Intellectual Property
We believe that it is important to maintain a large patent portfolio to protect our innovations. We currently hold twenty-oneeighteen active U.S. patents and have twofive pending applications for an additional U.S. patents.patent. Our patents contain claims covering various aspects of programmable integrated circuits, programmable interconnect structures and programmable metal devices.hardware products. In Europe and Asia, we have been granted thirteenhold three patents and have fivetwo pending applications. Our issued patents expire between 20202033 and 2037.2039.
In most cases, revenue will decline from a decrease in demand for our mature products long before the expiration of pending or issued patents relating to the underlying technology in such products. The decision to cease maintaining a patent is made based on the importance of the patent in our current or future product offerings.
We have sevenfive registered trademarks registered with the U.S. Patent and Trademark Office.
With regard to certain patents, the U.S. Government has an irrevocable, non-exclusive, royalty-free license, pursuant to which the U.S. Government may use or authorize others to use the inventions covered by such patents.
Information About Our Executive Officers and Directors
Our executive officers are appointed by, and serve at the discretion of, our Board of Directors. There are no family relationships among our directors and officers.
The following table sets forth certain information concerning our current executive officers and directorsdirectors as of March 13, 2020:20, 2023:
Name |
| Age |
|
| Position | ||
Brian C. Faith |
|
|
|
|
| President and Chief Executive Officer; Director | |
|
|
|
|
| Chief Financial Officer and Senior Vice President (SVP) of Finance | ||
Rajiv Jain |
|
|
|
|
| Vice President, Worldwide Operations | |
Timothy Saxe |
|
|
|
|
| Senior Vice President Engineering and Chief Technology Officer | |
| Owen Bateman | 56 | Vice President, Worldwide Sales | |||||
Michael R. Farese |
|
|
|
|
| Chairman of the Board | |
| Joyce Kim | 52 | Director | |||||
| Radhika Krishnan | 52 | Director | |||||
Andrew J. Pease |
|
|
|
| |||
|
|
| |||||
|
|
|
| Director | |||
Christine Russell |
|
|
|
|
| Director | |
Gary H. Tauss |
|
|
|
| Director |
| |
Brian C. Faithjoined QuickLogic in June 1996. Mr. Faith has served as our President and Chief Executive Officer since June 2016 after having served as Vice President of Worldwide Marketing and Vice President of Worldwide Sales & Marketing between 2008 and 2016. Mr. Faith during the last 2125 years has held a variety of managerial and executive leadership positions in engineering, product line management, marketing and sales. Mr. Faith has also served as the board member of the Global Semiconductor Alliance (GSA), the Chairman of the Marketing Committee for the CE-ATA Organization. He holds a B.S. degree in Computer Engineering from Santa Clara University and was an Adjunct Lecturer at Santa Clara University for Programmable Logic courses.
Suping (Sue) Cheung (Ph.D.)
Elias Nader joined QuickLogic in May 2007. Dr. Cheung has served as our Chief Financial Officer, Vice PresidentFebruary 2022. Mr. Nader brings more than 30 years of Finance, Chief Accounting Officer,experience in semiconductors and Principal Accounting Officer since May 2015, Corporate Controller from 2007 to 2018.related industries, including 20 years in senior leadership positions. Prior to joining QuickLogic, Dr. CheungMr. Nader most recently served as Senior Vice President and Chief Financial officer at Pixelworks, Inc., where he was directly responsible for all of General and Administrative worldwide and worked directly with the Board of Directors to provide strategic and operational direction to the company. Prior to that, Mr. Nader worked at Sigma Designs, Inc. as the Senior Vice President, Chief Financial Officer and Corporate Secretary. Mr. Nader has also served in executive capacities at Imperial Jet and Dionex Corp. Mr. Nader holds a Senior ManagerBachelor of SEC Reporting, TechnicalScience Degree in Accounting and Bachelor of Arts Degree in Economics and an MBA in International Consolidation at Dell SonicWALLBusiness from 2006 to 2007 and was the Senior Accounting Manager at VeriFone System, Inc. from 2005 to 2006. Prior to 2005, Dr. Cheung held various senior accounting and financial management roles in both publicly traded and privately held companies. Dr. Cheung began her career with PricewaterhouseCoopers (PWC) where she served as an auditor and as a tax consultant. Dr. Cheung holds a Ph.D. in Business Administration and a Masters in Accounting from the Florida International University in Miami. She is a Certified Public Accountant.San Jose State University.
Rajiv Jain joinedQuickLogic in August 1992. Mr. Jain has served as our Vice President of Worldwide Operations since April 2014. Prior to this role, Mr. Jain served as QuickLogic’s Senior Director of Operations and Development Engineering from 2011 to 2014, Senior Director of System Solutions and Process Technology from 2009 to 2011, Director of Process Technology from 1997 to 2009, and Senior Process Technologist from 1992 to 1997. Prior to joining QuickLogic, Mr. Jain was a Senior Yield Engineer at National Semiconductor from 1991 to 1992, where he focused on BiCMOS product yield improvements, and at Monolithic Memories from 1985 to 1988, where he focused on BiPolar product yield and engineering wafer sort improvements. Mr. Jain holds a Master’s degree in Chemical Engineering from the University of California, Berkeley and a B.S. degree in Chemical Engineering from the University of Illinois, Champaign/Urbana.
Owen Bateman joinedQuickLogic in February 1997. Mr. Bateman has served as our Vice President of Worldwide Sales since April 2022. Prior to this role, Mr. Bateman served as QuickLogic’s Senior Director of Sales EMEA and USA from 2013 to 2022, and Strategic Accounts, Direct Sales and Channel Sales from 1997 to 2013. Prior to joining QuickLogic, Mr. Bateman held sales and field application engineering positions at Intel and Abacus Polar. Mr. Bateman has designed with FPGAs and completed several successful FPGAs and custom ASIC designs. Mr. Bateman holds a Higher National Certificate in Electronic and Microelectronic Engineering from Brooklands College, England.
Timothy Saxe (Ph.D.) joined QuickLogic in May 2001. Dr. Saxe has served as our Senior Vice President of Engineering and Chief Technology Officer since August 2016 and Senior Vice President and Chief Technology Officer since November 2008. Previously, Dr. Saxe has held a variety of executive leadership positions in QuickLogic including Vice President of Engineering and Vice President of Software Engineering. Dr. Saxe was Vice President of FLASH Engineering at Actel Corporation,Corp. a semiconductor manufacturing company, from November 2000 to February 2001. Dr. Saxe joined GateField Corporation,Corp., a design verification tools and services company formerly known as Zycad, in June 1983 and was a founder of their semiconductor manufacturing division in 1993. Dr. Saxe became GateField’s Chief Executive Officer in February 1999 and served in that capacity until Actel CorporationCorp. acquired GateField in November 2000. Dr. Saxe holds a B.S.E.E. degree from North Carolina State University, and an M.S.E.E. degree and a Ph.D. in Electrical Engineering from Stanford University.
Information regarding the backgrounds of our directors is set forth under the caption “Proposal One, Election of Directors” inincorporated by reference from our definitive Proxy Statement relating to the 2023 Annual Meeting of Stockholders, which informationProxy Statement is incorporated hereinanticipated to be filed within 120 days after the end of the Fiscal Year covered by reference.
this Report.
In addition to other information in this Annual Report on Form 10-K and in other filings we make with the Securities and Exchange Commission, the following risk factors should be carefully considered in evaluating our business as they may have a significant impact on our business, operating results and financial condition. If any of the following risks actually occurs, our business, financial condition, results of operations and future prospects could be materially and adversely affected. Because of the following factors, as well as other variables affecting our operating results, past financial performance should not be considered as a reliable indicator of future performance and investors should not use historical trends to anticipate results or trends in future periods.
If we fail to successfully develop, introduce
Risk Factor Summary
Some of the factors that could materially and sell new products, eFPGA IP Product, SensiML Software subscriptions/licenses, and other new solutions or if our design opportunities do not generate the revenue we expect, we may be unable to compete effectively in the future and our future gross margins and operating results will be lower.
The market for differentiated consumer devices is highly competitive and dynamic, with short end market product life cycles and rapid obsolescence of existing products. To compete successfully, we must obtain access to advanced fabrication capacity and dedicate significant resources to specify, design, develop, manufacture and sell new or enhanced solutions that provide increasingly higher levels of performance, low power consumption, new features, meeting current and emerging industry standards, reliability and/or cost savings to our customers. Due to the short product life cycle of these devices, our revenue is subject to fluctuation in a short period of time and our ability to growadversely affect our business, depends on accelerating our design win activity. We often make significant investments in solutions, sensor algorithm software and silicon platform development, selling and marketing, long before we generate revenue, if any, from our efforts. The markets we are targeting typically have higher volumes and greater price pressure than our traditional business. In addition, we quote opportunities in anticipation of future cost reductions and may aggressively price products to gain market share. In order to react quickly to opportunities or to obtain favorable wafer prices, we make significant investments in and commitments to purchase inventories and capital equipment before we have firm commitments from customers.
We expect our business growth to be driven by new products, which currently include EOS™, Quick AI, SensiML, ArcticLink® III, PolarPro®3, PolarPro II, PolarPro, Eclipse II products. We also launched a business that licenses our FPGA technology for use in other semiconductor companies’ SoCs and delivered our first eFPGA IP product ArcticPro™ in 2017. The new product revenue growth of our new products and eFPGA IP product needs to be strong enough to achieve profitability. The gross margin associated with our new products is generally lower than the gross margin of our mature products, due primarily to the price-sensitive nature of the higher volume mobile consumer opportunities that we are pursuing with new products and eFPGA IP product. Because the product life cycle of mobile products is short, we must replace revenue at the end of a product life cycle with sales from new design opportunities. While we expect revenue and gross profit growth from new products and eFPGA IP product will offset the expected decline in revenue and gross profit from our mature products, there is no assurance whether or when this will occur. In order to increase our revenue from its current level, we depend upon increased revenue from our existing new products, especially solutions based on our EOS S3, ArcticLink and PolarPro solution platforms, the eFPGA IP product and the development of additional new products and solutions.
If (i) we are unable to design, produce and sell new products, eFPGA IP, SensiML and other products and solutions that meet design specifications, address customer requirements and generate sufficient revenue and gross profit; (ii) market demand for our new products, eFPGA IP product and other products fails to materialize; (iii) we are unable to obtain adequate fabrication capacity on a timely basis; (iv) we are unable to develop new silicon platforms or solutions in a timely manner; or (v) our customers do not successfully introduce products incorporating our devices, or choose a competing offering, our revenue and gross margin of the new products and eFPGA IP product will be materially harmed, which could have an overall adverse and potentially disproportionate effect on our business,financial condition, results of operations and financial condition.
Two of our products target new unproven markets, and if these markets docash flows, but are not develop, or if our products do not meet their needs, the loss of or reduction in orders could adversely affect our revenue and harm our business financial condition, operating results and cash flows.
eFPGA: We have history and experience in developing, selling and supporting FPGA products and incorporating FPGA IP developed by us into our platform solutions. The eFPGA market is a developing market with unknown requirements and demand. Our current FPGA architectures and their performance may not be a good fit for the eFPGA Market. eFPGA IP is designed for specific foundry/process node combinations, and the ones we have chosen to target may be different from what our customers require. The software developed by us for eFPGA may be delayed or may not meet the needs of the eFPGA Market. The support required by a customer to incorporate the eFPGA may be much higher than expected which may delay new engagements or lead to high costs. The incorporated eFPGA IP may have an unexpected result in the customer’s chip leading to compensation demands. The expected NRE and royalty rates we expect to charge for the eFPGA may not be competitive, which may have a material adverse effect on our business, results of operations and financial condition.
SensiML: Mainstream AI runs on powerful processors and large FPGAs. SensiML’s AI solution targets end point solutions that use low power processors. The end point AI market is a developing market with unknown requirements and demand. The current SensiML solution may not be a good fitlimited to, the evolvingfollowing:
Risks Related to Our Business, Industry and Global and Economic Conditions
• | We have incurred losses in the past years. Although we are targeting to break even during the 2023 Fiscal Year, we may not be able to generate sufficient revenue or raise additional financing to fund future losses, and we may not be able to sustain sufficient liquidity, and as a result, our financial condition and operating results could be materially and adversely affected. |
• | Pandemics or other widespread public health problems could adversely affect our business, results of operations, and financial condition in a material way. |
• | We may be unable to accurately estimate quarterly revenue, which could adversely affect the trading price of our stock. |
• | Our future operating results are likely to fluctuate and therefore may fail to meet expectations, which could cause our stock price to decline. |
• | Cyberattacks, like the 2023 cybersecurity incident can lead to disruption of business, reduced revenue, increased costs, liability claims, or harm to our reputation or competitive position. |
Risk Related to OurProducts
• | If we fail to successfully develop, introduce and sell new products and other new solutions or if our design opportunities do not generate the revenue we expect, we may be unable to compete effectively in the future and our future gross margins and operating results will be lower. |
• | Two of our products target new unproven markets, and if these markets do not develop, or if our products do not meet their needs, the loss of or reduction in orders could adversely affect our revenue and harm our business financial condition, operating results and cash flows. |
• | If our AI products are not low touch, the cost of addressing the fragmented AI market will be high which will delay market penetration, result in reduced revenues or require increased expenses, any of which could adversely affect our revenue and harm our business financial condition, operating results and cash flows. |
• | Our products are subject to a lengthy sales cycle and our customers may cancel or change their product plans after we have expended substantial time and resources in the design of their products. |
• | If we fail to adequately forecast demand for our products, we may incur product shortages or excess product inventories. |
Risk Related to Our Customers and Partners
• | We currently depend on a limited number of significant customers, for a significant portion of our revenue and the loss of or reduction in orders from such significant customers could adversely affect our revenue and harm our business financial condition, operating results and cash flows. |
• | We depend upon partnering with other companies to offer voice, motion, and other solutions into our platform. |
• | We depend on our relationships with third parties to manufacture our new products. |
• | We depend upon third parties for silicon IP, detailed registered-transfer level, ("RTL"), design, physical design, verification and assembly of our silicon platforms and any failure to meet our requirements in a timely fashion may adversely affect our time to market and revenue. |
• | We depend upon partnering with other companies to develop IP, reference platforms, algorithm and system software. |
• | We depend upon third parties to fabricate, assemble, test and program our products, and to provide logistics services. Any problems at these third parties could adversely affect our business, results of operations and financial condition. |
• | We entered into informal partnerships with certain third parties for the development of solutions. Our business could be adversely affected if such informal partnerships fail to grow as we expected. |
Risks Related to Our Financial Position and implementation may be higher than expected which may delay engagements and lead to higher costs. The expected SaaS licensing fees and royalty rates we expect to charge for the SensiML solutions may not be competitive, which may have a material adverse effect on our business, results of operations and financial condition.Capital Needs
If our AI products are not low touch, the cost of addressing the fragmented AI market will be high which will delay market penetration, result in reduced revenues or require increased expenses, any of which could adversely affect our revenue and harm our business financial condition, operating results and cash flows.
The end point AI market consists of many different use cases, with each individual use case having a modest volume even though the aggregate volume is large. This is quite different from the mobile consumer market which consists of a few large customers and use cases. In order to scale in the fragmented AI end point market, our products will have to be extremely low touch so that the cost of support is low and scalable across many customers. The current EOS S3AI solution and SensiML solutions may not be sufficiently low touch to address this market in a cost-effective manner, or in the volume required. Higher than expected costs, or lower than expected volume may have a material adverse effect on our business, results of operations and financial condition.
We have incurred losses in the past years since 2011 and anticipate that we will incur continued losses through at least the next year, weyears.We may not be able to generate sufficient revenue or raise additional financing to fund future losses, and we may not be able to sustain sufficient liquidity, to continue to operateand as a going concern.result, our financial condition and operating results could be materially and adversely affected.
We have experienced net losses in the past years and expect suchto experience losses to continue throughin at least some of the year ending January 3, 2021fiscal quarters during 2023, as we continue to develop new products, applications and technologies. Our new products and products currently under development have been generating lower gross margin as a percentage of revenue than our mature products due to the markets that we have targeted and the larger order quantities associated with these applications.new products. Whether we can achieve cash flow levels sufficient to support our operations cannot be accurately predicted, and our investment portfolio is subject to a degree of interest rate and liquidity risk. Unless such cash flow levels are achieved, in addition to the proceeds that we received on June 21, 2019 during Fiscal 2022from the sale of our equity securities, and the credit line we may be able to draw down from Heritage Bank of Commerce under the Amended and Restated Loan and Security Agreement dated December 21, 2018 and the first amendment to the Amended and Restated Loan and Security Agreement dated November 6, 2019, by and between our company and Heritage Bank of Commerce, we may need to obtain additional funds through strategic divestiture, or sell debt or equity securities, or some combination thereof, to provide funding for our operations. Such additional funding may not be available on commercially reasonable terms, or at all.
If we are unable to generate sufficient sales from itsour new products or adequate funds are not available when needed, our liquidity, financial condition and operating results would be materially and adversely affected, and we may not be able to operate our business without significant changes in our operations or at all.all,
Our products are subject
Risks Related to a lengthy sales cycle and our customers may cancel or change their product plans after we have expended substantial time and resourcesAdverse Developments Affecting Financial Institutions
Adverse Developments Affecting Financial Institutions, Companies in the designFinancial Services Industry or the Financial Services Industry Generally, such as Actual Events or Concerns Involving Liquidity, Defaults or Non-Performance, Could Adversely Affect our Operations and Liquidity.
Actual events involving limited liquidity, defaults, non-performance or other adverse developments that affect financial institutions or other companies in the financial services industry or the financial services industry generally, or concerns or rumors about any events of their products.
Our customers often evaluate our products for six months or more before designing them into their systems, and they may not commence volume shipments for up to an additional six to twelve months, if at all. During this lengthy sales cycle, our potential customers may cancel or change their product plans. Customers may also discontinue products incorporating our devices at any time or they may choose to replace our products with lower cost semiconductors. In addition, we are working with leading customers in our target markets to define our future products. If customers cancel, reduce or delay product orders from us, or choose not to release products that incorporate our devices after wethese kinds, have spent substantial time and resources developing products or assisting customers with their product design, our revenue levels may be less than anticipated and our business, results of operations and financial condition may be materially adversely affected.
We currently depend on a limited number of significant customers, for a significant portion of our revenue and the loss of or reduction in orders from such significant customers could adversely affect our revenue and harm our business financial condition, operating results and cash flows.
A small number of end-customers represented a significant portion our total revenue in our fiscal year ended December 29, 2019. During our fiscal year ended December 29, 2019, two customers accounted for 13% and 10%, respectively, of our total revenue. We expect to maintain this high level of customer concentration as we continue to market our solutions to leading manufacturers of high-volume mobile applications. As in the past and may in the future demand fromlead to market-wide liquidity problems. For example, on March 10, 2023, Silicon Valley Bank, or SVB, was closed by the California Department of Financial Protection and Innovation, which appointed the Federal Deposit Insurance Corporation ("FDIC") as receiver. On March 12, 2023, Signature Bank and Silvergate Capital Corp. were closed and placed under receivership. Although a statement by the U.S. Department of the Treasury, the Federal Reserve, and the FDIC stated that all depositors of these customers may fluctuate significantly from quarterfinancial institutions would have access to quarter. These customers typically order productsall of their money after only one business day following the date of closure, including funds held in uninsured deposit accounts, borrowers under credit agreements, letters of credit and certain other financial instruments with short requested delivery lead times, and do not provide a commitment to purchase product pastfinancial institutions placed into receivership by the period covered by purchase orders, whichFDIC may be rescheduled or canceled. In addition,unable to access undrawn amounts thereunder. If any of our manufacturing lead times are longer thancounterparties to any such instruments that we may enter into in the delivery lead times requested by these customers, and we make significant purchases of inventory and capital expenditures in anticipation of future demand. If revenue from any significant customer were to decline substantially,be placed into receivership, we may be unable to offset this declineaccess such funds. In addition, if any parties with increased revenue and gross margin from other customers andwhom we may purchase excess inventories. These factors could have a material adverse impact on ourconduct business results of operations and financial condition.
We may make a significant investment in long-lived assets for the production of our products based upon historical and expected demand. If demand for our products or gross margin generated from our products does not meet our expectations or if we are unable to collect amounts dueaccess funds pursuant to such instruments or lending arrangements with such a financial institution, such parties’ ability to pay their obligations to us or to enter into new commercial arrangements requiring additional payments to us could be adversely affected. In this regard, counterparties to these financial institutions' credit agreements and arrangements, and third parties such as beneficiaries of letters of credit, among other, may experience direct impacts from significant customers, we may be required to write-off inventories, provide for uncollectible accounts receivable or incur charges against long-lived assets, which may have a material adverse effect on our business, results of operations and financial condition.
We depend upon partnering with other companies to offer voice, motion, and other solutions into our platform.
In addition to working directly with our customers, we partner with other companies that are experts in certain technologies to create more complete solutions. The depththe closure of these relationships varies dependingfinancial institutions and uncertainty remains over liquidity concerns in the broader financial services industry. Similar impacts have occurred in the past, such as during the 2008-2010 financial crisis.
Inflation and rapid increases in interest rates have led to a decline in the trading value of previously issued government securities with interest rates below current market interest rates. The U.S. Department of Treasury, FDIC and Federal Reserve Board have announced a program to provide up to $25 billion of loans to financial institutions secured by such government securities held by financial institutions to mitigate the risk of potential losses on the partnersale of such instruments. However, widespread demands for customer withdrawals or other needs of financial institutions for immediate liquidity may exceed the capacity of such program. There is no guarantee that the U.S. Department of Treasury, FDIC and the dynamics of the end market being targeted, but these relationships are typically a co-marketing relationship that includes joint account calls, promotional activities and/or engineering collaboration and developments. The propriety code provided by these partners may be an integral part of the solutions that we offer our customers. If we are unableFederal Reserve Board will provide access to obtain competitive pricing (NRE, royalty) and prompt quality support by our partner, our solution may not be competitive. In addition, if the quality of our partner’s solution does not meet our customer’s requirements, it may delay or prevent the incorporation of our product by the customer. There may also be delays and additional expenses to improve or update the partner’s solution to meet current market needs. If we are unable to maintain a close working relationship with our partners it would hinder our ability to continue to develop and introduce leading solutions effectivelyuninsured funds in the future which may have a material adverse effect on our business, resultsin the event of operations andthe closure of other banks or financial condition.
We depend on our relationships with third parties to manufacture our new products.
We depend upon GLOBALFOUNDRIES, TSMC, Amkor and STAT-chipPAC to manufacture our new products. The inability of any one of these companies to continue manufacture of our new products for any reason would require us to identify and qualify a new foundry to manufacture our new products. This would be time consuming, difficult and result in unforeseen operational problems. Alternate foundries might not be available to fabricate our new products, or if available, might be unwilling or unable to offer services on acceptable terms and our ability to operate our business or deliver our products to our customers could be severely impaired.
We depend upon third parties for silicon IP, detailed registered-transfer level, or RTL, design, physical design, verification and assembly of our silicon platforms and any failure to meet our requirementsinstitutions in a timely fashion may adversely affect our time to market and revenue.or at all.
Our move to a variable cost or outsourced engineering development model allows us access to our cash and cash equivalents in amounts adequate to finance our operations could be significantly impaired by the best design resources for developing new silicon platforms. This includesfinancial institutions with which we have arrangements directly facing liquidity constraints or failures. In addition, investor concerns regarding the U.S. or international financial systems could result in less favorable commercial financing terms, including higher interest rates or costs and tighter financial and operating covenants, or systemic limitations on access to leading edge silicon IP as well as RTL designcredit and physical design expertise. However, outsourcing the design of a complex silicon platform typically involves multiple companiesliquidity sources, thereby making it more difficult for us to acquire financing on acceptable terms or at all. Any material decline in multiple locations, which may increase the risk of costly design errors. Any delaysavailable funding or errorsour ability to access our cash, cash equivalents, and liquidity resources could adversely impact our ability to meet our operating expenses, financial and contractual obligations, or result in the designbreaches of our new silicon platformscontractual obligations or result in violations of federal or state wage and hour laws. Any of these impacts could significantly increase the cost of development as well as adversely affect our time to market, which may have a material adverse effectimpacts on our business, results of operations and financial condition.liquidity.
We depend upon partnering with
Risks Related to Our Business, Industry and Global and Economic Conditions
Pandemics or other companies to develop IP, reference platforms, algorithm and system software.
In addition to working directly with our customers, we partner with other companies that are experts in certain technologies to develop additional intellectual property, reference platforms, algorithms and system software to provide application solutions. We also work with mobile processor manufacturers and companies that supply sensor, storage, networking or graphics components for embedded systems. The depth of these relationships varies depending on the partner and the dynamics of the end market being targeted, but is typically a co-marketing relationship that includes joint account calls, promotional activities and/or engineering collaboration and developments, such as reference designs. If we are unable to license new technologies, maintain a close working relationship with our partners, fail to continue to develop and introduce leading technologies or if these technologies fail to generate the revenue we expect, we may not be able to compete effectively in the future, which may have a material adverse effect on our business, results of operations and financial condition.
We depend upon third parties to fabricate, assemble, test and program our products, and to provide logistics services. Anywidespread public health problems at these third parties could adversely affect our business, results of operations, and financial condition.condition in a material way.
We contract with third parties
Pandemics, epidemics or other widespread public health problems, such as the ongoing COVID-19 pandemic, could negatively impact our business. Outbreaks have, and could again, result in significant government measures to fabricate, assemble, testcontrol the spread of disease, including, among others, restrictions on travel, manufacturing, and program our devices,the movement of employees. If, for example, pandemics were to occur in ways that significantly disrupt the manufacture, shipment, and vendors for logistics. In general, eachpurchasing of our devices is fabricated, assembledproducts or the products of our customers, this may materially negatively impact our operating results and programmed by a single supplier,our overall business. Disruptions to manufacturing and shipping could also constrain our supplies, leading to operational delays, disruptions and inflationary pressures.
For example, the lossspread and impact of the COVID-19 pandemic throughout Asia and other jurisdictions continues to fluctuate and its impacts remain uncertain. The ultimate impact of a supplier, transferpandemic and its potential effects on the Company’s business in its Fiscal Year 2023 depends on many factors that are not within our control. This could lead to further disruptions or restrictions on the Company’s ability to source, manufacture or distribute its products, including temporary disruptions to the facilities of manufacturingits contract manufacturers in China, Taiwan, Philippines and Singapore, or the facilities of its suppliers and their contract manufacturers globally. Additionally, multiple countries have imposed and may further impose restrictions on business operations and movement of people and products to a new location, expirationlimit the spread of a pandemic. Delays in production or delivery of components or raw materials that are part of the Company’s global supply agreement orchain due to restrictions imposed to limit the inability of our suppliers to manufacture our products to meet volume, performance, quality and cost targets could have a material adverse effect on our business. Our relationship with our suppliers could change as a resultspread of a mergerpandemic could delay or acquisition. If for any reason these suppliers or any other vendor becomes unable or unwilling to continue to provide services of acceptable quality, at acceptable costs and in a timely manner,inhibit our ability to operate ourobtain the supply of components and finished goods. If the impact of a pandemic becomes more severe in the locations where the Company, its customers or suppliers conduct business, or deliver our products to our customers could be severely impaired. We would have to identify and qualify substitute suppliers, which could be time consuming, difficult and resultthe Company experiences more pronounced disruptions in unforeseen operational problems, or we could announce an end-of-life program for these products. Alternate suppliers might not be available to fabricate, assemble, test and program our devices or, if available, might be unwilling or unable to offer services on acceptable terms. In addition, if competition for wafer manufacturing capacity increases, if we need to migrate to more advanced wafer manufacturing technology, or if competition for assembly services increases, weits operations, the Company may be required to pay or invest significant amounts to secure access to this capacity. The number of companies that provide these services is limited and some of them have limited operating histories and financial resources. In the event our current suppliers refuse or are unable to continue to provide these services to us, or if we are unable to secure sufficient capacity from our current suppliers on commercially reasonable terms, we may be unable to procure
services from alternate suppliers in a timely manner, if at all. Moreover, our reliance on a limited number of suppliers subjects us to reduced control over delivery schedules, quality assurance and costs. This lack of control may cause unforeseen product shortages or may increase our cost to manufacture and test our products.
We utilize third party logistics services, including transportation, warehouse and shipping services. These service providers are subject to interruptions that affect their ability to service us, including the availability of transportation services, disruptions related to work stoppages, volatility in fuel prices and security incidents or natural events at manufacturing, shipping or receiving points or along transportation routes.
In the event any of our third party suppliers or vendors were to experience financial, operational, production or quality assurance difficulties resulting in a reduction or interruption inconstrained supply or providing services to us, ourcurtailed demand that may materially adversely impact its business, cash flows and results of operations and financial condition may be materially adversely affected.operations.
If we fail to adequately forecast demand for our products, we may incur product shortages or excess product inventories.
Our agreements with certain suppliers require us to provide forecasts of our anticipated manufacturing orders, and place binding manufacturing commitments in advance of receiving purchase orders from our customers. We are limited in our ability to increase or decrease our forecasts under such agreements. Other manufacturers supply us with product on a purchase order basis. The allocation of capacity is determined solely by our suppliers, over which we have no direct control. Additionally, we may place orders with our suppliers in advance of customer orders to allow us to quickly respond to changing customer demand or to obtain favorable product costs. Furthermore, we provide our suppliers with equipment that is used to program our products to customer specifications. The programming equipment is manufactured to our specifications and has significant order lead times. These factors may result in product shortages or excess product inventories. Obtaining additional supply in the face of product, programming equipment or capacity shortages may be costly, or not possible, especially in the short-term since most of our products and programming equipment are supplied by a single supplier. If we fail to adequately forecast demand for our products, our business, the relationship with our customers, our results of operations and financial condition could be materially adversely affected.
We entered into informal partnerships with certain third parties for the development of solutions. Our business could be adversely affected if such informal partnerships fail to grow as we expected.
Our approach to developing solutions for potential customers involves developing solutions for and aligning our roadmap with application processor, sensor, and flash memory vendors. We have entered into informal partnerships with other parties that involve the development of solutions that interface with their devices or standards. These informal partnerships also may involve joint marketing campaigns and sales calls. If the informal partnerships do not grow as expected or if they are significantly reduced or terminated by acquisition or other means, our business, results of operations and financial condition could be materially adversely effected and we may be required to write-off related inventories and long-lived assets.
Our business could be adversely affected by undetected errors or defect in our products.
Difficulties encountered during the complex semiconductor manufacturing process can render a substantial percentage of semiconductor devices nonfunctional. New manufacturing techniques or fluctuations in the manufacturing process may change the performance distribution and yield of our products. We have, in the past, experienced manufacturing runs that have contained substantially reduced or no functioning devices, or that generated devices with below normal performance characteristics. Our reliance on third party suppliers may extend the period of time required to analyze and correct these problems. Once corrected, our customers may be required to redesign or re-qualify their products. As a result, we may incur substantially higher manufacturing costs, shortages of inventories or reduced customer demand.
Yield fluctuations frequently occur in connection with the manufacture of newly introduced products, with changes in product architecture, with manufacturing at new facilities, on new fabrication processes or in conjunction with new backend manufacturing processes. Newly introduced solutions and products are often more complex and
more difficult to produce, increasing the risk of manufacturing related defects. New manufacturing facilities or processes are often more complex and take a period of time to achieve expected quality levels and manufacturing efficiencies. While we test our products, including our software development tools, they may still contain errors or defects that are found after we have commenced commercial production. Undetected errors or defects may also result from new manufacturing processes or when new intellectual property is incorporated into our products. If our products or software development tools contain undetected or unresolved defects, we may lose market share, experience delays in or loss of market acceptance, reserve or scrap inventories or be required to issue a product recall. In addition, we would be at risk of product liability litigation if defects in our products were discovered. Although we attempt to limit our liability to end users through disclaimers of special, consequential and indirect damages and similar provisions, we cannot assure you that such limitations of liability will be legally enforceable.
We may be unable to accurately estimate quarterly revenue, which could adversely affect the trading price of our stock.
Due to our relatively long product delivery cycle and the inability of our customers in the rapidly evolving mobile marketend markets to confirm product requirements on a timely basis, we may have low visibility to product demand or estimated revenue in any given quarter. If our customers cannot provide us with accurate delivery lead times, we may not be able to deliver product to our customers in a timely fashion. Furthermore, our ability to respond to increased demand is limited to inventories on hand or on order, the capacity available at our contract manufacturers and our capacity to program products to customer specifications. If we fail to accurately estimate customer demand, or if our available capacity is less than needed to meet customer demand, we may not be able to accurately estimate our quarterly revenue, which may have a material adverse effect on our results of operations and financial condition, and our stock price could be materially fluctuate as a result.
We will be unable to compete effectively if we fail to anticipate product opportunities based upon emerging technologies and standards or fail to develop products and solutions that incorporate these technologies and standards in a timely manner.
We spend significant resources designing and developing silicon solution platforms, IP and software and reference designs, and adopting emerging technologies. We intend to develop additional products and solutions and to adopt new technologies in the future. If system manufacturers adopt alternative standards or technologies, if an industry standard or emerging technology that we have targeted fails to achieve broad market acceptance, if customers choose low power offerings from our competitors, or if we are unable to bring the technologies or solutions to market in a timely and cost-effective manner, we may be unable to generate significant revenue from our research and development efforts. As a result, our business, results of operations and financial condition could be materially adversely affected, and we may be required to write-off related inventories and long-lived assets.
The semiconductor business is subject to downward price pressure.
The market for our products has been characterized by declining selling prices, and we anticipate that our average selling prices will decrease in future periods, although the timing and amount of these decreases cannot be predicted with any certainty. The pricing pressure in the semiconductor industry in past years has been due to a large number of factors, many of which were not easily foreseeable, such as currency crisis, industry-wide excess manufacturing capacity, weak economic growth, the slowdown in capital spending that followed the "dot-com" collapse, the reduction in capital spending by telecom companies and satellite companies, and the effects of the terrorism since September 11, 2001. Similar to past years, recent unfavorable economic conditions have resulted in a tightening of the credit markets. If signs of improvement in the global economy do not progress as expected and global economic conditions worsen, we may experience a decline in our average selling prices. In addition, our competitors have in the past, and may again in the future, lower prices in order to increase their market share. Continued downward price pressure in the industry may harm our competitive position and materially and adversely affect our financial condition, cash flows, and results of operations.
Our future operating results are likely to fluctuate and therefore may fail to meet expectations, which could cause our stock price to decline.
Our operating results have varied widely in the past and are likely to do so in the future. In addition, our past operating results may not be an indicator of future operating results.
Factors that could cause our operating results to fluctuate include, without limitation: (i) successful development and market acceptance of our products and solutions; (ii) our ability to accurately forecast product volumes and mix, and to respond to rapid changes in customer demand; (iii) changes in sales volume or expected sales volume, product mix, average selling prices or production variances that affect gross profit; (iv) the effect of end-of-life programs; (v) a significant change in sales to, or the collectability of accounts receivable from, our largest customers; (vi) our ability to adjust our product features, manufacturing capacity and costs in response to economic and competitive pressures; (vii) our reliance on subcontract manufacturers for product capacity, yield and quality; (viii) our competitors’ product portfolio and product pricing policies; (ix) timely implementation of efficient manufacturing technologies; (x) errors in applying or changes in accounting and corporate governance rules; (xi) the issuance of equity compensation awards or changes in the terms of our stock plan or employee stock purchase plan; (xii) mergers or acquisitions; (xiii) the impact of import and export laws and regulations; (xiv) the cyclical nature of the semiconductor industry and general economic, market, political and social conditions in the countries where we sell our products and the related effect on our customers, distributors and suppliers; and (xv) our ability to obtain capital, debt financing and insurance on commercially reasonable terms, and allocations between our operating expenses and cost of sales. Although certain of these factors are out of our immediate control, unless we can anticipate and be prepared with contingency plans that respond to these factors, our business, results of operations and financial condition could be materially adversely affected, which could cause our stock price to significantly fluctuate or decline.
In particular, since we derived in 20192022 and expect to continue to derive a significantnotable portion of our revenue from China,Japan, our business development plans, results of operations and financial condition may be materially adversely affected by a significant political, social and economic developments in China.Japan. A slowdown in economic growth in China,Japan, such as due to the outbreak of the COVID-19 virusa pandemic could adversely impact our customers, prospective customers, suppliers, distributors and partners in China,Japan, which could have a material adverse effect on our results of the operations and financial condition. There is no guarantee that economic downturns, whether actual or perceived, any further decrease in economic growth rates or an otherwise uncertain economic outlook in ChinaJapan will not occur or persist in the future, that they will not be protracted or that governments will respond adequately to control and reverse such conditions, any of which could materially and adversely affect our business, financial condition and results of operations.
We may also encounter periods of industry wide semiconductor oversupply, resulting in pricing pressure, as well as undersupply, resulting in a risk that we could be unable to fulfill our customers' requirements. The semiconductor industry has historically been characterized by wide fluctuations in the demand for, and supply of, its products. These fluctuations have resulted in circumstances when supply of and demand for semiconductors has been widely out of balance. An industry wide semiconductor oversupply could result in severe downward pricing pressure from customers. In a market with undersupply of manufacturing capacity, we would have to compete with larger foundry and assembly customers for limited manufacturing resources. In such an environment, we may be unable to have our products manufactured in a timely manner, at a cost that generates adequate gross profit or in sufficient quantities. Since we outsource all of our manufacturing and generally have a single source of wafer supply, test, assembly and programming for our products, we are particularly vulnerable to such supply shortages and capacity limitations. As a result, we may be unable to fulfill orders and may lose customers. Any future industry wide oversupply or undersupply of semiconductors could therefore have a material adverse effect on our business, results of operations and financial condition.
We may be unable to successfully grow our business if we fail to compete effectively with others to attract and retain our executive officers, and other key management or technical personnel.
We believe our future success depends upon our ability to attract and retain highly competent personnel. Our employees are at-will and not subject to employment contracts. We could potentially lose the services of any of our senior management personnel at any time due to a variety of factors that could include, without limitation, death, incapacity, military service, personal issues, retirement, resignation or competing employers. Our ability to execute current plans could be adversely affected by such a loss. We may fail to attract and retain qualified technical, sales,
marketing and managerial personnel required to continue to operate our business successfully. Personnel with the expertise necessary for our business are scarce and competition for personnel with proper skills is intense.
In addition, new hires frequently require extensive training before they achieve desired levels of productivity. Additionally, attrition in personnel can result from, among other things, changes related to acquisitions, retirement and disability. We may not be able to retain existing key technical, sales, marketing and managerial employees or be successful in attracting, developing or retaining other highly-qualified technical, sales, marketing and managerial personnel, particularly at such times in the future as we may need to fill a key position. If we are unable to continue to develop and retain existing executive officers or other key employees or are unsuccessful in attracting new highly-qualified employees, our financial condition, cash flows, and results of operations could be materially and adversely affected.
We may have increasing difficulty attracting and retaining qualified outside board members.
The directors and management of publicly traded corporations are increasingly concerned with the extent of their personal exposure to lawsuits and shareholder claims, as well as governmental and creditor claims that may be made against them in connection with their positions with publicly held companies. Outside directors are becoming increasingly concerned with the availability of directors’ and officers’ liability insurance to pay on a timely basis the costs incurred in defending shareholder claims. Directors’ and officers’ liability insurance is expensive and difficult to obtain. The SEC and the Nasdaq Capital Market have also imposed higher independence standards and certain special requirements on directors of public companies. Accordingly, it may become increasingly difficult to attract and retain qualified outside directors to serve on our board of directors.
Our company’scompany’s global operations are subject to risks and uncertainties.
Most
Many of our products are manufactured outside of the United States at manufacturing facilities operated by our suppliers in Asia and South Asia.
A significant portion of our total revenue comes from sales to customers located outside the United States. We anticipate that sales to customers located outside the United States will continue to represent a significant portion of our total revenue in future periods. In addition, most of our domestic customers sell their products outside of North America, thereby indirectly exposing us to risks associated with foreign commerce and economic instability. In additionThe Company continues to maintain overseas sales offices, we have significant research and development activities in India.offices.
International operations are subject to certain risks inherent in conducting business outside the U.S., such as changes in currency exchange rates, tax laws, price and currency exchange controls, export and import restrictions, environmental regulations, protection of intellectual property rights, nationalization, expropriation and other governmental action. Accordingly, our operations and revenue are subject to a number of risks associated with foreign commerce, including the following: (i) staffing and managing foreign offices; (ii) managing foreign distributors; (iii) collecting amounts due; (iv) political and economic instability; (v) foreign currency exchange fluctuations; (vi) changes in tax laws, import and export regulations, tariffs and freight rates; (vii) timing and availability of export licenses; (viii) supplying products that meet local environmental regulations; and (ix) inadequate protection of intellectual property rights. In addition, we incur costs in foreign countries that may be difficult to reduce quickly because of employee related laws and practices in those foreign countries. Our global operations also may be adversely affected by political events and domestic or international terrorist events and hostilities. Current events, including the Russia-Ukraine military conflict, potential disruption caused by the COVID-19 virus outbreak first identified in China in December 2019,pandemics, the United Kingdom’s recent exit from the European Union, potential changes in immigration policies and tax reform proposals, create a level of uncertainty for multi-national companies. As U.S. companies continue to expand globally, increased complexity exists due to the possibility of renegotiated trade deals, revised international tax law treaties, and changes to the U.S. corporate tax code. These uncertainties could have a material adverse effect on our business and our results of operations and financial condition. As we continue to expand our business globally, our success will depend, in part, on our ability to anticipate and effectively manage these and other risks.
The semiconductor business is subject to downward price pressure.
Historically, the market for our products has been characterized by declining selling prices. With the recent supply chain shortages and materials price increases, and we anticipate that our average selling prices will fluctuate in future periods, although the timing and amount of these fluctuations cannot be predicted with any certainty. The pricing pressure in the semiconductor industry in past years has been due to a large number of factors, many of which were not easily foreseeable, such as industry-wide excess manufacturing capacity, weak economic growth, and at times, the slowdown in capital spending. Similar to past years, recent unfavorable economic conditions have resulted in a tightening of the credit markets. If signs of improvement in the global economy do not progress as expected and global economic conditions worsen, we may experience a decline in our average selling prices. In addition, our competitors have in the past, and may again in the future, lower prices in order to increase their market share. Despite the recent industry-wide price increases being implemented, prices may reduce in the future as the supply chain becomes more normalized again. In that event, downward price pressure in the industry may harm our competitive position and materially and adversely affect our financial condition, cash flows, and results of operations.
We may not be able to achieve the anticipated synergies and benefits from business acquisitions.
Part of our business strategy is to acquire businesses that we believe can complement our current business activities, both financially and strategically. Acquisitions, involve many complexities, including, but not limited to, risks associated with the acquired business’ past activities, difficulties in integrating personnel and human resource programs, integrating technology systems and other infrastructures under the Company’s control, unanticipated expenses and liabilities, and the impact on our internal controls and compliance with the regulatory requirements under the Sarbanes-Oxley Act of 2002. There is no guarantee that our acquisitions will increase the profitability and cash flow of the Company, and our efforts could cause unforeseen complexities and additional cash outflows, including financial losses. As a result, the realization of anticipated synergies or benefits from acquisitions may be delayed or substantially reduced.
Litigation could adversely impact our consolidated financial position.
We have been and may be in the future involved in various litigation matters arising in the ordinary course of business, including, but not limited to, litigation relating to employment matters, commercial transactions, intellectual property matters, contracts, environmental matters and matters related to compliance with governmental regulations. Litigation is inherently uncertain and unpredictable. The potential risks and uncertainties include, but are not limited to, such factors as the costs and expenses of litigation and the time and attention required of management to attend to litigation. An unfavorable resolution of any particular legal claim or proceeding, and/or the costs and expenses incurred in connection with a legal claim or proceeding, could have a material and adverse effect on our results of operations and financial condition.
We may be unable to adequately protect our intellectual property rights and may face significant expenses as a result of future litigation.
Protection of intellectual property rights is crucial to our business, since that is how we keep others from copying our innovations and those of third parties that are central to our existing and future products. From time to time, we receive letters alleging patent infringement or inviting us to license other parties’ patents. We evaluate these requests on a case-by-case basis. These situations may lead to litigation if we reject the offer to obtain the license.
In the past, we have been involved in litigation relating to our alleged infringement of third-party patents or other intellectual property rights. This type of litigation is expensive and consumes large amounts of management time and attention.
Because it is critical to our success that we continue to prevent competitors from copying our innovations, we intend to continue to seek patent and trade secret protection for our products. The process of seeking patent protection can be long and expensive, and we cannot be certain that any currently pending or future applications will actually result in issued patents or that, even if patents are issued, they will be of sufficient scope or strength to provide meaningful protection or any commercial advantage to us. Furthermore, others may develop technologies that are similar or superior to our technology or design around the patents we own. We also rely on trade secret protection for our technology, in part through confidentiality agreements with our employees, consultants and other third parties. However, these parties may breach these agreements and we may not have adequate remedies for any breach. In any case, others may come to know about or determine our trade secrets through a variety of methods. In addition, the laws of certain territories in which we develop, manufacture or sell our products may not protect our intellectual property rights to the same extent as the laws of the United States.
The market price of our common stock may fluctuate significantly and could lead to securities litigation.
Stock prices for many companies in the technology and emerging growth sectors have experienced wide fluctuations that have often been unrelated to the operating performance of such companies. In the past, securities class action litigation has often been brought against companies following periods of volatility in the market price of its securities. In the future, we may be the subject of similar litigation. Securities litigation could result in substantial costs and divert management’s attention.
If we do not maintain compliance with the listing requirements of the Nasdaq Capital Market, our common stock could be delisted, which could, among other things, reduce the price of our common stock and the levels of liquidity available to our stockholders.
Our common stock was originally listed on the Nasdaq Global Market and was transferred to the Nasdaq Capital Market (the “Nasdaq”) on July 22, 2019. In order to maintain that listing, we must satisfy minimum financial and other continued listing requirements and standards, including those regarding director independence and independent committee requirements, minimum stockholders' equity, minimum share price, and certain corporate governance requirements.
There can be no assurances that we will be able to maintain compliance with the applicable listing standards of Nasdaq. In the event that our common stock is delisted from Nasdaq and is not eligible for quotation on another market or exchange, trading of our common stock could be conducted in the over-the-counter market or on an electronic bulletin board established for unlisted securities, such as the Pink Sheets or the OTC Markets. In such event, it could become more difficult to dispose of, or obtain accurate price quotations for, our common stock, and there would likely also be a reduction in our coverage by securities analysts and the news media, which could cause the price of our common stock to decline further. Also, it may be difficult for us to raise additional capital if we are not listed on a major exchange.
Our business is subject to political, economic and health risks, natural disasters and other catastrophic events, which could have a material adverse effect on our business operations.
Our operations and the operations of our suppliers are vulnerable to interruption by fire, earthquake, power loss, flood, terrorist acts and other catastrophic events beyond our control. In particular, our headquarters are located near earthquake fault lines in the San Francisco Bay Area. In addition, we rely on certain suppliers to manufacture our products and would not be able to qualify an alternate supplier of our products for several quarters. Our suppliers often hold significant quantities of our inventories, which, in the event of a disaster, could be destroyed. If there is an earthquake or other catastrophic even near our headquarters, our customers’ facilities, our distributors facilities or our suppliers’ facilities, our business could be seriously harmed.
In addition, any catastrophic event, such as the recent COVID-19 virus outbreak, the failure of our computer systems or networks, including due to computer viruses, security breaches, war or acts of terrorism, could significantly disrupt our operations. Specifically, any prolonged health threat globally could adversely affect the economies and financial markets of many countries, resulting in an economic downturn that could impact our operating results. The occurrence of any of these events could also affect our customers, distributors and suppliers and produce similar disruptive effects upon their business, which would likely impact our sales and cause a decline in our revenue.
We do not maintain sufficient business interruption and other insurance policies to compensate us for all losses that may occur. Any losses or damages incurred by us as a result of a catastrophic event or any other significant uninsured loss could have a material adverse effect on our business.
There may be some effects of system outages or data security breaches, which could adversely affect our operations, financial results or reputation.
We face risks from electrical or telecommunications outages, computer hacking or other general system failure. We rely heavily on our internal information and communications systems and on systems or support services from third parties to manage our operations efficiently and effectively. Any of these are subject to failure. System-wide or local failures that affect our information processing could have a material adverse effect on our business, financial condition, results of operations and cash flows. Further, insurance coverage does not generally protect from normal wear and tear, which can affect system performance. Any applicable insurance coverage for an occurrence could prove to be inadequate. Coverage may be or become unavailable or inapplicable to any risks then prevalent.
Cyberattacks, like the 2023 cybersecurity incident, can lead to disruption of business, reduced revenue, increased costs, liability claims, or harm to our reputation or competitive position.
As demonstrated by the 2023 cybersecurity incident, security vulnerabilities may arise from our hardware, software, employees, contractors or policies we have deployed, which may result in external parties gaining access to our networks, datacenters, cloud datacenters, corporate computers, manufacturing systems, and or access to accounts we have at our suppliers, vendors, and customers. Due to the actions of outside parties, employee error, malfeasance, or otherwise, an authorized party may gain access to our data or our users’ or customers’ data or attack the networks causing denial of service or attempt to hold our data or systems in ransom. The vulnerability could be caused by inadequate account security practices such as failure to timely remove employee access when terminated. To mitigate these security issues, we have implemented measures throughout our organization, including firewalls, backups, encryption, employee information technology policies and user account policies. However, there can be no assurance these measures will be sufficient to avoid cyberattacks. If any of these types of security breaches were to occur and we were unable to protect sensitive data, our relationships with our business partners and customers could be materially damaged, our reputation could be materially harmed, and we could be exposed to a risk of litigation and possible significant liability.
As disclosed on March 14, 2023, on January 20, 2023, the Company detected a ransomware infection affecting a limited number of IT systems, including systems that contained personal information of our employees. Upon detection of the incident, the Company promptly began an assessment of all Company IT systems, notified law enforcement, and engaged legal counsel and other incident response professionals. The Company continued its business operations during this incident and successfully restored all of its critical operational data. The Company has also taken steps to further secure its IT systems. Based on the ongoing investigation and information currently known at this time, the Company believes the incident has not had nor will have a material impact on its business, operations, ability to serve its customers, or financial results, but the Company has no guarantee that similar cybersecurity incidents will not occur in the future.
Further, if we fail to adequately maintain our infrastructure, we may have outages and data loss. Excessive outages may affect our ability to timely and efficiently deliver products to customers or develop new products and solutions. Such disruptions and data loss may adversely impact our ability to fulfill orders, patent our intellectual property or protect our source code, and interrupt other processes. Delayed sales or lost customers resulting from these disruptions could adversely affect our financial results, stock price and reputation.
Effective May 25, 2018, the European Union ("EU") implemented the General Data Protection Regulation (“GDPR”) a broad data protection framework that expands the scope of current EU data protection law to non-European Union entities that process, or control the processing of, the personal information of EU subjects. The GDPR allows for the imposition of fines and corrective action on entities that improperly use or disclose the personal information of EU subjects, including through a data security breach. The State of California enacted the California Consumer Privacy Act of 2018 (“CCPA”) effective on January 1, 2020, which contains requirements similar to GDPR for the handling of personal information of California residents, commencing on January 1, 2020. Further, the California Privacy Rights Act (“CPRA”), which was recently voted into law by California residents and amends the CCPA, imposes additional data protection obligations on covered companies doing business in California and creates a new California data protection agency specifically tasked to enforce the law, which will likely result in increased regulatory scrutiny of California businesses in the areas of data protection and security. The substantive requirements for businesses subject to the CPRA went into effect on January 1, 2023 and become enforceable on July 1, 2023. Privacy and security laws, self-regulatory schemes, regulations, standards, and other obligations are constantly evolving, and may conflict with each other, and any such laws, schemes, regulations and standards may have an adverse impact on our business if we are not able to comply or if compliance requires time and resources for implementation.
Our and our collaborators’ and contractors’ failure to fully comply with GDPR, CCPA and other laws could lead to significant fines and require onerous corrective action. In addition, data security breaches experienced by us, our collaborators or contractors could result in the loss of trade secrets or other intellectual property, public disclosure of sensitive commercial data, and the exposure of personally identifiable information (including sensitive personal information) of our employees, customers, collaborators and others.
Unauthorized use or disclosure of, or access to, any personal information maintained by us or on our behalf, whether through breach of our systems, breach of the systems of our suppliers or vendors by an unauthorized party, or through employee or contractor error, theft or misuse, or otherwise, could harm our business. If any such unauthorized use or disclosure of, or access to, such personal information was to occur, our operations could be seriously disrupted, and we could be subject to demands, claims and litigation by private parties, and investigations, related actions, and penalties by regulatory authorities. In addition, we could incur significant costs in notifying affected persons and entities and otherwise complying with the multitude of foreign, federal, state and local laws and regulations relating to the unauthorized access to, or use or disclosure of, personal information. Finally, any perceived or actual unauthorized access to, or use or disclosure of, such information could harm our reputation, substantially impair our ability to attract and retain customers and have an adverse impact on our business, financial condition and results of operations.
Our Certificate of Incorporation, Bylaws and Delaware law contain provisions that could discourage a takeover that is beneficial to stockholders.
Provisions of our Certificate of Incorporation, our Bylaws and Delaware law could have the effect of discouraging takeover attempts that certain stockholders might deem to be in their interest. These anti-takeover provisions may make us a less attractive target for a takeover bid or merger, potentially depriving shareholders of an opportunity to sell their shares of common stock at a premium over prevailing market prices as a result of a takeover bid or merger.
Changes to existing accounting pronouncements or taxation rules or practices may cause adverse income fluctuations, affect our reported financial results or how we conduct our business.
Generally accepted accounting principles in the United States (“GAAP”) are promulgated by and are subject to the interpretation of the Financial Accounting Standards Board (“FASB”) and the SEC. New accounting pronouncements or taxation rules and varying interpretations of accounting pronouncements or taxation practices have occurred and may occur in the future. Any future changes in accounting pronouncements or taxation rules or practices may have a significant effect on how we report our results and may even affect our reporting of transactions completed before the change is effective. In addition, a review of existing or prior accounting practices may result in a change in previously reported amounts. This change to existing rules, future changes, if any, or the questioning of current practices may adversely affect our reported financial results, our ability to remain listed on the Nasdaq, or the way we conduct our business and subject us to regulatory inquiries or litigation.
If, in the future, we conclude our internal control over financial reporting is not effective, investors could lose confidence in the reliability of our financial statements, which could result in a decrease in the value of our common stock.
As directed by Section 404 of the Sarbanes-Oxley Act of 2002, the SEC adopted rules requiring public companies to include a report of management on the companies’ internal control over financial reporting in their annual reports on Form 10-K, including an assessment by management of the effectiveness of the filing company’s internal control over financial reporting. In addition, the independent registered public accounting firm auditing a public company’s financial statements must attest to the effectiveness of the Company’s internal control over financial reporting. There is a risk that in the future we may identify internal control deficiencies that suggest that our controls are no longer effective. This could result in an adverse reaction in the financial markets due to a loss of confidence in the reliability of our financial statements, which could cause the market price of our common stock to decline and make it more difficult for us to finance our operations
Risks Related to Our Products
If we fail to successfully develop, introduce and sell new products and other new solutions or if our design opportunities do not generate the revenue we expect, we may be unable to compete effectively in the future and our future gross margins and operating results will be lower.
The market for differentiated consumer hardware products is highly competitive and dynamic, with short end market product life cycles and rapid obsolescence of existing products. To compete successfully, we must obtain access to advanced fabrication capacity and dedicate significant resources to specify, design, develop, manufacture and sell new or enhanced solutions that provide increasingly higher levels of performance, low power consumption, new features, meeting current and emerging industry standards, reliability and/or cost savings to our customers. Due to the short product life cycle of these hardware products, our revenue is subject to fluctuation in a short period of time and our ability to grow our business depends on accelerating our design win activity. We often make significant investments in solutions, sensor algorithm software and silicon platform development, selling and marketing, long before we generate revenue, if any, from our efforts. The markets we are targeting typically have higher volumes and greater price pressure than our traditional business. In addition, we quote opportunities in anticipation of future cost reductions and may aggressively price products to gain market share. In order to react quickly to opportunities or to obtain favorable wafer prices, we make significant investments in and commitments to purchase inventories and capital equipment before we have firm commitments from customers.
We expect our business growth to be driven by new products, which currently include ArcticPro™, EOS™, QuickAI™, SensiML Analytics Toolkit, ArcticLink® III, PolarPro®3, PolarPro II, PolarPro, Eclipse II products and eFPGA IP licenses and professional services. The new product revenues growth of our new products needs to be strong enough to achieve profitability. The gross margin associated with our new products is generally lower than the gross margin of our mature products, due primarily to the price-sensitive nature of the higher volume IoT consumer opportunities that we are pursuing with new products. Because the product life cycle of IoT products is short, we must replace revenue at the end of a product life cycle with sales from new design opportunities. While we expect revenue and gross profit growth from new products will offset the expected decline in revenue and gross profit from our mature products, there is no assurance whether or when this will occur. In order to increase our revenue from its current level, we depend upon increased revenue from our existing new products, especially solutions based on our EOS S3, ArcticLink and PolarPro solution platforms, eFPGA IP and the development of additional new products and solutions.
If (i) we are unable to design, produce and sell new products and other products and solutions that meet design specifications, address customer requirements and generate sufficient revenue and gross profit; (ii) market demand for our new products and other products fails to materialize; (iii) we are unable to obtain adequate fabrication capacity on a timely basis; (iv) we are unable to develop new silicon platforms or solutions in a timely manner; or (v) our customers do not successfully introduce products incorporating our hardware products, or choose a competing offering, our revenue and gross margin of the new products will be materially harmed, which could have an overall adverse and potentially disproportionate effect on our business, results of operations and financial condition.
Two of our products target new unproven markets, and if these markets do not develop, or if our products do not meet their needs, the loss of or reduction in orders could adversely affect our revenue and harm our business financial condition, operating results and cash flows.
eFPGA: We have history and experience in developing, selling and supporting FPGA products and incorporating FPGA IP developed by us into our platform solutions. The eFPGA market is a developing market with unknown requirements and demand. Our current FPGA architectures and their performance may not be a good fit for the eFPGA Market. eFPGA IP is designed for specific foundry/process node combinations, and the ones we have chosen to target may be different from what our customers require. The software developed by us for eFPGA may be delayed or may not meet the needs of the eFPGA Market. The support required by a customer to incorporate the eFPGA may be much higher than expected which may delay new engagements or lead to high costs. The incorporated eFPGA IP may have an unexpected result in the customer’s chip leading to compensation demands. The expected NRE and royalty rates we expect to charge for the eFPGA may not be competitive, which may have a material adverse effect on our business, results of operations and financial condition.
SensiML: Mainstream AI runs on powerful processors and large FPGAs. SensiML’s AI solution targets end point solutions that use low power processors. The end point AI market is a developing market with unknown requirements and demand. The current SensiML solution may not be a good fit to the evolving needs of the end-point AI market. The support required for customer evaluations and implementation may be higher than expected which may delay engagements and lead to higher costs. The expected SaaS licensing fees and royalty rates we expect to charge for the SensiML solutions may not be competitive, which may have a material adverse effect on our business, results of operations and financial condition.
If our AI products are not low touch, the cost of addressing the fragmented AI market will be high which will delay market penetration, result in reduced revenues or require increased expenses, any of which could adversely affect our revenue and harm our business financial condition, operating results and cash flows.
The end point AI market consists of many different use cases, with each individual use case having a modest volume even though the aggregate volume is large. This is quite different from the IoT consumer market which consists of a few large customers and use cases. In order to scale in the fragmented AI end point market, our products will have to be extremely low touch so that the cost of support is low and scalable across many customers. The current EOS S3AI solution and SensiML solutions may not be sufficiently low touch to address this market in a cost-effective manner, or in the volume required. Higher than expected costs, or lower than expected volume may have a material adverse effect on our business, results of operations and financial condition.
Our products are subject to a lengthy sales cycle and our customers may cancel or change their product plans after we have expended substantial time and resources in the design of their products.
Our customers often evaluate our products for six months or more before designing them into their systems, and they may not commence volume shipments for up to an additional six to twelve months, if at all. During this lengthy sales cycle, our potential customers may cancel or change their product plans. Customers may also discontinue products incorporating our hardware products at any time or they may choose to replace our products with lower cost semiconductors. In addition, we are working with leading customers in our target markets to define our future products. If customers cancel, reduce or delay product orders from us, or choose not to release products that incorporate our hardware products after we have spent substantial time and resources developing products or assisting customers with their product design, our revenue levels may be less than anticipated and our business, results of operations and financial condition may be materially adversely affected.
If we fail to adequately forecast demand for our products, we may incur product shortages or excess product inventories.
Our agreements with certain suppliers require us to provide forecasts of our anticipated manufacturing orders, and place binding manufacturing commitments in advance of receiving purchase orders from our customers. We are limited in our ability to increase or decrease our forecasts under such agreements. Other manufacturers supply us with product on a purchase order basis. The allocation of capacity is determined solely by our suppliers, over which we have no direct control. Additionally, we may place orders with our suppliers in advance of customer orders to allow us to quickly respond to changing customer demand or to obtain favorable product costs. Furthermore, we provide our suppliers with equipment that is used to program our products to customer specifications. The programming equipment is manufactured to our specifications and has significant order lead times. These factors may result in product shortages or excess product inventories. Obtaining additional supply in the face of product, programming equipment or capacity shortages may be costly, or not possible, especially in the short-term since most of our products and programming equipment are supplied by a single supplier. If we fail to adequately forecast demand for our products, our business, the relationship with our customers, our results of operations and financial condition could be materially adversely affected.
Our business could be adversely affected by undetected errors or defect in our products.
Difficulties encountered during the complex semiconductor manufacturing process can render a substantial percentage of semiconductor hardware products nonfunctional. New manufacturing techniques or fluctuations in the manufacturing process may change the performance distribution and yield of our products. We have, in the past, experienced manufacturing runs that have contained substantially reduced or no functioning hardware products, or that generated hardware products with below normal performance characteristics. Our reliance on third-party suppliers may extend the period of time required to analyze and correct these problems. Once corrected, our customers may be required to redesign or re-qualify their products. As a result, we may incur substantially higher manufacturing costs, shortages of inventories or reduced customer demand.
Yield fluctuations frequently occur in connection with the manufacture of newly introduced products, with changes in product architecture, with manufacturing at new facilities, on new fabrication processes or in conjunction with new backend manufacturing processes. Newly introduced solutions and products are often more complex and more difficult to produce, increasing the risk of manufacturing related defects. New manufacturing facilities or processes are often more complex and take a period of time to achieve expected quality levels and manufacturing efficiencies. While we test our products, including our software development tools, they may still contain errors or defects that are found after we have commenced commercial production. Undetected errors or defects may also result from new manufacturing processes or when new intellectual property is incorporated into our products. If our products or software development tools contain undetected or unresolved defects, we may lose market share, experience delays in or loss of market acceptance, reserve or scrap inventories or be required to issue a product recall. In addition, we would be at risk of product liability litigation if defects in our products were discovered. Although we attempt to limit our liability to end users through disclaimers of special, consequential and indirect damages and similar provisions, we cannot assure you that such limitations of liability will be legally enforceable.
We will be unable to compete effectively if we fail to anticipate product opportunities based upon emerging technologies and standards or fail to develop products and solutions that incorporate these technologies and standards in a timely manner.
We spend significant resources designing and developing silicon solution platforms, IP and software and reference designs, and adopting emerging technologies. We intend to develop additional products and solutions and to adopt new technologies in the future. If system manufacturers adopt alternative standards or technologies, if an industry standard or emerging technology that we have targeted fails to achieve broad market acceptance, if customers choose low power offerings from our competitors, or if we are unable to bring the technologies or solutions to market in a timely and cost-effective manner, we may be unable to generate significant revenue from our research and development efforts. As a result, our business, results of operations and financial condition could be materially adversely affected, and we may be required to write-off related inventories and long-lived assets.
Rising concern of international tariffs, including tariffs applied to goods traded between the United States and China,as well as potential export restrictions, could materially and adversely affect our business and results of operations.
Regulatory activity, such as enforcement of U.S. export control and sanctions laws, and the imposition of tariffs and export regulations, have in the past and may materially limit our ability to make sales to customers in China, which may harm our results of operations and financial condition. Since the beginning of 2018, there has been increasing rhetoric, in some cases coupled with legislative or executive action, from several U.S. and foreign leaders regarding tariffs against foreign imports of certain materials. More specifically, there have been several rounds of U.S. tariffs on Chinese goods taking effect in 2018 and 2019, some of which prompted retaliatory Chinese tariffs on U.S. goods. Approximately $1.8We had sales to OEM and ODM customers in China of approximately $0.5 million, or 15%,3% of our total revenue for the year ended December 30, 2018,January 1, 2023, and approximately $1.1$0.1 million, or 11%,1% of our total revenue for the yearyears ended December 29, 2019, consistedJanuary 2, 2022 and January 3, 2021 of sales of our EOS S3 and FPGA products to both OEMs and ODMs in China. eFPGA products.
The institution of trade tariffs both globally and between the U.S. and China specifically carries the risk of negatively affecting China’s overall economic condition, which could have a negative impact on us as we derived and expect to continue to derive a significant amount of revenue from China. Further escalations of trade conflicts between the United States and China, or other countries where we have operations, may have a material adverse effect on our gross margin.
In addition to recent trade tariffs, if U.S. export controls expand to place new restrictions on the exportation of our products or a subset of our products, such controls could have a material adverse effect on our operating results. Moreover, concerns that U.S. companies may not be reliable suppliers may in the future cause some of our customers to replace our products in favor of products from other suppliers.
Imposition of tariffs or sustained export restrictions could cause a decrease in the sales of our products to customers located in China or other customers selling to Chinese end users, which would directly impact our business and operating results. Further, changes in United States trade policy could trigger retaliatory actions by affected countries, which could impose restrictions on our ability to do business in or with affected countries or prohibit, reduce, or discourage purchases of our products by foreign customers, leading to increased costs of products that contain our components, increased costs of manufacturing our products, and higher prices of our products in foreign markets. Changes in, and responses to, United States trade policy could reduce the competitiveness of our products and cause our sales and revenues to drop, which could materially and adversely impact our business and results of operations.
Exchange rate fluctuations could adversely affect our company’scompany’s results of operations and financial condition.
We denominate sales of our products to foreign countries exclusively in U.S. dollars. As a result, any increase in the value of the U.S. dollar relative to the local currency of a foreign country will increase the price of our products in that country so that our products become relatively more expensive to customers in their local currency which may cause sales of our products in that foreign country to decline. If the local currency of a foreign country in which we conduct business strengthens against the U.S. dollar, our payroll and other local expenses will be higher, and since sales are transacted in U.S. dollars, would not be offset by any increase in revenue. To the extent any such risks materialize, our business, results of operations and financial condition could be materially adversely affected.
We have implemented import and export control procedures to comply with United States regulations but we are still exposed to potential risks from import and export activity.
Our products, solutions, technology and software are subject to import and export control laws and regulations, which, in some instances, may impose restrictions on business activities, or otherwise require licenses or other authorizations from agencies such as the U.S. Department of State, U.S. Department of Commerce and U.S. Department of the Treasury. These restrictions may impact deliveries to customers or limit development and manufacturing alternatives. We have import and export licensing and compliance procedures in place for purposes of conducting our business consistent with U.S. and applicable international laws and regulations, and we periodically review these procedures to maintain compliance with the requirements relating to import and export regulations. If we are not able to remain in compliance with import and export regulations, we might be subject to investigation, sanctions or penalties by regulatory authorities. Such penalties can include civil, criminal or administrative remedies such as loss of export privileges. We cannot be certain as to the outcome of an evaluation, investigation, inquiry or other action or the impact of these items on our operations. Any such action could adversely affect our financial results and the market price of our common stock.
Risks Related to Our Customers and Partners
We currently depend on a limited number of significant customers, for a significant portion of our revenue and the loss of or reduction in orders from such significant customers could adversely affect our revenue and harm our business financial condition, operating results and cash flows.
A small number of end-customers represented a significant portion of our total revenue in our Fiscal Year ended January 1, 2023. During our Fiscal Year ended January 1, 2023, three customers accounted for 20%, 16% and 12%, respectively, of our total revenue. We expect this high level of customer concentration to reduce as we continue to market our solutions to customers in more fragmented IoT markets as well as Military, Aerospace and Defense customers. As in the past, future demand from these customers may fluctuate significantly from quarter to quarter. Customers typically order products with short, requested delivery lead times, and do not provide a commitment to purchase product past the period covered by purchase orders, which may be rescheduled or canceled. In addition, our manufacturing lead times are longer than the delivery lead times requested by these customers, and we make significant purchases of inventory and capital expenditures in anticipation of future demand. If revenue from any significant customer were to decline substantially, we may be unable to offset this decline with increased revenue and gross margin from other customers and we may purchase excess inventories. These factors could have a material adverse impact on our business, results of operations and financial condition.
We may make a significant investment in long-lived assets for the production of our products based upon historical and expected demand. If demand for our products or gross margin generated from our products does not meet our expectations or if we are unable to collect amounts due from significant customers, we may be required to write-off inventories, provide for uncollectible accounts receivable or incur charges against long-lived assets, which may have a material adverse effect on our business, results of operations and financial condition.
We depend upon partnering with other companies to offer voice, motion, and other solutions into our platform.
In addition to working directly with our customers, we partner with other companies that are experts in certain technologies to create more complete solutions. The depth of these relationships varies depending on the partner and the dynamics of the end market being targeted, but these relationships are typically a co-marketing relationship that includes joint account calls, promotional activities and/or engineering collaboration and developments. The propriety code provided by these partners may be an integral part of the solutions that we offer our customers. If we are unable to obtain competitive pricing (NRE, royalty) and prompt quality support by our partner, our solution may not be competitive. In addition, if the quality of our partner’s solution does not meet our customer’s requirements, it may delay or prevent the incorporation of our product by the customer. There may also be delays and additional expenses to improve or update the partner’s solution to meet current market needs. If we are unable to maintain a close working relationship with our partners it would hinder our ability to continue to develop and introduce leading solutions effectively in the future, which may have a material adverse effect on our business, results of operations and financial condition.
We depend on our relationships with third parties to manufacture our new hardware products.
We depend upon GlobalFoundries, TSMC, Amkor Technology, Inc., Integra Specialty Products, JCET Group Co. Ltd., and Golden Altos Corp. to manufacture our new hardware products. The inability of any one of these companies to continue manufacture of our new hardware products for any reason would require us to identify and qualify a new foundry to manufacture our new hardware products. This would be time consuming, difficult and result in unforeseen operational problems. Alternate foundries might not be available to fabricate our new hardware products, or if available, might be unwilling or unable to offer services on acceptable terms and our ability to operate our business or deliver our products to our customers could be severely impaired.
We depend upon third parties for silicon IP, RTL, design, physical design, verification and assembly of our silicon platforms and any failure to meet our requirements in a timely fashion may adversely affect our time to market and revenue.
Our move to a variable cost or outsourced engineering development model allows us access to the best design resources for developing new silicon platforms. This includes access to leading edge silicon IP as well as RTL design and physical design expertise. However, outsourcing the design of a complex silicon platform typically involves multiple companies in multiple locations, which may increase the risk of costly design errors. Any delays or errors in the design of our new silicon platforms could significantly increase the cost of development as well as adversely affect our time to market, which may have a material adverse effect on our business, results of operations and financial condition.
We depend upon partnering with other companies to develop IP, reference platforms, algorithms and system software.
In addition to working directly with our customers, we partner with other companies that are experts in certain technologies to develop additional intellectual property, reference platforms, algorithms, and system software to provide application solutions. We also work with IoP processor manufacturers and companies that supply sensor, storage, networking or graphics components for embedded systems. The depth of these relationships varies depending on the partner and the dynamics of the end market being targeted but is typically a co-marketing relationship that includes joint account calls, promotional activities and/or engineering collaboration and developments, such as reference designs. If we are unable to license new technologies, maintain a close working relationship with our partners, fail to continue to develop and introduce leading technologies or if these technologies fail to generate the revenue we expect, we may not be able to compete effectively in the future, which may have a material adverse effect on our business, results of operations and financial condition.
We depend upon third parties to fabricate, assemble, test and program our products, and to provide logistics services. Any problems at these third parties could adversely affect our business, results of operations and financial condition.
We contract with third parties to fabricate, assemble, test and program our hardware products, and vendors for logistics. In general, each of our hardware products is fabricated, assembled and programmed by a single supplier, and the loss of a supplier, transfer of manufacturing to a new location, expiration of a supply agreement or the inability of our suppliers to manufacture our products to meet volume, performance, quality and cost targets could have a material adverse effect on our business. Our relationship with our suppliers could change as a result of a merger or acquisition. If for any reason these suppliers or any other vendor becomes unable or unwilling to continue to provide services of acceptable quality, at acceptable costs and in a timely manner, our ability to operate our business or deliver our products to our customers could be severely impaired. We would have to identify and qualify substitute suppliers, which could be time consuming, difficult and result in unforeseen operational problems, or we could announce an end-of-life program for these products. Alternate suppliers might not be available to fabricate, assemble, test and program our hardware products or, if available, might be unwilling or unable to offer services on acceptable terms. In addition, if competition for wafer manufacturing capacity increases, if we need to migrate to more advanced wafer manufacturing technology, or if competition for assembly services increases, we may be required to pay or invest significant amounts to secure access to this capacity. The number of companies that provide these services is limited and some of them have limited operating histories and financial resources. In the event our current suppliers refuse or are unable to continue to provide these services to us, or if we are unable to secure sufficient capacity from our current suppliers on commercially reasonable terms, we may be unable to procure services from alternate suppliers in a timely manner, if at all. Moreover, our reliance on a limited number of suppliers subjects us to reduced control over delivery schedules, quality assurance and costs. This lack of control may cause unforeseen product shortages or may increase our cost to manufacture and test our products.
We utilize third-party logistics services, including transportation, warehouse and shipping services. These service providers are subject to interruptions that affect their ability to service us, including the availability of transportation services, disruptions related to work stoppages, volatility in fuel prices and security incidents or natural events at manufacturing, shipping or receiving points or along transportation routes.
In the event any of our third-party suppliers or vendors were to experience financial, operational, production or quality assurance difficulties resulting in a reduction or interruption in supply or providing services to us, our business, results of operations and financial condition may be materially adversely affected.
We entered into informal partnerships with certain third parties for the development of solutions. Our business could be adversely affected if such informal partnerships fail to grow as we expected.
Our approach to developing solutions for potential customers involves developing solutions for and aligning our roadmap with application processor, sensor, and flash memory vendors. We have entered into informal partnerships with other parties that involve the development of solutions that interface with their hardware products or standards. These informal partnerships also may involve joint marketing campaigns and sales calls. If the informal partnerships do not grow as expected or if they are significantly reduced or terminated by acquisition or other means, our business, results of operations and financial condition could be materially adversely affected and we may be required to write-off related inventories and long-lived assets.
Our solutions face competition from suppliers of ASSPs, suppliers of integrated application processors, low power FPGAs, low power MCUs, suppliers of ASICs, suppliers of eFPGA IP, and suppliers of sensor algorithm software whose software is running on competitors’ devices.hardware products.
We face competition from companies that offer ASSPs. While it is difficult to provide a unique solution through the use of ASSPs, ASSPs generally are cost-effective standard products with short lead times. In certain design opportunities, ASSPs can be combined to achieve system design objectives. Manufacturers of integrated application processors often integrate new features when they introduce new products. A system designer could elect the use of an integrated processor that includes the features offered in our solutions and/or a widely accepted feature of our solutions could be integrated into a competitor’s ASSP. Some vendors offer low power FPGAs that can be adopted by a mobileIoT device for hardware differentiation that is similar in functionality, physical size, power consumption and price to what we offer with our programmable logic-based solutions. We also face competition from low power MCU companies. While MCUs cannot be customized at the hardware level for product differentiation, they do have the ability to run custom software algorithms written in standard C code, which may yield similar functionality as what we can provide with our products. Companies that supply ASICs, which may be purchased for a lower price at higher volumes and typically have greater logic capacity, additional features and higher performance than our products. In addition, we face competition from companies that provide sensor algorithm software, which may be licensed directly by an OEM, or licensed for use through an MCU company. If we are unable to successfully compete with companies that supply ASSPs, lower power FPGAs, MCUs, ASICs, eFPGA IP, or sensor algorithm software in any of the following areas, our business, results of operations and financial condition will be materially adversely affected: (i) the development of new products, solutions and advanced manufacturing technologies; (ii) the quality, power characteristics, performance characteristics, price and availability of devices,hardware products, programming hardware and software development tools; (iii) the ability to engage with companies that provide synergistic products and services, including algorithms that may be preloaded into our device at configuration; (iv) the incorporation of industry standards in our products and solutions; (v) the diversity of product offerings available to customers; and (vi) the quality and cost-effectiveness of design, development, manufacturing and marketing efforts.
Our industry is in the midst of a consolidation phase which could result in stronger and better resourced competitors in the markets in which the company competes.
Mergers and acquisitions activity is at a high level in the semiconductor industry, as large companies have perceived attractive opportunities in today’s market to acquire new technologies and product lines by buying smaller companies. If our small and mid-sized competitors become targets of M&A activity and some of them are actually acquired by larger companies with much greater resources than us, we would face heightened competition that could result in lost sales and eroded margins.
We may not be able to achieve the anticipated synergies and benefits from business acquisitions, including our acquisition of SensiML Corporation.
Part of our business strategy is to acquire businesses that we believe can complement our current business activities, both financially and strategically. Acquisitions, including the SensiML Acquisition, involve many complexities, including, but not limited to, risks associated with the acquired business’ past activities, difficulties in integrating personnel and human resource programs, integrating technology systems and other infrastructures under the Company’s control, unanticipated expenses and liabilities, and the impact on our internal controls and compliance with the regulatory requirements under the Sarbanes-Oxley Act of 2002. There is no guarantee that our acquisitions will increase the profitability and cash flow of the Company, and our efforts could cause unforeseen complexities and additional cash outflows, including financial losses. As a result, the realization of anticipated synergies or benefits from acquisitions may be delayed or substantially reduced.
Litigation could adversely impact our consolidated financial position.
We have been and may be in the future involved in various litigation matters arising in the ordinary course of business, including, but not limited to, litigation relating to employment matters, commercial transactions, intellectual property matters, contracts, environmental matters and matters related to compliance with governmental regulations. Litigation is inherently uncertain and unpredictable. The potential risks and uncertainties include, but are not limited to, such factors as the costs and expenses of litigation and the time and attention required of management to attend to litigation. An unfavorable resolution of any particular legal claim or proceeding, and/or the costs and expenses incurred in connection with a legal claim or proceeding, could have a material and adverse effect on our results of operations and financial condition.
We may be unable to adequately protect our intellectual property rights and may face significant expenses as a result of future litigation.
Protection of intellectual property rights is crucial to our business, since that is how we keep others from copying our innovations and those of third parties that are central to our existing and future products. From time to time, we receive letters alleging patent infringement or inviting us to license other parties’ patents. We evaluate these requests on a case-by-case basis. These situations may lead to litigation if we reject the offer to obtain the license.
In the past, we have been involved in litigation relating to our alleged infringement of third party patents or other intellectual property rights. This type of litigation is expensive and consumes large amounts of management time and attention.
Because it is critical to our success that we continue to prevent competitors from copying our innovations, we intend to continue to seek patent and trade secret protection for our products. The process of seeking patent protection can be long and expensive, and we cannot be certain that any currently pending or future applications will actually result in issued patents or that, even if patents are issued, they will be of sufficient scope or strength to provide meaningful protection or any commercial advantage to us. Furthermore, others may develop technologies that are similar or superior to our technology or design around the patents we own. We also rely on trade secret protection for our technology, in part through confidentiality agreements with our employees, consultants and other third parties. However, these parties may breach these agreements and we may not have adequate remedies for any breach. In any case, others may come to know about or determine our trade secrets through a variety of methods. In
addition, the laws of certain territories in which we develop, manufacture or sell our products may not protect our intellectual property rights to the same extent as the laws of the United States.
The market price of our common stock may fluctuate significantly and could lead to securities litigation.
Stock prices for many companies in the technology and emerging growth sectors have experienced wide fluctuations that have often been unrelated to the operating performance of such companies. In the past, securities class action litigation has often been brought against companies following periods of volatility in the market price of its securities. In the future, we may be the subject of similar litigation. Securities litigation could result in substantial costs and divert management’s attention.
We may engage in manufacturing, distribution or technology agreements that involve numerous risks, including the use of cash, erosion of margins due to royalty obligations or revenue sharing and diversion of resources.
We have entered into and, in the future, intend to enter into agreements that involve numerous risks, including the use of significant amounts of our cash; royalty obligations or revenue sharing; diversion of resources from other development projects or market opportunities; our ability to collect amounts due under these contracts; and market acceptance of related products and solutions. If we fail to recover the cost of these or other assets from the cash flow generated by the related products, our assets will become impaired and our results of operations and financial condition could be materially adversely affected.
Our business is subject to political, economic and health risks, natural disasters and other catastrophic events, which could have a material adverse effect on our business operations.
Our operations and the operations of our suppliers are vulnerable to interruption by fire, earthquake, power loss, flood, terrorist acts and other catastrophic events beyond our control. In particular, our headquarters are located near earthquake fault lines in the San Francisco Bay Area. In addition, we rely on certain suppliers to manufacture our products and would not be able to qualify an alternate supplier of our products for several quarters. Our suppliers often hold significant quantities of our inventories, which, in the event of a disaster, could be destroyed. If there is an earthquake or other catastrophic even near our headquarters, our customers’ facilities, our distributors facilities or our suppliers’ facilities, our business could be seriously harmed.
In addition, any catastrophic event, such as the recent COVID-19 virus outbreak first identified in China, the failure of our computer systems or networks, including due to computer viruses, security breaches, war or acts of terrorism, could significantly disrupt our operations. Specifically, any prolonged health threat globally could adversely affect the economies and financial markets of many countries, resulting in an economic downturn that could impact our operating results. The occurrence of any of these events could also affect our customers, distributors and suppliers and produce similar disruptive effects upon their business, which would likely impact our sales and cause a decline in our revenue.
We do not maintain sufficient business interruption and other insurance policies to compensate us for all losses that may occur. Any losses or damages incurred by us as a result of a catastrophic event or any other significant uninsured loss could have a material adverse effect on our business.
There may be some potential effects of system outages or data security breaches, which could adversely affect our operations, financial results or reputation.
We face risks from electrical or telecommunications outages, computer hacking or other general system failure. We rely heavily on our internal information and communications systems and on systems or support services from third parties to manage our operations efficiently and effectively. Any of these are subject to failure. System-wide or local failures that affect our information processing could have a material adverse effect on our business, financial condition, results of operations and cash flows. In addition, a system failure or data security breach could also result in the unintentional disclosure of confidential information about us, our customers or our employees, which could result in our incurring costs for remedial or preventative actions, damage our reputation with customers and reduce demand for our products and services. Further, insurance coverage does not generally protect from
normal wear and tear, which can affect system performance. Any applicable insurance coverage for an occurrence could prove to be inadequate. Coverage may be or become unavailable or inapplicable to any risks then prevalent.
Our Certificate of Incorporation, Bylaws and Delaware law contain provisions that could discourage a takeover that is beneficial to stockholders.
Provisions of our Certificate of Incorporation, our Bylaws and Delaware law could have the effect of discouraging takeover attempts that certain stockholders might deem to be in their interest. These anti-takeover provisions may make us a less attractive target for a takeover bid or merger, potentially depriving shareholders of an opportunity to sell their shares of common stock at a premium over prevailing market prices as a result of a takeover bid or merger.
Changes to existing accounting pronouncements or taxation rules or practices may cause adverse revenue fluctuations, affect our reported financial results or how we conduct our business.
Generally accepted accounting principles in the United States, or GAAP, are promulgated by, and are subject to the interpretation of the Financial Accounting Standards Board, or FASB, and the SEC. New accounting pronouncements or taxation rules and varying interpretations of accounting pronouncements or taxation practices have occurred and may occur in the future. Any future changes in accounting pronouncements or taxation rules or practices may have a significant effect on how we report our results and may even affect our reporting of transactions completed before the change is effective. In addition, a review of existing or prior accounting practices may result in a change in previously reported amounts. This change to existing rules, future changes, if any, or the questioning of current practices may adversely affect our reported financial results, our ability to remain listed on the Nasdaq, or the way we conduct our business and subject us to regulatory inquiries or litigation.
If, in the future, we conclude our internal control over financial reporting is not effective, investors could lose confidence in the reliability of our financial statements, which could result in a decrease in the value of our common stock.
As directed by Section 404 of the Sarbanes-Oxley Act of 2002, the SEC adopted rules requiring public companies to include a report of management on the companies’ internal control over financial reporting in their annual reports on Form 10-K, including an assessment by management of the effectiveness of the filing company’s internal control over financial reporting. In addition, the independent registered public accounting firm auditing a public company’s financial statements must attest to the effectiveness of the company's internal control over financial reporting. There is a risk that in the future we may identify internal control deficiencies that suggest that our controls are no longer effective. This could result in an adverse reaction in the financial markets due to a loss of confidence in the reliability of our financial statements, which could cause the market price of our common stock to decline and make it more difficult for us to finance our operations.
Both our customers and we are subject to laws, regulations and similar requirements, changes to which may adversely affect our business, results of operations and financial condition.
Both our customers and we are subject to laws, regulations and similar requirements that affect our business, results of operations and financial condition, including, but not limited to, the areas of commerce, import and export control, financial disclosures, intellectual property, income and other taxes, anti-trust, anti-corruption, labor, environmental, health and safety. Our compliance in these areas may be costly, especially in areas where there are inconsistencies between the various jurisdictions in which we operate. While we have implemented policies and procedures to comply with laws and regulations, there can be no assurance that our employees, contractors, suppliers or agents will not violate such laws and regulations or our policies. Any such violation or alleged violation could materially and adversely affect our business, financial condition, cash flows and results of operations. Any changes or potential changes to laws, regulations or similar requirements, or our ability to respond to these changes, may significantly increase our costs to maintain compliance or result in our decision to limit our business, products or jurisdictions in which we operate, any of which could materially and adversely affect our results of operations and financial condition. Federal and state regulatory agencies, including the United States Federal Communications Commission and the various state public utility commissions and public service commissions, regulate most of our domestic telecommunications customers. Similar government oversight also exists in the international market.
While we may not be directly affected by this legislation, such regulation of our customers may negatively impact our business. For instance, the sale of our products may be affected by the imposition upon certain of our customers of common carrier tariffs and the taxation of telecommunications services. These regulations are continuously reviewed and changed by the various governmental agencies. Changes in current or future laws or regulations, in the United States or elsewhere, could materially and adversely affect our results of operations and financial condition.
The Dodd-Frank Wall Street Reform and Consumer Protection Act includes provisions regarding certain minerals and metals, known as conflict minerals, mined from the Democratic Republic of Congo and adjoining countries. These provisions require companies to undertake due diligence procedures and report on the use of conflict minerals in its products, including products manufactured by third parties. Compliance with these provisions has caused and will continue to cause us to incur costs to determine whether our supply chain is conflict free, and we may face difficulties if our suppliers are unwilling or unable to verify the source of their materials. Our ability to source these minerals and metals may also be adversely impacted. In addition, our customers may require that we provide them with a certification and our inability to do so may disqualify us as a supplier.
We have implemented import and export control procedures to comply with United States regulations but we are still exposed to potential risks from import and export activity.
Our products, solutions, technology and software are subject to import and export control laws and regulations, which, in some instances, may impose restrictions on business activities, or otherwise require licenses or other authorizations from agencies such as the U.S. Department of State, U.S. Department of Commerce and U.S. Department of the Treasury. These restrictions may impact deliveries to customers or limit development and manufacturing alternatives. We have import and export licensing and compliance procedures in place for purposes of conducting our business consistent with U.S. and applicable international laws and regulations, and we periodically review these procedures to maintain compliance with the requirements relating to import and export regulations. If we are not able to remain in compliance with import and export regulations, we might be subject to investigation, sanctions or penalties by regulatory authorities. Such penalties can include civil, criminal or administrative remedies such as loss of export privileges. We cannot be certain as to the outcome of an evaluation, investigation, inquiry or other action or the impact of these items on our operations. Any such action could adversely affect our financial results and the market price of our common stock.
We have entered and will continue to enter into strategic licensing and collaborative partnerships and relationships with third parties. The anticipated benefits of these partnerships and relationships may never materialize and these partnerships and relationships may instead disrupt our business and harm our financial condition.
We have entered into strategic licensing and collaborative partnerships and relationships with third parties and will continue to enter into such partnerships and relationships with the goal of acquiring or gaining access to new and innovative semiconductor products and technologies, as well as other technologies which can be used to add to the differentiation of our emerging products, on a timely basis. Negotiating and performing under these arrangements involves significant time and expense, and we cannot assure you that the anticipated benefits of these arrangements will ever materialize or that the products or technologies involved will ever be commercialized or that, as a result, we will not have written down a portion or all of our investment. The arrangements with some third parties contain conditions and contingencies (such as a condition to raise a certain amount of capital), and we cannot assure you that we will meet all the conditions under these arrangements. We may end up with owing various obligations and commitments to third parties related to these arrangements. Such arrangements can magnify several risks for us, including loss of control over the development and development timeline of products being developed with third parties. Accordingly, we face increased risk that development activities may result in products that are not commercially successful or that are not available in a timely fashion. In addition, any third partythird-party with whom we enter into a development, product collaboration or technology licensing arrangement may fail to commit sufficient resources to the project, change its policies or priorities and abandon or fail to perform its obligations related to the collaboration. The failure to timely develop commercially successful products through our development projects or strategic investment activities as a result of any of these and other challenges could have a material adverse effect on our business, results of operations and financial condition. Other challenges and risks presented by use of strategic partnerships include the acquisition of a partner with which we have a strategic relationship by an unaffiliated third partythird-party that either delays or jeopardizes the original intent of the partnering relationship or investment.
Cyberattacks through security vulnerabilities could lead to disruption of business, reduced revenue, increased costs, liability claims, or harm to our reputation or competitive position.
Security vulnerabilities may arise from our hardware, software, employees, contractors or policies we have deployed, which may result in external parties gaining access to our networks, datacenters, cloud datacenters, corporate computers, manufacturing systems, and or access to accounts we have at our suppliers, vendors, and customers. They may gain access to our data or our users’ or customers’ data, or attack the networks causing denial of service or attempt to hold our data or systems in ransom. The vulnerability could be caused by inadequate account security practices such as failure to timely remove employee access when terminated. To mitigate these security issues, we have implemented measures throughout our organization, including firewalls, backups, encryption, employee information technology policies and user account policies. However, there can be no assurance these measures will be sufficient to avoid cyberattacks. If any of these types of security breaches were to occur and we were unable to protect sensitive data, our relationships with our business partners and customers could be materially damaged, our reputation could be materially harmed, and we could be exposed to a risk of litigation and possible significant liability.
Further, if we fail to adequately maintain our infrastructure, we may have outages and data loss. Excessive outages may affect our ability to timely and efficiently deliver products to customers or develop new products and solutions. Such disruptions and data loss may adversely impact our ability to fulfill orders, patent our intellectual property or protect our source code, and interrupt other processes. Delayed sales or lost customers resulting from these disruptions could adversely affect our financial results, stock price and reputation.
Effective May 25, 2018, the European Union, or EU, implemented the General Data Protection Regulation, or GDPR, a broad data protection framework that expands the scope of current EU data protection law to non-European Union entities that process, or control the processing of, the personal information of EU subjects. The GDPR allows for the imposition of fines and corrective action on entities that improperly use or disclose the personal information of EU subjects, including through a data security breach. The State of California enacted the California Consumer Privacy Act of 2018, or CCPA, effective on January 1, 2020, which contains requirements similar to GDPR for the handling of personal information of California residents, commencing on January 1, 2020.
Our and our collaborators’ and contractors’ failure to fully comply with GDPR, CCPA and other laws could lead to significant fines and require onerous corrective action. In addition, data security breaches experienced by us, our collaborators or contractors could result in the loss of trade secrets or other intellectual property, public disclosure of sensitive commercial data, and the exposure of personally identifiable information (including sensitive personal information) of our employees, customers, collaborators and others.
Unauthorized use or disclosure of, or access to, any personal information maintained by us or on our behalf, whether through breach of our systems, breach of the systems of our suppliers or vendors by an unauthorized party, or through employee or contractor error, theft or misuse, or otherwise, could harm our business. If any such unauthorized use or disclosure of, or access to, such personal information was to occur, our operations could be seriously disrupted, and we could be subject to demands, claims and litigation by private parties, and investigations, related actions, and penalties by regulatory authorities. In addition, we could incur significant costs in notifying affected persons and entities and otherwise complying with the multitude of foreign, federal, state and local laws and regulations relating to the unauthorized access to, or use or disclosure of, personal information. Finally, any perceived or actual unauthorized access to, or use or disclosure of, such information could harm our reputation, substantially impair our ability to attract and retain customers and have an adverse impact on our business, financial condition and results of operations.
If we do not maintain compliance with the listing requirements of the Nasdaq Capital Market, our common stock could be delisted, which could, among other things, reduce the price of our common stock and the levels of liquidity available to our stockholders.
Our common stock was originally listed on the Nasdaq Global Market and was transferred to the Nasdaq Capital Market (the “Nasdaq”) on July 22, 2019. In order to maintain that listing, we must satisfy minimum financial and other continued listing requirements and standards, including those regarding director independence and
independent committee requirements, minimum stockholders' equity, minimum share price, and certain corporate governance requirements.
On January 18, 2019, we were notified in writing by the Nasdaq Stock Market LLC that the average closing bid price of our common stock was below the criteria of the continued listing standards of the Nasdaq Global Market, as the average per share closing price of our common stock over a consecutive 30-trading day period was less than $1.00. To regain compliance, we undertook steps to obtain shareholder approval and the approval of our Board of Directors to effect a reverse stock split of our outstanding shares of common stock, at a ratio of 1-for-14. The Reverse Stock Split was effected on December 23, 2019. On January 9, 2020, the Company received a letter from Nasdaq stating that the Company had regained compliance with the Bid Price Rule and it considered the matter closed.
There can be no assurances that we will be able to maintain compliance with the applicable listing standards of Nasdaq. In the event that our common stock is delisted from Nasdaq and is not eligible for quotation on another market or exchange, trading of our common stock could be conducted in the over-the-counter market or on an electronic bulletin board established for unlisted securities, such as the Pink Sheets or the OTC Markets. In such event, it could become more difficult to dispose of, or obtain accurate price quotations for, our common stock, and there would likely also be a reduction in our coverage by securities analysts and the news media, which could cause the price of our common stock to decline further. Also, it may be difficult for us to raise additional capital if we are not listed on a major exchange.
ITEM 1B. UNRESOLVED STAFF COMMENTS
None.
Our principal administrative, sales, marketing, research and development and final testing facility is located in a building of approximately 24,164 square feet of premises located at 2220 Lundy Avenue, San Jose, California, leased for a period of five years, effectiveduration from April 15, 2019. Until2019 to April 14, 2019, the Company’s principal administrative, sales, marketing, research and development and final testing facility was located at 1277 Orleans Drive, Sunnyvale, CA 94089. The Company exited Sunnyvale premises lease in July 2019.
In October 2018, the Company leased2024. Our subsidiary, SensiML Corp., occupies a facility for Research and Development in San Diego, California, the lease of which expires in July 2020. On February 28, 2019, SensiML Corporation, our newly acquired subsidiary, entered into an agreement to lease approximately 925706 square feet of facility space in Beaverton, Oregon, which expiresleased for a duration from April 2021 until March 2023. We lease flexible work-space on a monthly basis for sales offices in March 2021. Additionally, we lease a 9,400 square foot facility in Bangalore, India for the purpose of software development. This facility is leased through June 2021.Shanghai, China; London, England; and Taipei, Taiwan. We also lease sales office space in Shanghai, China; in London, England; in Taipei, Taiwan; and in Seongnam City,the Seoul Capital Area, South Korea.Korea on a short-term basis. We believe that our existing facilities are adequate for our current needs.
From time to time, we are involved in legal actions arising in the ordinary course of business, including but not limited to intellectual property infringement and collection matters. Absolute assurance cannot be given that third-party assertions will be resolved without costly litigation in a manner that is not adverse to our financial position, results of operations or cash flows or without requiring royalty or other payments in the future, which may adversely impact gross profit. We are not currently a party to any material pending legal proceedings.
ITEM 4. MINE SAFETY DISCLOSURES
Not applicable.
ITEM 5. MARKET FOR THE REGISTRANT’S COMMON EQUITY, RELATED STOCKHOLDER MATTERS AND ISSUER PURCHASES OF EQUITY SECURITIES
Market
Common Stock Information
Our
Our common stock is currently traded on the Nasdaq Capital Market under the symbol “QUIK.”QUIK. From October 15, 1999, the date of our initial public offering to July 21, 2019, our common stock was traded on the Nasdaq Global Market under the same symbol.
Stockholders
The closing price of our common stock on the Nasdaq was $5.34$5.06 per share on February 24, 2020.March 20, 2023. As of February 24, 2020,March 20, 2023, there were 8,378,38913,236,478 shares of common stock outstanding that were held of record by 155115 stockholders. The actual number of stockholders is greater than this number of holders of record since this number does not include stockholders whose shares are held in trust by other entities.
Dividend Policy
We have never declared or paid any dividends on our capital stock. We currently expect to retain future earnings, if any, for use in the operation and expansion of our business and do not anticipate paying any cash dividends in the foreseeable future.
Equity Compensation Plan Information
The information required by this item regarding equity compensation plans is set forth under the caption "Equity Compensation Plan Summary" in our Proxy Statement which information is incorporated by reference herein.
Stock Performance Graph
The following graph compares the cumulative total return to stockholders of our common stock from December 28, 201431, 2017 to December 29, 2019January 1, 2023 to the cumulative total return over such period of (i) the S&P 500 Index and (ii) the S&P Semiconductors Index. The graph assumes that $100 was invested on December 28, 201431, 2017 in QuickLogic’s common stock and in each of the other two indices and the reinvestment of all dividends, if any, through December 29, 2019January 1, 2023.
The information contained in the Performance Graph shall not be deemed to be “soliciting material” or to be “filed” with the SEC, nor shall such information be incorporated by reference into any future filing under the Securities Act of 1933, as amended, or the Securities Exchange Act of 1934, as amended, except to the extent that QuickLogic specifically incorporates it by reference into any such filing. The graph is presented in accordance with SEC requirements. Stockholders are cautioned against drawing any conclusions from the data contained therein, as past results are not necessarily indicative of future performance.
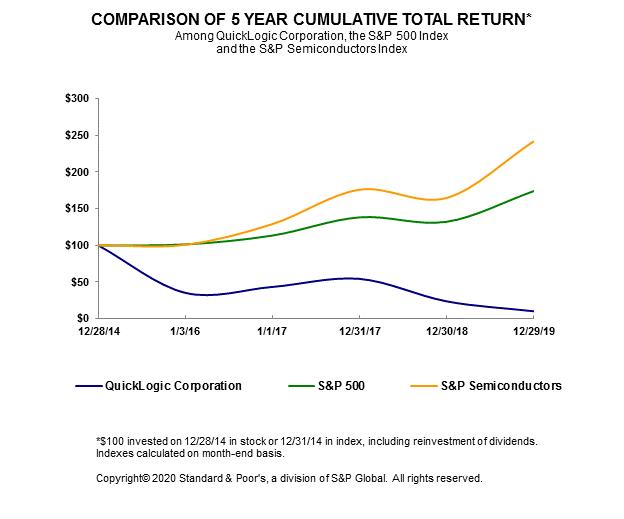
|
| 12/28/2014 |
|
| 1/03/2016 |
|
| 1/01/2017 |
|
| 12/31/2017 |
|
| 12/30/2018 |
|
| 12/29/2019 |
| ||||||
QuickLogic Corporation |
|
| 100.00 |
|
|
| 35.31 |
|
|
| 43.44 |
|
|
| 54.37 |
|
|
| 23.78 |
|
|
| 10.22 |
|
S&P 500 |
|
| 100.00 |
|
|
| 101.38 |
|
|
| 113.51 |
|
|
| 138.29 |
|
|
| 132.23 |
|
|
| 173.86 |
|
S&P Semiconductor |
|
| 100.00 |
|
|
| 100.88 |
|
|
| 129.07 |
|
|
| 175.96 |
|
|
| 164.72 |
|
|
| 241.74 |
|
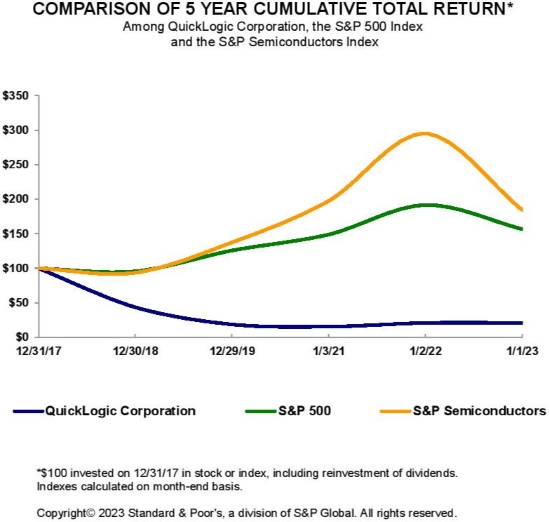
12/31/2017 | 12/30/2018 | 12/29/2019 | 1/3/2021 | 1/2/2022 | 1/1/2023 | |||||||||||||||||||
QuickLogic Corporation | 100.00 | 43.72 | 18.80 | 15.56 | 20.98 | 21.10 | ||||||||||||||||||
S&P 500 | 100.00 | 95.62 | 125.72 | 148.85 | 191.58 | 156.89 | ||||||||||||||||||
S&P Semiconductor | 100.00 | 93.62 | 137.39 | 197.46 | 294.91 | 184.86 | ||||||||||||||||||
The stock price performance included in this graph is not necessarily indicative of future stock price performance.
ITEM 6. SELECTED FINANCIAL DATA
|
| Fiscal Years |
| |||||||||||||||||
|
| 2019 |
|
| 2018 |
|
| 2017 |
|
| 2016 |
|
| 2015 |
| |||||
|
| (in thousands, except per share amount) |
| |||||||||||||||||
Statements of Operations: |
|
|
|
|
|
|
|
|
|
|
|
|
|
|
|
|
|
|
|
|
Revenue |
| $ | 10,310 |
|
| $ | 12,629 |
|
| $ | 12,149 |
|
| $ | 11,421 |
|
| $ | 18,956 |
|
Cost of revenue |
|
| 4,405 |
|
|
| 6,295 |
|
|
| 6,627 |
|
|
| 7,648 |
|
|
| 11,411 |
|
Gross profit |
|
| 5,905 |
|
|
| 6,334 |
|
|
| 5,522 |
|
|
| 3,773 |
|
|
| 7,545 |
|
Operating expenses: |
|
|
|
|
|
|
|
|
|
|
|
|
|
|
|
|
|
|
|
|
Research and development |
|
| 12,350 |
|
|
| 9,948 |
|
|
| 9,572 |
|
|
| 12,265 |
|
|
| 14,144 |
|
Selling, general and administrative |
|
| 8,918 |
|
|
| 9,982 |
|
|
| 9,900 |
|
|
| 10,310 |
|
|
| 10,619 |
|
Restructuring costs(1) |
|
| — |
|
|
| — |
|
|
| — |
|
|
| — |
|
|
| 295 |
|
Loss from operations |
|
| (15,363 | ) |
|
| (13,596 | ) |
|
| (13,950 | ) |
|
| (18,802 | ) |
|
| (17,513 | ) |
Interest expense |
|
| (350 | ) |
|
| (108 | ) |
|
| (115 | ) |
|
| (175 | ) |
|
| (82 | ) |
Interest income and other expense, net |
|
| 189 |
|
|
| 77 |
|
|
| 21 |
|
|
| (106 | ) |
|
| (107 | ) |
Loss before income taxes |
|
| (15,524 | ) |
|
| (13,627 | ) |
|
| (14,044 | ) |
|
| (19,083 | ) |
|
| (17,702 | ) |
(Benefit from) Provision for income taxes |
|
| (80 | ) |
|
| 152 |
|
|
| 87 |
|
|
| 65 |
|
|
| 146 |
|
Net loss |
| $ | (15,444 | ) |
| $ | (13,779 | ) |
| $ | (14,131 | ) |
| $ | (19,148 | ) |
| $ | (17,848 | ) |
Net loss per share: |
|
|
|
|
|
|
|
|
|
|
|
|
|
|
|
|
|
|
|
|
Basic and diluted |
| $ | (2.02 | ) |
| $ | (2.16 | ) |
| $ | (2.56 | ) |
| $ | (4.10 | ) |
| $ | (4.42 | ) |
Weighted average shares: |
|
|
|
|
|
|
|
|
|
|
|
|
|
|
|
|
|
|
|
|
Basic and diluted |
|
| 7,663 |
|
|
| 6,365 |
|
|
| 5,521 |
|
|
| 4,670 |
|
|
| 4,034 |
|
|
| December 29, 2019 |
|
| December 30, 2018 |
|
| December 31, 2017 |
|
| January 1, 2017 |
|
| January 3, 2016 |
| |||||
|
| (in thousands) |
| |||||||||||||||||
Balance Sheet Data: |
|
|
|
|
|
|
|
|
|
|
|
|
|
|
|
|
|
|
|
|
Cash and cash equivalents |
| $ | 21,548 |
|
| $ | 26,463 |
|
| $ | 16,527 |
|
| $ | 14,870 |
|
| $ | 19,136 |
|
Working capital |
| $ | 10,366 |
|
| $ | 15,576 |
|
| $ | 12,619 |
|
| $ | 9,042 |
|
| $ | 19,132 |
|
Total assets |
| $ | 33,404 |
|
| $ | 36,086 |
|
| $ | 24,636 |
|
| $ | 21,844 |
|
| $ | 28,461 |
|
Long-term obligations, excluding current portion |
| $ | 1,583 |
|
| $ | 124 |
|
| $ | 369 |
|
| $ | 49 |
|
| $ | 2,341 |
|
Total stockholders' equity |
| $ | 13,823 |
|
| $ | 17,255 |
|
| $ | 14,878 |
|
| $ | 11,988 |
|
| $ | 20,325 |
|
____________________
|
|
[RESERVED]
.
ITEM 7. MANAGEMENT’S DISCUSSION AND ANALYSIS OF FINANCIAL CONDITION AND RESULTS OF OPERATIONS
The following discussion of our financial condition and results of operations should be read in conjunction with the financial statements and related notes included in this Annual Report on Form 10-K. This discussion may contain forward-looking statements based upon current expectations that involve risks and uncertainties including those discussed under Part I, Item 1A, “Risk Factors.” These risks and uncertainties may cause actual results to differ materially from those discussed in the forward-looking statements.
Overview
We develop low power, multi-core semiconductor platforms and IP for AI, voice and sensor processing. The solutions include an eFPGA for hardware acceleration and pre-processing, and heterogeneous multi-core SoCs that integrate eFPGA with other processors and peripherals. The SensiML Analytics Toolkit from our recently acquired wholly owned subsidiary, SensiML completes the “full stack” end-to-end solution with accurate sensor algorithms using AI technology. The full range of platforms, software tools and eFPGA IP enables the practical and efficient adoption of AI, voice and sensor processing across mobile, wearable, hearable, consumer, industrial, edgeConsumer/Industrial IoT, Consumer Electronics, Military, Aerospace and endpoint IoTDefense applications.
Our new products include our ArcticPro™, EOS™, QuickAI™, SensiML Analytics Studio,Toolkit, ArcticLink® III, PolarPro®3, PolarPro II, PolarPro, and Eclipse II products (which together compriseproducts. In addition to delivering our own semiconductor solutions, our new product category).products category includes our IP business that licenses our eFPGA technology for use in other semiconductor companies SoCs and provides professional services, consisting of development and integration of eFPGA technology into bespoke semiconductor solutions. SensiML provides an AI software platform for products that include Software-as-a-Service ("SaaS") subscriptions for development, per unit license fees when deployed in production, and proof-of-concept services, all of which are also included in the new products revenue category. Our mature products include primarily FPGA families named pASIC®3 and QuickRAM® as well as programming hardware and design software. In addition to delivering our own semiconductor solutions, we have an IP business that licenses our eFPGA technology for use in other semiconductor companies SoCs. We began delivering our eFPGA IP product ArcticPro™ in 2017, which is included in the new product revenue category. Through the acquisition of SensiML, we now have an IoT AI software platform that includes SaaS subscriptions for development, per unit license fees when deployed in production, and proof-of-concept services – all of which are also included in the new product revenue category.
Our semiconductor solutions typically fall into one of threefour categories: Hardware products consisting of Sensor Processing, DisplayDisplay, Smart Connectivity, and Visual Enhancement,eFPGA intellectual property and Smart Connectivity. its associated Tools. Our solutions include a unique combination of our silicon platforms, IP cores, software drivers, and in some cases, firmware and application software. All of our silicon platforms are standard deviceshardware products and must be programmed to be effective in a system. Our IP that enables always-on context-aware sensor applications includes our Flexible Fusion Engine, our Sensor Manager and Communications Manager technologies as well as IP that (i) improves multimedia content, such as our Visual Enhancement Engine, or VEE, technology, and Display Power Optimizer, or DPO, technology; and (ii) implements commonly used mobile system interfaces, such as Low Voltage Differential Signaling, or LVDS, Mobile Industry Processor Interface, or MIPI, and Secure Digital Input Output, or SDIO.
Through the acquisition of SensiML, our
Our core IP also includes the SensiML AIAnalytics Toolkit that enables OEMs to develop AI software for a broad array of resource-constrained time-series sensor endpoint applications. These include a wide range of consumer and industrial sensing applications.
We also work with mobile processor manufacturers, sensor manufacturers, and voice recognition, sensor fusion and context awareness algorithm developers in the development of reference designs. Through reference designs that incorporate our solutions, we believe mobile processor manufacturers, sensor manufacturers, and sensor and voice algorithm companies can expand the available market for their respective products. Furthermore, should a solution developed for a processor manufacturer or sensor and/or sensor algorithm company be applicable to a set of common OEMs or Original Design Manufacturers, or ODMs, we can amortize our Research and Development, or R&D, investment over that set of OEMs or ODMs. There may also be cases when platform providers that intend to use always-on voice recognition will dictate certain performance requirements for the combined software/hardware solution before the platform provider certifies and/or qualifies our product for use by end customers.
In addition to working directly with our customers, we partner with other companies that are experts in certain technologies to develop additional IP, reference platforms and system software to provide application solutions, particularly in the area of hardware acceleration for AI-type applications. We also work with mobile processor and communications semiconductor device manufacturers and companies that supply sensor, algorithms and applications. For our sensor processing solutions, we collaborate with sensor manufacturers to ensure interface compatibility. We also collaborate with sensor and voice/audio software companies, helping them optimize their software technology on our silicon platforms in terms of performance, power consumption and user experience.
Our ArcticPro eFPGA IP are currently developed on 65nm, 40nm and 22nm process nodes. The licensable IP is generated by a compiler tool that enables licensees to create an eFPGA block that they can integrate into their SoC without significant involvement by QuickLogic. We believe this flow enables a scalable support model for QuickLogic. For our eFPGA strategy, we work with semiconductor manufacturing partners to ensure our eFPGA IP is proven for a given foundry and process node before it is licensed to a SoC company.
In order to grow our revenue from its current level, we depend upon increased revenue from our new products including existing new product platforms eFPGA IP and platforms currently in development. We expectexpect our business growth to be driven mainly by our silicon solutions, eFPGA IP and SensiML AI Software. Therefore, our revenue growth needs to be strong enough to enable us to sustain profitability while we continue to invest in the development, sales and marketing of our new solution platforms, IP and software. We are expecting revenue growth from EOS S3, SensiML AI SaaS, and eFPGA IP licensinglicense in fiscal year 2020.Fiscal Year 2023.
We continue to seek to expand our revenue, including pursuing high-volume sales opportunities in our target market segments, by providing solutions incorporating IP, or industry standard interfaces. Our industry is characterized by intense price competition and by lower margins as order volumes increase. While winning large volume sales opportunities will increase our revenue, we believe these opportunities may decrease our gross profit as a percentage of revenue.
During 2019, we
New products revenue for the Fiscal Year ended January 1, 2023 was $11.7 million, an increase of $3.9 million as compared to the Fiscal Year ended January 2, 2022. Of the $11.7 million in new products revenue, approximately $7.5 million was generated totalfrom eFPGA IP revenue, of $10.3primarily eFPGA-related professional engineering services, as compared to approximately $2.7 million which representsin the Fiscal Year ended January 2, 2022. Mature products revenue for the Fiscal Year ended January 1, 2023 was $4.5 million, a 18%9% decrease from 2018. Our new product revenue during 2019 was $3.1 million, which represents a 46% decrease from 2018, while our mature product revenue during 2019 was $7.2 million, which represents a 4% increase from 2018.compared to the Fiscal Year ended January 2, 2022. We shipped our new products into four of our targeted mobile market segments: Smartphones, Wearables, Mobile Enterprise, Tablets, and Tablets. In addition, we started to generate SaaS revenue from the new Artificial Intelligence or AI("AI") market in 2019. Overall, with the acquisition of SensiMLbeginning in the beginning of 2019, weFiscal Year ended January 3, 2021. We reported a net loss of $15.4$4.3 million for 2019the Fiscal Year ended January 1, 2023 compared to a net loss of $13.8$6.6 million for 2018. as compared to the Fiscal Year ended January 2, 2022.
We have experienced net losses in the recentpast years and expect suchto experience losses to continue throughin at least some of the year ending January 3, 2020fiscal quarters during 2023, as we continue to develop new products, applications and technologies. Our new hardware products and hardware products currently under development are generating stable gross margins year over year and higher margins than our mature products due to the markets that we have targeted, and the larger order quantities associated with these new products. New eFPGA products have been generating lower gross margin as a percentage of revenue. Whether we can achieve cash flow levels sufficient to support our operations cannot be accurately predicted.predicted, and our investment portfolio is subject to a degree of interest rate and liquidity risk. Unless such cash flow levels are achieved, in addition to the $3.2 million and $1.5 million in proceeds that we received in September 2022 and February 2022, respectively,from our recentthe sale of our equity securities, and the revolving line of credit we may be able to draw down from Heritage Bank of Commerce, we may need to borrowobtain additional funds through strategic divestiture, or sell debt or equity securities, or some combination thereof, to provide fundingfunding for our operations, and suchoperations. Such additional funding may not be available on commercially reasonable terms, or at all.
On December 6, 2019, the Board of Directors
Impact of the Company approved a 1-for-14 reverse stock split ofCOVID-19 and Supply Chain Disruptions on Business
The COVID-19 pandemic and its potential effects on the Company’s outstanding Common Stock, which became effective on December 23, 2019, which was approvedbusiness in Fiscal 2023 and beyond remain uncertain. There have been further restrictions by the Company’s shareholders in a special meeting held on November 26, 2019. At the effective time of the Reverse Stock Split, every 14 issued and outstanding shares of the Company Common Stock were automatically combined into one issued and outstanding share of Common Stock without any change in the par value per share. Stockholders who would have otherwise been entitled to fractional shares of Common Stockgovernmental authorities as a result of a surge in COVID-19 cases during the Reverse Stock Split received a cash paymentyear 2021, 2022, and potentially continuing into Fiscal 2023. These restrictions and other impacts from COVID-19 could cause further disruptions or restrictions on the Company’s ability to source, manufacture or distribute its products, including temporary disruptions to the facilities of its contract manufacturers in lieuChina, Taiwan, Philippines and Singapore, or the facilities of receiving fractional shares. All share, equity award,its suppliers and per share amounts containedtheir contract manufacturers globally. Additionally, multiple countries have imposed and may further impose restrictions on business operations and movement of people and products to limit the spread of COVID-19. This might cause delays in this Form 10-Kproduction or delivery of components or raw materials that are part of the Company’s global supply chain. If COVID-19 cases surge and the accompanying Consolidated Financial StatementsCompany experiences more pronounced disruptions in its operations, the Company may experience constrained supply or curtailed demand that may materially adversely impact its business and results of operations.
The extent of the impact of COVID-19 on our operational and financial performance will depend on future developments, including the duration and spread of the pandemic, restrictions on travel, transportation and other containment measures, the success and availability of the recent vaccine, our compliance with these measures and the impact on our employees, customers, contractors and supply chain, all of which are uncertain and cannot be predicted.
The Company continues to experience increased material and logistics costs and impacts from the worldwide semiconductor supply shortage. The semiconductor supply shortage is due, in part, to increased demand across multiple industries resulting in a slowdown in production schedules. The semiconductor supply shortage is also impacting the Company’s supply chain and its ability to meet demand at some of its customers.
The Russia-Ukraine military conflict has negatively impacted the Company's European customers. Although the Company does not have any customers or operations in Russia or Ukraine, certain of its customers and suppliers may have been adjustednegatively impacted by these events, which in turn may have impacted markets where the Company conducts business, including Europe and Asia. The economic sanctions imposed by the international community may have further increased existing supply chain, logistics, and inflationary challenges.
2023 Cybersecurity Incident
On January 20, 2023, the Company detected a ransomware infection affecting a limited number of IT systems, including systems that contained personal information of our employees. Upon detection of the incident, the Company promptly began an assessment of all Company IT systems, notified law enforcement, and engaged legal counsel and other incident response professionals. The Company continued its business operations during this incident and successfully restored all of its critical operational data. The Company has also taken steps to reflectfurther secure its IT systems. Based on the Reverse Stock Splitongoing investigation and information currently known at this time, the Company believes the incident has not had nor will have a material impact on its business, operations, ability to serve its customers, or financial results. See Note 15 for additional information.
Our employees and customers
Quicklogic nurtures a culture of highly talented teams of employees operating in a committed, execution-oriented, and globally collaborative environment. We are close-knit, family-oriented team welcomes and encourages all prior periods presented.perspectives and ideas to improve and innovate in our space, providing exciting career opportunities for the future of technology. Collaboration is deeply engrained in how we work with each other and our customers. We offer competitive compensation and benefits. Many of our personnel work from home except a few personnel required for minimum operations. We embrace remote work and enable our employees to do their best work from anywhere in the United States allowing them to balance their work obligations with their personal lives. We are committed to our customers to provide the support they need to continue providing vital services and tools. We do meaningful work with a global impact.
Critical Accounting Policies and Estimates
The methods, estimates and judgments we use in applying our most critical accounting policies have a significant impact on the results we report in our consolidated financial statements. The SEC has defined critical accounting policies as those that are most important to the portrayal of our financial condition and results of operations and require us to make our most difficult and subjective judgments, often as a result of the need to make estimates of matters that are inherently uncertain. Based on this definition, our critical accounting policies include revenue recognition includingand determination of the Stand-Alone Selling Price, or SSP,standalone selling price ("SSP") for eachcertain distinct performance obligation, sales returnsobligations, and allowances,in the valuation of inventories including identification of excess quantities and product obsolescence, allowance for doubtful accounts, valuation of long-lived assets, measurement of stock-based compensation and accounting for income taxes.obsolescence. We believe that we apply judgments and estimates in a consistent manner and that such consistent application results in consolidated financial statements and accompanying notes that fairly represent all periods presented. However, any factual errors or errors in these judgments and estimates may have a material impact on our consolidated financial statements.statements.
Revenue Recognition
We supplyearn revenue from our activities delivering standard hardware products, that must be programmed before they can be used in an application. Our products may be programmed by us, distributors, end-customers or third parties.
We adopted Accounting Standards Update, or ASU, No. 2014-09, Revenue from Contracts with Customers (Topic 606)professional engineering services, and related ASU No. 2016-08, ASU No. 2016-10, ASU No. 2016-12 and ASU No. 2016-20, which provide supplementary guidance, and clarifications, effective January 1, 2018. We adopted ASC 606 using the modified retrospective method. The results for the reporting period beginning after January 1, 2018, are presented in accordance with the new standard, although comparative information for the prior year has not been restated and continues to be reported under the accounting standards and policies in effect for those periods. Adoption of the new standard did not havesoftware as a significant impact on the current period revenues or on the prior year Consolidated Financial Statements. No transition adjustment was requiredservice to our retained earnings as of January 1, 2018. Under the new standard revenue is recognized as follows:customers.
Revenue is recognized upon transfer of control of promised products or services to customers in an amount that reflects the consideration we expect to receive in exchange
We apply a five-step model for those products or services.recognizing revenue:
We determine revenue recognition through the following steps:
• Identification of the contract, or contracts, with a customer,
• Identification of the performance obligations in the contract,
• Determination of the transaction price. The Company estimates the transaction price based on the amount expected to be received for transferring the performance obligations in the contract, which may include both fixed consideration and variable consideration. Our contracts with customers containing variable consideration are generally sales based royalties, which is fully constrained.
• Allocation of the transaction price to the performance obligations in the contract, and
• Recognition of revenue when, or as, we satisfy a performance obligation.
As part of its assessment of each contract, the Company evaluateswe evaluate certain factors including the customer’s ability to pay, or credit risk. For each contract, the Company considers the promise to transfer products, each of which
The following is distinct, to be the identified performance obligations. In determining the transaction price, the price stated on the purchase order is typically fixed and represents the net consideration to which the Company expects to be entitled, and therefore there is no variable consideration. As the Company’s standard payment terms are less than one year, the Company has elected, as a practical expedient, to not assess whether a contract has a significant financing component. The Company allocates the transaction price to each distinct product based on its relative standalone selling price. The product price as specified on the purchase order is considered the standalone selling price as it is an observable source that depicts the price as if sold to a similar customer in similar circumstances.description our revenue recognition policy by principal activity:
Hardware Product Revenue
We generate most of our revenue by supplying standard hardware products, which must be programmed before they can be used in an application. Our contractsStandard hardware products may be programmed by us, distributors, end-customers or third parties. Contracts with customers arefor hardware products generally for products only, and do not include other performance obligations such as services, extended warranties or other material rights.
Our promise to transfer hardware products is identified as a distinct performance obligation. We recognize revenue on hardware product revenue at the point of timeproducts when we transfer control of the promised products is transferred to the customers,customer. Transfer of control of hardware products occurs when our performance obligation is satisfied, which typically occurs upon shipment from our manufacturing site or our headquarters. We recognize revenue in an amount that reflects the consideration we expect to receive in exchange for those products, which also represents the SSP of our performance obligation. Hardware product transaction prices are fixed. We elected a practical expedient in which we do not assess whether a contract has a significant financing component since our standard payment terms are less than one year. We allocate the transaction price of customer contracts to each distinct product based on its relative standalone selling price. The majority of our revenue is derived from hardware product sales.
Intellectual Property and Software License Revenue
We also generaterecognized hardware product revenue of approximately $8.3 million, or 51% of total revenue, $9.8 million, or 77% of total revenue, and $8.2 million, or 95% total revenue, in the Fiscal Years ended January 1, 2023, January 2, 2022, and January 3, 2021, respectively.
eFPGA IP Revenue
eFPGA IP revenue is comprised primarily of eFPGA intellectual property revenue, eFPGA-related professional services revenue, and eFPGA-related support and maintenance. We recognize eFPGA intellectual property revenue from licensing IP, software toolsour eFPGA intellectual property to customers and royaltyrecognize eFPGA-related professional services revenue from licensingthe fees associated with custom development and integration of our technology.
technology solutions into hardware products. We recognize IPeFPGA revenue from support and Software Licensemaintenance services for post-implementation customer support ratably over the service term. Renewals of support and maintenance contracts create new performance obligations which we recognize as revenue atratably over the point of time when the control ofservice term.
eFPGA IP or software license has been transferred.
Some of the IP and Software Licensing contracts with customers containoften include promises to transfer multiple goods and services to a customer. Contracts with customers may include promises to transfer eFPGA intellectual property licenses, provide professional engineering services involving the design or modification of hardware products, and provide custom integration our technology solutions into the customers' products. These contracts require the application of judgment in identifying and evaluating any terms and conditions in contracts which may impact revenue recognition. Determining whether promised goods and services are distinct performance obligations that should be accounted for separately, or not distinct and thus accounted for together, requires significant judgment. In some contractual arrangements, we have concluded that the promised goods and services are distinct from each other and then these promised goods and services are considered individual performance obligations. ForIn other contractual arrangement, the promised goods and services are deemed to not be distinct from each other and we have concluded that these contracts,promised goods and services are a single, combined performance obligation.
Judgment is required to determine the SSP for each performance obligation. We rarely sell eFPGA intellectual property licenses on a standalone basis. Generally, we accountprovide eFPGA-related professional services to customers based on unique contractual arrangement terms and conditions and unique deliverables in conjunction with other performance obligations. As such, we are required to estimate the SSP for each performance obligation. In instances where the SSP is not directly observable because we do not sell the promised goods or services separately, we determine the SSP using information that may include market conditions and other observable inputs. We typically have more than one SSP for individual performance obligations separately if they are distinct. The transaction price is allocateddue to the separate performance obligations on a relative standalone selling price basis. We determine the standalone selling prices based onstratification of those items by classes of customers and circumstances. In these instances, we may use information such as our overall pricing objectives, taking into consideration market conditions and other factors, including the value of our contracts, type of the customer, customer tier, type of the technology used, customer demographics, geographic locations, and other factors. When contractual agreements contain multiple performance obligations, we account for individual performance obligations separately if they are distinct. We allocate the transaction price to the separate performance obligations based on their relative SSP. We also provide eFPGA-related professional services on a time-and-material basis.
We recognize revenue on contracts with customers with a single performance obligation to transfer eFPGA intellectual property when we transfer control of the eFPGA intellectual property to the customer, which is generally upon product delivery to the customer assuming all other criteria for revenue recognition have been met.
When we satisfy contractual performance obligations over time, we generally recognize eFPGA IP revenue by applying a methodology of recognizing revenue that provides a faithful depiction of the transfer of the contractual arrangement's deliverables to the customer. The Company generally applies an over-time methodology that reflects a generally consistent effort to satisfy those performance obligations throughout the contractual arrangement term. Other over-time methods used include an input method of units of labor consumed and materials cost, and an over-time output method of specific deliverables produced or delivered. Inputs using units of labor consumed and material costs are fully burdened overhead rate for the labor and any materials required.
Due to the nature of the work performed in contractual arrangements, the estimation of the over-time model is complex and involves significant judgment. In the case of the input methods, the key factors reviewed by management to estimate costs to complete each contract is the estimated labor days-effort necessary to complete the project, budgeted hours, hourly cost to us, profit margins, and engineering hours at cut-off when projects extend beyond a reporting period. In the case of the output method, key factors reviewed by us are the specific deliverables specified in the contracts with customers. We have methods and controls in place for tracking labor-days incurred in completing customization and other professional services as well as quantifying changes in estimates.
In the year ended January 2, 2022, we recognized revenue from a contract with an unaffiliated customer on the sale of eFPGA IP. The eFPGA IP included an eFPGA intellectual property license, know-how and eFPGA-related professional services. Consideration was comprised of cash and non-cash shares of common stock in the customer. The customer was a privately-held company and its common stock was not publicly traded. We applied significant judgement to estimate the fair value of the shares as a portion of the total contractual consideration. Inputs used to estimate the fair value of the common stock included the selection of a publicly traded peer company group, the estimated volatility of the equity based on the peer group, the discount rate, an estimate of a discount due to lack of marketability, and an estimated lead time for a hypothetical sale of the investment. We recognized a $0.3 million non-marketable equity investment on the consolidated balance sheet and a corresponding amount in deferred revenue. At January 1, 2023, the end of the Company’s Fiscal 2022 Year, the Company had determined that there were no indicators of impairment or changes in circumstances that would cause a revaluation or changes in the investment’s estimated fair value.
We recognized eFPGA IP revenue of approximately $7.5 million, or 47% of total revenue, $2.7 million, or 21% of total revenue, and $0.2 million, or 3% of total revenue, in the Fiscal Years ended January 1, 2023, January 2, 2022, and January 3, 2021, respectively.
SaaS & Other Revenue is comprised primarily of Software as a Service Revenue, or("SaaS") revenue, software-related professional services revenue, and royalties from licensing our technology. SaaS Revenue
Software products that are offeredrevenue is generated when we license our software to customers and allow customers to access the software over a short-term subscription basis. We grant customers with athe right to access and use software at the hosted software overoutset of the contract period without takingarrangement and throughout the possessionentire term of it are billed on a subscription basis. Revenue that are billed on a subscription basis is recognizedthe arrangement. We recognize SaaS revenue ratably over the contract period.
Maintenance Revenue
We recognizelicense term and software-related professional services revenue from maintenance ratably overas services are provided to the term of the underlying maintenance contract term. Renewals of maintenance contracts create new performance obligations that are satisfied over the term with the revenues recognized ratably over the term.
Royalty Revenue
customer. We recognize royalty revenue whenon the later of (i) the following events occurs: a) The subsequent sale or usage, occurs; b) Theor (ii) satisfaction of a performance obligation to which some or all of the sales-based royalty has been allocated has been
We recognized SaaS and Other Revenue of approximately $0.4 million, or 2% of total revenue, $0.2 million, or 1% of total revenue, and $0.2 million, or 2% of total revenue, in the Fiscal Years ended January 1, 2023, January 2, 2022, and January 3, 2021, respectively.
Deferred Revenue
Receivables Balances in contract assets are transferred to accounts receivable when we have an unconditional right to invoice the customer. Balances in contract liabilities (deferred revenue) are recognized in the period we ship the product. Payment terms on invoiced amounts are based on contractual terms with each customer. When we receive consideration, or such consideration is
unconditionally due, prior to transferring goods or services to the customer under the terms of a sales contract, we record deferredas revenue which represents a contract liability. We recognize deferred revenue as net sales once control of goods and/orand services havehas been transferred to the customer and all revenue recognition criteria have been met and any constraints have been resolved. We defer the product costs until recognition of the related revenue occurs.is recognized.
Assets Recognized from Costs to Obtain a Contract with a Customer
We recognize an asset for the incremental costs of obtainingobtaining a contract with a customer if we expect the benefit of those costs to be longer than one year. We have concluded that none of the costs we have incurred to obtain and fulfill our FASB Accounting StandardsStandard Codification or ASC,("ASC"), 606 contracts meet the capitalization criteria, and as such, there are no costs deferred and recognized as assets on the consolidated balance sheetsheets at December 29, 2019.January 1, 2023 and January 2, 2022.
|
|
|
|
|
• Taxes collected from customers and remitted to government authorities and that are related to the sales of our products are excluded from revenues. • Sales commissions are expensed when incurred because the amortization period would have been one year or less. These costs are recorded in selling, general and administrative expense in the consolidated statements of operations. • We do not disclose the value of unsatisfied performance obligations for (i) contracts with original expected lengths of one year or less or (ii) contracts for which we recognize revenue at the amount to which we have the right to invoice |
We record allowance for sales returns. Amounts recorded for sales returns for the year ended December 29, 2019 and December 30, 2018 were $60,000 and $156,000, respectively.services performed.
Revenue Recognition Prior to the Adoption of ASC Topic No. 606 on January 1, 2018
We supply standard products which must be programmed before they can be used in an application. The Company's products may be programmed by us, distributors, end-customers or third parties.
We recognize revenue as products are shipped if evidence of an arrangement exists, delivery has occurred, the sales price is fixed or determinable, collection of the resulting receivable is reasonably assured and product returns are reasonably estimable. Revenue is recognized upon shipment of programmed and unprogrammed parts to both OEM customers and distributors, provided that legal title and risk of ownership have transferred. Parts held by distributors may be returned for quality reasons only under its standard warranty policy. We record allowance for sales returns.
We account for our IP license revenues and related services in accordance with ASC No. 985-605, Software Revenue Recognition. Revenues are recognized when persuasive evidence of an arrangement exists and no further obligation exists, delivery has occurred, the license fee is fixed or determinable, and collection is reasonably assured. A license may be perpetual or time limited in its application. Our IP license agreement contains multiple elements including post-contract customer support. For multiple element arrangements involving software and other software-related deliverables, vendor-specific objective evidence of fair value, or VSOE, must exist to allocate the total fee among all delivered and non-essential undelivered elements of the arrangement. If undelivered elements of the arrangement are essential to the functionality of the product, revenue is deferred until the essential elements are delivered. If VSOE does not exist for one or more non-essential undelivered elements, revenue is deferred until such evidence exists for the undelivered elements, or until all elements are delivered, whichever is earlier. VSOE of each element is based on historical evidence of stand-alone sales of these elements to third parties including substantive renewal rate as stated in the agreement. When VSOE does not exist for undelivered items, the entire arrangement fee is recognized ratably over the performance period.
We record all costs associated with its product sales in cost of revenue. These costs include the cost of materials, contract manufacturing fees, shipping costs and quality assurance. Cost of revenue also includes indirect costs such as warranty, excess and obsolete inventory charges, general overhead costs and depreciation.
Valuation of Inventories
Inventories are stated at the lower of standard cost or net realizable value. Standard cost approximates actual cost on a first-in, first-out basis. We routinely evaluate quantities and values of our inventories in light of current market conditions and market trends and record reserves for quantities in excess of demand and product obsolescence. The evaluation may take into consideration historic usage, expected demand, anticipated sales price, the stage in the product life cycle of our customers’ products, new product development schedules, the effect new products might have on the sale of existing products, product obsolescence, customer design activity, customer concentrations, product merchantability and other factors. Market conditions are subject to change. Actual consumption of inventories could differ from forecasted demand and this difference could have a material impact on our gross margin and inventory balances based on additional provisions for excess or obsolete inventories or a benefit from inventories previously written down. We also regularly review the cost of inventories against estimated market value and record a lower of cost or market reserve for inventories that have a cost in excess of estimated market value, which could have a material impact on our gross margin and inventory balances based on additional write-downs to net realizable value or a benefit from inventories previously written down.
Our semiconductorhardware products have historically had an unusually long product life cycle and obsolescence has not been a significant factor in the valuation of inventories. However, as we pursue opportunities in the mobileIoT market and continue to develop new products, we believe our new product life cycle willmay be shorter, which could increase the potential for obsolescence. A significant decrease in demand could result in an increase in excess inventory on hand. Although we make every effort to ensure the accuracy of our forecasts of future product demand, any significant unanticipated changes in demand or frequent new product developments could have a significant impact on the value of our inventory and our results of operations.
Leases
The Company adopted Accounting Standards Update, or ASU, No. 2016-02, Leases (Topic 842) and related ASUs, which provide supplementary guidance and clarifications on December 31, 2018, utilizing the modified retrospective transition method through a cumulative-effect adjustment at the beginning of the first quarter of 2019. Additionally, the Company elected the practical expedient approach and did not reassess whether any contracts that existed prior to adoption have or contain leases or the classification of our existing leases.
Under Topic 842, all significant lease arrangements are generally recognized at lease commencement. Operating lease right-of-use, or ROU, assets and lease liabilities are recognized at the commencement date. A ROU asset and corresponding lease liability is not recorded for leases with an initial term of 12 months or less (short term leases) and the Company recognizes lease expense for these leases as incurred over the lease term.
ROU assets represent the Company’s right to use an underlying asset during the reasonably certain lease terms and lease liabilities represent the Company’s obligation to make lease payments arising from the lease. The Company’s lease terms may include options to extend or terminate the lease when it is reasonably certain that we will exercise that option. Operating lease ROU assets and liabilities are recognized at commencement date based on the present value of lease payments over the lease term. The Company primarily uses its incremental borrowing rate, based on the information available at commencement date, in determining the present value of lease payments. The operating lease ROU asset also includes any lease payments related to initial direct cost and prepayments and excludes lease incentives. Lease expense is recognized on a straight-line basis over the lease term. The Company has lease agreements with lease and non-lease components, which are generally accounted for separately.
In accordance with ASU No. 2016-02, the Company recognized right-of-use assets of approximately $975,000 and lease liabilities of approximately $939,000 on the Company’s Consolidated Balance Sheet as of
March 31, 2019, with no material impact to its Consolidated Statements of Operations. As of December 29, 2019, the Company’s right-of-use assets was approximately $2.4 million and lease liability was approximately $2.3 million as presented on the Company’s Consolidated Balance Sheet.
Business Combinations
The Company recognizes assets acquired (including goodwill and identifiable intangible assets) and liabilities assumed at fair value on the acquisition date. Subsequent changes to the fair value of such assets acquired and liabilities assumed are recognized in earnings, after the expiration of the measurement period, a period not to exceed 12 months from the acquisition date. Acquisition-related expenses and acquisition-related restructuring costs are recognized in earnings in the period in which they are incurred.
Goodwill and Intangible Assets
Goodwill represents the excess fair value of consideration transferred over the fair value of net assets acquired in business combinations. The carrying value of goodwill and indefinite lived intangible assets are not amortized, but are annually tested for impairment and more often if there is an indicator of impairment.
Intangible assets with finite useful lives are amortized on a straight-line basis over the periods benefited. The Company reviews the recoverability of its long-lived assets when events or changes in circumstances occur that indicate that the carrying value of the asset or asset group may not be recoverable. The assessment of possible impairment is based on the Company's ability to recover the carrying value of the asset or asset group from the expected future pre-tax cash flows (undiscounted and without interest charges) of the related operations. If these cash flows are less than the carrying value of such asset, an impairment loss is recognized for the difference between estimated fair value and carrying value. The measurement of impairment requires management to estimate future cash flows and the fair value of long-lived assets.
Valuation of Long-Lived Assets
We assess annually whether the value of identifiable long-lived assets, including property and equipment, have been impaired and when events or changes in circumstances indicate that the carrying value of an asset or asset group may not be recoverable. Our assessment of possible impairment is based on our ability to recover the carrying value of an asset or asset group from their expected future pre-tax cash flows, undiscounted and without interest charges, of the related operations. If these cash flows are less than the carrying value of the asset or asset group, we recognize an impairment loss for the difference between estimated fair value and carrying value, and the carrying value of the related assets is reduced by this difference. The measurement of impairment requires management to estimate future cash flows and the fair value of long-lived assets. Based on this analysis, there are no significant impairments to our long-lived assets.
Measurement of Stock-Based Compensation
We account for stock-based compensation under the provisions of the amended authoritative guidance and related interpretations, which require the measurement and recognition of expense related to the fair value of stock-based compensation awards. The fair value of stock-based compensation awards is measured at the grant date and re-measured upon modification, as appropriate. Determining the appropriate fair value model and calculating the fair value of stock-based awards at the date of grant require judgment.
We use the Black-Scholes option pricing model to estimate the fair value of employee stock options and rights to purchase shares under our 2019 Stock Plan, 2009 Stock Plan and 2009 Employee Stock Purchase Plan, or ESPP, consistent with the provisions of the amended authoritative guidance. This fair value is expensed on a straight-line basis over the requisite service period of the award. Using the Black-Scholes pricing model requires us to develop highly subjective assumptions, including the expected term of awards, expected volatility of our stock, expected risk-free interest rate and expected dividend rate over the term of the award. Our expected term of awards is based primarily on our historical experience with similar grants. Our expected stock price volatility for both stock options and ESPP shares is based on the historic volatility of our stock, using the daily average of the opening and closing prices and measured using historical data appropriate for the expected term. The risk-free interest rate assumption approximates the risk-free interest rate of a Treasury Constant Maturity bond with a maturity approximately equal to the expected term of the stock option or ESPP shares.
In addition to the assumptions used in the Black-Scholes pricing model, the amended authoritative guidance requires that we recognize compensation expense only for awards ultimately expected to vest; therefore, we are required to develop an estimate of the historical pre-vest forfeiture experience and apply this to all stock-based awards. The fair value of restricted stock awards, or RSAs, and restricted stock units, or RSUs, is based on the closing price of our common stock on the date of grant. RSA and RSU awards which vest with service are expensed over the requisite service period. RSAs and RSU awards that are expected to vest based on the achievement of a performance goal are expensed over the estimated vesting period. We regularly review the assumptions used to compute the fair value of our stock-based awards and we revise our assumptions as appropriate. In the event that assumptions used to compute the fair value of our stock-based awards are later determined to be inaccurate or if we change our assumptions significantly in future periods, stock-based compensation expense and our results of operations could be materially impacted. See Note 13 to the Consolidated Financial Statements.
Accounting for Income Taxes
As part of the process of preparing our financial statements, we are required to estimate our income taxes in each of the jurisdictions in which we operate. This process involves estimating our actual current tax exposure together with assessing temporary differences resulting from different tax and accounting treatment of items, such as deferred revenue, allowance for doubtful accounts, the impact of equity awards, depreciation and amortization, and employee-related accruals. These differences result in deferred tax assets and liabilities, which are included on our balance sheets. We must then assess the likelihood that our deferred tax assets will be recovered from future taxable income. To the extent we believe that recovery is not likely, we must establish a valuation allowance. To the extent we establish a valuation allowance or increase this allowance in a period, we must include an expense within the tax provision in the statements of operations.
Significant management judgment is required in determining our provision for income taxes, deferred tax assets, liabilities and any valuation allowance recorded against our net deferred tax assets. Our deferred tax assets, consisting primarily of net operating loss carryforwards, depreciation and amortization, amounted to $58.0 million, tax effected, as of the end of 2019. In evaluating our ability to recover our deferred tax assets within the jurisdiction from which they arise, we consider all available positive and negative evidence, including scheduled reversals of deferred tax liabilities, uncertainty of projecting future taxable income and results of recent operations. As of December 29, 2019, we had federal and state income tax net operating loss, or NOL, carryforwards of approximately $168.7 million and $75.4 million, respectively, which will expire at various dates from 2020 through 2038. Federal NOL generated in 2019 can be carried forward indefinitely. We had research credit carryforwards of approximately $4.0 million for federal and $4.4 million for state income tax purposes as of December 29, 2019. If not utilized, the federal carryforwards will expire at various dates from 2020. The California credit can be carried forward indefinitely. We believe that it is more likely than not that the deferred tax assets and benefits from these federal and state NOL and credit carryforwards will not be realized. In recognition of this risk, we have recorded a valuation allowance of $58.0 million, tax-effected, as of the end of 2019, due to uncertainties related to our ability to utilize our U.S. deferred tax assets before they expire.
The following table sets forth the percentage of revenue for certain items in our statements of operations for the periods indicated:
|
| Fiscal Years |
| Fiscal Years | ||||||||||||||||||||
|
| 2019 |
|
| 2018 |
|
| 2017 |
| 2022 | 2021 | 2020 | ||||||||||||
Statements of Operations: |
|
|
|
|
|
|
|
|
|
|
|
| ||||||||||||
Revenue |
|
| 100 | % |
|
| 100 | % |
|
| 100 | % | 100 | % | 100 | % | 100 | % | ||||||
Cost of revenue |
|
| 43 | % |
|
| 50 | % |
|
| 55 | % | 46 | % | 42 | % | 51 | % | ||||||
Gross profit |
|
| 57 | % |
|
| 50 | % |
|
| 45 | % | 54 | % | 58 | % | 49 | % | ||||||
Operating expenses: |
|
|
|
|
|
|
|
|
|
|
|
| ||||||||||||
Research and development |
|
| 120 | % |
|
| 79 | % |
|
| 79 | % | 31 | % | 55 | % | 87 | % | ||||||
Selling, general and administrative |
|
| 86 | % |
|
| 79 | % |
|
| 81 | % | 46 | % | 63 | % | 79 | % | ||||||
Restructuring costs | — | % | — | % | 9 | % | ||||||||||||||||||
Loss from operations |
|
| (149 | )% |
|
| (108 | )% |
|
| (115 | )% | (23 | )% | (59 | )% | (126 | )% | ||||||
Interest expense |
|
| (3 | )% |
|
| (1 | )% |
|
| (1 | )% | (1 | )% | (1 | )% | (4 | )% | ||||||
Interest income and other expense, net |
|
| 2 | % |
|
| 1 | % |
|
| — | % | ||||||||||||
Gain on forgiveness of PPP Loan | — | % | 9 | % | — | % | ||||||||||||||||||
Interest income and other (expense) income, net | (2 | )% | — | % | 1 | % | ||||||||||||||||||
Loss before income taxes |
|
| (150 | )% |
|
| (108 | )% |
|
| (116 | )% | (26 | )% | (51 | )% | (129 | )% | ||||||
Provision for income taxes |
|
| 1 | % |
|
| 1 | % |
|
| 1 | % | — | % | 1 | % | 1 | % | ||||||
Net loss |
|
| (151 | )% |
|
| (109 | )% |
|
| (117 | )% | (26 | )% | (52 | )% | (130 | )% | ||||||
Impact of inflation and product price changes on our revenue and on income was immaterial in 2019, 2018 and 2017.
ComparisonComparison of Fiscal Years 20192022 and 20182021
Revenue. The table below sets forth the changes in revenue for fiscal yearFiscal Year ended December 29, 2019, asJanuary 1, 2023, compared to fiscal yearFiscal Year ended December 30, 2018January 2, 2022 (in thousands, except percentage data):
Fiscal Years | ||||||||||||||||||||||||
2022 | 2021 | Year-Over-Year Change | ||||||||||||||||||||||
| Amount | % of Total Revenues | Amount | % of Total Revenues | Amount | Percentage | |||||||||||||||||||
New products | $ | 11,675 | 72 | % | $ | 7,761 | 61 | % | $ | 3,914 | 50 | % | ||||||||||||
Mature products | 4,505 | 28 | % | 4,924 | 39 | % | (419 | ) | (9 | )% | ||||||||||||||
Total revenue | $ | 16,180 | 100 | % | $ | 12,685 | 100 | % | $ | 3,495 | 28 | % | ||||||||||||
New products revenue consists of revenues from the sale of hardware products manufactured on 180 nanometer or smaller semiconductor processes, eFPGA IP license, professional services, QuickAI and SensiML AI software as a service (SaaS) revenues. Mature products include all products produced on semiconductor processes larger than 180 nanometer.
|
| Fiscal Years |
|
|
|
|
|
|
|
|
| |||||||||||||
| 2019 |
|
| 2018 |
|
|
|
|
|
|
|
|
| |||||||||||
|
| Amount |
|
| % of Total Revenues |
|
| Amount |
|
| % of Total Revenues |
|
| Year-Over-Year Change |
| |||||||||
Revenue by product family (1): |
|
|
|
|
|
|
|
|
|
|
|
|
|
|
|
|
|
|
|
|
|
|
|
|
New products |
| $ | 3,123 |
|
|
| 30 | % |
| $ | 5,735 |
|
|
| 45 | % |
| $ | (2,612 | ) |
|
| (46 | )% |
Mature products |
|
| 7,187 |
|
|
| 70 | % |
|
| 6,894 |
|
|
| 55 | % |
|
| 293 |
|
|
| 4 | % |
Total revenue |
| $ | 10,310 |
|
|
| 100 | % |
| $ | 12,629 |
|
|
| 100 | % |
| $ | (2,319 | ) |
|
| (18 | )% |
|
|
Total revenue increased approximately $3.5 million, or 28% in Fiscal Year ended January 1, 2023 as compared to the Fiscal Year ended January 2, 2022. The 46% decreaseincrease in product revenue was comprised of an increase of $3.9 million in new product revenue partially offset by a decrease of $0.4 million in 2019mature product revenue.
New Products Revenue. The table below sets forth the changes in new products revenue for Fiscal Year ended January 1, 2023, compared to Fiscal Year ended January 2, 2022 (in thousands, except percentage data):
Fiscal Years | ||||||||||||||||||||||||
2022 | 2021 | Year-Over-Year Change | ||||||||||||||||||||||
| Amount | % of Total Revenues | Amount | % of Total Revenues | Amount | Percentage | |||||||||||||||||||
Hardware products | $ | 3,757 | 23 | % | $ | 4,903 | 39 | % | $ | (1,146 | ) | (23 | )% | |||||||||||
eFPGA IP | 7,545 | 47 | % | 2,674 | 21 | % | 4,871 | 182 | % | |||||||||||||||
SaaS & Other | 373 | 2 | % | 184 | 1 | % | 189 | 103 | % | |||||||||||||||
Total new products revenue | $ | 11,675 | 72 | % | $ | 7,761 | 61 | % | $ | 3,914 | 50 | % | ||||||||||||
The increase in new product revenue was primarily duedriven by eFPGA IP revenue and also SaaS & Other revenue, partially offset by a decrease in new hardware product revenue. eFPGA IP revenue is primarily comprised of eFPGA intellectual property license revenue and eFPGA-related professional services revenue. eFPGA IP revenue increased approximately $4.9 million, or 182%, as compared to lower sales from Display Bridge Solution,the Fiscal Year ended January 2, 2022. The increase in eFPGA licenseIP revenue was comprised of $5.9 million in eFPGA-related professional services revenue, partially offset by $1.0 million in eFPGA revenue on the sale of intellectual property licenses during the prior Fiscal Year. SaaS & Other revenue increased approximately $0.2 million, or 103% as compared to the Fiscal Year ended January 2, 2022. The increase in SaaS & Other revenue was primarily driven by software-related professional services revenue partially offset by a decrease in SaaS-related revenue. New hardware revenue decreased by approximately $1.1 million, or 23%, in the Fiscal Year ended January 1, 2023 compared to the Fiscal Year endedJanuary 2, 2022. The decrease in new hardware product revenue was primarily comprised of a reduction of $1.9 million in sensor product revenue and $0.1 million in connectivity product which wasrevenue, partially offset by an increase of $0.9 million in AI SaaSdisplay product revenue. The increase in mature product
Contract liabilities (deferred revenue) associated with eFPGA-related professional services revenue was due primarily to increased orders from our customers$0 and $0.3 million and were included in deferred revenue on the defense, aerospace, testconsolidated balance sheets as of January 1, 2023 and instrumentation sectors.January 2, 2022, respectively. Contract assets associated with eFPGA-related professional services revenue was $2.0 million and $0.3 million on the consolidated balance sheets as of January 1, 2023 and January 2, 2022, respectively.
Gross Profit. The table below sets forth the changes in gross profit for fiscal yearFiscal Year ended December 29, 2019, asJanuary 1, 2023, compared to fiscal yearFiscal Year ended December 30, 2018January 2, 2022 (in thousands, except percentage data):
Fiscal Years | ||||||||||||||||||||||||
2022 | 2021 | Year-Over-Year Change | ||||||||||||||||||||||
| Amount | % of Total Revenues | Amount | % of Total Revenues | Amount | Percentage | |||||||||||||||||||
Revenue | $ | 16,180 | 100 | % | $ | 12,685 | 100 | % | $ | 3,495 | 28 | % | ||||||||||||
Cost of revenue | 7,378 | 46 | % | 5,266 | 42 | % | 2,112 | 40 | % | |||||||||||||||
Gross profit | $ | 8,802 | 54 | % | $ | 7,419 | 58 | % | $ | 1,383 | 19 | % | ||||||||||||
|
| Fiscal Years |
|
|
|
|
|
|
|
|
| |||||||||||||
|
| 2019 |
|
| 2018 |
|
|
|
|
|
|
|
|
| ||||||||||
|
| Amount |
|
| % of Total Revenues |
|
| Amount |
|
| % of Total Revenues |
|
| Year-Over-Year Change |
| |||||||||
Revenue |
| $ | 10,310 |
|
|
| 100 | % |
| $ | 12,629 |
|
|
| 100 | % |
| $ | (2,319 | ) |
|
| (18 | )% |
Cost of revenue |
|
| 4,405 |
|
|
| 43 | % |
|
| 6,295 |
|
|
| 50 | % |
|
| (1,890 | ) |
|
| (30 | )% |
Gross profit |
| $ | 5,905 |
|
|
| 57 | % |
| $ | 6,334 |
|
|
| 50 | % |
| $ | (429 | ) |
|
| (7 | )% |
The $1.4 million increase in gross profit and 19% increase in gross profit percentage was primarilysubstantially due to (i)revenue growth of eFPGA IP professional services revenue, partially offset by prior year eFPGA intellectual property license revenue with minimal associated cost. The slight decrease in gross margin year-over-year was due to product and customer mix and (ii) additional SaaS revenue in 2019. In 2019, mature product revenue was 70% of total revenue compared to 55% in the prior year. Mature product revenue increased by 4% compared to 2018.year which had more IP licensing with lower cost of sales. The sale of inventories that were previously written-off was $121,000approximately $0.2 million and $218,000$0.1 million in 2019Fiscal Years 2022 and 2018,2021, respectively. Inventory written-downThe Company recognized approximately $0.2 million in 2019 was $94,000inventory reserves in Fiscal Years 2022 and 2021.
Gross profit in Fiscal Year 2022 compared to $386,000Fiscal Year 2021 increased approximately $1.4 million, or 19%. The change gross profit reflects an increase in 2018.revenue of $3.5 million, or 28%, partially offset by an increase in cost of revenue of $2.1 million, or 40%. The increase in revenue was driven by a $3.9 million increase in new products revenue, partially offset by a $0.4 million decrease in mature products revenue. The $2.1 million increase in cost of revenue was comprised of $3.7 million in costs in support of eFPGA-related professional services revenue, partially offset by a reduction in hardware product costs primarily due to the lower volume of products sold. The higher eFPGA-related professional services costs were comprised of increased professional services costs, subcontractor costs, overhead-burdened labor costs allocated from research and development expenses, and higher tooling costs on eFPGA IP revenue projects. These costs were partially offset by a reduction in hardware product costs due primarily due to the lower volume of products sold.
In Fiscal Years 2022 and 2021, the Company capitalized costs associated with internal-use software of approximately $0.7 million and $0.5 million, respectively. For Fiscal Years 2022 and 2021, the Company recognized $0.4 million and $0.3 million, respectively in amortization expense of internal-use software in cost of revenues on its consolidated statements of operations.
Our semiconductorhardware products have historically had a long product life cycle and obsolescence has not been a significant factor in the valuation of inventories. However, as we pursue opportunities in the mobileIoT market and continue to develop new CSSPs and products, we believe our product life cycle willmay be shorter, which will increase the potential for obsolescence. In general, our standard manufacturing lead times are longer than the binding forecasts we receive from customers.
Operating Expenses. The table below sets forth the changes in operating expenses for fiscal yearFiscal Year ended December 29, 2019, asJanuary 1, 2023 compared to fiscal yearFiscal Year ended December 30, 2018January 2, 2022 (in thousands, except percentage data):
|
| Fiscal Years |
|
|
|
|
|
|
|
|
| |||||||||||||
| 2019 |
|
| 2018 |
|
|
|
|
|
|
|
|
| |||||||||||
|
| Amount |
|
| % of Total Revenues |
|
| Amount |
|
| % of Total Revenues |
|
| Year-Over-Year Change |
| |||||||||
R&D expenses |
| $ | 12,350 |
|
|
| 120 | % |
| $ | 9,948 |
|
|
| 79 | % |
| $ | 2,402 |
|
|
| 24 | % |
SG&A expenses |
|
| 8,918 |
|
|
| 86 | % |
|
| 9,982 |
|
|
| 79 | % |
|
| (1,064 | ) |
|
| (11 | )% |
Total operating expenses |
| $ | 21,268 |
|
|
| (206 | )% |
| $ | 19,930 |
|
|
| 158 | % |
| $ | 1,338 |
|
|
| 7 | % |
Fiscal Years | ||||||||||||||||||||||||
2022 | 2021 | Year-Over-Year Change | ||||||||||||||||||||||
| Amount | % of Total Revenues | Amount | % of Total Revenues | Amount | Percentage | |||||||||||||||||||
Research and development | $ | 5,001 | 31 | % | $ | 6,927 | 55 | % | $ | (1,926 | ) | (28 | )% | |||||||||||
Selling, general and administrative | 7,601 | 47 | % | 8,008 | 63 | % | (407 | ) | (5 | )% | ||||||||||||||
Total operating expenses | $ | 12,602 | 78 | % | $ | 14,935 | 118 | % | $ | (2,333 | ) | (16 | )% | |||||||||||
Research and Development Expenses. Our research and development or ("R&D,&D") expenses consist primarily of personnel, overhead and other costs associated with System on Chip (SoC)("SoC") and software development, programmable logic design, AI and eFPGA development. R&D expenses were $12.4$5.0 million and $9.9$6.9 million in 2019Fiscal Years 2022 and 2018,Fiscal 2021, respectively, which represented 120%31% and 79%55%, respectively, of revenue for those periods. The $2.4$1.9 million increasedecrease in R&D expenses in 2019Fiscal Year 2022 as compared to 2018 is partiallyFiscal Year 2021 was primarily attributable to the expandedoverhead-burdened labor costs allocated from R&D operations fromto cost of revenue in support of eFPGA-related professional services revenue, a reduction in consulting costs and in stock-based compensation costs, and a reduction in other allocations, partially offset by increased other outside services costs. R&D costs allocable to cost of revenues are included in cost of revenue in the acquisitionconsolidated statements of SensiML and new SoC software team in San Diego. In 2019, the Company capitalized costs of $365,000 associated with internal-use software.operations.
Selling, General and Administrative Expenses. Our selling, general and administrative or ("SG&A,&A") expenses consist primarily of personnel and related overhead costs for sales, marketing, finance, administration, human resources and general management. SG&A expenses were $8.9$7.6 million and $10$8.0 million in 2019Fiscal Years 2022 and 2018,2021, respectively, which represented 86%47% and 79%63%, respectively, of revenue for those periods. The $1.0$0.4 million decrease in SG&A expenses in 2019Fiscal Year 2022 as compared to 2018 isFiscal Year 2021 was primarily attributable to cost savings from new headquarter facilitya reduction in consulting costs, stock-based compensation costs and outside services.legal expenses, partially offset by an increase in salaries and accounting and audit expenses.
Interest Expense, andGain on Forgiveness of Debt, Interest Income and Other Expense, net
(Expense) Income, net. The table below sets forth the changes in interest expense, andgain on forgiveness of debt, interest income and other expense,(expense) income, net, for the fiscal yearFiscal Year ended December 29, 2019,January 1, 2023, as compared to fiscal yearFiscal Year ended December 30, 2018January 2, 2022 (in thousands, except percentage data):
|
| Fiscal Years |
|
| Year-Over-Year Change |
| Fiscal Years | Year-Over-Year Change | ||||||||||||||||||||||||
|
| 2019 |
|
| 2018 |
|
| Amount |
|
| Percentage |
| 2022 | 2021 | Amount | Percentage | ||||||||||||||||
Interest expense |
| $ | (350 | ) |
| $ | (108 | ) |
| $ | (242 | ) |
|
| 224 | % | $ | (148 | ) | $ | (130 | ) | $ | (18 | ) | 14 | % | |||||
Interest income and other expense, net |
|
| 189 |
|
|
| 77 |
|
|
| 112 |
|
|
| 145 | % | ||||||||||||||||
|
| $ | (161 | ) |
| $ | (31 | ) |
| $ | (130 | ) |
|
| 419 | % | ||||||||||||||||
Gain on forgiveness of debt | — | 1,192 | (1,192 | ) | (100 | )% | ||||||||||||||||||||||||||
Interest income and other (expense) income, net | (221 | ) | (43 | ) | (178 | ) | 414 | % | ||||||||||||||||||||||||
Total interest expense, gain on forgiveness of debt, and interest income and other (expense) income, net | $ | (369 | ) | $ | 1,019 | $ | (1,388 | ) | (136 | )% | ||||||||||||||||||||||
The $242,000 increase in interestInterest expense was attributablerelates primarily to higherour line of credit balance in 2019 compared to 2018. The $112,000 increase in interestfacility. Interest income and other expenses was attributable(expenses) income, net, relates to increase inthe interest income fromearned on our money market account with Heritage Bank.accounts and foreign exchange gain or losses recorded. In fiscal 2021, the Company's Paycheck Protection Program ("PPP") loan was forgiven under the Federal Government's Coronavirus Aid, Relief, and Economic Security Act enacted on March 27, 2020 ("CARES Act"). As a result, the Company subsequently recognized a gain of approximately $1.2 million on its consolidated statement of operations for Fiscal Year 2021.
Provision for Income Taxes. The table below sets forth the changes in provision for income taxes in the fiscal yearFiscal Year ended December 29, 2019, asJanuary 1, 2023 compared to the fiscal yearFiscal Year ended December 30, 2018January 2, 2022 (in thousands, except percentage data):
Fiscal Years | Year-Over-Year Change | |||||||||||||||
2022 | 2021 | Amount | Percentage | |||||||||||||
Provision for income taxes | $ | 98 | $ | 119 | $ | (21 | ) | (18 | )% | |||||||
|
| Fiscal Years |
|
| Year-Over-Year Change |
| ||||||||||
|
| 2019 |
|
| 2018 |
|
| Amount |
|
| Percentage |
| ||||
(Benefit from)/ income tax provision |
| $ | (80 | ) |
| $ | 152 |
|
| $ | (232 | ) |
|
| (153 | )% |
Income tax benefit for 2019 relates to the deferred tax liability arising from intangible assets acquired from the acquisition of SensiML which offsets and released a portion of the Company's valuation allowance outside of acquisition accounting. The income tax expense for 2018the Fiscal Year 2022 relates primarily to foreign income tax provision for the Company's India entity. Income tax expense for the Fiscal Year 2021 relates primarily to our foreign operations which are cost-plusincome tax provision for the Company's India and UK entities.
As of the end of 2019,Fiscal Year 2022, our ability to utilize our U.S. deferred tax assets in future periods is uncertain and, accordingly, we have recorded a full valuation allowance against the related U.S. deferred tax assets. We will continue to assess the realizability of deferred tax assets in future periods.
Comparison of Fiscal Years 20182021 and 20172020
For discussion related to the results of operations and changes in financial condition for fiscal 2018Fiscal Year 2021 compared to fiscal 2017,Fiscal Year 2020, please refer to “Part II, Item 7. Management’s Discussion and Analysis of Financial Conditions and Results of Operations” in our fiscal 2018Fiscal Year 2021 Form 10-K, as amended, which was originally filed with the SEC on March 15, 2019.22, 2022.
Restructuring
In January 2020, the Company announced a restructuring plan to lower the annual operating expenses. The restructuring plan was approved by the Company’s Board
In conjunction with this restructuring plan, the Company estimates it will incur approximately $500,000 to $600,000 of restructuring expenses, which will result in total cash expenditures of approximately $500,000, with the majority coming in the first quarter of fiscal 2020.
Liquidity and Capital Resources
We have
The Company has historically financed ourits operating losses and capital investments through salesthe sale of its common stock, capitalfinance and operating leases, a revolving line of credit and cash flows provided by operations. The Company also has the ability to draw advances from operations.its revolving facility with Heritage Bank of Commerce ("Heritage Bank"). As of December 29, 2019,January 1, 2023, the Company's principal sources of liquidity consisted of cash, cash equivalents and restricted cash of $21.5$19.2 million, includinginclusive of $15.0 million drawn downin advances from its revolving linefacility.
The Company's principal contractual commitments include purchase obligations, re-payments of credit, or Revolving Facility,advances from its revolving facility, and payments under finance and operating leases. Purchase obligations include amounts that are recorded on the Company's consolidated balance sheets as well as amounts that are not recorded on the Company's consolidated balance sheets. Purchase obligations that are recorded on the Company's consolidated balance sheets are largely comprised of open purchase order commitments to suppliers and to subcontractors. Our risk associated with Heritage Bankthese purchase obligations is limited to the termination liability provisions within those contracts, and as such, we do not believe they represent a material liquidity risk to us. Purchase obligations not recorded on the Company’s consolidated balance sheets represent significant future obligations from eFPGA IP procurement contracts forecasted to meet our extended planning horizon. These obligations are dependent on numerous variables, and are therefore, difficult to predict the amount and timing of Commerce, or Heritage Bank.payments which could differ materially from our estimates.
On September 28, 2018, we entered into a Loan and Security
Credit Agreement or Loan Agreement, with Heritage Bank. The Loan Agreement provided for, among other things, the Revolving Facility, with aggregate commitments of $9,000,000
On December 21, 2018 we, the Company entered into anthe QuickLogic Corporation Heritage Bank of Commerce Amended and Restated Loan and Security Agreement or the Amended and Restated Loan Agreement,(the "Loan Agreement") with Heritage Bank which among other things, provided a revolving facility ("Revolving Facility") allowing the Company to replace in its entiretydraw advances up to $15.0 million. The Revolving Facility includes a number of customary and restrictive financial covenants including maintaining certain minimum cash levels with the Loan Agreement.lender. The Amended and Restated Loan Agreement increasedRevolving Facility bears an annual facility fee of $45 thousand payable each December 31st. Advances under the Revolving Facility from $9,000,000 to $15,000,000. The Amended and Restated Loan Agreement requires the Company to maintaining at least $3,000,000 in unrestricted cash at Heritage Bank.
On November 6, 2019 the Company entered intobear a First Amendment to the Amended and Restated Loan Agreement with Heritage Bank to extend the maturity date of the Revolving Facility for one year through September 28, 2021. Under this amendment, the Revolving Facility advances shall bearvariable annual interest on the outstanding daily balance thereof, at a rate per annum equal to the greater of (i) one half of one percentage point (0.50%) above the Prime Rate, or (ii) five and one half of one percentage points (5.50%).
prime rate. On June 21, 2019,December 31, 2022 the Company closed its underwritten public offering of 1.3and Heritage Bank amended the maturity date for advances under the Revolving Facility to December 31, 2024. On January 1, 2023 and January 2, 2022, the Company had a $15.0 million shares of common stock, $0.001 par value per share at a price of $7.00 per share, which included 171,429 of common stock shares issued pursuant tooutstanding balance on the underwriters’ full exercise of their over-allotment option. The Company received net proceeds from the offering of approximately $8.0 million, net of underwriter’s commission and other offering expenses. See Note 11 to the Consolidated Financial Statements for the details.
We expect to use the net proceeds from this public offering for working capital, to accelerate the development of next generation products and for general corporate purposes.
Over the longer term, we anticipate that the generation of sales from our new product offerings, existing cash and cash equivalents, together with financial resources from our Revolving Facility with Heritage Bankinterest rates of 8.00% and our ability to raise additional capital in the public capital markets will be sufficient to satisfy our operations and capital expenditures. Our Revolving Facility will expire in September 2021 and we expect to renew the Revolving Facility or find an alternative lender prior to the expiration date. Further, any violations of debt covenants may restrict our access to any additional cash draws from the Revolving Facility, and may require our immediate repayment of the outstanding debt amounts. We believe that we will be able to either renew the Revolving Facility or obtain alternative financing on the acceptable terms. We cannot provide any assurance that we will be able to raise additional capital, if required, or that such capital will be available on terms acceptable to us. Our inability to generate sufficient sales from our new product offerings and/or raise additional capital if needed could have a material adverse effect on our operations and financial condition, including our ability to maintain compliance with our lender’s financial covenants.
3.75%, respectively. We were in compliance with all loan covenants under the Amended and Restated Loan Agreement, as amended as of the end of the current reporting period.
Heritage Bank has a first priority security interest in substantially all of the Company’s tangible and intangible assets to secure any outstanding amounts under the Loan Agreement. See Note 6 to the consolidated financial statements for additional information.
Common Stock Offerings
On September 14, 2022 and February 9, 2022, the Company entered into common stock purchase agreements with certain investors for the sale of an aggregate of 487 thousand and 310 thousand shares of common stock, respectively, in registered direct offering direct offerings pursuant to our effective shelf registration statement on Form S-3 (File No. 333-266942 and 333-230352, respectively), resulting in net cash proceeds of approximately $3.2 million and $1.5 million, respectively. Issuance costs related to the September 14, 2022 and the February 9, 2022 offerings were immaterial.
On August 17, 2022, the Company filed a new Registration Statement on Form S-3 with the SEC to replace a previously expired Registration on Form S-3, under which the Company may sell, from time-to-time common stock, preferred stock, depositary shares, warrants, debt securities, and units, individually or as units comprised of one or more of the other securities or a combination thereof. The Company's registration statement became effective on August 26, 2022. The Company's earlier shelf registration, which became effective on March 29, 2019, expired automatically after three years.
On September 22, 2021, the Company entered into a share subscription agreement for the sale of 125 thousand shares of its common stock. On September 30, 2021, the Company entered into a common stock purchase agreement for the sale of 74 thousand shares of its common stock, in a registered direct offering pursuant to our effective shelf registration statement on Form S-3 (File No. 333-230352). The net proceeds to the Company in aggregate, after deducting equity issuance costs of approximately $45 thousand was approximately $1.0 million.
On June 22, 2020, the Company closed an underwritten public offering of 2.5 million shares of common stock which included 142 thousand additional shares pursuant to the underwriters' exercise of their over-allotment option. We received net proceeds from the offering of approximately $8.1 million, net of underwriter's commission and other offering expenses.
At January 1, 2023 warrants exercisable for 386 thousand shares of common stock at an exercise price of $19.32 per share remain outstanding. The warrants are exercisable any time for a period of 60 months from the May 29, 2018 issuance date.
See Note 10 to the consolidated financial statements for additional information.
Paycheck Protection Program
On May 6, 2020, the Company entered into a loan agreement with Heritage Bank for a loan of $1.2 million pursuant to the Paycheck Protection Program ("PPP Loan") under the Coronavirus Aid, Relief, and Economic Security Act enacted on March 27, 2020 ("CARES Act") On June 5, 2020, the President of the United States of America signed into law the Paycheck Protection Flexibility Act (“PPPFA”) to address many concerns expressed by the small business community. As of December 29, 2019,September 27, 2020, we fully utilized the loan proceeds in compliance with PPPFA guidelines. We applied for the full loan forgiveness in the fourth quarter of 2020 and on January 26, 2021 we received a notice from Heritage Bank that principal and interest amounts under the PPP Loan had $15.0 millionbeen forgiven. See Note 6 to the consolidated financial statements for additional information.
Cash Flows
As of December 29, 2019,January 1, 2023, most of our cash and cash equivalents were invested in a Heritage Bank Money Market account. As of December 29, 2019,January 1, 2023, our interest-bearing debt consisted of $471,000$0.9 million outstanding under finance leases. Seeleases and $15.0 million outstanding under our Revolving Facility. See Note 8 to6 to the Consolidated Financial Statementsconsolidated financial statements for details.additional information.
Cash balances held at our foreign subsidiaries were approximately $548,000$0.2 million and $656,000 at December 29, 2019$0.4 million as of January 1, 2023 and December 30, 2018,January 2, 2022, respectively. Earnings from our foreign subsidiaries are currently deemed to be indefinitely reinvested. We do not expect such reinvestment to affect our liquidity and capital resources, and we continually evaluate our liquidity needs and ability to meet global cash requirements as a part of our overall capital deployment strategy. Factors which affect our liquidity, capital resources and global capital deployment strategy include anticipated cash flows, the ability to repatriate cash in a tax efficient manner, funding requirements for operations and investment activities, acquisitions and divestitures and capital market conditions.
In summary, our
Our cash flows were as follows (in thousands):
|
| Fiscal Year |
| |||||||||
|
| 2019 |
|
| 2018 |
|
| 2017 |
| |||
Net cash (used in) operating activities |
| $ | (11,594 | ) |
| $ | (12,638 | ) |
| $ | (12,938 | ) |
Net cash (used in) investing activities |
|
| (921 | ) |
|
| (288 | ) |
|
| (642 | ) |
Net cash provided by financing activities |
|
| 7,600 |
|
|
| 22,862 |
|
|
| 15,237 |
|
Fiscal Year | ||||||||||||
2022 | 2021 | 2020 | ||||||||||
Net cash used in operating activities | $ | (4,056 | ) | $ | (2,859 | ) | $ | (11,594 | ) | |||
Net cash used in investing activities | (814 | ) | (718 | ) | (921 | ) | ||||||
Net cash provided by financing activities | 4,466 | 434 | 7,600 | |||||||||
Net Cash from Operating Activities
In 2019,Fiscal Year 2022, net cash used in operating activities was $11.6$4.1 million, which was primarily due to a net loss of $15.4$4.3 million, adjusted for non-cash charges of $4.3$3.0 million. Non-cash charges primarily consisted primarilyof stock-based compensation expense of $3.1$2.0 million, depreciation and amortization of long-lived assets and certain definite-lived intangible assets of $0.7 million and write-down of inventories of $0.2 million. In addition, changes in working capital accounts used cash of $2.7 million that resulted from an increased use of cash as reflected by increases of $1.7 million each in accounts receivable and in contract assets, inventory of $0.6 million, other assets of $0.3 million, and a reduction in deferred revenue of $0.2 million, partially offset by an increase in accounts payable of $1.9 million. Historically, the Company's cash flow from operating activities represent cash used in operating activities. In fiscal 2022 net cash used in operating activities increased $1.2 million, or 42%, as compared to fiscal 2021 primarily reflecting higher levels of business activity related to the fulfillment of eFPGA-related professional services contracts.
In Fiscal Year 2021, net cash used in operating activities was $2.9 million, which was primarily due to a net loss of $6.6 million, adjusted for non-cash charges of $2.2 million. Non-cash charges primarily consisted of stock-based compensation expense of $2.5 million and depreciation and amortization of long-lived assets and certain definite-lived intangible assets of $1.2$0.6 million. In addition, changes in working capital accounts usedprovided cash of $392,000$3.1 million as a result of a decreasedecreases in accounts receivable $0.3 million, inventory of $0.4 million and other assets of $0.4 million, and increases in accounts payable of $0.4 million and accrued liabilities of $1.5$0.3 million, partially offset by cash inflow from a decrease in inventory of $483,000, a decrease in accounts receivable of $218,000, a decrease in other assets of $229,000 and an increase in deferred revenue of $158,000.$0.4 million.
In 2018, net cash used in operating activities was $12.6 million, and resulted primarily from a net loss of $13.8 million, adjusted for non-cash charges of $3.6 million. These non-cash charges included write-downs of inventories in the amount of $386,000 to reflect excess quantities, depreciation and amortization of our long-lived assets of $1.3 million and stock-based compensation of $1.9 million. In addition, changes in working capital accounts used cash of $2.4 million as a result of an increase in accounts receivable of $1.3 million, an increase in gross inventory of $662,000, and an increase in other assets of $879,000, partially offset by an increase in accrued liabilities of $235,000 and an increase in trade payables of $223,000.
In 2017, net cash used in operating activities was $12.9 million, and resulted primarily from a net loss of $14.1 million, adjusted for non-cash charges of $3.1 million. These non-cash charges included write-downs of inventories in the amount of $232,000 to reflect excess quantities, depreciation and amortization of our long-lived assets of $1.4 million and stock-based compensation of $1.4 million. In addition, changes in working capital accounts used cash of $1.9 million as a result of an increase in accounts receivable of $86,000, an increase in gross inventory of $1.8 million, and a decrease of accounts payable of $145,000, partially offset by an increase in accrued liabilities of $72,000.
Net Cash from Investing Activities
Net cash used for investing activities in 2019Fiscal Year 2022 was $921,000,approximately $0.8 million, which was primarily attributable to the leasehold improvements and computer equipment at the new office premises of $576,000 and capitalization of internal use software of $365,000.$0.7 million, and capital expenditures primarily related to property and equipment of $0.1 million.
Net cash used for investing activities in 2018Fiscal Year 2021 was $288,000,approximately $0.7 million, which was primarily forattributable to the capitalization of internal use software of $0.5 million and capital expenditures primarily related to acquire manufacturingproperty and equipment and software, which was partially offset by proceeds from the sale of old equipment.$0.2 million.
Net cash used for investing activities in 2017 was $642,000, primarily for capital expenditures to acquire manufacturing equipment and software.
Net Cash from Financing Activities
In 2019,Fiscal Year 2022, net cash provided by financing activities was $7.6$4.5 million, primarily attributable to the net proceeds from the issuance of 1.3 million shares of common stock in June 2019. These inflows wereof $4.9 million, partially offset by scheduled repayments of finance lease obligations and tax$0.5 million in payments related to net settlement of stock awards.finance leases.
In 2018,Fiscal Year 2021, net cash provided by financing activities was $22.9$0.4 million, resulting fromprimarily attributable to the additional borrowing of $9.0 million under the line of credit,collective net cash proceeds of $13.9approximately $1.0 million from our common stock offering in May 2018 and proceeds of $676,000 fromrelated to the issuance of approximately 199 thousand shares of common shares to employees under our equity plans. Thesestock sold on September 30, 2021. The proceeds from the share issuances were partially offset by scheduled payments of finance lease obligations and tax$0.6 million in payments related to net settlement of stock awards.finance leases.
In 2017, net cash provided by financing activities was $15.2 million, resulting from the proceeds of $15.2 million from our stock offering in March 2017 and proceeds of $352,000 from the issuance of common shares to employees under our equity plans, net of taxes paid related to net settlement of equity awards of $198,000. These proceeds were partially offset by payments of $344,000 under the terms of our capital software lease obligations.
We requireThe Company requires substantial cash to fund our business. However, we believethe Company believes that ourits existing cash and cash equivalents, together with available financial resources from the Revolving Facilityrevolving facility will be sufficient to satisfy our operations and capital expenditures over the next twelve months. Our Revolving FacilityThe Company's revolving facility will expire in September 2021, and we expect to renew this line of credit or find an alternative lender prior to the expiration date.December 2024. Further, any violations of debt covenants may restrict our access to any additional cash draws from the revolving line of credit and may require our immediate repayment of the outstanding debt amounts. After the next twelve months, ourthe Company's cash requirements will depend on many factors, including ourits level of revenue and gross profit, the market acceptance of ourits existing and new products, the levels at which we maintainit maintains inventories and accounts receivable, costs of securing access to adequate manufacturing capacity, new product development efforts, capital expenditures and the level of our operating expenses. In order to satisfy our longer termthe Company's longer-term liquidity requirements, weit may be required to raise additional equity or debt financing. There can be no assurance that financing will be available at commercially acceptable terms or at all.
Contractual Obligations and Commercial Commitments
The following table summarizes our non-cancelableMaterial Cash Requirements
Material cash requirements from known contractual obligations and commercial commitments as of the end of 2019other obligations and the effect such obligations and commitments are expected to have on ourthe Company's liquidity and cash flows in future fiscal periods (in thousands):periods. The following summarizes the Company's material cash requirements as of January 1, 2023:
|
| Payments Due by Period |
|
|
|
| |||||||||||||
|
| Total |
|
| Less than 1 year |
|
| 1-3 Years |
|
| 4-5 Years |
| More than 5 Years |
| |||||
Contractual cash obligations: |
|
|
|
|
|
|
|
|
|
|
|
|
|
|
|
|
|
|
|
Operating leases |
| $ | 2,040 |
|
| $ | 611 |
|
| $ | 902 |
|
| $ | 527 |
| $ | — |
|
Finance software lease obligations |
|
| 514 |
|
|
| 214 |
|
|
| 300 |
|
|
| — |
|
| — |
|
Wafer purchases (1) |
|
| 57 |
|
|
| 57 |
|
|
| — |
|
|
| — |
|
| — |
|
Other purchase commitments |
|
| 413 |
|
|
| 386 |
|
|
| 27 |
|
|
| — |
|
| — |
|
Total contractual cash obligations |
|
| 3,024 |
|
|
| 1,268 |
|
|
| 1,229 |
|
|
| 527 |
|
| — |
|
Other commercial commitments (2): |
|
|
|
|
|
|
|
|
|
|
|
|
|
|
|
|
|
|
|
Revolving line of credit |
|
| 15,000 |
|
|
| 15,000 |
|
|
| — |
|
|
| — |
|
| — |
|
Total commercial commitments |
|
| 15,000 |
|
|
| 15,000 |
|
|
| — |
|
|
| — |
|
| — |
|
Total contractual obligations and commercial commitments (3) |
| $ | 18,024 |
|
| $ | 16,268 |
|
| $ | 1,229 |
|
| $ | 527 |
|
| — |
|
Payments Due by Period | ||||||||||||||||||||
Total | Less than 1 year | 1-3 Years | 4-5 Years | More than 5 Years | ||||||||||||||||
Operating lease obligations | $ | 527 | $ | 421 | $ | 106 | $ | — | $ | — | ||||||||||
Finance lease obligations | 947 | 491 | 456 | — | — | |||||||||||||||
Revolving Facility (1) | 15,000 | 15,000 | — | — | — | |||||||||||||||
Purchase obligations: | ||||||||||||||||||||
Wafer purchases (2) | 131 | 131 | — | — | — | |||||||||||||||
Other purchase commitments | 5,703 | 5,663 | 40 | — | — | |||||||||||||||
Liability of an estimated amount (3) | 12,918 | 4,232 | 8,686 | — | — | |||||||||||||||
Total material cash requirements | $ | 35,226 | $ | 25,938 | $ | 9,288 | $ | — | $ | — | ||||||||||
(1) |
|
| (2) | Certain wafer manufacturers require us to forecast wafer starts several months in advance. We are committed to take delivery of and pay for a portion of forecasted wafer volume. |
|
|
|
|
Concentration of Suppliers
We depend on a limited number of contract manufacturers, subcontractors, and suppliers for wafer fabrication, assembly, programming and testing of our devices,hardware products, and for the supply of programming equipment. These services are typically provided by one supplier for each of our devices.hardware products. We generally purchase these single or limited source services through standard purchase orders. Because we rely on independent subcontractors to perform these services, we cannot directly control product delivery schedules, costs or quality levels. Our future success also depends on the financial viability of our independent subcontractors. These subcontract manufacturers produce products for other companies, and we must place orders in advance of expected delivery. As a result, we have only a limited ability to react to fluctuations in demand for our products, which could cause us to have an excess or a shortage of inventories of a particular product, and our ability to respond to changes in demand is limited by these suppliers’ ability to provide products with the quantity, quality, cost and timeliness that we require. The decision not to provide these services to us or the inability to supply these services to us, such as in the case of a natural or financial disaster, would have a significant impact on our business. Increased demand from other companies could result in these subcontract manufacturers allocating available capacity to customers that are larger or have long-term
supply contracts in place and we may be unable to obtain adequate foundry and other capacity at acceptable prices, or we may experience delays or interruption in supply. Additionally, volatility of economic, market, social and political conditions in countries where these suppliers operate may be unpredictable and could result in a reduction in product revenue or increase our cost of revenue and could adversely affect our business, financial condition and results of operations.
Off-Balance Sheet Arrangements
We do not maintain any off-balance sheet partnerships, arrangements or other relationships with unconsolidated entities or others, often referred to as structured finance or special purpose entities, which are established forwithin the purposemeaning of facilitating off-balance sheet arrangements or other contractually narrow or limited purposes.Item 303(b) of Regulation S-K.
Recently Issued Accounting Pronouncements
See Note 2 to the Consolidated Financial Statementsconsolidated financial statements for a full description of recent accounting pronouncements, including the expected dates of adoption and estimated effects on financial condition and results of operations, which is incorporated herein by reference.reference herein.
Changes from Prior Periodic Reports
In this Annual Report on Form 10-K, we have revised our disclosures to comply with SEC Release No. 33-10890 “Management’s Discussion and Analysis, Selected Financial Data, Supplementary Financial Information” which became fully effective on August 9, 2021. This release was adopted to simplify and enhance certain financial disclosure requirements in Regulation S-K.
Specifically, the SEC eliminated the requirement for selected financial data, only requiring quarterly disclosure when there are retrospective changes affecting comprehensive income, and amending the matters required to be presented under Management’s Discussion and Analysis. With our adoption of this release, we have eliminated from this document the item discussed above that are no longer required.
ITEM 7A. QUANTITATIVE AND QUALITATIVE DISCLOSURES ABOUT MARKET RISK
Interest Rate Risk
Our exposure to market rate risk for changes in interest rates relates primarily to our investment portfolio and variable rate debt. We do not use derivative financial instruments to manage our interest rate risk. We are averse to principal loss and ensure the safety and preservation of invested funds by limiting default, market risk and reinvestment risk. Our investment portfolio is generally comprised of investments that meet high credit quality standards and have active secondary and resale markets. Since these securities are subject to interest rate risk, they could decline in value if interest rates fluctuate or if the liquidity of the investment portfolio were to change. Due to the short duration and conservative nature of our investment portfolio, we do not anticipate any material loss with respect to our investment portfolio. A 10% change in interest rates during 2019 would have had an immaterial effect on our financial position, results of operations and cash flows.
Foreign Currency Exchange Rate Risk
All of our sales and cost of manufacturing are transacted in U.S. dollars. We conduct a portion of our research and development activities in India and have sales and marketing offices in several locations outside of the United States. We use the U.S. dollar as our functional currency. Most of the costs incurred at these international locations are in local currency. If these local currencies strengthen against the U.S. dollar, our payroll and other local expenses will be higher than we currently anticipate. Since our sales are transacted in U.S. dollars, this negative impact on expenses would not be offset by any positive effect on revenue. Operating expenses denominated in foreign currencies were approximately 19%, 27% and 25% of total operating expenses in 2019, 2018 and 2017, respectively. A majority of these foreign expenses were incurred in India, the United Kingdom, China, Taiwan and Korea. A currency exchange rate fluctuation of 10% would have caused our operating expenses to change by approximately $413,000 in 2019, $528,000 in 2018 and $486,000 in 2017.
Not applicable.
ITEM 8. FINANCIAL STATEMENTS AND SUPPLEMENTARY DATA
INDEX TO CONSOLIDATED FINANCIAL STATEMENTS
Report of Independent RegisteredRegistered Public Accounting Firm
To the StockholdersShareholders and the Board of Directors of
QuickLogic Corporation
OpinionsOpinion on the Financial Statements and Internal Control over Financial Reporting
We have audited the accompanying consolidated balance sheets of QuicklogicQuickLogic Corporation (the “Company”) as of December 29, 2019January 1, 2023 and December 30, 2018,January 2, 2022, the related consolidated statements of operations, stockholders’ equity, and cash flows for each of the three years in the period ended December 29, 2019,January 1, 2023, and the related notes and schedules (collectively referred to as the “consolidated financial statements”). We also have audited the Company’s internal control over financial reporting as of December 29, 2019, based on criteria established in Internal Control - Integrated Framework (2013) issued by the Committee of Sponsoring Organizations of the Treadway Commission (“COSO”).
In our opinion, the consolidated financial statements referred to above present fairly, in all material respects, the consolidated financial position of the Company as of December 29, 2019 January 1, 2023 and December 30, 2018, January 2, 2022, and the consolidated results of its operations and its cash flows for each of the three years in the period ended December 29, 2019,January 1, 2023, in conformity with accounting principles generally accepted in the United States of America. Also in our opinion, the Company maintained, in all material respects, effective internal control over financial reporting as of December 29, 2019, based on criteria established in Internal Control - Integrated Framework (2013) issued by COSO.America
Change in Accounting PrincipleBasis for Opinion
As discussed in Note 2 to theThese consolidated financial statements in 2019are the Company changed its method of accounting for leases due to the adoption of Accounting Standards Codification (“ASC”) Topic No. 842, and in 2018 the Company changed its method for revenue recognition due to the adoption of ASC Topic No. 606.
Basis for Opinions
The Company’s management is responsible for these consolidated financial statements, for maintaining effective internal control over financial reporting, and for its assessmentresponsibility of the effectiveness of internal control over financial reporting, included in the accompanying Management Report on Internal Control over Financial Reporting included in Item 9A.Company’s management. Our responsibility is to express an opinion on the Company’s consolidated financial statements and an opinion on the Company’s internal control over financial reporting based on our audits. We are a public accounting firm registered with the Public Company Accounting Oversight Board (United States) (“PCAOB”) and are required to be independent with respect to the Company in accordance with the U.S. federal securities laws and the applicable rules and regulations of the Securities and Exchange Commission and the PCAOB.
We conducted our audits in accordance with the standards of the PCAOB. Those standards require that we plan and perform the auditsaudit to obtain reasonable assurance about whether the consolidated financial statements are free of material misstatement, whether due to error or fraud, and whether effectivefraud. The Company is not required to have, nor were we engaged to perform, an audit of its internal control over financial reporting. As part of our audits we are required to obtain an understanding of internal control over financial reporting was maintained in all material respects.but not for the purpose of expressing an opinion on the effectiveness of the Company’s internal control over financial reporting. Accordingly, we express no such opinion.
Our audits of the consolidated financial statements included performing procedures to assess the risks of material misstatement of the consolidated financial statements, whether due to error or fraud, and performing procedures to respond to those risks. Such procedures included examining, on a test basis, evidence regarding the amounts and disclosures in the consolidated financial statements. Our audits also included evaluating the accounting principles used and significant estimates made by management, as well as evaluating the overall presentation of the consolidated financial statements. Our audit of internal control over financial reporting included obtaining an understanding of internal control over financial reporting, assessing the risk that a material weakness exists, and testing and evaluating the design and operating effectiveness of internal control based on the assessed risk. Our
audits also included performing such other procedures as we considered necessary in the circumstances. We believe that our audits provide a reasonable basis for our opinions.opinion.
Definition and Limitations of Internal Control Over Financial ReportingCritical Audit Matter
A company’s internal control over financial reportingThe critical audit matter communicated below is a process designed to provide reasonable assurance regardingmatter arising from the reliabilitycurrent period audit of financial reporting and the preparation ofconsolidated financial statements for external purposes in accordance with generally accepted accounting principles. A company’s internal control over financial reporting includes those policies and procedures that (1) pertainwas communicated or required to be communicated to the maintenance of recordsaudit committee and that: (1) relate to accounts or disclosures that in reasonable detail, accurately and fairly reflectare material to the transactions and dispositions of the assets of the company; (2) provide reasonable assurance that transactions are recorded as necessary to permit preparation ofconsolidated financial statements and (2) involved our especially challenging, subjective, or complex judgments. The communication of critical audit matters does not alter in accordance with generally accepted accounting principles,any way our opinion on the consolidated financial statements, taken as a whole, and we are not, by communicating the critical audit matter below, providing separate opinions on the critical audit matter or on the accounts or disclosures to which it relates.
Valuation of Inventories
As described in Notes 1 and 4 to the consolidated financial statements, the Company’s inventories balance was $2.5 million as of January 1, 2023. The Company values its inventories at lower of standard cost or net realizable value. Standard cost approximates actual cost on a first-in, first-out basis. The Company writes down inventory that receiptshas become obsolete, inventory that has a cost basis in excess of its expected net realizable value, and expendituresinventory in excess of expected requirements.
The estimate of excess quantities is subjective and primarily dependent on the company are being made onlyestimates of future demand for a particular product. Changes in accordance with authorizationsassumptions of management and directors of the company; and (3) provide reasonable assurance regarding prevention or timely detection of unauthorized acquisition, use, or disposition of the company’s assets thatproduct demand could have a material effectsignificant impact on the financial statements.amount of write-down recorded. The valuation of inventories requires management to make significant assumptions and subjective judgments about the future salability of the inventory and the value of obsolete and unmarketable inventory. These assumptions include the assessment of market conditions and trends, sales forecasts, historic usage, expected demand, anticipated sales price, the stage in the product life cycle of its customers’ products, new product development schedules, the effect new products might have on the sale of existing products, product obsolescence, customer design activity, customer concentrations, product merchantability and other factors.
BecauseWe identified the valuation of its inherent limitations, internal control over financial reporting may not prevent or detect misstatements. Also, projections of any evaluation of effectiveness to future periods are subject toinventories, in particular the risk that controls may become inadequateestimates for excess quantities and obsolescence, as a critical audit matter, because of changes in conditions, or that the degreesignificant assumptions and subjective judgments used by management, which involved significant audit effort and the use of compliance withespecially challenging and subjective auditor judgment when performing audit procedures and evaluating the policies orresults of those procedures.
The primary procedures may deteriorate.we performed to address this critical audit matter included:
• | Evaluating the appropriateness of management’s process for developing the estimates for excess and obsolete inventories by: |
• | Evaluating the methodology utilized to calculate the estimate. |
• | Performing inquiries with management as to the composition of the reserve for aged inventory items without recent sales. |
• | Assessing the appropriateness of the formulaic calculation and management adjustments by product type. |
• | Evaluating the reasonableness of the significant assumptions used by management including those related to future demand by: |
• | Evaluating management’s ability to provide reasonable forecast of sales by comparing management’s prior period sales forecasts to actual results. |
• | Performing inquiries with non-financial personnel, including sales and production employees, regarding obsolete or discontinued inventory items and other factors to corroborate management’s assertions regarding qualitative judgments about excess and obsolete inventories. |
• | Testing the completeness, accuracy, and relevance of the underlying data used in management’s estimate. |
• | Testing the calculations related to the application of the methodology to specific inventory categories by agreement to supporting documentation and recalculation. |
/s/ Moss Adams LLP
San Francisco, California
March 13, 202028, 2023
We have served as the Company’s auditor since 2016.
(in thousands, except par value amount)
January 1, | January 2, | |||||||||||||||
|
| December 29, 2019 |
|
| December 30, 2018 |
| 2023 | 2022 | ||||||||
ASSETS |
|
|
|
|
|
|
|
| ||||||||
Current assets: |
|
|
|
|
|
|
|
| ||||||||
Cash and cash equivalents |
| $ | 21,448 |
|
| $ | 26,363 |
| ||||||||
Restricted cash |
|
| 100 |
|
|
| 100 |
| ||||||||
Accounts receivable, net of allowances for doubtful accounts of $0 |
|
| 1,991 |
|
|
| 2,209 |
| ||||||||
Cash and cash equivalents and restricted cash | $ | 19,201 | $ | 19,605 | ||||||||||||
Accounts receivable, net of allowances for doubtful accounts of $18 and $62, as of January 1, 2023 and January 2, 2022, respectively | 2,689 | 999 | ||||||||||||||
Contract Assets | 1,987 | 295 | ||||||||||||||
Inventories |
|
| 3,260 |
|
|
| 3,836 |
| 2,493 | 2,078 | ||||||
Other current assets |
|
| 1,565 |
|
|
| 1,775 |
| ||||||||
Prepaid expenses and other current assets | 1,570 | 1,181 | ||||||||||||||
Total current assets |
|
| 28,364 |
|
|
| 34,283 |
| 27,940 | 24,158 | ||||||
Property and equipment, net |
|
| 830 |
|
|
| 1,449 |
| 465 | 499 | ||||||
Capitalized internal-use software, net |
|
| 333 |
|
|
| — |
| 1,514 | 1,241 | ||||||
Right of use assets, net |
|
| 2,370 |
|
|
| — |
| 1,397 | 1,529 | ||||||
Intangible assets, net |
|
| 1,008 |
|
|
| — |
| 645 | 752 | ||||||
Non-marketable equity investment | 300 | 300 | ||||||||||||||
Goodwill |
|
| 185 |
|
|
| — |
| 185 | 185 | ||||||
Other assets |
|
| 314 |
|
|
| 354 |
| 140 | 309 | ||||||
TOTAL ASSETS |
| $ | 33,404 |
|
| $ | 36,086 |
| $ | 32,586 | $ | 28,973 | ||||
|
|
|
|
|
|
|
|
| ||||||||
LIABILITIES AND STOCKHOLDERS' EQUITY |
|
|
|
|
|
|
|
| ||||||||
Current liabilities: |
|
|
|
|
|
|
|
| ||||||||
Revolving line of credit |
| $ | 15,000 |
|
| $ | 15,000 |
| $ | 15,000 | $ | 15,000 | ||||
Trade payables |
|
| 1,003 |
|
|
| 1,488 |
| 2,391 | 934 | ||||||
Accrued liabilities |
|
| 1,133 |
|
|
| 1,903 |
| 1,509 | 1,665 | ||||||
Deferred revenue |
|
| 158 |
|
|
| — |
| 272 | 455 | ||||||
Lease liabilities-current |
|
| 704 |
|
|
| 316 |
| ||||||||
Lease liabilities, current | 850 | 819 | ||||||||||||||
Total current liabilities |
|
| 17,998 |
|
|
| 18,707 |
| 20,022 | 18,873 | ||||||
Long-term liabilities: |
|
|
|
|
|
|
|
| ||||||||
Lease liabilities-non-current |
|
| 1,583 |
|
|
| 108 |
| ||||||||
Lease liabilities, non-current | 544 | 744 | ||||||||||||||
Other long-term liabilities |
|
| — |
|
|
| 16 |
| 125 | 147 | ||||||
Total liabilities |
|
| 19,581 |
|
|
| 18,831 |
| 20,691 | 19,764 | ||||||
Commitments (Note 12) |
|
|
|
|
|
|
|
| ||||||||
Commitments and Contingencies (Note 14) | — | — | ||||||||||||||
Stockholders' equity: |
|
|
|
|
|
|
|
| ||||||||
Preferred stock, $0.001 par value; 10,000 shares authorized; no shares issued or outstanding |
|
| — |
|
|
| — |
| ||||||||
Common stock, $0.001 par value; 200,000 and 100,000 shares authorized; 8,331 and 6,823 shares issued and outstanding as of December 29, 2019 and December 30, 2018, respectively (1) |
|
| 8 |
|
|
| 7 |
| ||||||||
Preferred stock, $0.001 par value; 10,000 shares authorized; no shares issued or outstanding | — | — | ||||||||||||||
Common stock, $0.001 par value; 200,000 shares authorized; 13,202 and 11,863 shares issued and outstanding as of January 1, 2023 and January 2, 2022, respectively | 13 | 12 | ||||||||||||||
Additional paid-in capital |
|
| 297,073 |
|
|
| 285,062 |
| 317,174 | 310,222 | ||||||
Accumulated deficit |
|
| (283,258 | ) |
|
| (267,814 | ) | (305,292 | ) | (301,025 | ) | ||||
Total stockholders' equity |
|
| 13,823 |
|
|
| 17,255 |
| 11,895 | 9,209 | ||||||
TOTAL LIABILITIES AND STOCKHOLDERS' EQUITY |
| $ | 33,404 |
|
| $ | 36,086 |
| $ | 32,586 | $ | 28,973 | ||||
The accompanying notes form an integral part of these Consolidated Financial Statements.
CONSOLIDATED STATEMENTS OF OPERATIONS
(in thousands, except per share amounts)
Fiscal Years | ||||||||||||
2022 | 2021 | 2020 | ||||||||||
Statements of Operations: | ||||||||||||
Revenue | $ | 16,180 | $ | 12,685 | $ | 8,634 | ||||||
Cost of revenue | 7,378 | 5,266 | 4,386 | |||||||||
Gross profit | 8,802 | 7,419 | 4,248 | |||||||||
Operating expenses: | ||||||||||||
Research and development | 5,001 | 6,927 | 7,544 | |||||||||
Selling, general and administrative | 7,601 | 8,008 | 6,820 | |||||||||
Restructuring costs | — | — | 753 | |||||||||
Loss from operations | (3,800 | ) | (7,516 | ) | (10,869 | ) | ||||||
Interest expense | (148 | ) | (130 | ) | (328 | ) | ||||||
Gain on forgiveness of PPP Loan | — | 1,192 | — | |||||||||
Interest income and other (expense) income, net | (221 | ) | (43 | ) | 97 | |||||||
Loss before income taxes | (4,169 | ) | (6,497 | ) | (11,100 | ) | ||||||
Provision for income taxes | 98 | 119 | 51 | |||||||||
Net loss | $ | (4,267 | ) | $ | (6,616 | ) | $ | (11,151 | ) | |||
Net loss per share: (1) | ||||||||||||
Basic and diluted | $ | (0.34 | ) | $ | (0.57 | ) | $ | (1.14 | ) | |||
Weighted average shares: (1) | ||||||||||||
Basic and diluted | 12,588 | 11,535 | 9,781 | |||||||||
(1) Common stock, par value and addition paid-in capital amounts are adjusted to reflect 1-for-14 reverse stock split effected on December 23, 2019.Note: Net loss equals comprehensive loss for all years presented.
The accompanying notes form an integral part of these Consolidated Financial Statements.
CONSOLIDATED STATEMENTS OF OPERATIONS
(in thousands, except per share amounts)
|
| Fiscal Years |
| |||||||||
|
| 2019 |
|
| 2018 |
|
| 2017 |
| |||
Statements of Operations: |
|
|
|
|
|
|
|
|
|
|
|
|
Revenue |
| $ | 10,310 |
|
| $ | 12,629 |
|
| $ | 12,149 |
|
Cost of revenue |
|
| 4,405 |
|
|
| 6,295 |
|
|
| 6,627 |
|
Gross profit |
|
| 5,905 |
|
|
| 6,334 |
|
|
| 5,522 |
|
Operating expenses: |
|
|
|
|
|
|
|
|
|
|
|
|
Research and development |
|
| 12,350 |
|
|
| 9,948 |
|
|
| 9,572 |
|
Selling, general and administrative |
|
| 8,918 |
|
|
| 9,982 |
|
|
| 9,900 |
|
Loss from operations |
|
| (15,363 | ) |
|
| (13,596 | ) |
|
| (13,950 | ) |
Interest expense |
|
| (350 | ) |
|
| (108 | ) |
|
| (115 | ) |
Interest income and other expense, net |
|
| 189 |
|
|
| 77 |
|
|
| 21 |
|
Loss before income taxes |
|
| (15,524 | ) |
|
| (13,627 | ) |
|
| (14,044 | ) |
(Benefit from) Provision for income taxes |
|
| (80 | ) |
|
| 152 |
|
|
| 87 |
|
Net loss |
| $ | (15,444 | ) |
| $ | (13,779 | ) |
| $ | (14,131 | ) |
Net loss per share: (1) |
|
|
|
|
|
|
|
|
|
|
|
|
Basic and diluted |
| $ | (2.02 | ) |
| $ | (2.16 | ) |
| $ | (2.56 | ) |
Weighted average shares: |
|
|
|
|
|
|
|
|
|
|
|
|
Basic and diluted |
|
| 7,663 |
|
|
| 6,365 |
|
|
| 5,521 |
|
Note: Net loss equals to comprehensive loss for all years presented.
(1)Net loss per share and weighted average shares, basic and diluted are adjusted to reflect 1-for-14 reverse stock split effected on December 23, 2019.
The accompanying notes form an integral part of these Consolidated Financial Statements.
CONSOLIDATED STATEMENTS OF CASH FLOWS
(in thousands)
|
| Fiscal Years |
| Fiscal Years | ||||||||||||||||||||
|
| 2019 |
|
| 2018 |
|
| 2017 |
| 2022 | 2021 | 2020 | ||||||||||||
Cash flows from operating activities: |
|
|
|
|
|
|
|
|
|
|
|
| ||||||||||||
Net loss |
| $ | (15,444 | ) |
| $ | (13,779 | ) |
| $ | (14,131 | ) | $ | (4,267 | ) | $ | (6,616 | ) | $ | (11,151 | ) | |||
Adjustments to reconcile net loss to net cash used in operating activities: |
|
|
|
|
|
|
|
|
|
|
|
| ||||||||||||
Depreciation and amortization |
|
| 1,201 |
|
|
| 1,276 |
|
|
| 1,373 |
| 710 | 626 | 817 | |||||||||
Stock-based compensation |
|
| 3,144 |
|
|
| 1,901 |
|
|
| 1,441 |
| 2,035 | 2,526 | 1,739 | |||||||||
Write-down of inventories |
|
| 94 |
|
|
| 386 |
|
|
| 232 |
| 224 | 225 | 199 | |||||||||
Write-off of equipment |
|
| 4 |
|
|
| 5 |
|
|
| 12 |
| ||||||||||||
Tax benefit from acquisition |
|
| (185 | ) |
|
| — |
|
|
| — |
| ||||||||||||
Gain on disposal of assets |
|
| — |
|
|
| (62 | ) |
|
| — |
| ||||||||||||
Gain on forgiveness of PPP Loan | — | (1,192 | ) | — | ||||||||||||||||||||
Loss (gain) on disposal of equipment | (27 | ) | (5 | ) | 44 | |||||||||||||||||||
Bad debt expense | 18 | 62 | — | |||||||||||||||||||||
Changes in operating assets and liabilities: |
|
|
|
|
|
|
|
|
|
|
|
| ||||||||||||
Accounts receivable |
|
| 218 |
|
|
| (1,284 | ) |
|
| (86 | ) | (1,708 | ) | 627 | 303 | ||||||||
Contract assets | (1,692 | ) | (295 | ) | — | |||||||||||||||||||
Inventories |
|
| 483 |
|
|
| (662 | ) |
|
| (1,774 | ) | (639 | ) | 385 | 373 | ||||||||
Other assets |
|
| 229 |
|
|
| (879 | ) |
|
| 103 |
| (321 | ) | (444 | ) | 533 | |||||||
Trade payables |
|
| (456 | ) |
|
| 223 |
|
|
| (145 | ) | 1,871 | 367 | 298 | |||||||||
Accrued liabilities |
|
| (1,024 | ) |
|
| 235 |
|
|
| 72 |
| (55 | ) | 325 | 207 | ||||||||
Deferred income |
|
| 158 |
|
|
| — |
|
|
| — |
| (183 | ) | 403 | (106 | ) | |||||||
Other long-term liabilities |
|
| (16 | ) |
|
| 2 |
|
|
| (35 | ) | (22 | ) | 147 | — | ||||||||
Net cash used in operating activities |
|
| (11,594 | ) |
|
| (12,638 | ) |
|
| (12,938 | ) | (4,056 | ) | (2,859 | ) | (6,744 | ) | ||||||
Cash flows from investing activities: |
|
|
|
|
|
|
|
|
|
|
|
| ||||||||||||
Capital expenditures for property and equipment |
|
| (576 | ) |
|
| (351 | ) |
|
| (642 | ) | (142 | ) | (185 | ) | (253 | ) | ||||||
Capitalized internal-use software |
|
| (365 | ) |
|
| — |
|
|
| — |
| (672 | ) | (533 | ) | (801 | ) | ||||||
Cash received from business acquisition |
|
| 20 |
|
|
| — |
|
|
| — |
| ||||||||||||
Proceeds from sale of assets |
|
| — |
|
|
| 63 |
|
|
| — |
| ||||||||||||
Net cash used in investing activities |
|
| (921 | ) |
|
| (288 | ) |
|
| (642 | ) | (814 | ) | (718 | ) | (1,054 | ) | ||||||
Cash flows from financing activities: |
|
|
|
|
|
|
|
|
|
|
|
| ||||||||||||
Payment of finance lease obligations |
|
| (365 | ) |
|
| (407 | ) |
|
| (344 | ) | (452 | ) | (378 | ) | (270 | ) | ||||||
Proceeds from PPP loan | — | — | 1,191 | |||||||||||||||||||||
Proceeds from line of credit |
|
| 46,000 |
|
|
| 36,000 |
|
|
| 18,000 |
| 60,000 | 60,000 | 57,000 | |||||||||
Repayment of line of credit |
|
| (46,000 | ) |
|
| (27,000 | ) |
|
| (18,000 | ) | (60,000 | ) | (60,000 | ) | (57,000 | ) | ||||||
Proceeds from issuance of common stock |
|
| 9,437 |
|
|
| 16,215 |
|
|
| 17,550 |
| ||||||||||||
Gross Proceeds from issuance of common stock | 4,935 | 1,342 | 9,296 | |||||||||||||||||||||
Stock issuance costs |
|
| (1,181 | ) |
|
| (1,638 | ) |
|
| (1,771 | ) | (17 | ) | (45 | ) | (1,147 | ) | ||||||
Taxes paid related to net settlement of equity awards |
|
| (291 | ) |
|
| (308 | ) |
|
| (198 | ) | — | (485 | ) | (72 | ) | |||||||
Net cash provided by financing activities |
|
| 7,600 |
|
|
| 22,862 |
|
|
| 15,237 |
| 4,466 | 434 | 8,998 | |||||||||
Net (decrease) increase in cash, cash equivalents and restricted cash |
|
| (4,915 | ) |
|
| 9,936 |
|
|
| 1,657 |
| (404 | ) | (3,143 | ) | 1,200 | |||||||
Cash, cash equivalents and restricted cash at the beginning of the period |
|
| 26,463 |
|
|
| 16,527 |
|
|
| 14,870 |
| 19,605 | 22,748 | 21,548 | |||||||||
Cash, cash equivalents, and restricted cash at the end of the period |
| $ | 21,548 |
|
| $ | 26,463 |
|
| $ | 16,527 |
| $ | 19,201 | $ | 19,605 | $ | 22,748 | ||||||
Supplemental disclosures of cash flow information: |
|
|
|
|
|
|
|
|
|
|
|
| ||||||||||||
Interest paid |
| $ | 300 |
|
| $ | 89 |
|
| $ | 106 |
| $ | 86 | $ | 77 | $ | 277 | ||||||
Income taxes paid |
| $ | 126 |
|
| $ | 171 |
|
| $ | 157 |
| $ | 16 | $ | 73 | $ | 24 | ||||||
Supplemental schedule of non-cash investing and financing activities : |
|
|
|
|
|
|
|
|
|
|
|
| ||||||||||||
Fair value of common stock issued as consideration for business acquisition |
| $ | 903 |
|
|
| — |
|
|
| — |
| ||||||||||||
Finance lease obligation to finance capital expenditures |
| $ | 471 |
|
| $ | 424 |
|
| $ | 654 |
| ||||||||||||
Purchase of equipment included in accounts payable |
|
| — |
|
| $ | 5 |
|
| $ | 436 |
| ||||||||||||
Supplemental schedule of non-cash investing and financing activities: | ||||||||||||||||||||||||
Finance lease obligations entered in during the year | $ | 650 | $ | 690 | $ | 670 | ||||||||||||||||||
The accompanying notes form an integral part of these Consolidated Financial Statements.
CONSOLIDATED STATEMENTS OF STOCKHOLDERS' EQUITY
(in thousands)
|
| Common Stock Par Value (1) |
|
| Additional Paid-In |
|
| Accumulated |
|
| Total Stockholders' |
| ||||||||
|
| Shares |
|
| Amount |
|
| Capital |
|
| Deficit |
|
| Equity |
| |||||
Balance at January 1, 2017 |
|
| 4,867 |
|
| $ | 5 |
|
| $ | 251,887 |
|
| $ | (239,904 | ) |
| $ | 11,988 |
|
Common stock issued under stock plans and employee stock purchase plans |
|
| 76 |
|
|
| — |
|
|
| 351 |
|
|
| — |
|
|
| 351 |
|
Common stock offering, net of issuance costs |
|
| 810 |
|
|
| 1 |
|
|
| 15,228 |
|
|
| — |
|
|
| 15,229 |
|
Stock-based compensation |
|
| — |
|
|
| — |
|
|
| 1,441 |
|
|
| — |
|
|
| 1,441 |
|
Net loss |
|
| — |
|
|
| — |
|
|
| — |
|
|
| (14,131 | ) |
|
| (14,131 | ) |
Balance at December 31, 2017 |
|
| 5,753 |
|
|
| 6 |
|
|
| 268,907 |
|
|
| (254,035 | ) |
|
| 14,878 |
|
Common stock issued under stock plans and employee stock purchase plans |
|
| 105 |
|
|
| — |
|
|
| 353 |
|
|
| — |
|
|
| 353 |
|
Common stock offering, net of issuance costs |
|
| 965 |
|
|
| 1 |
|
|
| 13,901 |
|
|
| — |
|
|
| 13,902 |
|
Stock-based compensation |
|
| — |
|
|
| — |
|
|
| 1,901 |
|
|
| — |
|
|
| 1,901 |
|
Net loss |
|
| — |
|
|
| — |
|
|
| — |
|
|
| (13,779 | ) |
|
| (13,779 | ) |
Balance at December 30, 2018 |
|
| 6,823 |
|
|
| 7 |
|
|
| 285,062 |
|
|
| (267,814 | ) |
|
| 17,255 |
|
Common stock issued under stock plans and employee stock purchase plans |
|
| 110 |
|
|
| — |
|
|
| (37 | ) |
|
| — |
|
|
| (37 | ) |
Common stock offering, net of issuance costs |
|
| 1,314 |
|
|
| 1 |
|
|
| 8,001 |
|
|
| — |
|
|
| 8,002 |
|
Common stock issued for SensiML acquisition |
|
| 84 |
|
|
| — |
|
|
| 903 |
|
|
| — |
|
|
| 903 |
|
Stock-based compensation |
|
| — |
|
|
| — |
|
|
| 3,144 |
|
|
| — |
|
|
| 3,144 |
|
Net loss |
|
| — |
|
|
| — |
|
|
| — |
|
|
| (15,444 | ) |
|
| (15,444 | ) |
Balance at December 29, 2019 |
|
| 8,331 |
|
| $ | 8 |
|
| $ | 297,073 |
|
| $ | (283,258 | ) |
| $ | 13,823 |
|
|
|
Common Stock | ||||||||||||||||||||
Par Value | Additional Paid-In | Accumulated | Total Stockholders' | |||||||||||||||||
Shares | Amount | Capital | Deficit | Equity | ||||||||||||||||
Balance at December 29, 2019 | 8,331 | $ | 8 | $ | 297,073 | $ | (283,258 | ) | $ | 13,823 | ||||||||||
Common stock issued under stock plans and employee stock purchase plans | 121 | — | (24 | ) | — | (24 | ) | |||||||||||||
Common stock offering, net of issuance costs | 2,642 | 3 | 8,097 | — | 8,100 | |||||||||||||||
Stock-based compensation | — | — | 1,739 | — | 1,739 | |||||||||||||||
Net loss | — | — | — | (11,151 | ) | (11,151 | ) | |||||||||||||
Balance at January 3, 2021 | 11,094 | 11 | 306,885 | (294,409 | ) | 12,487 | ||||||||||||||
Common stock issued under stock plans and employee stock purchase plans | 571 | — | (222 | ) | — | (222 | ) | |||||||||||||
Common stock offering, net of issuance costs | 198 | 1 | 1,033 | — | 1,034 | |||||||||||||||
Stock-based compensation | — | — | 2,526 | — | 2,526 | |||||||||||||||
Net loss | — | — | — | (6,616 | ) | (6,616 | ) | |||||||||||||
Balance at January 2, 2022 | 11,863 | 12 | 310,222 | (301,025 | ) | 9,209 | ||||||||||||||
Common stock issued under stock plans and employee stock purchase plans | 542 | — | 253 | — | 253 | |||||||||||||||
Common stock offering, net of issuance costs | 797 | 1 | 4,664 | — | 4,665 | |||||||||||||||
Stock-based compensation | — | — | 2,035 | — | 2,035 | |||||||||||||||
Net loss | — | — | — | (4,267 | ) | (4,267 | ) | |||||||||||||
Balance at January 1, 2023 | 13,202 | $ | 13 | $ | 317,174 | $ | (305,292 | ) | $ | 11,895 | ||||||||||
The accompanying notes form an integral part of these Consolidated Financial Statements.
NOTE 1-THE1— THE COMPANY AND BASIS OF PRESENTATION
QuickLogic Corporation ("QuickLogic", or, the "Company"), was founded in 1988 and reincorporated in Delaware in 1999. The Company enables Original Equipment Manufacturers or OEMs,"(OEMs"), to maximize battery life for highly differentiated, immersive user experiences with Smartphone, Wearable, Hearable, Tablet and Internet-of-Things or IoT devices.hardware products, Military, Aerospace and Defense products. QuickLogic delivers these benefits through industry leading ultra-low power customer programmable System on Chip or SoC semiconductor solutions, embedded software, and algorithm solutions for always-on voice and sensor processing, and enhanced visual experiences.processing. The Company is a fabless semiconductor provider of comprehensive, flexible sensor processing solutions, ultra-low power display bridges, and ultra-low power Field Programmable Gate Arrays, or FPGAs.Arrays"(FPGAs"). Starting in late 2021 the Company increased its professional engineering services business related to its eFPGA products for both civilian and military applications. The Company’s wholly owned subsidiary, SensiML Corporation, or SensiML,Corp.("SensiML"), provides Analytics Toolkit, which is used in many of the applications where the Company’s ArcticPro™, eFPGA intellectual property or IP"(IP") plays a critical role. SensiML Analytics toolkit is an end-to-end software suite that provides OEMs a straightforward process for developing pattern matching sensor algorithms using machine learning technology that are optimized for ultra-low power consumption.
QuickLogic’s fiscal yearFiscal Year ends on the Sunday closest to December 31. Fiscal years 2019, 2018Years2022, 2021, and 20172020 ended on December 29, 2019, December 30, 2018January 1, 2023, January 2, 2022 and December 31, 2017,January 3, 2021, respectively.
Global, supply chain constraints have not had a material impact on the Company's business. While the Company has experienced some volatilities with input material costs and supplier costs in accordance with domestic and global economic conditions, none of these have had a material impact to its business during the year ended January 1, 2023. The Company does not expect material increases in costs over the next twelve months; however, it expects to be subject to continued, broader-based inflationary, labor, and supplier costs increases in alignment with domestic and global economic conditions. The Company expects any increases in costs to be dilutive to its gross profit; and it may be limited in its ability to offset any increased costs with price increases to customers. This may have a negative impact to its results from operations and cash flows.
The conflict between Russia and Ukraine has negatively impacted the global economy and led to various economic sanctions being imposed by the U.S., United Kingdom, European Union and other countries against Russia. While the impacts of the conflict have not been material on the Company's results of operations, as the Company does not have operations or material customers or suppliers in either country, it is not possible to predict the broader consequences of this conflict. Changing U.S. Government export regulations, particularly relating to advanced semiconductors may limit the Company's ability to provide customers with certain goods and services in China.
2023 Cybersecurity Incident
On January 20, 2023, the Company detected a ransomware infection affecting a limited number of IT systems, including systems that contained personal information of our employees. Upon detection of the incident, the Company promptly began an assessment of all Company IT systems, notified law enforcement, and engaged legal counsel and other incident response professionals. The Company continued its business operations during this incident and successfully restored all of its critical operational data. The Company has also taken steps to further secure its IT systems. Based on the ongoing investigation and information currently known at this time, the Company believes the incident has not had nor will have a material impact on its business, operations, ability to serve its customers, or financial results. See Note 15 for additional information.
Liquidity
The Company has financed its operations and capital investments through the sale of common stock, capitalfinance and operating leases, a revolving line of credit and cash flows from operations. As of December 29, 2019,January 1, 2023, the Company’s principal sources of liquidity consisted of cash and cash equivalents of $21.5$19.1 million, includinginclusive of a $15.0 million drawn downadvance from its line of credit, or Revolving Facility with Heritage Bank of Commerce or ("Heritage Bank. Bank").
The Company’s priorCompany's principal contractual commitments include purchase obligations, re-payments of draw downs from the revolving line of credit, facilityand payments under operating and finance leases. Purchase obligations are largely comprised of open purchase order commitments to suppliers. The Company's risk associated with Silicon Valleythe purchase obligations is limited to the termination liability provisions within those contracts, and as such, the Company does not believe they represent a material liquidity risk. See Note 6 for additional information.
Heritage Bank has a first priority security interest in substantially all of the Company’s tangible and intangible assets to secure any outstanding amounts under a loan agreement. See Note 6 for additional information.
14, 2022
and the February 9, 2022 offerings were immaterial.On December 21, 2018, the Company entered into the Amended and Restated Loan Agreement with Heritage Bank to replace in its entirety the Loan Agreement. The Amended and Restated Loan Agreement increases the Revolving Facility from $9,000,000 to $15,000,000. The Amended and Restated Loan Agreement require the Company to maintain at least $3,000,000 in unrestricted cash at Heritage Bank.
On November 6, 2019, on September 30, 2021, the Company entered into a First Amendment tocommon stock purchase agreement for the Revolving Facility with Heritage Bank to extend the maturity date for one year through September 28, 2021. Under this amendment the Revolving Facility advances shall bear interest, on the outstanding daily balance thereof, at a rate per annum equal to the greatersale of (i) one half of one percentage point (0.50%) above the Prime Rate, or (ii) five and one half of one percentage points (5.50%). The Company was in compliance with all loan covenants as74 thousand shares of the end of the current reporting period. As of December 29, 2019, the Company had $15.0 million of outstanding revolving line of credit with an interest rate of 5.50%.
On June 21, 2019, the Company closed its underwritten public offering of 1.3 million shares ofCompany's common stock $0.001 par value per share atin a price of $7.00 per share,registered direct offering, which included 171,429 shares issued pursuant to the underwriters’ full exercise of their over-allotment option. The Company receivedresulted in net cash proceeds of approximately $8.0 million, after deducting underwriting commissions and other offering-related expenses. See Note 11 to the Consolidated Financial Statements for the details.
In May 2018, the Company issued an aggregate of 965,251 shares of common stock, $0.001 par value and warrants to purchase up to an aggregate of 386,100 shares of common stock in an underwritten public offering. The common stock and warrants were issued in units (the “Units”), with each Unit consisting of (i) one share of common stock and (ii) a warrant to purchase 0.40 of a share of common stock, at a combined price of $16.10 per Unit. The Company received total net proceeds from the offering of $13.9$1.0 million, net of underwriting discounts and other offering expenses$45 thousand in issuance costs. See Note 10 for additional information.
The common stock warrants are exercisable any time for a period of 60 months from the date of issuance on May 29, 2018, and are exercisable at a price of $19.32 per share. The estimated grant date fair value of the common stock warrants was $7.98 per warrant and was calculated based on the following assumptions used in the Black-Scholes model: expected term of 5 years, risk-free interest rate of 2.58%, expected volatility of 52.75% and expected dividend of zero.
Principles of Consolidation
The consolidated financial statements have been prepared in accordance with Generally Accepted Accounting Principles, in the United States of America or ("US GAAP,GAAP"), and the applicable rules and regulations of the Securities and Exchange Commission, or SEC,("SEC"), and include the accounts of QuickLogic and its wholly-owned subsidiaries. All intercompany accounts and transactions have been eliminated.
Foreign Currency
The functional currency of the Company’s non-U.S. operations is the U.S. dollar. Accordingly, all monetary assetsCritical Accounting Policies and liabilities of these foreign operations are translated into U.S. dollars at current period-end exchange rates and non-monetary assets and related elements of expense are translated using historical exchange rates. Income and expense elements are translated to U.S. dollars using the average exchange rates in effect during the period. Gains
and losses from the foreign currency transactions of these subsidiaries are recorded as interest income and other expense, net in the statements of operations.
Use of Estimates
The preparation of these consolidated financial statements in conformity with U.S. GAAP requires management to make estimates and assumptions that affect the reported amounts of assets and liabilities, the disclosures of contingent assets and liabilities and the reported amounts of revenue and expenses during the period. Actual
Although these estimates are based on the Company’s knowledge of current events and actions it may undertake in the future, actual results couldmay ultimately materially differ from thosethese estimates particularly and assumptions in relationregards to revenue recognition; the allowance for doubtful accounts; sales returns; valuation of long-lived assets including mask sets; valuation of goodwill; capitalized internal-use software and related amortizable lives and intangibles related to the acquisition of SensiML, including the estimated useful lives of acquired intangible assets, valuation of inventories including identification of excess quantities, market value and obsolescence; measurement of stock-based compensation awards; accounting for income taxesobsolescence.
The methods, estimates and estimating accrued liabilities.
Contracts with customers often include promises to transfer multiple products and services to a customer. Determining whether products and services are considered distinct performance obligations that should be accounted for separately versus together may require significant judgment.
Judgment is required to determine the Stand-alone Selling Price, or SSP, for each distinct performance obligation. The Company uses a range of amounts to estimate SSP when each of the products and services are sold separately and determines the discount to be allocated based on the relative SSP of the various products and services when products and services sold are bundled. In instances where SSP is not directly observable, such as when the Company does not sell the product or service separately, it determines the SSP using information that may include market conditions and other observable inputs. The Company typically has more than one SSP for individual products and services due to the stratification of those products and services by customers. In these instances, the Company mayjudgments we use information such as the size of the customer, customer tier, type of the technology used, customer demographics, geographic region and other factors in determining the SSP.
Concentration of Risk
The Company’s accounts receivable are denominated in U.S. dollars and are derived primarily from sales to customers located in North America, Asia Pacific, and Europe. The Company performs ongoing credit evaluations of its customers and generally does not require collateral. See Note 14 for information regarding concentrations associated with accounts receivable and revenue.
Reverse Stock Split
On December 6, 2019, the Board of Directors of the Company approved a 1-for-14 reverse stock split of the Company’s outstanding common stock, which became effective on December 23, 2019. The reverse stock split was previously approved by the Company’s shareholders in a special meeting held on November 26, 2019. At the effective time of the reverse stock split, every 14 issued and outstanding shares of common stock of the Company were automatically combined into one issued and outstanding share of common stock without any change in the par value per share. Stockholders who would have otherwise been entitled to fractional shares of common stock as a result of the reverse stock split received a cash payment in lieu of receiving fractional shares. All share, equity awards, and per share amounts contained in this Form 10-K and the accompanying Consolidated Financial Statements have been adjusted to reflect the reverse stock split for all prior periods presented. Warrants issued in connection with the May 2018 stock issuance were also adjusted to reflect the reverse stock split for all periods presented.
NOTE 2-SIGNIFICANT ACCOUNTING POLICIES
Cash Equivalents
The Company considers all short-term, highly liquid investments with an original or a remaining maturity at purchase of ninety days or less to be cash equivalents. The Company’s investment portfolio included in cash equivalents is generally comprised of investments that meet high credit quality standards. The Company’s investment portfolio consists of money market accounts and funds. Restricted cash represents amounts pledged as cash security related to the use of credit cards.
Fair Value
The guidance for the fair value option for financial assets and financial liabilities provides companies the irrevocable option to measure many financial assets and liabilities at fair value with changes in fair value recognized in earnings or equity. The Company has not elected to measure any financial assets or liabilities at fair value that were not previously required to be measured at fair value.
Foreign Currency Transactions
All of the Company’s sales and cost of manufacturing are transacted in U.S. dollars. The Company conducts a portion of its research and development activities in India and has sales and marketing activities in various countries outside of the United States. Most of these international expenses are incurred in local currency. Foreign currency transaction gains and losses, which are not significant, are included in interest income and other expense, net, as they occur. Operating expenses denominated in foreign currencies were approximately 19%, 27% and 25% of total operating expenses in 2019, 2018 and 2017 respectively. The Company incurred a majority of these foreign currency expenses in India, the United Kingdom, China, Taiwan and Korea in 2019, 2018 and 2017. The Company has not used derivative financial instruments to hedge its exposure to fluctuations in foreign currency and, therefore, is susceptible to fluctuations in foreign exchange gains or losses in its results of operations in future reporting periods.
Inventories
In accordance with the Financial Accounting Standards Board, or FASB Accounting Standards Update, or ASU No. 2015-11, Inventory (Topic 330): Simplifying the Measurement of Inventory, which was adopted by the Company in the first quarter of 2017, inventories are stated at the lower of standard cost or net realizable value. Standard cost approximates actual cost on a first-in, first-out basis. The Company routinely evaluates quantities and values of its inventories in light of current market conditions and market trends and records reserves for quantities in excess of demand and product obsolescence. The evaluation, which inherently involves judgments as to assumptions about expected future demand and the impact of market conditions on these assumptions, takes into consideration historic usage, expected demand, anticipated sales price, the stage in the product life cycle of its customers’ products, new product development schedules, the effect new products might have on the sale of existing products, product obsolescence, customer design activity, customer concentrations, product merchantability and other factors. Market conditions are subject to change. Actual consumption of inventories could differ from forecast demand, and this difference could have a material impact on the Company’s gross margin and inventory balances based on additional provisions for excess or obsolete inventories or a benefit from inventories previously written down. The Company also regularly reviews the cost of inventories against estimated net realizable value and records a lower of cost or net realizable value reserve for inventories that have a cost in excess of estimated net realizable value (previously market value), which could have a material impact on the Company’s gross margin and inventory balances based on additional write-downs to net realizable value or a benefit from inventories previously written down.
The Company’s semiconductor products have historically had an unusually long product life cycle and obsolescence has not been a significant factor in the valuation of inventories. However, as the Company pursues opportunities in the mobile market and continues to develop new solutions and products, the Company believes its product life cycle will be shorter which could increase the potential for obsolescence. A significant decrease in demand could result in an increase in excess inventory on hand. Although the Company makes every effort to ensure
the accuracy of its forecasts of future product demand, any significant unanticipated changes in demand or frequent new product developments couldapplying our most critical accounting policies have a significant impact on the valueresults we report in our consolidated financial statements. The SEC has defined critical accounting policies as those that are most important to the portrayal of its inventoryour financial condition and its results of operations.
Propertyoperations and Equipment
Propertyrequire us to make our most difficult and equipment are stated at cost less accumulated depreciation and amortization. Depreciation is calculated onsubjective judgments, often as a straight-line basis over the estimated useful livesresult of the assets, generally oneneed to seven years. Amortizationmake estimates of leasehold improvements is computedmatters that are inherently uncertain. Based on a straight-line basis over the shorterthis definition, our critical accounting policies include revenue recognition and determination of the lease termstandalone selling price ("SSP") for certain distinct performance obligations (such as for IP licensing and professional services contracts) and valuation of inventories. We believe that we apply judgments and estimates in a consistent manner and that such consistent application results in consolidated financial statements and accompanying notes that fairly represent all periods presented. However, any factual errors or the estimated useful lives of the assets, generally one to seven years.errors in these judgments and estimates may have a material impact on our financial statements.
Capitalized Internal-Use Software
The Company capitalizes costs related to development of hosted services that the Company provides to its customers and internal use of enterprise-level business and finance software in support of the Company’s operational needs. Costs incurred in the application development phase are capitalized and amortized on a straight-line basis over their useful lives, which are generally three to five years. Costs related to planning and other preliminary project activities and post-implementation activities are expensed as incurred. The Company tests these assets for impairment whenever events or changes in circumstances occur that could impact their recoverability.
Long-Lived Assets
The Company reviews the recoverability of its long-lived assets, such as property and equipment, annually and when events or changes in circumstances occur that indicate that the carrying value of the asset or asset group may not be recoverable. The assessment of possible impairment is based on the Company’s ability to recover the carrying value of the asset or asset group from the expected future pre-tax cash flows, undiscounted and without interest charges, of the related operations. If these cash flows are less than the carrying value of the asset or asset group, an impairment loss is recognized for the difference between the estimated fair value and the carrying value, and the carrying value of the related assets is reduced by this difference. The measurement of impairment requires management to estimate future cash flows and the fair value of long-lived assets. During 2019, 2018 and 2017 the Company wrote-off equipment with a net book value of $4,000, $5,000 and $12,000, respectively.
Licensed Intellectual Property
The Company licenses intellectual property that is incorporated into its products. Costs incurred under license agreements prior to the establishment of technological feasibility are included in research and development expense as incurred. Costs incurred for intellectual property once technological feasibility has been established and that can be used in multiple products are capitalized as a long-term asset. Once a product incorporating licensed intellectual property has production sales, the amount is amortized over the estimated useful life of the asset, generally up to five years. Licensed intellectual property is included in intangible assets, net on the Company’s consolidated balance sheet.
Revenue is recognized upon transfer of control of promised products or services to customers in an amount that reflects the consideration the Company expects to receive in exchange for those products or services.
The Company determines revenue recognition through the following steps:
customer,
• Identification of the performance obligations in the contract;
• Determination of the transaction price;
• Allocation of the transaction price to the performance obligations in the contract;contract, and
• Recognition of revenue when, or as, the Company satisfieswe satisfy a performance obligation.
Company's revenue recognition policy by principal activity:
The Company's promise to transfer hardware products is identified as a distinct performance obligation. The Company recognizes revenue on hardware product revenue at the point of timeproducts when it transfers control of the promised products is transferred to the customers,customer. Transfer of control of hardware products occurs when the Company’sits performance obligation is satisfied, which typically occurs upon shipment from the Company’sCompany's manufacturing site or its headquarters.
Intellectual Property and Software License Revenue
The Company recognizes revenue in an amount that reflects the consideration it expects to receive in exchange for those products, which also generatesrepresents the SSP of its performance obligation. Hardware product prices are fixed. The Company's standard payment terms are less than one year, and it elected a practical expedient in which it does not assess whether a contract has a significant financing component. The Company allocates the transaction price of customer contracts to each distinct product based on its relative SSP. The majority of the Company's revenue is derived from hardware product sales.
the fees associated with custom development and integration of the Company's technology solutions into hardware products. The Company recognizes eFPGA revenue from support and maintenance services for post-implementation customer support ratably over the service term. Renewals of support and maintenance contracts create new performance obligations which the Company recognizes as revenue ratably over the service term.
Some of the IPpromised goods and Software Licensing contracts with customers contain multipleservices are distinct from each other and then these promised goods and services are considered individual performance obligations. For these contracts,In other contractual arrangement, the promised goods and services are deemed to not be distinct from each other and the Company accountshas concluded that these promised goods and services are a single, combined performance obligation.
Software
Software products that are offered& Other revenue is comprised primarily of software as a s ervice ("SaaS") revenue, software-related professional services revenue, and royalties from licensing the Company's technology. SaaS revenue is generated when the Company licenses its software to customers withand allows customers to access the software over a short-term subscription basis. The Company grants the customer the right to access and use software at the hosted software overoutset of the contract period without takingarrangement and throughout the possessionentire term of it are billed on a subscription basis. Revenue that are billed on a subscription basis is recognizedthe arrangement. The Company recognizes SaaS revenue ratably over the contract period.
license term. The Company recognizes revenue from maintenance ratably oversoftware-related professional services as services are provided to the term of the underlying maintenance contract term. Renewals of maintenance contracts create new performance obligations that are satisfied over the term with the revenues recognized ratably over the term.
Royalty Revenue
customer.
Deferred Revenue
Receivablesan unconditional right to invoice the customer. Balances in contract liabilities (deferred revenue) are recognized inas revenue once the period the Company ships the product. Payment terms on invoiced amountsperformance obligations are based on contractual terms with each customer. When the Company receives consideration, or such consideration is unconditionally due, prior to transferring goods or services to the customer under the terms of a sales contract, the Company records deferred revenue, which represents a contract liability. The Company recognizes deferred revenuesatisfied, as net sales once control of goods and/orand services have beenare transferred to the customer, and all revenue recognition criteria have been met and any constraints have
consolidated balance sheets at January 1, 2023 and January 2, 2022, respectively.
The Company recognizes an asset for the incremental costs of obtaining a contract with a customer if it expects the benefit of those costs to be longer than one year. The Company has concluded that none of the costs it has incurred to obtain and fulfill its ASC 606 contracts meetduring the years ended January 1, 2023 and January 2, 2022 met the capitalization criteria, and as such, there are no costs deferred andnor recognized as assets on the consolidated balance sheetsheets at December 29, 2019.January 1, 2023, and January 2, 2022.
Practical expedients and exemptions
(i) Taxes collected from customers and remitted to government authorities and that are related to the sales of the Company’s products are excluded from revenues.
(ii)
(iii) The Company does not disclose the value of unsatisfied performance obligations for (i) contracts with original expected lengths of one year or less or (ii) contracts for which the Company recognizes revenue at the amount to which it has the right to invoice for the services performed.
Return Allowance
Revenue Recognition Prior to the Adoption of ASC Topic No. 606 on
The Company supplies standard products which must be programmed before they can be used in an application. The Company’s products may be programmed by us, distributors, end-customers or third parties.
The Company recognizes revenue as products are shipped if evidence2023
The Company accounts for its Intellectual Property or IP license revenues and related services in accordance with Financial Accounting Standard Board or FASB Accounting Standards Codification or ASC No. 985-605, Software Revenue Recognition. Revenues are recognized when persuasive evidencecosts of an arrangement exists and no further obligation exists, delivery has occurred, the license fee is fixed or determinable, and collection is reasonably assured. A license may be perpetual or time limited in its application. The Company’s IP license agreement contains multiple elements including post-contract customer support. For multiple element arrangements involving software and other software-related deliverables, vendor-specific objective evidence of fair value (“VSOE”) must exist to allocate the total fee among all delivered and non-essential undelivered elements of the arrangement. If undelivered elements of the arrangement are essential to the functionality of the product, revenue is deferred until the essential elements are delivered. If VSOE does not exist for one or more non-essential undelivered elements, revenue is deferred until such evidence exists for the undelivered elements, or until all elements are delivered, whichever is earlier. VSOE of each element is based on historical evidence of stand-alone sales of these elements to third parties including substantive renewal rate as stated in the agreement. When VSOE does not exist for undelivered items, the entire arrangement fee is recognized ratably over the performance period.
Cost of Revenue
The Company records all costs associated with itshardware product sales in cost ofrevenues, eFPGA IP revenue and SaaS revenue. TheseHardware product costs include the cost of materials, contract manufacturing fees, shipping costs, and quality assurance. Cost of revenueHardware product costs also includes indirect costs such as warranty, excess and obsolete inventory charges, general overhead costs, depreciation and depreciation.amortization of certain capitalized software. eFPGA IP and SaaS costs includes costs related to services under contractual agreements over the term of their respective agreements. These costs are primarily comprised of employee salary and benefits and other employee-related costs to perform work on revenue-generating contracts with customers, software tool utilization costs and contract engineering costs.
NOTE 2—OTHER RELEVANT ACCOUNTING POLICIES
Cash Equivalents and Restricted Cash
The Company considers all short-term, highly liquid investments with an original or a remaining maturity at purchase of ninety days or less to be cash equivalents. The Company’s investment portfolio included in cash equivalents is generally comprised of investments that meet high credit quality standards. The Company’s investment portfolio consists of money market accounts and funds. Restricted cash represents amounts pledged as cash security related to the use of credit cards.
Foreign Currency Transactions
All of the Company’s revenue transactions and inputs to its cost of revenue are denominated in U.S. dollars. The Company conducts sales and marketing activities in various countries outside of the United States. The Company's foreign operations' monetary assets and liabilities are translated into U.S. dollars at current period-end exchange rates and non-monetary assets and related elements of expense are translated using historical exchange rates. The Company's foreign operations' income and expenses are transacted in local foreign currency and translated to U.S. dollars using the average exchange rates in effect during the period. Gains and losses from the foreign currency transactions of the Company's foreign operations are recorded as interest income and other (expense) income, net in the consolidated statements of operations. The impact from foreign currencies was not significant for each of the Fiscal Years ended January 1, 2023, January 2, 2022 and January 3, 2021.
Operating expenses denominated in foreign currencies represented approximately 12%, 21% and 18% of total operating expenses for the years ended January 1, 2023, January 2, 2022 and January 3, 2021, respectively. The Company incurred a majority of such foreign currency expenses in India, the United Kingdom, China, Taiwan Japan, and Korea in the Fiscal Years ended January 1, 2023, January 2, 2022 and January 3, 2021. The Company does not use derivative financial instruments to hedge its exposure to fluctuations in foreign currency and, therefore, is susceptible to fluctuations in foreign exchange gains or losses in its results of operations in future reporting periods.
• | Level 1 - Observable inputs that reflect quoted prices (unadjusted) for identical assets or liabilities in active markets. |
• | Level 2 - Inputs that are based upon quoted prices for similar instruments in active markets, quoted prices for identical or similar instruments in markets that are not active, and model-based valuation techniques for which all significant inputs are observable in the market or can be derived from observable market data. Where applicable, these models project future cash flows and discount the future amounts to a present value using market-based observable inputs including interest rate curves, foreign exchange rates, and credit ratings. |
• | Level 3 - Unobservable inputs that are supported by little or no market activities. |
Property and Equipment
Property and equipment are stated at cost less accumulated depreciation and amortization. Depreciation is calculated on a straight-line basis over the estimated useful lives of the assets, generally one to seven years. Amortization of leasehold improvements is computed on a straight-line basis over the shorter of the lease term or the estimated useful lives of the assets, generally one to seven years.
Capitalized Internal-Use Software
The Company capitalizes costs related to the development of hosted services it provides to its customers and internally used enterprise-level business and finance software in support of the Company’s operational needs. Costs incurred in the application development phase are capitalized and amortized on a straight-line basis over their useful lives, which are generally five years. Costs related to planning and other preliminary project activities and post-implementation activities are expensed as incurred. The Company tests these assets for impairment whenever events or changes in circumstances occur that could impact their recoverability.
Long-Lived Assets
The Company reviews the recoverability of its long-lived assets annually and when events or changes in circumstances occur that indicate that the carrying value of the asset or asset group may not be recoverable.
The Company's long-lived assets include property and equipment. The Company assesses possible impairment based its ability to recover the carrying value of the asset or asset group from the expected future pre-tax cash flows, undiscounted and without interest charges, of the related operations, as well as the useful lives applied to the assets. If these cash flows are less than the carrying value of the asset or asset group, an impairment loss is recognized for the difference between the estimated fair value and the carrying value, and the carrying value of the related assets is reduced by this difference. The measurement of impairment requires management to estimate future cash flows and the fair value of long-lived assets. The Company recognized gains on disposalof equipment of $27 thousand and $5 thousand in the years ended January 1, 2023 and January 2, 2022, respectively.
Allowance for Doubtful Accounts Receivable Allowance
The Company estimates the amount of uncollectible accounts receivable at the end of each reporting period based on the aging of the receivable balance, current and historical customer trends, and communications with its customers. Amounts are written off only after considerable collection efforts have been made and the amounts are determined to be uncollectible.
The Company provides an allowance for doubtful accounts based on both historical experience and a specific identification basis. As of January 1, 2023 and January 2, 2022, the allowance for doubtful accounts was $18 thousand and $62 thousand, respectively, in its consolidated balance sheets. Bad debt expense for the years ended January 1, 2023 and January 2, 2022 was $18 thousand and $62 thousand, respectively.
Hardware Product Warranty Costs
The Company warrants finished goodsproduct hardware against defects in material and workmanship under normal use for twelve months from the date of shipment. The Company’s liability is limited to the cost of repair or replacement of the defective part. The Company does not consider activities related to such warranties to be a separate performance obligation under ASC 606. The terms and conditions of sale generally do not allow for refunds or product returns other than for warranty repairs. The Company does not have significant product warranty related costs or liabilities.liabilities for the years ended January 1, 2023, January 2, 2022 and January 3, 2021.
Leases
The Company adopted ASU No. 2016-02, Leases (Topic 842) accounts for leases under ASC842and related ASUs, which provide supplementary guidance and clarifications on December 31, 2018, utilizing the modified retrospective transition method. There was no cumulative-effect adjustment required upon adoption. Additionally, the Company elected the practical expedient approach and did not reassess whether any contracts that existed prior to adoption have or contain leases or the classification of our existing leases.
ASUs. Under Topic ASC 842, all significant lease arrangements are generally recognized at the lease commencement. Operating lease right-of-use, or ROU,commencement date. Right-of-use ("ROU") assets and lease liabilities are recognized atrecorded in the commencement date. A ROU asset and corresponding lease liability is not recorded for leases with an initial term of 12 months or less (short term leases) and the Company recognizes lease expense for these leases as incurred over the lease term.
ROU assets represent the Company’s right to use an underlying asset during the reasonably certain lease terms and leaseCompany's consolidated balance sheet. Lease liabilities represent the Company’s obligation to makepresent value of our future lease payments arising fromover the lease. The Company’sexpected lease terms may includeterm, which includes options to extend or terminate the lease when it is reasonably certain that wethose options will exercise that option. Operatingbe exercised. We determine if an arrangement is a lease ROU assets andat inception. When an arrangement is a lease, the Company determines if it is an operating lease or a finance lease. Lease liabilities are recognized at commencement date based onrepresent the present value of our future lease payments over the expected lease term.term, which includes options to extend or terminate the lease when it is reasonably certain those options will be exercised. The Company primarily uses its incremental borrowing rate, based on the information available at commencement date, in determining the present value of a lease payments. The
operatingliability is determined using our incremental collateralized borrowing rate at lease inception. ROU assets represent our right to control the use of the leased asset during the lease and are recognized in an amount equal to the lease liability for leases with an initial term greater than 12 months. An ROU asset may also includes anyinclude lease payments related to initial direct cost and prepayments and excludes lease incentives. Lease expense is recognizedWe do not apply lease recognition requirements to lease arrangements having terms twelve months or less, Instead we recognize payments in the consolidated statement of operations as rental costs on a straight-line basis over the lease term. The Company has lease agreements withwhich contain lease and non-lease components; non-lease components which are generally accounted for separately.
In accordance with ASU No. 2016-02, the Company recognized right-of-use
The Company’s ROU assets ofwere approximately $975,000$1.4 million and $1.5 million and lease liabilities ofwere approximately $939,000and $1.4 million and $1.6 million on the Company’s Consolidated Balance Sheet as of March 31, 2019, with no material impact to its Consolidated Statements of Operations. As of December 29, 2019, the Company’s right-of-use assets was approximately $2.4 million consolidated balance sheets at January 1, 2023 and lease liability was approximately $2.3 million as presented on the Company’s Consolidated Balance Sheet.January 2, 2022, respectively. See Note 87 for additional information.
Business Combinations
When the Company acquires a business, it allocates the purchase price to the Consolidated Financial Statementsacquired tangible assets and assumed liabilities, including deferred revenue, liabilities associated with the fair value of contingent consideration and acquired identifiable intangible assets with finite lives. Any residual purchase price is recorded as goodwill. The allocation of the purchase price requires the Company to make significant estimates in determining the fair values of these acquired assets and assumed liabilities, intangible assets with finite useful lives, and goodwill. These estimates are based on information obtained from management of the acquired companies, the Company's assessment of this information, and historical experience. These estimates can include, but are not limited to, the cash flows that an acquired business is expected to generate in the future, the cash flows that specific assets acquired with that business are expected to generate in the future, the appropriate weighted average cost of capital, and the cost savings expected to be derived from acquiring an asset. These estimates are inherently uncertain and unpredictable, and if different estimates were used, the purchase price for more details.the acquisition could be allocated to the acquired assets and assumed liabilities differently from the allocation that the Company has made to the acquired assets and assumed liabilities. In addition, unanticipated events and circumstances may occur that may affect the accuracy or validity of such estimates, and if such events occur, the Company may be required to adjust the value allocated to acquired assets or assumed liabilities and may impact the useful life assigned to intangible assets with finite useful lives, which would impact amortization expense of intangible assets with finite useful lives and results of operations.
Business Combinations
The Company recognizes assets acquired (including goodwill and identifiable intangible assets)assets with finite useful lives) and liabilities assumed at fair value on the acquisition date. Subsequent changes to the fair value of such assets acquired and liabilities assumed are recognized in earnings, after the expiration of the measurement period, a period not to exceed 12 months from the acquisition date. Acquisition-related expenses and acquisition-related restructuring costs are recognized in earnings in the period in which they are incurred.
Goodwill and Intangible Assets
Goodwill represents the excess fair value of consideration transferred over the fair value of net assets acquired a in business combinations.combination. The carrying value of goodwill and indefinite lived intangible assets with indefinite useful lives are not amortized but are annually tested for impairment during the Company's fourth fiscal quarter, and more often if there is an indicator of impairment. InSubsequent to the first quarterCompany's annual impairment testing at the end of 2019, the CompanyNovember 2022 and 2021, there were no indicators of impairment that gave cause for additional impairment testing of goodwill. No impairment of goodwill has been recognized Goodwill of $282,000 due to tax benefits that arised fromdate.
Acquired intangible assets acquired in the SensiML acquisition. Goodwill was trued-up to $185,000 during the measurement period, which is 12 months from the date of acquisition and therefore the change was accounted for as acquisition accounting.
Intangible assets with finite useful lives are amortized on a straight-line basis over the periods benefited. The Company reviews the recoverability of its long-lived assets when events or changes in circumstances occur that indicate that the carrying value of the asset or asset group may not be recoverable. The assessment of possible impairment is based on the Company's ability to recover the carrying value of the asset or asset group from the expected future pre-tax cash flows (undiscounted and without interest charges) of the related operations. If these cash flows are less than the carrying value of such asset, an impairment loss is recognized for the difference between estimated fair value and carrying value. The measurement of impairment requires management to estimate future cash flows and the fair value of long-livedthese assets. The Company performed an annual impairment assessment in November 2022 and 2021 and deemed no impairment was necessary for the current year. No impairment of intangible assets has been recognized to-date.
Restricted cash
Restricted cash represents amounts pledged as cash security related to the Company’s credit cards.
Advertising
Advertising
Costs related to advertising and promotion expendituresexpenses are charged to “Selling,“selling, general and administrative” expense in the consolidated statements of operations as incurred. Costs related to advertisingAdvertising and promotion expendituresexpenses were $146,000 in 2019, $93,000 in 2018,$40 thousand, $47 thousand and $95,000 in 2017.$76 thousand for the years ended January 1, 2023, January 2, 2022 and January 3, 2021, respectively.
Stock-Based Compensation
The Company grants stock-based compensation under its stock plan (the "Plan") to eligible employees and non-employee directors and grants stock-based compensation under an employee stock purchase plan ("ESPP") for all eligible employees. The Company accounts for stock-based compensation under the provisions of the amended authoritative guidance, and related interpretations which require the measurement and recognition of expense related to the fair value of stock-based compensation awards. The fair value of stock-based compensation awards is measured at the grant date and re-measured upon modification, as appropriate. The Company uses the Black-Scholes option pricing model to estimate the fair value of employee stock options and rights to purchase shares under the Company’s 1999 Employee Stock Purchase Plan, or ESPP, consistent with the provisions of the amended authoritative guidance.shares. The
fair value of restricted stock awards, or RSAs, and restricted stock units, or RSUs,and performance-based restricted stock units is based on the closing price of the Company’s common stock on the date of grant. Equity compensation
Accounting for Income Taxes
The Company is
Significant management judgment is required in determining To the Company’s provision for income taxes, the Company’s deferred tax assets and liabilities and any valuation allowance recorded against the Company's net deferred tax assets. The Company’s deferred tax assets, consisting primarily of net operating loss carryforwards, amounted to $58 million tax effected as of the end of 2019. The Company has also recordedextent we establish a valuation allowance of $58 million,or increase this allowance in a period, we must include an expense within the tax effected, as of the end of 2019 due to uncertainties related to the Company’s ability to utilize its U.S. deferred tax assets before they expire. In making such determination, the Company considers all available positive and negative evidence, including future reversals of existing taxable temporary differences, ability to project future taxable income, and results of recent operations. If the Company determines that it would be able to realize its deferred tax assetsprovision in the future in excessstatements of its net recorded amount, the Company would make an adjustment to the deferred tax assets valuation allowance, which would reduce its provision for income taxes.
operations.
Concentrations of Credit and Suppliers
Financial instruments, which potentially subject the Company to concentrations of credit risk, consist principally of cash and cash equivalents and accounts receivable. Cash and cash equivalents are maintained with high quality institutions. The Company’s accounts receivables are denominated in U.S. dollars and are derived primarily from sales to customers located in North America, Europe and Asia Pacific. The Company performs ongoing credit evaluations of its customers and generally does not require collateral.collateral. See Note 1413 for information regarding concentrations associatedassociated with accounts receivable.
The Company depends on a limited number of contract manufacturers, subcontractors, and suppliers for wafer fabrication, assembly, programming and test of its devices,hardware products, and for the supply of programming equipment, and these services are typically provided by one supplier for each of the Company’s devices.hardware products. The Company generally purchases these single or limited source services through standard purchase orders. Because the Company relies on independent subcontractors to perform these services, it cannot directly control its product delivery schedules, costs
or quality levels. The Company’s future success also depends on the financial viability of its independent subcontractors.
Comprehensive Income (Loss)
Comprehensive income (loss) includes all temporary changes in equity (net assets) during a period from non-owner sources. The Company’s comprehensive loss equaledaccounts receivables are denominated in U.S. dollars and are derived primarily from sales to customers located in North America, Asia Pacific, and Europe. The Company performs ongoing credit evaluations of its customers and generally does not require collateral. See Note 13 for additional information.
Comprehensive Loss
The net loss in the consolidated statements of operations for all periods presented.each of the years ended January 1, 2023, January 2, 2022 and January 3, 2021 is the same as the consolidated comprehensive loss.
Recently Adopted New Accounting Pronouncements:Pronouncements
In January 2017,May 2021, ASU No.2021-04, Earnings Per Share (Topic 260), Debt— Modifications and Extinguishments (Subtopic 470-50), Compensation—Stock Compensation (Topic 718), and Derivatives and Hedging— Contracts in Entity’s Own Equity (Subtopic 815-40): Issuer’s Accounting for Certain Modifications or Exchanges of Freestanding Equity-Classified Written Call Options a consensus of the FASB Emerging Issues Task Force, was issued Accounting Standardsto clarify the accounting for modifications or exchanges of freestanding equity-classified written call options, such was warrants, that remain equity classified after modification or exchange. The amendments in this Update ASU No. 2017-04, Simplifying the Test for Goodwill Impairment, which simplifies the subsequent measurement of goodwill. Goodwill impairment will equal the amount by which a reporting unit’s carrying value exceeds its fair value, not to exceed the carrying amount of goodwill. Furthermore, the ASU eliminates the requirements for any reporting unit with a zero or negative carrying amount to perform a qualitative assessment and, if it fails that qualitative test, to perform step 2 of the goodwill impairment test. The guidance will be applied prospectively, and isare effective for annual and interim goodwill impairment tests inall entities for fiscal years beginning after December 15, 2019.2021, including interim periods within those fiscal years. An entity should apply the amendments prospectively to modifications or exchanges occurring on or after the effective date of the amendments. Early adoption is permitted for any impairment tests performed on testing dates after January 1, 2017. The Company has electedall entities, including adoption in an interim period. If an entity elects to early adopt the amendments in this Update in an interim period, the guidance effective December 31, 2018 for the goodwill impairment test, which willshould be performed annually on December 1st . The adoption of this guidance did not have a material impact on the Company’s consolidated financial statements.
In February 2018, FASB issued ASU No. 2018-02, Income Statement - Reporting Comprehensive Income. The new standard provides companies with an option to reclassify stranded tax effects resulting from enactmentapplied as of the Tax Cuts and Jobs Act, or TCJA, from accumulated other comprehensive income to retained earnings. The guidance will be effective for the Company beginning in the first quarter of 2019 with early adoption permitted, and would be applied either in the period of adoption or retrospectively to each period (or periods) in which the effect of the change in the tax rate as a result of TCJA is recognized.fiscal year that includes that interim period. The Company adopted this ASU No.2021-04on December 31, 2018 with January 3, 2022 and it had no material impact on its results of operations,our consolidated financial position and cash flows.statements or related disclosures.
New Accounting Pronouncements Pending Adoption
In March 2018, FASB issued ASU No. 2018-05, Income Taxes (Topic 740). The new standard allows to insert the SEC’s interpretive guidance from Staff Accounting Bulletin, or SAB, No.118, into the income tax accounting codification under U.S. GAAP. The ASU permits companies to use provisional amounts for certain income tax effects of the Tax Act during a one-year measurement period. The provisional accounting impacts for the Company may change in future reporting periods until the accounting analysis is finalized, which will occur no later than the first quarter of fiscal 2019. The Company completed its SAB No.118 analysis with no material impact to the consolidated financial statements.
In June 2018, 2022, the FASB issued ASU No. 2018-07, Improvements2022-03,Fair Value Measurement (Topic820)Fair Value Measurement of Equity Securities Subject to Nonemployee Share-Based Payment Accounting. Currently, share-based paymentsContractual Sale Restrictions to nonemployeesclarify the measurement of the fair value of an equity security subject to contractual restrictions that prohibit the sale of an equity security and requires disclosures related to these types of equity securities. For public business entities, the amendments in this Update are accounted for under Subtopic 505-50, which significantly differs from the guidance for share-based payments to employees under Topic 718. This ASU supersedes Subtopic 505-50 by expanding the scope of Topic 718 to include nonemployee awards and generally aligning the accounting for nonemployee awards with the accounting for employee awards. The effective date for public companies is for fiscal years beginning after December 15, 2018, 2023, and interim periods within those fiscal years. For all other entities, the effective dateEarly adoption is fiscal years beginning after December 15, 2019. permitted for both interim and annual financial statements that have not yet been issued or made available for issuance. The Company adoptedadoption of this ASU on December 31, 2018 with no materialis not expected to have an impact on its resultsthe Company's consolidated financial statements or disclosures.
In August 2018, 2020, the FASB issued ASU No. 2018-13, Fair Value Measurement (Topic 820)2020-06,Debt—Debt with Conversion and Other Options (Subtopic470-20) and Derivatives and Hedging—Contracts in Entity’s Own Equity (Subtopic815-40): Disclosure Framework - Changes toAccounting for Convertible Instruments and Contracts in an Entity’s Own Equity, which address issues identified as a result of the Disclosure Requirementscomplexity associated with applying generally accepted accounting principles for Fair Value Measurement. This new standard modifies certain disclosure requirements on fair value measurements. This new standard will befinancial instruments with characteristics of liabilities and equity. The amendments in this Update are effective for public business entities that meet the definition of a Securities and Exchange Commission (SEC) filer, excluding entities eligible to be smaller reporting companies on January 1, 2020. The Company is currently evaluatingas defined by the impact of the pending adoption of the new standard on the consolidated financial statements.
In August 2018, the FASB issued ASU No. 2018-15, Intangibles - Goodwill and Other – Internal-Use Software (Subtopic 350-40):Customer’s Accounting for Implementations Costs Incurred in a Cloud Computing Arrangement That is a Service Contract. Under the new standard, implementations costs related to a cloud computing arrangement will be deferred or expensed as incurred, in accordance with the existing internal-use software guidance for similar costs. The new standard also prescribes the balance sheet, income statement and cash flow classification of the capitalized implementation costs and related amortizations expenses. The effective date for public companies isSEC, for fiscal years beginning after December 15, 2019, and2021, including interim periods within those fiscal years. The amendments may be applied either retrospectively or prospectively to all implementation costs incurredEarly adoption is permitted, but no earlier than Fiscal Years beginning after the date of adoption.December 15, 2020, including interim periods within those Fiscal Years. The Company is currently evaluating the impact of the pending adoption of the new standardASU No.2020-06 is not expected to have an impact on theour consolidated financial statements.statements or related disclosures.
NOTE 3-NET3—NET LOSS PER SHARE
Basic net loss per share is computed by dividing net loss available to common stockholders by the weighted average number of common shares outstanding during the period. Diluted net loss per share was computed using the weighted average number of common shares outstanding during the period plus potentially dilutive common shares outstanding during the period under the treasury stock method. In computing diluted net loss per share, the weighted average stock price for the period is used in determining the number of shares assumed to be purchased from the exercise of stock options and warrants.
For 2019, 2018 and 2017, 563,000
Approximately 0.8 million shares, 435,0000.7 million shares, and 476,0000.9 million shares respectively, associated with equity awards outstanding and the estimated number of shares to be purchased under the current offering period of the 2009 Employee Stock PurchaseESPP Plan were not included in the calculation of diluted net loss per share, as they were considered antidilutive due to the net loss the Company experienced during those years.in the years ended January 1, 2023, January 2, 2022 and January 3, 2021, respectively. Warrants to purchase up to 386,0000.4 million shares were issued in connection with May 29, 2018 stock offering were also not included in the diluted loss per share calculation for the year ended December 29, 2019 and December 30, 2018 as they were also considered anti-dilutive due to the net loss the Company experienced during these periods.
On December 6, 2019,in the Board of Directors of the Company approved a 1-for-14 reverse stock split of the Company’s outstanding common stock, which became effective on December 23, 2019. The reverse stock split was previously approved by the Company’s shareholders in a special meeting held on November 26, 2019. Accordingly, all share, equity award,years ended
January 3, 2021.
NOTE 4-BALANCE4—BALANCE SHEET COMPONENTS
|
| December 29, 2019 |
|
| December 30, 2018 |
| January 1, | January 2, | ||||||||
|
| (in thousands) |
| 2023 | 2022 | |||||||||||
(in thousands) | ||||||||||||||||
Accounts receivable: | ||||||||||||||||
Trade account receivables | $ | 2,707 | $ | 1,113 | ||||||||||||
Less: Allowance for doubtful accounts | (18 | ) | (62 | ) | ||||||||||||
| $ | 2,689 | $ | 1,051 | |||||||||||||
Inventories: |
|
|
|
|
|
|
|
| ||||||||
Raw material |
| $ | 222 |
|
| $ | 191 |
| ||||||||
Work-in-process |
|
| 2,370 |
|
|
| 2,929 |
| $ | 1,826 | $ | 1,397 | ||||
Finished goods |
|
| 668 |
|
|
| 716 |
| 667 | 681 | ||||||
|
| $ | 3,260 |
|
| $ | 3,836 |
| $ | 2,493 | $ | 2,078 | ||||
Other current assets: |
|
|
|
|
|
|
|
| ||||||||
Prepaid expenses |
| $ | 1,296 |
|
| $ | 1,483 |
| $ | 1,305 | $ | 921 | ||||
Other |
|
| 269 |
|
|
| 292 |
| 265 | 260 | ||||||
|
| $ | 1,565 |
|
| $ | 1,775 |
| $ | 1,570 | $ | 1,181 | ||||
Property and equipment: |
|
|
|
|
|
|
|
| ||||||||
Equipment |
| $ | 10,694 |
|
| $ | 10,607 |
| $ | 10,133 | $ | 10,341 | ||||
Software |
|
| 1,789 |
|
|
| 2,788 |
| 1,803 | 1,878 | ||||||
Furniture and fixtures |
|
| 36 |
|
|
| 42 |
| 65 | 32 | ||||||
Leasehold improvements |
|
| 474 |
|
|
| 712 |
| 466 | 466 | ||||||
|
|
| 12,993 |
|
|
| 14,149 |
| 12,467 | 12,717 | ||||||
Accumulated depreciation and amortization |
|
| (12,163 | ) |
|
| (12,700 | ) | (12,002 | ) | (12,218 | ) | ||||
|
| $ | 830 |
|
| $ | 1,449 |
| $ | 465 | $ | 499 | ||||
Capitalized internal-use software: |
|
|
|
|
|
|
|
| ||||||||
Capitalized during the year |
| $ | 365 |
|
|
| — |
| ||||||||
Capitalized software held for internal use | $ | 2,370 | $ | 1,699 | ||||||||||||
Accumulated amortization |
|
| (32 | ) |
|
| — |
| (856 | ) | (458 | ) | ||||
|
| $ | 333 |
|
|
| — |
| $ | 1,514 | $ | 1,241 | ||||
Accrued liabilities: |
|
|
|
|
|
|
|
| ||||||||
Employee compensation related accruals |
|
| 713 |
|
|
| 1,154 |
| ||||||||
Accrued compensation | $ | 865 | $ | 740 | ||||||||||||
Accrued employee benefits | 40 | 111 | ||||||||||||||
Accrued payroll tax | 57 | 102 | ||||||||||||||
Other |
|
| 420 |
|
|
| 749 |
| 547 | 712 | ||||||
|
| $ | 1,133 |
|
| $ | 1,903 |
| $ | 1,509 | $ | 1,665 | ||||
The Company recorded depreciation and amortization expense of $1.2$0.7 million, $1.3$0.6 million and $1.4$0.8 million for the fiscal years 2019, 2018 ended January 1, 2023, January 2, 2022 and 2017, respectively.January 3, 2021, respectively. No interest was capitalized for any period presented. Fiscal year 2019 depreciation
Depreciation and amortization of $1.2expense included approximately $0.4 million, includes $32,000 of$0.5 million and $0.1 million in amortization expense of capitalized internal-use software.
NOTE 5-BUSINESS ACQUISITION
SensiML Acquisition
On software for the years ended
SensiML has a software toolkit enabling IoT developers to quickly and easily create smart devices, transforming rich sensors into actionable event detectors.
SensiML’s Analytics Toolkit is an end-to-end software suite that provides OEMs a straightforward process for developing pattern matching sensor algorithms using machine learning technology that are optimized for ultra-low power consumption. The SensiML Analytics Toolkit enables OEMs to quickly and easily leverage the power of local AI in edge, endpoint and wearable designs without the need for significant Data Science or Firmware Engineering resources.
The results of operations for the Company for the fiscal year ended December 29, 2019 include operating activity for SensiML since its acquisition date of January 32021
intangible assets, were included in the statements of operations for respective periods. Deal costs associated with the acquisition were $104,000 for the fiscal year ended December 29, 2019. Deal costs were included in general and administrative expenses in the Company’s consolidated results of operations.
Purchase Price Allocation
Under the purchase accounting method, the total purchase price was allocated to SensiML’s net tangible and intangible assets based upon their estimated fair values as of the acquisition date. The excess purchase price over the value of the net tangible and identified intangible assets was recorded as goodwill. During the measurement period, which can be no more than one year from the date of acquisition, the Company obtained information to determine the final fair value of the net assets acquired at the acquisition date. Assets acquired and liabilities assumed are recorded based on valuations derived from estimated fair value assessments and assumptions used by the Company. The Company finalized the valuation with no change of acquired assets and liabilities as of December 29, 2019. In the first quarter of 2019, the Company recognized a Goodwill of $282,000 due to recording a deferred tax liability that arose from intangible assets acquired in the SensiML acquisition. Goodwill was trued-up at $185,000 during the measurement period, which is 12 months from the date of acquisition and therefore the change was accounted for in acquisition accounting.
Intangible assets associated with the acquisition is primarily attributable to the future technology, market presence and knowledgeable and experienced workforce. The fair value assigned to identifiable intangible assets acquired was determined using the income approach taking into account the Company’s consideration of a number of inputs, including an independent third-party analysis that was based upon estimates and assumptions provided by the Company. These estimates and assumptions were determined through established and generally accepted valuation techniques. The estimated fair value of the tangible and intangible assets acquired was allocated at SensiML’s acquisition date. Goodwill is not amortized for financial accounting purposes and is not expected to be deductible for income tax purposes.respectively.
The Stock Purchase Agreement contains customary representations and warranties between the Company and SensiML, who agreed to indemnify each other for certain breaches
NOTE 6-INTANGIBLE5-—INTANGIBLE ASSETS
The following table provides the details of the carrying value of intangible assets recorded from the 2019acquisition of SensiML during the year ended December 29, 2019at January 1, 2023 (in thousands):
|
| December 29, 2019 |
| |||||||||
|
| Gross Carrying Amount |
|
| Accumulated Amortization |
|
| Net Carrying Amount |
| |||
Developed technology |
| $ | 959 |
|
| $ | (96 | ) |
| $ | 863 |
|
Customer relationships |
|
| 81 |
|
|
| (40 | ) |
|
| 41 |
|
Trade names and trade marks |
|
| 116 |
|
|
| (12 | ) |
|
| 104 |
|
Total acquired identifiable intangible assets |
| $ | 1,156 |
|
| $ | (148 | ) |
| $ | 1,008 |
|
January 1, 2023 | ||||||||||||||||
Remaining Useful Life | Gross Carrying Amount | Accumulated Amortization | Net Carrying Amount | |||||||||||||
Developed technology | 6 | $ | 959 | $ | (383 | ) | $ | 576 | ||||||||
Customer relationships | — | 81 | (81 | ) | — | |||||||||||
Trade names and trademarks | 6 | 116 | (47 | ) | 69 | |||||||||||
Total acquired identifiable intangible assets | $ | 1,156 | $ | (511 | ) | $ | 645 | |||||||||
The following table provides the details of the carrying value of intangible assets recorded from the 2019 acquisition of SensiML at January 2, 2022 (in thousands):
January 2, 2022 | ||||||||||||||||
Remaining Useful Life | Gross Carrying Amount | Accumulated Amortization | Net Carrying Amount | |||||||||||||
Developed technology | 7 | $ | 959 | $ | (288 | ) | $ | 672 | ||||||||
Customer relationships | — | 81 | (81 | ) | — | |||||||||||
Trade names and trademarks | 7 | 116 | (35 | ) | 81 | |||||||||||
Total acquired identifiable intangible assets | $ | 1,156 | $ | (404 | ) | $ | 753 | |||||||||
The following table provides the details of future annual amortization of intangible assets, based upon the current useful lives as of December 29, 2019at January 1, 2023 (in thousands):
Amount | ||||
Annual Fiscal Years | ||||
2023 | $ | 107 | ||
2024 | 107 | |||
2025 | 107 | |||
2026 | 107 | |||
2027 | 107 | |||
Thereafter | 110 | |||
Total | $ | 645 | ||
|
| Amount |
| |
Annual Fiscal Years |
|
|
|
|
2020 |
|
| 149 |
|
2021 |
|
| 107 |
|
2022 |
|
| 107 |
|
2023 |
|
| 107 |
|
2024 |
|
| 107 |
|
Thereafter |
|
| 431 |
|
Total |
| $ | 1,008 |
|
NOTE 6—DEBT OBLIGATIONS
NOTE 7-OBLIGATIONS
Revolving Line of Credit
On September 28,December 21, 2018, the Company entered into a Loan and Security Agreement, orloan agreement, the Loan Agreement withQuickLogic Corporation Heritage Bank. The Loan Agreement provided for, among other things, the Revolving Facility with aggregate commitmentsBank of $9,000,000.
On December 21, 2018, the Company entered into anCommerce Amended and Restated Loan and Security Agreement, or the Amended and Restated Loan Agreement(the "Loan Agreement") with Heritage Bank which among things, provides a revolving line of credit facility ("Revolving Facility") allowing the Company to replace in its entiretydraw advances up to $15.0 million. The Revolving Facility, as amended, includes a number of customary and restrictive financial covenants including maintaining certain minimum cash levels with the Loan Agreement.lender. The Amended and Restated Loan Agreement increasedRevolving Facility bears an annual facility fee of $45 thousand payable on each December 31. Advances under the Revolving Facility from $9,000,000bear a variable annual interest rate equal to $15,000,000. The Amended and Restated Loan Agreement requires one half of one percentage point (0.50%) above the prime rate. On December 31, 2022, the Company and Heritage Bank amended the maturity date for advances under the Revolving Facility to maintain at least $3,000,000 in unrestricted cash at Heritage Bank. December 31, 2024. The Company washad a $15.0 million outstanding balance on the Revolving Facility as of January 1, 2023 and January 2, 2022, with interest rates of 8.00% and 3.75% for years ended January 1, 2023 and January 2, 2022, respectively.
We were in compliance with all loan covenants under the Amended and Restated Loan Agreement, as amended as of the end of the current reporting period.
On November 6, 2019 the Company entered into a First Amendment to the Amended and Restated Loan Agreement to extend the maturity date of the Revolving Facility for one year through September 28, 2021. Under this amendment, the Revolving Facility advances shall bear interest, on the outstanding daily balance thereof, at a rate per annum equal to the greater of (i) one half of one percentage point (0.50%) above the Prime Rate, or (ii) five and one half of one percentage points (5.50%).
As of December 29, 2019 and December 30, 2018, the Company had $15.0 million of revolving debt outstanding with an interest rates of 5.50% and 6.0% per annum, respectively. On January 2, 2020 and January 6, 2020, the Company repaid $10.0 million and $2.0 million respectively, of its outstanding debt under the Revolving Facility with Heritage Bank.
The Bank has a first priority security interest in substantially all of the Company’s tangible and intangible assets to secure any outstanding amounts under the Loan Agreement.
NOTE 8-LEASES
ThePayroll Protection Program Loan
On May 6, 2020, the Company entered into a loan agreement with Heritage Bank (“PPP Loan”) for a loan of $1.2 million pursuant to the Paycheck Protection Program under the Coronavirus Aid, Relief, and Economic Security Act ("CARES Act") as implemented by the U.S. Small Business Administration enacted on March 27, 2020.
The PPP Loan was evidenced by a promissory note (“Note”) dated May 6, 2020, maturing two years from the disbursement date. The Note bore interest at a rate of 1.00% per annum, with the firstsix months of interest deferred. Principal and interest were payable monthly commencing six months after the disbursement date. Principal and interest were allowed to be prepaid by the Company at any time prior to maturity with no prepayment penalties. The Note contained customary events of default relating to, among other things, payment defaults or breaches of the terms of the Note. Upon the occurrence of an event of default, the lender may require immediate repayment of all amounts outstanding under the Note. The Company applied for loan forgiveness in the fourth quarter of fiscal 2020, in accordance with the terms under the CARES Act. On January 26, 2021, the Company received a notice from Heritage Bank that amounts under the PPP Loan had been forgiven. The Company recorded the loan forgiveness under gain on forgiveness of PPP Loan on its consolidated statement of operations in the year ended January 2, 2022.
NOTE 7—LEASES
The Company's principal research and development and corporate facilities are leased office buildings located in the United States. These lease facilities are classified as operating leases. Operating leases for office space for its headquarters, domestic and foreign subsidiaries and sales offices.generally have lease terms of 1 year to 5 years. Finance leases are primarily for engineering design software. Operating leases generallysoftware and have lease terms of 1 year to 5 years. Finance leases are generally 2 years to 3 years. During the fiscal year ended December 29, 2019,The Company's corporate facility is located at 2220 Lundy Avenue, San Jose, California, 95131, where the Company recognized right-of-use assets of approximately $2.4 million and lease liability of approximately $2.3 million relating to the operating leases signed for the premises of its headquarters in San Jose, its San Diego office and its subsidiary SensiML in Oregon. The Company exited Sunnyvale premises lease in July 2019.
During 2018, the Company leased its primary facility under a non-cancelable operating lease that expires in March 2020. In October 2018, the Company submitted a nine months termination notice to the landlord to end the lease in July 2019. On February 13, 2019, the Company entered into an agreement to leaseoccupies approximately 24,164 square feet of premises located at 2220 Lundy Avenue, San Jose, CA 95131 for a period of space. The five years, effective April 15, 2019 to relocate its headquarters.
In October 2018, the Company leased a facility for research and development-year lease was entered into in San Diego, California, the lease of which expires in July 2020.
In April 2019, the Company leased a facility for itsFebruary 2019. The Company's SensiML subsidiary in Beaverton, Oregon theoccupies approximately 705 square feet of space. The four-year lease was entered into in April 2019. The Company expects to renew this lease in Fiscal 2023 under similar terms.The Company maintains sales offices out of which expiresit conducts sales and marketing activities in March 2021.
In addition,various countries outside of the Company rents development facilities in India as well asUnited States. The sales offices in Europe and Asia.are rented under short-term leases. Total rent expense during 2019, 2018 and 2017 was approximately $798,000, $881,000$0.4 million, $0.4 million and $866,000$0.5 million for the years ended January 1, 2023, January 2, 2022 and January 3, 2021, respectively.
The Company believes that these facilities are adequate for its current needs.
The following table provides the activity related to operating and finance leases (in thousands:thousands):
January 1, 2023 | January 2, 2022 | |||||||
Operating lease costs: | ||||||||
Fixed | $ | 409 | $ | 402 | ||||
Short term | 11 | 23 | ||||||
Total | $ | 420 | $ | 425 | ||||
Finance lease costs: | ||||||||
Amortization of ROU asset | $ | 437 | $ | 700 | ||||
Interest | 23 | 69 | ||||||
Total | $ | 460 | $ | 769 | ||||
|
| Fiscal Year Ended |
| |
|
| December 29, 2019 |
| |
Operating lease costs: |
|
|
|
|
Fixed |
| $ | 757 |
|
Variable |
|
| - |
|
Short term |
|
| 40 |
|
Total |
|
| 797 |
|
Finance lease costs: |
|
|
|
|
Amortization of ROU asset |
|
| 388 |
|
Interest |
|
| 18 |
|
Total |
| $ | 406 |
|
The following table provides the details of supplemental cash flow information (in thousands):
|
| Fiscal Year Ended |
| |
|
| December 29, 2019 |
| |
Cash paid for amounts included in the measurement of lease liabilities: |
|
|
|
|
Operating cash flows used for operating leases |
| $ | 791 |
|
Operating cash flows used for finance leases |
|
| 24 |
|
Financing cash flows used for financing leases |
|
| 365 |
|
Total |
| $ | 1,180 |
|
Right-of-use assets obtained in exchange for obligations: |
|
|
|
|
Operating leases |
| $ | 2,200 |
|
Finance leases |
|
| 170 |
|
Total |
| $ | 2,370 |
|
January 1, 2023 | January 2, 2022 | |||||||
Cash paid for amounts included in the measurement of lease liabilities: | ||||||||
Operating cash flows used for operating leases | $ | 409 | $ | 402 | ||||
Operating cash flows used for finance leases | 23 | 69 | ||||||
Financing cash flows used for financing leases | 452 | 378 | ||||||
Finance lease | $ | 650 | $ | 1,311 | ||||
The following table provides the details of right-of-useROU assets and lease liabilities as of December 29, 2019 (in thousands):
|
| December 29, 2019 |
| |
Right-of-use assets: |
|
|
|
|
Operating leases |
| $ | 2,200 |
|
Finance leases |
|
| 170 |
|
Total |
| $ | 2,370 |
|
Lease liabilities: |
|
|
|
|
Operating leases |
|
| 1,816 |
|
Finance leases |
|
| 471 |
|
Total |
| $ | 2,287 |
|
January 1, 2023 | January 2, 2022 | |||||||
Right-of-use assets: | ||||||||
Operating leases | $ | 464 | $ | 809 | ||||
Finance leases | 933 | 720 | ||||||
Total | $ | 1,397 | $ | 1,529 | ||||
Lease liabilities: | ||||||||
Operating leases | $ | 507 | $ | 873 | ||||
Finance leases | 887 | 690 | ||||||
Total | $ | 1,394 | $ | 1,563 | ||||
The following table provides the details of future lease payments for operating and finance leases as of December 29, 2019January 1, 2023 and (in thousands):
Annual Fiscal Years |
| Operating |
|
| Finance |
| Operating | Finance | ||||||||
2020 |
| $ | 611 |
|
| $ | 214 |
| ||||||||
2021 |
|
| 493 |
|
|
| 150 |
| ||||||||
2022 |
|
| 409 |
|
|
| 150 |
| ||||||||
2023 |
|
| 421 |
|
|
| — |
| $ | 421 | $ | 491 | ||||
2024 |
|
| 106 |
|
|
| — |
| 106 | 455 | ||||||
Total lease payments |
|
| 2,040 |
|
|
| 514 |
| 527 | 946 | ||||||
Less: Interest |
|
| (224 | ) |
|
| (43 | ) | 20 | 59 | ||||||
Present value of lease liabilities |
| $ | 1,816 |
|
| $ | 471 |
| $ | 507 | $ | 887 | ||||
The following table provides the details of lease terms and discount rates as of December 29, 2019:rates:
| |||||||
| |||||||
Weighted-average remaining lease term (years) | |||||||
Operating leases |
| ||||||
Finance leases |
| ||||||
Weighted-average discount rates: | |||||||
Operating leases | 6.00 | % | |||||
Finance leases |
| % | |||||
NOTE 8—FAIR VALUE MEASUREMENTS
NOTE 9-FAIR VALUE MEASUREMENTS
Pursuant to the accounting guidance for fair value measurements and its subsequent updates, fair value is defined as the price that would be received from selling an asset or paid to transfer a liability in an orderly transaction between market participants at the measurement date. When determining the fair value measurements for assets and liabilities required or permitted to be recorded at fair value, the Company considers the principal or most advantageous market and it considers assumptions that market participants would use when pricing the asset or liability.
The accounting guidance for fair value measurement also specifies a hierarchy of valuation techniques based upon whether the inputs to those valuation techniques reflect assumptions other market participants would use based upon market data obtained from independent sources (observable inputs) or reflect the company’s own assumption of market participant valuation (unobservable inputs). The fair value hierarchy consists of the following three levels:
Level 1 – Inputs are quoted prices in active markets for identical assets or liabilities.
Level 2 – Inputs are quoted prices for similar assets or liabilities in an active market, quoted prices for identical or similar assets or liabilities in markets that are not active, inputs other than quoted prices that are observable and market-corroborated inputs which are derived principally from or corroborated by observable market data.
Level 3 – Inputs are derived from valuation techniques in which one or more significant inputs or value drivers are unobservable.
OurCompany's cash, and cash equivalents include money market account balance of $20.9and restricted cash balances were $19.2 million and money market funds of $262,000 as of December 29, 2019 and December 30, 2018, respectively. Investment$19.6 million, including amounts in money market funds, as of January 1, 2023 and January 2, 2022, respectively. The money market funds are collateral for the company's credit card debt and had a balance of $0.1 million at January 1, 2023 and January 2, 2022. Interest in these funds is earned at a 0.01% annual percentage rate ( "APR"). Due to the short-term nature of the money market funds, the Company believes that carrying value approximates fair value.
In the third quarter of 2021, in connection with a revenue contract with a non-affiliated customer, the Company received shares of the customer's common stock. The full transaction price under the revenue contract was classified within level 1cash plus a non-cash consideration which consisted of a certain amount of the customer's equity. The Company considered the non-cash consideration to be an investment in the customer. The full transaction price was the amount of consideration which the Company received under the contract in exchange for transferring the promised goods and services to the customer. Since the non-cash consideration were shares of common stock that were not publicly traded, the fair value was not readily determinable. The Company considered various valuation methods such as market multiples, guideline public company method, and the Black-Scholes Option Pricing model. Due to limited data for the valuation, the Company ultimately selected the Black Scholes method using back-solve techniques as that was determined to be the most suitable with the available data. The Black Scholes Option Pricing model is a valuation approach that can be used to determine the value of common shares for companies in which there are no, or infrequent, transactions involving common shares. The Company believed that its valuation method for the non-public equity under this arrangement fell under Level 3 in the fair value hierarchy because they were valued using quotedthe value method relied on unobservable market prices for identical assets. Fairinputs. The initial fair value of the money market account balancenon-cash consideration is listed below:
Fair Value at Valuation Date Using: | ||||||||||||||||
Total | Quoted Prices in Active Markets for Identical Assets (Level I) | Significant Other Observable Inputs (Level 2) | Significant Unobservable Inputs (Level 3) | |||||||||||||
Non-marketable equity investment | $ | 300 | $ | — | $ | — | $ | 300 | ||||||||
In arriving at the estimated value for the non-cash consideration, the Company utilized inputs relying on significant judgment in accordance with Heritage Bank equalsthe AICPA Accounting and Valuation Guide, Valuation of Privately Held Company Equity Securities Issued as Compensation (2013). The key assumptions below were utilized:
utilize the practical expedient under ASC 321 by which entities can elect to measure equity securities without readily determinable fair values at “cost minus impairment,” basis for periods subsequent to the acquisition date. Under the “cost minus impairment” methods, when the investment is determined to be impaired on the basis of a qualitative assessment, or there is an observable price change in an orderly transaction, entities that have made the election in ASC 321 must remeasure such equity securities at fair value in accordance with ASC820. ASC 321 indicates that the adjustments to the carrying value of an equity security without a readily determinable fair value should reflect the fair value of the security as of the date that the observable transaction for the similar security took place.
Subsequent to the valuation date and through January 2, 2022, there were no observable indicators of impairment for the non-marketable equity investment. During Fiscal 2022, there were no observable indicators of impairment for the non-marketable equity investment. There was no change to the carrying value of the non-marketable equity investment as of January 1, 2023 and January 2, 2022.
The following table presentscarrying amount of the U.S. non-marketable equity investment was $0.3 million as of as of January 1, 2023 and foreignJanuary 2, 2022.
NOTE 9 —INCOME TAXES
The components of consolidated income (loss)loss before provision of income taxes and the components for the provision for (benefit from) income taxes are as follows (in thousands):
|
| Fiscal Years |
| Fiscal Years | ||||||||||||||||||||
|
| 2019 |
|
| 2018 |
|
| 2017 |
| 2022 | 2021 | 2020 | ||||||||||||
Income (loss) before income taxes: |
|
|
|
|
|
|
|
|
|
|
|
| ||||||||||||
Loss before income taxes: | ||||||||||||||||||||||||
U.S. |
| $ | (15,813 | ) |
| $ | (13,982 | ) |
| $ | (14,253 | ) | $ | (4,116 | ) | $ | (6,461 | ) | $ | (11,170 | ) | |||
Foreign |
|
| 289 |
|
|
| 355 |
|
|
| 209 |
| (53 | ) | (36 | ) | 70 | |||||||
Loss before income taxes |
| $ | (15,524 | ) |
| $ | (13,627 | ) |
| $ | (14,044 | ) | $ | (4,169 | ) | $ | (6,497 | ) | $ | (11,100 | ) | |||
Provision for (benefit from) income taxes: |
|
|
|
|
|
|
|
|
|
|
|
| ||||||||||||
Provision for income taxes: | ||||||||||||||||||||||||
Current: |
|
|
|
|
|
|
|
|
|
|
|
| ||||||||||||
Federal |
| $ | — |
|
| $ | (19 | ) |
| $ | — |
| ||||||||||||
State |
|
| 3 |
|
|
| 2 |
|
|
| 2 |
| $ | 3 | $ | 3 | $ | 3 | ||||||
Foreign |
|
| 108 |
|
|
| 169 |
|
|
| 85 |
| 36 | 22 | 39 | |||||||||
Subtotal |
|
| 111 |
|
|
| 152 |
|
|
| 87 |
| 39 | 25 | 42 | |||||||||
Deferred: |
|
|
|
|
|
|
|
|
|
|
|
| ||||||||||||
Federal |
|
| (141 | ) |
|
| — |
|
|
| — |
| ||||||||||||
State |
|
| (44 | ) |
|
| — |
|
|
| — |
| ||||||||||||
Foreign |
|
| (6 | ) |
|
| — |
|
|
| — |
| 59 | 94 | 9 | |||||||||
Subtotal |
|
| (191 | ) |
|
| — |
|
|
| — |
| 59 | 94 | 9 | |||||||||
Provision for income taxes |
| $ | (80 | ) |
| $ | 152 |
|
| $ | 87 |
| $ | 98 | $ | 119 | $ | 51 | ||||||
The following table presents the rate reconciliationdifference between income tax provisionstaxes computed at the U.S.statutory federal statutoryincome tax rate and the effective rate reflected inprovision for income taxes is attributable to the consolidated statements of operations:following (in thousands):
|
| Fiscal Years |
| Fiscal Years | ||||||||||||||||||||
|
| 2019 |
|
| 2018 |
|
| 2017 |
| 2022 | 2021 | 2020 | ||||||||||||
Income tax (benefit) at statutory rate |
| $ | (3,260 | ) |
| $ | (2,862 | ) |
| $ | (4,775 | ) | ||||||||||||
Income tax benefit at statutory rate | $ | (876 | ) | $ | (1,364 | ) | $ | (2,331 | ) | |||||||||||||||
State taxes |
|
| (42 | ) |
|
| 2 |
|
|
| 2 |
| 3 | 3 | 3 | |||||||||
Foreign taxes | 106 | 124 | 34 | |||||||||||||||||||||
Stock compensation and other permanent differences |
|
| 187 |
|
|
| 252 |
|
|
| 75 |
| 21 | (155 | ) | 171 | ||||||||
Foreign taxes |
|
| 42 |
|
|
| 95 |
|
|
| (30 | ) | ||||||||||||
PPP loan forgiveness | — | (250 | ) | — | ||||||||||||||||||||
R&D tax credits | (318 | ) | (230 | ) | (261 | ) | ||||||||||||||||||
Expired tax attributes | 3,563 | 3,303 | 208 | |||||||||||||||||||||
Future benefit of deferred tax assets not recognized |
|
| 3,133 |
|
|
| 2,684 |
|
|
| 4,815 |
| (2,401 | ) | (1,312 | ) | 2,227 | |||||||
Other |
|
| (140 | ) |
|
| (19 | ) |
|
| — |
| ||||||||||||
Provision for income taxes |
| $ | (80 | ) |
| $ | 152 |
|
| $ | 87 |
| $ | 98 | $ | 119 | $ | 51 | ||||||
Based on the available objective evidence, management believes it is more likely than not that the U.S. net deferred tax assets will not be fully realizable. Accordingly, the Company has provided a full valuation allowance against its U.S. federal and state deferred tax assets at December 29, 2019.January 1, 2023. Any future release of the valuation allowance may be recorded as a tax benefit increasing net income. The Company believes it is more likely than not it will be able to realize its foreign deferred tax assets. Deferred
Significant components of our deferred tax balances are comprisedas follows (in thousands):
| January 1, 2023 | January 2, 2022 | |||||||
Deferred tax assets: | ||||||||
Net operating losses | $ | 43,110 | $ | 45,197 | ||||
Accruals and reserves | 1,284 | 1,347 | ||||||
Credits carryforward | 6,004 | 5,660 | ||||||
Depreciation and amortization | 6,488 | 7,820 | ||||||
Stock-based compensation | 1 | 403 | ||||||
Operating lease liability | 327 | 409 | ||||||
Gross deferred tax assets | 57,214 | 60,836 | ||||||
Deferred tax liabilities: | ||||||||
Right-of-use asset | (328 | ) | (400 | ) | ||||
Withholding tax on future distribution | (125 | ) | (125 | ) | ||||
Gross deferred tax liabilities | (453 | ) | (525 | ) | ||||
Net deferred tax assets | 56,761 | 60,311 | ||||||
Valuation allowance | (56,862 | ) | (60,353 | ) | ||||
Total deferred tax liability | $ | (101 | ) | $ | (42 | ) | ||
Beginning January 1, 2022, the Tax Cuts and Jobs Act (the "Tax Act”) eliminated the option to deduct research and development expenditures in the current year and requires taxpayers to capitalize such expenses pursuant to Internal Revenue Code (“IRC”) Section 174. The capitalized expenses are amortized over a 5-year period for domestic expenses and a 15-year period for foreign expenses. As a result of this provision of the following (in thousands):Tax Act, the Company capitalized $5.4M of research expenses in the current year.
|
| December 29, 2019 |
|
| December 30, 2018 |
| ||
Deferred tax assets: |
|
|
|
|
|
|
|
|
Net operating losses |
| $ | 40,717 |
|
| $ | 37,527 |
|
Capital losses |
|
| — |
|
|
| — |
|
Accruals and reserves |
|
| 1,345 |
|
|
| 1,370 |
|
Credits carryforward |
|
| 5,765 |
|
|
| 5,836 |
|
Depreciation and amortization |
|
| 9,760 |
|
|
| 9,887 |
|
Stock-based compensation |
|
| 637 |
|
|
| 347 |
|
Gross deferred tax assets |
|
| 58,224 |
|
|
| 54,967 |
|
Deferred tax liabilities: |
|
|
|
|
|
|
|
|
Net lease asset/ (liability) |
|
| (23 | ) |
|
| — |
|
Gross deferred tax liabilities |
|
| (23 | ) |
|
| — |
|
Net deferred tax assets/ (liabilities) |
|
| 58,201 |
|
|
| 54,967 |
|
Valuation allowance |
|
| (58,140 | ) |
|
| (54,913 | ) |
Total deferred tax asset/ (liability) |
| $ | 61 |
|
| $ | 54 |
|
assets before they expire.December 29, 2019, the CompanyJanuary 1, 2023, we had federal and state income tax net operating loss ("NOL") carryforwards of approximately $168.7 $175.0 millio n and $91.2million, forrespectively. Approximately $112.4 million in federal and $75.4 million for state income tax purposes. If not utilized, the federal net operating loss for years beginningNOLs generated before January 1, 2018 of $141.6 million will expire beginning in 20202023 through 2038, and federal net operating losses beginning2037. Federal NOLs of $62.9 million generated in years after January 1, l, 2018 of $27.1 million will can be carried forward indefinitely (subject to certain limitations). If not utilized, the state net operating losses will expire beginning in 2020 through 2038.The Company hasforward indefinitely. We had research credit carryforwards of approximately $4.0 $3.9 $4.4 million$5.0 for state income tax purposes as of December 29, 2019.January 1, 2023. If not utilized, the federal carryforwards will expire in various amounts beginning in 2020.2026 through 2041. The California research credit carryforward can be carried forward indefinitely.Jobs Act (the "TCJA") was enacted on December 22, 2017. The Act reduces the USbenefits from these federal corporate tax rate from 35% to 21%, requires companies to payand state NOL and credit carryforwards will not be realized as of January 1, 2023. Accordingly, we established a one-time transition tax on earningsvaluation allowance of certain foreign subsidiaries that were previously tax deferred and creates new taxes on certain foreign sourced earnings. In December 2017, the SEC issued Staff Accounting Bulletin No. 118 (“SAB 118”), which provides guidance on accounting for the income tax effects$56.9 million, tax-effected, as of the TCJA. SAB 118 provides a measurement period that should not extend beyond one year from the TCJA enactment date for companiesFiscal Year ended January 1, 2023 due to complete the accounting relatinguncertainties related to the TCJA under Accounting Standards Codification Topic 740, “Income Taxes” (“ASC 740”). In accordance with SAB 118, the TCJA-related incomeour ability to utilize our U.S. deferred tax effects that we initially reported as provisional estimates were refined as additional analysis was performed. There was no material impact to the balance sheet and income statement recorded when the analysis was completed in the 2018 fourth quarter. The TCJA also includes a provision to tax global intangible low-taxed income ("GILTI") of foreign subsidiaries. In accordance with U.S. GAAP, the Company has made an accounting policy election to treat taxes due under the GILTI provision as a current period expense.2019.2022. The Company intends to reinvest these earnings indefinitely in the Company’s foreign subsidiaries. The Company believes that future domestic cash generation will be sufficient to meet future domestic cash needs. TheIn previous years, the Company has not recorded a deferred tax liability of approximately $0.1 million on the undistributed earnings of non-U.S. subsidiaries. During fiscal 2022, there were no changes to this balance, and at January 1, 2023, the balance for this deferred tax liability was approximately $0.1 million. The foreign withholding taxes would are not expected to have a material impact on the Company’s financial position and results of operation.
Uncertain Tax Positions
Uncertain Tax Positions
A reconciliation of the beginning and ending amount ofChanges in gross unrecognized tax benefits isare as follows (in thousands):
Fiscal Years | ||||||||||||||||||||||||
|
| December 29, 2019 |
|
| December 30, 2018 |
|
| December 31, 2017 |
| 2022 | 2021 | 2020 | ||||||||||||
Beginning balance of unrecognized tax benefits |
| $ | 2,161 |
|
| $ | 2,107 |
|
| $ | 2,014 |
| $ | 2,118 | $ | 2,176 | $ | 2,117 | ||||||
Additions for tax positions related to the prior year |
|
| (46 | ) |
|
| (2 | ) |
|
| 16 |
| ||||||||||||
Additions (subtractions) for tax positions related to the prior year | — | (7 | ) | 38 | ||||||||||||||||||||
Additions for tax positions related to the current year |
|
| 88 |
|
|
| 125 |
|
|
| 77 |
| 185 | 128 | 114 | |||||||||
Lapse of statutes of limitations |
|
| (86 | ) |
|
| (69 | ) |
|
| — |
| (54 | ) | (178 | ) | (93 | ) | ||||||
Ending balance of unrecognized tax benefits |
| $ | 2,117 |
|
| $ | 2,161 |
|
| $ | 2,107 |
| $ | 2,249 | $ | 2,118 | $ | 2,176 | ||||||
Out of $2.1$2.2 million of unrecognized tax benefits, there are no unrecognized tax benefits that would result in a change in the Company's effective tax rate if recognized in future years. The accrued interest and penalties related to uncertain tax positions was not significant for December 29, 2019, December 30, 2018as of January 1, 2023, January 2, 2022 and December 31, 2017.January 3, 2021.
The Company is not currently under tax examination in the U.S. and the Company’s historical net operating loss and credit carryforwards may be adjusted by the Internal Revenue Service, and other tax authorities until the statute closes on the year in which such tax attributes are utilized. The Company estimates that its unrecognized tax benefits will not change significantly within the next twelve months.
The Company is subject to U.S. federal income tax as well as income taxes in many U.S. states and foreign jurisdictions in which the Company operates. The U.S. tax years from 19992003 forward remain effectively open to examination due to the carryover of unused net operating losses and tax credits.
NOTE 10—STOCKHOLDERS’ EQUITY
NOTE 11-STOCKHOLDERS’ EQUITY
Common and Preferred Stock
As of December 29, 2019,January 1, 2023, the Company is authorized to issue 200 million shares of common stock and has 10ten million shares of authorized but unissued undesignated preferred stock. Without any further vote or action by the Company’s stockholders, the Board of Directors has the authority to determine the powers, preferences, rights, qualifications, limitations or restrictions granted to or imposed upon any wholly unissued shares of undesignated preferred stock.
Reverse
Issuance of Common Stock Split
On December 6, 2019, August 17, 2022, the BoardCompany filed a Registration Statement on Form S-3 with the SEC, under which the Company may sell, from time-to-time common stock, preferred stock, depositary shares, warrants, debt securities, and units, individually or as units comprised of Directorsone or more of the Company approvedother securities or a 1-for-14 reverse stock split of the Company’s outstanding common stock, whichcombination thereof. The Company's registration statement became effective on December 23, 2019. The reverseAugust 26, 2022.
On September 14, 2022 and February 9, 2022, the Company entered into common stock split was previously approved bypurchase agreements with certain investors for the Company’s shareholders in a special meeting held on November 26, 2019. At the effective timesale of the reverse stock split, every 14 issuedan aggregate of 487 thousand and outstanding310 thousand shares of common stock, respectively, in registered direct offering direct offerings pursuant to our effective shelf registration statements on Form S-3 (File No.333-266942 and 333-230352, respectively), resulting in net cash proceeds of approximately $3.2 million and $1.5 million, respectively. Issuance costs related to the Companyregistered direct offerings were automatically combined into one issued and outstandingimmaterial. The purchase price for each share of common stock without any change in the par value per share. Stockholders who would have otherwise been entitledSeptember 14, 2022 and in the February 9, 2022 placements were $6.57 and $4.78, respectively.
On September 22,2021, the Company entered into a Share Subscription Agreement for the sale of 125 thousand shares of our common stock. On September 30, 2021, the Company entered into a common stock purchase agreement for the sale of 74 thousand shares of the Company's common stock, in a registered direct offering pursuant to fractional sharesour effective shelf registration statement on Form S-3 (File No.333-230352). The net proceeds to the Company from the Share Placements in aggregate, after deducting equity issuance costs of approximately $45 thousand was approximately $1.0 million. The purchase price for each share of common stock as a result ofin the reverse stock split received a cash payment in lieu of receiving fractional shares. All share, equity awards, and per share amounts contained in this Form 10-K and the accompanying Consolidated Financial Statements have been adjusted to reflect the reverse stock split for all prior periods presented. Warrants issued in connection with the May 2018 stock issuance were also adjusted to reflect the reverse stock split for all the periods presented.Share Placements was $5.43.
Issuance of Common Stock
On June 21, 2019, 22, 2020, the Company closed an underwritten public offering of 1.32.5 million shares of common stock, $0.001 par value per share at a price of $ 7.00 per share, which included 171,429 shares issued pursuant to the underwriters’ full exercise of their over-allotment option. The Company received net proceeds from the offering of approximately $8.0 million, net of underwriter’s commission and other offering expenses paid as of the third quarter of 2019.
On March 15, 2019, the Company filed a shelf registration statement on Form S-3, under which the Company may, from time to time, sell securities in one or more offerings up to a total amount of $75 million. The Company’s shelf registration statement was declared effective on March 29, 2019.
In May 2018, the Company issued an aggregate of 965,251 shares of common stock, $0.001 par value and warrants to purchase up to an aggregate of 386,100 shares of common stock in an underwritten public offering. The common stock and warrants were issued in units, with each unit consisting of (i) one share of common stock and (ii) a warrant to purchase 0.40 of a share of common stock at a price of $16.10$3.50 per Unit.share. The Company received total netgross proceeds from the offering of $13.9approximately $8.8 million and incurred stock issuance costs of approximately $1.1 million. Under the terms of the underwriting agreement, the Company granted the underwriter a 30-day option to purchase up to an additional 375 thousand shares of common stock to cover overallotments and on July 21, 2020 the underwriters partially exercised the option to purchase 142 thousand additional shares of common stock. The Company received gross proceeds of approximately $0.5 million and incurred additional stock issuance costs of approximately $52 thousand from the sale of additional common stock to cover overallotments. Total gross proceeds received from this offering was approximately $9.3 million and total stock issuance costs were approximately $1.2 million. Net proceeds received from this offering after deducting stock issuance costs was approximately $8.1 million.
Warrants exercisable for 386 thousand shares of common stock remain outstanding as of January 1, 2023. The warrants are exercisable any time for a period of 60 months from the date of issuance on through May 29, 2018, and are exercisable 2023 at an exercisablea price of $19.32 per share. The estimated grant date fair value was $7.98 per warrant and was calculated based on the following assumptions used in the Black-Scholes model: expected term of 5 years, risk-free interest rate of 2.58%, expected volatility of 52.75% and expected dividend of zero.
NOTE 12-EMPLOYEE11—EMPLOYEE STOCK PLANS
2009 Stock Plan
The 2009 Stock Plan, or 2009 Plan, was amended and restated by the Board of Directors in January 2015, in February 2017, and in March 15, 2018 and approved by the Company’s stockholders on April 23, 2015, on April 26, 2017 and on April 25, 2018 to, among other things, reserve an additional 178,571, 107,143 and 285,714 shares of common stock, respectively, for issuance under the 2009 Plan.
On April 24, 2019, the QuickLogic Corporation 2009 Stock Plan ("2009 Stock Plan") was replaced by the 2019 Stock Plan with an extended term of ten years through March 15, 2028. Theand the remaining balance of available shares under the 2009 Stock Plan of 299,070 were cancelled as of April 24, 2019.cancelled.
2019 Stock Plan
On April 24, 2019, the Company’s Board of Directors and shareholders approved the QuickLogic Corporation 2019 Stock Plan or ("2019 Stock Plan"). The 2019 Stock Plan to replace the 2009 stock Plan, or the 2009 Plan. was extended ten years through March 15, 2028. Under the 2019 Stock Plan, 357,143357 thousand shares of common stock arewere available for grants, plus any shares subject to any outstanding options or other awards granted under the Company’s 2009 Stock Plan that expire, are forfeited, cancelled, returned to the Company for failure to satisfy vesting requirements, settled for cash or otherwise terminated without payment being made thereunder. The Company's Board of Directors approved and on May 10, 2022, stockholders subsequently ratified an increase in the total number of shares available for future awards under the 2019 Stock Plan. The increase in the total number of shares available for future awards consisted of the sum of (1) 900 thousand, (2) 522 thousand shares which were available for future awards under the plan immediately before such approval and (3) any shares subject to outstanding awards under the 2019 Stock Plan or the 2009 Stock Plan, that are terminated, canceled, surrendered, or forfeited as of May 10, 2022. On May 19, 2022, the Company filed a Registration Statement on Form S-8 with the Securities and Exchange Commission to register an additional nine hundred thousand shares of its common stock that may be issued under the Company’s 2019 Stock Plan.
As of December 29, 2019, approximately 271,507January 1, 2023, approximately 960 thousand shares of thethe Company’s common stock were reserved for issuance under the 2019 Stock Plan.
Options typically vest at a rate of 25% one year after the vesting commencement date, and one forty-eighthforty-eighth for each month of service thereafter. RSUs typically vest at a rate of 25% one year after the vesting commencement date, and oneeighth every six months thereafter. The Company may implement different vesting schedules in the future with respect to any new equity awards.
Employee
2009 ESPP Stock Purchase Plan
The QuickLogic Corporation 2009 Employee Stock Purchase Plan or ("2009 ESPP Stock Plan"), as amended on March 6, 2019, was adopted in March 2009. The 2009 ESPP was amended by the Board of Directors in January 2015 and in February 2017, and was approved by the Company’s stockholders on April 23, 2015 and April 26, 2017, to reserve an additional 71,429 and 107,143 shares of common stock, respectively, for issuance under the 2009 ESPP.
On May 6, 2019, the Board of Directors approved the extension of the term of the 2009 ESPP to Stock Plan extends ten years until March 5, 2029 which also requires the stockholders’ ratification within 12 months of the approval by the Board of Directors. The Company plans to submit the extension of the term of the 2009 ESPP for our stockholders to ratify in the next annual general meeting.
As of December 29, 2019, 62,335 shares were reserved for issuance under the 2009 ESPP. The 2009 ESPPand provides for six month offering periods. Participants purchase shares through payroll deductions of up to to 20% of an employee’s total compensation (maximum of 1,429 shares per offering period). The 2009 ESPP Stock Plan permits the Board of Directors to determine, prior to each offering period, whether participants purchase shares at: (i) 85% of the fair market value of the common stock at the end of the offering period; or (ii) 85% of the lower of the fair market value of the common stock at the beginning or the end of an offering period. The Board of Directors has determined that, until further notice, future offering periods will be made at 85% of the lower of the fair market value of the common stock at the beginning or the end of an offering period.
As of January 1, 2023, approximately 206 thousand shares of the Company’s common stock were reserved for issuance under the 2009 ESPP Stock Plan.
NOTE 13-STOCK-BASED12—STOCK-BASED COMPENSATION
The Company provides stock-based incentive compensation or awards to eligible employees and non-employee directors. Awards that may be granted under the program include non-qualified and incentive stock options, restricted stock awards, restricted stock units or RSUs,("RSU"), and performance-based restricted stock units or PRSUs, and(PRSU") is based on the closing price of the Company’s common stock bonus units.on the date of grant. To date, awards granted under the program consist of stock options, RSUs and PRSUs. The majority of stock-based awards granted under the program vest over four years. Stock options granted under the program have a maximum contractual term of ten years.
Stock-based compensation expense is recognized in the Company’s consolidated statements of operations and includes compensation expense for the stock-based compensation awards granted or modified subsequent to years ended January 1, 2006, based on the grant date fair value estimated in accordance with the provisions of the amended authoritative guidance. The impact on the Company’s results of operations of recording stock-based compensation expense for fiscal years 2019, 2018,2023, January 2, 2022 and 2017 wasJanuary 3, 2021, respectively is as follows (in thousands):
Fiscal Years | ||||||||||||
Stock-based compensation expense included in: | 2022 | 2021 | 2020 | |||||||||
Cost of revenue | $ | 272 | $ | 282 | $ | 162 | ||||||
Research and development | 652 | 843 | 670 | |||||||||
Selling, general and administrative | 1,111 | 1,401 | 907 | |||||||||
Total costs and expenses | $ | 2,035 | $ | 2,526 | $ | 1,739 | ||||||
|
| Fiscal Years |
| |||||||||
|
| 2019 |
|
| 2018 |
|
| 2017 |
| |||
Cost of revenue |
| $ | 78 |
|
| $ | 129 |
|
| $ | 121 |
|
Research and development |
|
| 2,242 |
|
|
| 760 |
|
|
| 614 |
|
Selling, general and administrative |
|
| 824 |
|
|
| 1,012 |
|
|
| 706 |
|
Total costs and expenses |
| $ | 3,144 |
|
| $ | 1,901 |
|
| $ | 1,441 |
|
Fiscal Years | ||||||||||||
Stock-based compensation expense by type of award: | 2022 | 2021 | 2020 | |||||||||
Stock options | $ | — | $ | — | $ | 39 | ||||||
ESPP | 70 | 110 | 39 | |||||||||
RSU and PRSU | 1,965 | 2,416 | 1,661 | |||||||||
Total costs and expenses | $ | 2,035 | $ | 2,526 | $ | 1,739 | ||||||
No stock-based compensation was capitalized or included in inventories atfor the end of 2019, 2018years ended January 1, 2023, January 2, 2022 and 2017.January 3, 2021.
Stock-Based Compensation Award Activity
The following table summarizes the
A roll forward of shares available for grant under the 2019 Plan and 2009 Plan (in thousands): is as follows:
Shares Available for Grant | ||||
Balance at January 3, 2021 | 320 | |||
Authorized | 600 | |||
Options forfeited or expired | 31 | |||
RSUs granted | (619 | ) | ||
RSUs forfeited | 262 | |||
Balance at January 2, 2022 | 594 | |||
Authorized | 900 | |||
RSUs granted | (584 | ) | ||
RSUs forfeited | 50 | |||
Balance at January 1, 2023 | 960 | |||
No stock options were granted during any of the periods presented.
|
| Shares Available for Grant |
| |||||
|
| 2019 Plan |
|
| 2009 Plan |
| ||
Balance at December 30, 2018 |
|
| — |
|
|
| 483 |
|
Authorized |
|
| 357 |
|
|
| — |
|
Options granted |
|
| — |
|
|
| — |
|
Options forfeited or expired |
|
| 26 |
|
|
| 2 |
|
RSUs granted |
|
| (113 | ) |
|
| (240 | ) |
RSUs forfeited |
|
| 2 |
|
|
| 54 |
|
Plan Shares expired |
|
| — |
|
|
| (299 | ) |
Balance at December 29, 2019 |
|
| 272 |
|
|
| — |
|
Stock Options
Stock Options
The following table summarizesA roll forward of stock options outstanding and stock option activity under the 2019 Plan and 2009 Plan, and the related weighted average exercise price, for 2019, 2018 and 2017:is as follows:
|
| Number of Shares |
|
| Weighted Average Exercise Price |
|
| Weighted Average Remaining Term |
|
| Aggregate Intrinsic Value |
| ||||
|
| (in thousands) |
|
|
|
|
|
| (in years) |
|
| (in thousands) |
| |||
Balance outstanding at January 1, 2017 |
|
| 356 |
|
| $ | 32.90 |
|
|
| 4.06 |
|
|
|
|
|
Granted |
|
| — |
|
|
| — |
|
|
|
|
|
|
|
|
|
Forfeited or expired |
|
| (97 | ) |
|
| 42.98 |
|
|
|
|
|
|
|
|
|
Exercised |
|
| (5 | ) |
|
| 18.34 |
|
|
|
|
|
|
|
|
|
Balance outstanding at December 31, 2017 |
|
| 254 |
|
|
| 29.26 |
|
|
| 4.34 |
|
|
|
|
|
Granted |
|
| — |
|
|
| — |
|
|
|
|
|
|
|
|
|
Forfeited or expired |
|
| (10 | ) |
|
| 25.20 |
|
|
|
|
|
|
|
|
|
Exercised |
|
| (15 | ) |
|
| 12.60 |
|
|
|
|
|
|
|
|
|
Balance outstanding at December 30, 2018 |
|
| 229 |
|
|
| 30.52 |
|
|
| 3.70 |
|
|
|
|
|
Granted |
|
| — |
|
|
| — |
|
|
|
|
|
|
|
|
|
Forfeited or expired |
|
| (42 | ) |
|
| 24.14 |
|
|
|
|
|
|
|
|
|
Exercised |
|
| (1 | ) |
|
| 10.92 |
|
|
|
|
|
|
|
|
|
Balance outstanding at December 29, 2019 |
|
| 186 |
|
| $ | 32.09 |
|
|
| 3.32 |
|
| $ | - |
|
Exercisable at December 29, 2019 |
|
| 176 |
|
| $ | 33.20 |
|
|
| 3.13 |
|
| $ | - |
|
Vested and expected to vest at December 29, 2019 |
|
| 185 |
|
| $ | 32.15 |
|
|
| 3.31 |
|
| $ | - |
|
Number of Shares | Weighted Average Exercise Price | Weighted Average Remaining Term | Aggregate Intrinsic Value | |||||||||||||
(in thousands) | (in years) | (in thousands) | ||||||||||||||
Balance outstanding at December 29, 2019 | 186 | $ | 32.09 | |||||||||||||
Forfeited or expired | (65 | ) | 38.83 | |||||||||||||
Balance outstanding at January 3, 2021 | 121 | 28.46 | ||||||||||||||
Forfeited or expired | (28 | ) | 31.68 | |||||||||||||
Balance outstanding at January 2, 2022 | 93 | 27.49 | ||||||||||||||
Forfeited or expired | (18 | ) | 39.72 | |||||||||||||
Outstanding, exercisable, and vested at January 1, 2023 | 75 | $ | 24.50 | 2.80 | $ | — | ||||||||||
There was noThe intrinsic value for the stock options, based on the Company’s closing stock priceprice of $4.58 $5.14 per share as of at December 30, 2022, the endlast trading day of the Company’s current reporting period, was $0 which would have beenbeen received by the option holders had all option holders exercised their options as of that date.
The total intrinsic value of options exercised during 2019, 2018the years ended January 1, 2023, January 2, 2022 and 2017January 3, 2021 was not significant. TotalThe Company did not receive cash received from employees as a result of employeerelated to options exercised and no stock option exercisesoptions were granted during 2019, 2018the years ended January 1, 2023, January 2, 2022 and 2017 was approximately $3,600, $195,000 and $85,000, respectively. January 3, 2021. The Company settles employee stock option exercises with newly issued common shares. In connection with these exercises, there was no tax benefit realized by the Company due to the Company’s current net loss position.
Total stock-based compensation expense recognized related to stock options was $117,000, $131,000, and $239,000 for 2019, 2018, and 2017, respectively. No stock options were granted during the fiscal year 2019, 2018 and 2017. As of the end of 2019, the fair value ofJanuary 1, 2023, there were no unvested stock options, net of expected forfeitures, was approximately $37,000. This unrecognized stock-based compensation expense is expected to be recorded over a weighted average period of 0.69 year.
Significant exercise price ranges of options outstanding, related weighted average exercise prices and contractual life information at the end of 2019 were as follows:options.
|
|
|
| Options Outstanding |
|
| Options Exercisable |
| ||||||||||||||
Range of Exercise Prices |
|
| Options Outstanding |
|
| Weighted Average Remaining Contractual Life |
|
| Weighted Average Exercise Price |
|
| Options Vested and Exercisable |
|
| Weighted Average Exercise Price |
| ||||||
|
|
|
| (in thousands) |
|
| (in years) |
|
|
|
|
|
| (in thousands) |
|
|
|
|
| |||
$12.05 |
|
|
| 52 |
|
|
| 6.69 |
|
| $ | 12.05 |
|
|
| 42 |
|
| $ | 12.05 |
| |
$18.48 - $31.50 |
|
|
| 20 |
|
|
| 2.89 |
|
|
| 28.24 |
|
|
| 20 |
|
|
| 28.24 |
| |
$32.20 - $37.10 |
|
|
| 3 |
|
|
| 3.31 |
|
|
| 32.57 |
|
|
| 3 |
|
|
| 32.57 |
| |
$ | 38.92 |
|
|
| 67 |
|
|
| 0.80 |
|
|
| 38.92 |
|
|
| 67 |
|
|
| 38.92 |
|
$39.48 - $44.94 |
|
|
| 9 |
|
|
| 3.78 |
|
|
| 42.94 |
|
|
| 9 |
|
|
| 42.94 |
| |
$46.62 |
|
|
| 5 |
|
|
| 2.64 |
|
|
| 46.62 |
|
|
| 5 |
|
|
| 46.62 |
| |
$47.04 |
|
|
| 1 |
|
|
| 0.62 |
|
|
| 47.04 |
|
|
| 1 |
|
|
| 47.04 |
| |
$47.46 |
|
|
| 16 |
|
|
| 3.77 |
|
|
| 47.46 |
|
|
| 16 |
|
|
| 47.46 |
| |
$48.72 |
|
|
| 8 |
|
|
| 2.36 |
|
|
| 48.72 |
|
|
| 8 |
|
|
| 48.72 |
| |
$53.48 |
|
|
| 5 |
|
|
| 4.08 |
|
|
| 53.48 |
|
|
| 5 |
|
|
| 53.48 |
| |
$12.05- $53.48 |
|
|
| 186 |
|
|
| 3.32 |
|
| $ | 32.09 |
|
|
| 176 |
|
| $ | 33.20 |
| |
Valuation Assumptions
The Company uses the Black-Scholes option pricing model to estimate the fair value
In addition to the assumptions used in the Black-Scholes pricing model, the amended authoritative guidance requires that the Company recognize expense for awards ultimately expected to vest; therefore, the Company is required to develop an estimate of the number of awards expected to be forfeited prior to vesting, or forfeiture rate. The forfeiture rate is estimated based on historical pre-vest cancellation experience and is applied to all share-based awards.
No stock options were granted during the years 2019, 2018 and 2017.
The Company grants restricted stock units, or RSUs to employees with various vesting terms. RSUs entitle the holder to receive, at no cost, one common share for each restricted stock unit on the vesting date as it vests.vested. The Company withholds shares in settlement of employee tax withholding obligations uponon the vesting of restricted stock units. Stock-based
As of January 1, 2023, there was approximately $2.7 million in unrecognized stock-based compensation expense related to RSUs. The remaining unrecognized stock-based compensation expense as of January 1, 2023 is expected to be recorded over a weighted average period of 1.65 years. During the fiscal year 2022, the Company did not have any PRSU awards that were subject to vesting. Consequently, the Company did not have any unrecognized stock-based compensation related to grants of vested RSUsPRSUs at January 1, 2023.
A roll forward summarizes RSU activity and PSUs was $3.0 million, $1.6, million and $1.0 million in 2019, 2018 and 2017, respectively.
The following table summarizes RSU’s activity under the 2019 Plan and 2009 Plan, and the related weighted average grant date fair value, for 2019, 2018 and 2017:values as follows:
RSUs Outstanding | |||||
Number of Shares | Weighted Average Grant Date Fair Value | ||||
(in thousands) | |||||
Nonvested at December 30, 2019 | 377 | $ | 12.55 | ||
Granted | 816 | 3.97 | |||
Vested | (144 | ) | 10.41 | ||
Forfeited | (249 | ) | 7.93 | ||
Nonvested at January 3, 2021 | 800 | 4.99 | |||
Granted | 619 | 5.81 | |||
Vested | (586 | ) | 4.99 | ||
Forfeited | (265 | ) | 5.00 | ||
Nonvested at January 2, 2022 | 568 | 5.86 | |||
Granted | 584 | 6.11 | |||
Vested | (490 | ) | 5.56 | ||
Forfeited | (32 | ) | 5.35 | ||
Nonvested at January 1, 2023 | 630 | $ | 6.05 | ||
2009 ESPP Stock Plan
|
| RSUs & PRSUs Outstanding |
| |||||
|
| Number of Shares |
|
| Weighted Average Grant Date Fair Value |
| ||
|
| (in thousands) |
|
|
|
|
| |
Nonvested at January 1, 2017 |
|
| 98 |
|
| $ | 23.52 |
|
Granted |
|
| 132 |
|
|
| 19.74 |
|
Vested |
|
| (43 | ) |
|
| 20.44 |
|
Forfeited |
|
| (19 | ) |
|
| — |
|
Nonvested at January 1, 2017 |
|
| 168 |
|
|
| 21.56 |
|
Granted |
|
| 110 |
|
|
| 11.90 |
|
Vested |
|
| (77 | ) |
|
| 19.18 |
|
Forfeited |
|
| (18 | ) |
|
| — |
|
Nonvested at December 30, 2018 |
|
| 183 |
|
|
| 17.22 |
|
Granted |
|
| 353 |
|
|
| 10.77 |
|
Vested |
|
| (118 | ) |
|
| 14.48 |
|
Forfeited |
|
| (41 | ) |
|
| — |
|
Nonvested at December 29, 2019 |
|
| 377 |
|
| $ | 12.55 |
|
Employee Stock Purchase Plan
The weighted average estimated fair value, as defined by the amended authoritative guidance, of rightsCompany issued pursuant to the Company’s ESPP during 2019, 2018 and 2017 was $4.28, $5.18 and $6.02, respectively. Sales under the ESPP were 24,13152 thousand shares of common stock at an average price of $4.82 per share, of $9.76 for 2019, 31,30684 thousand shares of common stock at an average price of $3.14 per share, of $15.40 for 2018, and 38,44920 thousand shares of common stock at an average price of $2.47 per share of $12.04 for 2017.to employees in the years ended January 1, 2023, January 2, 2022, and January 3, 2021, respectively.
As of December 29, 2019, 62,335 shares under
The weighted average grant date fair value and the 2009 ESPP remained available for issuance. The Company recorded compensation expenses relatedweight-average assumptions used to estimate the ESPP of $60,000, $205,000 and $153,000 in 2019, 2018 and 2017, respectively.
The fair value of ESPP option rights issued pursuant to the Company’s ESPP was estimated on the commencement date of each offering period using the following weighted average assumptions:granted is as follows:
Fiscal Years | ||||||||||||
2022 | 2021 | 2020 | ||||||||||
Expected life (months) | 6.0 | 6.0 | 6.0 | |||||||||
Risk-free interest rate | 3.04 | % | 0.05 | % | 0.12 | % | ||||||
Volatility | 57 | % | 74 | % | 82 | % | ||||||
Dividend yield | — | — | — | |||||||||
Weighted average fair value of ESPP options granted | $ | 2.04 | $ | 2.18 | $ | 1.09 | ||||||
|
| Fiscal Years |
| |||||||||
|
| 2019 |
|
| 2018 |
|
| 2017 |
| |||
Expected life (months) |
| 6.0 |
|
| 6.0 |
|
|
| 6.1 |
| ||
Risk-free interest rate |
|
| 2.37 | % |
|
| 2.26 | % |
|
| 1.22 | % |
Volatility |
|
| 54 | % |
|
| 50 | % |
|
| 53 | % |
Dividend yield |
|
| — |
|
|
| — |
|
|
| — |
|
The methodologies for determining the above values were as follows:
Expected term: The expected term represents the length of the purchase period contained in the ESPP.
Risk-free interest rate: The risk-free interest rate assumption is based upon the risk-free rate of a Treasury Constant Maturity bond with a maturity appropriate for the term of the purchase period.
|
|
Dividend Yield: The expected dividend assumption is based on the Company’s intent not to issue a dividend under its dividend policy.
NOTE 14-INFORMATION13— INFORMATION CONCERNING PRODUCT LINES, GEOGRAPHIC INFORMATION, ACCOUNTS RECEIVABLE AND REVENUE CONCENTRATION
The Company identifies its business segments based on business activities, management responsibility and geographic location. For all periods presented, the Company operated in a single reportable business segment.
The following is a breakdown of revenue by product family (in thousands):
Fiscal Years | ||||||||||||
2022 | 2021 | 2020 | ||||||||||
New products | $ | 11,675 | $ | 7,761 | $ | 2,782 | ||||||
Mature products | 4,505 | 4,924 | 5,852 | |||||||||
Total revenue | $ | 16,180 | $ | 12,685 | $ | 8,634 | ||||||
New products revenue consists of revenues from the sale of hardware products manufactured on 180 nanometer or smaller semiconductor processes, eFPGA IP license, professional services, QuickAI and SensiML AI software as a service (SaaS) revenues. Mature products include all products produced on semiconductor processes larger than 180 nanometer.
|
| Fiscal Years |
| |||||||||
|
| 2019 |
|
| 2018 |
|
| 2017 |
| |||
Revenue by product line (1) : |
|
|
|
|
|
|
|
|
|
|
|
|
New products |
| $ | 3,123 |
|
| $ | 5,735 |
|
| $ | 5,853 |
|
Mature products |
|
| 7,187 |
|
|
| 6,894 |
|
|
| 6,296 |
|
Total revenue |
| $ | 10,310 |
|
| $ | 12,629 |
|
| $ | 12,149 |
|
The following is a breakdown of new products revenue (in thousands):
Fiscal Years | ||||||||||||
2022 | 2021 | 2020 | ||||||||||
Hardware products | $ | 3,757 | $ | 4,903 | $ | 2,383 | ||||||
eFPGA IP | 7,545 | 2,674 | 223 | |||||||||
SaaS & Other | 373 | 184 | 176 | |||||||||
Total new products revenue | $ | 11,675 | $ | 7,761 | $ | 2,782 | ||||||
eFPGA IP revenue consists of primarily of eFPGA intellectual property license revenue and eFPGA-related professional services revenue. eFPGA-IP revenue related to professional services was approximately $7.4 million, $1.5 million, and $0.2 million in the Fiscal Years ended January 1, 2023, January 2, 2022, and January 3, 2021, respectively. Contract assets were approximately $2.0 million and $0.3 million at January 1, 2023 and January 2, 2022, respectively and were included under current assets on the Company's consolidated balance sheets. Contract liabilities of $0 and $0.3 million were included in deferred revenue on the Company's consolidated balance sheets at January 1, 2023 and January 2, 2022, respectively. We derive revenue from sales to customers located in North America, Europe and Asia Pacific. North America includes revenue from the United States. Revenue from the United States was $10.6 million or 67% of total revenue, $6.9 million or 54% of total revenue, and $5.0 million or 58% of total revenue in the years ended January 1, 2023, January 2, 2022, and January 3, 2021, respectively. |
|
The following is a breakdown of revenue by shipmentshipping destination (in thousands):
Fiscal Years | ||||||||||||
2022 | 2021 | 2020 | ||||||||||
Asia Pacific | $ | 3,558 | $ | 3,352 | $ | 2,100 | ||||||
North America | 10,912 | 6,885 | 5,033 | |||||||||
Europe | 1,710 | 2,448 | 1,501 | |||||||||
Total revenue | $ | 16,180 | $ | 12,685 | $ | 8,634 | ||||||
|
| Fiscal Years |
| |||||||||
|
| 2019 |
|
| 2018 |
|
| 2017 |
| |||
Revenue by geography: |
|
|
|
|
|
|
|
|
|
|
|
|
Asia Pacific (1) |
| $ | 3,049 |
|
| $ | 4,905 |
|
| $ | 5,810 |
|
Europe |
|
| 2,459 |
|
|
| 1,280 |
|
|
| 2,015 |
|
North America (2) |
|
| 4,802 |
|
|
| 6,444 |
|
|
| 4,324 |
|
Total revenue |
| $ | 10,310 |
|
| $ | 12,629 |
|
| $ | 12,149 |
|
|
|
|
|
The following distributors and customers accounted for 10% or more of the Company’s revenue for the periods presented:
|
| Fiscal Years |
| |||||||||
|
| 2019 |
|
| 2018 |
|
| 2017 |
| |||
Distributor "A" |
|
| 40 | % |
|
| 34 | % |
|
| 33 | % |
Distributor "C" |
|
| 13 | % |
|
| — |
|
|
| — |
|
Customer "B" |
|
| 13 | % |
|
| 12 | % |
|
| 11 | % |
Customer "E" |
|
| 10 | % |
|
| — |
|
|
| — |
|
Customer "G" |
|
| — |
|
|
| 10 | % |
|
| 19 | % |
Customer "J" |
|
| — |
|
|
| 10 | % |
|
| — |
|
The following distributors and customers accounted for 10% or more of the Company's revenue for the periods presented. Distributor amounts represent revenue from the Company's goods and services sold to a distributor. Customer amounts represent revenues from both distributor and from the Company to an end customer. As such, revenue to a distributor may also include information related to customers.
Fiscal Years | |||
2022 | 2021 | 2020 | |
Distributor "A" | 15% | 15% | 24% |
Distributor "B" | 12% | 22% | 19% |
Distributor "C" | * | 11% | 15% |
Customer "A" | 20% | * | * |
Customer "B" | * | * | 10% |
Customer "C" | 16% | 16% | * |
Customer "F" | 12% | 14% | * |
Customer "H" | * | 10% | * |
Customer "J" | * | * | 16% |
* Represents less than 10% of revenue as of the date presented.
The following distributors and customers accounted for 10% or more of the Company's accounts receivable as of the dates presented:
|
| December 29, 2019 |
|
| December 30, 2018 |
| ||
Distributor "A" |
|
| 20 | % |
|
| 35 | % |
Distributor "C" |
|
| 23 | % |
|
| — |
|
Distributor "E" |
|
| 12 | % |
|
| — |
|
Distributor "G" |
|
| — |
|
|
| 10 | % |
Distributor "J" |
| 31 |
|
|
| — |
| |
Customer "M" |
|
| — |
|
|
| 23 | % |
January 1, | January 2, | |||||||
2023 | 2022 | |||||||
Distributor "A" | 14 | % | 42 | % | ||||
Distributor "B" | * | 22 | % | |||||
Distributor "C" | * | 17 | % | |||||
Customer "C" | 22 | % | * | |||||
Customer "F" | 44 | % | 10 | % | ||||
| % | % | |||||||
| % | % | |||||||
* Represents less than 10% of trade accounts receivable, net, as of the date presented.
As of December 29, 2019Approximately 1% and December 30, 2018, approximately 7%3% of the Company’sCompany’s long-lived assets, including property and equipment and other assets, were located outside the United States.States as of January 1, 2023 and January 2, 2022, respectively.
NOTE 15-COMMITMENTS14—COMMITMENTS AND CONTINGENCIES
Commitments
The Company's principal contractual commitments include purchase obligations, re-payments of draw downs from the revolving line of credit, and payments under operating and finance leases. Purchase obligations are largely comprised of open purchase order commitments to suppliers and to subcontractors under professional services agreements. Our risk associated with the purchase obligations under professional services agreements is limited to the termination liability provisions within those contracts, and as such, we do not believe they represent a material liquidity risk to us.
Certain wafer manufacturers require the Company to forecast wafer starts several months in advance. The Company is committed to take delivery of and to pay for a portion of forecasted wafer volume. As The Company had$0.1 million of the endnon-cancelable purchase commitments with various wafer foundries as of 2019 and 2018, the Company had $57,000 and $22,000 respectively, of outstanding commitments for the purchase of wafer inventory.
January 1, 2023. The Company hasexpects this commitment to be fulfilled during the next twelve months of fiscal 2023.
Purchase Obligations
Purchase obligations represent contractual agreements to purchase obligations with certain suppliers for the purchase of goods andor services entered into in the ordinary course of business. Purchase obligations are legally binding and amongst other things specify a minimum or a range of quantities, pricing and approximate timing of the transaction. Purchase obligations include amounts that are recorded on the Company's consolidated balance sheets as well as amounts that are not recorded on the Company's consolidated balance sheets. The Company had $5.7 million of recorded and unrecorded purchase obligations due within the next twelve months as of January 1, 2023. The Company expects this commitment to be fulfilled over the next twelve months of Fiscal 2023.
Contingencies
Contingent commitments are not recorded on the Company’s consolidated balance sheets and represent significant contractual obligations on procurement contracts with determinable prices and quantities, but where the timing and probability of incurring the obligation is dependent on numerous variables which are not reasonably predictable. These obligations require our suppliers to build and deliver certain products in sufficient time to meet the Company’s planning horizon. The actual amounts we pay to our suppliers and the timing of payments for these future obligations could differ materially from our current estimates. As of December 29, 2019, total outstanding purchase obligationsJanuary 1, 2023, contingent commitments were $413,000 of which $386,000 wereapproximately $4.2 million due within the next twelve months. months and $8.7 million due within two to three years. These amounts represent the Company’s best estimates for contingent commitments which are expected to be delivered at some time in the future but for which delivery is currently undefined.
Litigation
From time to time, the Company may become involved in legal actions arising in the ordinary course of business including, but not limited to, intellectual property infringement and collection matters. Absolute assurance cannot be given that any such third party-party assertions will be resolved without costly litigation; in a manner that is not adverse to the Company’s financial position, results of operations or cash flows; or without requiring royalty or other payments which may adversely impact gross profit.
NOTE 17-SUBSEQUENT15—SUBSEQUENT EVENTS
Restructuring
In January 2020, the Company announced a restructuring plan to lower annual operating expenses. The restructuring plan was approved by the Company’s Board of Directors on January 24, 2020. The majority of the cost savings will come from personnel reductions, which were implemented across all parts of the Company and geographies. This plan resulted in a reduction of workforce of about 33% of the Company's global workforce.
In conjunction with this restructuring plan, the Company estimates it will incur approximately $500,000 to $600,000 of restructuring expenses, which will result in total cash expenditures of approximately $500,000, with the majority coming in the first quarter of fiscal 2020.
Cyber-Incident
On January 20, 2023, the Company detected a ransomware infection affecting a limited number of IT systems, including systems that contained personal information of our employees. Upon detection of the incident, the Company promptly began an assessment of all Company IT systems, notified law enforcement, and engaged legal counsel and other incident response professionals. Through counsel, the Company retained a leading cybersecurity forensics firm to review and investigate the incident. The Company’s investigation and assessment of the incident’s impact is ongoing.
SUPPLEMENTARY FINANCIAL DATAThe Company has continued its business operations during this incident and successfully restored all of its critical operational data. The Company has also taken steps to further secure its IT systems. Based on the ongoing investigation and information currently known at this time, the Company believes the incident has not had nor will have a material impact on its business, operations, ability to serve its customers, or financial results. The Company carries insurance, including cyber insurance, commensurate with its size and the nature of its operations.
QUARTERLY DATA (UNAUDITED)
|
| Quarter Ended |
| |||||||||||||||||||||||||||||
|
| December 29, 2019 | �� |
| September 29, 2019 |
|
| June 30, 2019 |
|
| March 31, 2019 |
|
| December 30, 2018 |
|
| September 30, 2018 |
|
| July 1, 2018 |
|
| April 1, 2018 |
| ||||||||
|
| (in thousands, except per share amount) |
| |||||||||||||||||||||||||||||
Statements of Operations: |
|
|
|
|
|
|
|
|
|
|
|
|
|
|
|
|
|
|
|
|
|
|
|
|
|
|
|
|
|
|
|
|
Revenue |
| $ | 2,871 |
|
| $ | 2,158 |
|
| $ | 2,087 |
|
| $ | 3,194 |
|
| $ | 3,233 |
|
| $ | 3,510 |
|
| $ | 3,122 |
|
| $ | 2,764 |
|
Cost of revenue |
|
| 1,008 |
|
|
| 1,117 |
|
|
| 1,065 |
|
|
| 1,215 |
|
|
| 1,561 |
|
|
| 1,767 |
|
|
| 1,592 |
|
|
| 1,375 |
|
Gross profit (1) |
|
| 1,863 |
|
|
| 1,041 |
|
|
| 1,022 |
|
|
| 1,979 |
|
|
| 1,672 |
|
|
| 1,743 |
|
|
| 1,530 |
|
|
| 1,389 |
|
Operating expenses: |
|
|
|
|
|
|
|
|
|
|
|
|
|
|
|
|
|
|
|
|
|
|
|
|
|
|
|
|
|
|
|
|
Research and development |
|
| 2,754 |
|
|
| 3,139 |
|
|
| 3,215 |
|
|
| 3,242 |
|
|
| 2,422 |
|
|
| 2,461 |
|
|
| 2,366 |
|
|
| 2,699 |
|
Selling, general and administrative |
|
| 2,037 |
|
|
| 2,095 |
|
|
| 2,340 |
|
|
| 2,446 |
|
|
| 2,302 |
|
|
| 2,509 |
|
|
| 2,610 |
|
|
| 2,561 |
|
Loss from operations |
|
| (2,928 | ) |
|
| (4,193 | ) |
|
| (4,533 | ) |
|
| (3,709 | ) |
|
| (3,052 | ) |
|
| (3,227 | ) |
|
| (3,446 | ) |
|
| (3,871 | ) |
Interest expense |
|
| (80 | ) |
|
| (63 | ) |
|
| (124 | ) |
|
| (83 | ) |
|
| (31 | ) |
|
| (21 | ) |
|
| (32 | ) |
|
| (24 | ) |
Interest income and other expense, net |
|
| 36 |
|
|
| 55 |
|
|
| 50 |
|
|
| 48 |
|
|
| 51 |
|
|
| 17 |
|
|
| 23 |
|
|
| (14 | ) |
Loss before taxes |
|
| (2,972 | ) |
|
| (4,201 | ) |
|
| (4,607 | ) |
|
| (3,744 | ) |
|
| (3,032 | ) |
|
| (3,231 | ) |
|
| (3,455 | ) |
|
| (3,909 | ) |
Provision for (benefit from) income taxes |
|
| 91 |
|
|
| 70 |
|
|
| 27 |
|
|
| (268 | ) |
|
| 33 |
|
|
| 29 |
|
|
| 29 |
|
|
| 61 |
|
Net loss |
| $ | (3,063 | ) |
| $ | (4,271 | ) |
| $ | (4,634 | ) |
| $ | (3,476 | ) |
| $ | (3,065 | ) |
| $ | (3,260 | ) |
| $ | (3,484 | ) |
| $ | (3,970 | ) |
Net loss per share: |
|
|
|
|
|
|
|
|
|
|
|
|
|
|
|
|
|
|
|
|
|
|
|
|
|
|
|
|
|
|
|
|
Basic and diluted |
| $ | (0.37 | ) |
| $ | (0.51 | ) |
| $ | (0.65 | ) |
| $ | (0.50 | ) |
| $ | (0.45 | ) |
| $ | (0.48 | ) |
| $ | (0.57 | ) |
| $ | (0.69 | ) |
Weighted average shares: |
|
|
|
|
|
|
|
|
|
|
|
|
|
|
|
|
|
|
|
|
|
|
|
|
|
|
|
|
|
|
|
|
Basic and diluted |
|
| 8,328 |
|
|
| 8,313 |
|
|
| 7,088 |
|
|
| 6,916 |
|
|
| 6,807 |
|
|
| 6,766 |
|
|
| 6,125 |
|
|
| 5,755 |
|
Registered Direct Offering
On March 21, 2023, the Company entered into common stock purchase agreements with certain investors for the sale of an aggregate of 450,000 shares of our common stock, in a registered direct offering pursuant to our effective shelf registration statement on Form S-3 (File No.333-266942), resulting in net cash proceeds of approximately $2.3 million. Issuance costs related to the offering was immaterial.
|
|
ITEM9.CHANGES IN AND DISAGREEMENTS WITH ACCOUNTANTS ON ACCOUNTING AND FINANCIAL DISCLOSURE
None.
ITEM 9A. CONTROLS AND PROCEDURES
Evaluation of Disclosure Controls and Procedures
We maintain disclosure controls and procedures designed to ensure that information required to be disclosed in the reports we file or submit pursuant to the Securities and Exchange Act of 1934, as amended, or the Exchange Act, is recorded, processed, summarized and reported within the time periods specified in the rules and forms of the SEC, and that such information is accumulated and communicated to our management, including our Chief Executive Officer and Chief Financial Officer,Principal, as appropriate, to allow timely decisions regarding required disclosure.
Management, with the participation of the Chief Executive Officer and Chief Financial Officer, has performed an evaluation of our disclosure controls and procedures as required by the applicable rules of the Exchange Act. Based on this evaluation, our Chief Executive Officer and Chief Financial Officer have concluded that, as of December 29, 2019January 1, 2023 our disclosure controls and procedures were effective.
Management’s Annual Report on Internal Control Over Financial Reporting
Our management is responsible for establishing and maintaining adequate internal control over financial reporting as defined in Rules 13a-15(f) and 15d-15(f) under the Securities Exchange Act of 1934, as amended. Internal control over financial reporting is the process designed by, or under the supervision of, our Chief Executive Officer and Chief Financial Officer, and effected by our board of directors, management and other personnel, to provide reasonable assurance regarding the reliability of financial reporting and the preparation of consolidated financial statements for external purposes in accordance with generally accepted accounting principles, and includes those policies and procedures that: (i) pertain to the maintenance of records that in reasonable detail accurately and fairly reflect our transactions and dispositions of assets; (ii) provide reasonable assurance that transactions are recorded as necessary to permit preparation of consolidated financial statements in accordance with generally accepted accounting principles, and that receipts and expenditures of the Company are being made only in accordance with authorizations of management and directors of the Company; and (iii) provide reasonable assurance regarding prevention or timely detection of unauthorized acquisition, use or disposition of our assets that could have a material effect on the financial statements.
Because of its inherent limitations, cost-effective internal control over financial reporting cannot provide absolute assurance of achieving financial reporting objectives. Internal control over financial reporting is a process that involves human diligence and compliance and is subject to lapses in judgment and breakdowns resulting from human failures. Internal control over financial reporting also can be circumvented by collusion or improper management override. Because of such limitations, there is a risk that material misstatements may not be prevented or detected on a timely basis by internal control over financial reporting. Also, projections of any evaluation of effectiveness to future periods are subject to the risk that controls may become inadequate because of changes in conditions or that the degree of compliance with established policies or procedures may deteriorate.
Under the supervision and with the participation of our management, including our Chief Executive Officer and Chief Financial Officer, we conducted an assessment of the effectiveness of our internal control over financial reporting as of the end of the period covered by this Annual Report on Form 10-K. In making this assessment, we used the criteria based on the framework set forth by the Committee of Sponsoring Organizations of the Treadway Commission in “Internal Control - Integrated Framework (2013).” Based on the results of this assessment, management (including our Chief Executive Officer and Chief Financial Officer) has concluded that, as of December 29, 2019January 1, 2023 our internal control over financial reporting was effective.
The effectiveness of the Company’s internal control over financial reporting as of December 29, 2019 has been audited by Moss Adams LLP, an independent registered public accounting firm, as stated in their report appearing in this Annual Report on Form 10-K.
Changes in Internal Control Over Financial Reporting
There were no changes in our internal control over financial reporting that occurred during our most recent fiscal quarter that have materially affected, or are reasonably likely to materially affect, our internal control over financial reporting.
None.
ITEM 9C. DISCLOSURE REGARDING FOREIGN JURISDICTIONS THAT PREVENT INSPECTIONS
Not applicable.
Certain
The information required by Part III is incorporated by reference from the definitive Proxy Statement regarding our 20192023 Annual Meeting of Stockholders, and willwhich Proxy Statement is anticipated to be filed not later thanwith the Security and Exchange Commission within 120 days after the end of the fiscal yearFiscal Year covered by this Report.
ITEM 10. DIRECTORS, EXECUTIVE OFFICERS AND CORPORATE GOVERNANCE
Information regarding the backgroundsbackground of our officers is contained herein under Item 1, “Executive"Executive Officers and Directors.”"
Information regarding the backgroundsbackground of our directors is set forth under the caption “Proposal One, Election of Directors” inhereby incorporated by reference from our definitive Proxy Statement relating to the 2023 Annual Meeting of Stockholders, which informationProxy Statement is incorporated hereinanticipated to be filed within 120 days after the end of the Fiscal Year covered by reference.this Report.
There are no family relationships between any of our directors, executive officers, or persons nominated or chosen to be a director or officer, and no such persons have been involved during the last ten years, in any legal proceedings material to their abilities or integrity.
Information regarding our Audit Committee, our Audit Committee financial expert, the procedures by which security holders may recommend nominees to our Board and our
We have adopted a Code of Conduct and Ethics, is hereby incorporated herein by reference from the section entitled “Board Meetings, Committees and Corporate Governance”including provisions enumerated in the Proxy Statement.Item 406 of Regulation S-K. A copy of our Code of Conduct and Ethics is posted on our website at http:https://www.quicklogic.com/corporate/about-us/management. We intend to satisfy the disclosure requirement under Item 5.05 of Form 8-K regarding an amendmentir.quicklogic.com/governance-docs. Any changes to or a waiver from this Code of Conduct and Ethics by posting such information will be posted to this page on our website http://www.quicklogic.com/corporate/about-us/management.website.
ITEM 11. EXECUTIVE COMPENSATION
ITEM 12. SECURITY OWNERSHIP OF CERTAIN BENEFICIAL OWNERS AND MANAGEMENT AND RELATED STOCKHOLDER MATTERS
The information required by Item 12this item is set forth under the captions “Equity Compensation Plan Summary”, "Post-Employment and Change of Control Compensation" and “Security Ownership” inhereby incorporated by reference from our definitive Proxy Statement relating to the 2023 Annual Meeting of Stockholders, which informationProxy Statement is incorporated hereinanticipated to be filed within 120 days after the end of the Fiscal Year covered by reference.this Report.
ITEM 13. CERTAIN RELATIONSHIPS, RELATED TRANSACTIONS AND DIRECTOR INDEPENDENCE
The information required by Item 13this item is set forth under the captions “Board Meetings, Committees and Corporate Governance” and “Transactions with Related Persons” inhereby incorporated by reference from our definitive Proxy Statement relating to the 2023 Annual Meeting of Stockholders, which informationProxy Statement is incorporated hereinanticipated to be filed within 120 days after the end of the Fiscal Year covered by reference.this Report.
ITEM 14. PRINCIPAL ACCOUNTING FEES AND SERVICES
ITEM 15. EXHIBITS AND FINANCIAL STATEMENT SCHEDULES
(a) | 1. Financial Statements |
Reference is made to Item 8 for a list of all financial statements and schedules filed as a part of this Report.
2. Financial Statement Schedules
| 2. Financial Statement Schedules |
QuickLogic Corporation
ValuationFollowing is the Company's valuation and Qualifying Accounts
(inqualifying accounts (in thousands):
|
| Balance at Beginning of Period |
|
| Charged to Costs and Expenses |
|
| Deductions/ Write-offs |
|
| Balance at End of Period |
| ||||
Allowance for Doubtful Accounts: |
|
|
|
|
|
|
|
|
|
|
|
|
|
|
|
|
Fiscal Year 2019 |
| $ | — |
|
| $ | — |
|
| $ | 5 |
|
| $ | — |
|
Fiscal Year 2018 |
| $ | — |
|
| $ | — |
|
| $ | — |
|
| $ | — |
|
Fiscal Year 2017 |
| $ | — |
|
| $ | — |
|
| $ | — |
|
| $ | — |
|
|
|
|
|
|
|
|
|
|
|
|
|
|
|
|
|
|
Allowance for Deferred Tax Assets: |
|
|
|
|
|
|
|
|
|
|
|
|
|
|
|
|
Fiscal Year 2019 |
| $ | 54,913 |
|
| $ | 3,227 |
|
| $ | — |
|
| $ | 58,140 |
|
Fiscal Year 2018 |
| $ | 55,931 |
|
| $ | — |
|
| $ | (1,018 | ) |
| $ | 54,913 |
|
Fiscal Year 2017 |
| $ | 79,150 |
|
| $ | — |
|
| $ | (23,219 | ) |
| $ | 55,931 |
|
Description: | Balance at Beginning of Period | Charged (Credited) to Costs and Expenses | Deductions (Recovery) | Balance at End of Period | ||||||||||||
(in thousands) | ||||||||||||||||
Year ended January 1, 2023 | ||||||||||||||||
Allowances: | ||||||||||||||||
— trade receivables | $ | 62 | $ | 18 | $ | (62 | ) | $ | 18 | |||||||
— deferred taxes | 60,353 | — | (3,491 | ) (1) | 56,862 | |||||||||||
| $ | 60,415 | $ | 18 | $ | (3,553 | ) | $ | 56,880 | ||||||||
Year ended January 2, 2022 | ||||||||||||||||
Allowances: | ||||||||||||||||
— trade receivables | $ | 32 | $ | 30 | $ | — | $ | 62 | ||||||||
— deferred taxes | 60,486 | — | (133 | ) (1) | 60,353 | |||||||||||
| $ | 60,518 | $ | 30 | $ | (133 | ) | $ | 60,415 | ||||||||
Year ended January 3, 2021 | ||||||||||||||||
Allowances: | ||||||||||||||||
— trade receivables | $ | — | $ | 32 | $ | — | $ | 32 | ||||||||
— deferred taxes | 60,353 | — | 133 | (1) | 60,486 | |||||||||||
| $ | 60,353 | $ | 32 | $ | 133 | $ | 60,518 | |||||||||
(1) Activity represents the (release) increase of a valuation allowance.
All other schedules not listed above have been omitted because the information required to be set forth therein is not applicable or is shown in the financial statements or notes hereto.
| (b) | Exhibits |
3. Exhibits
The exhibits listed under Item 15(b) hereof are filed with or incorporated by reference as part of this Annual Report on Form 10-K.
(b) Exhibits
Exhibit Number | Description | Form | Exhibit | Filing Date | |
|
|
|
|
| |
3.1 | Fourth Amended and Restated Certificate of Incorporation of QuickLogic Corporation. | 8-K | 3.1 | 4/28/2017 | |
|
|
|
|
| |
3.2 | 8-K | 3.1 | 12/24/2019 | ||
|
|
|
|
| |
3.3 | 8-K | 3.2 | 05/02/2005 | ||
|
|
|
|
| |
3.4 | Certificate of Elimination of the Series A Junior Participating Preferred Stock. | 8-K | 3.1 | 11/26/2013 | |
|
|
|
|
| |
4.1 | Specimen Common Stock certificate of QuickLogic Corporation. | S-1/A | 4.1 | 10/12/1999 | |
|
|
|
|
| |
4.2 | 8-K | 4.1 | 05/29/2018 | ||
|
|
|
|
| |
4.3 | 10-K | 4.3 | 3/13/2020 | ||
|
|
|
|
| |
10.1 | Form of Indemnification Agreement for directors and executive officers. | 10-Q | 10.24 | 11/13/2002 | |
|
|
|
|
| |
10.2 | 10-K | 10.2 | 03/22/2022 |
The following exhibits are filed with or incorporated by reference into this Report:
| 10.25 | Form of Common Stock Purchase Agreement, dated September 30, 2021, between QuickLogic Corporation and the investor named therein | 8-K | 10.1 | 09/30/2021 | |
| 10.26 | Form of Share Agreement, dated September 22, 2021, between QuickLogic Corporation and the purchases named therein | 8-K | 10.2 | 09/30/2021 | |
|
|
|
|
| |
| 10.27 | Form of Common Stock Purchase Agreement, dated February 9, 2022 | 8-K | 10.1 | 02/09/2022 | |
21** |
|
|
| ||
|
|
|
|
| |
23.1** | Consent of Moss Adams LLP, Independent Registered Public Accounting Firm. |
|
|
| |
|
|
|
|
| |
24.1** | Power of Attorney (included on the Signature page of this Annual Report on Form 10-K). |
|
|
| |
|
|
|
|
| |
31.1** |
|
|
| ||
|
|
|
|
| |
31.2** |
|
|
| ||
|
|
|
|
| |
32.1*** |
|
|
| ||
| 32.2*** | Certification of Elias Nader, Chief Financial Officer, pursuant to 18 U.S.C. Section 1350, as adopted pursuant to Section 906 of the Sarbanes-Oxley Act of 2002. | ||||
|
|
|
|
| |
101.INS | Inline XBRL Instance Document |
|
|
| |
101.SCH | Inline XBRL Taxonomy Extension Schema Document |
|
|
| |
101.CAL | Inline XBRL Taxonomy Extension Calculation Linkbase Document |
|
|
| |
101.DEF | Inline XBRL Taxonomy Extension Definition Linkbase Document |
|
|
| |
101.LAB | Inline XBRL Taxonomy Extension Label Linkbase Document |
|
|
| |
101.PRE | Inline XBRL Taxonomy Extension Presentation Linkbase Document |
|
|
| |
104 | The cover page from the Company's annual report on Form 10-K for the year ended January 1, 2023 has been formatted in Inline XBRL and contained in Exhibit 101. |
|
|
|
_______________
Exhibit Number | Description | Form | Exhibit | Filing Date |
|
|
|
|
|
3.1 | Fourth Amended and Restated Certificate of Incorporation of QuickLogic Corporation. | 8-K | 3.1 | 4/28/2017 |
|
|
|
|
|
3.2 | 8-K | 3.2 | 12/24/2019 | |
|
|
|
|
|
3.3 | 8-K | 3.2 | 05/02/2005 | |
|
|
|
|
|
3.4 | Certificate of Elimination of the Series A Junior Participating Preferred Stock. | 8-K | 3.1 | 11/26/2013 |
|
|
|
|
|
4.1 | Specimen Common Stock certificate of QuickLogic Corporation. | S-1/A | 4.1 | 10/12/1999 |
|
|
|
|
|
4.2 | 8-K | 4.1 | 05/29/2018 | |
|
|
|
|
|
4.3** |
|
|
| |
|
|
|
|
|
10.1 | Form of Indemnification Agreement for directors and executive officers. | 10-Q | 10.24 | 11/13/2002 |
|
|
|
|
|
10.2** |
|
|
| |
|
|
|
|
|
10.3 | S-1/A | 10.18 | 08/10/1999 | |
|
|
|
|
|
10-K | 10.13 | 03/11/2008 | ||
|
|
|
|
|
10.5 | Form of Change of Control Severance Agreement for Chief Executive Officer. | 10-K | 10.14 | 03/11/2008 |
|
|
|
|
|
10.6 | 8-K | 10.1 | 04/28/2008 | |
|
|
|
|
|
10.7 | 10-Q | 10.1 | 05/09/2019 | |
|
|
|
|
|
10.8*** |
|
|
| |
|
|
|
|
|
10.9* | 10-K/A | 10.7 | 03/19/2019 | |
|
|
|
|
|
10.10* | 10-Q | 10.2 | 05/11/2017 | |
|
|
|
|
|
10.11* | Form of Notice of Grant and Stock Option Agreement under the 2009 Stock Plan. | 8-K | 10-26 | 08/04/2009 |
|
|
|
|
|
10.12* | 8-K | 10-27 | 08/04/2009 | |
|
|
|
|
|
10.13*,** | 8-K | 10-28 | 08/04/2009 | |
|
|
|
|
|
10.14*.** | Form of Notice of Grant and Stock Option Agreement under the 2019 Stock Plan. |
|
|
|
|
|
|
|
|
10.15*,** |
|
|
| |
|
|
|
|
|
10.16*,** |
|
|
| |
|
|
|
|
|
10.17 | 8-K | 10.1 | 12/28/2018 | |
|
|
|
|
|
10.18 | 10-Q | 10.1 | 11/08/2019 | |
|
|
|
|
|
21** |
|
|
| |
|
|
|
|
|
23.1** | Consent of Moss Adams LLP, Independent Registered Public Accounting Firm. |
|
|
|
|
|
|
|
|
24.1** | Power of Attorney (included on the Signature page of this Annual Report on Form 10-K). |
|
|
|
|
|
|
|
|
31.1** | CEO Certification pursuant to Section 302 of the Sarbanes-Oxley Act of 2002. |
|
|
|
|
|
|
|
|
31.2** | CFO Certification pursuant to Section 302 of the Sarbanes-Oxley Act of 2002. |
|
|
|
|
|
|
|
|
32*** |
|
|
| |
|
|
|
|
|
101.INS | XBRL Instance Document |
|
|
|
|
|
|
|
|
101.SCH | XBRL Taxonomy Extension Schema Document |
|
|
|
|
|
|
|
|
101.CAL | XBRL Taxonomy Extension Calculation Linkbase Document |
|
|
|
|
|
|
|
|
101.DEF | XBRL Taxonomy Extension Definition Linkbase Document |
|
|
|
|
|
|
|
|
101.LAB | XBRL Taxonomy Extension Label Linkbase Document |
|
|
|
|
|
|
|
|
101.PRE | XBRL Taxonomy Extension Presentation Linkbase Document |
|
|
|
_______________
*Indicates management contract or compensatory plan or arrangement.
**Filed herewith.
***Furnished herewith.
None.
Pursuant to the requirements of Section 13 or 15(d) of the Securities Exchange Act of 1934, as amended, the registrant has duly caused this report to be signed on its behalf by the undersigned, thereunto duly authorized on this March 13, 2020.28, 2023.
| QUICKLOGIC CORPORATION | ||
|
|
|
|
| By: |
| /s/ Brian C. Faith |
|
|
| Brian C. Faith President and Chief Executive Officer |
QUICKLOGIC CORPORATION | |||
By: | /s/ Elias Nader | ||
Elias Nader Chief Financial Officer and SVP, Finance | |||
68 |