UNITED STATES
SECURITIES AND EXCHANGE COMMISSION
Washington, D.C. 20549
FORM 10-K
(Mark One)
☒ | ANNUAL REPORT PURSUANT TO SECTION 13 OR 15(d) OF THE SECURITIES EXCHANGE ACT OF 1934 |
For the fiscal year ended December 31, 20192020
OR
☐ | TRANSITION REPORT PURSUANT TO SECTION 13 OR 15(d) OF THE SECURITIES EXCHANGE ACT OF 1934 |
FOR THE TRANSITION PERIOD FROMTO
Commission File Number 001-38184
CAMBRIDGE BANCORP
(Exact name of Registrant as specified in its Charter)
Massachusetts | 04-2777442 |
(State or other jurisdiction of incorporation or organization) | (I.R.S. Employer
Identification No.) |
1336 Massachusetts Avenue Cambridge, MA | 02138 |
(Address of principal executive offices) | (Zip Code) |
Registrant’s telephone number, including area code: (617) 876-5500
Securities registered pursuant to Section 12(b) of the Act:
Common Stock | CATC | NASDAQ |
(Title of each class) | (Trading symbol) | (Name of each exchange on which registered) |
Securities registered pursuant to Section 12(g) of the Act:
None
(Title of class)
Indicate by check mark if the Registrant is a well-known seasoned issuer, as defined in Rule 405 of the Securities Act. YES Yes☐ NO No☒
Indicate by check mark if the Registrant is not required to file reports pursuant to Section 13 or 15(d) of the Act. YES Yes☐ NO No☒
Indicate by check mark whether the Registrant: (1) has filed all reports required to be filed by Section 13 or 15(d) of the Securities Exchange Act of 1934 during the preceding 12 months (or for such shorter period that the Registrant was required to file such reports), and (2) has been subject to such filing requirements for the past 90 days. YES Yes☒ NO No☐
Indicate by check mark whether the Registrant has submitted electronically every Interactive Data File required to be submitted pursuant to Rule 405 of Regulation S-T (§232.405 of this chapter) during the preceding 12 months (or for such shorter period that the Registrant was required to submit). YES Yes☒ NO No☐
Indicate by check mark whether the registrant is a large accelerated filer, an accelerated filer, a non-accelerated filer, smaller reporting company, or an emerging growth company. See the definitions of “large accelerated filer,” “accelerated filer,” “smaller reporting company,” and “emerging growth company” in Rule 12b-2 of the Exchange Act.
Large accelerated filer | | ☐ | | Accelerated filer | | ☒ |
Non-accelerated filer | | ☐ | | Smaller reporting company | | ☐ |
| | | | Emerging growth company | | ☐ |
If an emerging growth company, indicate by check mark if the registrant has elected not to use the extended transition period for complying with any new or revised financial accounting standards provided pursuant to Section 13(a) of the Exchange Act. ☐
Indicate by check mark whether the Registrant is a shell company (as defined in Rule 12b-2 of the Exchange Act). YES Yes☐ NO No☒
Indicate by check mark whether the registrant has filed a report on and attestation to its management’s assessment of the effectiveness of its internal control over financial reporting under Section 404(b) of the Sarbanes-Oxley Act (15 U.S.C. 726.2(b)) by the registered public accounting firm that prepared or issued its audit report. Yes ☒No☐
The aggregate market value of the voting and non-voting common equity held by non-affiliates of the Registrant, based on the closing price of the shares of common stock on The NASDAQ Stock Market on June 30, 2019,2020, was $361.1$378.5 million. The number of shares of Registrant’s Common Stock outstanding as of March 12, 20202021 was 5,412,221.6,960,194.
DOCUMENTS INCORPORATED BY REFERENCE
Portions of the Registrant’s Definitive Proxy Statement relating to the Annual Meeting of Shareholders, scheduled to be held on May 18, 2020,17, 2021, are incorporated by reference into Part III of this Report.
Table of Contents
i
PART
PART I
Unless the context requires otherwise, all references to the “Company,” “we,” “us,” and “our,” refer to Cambridge Bancorp.
Forward-Looking Statements
This report contains forward-looking statements as defined in the Private Securities Litigation Reform Act of 1995. Such forward-looking statements about the Company and its industry involve substantial risks and uncertainties. Statements other than statements of current or historical fact, including statements regarding the Company’s future financial condition, results of operations, business plans, liquidity, cash flows, projected costs, and the impact of any laws or regulations applicable to the Company, are forward-looking statements. Words such as “anticipates,” “believes,” “estimates,” “expects,” “forecasts,” “intends,” “plans,” “projects,” “may,” “will,” “should,” and other similar expressions are intended to identify these forward-looking statements. Such statements are subject to factors that could cause actual results to differ materially from anticipated results. Such factors include, but are not limited to, the following:
national, regional and local economic conditions may be less favorable than expected, resulting in, among other things, increased charge offs of loans, higher provisions for credit losses and/or reduced demand for the Company’s services;
| • | national, regional, and local economic conditions may be less favorable than expected, resulting in, among other things, increased charge offs of loans, higher provisions for credit losses and/or reduced demand for the Company’s services; |
disruptions to the credit and financial markets, either nationally or globally;
| • | disruptions to the credit and financial markets, either nationally or globally; |
weakness in the real estate market, including the secondary residential mortgage market, which can affect, among other things, the value of collateral securing mortgage loans, mortgage loan originations and delinquencies, and profits on sales of mortgage loans;
| • | the duration and scope of the coronavirus disease 2019 (“COVID-19”) pandemic and its impact on levels of consumer confidence; |
legislative, regulatory or accounting changes, including changes resulting from the adoption and implementation of the Dodd-Frank Act, which may adversely affect our business and/or competitive position, impose additional costs on the Company or cause us to change our business practices;
| • | actions governments, businesses and individuals take in response to the COVID-19 pandemic; |
the Dodd-Frank Act’s consumer protection regulations which could adversely affect the Company’s business, financial condition or results of operations;
| • | the impact of the COVID-19 pandemic and actions taken in response to the pandemic on global and regional economies and economic activity; |
disruptions in the Company’s ability to access capital markets which may adversely affect its capital resources and liquidity;
| • | the pace of recovery when the COVID-19 pandemic subsides; |
the Company’s heavy reliance on communications and information systems to conduct its business and reliance on third parties and affiliates to provide key components of its business infrastructure, any disruptions of which could interrupt the Company's operations or increase the costs of doing business;
| • | weakness in the real estate market, including the secondary residential mortgage market, which can affect, among other things, the value of collateral securing mortgage loans, mortgage loan originations and delinquencies, and profits on sales of mortgage loans; |
that the Company’s financial reporting controls and procedures may not prevent or detect all errors or fraud;
| • | legislative, regulatory, or accounting changes, including changes resulting from the adoption and implementation of the Dodd-Frank Act, which may adversely affect our business and/or competitive position, impose additional costs on the Company or cause us to change our business practices; |
the Company’s dependence on the accuracy and completeness of information about clients and counterparties;
| • | the Dodd-Frank Act’s consumer protection regulations which could adversely affect the Company’s business, financial condition or results of operations; |
the fiscal and monetary policies of the federal government and its agencies;
| • | disruptions in the Company’s ability to access capital markets which may adversely affect its capital resources and liquidity; |
the failure to satisfy capital adequacy and liquidity guidelines applicable to the Company;
| • | the Company’s heavy reliance on communications and information systems to conduct its business and reliance on third parties and affiliates to provide key components of its business infrastructure, any disruptions of which could interrupt the Company's operations or increase the costs of doing business; |
downgrades in the Company’s credit rating;
| • | that the Company’s financial reporting controls and procedures may not prevent or detect all errors or fraud; |
changes in interest rates which could affect interest rate spreads and net interest income;
| • | the Company’s dependence on the accuracy and completeness of information about clients and counterparties; |
costs and effects of litigation, regulatory investigations or similar matters;
| • | the fiscal and monetary policies of the federal government and its agencies; |
the inability to realize expected cost savings or implement integration plans and other adverse consequences associated with the merger with Optima Bank & Trust Company (“Optima”);
| • | the failure to satisfy capital adequacy and liquidity guidelines applicable to the Company; |
the failure to complete the proposed merger with Wellesley Bancorp, Inc. (“Wellesley”), the imposition of adverse regulatory conditions in connection with regulatory approval of the proposed Merger (as defined below) with Wellesley, disruption to the parties’ businesses as a result of the announcement and pendency of the Merger, the inability to realize expected cost savings or to implement integration plans and other adverse consequences associated with the merger with Wellesley;
| • | downgrades in the Company’s credit rating; |
a failure by the Company to effectively manage the risks the Company faces, including credit, operational and cyber security risks;
| • | changes in interest rates which could affect interest rate spreads and net interest income; |
increased pressures from competitors (both banks and non-banks) and/or an inability by of the Company to remain competitive in the financial services industry, particularly in the markets which the Company serves, and keep pace with technological changes;
| • | costs and effects of litigation, regulatory investigations or similar matters; |
| • | the inability to realize expected cost savings or implement integration plans and other adverse consequences associated with the mergers with Optima Bank & Trust Company (“Optima”) and Wellesley Bancorp, Inc. (“Wellesley”); |
unpredictable natural or other disasters, which could adversely impact the Company’s customers or operations;
| • | a failure by the Company to effectively manage the risks the Company faces, including credit, operational and cyber security risks; |
a loss of customer deposits, which could increase the Company’s funding costs;
| • | increased pressures from competitors (both banks and non-banks) and/or an inability by of the Company to remain competitive in the financial services industry, particularly in the markets which the Company serves, and keep pace with technological changes; |
the disparate impact that can result from having loans concentrated by loan type, industry segment, borrower type or location of the borrower or collateral;
| • | unpredictable natural or other disasters, which could adversely impact the Company’s customers or operations; |
changes in the creditworthiness of customers;
| • | a loss of customer deposits, which could increase the Company’s funding costs; |
increased loan losses or impairment of goodwill and other intangibles;
| • | the disparate impact that can result from having loans concentrated by loan type, industry segment, borrower type or location of the borrower or collateral; |
negative public opinion which could damage the Company’s reputation and adversely impact business and revenues;
| • | changes in the creditworthiness of customers; |
the Company depends on the expertise of key personnel, and if these individuals leave or change their roles without effective replacements, operations may suffer;
| • | increased credit losses or impairment of goodwill and other intangibles; |
the Company may not be able to hire or retain additional qualified personnel, including those acquired in previous acquisitions, and recruiting and compensation costs may increase as a result of turnover, both of which may increase costs and reduce profitability and may adversely impact the Company’s ability to implement the Company’s business strategies; and
| • | negative public opinion which could damage the Company’s reputation and adversely impact business and revenues; |
| • | the Company depends on the expertise of key personnel, and if these individuals leave or change their roles without effective replacements, operations may suffer; |
changes in the Company’s accounting policies or in accounting standards which could materially affect how the Company reports financial results and condition.
| • | the Company may not be able to hire or retain additional qualified personnel, including those acquired in previous acquisitions, and recruiting and compensation costs may increase as a result of turnover, both of which may increase costs and reduce profitability and may adversely impact the Company’s ability to implement the Company’s business strategies; and |
| • | changes in the Company’s accounting policies or in accounting standards which could materially affect how the Company reports financial results and condition. |
Except as required by law, the Company does not undertake, and specifically disclaims any obligation, to publicly release the result of any revisions which may be made to any forward-looking statements to reflect the occurrence of anticipated or unanticipated events or circumstances after the date of such statements. You are cautioned not to place undue reliance on these forward-looking statements.
Item 1. Business.
The Company
Cambridge Bancorp (together with its bank subsidiary, unless the context otherwise requires, the “Company”) is a Massachusetts state-chartered, federally registered bank holding company headquartered in Cambridge, Massachusetts. The Company is a Massachusetts corporation formed in 1983 and has one bank subsidiary, Cambridge Trust Company (the “Bank”), formed in 1890. On October 18, 2017, shares of the Company’s common stock commenced trading on the NASDAQ Stock Market under the symbol CATC. Prior to this date, the Company’s shares traded on the over the counterover-the-counter market. As of December 31, 2019,2020, the Company had total assets of approximately $2.9$3.9 billion. Currently, the Bank operates 1621 private banking offices in Eastern Massachusetts and New Hampshire. As a private bank, we focus on four core services that center around client needs. Our core services include Wealth Management, Commercial Banking, Residential Lending, and PersonalPrivate Banking. The Bank’s customers consist primarily of consumers and small- and medium-sized businesses in these communities and surrounding areas throughout Massachusetts and New Hampshire. The Company’s Wealth Management Group has five offices, two in Massachusetts in Boston Massachusettsand Wellesley, and three in New Hampshire in Concord, Manchester, and Portsmouth. As of December 31, 2019,2020, the Company had Assets under Management and Administration of approximately $3.5$4.2 billion. The Wealth Management Group offers comprehensive investment management, as well as trust administration, estate settlement, and financial planning services. Our wealth management clients value personal service and depend on the commitment and expertise of our experienced banking, investment, and fiduciary professionals.
The Wealth Management Group customizes investment portfolios to help clients meet their long-term financial goals. Through development of an appropriate asset allocation and disciplined security selection,and fund election, the Company’s in-house investment team targets long-term capital growth while seeking to minimize downside risk. Our internally developed, research-driven process is managed by our skilled team of portfolio managers and analysts. We build portfolios consisting of our best investment ideas, focusing on individual global equities, fixed income securities, exchange-traded funds, and mutual funds.
The Company offers a wide range of services to commercial enterprises, non-profit organizations, and individuals. The Company emphasizes service to consumers and small- and medium-sized businesses in its market area. The Company makes commercial loans, commercial real estate loans, construction loans, consumer loans, and real estate loans (including one-to-four family and home equity lines of credit), and accepts savings, money market, time, and demand deposits. In addition, the Company offers a wide range of commercial and personal banking services which include cash management, online banking, mobile banking, and global payments.
The Company’s results of operations are largely dependent on net interest income, which is the difference between the interest earned on loans and securities and interest paid on deposits and borrowings, and non-interest income largely from its wealth management
services. The results of operations are affected by the level of income and fees from loans, costs of deposits, and borrowings, as well as operating expenses, the provision for loancredit losses, the impact of federal and state income taxes, the relative levels of interest rates, and local and national economic activity.
Through the Bank, the Company focuses on wealth management, the commercial banking business and private banking for clients, including residential lending and personalrelationship banking. Within the commercial loan portfolio, the Company has traditionally been a commercial real estate lender andlender. However, in recent years the Company has diversified commercial operations within the areas of commercial and industrial lending to include Renewable Energy, Innovation Banking, which specializes in working with primarily New England-based entrepreneurs, and asset basedasset-based lending that helps companies throughout New England and New York grow by borrowing against existing assets. Through its renewable energy lending efforts, the Company provides financing for developers and operators of commercial and utility scale renewable energy projects. Financing is provided for the construction and permanent financing of new projects, the acquisition of completed projects, or the refinancing of existing operating projects. Target clients include experienced developer/operators who have built or managed other renewable energy facilities. The Innovation Banking Group has a narrow client focus for lending and provides a local banking option for life science, technology and entrepreneurial companies within our market area that are primarily serviced by out-of-market institutions. Personalarea. Relationship banking focuses on providing exceptional service to clients and in deepening relationships.
Cambridge Trust Company
The Bank offers a full range of commercial and consumer banking services through its network of 1621 private banking offices in Eastern Massachusetts and New Hampshire. The Bank is engaged principally in the business of attracting deposits from the public and investing those deposits. The Bank invests those funds in various types of loans, including residential and commercial real estate, and a variety of commercial and consumer loans. The Bank also invests its deposits and borrowed funds in investment securities and has two wholly-ownedwholly owned Massachusetts security corporations, CTC Security Corporation and CTC Security Corporation III, for this purpose. Deposits at the Bank are insured by the Federal Deposit Insurance Corporation (the “FDIC”) for the maximum amount permitted by FDIC regulations.
Investment management and trust services are offered through our two wealth management offices located in BostonMassachusetts and three wealth management offices located in New Hampshire. The Bank also utilizes its subsidiary and non-depository trust company, Cambridge Trust Company of New Hampshire, Inc., to provide specialized wealth management services in New Hampshire. The assets held for wealth management customers are not assets of the Bank and, accordingly, are not reflected in the Company’s consolidated balance sheets.
The Bank is active in the communities we serve. The Bank makes contributions to various non-profits and local organizations, investments in community development lending, and investments in low-income housing all, of which strive to improve the communities that our employees and customers call home.
Merger with Wellesley Bancorp, Inc.
On June 1, 2020, the Company completed its merger with Wellesley (“the Wellesley Merger”), adding 6 banking offices in Massachusetts. Under the terms of the Agreement and Plan of Merger with Wellesley, each outstanding share of Wellesley common stock was converted into 0.580 shares of the Company’s common stock. As a result of the merger, former Wellesley shareholders received an aggregate of 1,502,814 shares of the Company’s common stock. The total consideration paid amounted to $88.8 million, based on the closing price of $58.00 of the Company’s common stock, the value of Wellesley’s exercisable options, and cash paid for fractional shares on May 31, 2020.
The Company accounted for the Wellesley Merger using the acquisition method pursuant to the Business Combinations Topic of the Financial Accounting Standards Board (“FASB”) Accounting Standards Codification (“ASC”). Accordingly, the Company recorded merger expenses of approximately $6.4 million for the year ended December 31, 2020. The Company recorded total assets of $985.6 million, assumed total liabilities of $917.6 million, and recorded an additional $20.7 million in goodwill. Additionally, the Company recorded $8.6 million in provision for credit losses to reflect the impact of CECL merger accounting on June 1, 2020. See Note 4 – Mergers.
Merger with Optima Bank & Trust Company
In the fourth quarter of 2018, the Company, the Bank, and Optima Bank & Trust Company (“Optima”) entered into a definitive agreement pursuant to which Optima merged with and into the Bank in a stock and cash transaction.
The Company completed its merger with Optima on April 17, 2019. Under the terms of the Agreement and Plan of Merger with Optima, each outstanding share of Optima common stock was converted into $32.00 in cash or 0.3468 shares of the Company’s common stock, with the consideration for the transaction structured as 95%95 percent common stock and 5%5 percent cash. As a result of the merger, with Optima, former Optima shareholders received an aggregate of approximately 722,746 shares of the Company’s common stock and an aggregate of approximately $3.5 million in cash. The total consideration paid in the merger with Optima amounted to $64.3 million.
Merger with Wellesley Bancorp, Inc.
InThe Company accounted for the fourth quartermerger using the acquisition method and recorded total assets of 2019,$555.7 million, assumed total liabilities of $491.4 million, and recorded an additional $30.8 million in goodwill. Additionally, the Company recorded merger expenses of $3.9 million for the Bank, Wellesley, and Wellesley Bank, Wellesley’s subsidiary bank, entered into a definitive agreement pursuant to which Wellesley will merge with and into the Company and Wellesley Bank will merge with and into the Bank in an all-stock transaction (the “Merger”), which is anticipated to close during the second quarter of 2020. The Merger is subject to regulatory approval, approval by the Company’s and Wellesley’s shareholders, and the completion of other customary closing conditions. Under the terms of the merger agreement, Wellesley shareholders will receive 0.580 shares of the Company’s common stock for each share of Wellesley common stock they own on the effective date of the Merger. This strategically compelling transaction is expected to enhance and expand the Company’s Greater Boston presence with the addition of Wellesley’s six full-service banking offices in the Norfolk, Middlesex, and Suffolk Counties of Massachusetts.year ended December 31, 2019.
Market Area
The Company operates in Eastern Massachusetts and Southern New Hampshire. Our primary lending market includes Middlesex and Suffolk CountiesNorfolk counties in Massachusetts.Massachusetts and Rockingham and Hillsborough counties in New Hampshire. We benefit from the presence of numerous institutions of higher learning, medical care and research centers, a vibrant innovation economy in life sciences and technology, and the corporate headquarters of several significant financial service companies within the Boston area. Eastern Massachusetts also has many high technologyhigh-technology companies employing personnel with specialized skills. These factors affect the demand for wealth management services, residential homes, multi-family apartments, office buildings, shopping centers, industrial warehouses, and other commercial properties.
Our lending area is primarily an urban market area with a substantial number of one-to-four unitone-to-four-unit residential properties, some of which are non-owner occupied, as well as apartment buildings, condominiums, office buildings, and retail space. As a result, our loan portfolio contains a significantly greater number of multi-family and commercial real estate loans compared to institutions that operate in non-urban markets.
Our market area is located largely in the Boston-Cambridge-Quincy, Massachusetts/New Hampshire Metropolitan Statistical Area (“MSA”). The United States Census Bureau estimates that as of April 2019,2020, the Boston metropolitan area is the 10th largest metropolitan area in the United States. Located adjacent to major transportation corridors, the Boston metropolitan area provides a highly diversified economic base, with major employment sectors ranging from services, education, manufacturing, and wholesale/retail trade, to finance, technology, and medical care. According to the United States Department of Labor, in November 2019,December 2020, the Boston-Cambridge-Quincy,Boston-Cambridge-Nashua, Massachusetts/New Hampshire MSA had an unemployment rate of 2.1%6.9% compared to the national unemployment rate of 3.5%6.5%.
Competition
The financial services industry is highly competitive. The Company experiences substantial competition with other commercial banks, savings and loan associations, securities and brokerage companies, mortgage companies, insurance companies, finance companies, money market funds, credit unions, and other non-bank financial service providers in attracting deposits, making loans, and attracting wealth management customers. The competing major commercial banks have greater resources that may provide them a competitive advantage by enabling them to maintain numerous branch offices and mount extensive advertising campaigns. The increasingly competitive environment is the result of changes in regulation, changes in technology and product delivery systems, additional financial service providers, and the accelerating pace of consolidation among financial services providers.
The financial services industry has become even more competitive as a result of legislative, regulatory, and technological changes and continued consolidation. Banks, securities firms, and insurance companies can merge under the umbrella of a financial holding company, which can offer virtually any type of financial service, including banking, securities underwriting, insurance (both agency and underwriting), and merchant banking. Also, technology has lowered barriers to entry and made it possible for non-banks to offer products and services traditionally provided by banks, such as automatic transfer and automatic payment systems.
Some of the Company’s non-banking competitors have fewer regulatory constraints and may have lower cost structures. In addition, some of the Company’s competitors have assets, capital, and lending limits greater than that of the Company, greater access to capital markets, and offer a broader range of products and services than the Company. These institutions may have the ability to finance wide-ranging advertising campaigns and may also be able to offer lower rates on loans and higher rates on deposits than the Company can offer. Some of these institutions offer services, such as international banking, which the Company does not directly offer.
Various in-state market competitors and out-of-state banks continue to enter or have announced plans to enter or expand their presence in the market areas in which the Company currently operates. With the addition of new banking presences within our market, the Company expects increased competition for loans, deposits, and other financial products and services.
The Bank is a private bank, stressing the holistic client relationship, and relies upon local promotional activities, personal relationships established by officers, directors, and employees with their customers,clients, and specialized services tailored to meet the needs of the communities served. While the Bank’s position varies by market, management believes that it can compete effectively as a result of local market knowledge, local decision making, and awareness of customerclient needs.
Supervision and Regulation
General
Banking is a complex, highly regulated industry. Consequently, the performance of the Company and the Bank can be affected not only by management decisions and general and local economic conditions, but also by the statutes enacted by the U.S. Congress and state legislatures, and the regulations and policies of, various governmental regulatory authorities. These authorities include, but are not limited to, the Board of Governors of the Federal Reserve System (the “Federal Reserve”), the Massachusetts Division of Banks (the “MA DOB”), the State of New Hampshire Banking Department, and the FDIC.
The primary goals of bank regulation are to maintain a safe and sound banking system and to facilitate the conduct of sound monetary policy. In furtherance of these goals, the U.S. Congress and the Commonwealth of Massachusetts have created largely autonomous regulatory agencies that oversee and have enacted numerous laws that govern banks, bank holding companies, and the banking industry. The system of supervision and regulation applicable to the Company and the Bank establishes a comprehensive framework for the entities’ respective operations and is intended primarily for the protection of the Bank’s depositors and the public, rather than the shareholders and creditors. The following summarizes the significant laws, rules, and regulations governing banks and bank holding companies, including the Company and the Bank, but does not purport to be a complete summary of all applicable laws, rules, and regulations governing bank holding companies and banks or the Company or the Bank. The descriptions are qualified in their entirety by reference to the specific statutes, regulations, and policies discussed. Any change in applicable laws, regulations, or regulatory policies may have a material effect on our businesses, operations, and prospects. The Company is unable to predict the nature or extent of the effects that economic controls or new federal or state legislation may have on our business and earnings in the future.
In addition to the summary below, as a result of the COVID-19 pandemic, the U.S. bank regulators issued several letters and other guidance to bank holding companies and banks regarding expectations for supporting the community and certain related temporary regulatory changes or accommodations, including, for example, temporary relief for banks that may exceed certain regulatory asset thresholds due in large part to their participation in government programs established in response to the COVID-19 pandemic. The Company continues to monitor guidance and developments related to COVID-19.
Regulatory Agencies
The Company is a legal entity separate and distinct from its first tierfirst-tier bank subsidiary, the Bank, and its second tiersecond-tier subsidiaries, Cambridge Trust Company of New Hampshire, Inc., a New Hampshire state-chartered non-depository trust company, and CTC Security Corporation and CTC Security Corporation III, which are used to invest the Bank’s deposits and borrowed funds in investment securities. As a bank holding company, the Company is regulated under the Bank Holding Company Act of 1956, as amended (“BHC Act”), Massachusetts laws applying to bank holding companies and Massachusetts corporations more generally. The Company is subject to inspection, examination, and supervision by the Federal Reserve and the MA DOB.
As a Massachusetts state-chartered insured depository institution, the Bank is subject to supervision, periodic examination, and regulation by the MA DOB as its chartering authority, and by the FDIC as its primary federal regulator. The prior approval of the MA DOB and the FDIC is required, among other things, for the Bank to establish or relocate any additional branch offices, assume deposits, or engage in any merger, consolidation, purchase, or sale of all or substantially all of the assets of any insured depository institution.
Cambridge Trust Company of New Hampshire, Inc. is subject to supervision, periodic examination, and regulation by The State of New Hampshire Banking Department.
Bank Holding Company Regulations Applicable to the Company
The BHC Act and other federal laws and regulations subject bank holding companies to particular restrictions on the types of activities in which they may engage and to a range of supervisory requirements and activities, including regulatory enforcement actions for violations of laws and regulations. As a Massachusetts corporation and bank holding company, the Company is also subject to certain limitations and restrictions under applicable Massachusetts law.
Mergers & Acquisitions
The BHC Act, the Bank Merger Act, the laws of the Commonwealth of Massachusetts applicable to financial institutions, and other federal and state statutes regulate acquisitions of banks and their holding companies. The BHC Act generally limits acquisitions by bank holding companies to banks and companies engaged in activities that the Federal Reserve has determined to be so closely related to banking as to be a proper incident thereto. The BHC Act requires every bank holding company to obtain the prior approval of the Federal Reserve before (i) acquiring more than 5% of the voting stock of any bank or other bank holding company, (ii) acquiring all or substantially all of the assets of any bank or bank holding company, or (iii) merging or consolidating with any other bank holding company.
In reviewing applications seeking approval of merger and acquisition transactions, the bank regulatory authorities generally consider, among other things, the competitive effect and public benefits of the transactions, the financial and managerial resources and future prospects of the combined organization (including the capital position of the combined organization), the applicant’s performance record under the Community Reinvestment Act (see —Community Reinvestment Act), fair housing laws, and the effectiveness of the subject organizations in combating money laundering activities.
Non-bank Activities
Generally, bank holding companies are prohibited, under the BHC Act, from engaging in, or acquiring direct or indirect control of more than 5% of the voting shares of any company engaged in, any activity other than (i) banking or managing or controlling banks or (ii) an activity that the Federal Reserve determines to be so closely related to banking as to be a proper incident to the business of banking. The Federal Reserve has the authority to require a bank holding company to terminate an activity or terminate control of, or liquidate or divest, certain subsidiaries or affiliates when the Federal Reserve believes the activity or the control of the subsidiary or affiliate constitutes a significant risk to the financial safety, soundness, or stability of any of its bank subsidiaries.
A bank holding company that qualifies and elects to become a financial holding company is permitted to engage in additional activities that are financial in nature or incidental or complementary to financial activity. The Company currently has no plans to make a financial holding company election.
Bank holding companies and their non-banking subsidiaries are prohibited from engaging in activities that represent unsafe and unsound banking practices. For example, under certain circumstances the Federal Reserve’s Regulation Y requires a holding company to give the Federal Reserve prior notice of any redemption or repurchase of its own equity securities if the consideration to be paid, together with the consideration paid for any other redemptions or repurchases in the preceding year, is equal to 10% or more of the bank holding company’s consolidated net worth. The Federal Reserve may oppose the transaction if it believes that the transaction would constitute an unsafe or unsound practice or would violate a regulation. As another example, a bank holding company is prohibited from impairing its subsidiary bank’s soundness by causing the bank to make funds available to non-bank subsidiaries or their customers if the Federal Reserve believes it is not prudent to do so. The Federal Reserve has the power to assess civil money penalties for knowing or reckless violations if the activities leading to a violation caused a substantial loss to a depository institution. Potential penalties can reach as high as almost $2.0 million for each day such activity continues.
Source of Strength
In accordance with Federal Reserve policy, the Company is expected to act as a source of financial and managerial strength to the Bank. Section 616 of the Dodd-Frank Act codifies the requirement that bank holding companies serve as a source of financial strength to their subsidiary depository institutions. Under this policy, the holding company is expected to commit resources to support its bank subsidiary, including at times when the holding company may not be in a financial position to provide it. As discussed below, the Company could be required to guarantee the capital plan of the Bank if it becomes undercapitalized for purposes of banking regulations. Any capital loans by a bank holding company to its subsidiary bank are subordinate in right of payment to deposits and to certain other indebtedness of such subsidiary bank. The BHC Act provides that, in the event of a bank holding company’s bankruptcy, any commitment by the bank holding company to a federal bank regulatory agency to maintain the capital of a bank subsidiary will be assumed by the bankruptcy trustee and entitled to priority of payment.
Regulatory agencies have promulgated regulations to increase the capital requirements for bank holding companies to a level that matches those of banking institutions. See —Capital Adequacy and Prompt Corrective Action and Safety and Soundness.
Annual Reporting & Examinations
The Company is required to file annual and periodic reports with the Federal Reserve and such additional information as the Federal Reserve may require. The Federal Reserve may examine a bank holding company and any of its subsidiaries and charge the Company for the cost of such an examination.
Imposition of Liability for Undercapitalized Subsidiaries
Pursuant to Section 38 of the Federal Deposit Insurance Act (the “FDIA”) federal banking agencies are required to take “prompt corrective action” should an insured depository institution fail to meet certain capital adequacy standards. In the event an institution becomes “undercapitalized,” it must submit a capital restoration plan. The capital restoration plan will not be accepted by the regulators unless each company “having control of” the undercapitalized institution has “guaranteed” the subsidiary’s compliance with the capital restoration plan until it has been “adequately capitalized” on average during each of four consecutive calendar quarters. For purposes of this statute, the Company has control of the Bank. Under the FDIA, the aggregate guarantee liability of all companies controlling a particular institution is limited to the lesser of 5% of the depository institution’s total assets at the time it became
undercapitalized or the amount necessary to bring the institution into compliance with applicable capital standards. The FDIA grants greater powers to the federal banking agencies in situations where an institution becomes “significantly” or “critically” undercapitalized or fails to submit a capital restoration plan. For example, a bank holding company controlling such an institution can be required to obtain prior Federal Reserve approval of proposed distributionsor might be required to consent to a merger or to divest the troubled institution or other affiliates. See — Capital Adequacy and Prompt Corrective Action and Safety and Soundness.
Dividends
Dividends from the Bank are the Company’s principal source of cash revenues. The Company’s earnings and activities are affected by legislation, regulations, and local legislative and administrative bodies and decisions of courts in the jurisdictions in which we conduct business. These include limitations on the ability of the Bank to pay dividends to the Company and our ability to pay dividends to our shareholders. It is the policy of the Federal Reserve that bank holding companies should pay cash dividends on common stock only out of income available over the past year and only if prospective earnings retention is consistent with the organization’s expected future needs and financial condition. This policy provides that bank holding companies should not maintain a level of cash dividends that undermines the bank holding company’s ability to serve as a source of strength to its bank subsidiary. Consistent with such policy, a banking organization should have comprehensive policies on dividend payments that clearly articulate the organization’s objectives and approaches for maintaining a strong capital position and achieving the objectives of the policy statement. The Company has a comprehensive dividend policy in place.
The FDIC has the authority to use its enforcement powers to prohibit a bank from paying dividends if, in its opinion, the payment of dividends would constitute an unsafe or unsound practice. Federal law also prohibits the payment of dividends by a bank that will result in the bank failing to meet its applicable capital requirements on a pro forma basis. Under applicable Massachusetts law, the Bank’s board may declare from net profits cash dividends annually, semi-annually, or quarterly, but not more frequently, and noncash dividends at any time, although no dividends may be declared, credited, or paid so long as there is any impairment of capital stock. The MA DOB Commissioner’s approval is required in order to authorize the payment of a dividend, if the total dividends declared in a calendar year exceed that year’s net profits combined with retained net profits for the preceding two years, less any required transfer to surplus or a fund for the retirement of any preferred stock.
Federal Reserve System
Federal Reserve regulations require depository institutions to maintain reserves against certain types of deposits and other liabilities, including transaction accounts, such as interest-bearing and regular checking accounts. The Bank’s required reserves can be in the form of vault cash. If vault cash does not fully satisfy the required reserves, the reserves can be in the form of a balance maintained with the Federal Reserve Bank of Boston. For 2020, the Bank’s transaction accounts up to and including $16.9 million are exempt and subject to a zero percent reserve requirement. Any amount of transaction accounts greater than $16.9 million up to and including $127.5 million have a reserve requirement of 3%, and any amount of transaction accounts greater than $127.5. million have a reserve requirement of 10%. The Federal Reserve generally makes annual adjustments to the tiered reserves. The Bank is in compliance with these reserve requirements.
Transactions with Affiliates
Transactions between a bank and its affiliates are subject to certain restrictions under Sections 23A and 23B of the Federal Reserve Act (the “FRA”“FRA”) and the Federal Reserve’s implementing Regulation W. The Company is considered an “affiliate” of the Bank under these sections. Generally, Sections 23A and 23B: (1) limit the extent to which an insured depository or its subsidiaries may engage in covered transactions (a) with an affiliate (as defined in such sections) to an amount equal to 10% of such institution’s capital and surplus and (b) with all affiliates, in the aggregate, to an amount equal to 20% of such capital and surplus; and (2) require all transactions with an affiliate, whether or not covered transactions, to be on terms substantially the same, or at least as favorable to the institution or subsidiary, as the terms provided or that would be provided to a non-affiliate.non-affiliate. The term “covered transaction” includes the making of loans to an affiliate, purchase securities issued by an affiliate, purchase of assets from an affiliate,, issuance of a guarantee on behalf of an affiliate, and other similar types of transactions.
Capital Adequacy
In July 2013, the Federal Reserve, the Office of the Comptroller of the Currency (“OCC”), and the FDIC approved final rules (the “Capital Rules”) establishing a new comprehensive capital framework for U.S. banking organizations. The Capital Rules generally implement the Basel Committee on Banking Supervision’s (the “Basel Committee”) December 2010 final capital framework referred to as “Basel III” for strengthening international capital standards. The Capital Rules revise the definitions and the components of regulatory capital, as well as address other issues affecting the numerator in banking institutions’ regulatory capital ratios. The Capital Rules also address asset risk weights and other matters affecting the denominator in banking institutions’ regulatory capital ratios and replace the existing general risk-weighting approach with a more risk-sensitive approach.
The Capital Rules: (i) include “Common Equity Tier 1” (“CET1”) and related regulatory capital ratio of CET1 to risk-weighted assets; (ii) specify that Tier 1 capital consists of CET1 and “Additional Tier 1 capital” instruments meeting certain revised requirements; (iii) mandate that most deductions/adjustments to regulatory capital measures be made to CET1 and not to the other components of capital; and (iv) expand the scope of the deductions from and adjustments to capital as compared to existing regulations. Under the Capital Rules, for most banking organizations, including the Company, the most common form of Additional Tier 1 capital is non-cumulative perpetual preferred stock, and the most common forms of Tier 2 capital are subordinated notes and a portion of the allocation for loan and leaseallowance for credit losses, in each case, subject to the Capital Rules’ specific requirements.
Pursuant to the Capital Rules, effective January 1, 2015, the minimum capital ratios are as follows:
4.5% CET1 to risk-weighted assets;
| • | 4.5% CET1 to risk-weighted assets; |
6.0% Tier 1 capital (that is, CET1 plus Additional Tier 1 capital) to risk-weighted assets;
| • | 6.0% Tier 1 capital (that is, CET1 plus Additional Tier 1 capital) to risk-weighted assets; |
8.0% Total capital (that is, Tier 1 capital plus Tier 2 capital) to risk-weighted assets; and
| • | 8.0% Total capital (that is, Tier 1 capital plus Tier 2 capital) to risk-weighted assets; and |
4.0% Tier 1 capital to average consolidated assets as reported on consolidated financial statements (called “leverage ratio”).
| • | 4.0% Tier 1 capital to average consolidated assets as reported on consolidated financial statements (called “leverage ratio”). |
The Capital Rules also include a “capital conservation buffer,” composed entirely of CET1, in addition to these minimum risk-weighted asset ratios. The capital conservation buffer is designed to absorb losses during periods of economic stress. Banking institutions that do not hold the requisite capital conservation buffer will face constraints on dividends, capital instrument repurchases, interest payments on capital instruments and discretionary bonus payments based on the amount of the shortfall. Thus, the capital standards applicable to the Company include an additional capital conservation buffer of 2.5% of CET1, effectively resulting in minimum ratios inclusive of the capital conservation buffer of (i) CET1 to risk-weighted assets of at least 7%, (ii) Tier 1 capital to risk-weighted assets of at least 8.5%, and (iii) total capital to risk-weighted assets of at least 10.5%.
The Capital Rules provide for a number of deductions from and adjustments to CET1. These include, for example, the requirement that mortgage servicing assets, deferred tax assets arising from temporary differences that could not be realized through net operating loss carrybacks, and significant investments in non-consolidated financial entities be deducted from CET1 to the extent that any one such category exceeds 10% of CET1 or all such items, in the aggregate, exceed 15% of CET1. In November 2017, the Federal Reserve finalized a rule pausing the phase-in of these deductions and adjustments for non-advanced approaches institutions. In July 2019, the Office of the Comptroller of the Currency, the Federal Reserve Board and the FDIC adopted a final rule intended to simply the Capital Rules described above for non-advanced approaches institutions. Institutions maycould implement the provisions of the simplification rule beginning on January 1, 2020 and mustwere required to implement them by April 1, 2020. The transition provisions to the Capital Rules issued by these agencies in November 2017 will ceaseceased to apply to an institution in the quarter in which it adoptsadopted the simplification rule.
In addition, under the current general risk-based capital rules, the effects of accumulated other comprehensive income or loss items included in shareholders’ equity (for example, mark-to-market of securities held in the available for sale portfolio) under U.S. generally accepted accounting principles (“GAAP”) are reversed for the purposes of determining regulatory capital ratios. Pursuant to the Capital Rules, the effects of certain of the above items are not excluded. However, banking organizations, including the Company, that are not subject to the advanced approaches rule, could make a one-time permanent election to exclude these items. The Company made the one-time permanent election to exclude these items.
The Capital Rules also preclude certain hybrid securities, such as trust preferred securities, from inclusion in bank holding companies’ Tier 1 capital, although bank holding companies that had total consolidated assets of less than $15 billion at December 31, 2009 may include trust preferred securities issued prior to May 19, 2010 as a component of Tier 1 capital.
The risk-weighting categories in the Capital Rules are standardized and include a risk-sensitive number of categories, depending on the nature of the assets, generally ranging from 0% for U.S. government and agency securities, to 1,250% for certain credit exposures, and resulting in higher risk weights for a variety of asset classes.
In September 2019, the Office of the Comptroller of the Currency, the Federal Reserve Board, and the FDIC adopted a final rule that is intended to further simply the Capital Rules for depository institutions and their holding companies that have less than $10 billion in total consolidated assets, such as us, if such institutions meet certain qualifying criteria. This final rule became effective on January 1, 2020. Under this final rule, if we meet the qualifying criteria, including having a leverage ratio (equal to tier 1 capital divided by average total consolidated assets) of greatera certain size (greater than 8.5 percent through 2021 and 9 percent thereafter), we will be eligible to opt into the community bank leverage ratio framework. If we opt into this framework, we will be considered to have satisfied the generally applicable risk-based and leverage capital requirements in the Capital Rules (as modified pursuant to the simplification rule) and will be considered to have met the well-capitalized ratio requirements for PCA purposes. The Bank is currently evaluation the requirements ofhas not elected to adopt this framework.
The Company and the Bank are in compliance with the currently applicable capital requirements.
Prompt Corrective Action and Safety and Soundness
Pursuant to Section 38 of the FDIA, federal banking agencies are required to take “prompt corrective action” should a depository institution fail to meet certain capital adequacy standards. At each successive lower capital category, an insured depository institution is subject to more restrictions and prohibitions, including restrictions on growth, restrictions on interest rates paid on deposits, restrictions, or prohibitions on payment of dividends, and restrictions on the acceptance of brokered deposits. For example, “well-capitalized” institutions are permitted to accept brokered deposits, but banks that are not well-capitalized are generally restricted or prohibited from accepting such deposits. Furthermore, if an insured depository institution is classified in one of the undercapitalized categories, it is required to submit a capital restoration plan to the appropriate federal banking agency, and the holding company must guarantee the performance of that plan. Based upon its capital levels, a bank that is classified as well-capitalized, adequately capitalized, or undercapitalized may be treated as though it were in the next lower capital category if the appropriate federal banking agency, after notice and opportunity for hearing, determines that an unsafe or unsound condition or an unsafe or unsound practice warrants such treatment.
For purposes of prompt corrective action, to be: (i) well-capitalized, a bank must have a total risk-based capital ratio of at least 10%, a Tier 1 risk-based capital ratio of at least 8%, a CET1 risk-based capital ratio of at least 6.5%, and a Tier 1 leverage ratio of at least 5%; (ii) adequately capitalized, a bank must have a total risk-based capital ratio of at least 8%, a Tier 1 risk-based capital ratio of at least 6%, a CET1 risk-based capital ratio of at least 4.5%, and a Tier 1 leverage ratio of at least 4% (but not otherwise meet all of the criteria to be considered “well-capitalized”); (iii) undercapitalized, a bank would have a total risk-based capital ratio of less than 8%, a Tier 1 risk-based capital ratio of less than 6%, a CET1 risk-based capital ratio of less than 4.5%, or a Tier 1 leverage ratio of less than 4% (but not otherwise meet all of the criteria to be considered “significantly” or “critically” undercapitalized); (iv) significantly undercapitalized, a bank would have a total risk-based capital ratio of less than 6%, a Tier 1 risk-based capital ratio of less than 4%, a CET1 risk-based capital ratio of less than 3%, or a Tier 1 leverage ratio of less than 3% (but not otherwise meet the criterion to be considered “critically undercapitalized”); and (v) critically undercapitalized, a bank would have a ratio of tangible equity to total assets that is less than or equal to 2%.
The Bank is currently well-capitalized, under the prompt corrective action standards.
Bank holding companies and insured banks also may be subject to potential enforcement actions of varying levels of severity by the federal banking agencies for unsafe or unsound practices in conducting their business, or for violation of any law, rule, regulation, condition imposed in writing by the agency or term of a written agreement with the agency. In more serious cases, enforcement actions may include: issuances of directives to increase capital; issuances of formal and informal agreements; impositions of civil monetary penalties; issuances of a cease and desist order that can be judicially enforced; issuances of removal and prohibition orders against officers, directors, and other institution−affiliated parties; terminations of the bank’s deposit insurance; appointment of a conservator or receiver for the bank; and enforcements of such actions through injunctions or restraining orders based upon a judicial determination that the agency would be harmed if such equitable relief was not granted.
The Volcker Rule
Section 619 of the Dodd-Frank Act, commonly known as the Volcker Rule, restricts the ability of banking entities, such as the Company and the Bank, from: (i) engaging in “proprietary trading” and (ii) investing in or sponsoring certain types of funds (“Covered Funds”), subject to certain limited exceptions. Under the Volcker Rule, the term “Covered Fund” includes any issuer that would be an investment company under the Investment Company Act of 1940 (the “ICA”) but for the exemptions in section 3(c)(1) and 3(c)(7) of the ICA. Collateralized loan obligation (“CLO”) and collateralized debt obligation securities are generally considered ownership interests in Covered Funds, but the Volcker Rule provides, among other exemptions, an exemption for CLOs meeting certain requirements. The Company is in compliance with the Volcker Rule.
Deposit Insurance
The Bank’s deposit accounts are fully insured by the Deposit Insurance Fund (the “DIF”) of the FDIC up to the deposit insurance limit of $250,000 per depositor, per insured institution, per ownership category, in accordance with applicable laws and regulations.
The FDIC uses a risk-based assessment system that imposes insurance premiums based upon a risk matrix that accounts for a bank’s capital level and supervisory rating (CAMELS rating). The risk matrix uses different risk categories distinguished by capital levels and supervisory ratings. The base for deposit insurance assessments is average consolidated total assets less average tangible equity. Assessment rates are calculated using formulas that take into account the risk of the institution being assessed. The FDIC may increase or decrease the assessment rate schedule in order to manage the DIF to prescribed statutory target levels. An increase in the risk category for the Bank or in the assessment rates could have an adverse effect on the Bank’s, and consequently the Company’s earnings. The FDIC may terminate deposit insurance if it determines the institution involved has engaged in or is engaging in unsafe or unsound banking practices, is in an unsafe or unsound condition, or has violated applicable laws, regulations, or orders. The Bank is not aware of any practice, condition, or violation that might lead to the termination of its deposit insurance.
The FDIA and FDIC regulations generally limit the ability of an insured depository institution to accept, renew or roll over any brokered deposit unless the institution’s capital category is “well capitalized” or, with the FDIC’s approval, “adequately capitalized.” Depository institutions that have brokered deposits in excess of 10% of total assets are subject to increased FDIC deposit insurance premium assessments. However, for institutions that are well capitalized and have a CAMELS composite rating of 1 or 2, reciprocal deposits are deducted from brokered deposits. Section 202 of the Economic Growth, Regulatory Relief, and Consumer Protection Act (the “Economic Growth Act”), which was enacted in 2018, amendsamended the FDIA to exempt a capped amount of reciprocal deposits from treatment as brokered deposits for certain insured depository institutions.
Depositor Preference
The FDIA provides that, in the event of the “liquidation or other resolution” of an insured depository institution, the claims of depositors of the institution, including the claims of the FDIC as subrogee of insured depositors, and certain claims for administrative expenses of the FDIC as a receiver, will have priority over other general unsecured claims against the institution. If an insured depository institution fails, insured and uninsured depositors, along with the FDIC, will have priority in payment ahead of unsecured, non-deposit creditors, including the parent bank holding company, with respect to any extensions of credit they have made to such insured depository institution.
Consumer Financial Protection
The Company and the Bank are subject to a number of federal and state consumer protection laws that govern their relationship with customers. These laws include the Consumer Financial Protection Act of 2010, Equal Credit Opportunity Act, the Fair Credit Reporting Act, the Truth in Lending Act, the Truth in Savings Act, the Electronic Fund Transfer Act, the Expedited Funds Availability Act, the Home Mortgage Disclosure Act, the Fair Housing Act, the Real Estate Settlement Procedures Act, the Fair Debt Collection Practices Act, the Right to Financial Privacy Act, the Servicemembers Civil Relief Act, and these laws’ respective state-law counterparts, as well as state usury laws and laws regarding unfair and deceptive acts and practices. These and other federal laws, among other things, require disclosures of the cost of credit and terms of deposit accounts, provide substantive consumer rights, prohibit discrimination in credit transactions, regulate the use of credit report information, provide financial privacy protections, prohibit unfair, deceptive, and abusive practices, restrict the Bank’s ability to raise interest rates, and subject the Bank to substantial regulatory oversight. Violations of applicable consumer protection laws can result in significant potential liability from litigation brought by customers, including actual damages, restitution, and attorneys’ fees.
Further, the Consumer Financial Protection Bureau (“CFPB”) has broad rulemaking authority for a wide range of consumer financial laws that apply to all banks, including, among other things, the authority to prohibit “unfair, deceptive or abusive” acts and practices. While there are no statutory definitions for those terms, the CFPB has found an act or practice to be “unfair” when: “(i) it causes or is likely to cause substantial injury to consumers; (ii) the injury is not reasonably avoidable by consumers; and (iii) the injury is not outweighed by countervailing benefits to consumers or to competition.���” “Deceptive acts or practices” occur when “(i) the act or practice misleads or is likely to mislead the consumer; (ii) the consumer’s interpretation is reasonable under the circumstances; and (iii) the misleading act or practice is material.” Finally, an act or practice is “abusive” when it: “(i) materially interferes with the ability of a consumer to understand a term or condition of a consumer financial product or service; or (ii) takes unreasonable advantage of (a) a consumer’s lack of understanding of the material risks, costs, or conditions of the product or service; (b) a consumer’s inability to protect his or her interests in selecting or using a consumer financial product or service; or (c) a consumer’s reasonable reliance on a covered person to act in his or her interests.”
Neither the Dodd-Frank Act, nor the individual consumer financial protection laws prevent states from adopting stricter consumer protection standards.
Community Reinvestment Act
The Community Reinvestment Act of 1977 (the “CRA”), requires depository institutions to assist in meeting the credit needs of their market areas consistent with safe and sound banking practice. Under the CRA, each depository institution is required to help meet the credit needs of its market areas by, among other things, providing credit to lowlow- and moderate incomemoderate-income individuals and communities. These factors are also considered in evaluating mergers, acquisitions, and applications to open a branch or facility. The applicable federal banking agencies regularly conduct CRA examinations to assess the performance of financial institutions and assign one of four ratings to the institution’s records of meeting the credit needs of its community. The Bank received a “Satisfactory” rating during its last examination in August 2017.July 2020.
Insider Credit Transactions
Section 22(h) of the FRA and its implementing Regulation O restricts loans to directors, executive officers, and principal shareholders of a bank or its affiliates, and companies and political or campaign committees controlled by such persons (“insiders”). Under Section 22(h), a loan by a bank to any insider may not exceed, together with all other outstanding loans to suchsuch person and any company or political or campaign committee controlled by such person, the bank’s loan-to-one-borrower limit. Loans to insiders above specified amounts must receive the prior approval of the board of directors. Further, under Section 22(h) of the FRA, loans to insiders must be made on terms substantially the same as offered in comparable transactions to other persons, except that such insiders may receive preferential loans made under a benefit or compensation program that is widely availableavailable to the bank’s (or, if applicable, the bank affiliate’s) employees and does not give preference to the insider over the employees. Section 22(g) of the FRA places additional limitations on loans to executive officers. A violation of these restrictions may result in the assessment of substantial civil monetary penalties on the affected bank or any officer, director, employee, agent, or other person participating in the conduct of the affairs of that bank, the imposition of a cease and desist order, and other regulatory sanctions.
Financial Privacy
The Company is subject to federal laws, including the Gramm-Leach-Bliley Act (the “GLBA”), and certain state laws containing consumer privacy protection provisions. These provisions limit the ability of banks and other financial institutions to disclose nonpublic information about consumers to affiliated and non-affiliated third parties and limit the reuse of certain consumer information received from non-affiliated financial institutions. These provisions require notice of privacy policies to customers and, in some circumstances, allow consumers to prevent disclosure of certain nonpublic personal information to affiliates or non-affiliated third parties by means of “opt out” or “opt in” authorizations.
Financial Data Security
The GLBA requires that financial institutions implement comprehensive written information security programs that include administrative, technical, and physical safeguards to protect consumer information. Further, pursuant to interpretive guidance issued under the GLBA and certain state laws, financial institutions are required to notify customers and regulators of security breaches that result in unauthorized access to their nonpublic personal information.
Incentive Compensation
The Dodd-Frank Act requires the federal banking agencies and the Securities and Exchange Commission (the “SEC”“SEC”) to establish joint regulations or guidelines prohibiting incentive-based payment arrangements at specified regulated entities, including the Company and the Bank, with at least $1 billion in total consolidated assets that encourage inappropriate risks by providing an executive officer, employee, director or principal shareholder with excessive compensation, fees, or benefits that could lead to material financial loss to the entity. The federal banking agencies and the SEC most recently proposed such regulations in 2016, but the regulations have not yet been finalized. If the regulations are adopted in the form initially proposed, they will restrict the manner in which executive compensation is structured.
The Dodd-Frank Act also requires publicly traded companies to give shareholders a non-binding vote on executive compensation and on so-called “golden parachute” payments in connection with approvals of mergers and acquisitions.
Anti-Money Laundering Initiatives and the USA PATRIOT Act
Under Title III of the USA PATRIOT Act, all financial institutions are required to take certain measures to identify their customers, prevent money laundering, monitor customer transactions, and report suspicious activity to U.S. law enforcement agencies. Financial institutions also are required to respond to requests for information from federal banking agencies and law enforcement agencies. Information sharing among financial institutions for the above purposes is encouraged by an exemption granted to complying financial institutions from the privacy provisions of the GLBA and other privacy laws. Financial institutions that hold correspondent accounts for foreign banks or provide private banking services to foreign individuals are required to take measures to avoid dealing with certain foreign individuals or entities, including foreign banks with profiles that raise money laundering concerns, and are prohibited from dealing with foreign “shell banks” and persons from jurisdictions of particular concern. The primary federal banking agencies and the Secretary of the U.S. Department of the Treasury have adopted regulations to implement several of these provisions. All financial institutions also are required to establish internal anti-money laundering programs. The effectiveness of a financial institution in combating money laundering activities is a factor to be considered in any application submitted by the financial institution under the Bank Merger Act. The Company has a Bank Secrecy Act and USA PATRIOT Act compliance program commensurate with its risk profile.
The Fair Credit Reporting Act’s Red Flags Rule requires financial institutions with covered accounts (e.g., consumer bank accounts and loans) to develop, implement, and administer an identity theft prevention program. This program must include reasonable policies and procedures to detect suspicious patterns or practices that indicate the possibility of identity theft, such as inconsistencies in personal information or changes in account activity.
Office of Foreign Assets Control (“OFAC”) Regulation
The Office of Foreign Assets Control (“OFAC”) of the U.S. Department of the Treasury administers and enforces economic and trade sanctions based on U.S. foreign policy and national security goals against targeted foreign countries and regimes, terrorists, international narcotics traffickers, those engaged in activities related to the proliferation of weapons of mass destruction, and other threats to the national security, foreign policy, or economy of the United States. OFAC publishes lists of individuals and companies owned or controlled by, or acting for or on behalf of, targeted countries. It also lists individuals, groups, and entities, such as terrorists and narcotics traffickers, designated under programs that are not country-specific.country specific. These are typically known as the OFAC rules based on their administration by the OFAC. The OFAC-administered sanctions targeting countries take many different forms. Generally, they contain one or more of the following elements: (i) restrictions on trade with or investment in a sanctioned country, including prohibitions against direct or indirect imports from and exports to a sanctioned country and prohibitions on “U.S. persons” engaging in financial transactions relating to making investments in, or providing investment-related advice or assistance to, a sanctioned country; and (ii) a blocking of assets in which the government or specially designated nationals of the sanctioned country have an interest by prohibiting transfers of property subject to U.S. jurisdiction (including property in the possession or control of U.S. persons). Blocked assets (property and bank deposits) cannot be paid out, withdrawn, set off, or transferred in any manner without a license from OFAC. Failure to comply with these sanctions could have serious legal and reputational consequences.
Available Information
The SEC maintains an Internet website at http://www.sec.gov that contains reports, proxy and information statements, and other information regarding issuers that file electronically with the SEC.
Our Internet website is http:https://www.cambridgetrust.com. You can obtain on our website, free of charge, a copy of our Annual Report on Form 10-K, our quarterly reports on Form 10-Q, our current reports on Form 8-K, and any amendments to those reports, as soon as reasonably practicable after we electronically file such reports or amendments with, or furnish them to, the SEC. Our Internet website and the information contained therein or connected thereto are not intended to be incorporated into this Annual Report on Form 10-K.
EmployeesHuman Capital
As of December 31, 2019,2020, the Company had 312372 full-time and 911 part-time employees. At any given time, less than 1% of our employees are temporary. The Company’s employees are not represented by any collective bargaining unit.
The Company is committed to recruiting, developing and promoting a diverse workforce to meet the current and future demands of our business. In 2019, we instituted a policy which requires that all searches for positions Vice President and above include least one racially or ethnically diverse and one female candidate. All of our positions are listed on multiple job boards specifically targeted towards women, minorities, veterans, and people with disabilities.
As of December 31, 2020, our overall workforce was 54.8% female and 21.3% racially or ethnically diverse. Of those employees with position titles of Vice President and above, 42% were female and 12.5% were racially or ethnically diverse.
To ensure we provide a rich experience for our employees, we measure organizational culture and engagement by periodically engaging independent third parties to conduct cultural assessments and employee engagement surveys. Our employee driven Engagement Committee and Culture Task Force focus on monitoring and making continuous improvements to our work environment and employee engagement.
The Company encourages employees to contribute their personal best while respecting the balance between work and personal life. To empower employees to reach their potential, we provide training and development programs including traditional classroom training and coaching and experiential learning through Company-wide initiative beyond the scope of their everyday responsibilities. We also provide access to virtual and self-directed online courses in topics ranging from compliance to management skills through our BAI Learning system. To identify and develop our next generation of leaders, we have a robust talent and succession planning process and specialized programs to support the development of our talent pipeline at different levels. The Company believes that its employee relations are good.
Item 1A. Risk Factors.
Risks Related to our Business and Industry
The COVID-19 pandemic is adversely impacting us and our customers, counterparties, employees, and third-party service providers. Further, the COVID-19 pandemic could lead to an economic recession or other severe disruptions in the U.S. economy and may disrupt banking and other financial activity in the areas in which we operate and the adverse impacts on our business, financial position, results of operations and prospects could be significant.
The outbreak of COVID-19 has caused significant economic dislocation in the United States as many state and local governments have ordered non-essential businesses to close and residents to shelter in place at home. This has resulted in an unprecedented slow-down in economic activity and a related increase in unemployment. Since the COVID-19 outbreak, more than 70 million people have filed claims for unemployment, and stock markets have declined in value and in particular bank stocks have significantly declined in value. In response to the COVID-19 pandemic, the Federal Reserve has reduced the benchmark fed funds rate to a target range of 0% to 0.25%, and the yields on 10-year and 30-year treasury notes have declined to historic lows. Various state governments and federal agencies are requiring lenders to provide forbearance and other relief to borrowers (e.g., waiving late payment and other fees). We have instituted payment deferral programs to aid existing borrowers with payment forbearance. In addition, the federal banking agencies have encouraged financial institutions to prudently work with affected borrowers and recently passed legislation has provided relief from reporting loan classifications due to modifications related to the COVID-19 outbreak. Certain industries have been particularly hard-hit, including the travel and hospitality industry, the restaurant industry, and the retail industry. Finally, the spread of COVID-19 has caused us to modify our business practices, including employee travel, employee work locations, and cancellation of physical participation in meetings, events, and conferences. We have many employees working remotely and may take further actions as may be required by government authorities or that we determine is in the best interests of our employees, customers, and business partners.
Given the ongoing and dynamic nature of the circumstances, it is difficult to predict the full impact of the COVID-19 outbreak on our business. The extent of such impact will depend on future developments, which are highly uncertain, including when COVID-19 can be controlled and abated and when and how the economy may be reopened. As the result of the COVID-19 pandemic and the related adverse local and national economic consequences, we could be subject to any of the following risks, any of which could have a material, adverse effect on our business, financial condition, liquidity, and results of operations:
| • | demand for products and services may decline, making it difficult to grow assets and income; |
| • | if the economy is unable to substantially reopen, and high levels of unemployment continue for an extended period of time, loan delinquencies, problem assets, and foreclosures may increase, resulting in increased charges and reduced income; |
| • | collateral for loans, especially real estate, may decline in value, which could cause loan losses to increase; |
| • | our allowance for credit losses may have to be increased if unemployment forecasts increase or borrowers experience financial difficulties beyond forbearance periods, which will adversely affect our net income; |
| • | the net worth and liquidity of loan guarantors may decline, impairing their ability to honor commitments to us; |
| • | as the result of the decline in the Federal Reserve Board’s target federal funds rate to near 0%, the yield on our assets may decline to a greater extent than the decline in our cost of interest-bearing liabilities, reducing our net interest margin and spread and reducing net income; |
| • | a material decrease in net income or a net loss over several quarters could result in a decrease in the rate of our quarterly cash dividend; |
| • | our wealth management revenues may decline with continuing market turmoil; |
| • | our cyber security risks are increased as the result of an increase in the number of employees working remotely; and |
| • | we rely on third party vendors for certain services and the unavailability of a critical service due to the COVID-19 outbreak could have an adverse effect on us. |
These factors, among others, together or in combination with other events or occurrences not yet known or anticipated, could adversely affect our operations. In addition, other countries as well as the United States are currently experiencing a resurgence of the COVID-19 virus and if the rate of infections continues to rise, these factors will be exacerbated.
Deterioration in local economic conditions may negatively impact our financial performance.
The Company’s success depends primarily on the general economic conditions in Eastern Massachusetts and New Hampshire and the specific local markets in which the Company operates. Unlike larger national or other regional banks that are more geographically diversified, the Company provides banking and financial services to customers primarily in Massachusetts and New Hampshire. The local economic conditions in these areas have a significant impact on the demand for the Company’s products and services as well as the ability of the Company’s customers to repay loans, the value of the collateral securing loans, and the stability of the Company’s deposit funding sources.
A downturn in our local economy may limit funds available for deposit and may negatively affect our borrowers’ ability to repay their loans on a timely basis, both of which could have an impact on our profitability.
Variations in interest rates may negatively affect our financial performance.
The Company’s earnings and financial condition are largely dependent upon net interest income, which is the difference between interest earned from loans and investments and interest paid on deposits and borrowings. The narrowing of interest rate spreads could adversely affect the Company’s earnings and financial condition. The Company cannot predict with certainty, or control, changes in interest rates. Regional and local economic conditions and the policies of regulatory authorities, including monetary policies of the Federal Reserve, affect interest income and interest expense. High interest rates could also affect the amount of loans that the Company can originate because higher rates could cause customers to apply for fewer mortgages or cause depositors to shift funds from accounts that have a comparatively lower cost to accounts with a higher cost. The Company may also experience customer
attrition due to competitor pricing. If the cost of interest-bearing deposits increases at a rate greater than the yields on interest-earning assets increase, then net interest income will be negatively affected. Changes in the asset and liability mix may also affect net interest income. Similarly, lower interest rates cause higher yielding assets to prepay and floating or adjustable rateadjustable-rate assets to reset to lower rates. If the Company is not able to reduce its funding costs sufficiently, due to either competitive factors or the maturity schedule of existing liabilities, then the Company’s net interest margin will decline.
Although management believes it has implemented effective asset and liability management strategies to mitigate the potential adverse effects of changes in interest rates on the Company’s results of operations, any substantial or unexpected change in, or prolonged change in market interest rates could have a material adverse effect on the Company’s financial condition and results of operations.
Changes in the economy or the financial markets could materially affect our financial performance.
Downturns in the United States or global economies or financial markets could adversely affect the demand for and income received from the Company’s fee-based services. Revenues from the Wealth Management Group depend in large part on the level of assets under management and administration. Market volatility that leads customers to liquidate investments, as well as lower asset values, can reduce our level of assets under management and administration and thereby decrease our investment management and administration revenues.
Our loan portfolio includes loans with a higher risk of loss.
The Bank originates commercial and industrial loans, commercial real estate loans, consumer loans, and residential mortgage loans primarily within our market area. Our lending strategy focuses on residential real estate lending, as well as servicing commercial customers, including increased emphasis on commercial and industrial lending, and commercial deposit relationships. Commercial and industrial loans, commercial real estate loans, and consumer loans may expose a lender to greater credit risk than loans secured by residential real estate because the collateral securing these loans may not be sold as easily as residential real estate. In addition, commercial real estate and commercial and industrial loans may also involve relatively large loan balances to individual borrowers or groups of borrowers. These loans also have greater credit risk than residential real estate for the following reasons:
Commercial Real Estate Loans. Repayment is dependent on income being generated in amounts sufficient to cover operating expenses and debt service.
| • | Commercial Real Estate Loans. Repayment is dependent on income being generated in amounts sufficient to cover operating expenses and debt service. |
Commercial and Industrial Loans. Repayment is generally dependent upon the successful operation of the borrower’s business.
| • | Commercial and Industrial Loans. Repayment is generally dependent upon the successful operation of the borrower’s business. |
Consumer Loans. Consumer loans are collateralized, if at all, with assets that may not provide an adequate source of payment of the loan due to depreciation, damage or loss.
| • | Consumer Loans. Consumer loans are collateralized, if at all, with assets that may not provide an adequate source of payment of the loan due to depreciation, damage, or loss. |
Any downturn in the real estate market or local economy could adversely affect the value of the properties securing the loans or revenues from the borrowers’ businesses thereby increasing the risk of non-performing loans.
We may experience losses and expenses if security interests granted for loans are not enforceable.
When the Company makes loans it sometimes obtains liens, such as real estate mortgages or other asset pledges, to provide the Company with a security interest in collateral. If there is a loan default, the Company may seek to foreclose upon collateral and enforce the security interests to obtain repayment and eliminate or mitigate the Company’s loss. Drafting errors, recording errors, other defects or imperfections in the security interests granted to the Company and/or changes in law may render liens granted to the Company unenforceable. The Company may incur losses or expenses if security interests granted to the Company are not enforceable.
If our allowance for loancredit losses is not sufficient to cover actual loan losses, then our earnings will decrease.
The Bank’s loan customers may not repay their loans according to their terms and the collateral securing the payment of these loans may be insufficient to pay any remaining loan balance. The Bank therefore may experience significant loancredit losses, which could have a material adverse effect on our operating results. Material additions to our allowance for loancredit losses would materially decrease our net income, and the charge-off of loans may cause us to increase the allowance. The Bank makes various assumptions and judgments about the collectability of the loan portfolio, including the creditworthiness of our borrowers and the value of the real estate and other assets serving as collateral for the repayment of many of our loans. We rely on our loan quality reviews, our experience, and our evaluation of economic conditions, among other factors, in determining the amount of the allowance for loancredit losses. If our assumptions prove to be incorrect, our allowance for loancredit losses may not be sufficient to cover losses inherent in our loan portfolio, resulting in additions to our allowance.
A new accounting standard may require us to increase our allowance for loan losses and may have a material adverse effect on our financial condition and results of operations.
The Financial Accounting Standards Board has issued Accounting Standards Update 2016-13, which will be effective for the Company for the first quarter of 2020. This standard, often referred to as “CECL” (reflecting a current expected credit loss model), will require companies to recognize an allowance for credit losses based on estimates of losses expected to be realized over the contractual lives of the loans. Under current U.S. GAAP, companies generally recognize credit losses only when it is probable that a loss has been incurred as of the balance sheet date. This new standard will require us to collect and review increased types and amounts of data for us to determine the appropriate level of the allowance for loan losses, and may require us to increase our allowance for loan losses. It also could produce higher volatility in future provisions for credit losses than our current process and may adversely impact our results of operations.
Strong competition within our industry and market area could hurt our performance and slow our growth.
The Company operates in a competitive market for both attracting deposits, which is our primary source of funds, and originating loans. Historically, our most direct competition for deposits has come from savings and commercial banks. Our competition for loans comes principally from commercial banks, savings institutions, mortgage banking firms, credit unions, finance companies, mutual funds, insurance companies, and investment banking firms. We also face additional competition from internet-based institutions and brokerage firms. Competition for loan originations and deposits may limit our future growth and earnings prospects.
The Company’s ability to compete successfully depends on a number of factors, including, among other things:
the ability to develop, maintain, and build upon long-term customer relationships based on service quality, high ethical standards and reputation;
| • | the ability to develop, maintain, and build upon long-term customer relationships based on service quality, high ethical standards and reputation; |
the ability to expand the Company’s market position;
| • | the ability to expand the Company’s market position; |
the scope, relevance, and pricing of products and services offered to meet customer needs and demands;
| • | the scope, relevance, and pricing of products and services offered to meet customer needs and demands; |
the rate at which the Company introduces new products, services, and technologies relative to its competitors;
| • | the rate at which the Company introduces new products, services, and technologies relative to its competitors; |
customer satisfaction with the Company’s level of service;
| • | customer satisfaction with the Company’s level of service; |
industry and general economic trends; and
| • | industry and general economic trends; and |
the ability to attract and retain talented employees.
| • | the ability to attract and retain talented employees. |
Failure to perform in any of these areas could significantly weaken the Company’s competitive position, which could adversely affect the Company’s growth and profitability, which, in turn, could have a material adverse effect on the Company’s financial condition and results of operations.
The Company is subjectCompany’s earnings may not grow if we are unable to extensive government regulationsuccessfully attractcore deposits and supervision, which may interfere with its abilitylending opportunities and execute opportunities to conduct its business and may negatively impact its financial results.generate fee-based income.
The Company primarily throughhas experienced growth, and our future business strategy is to continue to expand. Historically, the Bank, Cambridge Trust Companygrowth of New Hampshire, Inc.,our loans and certain non-bank subsidiaries,deposits has been the principal factor in our increase in net-interest income. In the event that we are subjectunable to extensive federalexecute our business strategy of continued growth in loans and state regulationdeposits, our earnings could be adversely impacted. The Company’s ability to continue to
grow depends, in part, upon our ability to expand our market share, to successfully attract core deposits and supervision. Banking regulationsidentify loan and investment opportunities, as well as opportunities to generate fee-based income. Our ability to manage growth successfully will also depend on whether we can continue to efficiently fund asset growth and maintain asset quality and cost controls, as well as on factors beyond our control, such as economic conditions and interest-rate trends.
There are primarily intendedsubstantial risks and uncertainties associated with the introduction or expansion of lines of business or new products and services within existing lines of business.
From time to protect depositors’ funds, the DIF and the safety and soundness of the banking system as a whole, not shareholders. These laws and regulations affect the Company’s lending practices, capital structure, investment practices, dividend policy, and growth, among other things. Congress and federal and state banking agencies continually review banking laws, regulations, and policies for possible changes. Changes to statutes, regulations, or regulatory policies, including changes in interpretation or implementation of statutes, regulations, or policies, could affect the Company in substantial and unpredictable ways. Such changes could subject the Company to additional costs, limit the types of financial services and productstime, the Company may implement new lines of business or offer new products and services within existing lines of business. There are substantial risks and uncertainties associated with these efforts, particularly in instances where the markets are not fully developed. In developing and marketing new lines of business and/or limit the pricingnew products and services, the Company may chargeinvest significant time and resources. Initial timetables for the introduction and development of new lines of business and/or new products or services may not be achieved and price and profitability targets may not prove attainable. External factors, such as compliance with regulations, competitive alternatives, and shifting market preferences, may also impact the successful implementation of a new line of business or a new product or service. Furthermore, any new line of business and/or new product or service could have a significant impact on certain banking services, among other things. Compliance personnel and resources may increase our coststhe effectiveness of operations and adversely impact our earnings.
the Company’s system of internal controls. Failure to comply with laws, regulations,successfully manage these risks in the development and implementation of new lines of business or policies could result in sanctions by regulatory agencies, civil money penalties, and/new products or reputation damage, whichservices could have a material adverse effect on ourthe Company’s business, financial condition, and results of operations. While the Company has policiesoperations, and procedures designed to prevent any such violations, there can be no assurance that such violations will not occur.
State and federal banking agencies periodically conduct examinations of our business, including for compliance with laws and regulations, and our failure to comply with any supervisory actions to which we are or become subject as a result of such examinations may adversely affect our business.
Federal and state regulatory agencies periodically conduct examinations of our business, including our compliance with laws and regulations. If, as a result of an examination, an agency were to determine that the financial, capital resources, asset quality, earnings prospects, management, liquidity, or other aspects of any of our operations had become unsatisfactory or violates any law or regulation, such agency may take certain remedial or enforcement actions it deems appropriate to correct any deficiency. Remedial or enforcement actions include the power to enjoin “unsafe or unsound” practices, to require affirmative actions to correct any conditions resulting from any violation or practice, to issue an administrative order that can be judicially enforced against a bank, to direct an increase in the bank’s capital, to restrict the bank’s growth, to assess civil monetary penalties against a bank’s officers or directors, and to remove officers and directors. In the event that the FDIC concludes that, among other things, our financial condition cannot be corrected or that there is an imminent risk of loss to our depositors, it may terminate our deposit insurance. The CFPB also has authority to take enforcement actions, including cease-and desist orders or civil monetary penalties, if it finds that we offer consumer financial products and services in violation of federal consumer financial protection laws.
If we are unable to comply with future regulatory directives, or with the terms of any future supervisory requirements to which we may become subject, then we could become subject to a variety of supervisory actions and orders, including cease and desist orders, prompt corrective actions, memoranda of understanding, and other regulatory enforcement actions. Such supervisory actions could, among other things, impose greater restrictions on our business, as well as our ability to develop any new business. The Company could also be required to raise additional capital, or dispose of certain assets and liabilities within a prescribed time period, or both. Failure to implement remedial measures as required by financial regulatory agencies could result in additional orders or penalties from federal and state regulators, which could trigger one or more of the remedial actions described above. The terms of any supervisory action and associated consequences with any failure to comply with any supervisory action could have a material negative effect on our business, operating flexibility, and overall financial condition.
The Company is subject to liquidity risk, which could adversely affect net interest income and earnings.
The purpose of the Company’s liquidity management is to meet the cash flow obligations of its customers for both deposits and loans. The primaryOne liquidity measurement the Company utilizes is called basic surplus, which captures the adequacy of the Company’s access to reliable sources of cash relative to the stability of its funding mix of average liabilities. This approach recognizes the importance of balancing levels of cash flow liquidity from short- and long-term securities with the availability of dependable borrowing sources which can be accessed when necessary. However, competitive pressure on deposit pricing could result in a decrease in the Company’s deposit base or an increase in funding costs. In addition, liquidity will come under additional pressure if loan growth exceeds deposit growth. These scenarios could lead to a decrease in the Company’s basic surplus measure below the minimum policy level of 5%. To manage this risk, the Company has the ability to purchase brokered certificates of deposit, borrow against established borrowing facilities with other banks (Federal funds), and enter into repurchase agreements with investment companies. Depending on the level of interest rates, the Company’s net interest income, and therefore earnings, could be adversely affected.
Our ability to service our debt, pay dividends, and otherwise pay our obligations as they come due is substantially dependent on capital distributions from our subsidiary.
The Company is a separate and distinct legal entity from its subsidiary, the Bank. It receives substantially all of its revenue from dividends from the Bank. These dividends are the principal source of funds to pay dividends on the Company’s common stock. Various federal and/or state laws and regulations limit the amount of dividends that the Bank may pay to the Company. Also, the Company’s right to participate in a distribution of assets upon a subsidiary’s liquidation or reorganization is subject to the prior claims of the subsidiary’s depositors and certain other creditors. In the event the Bank is unable to pay dividends to the Company, the Company may not be able to service debt, pay obligations, or pay dividends on the Company’s common stock. The inability to receive dividends from the Bank could have a material adverse effect on the Company’s business, financial condition, and results of operations.
A breachThe Company depends on its executive officers and key personnel to continue the implementation of information security, including cyber-attacks,our long-term business strategy and could disrupt our business and impact our earnings.be harmed by the loss of their services.
The Company dependsbelieves that its continued growth and future success will depend in large part upon data processing, communication, and information exchange on a variety of computing platforms and networks and over the internet. In addition, we rely on the services of a variety of vendors to meet our data processing and communication needs. Despite existing safeguards, we cannot be certain that allskills of our systems are free from vulnerability to attack or other technological difficulties or failures. During the normal course of our business, we have experienced and we expect to continue to experience attempts to breach our systems, none of which has been material to the Company to date, and we may be unable to protect sensitive data and the integrity of our systems. If information security is breached or difficulties or failures occur, despite the controls we and our third party vendors have instituted, information can be lost or misappropriated, resulting in financial loss or costs to us, reputational harm, or damages to others. Such costs or losses could exceed the amount of insurance coverage, if any, which would adversely affect our earnings.
management team. The Company may be adversely affected by fraud.
The Company is inherently exposed to operational riskcompetition for qualified personnel in the form of theft and other fraudulent activity by employees, customers, and other third parties targeting the Company and/or the Company’s customers or data. Such activity may take many forms, including check fraud, electronic fraud, wire fraud, phishing, social engineering, and other dishonest acts. During the normal course of our business, we have been subjected to and we expect to continue to be subject to theft and fraudulent activity, none of which has been material to the Company to date.
The Company continually encounters technological change and the failure to understand and adapt to these changes could hurt its business.
The financial services industry is continually undergoing rapid technological change with frequent introductionsintense, and the loss of new technology-driven productsour key personnel, or an inability to continue to attract or retain and services. The effective use of technology increases efficiency and enables financial institutions to better serve customers and to reduce costs. The Company’s future success depends, in part, upon its ability to address the needs of its customers by using technology tomotivate key personnel could adversely affect our business. We cannot provide products and servicesany assurance that we will satisfy customer demands, as well as to create additional efficiencies in the Company’s operations. Many of the Company’s competitors have substantially greater resources to invest in technological improvements. The Company may not be able to retain our existing key personnel, attract additional qualified personnel, or effectively implement new technology-driven productsmanage the succession of key personnel. We have change of control agreements with our actively employed named executive officers, and the loss of the services of one or be successful in marketing these products and servicesmore of our executive officers or key personnel could impair our ability to its customers. Failurecontinue to successfully keep pace with technological changes affecting the financial services industry could have a material adverse impact on the Company’sdevelop our business and, in turn, the Company’s financial condition and results of operations.strategy.
The Company relies on third parties to provide key components of its business infrastructure.
The Company relies on third parties to provide key components for its business operations, such as data processing and storage, recording and monitoring transactions, online banking interfaces and services, internet connections, and network access. While the Company selects these third-party vendors carefully, it does not control their actions. Any problems caused by these third parties, including those resulting from breakdowns or other disruptions in communication services provided by a vendor, failure of a vendor to handle current or higher volumes, cyber-attacks and security breaches at a vendor, failure of a vendor to provide services for any reason, or poor performance of services by a vendor, could adversely affect the Company’s ability to deliver products and services to its customers and otherwise conduct its business. Financial or operational difficulties of a third-party vendor could also hurt the Company’s operations if those difficulties interfere with the vendor’s ability to serve the Company. Replacing these third-party vendors could create significant delays and expense that adversely affect the Company’s business and performance.
The possibility of the economy’s return to recessionary conditions and the possibility of further turmoil or volatility in the financial markets would likely have an adverse effect on our business, financial position, and results of operations.
The economy in the United States and globally has experienced volatility in recent years and may continue to experience such volatility for the foreseeable future. There can be no assurance that economic conditions will not worsen. Unfavorable or uncertain economic conditions can be caused by declines in economic growth, business activity, or investor or business confidence, limitations on the availability or increases in the cost of credit and capital, increases in inflation or interest rates, the timing and impact of changing governmental policies, natural disasters, epidemics / pandemics, such as coronavirus disease 2019 (“COVID-19”),COVID-19, terrorist attacks, acts of war, or a combination of these or other factors. A worsening of business and economic conditions could have adverse effects on our business, including the following:
| • | investors may have less confidence in the equity markets in general and in financial services industry stocks in particular, which could place downward pressure on the Company’s stock price and resulting market valuation; |
| • | economic and market developments may further affect consumer and business confidence levels and may cause declines in credit usage and adverse changes in payment patterns, causing increases in delinquencies and default rates; |
| • | the Company’s ability to assess the creditworthiness of its customers may be impaired if the models and approaches the Company uses to select, manage, and underwrite its customers become less predictive of future behaviors; |
| • | the Company could suffer decreases in demand for loans or other financial products and services or decreased deposits or other investments in accounts with the Company; |
| • | customers of the Company’s Wealth Management Group may liquidate investments, which together with lower asset values, may reduce the level of assets under management and administration, and thereby decrease the Company’s investment management and administration revenues; |
| • | competition in the financial services industry could intensify as a result of the increasing consolidation of financial services companies in connection with current market conditions or otherwise; and |
| • | the value of loans and other assets or collateral securing loans may decrease. |
investorsThe Company may have less confidence inbe adversely affected by the equity markets in general and insoundness of other financial services industry stocks in particular, which could place downward pressure oninstitutions, including the Company’s stock price and resulting market valuation;FHLB of Boston.
economic and market developments may further affect consumer and business confidence levels and may cause declines in credit usage and adverse changes in payment patterns, causing increases in delinquencies and default rates;
the Company’sOur ability to assessengage in routine funding transactions could be adversely affected by the creditworthinessactions and commercial soundness of its customers may be impaired if the models and approaches the Company uses to select, manage, and underwrite its customers become less predictiveother financial institutions. Financial services companies are interrelated as a result of future behaviors;
the Company could suffer decreases in demand for loanstrading, clearing, counterparty, or other financial productsrelationships. The Company has exposure to different industries and services or decreased deposits or other investments in accountscounterparties, and we routinely execute transactions with the Company;
customers of the Company’s Wealth Management Group may liquidate investments, which together with lower asset values, may reduce the level of assets under management and administration, and thereby decrease the Company’s investment management and administration revenues;
competitioncounterparties in the financial services industry, could intensify asincluding brokers and dealers, commercial banks, investment banks, mutual and hedge funds, and other institutional clients. As a result, of the increasing consolidation ofdefaults by, or even rumors or questions about, one or more financial services companies, or the financial services industry generally, have led to market-wide liquidity problems and could lead to losses or defaults by us or by other institutions. Many of these transactions expose us to credit risk in connection with currentthe event of default of our counterparty or client. In addition, our credit risk may be exacerbated if the collateral held by us cannot be realized or is liquidated at prices not sufficient to recover the full amount of the loan or derivative exposure due us. There is no assurance that any such losses would not materially and adversely affect our business, financial condition, or results of operations.
The Company owns common stock of the Federal Home Loan Bank of Boston (“FHLB of Boston”) in order to qualify for membership in the FHLB system, which enables it to borrow funds under the FHLB of Boston’s advance program. The carrying value and fair market conditions or otherwise; and
value of our FHLB of Boston common stock was $5.7 million as of December 31, 2020. There are 11 branches of the FHLB, including Boston, which are jointly liable for the consolidated obligations of the FHLB system. To the extent that one FHLB branch cannot meet its obligations to pay its share of the system’s debt, other FHLB branches can be called upon to make the payment. Any adverse effects on the FHLB of Boston could adversely affect the value of loansour investment in its common stock and negatively impact our results of operations.
Risks Related to an Investment in the Company’s Securities
The Company’s common stock price may fluctuate significantly.
The market price of the Company’s common stock may fluctuate significantly in response to a number of factors including, but not limited to:
| • | the political climate and whether the proposed policies of the current presidential administration in the U.S. that have affected market prices for financial institution stocks are successfully implemented; |
| • | changes in securities analysts’ recommendations or expectations of financial performance; |
| • | volatility of stock market prices and volumes; |
| • | incorrect information or speculation; |
| • | changes in industry valuations; |
| • | announcements regarding proposed acquisitions; |
| • | variations in operating results from general expectations; |
| • | actions taken against the Company by various regulatory agencies; |
| • | changes in authoritative accounting guidance; |
| • | changes in general domestic economic conditions such as inflation rates, tax rates, unemployment rates, labor and healthcare cost trend rates, recessions, and changing government policies, laws, and regulations; and |
| • | severe weather, natural disasters, epidemics / pandemics such as COVID-19, acts of war or terrorism, and other external events. |
Future issuance of our common stock may have a dilutive effect and may reduce the voting power and relative percentage interests of current common stockholders in our earnings and market value, and there may be future sales or other dilution of the Company’s equity, which may adversely affect the market price of the Company’s stock.
Future issuances of shares of our common stock, including for acquisitions, may have a dilutive effect and may reduce the voting power and relative percentage interests of current common stockholders in our earnings and market value. Additionally, the Company is not restricted from issuing additional common stock, including any securities that are convertible into or exchangeable for, or that represent the right to receive, common stock. The Company also grants shares of common stock to employees and directors under the Company’s incentive plan each year. The issuance of any additional shares of the Company’s common stock or securities convertible into, exchangeable for or that represent the right to receive common stock, or the exercise of such securities could be substantially dilutive to shareholders of the Company’s common stock. Holders of the Company’s common stock have no preemptive rights that entitle such holders to purchase their pro rata share of any offering of shares or any class or series. Because the Company’s decision to issue securities in any future offering will depend on market conditions, its acquisition activity and other assetsfactors, the Company cannot predict or collateral securing loans may decrease.estimate the amount, timing, or nature of its future offerings. Thus, the Company’s shareholders bear the risk of the Company’s future offerings reducing the market price of the Company’s common stock and diluting their stock holdings in the Company.
Risks Related to Legal, Governmental and Regulatory Changes
The Company is subject to other-than-temporary impairment risk,extensive government regulation and supervision, which couldmay interfere with its ability to conduct its business and may negatively impact ourits financial performance.results.
The Company, recognizes an impairment charge whenprimarily through the decline inBank, Cambridge Trust Company of New Hampshire, Inc., and certain non-bank subsidiaries, are subject to extensive federal and state regulation and supervision. Banking regulations are primarily intended to protect depositors’ funds, the fair value of equity, debt securities,DIF and cost-method investments below their cost basis are judged to be other-than-temporary. Significant judgment is used to identify events or circumstances that would likely have a significant adverse effect on the future usesafety and soundness of the investment. The Company considers various factorsbanking system as a whole, not shareholders. These laws and regulations affect the Company’s lending practices, capital structure, investment practices, dividend policy, and growth, among other things. Congress and federal and state banking agencies continually review banking laws, regulations, and policies for possible changes. Changes to statutes, regulations, or regulatory policies, including changes in determining whether an impairment is other-than-temporary, including the severity and durationinterpretation or implementation of the impairment, forecasted recovery, the financial condition and near-term prospects of the investee, whetherstatutes, regulations, or policies, could affect the Company hasin substantial and unpredictable ways. Such changes could subject the intentCompany to selladditional costs, limit the types of financial services and whether it is more likely than not it will be forced to sell the security in question. Information about unrealized gains and losses is subject to changing conditions. The values of securities with unrealized gains and losses will fluctuate, as will the values of securities that we identify as potentially distressed. Our current evaluation of other-than-temporary impairments reflects our intent to hold securities for a reasonable period of time sufficient for a forecasted recovery of fair value. However, our intent to hold certain of these securities may change in future periods as a result of facts and circumstances impacting a specific security. If our intent to hold a security with an unrealized loss changes and we do not expect the security to fully recover prior to the expected time of disposition, we will write down the security to its fair value in the period that our intent to hold the security changes.
The risks presented by acquisitions, such as the acquisition of Optima and the proposed merger with Wellesley, could adversely affect our financial condition and results of operations.
The business strategy ofproducts the Company may include growth through acquisition such asoffer, and/or limit the acquisition of Optima andpricing the proposed merger with Wellesley. Any such future acquisitions will be accompanied by the risks commonly encountered in acquisitions. These risksCompany may include,charge on certain banking services, among other things:
things. Compliance personnel and resources may increase our ability to realize anticipated cost savings;
the difficultycosts of integrating operations and personnel, and the loss of key employees;
the potential disruption ofadversely impact our earnings.
Failure to comply with laws, regulations, or the acquired company’s ongoing business in such a way thatpolicies could result in decreased revenues, the inability of our management to maximize our financial and strategic position;
the inability to maintain uniform standards, controls, procedures, and policies; and
the impairment of relationships with the acquired company’s employees and customers as a result of changes in ownership and management.
The Company cannot provide any assurance that we will be successful in overcoming these risks or any other problems encountered in connection with acquisitions. Our inability to overcome these risks could have an adverse effect on the achievement of our business strategy and results of operations.
The Merger with Wellesley is subject to the receipt of consents and approvals from governmental authorities that may delay the date of completion of the Merger or impose conditions that could have an adverse effect on the Company.
Before the Merger may be completed, various consents, approvals, waiver or non-objections must be obtained from state and federal governmental authorities, including the FDIC, the Federal Reserve, the Massachusetts Commissioner of Banks, the Massachusetts Housing Partnership, and the Co-Operative Central Bank. Satisfying the requirements of these governmental authorities may delay the date of completion of the Merger. In addition, these governmental authorities may include conditions on the completion of the merger, or require changes to the terms of the Merger. While the Company and Wellesley do not currently expect that any such conditions or changes would result in a material adverse effect on the Company, there can be no assurance that they will not, and such conditions or changes could have the effect of delaying completion of the Merger, or imposing additional costs on or limiting the revenues of the Company following the Merger, any of which might have a material adverse effect on the Company following the Merger. The parties are not obligated to complete the Merger should anysanctions by regulatory approval contain a non-standard condition, restriction or requirement that the Company’s board of directors reasonably determines in good faith would, individually or in the aggregate, materially reduce the benefits of the Merger to such a degree that the Company would not have entered into the merger agreement had such condition, restriction or requirement been known at the date of the merger agreement.
Failure to complete the Merger with Wellesley could negatively impact the stock price of the Company and future businesses and financial results of the Company.
If the Merger is not completed, the ongoing businesses of the Company may be adversely affected, and the Company will be subject to several risks, including the following:
the Company will be required to pay certain costs relating to the Merger, whether or not the Merger is completed, such as legal, accounting, financial advisor and printing fees; and
matters relating to the Merger may require substantial commitments of time and resources by management of the Company, which could otherwise have been devoted to serving existing customers or other opportunities that may have been beneficial to the Company as an independent company.
In addition, if the Merger is not completed, the Company may experience negative reactions from the financial markets, and the Company may experience negative reactions from its customers and employees. The Company also could be subject to litigation related to any failure to complete the Merger or to enforcement proceedings commenced against the Company to perform its obligations under the merger agreement. If the Merger is not completed, the Company cannot assure shareholders that the risks described above will not materialize and will not materially affect the business, financial results and stock price of the Company.
The integration of the Company, Optima, and the proposed Merger with Wellesley will present significant challenges that may result in the combined business not operating as effectively as expected or in the failure to achieve some or all of the anticipated benefits of the transaction.
The benefits and synergies expected to result from the Merger with Wellesley will depend in part on whether the operations of Wellesley can be integrated in a timely and efficient manner with those of the Company. The Company will face challenges in consolidating its functions with those of Wellesley, and integrating the organizations, procedures and operations of the two businesses. The integration of the Company and Wellesley will be complex and time-consuming, and the management of both companies will have to dedicate substantial time and resources to it. These efforts could divert management’s focus and resources from serving existing customers or other strategic opportunities and from day-to-day operational matters during the integration process. Failure to successfully integrate the operations of the Company and Wellesley could result in the failure to achieve some of the anticipated benefits from the transaction, including cost savings and other operating efficiencies, and the Company may not be able to capitalize on the existing relationships of Wellesley to the extent anticipated, or it may take longer, or be more difficult or expensive than expected to achieve these goals. This could have an adverse effect on the business, results of operations, financial condition or prospects of the Companyagencies, civil money penalties, and/or the Bank after the transaction.
Unanticipated costs relating to the Merger with Wellesley could reduce the Company’s future earnings per share.
The Company and the Bank believe that each has reasonably estimated the likely costs of integrating the operations of the Bank and Wellesley, and the incremental costs of operating as a combined company. However, it is possible that unexpected transaction costs such as taxes, fees or professional expenses or unexpected future operating expenses such as increased personnel costs or increased taxes, as well as other types of unanticipated adverse developments,reputation damage, which could have a material adverse effect on theour business, financial condition, and results of operations. While the Company has policies and procedures designed to prevent any such violations, there can be no assurance that such violations will not occur.
State and federal banking agencies periodically conduct examinations of our business, including for compliance with laws and regulations, and our failure to comply with any supervisory actions to which we are or become subject as a result of such examinations may adversely affect our business.
Federal and state regulatory agencies periodically conduct examinations of our business, including our compliance with laws and regulations. If, as a result of an examination, an agency were to determine that the financial, capital resources, asset quality, earnings prospects, management, liquidity, or other aspects of any of our operations had become unsatisfactory or violates any law or regulation, such agency may take certain remedial or enforcement actions it deems appropriate to correct any deficiency. Remedial or enforcement actions include the power to enjoin “unsafe or unsound” practices, to require affirmative actions to correct any conditions resulting from any violation or practice, to issue an administrative order that can be judicially enforced against a bank, to direct an increase in the bank’s capital, to restrict the bank’s growth, to assess civil monetary penalties against a bank’s officers or directors, and to remove officers and directors. In the event that the FDIC concludes that, among other things, our financial condition cannot be corrected or that there is an imminent risk of loss to our depositors, it may terminate our deposit insurance. The Consumer Financial Protection Bureau (“CFPB”) also has authority to take enforcement actions, including cease-and desist orders or civil monetary penalties, if it finds that we offer consumer financial products and services in violation of federal consumer financial protection laws.
If we are unable to comply with future regulatory directives, or with the terms of any future supervisory requirements to which we may become subject, then we could become subject to a variety of supervisory actions and orders, including cease and desist orders, prompt corrective actions, memoranda of understanding, and other regulatory enforcement actions. Such supervisory actions could, among other things, impose greater restrictions on our business, as well as our ability to develop any new business. The Company could also be required to raise additional capital or dispose of certain assets and liabilities within a prescribed time period, or both. Failure to implement remedial measures as required by financial regulatory agencies could result in additional orders or penalties from federal and state regulators, which could trigger one or more of the combined company. If unexpected costs are incurred, the Merger Wellesleyremedial actions described above. The terms of any supervisory action and associated consequences with any failure to comply with any supervisory action could have a dilutivematerial negative effect on the Company’s earnings per share. In other words, if the Merger is completed, the earnings per share of the Company’s common stock could be less than anticipated or even less than if the Merger had not been completed.our business, operating flexibility, and overall financial condition.
Following the Merger, the Company may not continue to pay dividends at or above the rate currently paid by the Company.
Following the Merger, the Company’s shareholders may not receive dividends at the same rate that they did prior to the merger for various reasons, including the following:
the Company may not have enough cash to pay such dividends due to changes in its cash requirements, capital spending plans, cash flow or financial position;
decisions on whether, when and in what amounts to make any future dividends will remain at all times entirely at the discretion of the Company’s board of directors, which reserves the right to change the Company’s dividend practices at any time and for any reason; and
the amount of dividends that the Company’s subsidiaries may distribute to theThe Company may be subject to restrictions imposed by state law and restrictions imposed by the terms of any current or future indebtedness that these subsidiaries may incur.
more stringent capital requirements.
The Company’s shareholders will have no contractual orBank and the Company are each subject to capital adequacy guidelines and other legal right to dividends that have not been declared byregulatory requirements specifying minimum amounts and types of capital which each of the Company’s board of directors.
The Company’s earnings may not grow if we are unable to successfully attract core depositsBank and lending opportunities and execute opportunities to generate fee-based income.
Thethe Company has experienced growth, and our future business strategy is to continue to expand. Historically, the growth of our loans and deposits has been the principal factor in our increase in net-interest income. In the event that we are unable to execute our business strategy of continued growth in loans and deposits, our earnings could be adversely impacted. The Company’s ability to continue to grow depends, in part, upon our ability to expand our market share, to successfully attract core deposits and identify loan and investment opportunities, as well as opportunities to generate fee-based income. Our ability to manage growth successfully will also depend on whether we can continue to efficiently fund asset growth and maintain asset quality and cost controls, as well as on factors beyond our control, such as economic conditions and interest-rate trends.
There are substantial risks and uncertainties associated with the introduction or expansion of lines of business or new products and services within existing lines of business.
must maintain. From time to time, the Companyregulators implement changes to these regulatory capital adequacy guidelines. If we fail to meet these minimum capital guidelines and other regulatory requirements, then our financial condition would be materially and adversely affected. Any changes to regulatory capital requirements could adversely affect our ability to pay dividends or could require us to reduce business levels or to raise capital, including in ways that may implementadversely affect our financial condition or results of operations.
Replacement of the LIBOR benchmark interest rate could adversely affect our business, financial condition, and results of operations.
In 2017, the United Kingdom’s Financial Conduct Authority (“FCA”), which regulates the London Interbank Offered Rate (“LIBOR”), announced that the FCA intends to stop persuading or compelling banks to submit the rates required to calculate LIBOR after 2021. This announcement indicates that the continuation of LIBOR on the current basis cannot and will not be guaranteed after 2021. The U.S. bank regulators issued a Statement on LIBOR Transition on November 30, 2020 encouraging banks to transition away from U.S. Dollar (USD) LIBOR as soon as practicable and in any event by December 31, 2021 for new linescontracts. LIBOR is currently anticipated to be fully phased out by June 30, 2023. At this time, it is not possible to predict whether and to what extent banks will continue to provide submissions for the calculation of businessLIBOR. Similarly, it is not possible to predict whether LIBOR will continue to be viewed as an acceptable market benchmark, what rate or offer new products and services within existing linesrates may become accepted alternatives to LIBOR or what the effect of business. There are substantial risks and uncertainties associated with these efforts, particularlyany such changes in instances whereviews or alternatives may be on the markets for LIBOR-indexed financial instruments.
We have other financial instruments with attributes that are not fully developed. In developing and marketing new lineseither directly or indirectly dependent on LIBOR. The transition from LIBOR, or any changes or reforms to the determination or supervision of business and/or new products and services, the Company may invest significant time and resources. Initial timetables for the introduction and development of new lines of business and/or new products or services may not be achieved and price and profitability targets may not prove attainable. External factors, such as compliance with regulations, competitive alternatives, and shifting market preferences, may also impact the successful implementation of a new line of business or a new product or service. Furthermore, any new line of business and/or new product or serviceLIBOR, could have a significantan adverse impact on the effectivenessmarket for or value of any LIBOR-linked securities, loans, and other financial obligations or extensions of credit held by or due to us, could create considerable costs and additional risk and could have an adverse impact on or overall financial condition or results of operations. Since proposed alternative rates are calculated differently, payments under contracts referencing new rates will differ from those referencing LIBOR. The transition will change our market risk profiles, requiring changes to risk and pricing models, valuation tools, product design and hedging strategies. Furthermore, failure to adequately manage this transition process with our customers could adversely impact our reputation. Although we are currently unable to assess what the ultimate impact of the Company’s system of internal controls. Failuretransition from LIBOR will be, failure to successfullyadequately manage these risks in the development and implementation of new lines of business or new products or servicestransition could have a material adverse effect on the Company’sour business, financial condition, and results of operations, and financial condition.operations.
Accounting standards periodically change and the application of our accounting policies and methods may require management to make estimates about matters that are uncertain.
The regulatory bodies that establish accounting standards, including, among others, the Financial Accounting Standards Board (“FASB”)FASB, and the SEC, periodically revise or issue new financial accounting and reporting standards that govern the preparation of our consolidated financial statements. The effect of such revised or new standards on our financial statements can be difficult to predict and can materially impact how we record and report our financial condition and results of operations.
In addition, management must exercise judgment in appropriately applying many of our accounting policies and methods so they comply with generally accepted accounting principles. In some cases, management may have to select a particular accounting policy or method from two or more alternatives. In some cases, the accounting policy or method chosen might be reasonable under the circumstances and yet might result in our reporting materially different amounts than would have been reported if we had selected a different policy or method. Accounting policies are critical to fairly presenting our financial condition and results of operations and may require management to make difficult, subjective, or complex judgments about matters that are uncertain.
Our controls and procedures may fail or be circumvented, which may result in a material adverse effect on our business.
Management regularly reviews and updates our internal controls, disclosure controls and procedures, and corporate governance policies. Any system of controls, however well designed and operated, is based in part on certain assumptions and can provide only reasonable, not absolute, assurances that the objectives of the system are met. Any failure or circumvention of the controls and procedures or failure to comply with regulations related to could have a material adverse effect on our business, results of operations and financial condition.
Legal proceedings to which we are subject or may become subject may have a material adverse impact on our financial position and results of operations.
Like many banks and other financial services organizations in our industry, we are from time to time involved in various legal proceedings and subject to claims and other actions related to our business activities brought by customers, employees, and others. All such legal proceedings are inherently unpredictable and, regardless of the merits of the claims, litigation is often expensive, time-consuming, disruptive to our operations and resources, and distracting to management. If resolved against us, such legal proceedings could result in excessive verdicts and judgments, injunctive relief, equitable relief, and other adverse consequences that may affect our financial condition and how we operate our business. Similarly, if we settle such legal proceedings, it may affect our financial condition and how we operate our business. Future court decisions, alternative dispute resolution awards, matters arising due to business expansion, or legislative activity may increase our exposure to litigation and regulatory investigations. In some cases, substantial non-economic remedies or punitive damages may be sought. Although we maintain liability insurance coverage, there can be no assurance that such coverage will cover any particular verdict, judgment, or settlement that may be entered against us, that such coverage will prove to be adequate, or that such coverage will continue to remain available on acceptable terms, if at all. Legal proceedings to which we are subject or may become subject may have a material adverse impact on our financial position and results of operations.
The Company is exposed to risk of environmental liabilities with respect to properties to which we obtain title.
A significant portion of our loan portfolio is secured by real estate. In the course of our business, we may foreclose and take title to real estate and could be subject to environmental liabilities with respect to these properties. The Company may be held liable to a government entity or to third parties for property damage, personal injury, investigation, and clean-up costs incurred by these parties in connection with environmental contamination or may be required to clean up hazardous or toxic substances or chemical releases at a property. The costs associated with investigation and remediation activities could be substantial. In addition, if we are the owner or former owner of a contaminated site, we may be subject to common law claims by third parties based on damages and costs resulting from environmental contamination emanating from the property. These costs and claims could adversely affect our business, results of operations, and prospects.
Risks Related to Cybersecurity and Data Privacy
A breach of information security, including cyber-attacks, could disrupt our business and impact our earnings.
The Company depends upon data processing, communication, and information exchange on a variety of computing platforms and networks and over the internet. In addition, we rely on the services of a variety of vendors to meet our data processing and communication needs. Despite existing safeguards, we cannot be certain that all of our systems are free from vulnerability to attack or other technological difficulties or failures. During the normal course of our business, we have experienced and we expect to continue to experience attempts to breach our systems, none of which has been material to the Company to date, and we may be unable to protect sensitive data and the integrity of our systems. If information security is breached or difficulties or failures occur, despite the controls we and our third-party vendors have instituted, information can be lost or misappropriated, resulting in financial loss or costs to us, reputational harm, or damages to others. Such costs or losses could exceed the amount of insurance coverage, if any, which would adversely affect our earnings.
The Company may be adversely affected by fraud.
The Company is inherently exposed to operational risk in the soundnessform of theft and other fraudulent activity by employees, customers, and other third parties targeting the Company and/or the Company’s customers or data. Such activity may take many forms, including check fraud, electronic fraud, wire fraud, phishing, social engineering, and other dishonest acts. During the normal course of our business, we have been subjected to and we expect to continue to be subject to theft and fraudulent activity, none of which has been material to the Company to date.
The Company continually encounters technological change and the failure to understand and adapt to these changes could hurt its business.
The financial services industry is continually undergoing rapid technological change with frequent introductions of new technology-driven products and services. The effective use of technology increases efficiency and enables financial institutions including the FHLB of Boston.
Ourto better serve customers and to reduce costs. The Company’s future success depends, in part, upon its ability to engageaddress the needs of its customers by using technology to provide products and services that will satisfy customer demands, as well as to create additional efficiencies in routine funding transactions could be adversely affected by the actions and commercial soundnessCompany’s operations. Many of other financial institutions. Financial services companies are interrelated as a result of trading, clearing, counterparty, or other relationships.the Company’s competitors have substantially greater resources to invest in technological improvements. The Company has exposuremay not be able to different industrieseffectively implement new technology-driven products and counterparties,services or be successful in marketing these products and we routinely execute transactionsservices to its customers. Failure to successfully keep pace with counterparties intechnological changes affecting the financial services industry including brokerscould have a material adverse impact on the Company’s business and, dealers, commercial banks, investment banks, mutualin turn, the Company’s financial condition and hedge funds,results of operations.
Risks Related to Acquisitions
The risks presented by acquisitions, such as the acquisition of Optima and other institutional clients. As a result, defaults by, or even rumors or questions about, one or more financial services companies, or the financial services industry generally, have led to market-wide liquidity problems andWellesley Merger, could lead to losses or defaults by us or by other institutions. Many of these transactions expose us to credit risk in the event of default of our counterparty or client. In addition, our credit risk may be exacerbated if the collateral held by us cannot be realized or is liquidated at prices not sufficient to recover the full amount of the loan or derivative exposure due us. There is no assurance that any such losses would not materially and adversely affect our business, financial condition orand results of operations.
The Company owns common stock of FHLB of Boston in order to qualify for membership in the FHLB system, which enables it to borrow funds under the FHLB of Boston’s advance program. The carrying value and fair market value of our FHLB of Boston common stock was $7.9 million as of December 31, 2019. There are 11 branchesbusiness strategy of the FHLB, including Boston, which are jointly liable for the consolidated obligations of the FHLB system. To the extent that one FHLB branch cannot meet its obligations to pay its share of the system’s debt, other FHLB branches can be called upon to make the payment. Any adverse effects on the FHLB of Boston could adversely affect the value of our investment in its common stock and negatively impact our results of operations.
The Company’s common stock priceCompany may fluctuate significantly.
The market price of the Company’s common stock may fluctuate significantly in response to a number of factors including, but not limited to:
the political climate and whether the proposed policies of the current presidential administration in the U.S. that have affected market prices for financial institution stocks are successfully implemented;
changes in securities analysts’ recommendations or expectations of financial performance;
volatility of stock market prices and volumes;
incorrect information or speculation;
changes in industry valuations;
announcements regarding proposed acquisitions;
variations in operating results from general expectations;
actions taken against the Company by various regulatory agencies;
changes in authoritative accounting guidance;
changes in general domestic economic conditionsinclude growth through acquisition such as inflation rates, tax rates, unemployment rates, laborthe acquisition of Optima and healthcare cost trend rates, recessions, and changing government policies, laws, and regulations; andthe Wellesley merger. Any such future acquisitions will be accompanied by the risks commonly encountered in acquisitions. These risks may include, among other things:
| • | our ability to realize anticipated cost savings; |
severe weather, natural disasters, epidemics / pandemics such as COVID-19, acts of war or terrorism, and other external events.
| • | the difficulty of integrating operations and personnel, and the loss of key employees; |
| • | the potential disruption of our or the acquired company’s ongoing business in such a way that could result in decreased revenues, the inability of our management to maximize our financial and strategic position; |
| • | the inability to maintain uniform standards, controls, procedures, and policies; and |
| • | the impairment of relationships with the acquired company’s employees and customers as a result of changes in ownership and management. |
The issuance of our common stock in the Merger will have a dilutive effect and will reduce the voting power and relative percentage interests of current common stockholders in our earnings and market value, and there may be future sales or other dilution of the Company’s equity, which may adversely affect the market price of the Company’s stock.
The consideration payable in the Merger includes up to an aggregate of 1,579,725 of our common stock, based on the maximum possible number of shares of Wellesley common stock that may be exchanged or cancelled in the Merger. The issuances of shares of our common stock in the Merger will have a dilutive effect and will reduce the voting power and relative percentage interests of current common stockholders in our earnings and market value.
Additionally, the Company is not restricted from issuing additional common stock, including any securities that are convertible into or exchangeable for, or that represent the right to receive, common stock. The Company also grants shares of common stock to employees and directors under the Company’s incentive plan each year. The issuance of any additional shares of the Company’s common stock or securities convertible into, exchangeable for or that represent the right to receive common stock, or the exercise of such securities could be substantially dilutive to shareholders of the Company’s common stock. Holders of the Company’s common stock have no preemptive rights that entitle such holders to purchase their pro rata share of any offering of shares or any class or series. Because the Company’s decision to issue securities in any future offering will depend on market conditions, its acquisition activity and other factors, the Company cannot predict or estimate the amount, timing, or nature of its future offerings. Thus, the Company’s shareholders bear the risk of the Company’s future offerings reducing the market price of the Company’s common stock and diluting their stock holdings in the Company.
The Company depends on its executive officers and key personnel to continue the implementation of our long-term business strategy and could be harmed by the loss of their services.
The Company believes that its continued growth and future success will depend in large part upon the skills of our management team. The competition for qualified personnel in the financial services industry is intense, and the loss of our key personnel, or an inability to continue to attract or retain and motivate key personnel could adversely affect our business. We cannot provide any assurance that we will be able to retain our existing key personnel, attract additional qualified personnel, or effectively manage the succession of key personnel. We have change of control agreements with our actively employed named executive officers, and the loss of the services of one or more of our executive officers or key personnel could impair our ability to continue to develop our business strategy.
The Company may be subject to more stringent capital requirements.
The Bank and the Company are each subject to capital adequacy guidelines and other regulatory requirements specifying minimum amounts and types of capital which each of the Bank and the Company must maintain. From time to time, the regulators implement changes tosuccessful in overcoming these regulatory capital adequacy guidelines. If we fail to meet these minimum capital guidelines and other regulatory requirements, then our financial condition would be materially and adversely affected. Any changes to regulatory capital requirements could adversely affect our ability to pay dividends, or could require us to reduce business levels or to raise capital, including in ways that may adversely affect our financial condition or results of operations.
Replacement of the LIBOR benchmark interest rate could adversely affect our business, financial condition, and results of operations.
In 2017, the United Kingdom’s Financial Conduct Authority (“FCA”), which regulates the London Interbank Offered Rate (“LIBOR”), announced that the FCA intends to stop persuading or compelling banks to submit the rates required to calculate LIBOR after 2021. This announcement indicates that the continuation of LIBOR on the current basis cannot and will not be guaranteed after 2021. Consequently, at this time, it is not possible to predict whether and to what extent banks will continue to provide submissions for the calculation of LIBOR. Similarly, it is not possible to predict whether LIBOR will continue to be viewed as an acceptable market benchmark, what rate or rates may become accepted alternatives to LIBOR or what the effect of any such changes in views or alternatives may be on the markets for LIBOR-indexed financial instruments.
We have a significant number of loans, derivative contracts, borrowings and other financial instruments with attributes that are either directly or indirectly dependent on LIBOR. The transition from LIBOR,risks or any changes or reformsother problems encountered in connection with acquisitions. Our inability to the determination or supervision of LIBOR,overcome these risks could have an adverse impacteffect on the market forachievement of our business strategy and results of operations.
The integration of the Company and Wellesley will present significant challenges that may result in the combined business not operating as effectively as expected or valuein the failure to achieve some or all of any LIBOR-linked securities, loans,the anticipated benefits of the transaction.
The benefits and synergies expected to result from the Wellesley merger will depend in part on whether the operations of Wellesley can be integrated in a timely and efficient manner with those of the Company. The Company will face challenges in consolidating its
functions with those of Wellesley, and integrating the organizations, procedures, and operations of the two businesses. The integration of the Company and Wellesley will be complex and time-consuming, and the management of both companies will have to dedicate substantial time and resources to it. These efforts could divert management’s focus and resources from serving existing customers or other strategic opportunities and from day-to-day operational matters during the integration process. Failure to successfully integrate the operations of the Company and Wellesley could result in the failure to achieve some of the anticipated benefits from the transaction, including cost savings and other financial obligationsoperating efficiencies, and the Company may not be able to capitalize on the existing relationships of Wellesley to the extent anticipated, or extensions of credit held byit may take longer, or duebe more difficult or expensive than expected to us, could create considerable costs and additional risk andachieve these goals. This could have an adverse impacteffect on or overallthe business, results of operations, financial condition, or results of operations. Since proposed alternative rates are calculated differently, payments under contracts referencing new rates will differ from those referencing LIBOR. The transition will change our market risk profiles, requiring changes to risk and pricing models, valuation tools, product design and hedging strategies. Furthermore, failure to adequately manage this transition process with our customers could adversely impact our reputation. Although we are currently unable to assess what the ultimate impactprospects of the transition from LIBOR will be, failure to adequately manageCompany and/or the transition could have a material adverse effect on our business, financial condition and results of operations.Bank after the transaction.
General Risks
Natural disasters, acts of war or terrorism, the impact of health epidemics and other adverse external events could detrimentally affect our financial condition and results of operations.
Natural disasters, acts of war or terrorism, and other adverse external events could have a significant negative impact on our ability to conduct business or upon third parties who perform operational services for us or our customers. Such events also could affect the stability of our deposit base, impair the ability of borrowers to repay outstanding loans, impair the value of collateral securing loans, cause significant property damage, result in lost revenue or cause us to incur additional expenses.
The recent COVID-19 outbreak could negatively impact the ability of our employees and customers to engage in banking and other financial transactions in the geographic areas in which the Company operates. The Company also could be adversely affected if key personnel or a significant number of employees were to become unavailable due to a coronavirus outbreak in our market areas. Although the Company has business continuity plans and other safeguards in place, there is no assurance that such plans and safeguards will be effective. In the event of a natural disaster, the spread of the coronavirus to our market areas or other adverse external events, our business, services, asset quality, financial condition and results of operations could be adversely affected.
The effects of widespread public health emergencies may negatively affect our local economies or disrupt our operations, which would have an adverse effect on our business or results of operations.
Widespread health emergencies, such as the recent coronavirus outbreak, can disrupt our operations through their impact on our employees, customers and their businesses, and the communities in which we operate. Disruptions to our customers could result in increased risk of delinquencies, defaults, foreclosures, and losses on our loans, negatively impact regional economic conditions, result in a decline in local loan demand, loan originations and deposit availability and negatively impact the implementation of our growth strategy. Any one or more of these developments could have a material adverse effect on our business, financial condition, and results of operations.
Item 1B. Unresolved Staff Comments.
None.
Item 2. Properties.
The Company conducts its business through 1621 private banking offices, including its main banking office and headquarters in Cambridge, Massachusetts, itsMassachusetts. The Company also has operations centercenters in Burlington and Wellesley, Massachusetts, and Portsmouth, New Hampshire, five wealth management offices, and onetwo off-site ATM.ATMs.
Item 3. Legal Proceedings.
From time to time, the Company and its subsidiaries may be parties to various claims and lawsuits arising in the ordinary course of their normal business activities. Although the ultimate outcome of these suits, if any, cannot be ascertained at this time, it is the opinion of management that none of these matters, even if it resolved adversely to the Company, will have a material adverse effect on the Company’s consolidated financial position. The Company is not currently party to any material pending legal proceedings.
On February 25, 2020, one purported stockholder of Wellesley Bancorp, Inc. filed a putative derivative and class action lawsuit against Wellesley, the members of the Wellesley board of directors, Wellesley Bank, the Company and the Bank in the Circuit Court for Baltimore City, Maryland, on behalf of himself and similarly situated Wellesley stockholders, and derivatively on behalf of Wellesley, captioned Parshall v. Fontaine et al., Case No. 24-C-20-001127 (the “Merger Litigation”). The plaintiff generally alleges that the Wellesley board of directors breached its fiduciary obligations by approving the terms of the Agreement and Plan of Merger, dated December 5, 2019, by and among Wellesley, the Company, the Bank and Wellesley Bank, which provides for, among other things, the merger of Wellesley with and into the Company. The plaintiff further alleges inadequate merger consideration. Lastly, the plaintiff alleges that the joint proxy statement/prospectus for the Merger filed with the SEC on February 4, 2020 and first mailed to Wellesley stockholders on February 6, 2020 contained materially incomplete disclosures about the Merger. The plaintiff seeks injunctive relief, rescission of the Merger or rescissory damages, other unspecified damages, and an award of attorneys’ fees and expenses. On March 5, 2020, solely to avoid the costs, risks and uncertainties inherent in litigation, the Company and Wellesley agreed to make additional disclosures to supplement the disclosures contained in the joint proxy statement/prospectus. These additional disclosures moot plaintiff’s disclosure claims asserted in the Merger Litigation and, as a result, the plaintiff has agreed to dismiss the Merger Litigation with prejudice as to their individual claims and without prejudice to the claims of the putative members of the class.
Item 4. Mine SafetySafety Disclosures.
None.
PART II
Item 5. Market for Registrant’s Common Equity Related Stockholder Matters and Issuer Purchases of Equity Securities.
Market Information
On October 18, 2017, shares of the Company’s common stock commenced trading on the NASDAQ Stock Market under the symbol “CATC”. Prior to this date, the Company’s shares traded on the over the counterover-the-counter market.
As of February 29, 2020,28, 2021, there were 5,412,2216,940,649 shares of the Company’s common stock outstanding held by 423559 holders of record. The number of record-holders may not reflect the number of persons or entities holding stock in nominee name through banks, brokerage firms, and other nominees. The closing price of the Company’s common stock on December 31, 2019 2020 was $80.15. $69.75. The Company declared cash dividends of $2.04 $2.12 and $1.96$2.04 per share in 20192020 and in 20182019, respectively.
The continued payment of dividends depends upon our profitability, debt and equity structure, earnings, financial condition, need for capital and other factors, including economic conditions, regulatory restrictions, and tax considerations. We cannot guarantee the payment of dividends or that, if paid, that dividends will not be reduced or eliminated in the future.
The only funds available for the payment of dividends on our capital stock will be cash and cash equivalents held by us, dividends paid to us by the Bank, and borrowings. The Bank will be prohibited from paying cash dividends to us to the extent that any such payment would reduce the Bank’s capital below required capital levels.
The Company’s primary source of funds for dividends paid to shareholders is the receipt of dividends from the Bank. A discussion of the restrictions on the advance of funds or payments of dividends by the Bank to the Company is included in “Supervision and Regulation – Dividends.”
Stock Performance Graph
The following compares the cumulative total shareholder return on the Company’s common stock against the cumulative total return of the KBW NASDAQ Composite Index and the SNL U.S. Bank NASDAQand Thrift Index from December 31, 20142015 to December 31, 2019.2020. The results presented assume that the value of the Company’s common stock and each index was $100.00 on December 31, 2014.2015. The total return assumes reinvestment of dividends.
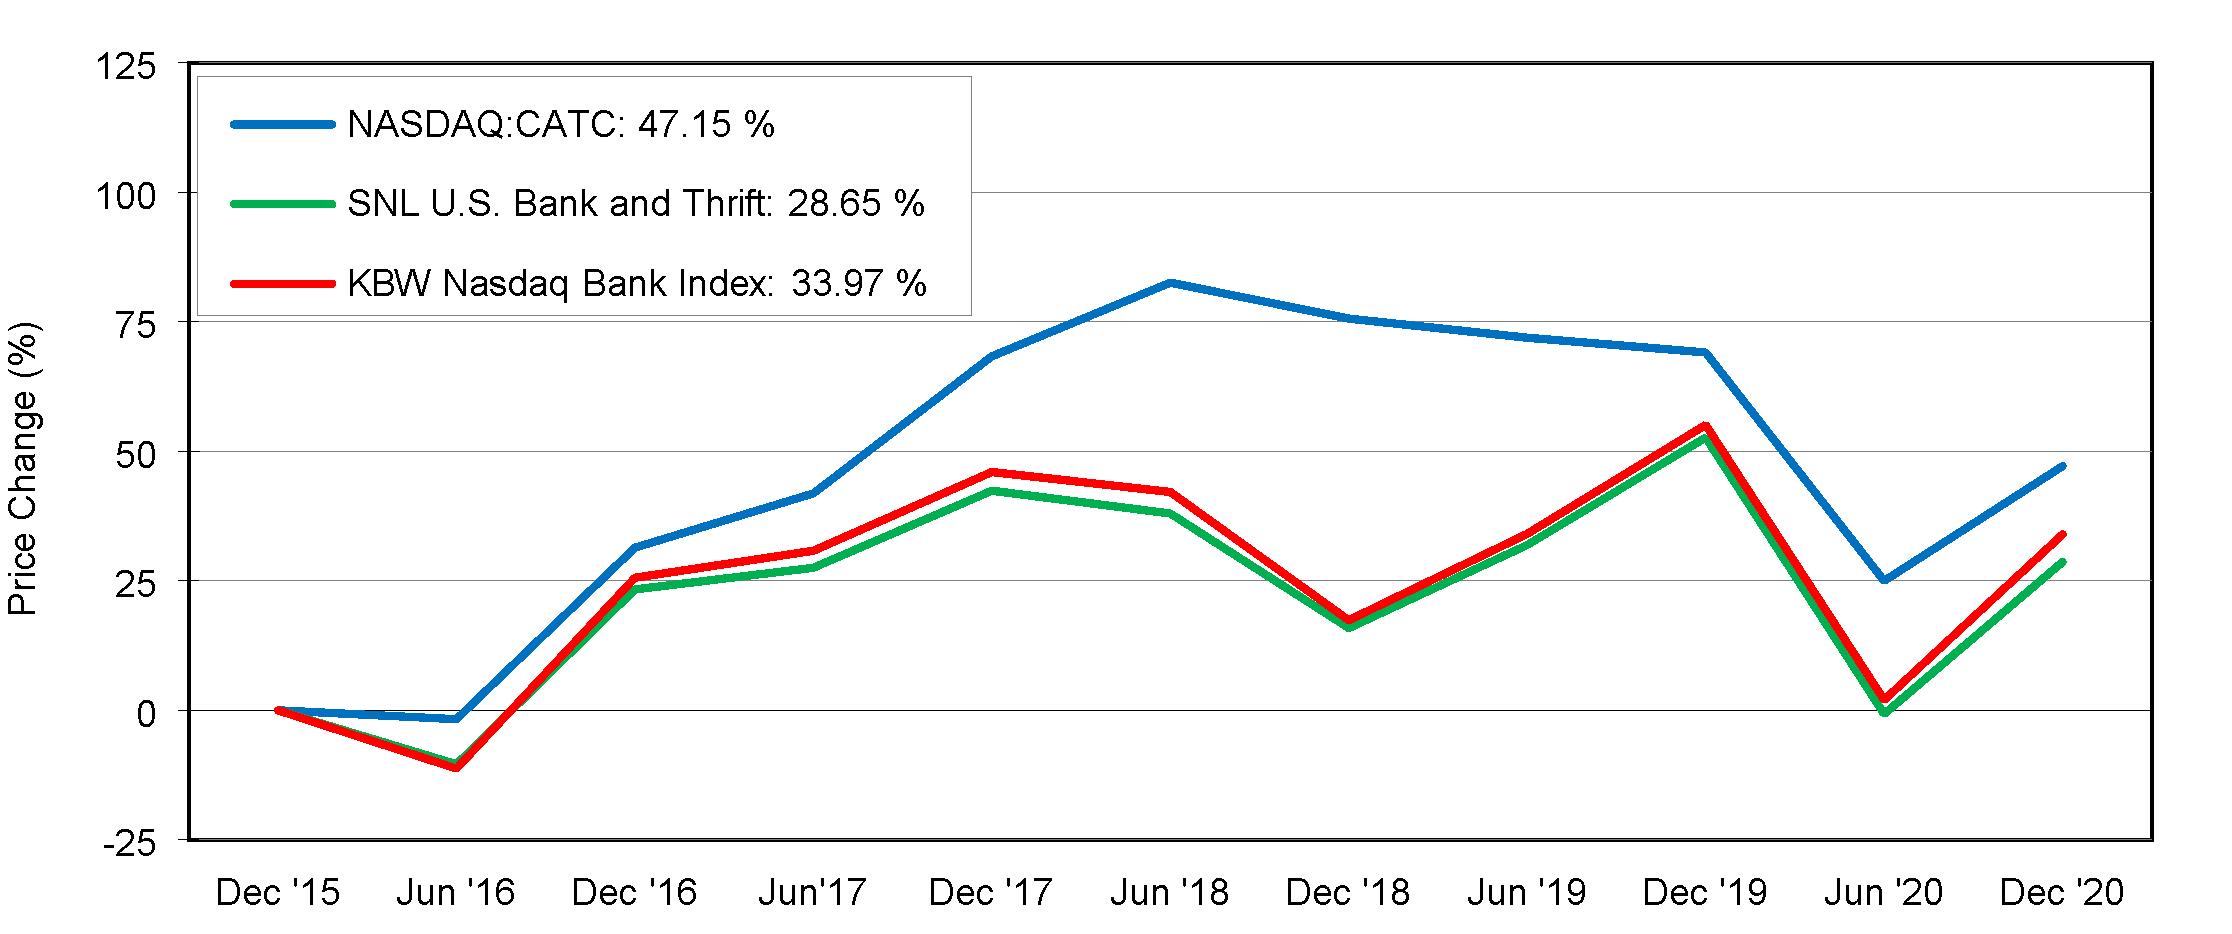
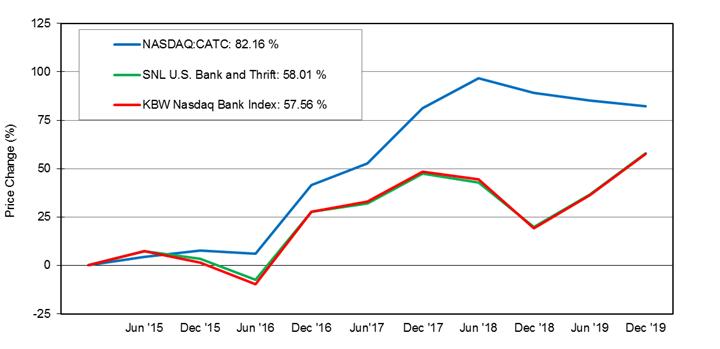


Source: S&P Global Market Intelligence © 20202021
This performance graph shall not be deemed “filed” for the purposes of Section 18 of the Securities Exchange Act of 1934, as amended, or incorporated by reference into any filing by us under the Securities Act of 1933, as amended, or the Securities Exchange Act, except as shall be expressly set forth by specific reference in such filing.
Issuer Purchase of Equity Securities
The following table sets forth the information regarding the Company’s repurchases of its common stock during the three months ended December 31, 2019:2020:
| | Total Number of Shares Repurchased (1) | | | Weighted Average Price Paid Per Share | |
Period | | | | | | | | |
October 1 to October 31, 2019 | | | — | | | $ | — | |
November 1 to November 30, 2019 | | | 260 | | | $ | 79.62 | |
December 1 to December 31, 2019 | | | — | | | $ | — | |
Total | | | 260 | | | | | |
| | Total Number of Shares Repurchased (1) | | | Weighted Average Price Paid Per Share | |
Period | | | | | | | | |
October 1 to October 31, 2020 | | | — | | | $ | — | |
November 1 to November 30, 2020 | | | 172 | | | $ | 69.74 | |
December 1 to December 31, 2020 | | | — | | | $ | — | |
Total | | | 172 | | | | | |
(1) | Shares repurchased by the Company relate to shares tendered by employees to pay their income tax liability on current period equity award vestings. |
The Company does not currently have
On March 15, 2021, the Company's board of directors authorized a stock repurchase program to acquire from time to time up to 5.0% shares of the Company’s common stock through March 15, 2022, provided that the aggregate purchase price does not exceed $26.0 million. The timing and amount of any shares of the Company’s common stock repurchased will be determined by the Company’s management based on its evaluation of market conditions and other factors. The stock repurchase program may be suspended or plan in place. discontinued at any time.
Recent Sales of Unregistered Securities
There were no unregistered sales of equity securities during the year ended December 31, 2019.2020.
Item 6. Selected Financial Data.
The selected consolidated financial data set forth below does not purport to be complete and should be read in conjunction with, and is qualified in its entirety by, the more detailed information including the Consolidated Financial Statements and related Notes and the section entitled “Management’s Discussion and Analysis of Financial Condition and Results of Operations.”
| | December 31, | | | December 31, | |
| | 2019 | | | 2018 | | | 2017 | | | 2016 | | | 2015 | | | 2020 | | | 2019 | | | 2018 | | | 2017 | | | 2016 | |
| | (dollars in thousands, except per share data) | | | (dollars in thousands, except per share data) | |
Operating Data | | | | | | | | | | | | | | | | | | | | | | | | | | | | | | | | | | | | | | | | |
Interest Income | | $ | 96,339 | | | $ | 69,055 | | | $ | 61,191 | | | $ | 57,028 | | | $ | 54,341 | | | $ | 129,378 | | | $ | 96,339 | | | $ | 69,055 | | | $ | 61,191 | | | $ | 57,028 | |
Interest Expense | | | 17,643 | | | | 5,467 | | | | 3,587 | | | | 3,355 | | | | 2,694 | | | | 9,145 | | | | 17,643 | | | | 5,467 | | | | 3,587 | | | | 3,355 | |
Net interest and dividend Income | | | 78,696 | | | | 63,588 | | | | 57,604 | | | | 53,673 | | | | 51,647 | | |
Provision for Loan Losses | | | 3,004 | | | | 1,502 | | | | 362 | | | | 132 | | | | 1,075 | | |
Net Interest and Dividend Income | | | | 120,233 | | | | 78,696 | | | | 63,588 | | | | 57,604 | | | | 53,673 | |
Provision for Credit Losses | | | | 18,310 | | | | 3,004 | | | | 1,502 | | | | 362 | | | | 132 | |
Noninterest Income | | | 36,401 | | | | 32,989 | | | | 30,224 | | | | 28,661 | | | | 25,865 | | | | 39,525 | | | | 36,401 | | | | 32,989 | | | | 30,224 | | | | 28,661 | |
Noninterest Expense | | | 78,175 | | | | 63,987 | | | | 59,292 | | | | 56,750 | | | | 53,192 | | | | 98,085 | | | | 78,175 | | | | 63,987 | | | | 59,292 | | | | 56,750 | |
Income Before Taxes | | | 33,918 | | | | 31,088 | | | | 28,174 | | | | 25,452 | | | | 23,245 | | | | 43,363 | | | | 33,918 | | | | 31,088 | | | | 28,174 | | | | 25,452 | |
Income Taxes | | | 8,661 | | | | 7,207 | | | | 13,358 | | | | 8,556 | | | | 7,551 | | | | 11,404 | | | | 8,661 | | | | 7,207 | | | | 13,358 | | | | 8,556 | |
Net Income (a GAAP Measure) | | $ | 25,257 | | | $ | 23,881 | | | $ | 14,816 | | | $ | 16,896 | | | $ | 15,694 | | | $ | 31,959 | | | $ | 25,257 | | | $ | 23,881 | | | $ | 14,816 | | | $ | 16,896 | |
| | | | | | | | | | | | | | | | | | | | | | | | | | | | | | | | | | | | | | | | |
Operating Net Income (a non-GAAP measure)* | | $ | 29,156 | | | $ | 24,024 | | | $ | 18,687 | | | $ | 16,896 | | | | 15,694 | | | $ | 43,870 | | | $ | 29,156 | | | $ | 24,024 | | | $ | 18,687 | | | | 16,896 | |
Average shares outstanding, basic | | | 4,629,255 | | | | 4,061,529 | | | | 4,030,530 | | | | 3,990,343 | | | | 3,938,117 | | | | 6,289,481 | | | | 4,629,255 | | | | 4,061,529 | | | | 4,030,530 | | | | 3,990,343 | |
Average shares outstanding, diluted | | | 4,661,720 | | | | 4,098,633 | | | | 4,065,754 | | | | 4,028,944 | | | | 3,993,599 | | | | 6,344,409 | | | | 4,661,720 | | | | 4,098,633 | | | | 4,065,754 | | | | 4,028,944 | |
Total shares outstanding | | | 5,400,868 | | | | 4,107,051 | | | | 4,082,188 | | | | 4,036,879 | | | | 4,000,181 | | | | 6,926,728 | | | | 5,400,868 | | | | 4,107,051 | | | | 4,082,188 | | | | 4,036,879 | |
Basic Earnings Per Share | | $ | 5.41 | | | $ | 5.82 | | | $ | 3.64 | | | $ | 4.19 | | | $ | 3.94 | | | $ | 5.07 | | | $ | 5.41 | | | $ | 5.82 | | | $ | 3.64 | | | $ | 4.19 | |
Diluted Earnings Per Share | | $ | 5.37 | | | $ | 5.77 | | | $ | 3.61 | | | $ | 4.15 | | | $ | 3.93 | | | $ | 5.03 | | | $ | 5.37 | | | $ | 5.77 | | | $ | 3.61 | | | $ | 4.15 | |
Operating Diluted Earnings Per Share (a non-GAAP measure)* | | $ | 6.20 | | | $ | 5.80 | | | $ | 4.56 | | | $ | 4.15 | | | $ | 3.93 | | | $ | 6.90 | | | $ | 6.20 | | | $ | 5.80 | | | $ | 4.56 | | | $ | 4.15 | |
Dividends Declared Per Share | | $ | 2.04 | | | $ | 1.96 | | | $ | 1.86 | | | $ | 1.84 | | | $ | 1.80 | | | $ | 2.12 | | | $ | 2.04 | | | $ | 1.96 | | | $ | 1.86 | | | $ | 1.84 | |
Dividend payout ratio (1) | | | 38 | % | | | 34 | % | | | 51 | % | | | 44 | % | | | 46 | % | | | 42 | % | | | 38 | % | | | 34 | % | | | 51 | % | | | 44 | % |
| | | | | | | | | | | | | | | | | | | | | | | | | | | | | | | | | | | | | | | | |
Financial Condition Data | | | | | | | | | | | | | | | | | | | | | | | | | | | | | | | | | | | | | | | | |
Total Assets | | $ | 2,855,563 | | | $ | 2,101,384 | | | $ | 1,949,934 | | | $ | 1,848,999 | | | $ | 1,706,201 | | | $ | 3,949,297 | | | $ | 2,855,563 | | | $ | 2,101,384 | | | $ | 1,949,934 | | | $ | 1,848,999 | |
Total Deposits | | | 2,358,878 | | | | 1,811,410 | | | | 1,775,400 | | | | 1,686,038 | | | | 1,557,224 | | | | 3,403,083 | | | | 2,358,878 | | | | 1,811,410 | | | | 1,775,400 | | | | 1,686,038 | |
Total Loans | | | 2,226,728 | | | | 1,559,772 | | | | 1,350,899 | | | | 1,320,154 | | | | 1,192,214 | | | | 3,153,648 | | | | 2,226,728 | | | | 1,559,772 | | | | 1,350,899 | | | | 1,320,154 | |
Shareholders' equity | | | 286,561 | | | | 167,026 | | | | 147,957 | | | | 134,671 | | | | 125,063 | | |
Shareholders' Equity | | | | 401,732 | | | | 286,561 | | | | 167,026 | | | | 147,957 | | | | 134,671 | |
Book Value Per Share | | | 53.06 | | | | 40.67 | | | | 36.24 | | | | 33.36 | | | | 31.26 | | | | 58.00 | | | | 53.06 | | | | 40.67 | | | | 36.24 | | | | 33.36 | |
Tangible Book Value Per Share (a non-GAAP measure)* | | $ | 46.66 | | | $ | 40.57 | | | $ | 36.14 | | | $ | 33.26 | | | $ | 31.16 | | | $ | 50.07 | | | $ | 46.66 | | | $ | 40.57 | | | $ | 36.14 | | | $ | 33.26 | |
| | | | | | | | | | | | | | | | | | | | | | | | | | | | | | | | | | | | | | | | |
Performance Ratios | | | | | | | | | | | | | | | | | | | | | | | | | | | | | | | | | | | | | | | | |
Return on Average Assets | | | 0.97 | % | | | 1.21 | % | | | 0.79 | % | | | 0.95 | % | | | 0.95 | % | | | 0.91 | % | | | 0.97 | % | | | 1.21 | % | | | 0.79 | % | | | 0.95 | % |
Operating Return on Average Assets (a non-GAAP measure)* | | | 1.12 | % | | | 1.21 | % | | | 1.00 | % | | | 0.95 | % | | | 0.95 | % | | | 1.25 | % | | | 1.12 | % | | | 1.21 | % | | | 1.00 | % | | | 0.95 | % |
Return on Average Shareholders' equity | | | 11.40 | % | | | 15.35 | % | | | 10.47 | % | | | 12.77 | % | | | 12.91 | % | | | 9.09 | % | | | 11.40 | % | | | 15.35 | % | | | 10.47 | % | | | 12.77 | % |
Operating Return on Tang Common Equity (a non-GAAP measure)* | | | 14.80 | % | | | 15.49 | % | | | 13.24 | % | | | 12.81 | % | | | 12.91 | % | |
Operating Return on Tangible Common Equity (a non-GAAP measure)* | | | | 14.38 | % | | | 14.80 | % | | | 15.49 | % | | | 13.24 | % | | | 12.81 | % |
Total Shareholders’ Equity to Total Assets | | | 10.04 | % | | | 7.95 | % | | | 7.59 | % | | | 7.28 | % | | | 7.33 | % | | | 10.17 | % | | | 10.04 | % | | | 7.95 | % | | | 7.59 | % | | | 7.28 | % |
Interest rate spread (2) | | | 2.93 | % | | | 3.19 | % | | | 3.16 | % | | | 3.12 | % | | | 3.24 | % | | | 3.52 | % | | | 2.93 | % | | | 3.19 | % | | | 3.16 | % | | | 3.12 | % |
Net Interest Margin, taxable equivalent (3) | | | 3.22 | % | | | 3.33 | % | | | 3.25 | % | | | 3.21 | % | | | 3.32 | % | | | 3.65 | % | | | 3.22 | % | | | 3.33 | % | | | 3.25 | % | | | 3.21 | % |
Efficiency ratio (4) | | | 67.92 | % | | | 66.25 | % | | | 67.51 | % | | | 68.93 | % | | | 68.62 | % | | | 61.40 | % | | | 67.92 | % | | | 66.25 | % | | | 67.51 | % | | | 68.93 | % |
Operating Efficiency Ratio (a non-GAAP measure)* | | | 63.78 | % | | | 66.05 | % | | | 67.51 | % | | | 68.93 | % | | | 68.62 | % | | | 56.66 | % | | | 63.78 | % | | | 66.05 | % | | | 67.51 | % | | | 68.93 | % |
| | | | | | | | | | | | | | | | | | | | | | | | | | | | | | | | | | | | | | | | |
Wealth Management Assets | | | | | | | | | | | | | | | | | | | | | | | | | | | | | | | | | | | | | | | | |
Market Value of Assets Under Management & Administration | | $ | 3,452,852 | | | $ | 2,876,702 | | | $ | 3,085,669 | | | $ | 2,689,103 | | | $ | 2,449,139 | | | $ | 4,167,903 | | | $ | 3,452,852 | | | $ | 2,876,702 | | | $ | 3,085,669 | | | $ | 2,689,103 | |
| | | | | | | | | | | | | | | | | | | | | | | | | | | | | | | | | | | | | | | | |
Asset Quality | | | | | | | | | | | | | | | | | | | | | | | | | | | | | | | | | | | | | | | | |
Non-Performing Loans | | $ | 5,651 | | | $ | 642 | | | $ | 1,298 | | | $ | 1,676 | | | $ | 1,481 | | | $ | 8,962 | | | $ | 5,651 | | | $ | 642 | | | $ | 1,298 | | | $ | 1,676 | |
Non-Performing Loans/Total Loans | | | 0.25 | % | | | 0.04 | % | | | 0.10 | % | | | 0.13 | % | | | 0.12 | % | | | 0.28 | % | | | 0.25 | % | | | 0.04 | % | | | 0.10 | % | | | 0.13 | % |
Net (Charge-Offs)/Recoveries | | $ | (1,592 | ) | | $ | (54 | ) | | $ | (303 | ) | | $ | (62 | ) | | $ | (153 | ) | | $ | (439 | ) | | $ | (1,592 | ) | | $ | (54 | ) | | $ | (303 | ) | | $ | (62 | ) |
Allowance/Total Loans | | | 0.82 | % | | | 1.08 | % | | | 1.13 | % | | | 1.16 | % | | | 1.27 | % | | | 1.14 | % | | | 0.82 | % | | | 1.08 | % | | | 1.13 | % | | | 1.16 | % |
| | | | | | | | | | | | | | | | | | | | | | | | | | | | | | | | | | | | | | | | |
Capital Ratios (5): | | | | | | | | | | | | | | | | | | | | | | | | | | | | | | | | | | | | | | | | |
Total capital | | | 13.61 | % | | | 13.25 | % | | | 13.75 | % | | | 13.14 | % | | | 13.05 | % | | | 13.93 | % | | | 13.61 | % | | | 13.25 | % | | | 13.75 | % | | | 13.14 | % |
Tier 1 capital | | | 12.70 | % | | | 12.07 | % | | | 12.50 | % | | | 11.89 | % | | | 11.80 | % | | | 12.68 | % | | | 12.70 | % | | | 12.07 | % | | | 12.50 | % | | | 11.89 | % |
Common Equity Tier 1 | | | 12.70 | % | | | 12.07 | % | | | 12.50 | % | | | 11.89 | % | | | 11.80 | % | | | 12.68 | % | | | 12.70 | % | | | 12.07 | % | | | 12.50 | % | | | 11.89 | % |
Tier 1 leverage capital | | | 8.98 | % | | | 8.49 | % | | | 8.06 | % | | | 7.95 | % | | | 7.75 | % | | | 8.89 | % | | | 8.98 | % | | | 8.49 | % | | | 8.06 | % | | | 7.95 | % |
| | | | | | | | | | | | | | | | | | | | | | | | | | | | | | | | | | | | | | | | |
Other Data: | | | | | | | | | | | | | | | | | | | | | | | | | | | | | | | | | | | | | | | | |
Number of full service offices | | | 16 | | | | 10 | | | | 11 | | | | 11 | | | | 12 | | |
Number of full-service offices | | | | 21 | | | | 16 | | | | 10 | | | | 11 | | | | 11 | |
Full time equivalent employees | | | 303 | | | | 252 | | | | 239 | | | | 238 | | | | 228 | | | | 372 | | | | 303 | | | | 252 | | | | 239 | | | | 238 | |
* See GAAP to Non-GAAP reconciliations in Item 7
(1)*
| See GAAP to Non-GAAP reconciliations in Item 7 |
(1) | Dividend payout ratio represents per share dividends declared divided by diluted earnings per share. |
(2) | The interest rate spread represents the difference between the fully taxable equivalent weighted-average yield on interest-earning assets and the weighted-average cost of interest-bearing liabilities for the period. |
(3) | The net interest margin represents fully taxable equivalent net interest income as a percent of average interest-earning assets for the period. |
(4) | The efficiency ratio represents noninterest expense as a percentage of the sum of net interest income and noninterest income. |
(5) | Capital ratios are for Cambridge Bancorp. |
Item
Item 7. Management’s Discussion and Analysis of Financial Condition and Results of Operations.
OVERVIEW
Cambridge Bancorp (together with its bank subsidiary, unless the context otherwise requires, the “Company”) is a Massachusetts state-chartered, federally registered bank holding company headquartered in Cambridge, Massachusetts. The Company is a Massachusetts corporation formed in 1983 and has one banking subsidiary, Cambridge Trust Company (the “Bank”), formed in 1890. At December 31, 2019,2020, the Company had total assets of approximately $2.9$3.9 billion. Currently, the Bank operates 1621 private banking offices in in Eastern Massachusetts and New Hampshire. The Company’s Wealth Management Group has five offices, twoone in Boston and Wellesley, Massachusetts and three in New Hampshire in Concord, Manchester, and Portsmouth. The Company’s Assets under Management and Administration as of December 31, 20192020 were approximately $3.5$4.2 billion. The Bank’s clients consist primarily of small- and medium-sized businesses and retail customers in these communities and surrounding areas throughout Massachusetts and New Hampshire.
The Company’s results of operations are largely dependent on net interest income, which is the difference between the interest earned on loans and securities and interest paid on deposits and borrowings. The results of operations are also affected by the level of income and fees from wealth management services, loans, deposits, as well as operating expenses, the provision for loancredit losses, the impact of federal and state income taxes, and the relative levels of interest rates and economic activity.
Critical Accounting Policies
Accounting policies involving significant judgments and assumptions by management, which have, or could have, a material impact on the carrying value of certain assets and impact income, are considered critical accounting policies.
The Company considers allowance for loancredit losses and income taxes to be its critical accounting policies.
Allowance for loancredit losses
Arriving at an appropriate level of allowance for loan losses involves a high degree of judgment. Management maintains an allowance for loan losses to absorb losses inherent in the loan portfolio. The allowance is based on assessments of the probable estimated losses inherent in the loan portfolio. Management’s methodology for assessing the appropriateness of the allowance consists of several key elements, which include the specific allowances, if appropriate, for identified problem loans, formula allowance, and possibly an unallocated allowance.
The provision for loan losses and the level of the allowance for loan losses reflects management’s estimate of probable loan losses inherent in the loan portfolio at the balance sheet date. Management uses a systematic process and methodology to establish the allowance for loan losses each quarter. To determine the total allowance for loan losses, management estimates the allowance needed for each of the following segments of the loan portfolio: (1) residential mortgage loans, (2) commercial mortgage loans, including multi-family loans and construction loans, (3) home equity loans and lines of credit, (4) commercial & industrial loans, and (5) consumer loans.
The establishment of the allowance for each portfolio segment is based on a process that evaluates the risk characteristics relevant to each portfolio segment and takes into consideration multiple internal and external factors.
Internal factors include, but are not limited to:
(a) the loss emergence period,
(b) historic levels and trends in the number and amount of loans on non-accrual and past due, charge-offs, delinquencies, risk ratings, and foreclosures,
(c) level and changes in industry, geographic, and credit concentrations,
(d) underwriting policies and adherence to such policies,
(e) the growth and vintage of the portfolios, and
(f) the experience of, and any changes in, lending and credit personnel.
External factors include, but are not limited to:
(a) conditions and trends in the local and national economy and
(b) levels and trends in national delinquent and non-performing loans.
The Bank evaluates certain loans individually for specific impairment. A loan is considered impaired when, based on current information and events, it is probable that the Bank will be unable to collect the scheduled payments of principal or interest when due according to the contractual terms of the loan agreement. Loans that experience insignificant payment delays and payment shortfalls generally are not classified as impaired. Loans are selected for evaluation based upon internal risk rating, delinquency status, or non-accrual status. A specific allowance amount is allocated to an individual loan when such loan has been deemed impaired and when the amount of the probable loss is able to be estimated. Estimates of loss may be determined by the present value of anticipated future cash flows, the loan’s observable fair market value, or the fair value of the collateral, if the loan is collateral dependent.
In addition, the adoption of Accounting Standards Update (“ASU”) 2016-13, “FinancialThe Company adopted ASU-2016-13 - Financial Instruments - Credit Losses (Topic(Topic 326): Measurement of Credit Losses on Financial Instruments” (“ASU 2016-13”) during the first quarter of 2020. ASU 2016-13, which has been codified under Topic 326, replaced the previous GAAP method of calculating loan losses. Previously, GAAP required the use of the incurred loss methodology versus ASU 2016-13 which utilizes an expected loss methodology. The use of an expected loss methodology, referred to as amended, on January 1, 2020 will impact ourthe current expected credit loss (“CECL”) methodology, requires institutions to account for estimatingpotential losses that previously would not have been part of the calculation. The CECL methodology incorporates forecasting in addition to historical and current measures utilized in the prior incurred loss methodology. The measurement of expected credit losses under the CECL methodology is applicable to financial assets measured at amortized cost, including loan receivables, held to maturity and available for sale debt securities.
Under the CECL methodology, the allowance for loancredit losses(“ACL”) consists of quantitative and qualitative components. The quantitative component of the ACL is model based and utilizes a forward-looking macroeconomic forecast, complemented by a qualitative component in estimating expected credit losses. See Note 3 - Recently Issued and Adopted Accounting StandardsThe qualitative component of the ACLconsiders (i) the uncertainty of forward-looking scenarios; (ii) certain portfolio characteristics, such as portfolio concentrations, real estate values, changes in the notesnumber and amount of non-accrual and past due loans; and (iii) model limitations; among other factors.
ASU 2016-13 also applies to consolidatedoff-balance sheet credit exposures not accounted for as insurance (loan commitments, standby letters of credit, financial statements includedguarantees, and other similar investment;) and net investments in Item 8. Financial Statementsleases recognized by a lessor in accordance with ASU 2016-02 - Leases (Topic 842).
Losses on loan receivables are estimated and Supplementary Data elsewhererecognized upon origination of the loan, based on expected credit losses for the life of the loan balance as of the period end date. The Company uses a discounted cash flow method incorporating probability of default and loss given default forecasted based on statistically derived economic variable loss drivers combined with qualitative factors to estimate expected credit losses. This process includes estimates which involve modeling loss projections attributable to existing loan balances, considering historical experience, current conditions, and future expectations for homogeneous pools of loans over a reasonable and supportable forecast period. The historical information either experienced by the Company or by a selection of peer banks when appropriate, is derived from a combination of recessionary and non-recessionary performance periods for which data is available.
The reasonable and supportable forecast period is primarily determined based upon the stability of current economic conditions at each measurement date. Management considers the accuracy level of historical loss forecast estimates, the specific loan level models and methodology utilized, and considers material changes in this report.growth and credit strategy; and business changes which may not be applicable within the current environment. For periods beyond a reasonable and supportable forecast interval, we revert to historical information over a period for which comparable data is available.
We also perform a qualitative assessment beyond model estimates and apply qualitative adjustments as management deems necessary Adjustments are considered when management believes expected credit losses are not representative of historical loss experience alone, and should be adjusted to reflect the current conditions and characteristics of the Company’s own portfolio. They are made at the segment level, considering any required adjustments for differences in underwriting standards, portfolio mix, and other relevant data shifts over time.
We evaluate the allowance for credit losses quarterly. We regularly review our collection experience (including delinquencies and net charge-offs) in determining our allowance for credit losses. We also consider our historical loss experience to date based on actual defaulted loans and overall portfolio indicators including delinquent and non-accrual loans, trends in loan volume and lending terms, credit policies and other observable environmental factors such as unemployment and interest rate changes.
The underlying assumptions, estimates and assessments we use to estimate the allowance for credit losses reflect management’s best estimate of model assumptions and forecasted conditions at that time. Changes in such estimates can significantly affect the allowance and provision for credit losses. It is possible and likely that we will experience credit losses that are different from our current estimates. Charge-offs are deducted from the allowance for credit losses when we judge the principal to be uncollectible, and subsequent recoveries are added to the allowance, generally at the time cash is received on a charged-off account.
The expected credit losses for unfunded commitments are measured over the contractual period of the Company’s exposure to credit risk. The estimate of credit loss incorporates assumptions for both the likelihood and amount of funding over the estimated life of the commitments, for the risk of loss, and current conditions and expectations. Management periodically reviews and updates its assumptions for estimated funding rates based on historical rates, and factors such as portfolio growth, changes to organizational structure, economic conditions, borrowing habits, or any other factor which could impact the likelihood that funding will occur. The Company does not reserve for unfunded commitments which are unconditionally cancellable.
Income Taxes
The Company and its subsidiaries file income tax returns in the U.S. federal jurisdiction, the Commonwealth of Massachusetts, the State of New Hampshire, the State of Maine, and other states as required. Income taxes are accounted for under the asset and liability method. Deferred tax assets and liabilities are reflected at currently enacted income tax rates applicable to the period in which the deferred tax assets or liabilities are expected to be realized or settled. As changes in tax laws or rates are enacted, deferred tax assets and liabilities are adjusted through the provision for income taxes.tax expense. Deferred tax assets are reviewed quarterly and reduced by a valuation allowance if, based upon the information available, it is more likely than not that some or all of the deferred tax assets will not be realized. Interest and penalties related to unrecognized tax benefits, if incurred, are recognized as a component of income tax expense.
Recent Accounting Developments
In June 2016, the FASB issued ASU 2016-13, “Financial Instruments - Credit Losses (Topic 326): Measurement of Credit Losses on Financial Instruments” (“ASU 2016-13”). ASU 2016-13 replaced the previous GAAP method of calculating credit losses. Previously, GAAP required the use of the incurred loss methodology, which used a higher threshold at which probable losses were calculated and recorded. ASU 2016-13 requires the use of an expected loss methodology, referred to as the current expected credit loss (“CECL”) methodology, which requires institutions to account for probable losses that previously would not have been part of the calculation. The CECL methodology incorporates future forecasting in addition to historical and current measures. For public entities that file with the SEC, ASU 2016-13 becomes effective for the fiscal years beginning after December 15, 2019, including interim periods within those fiscal years.
ASU 2016-13 must be applied to held to maturity (“HTM”) debt securities, available for sale (“AFS”) debt securities, and loans held for portfolio. A modified-retrospective approach will be applied cumulatively to retained earnings. Early adoption was permitted as of the fiscal years beginning after December 15, 2018. In November 2018, FASB issued ASU 2018-19 to clarify that operating lease receivables are not in scope of the credit losses standard. The Company will adopt ASU 2016-13 on January 1, 2020. The measurement of expected credit losses under the CECL methodology is applicable to financial assets measured at amortized cost, including loan receivables, and HTM debt securities.
CECL also applies to off-balance sheet credit exposure not accounted for as insurance (loan commitments, standby letters of credit, financial guarantees and other similar investment) and net investments in leases recognized by a lessor in accordance with Topic 842 on leases. In addition, ASU 2016-13 made changes to the accounting for AFS debt securities. One such change is to require credit losses to be presented as an allowance rather than as a write-down on AFS debt securities that management does not intend to sell or believes that is more likely than not they will be required to sell.
The Company assembled a cross-functional project team that met regularly to address the additional data requirements, to determine the approach for implementation and to identify new internal controls over enhanced accounting processes upon the adoption of ASU 2016-13. This included assessing the adequacy of existing loan and loss data, as well as assessing models for default and loss estimates.
The Company has completed the development of its CECL methodology. To estimate the allowance for loans and off-balance sheet credit exposures, such as unfunded loan commitments, the Company will utilize a discounted cash flow model that contains additional assumptions to calculate credit losses over the estimated life of financial assets and off-balance sheet credit exposures and will include the impact of forecasted economic conditions. The estimate will also include qualitative factors that may not be reflected in quantitatively derived results to ensure that the ACL reflects a reasonable estimate of current expected credit losses.
The project team completed limited “trial” runs and analytical reviews through the year ended December 31, 2019. The Company expects to complete independent model validation and to finalize its documentation of the new processes and controls in the first quarter of 2020.
Upon adoption of ASU 2016-13 on January 1, 2020, the Company currently expects to recognize a total increase in the allowance for credit loss for loans (a contra-asset) and for off-balance sheet credit exposures (a liability) in the range of $200,000 to $1.5 million, and a one-time cumulative-effect adjustment that decreases retained earnings in the range of $144,000 to $1.1 million (net of tax). The Company does not expect to record a reserve for its HTM debt securities. The adoption of ASU 2016-13 is not expected to have a material impact on our regulatory capital ratios.
See Note 3 – Recently Issued and Adopted Accounting Standards to the Auditedaudited Consolidated Financial Statements for additional details on other recently issued and adopted accounting pronouncements and their expected impact on the Company’s financial statements.
COVID-19
In December 2019, a novel strain of coronavirus was reported in Wuhan, China. The World Health Organization has declared the outbreak to constitute a “Public Health Emergency of International Concern.” The COVID-19 outbreak is disrupting supply chains and affecting production and sales across a range of industries.
The impact of the pandemic on the Company’s business, financial condition, results of operations, and its customers has not fully manifested in 2020. The fiscal stimulus and relief programs appear to have delayed any materially adverse financial impact to the Company. Once these stimulus programs have been exhausted, loan credit metrics may worsen and credit losses may ultimately materialize. The magnitude of future credit losses may be affected by the impact of COVID-19 on individuals and businesses in the long and short term. However, economic uncertainty remains high and bouts of elevated volatility are expected to continue, which may have a future adverse financial impact on the Company. The extent of the continued impact of COVID-19 on our operational and financial performance will depend on certain developments, including the duration and spread of the outbreak, impact on our customers, employees, and vendors all of which are uncertain and cannot be predicted. At this point, the extentPlease see Risk Factors above for more detail on risks related to which COVID-19 may impact our financial condition or results of operations is uncertain.COVID-19.
Results of Operations
Results of Operations for the years ended December 31, 2020 and 2019
General. Net income increased by $6.7 million, or 26.5%, to $32.0 million for the year ended December 31, 2020, from $25.3 million for the year ended December 31, 2019, primarily due to a $26.2 million increase in net interest and dividend income after the provision for credit losses and a $3.1 million increase in noninterest income. These increases were partially offset by a $19.9 million increase in noninterest expense and higher income tax expenses of $2.7 million. Diluted earnings per share were $5.03 for 2020, representing a 6.3% decrease over diluted earnings per share of $5.37 for 2019.
The results for the year ended December 31, 2020, included the merger accounting impact of the current expected credit loss accounting standard (“CECL”) within the provision for credit losses, merger expenses, office closures and related one-time occupancy expenses, and other non-operating items. Operating net income, excluding these items, was $43.9 million for the year ended December 31, 2020, an increase of $14.7 million, or 50.5%, as compared to operating net income of $29.2 million for 2019. Operating diluted earnings per share were $6.90 for 2020, representing an 11.3% increase over operating diluted earnings per share of $6.20 for 2019.
Net Interest and Dividend Income. Net interest and dividend income before provision for credit losses increased by $41.5 million, or 52.8%, to $120.2 million for the year ended December 31, 2020, as compared to $78.7 million for the year ended December 31, 2019, primarily due to loan growth (both organic and as a result of the Optima and Wellesley mergers), lower cost of funds, loan accretion associated with merger accounting and accelerated interest income from Payment Protection Program (“PPP”) loans forgiven during the year.
| • | Interest on loans increased by $35.4 million, or 41.6%, primarily due to merger related loan growth. |
| • | Interest on deposits decreased $8.3 million, or 53.4%, due to a decrease in interest rates paid on these deposits. |
Total average interest-earning assets increased by $850.7 million, or 34.6%, to $3.3 billion for the year ended December 31, 2020 from $2.5 billion in 2019. The Company’s net interest margin, on a fully tax equivalent basis, increased 43 basis points to 3.65% for the year ended December 31, 2020, as compared to 3.22% in 2019, and the net interest rate spread increased 59 basis points to 3.52% for the year ended December 31, 2020, as compared to 2.93% in 2019.
Interest and Dividend Income. Total interest and dividend income increased by $33.0 million, or 34.3%, to $129.4 million for the year ended December 31, 2020, from $96.3 million in 2019, primarily due to loan growth, as a result of the Optima and Wellesley mergers, loan accretion associated with merger accounting, and accelerated interest income from PPP loans forgiven during the year.
Interest Expense.Interest expense decreased by $8.5 million, or 48.2% to $9.1 million for the year ended December 31, 2020, from $17.6 million in 2019, primarily driven by a decrease in cost of deposits.
Average interest-bearing liabilities increased $487.7 million to $2.2 billion at December 31, 2020 from $1.7 billion at December 31, 2019, primarily related to the mergers with Optima and Wellesley coupled with organic core deposit growth. The average cost of funds decreased to 0.28% at December 31, 2020 from 0.72% at December 31, 2019. The increase in average interest-bearing liabilities was primarily driven by higher average savings account balances of $110.0 million, higher average money market accounts of $160.3 million, higher average certificates of deposits of $38.3 million, and higher average borrowed funds of $37.0 million.
Provision for Credit Losses. The Company recorded a provision for credit losses of $18.3 million for the year ended December 31, 2020, compared to a provision for loan losses of $3.0 million in 2019. The provision includes $9.4 million associated with the expected impact of the COVID-19 pandemic on future loan losses and $8.6 million for the recognition of the non-operating impact of the merger related CECL accounting. The Company recorded net charge-offs of $439,000 for the year ended December 31, 2020, as compared to net charge-offs of $1.6 million during the same period in 2019.
The allowance for credit losses was $36.0 million, or 1.14% of total loans outstanding at December 31, 2020, as compared to $18.2 million, or 0.82% of total loans outstanding at year end 2019.
Noninterest Income. Inclusive of the Wellesley merger, total noninterest income increased by $3.1 million, or 8.6%, to $39.5 million for the year ended December 31, 2020, as compared to $36.4 million for the same period in 2019, primarily as a result of higher Wealth Management revenue and higher gains on loans sold, partially offset by lower deposit and ATM related fees, lower loan related derivative income and other fee income. Total noninterest income was 24.7% of total revenue for the year ended December 31, 2020.
| • | Wealth Management revenue increased by $3.3 million, or 12.3%, for the year ended December 31, 2020, as compared to the year ended December 31, 2019, as a result of the Wellesley merger and appreciation in the equity markets during 2020. Assets Under Management combined with Assets Under Administration were $4.2 billion at December 31, 2020, as compared to $3.5 billion at December 31, 2019. |
| • | Gain on loans sold increased by $680,000 as compared to the same period in 2019 primarily due to increased sales of residential mortgage loans given the low-rate environment and active refinance market. |
| • | Deposit account fees decreased by $590,000, or 18.5%, for the year ended December 31, 2020 primarily as a result of lower transactional fee activity during the year. |
| • | Other income decreased $201,000 during the year ended December 31, 2020 primarily as a result of lower loan prepayment income during the year. |
| • | ATM/Debit card income decreased $105,000 during the year ended December 31, 2020 primarily as a result of the COVID-19 pandemic’s impact on transactions during 2020. |
| • | Loan related derivative income decreased $195,000 during the year ended December 31, 2020, primarily due to valuation adjustments associated with changes in interest rates on existing derivative transactions. |
The categories of Wealth Management revenues are shown in the following table:
| | For the Year Ended December 31, | |
| | 2020 | | | 2019 | |
| | (dollars in thousands) | |
Wealth Management revenues: | | | | | | | | |
Trust and investment advisory fees | | $ | 28,599 | | | $ | 25,544 | |
Financial planning fees and other service fees | | | 1,152 | | | | 955 | |
Total wealth management revenues | | $ | 29,751 | | | $ | 26,499 | |
The following table presents the changes in wealth management assets under management:
| | For the Year Ended December 31, | |
| | 2020 | | | 2019 | |
| | (dollars in thousands) | |
Wealth Management Assets under Management | | | | | | | | |
Balance at the beginning of the period | | $ | 3,287,371 | | | $ | 2,759,547 | |
Acquired wealth management assets | | | 338,676 | | | | — | |
Gross client asset inflows | | | 314,032 | | | | 343,477 | |
Gross client asset outflows | | | (383,059 | ) | | | (348,938 | ) |
Net market impact | | | 437,132 | | | | 533,285 | |
Balance at the end of the period | | $ | 3,994,152 | | | $ | 3,287,371 | |
Weighted average management fee | | | 0.81 | % | | | 0.84 | % |
There were no significant changes to the average fee rates and fee structure for the year ended December 31, 2020 and 2019.
Noninterest Expense. Total noninterest expense increased by $19.9 million, or 25.5%, to $98.1 million for the year ended December 31, 2020, as compared to $78.2 million for the year ended December 31, 2019. This increase was primarily driven by increases in salaries and employee benefits expense, merger and other non-operating expenses including branch and office closure related expense, occupancy and equipment expense, and data processing expenses resulting from our mergers with Optima in 2019 and Wellesley in 2020, as described below.
| • | Salaries and employee benefits increased $11.5 million, or 24.2%, primarily as a result of the increased staffing related to the mergers with Optima and Wellesley in 2019 and 2020, respectively, additions to support business initiatives, normal merit increases and higher employee benefit costs. |
| • | Non-operating expenses increased $2.9 million primarily due to merger expenses associated with the Wellesley merger and branch and office closure expenses of $1.2 million during the fourth quarter of 2020. |
Occupancy and equipment expense increased by $2.1 million, or 19.8%, primarily as a result of additional branches and office space as a result of the mergers with Optima and Wellesley.
| • | Data processing expense increased by $1.4 million, or 22.9%, primarily as a result of increased client activity associated with the mergers with Optima and Wellesley. |
Income Tax Expense. The Company recorded income tax expense of $11.4 million for the year ended December 31, 2020, as compared to $8.7 million for the same period in 2019. For the year ended December 31, 2020, the effective tax rate was 26.3%, as compared to 25.5% for the year ended December 31, 2019.
The Coronavirus Aid, Relief, and Economic Security (the “CARES Act”) was signed into law on March 27, 2020, to help stimulate the United States economy. One of the business tax provisions of the CARES Act included allowing net operating losses (“NOL”) generated by the Company in tax years 2018 and 2019 to be carried back up to five years at the tax rates in effect during those periods, rather than carried forward at current federal tax rates of 21%. The effect of the Act allowed the Company to recognize lower tax expense associated with NOL carryforwards from 2018 and 2019 (as a result of the Optima merger) and resulted in a benefit of $539,000.
Results of Operations for the years ended December 31, 2019 and 2018
General. Net income increased by $1.4 million, or 5.8%, to $25.3 million for the year ended December 31, 2019, from $23.9 million for the year ended December 31, 2018, primarily due to a $13.6 million increase in net interest and dividend income after the provision for loan losses and a $3.4 million increase in noninterest income .income. These increases were partially offset by a $14.2 million increase in noninterest expense and higher provision for income taxes of $1.5 million. Diluted earnings per share were $5.37 for 2019, representing a 6.9% decrease over diluted earnings per share of $5.77 for 2018. Net income for 2019 included non-operating expenses of $4.7 million related to costs associated with the Company’s December common stock offering and merger related expenses resulting from the completed merger with Optima Bank & Trust Company (“Optima”) and the pending merger with Wellesley Bancorp, Inc. (“Wellesley”).Wellesley.
Excluding non-operating expenses, operating net income was $29.2 million for the year ended December 31, 2019, an increase of $5.1 million, or 21.4%, as compared to operating net income of $24.0 million for 2018. Operating diluted earnings per share were $6.20 for 2019, representing a 7% increase over operating diluted earnings per share of $5.80 for 2018.
Net Interest and Dividend Income. Net interest and dividend income before provision for loan losses increased by $15.1 million, or 23.8%, to $78.7 million for the year ended December 31, 2019, as compared to $63.6 million for the year ended 2018, primarily due to loan growth, both organic and as a result of the Optima merger and higher levels of interest-earning assets.
Interest on loans increased by $26.7 million, or 45.7%, primarily due to organic loan growth and the impact of loan balances acquired related to the Optima merger.
| • | Interest on loans increased by $26.7 million, or 45.7%, primarily due to organic loan growth and the impact of loan balances acquired related to the Optima merger. |
Interest on deposits increased $10.6 million, or 211.4%, due to an increase in cost primarily as a result of the impact of the cost of deposits acquired from our merger with Optima and growth within our higher cost savings products.
| • | Interest on deposits increased $10.6 million, or 211.4%, due to an increase in cost primarily as a result of the impact of the cost of deposits acquired from our merger with Optima and growth within our higher cost savings products. |
Total average interest-earning assets increased by $532.0 million, , or 27.7%, to $2.5 billion for the year ended December 31, 2019 from $1.9 billion in 2018. The Company’s net interest margin, on a fully tax equivalent basis, decreased 11 basis points to 3.22% for the year ended December 31, 2019, as compared to 3.33% in 2018, and the net interest rate spread decreased 26 basis points to 2.93% for the year ended December 31, 2019, as compared to 3.19% in 2018.
Interest and Dividend Income. Total interest and dividend income increased by $27.3 million, or 39.5%, to $96.3 million for the year ended December 31, 2019, from $69.1 million in 2018, primarily due to a $26.7 million increase in interest income on loans.
Interest Expense.Interest expense increased by $12.2 million, or 222.7% to $17.6 million for the year ended December 31, 2019, from $5.5 million in 2018, primarily as a result of the impact of the cost of deposits acquired from our merger with Optima and growth within our higher cost savings products.
Average interest-bearing liabilities increased $462.6 million to $1.7 billion at December 31, 2019 from $1.3 billion, which contributed to a 44 basis points increase in the average cost of funds of 0.72% from 0.28%. The increase in average interest-bearing liabilities was primarily driven by higher average savings account balances of $202.9 million, higher average money market accounts of $96.4 million, higher average certificates of deposits of $87.3 million, and higher average other borrowed funds of $68.0 million.
Provision for Loan Losses. The Company recorded a provision for loan losses of $3.0 million for the year ended December 31, 2019, compared to a provision for loan losses of $1.5 millionin 2018. The increase is the result of strong loan growth and a $1.2 million charge-off on an acquired commercial real estate loan during the third quarter of 2019. The charge-off was taken upon receipt of information indicating misstatements of fact and potential borrower fraud. We believe this to be an isolated incident and do not have any additional exposure to the borrower. We recorded net charge-offs of $1.6 million for the year ended December 31, 2019, as compared to net charge-offs of $54,000 during the same period in 2018. The allowance for loan losses was$18.2 million, or 0.82% of total loans outstanding at December 31, 2019, as compared to $16.8 million, or 1.08% of total loans outstanding at year end 2018.
Noninterest Income. Noninterest income increased by $3.4 million, or 10.3%, to $36.4 million for the year ended December 31, 2019, as compared to $33.0 million for the same period in 2018, primarily as a result of higher Wealth Management revenue, higher gains on loans sold and higher loan prepayment income. Total noninterest income was 31.6% of total revenue for the year ended December 31, 2019.
Wealth Management revenue increased by $1.3 million, or 5.2%, for the year ended December 31, 2019, as compared to the year ended December 31, 2018, due to higher average assets under management during the period and higher average fees. Assets under Management combined with Assets under Administration were $3.5 billion at December 31, 2019, as compared to $2.9 billion at December 31, 2018.
| • | Wealth Management revenue increased by $1.3 million, or 5.2%, for the year ended December 31, 2019, as compared to the year ended December 31, 2018, due to higher average assets under management during the period and higher average fees. Assets under Management combined with Assets under Administration were $3.5 billion at December 31, 2019, as compared to $2.9 billion at December 31, 2018. |
Gain on loans sold increased by $1.1 million as compared to the same period in 2018 primarily due to the sale of residential mortgages totaling $90.0 million during 2019.
| • | Gain on loans sold increased by $1.1 million as compared to the same period in 2018 primarily due to the sale of residential mortgages totaling $90.0 million during 2019. |
Other income increased $658,000 during the year ended 2019 primarily as a result of higher loan prepayment income during the year.
| • | Other income increased $658,000 during the year ended 2019 primarily as a result of higher loan prepayment income during the year. |
The categories of Wealth Management revenues are shown in the following table:
| | For the Year Ended December 31, | | | For the Year Ended December 31, | |
| | 2019 | | | 2018 | | | 2019 | | | 2018 | |
| | (dollars in thousands) | | | (dollars in thousands) | |
Wealth Management revenues: | | | | | | | | | | | | | | | | |
Trust and investment advisory fees | | $ | 25,544 | | | $ | 24,126 | | | $ | 25,544 | | | $ | 24,126 | |
Asset-based revenues | | | 25,544 | | | | 24,126 | | |
Financial planning fees and other service fees | | | 955 | | | | 1,065 | | | | 955 | | | | 1,065 | |
Total wealth management revenues | | $ | 26,499 | | | $ | 25,191 | | | $ | 26,499 | | | $ | 25,191 | |
The following table presents the changes in wealth management assets under management:
| | For the Year Ended December 31, | |
| | 2019 | | | 2018 | |
| | (dollars in thousands) | |
Wealth Management Assets under Management | | | | | | | | |
Balance at the beginning of the period | | $ | 2,759,547 | | | $ | 2,971,322 | |
Gross client asset inflows | | | 343,477 | | | | 313,629 | |
Gross client asset outflows | | | (348,938 | ) | | | (490,094 | ) |
Net market impact | | | 533,285 | | | | (35,310 | ) |
Balance at the end of the period | | $ | 3,287,371 | | | $ | 2,759,547 | |
Weighted average management fee | | | 0.84 | % | | | 0.81 | % |
There were no significant changes to the average fee rates and fee structure for the year ended December 31, 2019 and 2018.
Noninterest Expense. Noninterest expense increased by $14.2 million, or 22.2%, to $78.2 million for the year ended December 31, 2019, as compared to $64.0 million for the year ended December 31, 2018, primarily driven by an increase in non-operating expenses, salaries and employee benefit expense, occupancy and equipment expense, data processing fees, and professional service fees. The increase to noninterest expense was partially offset by lower marketing, and FDIC insurance expenses.
| • | Non-operating expense of $4.7 million were primarily related to professional fees, compensation and severance payments, and contract termination costs associated with the Optima merger combined with expenses associated with the pending Wellesley merger and the December 2019 common equity offering. |
Non-operating expense of $4.7 million were primarily related to professional fees, compensation and severance payments, and contract termination costs associated with the Optima merger combined with expenses associated with the pending Wellesley merger and the December 2019 common equity offering.
| • | Salaries and employee benefit increases of $6.3 million were primarily the result of the merger with Optima, increased staffing to support business initiatives, and higher employee benefit costs. |
Salaries and employee benefit increases of $6.3 million were primarily the result of the merger with Optima, increased staffing to support business initiatives, and higher employee benefit costs.
| • | Occupancy and equipment expense increases of $1.8 million were primarily due to the merger with Optima and additional office space in Boston, Massachusetts. |
Occupancy and equipment expense increases of $1.8 million were primarily due to the merger with Optima and additional office space in Boston, Massachusetts.
Data processing expense increases of $1.1 million were primarily due to increased transaction volume related to the merger with Optima and investments made in technology.
| • | Data processing expense increases of $1.1 million were primarily due to increased transaction volume related to the merger with Optima and investments made in technology. |
Income Tax Expense. The Company recorded a provision for income taxestax expense of $8.7 million for the year ended December 31, 2019, as compared to $7.2 million for the same period in 2018, reflecting effective tax rates of 25.5% and 23.2%, respectively. The increase in the effective tax rate was primarily driven by the costs associated with the Optima merger, the pending Wellesley merger and the common stock offering completed during the fourth quarter of 2019, as some of these items were nondeductible for tax purposes.
Results of Operations for the years ended December 31, 2018 and 2017
General. Net income increased by $9.1 million, or 61.2%, to $23.9 million for the year ended December 31, 2018, from $14.8 million for the year ended December 31, 2017, primarily due to a $4.8 million increase in net interest and dividend income after the provision for loan losses, a $2.8 million increase in noninterest income, and lower income tax expense of $6.2 million. These increases were partially offset by a $4.7 million increase in noninterest expense. The reduction in income tax expense was mainly due to the enactment of the Tax Cuts and Jobs Act of 2017, which required a one-time non-cash write-down of our net deferred tax assets of $3.9 million in 2017 and reduced the Company’s statutory federal tax rate from 35% to 21% effective in 2018.
Net Interest and Dividend Income. Net interest and dividend income after provision for loan losses increased by $4.8 million, or 8.5% to $62.1 million for the year ended December 31, 2018, from $57.2 million for the year ended 2017. The increase was driven by a combination of the impact of rising interest rates and earning asset growth. Interest on loans increased by $6.6 million, or 12.7% for the year ended December 31, 2018, as compared to the same period in 2017. Total average interest-earning assets increased $106.1 million, or 5.8%, to $1.9 billion for the year ended December 31, 2018 from $1.8 billion in 2017. The Company’s net interest margin, on a fully tax equivalent basis, increased eight basis points to 3.33% for the year ended December 31, 2018, as compared to 3.25% in 2017, and the net interest rate spread increased three basis points to 3.19% for the year ended December 31, 2018, as compared to 3.16% in 2017.
Interest and Dividend Income. Total interest and dividend income increased by $7.9 million, or 12.9%, to $69.1 million for the year ended December 31, 2018, from $61.2 million in 2017, primarily due to a $6.6 million increase in interest income on loans and a $940,000 increase in interest income on investment securities.
Interest Expense. Interest expense increased by $1.9 million, or 52.4% to $5.5 million for the year ended December 31, 2018, from $3.6 million in 2017, primarily due to a combination of higher interest rates and higher average interest-bearing liabilities. Average cost of funds increased eight basis points to 0.28% for the year ended December 31, 2018, from 0.20% in 2017. Average interest bearing liabilities increased $42.6 million to $1.3 billion at December 31, 2018, primarily driven by an increase in average savings account balances of $52.8 million, higher average money market accounts of $24.6 million, higher average checking accounts of $15.0 million, partially offset by lower average certificates of deposits of $32.4 million, and lower average other borrowed funds of $17.4 million. We experienced an increase in the average cost of savings and money market accounts during 2018, as the Company continues to offer competitively priced products to attract new clients and deepen existing client relationships.
Provision for Loan Losses. The Company recorded a provision for loan losses of $1.5 million for the year ended December 31, 2018, compared to a provision for loan losses of $362,000 in 2017. The increase in the provision was primarily driven by strong loan growth during the year totaling $208.9 million. We recorded net charge-offs of $54,000 for the year ended December 31, 2018, as compared to net charge-offs of $303,000 during the same period in 2017. The allowance for loan losses was $16.8 million, or 1.08% of total loans outstanding at December 31, 2018, as compared to $15.3 million, or 1.13% of total loans outstanding at year end 2017.
Noninterest Income. Noninterest income increased by $2.8 million, or 9.1%, to $33.0 million for the year ended December 31, 2018, as compared to $30.2 million for the same period in 2017, primarily as a result of higher wealth management revenue and higher loan related derivative income associated with the Company’s interest rate risk strategy. Noninterest income was 34.2% of total revenue for the year ended December 31, 2018. The Company’s wealth management revenue is the largest component of noninterest income and increased by $2.2 million, or 9.4%, to $25.2 million for the year ended 2018, as compared $23.0 million in 2017, due to higher average assets under management during the period. Assets under Management combined with Assets under Administration were $2.9 billion at December 31, 2018, as compared to $3.1 billion at December 31, 2017. Loan related derivative income increased $871,000 for the year ended December 31, 2018, as compared to the same period in 2017, due to the volume of loan related derivative transactions executed in 2018.
The categories of Wealth Management revenues are shown in the following table:
| | For the Year Ended December 31, | |
| | 2018 | | | 2017 | |
| | (dollars in thousands) | |
Wealth Management revenues: | | | | | | | | |
Trust and investment advisory fees | | $ | 24,126 | | | $ | 21,850 | |
Asset-based revenues | | | 24,126 | | | | 21,850 | |
Financial planning fees and other service fees | | | 1,065 | | | | 1,179 | |
Total wealth management revenues | | $ | 25,191 | | | $ | 23,029 | |
The following table presents the changes in wealth management assets under management:
| | For the Year Ended December 31, | |
| | 2018 | | | 2017 | |
| | (dollars in thousands) | |
Wealth management assets under management | | | | | | | | |
Balance at the beginning of the period | | $ | 2,971,322 | | | $ | 2,572,760 | |
Gross client asset inflows | | | 313,629 | | | | 445,125 | |
Gross client asset outflows | | | (490,094 | ) | | | (371,274 | ) |
Net market impact | | | (35,310 | ) | | | 324,711 | |
Balance at the end of the period | | $ | 2,759,547 | | | $ | 2,971,322 | |
Weighted average management fee | | | 0.81 | % | | | 0.80 | % |
There were no significant changes to the average fee rates and fee structure for the year ended December 31, 2018 and 2017.
Noninterest Expense. Noninterest expense increased by $4.7 million, or 7.9%, to $64.0 million for the year ended December 31, 2018, as compared to $59.3 million in 2017, primarily driven by increases in salaries and employee benefits expense, marketing expense, data processing expense, and merger related expenses. The increase in salaries and employee benefits expense of $4.8 million was driven by the combination of increased staffing to support business initiatives, higher employee benefit costs including performance-based equity compensation, and the adoption of ASU 2017-07 for the presentation of net periodic pension costs and net periodic postretirement benefit costs in 2018. The retrospective application of ASU 2017-07 for the twelve months ended December 31, 2017 resulted in a decrease in salaries and employee benefits and an increase in other expenses of approximately $252,000. The increase of $609,000 in marketing was due to costs related to the Bank’s rebranding efforts, which included the development of a new brand, website, and advertising campaign. The increase of $221,000 in data processing expense was due to investments made in technology. The merger expenses of $201,000 were professional services related to the pending acquisition of Optima.
Noninterest expense increases were partially offset by lower other expenses of $880,000, primarily due to the other components of net periodic pension cost, and net periodic postretirement benefit cost recorded in other expenses for the twelve months ended December 31, 2018, as compared to the twelve months ended December 31, 2017.
Income Tax Expense. In accordance with the Tax Cuts and Jobs Act of 2017, the Company’s federal statutory corporate tax rate decreased from 35% to 21% effective January 1, 2018. The Company recorded a provision for income taxes of $7.2 million for the year ended December 31, 2018, as compared to $13.4 million for the same period in 2017, reflecting effective tax rates of 23.2% and 47.4%, respectively.
Changes in Financial Condition
Total Assets. Inclusive of the merger with OptimaWellesley and organic growth, total assets increased $754.2 million,$1.1 billion, or 35.9%38.3%, from December 31, 20182019 and were $2.9$3.9 billion as of December 31, 2019. 2020. The increase was primarily the result of a $667.0$926.9 million increase in total loans, an increase of $86.2 million in investment securities, an increase in goodwill of $20.7 million associated with the Wellesley merger, and a $42.9$14.5 million increase in cash and cash equivalents, right-of-use assets of $33.6 million associated with the Company’s operating leases, goodwill of $30.8 million associated with the Optima merger, partially offset by lower investment securities of $52.5 million.
Cash and Cash Equivalents. Cash and cash equivalents increased by $42.9 million to $61.3 million at December 31, 2019, from $18.5 million at December 31, 2018.equivalents.
Investment Securities. The carrying value of total investment securities decreasedincreased by $52.5$86.2 million to $484.7 million at December 31, 2020, from $398.5 million at December 31, 2019, from $451.0 million at December 31, 2018, as cash flows were used to reduce wholesale funding.the Company invested excess cash.
Loans.Inclusive of the Wellesley merger, with Optima and organic growth, total loans increased by $667.0$926.9 million, or 42.8%41.6%, to $3.2 billion at December 31, 2020, from $2.2 billion at December 31, 2019, from $1.6 billion at December 31, 2018.
2019. Residential real estate loans increased $313.2$381.3 million to $1.3 billion at December 31, 2020, from $917.6 million at December 31, 2019, from $604.3 million at December 31, 2018.2019.
| • | Commercial real estate loans increased $298.4 million to $1.4 billion at December 31, 2020, from $1.1 billion at December 31, 2019. |
Commercial real estate loans increased $302.6 million to $1.1 billion at December 31, 2019, from $758.0 million at December 31, 2018.
| • | Commercial & industrial loans increased $214.6 million to $347.9 million at December 31, 2020, from $133.2 million at December 31, 2019. |
Commercial & industrial loans increased $39.5 million to $133.2 million at December 31, 2019, from $93.7 million at December 31, 2018.
| • | Loans under the Small Business Administration’s (“SBA”) Paycheck Protection Program (“PPP”) amounted to $124.2 million at December 31, 2020. PPP loans are included in commercial & industrial loans. |
Excluding the impact of the Wellesley merger with Optima, organic loan growth during 2019 consisted of:
Commercial real estateand PPP loans, increased $188.3total loans decreased by $35.0 million, or 24.8%1.6%, from December 31, 2018.2019.
Commercial and industrial loans increased $9.3 million, or 9.9%, from December 31, 2018.
| •
| Residential mortgage loans decreased $1.3 million from December 31, 2018. The Company had total residential mortgage loan sales of $90.0 million of residential mortgages in 2019.
|
For further details, see the Organic“Organic Loan and Deposit GrowthGrowth” table at the end of this section.
Bank-Owned Life Insurance. The Company invests in bank-owned life insurance to help offset the costs of our employee benefit plan obligations. Bank-owned life insurance also generally provides noninterest income that is nontaxable. At December 31, 2019,2020, our investment in bank-owned life insurance was $37.3$46.2 million, a $6.4an $8.9 million increase from $30.9$37.3 million at December 31, 2018,2019, primarily due to additionalnew policies associated withacquired as a result of the OptimaWellesley merger.
Goodwill and merger relatedMerger Related intangibles. The Company recorded additional goodwill of $30.8 million and other merger related intangibles of $3.6$20.7 million during the second quarter of 2019,2020 due to the merger with Optima.Wellesley merger. Goodwill and merger related intangible assets were $31.2totaled $54.9 million and $3.3 million, respectively, at December 31, 2019.
Right of use assets. At December 31, 2019, the Company had right-of-use assets related to its operating leases of $33.6 million due to the adoption of new lease accounting guidance in 2019.2020.
Other assets. Assets. Other assets increased $14.7$40.9 million, or 53.1%,96.8% to $83.2 million at December 31, 2020 from $42.3 million at December 31, 2019, from $27.6 million at December 31, 2018, primarily due to an increase inhigher loan related derivative assets and retirement plan assets.at December 31, 2020.
Deposits. Inclusive of Optima, totalTotal deposits grewincreased by $547.5 million,$1.0 billion, or 30.2%44.3%, to $3.4 billion at December 31, 2020, from $2.4 billion at December 31, 2019, from $1.8 billion at December 31, 2018, primarily driven by a combination of the impact of the OptimaWellesley merger and organic core deposit growth.
Core deposits, which the Company defines as all deposits other than certificates of deposit, increased by $486.6 million, or 28.8%, to $2.2 billion from $1.7 billion at December 31, 2018.
| • | Core deposits, which the Company defines as all deposits other than certificates of deposit, increased by $971.7 million, or 44.6%, to $3.1 billion from $2.2 billion at December 31, 2019. |
Excluding the impact of the Optima merger, organic growth in core deposits was $172.0 million, or 10.2%, at December 31, 2019. Growth in core deposits during 2019 was attributable to successful deposit campaigns, as we strived to attract and deepen client relationships.
The cost of total deposits for the year ended December 31, 2019 was 0.70%, as compared to 0.28% for the same period in 2018, driven by the impact of higher deposit rates associated with the Optima merger and the promotional deposit campaigns described above.
| • | Excluding the impact of the Wellesley merger, organic growth in core deposits was $422.9 million, or 19.4%, as of December 31, 2020. |
Certificates of deposit, which totaled $254.8 million at December 31, 2020, increased by $72.5 million from $182.3 million at December 31, 2019, increased by $60.9 million from $121.4 million at December 31, 2018, primarily due to the merger with Optima.impact of the Wellesley merger. Total brokered certificates of deposit, which are included within certificates of deposit, were $7.1$30.8 million and $27.5$7.1 million at December 31, 20192020 and December 31, 2018,2019, respectively.
For further details on the loans and deposits acquired, see the Organic“Organic Loan and Deposit GrowthGrowth” table provided at the end of this section.
Borrowings. At December 31, 2019,2020, borrowings consisted of advances from the FHLB of Boston. Total borrowings increased $42.3decreased $102.7 million, or 75.7%, to $33.0 million at December 31, 2020, from $135.7 million at December 31, 2019 from $93.4as the Company utilized excess cash to pay down borrowings. Additionally, during the fourth quarter of 2020, the Company redeemed $10.0 million in subordinated debt, bearing a 6.0% coupon, assumed as part of the Wellesley merger.
Shareholders’ Equity. Total shareholders’ equity increased $115.2 million, or 40.2%, to $401.7 million at December 31, 2018 as the Company utilized short-term borrowings to fund loan growth.
Shareholders’ Equity. Total shareholders’ equity increased $119.5 million, or 71.6%, to2020, from $286.6 million at December 31, 2019, from $167.0 million at December 31, 2018, primarily due to net income of $25.3 million, $59.4$87.2 million of equity increaseissued as a result of the OptimaWellesley merger, $38.2net income of $32.0 million, (netbefore tax-effect increases in the value of underwriting fees) from the Company’s fourth quarter 2019 common stock offering,interest rate derivative positions of $4.7 million, and stock-based compensation during 2019. Increasesbefore tax-effect increases in equity wereunrealized gains on the available for sale investment portfolio of $3.6 million, partially offset by regular dividend payments of $9.5$13.1 million paid during the year.
The Company’s ratio of tangible common equity to tangible assets increased 12.6%, to 8.93%,was 8.91% at December 31, 2019 from 7.93%2020, as compared to 8.93% at December 31, 2018, primarily due to receipt of proceeds from the December 2019 equity offering, partially offset by growth and the impact of goodwill and acquisition related intangibles recorded as a result of the merger with Optima.2019. Tangible book value per share grewincreased by $6.09,$3.41, or 15.0%7.3%, to $50.07 as of December 31, 2020, as compared to $46.66 as of December 31, 2019, as compared to $40.57 as of December 31, 2018.2019.
Organic Loan and Deposit Growth (dollars in thousands)
| | | | | | | | | | | | | | December 2018 vs December 2019 | | | | | | | | | | | | | | | | | | | | | |
| | December 31, | | | December 31, | | | Balance | | | Organic | | | Organic | | | | | | | | | | | | | | | December 2020 vs December 2019 | |
| | 2019 | | | 2018 | | | Acquired | | | Growth/(Loss) $ | | | Growth/(Loss) % | | | December 31, 2020 | | | December 31, 2019 | | | Balance Acquired | | | Organic Growth/(Decline) $ | | | Organic Growth/(Decline) % | |
Loans | | | | | | | | | | | | | | | | | | | | | | | | | | | | | | | | | | | | | | | | |
Residential mortgage | | $ | 917,566 | | | $ | 604,331 | | | $ | 314,552 | | | $ | (1,317 | ) | | (0.2%) | | | $ | 1,298,868 | | | $ | 917,566 | | | $ | 403,855 | | | $ | (22,553 | ) | | (2.5%) | |
Commercial mortgage | | | 1,060,574 | | | | 757,957 | | | | 114,338 | | | | 188,279 | | | 24.8% | | | | 1,358,962 | | | | 1,060,574 | | | | 290,909 | | | | 7,479 | | | 0.7% | |
Home equity | | | 80,675 | | | | 69,336 | | | | 15,452 | | | | (4,113 | ) | | (5.9%) | | | | 106,194 | | | | 80,675 | | | | 36,213 | | | | (10,694 | ) | | (13.3%) | |
Commercial & Industrial | | | 133,236 | | | | 93,712 | | | | 30,215 | | | | 9,309 | | | 9.9% | | | | 223,654 | | | | 133,236 | | | | 106,664 | | | | (16,246 | ) | | (12.2%) | |
Consumer | | | 34,677 | | | | 34,436 | | | | 849 | | | | (608 | ) | | (1.8%) | | | | 41,769 | | | | 34,677 | | | | 103 | | | | 6,989 | | | 20.2% | |
Total loans excluding PPP loans | | | $ | 3,029,447 | | | $ | 2,226,728 | | | $ | 837,744 | | | $ | (35,025 | ) | | (1.6%) | |
PPP Loans (1) | | | | 124,201 | | | | — | | | | 32,289 | | | | 91,912 | | | | — | |
Total loans | | $ | 2,226,728 | | | $ | 1,559,772 | | | $ | 475,406 | | | $ | 191,550 | | | 12.3% | | | $ | 3,153,648 | | | $ | 2,226,728 | | | $ | 870,033 | | | $ | 56,887 | | | 2.6% | |
Deposits | | | | | | | | | | | | | | | | | | | | | | | | | | | | | | | | | | | | | | | | |
Demand | | $ | 630,593 | | | $ | 494,492 | | | $ | 58,722 | | | $ | 77,379 | | | 15.6% | | | $ | 1,006,132 | | | $ | 630,593 | | | | 175,912 | | | $ | 199,627 | | | 31.7% | |
Interest bearing checking | | | 450,098 | | | | 431,702 | | | | 49,454 | | | | (31,058 | ) | | (7.2%) | | | | 625,650 | | | | 450,098 | | | | 49,944 | | | | 125,608 | | | 27.9% | |
Money market | | | 181,406 | | | | 135,585 | | | | 68,183 | | | | (22,362 | ) | | (16.5%) | | | | 532,218 | | | | 181,406 | | | | 250,226 | | | | 100,586 | | | 55.4% | |
Savings | | | 914,499 | | | | 628,212 | | | | 138,285 | | | | 148,002 | | | 23.6% | | | | 984,262 | | | | 914,499 | | | | 72,700 | | | | (2,937 | ) | | (0.3%) | |
Core deposits | | | 2,176,596 | | | | 1,689,991 | | | | 314,644 | | | | 171,961 | | | 10.2% | | | | 3,148,262 | | | | 2,176,596 | | | | 548,782 | | | | 422,884 | | | 19.4% | |
Certificates of deposit | | | 182,282 | | | | 121,419 | | | | 162,545 | | | | (101,682 | ) | | (83.7%) | | | | 254,821 | | | | 182,282 | | | | 212,096 | | | | (139,557 | ) | | (76.6%) | |
Total deposits | | $ | 2,358,878 | | | $ | 1,811,410 | | | $ | 477,189 | | | $ | 70,279 | | | 3.9% | | | $ | 3,403,083 | | | $ | 2,358,878 | | | $ | 760,878 | | | $ | 283,327 | | | 12.0% | |
(1) | PPP loans are included within Commercial & Industrial on the face of the Balance Sheet. |
GAAP to Non-GAAP Reconciliations (dollars in thousands except per share data)
Statement on Non-GAAP Measures: The Company believes the presentation of the following non-GAAP financial measures provides useful supplemental information that is essential to an investor’s proper understanding of the results of operations and financial condition of the Company. Management uses non-GAAP financial measures in its analysis of the Company’s performance. These non-GAAP measures should not be viewed as substitutes for the financial measures determined in accordance with GAAP, nor are they necessarily comparable to non-GAAP performance measures that may be presented by other companies.
| | For the Year Ended December 31, | |
Operating Net Income / Operating Diluted EPS | | 2019 | | | 2018 | | | 2017 | | | 2016 | | | 2015 | |
| (in thousands, except share data) | | | | | | | | | | | | | |
| | | | | | | | | | | | | | | | | | | | |
Net Income (a GAAP measure) | | $ | 25,257 | | | $ | 23,881 | | | $ | 14,816 | | | $ | 16,896 | | | $ | 15,694 | |
Add: Merger and Capital Raise Expenses (Pretax) | | | 4,721 | | | | 201 | | | | — | | | | — | | | | — | |
Add: (Gain)/loss on disposition of investment securities | | | 79 | | | | (2 | ) | | | 3 | | | | — | | | | — | |
Tax effect of Merger and Capital Raise Expenses, and Gain (loss) on disposition of investment securities(1) | | | (901 | ) | | | (56 | ) | | | (1 | ) | | | — | | | | — | |
Add: Impact of the tax cuts and jobs act of 2017(2) | | | — | | | | — | | | | 3,869 | | | | — | | | | — | |
Operating Net Income (a non-GAAP measure) | | $ | 29,156 | | | $ | 24,024 | | | $ | 18,687 | | | $ | 16,896 | | | $ | 15,694 | |
Less: Dividends and Undistributed Earnings Allocated to Participating Securities (GAAP) | | | (243 | ) | | | (239 | ) | | | (157 | ) | | | (181 | ) | | | — | |
Operating Income Applicable to Common Shareholders (a non-GAAP measure) | | $ | 28,913 | | | $ | 23,785 | | | $ | 18,530 | | | $ | 16,715 | | | $ | 15,694 | |
Weighted Average Diluted Shares | | | 4,661,720 | | | | 4,098,633 | | | | 4,065,754 | | | | 4,028,944 | | | | 3,993,599 | |
Operating Diluted earnings per share (a non-GAAP measure) | | $ | 6.20 | | | $ | 5.80 | | | $ | 4.56 | | | $ | 4.15 | | | $ | 3.93 | |
| | For the Years Ended December 31, | |
Operating Net Income / Operating Diluted Earnings Per Share | | 2020 | | | 2019 | | | 2018 | | | 2017 | | | 2016 | |
| | | | | | | | | | | | | | | | | | | | |
| | | | | | | | | | | | | | | | | | | | |
Net Income (a GAAP measure) | | $ | 31,959 | | | $ | 25,257 | | | $ | 23,881 | | | $ | 14,816 | | | $ | 16,896 | |
Add: Merger and Capital issuance expenses | | | 6,368 | | | | 4,721 | | | | 201 | | | | — | | | | — | |
Add: (Gain) Loss on disposition of investment securities | | | (69 | ) | | | 79 | | | | (2 | ) | | | 3 | | | | — | |
Add: Provision established for acquired Wellesley loans | | | 8,638 | | | | — | | | | — | | | | — | | | | — | |
Add: Branch and office closure expenses | | | 1,244 | | | | — | | | | — | | | | — | | | | — | |
Add: Impact of the Tax Cuts and Jobs Act of 2017(1) | | | — | | | | — | | | | — | | | | 3,869 | | | | — | |
Tax effect of non-operating adjustments(2) | | | (4,270 | ) | | | (901 | ) | | | (56 | ) | | | (1 | ) | | | — | |
Operating Net Income (a non-GAAP measure) | | $ | 43,870 | | | $ | 29,156 | | | $ | 24,024 | | | $ | 18,687 | | | $ | 16,896 | |
Less: Dividends and Undistributed Earnings Allocated to Participating Securities (GAAP) | | | (64 | ) | | | (243 | ) | | | (239 | ) | | | (157 | ) | | | (181 | ) |
Operating Income Applicable to Common Shareholders (a non-GAAP measure) | | $ | 43,806 | | | $ | 28,913 | | | $ | 23,785 | | | $ | 18,530 | | | $ | 16,715 | |
Weighted Average Diluted Shares | | | 6,344,409 | | | | 4,661,720 | | | | 4,098,633 | | | | 4,065,754 | | | | 4,028,944 | |
Operating Diluted Earnings Per Share (a non-GAAP measure) | | $ | 6.90 | | | $ | 6.20 | | | $ | 5.80 | | | $ | 4.56 | | | $ | 4.15 | |
| | | | | | | | | | | | | | | | | | | | |
(1) | Income adjustment related to the re-measurement of net deferred tax assets due to the Tax Cuts and Jobs Act. |
(2) | The net tax benefit associated with non-operating items is determined by assessing whether each noncore item is included or excluded from net taxable income and applying the Company’s combined marginal tax rate to only those items included in net taxable income. |
(2)
| Income tax adjustment related to the re-measurement of net deferred tax assets due to the Tax Cuts and Jobs Act.
|
The following tables summarize the calculation of the Company’s tangible common equity ratio and tangible book value per share for the periods indicated:
| | December 31, 2019 | | | December 31, 2018 | | | December 31, 2017 | | | December 31, 2016 | | | December 31, 2015 | | | December 31, 2020 | | | December 31, 2019 | | | December 31, 2018 | | | December 31, 2017 | | | December 31, 2016 | | |
| | (in thousands, except share data) | | | (in thousands, except share data) | | |
Tangible Common Equity: | | | | | | | | | | | | | | | | | | | | | | | | | | | | | | | | | | | | | | | | | |
Shareholders' equity (GAAP) | | $ | 286,561 | | | $ | 167,026 | | | $ | 147,957 | | | $ | 134,671 | | | $ | 125,063 | | | $ | 401,732 | | | $ | 286,561 | | | $ | 167,026 | | | $ | 147,957 | | | $ | 134,671 | | |
Less: Goodwill and acquisition related intangibles (GAAP) | | | (34,544 | ) | | | (412 | ) | | | (412 | ) | | | (412 | ) | | | (412 | ) | | | (54,889 | ) | | | (34,544 | ) | | | (412 | ) | | | (412 | ) | | | (412 | ) | |
Tangible Common Equity (a non-GAAP measure) | | | 252,017 | | | | 166,614 | | | | 147,545 | | | | 134,259 | | | | 124,651 | | | | 346,843 | | | | 252,017 | | | | 166,614 | | | | 147,545 | | | | 134,259 | | |
Total assets (GAAP) | | | 2,855,563 | | | | 2,101,384 | | | | 1,949,934 | | | | 1,848,999 | | | | 1,706,201 | | | | 3,949,297 | | | | 2,855,563 | | | | 2,101,384 | | | | 1,949,934 | | | | 1,848,999 | | |
Less: Goodwill and acquisition related intangibles (GAAP) | | | (34,544 | ) | | | (412 | ) | | | (412 | ) | | | (412 | ) | | | (412 | ) | | | (54,889 | ) | | | (34,544 | ) | | | (412 | ) | | | (412 | ) | | | (412 | ) | |
Tangible assets (a non-GAAP measure) | | $ | 2,821,019 | | | $ | 2,100,972 | | | $ | 1,949,522 | | | $ | 1,848,587 | | | $ | 1,705,789 | | | $ | 3,894,408 | | | $ | 2,821,019 | | | $ | 2,100,972 | | | $ | 1,949,522 | | | $ | 1,848,587 | | |
Tangible Common Equity Ratio (a non-GAAP measure) | | | 8.93 | % | | | 7.93 | % | | | 7.57 | % | | | 7.26 | % | | | 7.31 | % | | | 8.91 | % | | | 8.93 | % | | | 7.93 | % | | | 7.57 | % | | | 7.26 | % | |
| | | | | | | | | | | | | | | | | | | | | |
Tangible Book Value Per Share: | | | | | | | | | | | | | | | | | | | | | | | | | | | | | | | | | | | | | | | | | |
Tangible Common Equity (a non-GAAP measure) | | $ | 252,017 | | | $ | 166,614 | | | $ | 147,545 | | | $ | 134,259 | | | $ | 124,651 | | | $ | 346,843 | | | $ | 252,017 | | | $ | 166,614 | | | $ | 147,545 | | | $ | 134,259 | | |
Common shares outstanding | | | 5,400,868 | | | | 4,107,051 | | | | 4,082,188 | | | | 4,036,879 | | | | 4,000,181 | | | | 6,926,728 | | | | 5,400,868 | | | | 4,107,051 | | | | 4,082,188 | | | | 4,036,879 | | |
Tangible Book Value Per Share (a non-GAAP measure) | | $ | 46.66 | | | $ | 40.57 | | | $ | 36.14 | | | $ | 33.26 | | | $ | 31.16 | | | $ | 50.07 | | | $ | 46.66 | | | $ | 40.57 | | | $ | 36.14 | | | $ | 33.26 | | |
Investment Securities
The Company’s securities portfolio consists of securities available for sale (“AFS”) and securities held to maturity (“HTM”). The largest component of the securities portfolio is mortgage-backed securities, all of which are issued by U.S. government agencies or U.S. government-sponsored enterprises.
Securities available for sale consist of certain U.S. Government Sponsored Enterprises (“GSE”) andobligations, U.S. GSE mortgage-backed securities, and corporate debt securities, and mutual funds.securities. These securities are carried at fair value, and unrealized gains and losses net of
applicable income taxes are recognized as a separate component of shareholders’ equity. The fair value of securities available for sale totaled $237.0 million and included gross unrealized gains of $3.2 million and gross unrealized losses of $406,000 at December 31, 2020. At December 31, 2019, the fair value of securities available for sale totaled $140.3 million and included gross unrealized gains of $231,000 and gross unrealized losses of $1.0 million at December 31, 2019. At December 31, 2018, the fair value of securities available for sale totaled $168.2 million and included gross unrealized gains of $118,000 and gross unrealized losses of $4.2 million.
Securities classified as held to maturity consist of certain U.S. GSE andobligations, U.S. GSE mortgage-backed securities, corporate debt securities, and state, county, and municipal securities. Securities held to maturity as of December 31, 20192020 are carried at their amortized cost of $258.2$247.7 million. At December 31, 2018,2019, the amortized cost of securities held to maturity totaled $282.9$258.2 million.
The following table sets forth the fair value of available for sale investment securities, the amortized costs of held to maturity, and the percentage distribution at the dates indicated:
| | December 31, | | | December 31, | | |
The following table sets forth the fair value of available for sale investment securities, the amortized costs of held to maturity, and the percentage distribution at the dates indicated: | | | December 31, | | | December 31, | |
| | 2019 | | | 2018 | | | 2020 | | | 2019 | |
| | Amount | | | Percent | | | Amount | | | Percent | | | Amount | | | Percent | | | Amount | | | Percent | |
| | (dollars in thousands) | | | (dollars in thousands) | |
Available for sale securities | | | | | | | | | | | | | | | | | | | | | | | | | | | | | | | | |
U.S. GSE obligations | | $ | 37,848 | | | | 27 | % | | $ | 74,039 | | | | 44 | % | | $ | 23,617 | | | | 10 | % | | $ | 37,848 | | | | 27 | % |
Mortgage-backed securities | | | 102,482 | | | | 73 | % | | | 89,268 | | | | 53 | % | | | 210,630 | | | | 89 | % | | | 102,482 | | | | 73 | % |
Corporate debt securities | | | — | | | | 0 | % | | | 4,856 | | | | 3 | % | | | 2,783 | | | | 1 | % | | | — | | | | — | |
Total securities available for sale | | $ | 140,330 | | | | 100 | % | | $ | 168,163 | | | | 100 | % | | $ | 237,030 | | | | 100 | % | | $ | 140,330 | | | | 100 | % |
Held to maturity securities | | | | | | | | | | | | | | | | | | | | | | | | | | | | | | | | |
U.S. GSE obligations | | $ | 5,000 | | | | 2 | % | | $ | 32,571 | | | | 12 | % | | $ | — | | | | — | | | $ | 5,000 | | | | 2 | % |
Mortgage-backed securities | | | 161,759 | | | | 63 | % | | | 168,118 | | | | 59 | % | | | 137,435 | | | | 55 | % | | | 161,759 | | | | 63 | % |
Corporate debt securities | | | 6,980 | | | | 3 | % | | | 6,972 | | | | 2 | % | | | 6,989 | | | | 3 | % | | | 6,980 | | | | 3 | % |
Municipal securities | | | 84,433 | | | | 32 | % | | | 75,208 | | | | 27 | % | | | 103,248 | | | | 42 | % | | | 84,433 | | | | 32 | % |
Total securities held to maturity | | $ | 258,172 | | | | 100 | % | | $ | 282,869 | | | | 100 | % | | $ | 247,672 | | | | 100 | % | | $ | 258,172 | | | | 100 | % |
Total | | $ | 398,502 | | | | 100 | % | | $ | 451,032 | | | | 100 | % | | $ | 484,702 | | | | 100 | % | | $ | 398,502 | | | | 100 | % |
The following tables set forth the composition and maturities of investment securities. Actual maturities may differ from contractual maturities because borrowers may have the right to call or prepay obligations with or without call or prepayment penalties.
| | Within One Year | | | After One, But Within Five Years | | | After Five, But Within Ten Years | | | After Ten Years | | | Total | | | Within One Year | | | After One, But Within Five Years | | | After Five, But Within Ten Years | | | After Ten Years | | | Total | | |
| | Amortized Cost | | | Weighted Average Yield (1) | | | Amortized Cost | | | Weighted Average Yield (1) | | | Amortized Cost | | | Weighted Average Yield (1) | | | Amortized Cost | | | Weighted Average Yield (1) | | | Amortized Cost | | | Weighted Average Yield (1) | | | Amortized Cost | | | Weighted Average Yield (1) | | | Amortized Cost | | | Weighted Average Yield (1) | | | Amortized Cost | | | Weighted Average Yield (1) | | | Amortized Cost | | | Weighted Average Yield (1) | | | Amortized Cost | | | Weighted Average Yield (1) | | |
At December 31, 2019 | | (dollars in thousands) | | |
At December 31, 2020 | | | (dollars in thousands) | | |
Available for sale securities | | | | | | | | | | | | | | | | | | | | | | | | | | | | | | | | | | | | | | | | | | | | | | | | | | | | | | | | | | | | | | | | | | | | | | | | | | | | | | | | | |
U.S. GSE obligations | | $ | 5,000 | | | | 1.4 | % | | $ | 20,000 | | | | 1.5 | % | | $ | 5,000 | | | | 2.3 | % | | $ | 8,000 | | | | 2.6 | % | | $ | 38,000 | | | | 1.8 | % | | $ | — | | | | — | | | $ | 9,995 | | | | 0.5 | % | | $ | 5,000 | | | | 2.3 | % | | $ | 8,000 | | | | 2.6 | % | | $ | 22,995 | | | | 1.6 | % | |
Mortgage-backed securities | | | — | | | | — | | | | 37 | | | | 5.4 | % | | | 36,393 | | | | 1.9 | % | | | 66,679 | | | | 2.1 | % | | | 103,109 | | | | 2.0 | % | | | 1 | | | | 5.2 | % | | | 4,226 | | | | 1.4 | % | | | 54,849 | | | | 1.5 | % | | | 149,439 | | | | 1.2 | % | | | 208,515 | | | | 1.3 | % | |
Corporate debt securities | | | — | | | | — | | | | — | | | | — | | | | — | | | | — | | | | — | | | | — | | | | — | | | | — | | | | 1,001 | | | | 1.1 | % | | | 1,741 | | | | 1.8 | % | | | — | | | | — | | | | — | | | | — | | | | 2,742 | | | | 1.6 | % | |
Total available for sale securities | | $ | 5,000 | | | | 1.4 | % | | $ | 20,037 | | | | 1.5 | % | | $ | 41,393 | | | | 1.9 | % | | $ | 74,679 | | | | 2.1 | % | | $ | 141,109 | | | | 2.0 | % | | $ | 1,002 | | | | 1.1 | % | | $ | 15,962 | | | | 0.9 | % | | $ | 59,849 | | | | 1.6 | % | | $ | 157,439 | | | | 1.2 | % | | $ | 234,252 | | | | 1.3 | % | |
| | | | | | | | | | | | | | | | | | | | | | | | | | | | | | | | | | | | | | | | | | | | | | | | | | | | | | | | | | | | | | | | | | | | | | | | | | | | | | | | | |
Held to maturity securities | | | | | | | | | | | | | | | | | | | | | | | | | | | | | | | | | | | | | | | | | | | | | | | | | | | | | | | | | | | | | | | | | | | | | | | | | | | | | | | | | |
U.S. GSE obligations | | $ | 5,000 | | | | 1.6 | % | | $ | — | | | | — | | | $ | — | | | | — | | | $ | — | | | | — | | | $ | 5,000 | | | | 1.6 | % | |
Mortgage-backed securities | | | — | | | | — | | | | 2 | | | | 5.6 | % | | | 48,088 | | | | 2.7 | % | | | 113,669 | | | | 2.6 | % | | | 161,759 | | | | 2.6 | % | | $ | — | | | | — | | | $ | 2 | | | | 5.6 | % | | $ | 60,933 | | | | 2.4 | % | | $ | 76,500 | | | | 2.1 | % | | $ | 137,435 | | | | 2.3 | % | |
Corporate debt securities | | | — | | | | — | | | | 6,980 | | | | 2.6 | % | | | — | | | | — | | | | — | | | | — | | | | 6,980 | | | | 2.6 | % | | | — | | | | — | | | | 6,989 | | | | 2.6 | % | | | — | | | | — | | | | — | | | | — | | | | 6,989 | | | | 2.6 | % | |
Municipal securities | | | 3,270 | | | | 4.6 | % | | | 10,606 | | | | 4.2 | % | | | 45,201 | | | | 3.7 | % | | | 25,356 | | | | 3.4 | % | | | 84,433 | | | | 3.7 | % | | | 2,541 | | | | 4.5 | % | | | 19,343 | | | | 3.7 | % | | | 40,934 | | | | 3.4 | % | | | 40,430 | | | | 2.8 | % | | | 103,248 | | | | 3.3 | % | |
Total held to maturity securities | | $ | 8,270 | | | | 2.8 | % | | $ | 17,588 | | | | 3.6 | % | | $ | 93,289 | | | | 3.2 | % | | $ | 139,025 | | | | 2.8 | % | | $ | 258,172 | | | | 3.0 | % | | $ | 2,541 | | | | 4.5 | % | | $ | 26,334 | | | | 3.4 | % | | $ | 101,867 | | | | 2.8 | % | | $ | 116,930 | | | | 2.3 | % | | $ | 247,672 | | | | 2.7 | % | |
Total | | $ | 13,270 | | | | 2.3 | % | | $ | 37,625 | | | | 2.4 | % | | $ | 134,682 | | | | 2.8 | % | | $ | 213,704 | | | | 2.5 | % | | $ | 399,281 | | | | 2.6 | % | | $ | 3,543 | | | | 3.5 | % | | $ | 42,296 | | | | 2.4 | % | | $ | 161,716 | | | | 2.4 | % | | $ | 274,369 | | | | 1.7 | % | | $ | 481,924 | | | | 2.0 | % | |
| | Within One Year | | | After One, But Within Five Years | | | After Five, But Within Ten Years | | | After Ten Years | | | Total | | | Within One Year | | | After One, But Within Five Years | | | After Five, But Within Ten Years | | | After Ten Years | | | Total | |
| | Amortized Cost | | | Weighted Average Yield (1) | | | Amortized Cost | | | Weighted Average Yield (1) | | | Amortized Cost | | | Weighted Average Yield (1) | | | Amortized Cost | | | Weighted Average Yield (1) | | | Amortized Cost | | | Weighted Average Yield (1) | | | Amortized Cost | | | Weighted Average Yield (1) | | | Amortized Cost | | | Weighted Average Yield (1) | | | Amortized Cost | | | Weighted Average Yield (1) | | | Amortized Cost | | | Weighted Average Yield (1) | | | Amortized Cost | | | Weighted Average Yield (1) | |
At December 31, 2018 | | (dollars in thousands) | | |
At December 31, 2019 | | | (dollars in thousands) | |
Available for sale securities | | | | | | | | | | | | | | | | | | | | | | | | | | | | | | | | | | | | | | | | | | | | | | | | | | | | | | | | | | | | | | | | | | | | | | | | | | | | | | | | |
U.S. GSE obligations | | $ | 10,004 | | | | 1.1 | % | | $ | 65,000 | | | | 1.5 | % | | $ | — | | | | — | | | $ | — | | | | — | | | $ | 75,004 | | | | 1.4 | % | | $ | 5,000 | | | | 1.4 | % | | $ | 20,000 | | | | 1.5 | % | | $ | 5,000 | | | | 2.3 | % | | $ | 8,000 | | | | 2.6 | % | | $ | 38,000 | | | | 1.8 | % |
Mortgage-backed securities | | | — | | | | — | | | | 78 | | | | 5.4 | % | | | 33,768 | | | | 1.8 | % | | | 58,425 | | | | 2.0 | % | | | 92,271 | | | | 1.9 | % | |
Corporate debt securities | | | 2,008 | | | | 1.5 | % | | | 3,007 | | | | 2.5 | % | | | — | | | | — | | | | — | | | | — | | | | 5,015 | | | | 2.1 | % | |
Mortgage-backed Securities | | | | — | | | | — | | | | 37 | | | | 5.4 | % | | | 36,393 | | | | 1.9 | % | | | 66,679 | | | | 2.1 | % | | | 103,109 | | | | 2.0 | % |
Total available for sale securities | | $ | 12,012 | | | | 1.1 | % | | $ | 68,085 | | | | 1.5 | % | | $ | 33,768 | | | | 1.8 | % | | $ | 58,425 | | | | 2.0 | % | | $ | 172,290 | | | | 1.7 | % | | $ | 5,000 | | | | 1.4 | % | | $ | 20,037 | | | | 1.5 | % | | $ | 41,393 | | | | 1.9 | % | | $ | 74,679 | | | | 2.1 | % | | $ | 141,109 | | | | 2.0 | % |
| | | | | | | | | | | | | | | | | | | | | | | | | | | | | | | | | | | | | | | | | | | | | | | | | | | | | | | | | | | | | | | | | | | | | | | | | | | | | | | | |
Held to maturity securities | | | | | | | | | | | | | | | | | | | | | | | | | | | | | | | | | | | | | | | | | | | | | | | | | | | | | | | | | | | | | | | | | | | | | | | | | | | | | | | | |
U.S. GSE obligations | | $ | 5,001 | | | | 1.4 | % | | $ | 27,570 | | | | 2.5 | % | | $ | — | | | | — | | | $ | — | | | | — | | | $ | 32,571 | | | | 2.4 | % | | $ | 5,000 | | | | 1.6 | % | | $ | — | | | | — | | | $ | — | | | | — | | | $ | — | | | | — | | | $ | 5,000 | | | | 1.6 | % |
Mortgage-backed securities | | | 50 | | | | 4.2 | % | | | — | | | | — | | | | 34,434 | | | | 2.4 | % | | | 133,634 | | | | 2.9 | % | | | 168,118 | | | | 2.8 | % | |
Mortgage-backed Securities | | | | — | | | | — | | | | 2 | | | | 5.6 | % | | | 48,088 | | | | 2.7 | % | | | 113,669 | | | | 2.6 | % | | | 161,759 | | | | 2.6 | % |
Corporate debt securities | | | — | | | | — | | | | 6,972 | | | | 2.6 | % | | | — | | | | — | | | | — | | | | — | | | | 6,972 | | | | 2.6 | % | | | — | | | | — | | | | 6,980 | | | | 2.6 | % | | | — | | | | — | | | | — | | | | — | | | | 6,980 | | | | 2.6 | % |
Municipal securities | | | 4,630 | | | | 4.8 | % | | | 13,259 | | | | 4.4 | % | | | 41,390 | | | | 3.8 | % | | | 15,929 | | | | 3.6 | % | | | 75,208 | | | | 3.9 | % | | | 3,270 | | | | 4.6 | % | | | 10,606 | | | | 4.2 | % | | | 45,201 | | | | 3.7 | % | | | 25,356 | | | | 3.4 | % | | | 84,433 | | | | 3.7 | % |
Total held to maturity securities | | $ | 9,681 | | | | 3.1 | % | | $ | 47,801 | | | | 3.1 | % | | $ | 75,824 | | | | 3.2 | % | | $ | 149,563 | | | | 3.0 | % | | $ | 282,869 | | | | 3.1 | % | | $ | 8,270 | | | | 2.8 | % | | $ | 17,588 | | | | 3.6 | % | | $ | 93,289 | | | | 3.2 | % | | $ | 139,025 | | | | 2.8 | % | | $ | 258,172 | | | | 3.0 | % |
Total | | $ | 21,693 | | | | 2.0 | % | | $ | 115,886 | | | | 2.2 | % | | $ | 109,592 | | | | 2.7 | % | | $ | 207,988 | | | | 2.7 | % | | $ | 455,159 | | | | 2.5 | % | | $ | 13,270 | | | | 2.3 | % | | $ | 37,625 | | | | 2.4 | % | | $ | 134,682 | | | | 2.8 | % | | $ | 213,704 | | | | 2.5 | % | | $ | 399,281 | | | | 2.6 | % |
(1)
| (1) | Weighted Average Yield is shown on a fully taxable equivalent basis using a federal tax rate of 21% for 20182020 and 2019. |
Management evaluates
The Company adopted Topic 326 on January 1, 2020 and did not record an allowance for credit losses on its investment securities as of December 31, 2020. The Company regularly reviews debt securities for expected credit loss using both qualitative and quantitative criteria, as necessary based on the composition of the portfolio at period end.
Prior to January 1, 2020, investment securities were evaluated by management for other-than-temporary impairment on at least a quarterly basis, and more frequently when economic or market conditions warrantwarranted such evaluation. Consideration is given to: (1) the length of time and the extent to which the fair value has been less than cost; (2) the financial condition and near-term prospects of the issuer; and (3) the intent and ability of the Company to retain its investment in the issuer for a period of time sufficient to allow for any anticipated recovery in fair value.
As of December 31, 2020, 30 debt securities had gross unrealized losses, with an aggregate depreciation of 0.47% from the Company’s amortized cost basis. The largest unrealized loss percentage of any single security was 2.07%, or $55,000, the largest unrealized dollar loss of a single security of its amortized cost.
As of December 31, 2019, 68 debt securities had gross unrealized losses, with an aggregate depreciation of 0.74% from the Company’s amortized cost basis. The largest unrealized loss percentage of any single security was 3.15%, or $63,000, of its amortized cost. The largest unrealized dollar loss of any single security was $96,000, or 1.93%, of its amortized cost.
As of December 31, 2018, 142 debt securities had gross unrealized losses, with an aggregate depreciation of 2.05% from the Company’s amortized cost basis. The largest unrealized loss percentage of any single security was 9.79%, or $98,000, of its amortized cost. The largest unrealized dollar loss of any single security was $189,000, or 5.34%, of its amortized cost.
Loans
The Company’s lending activities are conducted principally in Eastern Massachusetts and Southern New Hampshire. The Company grants single- and multi-family residential loans, commercial & industrial (“C&I”), commercial real estate (“CRE”), construction loans, and a variety of consumer loans. Most of the loans granted by the Company are secured by real estate collateral. Repayment of the Company’s residential loans are generally dependent on the health of the employment market in the borrowers’ geographic areas and that of the general economy with liquidation of the underlying real estate collateral being typically viewed as the primary source of repayment in the event of borrower default. The repayment of C&I loans depends primarily on the cash flow and credit worthiness of the borrower and secondarily on the underlying collateral provided by the borrower. As borrower cash flow may be difficult to predict, liquidation of the underlying collateral securing these loans is typically viewed as the primary source of repayment in the event of borrower default. However, collateral typically consists of equipment, inventory, accounts receivable, or other business assets that may fluctuate in value, so the liquidation of collateral in the event of default is often an insufficient source of repayment. For renewable energy loans, cash flow is generally from multiple revenue sources and dependent on energy output. For PPP loans, the SBA guarantees 100% of the PPP loans made to eligible borrowers. The entire principal amount of the borrower’s PPP loan, including any accrued interest, is eligible to be reduced by the loan forgiveness amount subject to program requirements. The Company’s CRE loans are primarily made based on the cash flow from the collateral property and secondarily on the underlying collateral provided by the borrower, with liquidation of the underlying real estate collateral typically being viewed as the primary source of repayment in the event of borrower default. The Company’s construction loans are primarily made based on the borrower’s expected ability to execute and the future completed value of the collateral property, with sale of the underlying real estate collateral typically being viewed as the primary source of repayment.
The following summary shows the composition of the loan portfolio at the dates indicated:
| | December 31, | | | | December 31, | | | |
| | 2019 | | | % of Total | | | 2018 | | | % of Total | | | 2017 | | | % of Total | | | 2016 | | | % of Total | | | 2015 | | | % of Total | | | | 2020 | | | % of Total | | | 2019 | | | % of Total | | | 2018 | | | % of Total | | | 2017 | | | % of Total | | | 2016 | | | % of Total | | | |
| | (dollars in thousands) | | (dollars in thousands) | |
Residential mortgage | | | | | | | | | | | | | | | | | | | | | | | | | | | | | | | | | | | | | | | | | | | | | | | | | | | | | | | | | | | | | | | | | | | | | | | | | | | | | | | | | | |
Mortgages - fixed rate | | $ | 430,877 | | | | 19 | % | | $ | 293,267 | | | | 19 | % | | $ | 298,851 | | | | 22 | % | | $ | 305,404 | | | | 23 | % | | $ | 338,576 | | | | 29 | % | | | $ | 535,804 | | | | 17 | % | | $ | 430,877 | | | | 19 | % | | $ | 293,267 | | | | 19 | % | | $ | 298,851 | | | | 22 | % | | $ | 305,404 | | | | 23 | % | |
Mortgages - adjustable rate | | | 467,139 | | | | 21 | % | | | 309,656 | | | | 20 | % | | | 239,027 | | | | 18 | % | | | 228,028 | | | | 17 | % | | | 206,835 | | | | 17 | % | | | | 734,593 | | | | 23 | % | | | 467,139 | | | | 21 | % | | | 309,656 | | | | 20 | % | | | 239,027 | | | | 18 | % | | | 228,028 | | | | 17 | % | |
Construction | | | 17,374 | | | | 1 | % | | | — | | | | 0 | % | | | — | | | | 0 | % | | | — | | | | 0 | % | | | — | | | | 0 | % | | | | 25,495 | | | | 1 | % | | | 17,374 | | | | 1 | % | | | — | | | | 0 | % | | | — | | | | 0 | % | | | — | | | | 0 | % | |
Deferred costs net of unearned fees | | | 2,176 | | | | 0 | % | | | 1,408 | | | | 0 | % | | | 1,042 | | | | 0 | % | | | 972 | | | | 0 | % | | | 834 | | | | 0 | % | | | | 2,976 | | | | 0 | % | | | 2,176 | | | | 0 | % | | | 1,408 | | | | 0 | % | | | 1,042 | | | | 0 | % | | | 972 | | | | 0 | % | |
Total residential mortgages | | | 917,566 | | | | 41 | % | | | 604,331 | | | | 39 | % | | | 538,920 | | | | 40 | % | | | 534,404 | | | | 40 | % | | | 546,245 | | | | 46 | % | | | | 1,298,868 | | | | 41 | % | | | 917,566 | | | | 41 | % | | | 604,331 | | | | 39 | % | | | 538,920 | | | | 40 | % | | | 534,404 | | | | 40 | % | |
Commercial mortgage | | | | | | | | | | | | | | | | | | | | | | | | | | | | | | | | | | | | | | | | | | | | | | | | | | | | | | | | | | | | | | | | | | | | | | | | | | | | | | | | | | |
Mortgages - nonowner occupied | | | 870,047 | | | | 40 | % | | | 654,394 | | | | 42 | % | | | 562,203 | | | | 41 | % | | | 513,578 | | | | 39 | % | | | 422,923 | | | | 35 | % | | |
Mortgages - non-owner occupied | | | | 1,064,317 | | | | 35 | % | | | 870,047 | | | | 40 | % | | | 654,394 | | | | 42 | % | | | 562,203 | | | | 41 | % | | | 513,578 | | | | 39 | % | |
Mortgages - owner occupied | | | 114,095 | | | | 5 | % | | | 59,335 | | | | 4 | % | | | 35,343 | | | | 3 | % | | | 43,932 | | | | 3 | % | | | 43,265 | | | | 4 | % | | | | 153,474 | | | | 5 | % | | | 114,095 | | | | 5 | % | | | 59,335 | | | | 4 | % | | | 35,343 | | | | 3 | % | | | 43,932 | | | | 3 | % | |
Construction | | | 76,288 | | | | 3 | % | | | 44,146 | | | | 3 | % | | | 35,904 | | | | 3 | % | | | 58,406 | | | | 4 | % | | | 44,624 | | | | 4 | % | | | | 139,075 | | | | 4 | % | | | 76,288 | | | | 3 | % | | | 44,146 | | | | 3 | % | | | 35,904 | | | | 3 | % | | | 58,406 | | | | 4 | % | |
Deferred costs net of unearned fees | | | 144 | | | | 0 | % | | | 82 | | | | 0 | % | | | 199 | | | | 0 | % | | | 224 | | | | 0 | % | | | 259 | | | | 0 | % | | | | 2,096 | | | | 0 | % | | | 144 | | | | 0 | % | | | 82 | | | | 0 | % | | | 199 | | | | 0 | % | | | 224 | | | | 0 | % | |
Total commercial mortgages | | | 1,060,574 | | | | 48 | % | | | 757,957 | | | | 49 | % | | | 633,649 | | | | 47 | % | | | 616,140 | | | | 46 | % | | | 511,071 | | | | 43 | % | | | | 1,358,962 | | | | 44 | % | | | 1,060,574 | | | | 48 | % | | | 757,957 | | | | 49 | % | | | 633,649 | | | | 47 | % | | | 616,140 | | | | 46 | % | |
Home equity | | | | | | | | | | | | | | | | | | | | | | | | | | | | | | | | | | | | | | | | | | | | | | | | | | | | | | | | | | | | | | | | | | | | | | | | | | | | | | | | | | |
Home equity - lines of credit | | | 73,880 | | | | 3 | % | | | 63,421 | | | | 4 | % | | | 70,326 | | | | 5 | % | | | 70,883 | | | | 6 | % | | | 59,676 | | | | 5 | % | | | | 102,460 | | | | 3 | % | | | 73,880 | | | | 3 | % | | | 63,421 | | | | 4 | % | | | 70,326 | | | | 5 | % | | | 70,883 | | | | 6 | % | |
Home equity - term loans | | | 6,555 | | | | 1 | % | | | 5,665 | | | | 0 | % | | | 3,863 | | | | 0 | % | | | 3,925 | | | | 0 | % | | | 3,630 | | | | 0 | % | | | | 3,503 | | | | 0 | % | | | 6,555 | | | | 1 | % | | | 5,665 | | | | 0 | % | | | 3,863 | | | | 0 | % | | | 3,925 | | | | 0 | % | |
Deferred costs net of unearned fees | | | 240 | | | | 0 | % | | | 250 | | | | 0 | % | | | 255 | | | | 0 | % | | | 243 | | | | 0 | % | | | 216 | | | | 0 | % | | | | 231 | | | | 0 | % | | | 240 | | | | 0 | % | | | 250 | | | | 0 | % | | | 255 | | | | 0 | % | | | 243 | | | | 0 | % | |
Total home equity | | | 80,675 | | | | 4 | % | | | 69,336 | | | | 4 | % | | | 74,444 | | | | 5 | % | | | 75,051 | | | | 6 | % | | | 63,522 | | | | 5 | % | | | | 106,194 | | | | 3 | % | | | 80,675 | | | | 4 | % | | | 69,336 | | | | 4 | % | | | 74,444 | | | | 5 | % | | | 75,051 | | | | 6 | % | |
Commercial & industrial | | | | | | | | | | | | | | | | | | | | | | | | | | | | | | | | | | | | | | | | | | | | | | | | | | | | | | | | | | | | | | | | | | | | | | | | | | | | | | | | | | |
Commercial & industrial | | | 133,337 | | | | 6 | % | | | 93,728 | | | | 6 | % | | | 65,305 | | | | 5 | % | | | 59,638 | | | | 5 | % | | | 42,209 | | | | 4 | % | | | | 225,441 | | | | 7 | % | | | 133,337 | | | | 6 | % | | | 93,728 | | | | 6 | % | | | 65,305 | | | | 5 | % | | | 59,638 | | | | 5 | % | |
Deferred costs net of unearned fees | | | (101 | ) | | | 0 | % | | | (16 | ) | | | 0 | % | | | (10 | ) | | | 0 | % | | | 68 | | | | 0 | % | | | 175 | | | | 0 | % | | |
PPP loans | | | | 124,201 | | | | 4 | % | | | — | | | | 0 | % | | | - | | | | 0 | % | | | — | | | | 0 | % | | | — | | | | 0 | % | |
Unearned fees, net of deferred costs | | | | (1,787 | ) | | | 0 | % | | | (101 | ) | | | 0 | % | | | (16 | ) | | | 0 | % | | | (10 | ) | | | 0 | % | | | 68 | | | | 0 | % | |
Total commercial & industrial | | | 133,236 | | | | 6 | % | | | 93,712 | | | | 6 | % | | | 65,295 | | | | 5 | % | | | 59,706 | | | | 5 | % | | | 42,384 | | | | 4 | % | | | | 347,855 | | | | 11 | % | | | 133,236 | | | | 6 | % | | | 93,712 | | | | 6 | % | | | 65,295 | | | | 5 | % | | | 59,706 | | | | 5 | % | |
Consumer | | | | | | | | | | | | | | | | | | | | | | | | | | | | | | | | | | | | | | | | | | | | | | | | | | | | | | | | | | | | | | | | | | | | | | | | | | | | | | | | | | |
Secured | | | 33,453 | | | | 1 | % | | | 33,252 | | | | 2 | % | | | 37,272 | | | | 3 | % | | | 33,386 | | | | 3 | % | | | 27,390 | | | | 2 | % | | | | 41,409 | | | | 1 | % | | | 33,453 | | | | 1 | % | | | 33,252 | | | | 2 | % | | | 37,272 | | | | 3 | % | | | 33,386 | | | | 3 | % | |
Unsecured | | | 1,199 | | | | 0 | % | | | 1,171 | | | | 0 | % | | | 1,303 | | | | 0 | % | | | 1,451 | | | | 0 | % | | | 1,585 | | | | 0 | % | | | | 341 | | | | 0 | % | | | 1,199 | | | | 0 | % | | | 1,171 | | | | 0 | % | | | 1,303 | | | | 0 | % | | | 1,451 | | | | 0 | % | |
Deferred costs net of unearned fees | | | 25 | | | | 0 | % | | | 13 | | | | 0 | % | | | 16 | | | | 0 | % | | | 16 | | | | 0 | % | | | 17 | | | | 0 | % | | |
Unearned fees net of deferred costs | | | | 19 | | | | 0 | % | | | 25 | | | | 0 | % | | | 13 | | | | 0 | % | | | 16 | | | | 0 | % | | | 16 | | | | 0 | % | |
Total consumer | | | 34,677 | | | | 1 | % | | | 34,436 | | | | 2 | % | | | 38,591 | | | | 3 | % | | | 34,853 | | | | 3 | % | | | 28,992 | | | | 2 | % | | | | 41,769 | | | | 1 | % | | | 34,677 | | | | 1 | % | | | 34,436 | | | | 2 | % | | | 38,591 | | | | 3 | % | | | 34,853 | | | | 3 | % | |
Total loans | | $ | 2,226,728 | | | | 100 | % | | $ | 1,559,772 | | | | 100 | % | | $ | 1,350,899 | | | | 100 | % | | $ | 1,320,154 | | | | 100 | % | | $ | 1,192,214 | | | | 100 | % | | | $ | 3,153,648 | | | | 100 | % | | $ | 2,226,728 | | | | 100 | % | | $ | 1,559,772 | | | | 100 | % | | $ | 1,350,899 | | | | 100 | % | | $ | 1,320,154 | | | | 100 | % | |
Residential Mortgage.Residential real estate loans held in portfolio amounted to $1.3 billion at December 31, 2020, an increase of $381.3 million, or 41.6%, from $917.6 million at December 31, 2019 an increase of $313.2 million, or 51.8%, from $604.3 million at December 31, 2018 and consisted of one-to-four family residential mortgage loans. The residential mortgage portfolio represented 41% and 39% of total loans at both December 31, 20192020 and December 31, 2018, respectively. 2019.
The average loan balance outstanding in the residential portfolio was $390,000454,000 and the largest individual residential mortgage loan outstanding was $9.0$5.9 million as of December 31, 2019.2020. At December 31, 2019,2020, this loan was performing in accordance with its original terms.
The Bank offers fixed and adjustable rateadjustable-rate residential mortgage and construction loans with maturities up to 30 years. One-to-four family residential mortgage loans are generally underwritten according to Fannie Mae and Freddie Mac guidelines, and we refer to loans that conform to such guidelines as “conforming loans.” The Bank generally originates and purchases both fixed and adjustable rateadjustable-rate mortgage loans in amounts up to the maximum conforming loan limits as established by the Federal Housing Finance Agency, which increased to $484,350510,400 in 20192020 from $453,100484,350 in 2018,2019, for one-unit properties. In addition, the Bank also offers loans above conforming lending limits typically referred to as “jumbo” loans and interest only loans. These loans are typically underwritten to jumbo conforming guidelines,guidelines; however, the Bank may choose to hold a jumbo loan within its portfolio with underwriting criteria that does not exactly match conforming guidelines. The Bank may also, from time to time, purchase residential loans that are either jumbo, conforming, or meet our Community Reinvestment Act (“CRA”) requirements. Purchases have historically been made to satisfy CRA requirements for lending to lowlow- and moderate incomemoderate-income borrowers within the Bank’s CRA Assessment Area.
Generally, our residential construction loans are based on complete value per plans and specifications, with loan proceeds used to construct the house for single family primary residence. Loans are provided for terms up to 12 months during the construction phase, with loan-to-values that generally do not exceed 80% on as complete basis. The loans then convert to permanent financing at terms up to 360 months.
The Company does not offer reverse mortgages, nor do we offer loans that provide for negative amortization of principal, such as “Option ARM” loans, where the borrower can pay less than the interest owed on the loan, resulting in an increased principal balance
during the life of the loan. We do not offer “subprime loans” (loans that are made with low down payments to borrowers with weakened credit histories typically characterized by payment delinquencies, previous charge-offs, judgments, bankruptcies, or borrowers with questionable repayment capacity as evidenced by low credit scores or high debt-burden ratios) or Alt-A loans (defined as loans having less than full documentation).
Residential real estate loans are originated both for sale to the secondary market, as well as for retention in the Bank’s loan portfolio. The decision to sell a loan to the secondary market or retain within the portfolio is determined based on a variety of factors including but not limited to the Bank’s asset/liability position, the current interest rate environment, and customer preference.
The Company was servicing mortgage loans sold to others without recourse of approximately $188.2 millionat December 31, 2020 and $159.6 million at December 31, 2019 and $90.2 million at December 31, 2018.2019.
The table below presents residential real estate loan origination activity for the periods indicated:
| | | | | | | | | | | | | |
| | For the Year Ended December 31, | | | For the Year Ended December 31, | |
| | 2019 | | | 2018 | | | 2017 | | | 2020 | | | 2019 | | | 2018 | |
| | (dollars in thousands) | | | (dollars in thousands) | |
Originations for retention in portfolio | | $ | 229,163 | | | $ | 135,468 | | | $ | 101,307 | | | $ | 378,247 | | | $ | 229,163 | | | $ | 135,468 | |
Originations for sale to the secondary market | | | 17,537 | | | | 9,431 | | | | 15,663 | | | | 82,620 | | | | 17,537 | | | | 9,431 | |
Total | | $ | 246,700 | | | $ | 144,899 | | | $ | 116,970 | | | $ | 460,867 | | | $ | 246,700 | | | $ | 144,899 | |
Loans are sold with servicing retained or released. The table below presents residential real estate loan sale activity for the periods indicated:
| For the Year Ended December 31, | | For the Year Ended December 31, | |
| 2019 | | | 2018 | | | 2017 | | 2020 | | | 2019 | | | 2018 | |
| (dollars in thousands) | | (dollars in thousands) | |
Loans sold with servicing rights retained | $ | 82,932 | | | $ | 1,605 | | | $ | 11,906 | | $ | 60,453 | | | $ | 82,932 | | | $ | 1,605 | |
Loans sold with servicing rights released | | 7,006 | | | | 7,826 | | | | 10,338 | | | 18,024 | | | | 7,006 | | | | 7,826 | |
Total | $ | 89,938 | | | $ | 9,431 | | | $ | 22,244 | | $ | 78,477 | | | $ | 89,938 | | | $ | 9,431 | |
Loans sold with the retention of servicing typically result in the capitalization of servicing rights. Loan servicing rights are included in other assets and subsequently amortized as an offset to other income over the estimated period of servicing. The net balance of capitalized servicing rights amounted to $1.2 million and $1.3 million $666,000, and $793,000 at December 31, 2019, December 31, 2018,2020 and December 31, 2017,2019, respectively.
Commercial Mortgage. Commercial real estate loans were $1.1$1.4 billion as of December 31, 2019,2020, an increase of $302.6$298.4 million, or 39.9%28.1%, from $758.0 million$1.1 billion at December 31, 2018.2019. The commercial real estate loan portfolio represented 48%44% and 49%48% of total loans at December 31, 20192020 and December 31, 2018,2019, respectively. The average loan balance outstanding in this portfolio was $1.3$1.6 million and the largest individual commercial real estate loan outstanding was $24.0$27.0 million as of December 31, 2019.2020. At December 31, 2019,2020, this commercial mortgage was performing in accordance with its original terms.
Commercial real estateCRE loans are secured by a variety of property types with approximately 87.2% of the total at December 31, 2019 composedinclusive of multi-family dwellings, retail facilities, office buildings, commercial mixed use, lodging, and industrial and warehouse properties, and other specialized properties.
Generally, our commercial real estateCRE loans are for terms of up to 10ten years, with loan-to-values that generally do not exceed 75%. Amortization schedules are long term,long-term, and thus, a balloon payment is generally due at maturity. Under most circumstances, the Bank will offer to rewrite or otherwise extend the loan at prevailing interest rates.
Generally, our commercial construction loans are speculative in nature, with loan proceeds used to acquire and develop real estate property for sale or rental. Loans are provided for terms up to 36 months during the construction phase, with loan-to-values that generally do not exceed 75% on both an ‘as is’“as is” and ‘as“as complete and stabilized’stabilized” basis. Construction projects are primarily for the development of residential property types, inclusive of 1-4one-to-four family and multifamily properties.
Home Equity.The home equity portfolio totaled $80.7$106.2 million and $69.3$80.7 million at December 31, 20192020 and December 31, 2018,2019, respectively. The home equity portfolio represented 3% and 4% of total loans at December 31, 2020 and 2019, and respectively. At December 31, 2018. At December 31, 2019, our2020, the largest home equity line of credit was a $2.03.5 million line of credit and had noan outstanding balance of $3.3 million at December 31, 2019.2020. At December 31, 2019,2020, this line of credit was performing in accordance with its original terms.
Home equity lines of credit are extended as both first and second mortgages on owner-occupied residential and one-to-four family investment properties in the Bank’s market area. Home equity lines of credit are generally underwritten with the same criteria that we use to underwrite one-to-four family residential mortgage loans.
Our home equity lines of credit are revolving lines of credit, which generally have a term between 15 and 20 years, with draws available for the first 10 years. Our 15-year lines of credit are interest only during the first 10 years and amortize on a five-year basis thereafter. Our 20-year lines of credit are interest only during the first 10 years and amortize on a 10-year basis thereafter. We generally originate home equity lines of credit with loan-to-value ratios of up to 80% when combined with the principal balance of the existing first mortgage loan, although loan-to-value ratios may occasionally exceed 80% on a case-by-case basis. Maximum combined loan-to-values are determined based on an applicant’s loan/line amount and the estimated property value. Lines of credit above $1.0 million generally will not exceed combined loan-to-value of 75%. Rates are adjusted monthly based on changes in a designated market index. We also offer home equity term loans, which are extended as second mortgages on owner-occupied residential properties in our market area. Our home equity term loans are fixed-ratefixed rate second mortgage loans, which generally have a term between 5 and 20 years.
Commercial and Industrial (C&I). The commercial and industrial portfolio totaled $347.9 million at December 31, 2020, an increase of $214.6 million, or 161.1%, from $133.2 million at December 31, 2019, an increase of $39.5 million, or 42.2%, from $93.7 million at December 31, 2018.2019. C&I loans represented 11% and 6% of total loans at December 31, 2020 and 2019, and December 31, 2018.respectively. The average loan balance outstanding in this portfolio was $209,000$414,000, excluding PPP loans, and the largest individual commercial and industrial loan outstanding was $10.5$8.8 million as of December 31, 2019.2020. At December 31, 2019,2020, this loan was performing in accordance with its original terms.
The Company’s Innovation BankingLoans under the SBA’s PPP program totaled $126.2 million at December 31, 2020 and asset-based loans are reported withinincluded in the C&I portfolio.
At December 31, 2019, Innovation Banking loans totaled $30.3 million and the average loan balance outstanding in this portfolio was $1.3 million. The largest individual loan outstanding was $5.7 million and this loan was performing in accordance with its original terms.
| • | At December 31, 2020, Innovation Banking loans totaled $19.9 million and the average loan balance outstanding in this portfolio was $795,000. The largest individual loan outstanding was $4.7 million and this loan was performing in accordance with its original terms at December 31, 2020. |
| • | At December 31, 2020, asset-based loans totaled $21.2 million and the average loan balance outstanding in this portfolio was $1.5 million. The largest individual loans outstanding was $5.0 million and this loan was performing in accordance with its original terms at December 31, 2020. |
| • | At December 31, 2020, commercial renewable energy loans totaled $89.8 million and the average loan balance outstanding in this portfolio was $2.7 million. The largest individual loan outstanding was $8.8 million, and this loan was performing in accordance with its original terms at December 31, 2020. |
At December 31, 2019, asset-based loans totaled $23.2 million and the average loan balance outstanding in this portfolio was $2.3 million. The largest individual loans outstanding was $10.5 million and this loan was performing in accordance with its original terms.
The Company’s C&I loan customers represent various small- and middle-market established businesses involved in professional services, accommodation and food services, utilities, health care, wholesale trade, manufacturing, distribution, retailing, and non-profits. Most clients are privately owned businesses with markets that range from local to national in scope. Many of the loans to this segment are secured by liens on corporate assets and the personal guarantees of the principals. The Company also makes loans to entrepreneurial and technology businesses. Thebusinesses, where regional economic strength or weakness impacts the relative risks in this loan category. Therecategory, in addition to renewable energy lending which is little concentrationmore specialized in nature. The Bank has expanded its exposure within renewable energy lending but otherwise there are no significant concentrations in any one business sector, and loan risks are generally diversified among many borrowers.
Consumer.
Consumer Loans. The consumer loan portfolio totaled $41.8 million at December 31, 2020, an increase of $7.1 million, or 20.5%, from $34.7 million at December 31, 2019, an increase of $241,000, or 0.7%, from $34.4 million at December 31, 2018.2019. Consumer loans represented 1% and 2% of the total loan portfolio at both December 31, 20192020 and December 31, 2018, respectively.2019. Consumer loans include secured and unsecured loans, lines of credit, and personal installment loans. Unsecured consumer loans generally have greater risk compared to longer-term loans secured by improved, owner-occupied real estate,particularly consumer loans that are secured by rapidly depreciable assets. The secured consumer loans and lines portfolio are generally fully secured by pledged assets such as bank accounts or investments. The average loan balance outstanding in this portfolio was $14,000 and the largest individual consumer loan outstanding was $3.0 million as of December 31, 2020. At December 31, 2020, this loan was performing in accordance with its original terms.
Loan Portfolio Maturities. The following table summarizes the dollar amount of loans maturing in our portfolio based on their loan type and contractual terms to maturity at December 31, 2019.2020. The table does not include any estimate of prepayments, which can significantly shorten the average life of all loans and may cause our actual repayment experience to differ from that shown below. Demand loans, loans having no stated repayment schedule or maturity, and overdraft loans are reported as being due in one year or less.
| | December 31, 2019 | | | December 31, 2020 | |
| | One Year or Less | | | One to Five Years | | | Over Five Years | | | Total | | | One Year or Less | | | One to Five Years | | | Over Five Years | | | Total | |
| | (dollars in thousands) | | | (dollars in thousands) | |
Residential mortgage | | $ | 5,441 | | | $ | 12,389 | | | $ | 899,736 | | | $ | 917,566 | | | $ | 6,702 | | | $ | 13,020 | | | $ | 1,279,146 | | | $ | 1,298,868 | |
Commercial mortgage | | | 49,781 | | | | 297,723 | | | | 713,070 | | | | 1,060,574 | | | | 124,400 | | | | 301,752 | | | | 932,810 | | | | 1,358,962 | |
Home equity | | | 265 | | | | 960 | | | | 79,450 | | | | 80,675 | | | | 527 | | | | 5,057 | | | | 100,610 | | | | 106,194 | |
Commercial & Industrial | | | 43,761 | | | | 65,292 | | | | 24,183 | | | | 133,236 | | | | 40,434 | | | | 192,400 | | | | 115,021 | | | | 347,855 | |
Consumer | | | 34,413 | | | | 145 | | | | 119 | | | | 34,677 | | | | 41,615 | | | | 73 | | | | 81 | | | | 41,769 | |
Total | | $ | 133,661 | | | $ | 376,509 | | | $ | 1,716,558 | | | $ | 2,226,728 | | | $ | 213,678 | | | $ | 512,302 | | | $ | 2,427,668 | | | $ | 3,153,648 | |
Loan Portfolio by Interest Rate Type. The following table summarizes the dollar amount of loans maturing in our portfolio based on whether the loan has a fixed, adjustable, or variablefloating rate of interest at December 31, 2019:2020:
| | December 31, 2019 | | | December 31, 2020 | |
| | Fixed | | | Adjustable | | | Floating | | | Total | | | Fixed | | | Adjustable | | | Floating | | | Total | |
| | (dollars in thousands) | | | (dollars in thousands) | |
Residential mortgage | | $ | 447,334 | | | $ | 470,232 | | | $ | — | | | $ | 917,566 | | | $ | 544,663 | | | $ | 741,002 | | | $ | 13,203 | | | $ | 1,298,868 | |
Commercial mortgage | | | 404,100 | | | | 287,332 | | | | 369,142 | | | | 1,060,574 | | | | 418,787 | | | | 411,371 | | | | 528,804 | | | | 1,358,962 | |
Home equity | | | 6,777 | | | | — | | | | 73,898 | | | | 80,675 | | | | 4,297 | | | | — | | | | 101,897 | | | | 106,194 | |
Commercial & Industrial | | | 48,076 | | | | 6,468 | | | | 78,692 | | | | 133,236 | | | | 177,438 | | | | 51,106 | | | | 119,311 | | | | 347,855 | |
Consumer | | | 788 | | | | 606 | | | | 33,283 | | | | 34,677 | | | | 413 | | | | 468 | | | | 40,888 | | | | 41,769 | |
Total | | $ | 907,075 | | | $ | 764,638 | | | $ | 555,015 | | | $ | 2,226,728 | | | $ | 1,145,598 | | | $ | 1,203,947 | | | $ | 804,103 | | | $ | 3,153,648 | |
Nonperforming Loans and TROUBLED DEBT RESTRUCTURINGS (TDRs)
The composition of nonperforming loans is as follows:
| | December 31, | | | December 31, | |
| | 2019 | | | 2018 | | | 2017 | | | 2016 | | | 2015 | | | 2020 | | | 2019 | | | 2018 | | | 2017 | | | 2016 | |
| | (dollars in thousands) | | | (dollars in thousands) | |
Nonaccruals | | $ | 4,160 | | | $ | 525 | | | $ | 1,148 | | | $ | 1,023 | | | $ | 1,481 | | |
Non-accruals | | | $ | 7,744 | | | $ | 4,160 | | | $ | 525 | | | $ | 1,148 | | | $ | 1,023 | |
Loans past due > 90 days, but still accruing | | | 1,264 | | | | — | | | | — | | | | 232 | | | | — | | | | 407 | | | | 1,264 | | | | — | | | | — | | | | 232 | |
Troubled debt restructurings | | | 227 | | | | 117 | | | | 150 | | | | 421 | | | | — | | | | 811 | | | | 227 | | | | 117 | | | | 150 | | | | 421 | |
Total nonperforming loans | | $ | 5,651 | | | $ | 642 | | | $ | 1,298 | | | $ | 1,676 | | | $ | 1,481 | | |
Total non-performing loans | | | $ | 8,962 | | | $ | 5,651 | | | $ | 642 | | | $ | 1,298 | | | $ | 1,676 | |
Accruing troubled debt restructured loans | | $ | — | | | $ | 6 | | | $ | 29 | | | $ | — | | | $ | — | | | $ | — | | | $ | — | | | $ | 6 | | | $ | 29 | | | $ | — | |
Nonperforming loans as a percentage of gross loans | | | 0.25 | % | | | 0.04 | % | | | 0.10 | % | | | 0.13 | % | | | 0.12 | % | | | 0.28 | % | | | 0.25 | % | | | 0.04 | % | | | 0.10 | % | | | 0.13 | % |
Nonperforming loans as a percentage of total assets | | | 0.20 | % | | | 0.03 | % | | | 0.07 | % | | | 0.09 | % | | | 0.09 | % | | | 0.23 | % | | | 0.20 | % | | | 0.03 | % | | | 0.07 | % | | | 0.09 | % |
AtTotal non-performing loans increased $3.3 million at December 31, 2020 as compared to December 31, 2019, 2018,primarily due to an increase of loans on non-accrual.
The Company continues to closely monitor the portfolio of non-performing loans for which management has concerns regarding the ability of the borrowers to perform. The majority of the loans are secured by real estate and 2017 impaired loans had specific reservesare considered to have adequate collateral value to cover the loan balances at December 31, 2020 and December 31, 2019, although such values may fluctuate with changes in the economy and the real estate market. In addition to the monitoring and review of $87,000, $0,loan performance internally, the Company has contracted with an independent organization to review the Company’s commercial and $93,000 respectively.CRE loan portfolios. This independent review was performed in each of the past five years.
Nonaccrual
Non-accrual Loans. Loans are typically placed on nonaccrualnon-accrual status when any payment of principal and/or interest is 90 days or more past due unless the collateral is sufficient to cover both principal and interest and the loan is in the process of collection. The Company monitors closely the performance of its loan portfolio. In addition to the monitoring and review of loan performance internally, the Company has contracted with an independent organization to review the Company’s commercial and commercial real estate loan portfolios. This independent review was performed in each of the past five years. The status of delinquent loans, as well as situations identified as potential problems, is reviewed on a regular basis by senior management.
Troubled Debt Restructurings.Loans are considered restructured in a troubled debt restructuring when the Company has granted concessions to a borrower due to the borrower’s financial condition that it otherwise would not have considered. These concessions may include modifications of the terms of the debt such as deferral of payments, extension of maturity, reduction of principal balance, reduction of the stated interest rate other than normal market rate adjustments, or a combination of these concessions. Debt may be bifurcated with separate terms for each tranche of the restructured debt. Restructuring a loan in lieu of aggressively enforcing the collection of the loan may benefit the Company by increasing the ultimate probability of collection.
Restructured loans are classified as accruing or non-accruing based on management’s assessment of the collectability of the loan. Loans which are already on nonaccrualnon-accrual status at the time of the restructuring generally remain on nonaccrualnon-accrual status for approximately six months or longer before management considers such loans for return to accruing status. Accruing restructured loans are placed into nonaccrualnon-accrual status if and when the borrower fails to comply with the restructured terms and management deems it unlikely that the borrower will return to a status of compliance in the near term.
Troubled debt restructurings are classifiedindividually evaluated for credit losses.
Pursuant to Section 4013 of the CARES Act, financial institutions can suspend the requirements under U.S. GAAP related to TDRs for modifications made before December 31, 2020 to loans that were current as impaired loans.of December 31, 2019. On January 3, 2021, the President signed into law the Consolidated Appropriations Act, 2021 (the “Act”). As a result of the Act, the suspension of TDR accounting has been extended to the earlier of January 1, 2022, or the date that is 60 days after the date on which the national emergency concerning the COVID-19 pandemic declared by the President terminates. The requirement that a loan be not more than 30 days past due as of December 31, 2019 is still applicable. In response to the COVID-19 and its economic impact to customers, a short-term modification program that complies with the CARES Act was implemented to provide temporary payment relief to those borrowers directly impacted by COVID-19. The deferred payments along with interest accrued during the deferral period are due and payable on the maturity date. Under recently issued guidance, provided these loans were current as of either year end or the date of the modification, these loans are not considered TDR loans at December 31, 2020 and will not be reported as past due during the deferral period. As of December 31, 2020, the Company had $23.1 million of loans in deferral.
Allowance for CREDIT Losses
The following table summarizes the changes in the Company’s allowance for credit losses for the years indicated:
| | Years Ended December 31, | | |
| | 2020 | | | 2019 | | | 2018 | | | | 2017 | | | 2016 | | |
| | (dollars in thousands) |
Period-end loans outstanding (net of unearned discount and deferred loan fees) | | $ | 3,153,648 | | | $ | 2,226,728 | | | $ | 1,559,772 | | | | $ | 1,350,899 | | | $ | 1,320,154 | | |
Average loans outstanding (net of unearned discount and deferred loan fees) | | $ | 2,856,631 | | | $ | 1,969,696 | | | $ | 1,417,237 | | | | $ | 1,333,341 | | | $ | 1,262,497 | | |
Balance of allowance for credit losses at the beginning of year - loans | | $ | 18,180 | | | $ | 16,768 | | | $ | 15,320 | | | | $ | 15,261 | | | $ | 15,191 | | |
Loans charged-off: | | | | | | | | | | | | | | | | | | | | | | |
Commercial and industrial | | | (400 | ) | | | (338 | ) | | | (73 | ) | | | | (284 | ) | | | (71 | ) | |
Commercial mortgage | | | (264 | ) | | | (1,270 | ) | | | — | | | | | — | | | | — | | |
Consumer | | | (40 | ) | | | (48 | ) | | | (36 | ) | | | | (39 | ) | | | (33 | ) | |
Total loans charged-off | | $ | (704 | ) | | $ | (1,656 | ) | | $ | (109 | ) | | | $ | (323 | ) | | $ | (104 | ) | |
Recovery of loans previously charged-off: | | | | | | | | | | | | | | | | | | | | | | |
Commercial and industrial | | | 250 | | | | 53 | | | | 48 | | | | | 13 | | | | 14 | | |
Commercial mortgage | | | — | | | | — | | | | — | | | | | — | | | | 7 | | |
Residential mortgage | | | — | | | | — | | | | — | | | | | — | | | | 13 | | |
Home Equity | | | — | | | | — | | | | — | | | | | — | | | | 1 | | |
Consumer | | | 15 | | | | 11 | | | | 7 | | | | | 7 | | | | 7 | | |
Total recoveries of loans previously charged-off: | | | 265 | | | | 64 | | | | 55 | | | | | 20 | | | | 42 | | |
Net loan (charge-offs) recoveries | | $ | (439 | ) | | $ | (1,592 | ) | | $ | (54 | ) | | | $ | (303 | ) | | $ | (62 | ) | |
Adoption of CECL accounting standard - loans | | | 205 | | | | — | | | | — | | | | | — | | | | — | | |
Provision for credit losses - acquired loans | | | 8,282 | | | | — | | | | — | | | | | — | | | | — | | |
Initial allowance for PCD | | | 437 | | | | — | | | | — | | | | | — | | | | — | | |
Provision for credit losses - loans | | | 9,351 | | | | 3,004 | | | | 1,502 | | | | | 362 | | | | 132 | | |
Balance at end of period | | $ | 36,016 | | | $ | 18,180 | | | $ | 16,768 | | | | $ | 15,320 | | | $ | 15,261 | | |
Ratio of net (charge-offs) recoveries to average loans outstanding | | | (0.02 | )% | | | (0.08 | )% | | | (0.00 | )% | | | | (0.02 | )% | | | (0.00 | )% | |
Ratio of allowance for credit losses to loans outstanding | | | 1.14 | % | | | 0.82 | % | | | 1.08 | % | | | | 1.13 | % | | | 1.16 | % | |
The allowance for credit losses to loans outstanding excluding PPP loans was 1.19% at December 31, 2020.
The level of charge-offs depends on many factors, including the national and regional economy. Cyclical lagging factors may result in charge-offs being higher than historical levels. Although the allowance is allocated between categories, the entire allowance is available to absorb losses attributable to all loan categories. Management believes that the allowance for credit losses is adequate.
See additional discussion regarding the allowance for credit losses, in Item 7 under the caption “Critical Accounting Policies” and in Note 7 to the Audited Consolidated Financial Statements.
Sources of Funds
General. Deposits traditionally have been our primary source of funds for our investment and lending activities. The Company identifies loss allocationsalso borrows from the FHLB of Boston or the Federal Reserve Bank of Boston (“FRB of Boston”), and utilizes brokered deposits to supplement cash flow needs, to lengthen the maturities of liabilities for impairedinterest rate risk management purposes, and to manage our cost of funds. Our additional sources of funds are scheduled payments and prepayments of principal and interest on loans and investment securities and fee income and proceeds from the sales of loans and securities.
Deposits. The Company accepts deposits primarily from customers in the communities in which our branches and offices are located, as well as from small- and medium-sized businesses and other customers throughout our lending area. We rely on anour competitive pricing and products, convenient locations, and client service to attract and retain deposits. We offer a variety of deposit accounts with a range of interest rates and terms. Our deposit accounts consist of relationship checking for consumers and businesses, statement savings accounts, certificates of deposit, money market accounts, interest on lawyer trust accounts, commercial and regular checking accounts, and individual loan basis.retirement accounts. Deposit rates and terms are based primarily on current business strategies, market interest rates, liquidity requirements, and our deposit growth goals. The Bank may also access the brokered deposit market for funding.
At December 31, 2020, we had a total of $223.8 million in certificates of deposit, excluding brokered deposits, of which $185.9 million had remaining maturities of one year or less. Based on historical experience and our current pricing strategy, we believe the Bank will retain a large portion of these accounts upon maturity. The Bank had total brokered deposits of $30.8 million, $7.1 million, and $27.5 million at December 31, 2020, 2019, and 2018, respectively.
Nonperforming loans increased duringThe following table sets forth the Bank’s deposits for the periods indicated:
| | December 31, | December 31, | |
| | 2020 | 2019 | |
| | Amount | | | Percent | | | Amount | | | Percent | |
| | (dollars in thousands) | |
Demand deposits (non-interest bearing) | | $ | 1,006,132 | | | | 29.7 | % | | $ | 630,593 | | | | 26.7 | % |
Interest bearing checking | | | 625,650 | | | | 18.4 | % | | | 450,098 | | | | 19.1 | % |
Money market | | | 532,218 | | | | 15.6 | % | | | 181,406 | | | | 7.7 | % |
Savings | | | 984,262 | | | | 28.9 | % | | | 914,499 | | | | 38.8 | % |
Retail certificates of deposit under $100,000 | | | 62,646 | | | | 1.8 | % | | | 56,602 | | | | 2.4 | % |
Retail certificates of deposit of $100,000 or greater | | | 161,387 | | | | 4.7 | % | | | 118,596 | | | | 5.0 | % |
Wholesale certificates of deposit | | | 30,788 | | | | 0.9 | % | | | 7,084 | | | | 0.3 | % |
Total | | $ | 3,403,083 | | | | 100.0 | % | | $ | 2,358,878 | | | | 100.0 | % |
Retail certificates of deposit of $100,000 or greater by maturity are as follows:
| | December 31, | |
| | 2020 | | | 2019 | |
| | (dollars in thousands) | |
Less than 3 months remaining | | $ | 34,453 | | | $ | 35,054 | |
3 to 5 months remaining | | | 41,755 | | | | 32,245 | |
6 to 11 months remaining | | | 61,320 | | | | 27,119 | |
12 months or more remaining | | | 23,859 | | | | 24,178 | |
Total | | $ | 161,387 | | | $ | 118,596 | |
Interest expense on retail certificates of deposit of $100,000 or greater was $126,000 and $2.1 million for the years ended December 31, 2020 and 2019, from 2018 primarily duerespectively.
The following table sets forth certificates of deposit classified by interest rate as of the dates indicated:
| | December 31, | |
| | 2020 | | | 2019 | |
| | (dollars in thousands) | |
Interest Rate: | | | | | | | | |
Less than 1.00% | | $ | 156,732 | | | $ | 51,306 | |
1.00% to 1.99% | | | 62,194 | | | | 62,986 | |
2.00% to 2.99% | | | 35,895 | | | | 67,990 | |
Total | | $ | 254,821 | | | $ | 182,282 | |
Borrowings. Total borrowings were $33.0 million, a decrease of $102.7 million as compared to an increase in loans on nonaccrual$135.7 million at December 31, 2019. NonperformingThe Company’s borrowings consisted of advances from the FHLB of Boston. FHLB of Boston advances are collateralized by a blanket pledge agreement on the Company’s FHLB of Boston stock and residential mortgages held in the Bank’s portfolios.
The Bank’s remaining borrowing capacity at the FHLB of Boston at December 31, 2020 was approximately $672.7 million. In addition, the Bank has a $10.0 million line of credit with the FHLB of Boston.
The Company had no borrowings outstanding with the FRB Boston at both December 31, 2020 and 2019. The Company’s remaining borrowing capacity at the FRB Boston at December 31, 2020 was approximately $562.4 million.
See Note 12 - Borrowings, for a schedule, including related interest rates and other information.
Net Interest MargiN
Net interest income represents the difference between interest earned, primarily on loans decreasedand investments, and interest paid on funding sources, primarily deposits and borrowings. Interest rate spread is the difference between the average rate earned on total interest-earning assets and the average rate paid on total interest-bearing liabilities. Net interest margin is the amount of net interest income, on a fully taxable-equivalent basis, expressed as a percentage of average interest-earning assets. The average rate earned on earning assets is the amount of annualized taxable equivalent interest income expressed as a percentage of average earning assets. The average rate paid on interest-bearing liabilities is equal to annualized interest expense as a percentage of average interest-bearing liabilities.
The following table sets forth the distribution of the Company’s average assets, liabilities and shareholders’ equity, and average rates earned or paid on a fully taxable equivalent basis for each of the periods indicated:
| | Year Ended | |
| | December 31, 2020 | | | December 31, 2019 | | | December 31, 2018 | |
| | Average Balance | | | Interest Income/ Expenses (1) | | | Rate Earned/ Paid (1) | | | Average Balance | | | Interest Income/ Expenses (1) | | | Rate Earned/ Paid (1) | | | Average Balance | | | Interest Income/ Expenses (1) | | | Rate Earned/ Paid (1) | |
| | (dollars in thousands) | |
ASSETS | | | | | | | | | | | | | | | | | | | | | | | | | | | | | | | | | | | | |
Interest-earning assets | | | | | | | | | | | | | | | | | | | | | | | | | | | | | | | | | | | | |
Loans (2) | | | | | | | | | | | | | | | | | | | | | | | | | | | | | | | | | | | | |
Taxable | | $ | 2,832,796 | | | $ | 119,447 | | | | 4.22 | % | | $ | 1,952,374 | | | $ | 84,382 | | | | 4.32 | % | | $ | 1,407,079 | | | $ | 57,941 | | | | 4.12 | % |
Tax-exempt | | | 23,835 | | | | 1,115 | | | | 4.68 | | | | 17,322 | | | | 740 | | | | 4.27 | | | | 10,158 | | | | 469 | | | | 4.62 | |
Securities available for sale (3) | | | | | | | | | | | | | | | | | | | | | | | | | | | | | | | | | | | | |
Taxable | | | 136,776 | | | | 2,337 | | | | 1.71 | | | | 154,256 | | | | 2,884 | | | | 1.87 | | | | 194,419 | | | | 3,202 | | | | 1.65 | |
Securities held to maturity | | | | | | | | | | | | | | | | | | | | | | | | | | | | | | | | | | | | |
Taxable | | | 152,789 | | | | 3,711 | | | | 2.43 | | | | 204,909 | | | | 5,079 | | | | 2.48 | | | | 189,120 | | | | 4,255 | | | | 2.25 | |
Tax-exempt | | | 89,841 | | | | 3,145 | | | | 3.50 | | | | 75,432 | | | | 2,897 | | | | 3.84 | | | | 76,966 | | | | 3,043 | | | | 3.95 | |
Cash and cash equivalents | | | 69,783 | | | | 187 | | | | 0.27 | | | | 50,839 | | | | 731 | | | | 1.44 | | | | 45,365 | | | | 595 | | | | 1.31 | |
Total interest-earning assets (4) | | | 3,305,820 | | | | 129,942 | | | | 3.93 | % | | | 2,455,132 | | | | 96,713 | | | | 3.94 | % | | | 1,923,107 | | | | 69,505 | | | | 3.61 | % |
Non interest-earning assets | | | 245,316 | | | | | | | | | | | | 162,529 | | | | | | | | | | | | 73,330 | | | | | | | | | |
Allowance for loan losses | | | (27,887 | ) | | | | | | | | | | | (17,345 | ) | | | | | | | | | | | (15,857 | ) | | | | | | | | |
Total assets | | $ | 3,523,249 | | | | | | | | | | | $ | 2,600,316 | | | | | | | | | | | $ | 1,980,580 | | | | | | | | | |
LIABILITIES AND SHAREHOLDERS’ EQUITY | | | | | | | | | | | | | | | | | | | | | | | | | | | | | | | | | | | | |
Interest-bearing deposits | | | | | | | | | | | | | | | | | | | | | | | | | | | | | | | | | | | | |
Checking accounts | | $ | 554,000 | | | $ | 682 | | | | 0.12 | % | | $ | 417,226 | | | $ | 440 | | | | 0.11 | % | | $ | 409,178 | | | $ | 247 | | | | 0.06 | % |
Savings accounts | | | 937,247 | | | | 3,378 | | | | 0.36 | | | | 827,279 | | | | 8,708 | | | | 1.05 | | | | 624,421 | | | | 2,900 | | | | 0.46 | |
Money market accounts | | | 350,117 | | | | 1,277 | | | | 0.36 | | | | 189,836 | | | | 2,481 | | | | 1.31 | | | | 93,449 | | | | 597 | | | | 0.64 | |
Certificates of deposit | | | 259,568 | | | | 1,958 | | | | 0.75 | | | | 221,299 | | | | 4,012 | | | | 1.81 | | | | 134,007 | | | | 1,279 | | | | 0.95 | |
Total interest-bearing deposits | | | 2,100,932 | | | | 7,295 | | | | 0.35 | % | | | 1,655,640 | | | | 15,641 | | | | 0.94 | % | | | 1,261,055 | | | | 5,023 | | | | 0.40 | % |
Subordinated debt | | | 5,408 | | | | 444 | | | | 8.21 | | | | — | | | | — | | | | — | | | | - | | | | | | | | | |
Other borrowed funds | | | 123,693 | | | | 1,406 | | | | 1.14 | | | | 86,712 | | | | 2,002 | | | | 2.31 | | | | 18,671 | | | | 444 | | | | 2.38 | |
Total interest-bearing liabilities | | | 2,230,033 | | | | 9,145 | | | | 0.41 | % | | | 1,742,352 | | | | 17,643 | | | | 1.01 | % | | | 1,279,726 | | | | 5,467 | | | | 0.43 | % |
Non-interest-bearing liabilities | | | | | | | | | | | | | | | | | | | | | | | | | | | | | | | | | | | | |
Demand deposits | | | 838,653 | | | | | | | | | | | | 567,500 | | | | | | | | | | | | 521,091 | | | | | | | | | |
Other liabilities | | | 103,086 | | | | | | | | | | | | 68,847 | | | | | | | | | | | | 24,217 | | | | | | | | | |
Total liabilities | | | 3,171,772 | | | | | | | | | | | | 2,378,699 | | | | | | | | | | | | 1,825,034 | | | | | | | | | |
Shareholders’ equity | | | 351,477 | | | | | | | | | | | | 221,617 | | | | | | | | | | | | 155,546 | | | | | | | | | |
Total liabilities & shareholders’ equity | | $ | 3,523,249 | | | | | | | | | | | $ | 2,600,316 | | | | | | | | | | | $ | 1,980,580 | | | | | | | | | |
Net interest income on a fully taxable equivalent basis | | | | | | | 120,797 | | | | | | | | | | | | 79,070 | | | | | | | | | | | | 64,038 | | | | | |
Less taxable equivalent adjustment | | | | | | | (895 | ) | | | | | | | | | | | (764 | ) | | | | | | | | | | | (737 | ) | | | | |
Net interest income | | | | | | $ | 119,902 | | | | | | | | | | | $ | 78,306 | | | | | | | | | | | $ | 63,301 | | | | | |
Net interest spread (5) | | | | | | | | | | | 3.52 | % | | | | | | | | | | | 2.93 | % | | | | | | | | | | | 3.19 | % |
Net interest margin (6) | | | | | | | | | | | 3.65 | % | | | | | | | | | | | 3.22 | % | | | | | | | | | | | 3.33 | % |
(1) | Annualized on a fully taxable equivalent basis calculated using a federal tax rate of 21% for 2020, 2019, and 2018. |
(2) | Non-accrual loans are included in average amounts outstanding. |
(3) | Average balances of securities available for sale calculated utilizing amortized cost. |
(4) | Federal Home Loan Bank stock balance and dividend income is excluded from interest-earning assets. |
(5) | Net Interest rate spread represents the difference between the weighted average yield on interest-earning assets, inclusive of PPP loans originated during 2020, and the weighted average cost of interest-bearing liabilities. |
(6) | Net interest margin represents net interest income on a fully tax equivalent basis as a percentage of average interest-earning assets, inclusive of PPP loans originated during 2020. |
Rate/Volume Analysis
The following table describes the extent to which changes in interest rates and changes in the volume of interest-earning assets and interest-bearing liabilities have affected the Company’s interest income and interest expense during 2018the periods indicated. Information is provided in each category with respect to: (i) changes attributable to changes in volumes (changes in average balance multiplied by prior year average rate), (ii) changes attributable to changes in rate (change in average interest rate multiplied by prior year average balance), and (iii) changes attributable to the combined impact of volumes and rates have been allocated proportionately to separate volume and rate categories.
| | Year Ended December 31, 2020 | | | Year Ended December 31, 2019 | |
| | Compared with | | | Compared with | |
| | Year Ended December 31, 2019 | | | Year Ended December 31, 2018 | |
| | Increase/(Decrease) Due to Change in | | | Increase/(Decrease) Due to Change in | |
| | Volume | | | Rate | | | Total | | | Volume | | | Rate | | | Total | |
| | (dollars in thousands) | | | (dollars in thousands) | |
Interest income | | | | | | | | | | | | | | | | | | | | | | | | |
Loans | | | | | | | | | | | | | | | | | | | | | | | | |
Taxable | | $ | 37,171 | | | $ | (2,106 | ) | | $ | 35,065 | | | $ | 23,441 | | | $ | 3,000 | | | $ | 26,441 | |
Tax-exempt | | | 299 | | | | 76 | | | | 375 | | | | 308 | | | | (37 | ) | | | 271 | |
Securities available for sale | | | | | | | | | | | | | | | | | | | | | | | | |
Taxable | | | (311 | ) | | | (236 | ) | | | (547 | ) | | | (716 | ) | | | 398 | | | | (318 | ) |
Securities held to maturity | | | | | | | | | | | | | | | | | | | | | | | | |
Taxable | | | (1,268 | ) | | | (100 | ) | | | (1,368 | ) | | | 372 | | | | 452 | | | | 824 | |
Tax-exempt | | | 520 | | | | (272 | ) | | | 248 | | | | (60 | ) | | | (86 | ) | | | (146 | ) |
Cash and due from banks | | | 203 | | | | (747 | ) | | | (544 | ) | | | 76 | | | | 60 | | | | 136 | |
Total interest income | | $ | 36,614 | | | $ | (3,385 | ) | | $ | 33,229 | | | $ | 23,421 | | | $ | 3,787 | | | $ | 27,208 | |
Interest expense | | | | | | | | | | | | | | | | | | | | | | | | |
Deposits | | | | | | | | | | | | | | | | | | | | | | | | |
Checking accounts | | | 160 | | | | 82 | | | | 242 | | | | 5 | | | | 188 | | | | 193 | |
Savings accounts | | | 1,030 | | | | (6,360 | ) | | | (5,330 | ) | | | 1,186 | | | | 4,622 | | | | 5,808 | |
Money market accounts | | | 1,280 | | | | (2,484 | ) | | | (1,204 | ) | | | 936 | | | | 948 | | | | 1,884 | |
Certificates of deposit | | | 601 | | | | (2,655 | ) | | | (2,054 | ) | | | 1,148 | | | | 1,585 | | | | 2,733 | |
Total interest-bearing deposits | | | 3,071 | | | | (11,417 | ) | | | (8,346 | ) | | | 3,275 | | | | 7,343 | | | | 10,618 | |
Subordinated debt | | | 444 | | | | — | | | | 444 | | | | — | | | | — | | | | — | |
Other borrowed funds | | | 656 | | | | (1,252 | ) | | | (596 | ) | | | 1,571 | | | | (13 | ) | | | 1,558 | |
Total interest expense | | $ | 4,171 | | | $ | (12,669 | ) | | $ | (8,498 | ) | | $ | 4,846 | | | $ | 7,330 | | | $ | 12,176 | |
Change in net interest income | | $ | 32,443 | | | $ | 9,284 | | | $ | 41,727 | | | $ | 18,575 | | | $ | (3,543 | ) | | $ | 15,032 | |
Excluding the impact of merger-related loan accretion and the impact of PPP loans, the adjusted net interest margin for the year ended December 31, 2020 was 3.36%, representing a 14 basis points increase over the net interest margin for the year ended December 31, 2019 of 3.22%.
| | For the Year Ended | |
| | December 31, 2020 | |
| | Average Balance | | | Interest Income/ Expenses | | | Rate Earned/ Paid | |
| | (dollars in thousands) | |
Total interest-earning assets (GAAP) | | $ | 3,305,820 | | | | | | | | | |
Net interest income on a fully taxable equivalent basis (GAAP) | | | | | | $ | 120,797 | | | | | |
Net interest margin (GAAP) | | | | | | | | | | | 3.65 | % |
Less: Paycheck Protection Program loan impact | | | (120,048 | ) | | | (4,062 | ) | | | 0.01 | % |
Less: Accretion of loan fair value adjustments | | | | | | | (9,791 | ) | | | -0.30 | % |
Adjusted net interest margin on a fully taxable equivalent basis | | $ | 3,185,772 | | | $ | 106,944 | | | | 3.36 | % |
Market Risk and Asset Liability Management
Market risk is the risk of loss from 2017adverse changes in market prices and rates. The Company’s market risk arises primarily from interest rate risk inherent in its lending and deposit-taking activities. To that end, management actively monitors and manages its interest rate risk exposure.
The Company’s profitability is affected by fluctuations in interest rates. A sudden and substantial change in interest rates may adversely impact the Company’s earnings to the extent that the interest rates borne by assets and liabilities do not change at the same speed, to the same extent or on the same basis. The Company monitors the impact of changes in interest rates on its net interest income using several tools.
The Company’s primary objective in managing interest rate risk is to minimize the adverse impact of changes in interest rates on the Company’s net interest income and capital, while structuring the Company’s asset-liability structure to obtain the maximum yield-cost spread on that structure. The Company relies primarily on its asset-liability structure to control interest rate risk.
Interest Rate Sensitivity. The Company actively manages its interest rate sensitivity position. The objectives of interest rate risk management are to control exposure of net interest income to risks associated with interest rate movements and to achieve sustainable growth in net interest income. The Company’s Asset Liability Committee (“ALCO”), using policies and procedures approved by the Company’s board of directors, is responsible for the management of the Company’s interest rate sensitivity position. The Company manages interest rate sensitivity by changing the mix, pricing, and re-pricing characteristics of its assets and liabilities, through the management of its investment portfolio, its offerings of loan and selected deposit terms, and through wholesale funding. Wholesale funding consists of, but is not limited to, multiple sources including borrowings with the FHLB of Boston, the Federal Reserve Bank of Boston’s discount window, and certificates of deposit from institutional brokers.
The Company uses several tools to manage its interest rate risk including interest rate sensitivity analysis, or gap analysis, market value of portfolio equity analysis, interest rate simulations under various rate scenarios, and net interest margin reports. The results of these reports are compared to limits established by the Company’s ALCO policies and appropriate adjustments may be made if the results are outside the established limits.
The following table demonstrates the annualized result of an interest rate simulation (excluding purchase accounting adjustments and PPP fee income) and the estimated effect that a parallel interest rate shift, or “shock,” in the yield curve and subjective adjustments in deposit pricing might have on the Company’s projected net interest income over the next 12 months and 24 months.
As of December 31, 2020:
| | Year 1 | | Year 2 | |
Change in Interest Rates (in Basis Points) | | Percentage Change in Net Interest Income | | Percentage Change in Net Interest Income | |
Parallel rate shocks | | | | | | |
+400 | | 2.3 | | 15.2 | |
+300 | | 1.1 | | 10.2 | |
+200 | | (0.1) | | 5.1 | |
+100 | | 0.1 | | | 1.0 | |
–100 | | (2.3) | | (12.0) | |
The following table demonstrates the annualized result of an interest rate simulation (excluding purchase accounting adjustments and PPP fee income) and the estimated effect that a gradual interest rate shift in the yield curve and subjective adjustments in deposit pricing might have on the Company’s projected net interest income over the next 12 months and 24 months.
As of December 31, 2020:
| | Year 1 | | Year 2 |
Change in Interest Rates (in Basis Points) | | Percentage Change in Net Interest Income | | Percentage Change in Net Interest Income |
| | | | |
Gradual rate shifts | | | | |
+200 | | (1.3) | | 1.6 |
–100 | | 0.3 | | (9.2) |
These simulations assume that there is no growth in interest-earning assets or interest-bearing liabilities over the next 12 months and 24 months. The changes to net interest income shown above are in compliance with the Company’s policy guidelines.
Economic Value of Equity Analysis. The Company also analyzes the sensitivity of the Bank’s financial condition to changes in interest rates through our economic value of equity model. This analysis measures the difference between estimated changes in the present value of the Bank’s assets and estimated changes in the present value of the Bank’s liabilities assuming various changes in current interest rates.
The Bank’s economic value of equity analysis as of December 31, 2020 estimated that, in the event of an instantaneous 200 basis point increase in interest rates, the Bank would experience a 9.7% decrease in the economic value of equity for the next 12 months, and a 9.9% increase in the economic value of equity for the next 24 months. At the same date, our analysis estimated that, in the event of an instantaneous 100 basis point decrease in interest rates, the Bank would experience an 8.0% increase in the economic value of equity over the next 12 months, and an 11.2% increase in the economic value of equity for the next 24 months. The estimates within the economic value of equity calculation are significantly impacted by management’s assumption that the value of non-maturity deposits do not fall below their stated balance as of December 31, 2020. This assumption has the impact of increasing the Bank’s economic value of equity in the falling rate scenario as lower market rates increase the value of the loan and investment portfolios while the value of the non-maturity deposit base remains static. The Company believes retaining customer relationships is the most desirable strategy over the long term.
The estimates of changes in the economic value of our equity require us to make certain assumptions including loan- and mortgage-related investment prepayment speeds, reinvestment rates, and deposit maturities and decay rates. These assumptions are inherently uncertain and, as a result, we cannot precisely predict the impact of changes in interest rates on the economic value of our equity. Although our economic value of equity analysis provides an indication of our interest rate risk exposure at a particular point in time, such estimates are not intended to, and do not, provide a precise forecast of the effect of changes in market interest rates on the economic value of our equity and will differ from actual results.
LIQUIDITY AND CAPITAL RESOURCES
Impact of Inflation and Changing Prices. Our Consolidated Financial Statements and related notes have been prepared in accordance with GAAP. GAAP generally requires the measurement of financial position and operating results in terms of historical dollars without consideration of changes in the relative purchasing power of money over time due to inflation. The impact of inflation is reflected in the increased cost of our operations. Unlike industrial companies, our assets and liabilities are primarily monetary in nature. As a result, changes in market interest rates have a greater impact on performance than the effects of inflation.
Liquidity. Liquidity is defined as the Company’s ability to generate adequate cash to meet its needs for day-to-day operations and material long- and short-term commitments. Liquidity risk is the risk of potential loss if the Company were unable to meet its funding requirements at a reasonable cost. The Company manages its liquidity based on demand and specific events and uncertainties to meet current and future financial obligations of a short-term nature. The Company’s objective in managing liquidity is to respond to the needs of depositors and borrowers, as well as increase to earnings enhancement opportunities in a changing marketplace. At December 31, 2020, the Company had access to funds totaling $1.8 billion.
The Company’s liquidity position is managed on a daily basis as part of the daily settlement function and continuously as part of the formal asset liability management process. The Bank’s liquidity is maintained by managing its core deposits as the primary source, selling investment securities, selling loans in the secondary market, borrowing from the FHLB of Boston and the FRB, and purchasing wholesale certificates of deposit as its secondary sources.
The sources of funds for dividends paid by the Company are dividends received from the Bank and liquid funds held by the Company. The Company and the Bank are regulated enterprises and their abilities to pay dividends are subject to regulatory review and restriction. Certain regulatory and statutory restrictions exist regarding dividends, loans, and advances from the Bank to the Company. Generally, the Bank has the ability to pay dividends to the Company subject to minimum regulatory capital requirements.
Quarterly, ALCO reviews the Company’s liquidity needs and reports any findings (if required) to the Board of Directors.
Capital Adequacy. Total shareholders’ equity was $401.7 million at December 31, 2020, as compared to $286.6 million at December 31, 2019. The Company’s equity increased primarily due to net income of $32.0 million, $87.2 million of equity issued as a result of a decreasethe Wellesley merger, before tax-effect increases in loansthe value of the Company’s interest rate derivative positions of $4.7 million, and before tax-effect increases in unrealized gains on nonaccrualthe available for sale investment portfolio of $3.6 million, partially offset by regular dividend payments of $13.1 million paid during the year. The ratio of total equity to total assets was 10.17% and 10.04% at December 31, 2018, as compared to2020 and December 31, 2017.2019, respectively. Book value per share was $58.00 and $53.06, at December 31, 2020 and 2019, respectively.
The Company and the Bank are subject to various regulatory capital requirements. As of December 31, 2020, the Company and the Bank exceeded the regulatory minimum levels to be considered “well capitalized.” See Note 18 – Shareholders’ Equity to the Consolidated Financial Statements for additional discussion of regulatory capital requirements.
Contractual Obligations, Commitments, and Contingencies
The Company has entered into contractual obligations and commitments. The following tables summarize the Company’s contractual cash obligations and other commitments by maturity at December 31, 2020:
| | Payments Due — By Period as of December 31, 2020 | |
CONTRACTUAL OBLIGATIONS | | Total | | | Less Than One Year | | | One to Three Years | | | Three to Five Years | | | After Five Years | |
| | (dollars in thousands) | |
FHLBB advances | | $ | 32,992 | | | $ | 15,157 | | | $ | 17,835 | | | $ | — | | | $ | — | |
Retirement benefit obligations | | | 29,033 | | | | 2,456 | | | | 5,332 | | | | 5,658 | | | | 15,587 | |
Lease obligations | | | 41,681 | | | | 7,173 | | | | 13,151 | | | | 10,010 | | | | 11,347 | |
Certificates of deposit | | | 254,821 | | | | 214,900 | | | | 35,291 | | | | 4,630 | | | | — | |
Total contractual cash Obligations | | $ | 358,527 | | | $ | 239,686 | | | $ | 71,609 | | | $ | 20,298 | | | $ | 26,934 | |
| | Amounts of Commitments Expiring — By Period as of December 31, 2020 | |
OTHER COMMITMENTS | | Total | | | Less Than One Year | | | One to Three Years | | | Three to Five Years | | | After Five Years | |
| | (dollars in thousands) | |
Unused portion of existing lines of credit | | $ | 584,520 | | | $ | 280,892 | | | $ | 120,268 | | | $ | 68,520 | | | $ | 114,840 | |
Standby letters of credit | | | 9,430 | | | | 8,212 | | | | 440 | | | | 778 | | | | — | |
Originations of new loans | | | 94,399 | | | | 94,399 | | | | — | | | | — | | | | — | |
Total commitments | | $ | 688,349 | | | $ | 383,503 | | | $ | 120,708 | | | $ | 69,298 | | | $ | 114,840 | |
Further discussion regarding commitments and contingencies can be found in Note 16 – FINANCIAL INSTRUMENTS WITH OFF-BALANCE SHEET RISK and Note 17 – Commitments and Contingencies to the Consolidated Financial Statements.
Financial Instruments with Off-Balance-Sheet Risk
The Company is party to financial instruments with off-balance-sheet risk in the normal course of business to meet the financing needs of its customers. These financial instruments primarily include commitments to originate and sell loans, standby letters of credit, unused lines of credit, and unadvanced portions of construction loans. The instruments involve, to varying degrees, elements of credit and interest rate risk in excess of the amount recognized in the consolidated balance sheet. The contract or notional amounts of those instruments reflect the extent of involvement the Company has in these particular classes of financial instruments.
The Company’s exposure to credit loss in the event of nonperformance by the other party to the financial instrument for loan commitments, standby letters of credit and unadvanced portions of construction loans is represented by the contractual amount of those instruments. The Company continuesuses the same credit policies in making commitments and conditional obligations as it does for on-balance-sheet instruments.
Off-Balance-Sheet Arrangements. Our significant off-balance-sheet arrangements consist of the following:
| • | commitments to originate and sell loans, |
| • | standby and commercial letters of credit, |
| • | unadvanced portions of construction loans, |
| • | unadvanced portions of other loans, |
| • | loan related derivatives, and |
| • | risk participation agreements. |
Off-balance-sheet arrangements are more fully discussed in Note 16 – Financial Instruments with Off-Balance-Sheet Risk to monitor closely the portfolioConsolidated Financial Statements.
Item 7A. Quantitative and Qualitative Disclosures About Market Risk.
The information required by this item is included in Item 7 of nonperformingthis report under “Market Risk and Asset Liability Management.”
Item 8. Financial Statements and Supplementary Data.
CAMBRIDGE BANCORP AND SUBSIDIARIES
CONSOLIDATED BALANCE SHEETS
| | December 31, 2020 | | | December 31, 2019 | |
| | (dollars in thousands, except par value) | |
Assets | | | | | | | | |
Cash and cash equivalents | | $ | 75,785 | | | $ | 61,335 | |
Investment securities | | | | | | | | |
Available for sale, at fair value (amortized cost $234,252 and $141,109, respectively) | | | 237,030 | | | | 140,330 | |
Held to maturity, at amortized cost (fair value $260,139 and $264,114, respectively) | | | 247,672 | | | | 258,172 | |
Total investment securities | | | 484,702 | | | | 398,502 | |
Loans held for sale, at lower of cost or fair value | | | 6,909 | | | | 1,546 | |
Loans | | | | | | | | |
Residential mortgage | | | 1,298,868 | | | | 917,566 | |
Commercial mortgage | | | 1,358,962 | | | | 1,060,574 | |
Home equity | | | 106,194 | | | | 80,675 | |
Commercial & Industrial | | | 347,855 | | | | 133,236 | |
Consumer | | | 41,769 | | | | 34,677 | |
Total loans | | | 3,153,648 | | | | 2,226,728 | |
Less: allowance for credit losses on loans | | | (36,016 | ) | | | (18,180 | ) |
Net loans | | | 3,117,632 | | | | 2,208,548 | |
Federal Home Loan Bank of Boston Stock, at cost | | | 5,734 | | | | 7,854 | |
Bank owned life insurance | | | 46,169 | | | | 37,319 | |
Banking premises and equipment, net | | | 18,158 | | | | 14,756 | |
Right-of-use asset operating leases | | | 34,927 | | | | 33,587 | |
Deferred income taxes, net | | | 11,639 | | | | 8,229 | |
Accrued interest receivable | | | 9,514 | | | | 7,052 | |
Goodwill | | | 51,912 | | | | 31,206 | |
Merger related intangibles, net | | | 2,977 | | | | 3,338 | |
Other assets | | | 83,239 | | | | 42,291 | |
Total assets | | $ | 3,949,297 | | | $ | 2,855,563 | |
Liabilities | | | | | | | | |
Deposits | | | | | | | | |
Demand | | $ | 1,006,132 | | | $ | 630,593 | |
Interest bearing checking | | | 625,650 | | | | 450,098 | |
Money market | | | 532,218 | | | | 181,406 | |
Savings | | | 984,262 | | | | 914,499 | |
Certificates of deposit | | | 254,821 | | | | 182,282 | |
Total deposits | | | 3,403,083 | | | | 2,358,878 | |
Borrowings | | | 32,992 | | | | 135,691 | |
Operating lease liabilities | | | 37,448 | | | | 35,054 | |
Other liabilities | | | 74,042 | | | | 39,379 | |
Total liabilities | | | 3,547,565 | | | | 2,569,002 | |
Shareholders’ Equity | | | | | | | | |
Common stock, par value $1.00; Authorized: 10,000,000 shares; Outstanding: 6,926,728 shares and 5,400,868 shares, respectively | | | 6,927 | | | | 5,401 | |
Additional paid-in capital | | | 226,967 | | | | 136,766 | |
Retained earnings | | | 165,404 | | | | 146,875 | |
Accumulated other comprehensive income (loss) | | | 2,434 | | | | (2,481 | ) |
Total shareholders’ equity | | | 401,732 | | | | 286,561 | |
Total liabilities and shareholders’ equity | | $ | 3,949,297 | | | $ | 2,855,563 | |
The accompanying notes are an integral part of these consolidated financial statements.
CAMBRIDGE BANCORP AND SUBSIDIARIES
CONSOLIDATED STATEMENTS OF INCOME
| | | For the Year Ended December 31, | |
| | | | | | | | | | | | | |
| | | 2020 | | | 2019 | | | 2018 | |
Interest and dividend income | | | | | | | | | | | | | |
Interest on taxable loans | | | $ | 119,447 | | | $ | 84,382 | | | $ | 57,941 | |
Interest on tax-exempt loans | | | | 880 | | | | 584 | | | | 371 | |
Interest on taxable investment securities | | | | 6,048 | | | | 7,963 | | | | 7,457 | |
Interest on tax-exempt investment securities | | | | 2,485 | | | | 2,289 | | | | 2,404 | |
Dividends on FHLB of Boston stock | | | | 331 | | | | 390 | | | | 287 | |
Interest on overnight investments | | | | 187 | | | | 731 | | | | 595 | |
Total interest and dividend income | | | | 129,378 | | | | 96,339 | | | | 69,055 | |
Interest expense | | | | | | | | | | | | | |
Interest on deposits | | | | 7,295 | | | | 15,641 | | | | 5,023 | |
Interest on borrowed funds | | | | 1,406 | | | | 2,002 | | | | 444 | |
Interest on subordinated debt | | | | 444 | | | | — | | | | — | |
Total interest expense | | | | 9,145 | | | | 17,643 | | | | 5,467 | |
Net interest and dividend income | | | | 120,233 | | | | 78,696 | | | | 63,588 | |
Provision for credit losses | | | | 18,310 | | | | 3,004 | | | | 1,502 | |
Net interest and dividend income after provision for credit losses | | | | 101,923 | | | | 75,692 | | | | 62,086 | |
Noninterest income | | | | | | | | | | | | | |
Wealth management revenue | | | | 29,751 | | | | 26,499 | | | | 25,191 | |
Deposit account fees | | | | 2,595 | | | | 3,185 | | | | 3,071 | |
ATM/Debit card income | | | | 1,308 | | | | 1,413 | | | | 1,180 | |
Bank owned life insurance income | | | | 747 | | | | 612 | | | | 526 | |
Gain (loss) on disposition of investment securities | | | | 69 | | | | (79 | ) | | | 2 | |
Gain on loans sold | | | | 1,850 | | | | 1,170 | | | | 99 | |
Loan related derivative income | | | | 1,479 | | | | 1,674 | | | | 1,651 | |
Other income | | | | 1,726 | | | | 1,927 | | | | 1,269 | |
Total noninterest income | | | | 39,525 | | | | 36,401 | | | | 32,989 | |
Noninterest expense | | | | | | | | | | | | | |
Salaries and employee benefits | | | | 58,975 | | | | 47,494 | | | | 41,212 | |
Occupancy and equipment | | | | 13,004 | | | | 10,855 | | | | 9,072 | |
Data processing | | | | 7,662 | | | | 6,232 | | | | 5,177 | |
Professional services | | | | 4,190 | | | | 3,623 | | | | 3,258 | |
Marketing | | | | 1,818 | | | | 1,760 | | | | 2,229 | |
FDIC insurance (credit) | | | | 992 | | | | 291 | | | | 574 | |
Nonoperating expenses | | | | 7,612 | | | | 4,721 | | | | 201 | |
Other expenses | | | | 3,832 | | | | 3,199 | | | | 2,264 | |
Total noninterest expense | | | | 98,085 | | | | 78,175 | | | | 63,987 | |
Income before income taxes | | | | 43,363 | | | | 33,918 | | | | 31,088 | |
Income tax expense | | | | 11,404 | | | | 8,661 | | | | 7,207 | |
Net income | | | $ | 31,959 | | | $ | 25,257 | | | $ | 23,881 | |
Share data: | | | | | | | | | | | | | |
Weighted average number of shares outstanding, basic | | | | 6,289,481 | | | | 4,629,255 | | | | 4,061,529 | |
Weighted average number of shares outstanding, diluted | | | | 6,344,409 | | | | 4,661,720 | | | | 4,098,633 | |
Basic earnings per share | | | $ | 5.07 | | | $ | 5.41 | | | $ | 5.82 | |
Diluted earnings per share | | | $ | 5.03 | | | $ | 5.37 | | | $ | 5.77 | |
The accompanying notes are an integral part of these consolidated financial statements.
CAMBRIDGE BANCORP AND SUBSIDIARIES
CONSOLIDATED STATEMENTS OF COMPREHENSIVE INCOME
| | For the Year Ended December 31, | |
| | 2020 | | | 2019 | | | 2018 | |
| | (dollars in thousands) | |
Net income | | $ | 31,959 | | | $ | 25,257 | | | $ | 23,881 | |
Other comprehensive income, net of tax: | | | | | | | | | | | | |
Available for sale securities | | | | | | | | | | | | |
Unrealized holding gains(losses) | | | 2,800 | | | | 2,500 | | | | (242 | ) |
Less: reclassification adjustment for (gains)losses realized in net income | | | (57 | ) | | | 62 | | | | (2 | ) |
Total unrealized gains(losses) on available for sale securities | | | 2,743 | | | | 2,562 | | | | (244 | ) |
Interest rate swaps designated as cash flow hedges | | | | | | | | | | | | |
Unrealized holding gains(losses) | | | 4,758 | | | | 713 | | | | 720 | |
Less: reclassification adjustment for (gains)losses realized in net income | | | (1,354 | ) | | | 108 | | | | 31 | |
Defined benefit retirement plans | | | | | | | | | | | | |
Change in retirement liabilities | | | (1,232 | ) | | | 623 | | | | 89 | |
Other comprehensive income | | | 4,915 | | | | 4,006 | | | | 596 | |
Comprehensive income | | $ | 36,874 | | | $ | 29,263 | | | $ | 24,477 | |
The accompanying notes are an integral part of these consolidated financial statements.
CAMBRIDGE BANCORP AND SUBSIDIARIES
CONSOLIDATED STATEMENTS OF CHANGES IN SHAREHOLDERS’ EQUITY
| | For the Years Ended December 31, | |
| | Common Stock | | | | | Additional Paid-In Capital | | | | | Retained Earnings | | | | | Accumulated Other Comprehensive Income / (Loss) | | | | | Total Shareholders’ Equity | |
| | (dollars in thousands, except per share data) | |
Balance at December 31, 2017 | | $ | 4,082 | | | | | $ | 35,663 | | | | | $ | 114,093 | | | | | $ | (5,881 | ) | | | | $ | 147,957 | |
Cumulative effect of accounting changes | | | — | | | | | | — | | | | | | 1,202 | | | | | | (1,202 | ) | | | | | — | |
Net income | | | — | | | | | | — | | | | | | 23,881 | | | | | | — | | | | | | 23,881 | |
Other comprehensive income | | | — | | | | | | — | | | | | | — | | | | | | 596 | | | | | | 596 | |
Share based compensation and other share-based activity | | | 25 | | | | | | 2,608 | | | | | | — | | | | | | — | | | | | | 2,633 | |
Dividends declared ($1.96 per share) | | | — | | | | | | — | | | | | | (8,041 | ) | | | | | — | | | | | | (8,041 | ) |
Balance at December 31, 2018 | | $ | 4,107 | | | | | $ | 38,271 | | | | | $ | 131,135 | | | | | $ | (6,487 | ) | | | | $ | 167,026 | |
| | | | | | | | | | | | | | | | | | | | | | | | | | | | |
Balance at December 31, 2018 | | $ | 4,107 | | | | | $ | 38,271 | | | | | $ | 131,135 | | | | | $ | (6,487 | ) | | | | $ | 167,026 | |
Net income | | | — | | | | | | — | | | | | | 25,257 | | | | | | — | | | | | | 25,257 | |
Other comprehensive income | | | — | | | | | | — | | | | | | — | | | | | | 4,006 | | | | | | 4,006 | |
Share based compensation and other share-based activity | | | 20 | | | | | | 2,150 | | | | | | — | | | | | | — | | | | | | 2,170 | |
Dividends declared ($2.04 per share) | | | — | | | | | | — | | | | | | (9,517 | ) | | | | | — | | | | | | (9,517 | ) |
Common stock issued for Optima merger | | | 723 | | | | | | 58,694 | | | | | | — | | | | | | — | | | | | | 59,417 | |
Common stock offering | | | 551 | | | | | | 37,651 | | | | | | — | | | | | | — | | | | | | 38,202 | |
Balance at December 31, 2019 | | $ | 5,401 | | | | | $ | 136,766 | | | | | $ | 146,875 | | | | | $ | (2,481 | ) | | | | $ | 286,561 | |
| | | | | | | | | | | | | | | | | | | | | | | | | | | | |
Balance at December 31, 2019 | | $ | 5,401 | | | | | $ | 136,766 | | | | | $ | 146,875 | | | | | $ | (2,481 | ) | | | | $ | 286,561 | |
Cumulative effect of accounting changes (Note 3) | | | — | | | | | | — | | | | | | (347 | ) | | | | | — | | | | | | (347 | ) |
Net income | | | — | | | | | | — | | | | | | 31,959 | | | | | | — | | | | | | 31,959 | |
Other comprehensive income | | | — | | | | | | — | | | | | | — | | | | | | 4,915 | | | | | | 4,915 | |
Share based compensation and other share-based activity | | | 23 | | | | | | 4,541 | | | | | | — | | | | | | — | | | | | | 4,564 | |
Dividends declared ($2.12 per share) | | | — | | | | | | — | | | | | | (13,083 | ) | | | | | — | | | | | | (13,083 | ) |
Common stock issued for Wellesley merger | | | 1,503 | | | | | | 85,660 | | | | | | — | | | | | | — | | | | | | 87,163 | |
Balance at December 31, 2020 | | $ | 6,927 | | | | | $ | 226,967 | | | | | $ | 165,404 | | | | | $ | 2,434 | | | | | $ | 401,732 | |
The accompanying notes are an integral part of these consolidated financial statements.
CAMBRIDGE BANCORP AND SUBSIDIARIES
CONSOLIDATED STATEMENTS OF CASH FLOWS
| | | | | | | | | | | | |
| | For the Year Ended December 31, | |
| | 2020 | | | 2019 | | | 2018 | |
| | (dollars in thousands) | |
CASH FLOWS FROM OPERATING ACTIVITIES | | | | | | | | | | | | |
Net income | | $ | 31,959 | | | $ | 25,257 | | | $ | 23,881 | |
Adjustments to reconcile net income to net cash provided by operating activities: | | | | | | | | | | | | |
Provision for credit losses | | | 18,310 | | | | 3,004 | | | | 1,502 | |
Amortization(accretion) of deferred charges and fees net | | | (780 | ) | | | 166 | | | | 777 | |
(Accretion), depreciation, and amortization, net | | | (8,134 | ) | | | 828 | | | | 1,888 | |
Bank owned life insurance income | | | (747 | ) | | | (612 | ) | | | (526 | ) |
(Gain)/loss on disposition of investment securities | | | (69 | ) | | | 79 | | | | (2 | ) |
Share based compensation and other share-based activity | | | 4,564 | | | | 2,170 | | | | 2,633 | |
Change in accrued interest receivable | | | 253 | | | | (162 | ) | | | (634 | ) |
Deferred income tax (benefit)/expense | | | (665 | ) | | | 110 | | | | (721 | ) |
Change in other assets, net | | | (22,863 | ) | | | (11,667 | ) | | | (12,231 | ) |
Change in other liabilities, net | | | 20,332 | | | | 11,166 | | | | 7,455 | |
Change in loans held for sale | | | (5,363 | ) | | | (1,546 | ) | | | — | |
Net cash provided by operating activities | | | 36,797 | | | | 28,793 | | | | 24,022 | |
CASH FLOWS FROM INVESTING ACTIVITIES | | | | | | | | | | | | |
Origination of loans | | | (1,070,321 | ) | | | (790,097 | ) | | | (596,259 | ) |
Proceeds from principal payments of loans | | | 1,022,516 | | | | 524,907 | | | | 387,537 | |
Proceeds from loan pool sale | | | — | | | | 74,412 | | | | — | |
Proceeds from calls/maturities of securities available for sale | | | 47,087 | | | | 49,832 | | | | 35,415 | |
Purchase of securities available for sale | | | (140,570 | ) | | | (23,450 | ) | | | — | |
Proceeds from sales of securities available for sale | | | 10,821 | | | | 26,552 | | | | 702 | |
Proceeds from calls/maturities of securities held to maturity | | | 56,007 | | | | 72,655 | | | | 33,064 | |
Purchase of securities held to maturity | | | (33,818 | ) | | | (48,906 | ) | | | (84,261 | ) |
Proceeds from settlement of bank owned life insurance policies | | | — | | | | — | | | | 676 | |
Redemption (purchase) of FHLB of Boston stock | | | 8,505 | | | | 456 | | | | (2,602 | ) |
Purchase of banking premises and equipment | | | (2,218 | ) | | | (1,896 | ) | | | (1,155 | ) |
Net cash acquired in business combinations | | | 43,063 | | | | 2,063 | | | | — | |
Net cash used in investing activities | | | (58,928 | ) | | | (113,472 | ) | | | (226,883 | ) |
CASH FLOWS FROM FINANCING ACTIVITIES | | | | | | | | | | | | |
Change in demand, interest bearing, money market and savings accounts | | | 422,866 | | | | 171,961 | | | | 74,421 | |
Change in certificates of deposit | | | (138,213 | ) | | | (101,928 | ) | | | (38,467 | ) |
Change in borrowings | | | (224,989 | ) | | | 28,823 | | | | 89,830 | |
Proceeds from common stock offering (net of underwriting fees) | | | — | | | | 38,202 | | | | — | |
Redemption of subordinated debt | | | (10,000 | ) | | | — | | | | — | |
Cash dividends paid on common stock | | | (13,083 | ) | | | (9,517 | ) | | | (8,041 | ) |
Net cash provided by financing activities | | | 36,581 | | | | 127,541 | | | | 117,743 | |
Net change in cash and cash equivalents | | | 14,450 | | | | 42,862 | | | | (85,118 | ) |
Cash and cash equivalents at beginning of period | | | 61,335 | | | | 18,473 | | | | 103,591 | |
Cash and cash equivalents at end of period | | $ | 75,785 | | | $ | 61,335 | | | $ | 18,473 | |
SUPPLEMENTAL DISCLOSURES OF CASH FLOW INFORMATION: | | | | | | | | | | | | |
Cash paid during the period for: | | | | | | | | | | | | |
Interest | | $ | 9,172 | | | $ | 17,918 | | | $ | 5,457 | |
Income taxes | | | 14,628 | | | | 7,770 | | | | 8,330 | |
Significant non-cash transactions | | | | | | | | | | | | |
Right-of-use assets for lessee operating leases | | | — | | | | 33,587 | | | | — | |
Right-of-use liabilities for lessee operating leases | | | — | | | | 35,054 | | | | — | |
Transfer of other real estate owned | | | 2,293 | | | | 163 | | | | — | |
Common Stock issued to shareholders due to merger | | | 87,163 | | | | 59,417 | | | | — | |
Fair value of assets acquired, net of cash acquired | | | 961,668 | | | | 548,801 | | | | — | |
Fair value of liabilities assumed | | | 917,569 | | | | 491,447 | | | | — | |
The accompanying notes are an integral part of these consolidated financial statements.
CAMBRIDGE BANCORP AND SUBSIDIARIES
NOTES TO CONSOLIDATED FINANCIAL STATEMENTS
December 31, 2020
The accompanying consolidated financial statements include the accounts of Cambridge Bancorp (the “Company”) and its wholly owned subsidiary, Cambridge Trust Company (the “Bank”), and the Bank’s subsidiaries, Cambridge Trust Company of New Hampshire, Inc., CTC Security Corporation, and CTC Security Corporation III. References to the Company herein relate to the consolidated group of companies. All significant intercompany accounts and transactions have been eliminated in preparation of the consolidated financial statements.
The Company is a state-chartered, federally registered bank holding company headquartered in Cambridge, Massachusetts, incorporated in 1983. The Company is the sole shareholder of the Bank, a Massachusetts trust company chartered in 1890 which is a commercial bank. The Company is a private bank offering a full range of private banking and wealth management services to our clients. The private banking business, the Company’s only reportable operating segment, is managed as a single strategic unit.
As a private bank, the Company focuses on 4 core services that center around client needs. The core services include Wealth Management, Commercial Banking, Residential Lending, and Personal Banking. The Bank offers a full range of commercial and consumer banking services through its network of 21 private banking offices in Massachusetts and New Hampshire. The Bank is engaged principally in the business of attracting deposits from the public and investing those deposits. The Bank invests those funds in various types of loans, including residential and commercial real estate, and a variety of commercial and consumer loans. The Bank also invests its deposits and borrowed funds in investment securities and has 2 wholly owned Massachusetts security corporations, CTC Security Corporation and CTC Security Corporation III, for this purpose. Deposits at the Bank are insured by the Federal Deposit Insurance Corporation (“FDIC”) for the maximum amount permitted by FDIC Regulations.
Trust and investment management services are offered through the Bank’s private banking offices in Massachusetts and New Hampshire, and its wealth management offices located in Boston and Wellesley, Massachusetts and Concord, Manchester, and Portsmouth, New Hampshire. The Bank also has a non-depository trust company, Cambridge Trust Company of New Hampshire, Inc., which allows non-New Hampshire residents the opportunity to take advantage of the state’s favorable trust laws. The assets held for wealth management clients are not assets of the Bank and, accordingly, are not reflected in the accompanying consolidated balance sheets.
2. | SUMMARY OF SIGNIFICANT ACCOUNTING POLICIES |
Basis of Presentation
The consolidated financial statements have been prepared in conformity with U.S. generally accepted accounting principles (“GAAP”).
Use of Estimates
The preparation of consolidated financial statements in conformity with GAAP requires management to make estimates and assumptions that affect the reported amounts of assets and liabilities and disclosure of contingent assets and liabilities at the date of the consolidated financial statements. Actual results could differ from those estimates. The allowance for credit losses, the valuation of deferred tax assets, and the valuation of assets acquired and liabilities assumed in business combinations are particularly subject to change.
Reclassifications
Certain amounts in the prior year’s financial statements may have been reclassified to conform with the current year’s presentation.
Cash and Cash Equivalents
Cash and cash equivalents consist of cash on hand, amounts due from banks, and overnight investments.
Investment Securities
Investment securities are classified as either ‘held to maturity’ or ‘available for sale’ in accordance with the Financial Accounting Standards Board (“FASB”) Accounting Standards Codification (“ASC”) 320, Investments – Debt Securities. Debt securities that management has the positive intent and ability to hold to maturity are classified as held to maturity and recorded at amortized cost.
Debt securities not classified as held to maturity are classified as available for sale and carried at fair value with unrealized after-tax gains and losses reported net as a separate component of shareholders�� equity. The Company classifies its securities based on its intention at the time of purchase.
Purchase premiums and discounts are recognized in interest income using the effective yield or straight-line method over the term of the securities, except for callable debt securities for which management has concerns regarding the abilitypurchase premiums are recognized through the earliest call date. Gains and losses on the sale of debt securities are recorded on the trade date and determined using the specific identification method.
Allowance for Credit Losses- Held to Maturity Securities
The Company measures expected credit losses on held to maturity debt securities on a collective basis by security type and risk rating where available. The reserve for each pool is calculated based on a Probability of Default/Loss Given Default (“PD/LGD”) basis taking into consideration the expected life of each security. Held to maturity securities which are issued by the United States of America (“U.S.”) or are guaranteed by U.S. federal agencies do not currently have an allowance for credit loss as the Company determined these securities are either backed by the full faith and credit of the borrowersU.S. government and/or there is an unconditional commitment to perform. make interest payments and to return the principal investment in full to investors when a debt security reaches maturity. The Company will evaluate this position no less than annually, however, certain items which may cause the Company to change this methodology include legislative changes that remove a government-sponsored enterprise’s (“GSE”) ability to draw funds from the U.S. government, or legislative changes to housing policy that reduce or eliminate the U.S. government’s implicit guarantee on such securities. For securities which are not U.S. treasury or agency backed, risk ratings are generally sourced from Moody’s or Standard & Poor’s (“S&P”). The Company updates loss given default, probability of default, and recovery rates for each security as that information becomes available but no less than annually. The expected remaining life to maturity of each applicable security is updated quarterly. Any expected credit losses on held to maturity securities would be presented as an allowance rather than as a direct write-down through the consolidated statement of income if the Company does not intend to sell or believes that it is more-likely-than-not that the Company will be required to sell the security.
Allowance for Credit Losses-Available for Sale Securities
The Company measures expected credit losses on available for sale securities based upon the gain or loss position of the security. For available-for sale debt securities in an unrealized loss position, which the Company does not intend to sell, or it is not more likely than not that the Company will be required to sell the security before recovery of the Company’s amortized cost, the Company evaluates qualitative criteria to determine any expected loss. This includes among other items the financial health of, and specific prospects for the issuer, including whether the issuer is in compliance with the terms and covenants of the security. The Company also evaluates quantitative criteria including determining whether there has been an adverse change in expected future cash flows of the security. If the Company does not expect to recover the entire amortized cost basis of the security, an allowance for credit losses would be recorded, with a related charge to earnings, limited by the amount of the fair value of the security less its amortized cost. If the Company intends to sell the security or it is more likely than not that the Company will be required to sell the debt security before recovery of its amortized cost basis, the Company recognizes the entire difference between the security’s amortized cost basis and its fair value in earnings.
Prior to the adoption of Topic 326 on January 1, 2020, declines in the fair value of investment securities below their amortized cost that were deemed to be other-than-temporary were reflected in earnings as realized losses to the extent the impairment was related to credit losses. The amount of the impairment related to other factors was recognized in other comprehensive income. In estimating other-than-temporary impairment losses, management considered: (1) the length of time and the extent to which the fair value has been less than cost; (2) the financial condition and near-term prospects of the issuer; and (3) the Company’s intent to sell the security or whether it is more likely than not that the Company will be required to sell the debt security before its anticipated recovery.
Loans
Loans are reported at the amount of their outstanding principal, including deferred loan origination fees and costs, reduced by unearned discounts, and the allowance for credit losses. Loans are considered delinquent when a payment of principal and/or interest becomes past due 30 days following its scheduled payment due date. Loans on which the accrual of interest has been discontinued are designated as non-accrual loans. Loans are removed from non-accrual when they become less than 90 days past due and when concern no longer exists as to the collectability of principal or interest.
Allowance for Credit Losses - Loans
Losses on loan receivables are estimated and recognized upon origination of the loan, based on expected credit losses for the life of the loan balance as of the period end date. The Company uses a discounted cash flow method incorporating probability of default and loss given default forecasted based on statistically derived economic variable loss drivers combined with qualitative factors, to estimate expected credit losses. This process includes estimates which involve modeling loss projections attributable to existing loan
balances, considering historical experience, current conditions, and future expectations for homogeneous pools of loans over the reasonable and supportable forecast period. The reasonable and supportable forecast period is determined based upon the accuracy level of historical loss forecast estimates, the specific loan level models and methodology utilized, and considers material changes in growth and credit strategy, and business changes. For periods beyond a reasonable and supportable forecast interval, the Company reverts to historical information over a period for which comparable data is available. The historical information either experienced by the Company, or by a selection of peer banks when appropriate, is derived from a combination of recessionary and non-recessionary performance periods for which data is available. Similar to the reasonable and supportable forecast period, the Company reassesses the reversion period at the segment level, considering any required adjustments for differences in underwriting standards, portfolio mix, and other relevant data shifts over time.
The Company generally segments its loan receivable population into homogeneous pools of loans. Consistent with the Company’s other assumptions, the Company regularly reviews segmentation to determine whether the segmentation pools remain relevant as risk characteristics change. When a loan no longer meets the criteria of its initial pooling as a result of credit deterioration or other changes, the Company may evaluate the credit for estimated losses on an individual basis if it determines that they no longer retain the same risk characteristics. To the extent that there are a multitude of these loans with new similar credit characteristics, the Company would anticipate a change to the pooling methodology. Loans that do not share risk characteristics are evaluated on an individual basis and are not included in the collective evaluation. For loans with real estate collateral, when management determines that foreclosure is probable, expected credit losses are based on the fair value of the collateral at the reporting date, adjusted for selling costs as appropriate.
The Company evaluates the loan allowance for credit losses quarterly. The Company regularly reviews its collection experience (including delinquencies and net charge-offs) in determining our allowance for credit losses. The Company also considers its historical loss experience to date based on actual defaulted loans and overall portfolio indicators including delinquent and non-accrual loans, trends in loan volume and lending terms, credit policies and other observable environmental factors such as unemployment and interest rate changes.
The underlying assumption estimates and assessments the Company uses to estimate the allowance for credit losses reflects the Company’s best estimate of model assumptions and forecasted conditions at that time. Changes in such estimates can significantly affect the allowance and provision for credit losses. It is possible and likely that the Company will experience credit losses that are different from the current estimates.
The provision for credit losses charged to income is based on management’s judgment of the amount necessary to maintain the allowance at a level to provide for probable inherent credit losses as of the evaluation date. When management believes that the collectability of a loan’s principal balance, or portions thereof, is unlikely, the principal amount is charged against the allowance for credit losses. Recoveries on loans that have been previously charged off are credited to the allowance for loan losses, generally at the time cash is received on a charged-off account. The allowance is an estimate, and ultimate losses may vary from current estimates. As adjustments become necessary, they are reported in the results of operations through the provision for credit losses in the period in which they become known.
Risk characteristics relevant to each portfolio segment are as follows:
Residential mortgage and home equity loans – The Company generally does not originate loans in these segments with a loan-to-value ratio greater than 80%, unless covered by private mortgage insurance, and in all cases not greater than a loan-to-value ratio of 97%. The Company does not originate subprime loans. Loans in these segments are secured by one-to-four family residential real estate, and repayment is primarily dependent on the credit quality of the individual borrower.
Commercial mortgage loans – This includes multi-family properties and construction. The Company generally does not originate loans in this segment with a loan-to-value ratio greater than 75%. Loans in this segment are secured by owner-occupied and nonowner-occupied commercial real estate, and repayment is primarily dependent on the cash flows of the property (if nonowner-occupied) or of the business (if owner-occupied).
Commercial & industrial loans – Loans in this segment are made to businesses and are generally secured by equipment, accounts receivable, or inventory, as well as the personal guarantees of the principal owners of the business, and repayment is primarily dependent on the cash flows generated by the business. In addition, this segment includes loans issued under the United States Small Business Administration’s (“SBA”) Paycheck Protection Program (“PPP”). These loans are guaranteed and are not evaluated for an allowance for credit losses because the Company expects the guarantees will be effective, if necessary.
Consumer loans – Loans in this segment are made to individuals and can be secured or unsecured. Repayment is primarily dependent on the credit quality of the individual borrower.
The majority of the Company’s loans are secured by real estateconcentrated in Eastern Massachusetts and Southern New Hampshire and therefore the overall health of the local economy, including unemployment rates, vacancy rates, and consumer spending levels, can have a material effect on the credit quality of all of these portfolio segments.
The process to determine the allowance for credit losses requires management to exercise considerable judgment regarding the risk characteristics of the loan portfolio segments and the effect of relevant internal and external factors.
Allowance for Credit Losses- Unfunded Commitments
The expected credit losses for unfunded commitments are measured over the contractual period of the Company’s exposure to credit risk. The estimate of credit loss incorporates assumptions for both the likelihood and amount of funding over the estimated life of the commitments, for the risk of loss, and current conditions and expectations. Management periodically reviews and updates its assumptions for estimated funding rates based on historical rates, and factors such as portfolio growth, changes to organizational structure, economic conditions, borrowing habits, or any other factor which could impact the likelihood that funding will occur. The Company does not reserve for unfunded commitments which are unconditionally cancellable.
Acquired Loans
Acquired loans are recorded at fair value at the date of acquisition based on a discounted cash flow methodology that considers various factors, including the type of loan and related collateral, classification status, fixed or variable interest rate, term of loan and whether or not the loan was amortizing, and a discount rate reflecting the Company’s assessment of risk inherent in the cash flow estimates. Purchased loans are grouped together according to similar risk characteristics and are treated in the aggregate when applying various valuation techniques. These cash flow evaluations are inherently subjective as they may be susceptible to significant change.
Effective January 1, 2020, loans acquired in a business combination that have experienced more-than-insignificant deterioration in credit quality since origination are considered purchased credit deteriorated (“PCD”) loans. The Company evaluates acquired loans for deterioration in credit quality based on, but not limited to, the following: (1) non-accrual status; (2) troubled debt restructured designation; (3) risk ratings of special mention, substandard or doubtful; (4) watchlist credits; and (5) delinquency status, including loans that are current on acquisition date, but had been previously delinquent. At the acquisition date, an estimate of expected credit losses is made for groups of PCD loans with similar risk characteristics and individual PCD loans without similar risk characteristics. This initial allowance for credit losses is allocated to individual PCD loans and added to the purchase price or acquisition date fair values to establish the initial amortized cost basis of the PCD loans. As the initial allowance for credit losses is added to the purchase price, there is no credit loss expense recognized upon acquisition of a PCD loan. Any difference between the unpaid principal balance of PCD loans and the amortized cost basis is considered to have adequate collateralrelate to noncredit factors and results in a discount or premium. Discounts and premiums are recognized through interest income on a level-yield method over the life of the loans.
For acquired loans not deemed PCD at acquisition, the differences between the initial fair value to cover the loan balances at December 31, 2019 and December 31, 2018, although such values may fluctuate with changes in the economy and the real estate market.unpaid principal balance are recognized as interest income on a level-yield basis over the lives of the related loans. At the acquisition date, an initial allowance for expected credit losses is estimated and recorded as provision for credit losses. The subsequent measurement of expected credit losses for all acquired loans is the same as the subsequent measurement of expected credit losses for originated loans.
AllowanceSources of Funds
General. Deposits traditionally have been our primary source of funds for Loan Lossesour investment and lending activities. The Company also borrows from the FHLB of Boston or the Federal Reserve Bank of Boston (“FRB of Boston”), and utilizes brokered deposits to supplement cash flow needs, to lengthen the maturities of liabilities for interest rate risk management purposes, and to manage our cost of funds. Our additional sources of funds are scheduled payments and prepayments of principal and interest on loans and investment securities and fee income and proceeds from the sales of loans and securities.
Deposits. The Company accepts deposits primarily from customers in the communities in which our branches and offices are located, as well as from small- and medium-sized businesses and other customers throughout our lending area. We rely on our competitive pricing and products, convenient locations, and client service to attract and retain deposits. We offer a variety of deposit accounts with a range of interest rates and terms. Our deposit accounts consist of relationship checking for consumers and businesses, statement savings accounts, certificates of deposit, money market accounts, interest on lawyer trust accounts, commercial and regular checking accounts, and individual retirement accounts. Deposit rates and terms are based primarily on current business strategies, market interest rates, liquidity requirements, and our deposit growth goals. The Bank may also access the brokered deposit market for funding.
At December 31, 2020, we had a total of $223.8 million in certificates of deposit, excluding brokered deposits, of which $185.9 million had remaining maturities of one year or less. Based on historical experience and our current pricing strategy, we believe the Bank will retain a large portion of these accounts upon maturity. The Bank had total brokered deposits of $30.8 million, $7.1 million, and $27.5 million at December 31, 2020, 2019, and 2018, respectively.
The following table sets forth the Bank’s deposits for the periods indicated:
| | December 31, | December 31, | |
| | 2020 | 2019 | |
| | Amount | | | Percent | | | Amount | | | Percent | |
| | (dollars in thousands) | |
Demand deposits (non-interest bearing) | | $ | 1,006,132 | | | | 29.7 | % | | $ | 630,593 | | | | 26.7 | % |
Interest bearing checking | | | 625,650 | | | | 18.4 | % | | | 450,098 | | | | 19.1 | % |
Money market | | | 532,218 | | | | 15.6 | % | | | 181,406 | | | | 7.7 | % |
Savings | | | 984,262 | | | | 28.9 | % | | | 914,499 | | | | 38.8 | % |
Retail certificates of deposit under $100,000 | | | 62,646 | | | | 1.8 | % | | | 56,602 | | | | 2.4 | % |
Retail certificates of deposit of $100,000 or greater | | | 161,387 | | | | 4.7 | % | | | 118,596 | | | | 5.0 | % |
Wholesale certificates of deposit | | | 30,788 | | | | 0.9 | % | | | 7,084 | | | | 0.3 | % |
Total | | $ | 3,403,083 | | | | 100.0 | % | | $ | 2,358,878 | | | | 100.0 | % |
Retail certificates of deposit of $100,000 or greater by maturity are as follows:
| | December 31, | |
| | 2020 | | | 2019 | |
| | (dollars in thousands) | |
Less than 3 months remaining | | $ | 34,453 | | | $ | 35,054 | |
3 to 5 months remaining | | | 41,755 | | | | 32,245 | |
6 to 11 months remaining | | | 61,320 | | | | 27,119 | |
12 months or more remaining | | | 23,859 | | | | 24,178 | |
Total | | $ | 161,387 | | | $ | 118,596 | |
Interest expense on retail certificates of deposit of $100,000 or greater was $126,000 and $2.1 million for the years ended December 31, 2020 and 2019, respectively.
The following table sets forth certificates of deposit classified by interest rate as of the dates indicated:
| | December 31, | |
| | 2020 | | | 2019 | |
| | (dollars in thousands) | |
Interest Rate: | | | | | | | | |
Less than 1.00% | | $ | 156,732 | | | $ | 51,306 | |
1.00% to 1.99% | | | 62,194 | | | | 62,986 | |
2.00% to 2.99% | | | 35,895 | | | | 67,990 | |
Total | | $ | 254,821 | | | $ | 182,282 | |
Borrowings. Total borrowings were $33.0 million, a decrease of $102.7 million as compared to $135.7 million at December 31, 2019. The Company’s borrowings consisted of advances from the FHLB of Boston. FHLB of Boston advances are collateralized by a blanket pledge agreement on the Company’s FHLB of Boston stock and residential mortgages held in the Bank’s portfolios.
The Bank’s remaining borrowing capacity at the FHLB of Boston at December 31, 2020 was approximately $672.7 million. In addition, the Bank has a $10.0 million line of credit with the FHLB of Boston.
The Company maintains an allowancehad no borrowings outstanding with the FRB Boston at both December 31, 2020 and 2019. The Company’s remaining borrowing capacity at the FRB Boston at December 31, 2020 was approximately $562.4 million.
See Note 12 - Borrowings, for a schedule, including related interest rates and other information.
Net Interest MargiN
Net interest income represents the difference between interest earned, primarily on loans and investments, and interest paid on funding sources, primarily deposits and borrowings. Interest rate spread is the difference between the average rate earned on total interest-earning assets and the average rate paid on total interest-bearing liabilities. Net interest margin is the amount of net interest income, on a fully taxable-equivalent basis, expressed as a percentage of average interest-earning assets. The average rate earned on earning assets is the amount of annualized taxable equivalent interest income expressed as a percentage of average earning assets. The average rate paid on interest-bearing liabilities is equal to annualized interest expense as a percentage of average interest-bearing liabilities.
The following table sets forth the distribution of the Company’s average assets, liabilities and shareholders’ equity, and average rates earned or paid on a fully taxable equivalent basis for each of the periods indicated:
| | Year Ended | |
| | December 31, 2020 | | | December 31, 2019 | | | December 31, 2018 | |
| | Average Balance | | | Interest Income/ Expenses (1) | | | Rate Earned/ Paid (1) | | | Average Balance | | | Interest Income/ Expenses (1) | | | Rate Earned/ Paid (1) | | | Average Balance | | | Interest Income/ Expenses (1) | | | Rate Earned/ Paid (1) | |
| | (dollars in thousands) | |
ASSETS | | | | | | | | | | | | | | | | | | | | | | | | | | | | | | | | | | | | |
Interest-earning assets | | | | | | | | | | | | | | | | | | | | | | | | | | | | | | | | | | | | |
Loans (2) | | | | | | | | | | | | | | | | | | | | | | | | | | | | | | | | | | | | |
Taxable | | $ | 2,832,796 | | | $ | 119,447 | | | | 4.22 | % | | $ | 1,952,374 | | | $ | 84,382 | | | | 4.32 | % | | $ | 1,407,079 | | | $ | 57,941 | | | | 4.12 | % |
Tax-exempt | | | 23,835 | | | | 1,115 | | | | 4.68 | | | | 17,322 | | | | 740 | | | | 4.27 | | | | 10,158 | | | | 469 | | | | 4.62 | |
Securities available for sale (3) | | | | | | | | | | | | | | | | | | | | | | | | | | | | | | | | | | | | |
Taxable | | | 136,776 | | | | 2,337 | | | | 1.71 | | | | 154,256 | | | | 2,884 | | | | 1.87 | | | | 194,419 | | | | 3,202 | | | | 1.65 | |
Securities held to maturity | | | | | | | | | | | | | | | | | | | | | | | | | | | | | | | | | | | | |
Taxable | | | 152,789 | | | | 3,711 | | | | 2.43 | | | | 204,909 | | | | 5,079 | | | | 2.48 | | | | 189,120 | | | | 4,255 | | | | 2.25 | |
Tax-exempt | | | 89,841 | | | | 3,145 | | | | 3.50 | | | | 75,432 | | | | 2,897 | | | | 3.84 | | | | 76,966 | | | | 3,043 | | | | 3.95 | |
Cash and cash equivalents | | | 69,783 | | | | 187 | | | | 0.27 | | | | 50,839 | | | | 731 | | | | 1.44 | | | | 45,365 | | | | 595 | | | | 1.31 | |
Total interest-earning assets (4) | | | 3,305,820 | | | | 129,942 | | | | 3.93 | % | | | 2,455,132 | | | | 96,713 | | | | 3.94 | % | | | 1,923,107 | | | | 69,505 | | | | 3.61 | % |
Non interest-earning assets | | | 245,316 | | | | | | | | | | | | 162,529 | | | | | | | | | | | | 73,330 | | | | | | | | | |
Allowance for loan losses | | | (27,887 | ) | | | | | | | | | | | (17,345 | ) | | | | | | | | | | | (15,857 | ) | | | | | | | | |
Total assets | | $ | 3,523,249 | | | | | | | | | | | $ | 2,600,316 | | | | | | | | | | | $ | 1,980,580 | | | | | | | | | |
LIABILITIES AND SHAREHOLDERS’ EQUITY | | | | | | | | | | | | | | | | | | | | | | | | | | | | | | | | | | | | |
Interest-bearing deposits | | | | | | | | | | | | | | | | | | | | | | | | | | | | | | | | | | | | |
Checking accounts | | $ | 554,000 | | | $ | 682 | | | | 0.12 | % | | $ | 417,226 | | | $ | 440 | | | | 0.11 | % | | $ | 409,178 | | | $ | 247 | | | | 0.06 | % |
Savings accounts | | | 937,247 | | | | 3,378 | | | | 0.36 | | | | 827,279 | | | | 8,708 | | | | 1.05 | | | | 624,421 | | | | 2,900 | | | | 0.46 | |
Money market accounts | | | 350,117 | | | | 1,277 | | | | 0.36 | | | | 189,836 | | | | 2,481 | | | | 1.31 | | | | 93,449 | | | | 597 | | | | 0.64 | |
Certificates of deposit | | | 259,568 | | | | 1,958 | | | | 0.75 | | | | 221,299 | | | | 4,012 | | | | 1.81 | | | | 134,007 | | | | 1,279 | | | | 0.95 | |
Total interest-bearing deposits | | | 2,100,932 | | | | 7,295 | | | | 0.35 | % | | | 1,655,640 | | | | 15,641 | | | | 0.94 | % | | | 1,261,055 | | | | 5,023 | | | | 0.40 | % |
Subordinated debt | | | 5,408 | | | | 444 | | | | 8.21 | | | | — | | | | — | | | | — | | | | - | | | | | | | | | |
Other borrowed funds | | | 123,693 | | | | 1,406 | | | | 1.14 | | | | 86,712 | | | | 2,002 | | | | 2.31 | | | | 18,671 | | | | 444 | | | | 2.38 | |
Total interest-bearing liabilities | | | 2,230,033 | | | | 9,145 | | | | 0.41 | % | | | 1,742,352 | | | | 17,643 | | | | 1.01 | % | | | 1,279,726 | | | | 5,467 | | | | 0.43 | % |
Non-interest-bearing liabilities | | | | | | | | | | | | | | | | | | | | | | | | | | | | | | | | | | | | |
Demand deposits | | | 838,653 | | | | | | | | | | | | 567,500 | | | | | | | | | | | | 521,091 | | | | | | | | | |
Other liabilities | | | 103,086 | | | | | | | | | | | | 68,847 | | | | | | | | | | | | 24,217 | | | | | | | | | |
Total liabilities | | | 3,171,772 | | | | | | | | | | | | 2,378,699 | | | | | | | | | | | | 1,825,034 | | | | | | | | | |
Shareholders’ equity | | | 351,477 | | | | | | | | | | | | 221,617 | | | | | | | | | | | | 155,546 | | | | | | | | | |
Total liabilities & shareholders’ equity | | $ | 3,523,249 | | | | | | | | | | | $ | 2,600,316 | | | | | | | | | | | $ | 1,980,580 | | | | | | | | | |
Net interest income on a fully taxable equivalent basis | | | | | | | 120,797 | | | | | | | | | | | | 79,070 | | | | | | | | | | | | 64,038 | | | | | |
Less taxable equivalent adjustment | | | | | | | (895 | ) | | | | | | | | | | | (764 | ) | | | | | | | | | | | (737 | ) | | | | |
Net interest income | | | | | | $ | 119,902 | | | | | | | | | | | $ | 78,306 | | | | | | | | | | | $ | 63,301 | | | | | |
Net interest spread (5) | | | | | | | | | | | 3.52 | % | | | | | | | | | | | 2.93 | % | | | | | | | | | | | 3.19 | % |
Net interest margin (6) | | | | | | | | | | | 3.65 | % | | | | | | | | | | | 3.22 | % | | | | | | | | | | | 3.33 | % |
(1) | Annualized on a fully taxable equivalent basis calculated using a federal tax rate of 21% for 2020, 2019, and 2018. |
(2) | Non-accrual loans are included in average amounts outstanding. |
(3) | Average balances of securities available for sale calculated utilizing amortized cost. |
(4) | Federal Home Loan Bank stock balance and dividend income is excluded from interest-earning assets. |
(5) | Net Interest rate spread represents the difference between the weighted average yield on interest-earning assets, inclusive of PPP loans originated during 2020, and the weighted average cost of interest-bearing liabilities. |
(6) | Net interest margin represents net interest income on a fully tax equivalent basis as a percentage of average interest-earning assets, inclusive of PPP loans originated during 2020. |
Rate/Volume Analysis
The following table describes the extent to which changes in interest rates and changes in the volume of interest-earning assets and interest-bearing liabilities have affected the Company’s interest income and interest expense during the periods indicated. Information is provided in each category with respect to: (i) changes attributable to changes in volumes (changes in average balance multiplied by prior year average rate), (ii) changes attributable to changes in rate (change in average interest rate multiplied by prior year average balance), and (iii) changes attributable to the combined impact of volumes and rates have been allocated proportionately to separate volume and rate categories.
| | Year Ended December 31, 2020 | | | Year Ended December 31, 2019 | |
| | Compared with | | | Compared with | |
| | Year Ended December 31, 2019 | | | Year Ended December 31, 2018 | |
| | Increase/(Decrease) Due to Change in | | | Increase/(Decrease) Due to Change in | |
| | Volume | | | Rate | | | Total | | | Volume | | | Rate | | | Total | |
| | (dollars in thousands) | | | (dollars in thousands) | |
Interest income | | | | | | | | | | | | | | | | | | | | | | | | |
Loans | | | | | | | | | | | | | | | | | | | | | | | | |
Taxable | | $ | 37,171 | | | $ | (2,106 | ) | | $ | 35,065 | | | $ | 23,441 | | | $ | 3,000 | | | $ | 26,441 | |
Tax-exempt | | | 299 | | | | 76 | | | | 375 | | | | 308 | | | | (37 | ) | | | 271 | |
Securities available for sale | | | | | | | | | | | | | | | | | | | | | | | | |
Taxable | | | (311 | ) | | | (236 | ) | | | (547 | ) | | | (716 | ) | | | 398 | | | | (318 | ) |
Securities held to maturity | | | | | | | | | | | | | | | | | | | | | | | | |
Taxable | | | (1,268 | ) | | | (100 | ) | | | (1,368 | ) | | | 372 | | | | 452 | | | | 824 | |
Tax-exempt | | | 520 | | | | (272 | ) | | | 248 | | | | (60 | ) | | | (86 | ) | | | (146 | ) |
Cash and due from banks | | | 203 | | | | (747 | ) | | | (544 | ) | | | 76 | | | | 60 | | | | 136 | |
Total interest income | | $ | 36,614 | | | $ | (3,385 | ) | | $ | 33,229 | | | $ | 23,421 | | | $ | 3,787 | | | $ | 27,208 | |
Interest expense | | | | | | | | | | | | | | | | | | | | | | | | |
Deposits | | | | | | | | | | | | | | | | | | | | | | | | |
Checking accounts | | | 160 | | | | 82 | | | | 242 | | | | 5 | | | | 188 | | | | 193 | |
Savings accounts | | | 1,030 | | | | (6,360 | ) | | | (5,330 | ) | | | 1,186 | | | | 4,622 | | | | 5,808 | |
Money market accounts | | | 1,280 | | | | (2,484 | ) | | | (1,204 | ) | | | 936 | | | | 948 | | | | 1,884 | |
Certificates of deposit | | | 601 | | | | (2,655 | ) | | | (2,054 | ) | | | 1,148 | | | | 1,585 | | | | 2,733 | |
Total interest-bearing deposits | | | 3,071 | | | | (11,417 | ) | | | (8,346 | ) | | | 3,275 | | | | 7,343 | | | | 10,618 | |
Subordinated debt | | | 444 | | | | — | | | | 444 | | | | — | | | | — | | | | — | |
Other borrowed funds | | | 656 | | | | (1,252 | ) | | | (596 | ) | | | 1,571 | | | | (13 | ) | | | 1,558 | |
Total interest expense | | $ | 4,171 | | | $ | (12,669 | ) | | $ | (8,498 | ) | | $ | 4,846 | | | $ | 7,330 | | | $ | 12,176 | |
Change in net interest income | | $ | 32,443 | | | $ | 9,284 | | | $ | 41,727 | | | $ | 18,575 | | | $ | (3,543 | ) | | $ | 15,032 | |
Excluding the impact of merger-related loan lossesaccretion and the impact of PPP loans, the adjusted net interest margin for the year ended December 31, 2020 was 3.36%, representing a 14 basis points increase over the net interest margin for the year ended December 31, 2019 of 3.22%.
| | For the Year Ended | |
| | December 31, 2020 | |
| | Average Balance | | | Interest Income/ Expenses | | | Rate Earned/ Paid | |
| | (dollars in thousands) | |
Total interest-earning assets (GAAP) | | $ | 3,305,820 | | | | | | | | | |
Net interest income on a fully taxable equivalent basis (GAAP) | | | | | | $ | 120,797 | | | | | |
Net interest margin (GAAP) | | | | | | | | | | | 3.65 | % |
Less: Paycheck Protection Program loan impact | | | (120,048 | ) | | | (4,062 | ) | | | 0.01 | % |
Less: Accretion of loan fair value adjustments | | | | | | | (9,791 | ) | | | -0.30 | % |
Adjusted net interest margin on a fully taxable equivalent basis | | $ | 3,185,772 | | | $ | 106,944 | | | | 3.36 | % |
Market Risk and Asset Liability Management
Market risk is the risk of loss from adverse changes in an amount determinedmarket prices and rates. The Company’s market risk arises primarily from interest rate risk inherent in its lending and deposit-taking activities. To that end, management actively monitors and manages its interest rate risk exposure.
The Company’s profitability is affected by managementfluctuations in interest rates. A sudden and substantial change in interest rates may adversely impact the Company’s earnings to the extent that the interest rates borne by assets and liabilities do not change at the same speed, to the same extent or on the basissame basis. The Company monitors the impact of changes in interest rates on its net interest income using several tools.
The Company’s primary objective in managing interest rate risk is to minimize the adverse impact of changes in interest rates on the Company’s net interest income and capital, while structuring the Company’s asset-liability structure to obtain the maximum yield-cost spread on that structure. The Company relies primarily on its asset-liability structure to control interest rate risk.
Interest Rate Sensitivity. The Company actively manages its interest rate sensitivity position. The objectives of interest rate risk management are to control exposure of net interest income to risks associated with interest rate movements and to achieve sustainable growth in net interest income. The Company’s Asset Liability Committee (“ALCO”), using policies and procedures approved by the Company’s board of directors, is responsible for the management of the characterCompany’s interest rate sensitivity position. The Company manages interest rate sensitivity by changing the mix, pricing, and re-pricing characteristics of its assets and liabilities, through the management of its investment portfolio, its offerings of loan and selected deposit terms, and through wholesale funding. Wholesale funding consists of, but is not limited to, multiple sources including borrowings with the FHLB of Boston, the Federal Reserve Bank of Boston’s discount window, and certificates of deposit from institutional brokers.
The Company uses several tools to manage its interest rate risk including interest rate sensitivity analysis, or gap analysis, market value of portfolio equity analysis, interest rate simulations under various rate scenarios, and net interest margin reports. The results of these reports are compared to limits established by the Company’s ALCO policies and appropriate adjustments may be made if the results are outside the established limits.
The following table demonstrates the annualized result of an interest rate simulation (excluding purchase accounting adjustments and PPP fee income) and the estimated effect that a parallel interest rate shift, or “shock,” in the yield curve and subjective adjustments in deposit pricing might have on the Company’s projected net interest income over the next 12 months and 24 months.
As of December 31, 2020:
| | Year 1 | | Year 2 | |
Change in Interest Rates (in Basis Points) | | Percentage Change in Net Interest Income | | Percentage Change in Net Interest Income | |
Parallel rate shocks | | | | | | |
+400 | | 2.3 | | 15.2 | |
+300 | | 1.1 | | 10.2 | |
+200 | | (0.1) | | 5.1 | |
+100 | | 0.1 | | | 1.0 | |
–100 | | (2.3) | | (12.0) | |
The following table demonstrates the annualized result of an interest rate simulation (excluding purchase accounting adjustments and PPP fee income) and the estimated effect that a gradual interest rate shift in the yield curve and subjective adjustments in deposit pricing might have on the Company’s projected net interest income over the next 12 months and 24 months.
As of December 31, 2020:
| | Year 1 | | Year 2 |
Change in Interest Rates (in Basis Points) | | Percentage Change in Net Interest Income | | Percentage Change in Net Interest Income |
| | | | |
Gradual rate shifts | | | | |
+200 | | (1.3) | | 1.6 |
–100 | | 0.3 | | (9.2) |
These simulations assume that there is no growth in interest-earning assets or interest-bearing liabilities over the next 12 months and 24 months. The changes to net interest income shown above are in compliance with the Company’s policy guidelines.
Economic Value of Equity Analysis. The Company also analyzes the sensitivity of the loans, loan performance,Bank’s financial condition to changes in interest rates through our economic value of borrowers,equity model. This analysis measures the difference between estimated changes in the present value of the Bank’s assets and estimated changes in the present value of the Bank’s liabilities assuming various changes in current interest rates.
The Bank’s economic value of equity analysis as of December 31, 2020 estimated that, in the event of an instantaneous 200 basis point increase in interest rates, the Bank would experience a 9.7% decrease in the economic value of equity for the next 12 months, and a 9.9% increase in the economic value of equity for the next 24 months. At the same date, our analysis estimated that, in the event of an instantaneous 100 basis point decrease in interest rates, the Bank would experience an 8.0% increase in the economic value of equity over the next 12 months, and an 11.2% increase in the economic value of equity for the next 24 months. The estimates within the economic value of equity calculation are significantly impacted by management’s assumption that the value of collateral securing loans,non-maturity deposits do not fall below their stated balance as of December 31, 2020. This assumption has the impact of increasing the Bank’s economic value of equity in the falling rate scenario as lower market rates increase the value of the loan and other relevant factors. We provide for loan losses based uponinvestment portfolios while the consistent applicationvalue of the non-maturity deposit base remains static. The Company believes retaining customer relationships is the most desirable strategy over the long term.
The estimates of changes in the economic value of our documented allowance for loan loss methodology. All loan lossesequity require us to make certain assumptions including loan- and mortgage-related investment prepayment speeds, reinvestment rates, and deposit maturities and decay rates. These assumptions are charged toinherently uncertain and, as a result, we cannot precisely predict the allowance for loan losses and all recoveries are credited to it. Additions toimpact of changes in interest rates on the allowance for loan losses are provided by charges to income based on various factors which, in our judgment, deserve current recognition in estimating probable losses. We regularly review the loan portfolio, including a revieweconomic value of our classified assets,equity. Although our economic value of equity analysis provides an indication of our interest rate risk exposure at a particular point in time, such estimates are not intended to, and make provisions for loan lossesdo not, provide a precise forecast of the effect of changes in order to maintainmarket interest rates on the allowance for loan losseseconomic value of our equity and will differ from actual results.
LIQUIDITY AND CAPITAL RESOURCES
Impact of Inflation and Changing Prices. Our Consolidated Financial Statements and related notes have been prepared in accordance with GAAP. GAAP generally requires the measurement of financial position and operating results in terms of historical dollars without consideration of changes in the relative purchasing power of money over time due to inflation. The allowanceimpact of inflation is reflected in the increased cost of our operations. Unlike industrial companies, our assets and liabilities are primarily monetary in nature. As a result, changes in market interest rates have a greater impact on performance than the effects of inflation.
Liquidity. Liquidity is defined as the Company’s ability to generate adequate cash to meet its needs for day-to-day operations and material long- and short-term commitments. Liquidity risk is the risk of potential loss if the Company were unable to meet its funding requirements at a reasonable cost. The Company manages its liquidity based on demand and specific events and uncertainties to meet current and future financial obligations of a short-term nature. The Company’s objective in managing liquidity is to respond to the needs of depositors and borrowers, as well as increase to earnings enhancement opportunities in a changing marketplace. At December 31, 2020, the Company had access to funds totaling $1.8 billion.
The Company’s liquidity position is managed on a daily basis as part of the daily settlement function and continuously as part of the formal asset liability management process. The Bank’s liquidity is maintained by managing its core deposits as the primary source, selling investment securities, selling loans in the secondary market, borrowing from the FHLB of Boston and the FRB, and purchasing wholesale certificates of deposit as its secondary sources.
The sources of funds for dividends paid by the Company are dividends received from the Bank and liquid funds held by the Company. The Company and the Bank are regulated enterprises and their abilities to pay dividends are subject to regulatory review and restriction. Certain regulatory and statutory restrictions exist regarding dividends, loans, and advances from the Bank to the Company. Generally, the Bank has the ability to pay dividends to the Company subject to minimum regulatory capital requirements.
Quarterly, ALCO reviews the Company’s liquidity needs and reports any findings (if required) to the Board of Directors.
Capital Adequacy. Total shareholders’ equity was $401.7 million at December 31, 2020, as compared to $286.6 million at December 31, 2019. The Company’s equity increased primarily due to net income of $32.0 million, $87.2 million of equity issued as a result of the Wellesley merger, before tax-effect increases in the value of the Company’s interest rate derivative positions of $4.7 million, and before tax-effect increases in unrealized gains on the available for sale investment portfolio of $3.6 million, partially offset by regular dividend payments of $13.1 million paid during the year. The ratio of total equity to total assets was 10.17% and 10.04% at December 31, 2020 and December 31, 2019, respectively. Book value per share was $58.00 and $53.06, at December 31, 2020 and 2019, respectively.
The Company and the Bank are subject to various regulatory capital requirements. As of December 31, 2020, the Company and the Bank exceeded the regulatory minimum levels to be considered “well capitalized.” See Note 18 – Shareholders’ Equity to the Consolidated Financial Statements for additional discussion of regulatory capital requirements.
Contractual Obligations, Commitments, and Contingencies
The Company has entered into contractual obligations and commitments. The following tables summarize the Company’s contractual cash obligations and other commitments by maturity at December 31, 2020:
| | Payments Due — By Period as of December 31, 2020 | |
CONTRACTUAL OBLIGATIONS | | Total | | | Less Than One Year | | | One to Three Years | | | Three to Five Years | | | After Five Years | |
| | (dollars in thousands) | |
FHLBB advances | | $ | 32,992 | | | $ | 15,157 | | | $ | 17,835 | | | $ | — | | | $ | — | |
Retirement benefit obligations | | | 29,033 | | | | 2,456 | | | | 5,332 | | | | 5,658 | | | | 15,587 | |
Lease obligations | | | 41,681 | | | | 7,173 | | | | 13,151 | | | | 10,010 | | | | 11,347 | |
Certificates of deposit | | | 254,821 | | | | 214,900 | | | | 35,291 | | | | 4,630 | | | | — | |
Total contractual cash Obligations | | $ | 358,527 | | | $ | 239,686 | | | $ | 71,609 | | | $ | 20,298 | | | $ | 26,934 | |
| | Amounts of Commitments Expiring — By Period as of December 31, 2020 | |
OTHER COMMITMENTS | | Total | | | Less Than One Year | | | One to Three Years | | | Three to Five Years | | | After Five Years | |
| | (dollars in thousands) | |
Unused portion of existing lines of credit | | $ | 584,520 | | | $ | 280,892 | | | $ | 120,268 | | | $ | 68,520 | | | $ | 114,840 | |
Standby letters of credit | | | 9,430 | | | | 8,212 | | | | 440 | | | | 778 | | | | — | |
Originations of new loans | | | 94,399 | | | | 94,399 | | | | — | | | | — | | | | — | |
Total commitments | | $ | 688,349 | | | $ | 383,503 | | | $ | 120,708 | | | $ | 69,298 | | | $ | 114,840 | |
Further discussion regarding commitments and contingencies can be found in Note 16 – FINANCIAL INSTRUMENTS WITH OFF-BALANCE SHEET RISK and Note 17 – Commitments and Contingencies to the Consolidated Financial Statements.
Financial Instruments with Off-Balance-Sheet Risk
The Company is party to financial instruments with off-balance-sheet risk in the normal course of business to meet the financing needs of its customers. These financial instruments primarily include commitments to originate and sell loans, standby letters of credit, unused lines of credit, and unadvanced portions of construction loans. The instruments involve, to varying degrees, elements of credit and interest rate risk in excess of the amount recognized in the consolidated balance sheet. The contract or notional amounts of those instruments reflect the extent of involvement the Company has in these particular classes of financial instruments.
The Company’s exposure to credit loss in the event of nonperformance by the other party to the financial instrument for loan losses consists primarilycommitments, standby letters of two components:credit and unadvanced portions of construction loans is represented by the contractual amount of those instruments. The Company uses the same credit policies in making commitments and conditional obligations as it does for on-balance-sheet instruments.
Off-Balance-Sheet Arrangements. Our significant off-balance-sheet arrangements consist of the following:
| 1.•
| specific allowances established for impairedcommitments to originate and sell loans, as defined by GAAP. The amount of impairment provided for as a specific allowance is measured based on the deficiency, if any, between the present value of expected future cash flows discounted at the loan’s effective interest rate at the time of impairment or, as a practical expedient, at the loan’s observable market price or the fair value of the collateral if the loan is collateral-dependent, and the carrying value of the loan; and
|
| 2.•
| general allowances established for standby and commercial letters of credit,
|
| • | unadvanced portions of construction loans, |
| • | unadvanced portions of other loans, |
| • | loan losses on a portfolio basis for loans that do not meet the definition of impaired loans. The portfolio is grouped into homogenous pools by similar related derivatives, and |
| • | risk characteristics, primarily by loan type and regulatory classification. We apply an estimated incurred loss rate to each loan group. The loss rates applied are based upon our historical loss experience over a designated look back period adjusted, as appropriate, for the quantitative, qualitative, and environmental factors discussed below. This evaluation is inherently subjective, as it requires material estimates that may be susceptible to significant revisions based upon changes in economic and real estate market conditions.participation agreements. |
Off-balance-sheet arrangements are more fully discussed in Note 16 – Financial Instruments with Off-Balance-Sheet Risk to the Consolidated Financial Statements.
Item 7A. Quantitative and Qualitative Disclosures About Market Risk.
The information required by this item is included in Item 7 of this report under “Market Risk and Asset Liability Management.”
Item 8. Financial Statements and Supplementary Data.
CAMBRIDGE BANCORP AND SUBSIDIARIES
CONSOLIDATED BALANCE SHEETS
| | December 31, 2020 | | | December 31, 2019 | |
| | (dollars in thousands, except par value) | |
Assets | | | | | | | | |
Cash and cash equivalents | | $ | 75,785 | | | $ | 61,335 | |
Investment securities | | | | | | | | |
Available for sale, at fair value (amortized cost $234,252 and $141,109, respectively) | | | 237,030 | | | | 140,330 | |
Held to maturity, at amortized cost (fair value $260,139 and $264,114, respectively) | | | 247,672 | | | | 258,172 | |
Total investment securities | | | 484,702 | | | | 398,502 | |
Loans held for sale, at lower of cost or fair value | | | 6,909 | | | | 1,546 | |
Loans | | | | | | | | |
Residential mortgage | | | 1,298,868 | | | | 917,566 | |
Commercial mortgage | | | 1,358,962 | | | | 1,060,574 | |
Home equity | | | 106,194 | | | | 80,675 | |
Commercial & Industrial | | | 347,855 | | | | 133,236 | |
Consumer | | | 41,769 | | | | 34,677 | |
Total loans | | | 3,153,648 | | | | 2,226,728 | |
Less: allowance for credit losses on loans | | | (36,016 | ) | | | (18,180 | ) |
Net loans | | | 3,117,632 | | | | 2,208,548 | |
Federal Home Loan Bank of Boston Stock, at cost | | | 5,734 | | | | 7,854 | |
Bank owned life insurance | | | 46,169 | | | | 37,319 | |
Banking premises and equipment, net | | | 18,158 | | | | 14,756 | |
Right-of-use asset operating leases | | | 34,927 | | | | 33,587 | |
Deferred income taxes, net | | | 11,639 | | | | 8,229 | |
Accrued interest receivable | | | 9,514 | | | | 7,052 | |
Goodwill | | | 51,912 | | | | 31,206 | |
Merger related intangibles, net | | | 2,977 | | | | 3,338 | |
Other assets | | | 83,239 | | | | 42,291 | |
Total assets | | $ | 3,949,297 | | | $ | 2,855,563 | |
Liabilities | | | | | | | | |
Deposits | | | | | | | | |
Demand | | $ | 1,006,132 | | | $ | 630,593 | |
Interest bearing checking | | | 625,650 | | | | 450,098 | |
Money market | | | 532,218 | | | | 181,406 | |
Savings | | | 984,262 | | | | 914,499 | |
Certificates of deposit | | | 254,821 | | | | 182,282 | |
Total deposits | | | 3,403,083 | | | | 2,358,878 | |
Borrowings | | | 32,992 | | | | 135,691 | |
Operating lease liabilities | | | 37,448 | | | | 35,054 | |
Other liabilities | | | 74,042 | | | | 39,379 | |
Total liabilities | | | 3,547,565 | | | | 2,569,002 | |
Shareholders’ Equity | | | | | | | | |
Common stock, par value $1.00; Authorized: 10,000,000 shares; Outstanding: 6,926,728 shares and 5,400,868 shares, respectively | | | 6,927 | | | | 5,401 | |
Additional paid-in capital | | | 226,967 | | | | 136,766 | |
Retained earnings | | | 165,404 | | | | 146,875 | |
Accumulated other comprehensive income (loss) | | | 2,434 | | | | (2,481 | ) |
Total shareholders’ equity | | | 401,732 | | | | 286,561 | |
Total liabilities and shareholders’ equity | | $ | 3,949,297 | | | $ | 2,855,563 | |
The accompanying notes are an integral part of these consolidated financial statements.
CAMBRIDGE BANCORP AND SUBSIDIARIES
CONSOLIDATED STATEMENTS OF INCOME
| | | For the Year Ended December 31, | |
| | | | | | | | | | | | | |
| | | 2020 | | | 2019 | | | 2018 | |
Interest and dividend income | | | | | | | | | | | | | |
Interest on taxable loans | | | $ | 119,447 | | | $ | 84,382 | | | $ | 57,941 | |
Interest on tax-exempt loans | | | | 880 | | | | 584 | | | | 371 | |
Interest on taxable investment securities | | | | 6,048 | | | | 7,963 | | | | 7,457 | |
Interest on tax-exempt investment securities | | | | 2,485 | | | | 2,289 | | | | 2,404 | |
Dividends on FHLB of Boston stock | | | | 331 | | | | 390 | | | | 287 | |
Interest on overnight investments | | | | 187 | | | | 731 | | | | 595 | |
Total interest and dividend income | | | | 129,378 | | | | 96,339 | | | | 69,055 | |
Interest expense | | | | | | | | | | | | | |
Interest on deposits | | | | 7,295 | | | | 15,641 | | | | 5,023 | |
Interest on borrowed funds | | | | 1,406 | | | | 2,002 | | | | 444 | |
Interest on subordinated debt | | | | 444 | | | | — | | | | — | |
Total interest expense | | | | 9,145 | | | | 17,643 | | | | 5,467 | |
Net interest and dividend income | | | | 120,233 | | | | 78,696 | | | | 63,588 | |
Provision for credit losses | | | | 18,310 | | | | 3,004 | | | | 1,502 | |
Net interest and dividend income after provision for credit losses | | | | 101,923 | | | | 75,692 | | | | 62,086 | |
Noninterest income | | | | | | | | | | | | | |
Wealth management revenue | | | | 29,751 | | | | 26,499 | | | | 25,191 | |
Deposit account fees | | | | 2,595 | | | | 3,185 | | | | 3,071 | |
ATM/Debit card income | | | | 1,308 | | | | 1,413 | | | | 1,180 | |
Bank owned life insurance income | | | | 747 | | | | 612 | | | | 526 | |
Gain (loss) on disposition of investment securities | | | | 69 | | | | (79 | ) | | | 2 | |
Gain on loans sold | | | | 1,850 | | | | 1,170 | | | | 99 | |
Loan related derivative income | | | | 1,479 | | | | 1,674 | | | | 1,651 | |
Other income | | | | 1,726 | | | | 1,927 | | | | 1,269 | |
Total noninterest income | | | | 39,525 | | | | 36,401 | | | | 32,989 | |
Noninterest expense | | | | | | | | | | | | | |
Salaries and employee benefits | | | | 58,975 | | | | 47,494 | | | | 41,212 | |
Occupancy and equipment | | | | 13,004 | | | | 10,855 | | | | 9,072 | |
Data processing | | | | 7,662 | | | | 6,232 | | | | 5,177 | |
Professional services | | | | 4,190 | | | | 3,623 | | | | 3,258 | |
Marketing | | | | 1,818 | | | | 1,760 | | | | 2,229 | |
FDIC insurance (credit) | | | | 992 | | | | 291 | | | | 574 | |
Nonoperating expenses | | | | 7,612 | | | | 4,721 | | | | 201 | |
Other expenses | | | | 3,832 | | | | 3,199 | | | | 2,264 | |
Total noninterest expense | | | | 98,085 | | | | 78,175 | | | | 63,987 | |
Income before income taxes | | | | 43,363 | | | | 33,918 | | | | 31,088 | |
Income tax expense | | | | 11,404 | | | | 8,661 | | | | 7,207 | |
Net income | | | $ | 31,959 | | | $ | 25,257 | | | $ | 23,881 | |
Share data: | | | | | | | | | | | | | |
Weighted average number of shares outstanding, basic | | | | 6,289,481 | | | | 4,629,255 | | | | 4,061,529 | |
Weighted average number of shares outstanding, diluted | | | | 6,344,409 | | | | 4,661,720 | | | | 4,098,633 | |
Basic earnings per share | | | $ | 5.07 | | | $ | 5.41 | | | $ | 5.82 | |
Diluted earnings per share | | | $ | 5.03 | | | $ | 5.37 | | | $ | 5.77 | |
The accompanying notes are an integral part of these consolidated financial statements.
CAMBRIDGE BANCORP AND SUBSIDIARIES
CONSOLIDATED STATEMENTS OF COMPREHENSIVE INCOME
| | For the Year Ended December 31, | |
| | 2020 | | | 2019 | | | 2018 | |
| | (dollars in thousands) | |
Net income | | $ | 31,959 | | | $ | 25,257 | | | $ | 23,881 | |
Other comprehensive income, net of tax: | | | | | | | | | | | | |
Available for sale securities | | | | | | | | | | | | |
Unrealized holding gains(losses) | | | 2,800 | | | | 2,500 | | | | (242 | ) |
Less: reclassification adjustment for (gains)losses realized in net income | | | (57 | ) | | | 62 | | | | (2 | ) |
Total unrealized gains(losses) on available for sale securities | | | 2,743 | | | | 2,562 | | | | (244 | ) |
Interest rate swaps designated as cash flow hedges | | | | | | | | | | | | |
Unrealized holding gains(losses) | | | 4,758 | | | | 713 | | | | 720 | |
Less: reclassification adjustment for (gains)losses realized in net income | | | (1,354 | ) | | | 108 | | | | 31 | |
Defined benefit retirement plans | | | | | | | | | | | | |
Change in retirement liabilities | | | (1,232 | ) | | | 623 | | | | 89 | |
Other comprehensive income | | | 4,915 | | | | 4,006 | | | | 596 | |
Comprehensive income | | $ | 36,874 | | | $ | 29,263 | | | $ | 24,477 | |
The accompanying notes are an integral part of these consolidated financial statements.
CAMBRIDGE BANCORP AND SUBSIDIARIES
CONSOLIDATED STATEMENTS OF CHANGES IN SHAREHOLDERS’ EQUITY
| | For the Years Ended December 31, | |
| | Common Stock | | | | | Additional Paid-In Capital | | | | | Retained Earnings | | | | | Accumulated Other Comprehensive Income / (Loss) | | | | | Total Shareholders’ Equity | |
| | (dollars in thousands, except per share data) | |
Balance at December 31, 2017 | | $ | 4,082 | | | | | $ | 35,663 | | | | | $ | 114,093 | | | | | $ | (5,881 | ) | | | | $ | 147,957 | |
Cumulative effect of accounting changes | | | — | | | | | | — | | | | | | 1,202 | | | | | | (1,202 | ) | | | | | — | |
Net income | | | — | | | | | | — | | | | | | 23,881 | | | | | | — | | | | | | 23,881 | |
Other comprehensive income | | | — | | | | | | — | | | | | | — | | | | | | 596 | | | | | | 596 | |
Share based compensation and other share-based activity | | | 25 | | | | | | 2,608 | | | | | | — | | | | | | — | | | | | | 2,633 | |
Dividends declared ($1.96 per share) | | | — | | | | | | — | | | | | | (8,041 | ) | | | | | — | | | | | | (8,041 | ) |
Balance at December 31, 2018 | | $ | 4,107 | | | | | $ | 38,271 | | | | | $ | 131,135 | | | | | $ | (6,487 | ) | | | | $ | 167,026 | |
| | | | | | | | | | | | | | | | | | | | | | | | | | | | |
Balance at December 31, 2018 | | $ | 4,107 | | | | | $ | 38,271 | | | | | $ | 131,135 | | | | | $ | (6,487 | ) | | | | $ | 167,026 | |
Net income | | | — | | | | | | — | | | | | | 25,257 | | | | | | — | | | | | | 25,257 | |
Other comprehensive income | | | — | | | | | | — | | | | | | — | | | | | | 4,006 | | | | | | 4,006 | |
Share based compensation and other share-based activity | | | 20 | | | | | | 2,150 | | | | | | — | | | | | | — | | | | | | 2,170 | |
Dividends declared ($2.04 per share) | | | — | | | | | | — | | | | | | (9,517 | ) | | | | | — | | | | | | (9,517 | ) |
Common stock issued for Optima merger | | | 723 | | | | | | 58,694 | | | | | | — | | | | | | — | | | | | | 59,417 | |
Common stock offering | | | 551 | | | | | | 37,651 | | | | | | — | | | | | | — | | | | | | 38,202 | |
Balance at December 31, 2019 | | $ | 5,401 | | | | | $ | 136,766 | | | | | $ | 146,875 | | | | | $ | (2,481 | ) | | | | $ | 286,561 | |
| | | | | | | | | | | | | | | | | | | | | | | | | | | | |
Balance at December 31, 2019 | | $ | 5,401 | | | | | $ | 136,766 | | | | | $ | 146,875 | | | | | $ | (2,481 | ) | | | | $ | 286,561 | |
Cumulative effect of accounting changes (Note 3) | | | — | | | | | | — | | | | | | (347 | ) | | | | | — | | | | | | (347 | ) |
Net income | | | — | | | | | | — | | | | | | 31,959 | | | | | | — | | | | | | 31,959 | |
Other comprehensive income | | | — | | | | | | — | | | | | | — | | | | | | 4,915 | | | | | | 4,915 | |
Share based compensation and other share-based activity | | | 23 | | | | | | 4,541 | | | | | | — | | | | | | — | | | | | | 4,564 | |
Dividends declared ($2.12 per share) | | | — | | | | | | — | | | | | | (13,083 | ) | | | | | — | | | | | | (13,083 | ) |
Common stock issued for Wellesley merger | | | 1,503 | | | | | | 85,660 | | | | | | — | | | | | | — | | | | | | 87,163 | |
Balance at December 31, 2020 | | $ | 6,927 | | | | | $ | 226,967 | | | | | $ | 165,404 | | | | | $ | 2,434 | | | | | $ | 401,732 | |
The accompanying notes are an integral part of these consolidated financial statements.
CAMBRIDGE BANCORP AND SUBSIDIARIES
CONSOLIDATED STATEMENTS OF CASH FLOWS
| | | | | | | | | | | | |
| | For the Year Ended December 31, | |
| | 2020 | | | 2019 | | | 2018 | |
| | (dollars in thousands) | |
CASH FLOWS FROM OPERATING ACTIVITIES | | | | | | | | | | | | |
Net income | | $ | 31,959 | | | $ | 25,257 | | | $ | 23,881 | |
Adjustments to reconcile net income to net cash provided by operating activities: | | | | | | | | | | | | |
Provision for credit losses | | | 18,310 | | | | 3,004 | | | | 1,502 | |
Amortization(accretion) of deferred charges and fees net | | | (780 | ) | | | 166 | | | | 777 | |
(Accretion), depreciation, and amortization, net | | | (8,134 | ) | | | 828 | | | | 1,888 | |
Bank owned life insurance income | | | (747 | ) | | | (612 | ) | | | (526 | ) |
(Gain)/loss on disposition of investment securities | | | (69 | ) | | | 79 | | | | (2 | ) |
Share based compensation and other share-based activity | | | 4,564 | | | | 2,170 | | | | 2,633 | |
Change in accrued interest receivable | | | 253 | | | | (162 | ) | | | (634 | ) |
Deferred income tax (benefit)/expense | | | (665 | ) | | | 110 | | | | (721 | ) |
Change in other assets, net | | | (22,863 | ) | | | (11,667 | ) | | | (12,231 | ) |
Change in other liabilities, net | | | 20,332 | | | | 11,166 | | | | 7,455 | |
Change in loans held for sale | | | (5,363 | ) | | | (1,546 | ) | | | — | |
Net cash provided by operating activities | | | 36,797 | | | | 28,793 | | | | 24,022 | |
CASH FLOWS FROM INVESTING ACTIVITIES | | | | | | | | | | | | |
Origination of loans | | | (1,070,321 | ) | | | (790,097 | ) | | | (596,259 | ) |
Proceeds from principal payments of loans | | | 1,022,516 | | | | 524,907 | | | | 387,537 | |
Proceeds from loan pool sale | | | — | | | | 74,412 | | | | — | |
Proceeds from calls/maturities of securities available for sale | | | 47,087 | | | | 49,832 | | | | 35,415 | |
Purchase of securities available for sale | | | (140,570 | ) | | | (23,450 | ) | | | — | |
Proceeds from sales of securities available for sale | | | 10,821 | | | | 26,552 | | | | 702 | |
Proceeds from calls/maturities of securities held to maturity | | | 56,007 | | | | 72,655 | | | | 33,064 | |
Purchase of securities held to maturity | | | (33,818 | ) | | | (48,906 | ) | | | (84,261 | ) |
Proceeds from settlement of bank owned life insurance policies | | | — | | | | — | | | | 676 | |
Redemption (purchase) of FHLB of Boston stock | | | 8,505 | | | | 456 | | | | (2,602 | ) |
Purchase of banking premises and equipment | | | (2,218 | ) | | | (1,896 | ) | | | (1,155 | ) |
Net cash acquired in business combinations | | | 43,063 | | | | 2,063 | | | | — | |
Net cash used in investing activities | | | (58,928 | ) | | | (113,472 | ) | | | (226,883 | ) |
CASH FLOWS FROM FINANCING ACTIVITIES | | | | | | | | | | | | |
Change in demand, interest bearing, money market and savings accounts | | | 422,866 | | | | 171,961 | | | | 74,421 | |
Change in certificates of deposit | | | (138,213 | ) | | | (101,928 | ) | | | (38,467 | ) |
Change in borrowings | | | (224,989 | ) | | | 28,823 | | | | 89,830 | |
Proceeds from common stock offering (net of underwriting fees) | | | — | | | | 38,202 | | | | — | |
Redemption of subordinated debt | | | (10,000 | ) | | | — | | | | — | |
Cash dividends paid on common stock | | | (13,083 | ) | | | (9,517 | ) | | | (8,041 | ) |
Net cash provided by financing activities | | | 36,581 | | | | 127,541 | | | | 117,743 | |
Net change in cash and cash equivalents | | | 14,450 | | | | 42,862 | | | | (85,118 | ) |
Cash and cash equivalents at beginning of period | | | 61,335 | | | | 18,473 | | | | 103,591 | |
Cash and cash equivalents at end of period | | $ | 75,785 | | | $ | 61,335 | | | $ | 18,473 | |
SUPPLEMENTAL DISCLOSURES OF CASH FLOW INFORMATION: | | | | | | | | | | | | |
Cash paid during the period for: | | | | | | | | | | | | |
Interest | | $ | 9,172 | | | $ | 17,918 | | | $ | 5,457 | |
Income taxes | | | 14,628 | | | | 7,770 | | | | 8,330 | |
Significant non-cash transactions | | | | | | | | | | | | |
Right-of-use assets for lessee operating leases | | | — | | | | 33,587 | | | | — | |
Right-of-use liabilities for lessee operating leases | | | — | | | | 35,054 | | | | — | |
Transfer of other real estate owned | | | 2,293 | | | | 163 | | | | — | |
Common Stock issued to shareholders due to merger | | | 87,163 | | | | 59,417 | | | | — | |
Fair value of assets acquired, net of cash acquired | | | 961,668 | | | | 548,801 | | | | — | |
Fair value of liabilities assumed | | | 917,569 | | | | 491,447 | | | | — | |
The accompanying notes are an integral part of these consolidated financial statements.
CAMBRIDGE BANCORP AND SUBSIDIARIES
NOTES TO CONSOLIDATED FINANCIAL STATEMENTS
December 31, 2020
The accompanying consolidated financial statements include the accounts of Cambridge Bancorp (the “Company”) and its wholly owned subsidiary, Cambridge Trust Company (the “Bank”), and the Bank’s subsidiaries, Cambridge Trust Company of New Hampshire, Inc., CTC Security Corporation, and CTC Security Corporation III. References to the Company herein relate to the consolidated group of companies. All significant intercompany accounts and transactions have been eliminated in preparation of the consolidated financial statements.
The Company is a state-chartered, federally registered bank holding company headquartered in Cambridge, Massachusetts, incorporated in 1983. The Company is the sole shareholder of the Bank, a Massachusetts trust company chartered in 1890 which is a commercial bank. The Company is a private bank offering a full range of private banking and wealth management services to our clients. The private banking business, the Company’s only reportable operating segment, is managed as a single strategic unit.
As a private bank, the Company focuses on 4 core services that center around client needs. The core services include Wealth Management, Commercial Banking, Residential Lending, and Personal Banking. The Bank offers a full range of commercial and consumer banking services through its network of 21 private banking offices in Massachusetts and New Hampshire. The Bank is engaged principally in the business of attracting deposits from the public and investing those deposits. The Bank invests those funds in various types of loans, including residential and commercial real estate, and a variety of commercial and consumer loans. The Bank also invests its deposits and borrowed funds in investment securities and has 2 wholly owned Massachusetts security corporations, CTC Security Corporation and CTC Security Corporation III, for this purpose. Deposits at the Bank are insured by the Federal Deposit Insurance Corporation (“FDIC”) for the maximum amount permitted by FDIC Regulations.
Trust and investment management services are offered through the Bank’s private banking offices in Massachusetts and New Hampshire, and its wealth management offices located in Boston and Wellesley, Massachusetts and Concord, Manchester, and Portsmouth, New Hampshire. The Bank also has a non-depository trust company, Cambridge Trust Company of New Hampshire, Inc., which allows non-New Hampshire residents the opportunity to take advantage of the state’s favorable trust laws. The assets held for wealth management clients are not assets of the Bank and, accordingly, are not reflected in the accompanying consolidated balance sheets.
2. | SUMMARY OF SIGNIFICANT ACCOUNTING POLICIES |
Basis of Presentation
The consolidated financial statements have been prepared in conformity with U.S. generally accepted accounting principles (“GAAP”).
Use of Estimates
The preparation of consolidated financial statements in conformity with GAAP requires management to make estimates and assumptions that affect the reported amounts of assets and liabilities and disclosure of contingent assets and liabilities at the date of the consolidated financial statements. Actual results could differ from those estimates. The allowance for credit losses, the valuation of deferred tax assets, and the valuation of assets acquired and liabilities assumed in business combinations are particularly subject to change.
Reclassifications
Certain amounts in the prior year’s financial statements may have been reclassified to conform with the current year’s presentation.
Cash and Cash Equivalents
Cash and cash equivalents consist of cash on hand, amounts due from banks, and overnight investments.
Investment Securities
Investment securities are classified as either ‘held to maturity’ or ‘available for sale’ in accordance with the Financial Accounting Standards Board (“FASB”) Accounting Standards Codification (“ASC”) 320, Investments – Debt Securities. Debt securities that management has the positive intent and ability to hold to maturity are classified as held to maturity and recorded at amortized cost.
Debt securities not classified as held to maturity are classified as available for sale and carried at fair value with unrealized after-tax gains and losses reported net as a separate component of shareholders�� equity. The Company classifies its securities based on its intention at the time of purchase.
Purchase premiums and discounts are recognized in interest income using the effective yield or straight-line method over the term of the securities, except for callable debt securities for which the purchase premiums are recognized through the earliest call date. Gains and losses on the sale of debt securities are recorded on the trade date and determined using the specific identification method.
Allowance for Credit Losses- Held to Maturity Securities
The Company measures expected credit losses on held to maturity debt securities on a collective basis by security type and risk rating where available. The reserve for each pool is calculated based on a Probability of Default/Loss Given Default (“PD/LGD”) basis taking into consideration the expected life of each security. Held to maturity securities which are issued by the United States of America (“U.S.”) or are guaranteed by U.S. federal agencies do not currently have an allowance for credit loss as the Company determined these securities are either backed by the full faith and credit of the U.S. government and/or there is an unconditional commitment to make interest payments and to return the principal investment in full to investors when a debt security reaches maturity. The Company will evaluate this position no less than annually, however, certain items which may cause the Company to change this methodology include legislative changes that remove a government-sponsored enterprise’s (“GSE”) ability to draw funds from the U.S. government, or legislative changes to housing policy that reduce or eliminate the U.S. government’s implicit guarantee on such securities. For securities which are not U.S. treasury or agency backed, risk ratings are generally sourced from Moody’s or Standard & Poor’s (“S&P”). The Company updates loss given default, probability of default, and recovery rates for each security as that information becomes available but no less than annually. The expected remaining life to maturity of each applicable security is updated quarterly. Any expected credit losses on held to maturity securities would be presented as an allowance rather than as a direct write-down through the consolidated statement of income if the Company does not intend to sell or believes that it is more-likely-than-not that the Company will be required to sell the security.
Allowance for Credit Losses-Available for Sale Securities
The Company measures expected credit losses on available for sale securities based upon the gain or loss position of the security. For available-for sale debt securities in an unrealized loss position, which the Company does not intend to sell, or it is not more likely than not that the Company will be required to sell the security before recovery of the Company’s amortized cost, the Company evaluates qualitative criteria to determine any expected loss. This includes among other items the financial health of, and specific prospects for the issuer, including whether the issuer is in compliance with the terms and covenants of the security. The Company also evaluates quantitative criteria including determining whether there has been an adverse change in expected future cash flows of the security. If the Company does not expect to recover the entire amortized cost basis of the security, an allowance for credit losses would be recorded, with a related charge to earnings, limited by the amount of the fair value of the security less its amortized cost. If the Company intends to sell the security or it is more likely than not that the Company will be required to sell the debt security before recovery of its amortized cost basis, the Company recognizes the entire difference between the security’s amortized cost basis and its fair value in earnings.
Prior to the adoption of Topic 326 on January 1, 2020, declines in the fair value of investment securities below their amortized cost that were deemed to be other-than-temporary were reflected in earnings as realized losses to the extent the impairment was related to credit losses. The amount of the impairment related to other factors was recognized in other comprehensive income. In estimating other-than-temporary impairment losses, management considered: (1) the length of time and the extent to which the fair value has been less than cost; (2) the financial condition and near-term prospects of the issuer; and (3) the Company’s intent to sell the security or whether it is more likely than not that the Company will be required to sell the debt security before its anticipated recovery.
Loans
Loans are reported at the amount of their outstanding principal, including deferred loan origination fees and costs, reduced by unearned discounts, and the allowance for credit losses. Loans are considered delinquent when a payment of principal and/or interest becomes past due 30 days following its scheduled payment due date. Loans on which the accrual of interest has been discontinued are designated as non-accrual loans. Loans are removed from non-accrual when they become less than 90 days past due and when concern no longer exists as to the collectability of principal or interest.
Allowance for Credit Losses - Loans
Losses on loan receivables are estimated and recognized upon origination of the loan, based on expected credit losses for the life of the loan balance as of the period end date. The Company uses a discounted cash flow method incorporating probability of default and loss given default forecasted based on statistically derived economic variable loss drivers combined with qualitative factors, to estimate expected credit losses. This process includes estimates which involve modeling loss projections attributable to existing loan
balances, considering historical experience, current conditions, and future expectations for homogeneous pools of loans over the reasonable and supportable forecast period. The reasonable and supportable forecast period is determined based upon the accuracy level of historical loss forecast estimates, the specific loan level models and methodology utilized, and considers material changes in growth and credit strategy, and business changes. For periods beyond a reasonable and supportable forecast interval, the Company reverts to historical information over a period for which comparable data is available. The historical information either experienced by the Company, or by a selection of peer banks when appropriate, is derived from a combination of recessionary and non-recessionary performance periods for which data is available. Similar to the reasonable and supportable forecast period, the Company reassesses the reversion period at the segment level, considering any required adjustments for differences in underwriting standards, portfolio mix, and other relevant data shifts over time.
The Company generally segments its loan receivable population into homogeneous pools of loans. Consistent with the Company’s other assumptions, the Company regularly reviews segmentation to determine whether the segmentation pools remain relevant as risk characteristics change. When a loan no longer meets the criteria of its initial pooling as a result of credit deterioration or other changes, the Company may beevaluate the credit for estimated losses on an individual basis if it determines that they no longer retain the same risk characteristics. To the extent that there are a multitude of these loans with new similar credit characteristics, the Company would anticipate a change to the pooling methodology. Loans that do not share risk characteristics are evaluated on an individual basis and are not included in the collective evaluation. For loans with real estate collateral, when management determines that foreclosure is probable, expected credit losses are based on the fair value of the collateral at the reporting date, adjusted for selling costs as appropriate.
The Company evaluates the loan allowance for credit losses quarterly. The Company regularly reviews its collection experience (including delinquencies and net charge-offs) in determining our allowance for credit losses. The Company also considers its historical loss experience to date based on actual defaulted loans and overall portfolio indicators including delinquent and non-accrual loans, trends in loan volume and lending terms, credit policies and other observable environmental factors such as unemployment and interest rate changes.
The underlying assumption estimates and assessments the Company uses to estimate the allowance for credit losses reflects the Company’s best estimate of model assumptions and forecasted conditions at that time. Changes in such estimates can significantly more thanaffect the allowance and provision for credit losses. It is possible and likely that the Company will experience credit losses that are different from the current estimates.
The provision for credit losses charged to income is based on management’s judgment of the amount necessary to maintain the allowance at a level to provide for probable inherent credit losses as of the evaluation date. When management believes that the collectability of a loan’s principal balance, or portions thereof, is unlikely, the principal amount is charged against the allowance for credit losses. Recoveries on loans that have been previously charged off are credited to the allowance for loan losses, we have established,generally at the time cash is received on a charged-off account. The allowance is an estimate, and ultimate losses may vary from current estimates. As adjustments become necessary, they are reported in the results of operations through the provision for credit losses in the period in which couldthey become known.
Risk characteristics relevant to each portfolio segment are as follows:
Residential mortgage and home equity loans – The Company generally does not originate loans in these segments with a loan-to-value ratio greater than 80%, unless covered by private mortgage insurance, and in all cases not greater than a loan-to-value ratio of 97%. The Company does not originate subprime loans. Loans in these segments are secured by one-to-four family residential real estate, and repayment is primarily dependent on the credit quality of the individual borrower.
Commercial mortgage loans – This includes multi-family properties and construction. The Company generally does not originate loans in this segment with a loan-to-value ratio greater than 75%. Loans in this segment are secured by owner-occupied and nonowner-occupied commercial real estate, and repayment is primarily dependent on the cash flows of the property (if nonowner-occupied) or of the business (if owner-occupied).
Commercial & industrial loans – Loans in this segment are made to businesses and are generally secured by equipment, accounts receivable, or inventory, as well as the personal guarantees of the principal owners of the business, and repayment is primarily dependent on the cash flows generated by the business. In addition, this segment includes loans issued under the United States Small Business Administration’s (“SBA”) Paycheck Protection Program (“PPP”). These loans are guaranteed and are not evaluated for an allowance for credit losses because the Company expects the guarantees will be effective, if necessary.
Consumer loans – Loans in this segment are made to individuals and can be secured or unsecured. Repayment is primarily dependent on the credit quality of the individual borrower.
The majority of the Company’s loans are concentrated in Eastern Massachusetts and Southern New Hampshire and therefore the overall health of the local economy, including unemployment rates, vacancy rates, and consumer spending levels, can have a material negative effect on our financial results.the credit quality of all of these portfolio segments.
The adjustmentsprocess to historicaldetermine the allowance for credit losses requires management to exercise considerable judgment regarding the risk characteristics of the loan portfolio segments and the effect of relevant internal and external factors.
Allowance for Credit Losses- Unfunded Commitments
The expected credit losses for unfunded commitments are measured over the contractual period of the Company’s exposure to credit risk. The estimate of credit loss experience areincorporates assumptions for both the likelihood and amount of funding over the estimated life of the commitments, for the risk of loss, and current conditions and expectations. Management periodically reviews and updates its assumptions for estimated funding rates based on our evaluation of several quantitative, qualitative,historical rates, and environmental factors including:
such as portfolio growth, changes to organizational structure, economic conditions, borrowing habits, or any other factor which could impact the loss emergence periodlikelihood that funding will occur. The Company does not reserve for unfunded commitments which represents the average amount of time between when loss events occur for specific loan types and when such problemare unconditionally cancellable.
Acquired Loans
Acquired loans are identifiedrecorded at fair value at the date of acquisition based on a discounted cash flow methodology that considers various factors, including the type of loan and related collateral, classification status, fixed or variable interest rate, term of loan and whether or not the related loss amountsloan was amortizing, and a discount rate reflecting the Company’s assessment of risk inherent in the cash flow estimates. Purchased loans are confirmed through charge-offs;
changesgrouped together according to similar risk characteristics and are treated in any concentration ofthe aggregate when applying various valuation techniques. These cash flow evaluations are inherently subjective as they may be susceptible to significant change.
Effective January 1, 2020, loans acquired in a business combination that have experienced more-than-insignificant deterioration in credit (including,quality since origination are considered purchased credit deteriorated (“PCD”) loans. The Company evaluates acquired loans for deterioration in credit quality based on, but not limited to, concentrations by geography, industry,the following: (1) non-accrual status; (2) troubled debt restructured designation; (3) risk ratings of special mention, substandard or collateral type);
changes indoubtful; (4) watchlist credits; and (5) delinquency status, including loans that are current on acquisition date, but had been previously delinquent. At the numberacquisition date, an estimate of expected credit losses is made for groups of PCD loans with similar risk characteristics and amount of non-accrualindividual PCD loans without similar risk characteristics. This initial allowance for credit losses is allocated to individual PCD loans and past due loans;
changes in national, state, and local economic trends;
changes inadded to the types of loans inpurchase price or acquisition date fair values to establish the loan portfolio;
changes in the experience and ability of personnel;
changes in lending strategies; and
changes in lending policies and procedures.
In addition, we may establish an unallocated allowance to provide for probable losses that have been incurred asinitial amortized cost basis of the reporting date but are not reflected inPCD loans. As the allocated allowance.
We evaluate theinitial allowance for loancredit losses basedis added to the purchase price, there is no credit loss expense recognized upon acquisition of a PCD loan. Any difference between the combined totalunpaid principal balance of PCD loans and the specificamortized cost basis is considered to relate to noncredit factors and general components. Generally, when the loan portfolio increases, absent other factors, the allowance for loan loss methodology results in a higher dollar amountdiscount or premium. Discounts and premiums are recognized through interest income on a level-yield method over the life of estimated probable losses than would be the case withoutloans.
For acquired loans not deemed PCD at acquisition, the increase. Generally, whendifferences between the loan portfolio decreases, absent other factors,initial fair value and the unpaid principal balance are recognized as interest income on a level-yield basis over the lives of the related loans. At the acquisition date, an initial allowance for loanexpected credit losses methodology results in a lower dollar amountis estimated and recorded as provision for credit losses. The subsequent measurement of estimated probableexpected credit losses than would befor all acquired loans is the case withoutsame as the decrease. Periodically, management conducts an analysis to estimate the loss emergence periodsubsequent measurement of expected credit losses for various loan categories based on samples of historical charge-offs. Model output by loan category is reviewed to evaluate the reasonableness of the reserve levels in comparison to the estimated loss emergence period applied to historical loss experience.
We evaluate the loan portfolio on a quarterly basis and the allowance is adjusted accordingly. While we use the best information available to make evaluations, future adjustments to the allowance may be necessary if conditions differ substantially from the information used in making the evaluations. In addition, various regulatory agencies, as an integral part of their examination process, will periodically review the allowance for loan losses. Such agencies may require us to recognize additions to the allowance based on their analysis of information available to them at the time of their examination.originated loans.
The following table summarizes the changes in the Company’s allowance for loan losses for the years indicated:
| | Years Ended December 31, | |
| | 2019 | | | 2018 | | | 2017 | | | 2016 | | | 2015 | |
| | (dollars in thousands) | |
Period-end loans outstanding (net of unearned discount and deferred loan fees) | | $ | 2,226,728 | | | $ | 1,559,772 | | | $ | 1,350,899 | | | $ | 1,320,154 | | | $ | 1,192,214 | |
Average loans outstanding (net of unearned discount and deferred loan fees) | | $ | 1,969,696 | | | $ | 1,417,237 | | | $ | 1,333,341 | | | $ | 1,262,497 | | | $ | 1,144,965 | |
Balance of allowance for loan losses at the beginning of year | | $ | 16,768 | | | $ | 15,320 | | | $ | 15,261 | | | $ | 15,191 | | | $ | 14,269 | |
Loans charged-off: | | | | | | | | | | | | | | | | | | | | |
Commercial and industrial | | | (338 | ) | | | (73 | ) | | | (284 | ) | | | (71 | ) | | | (124 | ) |
Commercial mortgage | | | (1,270 | ) | | | — | | | | — | | | | — | | | | — | |
Residential mortgage | | | — | | | | — | | | | — | | | | — | | | | (37 | ) |
Home Equity | | | — | | | | — | | | | — | | | | — | | | | (1 | ) |
Consumer | | | (48 | ) | | | (36 | ) | | | (39 | ) | | | (33 | ) | | | (16 | ) |
Total loans charged-off | | $ | (1,656 | ) | | $ | (109 | ) | | $ | (323 | ) | | $ | (104 | ) | | $ | (178 | ) |
Recovery of loans previously charged-off: | | | | | | | | | | | | | | | | | | | | |
Commercial and industrial | | | 53 | | | | 48 | | | | 13 | | | | 14 | | | | 4 | |
Commercial mortgage | | | — | | | | — | | | | — | | | | 7 | | | | 8 | |
Residential mortgage | | | — | | | | — | | | | — | | | | 13 | | | | — | |
Home Equity | | | — | | | | — | | | | — | | | | 1 | | | | — | |
Consumer | | | 11 | | | | 7 | | | | 7 | | | | 7 | | | | 13 | |
Total recoveries of loans previously charged-off: | | | 64 | | | | 55 | | | | 20 | | | | 42 | | | | 25 | |
Net loan (charge-offs) recoveries | | $ | (1,592 | ) | | $ | (54 | ) | | $ | (303 | ) | | $ | (62 | ) | | $ | (153 | ) |
Provision charged to operating expense | | | 3,004 | | | | 1,502 | | | | 362 | | | | 132 | | | | 1,075 | |
Balance at end of period | | $ | 18,180 | | | $ | 16,768 | | | $ | 15,320 | | | $ | 15,261 | | | $ | 15,191 | |
Ratio of net (charge-offs) recoveries during the year to average loans outstanding | | | (0.08 | )% | | | (0.00 | )% | | | (0.02 | )% | | | (0.00 | )% | | | (0.01 | )% |
Ratio of allowance for loan losses to loans outstanding | | | 0.82 | % | | | 1.08 | % | | | 1.13 | % | | | 1.16 | % | | | 1.27 | % |
The level of charge-offs depends on many factors, including the national and regional economy. Cyclical lagging factors may result in charge-offs being higher than historical levels. The allowance for loan losses increased primarily due to continued loan growth and changes in the portfolio composition. Although the allowance is allocated between categories, the entire allowance is available to absorb losses attributable to all loan categories. Management believes that the allowance for loan losses is adequate.
Sources of Funds
General. Deposits traditionally have been our primary source of funds for our investment and lending activities. The Company also borrows from the FHLB of Boston or the Federal Reserve Bank of Boston (“FRB of Boston”), and utilizes brokered deposits to supplement cash flow needs, to lengthen the maturities of liabilities for interest rate risk management purposes, and to manage our cost of funds. Our additional sources of funds are scheduled payments and prepayments of principal and interest on loans and investment securities and fee income and proceeds from the sales of loans and securities.
Deposits. The Company accepts deposits primarily from customers in the communities in which our branches and offices are located, as well as from small- and medium-sized businesses and other customers throughout our lending area. We rely on our competitive pricing and products, convenient locations, and client service to attract and retain deposits. We offer a variety of deposit accounts with a range of interest rates and terms. Our deposit accounts consist of relationship checking for consumers and businesses, statement savings accounts, certificates of deposit, money market accounts, interest on lawyer trust accounts, commercial and regular checking accounts, and individual retirement accounts. Deposit rates and terms are based primarily on current business strategies, market interest rates, liquidity requirements, and our deposit growth goals. The Bank may also access the brokered deposit market for funding.
At December 31, 2019,2020, we had a total of $175.2$223.8 million in certificates of deposit, excluding brokered deposits, of which $141.3$185.9 million had remaining maturities of one year or less. Based on historical experience and our current pricing strategy, we believe the Bank will retain a large portion of these accounts upon maturity. The Bank had total brokered deposits of $30.8 million, $7.1 million, $27.5 million and $52.7$27.5 million at December 31, 2020, 2019, and 2018, and 2017, respectively.
The following table sets forth the average balances of the Bank’s deposits for the periods indicated:
| | December 31, | | | December 31, | | | | December 31, | December 31, | |
| | 2019 | | | 2018 | | | | 2020 | 2019 | |
| | Average Balance | | | Percent | | | Weighted Average Rate | | | Average Balance | | | Percent | | | Weighted Average Rate | | | | Amount | | | Percent | | | Amount | | | Percent | |
| | (dollars in thousands) | | (dollars in thousands) | |
Demand deposits (non-interest bearing) | | $ | 567,500 | | | | 25.5 | % | | | — | | | $ | 521,091 | | | | 29.2 | % | | | — | | | | $ | 1,006,132 | | | | 29.7 | % | | $ | 630,593 | | | | 26.7 | % |
Interest bearing checking | | | 417,226 | | | | 18.8 | % | | | 0.09 | % | | | 409,178 | | | | 23.0 | % | | | 0.08 | % | | | | 625,650 | | | | 18.4 | % | | | 450,098 | | | | 19.1 | % |
Money Market | | | 189,836 | | | | 8.5 | % | | | 1.06 | % | | | 93,449 | | | | 5.2 | % | | | 1.14 | % | | |
Money market | | | | 532,218 | | | | 15.6 | % | | | 181,406 | | | | 7.7 | % |
Savings | | | 827,279 | | | | 37.3 | % | | | 0.97 | % | | | 624,421 | | | | 35.1 | % | | | 0.78 | % | | | | 984,262 | | | | 28.9 | % | | | 914,499 | | | | 38.8 | % |
Retail certificates of deposit under $100,000 | | | 58,677 | | | | 2.6 | % | | | 1.13 | % | | | 36,408 | | | | 2.0 | % | | | 0.69 | % | | | | 62,646 | | | | 1.8 | % | | | 56,602 | | | | 2.4 | % |
Retail certificates of deposit of $100,000 or greater | | | 111,018 | | | | 5.0 | % | | | 1.42 | % | | | 59,226 | | | | 3.3 | % | | | 1.27 | % | | | | 161,387 | | | | 4.7 | % | | | 118,596 | | | | 5.0 | % |
Wholesale certificates of deposit | | | 51,604 | | | | 2.3 | % | | | 1.82 | % | | | 38,373 | | | | 2.2 | % | | | 1.69 | % | | | | 30,788 | | | | 0.9 | % | | | 7,084 | | | | 0.3 | % |
Total | | $ | 2,223,140 | | | | 100 | % | | | 0.61 | % | | $ | 1,782,146 | | | | 100 | % | | | 0.44 | % | | | $ | 3,403,083 | | | | 100.0 | % | | $ | 2,358,878 | | | | 100.0 | % |
Retail certificates of deposit of $100,000 or greater by maturity are as follows:
| | December 31, | | | December 31, | |
| | 2019 | | | 2018 | | | 2017 | | | 2020 | | | 2019 | |
| | (dollars in thousands) | | | (dollars in thousands) | |
Less than 3 months remaining | | $ | 35,054 | | | $ | 7,807 | | | $ | 22,995 | | | $ | 34,453 | | | $ | 35,054 | |
3 to 5 months remaining | | | 32,245 | | | | 7,361 | | | | 10,535 | | | | 41,755 | | | | 32,245 | |
6 to 11 months remaining | | | 27,119 | | | | 14,078 | | | | 6,361 | | | | 61,320 | | | | 27,119 | |
12 months or more remaining | | | 24,178 | | | | 28,446 | | | | 29,202 | | | | 23,859 | | | | 24,178 | |
Total | | $ | 118,596 | | | $ | 57,692 | | | $ | 69,093 | | | $ | 161,387 | | | $ | 118,596 | |
Retail certificates of deposit of $100,000 or greater totaled $118.6 million, $57.7 million, and, $69.1 million at December 31, 2019, 2018, and 2017, respectively. Interest expense on retail certificates of deposit of $100,000 or greater was $126,000 and $2.1 million $467,000, and, $446,000 for the years ended December 31, 2019, 2018,2020 and 2017,2019, respectively.
The following table sets forth certificates of deposit classified by interest rate as of the dates indicated:
| | December 31, | | | December 31, | |
| | 2019 | | | 2018 | | | 2017 | | | 2020 | | | 2019 | |
| | (dollars in thousands) | | | (dollars in thousands) | |
Interest Rate: | | | | | | | | | | | | | | | | | | | | |
Less than 1.00% | | $ | 51,306 | | | $ | 49,360 | | | $ | 75,284 | | | $ | 156,732 | | | $ | 51,306 | |
1.00% to 1.99% | | | 62,986 | | | | 52,888 | | | | 84,546 | | | | 62,194 | | | | 62,986 | |
2.00% to 2.99% | | | 67,990 | | | | 19,171 | | | | — | | | | 35,895 | | | | 67,990 | |
Total | | $ | 182,282 | | | $ | 121,419 | | | $ | 159,830 | | | $ | 254,821 | | | $ | 182,282 | |
Borrowings. Total borrowings were $33.0 million, a decrease of $102.7 million as compared to $135.7 million at December 31, 2019. The Bank’sCompany’s borrowings consisted primarily of advances from the FHLB of Boston. FHLB of Boston advances are collateralized by a blanket pledge agreement on the Bank’sCompany’s FHLB of Boston stock and residential mortgages held in the Bank’s portfolios. The Bank’s borrowings with the FHLB of Boston totaled $135.7 million at December 31, 2019, an increase of $42.3 million compared to $93.4 million at December 31, 2018.
The Bank’s remaining borrowing capacity at the FHLB of Boston at December 31, 20192020 was approximately $345.5$672.7 million. In addition, the Bank has a $10.0 million line of credit with the FHLB of Boston.Boston.
The Company had no borrowings outstanding with the FRB Boston at both December 31, 2020 and 2019. The Company’s remaining borrowing capacity at the FRB Boston at December 31, 2020 was approximately $562.4 million.
See Note 12 “- Borrowings,” for a schedule, including related interest rates and other information.
Net Interest MarginMargiN
Net interest income represents the difference between interest earned, primarily on loans and investments, and interest paid on funding sources, primarily deposits and borrowings. Interest rate spread is the difference between the average rate earned on total interest-earning assets and the average rate paid on total interest-bearing liabilities. Net interest margin is the amount of net interest income, on
a fully taxable-equivalent basis, expressed as a percentage of average interest-earning assets. The average rate earned on earning assets is the amount of annualized taxable equivalent interest income expressed as a percentage of average earning assets. The average rate paid on interest-bearing liabilities is equal to annualized interest expense as a percentage of average interest-bearing liabilities.
The following table sets forth the distribution of the Company’s average assets, liabilities and shareholders’ equity, and average rates earned or paid on a fully taxable equivalent basis for each of the periods indicated:
| | Year Ended | | | Year Ended | |
| | December 31, 2019 | | | December 31, 2018 | | | December 31, 2017 | | | December 31, 2020 | | | December 31, 2019 | | | December 31, 2018 | |
| | Average Balance | | | Interest Income/ Expenses (1) | | | Rate Earned/ Paid (1) | | | Average Balance | | | Interest Income/ Expenses (1) | | | Rate Earned/ Paid (1) | | | Average Balance | | | Interest Income/ Expenses (1) | | | Rate Earned/ Paid (1) | | | Average Balance | | | Interest Income/ Expenses (1) | | | Rate Earned/ Paid (1) | | | Average Balance | | | Interest Income/ Expenses (1) | | | Rate Earned/ Paid (1) | | | Average Balance | | | Interest Income/ Expenses (1) | | | Rate Earned/ Paid (1) | |
| | (dollars in thousands) | | | (dollars in thousands) | |
ASSETS | | | | | | | | | | | | | | | | | | | | | | | | | | | | | | | | | | | | | | | | | | | | | | | | | | | | | | | | | | | | | | | | | | | | | | | | |
Interest-earning assets | | | | | | | | | | | | | | | | | | | | | | | | | | | | | | | | | | | | | | | | | | | | | | | | | | | | | | | | | | | | | | | | | | | | | | | | |
Loans (2) | | | | | | | | | | | | | | | | | | | | | | | | | | | | | | | | | | | | | | | | | | | | | | | | | | | | | | | | | | | | | | | | | | | | | | | | |
Taxable | | $ | 1,952,374 | | | $ | 84,382 | | | | 4.32 | % | | $ | 1,407,079 | | | $ | 57,941 | | | | 4.12 | % | | $ | 1,318,284 | | | $ | 51,238 | | | | 3.89 | % | | $ | 2,832,796 | | | $ | 119,447 | | | | 4.22 | % | | $ | 1,952,374 | | | $ | 84,382 | | | | 4.32 | % | | $ | 1,407,079 | | | $ | 57,941 | | | | 4.12 | % |
Tax-exempt | | | 17,322 | | | | 740 | | | | 4.27 | | | | 10,158 | | | | 469 | | | | 4.62 | | | | 15,057 | | | | 764 | | | | 5.07 | | | | 23,835 | | | | 1,115 | | | | 4.68 | | | | 17,322 | | | | 740 | | | | 4.27 | | | | 10,158 | | | | 469 | | | | 4.62 | |
Securities available for sale (3) | | | | | | | | | | | | | | | | | | | | | | | | | | | | | | | | | | | | | | | | | | | | | | | | | | | | | | | | | | | | | | | | | | | | | | | | |
Taxable | | | 154,256 | | | | 2,884 | | | | 1.87 | | | | 194,419 | | | | 3,202 | | | | 1.65 | | | | 248,787 | | | | 4,011 | | | | 1.61 | | | | 136,776 | | | | 2,337 | | | | 1.71 | | | | 154,256 | | | | 2,884 | | | | 1.87 | | | | 194,419 | | | | 3,202 | | | | 1.65 | |
Securities held to maturity | | | | | | | | | | | | | | | | | | | | | | | | | | | | | | | | | | | | | | | | | | | | | | | | | | | | | | | | | | | | | | | | | | | | | | | | |
Taxable | | | 204,909 | | | | 5,079 | | | | 2.48 | | | | 189,120 | | | | 4,255 | | | | 2.25 | | | | 111,452 | | | | 2,310 | | | | 2.07 | | | | 152,789 | | | | 3,711 | | | | 2.43 | | | | 204,909 | | | | 5,079 | | | | 2.48 | | | | 189,120 | | | | 4,255 | | | | 2.25 | |
Tax-exempt | | | 75,432 | | | | 2,897 | | | | 3.84 | | | | 76,966 | | | | 3,043 | | | | 3.95 | | | | 81,528 | | | | 4,000 | | | | 4.91 | | | | 89,841 | | | | 3,145 | | | | 3.50 | | | | 75,432 | | | | 2,897 | | | | 3.84 | | | | 76,966 | | | | 3,043 | | | | 3.95 | |
Cash and cash equivalents | | | 50,839 | | | | 731 | | | | 1.44 | | | | 45,365 | | | | 595 | | | | 1.31 | | | | 41,888 | | | | 291 | | | | 0.69 | | | | 69,783 | | | | 187 | | | | 0.27 | | | | 50,839 | | | | 731 | | | | 1.44 | | | | 45,365 | | | | 595 | | | | 1.31 | |
Total interest-earning assets (4) | | | 2,455,132 | | | | 96,713 | | | | 3.94 | % | | | 1,923,107 | | | | 69,505 | | | | 3.61 | % | | | 1,816,996 | | | | 62,614 | | | | 3.45 | % | | | 3,305,820 | | | | 129,942 | | | | 3.93 | % | | | 2,455,132 | | | | 96,713 | | | | 3.94 | % | | | 1,923,107 | | | | 69,505 | | | | 3.61 | % |
Non interest-earning assets | | | 162,529 | | | | | | | | | | | | 73,330 | | | | | | | | | | | | 73,532 | | | | | | | | | | | | 245,316 | | | | | | | | | | | | 162,529 | | | | | | | | | | | | 73,330 | | | | | | | | | |
Allowance for loan losses | | | (17,345 | ) | | | | | | | | | | | (15,857 | ) | | | | | | | | | | | (15,392 | ) | | | | | | | | | | | (27,887 | ) | | | | | | | | | | | (17,345 | ) | | | | | | | | | | | (15,857 | ) | | | | | | | | |
Total assets | | $ | 2,600,316 | | | | | | | | | | | $ | 1,980,580 | | | | | | | | | | | $ | 1,875,136 | | | | | | | | | | | $ | 3,523,249 | | | | | | | | | | | $ | 2,600,316 | | | | | | | | | | | $ | 1,980,580 | | | | | | | | | |
LIABILITIES AND SHAREHOLDERS’ EQUITY | | | | | | | | | | | | | | | | | | | | | | | | | | | | | | | | | | | | | | | | | | | | | | | | | | | | | | | | | | | | | | | | | | | | | | | | |
Interest-bearing deposits | | | | | | | | | | | | | | | | | | | | | | | | | | | | | | | | | | | | | | | | | | | | | | | | | | | | | | | | | | | | | | | | | | | | | | | | |
Checking accounts | | $ | 417,226 | | | $ | 440 | | | | 0.11 | % | | $ | 409,178 | | | $ | 247 | | | | 0.06 | % | | $ | 394,132 | | | $ | 131 | | | | 0.03 | % | | $ | 554,000 | | | $ | 682 | | | | 0.12 | % | | $ | 417,226 | | | $ | 440 | | | | 0.11 | % | | $ | 409,178 | | | $ | 247 | | | | 0.06 | % |
Savings accounts | | | 827,279 | | | | 8,708 | | | | 1.05 | | | | 624,421 | | | | 2,900 | | | | 0.46 | | | | 571,659 | | | | 1,457 | | | | 0.25 | | | | 937,247 | | | | 3,378 | | | | 0.36 | | | | 827,279 | | | | 8,708 | | | | 1.05 | | | | 624,421 | | | | 2,900 | | | | 0.46 | |
Money market accounts | | | 189,836 | | | | 2,481 | | | | 1.31 | | | | 93,449 | | | | 597 | | | | 0.64 | | | | 68,891 | | | | 103 | | | | 0.15 | | | | 350,117 | | | | 1,277 | | | | 0.36 | | | | 189,836 | | | | 2,481 | | | | 1.31 | | | | 93,449 | | | | 597 | | | | 0.64 | |
Certificates of deposit | | | 221,299 | | | | 4,012 | | | | 1.81 | | | | 134,007 | | | | 1,279 | | | | 0.95 | | | | 166,410 | | | | 1,434 | | | | 0.86 | | | | 259,568 | | | | 1,958 | | | | 0.75 | | | | 221,299 | | | | 4,012 | | | | 1.81 | | | | 134,007 | | | | 1,279 | | | | 0.95 | |
Total interest-bearing deposits | | | 1,655,640 | | | | 15,641 | | | | 0.94 | % | | | 1,261,055 | | | | 5,023 | | | | 0.40 | % | | | 1,201,092 | | | | 3,125 | | | | 0.26 | % | | | 2,100,932 | | | | 7,295 | | | | 0.35 | % | | | 1,655,640 | | | | 15,641 | | | | 0.94 | % | | | 1,261,055 | | | | 5,023 | | | | 0.40 | % |
Subordinated debt | | | | 5,408 | | | | 444 | | | | 8.21 | | | | — | | | | — | | | | — | | | | - | | | | | | | | | |
Other borrowed funds | | | 86,712 | | | | 2,002 | | | | 2.31 | | | | 18,671 | | | | 444 | | | | 2.38 | | | | 36,074 | | | | 462 | | | | 1.28 | | | | 123,693 | | | | 1,406 | | | | 1.14 | | | | 86,712 | | | | 2,002 | | | | 2.31 | | | | 18,671 | | | | 444 | | | | 2.38 | |
Total interest-bearing liabilities | | | 1,742,352 | | | | 17,643 | | | | 1.01 | % | | | 1,279,726 | | | | 5,467 | | | | 0.43 | % | | | 1,237,166 | | | | 3,587 | | | | 0.29 | % | | | 2,230,033 | | | | 9,145 | | | | 0.41 | % | | | 1,742,352 | | | | 17,643 | | | | 1.01 | % | | | 1,279,726 | | | | 5,467 | | | | 0.43 | % |
Non-interest-bearing liabilities | | | | | | | | | | | | | | | | | | | | | | | | | | | | | | | | | | | | | | | | | | | | | | | | | | | | | | | | | | | | | | | | | | | | | | | | |
Demand deposits | | | 567,500 | | | | | | | | | | | | 521,091 | | | | | | | | | | | | 470,871 | | | | | | | | | | | | 838,653 | | | | | | | | | | | | 567,500 | | | | | | | | | | | | 521,091 | | | | | | | | | |
Other liabilities | | | 68,847 | | | | | | | | | | | | 24,217 | | | | | | | | | | | | 25,611 | | | | | | | | | | | | 103,086 | | | | | | | | | | | | 68,847 | | | | | | | | | | | | 24,217 | | | | | | | | | |
Total liabilities | | | 2,378,699 | | | | | | | | | | | | 1,825,034 | | | | | | | | | | | | 1,733,648 | | | | | | | | | | | | 3,171,772 | | | | | | | | | | | | 2,378,699 | | | | | | | | | | | | 1,825,034 | | | | | | | | | |
Shareholders’ equity | | | 221,617 | | | | | | | | | | | | 155,546 | | | | | | | | | | | | 141,488 | | | | | | | | | | | | 351,477 | | | | | | | | | | | | 221,617 | | | | | | | | | | | | 155,546 | | | | | | | | | |
Total liabilities & shareholders’ equity | | $ | 2,600,316 | | | | | | | | | | | $ | 1,980,580 | | | | | | | | | | | $ | 1,875,136 | | | | | | | | | | | $ | 3,523,249 | | | | | | | | | | | $ | 2,600,316 | | | | | | | | | | | $ | 1,980,580 | | | | | | | | | |
Net interest income on a fully taxable equivalent basis | | | | | | | 79,070 | | | | | | | | | | | | 64,038 | | | | | | | | | | | | 59,027 | | | | | | | | | | | | 120,797 | | | | | | | | | | | | 79,070 | | | | | | | | | | | | 64,038 | | | | | |
Less taxable equivalent adjustment | | | | | | | (764 | ) | | | | | | | | | | | (737 | ) | | | | | | | | | | | (1,668 | ) | | | | | | | | | | | (895 | ) | | | | | | | | | | | (764 | ) | | | | | | | | | | | (737 | ) | | | | |
Net interest income | | | | | | $ | 78,306 | | | | | | | | | | | $ | 63,301 | | | | | | | | | | | $ | 57,359 | | | | | | | | | | | $ | 119,902 | | | | | | | | | | | $ | 78,306 | | | | | | | | | | | $ | 63,301 | | | | | |
Net interest spread (5) | | | | | | | | | | | 2.93 | % | | | | | | | | | | | 3.19 | % | | | | | | | | | | | 3.16 | % | | | | | | | | | | | 3.52 | % | | | | | | | | | | | 2.93 | % | | | | | | | | | | | 3.19 | % |
Net interest margin (6) | | | | | | | | | | | 3.22 | % | | | | | | | | | | | 3.33 | % | | | | | | | | | | | 3.25 | % | | | | | | | | | | | 3.65 | % | | | | | | | | | | | 3.22 | % | | | | | | | | | | | 3.33 | % |
(1) | Annualized on a fully taxable equivalent basis calculated using a federal tax rate of 21% for 2020, 2019, and 2018 and 35% for 2017.2018. |
(2) | NonaccrualNon-accrual loans are included in average amounts outstanding.
|
(3) | Average balances of securities available for sale calculated utilizing amortized cost. |
(4) | Federal Home Loan Bank stock balance and dividend income is excluded from interest-earning assets. |
(5) | Net Interest rate spread represents the difference between the weighted average yield on interest-earning assets, inclusive of PPP loans originated during 2020, and the weighted average cost of interest-bearing liabilities. |
(6) | Net interest margin represents net interest income on a fully tax equivalent basis as a percentage of average interest-earning assets.assets, inclusive of PPP loans originated during 2020. |
Rate/Volume Analysis
The following table describes the extent to which changes in interest rates and changes in the volume of interest-earning assets and interest-bearing liabilities have affected the Company’s interest income and interest expense during the periods indicated. Information is provided in each category with respect to: (i) changes attributable to changes in volumes (changes in average balance multiplied by prior year average rate), (ii) changes attributable to changes in rate (change in average interest rate multiplied by prior year average balance), and (iii) changes attributable to the combined impact of volumes and rates have been allocated proportionately to separate volume and rate categories.
| | Year Ended December 31, 2019 | | | Year Ended December 31, 2018 | | | Year Ended December 31, 2020 | | | Year Ended December 31, 2019 | |
| | Compared with | | | Compared with | | | Compared with | | | Compared with | |
| | Year Ended December 31, 2018 | | | Year Ended December 31, 2017 | | | Year Ended December 31, 2019 | | | Year Ended December 31, 2018 | |
| | Increase/(Decrease) Due to Change in | | | Increase/(Decrease) Due to Change in | | | Increase/(Decrease) Due to Change in | | | Increase/(Decrease) Due to Change in | |
| | Volume | | | Rate | | | Total | | | Volume | | | Rate | | | Total | | | Volume | | | Rate | | | Total | | | Volume | | | Rate | | | Total | |
| | (dollars in thousands) | | | (dollars in thousands) | | | (dollars in thousands) | | | (dollars in thousands) | |
Interest income | | | | | | | | | | | | | | | | | | | | | | | | | | | | | | | | | | | | | | | | | | | | | | | | |
Loans | | | | | | | | | | | | | | | | | | | | | | | | | | | | | | | | | | | | | | | | | | | | | | | | |
Taxable | | $ | 23,441 | | | $ | 3,000 | | | $ | 26,441 | | | $ | 3,560 | | | $ | 3,143 | | | $ | 6,703 | | | $ | 37,171 | | | $ | (2,106 | ) | | $ | 35,065 | | | $ | 23,441 | | | $ | 3,000 | | | $ | 26,441 | |
Tax-exempt | | | 308 | | | | (37 | ) | | | 271 | | | | (231 | ) | | | (64 | ) | | | (295 | ) | | | 299 | | | | 76 | | | | 375 | | | | 308 | | | | (37 | ) | | | 271 | |
Securities available for sale | | | | | | | | | | | | | | | | | | | | | | | | | | | | | | | | | | | | | | | | | | | | | | | | |
Taxable | | | (716 | ) | | | 398 | | | | (318 | ) | | | (894 | ) | | | 85 | | | | (809 | ) | | | (311 | ) | | | (236 | ) | | | (547 | ) | | | (716 | ) | | | 398 | | | | (318 | ) |
Securities held to maturity | | | | | | | | | | | | | | | | | | | | | | | | | | | | | | | | | | | | | | | | | | | | | | | | |
Taxable | | | 372 | | | | 452 | | | | 824 | | | | 1,732 | | | | 213 | | | | 1,945 | | | | (1,268 | ) | | | (100 | ) | | | (1,368 | ) | | | 372 | | | | 452 | | | | 824 | |
Tax-exempt | | | (60 | ) | | | (86 | ) | | | (146 | ) | | | (214 | ) | | | (743 | ) | | | (957 | ) | | | 520 | | | | (272 | ) | | | 248 | | | | (60 | ) | | | (86 | ) | | | (146 | ) |
Cash and due from banks | | | 76 | | | | 60 | | | | 136 | | | | 26 | | | | 278 | | | | 304 | | | | 203 | | | | (747 | ) | | | (544 | ) | | | 76 | | | | 60 | | | | 136 | |
Total interest income | | $ | 23,421 | | | $ | 3,787 | | | $ | 27,208 | | | $ | 3,979 | | | $ | 2,912 | | | $ | 6,891 | | | $ | 36,614 | | | $ | (3,385 | ) | | $ | 33,229 | | | $ | 23,421 | | | $ | 3,787 | | | $ | 27,208 | |
Interest expense | | | | | | | | | | | | | | | | | | | | | | | | | | | | | | | | | | | | | | | | | | | | | | | | |
Deposits | | | | | | | | | | | | | | | | | | | | | | | | | | | | | | | | | | | | | | | | | | | | | | | | |
Checking accounts | | | 5 | | | | 188 | | | | 193 | | | | 5 | | | | 111 | | | | 116 | | | | 160 | | | | 82 | | | | 242 | | | | 5 | | | | 188 | | | | 193 | |
Savings accounts | | | 1,186 | | | | 4,622 | | | | 5,808 | | | | 146 | | | | 1,297 | | | | 1,443 | | | | 1,030 | | | | (6,360 | ) | | | (5,330 | ) | | | 1,186 | | | | 4,622 | | | | 5,808 | |
Money market accounts | | | 936 | | | | 948 | | | | 1,884 | | | | 49 | | | | 445 | | | | 494 | | | | 1,280 | | | | (2,484 | ) | | | (1,204 | ) | | | 936 | | | | 948 | | | | 1,884 | |
Certificates of deposit | | | 1,148 | | | | 1,585 | | | | 2,733 | | | | (299 | ) | | | 144 | | | | (155 | ) | | | 601 | | | | (2,655 | ) | | | (2,054 | ) | | | 1,148 | | | | 1,585 | | | | 2,733 | |
Total interest-bearing deposits | | | 3,275 | | | | 7,343 | | | | 10,618 | | | | (99 | ) | | | 1,997 | | | | 1,898 | | | | 3,071 | | | | (11,417 | ) | | | (8,346 | ) | | | 3,275 | | | | 7,343 | | | | 10,618 | |
Subordinated debt | | | | 444 | | | | — | | | | 444 | | | | — | | | | — | | | | — | |
Other borrowed funds | | | 1,571 | | | | (13 | ) | | | 1,558 | | | | (292 | ) | | | 274 | | | | (18 | ) | | | 656 | | | | (1,252 | ) | | | (596 | ) | | | 1,571 | | | | (13 | ) | | | 1,558 | |
Total interest expense | | $ | 4,846 | | | $ | 7,330 | | | $ | 12,176 | | | $ | (391 | ) | | $ | 2,271 | | | $ | 1,880 | | | $ | 4,171 | | | $ | (12,669 | ) | | $ | (8,498 | ) | | $ | 4,846 | | | $ | 7,330 | | | $ | 12,176 | |
Change in net interest income | | $ | 18,575 | | | $ | (3,543 | ) | | $ | 15,032 | | | $ | 4,370 | | | $ | 641 | | | $ | 5,011 | | | $ | 32,443 | | | $ | 9,284 | | | $ | 41,727 | | | $ | 18,575 | | | $ | (3,543 | ) | | $ | 15,032 | |
Excluding the impact of merger-related loan accretion and the impact of PPP loans, the adjusted net interest margin for the year ended December 31, 2020 was 3.36%, representing a 14 basis points increase over the net interest margin for the year ended December 31, 2019 of 3.22%.
| | For the Year Ended | |
| | December 31, 2020 | |
| | Average Balance | | | Interest Income/ Expenses | | | Rate Earned/ Paid | |
| | (dollars in thousands) | |
Total interest-earning assets (GAAP) | | $ | 3,305,820 | | | | | | | | | |
Net interest income on a fully taxable equivalent basis (GAAP) | | | | | | $ | 120,797 | | | | | |
Net interest margin (GAAP) | | | | | | | | | | | 3.65 | % |
Less: Paycheck Protection Program loan impact | | | (120,048 | ) | | | (4,062 | ) | | | 0.01 | % |
Less: Accretion of loan fair value adjustments | | | | | | | (9,791 | ) | | | -0.30 | % |
Adjusted net interest margin on a fully taxable equivalent basis | | $ | 3,185,772 | | | $ | 106,944 | | | | 3.36 | % |
Market Risk and Asset Liability Management
Market risk is the risk of loss from adverse changes in market prices and rates. The Company’s market risk arises primarily from interest rate risk inherent in its lending and deposit-taking activities. To that end, management actively monitors and manages its interest rate risk exposure.
The Company’s profitability is affected by fluctuations in interest rates. A sudden and substantial change in interest rates may adversely impact the Company’s earnings to the extent that the interest rates borne by assets and liabilities do not change at the same speed, to the same extent or on the same basis. The Company monitors the impact of changes in interest rates on its net interest income using several tools.
The Company’s primary objective in managing interest rate risk is to minimize the adverse impact of changes in interest rates on the Company’s net interest income and capital, while structuring the Company’s asset-liability structure to obtain the maximum yield-cost spread on that structure. The Company relies primarily on its asset-liability structure to control interest rate risk.
Interest Rate Sensitivity. The Company actively manages its interest rate sensitivity position. The objectives of interest rate risk management are to control exposure of net interest income to risks associated with interest rate movements and to achieve sustainable growth in net interest income. The Company’s Asset Liability Committee (“ALCO”), using policies and procedures approved by the
Company’s board of directors, is responsible for the management of the Company’s interest rate sensitivity position. The Company manages interest rate sensitivity by changing the mix, pricing, and re-pricing characteristics of its assets and liabilities, through the management of its investment portfolio, its offerings of loan and selected deposit terms, and through wholesale funding. Wholesale funding consists of, but is not limited to, multiple sources including borrowings with the FHLB of Boston, the Federal Reserve Bank of Boston’s discount window, and certificates of deposit from institutional brokers.
The Company uses several tools to manage its interest rate risk including interest rate sensitivity analysis, or gap analysis, market value of portfolio equity analysis, interest rate simulations under various rate scenarios, and net interest margin reports. The results of these reports are compared to limits established by the Company’s ALCO policies and appropriate adjustments may be made if the results are outside the established limits.
The following table demonstrates the annualized result of an interest rate simulation (excluding purchase accounting adjustments and PPP fee income) and the estimated effect that a parallel interest rate shift, or “shock,” in the yield curve and subjective adjustments in deposit pricing might have on the Company’s projected net interest income over the next 12 months and 24 months.
As of December 31, 2019:2020:
| | Year 1 | | Year 2 | | Year 1 | | Year 2 | |
Change in Interest Rates (in Basis Points) | | Percentage Change in Net Interest Income | | Percentage Change in Net Interest Income | | Percentage Change in Net Interest Income | | Percentage Change in Net Interest Income | |
Parallel rate shocks | | | | | | | | | | |
+400 | | (6.9) | | 4.3 | | 2.3 | | 15.2 | |
+300 | | (5.1) | | 3.3 | | 1.1 | | 10.2 | |
+200 | | (3.4) | | 2.1 | | (0.1) | | 5.1 | |
+100 | | (1.8) | | 0.5 | | 0.1 | | | 1.0 | |
–100 | | 1.5 | | (6.1) | | (2.3) | | (12.0) | |
The following table demonstrates the annualized result of an interest rate simulation (excluding purchase accounting adjustments and PPP fee income) and the estimated effect that a gradual interest rate shift in the yield curve and subjective adjustments in deposit pricing might have on the Company’s projected net interest income over the next 12 months and 24 months.
As of December 31, 2019:2020:
| | Year 1 | | Year 2 |
Change in Interest Rates (in Basis Points) | | Percentage Change in Net Interest Income | | Percentage Change in Net Interest Income |
| | | | |
Gradual rate shifts | | | | |
+200 | | (1.3) | | 1.6 |
–100 | | 0.3 | | (9.2) |
These simulations assume that there is no growth in interest-earning assets or interest-bearing liabilities over the next 12 months and 24 months. The changes to net interest income shown above are in compliance with the Company’s policy guidelines.
| | Year 1 | | Year 2 |
Change in Interest Rates (in Basis Points) | | Percentage Change in Net Interest Income | | Percentage Change in Net Interest Income |
| | | | |
Gradual rate shifts | | | | |
+200 | | (2.6) | | (0.7) |
–100 | | 1.7 | | (3.0) |
Economic Value of Equity Analysis. The Company also analyzes the sensitivity of the Bank’s financial condition to changes in interest rates through our economic value of equity model. This analysis measures the difference between estimated changes in the present value of the Bank’s assets and estimated changes in the present value of the Bank’s liabilities assuming various changes in current interest rates.
The Bank’s economic value of equity analysis as of December 31, 20192020 estimated that, in the event of an instantaneous 200 basis point increase in interest rates, the Bank would experience a 5.4% increase9.7% decrease in the economic value of equity for the next 12 months, and a 11.0%9.9% increase in the economic value of equity for the next 24 months. At the same date, our analysis estimated that, in the event of an instantaneous 100 basis point decrease in interest rates, the Bank would experience a 16.7%an 8.0% increase in the economic value of equity over the next 12 months, and a 11.4%an 11.2% increase in the economic value of equity for the next 24 months. The estimates within the economic value of equity calculation are significantly impacted by management’s assumption that the value of non-maturity deposits do not fall below their stated balance as of December 31, 2019.2020. This assumption has the impact of increasing the Bank’s economic value of equity in the falling rate scenario as lower market rates increase the value of the loan and investment portfolios while the value of the non-maturity deposit base remains static. The Company believes retaining customer relationships is the most desirable strategy over the long term.
The estimates of changes in the economic value of our equity require us to make certain assumptions including loan- and mortgage-related investment prepayment speeds, reinvestment rates, and deposit maturities and decay rates. These assumptions are inherently uncertain and, as a result, we cannot precisely predict the impact of changes in interest rates on the economic value of our equity. Although our economic value of equity analysis provides an indication of our interest rate risk exposure at a particular point in time, such estimates are not intended to, and do not, provide a precise forecast of the effect of changes in market interest rates on the economic value of our equity and will differ from actual results.
LIQUIDITY AND CAPITAL RESOURCES
Impact of Inflation and Changing Prices. Our Consolidated Financial Statements and related notes have been prepared in accordance with GAAP. GAAP generally requires the measurement of financial position and operating results in terms of historical dollars without consideration of changes in the relative purchasing power of money over time due to inflation. The impact of inflation is reflected in the increased cost of our operations. Unlike industrial companies, our assets and liabilities are primarily monetary in nature. As a result, changes in market interest rates have a greater impact on performance than the effects of inflation.
Liquidity. Liquidity is defined as the Company’s ability to generate adequate cash to meet its needs for day-to-day operations and material long- and short-term commitments. Liquidity risk is the risk of potential loss if the Company were unable to meet its funding requirements at a reasonable cost. The Company manages its liquidity based on demand and specific events and uncertainties to meet current and future financial obligations of a short-term nature. The Company’s objective in managing liquidity is to respond to the needs of depositors and borrowers, as well as increase to earnings enhancement opportunities in a changing marketplace. At December 31, 2020, the Company had access to funds totaling $1.8 billion.
The Company’s liquidity position is managed on a daily basis as part of the daily settlement function and continuously as part of the formal asset liability management process. The Bank’s liquidity is maintained by managing its core deposits as the primary source, selling investment securities, selling loans in the secondary market, borrowing from the FHLB of Boston and the FRB, and purchasing wholesale certificates of deposit as its secondary sources.
The sources of funds for dividends paid by the Company are dividends received from the Bank and liquid funds held by the Company. The Company and the Bank are regulated enterprises and their abilities to pay dividends are subject to regulatory review and restriction. Certain regulatory and statutory restrictions exist regarding dividends, loans, and advances from the Bank to the Company. Generally, the Bank has the ability to pay dividends to the Company subject to minimum regulatory capital requirements.
Quarterly, ALCO reviews the Company’s liquidity needs and reports any findings (if required) to the Board of Directors.
Capital Adequacy. Total shareholders’ equity was $401.7 million at December 31, 2020, as compared to $286.6 million at December 31, 2019, as compared to $167.0 million at December 31, 2018.2019. The Company’s equity increased primarily due to net income of $25.3$32.0 million, $59.4$87.2 million of equity increaseissued as a result of the OptimaWellesley merger, $38.2 million (netbefore tax-effect increases in the value of underwriting fees) from the Company’s fourth quarter 2019 common stock offering,interest rate derivative positions of $4.7 million, and stock-based compensationbefore tax-effect increases in unrealized gains on the available for sale investment portfolio of $3.6 million, partially offset by regular dividend payments of $13.1 million paid during 2019.the year. The ratio of total equity to total assets was 10.04%10.17% and 7.95%10.04% at December 31, 20192020 and December 31, 2018,2019, respectively. Book value per share was $53.06$58.00 and $40.67,$53.06, at December 31, 2020 and 2019, and 2018, respectively.
The Company and the Bank are subject to various regulatory capital requirements. As of December 31, 2019,2020, the Company and the Bank exceeded the regulatory minimum levels to be considered “well capitalized.” See Note 18 – Shareholders’ Equity to the Consolidated Financial Statements for additional discussion of regulatory capital requirements.
Contractual Obligations, Commitments, and Contingencies
The Company has entered into contractual obligations and commitments. The following tables summarize the Company’s contractual cash obligations and other commitments by maturity at December 31, 2019:2020:
| | Payments Due — By Period as of December 31, 2019 | | | Payments Due — By Period as of December 31, 2020 | |
CONTRACTUAL OBLIGATIONS | | Total | | | Less Than One Year | | | One to Three Years | | | Three to Five Years | | | After Five Years | | | Total | | | Less Than One Year | | | One to Three Years | | | Three to Five Years | | | After Five Years | |
| | (dollars in thousands) | | | (dollars in thousands) | |
FHLBB advances | | $ | 135,691 | | | $ | 135,691 | | | $ | — | | | $ | — | | | $ | — | | | $ | 32,992 | | | $ | 15,157 | | | $ | 17,835 | | | $ | — | | | $ | — | |
Retirement benefit obligations | | | 27,728 | | | | 2,375 | | | | 5,022 | | | | 5,465 | | | | 14,866 | | | | 29,033 | | | | 2,456 | | | | 5,332 | | | | 5,658 | | | | 15,587 | |
Lease obligations | | | 40,301 | | | | 5,478 | | | | 10,894 | | | | 9,376 | | | | 14,553 | | | | 41,681 | | | | 7,173 | | | | 13,151 | | | | 10,010 | | | | 11,347 | |
Certificates of deposit | | | 182,282 | | | | 139,565 | | | | 37,894 | | | | 4,823 | | | | — | | | | 254,821 | | | | 214,900 | | | | 35,291 | | | | 4,630 | | | | — | |
Total contractual cash obligations | | $ | 386,002 | | | $ | 283,109 | | | $ | 53,810 | | | $ | 19,664 | | | $ | 29,419 | | |
Total contractual cash Obligations | | | $ | 358,527 | | | $ | 239,686 | | | $ | 71,609 | | | $ | 20,298 | | | $ | 26,934 | |
| | Amounts of Commitments Expiring — By Period as of December 31, 2019 | | | Amounts of Commitments Expiring — By Period as of December 31, 2020 | |
OTHER COMMITMENTS | | Total | | | Less Than One Year | | | One to Three Years | | | Three to Five Years | | | After Five Years | | | Total | | | Less Than One Year | | | One to Three Years | | | Three to Five Years | | | After Five Years | |
| | (dollars in thousands) | | | (dollars in thousands) | |
Unused portion of existing lines of credit | | $ | 428,020 | | | $ | 169,719 | | | $ | 105,881 | | | $ | 40,450 | | | $ | 111,970 | | | $ | 584,520 | | | $ | 280,892 | | | $ | 120,268 | | | $ | 68,520 | | | $ | 114,840 | |
Standby letters of credit | | | 9,150 | | | | 8,527 | | | | 623 | | | | — | | | | — | | | | 9,430 | | | | 8,212 | | | | 440 | | | | 778 | | | | — | |
Originations of new loans | | | 24,413 | | | | 24,413 | | | | — | | | | — | | | | — | | | | 94,399 | | | | 94,399 | | | | — | | | | — | | | | — | |
Total commitments | | $ | 461,583 | | | $ | 202,659 | | | $ | 106,504 | | | $ | 40,450 | | | $ | 111,970 | | | $ | 688,349 | | | $ | 383,503 | | | $ | 120,708 | | | $ | 69,298 | | | $ | 114,840 | |
On October 23, 2017, the Company announced its decision to freeze the accrual of benefits within the Pension Plan, effective December 31, 2017. Further discussion regarding commitments and contingencies can be found in Note 16 – FINANCIAL INSTRUMENTS WITH OFF-BALANCE SHEET RISK and Note 17 – Commitments and Contingencies to the Consolidated Financial Statements.
Financial Instruments with Off-Balance-Sheet Risk
The Company is party to financial instruments with off-balance-sheet risk in the normal course of business to meet the financing needs of its customers. These financial instruments primarily include commitments to originate and sell loans, standby letters of credit, unused lines of credit, and unadvanced portions of construction loans. The instruments involve, to varying degrees, elements of credit and interest rate risk in excess of the amount recognized in the consolidated balance sheet. The contract or notional amounts of those instruments reflect the extent of involvement the Company has in these particular classes of financial instruments.
The Company’s exposure to credit loss in the event of nonperformance by the other party to the financial instrument for loan commitments, standby letters of credit and unadvanced portions of construction loans is represented by the contractual amount of those instruments. The Company uses the same credit policies in making commitments and conditional obligations as it does for on-balance-sheet instruments.
Off-Balance-Sheet Arrangements. Our significant off-balance-sheet arrangements consist of the following:
commitments to originate and sell loans,
| • | commitments to originate and sell loans, |
standby and commercial letters of credit,
| • | standby and commercial letters of credit, |
unadvanced portions of construction loans,
| • | unadvanced portions of construction loans, |
unadvanced portions of other loans,
| • | unadvanced portions of other loans, |
loan related derivatives, and
| • | loan related derivatives, and |
risk participation agreements.
| • | risk participation agreements. |
Off-balance-sheet arrangements are more fully discussed in Note 16 – Financial Instruments with Off-Balance-Sheet Risk to the Consolidated Financial Statements.
Item 7A. Quantitative and Qualitative Disclosures About Market Risk.
The information required by this item is included in Item 7 of this report under “Market Risk and Asset Liability Management.”
Item 8. Financial StatementsStatements and Supplementary Data.
CAMBRIDGE BANCORP AND SUBSIDIARIES
CONSOLIDATED BALANCE SHEETS
| | December 31, 2019 | | | December 31, 2018 | | | December 31, 2020 | | | December 31, 2019 | |
| | (dollars in thousands, except par value) | | | (dollars in thousands, except par value) | |
Assets | | | | | | | | | | | | | | | | |
Cash and cash equivalents | | $ | 61,335 | | | $ | 18,473 | | | $ | 75,785 | | | $ | 61,335 | |
Investment securities | | | | | | | | | | | | | | | | |
Available for sale, at fair value (amortized cost $141,109 and $172,290, respectively) | | | 140,330 | | | | 168,163 | | |
Held to maturity, at amortized cost (fair value $264,114 and $281,310, respectively) | | | 258,172 | | | | 282,869 | | |
Available for sale, at fair value (amortized cost $234,252 and $141,109, respectively) | | | | 237,030 | | | | 140,330 | |
Held to maturity, at amortized cost (fair value $260,139 and $264,114, respectively) | | | | 247,672 | | | | 258,172 | |
Total investment securities | | | 398,502 | | | | 451,032 | | | | 484,702 | | | | 398,502 | |
Loans held for sale, at lower of cost or fair value | | | 1,546 | | | | — | | | | 6,909 | | | | 1,546 | |
Loans | | | | | | | | | | | | | | | | |
Residential mortgage | | | 917,566 | | | | 604,331 | | | | 1,298,868 | | | | 917,566 | |
Commercial mortgage | | | 1,060,574 | | | | 757,957 | | | | 1,358,962 | | | | 1,060,574 | |
Home equity | | | 80,675 | | | | 69,336 | | | | 106,194 | | | | 80,675 | |
Commercial & Industrial | | | 133,236 | | | | 93,712 | | | | 347,855 | | | | 133,236 | |
Consumer | | | 34,677 | | | | 34,436 | | | | 41,769 | | | | 34,677 | |
Total loans | | | 2,226,728 | | | | 1,559,772 | | | | 3,153,648 | | | | 2,226,728 | |
Less: allowance for loan losses | | | (18,180 | ) | | | (16,768 | ) | |
Less: allowance for credit losses on loans | | | | (36,016 | ) | | | (18,180 | ) |
Net loans | | | 2,208,548 | | | | 1,543,004 | | | | 3,117,632 | | | | 2,208,548 | |
Federal Home Loan Bank of Boston Stock, at cost | | | 7,854 | | | | 6,844 | | | | 5,734 | | | | 7,854 | |
Bank owned life insurance | | | 37,319 | | | | 30,933 | | | | 46,169 | | | | 37,319 | |
Banking premises and equipment, net | | | 14,756 | | | | 8,578 | | | | 18,158 | | | | 14,756 | |
Right-of-use asset operating leases | | | 33,587 | | | | — | | | | 34,927 | | | | 33,587 | |
Deferred income taxes, net | | | 8,229 | | | | 8,717 | | | | 11,639 | | | | 8,229 | |
Accrued interest receivable | | | 7,052 | | | | 5,762 | | | | 9,514 | | | | 7,052 | |
Goodwill | | | 31,206 | | | | 412 | | | | 51,912 | | | | 31,206 | |
Merger related intangibles, net | | | 3,338 | | | | — | | | | 2,977 | | | | 3,338 | |
Other assets | | | 42,291 | | | | 27,629 | | | | 83,239 | | | | 42,291 | |
Total assets | | $ | 2,855,563 | | | $ | 2,101,384 | | | $ | 3,949,297 | | | $ | 2,855,563 | |
Liabilities | | | | | | | | | | | | | | | | |
Deposits | | | | | | | | | | | | | | | | |
Demand | | $ | 630,593 | | | $ | 494,492 | | | $ | 1,006,132 | | | $ | 630,593 | |
Interest bearing checking | | | 450,098 | | | | 431,702 | | | | 625,650 | | | | 450,098 | |
Money market | | | 181,406 | | | | 135,585 | | | | 532,218 | | | | 181,406 | |
Savings | | | 914,499 | | | | 628,212 | | | | 984,262 | | | | 914,499 | |
Certificates of deposit | | | 182,282 | | | | 121,419 | | | | 254,821 | | | | 182,282 | |
Total deposits | | | 2,358,878 | | | | 1,811,410 | | | | 3,403,083 | | | | 2,358,878 | |
Short-term borrowings | | | 135,691 | | | | 90,000 | | |
Long-term borrowings | | | — | | | | 3,409 | | |
Borrowings | | | | 32,992 | | | | 135,691 | |
Operating lease liabilities | | | 35,054 | | | | — | | | | 37,448 | | | | 35,054 | |
Other liabilities | | | 39,379 | | | | 29,539 | | | | 74,042 | | | | 39,379 | |
Total liabilities | | | 2,569,002 | | | | 1,934,358 | | | | 3,547,565 | | | | 2,569,002 | |
Shareholders’ Equity | | | | | | | | | | | | | | | | |
Common stock, par value $1.00; Authorized: 10,000,000 shares; Outstanding: 5,400,868 shares and 4,107,051 shares, respectively | | | 5,401 | | | | 4,107 | | |
Common stock, par value $1.00; Authorized: 10,000,000 shares; Outstanding: 6,926,728 shares and 5,400,868 shares, respectively | | | | 6,927 | | | | 5,401 | |
Additional paid-in capital | | | 136,766 | | | | 38,271 | | | | 226,967 | | | | 136,766 | |
Retained earnings | | | 146,875 | | | | 131,135 | | | | 165,404 | | | | 146,875 | |
Accumulated other comprehensive loss | | | (2,481 | ) | | | (6,487 | ) | |
Accumulated other comprehensive income (loss) | | | | 2,434 | | | | (2,481 | ) |
Total shareholders’ equity | | | 286,561 | | | | 167,026 | | | | 401,732 | | | | 286,561 | |
Total liabilities and shareholders’ equity | | $ | 2,855,563 | | | $ | 2,101,384 | | | $ | 3,949,297 | | | $ | 2,855,563 | |
The accompanying notes are an integral part of these consolidated financial statements.
CAMBRIDGE BANCORP AND SUBSIDIARIES
CONSOLIDATED STATEMENTSSTATEMENTS OF INCOME
| | For the Year Ended December 31, | | | For the Year Ended December 31, | |
| | 2019 | | | 2018 | | | 2017 | | | | | | | | | | | | | |
| | (dollars in thousands, except share data) | | | 2020 | | | 2019 | | | 2018 | |
Interest and dividend income | | | | | | | | | | | | | | | | | | | | | | | | |
Interest on taxable loans | | $ | 84,382 | | | $ | 57,941 | | | $ | 51,238 | | | $ | 119,447 | | | $ | 84,382 | | | $ | 57,941 | |
Interest on tax-exempt loans | | | 584 | | | | 371 | | | | 496 | | | | 880 | | | | 584 | | | | 371 | |
Interest on taxable investment securities | | | 7,963 | | | | 7,457 | | | | 6,321 | | | | 6,048 | | | | 7,963 | | | | 7,457 | |
Interest on tax-exempt investment securities | | | 2,289 | | | | 2,404 | | | | 2,600 | | | | 2,485 | | | | 2,289 | | | | 2,404 | |
Dividends on FHLB of Boston stock | | | 390 | | | | 287 | | | | 245 | | | | 331 | | | | 390 | | | | 287 | |
Interest on overnight investments | | | 731 | | | | 595 | | | | 291 | | | | 187 | | | | 731 | | | | 595 | |
Total interest and dividend income | | | 96,339 | | | | 69,055 | | | | 61,191 | | | | 129,378 | | | | 96,339 | | | | 69,055 | |
Interest expense | | | | | | | | | | | | | | | | | | | | | | | | |
Interest on deposits | | | 15,641 | | | | 5,023 | | | | 3,125 | | | | 7,295 | | | | 15,641 | | | | 5,023 | |
Interest on borrowed funds | | | 2,002 | | | | 444 | | | | 462 | | | | 1,406 | | | | 2,002 | | | | 444 | |
Interest on subordinated debt | | | | 444 | | | | — | | | | — | |
Total interest expense | | | 17,643 | | | | 5,467 | | | | 3,587 | | | | 9,145 | | | | 17,643 | | | | 5,467 | |
Net interest and dividend income | | | 78,696 | | | | 63,588 | | | | 57,604 | | | | 120,233 | | | | 78,696 | | | | 63,588 | |
Provision for Loan Losses | | | 3,004 | | | | 1,502 | | | | 362 | | |
Net interest and dividend income after provision for loan losses | | | 75,692 | | | | 62,086 | | | | 57,242 | | |
Provision for credit losses | | | | 18,310 | | | | 3,004 | | | | 1,502 | |
Net interest and dividend income after provision for credit losses | | | | 101,923 | | | | 75,692 | | | | 62,086 | |
Noninterest income | | | | | | | | | | | | | | | | | | | | | | | | |
Wealth management revenue | | | 26,499 | | | | 25,191 | | | | 23,029 | | | | 29,751 | | | | 26,499 | | | | 25,191 | |
Deposit account fees | | | 3,185 | | | | 3,071 | | | | 3,142 | | | | 2,595 | | | | 3,185 | | | | 3,071 | |
ATM/Debit card income | | | 1,413 | | | | 1,180 | | | | 1,182 | | | | 1,308 | | | | 1,413 | | | | 1,180 | |
Bank owned life insurance income | | | 612 | | | | 526 | | | | 584 | | | | 747 | | | | 612 | | | | 526 | |
Gain (loss) on disposition of investment securities | | | (79 | ) | | | 2 | | | | (3 | ) | | | 69 | | | | (79 | ) | | | 2 | |
Gain on loans sold | | | 1,170 | | | | 99 | | | | 355 | | | | 1,850 | | | | 1,170 | | | | 99 | |
Loan related derivative income | | | 1,674 | | | | 1,651 | | | | 780 | | | | 1,479 | | | | 1,674 | | | | 1,651 | |
Other income | | | 1,927 | | | | 1,269 | | | | 1,155 | | | | 1,726 | | | | 1,927 | | | | 1,269 | |
Total noninterest income | | | 36,401 | | | | 32,989 | | | | 30,224 | | | | 39,525 | | | | 36,401 | | | | 32,989 | |
Noninterest expense | | | | | | | | | | | | | | | | | | | | | | | | |
Salaries and employee benefits | | | 47,494 | | | | 41,212 | | | | 36,455 | | | | 58,975 | | | | 47,494 | | | | 41,212 | |
Occupancy and equipment | | | 10,855 | | | | 9,072 | | | | 9,114 | | | | 13,004 | | | | 10,855 | | | | 9,072 | |
Data processing | | | 6,232 | | | | 5,177 | | | | 4,956 | | | | 7,662 | | | | 6,232 | | | | 5,177 | |
Professional services | | | 3,623 | | | | 3,258 | | | | 3,374 | | | | 4,190 | | | | 3,623 | | | | 3,258 | |
Marketing | | | 1,760 | | | | 2,229 | | | | 1,620 | | | | 1,818 | | | | 1,760 | | | | 2,229 | |
FDIC insurance | | | 291 | | | | 574 | | | | 629 | | |
FDIC insurance (credit) | | | | 992 | | | | 291 | | | | 574 | |
Nonoperating expenses | | | 4,721 | | | | 201 | | | | — | | | | 7,612 | | | | 4,721 | | | | 201 | |
Other expenses | | | 3,199 | | | | 2,264 | | | | 3,144 | | | | 3,832 | | | | 3,199 | | | | 2,264 | |
Total noninterest expense | | | 78,175 | | | | 63,987 | | | | 59,292 | | | | 98,085 | | | | 78,175 | | | | 63,987 | |
Income before income taxes | | | 33,918 | | | | 31,088 | | | | 28,174 | | | | 43,363 | | | | 33,918 | | | | 31,088 | |
Income tax expense | | | 8,661 | | | | 7,207 | | | | 13,358 | | | | 11,404 | | | | 8,661 | | | | 7,207 | |
Net income | | $ | 25,257 | | | $ | 23,881 | | | $ | 14,816 | | | $ | 31,959 | | | $ | 25,257 | | | $ | 23,881 | |
Share data: | | | | | | | | | | | | | | | | | | | | | | | | |
Weighted average number of shares outstanding, basic | | | 4,629,255 | | | | 4,061,529 | | | | 4,030,530 | | | | 6,289,481 | | | | 4,629,255 | | | | 4,061,529 | |
Weighted average number of shares outstanding, diluted | | | 4,661,720 | | | | 4,098,633 | | | | 4,065,754 | | | | 6,344,409 | | | | 4,661,720 | | | | 4,098,633 | |
Basic earnings per share | | $ | 5.41 | | | $ | 5.82 | | | $ | 3.64 | | | $ | 5.07 | | | $ | 5.41 | | | $ | 5.82 | |
Diluted earnings per share | | $ | 5.37 | | | $ | 5.77 | | | $ | 3.61 | | | $ | 5.03 | | | $ | 5.37 | | | $ | 5.77 | |
The accompanying notes are an integral part of these consolidated financial statements.
CAMBRIDGE BANCORP AND SUBSIDIARIES
CONSOLIDATED STATEMENTS OF COMPREHENSIVE INCOME (LOSS)
| | For the Year Ended December 31, | |
| | 2019 | | | 2018 | | | 2017 | |
| | (dollars in thousands) | |
Net income | | $ | 25,257 | | | $ | 23,881 | | | $ | 14,816 | |
Other comprehensive income/(loss), net of tax: | | | | | | | | | | | | |
Unrealized gains/(losses) on available for sale securities | | | | | | | | | | | | |
Unrealized holding gains/(losses) arising during period | | | 2,500 | | | | (242 | ) | | | 128 | |
Less: reclassification adjustment for losses/(gains) included in net income | | | 62 | | | | (2 | ) | | | 1 | |
Total unrealized gains/(losses) on securities | | | 2,562 | | | | (244 | ) | | | 129 | |
Derivatives | | | | | | | | | | | | |
Change in interest rate contracts | | | 821 | | | | 751 | | | | — | |
Defined benefit retirement plans | | | | | | | | | | | | |
Change in retirement liabilities | | | 623 | | | | 89 | | | | 3,871 | |
Other comprehensive income/(loss) | | | 4,006 | | | | 596 | | | | 4,000 | |
Comprehensive income | | $ | 29,263 | | | $ | 24,477 | | | $ | 18,816 | |
| | For the Year Ended December 31, | |
| | 2020 | | | 2019 | | | 2018 | |
| | (dollars in thousands) | |
Net income | | $ | 31,959 | | | $ | 25,257 | | | $ | 23,881 | |
Other comprehensive income, net of tax: | | | | | | | | | | | | |
Available for sale securities | | | | | | | | | | | | |
Unrealized holding gains(losses) | | | 2,800 | | | | 2,500 | | | | (242 | ) |
Less: reclassification adjustment for (gains)losses realized in net income | | | (57 | ) | | | 62 | | | | (2 | ) |
Total unrealized gains(losses) on available for sale securities | | | 2,743 | | | | 2,562 | | | | (244 | ) |
Interest rate swaps designated as cash flow hedges | | | | | | | | | | | | |
Unrealized holding gains(losses) | | | 4,758 | | | | 713 | | | | 720 | |
Less: reclassification adjustment for (gains)losses realized in net income | | | (1,354 | ) | | | 108 | | | | 31 | |
Defined benefit retirement plans | | | | | | | | | | | | |
Change in retirement liabilities | | | (1,232 | ) | | | 623 | | | | 89 | |
Other comprehensive income | | | 4,915 | | | | 4,006 | | | | 596 | |
Comprehensive income | | $ | 36,874 | | | $ | 29,263 | | | $ | 24,477 | |
The accompanying notes are an integral part of these consolidated financial statements.
CAMBRIDGE BANCORP AND SUBSIDIARIES
CONSOLIDATED STATEMENTS OF CHANGES IN SHAREHOLDERS’ EQUITY
| | Common Stock | | | Additional Paid-In Capital | | | Retained Earnings | | | Accumulated Other Comprehensive (Loss ) / Income | | | Total Shareholders’ Equity | | | For the Years Ended December 31, | |
| | (dollars in thousands, except per share data) | | | Common Stock | | | | | Additional Paid-In Capital | | | | | Retained Earnings | | | | | Accumulated Other Comprehensive Income / (Loss) | | | | | Total Shareholders’ Equity | |
Balance at December 31, 2016 | | $ | 4,037 | | | $ | 33,253 | | | $ | 107,262 | | | $ | (9,881 | ) | | $ | 134,671 | | |
Net income | | | — | | | | — | | | | 14,816 | | | | — | | | | 14,816 | | |
Other comprehensive income (loss) | | | — | | | | — | | | | — | | | | 4,000 | | | | 4,000 | | |
Share based compensation | | | 45 | | | | 2,410 | | | | (403 | ) | | | — | | | | 2,052 | | |
Dividends declared ($1.86 per share) | | | — | | | | — | | | | (7,582 | ) | | | — | | | | (7,582 | ) | |
Balance at December 31, 2017 | | $ | 4,082 | | | $ | 35,663 | | | $ | 114,093 | | | $ | (5,881 | ) | | $ | 147,957 | | |
| | | | | | | | | | | | | | | | | | | | | | (dollars in thousands, except per share data) | |
Balance at December 31, 2017 | | $ | 4,082 | | | $ | 35,663 | | | $ | 114,093 | | | $ | (5,881 | ) | | $ | 147,957 | | | $ | 4,082 | | | | $ | 35,663 | | | | $ | 114,093 | | | | $ | (5,881 | ) | | | | $ | 147,957 | |
Cumulative effect of accounting changes | | | — | | | | — | | | | 1,202 | | | | (1,202 | ) | | | — | | | | — | | | | — | | | | 1,202 | | | | (1,202 | ) | | | | — | |
Net income | | | — | | | | — | | | | 23,881 | | | | — | | | | 23,881 | | | | — | | | | — | | | | 23,881 | | | | — | | | | 23,881 | |
Other comprehensive income (loss) | | | — | | | | — | | | | — | | | | 596 | | | | 596 | | |
Share based compensation | | | 25 | | | | 2,608 | | | | — | | | | — | | | | 2,633 | | |
Other comprehensive income | | | | — | | | | — | | | | — | | | | 596 | | | | 596 | |
Share based compensation and other share-based activity | | | | 25 | | | | 2,608 | | | | — | | | | — | | | | 2,633 | |
Dividends declared ($1.96 per share) | | | — | | | | — | | | | (8,041 | ) | | | — | | | | (8,041 | ) | | | — | | | | | — | | | | | (8,041 | ) | | | | | — | | | | | (8,041 | ) |
Balance at December 31, 2018 | | $ | 4,107 | | | $ | 38,271 | | | $ | 131,135 | | | $ | (6,487 | ) | | $ | 167,026 | | | $ | 4,107 | | | | $ | 38,271 | | | | $ | 131,135 | | | | $ | (6,487 | ) | | | | $ | 167,026 | |
| | | | | | | | | | | | | | | | | | | | | | | | | | | | | | | | | | | | | | | | | | | | |
Balance at December 31, 2018 | | $ | 4,107 | | | $ | 38,271 | | | $ | 131,135 | | | $ | (6,487 | ) | | $ | 167,026 | | | $ | 4,107 | | | | $ | 38,271 | | | | $ | 131,135 | | | | $ | (6,487 | ) | | | | $ | 167,026 | |
Net income | | | — | | | | — | | | | 25,257 | | | | — | | | | 25,257 | | | | — | | | | — | | | | 25,257 | | | | — | | | | 25,257 | |
Other comprehensive income (loss) | | | — | | | | — | | | | — | | | | 4,006 | | | | 4,006 | | |
Share based compensation | | | 20 | | | | 2,150 | | | | — | | | | — | | | | 2,170 | | |
Other comprehensive income | | | | — | | | | — | | | | — | | | | 4,006 | | | | 4,006 | |
Share based compensation and other share-based activity | | | | 20 | | | | 2,150 | | | | — | | | | — | | | | 2,170 | |
Dividends declared ($2.04 per share) | | | — | | | | — | | | | (9,517 | ) | | | — | | | | (9,517 | ) | | | — | | | | — | | | | (9,517 | ) | | | | — | | | | (9,517 | ) |
Common stock issued for merger | | | 723 | | | | 58,694 | | | | — | | | | — | | | | 59,417 | | |
Common stock issued for Optima merger | | | | 723 | | | | 58,694 | | | | — | | | | — | | | | 59,417 | |
Common stock offering | | | 551 | | | | 37,651 | | | | — | | | | — | | | | 38,202 | | | | 551 | | | | | 37,651 | | | | | — | | | | | — | | | | | 38,202 | |
Balance at December 31, 2019 | | $ | 5,401 | | | $ | 136,766 | | | $ | 146,875 | | | $ | (2,481 | ) | | $ | 286,561 | | | $ | 5,401 | | | | $ | 136,766 | | | | $ | 146,875 | | | | $ | (2,481 | ) | | | | $ | 286,561 | |
| | | | | | | | | | | | | | | | | |
Balance at December 31, 2019 | | | $ | 5,401 | | | | $ | 136,766 | | | | $ | 146,875 | | | | $ | (2,481 | ) | | | | $ | 286,561 | |
Cumulative effect of accounting changes (Note 3) | | | | — | | | | — | | | | (347 | ) | | | | — | | | | (347 | ) |
Net income | | | | — | | | | — | | | | 31,959 | | | | — | | | | 31,959 | |
Other comprehensive income | | | | — | | | | — | | | | — | | | | 4,915 | | | | 4,915 | |
Share based compensation and other share-based activity | | | | 23 | | | | 4,541 | | | | — | | | | — | | | | 4,564 | |
Dividends declared ($2.12 per share) | | | | — | | | | — | | | | (13,083 | ) | | | | — | | | | (13,083 | ) |
Common stock issued for Wellesley merger | | | | 1,503 | | | | | 85,660 | | | | | — | | | | | — | | | | | 87,163 | |
Balance at December 31, 2020 | | | $ | 6,927 | | | | $ | 226,967 | | | | $ | 165,404 | | | | $ | 2,434 | | | | $ | 401,732 | |
The accompanying notes are an integral part of these consolidated financial statements.
CAMBRIDGE BANCORP AND SUBSIDIARIES
CONSOLIDATED STATEMENTS OF CASH FLOWS
| | | | | | | | | | | | |
| | For the Year Ended December 31, | |
| | 2020 | | | 2019 | | | 2018 | |
| | (dollars in thousands) | |
CASH FLOWS FROM OPERATING ACTIVITIES | | | | | | | | | | | | |
Net income | | $ | 31,959 | | | $ | 25,257 | | | $ | 23,881 | |
Adjustments to reconcile net income to net cash provided by operating activities: | | | | | | | | | | | | |
Provision for credit losses | | | 18,310 | | | | 3,004 | | | | 1,502 | |
Amortization(accretion) of deferred charges and fees net | | | (780 | ) | | | 166 | | | | 777 | |
(Accretion), depreciation, and amortization, net | | | (8,134 | ) | | | 828 | | | | 1,888 | |
Bank owned life insurance income | | | (747 | ) | | | (612 | ) | | | (526 | ) |
(Gain)/loss on disposition of investment securities | | | (69 | ) | | | 79 | | | | (2 | ) |
Share based compensation and other share-based activity | | | 4,564 | | | | 2,170 | | | | 2,633 | |
Change in accrued interest receivable | | | 253 | | | | (162 | ) | | | (634 | ) |
Deferred income tax (benefit)/expense | | | (665 | ) | | | 110 | | | | (721 | ) |
Change in other assets, net | | | (22,863 | ) | | | (11,667 | ) | | | (12,231 | ) |
Change in other liabilities, net | | | 20,332 | | | | 11,166 | | | | 7,455 | |
Change in loans held for sale | | | (5,363 | ) | | | (1,546 | ) | | | — | |
Net cash provided by operating activities | | | 36,797 | | | | 28,793 | | | | 24,022 | |
CASH FLOWS FROM INVESTING ACTIVITIES | | | | | | | | | | | | |
Origination of loans | | | (1,070,321 | ) | | | (790,097 | ) | | | (596,259 | ) |
Proceeds from principal payments of loans | | | 1,022,516 | | | | 524,907 | | | | 387,537 | |
Proceeds from loan pool sale | | | — | | | | 74,412 | | | | — | |
Proceeds from calls/maturities of securities available for sale | | | 47,087 | | | | 49,832 | | | | 35,415 | |
Purchase of securities available for sale | | | (140,570 | ) | | | (23,450 | ) | | | — | |
Proceeds from sales of securities available for sale | | | 10,821 | | | | 26,552 | | | | 702 | |
Proceeds from calls/maturities of securities held to maturity | | | 56,007 | | | | 72,655 | | | | 33,064 | |
Purchase of securities held to maturity | | | (33,818 | ) | | | (48,906 | ) | | | (84,261 | ) |
Proceeds from settlement of bank owned life insurance policies | | | — | | | | — | | | | 676 | |
Redemption (purchase) of FHLB of Boston stock | | | 8,505 | | | | 456 | | | | (2,602 | ) |
Purchase of banking premises and equipment | | | (2,218 | ) | | | (1,896 | ) | | | (1,155 | ) |
Net cash acquired in business combinations | | | 43,063 | | | | 2,063 | | | | — | |
Net cash used in investing activities | | | (58,928 | ) | | | (113,472 | ) | | | (226,883 | ) |
CASH FLOWS FROM FINANCING ACTIVITIES | | | | | | | | | | | | |
Change in demand, interest bearing, money market and savings accounts | | | 422,866 | | | | 171,961 | | | | 74,421 | |
Change in certificates of deposit | | | (138,213 | ) | | | (101,928 | ) | | | (38,467 | ) |
Change in borrowings | | | (224,989 | ) | | | 28,823 | | | | 89,830 | |
Proceeds from common stock offering (net of underwriting fees) | | | — | | | | 38,202 | | | | — | |
Redemption of subordinated debt | | | (10,000 | ) | | | — | | | | — | |
Cash dividends paid on common stock | | | (13,083 | ) | | | (9,517 | ) | | | (8,041 | ) |
Net cash provided by financing activities | | | 36,581 | | | | 127,541 | | | | 117,743 | |
Net change in cash and cash equivalents | | | 14,450 | | | | 42,862 | | | | (85,118 | ) |
Cash and cash equivalents at beginning of period | | | 61,335 | | | | 18,473 | | | | 103,591 | |
Cash and cash equivalents at end of period | | $ | 75,785 | | | $ | 61,335 | | | $ | 18,473 | |
SUPPLEMENTAL DISCLOSURES OF CASH FLOW INFORMATION: | | | | | | | | | | | | |
Cash paid during the period for: | | | | | | | | | | | | |
Interest | | $ | 9,172 | | | $ | 17,918 | | | $ | 5,457 | |
Income taxes | | | 14,628 | | | | 7,770 | | | | 8,330 | |
Significant non-cash transactions | | | | | | | | | | | | |
Right-of-use assets for lessee operating leases | | | — | | | | 33,587 | | | | — | |
Right-of-use liabilities for lessee operating leases | | | — | | | | 35,054 | | | | — | |
Transfer of other real estate owned | | | 2,293 | | | | 163 | | | | — | |
Common Stock issued to shareholders due to merger | | | 87,163 | | | | 59,417 | | | | — | |
Fair value of assets acquired, net of cash acquired | | | 961,668 | | | | 548,801 | | | | — | |
Fair value of liabilities assumed | | | 917,569 | | | | 491,447 | | | | — | |
The accompanying notes are an integral part of these consolidated financial statements.
CAMBRIDGE BANCORP AND SUBSIDIARIES
CONSOLIDATED STATEMENTS OF CASH FLOWS
| | For the Year Ended December 31, | |
| | 2019 | | | 2018 | | | 2017 | |
| | (dollars in thousands) | |
CASH FLOWS FROM OPERATING ACTIVITIES | | | | | | | | | | | | |
Net income | | $ | 25,257 | | | $ | 23,881 | | | $ | 14,816 | |
Adjustments to reconcile net income to net cash provided by operating activities: | | | | | | | | | | | | |
Provision for loan losses | | | 3,004 | | | | 1,502 | | | | 362 | |
Amortization of deferred charges and fees, net | | | 166 | | | | 777 | | | | 972 | |
Net (Accretion)/Amortization of merger-related intangibles | | | (1,176 | ) | | | — | | | | — | |
Depreciation and amortization | | | 2,004 | | | | 1,888 | | | | 1,948 | |
Bank owned life insurance income | | | (612 | ) | | | (526 | ) | | | (584 | ) |
Loss/(gain) on disposition of investment securities | | | 79 | | | | (2 | ) | | | 3 | |
Share based compensation | | | 2,170 | | | | 2,633 | | | | 2,052 | |
Change in accrued interest receivable | | | (162 | ) | | | (634 | ) | | | (501 | ) |
Deferred income tax expense/(benefit) | | | 110 | | | | (721 | ) | | | 2,687 | |
Change in other assets, net | | | (11,667 | ) | | | (12,231 | ) | | | (758 | ) |
Change in other liabilities, net | | | 11,166 | | | | 7,455 | | | | 2,264 | |
Change in loans held for sale | | | (1,546 | ) | | | — | | | | 6,506 | |
Net cash provided by operating activities | | | 28,793 | | | | 24,022 | | | | 29,767 | |
CASH FLOWS FROM INVESTING ACTIVITIES | | | | | | | | | | | | |
Origination of loans | | | (790,097 | ) | | | (596,259 | ) | | | (354,657 | ) |
Proceeds from principal payments of loans | | | 524,907 | | | | 387,537 | | | | 323,632 | |
Proceeds from principal loan pool sales | | | 74,412 | | | | — | | | | — | |
Purchase of securities available for sale | | | (23,450 | ) | | | — | | | | (5,091 | ) |
Proceeds from calls/maturities of securities available for sale | | | 49,832 | | | | 35,415 | | | | 47,955 | |
Proceeds from sales of securities available for sale and held to maturity | | | 26,552 | | | | 702 | | | | 77,369 | |
Proceeds from calls/maturities of securities held to maturity | | | 72,655 | | | | 33,064 | | | | 34,488 | |
Purchase of securities held to maturity | | | (48,906 | ) | | | (84,261 | ) | | | (184,505 | ) |
Proceeds from settlement of bank owned life insurance policies | | | — | | | | 676 | | | | — | |
Redemption/(purchase) of FHLB of Boston stock | | | 456 | | | | (2,602 | ) | | | (144 | ) |
Purchase of banking premises and equipment | | | (1,896 | ) | | | (1,155 | ) | | | (807 | ) |
Net cash acquired in business combinations | | | 2,063 | | | | — | | | | — | |
Net cash (used in) provided by investing activities | | | (113,472 | ) | | | (226,883 | ) | | | (61,760 | ) |
CASH FLOWS FROM FINANCING ACTIVITIES | | | | | | | | | | | | |
Change in demand, interest bearing, money market and savings accounts | | | 171,961 | | | | 74,421 | | | | 100,694 | |
Change in certificates of deposit | | | (101,928 | ) | | | (38,467 | ) | | | (11,411 | ) |
Change in borrowings | | | 28,823 | | | | 89,830 | | | | (167 | ) |
Proceeds from common stock offering (net of underwriting fees) | | | 38,202 | | | | — | | | | — | |
Cash dividends paid on common stock | | | (9,517 | ) | | | (8,041 | ) | | | (7,582 | ) |
Net cash provided by (used in) financing activities | | | 127,541 | | | | 117,743 | | | | 81,534 | |
Net (decrease)/increase in cash and cash equivalents | | | 42,862 | | | | (85,118 | ) | | | 49,541 | |
Cash and cash equivalents at beginning of period | | | 18,473 | | | | 103,591 | | | | 54,050 | |
Cash and cash equivalents at end of period | | $ | 61,335 | | | $ | 18,473 | | | $ | 103,591 | |
SUPPLEMENTAL DISCLOSURES OF CASH FLOW INFORMATION: | | | | | | | | | | | | |
Cash paid during the period for: | | | | | | | | | | | | |
Interest | | $ | 17,918 | | | $ | 5,457 | | | $ | 3,579 | |
Income taxes | | | 7,770 | | | | 8,330 | | | | 10,100 | |
Significant non-cash transactions | | | | | | | | | | | | |
Right-of-use assets for lessee operating leases | | | 33,587 | | | | — | | | | — | |
Right-of-use liabilities for lessee operating leases | | | 35,054 | | | | — | | | | — | |
Transfer of other real estate owned | | | 163 | | | | — | | | | — | |
Common Stock issued to Optima shareholders | | | 59,417 | | | | — | | | | — | |
Fair value of assets acquired, net of cash acquired | | | 548,801 | | | | — | | | | — | |
Fair value of liabilities assumed | | | 491,447 | | | | — | | | | — | |
| | | | | | | | | | | | |
The accompanying notes are an integral part of these consolidated financial statements.
CAMBRIDGE BANCORP AND SUBSIDIARIES
NOTES TO CONSOLIDATED FINANCIAL STATEMENTS
December 31, 20192020
The accompanying consolidated financial statements include the accounts of Cambridge Bancorp (the “Company”) and its wholly-ownedwholly owned subsidiary, Cambridge Trust Company (the “Bank”), and the Bank’s subsidiaries, Cambridge Trust Company of New Hampshire, Inc., CTC Security Corporation, and CTC Security Corporation III. References to the Company herein relate to the consolidated group of companies. All significant intercompany accounts and transactions have been eliminated in preparation of the consolidated financial statements.
The Company is a state-chartered, federally registered bank holding company headquartered in Cambridge, Massachusetts, incorporated in 1983. The Company is the sole shareholder of the Bank, a Massachusetts trust company chartered in 1890 which is a commercial bank. We areThe Company is a private bank offering a full range of private banking and wealth management services to our clients. The private banking business, the Company’s only reportable operating segment, is managed as a single strategic unit.
As a private bank, the Company focuses on four4 core services that center around client needs. The core services include Wealth Management, Commercial Banking, Residential Lending, and Personal Banking. The Bank offers a full range of commercial and consumer banking services through its network of 1621 private banking offices in Massachusetts and New Hampshire. The Bank is engaged principally in the business of attracting deposits from the public and investing those deposits. The Bank invests those funds in various types of loans, including residential and commercial real estate, and a variety of commercial and consumer loans. The Bank also invests its deposits and borrowed funds in investment securities and has two wholly-owned2 wholly owned Massachusetts security corporations, CTC Security Corporation and CTC Security Corporation III, for this purpose. Deposits at the Bank are insured by the Federal Deposit Insurance Corporation (“FDIC”) for the maximum amount permitted by FDIC Regulations.
Trust and investment management services are offered through the Bank’s private banking offices in Massachusetts and New Hampshire, and its wealth management offices located in Boston and Wellesley, Massachusetts and Concord, Manchester, and Portsmouth, New Hampshire. The Bank also has a non-depository trust company, Cambridge Trust Company of New Hampshire, Inc., which allows non-New Hampshire residents the opportunity to take advantage of the state’s favorable trust laws. The assets held for wealth management clients are not assets of the Bank and, accordingly, are not reflected in the accompanying consolidated balance sheets.
2. | SUMMARY OF SIGNIFICANT ACCOUNTING POLICIES |
Basis of Presentation
The consolidated financial statements have been prepared in conformity with U.S. generally accepted accounting principles (“GAAP”).
Use of Estimates
The preparation of consolidated financial statements in conformity with GAAP requires management to make estimates and assumptions that affect the reported amounts of assets and liabilities and disclosure of contingent assets and liabilities at the date of the consolidated financial statements. Actual results could differ from those estimates. The allowance for loancredit losses, and the valuation of deferred tax assets, and the valuation of assets acquired and liabilities assumed in business combinations are particularly subject to change.
Reclassifications
Certain amounts in the prior year’s financial statements may have been reclassified to conform with the current year’s presentation.
Cash and Cash Equivalents
Cash and cash equivalents consist of cash on hand, amounts due from banks, and overnight investments.
Investment Securities
Investment securities are classified as either ‘held to maturity’ or ‘available for sale’ in accordance with the Financial Accounting Standards Board’sBoard (“FASB”) Accounting Standards Codification (“ASC”) 320, “Investments – Debt and Equity Securities.” Debt securities that management has the positive intent and ability to hold to maturity are classified as held to maturity. Held to maturity securities are carriedand recorded at cost and adjusted for the amortization of premiums and the accretion of discounts using the effective-yield or straight line method. U.S. Government Sponsored Enterprises (“GSE”) and U.S. Government Agency obligations represent debt securities issued by the Federal Farm Credit Bank, the Federal Home Loan Banks (“FHLB”), the Government National Mortgageamortized cost.
Association (“GNMA”), the Federal National Mortgage Association (“FNMA”), or the Federal Home Loan Mortgage Corporation (“FHLMC”). Mortgage-backed securities represent Pass-Through Certificates and Collateralized Mortgage Obligations either issued by, or collateralized by securities issued by GNMA, FNMA, or FHLMC. Mortgage-backed securities are adjusted for amortization of premiums and accretion of discounts, using the effective-yield method over the estimated average lives of the investments.
Debt and equity securities not classified as held to maturity are classified as available for sale and carried at fair value with unrealized after-tax gains and losses reported net as a separate component of shareholders’shareholders�� equity. The Company classifies its securities based on its intention at the time of purchase.
DeclinesPurchase premiums and discounts are recognized in interest income using the effective yield or straight-line method over the term of the securities, except for callable debt securities for which the purchase premiums are recognized through the earliest call date. Gains and losses on the sale of debt securities are recorded on the trade date and determined using the specific identification method.
Allowance for Credit Losses- Held to Maturity Securities
The Company measures expected credit losses on held to maturity debt securities on a collective basis by security type and risk rating where available. The reserve for each pool is calculated based on a Probability of Default/Loss Given Default (“PD/LGD”) basis taking into consideration the expected life of each security. Held to maturity securities which are issued by the United States of America (“U.S.”) or are guaranteed by U.S. federal agencies do not currently have an allowance for credit loss as the Company determined these securities are either backed by the full faith and credit of the U.S. government and/or there is an unconditional commitment to make interest payments and to return the principal investment in full to investors when a debt security reaches maturity. The Company will evaluate this position no less than annually, however, certain items which may cause the Company to change this methodology include legislative changes that remove a government-sponsored enterprise’s (“GSE”) ability to draw funds from the U.S. government, or legislative changes to housing policy that reduce or eliminate the U.S. government’s implicit guarantee on such securities. For securities which are not U.S. treasury or agency backed, risk ratings are generally sourced from Moody’s or Standard & Poor’s (“S&P”). The Company updates loss given default, probability of default, and recovery rates for each security as that information becomes available but no less than annually. The expected remaining life to maturity of each applicable security is updated quarterly. Any expected credit losses on held to maturity securities would be presented as an allowance rather than as a direct write-down through the consolidated statement of income if the Company does not intend to sell or believes that it is more-likely-than-not that the Company will be required to sell the security.
Allowance for Credit Losses-Available for Sale Securities
The Company measures expected credit losses on available for sale securities based upon the gain or loss position of the security. For available-for sale debt securities in an unrealized loss position, which the Company does not intend to sell, or it is not more likely than not that the Company will be required to sell the security before recovery of the Company’s amortized cost, the Company evaluates qualitative criteria to determine any expected loss. This includes among other items the financial health of, and specific prospects for the issuer, including whether the issuer is in compliance with the terms and covenants of the security. The Company also evaluates quantitative criteria including determining whether there has been an adverse change in expected future cash flows of the security. If the Company does not expect to recover the entire amortized cost basis of the security, an allowance for credit losses would be recorded, with a related charge to earnings, limited by the amount of the fair value of the security less its amortized cost. If the Company intends to sell the security or it is more likely than not that the Company will be required to sell the debt security before recovery of its amortized cost basis, the Company recognizes the entire difference between the security’s amortized cost basis and its fair value in earnings.
Prior to the adoption of Topic 326 on January 1, 2020, declines in the fair value of investment securities below their amortized cost that arewere deemed to be other-than-temporary arewere reflected in earnings as realized losses to the extent the impairment iswas related to credit losses. The amount of the impairment related to other factors iswas recognized in other comprehensive income. In estimating other-than-temporary impairment losses, management considers:considered: (1) the length of time and the extent to which the fair value has been less than cost; (2) the financial condition and near-term prospects of the issuer; and (3) the Company’s intent to sell the security or whether it is more likely than not that the Company will be required to sell the debt security before its anticipated recovery.
Loans and the Allowance for Loan Losses
Loans are reported at the amount of their outstanding principal, including deferred loan origination fees and costs, reduced by unearned discounts, and the allowance for loancredit losses. Loan origination fees, net of related direct incremental loan origination costs, are deferred and amortized as an adjustment to yield over the life of the related loans. Unearned discount is recognized as an adjustment to the loan yield, using the interest method over the contractual life of the related loan. When a loan is paid off, the unamortized portion of net fees or unearned discount is recognized as interest income.
Loans are considered delinquent when a payment of principal and/or interest becomes past due 30 days following its scheduled payment due date.
Loans on which the accrual of interest has been discontinued are designated as non-accrual loans. Accrual of interest income is discontinued when concern exists as to the collectability of principal or interest or typically when a loan becomes over 90 days delinquent. Additionally, when a loan is placed on non-accrual status, all interest previously accrued but not collected is reversed against current period income. Loans are removed from non-accrual when they become less than 90 days past due and when concern no longer exists as to the collectability of principal or interest. Interest collected
Allowance for Credit Losses - Loans
Losses on non-accruing loans is either applied against principal or reported as income according to management’s judgment as to the collectability of principal.
A loan is considered impaired when, based on current informationreceivables are estimated and events, it is probable that the Company will be unable to collect the scheduled payments of principal or interest when due according to the contractual termsrecognized upon origination of the loan, agreement. Under certain circumstances,based on expected credit losses for the life of the loan balance as of the period end date. The Company uses a discounted cash flow method incorporating probability of default and loss given default forecasted based on statistically derived economic variable loss drivers combined with qualitative factors, to estimate expected credit losses. This process includes estimates which involve modeling loss projections attributable to existing loan
balances, considering historical experience, current conditions, and future expectations for homogeneous pools of loans over the reasonable and supportable forecast period. The reasonable and supportable forecast period is determined based upon the accuracy level of historical loss forecast estimates, the specific loan level models and methodology utilized, and considers material changes in growth and credit strategy, and business changes. For periods beyond a reasonable and supportable forecast interval, the Company reverts to historical information over a period for which comparable data is available. The historical information either experienced by the Company, or by a selection of peer banks when appropriate, is derived from a combination of recessionary and non-recessionary performance periods for which data is available. Similar to the reasonable and supportable forecast period, the Company reassesses the reversion period at the segment level, considering any required adjustments for differences in underwriting standards, portfolio mix, and other relevant data shifts over time.
The Company generally segments its loan receivable population into homogeneous pools of loans. Consistent with the Company’s other assumptions, the Company regularly reviews segmentation to determine whether the segmentation pools remain relevant as risk characteristics change. When a loan no longer meets the criteria of its initial pooling as a result of credit deterioration or other changes, the Company may restructureevaluate the termscredit for estimated losses on an individual basis if it determines that they no longer retain the same risk characteristics. To the extent that there are a multitude of these loans with new similar credit characteristics, the Company would anticipate a loan as a concessionchange to a borrower. These restructuredthe pooling methodology. Loans that do not share risk characteristics are evaluated on an individual basis and are not included in the collective evaluation. For loans with real estate collateral, when management determines that foreclosure is probable, expected credit losses are generally also considered impaired loans. Impairment is measuredbased on a loan-by-loan basis by either the present value of expected future cash flows discounted at the loan’s effective interest rate, the loan’s obtainable market price, or the fair value of the collateral ifat the reporting date, adjusted for selling costs as appropriate.
The Company evaluates the loan allowance for credit losses quarterly. The Company regularly reviews its collection experience (including delinquencies and net charge-offs) in determining our allowance for credit losses. The Company also considers its historical loss experience to date based on actual defaulted loans and overall portfolio indicators including delinquent and non-accrual loans, trends in loan volume and lending terms, credit policies and other observable environmental factors such as unemployment and interest rate changes.
The underlying assumption estimates and assessments the Company uses to estimate the allowance for credit losses reflects the Company’s best estimate of model assumptions and forecasted conditions at that time. Changes in such estimates can significantly affect the allowance and provision for credit losses. It is possible and likely that the Company will experience credit losses that are different from the current estimates.
The provision for credit losses charged to income is based on management’s judgment of the amount necessary to maintain the allowance at a level to provide for probable inherent credit losses as of the evaluation date. When management believes that the collectability of a loan’s principal balance, or portions thereof, is unlikely, the principal amount is charged against the allowance for credit losses. Recoveries on loans that have been previously charged off are credited to the allowance for loan losses, generally at the time cash is received on a charged-off account. The allowance is an estimate, and ultimate losses may vary from current estimates. As adjustments become necessary, they are reported in the results of operations through the provision for credit losses in the period in which they become known.
Risk characteristics relevant to each portfolio segment are as follows:
Residential mortgage and home equity loans – The Company generally does not originate loans in these segments with a loan-to-value ratio greater than 80%, unless covered by private mortgage insurance, and in all cases not greater than a loan-to-value ratio of 97%. The Company does not originate subprime loans. Loans in these segments are secured by one-to-four family residential real estate, and repayment is primarily dependent on the credit quality of the individual borrower.
Commercial mortgage loans – This includes multi-family properties and construction. The Company generally does not originate loans in this segment with a loan-to-value ratio greater than 75%. Loans in this segment are secured by owner-occupied and nonowner-occupied commercial real estate, and repayment is primarily dependent on the cash flows of the property (if nonowner-occupied) or of the business (if owner-occupied).
Commercial & industrial loans – Loans in this segment are made to businesses and are generally secured by equipment, accounts receivable, or inventory, as well as the personal guarantees of the principal owners of the business, and repayment is primarily dependent on the cash flows generated by the business. In addition, this segment includes loans issued under the United States Small Business Administration’s (“SBA”) Paycheck Protection Program (“PPP”). These loans are guaranteed and are not evaluated for an allowance for credit losses because the Company expects the guarantees will be effective, if necessary.
Consumer loans – Loans in this segment are made to individuals and can be secured or unsecured. Repayment is primarily dependent on the credit quality of the individual borrower.
The majority of the Company’s loans are concentrated in Eastern Massachusetts and Southern New Hampshire and therefore the overall health of the local economy, including unemployment rates, vacancy rates, and consumer spending levels, can have a material effect on the credit quality of all of these portfolio segments.
The process to determine the allowance for credit losses requires management to exercise considerable judgment regarding the risk characteristics of the loan portfolio segments and the effect of relevant internal and external factors.
Allowance for Credit Losses- Unfunded Commitments
The expected credit losses for unfunded commitments are measured over the contractual period of the Company’s exposure to credit risk. The estimate of credit loss incorporates assumptions for both the likelihood and amount of funding over the estimated life of the commitments, for the risk of loss, and current conditions and expectations. Management periodically reviews and updates its assumptions for estimated funding rates based on historical rates, and factors such as portfolio growth, changes to organizational structure, economic conditions, borrowing habits, or any other factor which could impact the likelihood that funding will occur. The Company does not reserve for unfunded commitments which are unconditionally cancellable.
Acquired Loans
Acquired loans are recorded at fair value at the date of acquisition based on a discounted cash flow methodology that considers various factors, including the type of loan and related collateral, dependent. Largeclassification status, fixed or variable interest rate, term of loan and whether or not the loan was amortizing, and a discount rate reflecting the Company’s assessment of risk inherent in the cash flow estimates. Purchased loans are grouped together according to similar risk characteristics and are treated in the aggregate when applying various valuation techniques. These cash flow evaluations are inherently subjective as they may be susceptible to significant change.
Effective January 1, 2020, loans acquired in a business combination that have experienced more-than-insignificant deterioration in credit quality since origination are considered purchased credit deteriorated (“PCD”) loans. The Company evaluates acquired loans for deterioration in credit quality based on, but not limited to, the following: (1) non-accrual status; (2) troubled debt restructured designation; (3) risk ratings of special mention, substandard or doubtful; (4) watchlist credits; and (5) delinquency status, including loans that are current on acquisition date, but had been previously delinquent. At the acquisition date, an estimate of expected credit losses is made for groups of smallerPCD loans with similar risk characteristics and individual PCD loans without similar risk characteristics. This initial allowance for credit losses is allocated to individual PCD loans and added to the purchase price or acquisition date fair values to establish the initial amortized cost basis of the PCD loans. As the initial allowance for credit losses is added to the purchase price, there is no credit loss expense recognized upon acquisition of a PCD loan. Any difference between the unpaid principal balance homogeneousof PCD loans and the amortized cost basis is considered to relate to noncredit factors and results in a discount or premium. Discounts and premiums are collectively evaluatedrecognized through interest income on a level-yield method over the life of the loans.
For acquired loans not deemed PCD at acquisition, the differences between the initial fair value and the unpaid principal balance are recognized as interest income on a level-yield basis over the lives of the related loans. At the acquisition date, an initial allowance for impairment.expected credit losses is estimated and recorded as provision for credit losses. The subsequent measurement of expected credit losses for all acquired loans is the same as the subsequent measurement of expected credit losses for originated loans.
The
Allowance for Loan Losses
Prior to the adoption of CECL on January 1, 2020, the Company calculated provision for loan losses and the level of the allowance for loan losses reflectsto reflect management’s estimate of probable loan losses inherent in the loan portfolio at the balance sheet date. Management usesused a systematic process and methodology to establish the allowance for loan losses each quarter. To determine the total allowance for loan losses, an estimate iswas made by management of the allowance needed for each of the following segments of the loan portfolio: (a) residential mortgage loans, (b) commercial mortgage loans, (c) home equity loans, (d) commercial & industrial loans, and (e) consumer loans. Portfolio segments arewere further disaggregated into classes of loans. The establishment of the allowance for each portfolio segment iswas based on a process that evaluatesevaluated the risk characteristics relevant to each portfolio segment and takestook into consideration multiple internal and external factors. Internal factors include,included, but arewere not limited to, (a) historic levels and trends in charge-offs, delinquencies, risk ratings, and foreclosures, (b) level and changes in industry, geographic, and credit concentrations, (c) underwriting policies and adherence to such policies, (d) the growth and vintage of the portfolios, and (e) the experience of, and any changes in, lending and credit personnel. External factors include,included, but arewere not limited to, (a) conditions and trends in the local and national economy and (b) levels and trends in national delinquent and non-performing loans.
The Bank evaluatesevaluated certain loans individually for specific impairment. A loan iswas considered impaired when, based on current information and events, it iswas probable that the Bank willwould be unable to collect the scheduled payments of principal or interest when due according to the contractual terms of the loan agreement. Loans that experienceexperienced insignificant payment delays and payment shortfalls generally arewere not classified as impaired. Loans arewere selected for evaluation based upon internal risk rating, delinquency status, or non-accrual status. A specific allowance amount iswas allocated to an individual loan when such loan hashad been deemed impaired and when the amount of the probable loss iswas able to be estimated. Estimates of loss may bewere determined by the present value of anticipated future cash flows, the loan’s observable fair market value, or the fair value of the collateral, if the loan iswas collateral dependent.
Risk characteristics relevant to each portfolio segment are as follows:
Residential mortgage and home equity loans – The Bank generally does not originate loans in these segments with a loan-to-value ratio greater than 80%, unless covered by private mortgage insurance, and in all cases not greater than a loan-to-value ratio of 97%. The Bank does not originate subprime loans. Loans in these segments are secured by one-to-four family residential real estate, and repayment is primarily dependent on the credit quality of the individual borrower.
Commercial mortgage loans – This includes multi-family properties and construction. The Bank generally does not originate loans in this segment with a loan-to-value ratio greater than 75%. Loans in this segment are secured by owner-occupied and nonowner-occupied commercial real estate, and repayment is primarily dependent on the cash flows of the property (if nonowner-occupied) or of the business (if owner-occupied).
Commercial loans – Loans in this segment are made to businesses and are generally secured by equipment, accounts receivable, or inventory, as well as the personal guarantees of the principal owners of the business, and repayment is primarily dependent on the cash flows generated by the business.
Consumer loans – Loans in this segment are made to individuals and can be secured or unsecured. Repayment is primarily dependent on the credit quality of the individual borrower.
The majority of the Bank’s loans are concentrated in Eastern Massachusetts and New Hampshire and therefore the overall health of the local economy, including unemployment rates, vacancy rates, and consumer spending levels, can have a material effect on the credit quality of all of these portfolio segments.
The process to determine the allowanceHeld for loan losses requires management to exercise considerable judgment regarding the risk characteristics of the loan portfolio segments and the effect of relevant internal and external factors.
The provision for loan losses charged to income is based on management’s judgment of the amount necessary to maintain the allowance at a level to provide for probable inherent loan losses as of the evaluation date. When management believes that the collectability of a loan’s principal balance, or portions thereof, is unlikely, the principal amount is charged against the allowance for loan losses. Recoveries on loans that have been previously charged off are credited to the allowance for loan losses as received. The allowance is an estimate, and ultimate losses may vary from current estimates. As adjustments become necessary, they are reported in the results of operations through the provision for loan losses in the period in which they become known.Sale
Residential mortgage loans originated and intended for sale in the secondary market are classified as held for sale at the time of their origination and are carried at the lower of cost or fair value on an individual loan basis. Changes in fair value relating to loans held for sale below the loans cost basis are charged against gain on loans held for sale.sold. Gains and losses on the actual sale of the residential loans are recorded in earnings as net gains (losses) on loans held for salesold on the consolidated statements of income.
Bank Owned Life Insurance
Bank owned life insurance (“BOLI”) represents life insurance on the lives of certain active and former employees who have provided positive consent allowing the Bank to be the beneficiary of such policies. Since the BankCompany is the primary beneficiary of the insurance policies, increases in the cash value of the policies, as well as insurance proceeds received in excess of cash surrender value, are recorded in other noninterest income, and are not subject to income taxes. Applicable regulations generally limit ourthe Company’s investment in bank-owned life insurance to 25% of our Tier 1 capital plus ourits allowance for loancredit losses. The BankCompany reviews the financial strength of the insurance carriers prior to the purchase of BOLI and at least annually thereafter.
Banking Premises and Equipment
Land is stated at cost. Buildings, leasehold improvements, and equipment are stated at cost, less accumulated depreciation, and amortization, which is computed using the straight-line method over the estimated useful lives of the assets or the terms of the leases, if shorter. The cost of ordinary maintenance and repairs is charged to expense when incurred.
Leases
The Company leases office space, certain branch locations under noncancelable operating leases, and an ATM location,2 automated teller machine (“ATM”) locations, several of which have renewal options to extend lease terms. Upon commencement of a new lease, the Company will recognize a right of use ("ROU"(“ROU”) asset and corresponding lease liability. The Company makes the decision on whether to renew an option to extend a lease byconsidering various factors. The Company will recognize an adjustment to its ROU asset and lease liability when lease agreements are amended and executed. The discount rate used in determining the present value of lease payments is based on the Company’s
incremental borrowing rate for borrowings with terms similar to each lease at commencement date. The Company has lease agreements with lease and non-lease components, which are generally accounted for separately. For real estate leases, non-lease components and other non-components, such as common area maintenance charges, real estate taxes, and insurance are not included in the measurement of the lease liability since they are generally able to be segregated.
Marketing Expense
Advertising costs are expensed as incurred.
Other Real Estate Owned
Other real estate owned (“OREO”) consists of properties formerly pledged as collateral to loans, which have been acquired by the BankCompany through foreclosure proceedings or acceptance of a deed in lieu of foreclosure. Upon transfer of a loan to foreclosure status, an appraisal is obtained and any excess of the loan balance over the fair value, less estimated costs to sell, is charged against the allowance for loancredit losses. Expenses and subsequent adjustments to the fair value are treated as noninterest expense through other operating expense.expenses.
Goodwill, Core Deposit Intangibles, and Other Intangible Assets
Goodwill represents the excess of the purchase price over the fair value of net assets acquired in a business combination. Core deposit intangible (“CDI”) represents a premium paid to acquire the core deposits of an institution and is recorded as an intangible asset. Goodwill and intangible assets that are not amortized are tested for impairment, based on their fair values, at least annually. There was 0 goodwill impairment recognized during 2020, 2019, or 2018. Identifiable intangible assets that are subject to amortization are also
reviewed for impairment based on their fair value. Any impairment is recognized as a charge to earnings and the adjusted carrying amount of the intangible asset becomes its new accounting basis. The remaining useful life of an intangible asset that is being amortized is also evaluated each reporting period to determine whether events and circumstances warrant a revision to the remaining period of amortization. The Company is amortizing the CDI on a straight-line basis over a ten-year period.
Mortgage servicing assetsrights (“MSR”) are recognized as separate assets when rights are acquired through purchase or through sale of financial assets with servicing rights retained. The fair value of the servicing rights is determined by estimating the present value of future net cash flows, taking into consideration market loan prepayment speeds, discount rates, servicing costs, and other economic factors. For purposes of measuring impairment, the underlying loans are stratified into relatively homogeneous pools based on predominant risk characteristics which include product type (i.e., fixed or adjustable) and interest rate bands. If the aggregate carrying value of the capitalized mortgage servicing rights for a stratum exceeds its fair value, MSR impairment is recognized in earnings through a valuation allowance for the difference. As the loans are repaid and net servicing revenue is earned, the MSR asset is amortized as an offset to loan servicing income. Servicing revenues are expected to exceed this amortization expense. However, if actual prepayment experience or defaults exceed what was originally anticipated, net servicing revenues may be less than expected and mortgage servicing rights may be impaired.
Income Taxes
The Company and its subsidiaries file income tax returns in the U.S. federal jurisdiction, the Commonwealth of Massachusetts, the state of New Hampshire, the state of Maine, and other states as required. For the tax year 2019,ended December 31, 2020, the Company expects to will file taxes in Massachusetts, New Hampshire, and Maine.
Income taxes are accounted for under the asset and liability method. Deferred tax assets and liabilities are reflected at currently enacted income tax rates applicable to the period in which the deferred tax assets or liabilities are expected to be realized or settled. As changes in tax laws or rates are enacted, deferred tax assets and liabilities are adjusted through income tax expenses in the provision for income taxes.period of enactment. Deferred tax assets are reviewed quarterly and reduced by a valuation allowance if, based upon the information available, it is more likely than not that some or all of the deferred tax assets will not be realized.
Interest and penalties related to unrecognized tax benefits, if incurred, are recognized as a component of income tax expense.
The Tax Cuts and Jobs Act of 2017 was enacted on December 22, 2017. Effective in 2018, the change in tax law reduced the Company’s statutory federal tax rate from 35% to 21%. The Company recorded a one-time non-cash write-down of net deferred tax assets of $3.9 million as these deferred tax assets were required to be re-measured using the new lower tax rate in 2017.
Wealth ManagementFee Revenue
WealthThe Company earns wealth management revenues include asset-based revenues (trustfees for providing investment management, trust administration, and investment advisory fees) thatfinancial planning services to clients. The Company’s performance obligation under these contracts is satisfied over time as the wealth management services are primarily accruedprovided. Fees are recognized monthly based on the monthly value of the assets under management and the applicable fee rate, or at a fixed annual rate, depending on the terms of the contract. No performance-based incentives are earned on wealth management contracts.
The Company also earns trust fees for servicing as earnedtrustee for certain clients. As trustee, the Company serves as a fiduciary, administers the client’s trust, and in some cases, manages the assets of the trust. The Company’s performance obligation under these agreements is satisfied over time as the administrative and management services are provided. Fees are recognized monthly based uponon a percentage of asset valuesthe market value of the account or at a fixed annual rate as outlined in the agreement. The Company also earns fees for trust related activities. The Company’s performance obligation under management, or administration. Also includedthese agreements is satisfied at a point in wealth management revenues are transaction-based revenues (financial planning feestime and other service fees), which are recognized as revenue to the extent thatwhen these services have been completed.performed.
Other Banking Fee revenue fromIncome
The Company charges a variety of fees to its clients for services provided on the deposit and deposit management related accounts. Each fee is either transaction-based or assessed monthly. The types of fees include service charges is generallyon accounts, overdraft fees, wire transfer fees, maintenance fees, ATM fee charges, and other miscellaneous charges related to the accounts. These fees are not governed by individual contracts with clients. They are charged to clients based on disclosures presented to these clients upon opening these accounts, along with updated disclosures when changes are made to the fee structures. The transaction-based fees are recognized in revenue when earned.charged to the client based on specific activity on the client’s account. Monthly service and maintenance charges are recognized in the month they are earned and are charged directly to the client’s account.
Pension and Retirement Plans
The Company sponsoredsponsors a defined benefit pension plan (the “Pension Plan”) and a postretirement health care plan covering substantially all employees hired before May 2, 2011. On October 23,Effective December 31, 2017, the Company announced its decision to freeze the accrual of benefits for all participants in the Pension Plan effective as of December 31, 2017. Benefits for the Pension Plan were based primarily on years of service and the employee’s average monthly pay during the five highest consecutive plan years of the employee’s final 10 years.was frozen. Benefits for the postretirement health care plan are based on years of service. Expense for both of these plansthe postretirement health care plan is recognized over the employee’s service life utilizing the projected unit credit actuarial cost method. Effective November 7, 2019, the postretirement health care plan was frozen for employees hired after that date.
The Company also sponsors non-qualified retirement programs that provide supplemental retirement benefits to certain current and former executives. Prior to 2016, the Company provided individual non-qualified defined benefit supplemental executive retirement plans (“DB SERPs”) to certain executives. The DB SERPs generally provide for an annual benefit payable in equal monthly installments following the executive’s retirement and continuing for at least the remainder of his or her lifetime, with such annual benefit generally based on the executive’s years of service and his or her highest three consecutive years of base salary and bonus. In 2016, the Company’s Board of Directors discontinued the use of DB SERPs for new entrants to the Company’s non-qualified retirement programs. Instead, new entrants are provided with individual non-qualified defined contribution supplemental executive retirement plans (“DC SERPs”). Under the DC SERPs, the Company may contribute an amount equal to 10% of the executive’s base salary and bonus to his or her account under the Company’s non-qualified deferred compensation plan, the Executive Deferred Compensation Plan. Expense for the DB SERPs is recognized over the executive’s service life utilizing the projected unit credit actuarial cost method. Expense for the DC SERPs is recognized as incurred.
The Company maintains a Profit SharingProfit-Sharing Plan (“PSP”) that provides for deferral of federal and state income taxes on employee contributions allowed under Section 401(k) of federal law. Beginning in 2018, the Company matched employee contributions up to 100% of the first 4% of each participant’s salary, eligible bonus, and eligible incentive, up from 3% in 2017.. Each year, the Company may also make a discretionary contribution to the PSP of up to 4%based on eligible salary, eligible bonus, and eligible incentive. Employees are eligible to participate in the PSP on the first day of their initial date of service. InEffective January 1, 2019, employees were eligible to participate in the discretionary contribution portion of the PSP on the first date of their initial date of service. During 2018, employees were eligible to participate in the discretionary contribution portion of the PSP after completing 12 months of employment, and 1,000 hours of service. The employee must be employed on the last day of the calendar year or retire at the normal retirement age of 65 during the calendar year to receive the discretionary contribution. Effective in 2019, employees are eligible to participate in the discretionary contribution portion of the PSP on the first day of their initial date of service.
Share-Based CompensationOther Banking Fee Income
Share-based compensation plans provideThe Company charges a variety of fees to its clients for stock option awards, restricted stock awards, nonvested timeservices provided on the deposit and deposit management related accounts. Each fee is either transaction-based or assessed monthly. The types of fees include service charges on accounts, overdraft fees, wire transfer fees, maintenance fees, ATM fee charges, and other miscellaneous charges related to the accounts. These fees are not governed by individual contracts with clients. They are charged to clients based share units,on disclosures presented to these clients upon opening these accounts, along with updated disclosures when changes are made to the fee structures. The transaction-based fees are recognized in revenue when charged to the client based on specific activity on the client’s account. Monthly service and nonvested performancemaintenance charges are recognized in the month they are earned and are charged directly to the client’s account.
Pension and Retirement Plans
The Company sponsors a defined benefit pension plan (the “Pension Plan”) and a postretirement health care plan covering substantially all employees hired before May 2, 2011. Effective December 31, 2017, the accrual of benefits for all participants in the Pension Plan was frozen. Benefits for the postretirement health care plan are based share units.
Compensation expenseon years of service. Expense for nonvested restricted stock awardsthe postretirement health care plan is recognized over the employee’s service periodlife utilizing the projected unit credit actuarial cost method. Effective November 7, 2019, the postretirement health care plan was frozen for employees hired after that date.
The Company also sponsors non-qualified retirement programs that provide supplemental retirement benefits to certain current and former executives. Prior to 2016, the Company provided individual non-qualified defined benefit supplemental executive retirement plans (“DB SERPs”) to certain executives. The DB SERPs generally provide for an annual benefit payable in equal monthly installments following the executive’s retirement and continuing for at least the remainder of his or her lifetime, with such annual benefit generally based on the fair value at the dateexecutive’s years of grant. Awardsservice and his or her highest three consecutive years of nonvested time based share unitsbase salary and nonvested performance share units are valued at the fair market value ofbonus. In 2016, the Company’s common stock asBoard of the award date. Nonvested performance share unit compensation expense is based on the most recent performance assumption available and is adjusted as assumptions change. If the goals are not met, vesting does not occur and no compensation cost will be recognized and any recognized compensation costs will be reversed. Stock-based awards that do not require future service are expensed in the year of grant.
Derivative Instruments and Hedging Activities
Derivatives are recognized as either assets or liabilities on the balance sheet and are measured at fair value. The accounting for changes in the fair value of such derivatives depends on the intended use of the derivative and resulting designation. For derivatives not designated as hedges, changes in fair value of the derivative instruments are recognized in earnings in noninterest income.
For derivatives designated as fair value hedges, changes in the fair value of such derivatives are recognized in earnings together with the changes in the fair value of the related hedged item. The net amount, if any, represents hedge ineffectiveness and is reflected in earnings.
For derivatives designated as cash flow hedges, the effective portion of changes in the fair value of the derivative is recorded in other comprehensive income (loss) and recognized in earnings when the hedged transaction affects earnings. The ineffective portion of changes in the fair value of cash flow hedges is recognized directly in earnings.
Fair Value Measurements
Fair value is defined as the price that would be received to sell an asset or paid to transfer a liability in an orderly transaction between market participants at the measurement date. The Company measures the fair values of its financial instruments in accordance with accounting guidance that requires an entity to base fair value on exit price and maximizeDirectors discontinued the use of observable inputs and minimizeDB SERPs for new entrants to the use of unobservable inputsCompany’s non-qualified retirement programs. Instead, new entrants are provided with individual non-qualified defined contribution supplemental executive retirement plans (“DC SERPs”). Under the DC SERPs, the Company may contribute an amount equal to determine the exit price.
ASC 820, “Fair Value Measurements and Disclosures” establishes a fair value hierarchy that gives the highest priority to quoted prices in active markets and the lowest priority to unobservable data and requires fair value measurements to be disclosed by level within the hierarchy. The three broad levels defined by the fair value hierarchy are as follows:
Level 1 – Quoted prices are available in active markets for identical assets or liabilities as10% of the reported date. executive’s base salary and bonus to his or her account under the Company’s non-qualified deferred compensation plan, the Executive Deferred Compensation Plan. Expense for the DB SERPs is recognized over the executive’s service life utilizing the projected unit credit actuarial cost method. Expense for the DC SERPs is recognized as incurred.
The typeCompany maintains a Profit-Sharing Plan (“PSP”) that provides for deferral of financial instruments includedfederal and state income taxes on employee contributions allowed under Section 401(k) of federal law. Beginning in Level 1 are highly liquid cash instruments with quoted prices such as government or agency securities, listed equities and money market securities, as well as listed derivative instruments.
Level 2 – Pricing inputs are other than quoted prices in active markets, which are either directly or indirectly observable as2018, the Company matched employee contributions up to 100% of the reported date. The naturefirst 4% of these financial instruments includes cash instruments for which quoted prices are available but traded less frequently, derivative instruments whose fair value has been derived usingeach participant’s salary, eligible bonus, and eligible incentive. Each year, the Company may also make a model where inputsdiscretionary contribution to the modelPSP based on eligible salary, bonus, and incentive. Employees are directly observableeligible to participate in the market, or can be derived principally from or corroborated by observable market data, and instruments that are fair valued using other financial instruments, the parameters of which can be directly observed. Instruments which are generally included in this category are corporate bonds and loans, mortgage whole loans, municipal bonds and over-the-counter derivatives.
Level 3 – Instruments that have little to no pricing observability as of the reported date. These financial instruments do not have two-way markets and are measured using management’s best estimate of fair value, where the inputs into the determination of fair value require significant management judgment to estimation. Instruments that are included in this category generally include certain commercial mortgage loans, certain private equity investments, distressed debt, non-investment grade residual interests in securitizations, as well as certain highly structured over-the-counter derivative contracts.
Earnings per Common Share
Earnings per common share is computed using the two-class method prescribed under ASC Topic 260, “Earnings Per Share.” ASC Topic 260 provides that unvested share-based payment awards that contain nonforfeitable rights to dividends or dividend equivalents (whether paid or unpaid) are participating securities and shall be included in the computation of earnings per share pursuant to the two-class method. We have determined that our outstanding non-vested stock awards are participating securities.
Under the two-class method, basic earnings per common share is computed by dividing net earnings allocated to common stock by the weighted-average number of common shares outstanding during the applicable period, excluding outstanding participating securities. Diluted earnings per common share is computed using the weighted-average number of shares determined for the basic earnings per common share computation plus the dilutive effect of common stock equivalents. A reconciliation of the weighted-average shares used in calculating basic earnings per common share and the weighted average common shares used in calculating diluted earnings per common share for the reported periods is provided in Note 22 - Earnings Per Share.
Subsequent Events
Management has reviewed events occurring through March 16, 2020, the date the consolidated financial statements were issued and determined that no subsequent events occurred requiring adjustment to or disclosure in these financial statements.
3.
| Recently Issued and Adopted Accounting Standards
|
Accounting Standards Update 2018-16 - Inclusion of the Secured Overnight Financing Rate (“SOFR”) Overnight Index Swap (“OIS”) Rate as a Benchmark Interest Rate for Hedge Accounting Purposes (“ASU 2018-16”). On October 25, 2018, the FASB issued ASU 2018-16 to introduce OIS Rate basedPSP on the SOFR as an acceptable US benchmark interest for the purposefirst day of applying hedge accounting under Topic 815. This update is effective for interim and annual reporting periods beginning after December 15, 2018 because the Company has already adopted ASU 2017-12 - Derivatives and Hedging: Targeted Improvements to Accounting for Hedging Activities. The Company adopted this update ontheir initial date of service. Effective January 1, 2019, andemployees were eligible to participate in the update did not have a material impactdiscretionary contribution portion of the PSP on the consolidated financial statements.
Accounting Standards Update 2018-15 - Customer’s Accounting for Implementation Costs Incurred in a Cloud Computing Arrangement That Is a Service Contract (“ASU 2018-15”). On August 29, 2018, the FASB issued amended guidance to align the requirements for capitalizing implementation costs incurred in a hosting arrangement that is a service contract with the requirements for capitalizing implementation costs incurred to develop or obtain internal-use software (and hosting arrangements that include an internal use software license). The ASU is effective for fiscal years beginning after December 15, 2019, including interim periods within those fiscal years; early adoption is permitted and should be applied either retrospectively or prospectively to all implementation costs incurred after thefirst date of adoption.their initial date of service. During 2018, employees were eligible to participate in the discretionary contribution portion of the PSP after completing 12 months of employment, and 1,000 hours of service. The Company adopted the amended guidance on January 1, 2020, and it did not have a material impactemployee must be employed on the consolidated financial statements.
Accounting Standards Update 2018-14 - Changes to the Disclosure Requirements for Defined Benefit Plans (“ASU 2018-14”). On August 28, 2018, the FASB issued guidance to remove, add, and clarify certain disclosures for defined benefit plans. The ASU is effective for fiscal years ending after December 15, 2020; early adoption is permitted and should be applied using the retrospective method to all periods presented. We are currently assessing the impact the adoption of this guidance will have on our consolidated balance sheets, statements of income, and cash flows.
Accounting Standards Update 2018-13 - Changes to the Disclosure Requirements for Fair Value Measurement (“ASU 2018-13”). On August 28, 2018, the FASB issued guidance to remove, add, and clarify certain disclosures for fair value measurement. The ASU is effective for fiscal years, and interim periods within those fiscal years, beginning after December 15, 2019; early adoption is permitted and should be applied using either retrospective method or the prospective method as specified in the ASU. The adoption of this guidance is not expected to have a material impact on our consolidated balance sheets, statements of income, and cash flows.
Accounting Standards Update 2018-07 - Improvements to Nonemployee Share-Based Payment Accounting (“ASU 2018-07”). On June 20, 2018, the FASB issued ASU 2018-07 to align the accounting for share-based payment awards issued to employees and nonemployees. The new guidance also clarifies that any share-based payment awards issued to customers should be evaluated under ASC 606, Revenue from Contracts with Customers. Currently, the accounting for nonemployee share-based payments differs from that applied to employee awards, particularly with regard to the measurement date and the impact of performance conditions. Under the new guidance, the existing employee guidance will apply to nonemployee share-based transactions, with certain exceptions. The cost of nonemployee awards will continue to be recorded as if the grantor had paid cash for the goods or services. The ASU is effective for public companies for fiscal years beginning after December 15, 2018, including interim periods within that fiscal year, and early adoption is permitted. The adoption of this guidance did not have a material impact on our consolidated balance sheets, statements of income, and cash flows.
Accounting Standard Update No. 2017-12 - Derivatives and Hedging: Targeted Improvements to Accounting for Hedging Activities (“ASU 2017-12”). On August 28, 2017, the FASB issued a new standard that allows companies to better align their hedge accounting and risk management activities. The new standard will also reduce the cost and complexity of applying hedge accounting. The standard requires companies to change the recognition and presentation of the effects of hedge accounting by:
eliminating therequirementtoseparatelymeasureandreporthedge ineffectiveness;and
requiringcompaniestopresentalloftheelementsofhedgeaccounting thataffectearningsinthesameincomestatementlineasthehedgeditem.
The standard also permits hedge accounting for strategies for which hedge accounting was not historically permitted and includes new alternatives for measuring the hedged item for fair value hedges of interest rate risk. Furthermore, the standard eases the requirements for effectiveness testing, hedge documentation, applying the critical terms match method, and introduces new alternatives that will permit companies to reduce the risk of material error corrections if they misapply the shortcut method. The new accounting standard was effective for fiscal years beginning after December 15, 2018 and interim periods within those fiscal years.
The new standard requires a modified retrospective transition method in which the Company will recognize the cumulative effectlast day of the change oncalendar year or retire at the opening balancenormal retirement age of each affected component of equity in the statement of financial position as of the date of adoption. The Company early adopted the standard65 during the fourth quarter of 2018, using a modified retrospective transition method, and it did not have an effect on our consolidated balance sheets, statements of income, and cash flows. See note 23 – DERIVATIVE AND HEDGING ACTIVITIES.
Accounting Standards Update No. 2016-02 - Leases (“ASU 2016-02”). On February 25, 2016,calendar year to receive the FASB issued guidance that requires recognition of lease assets and lease liabilities on the statement of condition and disclosure of key information about leasing arrangements. In particular, this guidance requires a lessee of operating or finance leases to recognize on the statement of condition a liability to make lease payments and a right-of-use asset representing its right to use the underlying asset for the lease term. However, for leases with a term of 12 months or less, a lessee is permitted to make an accounting policy election not to recognize lease assets and lease liabilities. Under previous GAAP, a lessee was not required to recognize lease assets and lease liabilities arising from operating leases on the statement of condition. The guidance became effective for the Company on January 1, 2019. Also in July 2018, the FASB issued Accounting Standards Update No. 2018-11, “Targeted Improvements” (“ASU 2018-11”), to allow an optional transition method in which the provisions of Topic 842 would be applied upon the adoption date and would not have to be retroactively applied to the earliest reporting period presented in the consolidated financial statements. Using the optional transition method discussed above,the Company adopted the new lease guidance on January 1, 2019 and recorded a right-of-use asset of $32.9 million and a corresponding net lease liability. See note 17 – commitments and contingencies.discretionary contribution.
Accounting Standards Update No. 2014-09 - Revenue from Contracts with Customers (“ASU 2014-09”). On May 28, 2014, the FASB issued Accounting Standards Update (“ASU”) No. 2014-09, “Revenue from Contracts with Customers,” which requires an entity to recognize the amount of revenue to which it expects to be entitled for the transfer of promised goods or services to customers. The new guidance supersedes current U.S. GAAP guidance on revenue recognition and requires the use of more estimates and judgments than the current revenue standards. Topic 606 does not apply to revenue associated with financial instruments, including revenue from loans and securities. In addition, certain noninterest income streams, such as fees associated with mortgage servicing rights, financial guarantees, derivatives, and certain credit card fees, are also not in scope of the new guidance.
On January 1, 2018, the Company adopted ASU No. 2014-09 and all subsequent ASUs that modified Topic 606. Topic 606 is applicable to noninterest revenue streams such as trust and asset management income, deposit related fees, interchange fees, and merchant income. The Company completed its overall assessment of revenue streams and review of related contracts potentially affected by the ASU, including trust and asset management fees, deposit related fees, and other income within noninterest income. Based on this assessment, the Company concluded that ASU 2014-09 did not materially change the method in which the Company currently recognizes revenue for these revenue streams. The Company adopted ASU 2014-09 and its related amendments utilizing the modified retrospective approach. Since there was no net income impact upon adoption of the new guidance, a cumulative effect adjustment to opening retained earnings was not deemed necessary. Noninterest income considered in-scope of Topic 606 is discussed below.
Wealth Management and Trust Fees
The Company earns wealth management fees for providing investment management, trust administration, and financial planning services to clients. The Company’s performance obligation under these contracts is satisfied over time as the wealth management services are provided. Fees are recognized monthly based on the monthly value of the assets under management and the applicable fee rate, or at a fixed annual rate, depending on the terms of the contract. No performance-based incentives are earned on wealth management contracts.
The Company earns trust fees for serving as trustee for certain clients. As trustee, the Company serves as a fiduciary, administers the client’s trust, and in some cases, manages the assets of the trust. The Company’s performance obligation under these agreements is satisfied over time as the administration and management services are provided. Fees are recognized monthly based on a percentage of the market value of the account or at a fixed annual rate as outlined in the agreement. The Company also earns fees for trust related activities. The Company’s performance obligation under these agreements is satisfied at a point in time and recognized when these services have been performed.
All of the wealth management and trust fee income on the consolidated statement of income is considered in-scope of Topic 606.
Other Banking Fee Income
The Company charges a variety of fees to its clients for services provided on the deposit and deposit management related accounts. Each fee is either transaction-based or assessed monthly. The types of fees include service charges on accounts, overdraft fees, wire transfer fees, maintenance fees, ATM fee charges, and other miscellaneous charges related to the accounts. These fees are not governed by individual contracts with clients. They are chargescharged to clients based on disclosures presented to these clients upon opening these accounts, along with updated disclosures when changes are made to the fee structures. The transaction-based fees are recognized in revenue when charged to the client based on specific activity on the client’s account. Monthly service and maintenance charges are recognized in the month they are earned and are charged directly to the client’s account.
Pension and Retirement Plans
The Company sponsors a defined benefit pension plan (the “Pension Plan”) and a postretirement health care plan covering substantially all employees hired before May 2, 2011. Effective December 31, 2017, the accrual of benefits for all participants in the Pension Plan was frozen. Benefits for the postretirement health care plan are based on years of service. Expense for the postretirement health care plan is recognized over the employee’s service life utilizing the projected unit credit actuarial cost method. Effective November 7, 2019, the postretirement health care plan was frozen for employees hired after that date.
The Company also sponsors non-qualified retirement programs that provide supplemental retirement benefits to certain current and former executives. Prior to 2016, the Company provided individual non-qualified defined benefit supplemental executive retirement plans (“DB SERPs”) to certain executives. The DB SERPs generally provide for an annual benefit payable in equal monthly installments following the executive’s retirement and continuing for at least the remainder of his or her lifetime, with such annual benefit generally based on the executive’s years of service and his or her highest three consecutive years of base salary and bonus. In 2016, the Company’s Board of Directors discontinued the use of DB SERPs for new entrants to the Company’s non-qualified retirement programs. Instead, new entrants are provided with individual non-qualified defined contribution supplemental executive retirement plans (“DC SERPs”). Under the DC SERPs, the Company may contribute an amount equal to 10% of the executive’s base salary and bonus to his or her account under the Company’s non-qualified deferred compensation plan, the Executive Deferred Compensation Plan. Expense for the DB SERPs is recognized over the executive’s service life utilizing the projected unit credit actuarial cost method. Expense for the DC SERPs is recognized as incurred.
The Company maintains a Profit-Sharing Plan (“PSP”) that provides for deferral of federal and state income taxes on employee contributions allowed under Section 401(k) of federal law. Beginning in 2018, the Company matched employee contributions up to 100% of the first 4% of each participant’s salary, eligible bonus, and eligible incentive. Each year, the Company may also make a discretionary contribution to the PSP based on eligible salary, bonus, and incentive. Employees are eligible to participate in the PSP on the first day of their initial date of service. Effective January 1, 2019, employees were eligible to participate in the discretionary contribution portion of the PSP on the first date of their initial date of service. During 2018, employees were eligible to participate in the discretionary contribution portion of the PSP after completing 12 months of employment, and 1,000 hours of service. The employee must be employed on the last day of the calendar year or retire at the normal retirement age of 65 during the calendar year to receive the discretionary contribution.
Share-Based Compensation
Share-based compensation plans provide for stock option awards, restricted stock awards, time-based restricted stock units (“RSUs”), and performance-based restricted stock units (“PRSUs”).
Compensation expense for restricted stock awards is recognized over the service period based on the fair value at the date of grant. RSUs and PRSUs are valued at the fair market value of the Company’s common stock as of the award date. PRSUs’ compensation expense is based on the most recent performance assumption available and is adjusted as assumptions change. If the goals are not met, vesting does not occur, 0 compensation cost will be recognized and any recognized compensation costs will be reversed. Stock-based awards that do not require future service are expensed in the year of grant.
Derivative Instruments and Hedging Activities
Derivatives are recognized as either assets or liabilities on the balance sheet and are measured at fair value. The accounting for changes in the fair value of such derivatives depends on the intended use of the derivative and resulting designation. For derivatives not designated as hedges, changes in fair value of the derivative instruments are recognized in earnings in noninterest income.
For derivatives designated as fair value hedges, changes in the fair value of such derivatives are recognized in earnings together with the changes in the fair value of the related hedged item. The net amount, if any, represents hedge ineffectiveness and is reflected in earnings.
For derivatives designated as cash flow hedges, the effective portion of changes in the fair value of the derivative is recorded in other comprehensive income (loss) and recognized in earnings when the hedged transaction affects earnings. The ineffective portion of changes in the fair value of cash flow hedges is recognized directly in earnings.
Fair Value Measurements
Fair value is defined as the price that would be received to sell an asset or paid to transfer a liability in an orderly transaction between market participants at the measurement date. The Company measures the fair values of its financial instruments in accordance with accounting guidance that requires an entity to base fair value on exit price and maximize the use of observable inputs and minimize the use of unobservable inputs to determine the exit price.
ASC 820, “Fair Value Measurements and Disclosures” establishes a fair value hierarchy that gives the highest priority to quoted prices in active markets and the lowest priority to unobservable data and requires fair value measurements to be disclosed by level within the hierarchy. The three broad levels defined by the fair value hierarchy are as follows:
Level 1 – Quoted prices are available in active markets for identical assets or liabilities as of the reported date. The type of financial instruments included in Level 1 are highly liquid cash instruments with quoted prices such as government or agency securities, listed equities, and money market securities, as well as listed derivative instruments.
Level 2 – Pricing inputs are other than quoted prices in active markets, which are either directly or indirectly observable as of the reported date. The nature of these financial instruments includes cash instruments for which quoted prices are available but traded less frequently, derivative instruments whose fair value has been derived using a model where inputs to the model are directly observable in the market or can be derived principally from or corroborated by observable market data, and instruments that are fair valued using other financial instruments, the parameters of which can be directly observed. Instruments which are generally included in this category are corporate bonds and loans, mortgage whole loans, municipal bonds, and over-the-counter derivatives.
Level 3 – Instruments that have little to no pricing observability as of the reported date. These financial instruments do not have two-way markets and are measured using management’s best estimate of fair value, where the inputs into the determination of fair value require significant management judgment to estimation. Instruments that are included in this category generally include certain commercial mortgage loans, certain private equity investments, distressed debt, non-investment grade residual interests in securitizations, as well as certain highly structured over-the-counter derivative contracts.
Earnings per Common Share
Earnings per common share is computed using the two-class method prescribed under ASC Topic 260, “Earnings Per Share.” ASC Topic 260 provides that unvested share-based payment awards that contain nonforfeitable rights to dividends or dividend equivalents (whether paid or unpaid) are participating securities and shall be included in the computation of earnings per share pursuant to the two-class method. The Company has determined that its outstanding non-vested stock awards are participating securities.
Under the two-class method, basic earnings per common share is computed by dividing net earnings allocated to common stock by the weighted-average number of common shares outstanding during the applicable period, excluding outstanding participating securities. Diluted earnings per common share is computed using the weighted-average number of shares determined for the basic earnings per common share computation plus the dilutive effect of common stock equivalents. A reconciliation of the weighted-average shares used in calculating basic earnings per common share and the weighted average common shares used in calculating diluted earnings per common share for the reported periods is provided in Note 20 - Earnings Per Share.
Subsequent Events
Management has reviewed events occurring through March 15, 2021, the date the consolidated financial statements were issued and determined that no subsequent events occurred requiring adjustment to or disclosure in these financial statements.
3. | Recently Issued and Adopted Accounting Standards |
Accounting Pronouncements Yet to be Adopted
Accounting Standards Update (“ASU”) 2020-04 - Facilitation of the Effects of Reference Rate Reform on Financial Reporting (“ASU 2020-04”). On March 12, 2020, the FASB issued ASU 2020-04 and related amendments to ease the potential burden in accounting for reference rate reform. The amendments in ASU 2020-04 are elective and apply to all entities that have contracts, hedging relationships, and other transactions that reference the London Inter-bank Offer Rate (“LIBOR”) or another reference rate expected to be discontinued due to reference rate reform. The new guidance provides the following optional expedients:
| • | Simplify accounting analyses for contract modifications. |
| • | Allow hedging relationships to continue without de-designation if there are qualifying changes in the critical terms of an existing hedging relationship due to reference rate reform. |
| • | Allow a change in the systematic and rational method used to recognize in earnings the components excluded from the assessment of hedge effectiveness. |
| • | Allow a change in the designated benchmark interest rate to a different eligible benchmark interest rate in a fair value hedging relationship. |
| • | Allow the shortcut method for a fair value hedging relationship to continue for the remainder of the hedging relationship. |
| • | Simplify the assessment of hedge effectiveness and provide temporary optional expedients for cash flow hedging relationships affected by reference rate reform. |
| • | Allow a one-time election to sell or transfer debt securities classified as held to maturity that reference a rate affected by reference rate reform and that are classified as held to maturity before January 1, 2020. |
The amendments are effective for all entities from the beginning of an interim period that includes the issuance date of the ASU. An entity may elect to apply the amendments prospectively through December 31, 2022. The Company is currently assessing the impact the adoption of this guidance will have on its consolidated balance sheets, statements of income, and cash flows.
Accounting Pronouncements Adopted in 2020
Accounting Standards Update 2018-13 - Changes to the Disclosure Requirements for Fair Value Measurement (“ASU 2018-13”). On August 28, 2018, the FASB issued guidance to remove, add, and clarify certain disclosures for fair value measurement. The Company adopted the amended guidance on January 1, 2020 using the prospective method.
Accounting Standards Update 2018-14 - Changes to the Disclosure Requirements for Defined Benefit Plans (“ASU 2018-14”). On August 28, 2018, the FASB issued guidance to remove, add, and clarify certain disclosures for defined benefit plans. The standard became effective on December 31, 2020 for the Company. The Company adopted this standard as of December 31, 2020.
Accounting Standards Update 2016-13 - Financial Instruments - Credit Losses (“Topic 326”): Measurement of Credit Losses on Financial Instruments (“ASU 2016-13”). ASU 2016-13, which has been codified under Topic 326, replaced the previous GAAP method of calculating loan losses. Previously, GAAP required the use of the incurred loss methodology versus ASU 2016-13 which utilizes an expected loss methodology. The current expected credit loss (“CECL”) methodology incorporates forecasting in addition to historical and current measures. The measurement of expected credit losses under the CECL methodology is applicable to financial assets measured at amortized cost, including loan receivables, held to maturity and available for sale debt securities. The Company adopted ASU 2016-13 and related amendments on January 1, 2020 using a modified-retrospective approach for all financial assets measured at amortized cost and off-balance-sheet (“OBS”) credit exposures and recorded an additional allowance for credit loss of $481,000 before taxes and a corresponding decrease in retained earnings of $347,000, net of taxes. Results for reporting periods beginning after January 1, 2020 are presented under Topic 326 while prior period amounts continue to be reported in accordance with previously applicable GAAP.
ASU 2016-13 also applies to OBS credit exposure not accounted for as insurance (loan commitments, standby letters of credit, financial guarantees, and other similar investment) and net investments in leases recognized by a lessor in accordance with ASU 2016-02 - Leases (Topic 842).
January 1, 2020 CECL Transition (Day 1) Impact
The CECL methodology reflects the Company’s view of the state of the economy and forecasted macroeconomic conditions and their impact on the Company’s loan and investment portfolios as of the adoption date.
The following table illustrates the impact of Topic 326:
| | January 1, 2020 | |
| | As reported under ASC 326 | | | Pre-ASC 326 Adoption | | | Impact of ASC 326 Adoption | |
| | (dollars in thousands) | |
ASSETS | | | | | | | | | | | | |
Loans | | | | | | | | | | | | |
Residential mortgage | | $ | 7,202 | | | $ | 5,141 | | | $ | 2,061 | |
Commercial mortgage | | | 9,545 | | | | 10,992 | | | | (1,447 | ) |
Home equity | | | 256 | | | | 461 | | | | (205 | ) |
Commercial & industrial | | | 896 | | | | 1,388 | | | | (492 | ) |
Consumer | | | 486 | | | | 198 | | | | 288 | |
Allowance for credit losses on loans | | $ | 18,385 | | | $ | 18,180 | | | $ | 205 | |
LIABILITIES | | | | | | | | | | | | |
Allowance for credit losses on OBS credit exposure | | $ | 326 | | | $ | 50 | | | $ | 276 | |
4. Mergers
Wellesley Bancorp, Inc.
On June 1, 2020, the Company completed its merger with Wellesley Bancorp, Inc. (“Wellesley”), adding 6 banking offices in Massachusetts. Under the terms of the Agreement and Plan of Merger, each outstanding share of Wellesley common stock was converted into 0.580 shares of the Company’s common stock. As a result of the merger, former Wellesley stockholders received an aggregate of 1,502,814 shares of the Company's common stock. The total consideration paid amounted to $88.8 million, based on the closing price of $58.00 of the Company's common stock, the value of Wellesley's exercisable options, and cash paid for fractional shares on May 31, 2020.
The Company accounted for the merger using the acquisition method pursuant to ASC Topic 805, “Business Combinations”. Accordingly, the Company recorded merger expenses of $6.4 million during the year ended at December 31, 2020. Additionally, on June 1, 2020, the Company recorded $8.6 million in provision for credit losses to reflect the impact of CECL on the acquired loans.
The acquisition method requires the acquirer to recognize the assets acquired and the liabilities assumed at their fair values as of the acquisition date. The following table summarizes the estimated fair value of the assets acquired and liabilities assumed as of the date of the acquisition:
| | At June 1, 2020 | |
| | Wellesley Book Value | | | Purchase Accounting Adjustments | | | Net Assets Acquired at Fair Value | |
| | (dollars in thousands) | |
Total Purchase Price | | | | | | | | | | $ | 88,766 | |
Assets | | | | | | | | | | | | |
Cash and cash equivalents | | $ | 44,667 | | | $ | — | | | $ | 44,667 | |
Investments | | | 23,331 | | | | — | | | | 23,331 | |
Gross Loans | | | 883,659 | | | | (13,626 | ) | | | 870,033 | |
Allowance for loan loss | | | (8,461 | ) | | | 8,461 | | | | — | |
Premises and equipment | | | 2,972 | | | | 1,040 | | | | 4,012 | |
Other assets | | | 41,082 | | | | 2,505 | | | | 43,587 | |
Total assets acquired | | | 987,250 | | | | (1,620 | ) | | | 985,630 | |
| | | | | | | | | | | | |
Liabilities | | | | | | | | | | | | |
Deposits | | | 758,976 | | | | 1,902 | | | | 760,878 | |
Borrowings & Subordinated debt | | | 132,005 | | | | 477 | | | | 132,482 | |
Other liabilities | | | 21,847 | | | | 2,362 | | | | 24,209 | |
Total liabilities assumed | | | 912,828 | | | | 4,741 | | | | 917,569 | |
Net Assets Acquired | | $ | 74,422 | | | $ | (6,361 | ) | | $ | 68,061 | |
Goodwill | | | | | | | | | | $ | 20,705 | |
Fair value adjustments to assets acquired and liabilities assumed are generally amortized using either an effective yield or straight-line basis over periods consistent with the average life, useful life, and/or contractual term of the related assets and liabilities.
Fair values of the major categories of assets acquired and liabilities assumed were determined as follows:
Cash and Cash Equivalents
The fair values of cash and cash equivalents approximate the respective carrying amounts because the instruments are payable on demand or have short-term maturities.
Investments
The fair values of securities were based on quoted market prices for identical securities received from an independent, nationally recognized, third-party pricing service. Prices provided by the independent pricing service were based on recent trading activity and other observable information including, but not limited to, market interest rate curves, referenced credit spreads, and estimated prepayment rates where applicable.
Loans
Fair value was determined using market participant assumptions in estimating the amount and timing of both principal and interest cash flows expected to be collected, as adjusted for an estimate of default rate and prepayments, and then applying a market-based discount rate to those cash flows.
Premises and Equipment
The fair value of premises was determined based upon appraisals by licensed real estate appraisers. The appraisal was based upon the best and highest use of the property with the final value determined based upon an analysis of the cost, sales comparison, and income capitalization approaches for the property appraised.
Deposits
The fair value of acquired savings and transaction deposit accounts was assumed to approximate the carrying value as these accounts have no stated maturity and are payable on demand. The fair value of time deposits was determined based on the present value of the contractual cash flows over the remaining period to maturity using a market interest rate.
Borrowings
The fair value represents the adjustment necessary because the weighted average interest rate of the Federal Home Loan Bank borrowings differed from the cost of similar funding at the time of acquisition.
Subordinated Debt
The fair value represents the adjustment necessary because the interest rate of the subordinated debt differed from the cost of similar funding at the time of acquisition.
Optima Bank & Trust Company
The Company completed its merger with Optima Bank & Trust Company (“Optima”) on April 17, 2019. Under the terms of the Agreement and Plan of Merger, each outstanding share of Optima common stock was converted into $32.00 in cash or 0.3468 shares of the Company’s common stock, with the consideration for the transaction structured as 95%95 percent common stock and 5%5 percent cash. As a result of the merger, with Optima, former Optima shareholders received an aggregate of approximately 722,746 shares of the Company’s common stock and an aggregate of approximately $3.5 million in cash. The total consideration paid amounted to $64.3 million.
The Company accounted for the merger with Optima using the acquisition method pursuant to the Business Combinations Topicand recorded total assets of the FASB’s Accounting Standards Codification (“ASC”). Accordingly, for the year ended December 31, 2019$555.7 million, including $30.8 million in goodwill, and 2018,assumed total liabilities of $491.4 million. Additionally, the Company recorded merger expenses of $3.9 million and $201,000 related toduring the merger with Optima. Additionally, the acquisition method requires the acquirer to recognize the assets acquired and the liabilities assumed at their fair values as of the acquisition date. The following table summarizes the estimated fair value of the assets acquired and liabilities assumed as of the date of the acquisition:
| | Net Assets Acquired | |
| | at Fair Value | |
| | (dollars in thousands) | |
Assets | | | | |
Cash and cash equivalents | | $ | 6,902 | |
Investments | | | 23,298 | |
Loans | | | 475,406 | |
Premises and equipment | | | 6,286 | |
Goodwill | | | 30,794 | |
Core deposit and other intangibles | | | 3,609 | |
Other assets | | | 9,408 | |
Total assets acquired | | | 555,703 | |
| | | | |
Liabilities | | | | |
Deposits | | | 477,189 | |
Borrowings | | | 13,459 | |
Other liabilities | | | 799 | |
Total liabilities assumed | | | 491,447 | |
Purchase price | | $ | 64,256 | |
Fair value adjustments to assets acquired and liabilities assumed are generally accreted/amortized using either an effective yield or straight-line basis over periods consistent with the average life, useful life, and/or contractual term of the related assets and liabilities.
Fair values of the major categories of assets acquired and liabilities assumed were determined as follows:
Cash and Cash Equivalents
The fair values of cash and cash equivalents approximate the respective carrying amounts because the instruments are payable on demand or have short-term maturities.
Investments
The fair values of securities were based on quoted market prices for identical securities received from an independent, nationally-recognized, third-party pricing service. Prices provided by the independent pricing service were based on recent trading activity and other observable information including, but not limited to, market interest rate curves, referenced credit spreads, and estimated prepayment rates where applicable.
Loans
The loans acquired were recorded at fair value without a carryover of the allowance for loan losses. Fair value of the loans portfolio is determined using market participant assumptions in estimating the amount and timing of both principal and interest cash flows expected to be collected, as adjusted for an estimate of future credit losses and prepayments, and then applying a market-based discount rate to those cash flows. The overall discount on the loans acquired in this transaction was due to anticipated credit loss, as well as considerations for liquidity and market interest rates.
Premises and Equipment
The fair value of the premises, including buildings and improvements, was determined based upon appraisals by licensed real estate appraisers. The appraisals were based upon the best and highest use of the property with final values determined based upon an analysis of the cost, sales comparison, and income capitalization approaches for each property appraised.
Core Deposit Intangible
The fair value of the core deposit intangible is derived by comparing the interest rate and servicing costs that the financial institution pays on the core deposit liability versus the current market rate for alternative sources of financing, while factoring in estimates over the remaining life and attrition rate of the deposit accounts. The intangible asset represents the stable and relatively low cost source of funds that the deposits and accompanying relationships provide the Company, when compared to alternative funding sources.
Deposits
The fair value of acquired savings and transaction deposit accounts was assumed to approximate the carrying value as these accounts have no stated maturity and are payable on demand. The fair value of time deposits were determined based on the present value of the contractual cash flows over the remaining period to maturity using a market interest rate.
Borrowings
Federal Home Loan Bank (“FHLB”) borrowings were recorded at their carrying value which approximates fair value.year ended December 31, 2019.
5. | CASH AND CASH EQUIVALENTEQUIVALENTS |
At December 31, 20192020 and December 31, 2018,2019, cash and due from banks totaled $75.8 million and $61.3 million, and $18.5 million, respectively. Of this amount, $31.5 million and $12.7 million, respectively,There were 0 amounts required to be maintained to satisfy the reserve requirements ofat the Federal Reserve Bank of Boston (“FRB”) at December 31, 2020. At December 31, 2019, the Company maintained $31.5 million of cash and cash equivalents at the FRB Boston”).to satisfy reserve requirements. Additionally, at December 31, 20192020 and 2018,2019, the Company pledged $500,000 to the New Hampshire Banking Department relating to Cambridge Trust Company of New Hampshire, Inc.’s operations in that state. The Company also pledged cash collateral to derivative counterparties totaling $29.9 million and $10.4 million at December 31, 2020 and 2019, respectively. See Note 21 - Derivatives and Hedging Activities for a discussion of the Company’s derivative and hedging activities.
Investment securities have been classified in the accompanying consolidated balance sheets according to management’s intent. The carrying amounts of securities and their approximate fair values were as follows:
| | December 31, 2019 | | | December 31, 2018 | | | December 31, 2020 | | | December 31, 2019 | |
| | Amortized Cost | | | Gross Unrealized Gains | | | Gross Unrealized Losses | | | Fair Value | | | Amortized Cost | | | Gross Unrealized Gains | | | Gross Unrealized Losses | | | Fair Value | | | Amortized Cost | | | Gross Unrealized Gains | | | Gross Unrealized Losses | | | Fair Value | | | Amortized Cost | | | Gross Unrealized Gains | | | Gross Unrealized Losses | | | Fair Value | |
| | (dollars in thousands) | | | (dollars in thousands) | |
Available for sale securities | | | | | | | | | | | | | | | | | | | | | | | | | | | | | | | | | | | | | | | | | | | | | | | | | | | | | | | | | | | | | | | | |
U.S. GSE obligations | | $ | 38,000 | | | $ | — | | | $ | (152 | ) | | $ | 37,848 | | | $ | 75,004 | | | $ | — | | | $ | (965 | ) | | $ | 74,039 | | | $ | 22,995 | | | $ | 641 | | | $ | (19 | ) | | $ | 23,617 | | | $ | 38,000 | | | $ | — | | | $ | (152 | ) | | $ | 37,848 | |
Mortgage-backed securities | | | 103,109 | | | | 231 | | | | (858 | ) | | | 102,482 | | | | 92,271 | | | | 118 | | | | (3,121 | ) | | | 89,268 | | | | 208,515 | | | | 2,502 | | | | (387 | ) | | | 210,630 | | | | 103,109 | | | | 231 | | | | (858 | ) | | | 102,482 | |
Corporate debt securities | | | — | | | | — | | | | — | | | | — | | | | 5,015 | | | | — | | | | (159 | ) | | | 4,856 | | | | 2,742 | | | | 41 | | | | — | | | | 2,783 | | | | — | | | | — | | | | — | | | | — | |
Total available for sale securities | | $ | 141,109 | | | $ | 231 | | | $ | (1,010 | ) | | $ | 140,330 | | | $ | 172,290 | | | $ | 118 | | | $ | (4,245 | ) | | $ | 168,163 | | | $ | 234,252 | | | $ | 3,184 | | | $ | (406 | ) | | $ | 237,030 | | | $ | 141,109 | | | $ | 231 | | | $ | (1,010 | ) | | $ | 140,330 | |
| | | | | | | | | | | | | | | | | | | | | | | | | | | | | | | | | | | | | | | | | | | | | | | | | | | | | | | | | | | | | | | | |
Held to maturity securities | | | | | | | | | | | | | | | | | | | | | | | | | | | | | | | | | | | | | | | | | | | | | | | | | | | | | | | | | | | | | | | | |
U.S. GSE obligations | | $ | 5,000 | | | $ | — | | | | — | | | $ | 5,000 | | | $ | 32,571 | | | $ | — | | | $ | (238 | ) | | $ | 32,333 | | | $ | — | | | $ | — | | | $ | — | | | $ | — | | | $ | 5,000 | | | $ | — | | | $ | — | | | $ | 5,000 | |
Mortgage-backed securities | | | 161,759 | | | | 2,751 | | | | (111 | ) | | | 164,399 | | | | 168,118 | | | | 134 | | | | (2,290 | ) | | | 165,962 | | | | 137,435 | | | | 6,784 | | | | (97 | ) | | | 144,122 | | | | 161,759 | | | | 2,751 | | | | (111 | ) | | | 164,399 | |
Corporate debt securities | | | 6,980 | | | | 116 | | | | — | | | | 7,096 | | | | 6,972 | | | | — | | | | (107 | ) | | | 6,865 | | | | 6,989 | | | | 197 | | | | — | | | | 7,186 | | | | 6,980 | | | | 116 | | | | — | | | | 7,096 | |
Municipal securities | | | 84,433 | | | | 3,252 | | | | (66 | ) | | | 87,619 | | | | 75,208 | | | | 1,297 | | | | (355 | ) | | | 76,150 | | | | 103,248 | | | | 5,643 | | | | (60 | ) | | | 108,831 | | | | 84,433 | | | | 3,252 | | | | (66 | ) | | | 87,619 | |
Total held to maturity securities | | $ | 258,172 | | | $ | 6,119 | | | $ | (177 | ) | | $ | 264,114 | | | $ | 282,869 | | | $ | 1,431 | | | $ | (2,990 | ) | | $ | 281,310 | | | $ | 247,672 | | | $ | 12,624 | | | $ | (157 | ) | | $ | 260,139 | | | $ | 258,172 | | | $ | 6,119 | | | $ | (177 | ) | | $ | 264,114 | |
Total | | $ | 399,281 | | | $ | 6,350 | | | $ | (1,187 | ) | | $ | 404,444 | | | $ | 455,159 | | | $ | 1,549 | | | $ | (7,235 | ) | | $ | 449,473 | | | $ | 481,924 | | | $ | 15,808 | | | $ | (563 | ) | | $ | 497,169 | | | $ | 399,281 | | | $ | 6,350 | | | $ | (1,187 | ) | | $ | 404,444 | |
All of the Company’s mortgage-backed securities have been issued by, or are collateralized by securities issued by, either the Government National Mortgage Association (Ginnie Mae)(“Ginnie Mae” or “GNMA”), the Federal National Mortgage Association (Fannie Mae)(“Fannie Mae” or “FNMA”), or the Federal Home Loan Mortgage Corporation (Freddie Mac)(“Freddie Mac” or “FHLMA”).
The amortized cost and fair value of debt investments,investment securities, aggregated by contractual maturity, are shown below. Municipal securities are aggregated by the earliest of call date or contractual maturity. Maturities of mortgage-backed securities do not take into consideration scheduled amortization or prepayments. Actual maturities may differ from contractual maturities because issuers may have the right to call or prepay obligations with or without call or prepayment penalties.
| | Within One Year | | | After One, But Within Five Years | | | After Five, But Within Ten Years | | | After Ten Years | | | Total | | | Within One Year | | | After One, But Within Five Years | | | After Five, But Within Ten Years | | | After Ten Years | | | Total | |
| | Amortized Cost | | | Fair Value | | | Amortized Cost | | | Fair Value | | | Amortized Cost | | | Fair Value | | | Amortized Cost | | | Fair Value | | | Amortized Cost | | | Fair Value | | | Amortized Cost | | | Fair Value | | | Amortized Cost | | | Fair Value | | | Amortized Cost | | | Fair Value | | | Amortized Cost | | | Fair Value | | | Amortized Cost | | | Fair Value | |
At December 31, 2019 | | (dollars in thousands) | | |
At December 31, 2020 | | | (dollars in thousands) | |
Available for sale securities | | | | | | | | | | | | | | | | | | | | | | | | | | | | | | | | | | | | | | | | | | | | | | | | | | | | | | | | | | | | | | | | | | | | | | | | | | | | | | | | |
U.S. GSE obligations | | $ | 5,000 | | | $ | 4,997 | | | $ | 20,000 | | | $ | 19,939 | | | $ | 5,000 | | | $ | 4,934 | | | $ | 8,000 | | | $ | 7,978 | | | $ | 38,000 | | | $ | 37,848 | | | $ | — | | | $ | — | | | $ | 9,995 | | | $ | 9,983 | | | $ | 5,000 | | | $ | 5,150 | | | $ | 8,000 | | | $ | 8,484 | | | $ | 22,995 | | | $ | 23,617 | |
Mortgage-backed securities | | | — | | | | — | | | | 37 | | | | 38 | | | | 36,393 | | | | 35,997 | | | | 66,679 | | | | 66,447 | | | | 103,109 | | | | 102,482 | | | | 1 | | | | 1 | | | | 4,226 | | | | 4,318 | | | | 54,849 | | | | 56,127 | | | | 149,439 | | | | 150,184 | | | | 208,515 | | | | 210,630 | |
Corporate debt securities | | | — | | | | — | | | | — | | | | — | | | | — | | | | — | | | | — | | | | — | | | | — | | | | — | | | | 1,001 | | | | 1,002 | | | | 1,741 | | | | 1,781 | | | | — | | | | — | | | | — | | | | — | | | | 2,742 | | | | 2,783 | |
Total available for sale securities | | $ | 5,000 | | | $ | 4,997 | | | $ | 20,037 | | | $ | 19,977 | | | $ | 41,393 | | | $ | 40,931 | | | $ | 74,679 | | | $ | 74,425 | | | $ | 141,109 | | | $ | 140,330 | | | $ | 1,002 | | | $ | 1,003 | | | $ | 15,962 | | | $ | 16,082 | | | $ | 59,849 | | | $ | 61,277 | | | $ | 157,439 | | | $ | 158,668 | | | $ | 234,252 | | | $ | 237,030 | |
| | | | | | | | | | | | | | | | | | | | | | | | | | | | | | | | | | | | | | | | | | | | | | | | | | | | | | | | | | | | | | | | | | | | | | | | | | | | | | | | |
Held to maturity securities | | | | | | | | | | | | | | | | | | | | | | | | | | | | | | | | | | | | | | | | | | | | | | | | | | | | | | | | | | | | | | | | | | | | | | | | | | | | | | | | |
U.S. GSE obligations | | $ | 5,000 | | | $ | 5,000 | | | $ | — | | | $ | — | | | $ | — | | | $ | — | | | $ | — | | | $ | — | | | $ | 5,000 | | | $ | 5,000 | | |
Mortgage-backed securities | | | — | | | | — | | | | 2 | | | | 2 | | | | 48,088 | | | | 49,117 | | | | 113,669 | | | | 115,280 | | | | 161,759 | | | | 164,399 | | | $ | — | | | $ | — | | | $ | 2 | | | $ | 2 | | | $ | 60,933 | | | $ | 64,779 | | | $ | 76,500 | | | $ | 79,341 | | | $ | 137,435 | | | $ | 144,122 | |
Corporate debt securities | | | — | | | | — | | | | 6,980 | | | | 7,096 | | | | — | | | | — | | | | — | | | | — | | | | 6,980 | | | | 7,096 | | | | — | | | | — | | | | 6,989 | | | | 7,186 | | | | — | | | | — | | | | — | | | | — | | | | 6,989 | | | | 7,186 | |
Municipal securities | | | 3,270 | | | | 3,291 | | | | 10,606 | | | | 10,902 | | | | 45,201 | | | | 47,523 | | | | 25,356 | | | | 25,903 | | | | 84,433 | | | | 87,619 | | | | 2,541 | | | | 2,561 | | | | 19,343 | | | | 20,222 | | | | 40,934 | | | | 43,835 | | | | 40,430 | | | | 42,213 | | | | 103,248 | | | | 108,831 | |
Total held to maturity securities | | $ | 8,270 | | | $ | 8,291 | | | $ | 17,588 | | | $ | 18,000 | | | $ | 93,289 | | | $ | 96,640 | | | $ | 139,025 | | | $ | 141,183 | | | $ | 258,172 | | | $ | 264,114 | | | $ | 2,541 | | | $ | 2,561 | | | $ | 26,334 | | | $ | 27,410 | | | $ | 101,867 | | | $ | 108,614 | | | $ | 116,930 | | | $ | 121,554 | | | $ | 247,672 | | | $ | 260,139 | |
Total | | $ | 13,270 | | | $ | 13,288 | | | $ | 37,625 | | | $ | 37,977 | | | $ | 134,682 | | | $ | 137,571 | | | $ | 213,704 | | | $ | 215,608 | | | $ | 399,281 | | | $ | 404,444 | | | $ | 3,543 | | | $ | 3,564 | | | $ | 42,296 | | | $ | 43,492 | | | $ | 161,716 | | | $ | 169,891 | | | $ | 274,369 | | | $ | 280,222 | | | $ | 481,924 | | | $ | 497,169 | |
The following tables show the Company’s investment securities with gross unrealized losses, aggregated by investment category and length of time that individual investment securities have been in a continuous loss position:position at December 31, 2020:
| | December 31, 2019 | | | December 31, 2020 | |
| | Less than 12 months | | | 12 months or longer | | | Total | | | Less than 12 months | | | 12 months or longer | | | Total | |
| | Fair Value | | | Unrealized Losses | | | Fair Value | | | Unrealized Losses | | | Fair Value | | | Unrealized Losses | | | Fair Value | | | Unrealized Losses | | | Fair Value | | | Unrealized Losses | | | Fair Value | | | Unrealized Losses | |
| | (dollars in thousands) | | | (dollars in thousands) | |
Temporarily Impaired Securities | | | | | | | | | | | | | | | | | | | | | | | | | |
Available for sale securities | | | | | | | | | | | | | | | | | | | | | | | | | | | | | | | | | | | | | | | | | | | | | | | | |
U.S. GSE obligations | | $ | 12,912 | | | $ | (88 | ) | | $ | 24,936 | | | $ | (64 | ) | | $ | 37,848 | | | $ | (152 | ) | | $ | 4,981 | | | $ | (19 | ) | | $ | — | | | $ | — | | | $ | 4,981 | | | $ | (19 | ) |
Mortgage-backed securities | | | 33,381 | | | | (265 | ) | | | 50,766 | | | | (593 | ) | | | 84,147 | | | | (858 | ) | | | 91,094 | | | | (384 | ) | | | 944 | | | | (3 | ) | | | 92,038 | | | | (387 | ) |
Corporate debt securities | | | — | | | | — | | | | — | | | | — | | | | — | | | | — | | |
Total available for sale securities | | $ | 46,293 | | | $ | (353 | ) | | $ | 75,702 | | | $ | (657 | ) | | $ | 121,995 | | | $ | (1,010 | ) | | $ | 96,075 | | | $ | (403 | ) | | $ | 944 | | | $ | (3 | ) | | $ | 97,019 | | | $ | (406 | ) |
| | | | | | | | | | | | | | | | | | | | | | | | | | | | | | | | | | | | | | | | | | | | | | | | |
Held to maturity securities | | | | | | | | | | | | | | | | | | | | | | | | | | | | | | | | | | | | | | | | | | | | | | | | |
U.S. GSE obligations | | $ | — | | | $ | — | | | $ | 5,000 | | | $ | — | | | $ | 5,000 | | | $ | — | | |
Mortgage-backed securities | | | 14,838 | | | | (27 | ) | | | 12,928 | | | | (84 | ) | | | 27,766 | | | | (111 | ) | | $ | 16,340 | | | $ | (97 | ) | | $ | — | | | $ | — | | | $ | 16,340 | | | $ | (97 | ) |
Corporate debt securities | | | — | | | | — | | | | — | | | | — | | | | — | | | | — | | |
Municipal securities | | | 4,934 | | | | (66 | ) | | | — | | | | — | | | | 4,934 | | | | (66 | ) | | | 6,221 | | | | (60 | ) | | | — | | | | — | | | | 6,221 | | | | (60 | ) |
Total held to maturity securities | | $ | 19,772 | | | $ | (93 | ) | | $ | 17,928 | | | $ | (84 | ) | | $ | 37,700 | | | $ | (177 | ) | | $ | 22,561 | | | $ | (157 | ) | | $ | — | | | $ | — | | | $ | 22,561 | | | $ | (157 | ) |
Total temporarily impaired securities | | $ | 66,065 | | | $ | (446 | ) | | $ | 93,630 | | | $ | (741 | ) | | $ | 159,695 | | | $ | (1,187 | ) | |
Total | | | $ | 118,636 | | | $ | (560 | ) | | $ | 944 | | | $ | (3 | ) | | $ | 119,580 | | | $ | (563 | ) |
| | December 31, 2018 | |
| | Less than 12 months | | | 12 months or longer | | | Total | |
| | Fair Value | | | Unrealized Losses | | | Fair Value | | | Unrealized Losses | | | Fair Value | | | Unrealized Losses | |
| | (dollars in thousands) | |
Temporarily Impaired Securities | | | | | | | | | | | | | | | | | | | | | | | | |
Available for sale securities | | | | | | | | | | | | | | | | | | | | | | | | |
U.S. GSE obligations | | $ | — | | | $ | — | | | $ | 74,039 | | | $ | (965 | ) | | $ | 74,039 | | | $ | (965 | ) |
Mortgage-backed securities | | | — | | | | — | | | | 86,815 | | | | (3,121 | ) | | | 86,815 | | | | (3,121 | ) |
Corporate debt securities | | | 902 | | | | (98 | ) | | | 3,954 | | | | (61 | ) | | | 4,856 | | | | (159 | ) |
Total available for sale securities | | $ | 902 | | | $ | (98 | ) | | $ | 164,808 | | | $ | (4,147 | ) | | $ | 165,710 | | | $ | (4,245 | ) |
| | | | | | | | | | | | | | | | | | | | | | | | |
Held to maturity securities | | | | | | | | | | | | | | | | | | | | | | | | |
U.S. GSE obligations | | $ | 4,995 | | | $ | (5 | ) | | $ | 27,338 | | | $ | (233 | ) | | $ | 32,333 | | | $ | (238 | ) |
Mortgage-backed securities | | | 30,719 | | | | (216 | ) | | | 93,225 | | | | (2,074 | ) | | | 123,944 | | | | (2,290 | ) |
Corporate debt securities | | | 6,865 | | | | (107 | ) | | | — | | | | — | | | | 6,865 | | | | (107 | ) |
Municipal securities | | | 8,484 | | | | (82 | ) | | | 8,313 | | | | (273 | ) | | | 16,797 | | | | (355 | ) |
Total held to maturity securities | | $ | 51,063 | | | $ | (410 | ) | | $ | 128,876 | | | $ | (2,580 | ) | | $ | 179,939 | | | $ | (2,990 | ) |
Total temporarily impaired securities | | $ | 51,965 | | | $ | (508 | ) | | $ | 293,684 | | | $ | (6,727 | ) | | $ | 345,649 | | | $ | (7,235 | ) |
Securities are
| | December 31, 2019 | |
| | Less than 12 months | | | 12 months or longer | | | Total | |
| | Fair Value | | | Unrealized Losses | | | Fair Value | | | Unrealized Losses | | | Fair Value | | | Unrealized Losses | |
| | (dollars in thousands) | |
Available for sale securities | | | | | | | | | | | | | | | | | | | | | | | | |
U.S. GSE obligations | | $ | 12,912 | | | $ | (88 | ) | | $ | 24,936 | | | $ | (64 | ) | | $ | 37,848 | | | $ | (152 | ) |
Mortgage-backed securities | | | 33,381 | | | | (265 | ) | | | 50,766 | | | | (593 | ) | | | 84,147 | | | | (858 | ) |
Total available for sale securities | | $ | 46,293 | | | $ | (353 | ) | | $ | 75,702 | | | $ | (657 | ) | | $ | 121,995 | | | $ | (1,010 | ) |
| | | | | | | | | | | | | | | | | | | | | | | | |
Held to maturity securities | | | | | | | | | | | | | | | | | | | | | | | | |
U.S. GSE obligations | | $ | — | | | $ | — | | | $ | 5,000 | | | $ | — | | | $ | 5,000 | | | $ | — | |
Mortgage-backed securities | | | 14,838 | | | | (27 | ) | | | 12,928 | | | | (84 | ) | | | 27,766 | | | | (111 | ) |
Municipal securities | | | 4,934 | | | | (66 | ) | | | — | | | | — | | | | 4,934 | | | | (66 | ) |
Total held to maturity securities | | $ | 19,772 | | | $ | (93 | ) | | $ | 17,928 | | | $ | (84 | ) | | $ | 37,700 | | | $ | (177 | ) |
Total temporarily impaired securities | | $ | 66,065 | | | $ | (446 | ) | | $ | 93,630 | | | $ | (741 | ) | | $ | 159,695 | | | $ | (1,187 | ) |
The Company adopted Topic 326 on January 1, 2020 and did not record an allowance for credit losses on its investment securities as of December 31, 2020. The Company regularly reviews debt securities for expected credit loss using both qualitative and quantitative criteria, as necessary based on the composition of the portfolio at period end.
Prior to January 1, 2020, investment securities were evaluated by management for other-than-temporary impairment on at least a quarterly basis, and more frequently when economic or market conditions warrant such evaluation. Consideration is given to: (1) the length of time and the extent to which the fair value has been less than cost; (2) the financial condition and near-term prospects of the issuer; and (3) the intent and ability of the Company to retain its investment in the issuer for a period of time sufficient to allow for any anticipated recovery in fair value.
As of December 31, 2019, 682020, 30 debt securities had gross unrealized losses, with an aggregate depreciation of 0.74%0.47% from the Company’s amortized cost basis. The largest unrealized dollar and percentage loss percentage of any single security was 3.15%2.07%, or $63,000, of its amortized cost. The largest unrealized dollar loss of any single security was $96,000, or 1.93%, of its amortized cost.
As of December 31, 2018, 142 debt securities had gross unrealized losses, with an aggregate depreciation of 2.05% from the Company’s amortized cost basis. The largest unrealized loss percentage of any single security was 9.79%, or $98,000, of its amortized cost. The largest unrealized dollar loss of any single security was $189,000, or 5.34%, of its amortized cost.
The Company believes that the nature and duration of impairment on its debt security positions are primarily a function of interest rate movements and changes in investment spreads and does not consider full repayment of principal on the reported debt obligations to be at risk. Since nearly all of these securities are rated “investment grade” and a) the Company does not intend to sell these securities before recovery and b) that it is more likely than not that the Company will not be required to sell these securities before recovery, the Company does not consider these securities to be other-than-temporarily impaired as of December 31, 2019 and 2018.$55,000.
The following table sets forth information regarding sales of investment securities and the resulting gains or losses from such sales:
| | For the Year Ended December 31, | | | For the Year Ended December 31, | |
| | 2019 | | | 2018 | | | 2017 | | | 2020 | | | 2019 | | | 2018 | |
| | (dollars in thousands) | | | (dollars in thousands) | |
Amortized cost of securities sold | | $ | 26,631 | | | $ | 700 | | | $ | 77,372 | | | $ | 10,752 | | | $ | 26,631 | | | $ | 700 | |
Gain/(loss) realized on securities sold | | | (79 | ) | | | 2 | | | | (3 | ) | |
Gross gains realized on securities sold | | | | 111 | | | | — | | | | 2 | |
Gross losses realized on securities sold | | | | (42 | ) | | | (79 | ) | | | | |
Net proceeds from securities sold | | $ | 26,552 | | | $ | 702 | | | $ | 77,369 | | | $ | 10,821 | | | $ | 26,552 | | | $ | 702 | |
The Company monitors the credit quality of certain debt securities through the use of credit rating among other factors on a quarterly basis. The following table summarizes the credit rating of the Company’s debt securities portfolio at December 31, 2020.
| | December 31, 2020 | |
| | Mortgage- backed Securities | | | Corporate Debt Securities | | | Municipal Securities | | | U.S. GSE obligations | | | Total | |
| | (dollars in thousands) | |
Available for sale securities, at fair value | | | | | | | | | | | | | | | | | | | | |
AAA/AA/A (1) | | $ | 210,630 | | | $ | 1,779 | | | $ | — | | | $ | 23,617 | | | $ | 236,026 | |
BBB/BB/B | | | — | | | | 1,004 | | | | — | | | | — | | | | 1,004 | |
Total available for sale securities | | $ | 210,630 | | | $ | 2,783 | | | $ | — | | | $ | 23,617 | | | $ | 237,030 | |
Held to maturity securities, at amortized cost | | | | | | | | | | | | | | | | | | | | |
AAA/AA/A | | $ | 137,435 | | | $ | 6,989 | | | $ | 102,973 | | | $ | — | | | $ | 247,397 | |
BBB/BB/B | | | — | | | | — | | | | 275 | | | | — | �� | | | 275 | |
Total held to maturity securities | | $ | 137,435 | | | $ | 6,989 | | | $ | 103,248 | | | $ | — | | | $ | 247,672 | |
(1) | Includes Agency mortgage-backed pass-through securities and collateralized mortgage obligations issued by GSEs and U.S. government agencies, such as FNMA, FHLMC, and GNMA that are not rated by Moody’s or S&P. Each security contains a guarantee by the issuing GSE or agency and therefore carries an implicit guarantee of the U.S. government. These have been categorized as AAA/AA/A. |
7. | LOANS AND ALLOWANCE FOR LOANCREDIT LOSSES |
The Company’s lending activities are conducted primarily in Eastern Massachusetts.Massachusetts and Southern New Hampshire. The Company grants single- and multi-family residential loans, commercial & industrial (“C&I”), commercial real estate (“CRE”), construction loans, and a variety of consumer loans. Most of the loans granted by the Company are secured by real estate collateral. Repayment of the Company’s residential loans are generally dependent on the health of the employment market in the borrowers’ geographic areas and that of the general economy with liquidation of the underlying real estate collateral being typically viewed as the primary source of repayment in the event of borrower default. The repayment of C&I loans depends primarily on the cash flow and credit worthiness of the borrower and secondarily on the underlying collateral provided by the borrower. As borrower cash flow may be difficult to predict, liquidation of the underlying collateral securing these loans is typically viewed as the primary source of repayment in the event of borrower default. However, collateral typically consists of equipment, inventory, accounts receivable, or other business assets that may fluctuate in value, so the liquidation of collateral in the event of default is often an insufficient source of repayment. The Company’s CRE loans are primarily made based on the cash flow from the collateral property and secondarily on the underlying collateral provided by the borrower, with liquidation of the underlying real estate collateral typically being viewed as the primary source of repayment in the event of borrower default. The Company’s construction loans are primarily made based on the borrower’s expected ability to execute and the future completed value of the collateral property, with sale of the underlying real estate collateral typically being viewed as the primary source of repayment.
Loans outstanding are detailed by category as follows:
| | December 31, 2019 | | | December 31, 2018 | | | December 31, 2020 | | | December 31, 2019 | |
| | (dollars in thousands) | | | (dollars in thousands) | |
Residential mortgage | | | | | | | | | | | | | | | | |
Mortgages - fixed rate | | $ | 430,877 | | | $ | 293,267 | | | $ | 535,804 | | | $ | 430,877 | |
Mortgages - adjustable rate | | | 467,139 | | | | 309,656 | | | | 734,593 | | | | 467,139 | |
Construction | | | 17,374 | | | | — | | | | 25,495 | | | | 17,374 | |
Deferred costs net of unearned fees | | | 2,176 | | | | 1,408 | | | | 2,976 | | | | 2,176 | |
Total residential mortgages | | | 917,566 | | | | 604,331 | | | | 1,298,868 | | | | 917,566 | |
| | | | | | | | | | | | | | | | |
Commercial mortgage | | | | | | | | | | | | | | | | |
Mortgages - nonowner occupied | | | 870,047 | | | | 654,394 | | |
Mortgages - non-owner occupied | | | | 1,064,317 | | | | 870,047 | |
Mortgages - owner occupied | | | 114,095 | | | | 59,335 | | | | 153,474 | | | | 114,095 | |
Construction | | | 76,288 | | | | 44,146 | | | | 139,075 | | | | 76,288 | |
Deferred costs net of unearned fees | | | 144 | | | | 82 | | | | 2,096 | | | | 144 | |
Total commercial mortgages | | | 1,060,574 | | | | 757,957 | | | | 1,358,962 | | | | 1,060,574 | |
| | | | | | | | | | | | | | | | |
Home equity | | | | | | | | | | | | | | | | |
Home equity - lines of credit | | | 73,880 | | | | 63,421 | | | | 102,460 | | | | 73,880 | |
Home equity - term loans | | | 6,555 | | | | 5,665 | | | | 3,503 | | | | 6,555 | |
Deferred costs net of unearned fees | | | 240 | | | | 250 | | | | 231 | | | | 240 | |
Total home equity | | | 80,675 | | | | 69,336 | | | | 106,194 | | | | 80,675 | |
| | | | | | | | | | | | | | | | |
Commercial & industrial | | | | | | | | | | | | | | | | |
Commercial & industrial | | | 133,337 | | | | 93,728 | | | | 223,415 | | | | 133,337 | |
Deferred costs (fees) net of unearned fees | | | (101 | ) | | | (16 | ) | |
PPP loans | | | | 126,227 | | | | — | |
Unearned fees, net of deferred costs | | | | (1,787 | ) | | | (101 | ) |
Total commercial & industrial | | | 133,236 | | | | 93,712 | | | | 347,855 | | | | 133,236 | |
| | | | | | | | | | | | | | | | |
Consumer | | | | | | | | | | | | | | | | |
Secured | | | 33,453 | | | | 33,252 | | | | 41,409 | | | | 33,453 | |
Unsecured | | | 1,199 | | | | 1,171 | | | | 341 | | | | 1,199 | |
Deferred costs net of unearned fees | | | 25 | | | | 13 | | |
Deferred costs, net of unearned fees | | | | 19 | | | | 25 | |
Total consumer | | | 34,677 | | | | 34,436 | | | | 41,769 | | | | 34,677 | |
Total loans | | $ | 2,226,728 | | | $ | 1,559,772 | | | $ | 3,153,648 | | | $ | 2,226,728 | |
The Coronavirus Aid, Relief, and Economic Security Act, or CARES Act, was signed into law on March 27, 2020, and provided emergency economic relief to individuals and businesses impacted by the novel coronavirus (“COVID-19”) pandemic. The CARES Act authorized the SBA to temporarily guarantee loans under a new 7(a) loan program called the PPP. As a qualified SBA lender, the Company was automatically authorized to originate PPP loans.
An eligible business could apply for a PPP loan up to the lesser of: (1) 2.5 times its average monthly “payroll costs”; or (2) $10.0 million. PPP loans have: (a) an interest rate of 1.0%, (b) a two or five-year loan term to maturity; and (c) principal and interest payments deferred until the SBA remits the forgiven amount to the Company or 10 months from the end of the covered period, as defined. The SBA will guarantee 100% of the PPP loans made to eligible borrowers. The entire principal amount of the borrower’s PPP loan, including any accrued interest, is eligible to be reduced by the loan forgiveness amount under the PPP so long as employee and compensation levels of the business are maintained and 60% of the loan proceeds are used for payroll expense, with the remaining 40% of the loan proceeds used for other qualifying expenses.
Directors and officers of the Company and their associates are customers of, and have other transactions with, the Company in the normal course of business. All loans and commitments included in such transactions were made on substantially the same terms, including interest rates and collateral, as those prevailing at the time for comparable transactions with other persons and do not involve more than normal risk of collection or present other unfavorable features. At December 31, 2019
Asset Quality
The Company’s philosophy toward managing its loan portfolios is predicated upon careful monitoring, which stresses early detection and December 31, 2018, totalresponse to delinquent and default situations. The Company seeks to make arrangements to resolve any delinquent or default situation over the shortest possible time frame. As a general rule, loans outstandingmore than 90 days past due with respect to such directors and officers were $3,000 and $488,000, respectively. Duringprincipal or interest are classified as non-accrual loans. The Company may use discretion regarding other loans over 90 days past due if the year ended December 31, 2019, $85,000loan is well secured and/or in process of additions and $570,000 of repayments and other adjustments were made to these loans. There were $139,000 of additions and $167,000 of repayments during the year ended December 31, 2018. At December 31, 2019 and 2018, all of the loans to directors and officers were performing according to their original terms.collection.
The following tables set forth information regarding non-performing loans disaggregated by loan category:
| | December 31, 2019 | | | December 31, 2020 | |
. | | Residential Mortgages | | | Commercial Mortgages | | | Home Equity | | | Commercial & Industrial | | | Consumer | | | Total | | | Residential Mortgages | | | Commercial Mortgages | | | Home Equity | | | Commercial & Industrial | | | Total | |
| | (dollars in thousands) | | | (dollars in thousands) | |
Non-performing loans: | | | | | | | | | | | | | | | | | | | | | | | | | | | | | | | | | | | | | | | | | | | | |
Non-accrual loans | | $ | 1,298 | | | $ | 2,800 | | | $ | 12 | | | $ | 50 | | | $ | — | | | $ | 4,160 | | | $ | 3,695 | | | $ | 3,917 | | | $ | — | | | $ | 132 | | | $ | 7,744 | |
Loans past due >90 days, but still accruing | | | 527 | | | | 486 | | | | — | | | | 251 | | | | — | | | | 1,264 | | | | — | | | | — | | | | — | | | | 407 | | | | 407 | |
Troubled debt restructurings | | | 99 | | | | — | | | | — | | | | 128 | | | | — | | | | 227 | | | | 689 | | | | — | | | | — | | | | 122 | | | | 811 | |
Total | | $ | 1,924 | | | $ | 3,286 | | | $ | 12 | | | $ | 429 | | | $ | — | | | $ | 5,651 | | | $ | 4,384 | | | $ | 3,917 | | | $ | — | | | $ | 661 | | | $ | 8,962 | |
| | December 31, 2018 | | | December 31, 2019 | |
| | Residential Mortgages | | | Commercial Mortgages | | | Home Equity | | | Commercial & Industrial | | | Consumer | | | Total | | | Residential Mortgages | | | Commercial Mortgages | | | Home Equity | | | Commercial & Industrial | | | Total | |
| | (dollars in thousands) | | | (dollars in thousands) | |
Non-performing loans: | | | | | | | | | | | | | | | | | | | | | | | | | | | | | | | | | | | | | | | | | | | | |
Non-accrual loans | | $ | 512 | | | $ | — | | | $ | 13 | | | $ | — | | | $ | — | | | $ | 525 | | | $ | 1,298 | | | $ | 2,800 | | | $ | 12 | | | $ | 50 | | | $ | 4,160 | |
Loans past due >90 days, but still accruing | | | — | | | | — | | | | — | | | | — | | | | — | | | | — | | | | 527 | | | | 486 | | | | — | | | | 251 | | | | 1,264 | |
Troubled debt restructurings | | | 111 | | | | — | | | | — | | | | 6 | | | | — | | | | 117 | | | | 99 | | | | — | | | | — | | | | 128 | | | | 227 | |
Total | | $ | 623 | | | $ | — | | | $ | 13 | | | $ | 6 | | | $ | — | | | $ | 642 | | | $ | 1,924 | | | $ | 3,286 | | | $ | 12 | | | $ | 429 | | | $ | 5,651 | |
There were no commitmentsIt is the Company’s policy to lend additional funds to borrowers whosereverse any accrued interest when a loan is put on non-accrual status; as such the Company did 0t record any interest income on non-accrual loans were on nonaccrual status atduring the years ended December 31, 20192020 and December 31, 2018.2019.
Troubled Debt Restructurings (“TDRs”)
Loans are considered restructured in a troubled debt restructuring when the Company has granted concessions to a borrower due to the borrower’s financial condition that it otherwise would not have considered. These concessions may include modifications of the terms of the debt such as deferral of payments, extension of maturity, reduction of principal balance, reduction of the stated interest rate other than normal market rate adjustments, or a combination of these concessions. Debt may be bifurcated with separate terms for each tranche of the restructured debt. Restructuring a loan in lieu of aggressively enforcing the collection of the loan may benefit the Company by increasing the ultimate probability of collection.
Restructured loans are classified as accruing or non-accruing based on management’s assessment of the collectability of the loan. Loans which are already on nonaccrualnon-accrual status at the time of the restructuring generally remain on nonaccrualnon-accrual status for approximately six months or longer before management considers such loans for return to accruing status. Accruing restructured loans are placed into nonaccrualnon-accrual status if and when the borrower fails to comply with the restructured terms and management deems it unlikely that the borrower will return to a status of compliance in the near term.
Troubled debt restructurings TDRs are classified as impaired loans. The Company identifies loss allocationsindividually evaluated for impaired loans on an individual loan basis.credit losses.
DuringThere was 1 new TDR during the year ended December 31, 2019, the Company modified one loan2020. At December 31, 2020, 4 loans were determined to be TDRs with a total carrying value of $128,000. At$811,000. There were 0 TDR defaults during the year ended December 31, 2020.
As of December 31, 2019 three3 loans were determined to be TDRs with a total carrying value of $227,000. One TDR loan was paid off during the first quarter of 2019. There were no0 TDR defaults during the year ended December 31, 2019 . 2019.
AsThe allowance for credit losses includes a specific reserve for these TDRs of approximately $90,000 as of December 31, 2018 three loans were determined to be TDRs with a total carrying value of $117,000. There were no TDR defaults during the year ended December 31, 2018.
2020. The allowance for loan losses includesincluded a specific reserve for these TDRs of approximately $87,000 as of December 31, 2019. There were no specific reserves for the troubled debt restructurings at December 31, 2018 .
As of December 31, 20192020 and 2018,2019, there were no significant commitments to lend additional funds to borrowers whose loans were restructured.
Pursuant to Section 4013 of the CARES Act, financial institutions can suspend the requirements under U.S. GAAP related to TDRs for modifications made before December 31, 2020 to loans that were current as of December 31, 2019. On January 3, 2021, the President signed into law the Consolidated Appropriations Act, 2021 (the “Act”). As a result of the Act, the suspension of TDR accounting has been extended to the earlier of January 1, 2022, or the date that is 60 days after the date on which the national emergency concerning the COVID-19 pandemic declared by the President terminates. The requirement that a loan be not more than 30 days past due as of December 31, 2019 is still applicable. In response to the COVID-19 and its economic impact to customers, a short-term modification program that complies with the CARES Act was implemented to provide temporary payment relief to those borrowers directly impacted by COVID-19. The deferred payments along with interest accrued during the deferral period are due and payable on the maturity date. Under recently issued guidance, provided these loans were current as of either year end or the date of the modification, these loans are not considered TDR loans at December 31, 2020 and will not be reported as past due during the deferral period. As of December 31, 2020, the Company had $23.1 million of loans in deferral.
Purchased Credit Deteriorated Loans
As part of the Wellesley merger, the Company purchased loans, for which there was, at acquisition, evidence of more than insignificant deterioration of credit quality since origination. The carrying amount of those loans was $16.9 million at December 31, 2020.
These loans are assessed on a regular basis and subsequent adjustments to the ACL are recorded on the statement of income. On June 1, 2020, the Company acquired PCD loans with a fair value of $18.6 million and total discount of $825,000. In connection with Topic 326, the fair value mark was reduced by $438,000, which represents the ACL amount recorded. The outstanding balance at December 31, 2020 and related allowance on PCD loans is as follows:
| | Loan Balance | | | ACL Balance | |
| | (dollars in thousands) | |
Residential Mortgages | | $ | 558 | | | $ | 10 | |
Commercial Mortgages | | | 15,114 | | | | 300 | |
Home Equity | | | 106 | | | | 3 | |
Commercial & Industrial | | | 1,128 | | | | 37 | |
Consumer loans | | | — | | | | — | |
Total | | $ | 16,906 | | | $ | 350 | |
Loans by Credit Quality Indicator.The following tables contain period-end balances of loans receivable disaggregated by credit quality indicator:
| | Credit Quality Indicator - by Origination Year as of December 31, 2020 | |
| | 2020 | | | 2019 | | | 2018 | | | 2017 | | | 2016 | | | Prior | | | Revolving loans amortized cost basis | | | Total | |
| | (in thousands) | |
Residential: | | | | | | | | | | | | | | | | | | | | | | | | | | | | | | | | |
Current | | $ | 398,267 | | | $ | 221,019 | | | $ | 158,962 | | | $ | 144,256 | | | $ | 106,360 | | | $ | 265,620 | | | $ | — | | | $ | 1,294,484 | |
Non-performing | | | — | | | | — | | | | 782 | | | | 58 | | | | 1,454 | | | | 2,090 | | | | — | | | | 4,384 | |
Total | | | 398,267 | | | | 221,019 | | | | 159,744 | | | | 144,314 | | | | 107,814 | | | | 267,710 | | | | — | | | | 1,298,868 | |
| | | | | | | | | | | | | | | | | | | | | | | | | | | | | | | | |
Home equity: | | | | | | | | | | | | | | | | | | | | | | | | | | | | | | | | |
Current | | $ | 2,131 | | | $ | 6,024 | | | $ | 7,997 | | | $ | 6,976 | | | $ | 2,119 | | | $ | 5,191 | | | $ | 75,756 | | | $ | 106,194 | |
Non-performing | | | — | | | | — | | | | — | | | | — | | | | — | | | | — | | | | — | | | | — | |
Total | | $ | 2,131 | | | $ | 6,024 | | | $ | 7,997 | | | $ | 6,976 | | | $ | 2,119 | | | $ | 5,191 | | | $ | 75,756 | | | $ | 106,194 | |
| | | | | | | | | | | | | | | | | | | | | | | | | | | | | | | | |
Consumer: | | | | | | | | | | | | | | | | | | | | | | | | | | | | | | | | |
Current | | $ | 16,192 | | | $ | 5,819 | | | $ | 3,652 | | | $ | 2,643 | | | $ | 4,879 | | | $ | 8,032 | | | $ | 552 | | | $ | 41,769 | |
Non-performing | | | — | | | | — | | | | — | | | | — | | | | — | | | | — | | | | — | | | | — | |
Total | | $ | 16,192 | | | $ | 5,819 | | | $ | 3,652 | | | $ | 2,643 | | | $ | 4,879 | | | $ | 8,032 | | | $ | 552 | | | $ | 41,769 | |
| | Credit Quality Indicator - by Origination Year as of December 31, 2020 | |
| | 2020 | | | 2019 | | | 2018 | | | 2017 | | | 2016 | | | | | Prior | | | Revolving loans amortized cost basis | | | Revolving loans converted to term | | | Total | |
| | (in thousands) | |
Commercial: | | | | | | | | | | | | | | | | | | | | | | | | | | | | | | | | | | | | | | |
Credit risk profile by internally assigned grade: | | | | | | | | | | | | | | | | | | | | | | | | | | | | | | | | | | | | | | |
1-6 (Pass) | | $ | 282,870 | | | $ | 396,026 | | | $ | 197,473 | | | $ | 106,489 | | | $ | 126,537 | | | | | $ | 221,257 | | | $ | — | | | $ | — | | | $ | 1,330,652 | |
7 (Special Mention) | | | — | | | | 872 | | | | 13,445 | | | | 1,270 | | | | 85 | | | | | | 8,304 | | | | — | | | | — | | | | 23,976 | |
8 (Substandard) | | | — | | | | 145 | | | | — | | | | — | | | | 215 | | | | | | 3,300 | | | | — | | | | — | | | | 3,660 | |
9 (Doubtful) | | | — | | | | — | | | | — | | | | — | | | | — | | | | | | 674 | | | | — | | | | — | | | | 674 | |
10 (Loss) | | | — | | | | — | | | | — | | | | — | | | | — | | | | | | — | | | | — | | | | — | | | | — | |
Total | | $ | 282,870 | | | $ | 397,043 | | | $ | 210,918 | | | $ | 107,759 | | | $ | 126,837 | | | | | $ | 233,535 | | | $ | — | | | $ | — | | | $ | 1,358,962 | |
Commercial & Industrial: | | | | | | | | | | | | | | | | | | | | | | | | | | | | | | | | | | | | | | |
Credit risk profile by internally assigned grade: | | | | | | | | | | | | | | | | | | | | | | | | | | | | | | | | | | | | | | |
1-6 (Pass) | | $ | 210,356 | | | $ | 51,424 | | | $ | 37,286 | | | $ | 23,700 | | | $ | 2,920 | | | | | $ | 7,373 | | | $ | 416 | | | $ | — | | | $ | 333,475 | |
7 (Special Mention) | | | 534 | | | | 3,407 | | | | 3,725 | | | | 420 | | | | 180 | | | | | | 1,001 | | | | 10 | | | | — | | | | 9,277 | |
8 (Substandard) | | | 1,333 | | | | 1,116 | | | | 544 | | | | — | | | | 1,907 | | | | | | 203 | | | | — | | | | — | | | | 5,103 | |
9 (Doubtful) | | | — | | | | — | | | | — | | | | — | | | | — | | | | | | — | | | | — | | | | — | | | | — | |
10 (Loss) | | | — | | | | — | | | | — | | | | — | | | | — | | | | | | — | | | | — | | | | — | | | | — | |
Total | | $ | 212,223 | | | $ | 55,947 | | | $ | 41,555 | | | $ | 24,120 | | | $ | 5,007 | | | | | $ | 8,577 | | | $ | 426 | | | $ | — | | | $ | 347,855 | |
| | December 31, 2019 | |
| | Residential Mortgages | | | Home Equity | | | Consumer | |
| | (dollars in thousands) | |
Credit risk profile based on payment activity: | | | | | | | | | | | | |
Performing | | $ | 915,642 | | | $ | 80,663 | | | $ | 34,677 | |
Non-performing | | | 1,924 | | | | 12 | | | | — | |
Total | | $ | 917,566 | | | $ | 80,675 | | | $ | 34,677 | |
| | | | | | | | | | | | |
| | | | | | Commercial Mortgages | | | Commercial & Industrial | |
Credit risk profile by internally assigned grade: | | | | | | | | | | | | |
1-6 (Pass) | | | | | | $ | 1,050,037 | | | $ | 123,900 | |
7 (Special Mention) | | | | | | | 7,360 | | | | 4,289 | |
8 (Substandard) | | | | | | | 3,177 | | | | 5,047 | |
9 (Doubtful) | | | | | | | — | | | | — | |
10 (Loss) | | | | | | | — | | | | — | |
Total | | | | | | $ | 1,060,574 | | | $ | 133,236 | |
| | December 31, 2018 | |
| | Residential Mortgages | | | Home Equity | | | Consumer | |
| | (dollars in thousands) | |
Credit risk profile based on payment activity: | | | | | | | | | | | | |
Performing | | $ | 603,708 | | | $ | 69,323 | | | $ | 34,436 | |
Non-performing | | | 623 | | | | 13 | | | | — | |
Total | | $ | 604,331 | | | $ | 69,336 | | | $ | 34,436 | |
| | | | | | | | | | | | |
| | | | | | Commercial Mortgages | | | Commercial & Industrial | |
Credit risk profile by internally assigned grade: | | | | | | | | | | | | |
1-6 (Pass) | | | | | | $ | 753,338 | | | $ | 85,821 | |
7 (Special Mention) | | | | | | | 4,619 | | | | 4,186 | |
8 (Substandard) | | | | | | | — | | | | 3,705 | |
9 (Doubtful) | | | | | | | — | | | | — | |
10 (Loss) | | | | | | | — | | | | — | |
Total | | | | | | $ | 757,957 | | | $ | 93,712 | |
With respect to residential real estate mortgages, home equity, and consumer loans, the Bank utilizes the following categories as indicators of credit quality:
Performing – These loans are accruing and are considered having low to moderate risk.
| • | Performing – These loans are accruing and are considered having low to moderate risk. |
Non-performing – These loans are on non-accrual, or are past due more than 90 days but are still accruing, or are restructured. These loans may contain greater than average risk.
| • | Non-performing – These loans are on non-accrual or are past due more than 90 days but are still accruing or are restructured. These loans may contain greater than average risk. |
With respect to commercial real estate mortgages and commercial loans, the Bank utilizes a 10 grade10-grade internal loan rating system as an indicator of credit quality. The grades are as follows:
Loans rated 1-6 (Pass) – These loans are considered “pass” rated with low to moderate risk.
| • | Loans rated 1-6 (Pass) – These loans are considered “pass” rated with low to moderate risk. |
Loans rated 7 (Special Mention) – These loans have potential weaknesses warranting close attention, which, if left uncorrected, may result in deterioration of the credit at some future date.
| • | Loans rated 7 (Special Mention) – These loans have potential weaknesses warranting close attention, which, if left uncorrected, may result in deterioration of the credit at some future date. |
Loans rated 8 (Substandard) – These loans have well-defined weaknesses that jeopardize the orderly liquidation of the debt under the original loan terms. Loss potential exists but is not identifiable in any one customer.
| • | Loans rated 8 (Substandard) – These loans have well-defined weaknesses that jeopardize the orderly liquidation of the debt under the original loan terms. Loss potential exists but is not identifiable in any one customer. |
Loans rated 9 (Doubtful) – These loans have pronounced weaknesses that make full collection highly questionable and improbable.
| • | Loans rated 9 (Doubtful) – These loans have pronounced weaknesses that make full collection highly questionable and improbable. |
Loans rated 10 (Loss) – These loans are considered uncollectible and continuance as a bankable asset is not warranted.
| • | Loans rated 10 (Loss) – These loans are considered uncollectible and continuance as a bankable asset is not warranted. |
Delinquencies
The past due status of a loan is determined in accordance with its contractual repayment terms. All loan types are reported past due when one scheduled payment is due and unpaid for 30 days or more. Loan delinquencies can be attributed to many factors, such as but not limited to, a continuing weakness in, or deteriorating, economic conditions in the region in which the collateral is located, the loss of a tenant or lower lease rates for commercial borrowers, or the loss of income for consumers and the resulting liquidity impacts on the borrowers.
The following tables contain period-end balances of loans receivable disaggregated by past due status:
| | | December 31, 2020 | |
| | December 31, 2019 | | | 30-59 Days | | | 60-89 Days | | | 90 Days or greater | | | Total Past Due | | | Current Loans | | | Total | | | Amortized Cost 90+ Days and Accruing | |
| | 30-59 Days Past Due | | | 60-89 Days Past Due | | | 90 Days or Greater | | | Total Past Due | | | Current Loans | | | Total | | | (dollars in thousands) | | | | | |
| | (dollars in thousands) | | | | | | | | | | | | | | | | | | | | | | | | | | | | | |
Residential Mortgages | | $ | 8,710 | | | $ | 1,089 | | | $ | 1,047 | | | $ | 10,846 | | | $ | 906,720 | | | $ | 917,566 | | | $ | 12,647 | | | $ | 2,450 | | | $ | 2,335 | | | $ | 17,432 | | | $ | 1,281,436 | | | $ | 1,298,868 | | | $ | — | |
Commercial Mortgages | | | 811 | | | | — | | | | 3,161 | | | | 3,972 | | | | 1,056,602 | | | | 1,060,574 | | | | 1,080 | | | | — | | | | 674 | | | | 1,754 | | | | 1,357,208 | | | | 1,358,962 | | | | — | |
Home Equity | | | 57 | | | | 12 | | | | — | | | | 69 | | | | 80,606 | | | | 80,675 | | | | 843 | | | | 353 | | | | — | | | | 1,196 | | | | 104,998 | | | | 106,194 | | | | — | |
Commercial & Industrial | | | 272 | | | | 226 | | | | 251 | | | | 749 | | | | 132,487 | | | | 133,236 | | | | 276 | | | | 1,917 | | | | 409 | | | | 2,602 | | | | 345,253 | | | | 347,855 | | | | 407 | |
Consumer loans | | | 4 | | | | 5 | | | | — | | | | 9 | | | | 34,668 | | | | 34,677 | | | | 3,120 | | | | — | | | | — | | | | 3,120 | | | | 38,649 | | | | 41,769 | | | | — | |
Total | | $ | 9,854 | | | $ | 1,332 | | | $ | 4,459 | | | $ | 15,645 | | | $ | 2,211,083 | | | $ | 2,226,728 | | | $ | 17,966 | | | $ | 4,720 | | | $ | 3,418 | | | $ | 26,104 | | | $ | 3,127,544 | | | $ | 3,153,648 | | | $ | 407 | |
| | December 31, 2018 | | | December 31, 2019 | |
| | 30-59 Days Past Due | | | 60-89 Days Past Due | | | 90 Days or Greater | | | Total Past Due | | | Current Loans | | | Total | | | 30-59 Days Past Due | | | 60-89 Days Past Due | | | 90 Days or Greater | | | Total Past Due | | | Current Loans | | | Total | | | Amortized Cost 90+ Days and Accruing | |
| | (dollars in thousands) | | | (dollars in thousands) | |
Residential Mortgages | | $ | 1,034 | | | $ | 121 | | | $ | 351 | | | $ | 1,506 | | | $ | 602,825 | | | $ | 604,331 | | | $ | 8,710 | | | $ | 1,089 | | | $ | 1,047 | | | $ | 10,846 | | | $ | 906,720 | | | $ | 917,566 | | | $ | 527 | |
Commercial Mortgages | | | — | | | | — | | | | — | | | | — | | | | 757,957 | | | | 757,957 | | | | 811 | | | | — | | | | 3,161 | | | | 3,972 | | | | 1,056,602 | | | | 1,060,574 | | | | 486 | |
Home Equity | | | — | | | | — | | | | — | | | | — | | | | 69,336 | | | | 69,336 | | | | 57 | | | | 12 | | | | — | | | | 69 | | | | 80,606 | | | | 80,675 | | | | — | |
Commercial & Industrial | | | — | | | | — | | | | — | | | | — | | | | 93,712 | | | | 93,712 | | | | 272 | | | | 226 | | | | 251 | | | | 749 | | | | 132,487 | | | | 133,236 | | | | 251 | |
Consumer loans | | | 108 | | | | — | | | | — | | | | 108 | | | | 34,328 | | | | 34,436 | | | | 4 | | | | 5 | | | | — | | | | 9 | | | | 34,668 | | | | 34,677 | | | | — | |
Total | | $ | 1,142 | | | $ | 121 | | | $ | 351 | | | $ | 1,614 | | | $ | 1,558,158 | | | $ | 1,559,772 | | | $ | 9,854 | | | $ | 1,332 | | | $ | 4,459 | | | $ | 15,645 | | | $ | 2,211,083 | | | $ | 2,226,728 | | | $ | 1,264 | |
There were no0 significant commitments to lend additional funds to borrowers whose loans were on nonaccrualnon-accrual status at December 31, 2019.
Foreclosure Proceedings
Other Real Estate Owned (“OREO”)
As of December 31, 2019, the Company recorded other real estate owned assets of $163,000. OREO consists of real estate properties, which have primarily served as collateral to secure loans that are controlled or owned by the Bank. These properties are recorded at fair value less estimated costs to sell at the date control is established, resulting in a new cost basis. The amount by which the recorded investment in the loan exceeds the fair value (net of estimated costs to sell) of the foreclosed asset is charged to the allowance for loan losses. Subsequent declines in the fair value of the foreclosed asset below the new cost basis are recorded through the use of a valuation allowance. Subsequent increases in the fair value are recorded as reductions in the valuation allowance, but not below zero. All costs incurred thereafter in maintaining the property are generally charged to noninterest expense.2020.
In Process of Foreclosure
As of December 31, 2019 and 2018 loans secured by one- to four-family residential property amounting to $344,000 and $351,000, respectively, were in process of foreclosure.
Impaired Loans
Impaired loans are loans for which it is probable that the Company will not be able to collect all amounts due according to the contractual terms of the loan agreements and loans restructured in a troubled debt restructuring. The recorded investment in impaired loans consists of unpaid principal balance, net of charge-offs, interest payments received applied to principal, and unamortized deferred loan origination fees and costs.
The following is information pertaining to impaired loans:
| | For the Year Ended December 31, 2019 | |
| | Carrying Value | | | Average Carrying Value | | | Unpaid Principal Balance | | | Related Allowance | | | Interest Income Recognized | |
| | (dollars in thousands) | |
With no required reserve recorded: | | | | | | | | | | | | | | | | | | | | |
Commercial and industrial | | $ | — | | | $ | — | | | $ | — | | | $ | — | | | $ | — | |
Commercial mortgage | | | 3,161 | | | | 1,385 | | | | 4,376 | | | | — | | | | 35 | |
Residential mortgage | | | 765 | | | | 691 | | | | 940 | | | | — | | | | 5 | |
Home equity | | | 93 | | | | 96 | | | | 133 | | | | — | | | | 1 | |
Total | | | 4,019 | | | | 2,172 | | | | 5,449 | | | | — | | | | 41 | |
With required reserve recorded: | | | | | | | | | | | | | | | | | | | | |
Commercial and industrial | | | 128 | | | | 59 | | | | 167 | | | | 87 | | | | — | |
Commercial mortgage | | | — | | | | — | | | | — | | | | — | | | | — | |
Residential mortgage | | | — | | | | — | | | | — | | | | — | | | | — | |
Home equity | | | — | | | | — | | | | — | | | | — | | | | — | |
Total | | | 128 | | | | 59 | | | | 167 | | | | 87 | | | | — | |
Total: | | | | | | | | | | | | | | | | | | | | |
Commercial and industrial | | | 128 | | | | 59 | | | | 167 | | | | 87 | | | | — | |
Commercial mortgage | | | 3,161 | | | | 1,385 | | | | 4,376 | | | | — | | | | 35 | |
Residential mortgage | | | 765 | | | | 691 | | | | 940 | | | | — | | | | 5 | |
Home equity | | | 93 | | | | 96 | | | | 133 | | | | — | | | | 1 | |
Total | | $ | 4,147 | | | $ | 2,231 | | | $ | 5,616 | | | $ | 87 | | | $ | 41 | |
| | For the Year Ended December 31, 2018 | |
| | Carrying Value | | | Average Carrying Value | | | Unpaid Principal Balance | | | Related Allowance | | | Interest Income Recognized | |
| | (dollars in thousands) | |
With no required reserve recorded: | | | | | | | | | | | | | | | | | | | | |
Commercial and industrial | | $ | 6 | | | $ | 17 | | | $ | 6 | | | $ | — | | | $ | 1 | |
Commercial mortgage | | | — | | | | — | | | | — | | | | — | | | | — | |
Residential mortgage | | | 634 | | | | 647 | | | | 786 | | | | — | | | | 4 | |
Home equity | | | 100 | | | | 104 | | | | 135 | | | | — | | | | 1 | |
Total | | | 740 | | | | 768 | | | | 927 | | | | — | | | | 6 | |
With required reserve recorded: | | | | | | | | | | | | | | | | | | | | |
Commercial and industrial | | | — | | | | — | | | | — | | | | — | | | | — | |
Commercial mortgage | | | — | | | | — | | | | — | | | | — | | | | — | |
Residential mortgage | | | — | | | | — | | | | — | | | | — | | | | — | |
Home equity | | | — | | | | — | | | | — | | | | — | | | | — | |
Total | | | — | | | | — | | | | — | | | | — | | | | — | |
Total: | | | | | | | | | | | | | | | | | | | | |
Commercial and industrial | | | 6 | | | | 17 | | | | 6 | | | | — | | | | 1 | |
Commercial mortgage | | | — | | | | — | | | | — | | | | — | | | | — | |
Residential mortgage | | | 634 | | | | 647 | | | | 786 | | | | — | | | | 4 | |
Home equity | | | 100 | | | | 104 | | | | 135 | | | | — | | | | 1 | |
Total | | $ | 740 | | | $ | 768 | | | $ | 927 | | | $ | — | | | $ | 6 | |
| | For the Year Ended December 31, 2017 | |
| | Carrying Value | | | Average Carrying Value | | | Unpaid Principal Balance | | | Related Allowance | | | Interest Income Recognized | |
| | (dollars in thousands) | |
With no required reserve recorded: | | | | | | | | | | | | | | | | | | | | |
Commercial and industrial | | $ | 29 | | | $ | 36 | | | $ | 29 | | | $ | — | | | $ | 2 | |
Commercial mortgage | | | 213 | | | | 224 | | | | 227 | | | | — | | | | 3 | |
Residential mortgage | | | 904 | | | | 931 | | | | 1,103 | | | | — | | | | — | |
Home equity | | | 86 | | | | 91 | | | | 116 | | | | — | | | | — | |
Total | | | 1,232 | | | | 1,282 | | | | 1,475 | | | | — | | | | 5 | |
With required reserve recorded: | | | | | | | | | | | | | | | | | | | | |
Commercial and industrial | | | — | | | | — | | | | — | | | | — | | | | — | |
Commercial mortgage | | | — | | | | — | | | | — | | | | — | | | | — | |
Residential mortgage | | | 64 | | | | 66 | | | | 64 | | | | 93 | | | | 1 | |
Home equity | | | — | | | | — | | | | — | | | | — | | | | — | |
Total | | | 64 | | | | 66 | | | | 64 | | | | 93 | | | | 1 | |
Total: | | | | | | | | | | | | | | | | | | | | |
Commercial and industrial | | | 29 | | | | 36 | | | | 29 | | | | — | | | | 2 | |
Commercial mortgage | | | 213 | | | | 224 | | | | 227 | | | | — | | | | 3 | |
Residential mortgage | | | 968 | | | | 997 | | | | 1,167 | | | | 93 | | | | 1 | |
Home equity | | | 86 | | | | 91 | | | | 116 | | | | — | | | | — | |
Total | | $ | 1,296 | | | $ | 1,348 | | | $ | 1,539 | | | $ | 93 | | | $ | 6 | |
Allowance for LoanCredit Losses
The Company maintains an allowance for loan losses in an amount determined by management on the basis of the character of the loans, loan performance, financial condition of borrowers, the value of collateral securing loans, and other relevant factors. We provide for loan losses based upon the consistent application of our documented allowance for loan loss methodology. All loan losses are charged to the allowance for loan losses and all recoveries are credited to it. Additions to the allowance for loan losses are provided by charges to income based on various factors which, in our judgment, deserve current recognition in estimating probable losses. We regularly review the loan portfolio, including a review of our classified assets, and make provisions for loan losses in order to maintain the allowance for loan losses in accordance with GAAP. The allowance for loan losses consists primarily of two components:
| 1.
| Specific allowances established for impaired loans, as defined by GAAP. The amount of impairment provided for as a specific allowance is measured based on the deficiency, if any, between the present value of expected future cash flows discounted at the loan’s effective interest rate at the time of impairment or, as a practical expedient, at the loan’s observable market price, or the fair value of the collateral if the loan is collateral-dependent, and the carrying value of the loan; and
|
| 2.
| General allowances established for loan losses on a portfolio basis for loans that do not meet the definition of impaired loans. The portfolio is grouped into homogenous pools by similar risk characteristics, primarily by loan type and regulatory classification. We apply an estimated incurred loss rate to each loan group. The loss rates applied are based upon our historical loss experience over a designated look back period adjusted, as appropriate, for the quantitative, qualitative, and environmental factors discussed below. This evaluation is inherently subjective, as it requires material estimates that may be susceptible to significant revisions based upon changes in economic and real estate market conditions.
|
Actual loan losses may be significantly more than the allowance for loan losses we have established, which could have a material negative effect on our financial results.
The adjustments to historical loss experience are based on our evaluation of several quantitative, qualitative, and environmental factors, including:
the loss emergence period, which represents the average amount of time between when loss events occur for specific loan types and when such problem loans are identified and the related loss amounts are confirmed through charge-offs;
changes in any concentration of credit (including, but not limited to, concentrations by geography, industry, or collateral type);
changes in the number and amount of non-accrual loans and past due loans;
changes in national, state, and local economic trends;
changes in the types of loans in the loan portfolio;
changes in the experience and ability of personnel;
changes in lending strategies; and
changes in lending policies and procedures.
In addition, we may establish an unallocated allowance to provide for probable losses that have been incurred as of the reporting date but are not reflected in the allocated allowance.
We evaluate the allowance for loan losses based upon the combined total of the specific and general components. Generally, when the loan portfolio increases, absent other factors, the allowance for loan loss methodology results in a higher dollar amount of estimated probable losses than would be the case without the increase. Generally, when the loan portfolio decreases, absent other factors, the allowance for loan losses methodology results in a lower dollar amount of estimated probable losses than would be the case without the decrease. Periodically, management conducts an analysis to estimate the loss emergence period for various loan categories based on samples of historical charge-offs. Model output by loan category is reviewed to evaluate the reasonableness of the reserve levels in comparison to the estimated loss emergence period applied to historical loss experience.
We evaluate the loan portfolio on a quarterly basis and the allowance is adjusted accordingly. While we use the best information available to make evaluations, future adjustments to the allowance may be necessary if conditions differ substantially from the information used in making the evaluations. In addition, various regulatory agencies, as an integral part of their examination process, will periodically review the allowance for loan losses. Such agencies may require us to recognize additions to the allowance based on their analysis of information available to them at the time of their examination.
The following tables contain changes in the allowance for loancredit losses disaggregated by loan type for the periods noted:category:
| | For the Year Ended December 31, 2019 | | | For the Year Ended December 31, 2020 | |
| | Residential Mortgages | | | Commercial Mortgages | | | Home Equity | | | Commercial & Industrial | | | Consumer | | | Impaired | | | Total | | | Residential Mortgages | | | Commercial Mortgages | | | Home Equity | | | Commercial & Industrial | | | Consumer | | | Unfunded Commitments | | | Total | |
| | (dollars in thousands) | | | (dollars in thousands) | |
Allowance for loan losses: | | | | | | | | | | | | | | | | | | | | | | | | | | | | | |
Balance at December 31, 2018 | | $ | 4,946 | | | $ | 9,626 | | | $ | 517 | | | $ | 1,415 | | | $ | 264 | | | $ | — | | | $ | 16,768 | | |
Allowance for credit loss: | | | | | | | | | | | | | | | | | | | | | | | | | | | | | |
Allowance for credit losses - loan portfolio: | | | | | | | | | | | | | | | | | | | | | | | | | | | | | |
Balance at December 31, 2019 | | | $ | 5,141 | | | $ | 10,905 | | | $ | 461 | | | $ | 1,475 | | | $ | 198 | | | $ | — | | | $ | 18,180 | |
Adoption of ASC 326 | | | | 2,061 | | | | (1,447 | ) | | | (205 | ) | | | (492 | ) | | | 288 | | | | — | | | | 205 | |
Provision for acquired loans | | | | 2,880 | | | | 3,625 | | | | 188 | | | | 1,577 | | | | 12 | | | | — | | | | 8,282 | |
Initial allowance for PCD | | | | 35 | | | | 382 | | | | — | | | | 20 | | | | — | | | | — | | | | 437 | |
Charge-offs | | | — | | | | (1,270 | ) | | | — | | | | (338 | ) | | | (48 | ) | | | — | | | | (1,656 | ) | | | — | | | | (264 | ) | | | — | | | | (400 | ) | | | (40 | ) | | | — | | | | (704 | ) |
Recoveries | | | — | | | | — | | | | — | | | | 53 | | | | 11 | | | | — | | | | 64 | | | | — | | | | — | | | | — | | | | 250 | | | | 15 | | | | — | | | | 265 | |
Provision for (Release of) | | | 195 | | | | 2,549 | | | | (56 | ) | | | 258 | | | | (29 | ) | | | 87 | | | | 3,004 | | |
Provision for (Release of)-loan portfolio | | | | 2,950 | | | | 5,363 | | | | 108 | | | | 879 | | | | 51 | | | | — | | | | 9,351 | |
Allowance for credit losses - loan portfolio | | | $ | 13,067 | | | $ | 18,564 | | | $ | 552 | | | $ | 3,309 | | | $ | 524 | | | $ | — | | | $ | 36,016 | |
Allowance for credit losses - unfunded commitments: | | | | | | | | | | | | | | | | | | | | | | | | | | | | | |
Balance at December 31, 2019 | | $ | 5,141 | | | $ | 10,905 | | | $ | 461 | | | $ | 1,388 | | | $ | 198 | | | $ | 87 | | | $ | 18,180 | | | $ | — | | | $ | — | | | $ | — | | | $ | — | | | $ | — | | | $ | 50 | | | $ | 50 | |
Adoption of ASC 326 | | | | — | | | | — | | | | — | | | | — | | | | — | | | | 276 | | | | 276 | |
Acquired loan commitments | | | | — | | | | — | | | | — | | | | — | | | | — | | | | 356 | | | | 356 | |
Provision for - unfunded commitments | | | | — | | | | — | | | | — | | | | — | | | | — | | | | 322 | | | | 322 | |
Allowance for credit losses-unfunded commitments | | | | — | | | | — | | | | — | | | | — | | | | — | | | | 1,004 | | | | 1,004 | |
Total allowance for credit loss | | | $ | 13,067 | | | $ | 18,564 | | | $ | 552 | | | $ | 3,309 | | | $ | 524 | | | $ | 1,004 | | | $ | 37,020 | |
| | For the Year Ended December 31, 2019 | |
| | Residential Mortgages | | | Commercial Mortgages | | | Home Equity | | | Commercial & Industrial | | | Consumer | | | Impaired | | | Total | |
| | (dollars in thousands) | |
Allowance for loan losses: | | | | | | | | | | | | | | | | | | | | | | | | | | | | |
Balance at December 31, 2018 | | $ | 4,946 | | | $ | 9,626 | | | $ | 517 | | | $ | 1,415 | | | $ | 264 | | | $ | — | | | $ | 16,768 | |
Charge-offs | | | — | | | | (1,270 | ) | | | — | | | | (338 | ) | | | (48 | ) | | | — | | | | (1,656 | ) |
Recoveries | | | — | | | | — | | | | — | | | | 53 | | | | 11 | | | | — | | | | 64 | |
Provision for (Release of) | | | 195 | | | | 2,549 | | | | (56 | ) | | | 258 | | | | (29 | ) | | | 87 | | | | 3,004 | |
Balance at December 31, 2019 | | $ | 5,141 | | �� | $ | 10,905 | | | $ | 461 | | | $ | 1,388 | | | $ | 198 | | | $ | 87 | | | $ | 18,180 | |
| | For the Year Ended December 31, 2018 | |
| | Residential Mortgages | | | Commercial Mortgages | | | Home Equity | | | Commercial & Industrial | | | Consumer | | | Impaired | | | Total | |
| | (dollars in thousands) | |
Allowance for loan losses: | | | | | | | | | | | | | | | | | | | | | | | | | | | | |
Balance at December 31, 2017 | | $ | 5,047 | | | $ | 8,289 | | | $ | 630 | | | $ | 946 | | | $ | 315 | | | $ | 93 | | | $ | 15,320 | |
Charge-offs | | | — | | | | — | | | | — | | | | (73 | ) | | | (36 | ) | | | — | | | | (109 | ) |
Recoveries | | | — | | | | — | | | | — | | | | 48 | | | | 7 | | | | — | | | | 55 | |
Provision for (Release of) | | | (101 | ) | | | 1,337 | | | | (113 | ) | | | 494 | | | | (22 | ) | | | (93 | ) | | | 1,502 | |
Balance at December 31, 2018 | | $ | 4,946 | | | $ | 9,626 | | | $ | 517 | | | $ | 1,415 | | | $ | 264 | | | $ | — | | | $ | 16,768 | |
| | For the Year Ended December 31, 2017 | |
| | Residential Mortgages | | | Commercial Mortgages | | | Home Equity | | | Commercial & Industrial | | | Consumer | | | Impaired | | | Total | |
| | (dollars in thousands) | |
Allowance for loan losses: | | | | | | | | | | | | | | | | | | | | | | | | | | | | |
Balance at December 31, 2016 | | $ | 4,898 | | | $ | 8,451 | | | $ | 651 | | | $ | 807 | | | $ | 264 | | | $ | 190 | | | $ | 15,261 | |
Charge-offs | | | — | | | | — | | | | — | | | | (284 | ) | | | (39 | ) | | | — | | | | (323 | ) |
Recoveries | | | — | | | | — | | | | — | | | | 13 | | | | 7 | | | | — | | | | 20 | |
Provision for (Release of) | | | 149 | | | | (162 | ) | | | (21 | ) | | | 410 | | | | 83 | | | | (97 | ) | | | 362 | |
Balance at December 31, 2017 | | $ | 5,047 | | | $ | 8,289 | | | $ | 630 | | | $ | 946 | | | $ | 315 | | | $ | 93 | | | $ | 15,320 | |
The following tables contain period-end balances of the allowance for loan losses and related loans receivable disaggregated by impairment method:
| | December 31, 2019 | |
| | Residential Mortgages | | | Commercial Mortgages | | | Home Equity | | | Commercial & Industrial | | | Consumer | | | Total | |
| | (dollars in thousands) | |
Allowance for loan losses | | | | | | | | | | | | | | | | | | | | | | | | |
Individually evaluated for impairment | | $ | — | | | $ | — | | | $ | — | | | $ | 87 | | | $ | — | | | $ | 87 | |
Collectively evaluated for impairment | | | 5,141 | | | | 10,905 | | | | 461 | | | | 1,388 | | | | 198 | | | | 18,093 | |
Total | | $ | 5,141 | | | $ | 10,905 | | | $ | 461 | | | $ | 1,475 | | | $ | 198 | | | $ | 18,180 | |
| | | | | | | | | | | | | | | | | | | | | | | | |
Loans receivable | | | | | | | | | | | | | | | | | | | | | | | | |
Individually evaluated for impairment | | $ | 764 | | | $ | 3,161 | | | $ | 92 | | | $ | 128 | | | $ | — | | | $ | 4,145 | |
Collectively evaluated for impairment | | | 916,802 | | | | 1,057,413 | | | | 80,583 | | | | 133,108 | | | | 34,677 | | | | 2,222,583 | |
Total | | $ | 917,566 | | | $ | 1,060,574 | | | $ | 80,675 | | | $ | 133,236 | | | $ | 34,677 | | | $ | 2,226,728 | |
The following is information pertaining to impaired loans:
| | December 31, 2018 | |
| | Residential Mortgages | | | Commercial Mortgages | | | Home Equity | | | Commercial & Industrial | | | Consumer | | | Total | |
| | (dollars in thousands) | |
Allowance for loan losses | | | | | | | | | | | | | | | | | | | | | | | | |
Individually evaluated for impairment | | $ | — | | | $ | — | | | $ | — | | | $ | — | | | $ | — | | | $ | — | |
Collectively evaluated for impairment | | | 4,946 | | | | 9,626 | | | | 517 | | | | 1,415 | | | | 264 | | | | 16,768 | |
Total | | $ | 4,946 | | | $ | 9,626 | | | $ | 517 | | | $ | 1,415 | | | $ | 264 | | | $ | 16,768 | |
| | | | | | | | | | | | | | | | | | | | | | | | |
Loans receivable | | | | | | | | | | | | | | | | | | | | | | | | |
Individually evaluated for impairment | | $ | 647 | | | $ | — | | | $ | 88 | | | $ | 5 | | | $ | — | | | $ | 740 | |
Collectively evaluated for impairment | | | 603,684 | | | | 757,957 | | | | 69,248 | | | | 93,707 | | | | 34,436 | | | | 1,559,032 | |
Total | | $ | 604,331 | | | $ | 757,957 | | | $ | 69,336 | | | $ | 93,712 | | | $ | 34,436 | | | $ | 1,559,772 | |
| | For the Year Ended December 31, 2019 | |
| | Carrying Value | | | Average Carrying Value | | | Unpaid Principal Balance | | | Related Allowance | | | Interest Income Recognized | |
| | (dollars in thousands) | |
With no required reserve recorded: | | | | | | | | | | | | | | | | | | | | |
Commercial mortgage | | $ | 3,161 | | | $ | 1,385 | | | $ | 4,376 | | | $ | — | | | $ | 35 | |
Residential mortgage | | | 765 | | | | 691 | | | | 940 | | | | — | | | | 5 | |
Home equity | | | 93 | | | | 96 | | | | 133 | | | | — | | | | 1 | |
Total | | | 4,019 | | | | 2,172 | | | | 5,449 | | | | — | | | | 41 | |
With required reserve recorded: | | | | | | | | | | | | | | | | | | | | |
Commercial and industrial | | | 128 | | | | 59 | | | | 167 | | | | 87 | | | | — | |
Total | | | 128 | | | | 59 | | | | 167 | | | | 87 | | | | — | |
Total: | | | | | | | | | | | | | | | | | | | | |
Commercial and industrial | | | 128 | | | | 59 | | | | 167 | | | | 87 | | | | — | |
Commercial mortgage | | | 3,161 | | | | 1,385 | | | | 4,376 | | | | — | | | | 35 | |
Residential mortgage | | | 765 | | | | 691 | | | | 940 | | | | — | | | | 5 | |
Home equity | | | 93 | | | | 96 | | | | 133 | | | | — | | | | 1 | |
Total | | $ | 4,147 | | | $ | 2,231 | | | $ | 5,616 | | | $ | 87 | | | $ | 41 | |
As discussed in Note 2, Summary of Significant Accounting Policies, the provision for loan losses is evaluated on a periodic basis by management in order to determine the adequacy of the allowance for loan losses.
8. | FEDERAL HOME LOAN BANK OF BOSTON STOCK |
As a voluntary member of the FHLB of Boston, the Bank is required to invest in stock of the FHLB of Boston (which is considered a restricted equity security) in an amount based upon its outstanding advances from the FHLB of Boston. At December 31, 20192020 and December 31, 2018,2019, the Bank’s investment in FHLB of Boston stock totaled $7.9$5.7 million and $6.8$7.9 million, respectively. No market exists for shares of this stock. The Bank’s cost for FHLB of Boston stock is equal to its par value. Upon redemption of the stock, which is at the discretion of the FHLB of Boston, the Bank would receive an amount equal to the par value of the stock. At its discretion, the FHLB of Boston may also declare dividends on its stock.
The Bank’s investment in FHLB of Boston stock is reviewed for impairment at each reporting date based on the ultimate recoverability of the cost basis of the stock. As of December 31, 2020 and 2019, and December 31, 2018, no0 impairment has been recognized.
9. | BANKING PREMISES AND EQUIPMENT |
A summary of the cost and accumulated depreciation and amortization of property, leasehold improvements, and equipment is presented below:
| | December 31, | | | Estimated | | December 31, | | | Estimated |
| | 2019 | | | 2018 | | | Useful Lives | | 2020 | | | 2019 | | | Useful Lives |
| | (dollars in thousands) | | | | | (dollars in thousands) | | | |
Land | | $ | 1,116 | | | $ | 1,116 | | | | | $ | 1,516 | | | $ | 1,116 | | | |
Building and leasehold improvements | | | 17,817 | | | | 12,175 | | | 3-30 years | | | 20,017 | | | | 17,817 | | | 3-30 years |
Equipment, including vaults | | | 13,686 | | | | 11,613 | | | 3-20 years | | | 17,097 | | | | 13,686 | | | 3-20 years |
Work in process | | | 550 | | | | 84 | | | | | | 138 | | | | 550 | | | |
Subtotal | | | 33,169 | | | | 24,988 | | | | | | 38,768 | | | | 33,169 | | | |
Accumulated depreciation and amortization | | | (18,413 | ) | | | (16,410 | ) | | | | | (20,610 | ) | | | (18,413 | ) | | |
Total | | $ | 14,756 | | | $ | 8,578 | | | | | $ | 18,158 | | | $ | 14,756 | | | |
Total depreciation expense for the years ended December 31, 2020, 2019, 2018, and 20172018 amounted to approximately$2.5 million, $2.0 million, $1.9 million and $1.9 million, respectively, and is included in occupancy and equipment expenses in the accompanying consolidated statements of income.
10. | GOODWILL AND OTHER INTANGIBLE ASSETS |
Goodwill. At December 31, 20192020 and 2018,2019, the carrying value of goodwill, which is included in other assets, totaled $31.2$51.9 million and $412,000,$31.2 million, respectively. Goodwill is tested for impairment, based on its fair value, at least annually. As of December 31, 2020 and 2019, and 2018, no0 goodwill impairment has been recognized.
Core deposit intangibles. The Company recorded an asset for the core deposit intangible (“CDI”)CDI of $3.6 million related to the Optima merger. Amortization of CDI assets totaled $270,000 $361,000 and $271,000 for the twelve monthsyears ended December 31, 2019. As of2020 and 2019, respectively. At December 31, 2020 and 2019, the carrying value of CDI assets totaled $3.0 million and $3.3 million, .respectively. The weighted-average remaining amortization period for CDI was approximately nine8.3 years at December 31, 2019.2020.
Mortgage servicing rights. Periodically, the Company sells certain residential mortgage loans to the secondary market. Generally, these loans are sold without recourse or other credit enhancements.
The Company sells loans and either releases or retains the servicing rights. For loans sold with servicing rights retained, we providethe Company provides the servicing for the loans on a per-loan fee basis. Mortgage loans sold and servicing rights retained during the years ended December 31, 2020, 2019, and 2018 and 2017 were $60.5 million, $82.9 million, and $1.6 million, and $11.9 million, respectively, with net gains recognized in gain on loan sales of $685,000, $36,000, and $182,000, respectively.
An analysis of mortgage servicing rights, which are included in other assets, follows:
| | Mortgage Servicing Rights | | | Valuation Allowance | | | Total | | | Mortgage Servicing Rights | | | Valuation Allowance | | | Total | |
| | (dollars in thousands) | | | (dollars in thousands) | |
Balance at December 31, 2016 | | $ | 842 | | | $ | (30 | ) | | $ | 812 | | |
Mortgage servicing rights capitalized | | | 132 | | | | — | | | | 132 | | |
Amortization charged against servicing income | | | (151 | ) | | | — | | | | (151 | ) | |
Change in impairment reserve | | | — | | | | — | | | | — | | |
Balance at December 31, 2017 | | $ | 823 | | | $ | (30 | ) | | $ | 793 | | | $ | 823 | | | $ | (30 | ) | | $ | 793 | |
| | | | | | | | | | | | | |
Mortgage servicing rights capitalized | | | 20 | | | | — | | | | 20 | | | | 20 | | | | — | | | | 20 | |
Amortization charged against servicing income | | | (147 | ) | | | — | | | | (147 | ) | | | (147 | ) | | | — | | | | (147 | ) |
Change in impairment reserve | | | (30 | ) | | | 30 | | | | — | | | | (30 | ) | | | 30 | | | | — | |
Balance at December 31, 2018 | | $ | 666 | | | $ | — | | | $ | 666 | | | $ | 666 | | | $ | — | | | $ | 666 | |
| | | | | | | | | | | | | | | | | | | | | | | | |
Balance at December 31, 2018 | | | $ | 666 | | | $ | — | | | $ | 666 | |
Mortgage servicing rights acquired as a result of the merger | | | 334 | | | | — | | | | 334 | | | | 334 | | | | — | | | | 334 | |
Mortgage servicing rights capitalized | | | 618 | | | | — | | | | 618 | | | | 618 | | | | — | | | | 618 | |
Amortization charged against servicing income | | | (271 | ) | | | — | | | | (271 | ) | | | (271 | ) | | | — | | | | (271 | ) |
Change in impairment reserve | | | — | | | | (26 | ) | | | (26 | ) | | | — | | | | (26 | ) | | | (26 | ) |
Balance at December 31, 2019 | | $ | 1,347 | | | $ | (26 | ) | | $ | 1,321 | | | $ | 1,347 | | | $ | (26 | ) | | $ | 1,321 | |
| | | | | | | | | | | | | |
Balance at December 31, 2019 | | | $ | 1,347 | | | $ | (26 | ) | | $ | 1,321 | |
Mortgage servicing rights acquired as a result of the merger | | | | 50 | | | | — | | | | 50 | |
Mortgage servicing rights capitalized | | | | 536 | | | | — | | | | 536 | |
Amortization charged against servicing income | | | | (572 | ) | | | — | | | | (572 | ) |
Change in impairment reserve | | | | — | | | | (116 | ) | | | (116 | ) |
Balance at December 31, 2020 | | | $ | 1,361 | | | $ | (142 | ) | | $ | 1,219 | |
The fair value of ourthe Company’s mortgage servicing rights (“MSR”) portfolio was $1.5$1.2 million and $1.0$1.5 million as of December 31, 2020 and 2019, and 2018.respectively. The fair value of mortgage servicing rights is estimated based on the present value of expected cash flows, incorporating assumptions for discount rate, prepayment speed, and servicing cost.
The weighted-average amortization period for mortgage servicing rights portfolio was 5.23.3 years and 7.55.2 years at December 31, 20192020 and December 31, 2018,2019, respectively.
The estimated aggregate future amortization expense for mortgage servicing rights for each of the next five years and thereafter is as follows:
| | Future Amortization Expense | | | Future Amortization Expense | |
| | (dollars in thousands) | | | (dollars in thousands) | |
2020 | | $ | 202 | | |
2021 | | | 166 | | | $ | 370 | |
2022 | | | 135 | | | | 281 | |
2023 | | | 110 | | | | 205 | |
2024 | | | 89 | | | | 147 | |
2025 | | | | 82 | |
Thereafter | | | 619 | | | | 134 | |
Total | | $ | 1,321 | | | $ | 1,219 | |
Deposits are summarized as follows:
| | December 31, 2019 | | | December 31, 2018 | | | December 31, 2020 | | | December 31, 2019 | |
| | (dollars in thousands) | | | (dollars in thousands) | |
Demand deposits (non-interest bearing) | | $ | 630,593 | | | $ | 494,492 | | | $ | 1,006,132 | | | $ | 630,593 | |
Interest bearing checking | | | 450,098 | | | | 431,702 | | | | 625,650 | | | | 450,098 | |
Money market | | | 181,406 | | | | 135,585 | | | | 532,218 | | | | 181,406 | |
Savings | | | 914,499 | | | | 628,212 | | | | 984,262 | | | | 914,499 | |
Retail certificates of deposit under $100,000 | | | 56,602 | | | | 36,223 | | |
Retail certificates of deposit $100,000 or greater | | | 118,596 | | | | 57,692 | | |
Retail certificates of deposit under $250,000 | | | | 127,202 | | | | 113,940 | |
Retail certificates of deposit $250,000 or greater | | | | 96,831 | | | | 61,258 | |
Wholesale certificates of deposit | | | 7,084 | | | | 27,504 | | | | 30,788 | | | | 7,084 | |
Total deposits | | $ | 2,358,878 | | | $ | 1,811,410 | | | $ | 3,403,083 | | | $ | 2,358,878 | |
Certificates of deposit had the following schedule of maturities:
| | December 31, 2019 | | | December 31, 2018 | |
| | (dollars in thousands) | |
Less than 3 months remaining | | $ | 52,883 | | | $ | 24,219 | |
3 to 5 months remaining | | | 47,701 | | | | 17,486 | |
6 to 11 months remaining | | | 38,981 | | | | 37,987 | |
12 to 23 months remaining | | | 31,501 | | | | 28,529 | |
24 to 47 months remaining | | | 9,448 | | | | 9,652 | |
48 months or more remaining | | | 1,768 | | | | 3,546 | |
Total certificates of deposit | | $ | 182,282 | | | $ | 121,419 | |
| | December 31, 2020 | | | December 31, 2019 | |
| | (dollars in thousands) | |
2020 | | $ | — | | | $ | 140,938 | |
2021 | | | 215,206 | | | | 30,240 | |
2022 | | | 23,006 | | | | 6,426 | |
2023 | | | 11,997 | | | | 3,071 | |
2024 | | | 2,156 | | | | 1,607 | |
2025 | | | 2,456 | | | | — | |
Total certificates of deposit | | $ | 254,821 | | | $ | 182,282 | |
Interest expense on retail certificates of deposit $100,000 or greater was $2.1 million, $467,000, and $446,000 for the years ended December 31, 2019, 2018, and 2017, respectively.
The aggregate amount of certificates of deposit in denominations that meet or exceed the FDIC insurance limit of $250,000 at December 31, 2019 and 2018 was $60.8 million and $31.8 million, respectively.
Related Party Deposits
Deposit accounts of directors, executive officers, and their respective affiliates totaled $7.2 $7.7million and $6.8$7.2 million as of December 31, 20192020 and 2018,2019, respectively.
Information relating toFederal Home Loan Bank Advances
At December 31, 2020 and 2019, the Company had $15.0 million and $135.7 million of short-term borrowings is presented below:advances outstanding from the FHLB of Boston, with a weighted average rate of 2.14% and 2.31%, respectively.
| | For the Year Ended December 31, | |
| | 2019 | | | 2018 | |
| | (dollars in thousands) | |
FHLB of Boston short-term advances | | | | | | | | |
Ending balance | | $ | 135,691 | | | $ | 90,000 | |
Average daily balance | | | 84,414 | | | | 15,183 | |
Highest month-end balance | | | 135,691 | | | | 90,000 | |
Weighted average interest rate | | | 2.31 | % | | | 2.47 | % |
Information relating to long-term borrowings from the FHLB of Boston is presented below:
| | December 31, 2019 | | | December 31, 2018 | |
| | Amount | | | Rate | | | Amount | | | Rate | |
| | (dollars in thousands) | |
FHLB of Boston long-term advances | | | | | | | | | | | | | | | | |
Due 09/01/2020; amortizing | | $ | — | | | | 0.00 | % | | $ | 3,409 | | | | 1.94 | % |
| | December 31, 2020 | | |
| | Amount | | | Rate | | |
| | (dollars in thousands) | | |
2022 | | $ | 595 | | | | 1.84 | | % |
2023* | | | 17,240 | | | | 3.61 | | |
| | $ | 17,835 | | | | 3.55 | | % |
*Includes a $15 million advance with an interest rate of 3.80%, that is callable by the FHLB of Boston on January 27, 2021.
There were no long-term borrowings outstanding at December 31, 2019.
Federal Reserve Bank PPP Loan Facility (“PPPLF”) Advances
During the year ended December 31, 2020, in order to fund a portion of the Company’s PPP loan originations, the Company borrowed $85.4 million from the Federal Reserve Bank’s PPPLF, which carried a rate of 0.35% fixed for the term of the corresponding PPP loan. The Company pledged eligible PPP loans as collateral for the borrowings. At December 31, 2020, all of the Company’s borrowings under the PPPLF were repaid.
Subordinated Debt
In the fourth quarter of 2020, the Company redeemed $10.0 million in subordinated debt, bearing a 6.0% coupon, which was assumed as part of the Wellesley merger.
Unused Borrowing Capacity with the FHLB of Boston and FRB Boston
All short- and long-term borrowings with the FHLB of Boston are secured by the Bank’sCompany’s stock in the FHLB of Boston and a blanket lien on “qualified collateral” defined principally as 95% of the market value of certain U.S. Government and GSE obligations and 75% of the carrying value of certain residential mortgage loans. Based upon collateral pledged, the Bank’s unused borrowing capacity with the FHLB of Boston at December 31, 20192020 was approximately $345.5$672.0 million.
The BankCompany also has a line of credit with the FRB Boston. At December 31, 2020 and 2019, and 2018, the BankCompany had pledged commercial real estate and commercial & industrial loans with aggregate principal balances of approximately $316.4$734.3 million and $291.7$316.4 million, respectively, as collateral for this line of credit. Based upon the collateral pledged, the Bank’sCompany’s unused borrowing capacity with the FRB Boston at December 31, 20192020 and 20182019 was approximately $134.9$562.4 million and $167.5$134.9 million, respectively.
In accordance with the Tax Cuts and Jobs Act of 2017, the Company’s statutory federal tax rate decreased from 35% to 21% effective January 1, 2018. The change in tax law required a one-time non-cash write down of our net deferred tax assets of $3.9 million in 2017.
The components of income tax expense were as follows:
| | For the Year Ended December 31, | | | For the Year Ended December 31, | |
| | 2019 | | | 2018 | | | 2017 | | | 2020 | | | 2019 | | | 2018 | |
| | (dollars in thousands) | | | (dollars in thousands) | |
Current | | | | | | | | | | | | | |
Current tax expense | | | | | | | | | | | | | |
Federal | | $ | 5,954 | | | $ | 5,524 | | | $ | 8,446 | | | $ | 7,877 | | | $ | 5,954 | | | $ | 5,524 | |
State | | | 2,597 | | | | 2,404 | | | | 2,225 | | | | 4,192 | | | | 2,597 | | | | 2,404 | |
| | | 8,551 | | | | 7,928 | | | | 10,671 | | | | 12,069 | | | | 8,551 | | | | 7,928 | |
| | | | | | | | | | | | | | | | | | | | | | | | |
Deferred | | | | | | | | | | | | | |
Deferred tax expense (benefit) | | | | | | | | | | | | | |
Federal | | | (63 | ) | | | (490 | ) | | | 2,948 | | | | (250 | ) | | | (63 | ) | | | (490 | ) |
State | | | 173 | | | | (231 | ) | | | (261 | ) | | | (415 | ) | | | 173 | | | | (231 | ) |
Total deferred | | | 110 | | | | (721 | ) | | | 2,687 | | |
| | | | (665 | ) | | | 110 | | | | (721 | ) |
Total income tax expense | | $ | 8,661 | | | $ | 7,207 | | | $ | 13,358 | | | $ | 11,404 | | | $ | 8,661 | | | $ | 7,207 | |
The following is a reconciliation of the total income tax provision,expense, calculated at statutory federal income tax rates, to the income tax provision in the consolidated statements of income:
| | For the Year Ended December 31, | | | For the Year Ended December 31, | | |
| | 2019 | | | Rate | | | 2018 | | | Rate | | | 2017 | | | Rate | | | 2020 | | | | 2019 | | | | 2018 | | |
| | (dollars in thousands) | | | Dollars | | | Rate | | | | Dollars | | | Rate | | | | Dollars | | | Rate | | |
Provision at statutory rates | | $ | 7,123 | | | | 21.00 | % | | $ | 6,528 | | | | 21.00 | % | | $ | 9,861 | | | | 35.00 | % | |
| | | (dollars in thousands) | | |
Income tax expense at statutory rates | | | $ | 9,106 | | | | 21.0 | | % | | $ | 7,123 | | | | 21.0 | | % | | $ | 6,528 | | | | 21.0 | | % |
Increase/(decrease) resulting from: | | | | | | | | | | | | | | | | | | | | | | | | | | | | | | | | | | | | | | | | | | | | | | | | | | | |
State tax, net of federal tax benefit | | | 2,188 | | | | 6.45 | | | | 1,717 | | | | 5.52 | | | | 1,277 | | | | 4.53 | | | | 2,984 | | | | 6.9 | | | | | 2,188 | | | | 6.5 | | | | | 1,717 | | | | 5.5 | | |
Tax-exempt income | | | (599 | ) | | | (1.77 | ) | | | (580 | ) | | | (1.87 | ) | | | (1,079 | ) | | | (3.83 | ) | | | (694 | ) | | | (1.6 | ) | | | | (599 | ) | | | (1.8 | ) | | | | (580 | ) | | | (1.9 | ) | |
ESOP dividends | | | (124 | ) | | | (0.37 | ) | | | (127 | ) | | | (0.41 | ) | | | (216 | ) | | | (0.77 | ) | | | (125 | ) | | | (0.3 | ) | | | | (124 | ) | | | (0.4 | ) | | | | (127 | ) | | | (0.4 | ) | |
Bank owned life insurance | | | (129 | ) | | | (0.38 | ) | | | (140 | ) | | | (0.45 | ) | | | (205 | ) | | | (0.73 | ) | | | (157 | ) | | | (0.4 | ) | | | | (129 | ) | | | (0.4 | ) | | | | (140 | ) | | | (0.5 | ) | |
Compensation limited under 162(m) | | | | 511 | | | | 1.2 | | | | | — | | | | — | | | | | — | | | | — | | |
Benefit from stock compensation | | | (150 | ) | | | (0.44 | ) | | | (168 | ) | | | (0.54 | ) | | | (190 | ) | | | (0.67 | ) | | | — | | | | — | | | | | (150 | ) | | | (0.4 | ) | | | | (168 | ) | | | (0.5 | ) | |
Non-deductible Acquisition Costs | | | 236 | | | | 0.70 | | | | — | | | | — | | | | — | | | | — | | |
Impact of Tax Cuts and Jobs Act | | | — | | | | — | | | | — | | | | — | | | | 3,870 | | | | 13.74 | | |
Non-deductible acquisition Costs | | | | 186 | | | | 0.4 | | | | | 236 | | | | 0.7 | | | | | — | | | | — | | |
Impact of CARES Act | | | | (539 | ) | | | (1.2 | ) | | | | — | | | | — | | | | | — | | | | — | | |
Other | | | 116 | | | | 0.34 | | | | (23 | ) | | | (0.07 | ) | | | 40 | | | | 0.15 | | | | 132 | | | | 0.3 | | | | | 116 | | | | 0.3 | | | | | (23 | ) | | | (0.1 | ) | |
Total income tax expense | | $ | 8,661 | | | | 25.53 | % | | $ | 7,207 | | | | 23.18 | % | | $ | 13,358 | | | | 47.42 | % | | $ | 11,404 | | | | 26.3 | | % | | $ | 8,661 | | | | 25.5 | | % | | $ | 7,207 | | | | 23.2 | | % |
The Coronavirus Aid, Relief, and Economic Security (the “CARES Act”) was signed into law on March 27, 2020, to help stimulate the United States economy. One of the business tax provisions of the CARES Act included allowing net operating losses (“NOL”) generated by the Company in tax years 2018 and 2019 to be carried back up to five years at the tax rates in effect during those periods, rather than carried forward at current federal tax rates of 21%. The effect of the Act allowed the Company to recognize lower tax
expense associated with NOL carryforwards from 2018 and 2019 (as a result of the Optima merger) and resulted in a benefit of $539,000.
The Company’s 20192020 and 20182019 net deferred tax assets were measured using a27.92% and 27.86% and 28.11% tax rate, respectively, and consisted of the following components:
| | December 31, 2019 | | | December 31, 2018 | | | December 31, 2020 | | | December 31, 2019 | |
| | (dollars in thousands) | | | (dollars in thousands) | |
Gross deferred tax assets | | | | | | | | | | | | | | | | |
Allowance for loan losses | | $ | 5,029 | | | $ | 4,715 | | |
Allowance for credit losses | | | $ | 10,336 | | | $ | 5,029 | |
Accrued retirement benefits | | | 1,592 | | | | 2,082 | | | | 1,576 | | | | 1,592 | |
Unrealized losses on AFS securities | | | 171 | | | | 957 | | |
Unrealized losses on available for sale securities | | | | — | | | | 171 | |
Incentive compensation | | | 1,248 | | | | 1,189 | | | | 1,591 | | | | 1,248 | |
Equity based compensation | | | 1,034 | | | | 849 | | | | 1,343 | | | | 1,034 | |
Lease Liability | | | 9,765 | | | | 333 | | |
Lease liability | | | | 10,455 | | | | 9,765 | |
ESOP dividends | | | 165 | | | | 169 | | | | 166 | | | | 165 | |
Loss carryforwards as a result of the Optima merger | | | 877 | | | | — | | | | 21 | | | | 877 | |
Intangibles (merger related) | | | 472 | | | | — | | |
Intangibles / Fair value marks (merger related) | | | | 1,971 | | | | 472 | |
Other | | | 252 | | | | 155 | | | | 205 | | | | 252 | |
Total gross deferred tax assets | | | 20,605 | | | | 10,449 | | | | 27,664 | | | | 20,605 | |
| | | | | | | | | | | | | | | | |
Gross deferred tax liabilities | | | | | | | | | | | | | | | | |
Deferred loan origination costs | | | (911 | ) | | | (459 | ) | | | (1,434 | ) | | | (911 | ) |
Unrealized gains on available for sale securities | | | | (641 | ) | | | — | |
Depreciation of premises and equipment | | | (1,021 | ) | | | (678 | ) | | | (1,816 | ) | | | (1,021 | ) |
Right of Use Asset | | | (9,356 | ) | | | — | | |
Right of use asset | | | | (9,751 | ) | | | (9,356 | ) |
Mortgage servicing rights | | | (368 | ) | | | (187 | ) | | | (340 | ) | | | (368 | ) |
Goodwill | | | (113 | ) | | | (114 | ) | | | (115 | ) | | | (113 | ) |
Derivative transactions | | | (607 | ) | | | (294 | ) | | | (1,928 | ) | | | (607 | ) |
Total gross deferred tax liabilities | | | (12,376 | ) | | | (1,732 | ) | | | (16,025 | ) | | | (12,376 | ) |
Net deferred tax asset | | $ | 8,229 | | | $ | 8,717 | | | $ | 11,639 | | | $ | 8,229 | |
It is management’s belief that it is more likely than not that the reversal of deferred tax liabilities and results of future operations will generate sufficient taxable income to realize the deferred tax assets. Therefore, no0 valuation allowance was required at either December 31, 20192020 and 20182019 for the deferred tax assets. It should be noted, however, that factors beyond management’s control, such as the general state of the economy and real estate values, can affect future levels of taxable income and that no assurance can be given that sufficient taxable income will be generated in future periods to fully absorb deductible temporary differences.
At December 31, 20192020 and 2018,2019, the Company had no0 unrecognized tax benefits or any uncertain tax positions. The Company does not expect the total amount of unrecognized tax benefits to significantly increase in the next 12 months.
The Company’s federal income tax returns are open and subject to examination from the 20162017 tax return year and forward. The Company’s state income tax returns are open from the 20162017 and later tax return years based on individual statestates’ statute of limitations.
On January 1, 2017, The Company adopted Accounting Standards Update No. 2016-09 - “Improvements to Employee Share-Based Payment Accounting” (“ASU 2016-09”). ASU 2016-09 requires that excess tax benefits or tax deficiencies be recognized as income tax benefit or expense in earnings in the period that they occur. During the year ended December 31, 2019, 2018, and 2017, the Company recognized a tax benefit of $199,000, $225,000, and $221,000 respectively.
14. | PENSION AND RETIREMENT PLANS |
The Company has a noncontributory, defined benefit pension plan (“Pension Plan”) covering substantially all employees hired before May 2, 2011. Employees in positions requiring at least 1,000 hours of service per year were eligible to participate upon the attainment of age 21 and the completion of 12 months of service. Benefits are based primarily on years of service and the employee’s average monthly pay during the five highest consecutive plan years of the employee’s final ten years. On October 23, 2017, the Company announced its decision to freeze the accrual of benefits within the Pension Plan, effective December 31, 2017. The Company also provides supplemental retirement benefits to certain current and former executive officers of the Company under the terms of Supplemental Executive Retirement Agreements (“Supplemental Retirement Plan”). Prior to 2016, the Company provided individual non-qualified defined benefit supplemental executive retirement plans (“DB SERPs”) to certain executives. The DB SERPs generally provide for an annual benefit payable in equal monthly installments following the executive’s retirement and continuing for at least the remainder of his or her lifetime, with such annual benefit generally based on the executive’s years of service and his or her highest three consecutive years of base salary and bonus. In 2016, the Company’s Board discontinued the use of DB SERPs for new entrants
to the Company’s non-qualified retirement programs. Instead, new entrants are provided with individual non-qualified defined
contribution supplemental executive retirement plans (“DC SERPs”). Under the DC SERPs, the Company may contribute an amount equal to 10% of the executive’s base salary and bonus to his or her account under the Company’s non-qualified deferred compensation plan, the Executive Deferred Compensation Plan. The Company also offers postretirement health care benefits for current and future retirees of the Bank. Certain employees receive a fixed monthly benefit at age 65 toward the purchase of postretirement medical coverage. The benefit received is based on the employee’s years of active service. Effective November 7, 2019, the postretirement health care plan was frozen for employees hired after that date. The Company uses a December 31st measurement date each year to determine the benefit obligations for these plans.
Projected benefit obligations and funded status were as follows:
| | Pension Plan | | | Supplemental Retirement Plan | | | Pension Plan | | | Supplemental Retirement Plan | |
| | 2019 | | | 2018 | | | 2019 | | | 2018 | | | 2020 | | | 2019 | | | 2020 | | | 2019 | |
| | (dollars in thousands) | | | (dollars in thousands) | |
Change in projected benefit obligation | | | | | | | | | | | | | | | | | | | | | | | | | | | | | | | | |
Obligation at beginning of year | | $ | 40,522 | | | $ | 43,943 | | | $ | 8,830 | | | $ | 9,204 | | | $ | 45,401 | | | $ | 40,522 | | | $ | 9,622 | | | $ | 8,830 | |
Service cost | | | — | | | | — | | | | 283 | | | | 354 | | | | — | | | | — | | | | 355 | | | | 283 | |
Interest cost | | | 1,680 | | | | 1,557 | | | | 349 | | | | 309 | | | | 1,438 | | | | 1,680 | | | | 283 | | | | 349 | |
Actuarial loss/(gain) | | | 4,670 | | | | (3,659 | ) | | | 770 | | | | (499 | ) | |
Actuarial loss | | | | 4,827 | | | | 4,670 | | | | 840 | | | | 770 | |
Benefits paid | | | (1,471 | ) | | | (1,319 | ) | | | (610 | ) | | | (538 | ) | | | (1,549 | ) | | | (1,471 | ) | | | (595 | ) | | | (610 | ) |
Obligation at end of year | | | 45,401 | | | | 40,522 | | | | 9,622 | | | | 8,830 | | | | 50,117 | | | | 45,401 | | | | 10,505 | | | | 9,622 | |
Change in plan assets | | | | | | | | | | | | | | | | | | | | | | | | | | | | | | | | |
Fair value at beginning of year | | | 42,648 | | | | 45,247 | | | | — | | | | — | | | | 50,131 | | | | 42,648 | | | | — | | | | — | |
Actual return on plan assets | | | 8,954 | | | | (1,280 | ) | | | — | | | | — | | | | 7,220 | | | | 8,954 | | | | — | | | | — | |
Employer contribution | | | — | | | | — | | | | 610 | | | | 538 | | | | — | | | | — | | | | 595 | | | | 610 | |
Benefits paid | | | (1,471 | ) | | | (1,319 | ) | | | (610 | ) | | | (538 | ) | | | (1,549 | ) | | | (1,471 | ) | | | (595 | ) | | | (610 | ) |
Fair value at end of year | | | 50,131 | | | | 42,648 | | | | — | | | | — | | | | 55,802 | | | | 50,131 | | | | — | | | | — | |
Funded status at end of year | | $ | 4,730 | | | $ | 2,126 | | | $ | (9,622 | ) | | $ | (8,830 | ) | | $ | 5,685 | | | $ | 4,730 | | | $ | (10,505 | ) | | $ | (9,622 | ) |
The discount rate used to calculate the benefit obligation for the 2020 fiscal year was 2.46%, as compared to 3.22%, for the 2019 fiscal year. This discount rate decrease was the primary source of the increase in the benefit obligation during the year.
| | Pension Plan | | | Supplemental Retirement Plan | |
| | 2020 | | | 2019 | | | 2020 | | | 2019 | |
| | (dollars in thousands) | |
Accumulated benefit obligation | | | 50,117 | | | | 45,401 | | | | 9,909 | | | | 9,207 | |
Amounts recognized in the consolidated balance sheets consisted of:
| | Pension Plan | | | Supplemental Retirement Plan | |
| | 2019 | | | 2018 | | | 2019 | | | 2018 | |
| | (dollars in thousands) | |
Other assets/(liabilities) | | $ | 4,730 | | | $ | 2,126 | | | $ | (9,622 | ) | | $ | (8,830 | ) |
| | Pension Plan | | | Supplemental Retirement Plan | |
| | 2020 | | | 2019 | | | 2020 | | | 2019 | |
| | (dollars in thousands) | |
Other assets/(liabilities) | | $ | 5,685 | | | $ | 4,730 | | | $ | (10,505 | ) | | $ | (9,622 | ) |
Amounts recognized in accumulated other comprehensive lossincome (loss) consisted of:
| | Pension Plan | | | Supplemental Retirement Plan | |
| | 2019 | | | 2018 | | | 2019 | | | 2018 | |
| | (dollars in thousands) | |
Net actuarial loss/(gain) | | $ | 3,709 | | | $ | 5,427 | | | $ | 1,128 | | | $ | 358 | |
Prior service (benefit) | | | (7 | ) | | | (12 | ) | | | — | | | | — | |
Total | | $ | 3,702 | | | $ | 5,415 | | | $ | 1,128 | | | $ | 358 | |
Certain disaggregated information related to our retirement plans were as follows:
| | Pension Plan | | | Supplemental Retirement Plan | |
| | 2019 | | | 2018 | | | 2019 | | | 2018 | |
| | (dollars in thousands) | |
Projected benefit obligation | | $ | 45,401 | | | $ | 40,522 | | | $ | 9,622 | | | $ | 8,830 | |
Accumulated benefit obligation | | | 45,401 | | | | 40,522 | | | | 9,207 | | | | 8,567 | |
Fair value of plan assets | | | 50,131 | | | | 42,648 | | | | — | | | | — | |
Funded status at end of year | | | 4,730 | | | | 2,126 | | | | (9,622 | ) | | | (8,830 | ) |
| | Pension Plan | | | Supplemental Retirement Plan | |
| | 2020 | | | 2019 | | | 2020 | | | 2019 | |
| | (dollars in thousands) | |
Net actuarial loss | | $ | 4,517 | | | $ | 3,709 | | | $ | 1,959 | | | $ | 1,128 | |
Prior service credit | | | (3 | ) | | | (7 | ) | | | — | | | | — | |
Total | | $ | 4,514 | | | $ | 3,702 | | | $ | 1,959 | | | $ | 1,128 | |
The components of net periodic benefit cost and amounts recognized in other comprehensive income/ (loss)income were as follows:
| | Pension Plan | | | Supplemental Retirement Plan | | | Pension Plan | | | Supplemental Retirement Plan | |
| | 2019 | | | 2018 | | | 2019 | | | 2018 | | | 2020 | | | 2019 | | | 2020 | | | 2019 | |
| | (dollars in thousands) | | | (dollars in thousands) | |
Net periodic benefit cost | | | | | | | | | | | | | | | | | | | | | | | | | | | | | | | | |
Service cost | | $ | — | | | $ | — | | | $ | 283 | | | $ | 354 | | | $ | — | | | $ | — | | | $ | 355 | | | $ | 283 | |
Interest cost | | | 1,680 | | | | 1,557 | | | | 349 | | | | 309 | | | | 1,438 | | | | 1,680 | | | | 283 | | | | 349 | |
Expected return on assets | | | (2,721 | ) | | | (2,891 | ) | | | — | | | | — | | | | (3,201 | ) | | | (2,721 | ) | | | — | | | | — | |
Amortization of prior service credit | | | (4 | ) | | | (4 | ) | | | — | | | | — | | | | (4 | ) | | | (4 | ) | | | — | | | | — | |
Amortization of net actuarial loss/(gain) | | | 154 | | | | 106 | | | | — | | | | 4 | | |
Amortization of net actuarial loss | | | | — | | | | 154 | | | | 8 | | | | — | |
Net periodic benefit cost | | | (891 | ) | | | (1,232 | ) | | | 632 | | | | 667 | | | | (1,767 | ) | | | (891 | ) | | | 646 | | | | 632 | |
Amounts recognized in other comprehensive income/( loss) | | | | | | | | | | | | | | | | | |
Amounts recognized in other comprehensive income | | | | | | | | | | | | | | | | | |
Net actuarial loss/(gain) | | | (1,563 | ) | | | 512 | | | | 770 | | | | (499 | ) | | | 807 | | | | (1,563 | ) | | | 840 | | | | 770 | |
Amortization of prior service credit | | | 4 | | | | 4 | | | | | | | | (4 | ) | | | 4 | | | | 4 | | | | — | | | | | |
Amortization of net actuarial gain | | | (154 | ) | | | (106 | ) | | | — | | | | — | | |
Total recognized in other comprehensive income/( loss) | | | (1,713 | ) | | | 410 | | | | 770 | | | | (503 | ) | |
Total recognized in net periodic benefit cost and other comprehensive income/( loss) | | $ | (2,604 | ) | | $ | (822 | ) | | $ | 1,402 | | | $ | 164 | | |
Amortization of net actuarial loss | | | | — | | | | (154 | ) | | | (8 | ) | | | — | |
Total recognized in other comprehensive income | | | | 811 | | | | (1,713 | ) | | | 832 | | | | 770 | |
Total recognized in net periodic benefit cost and other comprehensive income | | | $ | (956 | ) | | $ | (2,604 | ) | | $ | 1,478 | | | $ | 1,402 | |
Weighted-average assumptions used to determine projected benefit obligations are as follows:
| | Pension Plan | | | Supplemental Retirement Plan | | | Pension Plan | | | Supplemental Retirement Plan | |
| | 2019 | | | 2018 | | | 2019 | | | 2018 | | | 2020 | | | 2019 | | | 2020 | | | 2019 | |
Discount rate | | | 3.22 | % | | | 4.23 | % | | | 3.04 | % | | | 4.10 | % | | | 2.45 | % | | | 3.22 | % | | | 2.21 | % | | | 3.04 | % |
Rate of compensation increase | | N/A | | | N/A | | | | 4.00 | % | | | 4.00 | % | | N/A | | | N/A | | | | 4.00 | % | | | 4.00 | % |
Weighted-average assumptions used to determine net periodic benefit cost are as follows:
| | Pension Plan | | | Supplemental Retirement Plan | | | Pension Plan | | | Supplemental Retirement Plan | |
| | 2019 | | | 2018 | | | 2019 | | | 2018 | | | 2020 | | | 2019 | | | 2020 | | | 2019 | |
Discount rate | | | 4.23 | % | | | 3.58 | % | | | 4.10 | % | | | 3.39 | % | | | 3.22 | % | | | 4.23 | % | | | 3.04 | % | | | 4.10 | % |
Expected long-term return on plan assets | | | 6.50 | % | | | 6.50 | % | | N/A | | | N/A | | | | 6.50 | % | | | 6.50 | % | | N/A | | | N/A | |
Rate of compensation increase | | N/A | | | N/A | | | | 4.00 | % | | | 4.00 | % | | N/A | | | N/A | | | | 4.00 | % | | | 4.00 | % |
To develop the expected long-term rate of return on assets assumption for the Pension Plan, the Company considered the historical returns and the future expectations for returns for each asset class, as well as target asset allocations of the pension portfolio. Based on this analysis, the Company selected 6.50% as the long-term rate of return on asset assumption.
The Company maintains an Investment Policy for its Pension Plan. The objective of this policy is to seek a balance between capital appreciation, current income, and preservation of capital, with a longer termlonger-term weighting towards equities because of the extended time horizon of the Pension Plan.
The Investment Policy guidelines suggest that the target asset allocation percentages are from 30% to 60% in domestic large cap equities, from 5% to 20% in domestic small/mid cap equities, from 0% to 20% in international equities, and from 20% to 50%60% in cash and fixed income.
The Company’s Pension Plan weighted-average asset allocations by asset category were as follows:
| | December 31, | | | December 31, | |
| | 2019 | | | 2018 | | | 2020 | | | 2019 | |
Equity securities | | | 53 | % | | | 60 | % | | | 42 | % | | | 53 | % |
Debt securities | | | 36 | | | | 35 | | | | 46 | | | | 36 | |
Other | | | 3 | | | | 1 | | | | 9 | | | | 3 | |
Cash and equivalents | | | 8 | | | | 4 | | | | 3 | | | | 8 | |
Total | | | 100 | % | | | 100 | % | | | 100 | % | | | 100 | % |
The three broad levels of fair values used to measure the Pension Plan assets are as follows:
Level 1 – Quoted prices for identical assets in active markets.
| • | Level 1 – Quoted prices for identical assets in active markets. |
Level 2 – Quoted prices for similar assets in active markets; quoted prices for identical or similar assets in inactive markets; and model-derived valuations in which all significant inputs and significant value drivers are observable in active markets.
| • | Level 2 – Quoted prices for similar assets in active markets; quoted prices for identical or similar assets in inactive markets; and model-derived valuations in which all significant inputs and significant value drivers are observable in active markets. |
Level 3 – Valuations derived from techniques in which one or more significant inputs or significant value drivers are unobservable in the markets and which reflect the Company’s market assumptions.
| • | Level 3 – Valuations derived from techniques in which one or more significant inputs or significant value drivers are unobservable in the markets and which reflect the Company’s market assumptions. |
The following table summarizes the various categories of the Pension Plan’s assets:
| | Fair Value as of December 31, 2019 | | | Fair Value as of December 31, 2020 | |
| | Level 1 | | | Level 2 | | | Level 3 | | | Total | | | Level 1 | | | Level 2 | | | Level 3 | | | Total | |
| | (dollars in thousands) | | | (dollars in thousands) | |
Asset category | | | | | | | | | | | | | | | | | | | | | | | | | | | | | | | | |
Cash and cash equivalents | | $ | 4,834 | | | $ | — | | | $ | — | | | $ | 4,834 | | | $ | 1,527 | | | $ | — | | | $ | — | | | $ | 1,527 | |
Fixed Income | | | — | | | | 7,197 | | | | — | | | | 7,197 | | |
Fixed income | | | | — | | | | 14,402 | | | | — | | | | 14,402 | |
Equity securities | | | | | | | | | | | | | | | | | | | | | | | | | | | | | | | | |
Common Stock | | | | | | | | | | | | | | | | | |
Common stock | | | | | | | | | | | | | | | | | |
Large cap core | | | 17,180 | | | | — | | | | — | | | | 17,180 | | | | 12,604 | | | | — | | | | — | | | | 12,604 | |
Mid cap core | | | — | | | | — | | | | — | | | | — | | |
Small cap core | | | 2,627 | | | | — | | | | — | | | | 2,627 | | | | 1,767 | | | | — | | | | — | | | | 1,767 | |
Mutual funds | | | | | | | | | | | | | | | | | | | | | | | | | | | | | | | | |
Domestic Equity | | | 3,931 | | | | — | | | | — | | | | 3,931 | | |
Domestic equity | | | | 9,306 | | | | — | | | | — | | | | 9,306 | |
International | | | 3,650 | | | | — | | | | — | | | | 3,650 | | | | 4,868 | | | | — | | | | — | | | | 4,868 | |
Domestic Fixed Income | | | 10,712 | | | | | | | | | | | | 10,712 | | |
Preferred Stock | | | — | | | | — | | | | — | | | | — | | |
Domestic fixed income | | | | 11,328 | | | | — | | | | — | | | | 11,328 | |
Total | | $ | 42,934 | | | $ | 7,197 | | | $ | — | | | $ | 50,131 | | | $ | 41,400 | | | $ | 14,402 | | | $ | — | | | $ | 55,802 | |
| | Fair Value as of December 31, 2018 | | | Fair Value as of December 31, 2019 | |
| | Level 1 | | | Level 2 | | | Level 3 | | | Total | | | Level 1 | | | Level 2 | | | Level 3 | | | Total | |
| | (dollars in thousands) | | | (dollars in thousands) | |
Asset category | | | | | | | | | | | | | | | | | | | | | | | | | | | | | | | | |
Cash and cash equivalents | | $ | 3,520 | | | $ | — | | | $ | — | | | $ | 3,520 | | | $ | 4,834 | | | $ | — | | | $ | — | | | $ | 4,834 | |
Fixed Income | | | — | | | | 6,534 | | | | — | | | | 6,534 | | |
Fixed income | | | | — | | | | 7,197 | | | | — | | | | 7,197 | |
Equity securities | | | | | | | | | | | | | | | | | | | | | | | | | | | | | | | | |
Common Stock | | | | | | | | | | | | | | | | | |
Common stock | | | | | | | | | | | | | | | | | |
Large cap core | | | 16,127 | | | | — | | | | — | | | | 16,127 | | | | 17,180 | | | | — | | | | — | | | | 17,180 | |
Mid cap core | | | — | | | | — | | | | — | | | | — | | |
Small cap core | | | 2,090 | | | | — | | | | — | | | | 2,090 | | | | 2,627 | | | | — | | | | — | | | | 2,627 | |
Mutual funds | | | | | | | | | | | | | | | | | | | | | | | | | | | | | | | | |
Domestic Equity | | | 4,320 | | | | — | | | | — | | | | 4,320 | | |
Domestic equity | | | | 3,931 | | | | — | | | | — | | | | 3,931 | |
International | | | 3,409 | | | | — | | | | — | | | | 3,409 | | | | 3,650 | | | | — | | | | — | | | | 3,650 | |
Domestic Fixed Income | | | 6,648 | | | | | | | | | | | | 6,648 | | |
Preferred Stock | | | — | | | | — | | | | — | | | | — | | |
Domestic fixed income | | | | 10,712 | | | | — | | | | — | | | | 10,712 | |
Total | | $ | 36,114 | | | $ | 6,534 | | | $ | — | | | $ | 42,648 | | | $ | 42,934 | | | $ | 7,197 | | | $ | — | | | $ | 50,131 | |
There were no0 transfers between fair value levels during the years ended December 31, 20192020 and 2018.2019.
The Company offers postretirement health care benefits for current and future retirees of the Bank. Employees receive a fixed monthly benefit at age 65 toward the purchase of postretirement medical coverage. The benefit received is based on the employee’s years of active service. The Company uses a December 31 measurement date each year to determine the benefit obligation for this plan. On November 7, 2019, the Company announced its decision to freeze the accrual of benefits to new hires within the plan.
Projected benefit obligations and funded status were as follows:
| | Postretirement Healthcare Plan | | | Postretirement Healthcare Plan | |
| | 2019 | | | 2018 | | | 2020 | | | 2019 | |
| | (dollars in thousands) | | | (dollars in thousands) | |
Change in projected benefit obligation | | | | | | | | | | | | | | | | |
Obligation at beginning of year | | $ | 598 | | | $ | 617 | | | $ | 689 | | | $ | 598 | |
Service cost | | | 25 | | | | 23 | | | | 30 | | | | 25 | |
Interest cost | | | 25 | | | | 22 | | | | 21 | | | | 25 | |
Actuarial loss/(gain) | | | 76 | | | | (30 | ) | |
Actuarial loss | | | | 51 | | | | 76 | |
Benefits paid | | | (35 | ) | | | (34 | ) | | | (30 | ) | | | (35 | ) |
Obligation at end of year | | | 689 | | | | 598 | | | | 761 | | | | 689 | |
Change in plan assets | | | | | | | | | | | | | | | | |
Fair value at beginning of year | | | — | | | | — | | | | — | | | | — | |
Actual return on plan assets | | | — | | | | — | | |
Employer contribution | | | 35 | | | | 33 | | | | 30 | | | | 35 | |
Benefits paid | | | (35 | ) | | | (33 | ) | | | (30 | ) | | | (35 | ) |
Fair value at end of year | | | — | | | | — | | | | — | | | | — | |
Funded status at end of year | | $ | (689 | ) | | $ | (598 | ) | | $ | (761 | ) | | $ | (689 | ) |
| | Postretirement Healthcare Plan | |
| | 2020 | | | 2019 | |
| | (dollars in thousands) | |
Accumulated benefit obligation | | | 761 | | | | 689 | |
Amounts recognized in the consolidated balance sheets consisted of:
| | Postretirement Healthcare Plan | |
| | 2019 | | | 2018 | |
| | (dollars in thousands) | |
Other liabilities | | $ | (689 | ) | | $ | (598 | ) |
| | Postretirement Healthcare Plan | |
| | 2020 | | | 2019 | |
| | (dollars in thousands) | |
Other liabilities | | $ | (761 | ) | | $ | (689 | ) |
Amounts recognized in accumulated other comprehensive loss consisted of:
| | Postretirement Healthcare Plan | |
| | 2019 | | | 2018 | |
| | (dollars in thousands) | |
Net actuarial (gain)/loss | | $ | (34 | ) | | $ | (113 | ) |
Prior service cost | | | — | | | | — | |
Total | | $ | (34 | ) | | $ | (113 | ) |
| | Postretirement Healthcare Plan | |
| | 2020 | | | 2019 | |
| | (dollars in thousands) | |
Net actuarial (gain)/loss | | $ | 18 | | | $ | (34 | ) |
Information for retirement plans with an accumulated benefit obligation in excess of plan assets:
| | Postretirement Healthcare Plan | |
| | 2019 | | | 2018 | |
| | (dollars in thousands) | |
Projected benefit obligation | | $ | 689 | | | $ | 598 | |
Accumulated benefit obligation | | | 689 | | | | 598 | |
Fair value of plan assets | | | — | | | | — | |
The components of net periodic benefit cost and amounts recognized in other comprehensive income were as follows:
| | Postretirement Healthcare Plan | | | Postretirement Healthcare Plan | |
| | 2019 | | | 2018 | | | 2020 | | | 2019 | |
| | (dollars in thousands) | | | (dollars in thousands) | |
Net periodic benefit cost | | | | | | | | | | | | | | | | |
Service cost | | $ | 25 | | | $ | 23 | | | $ | 30 | | | $ | 25 | |
Interest cost | | | 25 | | | | 22 | | | | 21 | | | | 25 | |
Expected return on assets | | | — | | | | — | | |
Amortization of prior service credit | | | — | | | | — | | |
Amortization of net actuarial gain | | | (3 | ) | | | — | | | | — | | | | (3 | ) |
Net periodic benefit cost | | | 47 | | | | 45 | | | | 51 | | | | 47 | |
Amounts recognized in other comprehensive income/( loss) | | | | | | | | | |
Amounts recognized in other comprehensive income/(loss) | | | | | | | | | |
Net actuarial (gain) loss | | | 76 | | | | (30 | ) | | | 51 | | | | 76 | |
Amortization of prior service credit | | | — | | | | — | | |
Amortization of net actuarial gain | | | 3 | | | | — | | |
Total recognized in other comprehensive income/( loss) | | | 79 | | | | (30 | ) | |
Total recognized in net periodic benefit cost and other comprehensive income/( loss) | | $ | 126 | | | $ | 15 | | |
Amortization of net actuarial loss | | | | — | | | | 3 | |
Total recognized in other comprehensive income | | | | 51 | | | | 79 | |
Total recognized in net periodic benefit cost and other comprehensive income | | | $ | 102 | | | $ | 126 | |
Weighted-average assumptions used to determine the projected benefit obligationsobligation are as follows:
| | Postretirement Healthcare Plan | | | Postretirement Healthcare Plan | |
| | 2019 | | | 2018 | | | 2020 | | | 2019 | |
Discount rate | | | 3.26 | % | | | 4.22 | % | | | 2.52 | % | | | 3.26 | % |
Rate of compensation increase | | N/A | | | N/A | | | N/A | | | N/A | |
Weighted-average assumptions used to determine net periodic benefit cost are as follows:
| | Postretirement Healthcare Plan | | | Postretirement Healthcare Plan | |
| | 2019 | | | 2018 | | | 2020 | | | 2019 | |
Discount rate | | | 4.22 | % | | | 3.58 | % | | | 3.26 | % | | | 4.22 | % |
Expected long-term return on plan assets | | N/A | | | N/A | | | N/A | | | N/A | |
Rate of compensation increase | | N/A | | | N/A | | | N/A | | | N/A | |
Assumed health care cost trend rates are as follows:
| | Postretirement Healthcare Plan | | | Postretirement Healthcare Plan | |
| | 2019 | | | 2018 | | | 2020 | | | 2019 | |
Health care cost trend rate assumed for next year | | | 4.00 | % | | | 4.00 | % | | | 4.00 | % | | | 4.00 | % |
Rate to which the cost trend rate is assumed to decline (the ultimate trend rate) | | | 4.00 | % | | | 4.00 | % | | | 4.00 | % | | | 4.00 | % |
Year that the rate reaches the ultimate trend rate | | | 2019 | | | | 2018 | | | | 2020 | | | | 2019 | |
Assumed health care trend rates have a significant effect on the amounts reported for the health care plans. A one-percentage-point change in assumed health care cost trend rates would have the following effects:
| | One Percentage Point | |
| | Increase | | | Decrease | |
| | (dollars in thousands) | |
Effect on total service and interest cost | | $ | — | | | $ | — | |
Effect on postretirement benefit obligation | | | 2 | | | | (2 | ) |
Benefits expected to be paid in the next ten years are as follows:
| | Pension Plan | | | Supplemental Retirement Plan | | | Postretirement Healthcare Plan | | | Total | | | Pension Plan | | | Supplemental Retirement Plan | | | Postretirement Healthcare Plan | | | Total | |
| | (dollars in thousands) | | | (dollars in thousands) | |
Year-ended December 31, | | | | | | | | | | | | | | | | | | | | | | | | | | | | | | | | |
2020 | | $ | 1,751 | | | $ | 594 | | | $ | 30 | | | $ | 2,375 | | |
2021 | | | 1,813 | | | | 591 | | | | 30 | | | | 2,434 | | | $ | 1,829 | | | $ | 594 | | | $ | 33 | | | $ | 2,456 | |
2022 | | | 1,948 | | | | 609 | | | | 31 | | | | 2,588 | | | | 1,966 | | | | 611 | | | | 33 | | | | 2,610 | |
2023 | | | 2,061 | | | | 605 | | | | 31 | | | | 2,697 | | | | 2,081 | | | | 608 | | | | 33 | | | | 2,722 | |
2024 | | | 2,135 | | | | 602 | | | | 31 | | | | 2,768 | | | | 2,156 | | | | 604 | | | | 33 | | | | 2,793 | |
2025-2029 inclusive | | | 11,784 | | | | 2,916 | | | | 166 | | | | 14,866 | | |
2025 | | | | 2,232 | | | | 600 | | | | 33 | | | | 2,865 | |
2026-2030 inclusive | | | | 12,183 | | | | 3,238 | | | | 166 | | | | 15,587 | |
Ten year total | | $ | 21,492 | | | $ | 5,917 | | | $ | 319 | | | $ | 27,728 | | | $ | 22,447 | | | $ | 6,255 | | | $ | 331 | | | $ | 29,033 | |
The estimated amounts that will be amortized from accumulated other comprehensive income (loss) into net periodic benefit cost during 20192021 are as follows:
| | Pension Plan | | | Supplemental Retirement Plan | | | Postretirement Healthcare Plan | | | Total | |
| | (dollars in thousands) | |
Prior service cost | | $ | (4 | ) | | $ | — | | | $ | — | | | $ | (4 | ) |
Net (gain)/loss | | | — | | | | — | | | | — | | | | — | |
Total | | $ | (4 | ) | | $ | — | | | $ | — | | | $ | (4 | ) |
| | Pension Plan | | | Supplemental Retirement Plan | | | Postretirement Healthcare Plan | | | Total | |
| | (dollars in thousands) | |
Prior service credit | | $ | 3 | | | $ | — | | | $ | — | | | $ | 3 | |
Employee Profit Sharing and 401(k) Plan
The Company maintains a Profit SharingProfit-Sharing Plan (“PSP”) that provides for deferral of federal and state income taxes on employee contributions allowed under Section 401(k) of federal law. Beginning in 2018, theThe Company matchedmatches employee contributions up to 100% of the first 4% of each participant’s salary, eligible bonus, and eligible incentive, up from 3% in 2017.incentive. Employees are eligible to participate in the PSP on the first day of their initial date of service. Each year, the Company may also make a discretionary contribution to the PSP. Effective in 2019, employees are eligible to participate in the discretionary contribution portion of the PSP on the first day of their initial date of service. In 2018, employees were eligible to participate in the discretionary contribution portion of the PSP after completing 12 months of employment, and 1,000 hours of service. The employee must be employed on the last day of the calendar year or retire at the normal retirement age of 65 during the calendar year to receive the discretionary contribution. Effective in 2019, employees are eligible to participate in the discretionary contribution portion of the PSP on the first day of their initial date of service.
Employee Stock Ownership Plan
The Company has an Employee Stock Ownership Plan (“ESOP”) for its eligible employees. Employees are eligible to participate upon the attainment of age 21 and the completion of 12 months of service consisting of at least 1,000 hours. Purchases of the Company’s stock by the ESOP will be funded by employer contributions or reinvestment of cash dividends.
Total expenses related to the Profit Sharing and ESOP Plans for the years ended December 31, 2020, 2019 2018 and 2017,2018, amounted to approximately$3.6 million, $2.8 million, $2.6 million, and $1.5$2.6 million, respectively.
Defined Contribution SERP Plan (“DC SERP”)
For executives participating in the DC SERP plan, the Company made a discretionary contribution of 10% of each executive’s base salary and bonus to his or her account under the Company’s DC SERP, the Executive Deferred Compensation Plan. Total expenses related to the Company’s DC SERP for the years ended December 31, 2020, 2019, 2018 and 2017,2018, amounted to approximately$209,000, $167,000, and $209,000, and $126,000, respectively.
15. | SHARE-BASED COMPENSATION |
In 1993, the Company adopted a Stock Option Plan for key employees as an incentive for them to assist the Company in achieving long-range performance goals. During 2005, the Company’s shareholders amended the plan to permit the issuance of restricted stock, restricted stock units, and stock appreciation rights.
In 2017, the Company adopted the 2017 Equity and Cash Incentive Plan (the “2017 Plan”) and all future awards will be made under the 2017 Plan. The 2017 plan permits the issuance of restricted stock, restricted stock units (both time and performance-based), stock options, and stock appreciation rights.
Stock options time-vest over a five-year period. All options expire ten years from the date granted and have been issued at fair value at the date of grant which, in some instances, may be less than publicly traded values. There were no outstanding stock options at December 31, 2019. A summary of stock option transactions for the year ended December 31, 2018 is presented below:
| | 2019 | | | 2018 | |
| | Number of Options | | | Weighted Average Exercise Price | | | Number of Options | | | Weighted Average Exercise Price | |
Stock Options | | | | | | | | | | | | | | | | |
Outstanding at beginning of year | | | — | | | $ | — | | | | 16,377 | | | $ | 29.21 | |
Granted | | | — | | | | — | | | | — | | | | — | |
Forfeited | | | — | | | | — | | | | — | | | | — | |
Expired | | | — | | | | — | | | | (2,600 | ) | | | 29.21 | |
Exercised | | | — | | | | — | | | | (13,777 | ) | | | 29.21 | |
Outstanding at end of year | | | — | | | $ | — | | | | — | | | $ | — | |
Exercisable at end of year | | | — | | | $ | — | | | | — | | | $ | — | |
Restricted stock awards time-vest either over a three-year or five-year period and have been fair valued as of the date of grant. The holders of restricted stock awards participate fully in the rewards of stock ownership of the Company, including voting and dividend rights. A summary of restricted stock transactions for the periodsoutstanding as of December 31, 20192020 and 2018,2019, and changes during the years ended on those dates, is presented below:
| | 2019 | | | 2018 | | | 2020 | | | 2019 | |
| | Number of Shares | | | Weighted Average Grant Value | | | Number of Shares | | | Weighted Average Grant Value | | | Number of Shares | | | Weighted Average Grant Value | | | Number of Shares | | | Weighted Average Grant Value | |
Restricted stock | | | | | | | | | | | | | | | | | | | | | | | | | | | | | | | | |
Non-vested at beginning of year | | | 41,311 | | | $ | 65.10 | | | | 43,240 | | | $ | 53.13 | | | | 36,121 | | | $ | 70.25 | | | | 41,311 | | | $ | 65.10 | |
Granted | | | 11,330 | | | | 75.67 | | | | 17,373 | | | | 80.43 | | | | 12,790 | | | | 72.48 | | | | 11,330 | | | | 75.67 | |
Vested | | | (14,642 | ) | | | 60.55 | | | | (15,760 | ) | | | 50.10 | | | | (13,846 | ) | | | 66.55 | | | | (14,642 | ) | | | 60.55 | |
Forfeited | | | (1,878 | ) | | | 65.33 | | | | (3,542 | ) | | | 60.84 | | | | (3,416 | ) | | | 67.50 | | | | (1,878 | ) | | | 65.33 | |
Non-vested at end of year | | | 36,121 | | | $ | 70.25 | | | | 41,311 | | | $ | 65.10 | | | | 31,649 | | | $ | 73.07 | | | | 36,121 | | | $ | 70.25 | |
Performance-based restricted stock units vest based upon the Company’s performance over a three-year period and have been fair valued as of the date of grant. The holders of performance-based restricted stock units do not participate in the rewards of stock ownership of the Company until vested. A summary of non-vested performance-based restricted stock units outstanding as of December 31, 20192020 and 2018,2019, and changes during the years ended on those dates, is presented below:
| | 2019 | | | 2018 | | | 2020 | | | 2019 | |
| | Number of Units | | | Weighted Average Grant Value | | | Number of Units | | | Weighted Average Grant Value | | | Number of Units | | | Weighted Average Grant Value | | | Number of Units | | | Weighted Average Grant Value | |
Performance-based restricted stock units | | | | | | | | | | | | | | | | | | | | | | | | | | | | | | | | |
Non-vested at beginning of year | | | 41,411 | | | $ | 66.39 | | | | 21,613 | | | $ | 56.05 | | | | 57,256 | | | $ | 72.82 | | | | 41,411 | | | $ | 66.39 | |
Granted | | | 28,542 | | | | 73.00 | | | | 23,511 | | | | 76.56 | | | | 36,067 | | | | 71.36 | | | | 28,542 | | | | 73.00 | |
Vested (Performance achieved) | | | (12,697 | ) | | | 46.00 | | | | — | | | | — | | | | (8,623 | ) | | | 62.54 | | | | (12,697 | ) | | | 46.00 | |
Forfeited | | | — | | | | — | | | | (3,713 | ) | | | 70.68 | | | | (9,454 | ) | | | 70.21 | | | | — | | | | — | |
Expired (Performance not achieved) | | | — | | | | — | | | | — | | | | — | | |
Non-vested at end of year | | | 57,256 | | | $ | 72.82 | | | | 41,411 | | | $ | 66.39 | | | | 75,246 | | | $ | 73.41 | | | | 57,256 | | | $ | 72.82 | |
Time basedTime-based restricted stock units vest over a three-year-periodthree-year-period and have been fair valued as of the date of the grant. The holders of time basedtime-based restricted stock units do not participate in the rewards of stock ownership of the company until vested. A summary of nonvested time basednon-vested time-based restricted stock units outstanding as of December 31, 20192020 and 2018,2019, and changes during the years ended on those dates, is presented below:
| | 2019 | | | 2018 | | | 2020 | | | 2019 | |
| | Number of Shares | | | Weighted Average Grant Value | | | Number of Shares | | | Weighted Average Grant Value | | | Number of Shares | | | | | Weighted Average Grant Value | | | Number of Shares | | | Weighted Average Grant Value | |
Time-based restricted stock units | | | | | | | | | | | | | | | | | | | | | | | | | | | | | | | |
Non-vested at beginning of year | | | 6,777 | | | $ | 76.56 | | | | — | | | $ | — | | | | 12,658 | | | | | $ | 74.27 | | | | 6,777 | | | $ | 76.56 | |
Granted | | | 8,132 | | | | 73.00 | | | | 7,839 | | | | 76.56 | | | | 9,120 | | | | | | 74.69 | | | | 8,132 | | | | 73.00 | |
Vested | | | (2,251 | ) | | | 76.56 | | | | (225 | ) | | | 76.56 | | | | (4,958 | ) | | | | | 74.62 | | | | (2,251 | ) | | | 76.56 | |
Forfeited | | | — | | | | — | | | | (837 | ) | | | 76.56 | | | | (1,852 | ) | | | | | 70.86 | | | | — | | | | — | |
Non-vested at end of year | | | 12,658 | | | $ | 74.27 | | | | 6,777 | | | $ | 76.56 | | | | 14,968 | | | | | $ | 74.84 | | | | 12,658 | | | $ | 74.27 | |
The following table presents the amounts recognized in the consolidated income statementConsolidated Statement of Income for restricted stock, awards, time-based restricted stock units, and performance-based restricted stock units:
| | December 31, | | | December 31, | |
| | 2019 | | | 2018 | | | 2017 | | | 2020 | | | 2019 | | | 2018 | |
| | (dollars in thousands) | | | (dollars in thousands) | |
Share-based compensation expense | | $ | 2,632 | | | $ | 2,592 | | | $ | 1,045 | | | $ | 4,923 | | | $ | 2,632 | | | $ | 2,592 | |
Related income tax benefit | | $ | 733 | | | $ | 729 | | | $ | 427 | | | $ | 1,375 | | | $ | 733 | | | $ | 729 | |
The 2017 Plan allows Directors of the Company to receive their annual retainer fee in the form of stock in the Company. Total shares issued under the 2017 Plan in the years ended December 31, 2020 and 2019 were 8,403 and 2018 were 4,484, and 4,164, respectively.
16. | FINANCIAL INSTRUMENTS WITH OFF-BALANCE-SHEET RISK |
To meet the financing needs of its customers, the BankCompany is a party to financial instruments with off-balance-sheet risk in the normal course of business. These financial instruments are primarily comprised of commitments to extend credit, commitments to sell residential real estate mortgage loans, risk participation agreements, and standby letters of credit. Those instruments involve, to varying degrees, elements of credit and interest rate risk in excess of the amounts recognized in the consolidated balance sheets.
The Bank’sCompany’s exposure to credit loss in the event of nonperformance by the other party to the financial instrument for loan commitments and standby letters of credit is represented by the contractual amount of those instruments assuming that the amounts are fully advanced and that collateral or other security is of no value. The BankCompany uses the same credit policies in making commitments and conditional obligations as it does for on-balance-sheet instruments.
Off-balance-sheet financial instruments with contractual amounts that present credit risk included the following:
| | December 31, 2019 | | | December 31, 2018 | | | December 31, 2020 | | | December 31, 2019 | |
| | (dollars in thousands) | | | (dollars in thousands) | |
Financial instruments whose contractual amount represents credit risk: | | | | | | | | | | | | | | | | |
Commitments to extend credit: | | | | | | | | | | | | | | | | |
Unused portion of existing lines of credit | | $ | 428,020 | | | $ | 368,410 | | | $ | 584,520 | | | $ | 428,020 | |
Origination of new loans | | | 24,413 | | | | 24,505 | | | | 94,399 | | | | 24,413 | |
Standby letters of credit | | | 9,150 | | | | 8,752 | | | | 9,430 | | | | 9,150 | |
| | | | | | | | | | | | | | | | |
Financial instruments whose notional amount exceeds the amount of credit risk: | | | | | | | | | | | | | | | | |
Commitments to sell residential mortgage loans | | | 3,909 | | | | — | | | | 17,644 | | | | 3,909 | |
Standby letters of credit are conditional commitments issued by the BankCompany to guarantee performance of a customer to a third party. Those guarantees are primarily issued to support public and private borrowing arrangements. Most guarantees extend for one year. The credit risk involved in issuing letters of credit is essentially the same as that involved in extending loan facilities to customers. The collateral supporting those commitments varies and may include real property, accounts receivable, or inventory.
Commitments to extend credit are agreements to lend to a customer as long as there is no violation of any condition established in the contract. Commitments generally have fixed expiration dates or other termination clauses and may require payment of a fee. Since some of the commitments may expire without being drawn upon, the total commitment amounts do not necessarily represent future cash requirements. The BankCompany evaluates each customer’s creditworthiness on a case-by-case basis. The amount of collateral obtained upon extension of the credit is based on management’s credit evaluation of the customer. Collateral held varies, but may include primary residences, accounts receivable, inventory, property, plant and equipment, and income-producing commercial real estate.
See Note 2321 - Derivatives and Hedging Activities for a discussion of the Company’s derivatives and hedging activities.
17. | COMMITMENTS AND CONTINGENCIES |
Lease Commitments. The Company is obligated under various lease agreements covering its main office, branch offices, and other locations. These agreements are accounted for as operating leases and their terms expire between 20192021 and 20302032 and, in some instances, contain options to renew for periods up to 30 years.
TheEffective January 1, 2019, the Company adopted Accounting Standards Update No. 2016-02 - Leases (“ASU 2016-02”) during the first quarter of 2019 and began recognizing its operating leases on its consolidated balance sheet by recording a lease liability, representing the Company’s legal obligation to make lease payments, and a Right-Of-Useright-of-use (ROU) Asset, representing the Company’s legal right to use the leased office space and banking centers. The Company, by policy, does not include renewal options for leases as part of its right-of-use assets and lease liabilities unless they are deemed reasonably certain to exercise. The Company does not have any material sub-lease agreements.
The following table summarizes information related to the Company’s right-of-use asset and net lease liability:
| | December 31, 2019 |
| | Operating Leases | | | Balance Sheet Location |
| | (dollars in thousands) |
Right-of-use asset | | $ | 33,587 | | | Right-of-use asset operating leases |
Lease liability | | $ | 35,054 | | | Operating lease liabilities |
Operating lease expenses are comprised of operating lease costs and variable lease costs, net of sublease income. The pattern and measurement of expense recognition of these costs were not significantly impacted by ASU 2016-02 and subsequent ASUs issued to amend this Topic.
Variable lease payments that are not dependent on an index or a rate or changes in variable payments based on an index or rate after the commencement date are excluded from the measurement of the lease liability, recognized in the period incurred and included within variable lease costs below.
The Company determines whether a contract contains a lease based on whether a contract, or a part of a contract, conveys the right to control the use of an identified asset for a period of time in exchange for consideration. The discount rate is determined as either the rate implicit in the lease or, when a rate cannot be readily determined, the Company’s incremental borrowing rate. The incremental borrowing rate is the rate of interest that the Company would have to pay to borrow on a collateralized basis over a similar term.
The components of operating lease cost and other related information are as follows:
| | Twelve Months Ended December 31, | | | For the Year Ended December 31, | |
| | 2019 | | | 2020 | | | 2019 | |
| | (dollars in thousands) | | | (dollars in thousands) | |
Operating lease cost | | $ | 5,280 | | | $ | 6,691 | | | $ | 5,280 | |
Short-term lease cost | | | — | | |
Variable lease cost (Cost excluded from lease payments) | | | 2 | | | | 2 | | | | 2 | |
Sublease income | | | (64 | ) | | | (65 | ) | | | (64 | ) |
Total Operating Lease Cost | | $ | 5,218 | | |
Total operating lease cost | | | $ | 6,628 | | | $ | 5,218 | |
Other Information | | | | | | | | | | | | |
Cash paid for amounts included in the measurement of lease liabilities - operating cash flows from operating leases | | $ | 5,027 | | |
Operating Lease - Operating Cash Flows (Liability reduction) | | | 3,868 | | |
Cash paid for amounts included in the measurement of lease liabilities – operating cash flows for operating leases | | | $ | 6,547 | | | $ | 5,027 | |
Operating Lease - Operating cash flows (Liability reduction) | | | | 5,430 | | | | 3,868 | |
Right-of-use assets obtained in exchange for new operating lease liabilities | | | 37,728 | | | | 7,850 | | | | 37,728 | |
Weighted average lease term - operating leases | | 8.15 Years | | | 6.90 Years | | | 8.15 Years | |
Weighted average discount rate - operating leases | | | 3.39 | % | | | 2.98 | % | | | 3.39 | % |
The total minimum lease payments due in future periods under these agreements in effect at December 31, 20192020 and December 31, 20182019 were as follows:
Year Ended | | Future Minimum | | |
December 31, 2019 | | Lease Payments | | |
| | (dollars in thousands) | | | Future Minimum | |
2020 | | $ | 5,478 | | |
December 31, 2020 | | | Lease Payments | |
| | | (dollars in thousands) | |
2021 | | | 5,523 | | | $ | 7,173 | |
2022 | | | 5,371 | | | | 6,789 | |
2023 | | | 5,021 | | | | 6,362 | |
2024 | | | 4,355 | | | | 5,493 | |
2025 | | | | 4,517 | |
Thereafter | | | 14,553 | | | | 11,347 | |
Total minimum lease payments | | | 40,301 | | | | 41,681 | |
Less: interest | | | (5,247 | ) | | | (4,233 | ) |
Total lease liability | | $ | 35,054 | | | $ | 37,448 | |
Year Ended | | Future Minimum | | |
December 31, 2018 | | Lease Payments | | |
| | (dollars in thousands) | | | Future Minimum | |
2019 | | $ | 4,448 | | |
December 31, 2019 | | | Lease Payments | |
| | | (dollars in thousands) | |
2020 | | | 4,661 | | | $ | 5,478 | |
2021 | | | 4,662 | | | | 5,523 | |
2022 | | | 4,553 | | | | 5,371 | |
2023 | | | 4,455 | | | | 5,021 | |
2024 | | | | 4,355 | |
Thereafter | | | 17,128 | | | | 14,553 | |
Total minimum lease payments | | $ | 39,907 | | | | 40,301 | |
Less: interest | | | | (5,247 | ) |
Total lease liability | | | $ | 35,054 | |
Several lease agreements contain clauses calling for escalation of minimum lease payments contingent on increases in real estate taxes, gross income adjustments, percentage increases in the consumer price index, and certain ancillary maintenance costs. Total rental expense was $5.7$7.0 million, $4.7$5.7 million, and $4.7 million for the years ended December 31, 2020, 2019 and 2018, respectively.
During the fourth quarter of 2020, the Company closed its South End branch location and 2017, respectively.a support office location in Boston. At December 31, 2020, the Company determined the remaining right-of-use assets for these locations were fully impaired. Impairment charges of $1.2 million were recorded as noninterest expenses, within nonoperating expenses, in the consolidated statement of income.
Change in Control Agreements. The Company has entered into agreements with its Chief Executive Officer and with certain other senior officers, whereby, following the occurrence of a change in control of the Company, if employment is terminated (except because of death, retirement, disability, or for “cause” as defined in the agreements) or is voluntarily terminated for “good reason,” as defined in the agreements, said officers will be entitled to receive additional compensation, as defined in the agreements.
Capital guidelines issued by the Federal Reserve Bank (the “FRB”) and by the FDIC require that the Company and the Bank maintain minimum capital levels for capital adequacy purposes. These regulations also require banks and their holding companies to maintain higher capital levels to be considered “well-capitalized.” Failure to meet minimum capital requirements can initiate certain mandatory, and possibly additional discretionary actions by regulators that, if undertaken, could have a direct material effect on the Company’s financial statements. Under capital adequacy guidelines and the regulatory framework for prompt corrective action, there are specific capital guidelines that involve quantitative measures of assets, liabilities, and certain off-balance-sheet items as calculated under regulatory accounting practices. The risk-based capital rules are designed to make regulatory capital more sensitive to differences in risk profiles among bank and bank holding companies, to account for off-balance-sheet exposure, and to minimize disincentives for holding liquid assets.
In July 2013, the Federal Reserve, the Office of the Comptroller of the Currency (“OCC”), and the FDIC approved final rules (the “Capital Rules”) establishing a new comprehensive capital framework for U.S. banking organizations. The Capital Rules generally implement the Basel Committee on Banking Supervision’s (the “Basel Committee”) December 2010 final capital framework referred to as “Basel III” for strengthening international capital standards. The Capital Rules revise the definitions and the components of regulatory capital, as well as address other issues affecting the numerator in banking institutions’ regulatory capital ratios. The Capital Rules also address asset risk weights and other matters affecting the denominator in banking institutions’ regulatory capital ratios and replace the existing general risk-weighting approach with a more risk-sensitive approach.
The Capital Rules: (i) include “Common Equity Tier 1” (“CET1”) and related regulatory capital ratio of CET1 to risk-weighted assets; (ii) specify that Tier 1 capital consists of CET1 and “Additional Tier 1 capital” instruments meeting certain revised requirements; (iii) mandate that most deductions/adjustments to regulatory capital measures be made to CET1 and not to the other components of capital; and (iv) expand the scope of the deductions from and adjustments to capital as compared to existing regulations. Under the Capital Rules, for most banking organizations, including the Company, the most common form of Additional Tier 1 capital is non-cumulative perpetual preferred stock, and the most common forms of Tier 2 capital are subordinated notes and a portion of the allocation for loan and lease losses, in each case, subject to the Capital Rules’ specific requirements.
Pursuant to the Capital Rules, effective January 1, 2015, the minimum capital ratios are as follows:
| • | 4.5%4.5% CET1 to risk-weighted assets;
|
| • | 6.0%6.0% Tier 1 capital (that is, CET1 plus Additional Tier 1 capital) to risk-weighted assets;
|
| • | 8.0% 8.0% Total capital (that is, Tier 1 capital plus Tier 2 capital) to risk-weighted assets; and
|
| • | 4.0%4.0% Tier 1 capital to average consolidated assets as reported on consolidated financial statements (called “leverage ratio”).
|
The Capital Rules also include a “capital conservation buffer,” composed entirely of CET1, in addition to these minimum risk-weighted asset ratios. The capital conservation buffer is designed to absorb losses during periods of economic stress. Banking institutions that do not hold the requisite capital conservation buffer will face constraints on dividends, capital instrument repurchases, interest payments on capital instruments and discretionary bonus payments based on the amount of the shortfall. Thus, the capital standards applicable toAdditionally, the Company include anis required to maintain additional capital conservation buffer of 2.5% of CET1, effectively resulting in minimum ratios inclusive of the capital conservation buffer of (i) CET1 to risk-weighted assets of at least 7%, (ii) Tier 1 capital to risk-weightedrisk-weighted assets of at least 8.5%8.5%, and (iii) total capital to risk-weighted assets of at least 10.5%.
The Capital Rules provide for a number of deductions from and adjustments to CET1. These include, for example, the requirement that mortgage servicing assets, deferred tax assets arising from temporary differences that could not be realized through net operating loss carrybacks, and significant investments in non-consolidated financial entities be deducted from CET1 to the extent that any one such category exceeds 10% of CET1 or all such items, in the aggregate, exceed 15% of CET1. In November 2017, the Federal Reserve finalized a rule pausing the phase-in of these deductions and adjustments for non-advanced approaches institutions. In July 2019, the OCC, the Federal Reserve Board and the FDIC adopted a final rule intended to simply the Capital Rules described above for non-advanced approaches institutions. Institutions may implement the provisions of the simplification rule beginning on January 1, 2020 and must implement them by April 1, 2020. The transition provisions to the Capital Rules issued by these agencies in November 2017 will cease to apply to an institution in the quarter in which it adopts the simplification rule.
In addition, under the current general risk-based capital rules, the effects of accumulated other comprehensive income or loss items included in shareholders’ equity (for example, mark-to-market of securities held in the available for sale portfolio) under U.S. generally accepted accounting principles (“GAAP”) are reversed for the purposes of determining regulatory capital ratios. Pursuant to the Capital Rules, the effects of certain of the above items are not excluded. However, banking organizations, including the Company, that are not subject to the advanced approaches rule, could make a one-time permanent election to exclude these items. The Company made the one-time permanent election to exclude these items.
The Capital Rules also preclude certain hybrid securities, such as trust preferred securities, from inclusion in bank holding companies’ Tier 1 capital, although bank holding companies that had total consolidated assets of less than $15 billion at December 31, 2009 may include trust preferred securities issued prior to May 19, 2010 as a component of Tier 1 capital.
The risk-weighting categories in the Capital Rules are standardized and include a risk-sensitive number of categories, depending on the nature of the assets, generally ranging from 0% for U.S. government and agency securities, to 1,250% for certain credit exposures, and resulting in higher risk weights for a variety of asset classes.
Management believes that as of December 31, 20192020 and 2018,2019, the Company and the Bank met all applicable minimum capital requirements and were considered “well-capitalized” by both the FRB and the FDIC. There have been no events or conditions since the end of the year that management believes would have changed the Company’s or the Bank’s category. In September 2019, the OCC, the Federal Reserve Board and the FDIC
The Company adopted a final rule that is intended to further simply the Capital Rules for depository institutions and their holding companies that have less than $10 billion in total consolidated assets, such as us, if such institutions meet certain qualifying criteria. This final rule became effectiveASU 2016-13 on January 1, 2020. Under thisThe joint federal bank regulatory agencies issued an interim final rule if we meetthat allows banking organizations to phase-in the qualifying criteria, including havingeffects of the CECL accounting standard in their regulatory capital, over a leverage ratio (equalthree-year period from January 1, 2022 through December 31, 2024. The Company did not elect to tier 1 capital divided by average total consolidated assets)delay the adoption of greater than 9 percent, we will be eligible to opt intoCECL and did not adopt the community bank leverage ratio framework. If we opt into this framework, we will be considered to have satisfied the generally applicable risk-based and leverage capital requirements in the Capital Rules (as modified pursuant to the simplification rule) and will be considered to have met the well-capitalized ratio requirementstransition period for PCA purposes. We are currently evaluating the requirements of this rule. regulatory capital.
The Company’s and the Bank’s actual and required capital measures were as follows:
| | Actual | | | Minimum Capital Required For Capital Adequacy Plus Capital Conservation Buffer (1) | | | Minimum To Be Well-Capitalized Under Prompt Corrective Action Provisions | | | Actual | | | Minimum Capital Required For Capital Adequacy Plus Capital Conservation Buffer | | | Minimum To Be Well-Capitalized Under Prompt Corrective Action Provisions | |
| | Amount | | | Ratio | | | Amount | | | Ratio | | | Amount | | | Ratio | | | Amount | | | Ratio | | | Amount | | | Ratio | | | Amount | | | Ratio | |
| | (dollars in thousands) | | | (dollars in thousands) | |
At December 31, 2019 | | | | | | | | | | | | | | | | | | | | | | | | | |
At December 31, 2020 | | | | | | | | | | | | | | | | | | | | | | | | | |
Cambridge Bancorp: | | | | | | | | | | | | | | | | | | | | | | | | | | | | | | | | | | | | | | | | | | | | | | | | |
Total capital (to risk-weighted assets) | | $ | 272,727 | | | | 13.6 | % | | $ | 210,342 | | | | 10.5 | % | | N/A | | | N/A | | | $ | 378,393 | | | | 13.9 | % | | $ | 285,145 | | | | 10.5 | % | | N/A | | | N/A | |
Tier I capital (to risk-weighted assets) | | | 254,497 | | | | 12.7 | % | | | 170,277 | | | | 8.5 | % | | N/A | | | N/A | | | | 344,409 | | | | 12.7 | % | | | 230,832 | | | | 8.5 | % | | N/A | | | N/A | |
Common equity tier I capital (to risk-weighted assets) | | | 254,497 | | | | 12.7 | % | | | 140,228 | | | | 7.0 | % | | N/A | | | N/A | | | | 344,409 | | | | 12.7 | % | | | 190,097 | | | | 7.0 | % | | N/A | | | N/A | |
Tier I capital (to average assets) | | | 254,497 | | | | 9.0 | % | | | 113,365 | | | | 4.0 | % | | N/A | | | N/A | | | | 344,409 | | | | 8.9 | % | | | 155,009 | | | | 4.0 | % | | N/A | | | N/A | |
Cambridge Trust Company: | | | | | | | | | | | | | | | | | | | | | | | | | | | | | | | | | | | | | | | | | | | | | | | | |
Total capital (to risk-weighted assets) | | $ | 271,034 | | | | 13.5 | % | | $ | 210,341 | | | | 10.5 | % | | $ | 200,325 | | | | 10.0 | % | | $ | 376,209 | | | | 13.9 | % | | $ | 285,117 | | | | 10.5 | % | | $ | 271,540 | | | | 10.0 | % |
Tier I capital (to risk-weighted assets) | | | 252,804 | | | | 12.6 | % | | | 170,276 | | | | 8.5 | % | | | 160,260 | | | | 8.0 | % | | | 342,229 | | | | 12.6 | % | | | 230,809 | | | | 8.5 | % | | | 217,232 | | | | 8.0 | % |
Common equity tier I capital (to risk-weighted assets) | | | 252,804 | | | | 12.6 | % | | | 140,227 | | | | 7.0 | % | | | 130,211 | | | | 6.5 | % | | | 342,229 | | | | 12.6 | % | | | 190,078 | | | | 7.0 | % | | | 176,501 | | | | 6.5 | % |
Tier I capital (to average assets) | | | 252,804 | | | | 8.9 | % | | | 113,364 | | | | 4.0 | % | | | 141,705 | | | | 5.0 | % | | | 342,229 | | | | 8.8 | % | | | 154,999 | | | | 4.0 | % | | | 193,748 | | | | 5.0 | % |
(1)
| The 2013 Capital Rules adopted by the Federal Reserve, Office of the Comptroller of the Currency, and the Federal Deposit Insurance Corporation implementing Basel III were fully phased-in effective January 1, 2019.
|
| | Actual | | | Minimum Capital Required For Capital Adequacy | | | Minimum Capital Required For Capital Adequacy Plus Capital Conservation Buffer Basel III Phase-In Schedule | | Minimum Capital Required For Capital Adequacy Plus Capital Conservation Buffer Basel III Fully Phased In | | Minimum To Be Well-Capitalized Under Prompt Corrective Action Provisions | | | Actual | | | Minimum Capital Required For Capital Adequacy Plus Capital Conservation Buffer | | | Minimum To Be Well-Capitalized Under Prompt Corrective Action Provisions | |
| | Amount | | | Ratio | | | Amount | | | Ratio | | | Amount | | | Ratio | | Amount | | | Ratio | | Amount | | | Ratio | | | Amount | | | Ratio | | | Amount | | | Ratio | | | Amount | | | Ratio | |
| | (dollars in thousands) | | | (dollars in thousands) | |
At December 31, 2018 | | | | | | | | | | | | | | | | | | | | | | | | | | | | | | | | | | | | | |
At December 31, 2019 | | | | | | | | | | | | | | | | | | | | | | | | | |
Cambridge Bancorp: | | | | | | | | | | | | | | | | | | | | | | | | | | | | | | | | | | | | | | | | | | | | | | | | | | | | | | | | | | | | |
Total capital (to risk-weighted assets) | | $ | 189,888 | | | | 13.2 | % | | $ | 114,666 | | | | 8.0 | % | | $ | 141,541 | | | | 9.875 | % | $ | 150,500 | | | | 10.5 | % | N/A | | | N/A | | | $ | 272,727 | | | | 13.6 | % | | $ | 210,342 | | | | 10.5 | % | | N/A | | | N/A | |
Tier I capital (to risk-weighted assets) | | | 173,070 | | | | 12.1 | % | | | 86,000 | | | | 6.0 | % | | | 112,875 | | | | 7.875 | % | | 121,833 | | | | 8.5 | % | N/A | | | N/A | | | | 254,497 | | | | 12.7 | % | | | 170,277 | | | | 8.5 | % | | N/A | | | N/A | |
Common equity tier I capital (to risk-weighted assets) | | | 173,070 | | | | 12.1 | % | | | 64,500 | | | | 4.5 | % | | | 91,375 | | | | 6.375 | % | | 100,333 | | | | 7.0 | % | N/A | | | N/A | | | | 254,497 | | | | 12.7 | % | | | 140,228 | | | | 7.0 | % | | N/A | | | N/A | |
Tier I capital (to average assets) | | | 173,070 | | | | 8.5 | % | | | 81,507 | | | | 4.0 | % | | | 81,507 | | | | 4.000 | % | | 81,507 | | | | 4.0 | % | N/A | | | N/A | | | | 254,497 | | | | 9.0 | % | | | 113,365 | | | | 4.0 | % | | N/A | | | N/A | |
Cambridge Trust Company: | | | | | | | | | | | | | | | | | | | | | | | | | | | | | | | | | | | | | | | | | | | | | | | | | | | | | | | | | | | | |
Total capital (to risk-weighted assets) | | $ | 185,507 | | | | 12.9 | % | | $ | 114,666 | | | | 8.0 | % | | $ | 141,541 | | | | 9.875 | % | $ | 150,500 | | | | 10.5 | % | $ | 143,333 | | | | 10.0 | % | | $ | 271,034 | | | | 13.5 | % | | $ | 210,341 | | | | 10.5 | % | | $ | 200,325 | | | | 10.0 | % |
Tier I capital (to risk-weighted assets) | | | 168,689 | | | | 11.8 | % | | | 86,000 | | | | 6.0 | % | | | 112,875 | | | | 7.875 | % | | 121,833 | | | | 8.5 | % | | 114,666 | | | | 8.0 | % | | | 252,804 | | | | 12.6 | % | | | 170,276 | | | | 8.5 | % | | | 160,260 | | | | 8.0 | % |
Common equity tier I capital (to risk-weighted assets) | | | 168,689 | | | | 11.8 | % | | | 64,500 | | | | 4.5 | % | | | 91,375 | | | | 6.375 | % | | 100,333 | | | | 7.0 | % | | 93,166 | | | | 6.5 | % | | | 252,804 | | | | 12.6 | % | | | 140,227 | | | | 7.0 | % | | | 130,211 | | | | 6.5 | % |
Tier I capital (to average assets) | | | 168,689 | | | | 8.3 | % | | | 81,507 | | | | 4.0 | % | | | 81,507 | | | | 4.000 | % | | 81,507 | | | | 4.0 | % | | 101,884 | | | | 5.0 | % | | | 252,804 | | | | 8.9 | % | | | 113,364 | | | | 4.0 | % | | | 141,705 | | | | 5.0 | % |
The components of other income were as follows:
| | For the Year Ended December 31, | |
| | 2019 | | | 2018 | | | 2017 | |
| | (dollars in thousands) | |
Safe deposit box income | | $ | 333 | | | $ | 342 | | | $ | 348 | |
Loan fee income | | | 1,030 | | | | 358 | | | | 473 | |
Miscellaneous income | | | 564 | | | | 569 | | | | 334 | |
Total other income | | $ | 1,927 | | | $ | 1,269 | | | $ | 1,155 | |
20.
| OTHER OPERATING EXPENSES
|
The components of other operating expenses were as follows:
| | For the Year Ended December 31, | |
| | 2019 | | | 2018 | | | 2017 | |
| | (dollars in thousands) | |
Director fees | | $ | 527 | | | $ | 724 | | | $ | 576 | |
Charitable donations & sponsorships | | | 575 | | | | 518 | | | | 432 | |
Printing and supplies | | | 437 | | | | 272 | | | | 251 | |
Travel and entertainment | | | 579 | | | | 456 | | | | 339 | |
Dues and memberships | | | 412 | | | | 293 | | | | 260 | |
Physical security | | | 86 | | | | 131 | | | | 172 | |
Postage and mailing | | | 246 | | | | 201 | | | | 229 | |
Miscellaneous expense | | | 337 | | | | (331 | ) | | | 885 | |
Total other operating expenses | | $ | 3,199 | | | $ | 2,264 | | | $ | 3,144 | |
Miscellaneous expense in 2018 and 2017 includes the reclassification adjustment for retirement plan expenses as required upon adoption of ASU 2017-07.19.COMPREHENSIVE INCOME
21.
| OTHER COMPREHENSIVE INCOME
|
Comprehensive income is defined as all changes to shareholders’ equity except investments by and distributions to shareholders. Net income is a component of comprehensive income, with all other components referred to in the aggregate as “other comprehensive income.” The Company’s other comprehensive income consists of unrealized gains or losses on securities held at year-end classified as available for sale and the component of the unfunded retirement liability computed in accordance with the requirements of ASC 715, “Compensation – Retirement Benefits.” The before-tax and after-tax amount of each of these categories, as well as the tax (expense)/benefit of each, is summarized as follows:
| | For the Year Ended December 31, 2019 | | | For the Year Ended December 31, 2018 | | | For the Year Ended December 31, 2017 | |
| | Before Tax Amount | | | Tax (Expense) or Benefit | | | Net-of- tax Amount | | | Before Tax Amount | | | Tax (Expense) or Benefit | | | Net-of- tax Amount | | | Before Tax Amount | | | Tax (Expense) or Benefit | | | Net-of- tax Amount | |
| | | | | (dollars in thousands) | | | | |
Unrealized (losses)/gains on available for sale securities | | | | | | | | | | | | | | | | | | | | | | | | | | | | | | | | | | | | |
Unrealized holding (losses)/gains arising during the period | | $ | 3,267 | | | $ | (767 | ) | | $ | 2,500 | | | $ | (231 | ) | | $ | (11 | ) | | $ | (242 | ) | | $ | 187 | | | $ | (59 | ) | | $ | 128 | |
Reclassification adjustment for (gains)/losses recognized in net income | | | 81 | | | | (19 | ) | | | 62 | | | | (2 | ) | | | — | | | | (2 | ) | | | 3 | | | | (2 | ) | | | 1 | |
Derivatives | | | | | | | | | | | | | | | | | | | | | | | | | | | | | | | | | | | | |
Change in interest rate contracts | | | 1,134 | | | | (313 | ) | | | 821 | | | | 1,045 | | | | (294 | ) | | | 751 | | | | — | | | | — | | | | — | |
Defined benefit retirement plans | | | | | | | | | | | | | | | | | | | | | | | | | | | | | | | | | | | | |
Net change in retirement liability | | | 864 | | | | (241 | ) | | | 623 | | | | 124 | | | | (35 | ) | | | 89 | | | | 6,545 | | | | (2,674 | ) | | | 3,871 | |
Total Other Comprehensive Income/(Loss) | | $ | 5,346 | | | $ | (1,340 | ) | | $ | 4,006 | | | $ | 936 | | | $ | (340 | ) | | $ | 596 | | | $ | 6,735 | | | $ | (2,735 | ) | | $ | 4,000 | |
| | For the Year Ended December 31, 2020 | | | For the Year Ended December 31, 2019 | | | For the Year Ended December 31, 2018 | |
| | Before Tax Amount | | | Tax (Expense) or Benefit | | | Net-of- tax Amount | | | Before Tax Amount | | | Tax (Expense) or Benefit | | | Net-of- tax Amount | | | Before Tax Amount | | | Tax (Expense) or Benefit | | | Net-of- tax Amount | |
| | | | | (dollars in thousands) | | | | |
Available for sale securities | | | | | | | | | | | | | | | | | | | | | | | | | | | | | | | | | | | | |
Unrealized holding gains/(losses) | | $ | 3,630 | | | $ | (830 | ) | | $ | 2,800 | | | $ | 3,267 | | | $ | (767 | ) | | $ | 2,500 | | | $ | (231 | ) | | $ | (11 | ) | | $ | (242 | ) |
Reclassification adjustment for (gains)/losses realized in net income | | | (73 | ) | | | 16 | | | | (57 | ) | | | 81 | | | | (19 | ) | | | 62 | | | | (2 | ) | | | — | | | | (2 | ) |
Interest rate swaps designated as cash flow hedges | | | | | | | | | | | | | | | | | | | | | | | | | | | | | | | | | | | | |
Unrealized holding gains(losses) | | | 6,602 | | | | (1,844 | ) | | | 4,758 | | | | 984 | | | | (271 | ) | | | 713 | | | | 1,002 | | | | (282 | ) | | | 720 | |
Reclassification adjustment for (gains)/losses recognized in net income | | | (1,879 | ) | | | 525 | | | | (1,354 | ) | | | 150 | | | | (42 | ) | | | 108 | | | | 43 | | | | (12 | ) | | | 31 | |
Defined benefit retirement plans | | | | | | | | | | | | | | | | | | | | | | | | | | | | | | | | | | | | |
Net change in retirement liability | | | (1,695 | ) | | | 463 | | | | (1,232 | ) | | | 864 | | | | (241 | ) | | | 623 | | | | 124 | | | | (35 | ) | | | 89 | |
Total other comprehensive income | | $ | 6,585 | | | $ | (1,670 | ) | | $ | 4,915 | | | $ | 5,346 | | | $ | (1,340 | ) | | $ | 4,006 | | | $ | 936 | | | $ | (340 | ) | | $ | 596 | |
Reclassifications out of accumulated other comprehensive income (“AOCI”) are presented below:
| | For the Year Ended December 31, | | | | | For the Year Ended December 31, | | | |
Details about Accumulated Other Comprehensive Income (Loss) Components | | 2019 | | | 2018 | | | 2017 | | | Affected Line Item in the Statement where Net Income is Presented | | 2020 | | | 2019 | | | 2018 | | | Affected Line Item in the Statement where Net Income is Presented |
| | (dollars in thousands) | | | | | (dollars in thousands) | | | |
Unrealized gains and losses on available for sale securities | | $ | (81 | ) | | $ | 2 | | | $ | (3 | ) | | (Loss) gain on disposition of investment securities | |
Tax benefit or (expense) | | | 19 | | | | — | | | | 2 | | | Provision for income taxes | |
Unrealized gains (losses) on available for sale securities | | | $ | 73 | | | $ | (81 | ) | | $ | 2 | | | Gain (loss) on disposition of investment securities |
Unrealized gains (losses) on derivatives | | | | 1,879 | | | | (150 | ) | | | (43 | ) | | Interest on taxable loans |
Tax (expense) benefit | | | | (541 | ) | | | 61 | | | | 12 | | | Income tax expense |
Net of tax | | $ | (62 | ) | | $ | 2 | | | $ | (1 | ) | | Net income | | $ | 1,411 | | | $ | (170 | ) | | $ | (29 | ) | | Net income |
The following represents a reconciliation between basic and diluted earnings per share:
| | For the Year Ended December 31, | | | For the Year Ended December 31, | |
| | 2019 | | | 2018 | | | 2017 | | | 2020 | | | 2019 | | | 2018 | |
| | (dollars in thousands, except per share data) | | | (dollars in thousands, except per share data) | |
Earnings per common share - basic: | | | | | | | | | | | | | | | | | | | | | | | | |
Numerator: | | | | | | | | | | | | | | | | | | | | | | | | |
Net income | | | $ | 25,257 | | | $ | 23,881 | | | $ | 14,816 | | | | $ | 31,959 | | | $ | 25,257 | | | $ | 23,881 | |
Less dividends and undistributed earnings allocated to participating securities | | | | (210 | ) | | | (239 | ) | | | (157 | ) | | | | (47 | ) | | | (210 | ) | | | (239 | ) |
Net income applicable to common shareholders | | | $ | 25,047 | | | $ | 23,642 | | | $ | 14,659 | | | | $ | 31,912 | | | $ | 25,047 | | | $ | 23,642 | |
| | | | | | | | | | | | | | | | | | | | | | | | | | |
Denominator: | | �� | | | | | | | | | | | | | | | | | | | | | | | | |
Weighted average common shares outstanding | | | | 4,629 | | | | 4,062 | | | | 4,031 | | | | | 6,289 | | | | 4,629 | | | | 4,062 | |
Earnings per common share - basic | | | $ | 5.41 | | | $ | 5.82 | | | $ | 3.64 | | |
Earnings per common share – basic | | | | $ | 5.07 | | | $ | 5.41 | | | $ | 5.82 | |
| | | | | | | | | | | | | | | | | | | | | | | | | | |
Earnings per common share - diluted: | | | | | | | | | | | | | | | | | | | | | | | | | | |
Numerator: | | | | | | | | | | | | | | | | | | | | | | | | | | |
Net income | | | $ | 25,257 | | | $ | 23,881 | | | $ | 14,816 | | | | $ | 31,959 | | | $ | 25,257 | | | $ | 23,881 | |
Less dividends and undistributed earnings allocated to participating securities | | | | (210 | ) | | | (239 | ) | | | (157 | ) | | | | (47 | ) | | | (210 | ) | | | (239 | ) |
Net income applicable to common shareholders | | | $ | 25,047 | | | $ | 23,642 | | | $ | 14,659 | | | | $ | 31,912 | | | $ | 25,047 | | | $ | 23,642 | |
| | | | | | | | | | | | | | | | | | | | | | | | | | |
Denominator: | | | | | | | | | | | | | | | | | | | | | | | | | | |
Weighted average common shares outstanding | | | | 4,629 | | | | 4,062 | | | | 4,031 | | | | | 6,289 | | | | 4,629 | | | | 4,062 | |
Dilutive effect of common stock equivalents | | | | 33 | | | | 37 | | | | 35 | | | | | 55 | | | | 33 | | | | 37 | |
Weighted average diluted common shares outstanding | | | | 4,662 | | | | 4,099 | | | | 4,066 | | | | | 6,344 | | | | 4,662 | | | | 4,099 | |
Earnings per common share - diluted | | | $ | 5.37 | | | $ | 5.77 | | | $ | 3.61 | | |
Earnings per common share – diluted | | | | $ | 5.03 | | | $ | 5.37 | | | $ | 5.77 | |
23.21.
| DERIVATIVES and Hedging Activities |
The Company utilizes interest rate swaps and floors to mitigate exposure to interest rate risk and to facilitate the needs of our customers. The Company’s derivative financial instruments are used to manage differences in the amount, timing, and duration of the Company’s known or expected cash receipts principally related to the Company’s assets.
Cash Flow Hedges of Interest Rate Risk
The Company uses interest floors to manage its exposure to interest rate movements. Interest rate floors designated as cash flow hedges involve the receipt of variable-rate amounts from a counterparty if interest rates fall below the strike rate on the contract in exchange for an up-front premium. The Company executed an interest rate floor with a notional value of $150.0 million during the fourth quarter of 2018. The Company did not execute any new cash flow hedges in 2019.
For derivatives designated and that qualify as cash flow hedges of interest rate risk, the gain or loss on the derivative is recorded in accumulated other comprehensive incomeAOCI and subsequently reclassified into interest income in the same period(s) during which the hedged transaction affects earnings. Gains and losses on the derivative representing hedge components excluded from the assessment of effectiveness are recognized over the life of the hedge on a systematic and rational basis. The earnings recognition of excluded components is presented in interest income. Amounts reported in accumulated other comprehensive incomeAOCI related to derivatives is reclassedwill be reclassified to interest income as the Company receives interest payments are received on itsthe Company’s variable-rate assets.
Non-designated Hedges
Derivatives not designated as hedges are not speculative and result from a service the Company provides to certain customers. For the Company’s customers, these are interest rate swaps and risk participation agreements.
Interest Rate Swaps. The Company enters into interest rate swap contracts to help commercial loan borrowers manage their interestrate risk. The interest rate swap contracts with commercial loan borrowers allow them to convert floating-rate loan payments to fixed-rate fixed rateloan payments. When the BankCompany enters into an interest rate swap contract with a commercial loan borrower, it simultaneouslyenters into a “mirror” swap contract with a third party. The third party exchanges the client’s fixed‑ratefixed-rate loan payments for floating-rateloan payments. These derivatives are not designated as hedges and therefore, changes in fair value are recognized in earnings. Becausethese derivatives have mirror-image contractual terms, the changes in fair value substantially offset each other through earnings. Feesearned in connection with the execution of derivatives related to this program are recognized in earnings through other loan relatedderivative income.
The credit risk associated with swap transactions is the risk of default by the counterparty. To minimize this risk, the Company enters into interest rate agreements only with highly rated counterparties that management believes to be creditworthy. The notional amounts of these agreements do not represent amounts exchanged by the parties and, thus, are not a measure of the potential loss exposure.
Risk Participation Agreements.
The Company enters into risk participation agreements (“RPAs”) with other banks participating in commercial loan arrangements. Participating banks guarantee the performance on borrower-related interest rate swap contracts. RPAs are derivative financial instruments and are recorded at fair value. These derivatives are not designated as hedges and therefore, changes in fair value are recognized in earnings with a corresponding offset within other assets or other liabilities.
Under a risk participation-out agreement, a derivative asset, the Company participates out a portion of the credit risk associated with the interest rate swap position executed with the commercial borrower, for a fee paid to the participating bank. Under a risk participation-in agreement, a derivative liability, the Company assumes, or participates in, a portion of the credit risk associated with the interest rate swap position with the commercial borrower and receivesfor a fee received from the other bank.
The following tables present the notional amount, the location, and fair values of derivative instruments in the Company’s Consolidated Balance Sheets:consolidated balance sheets:
| | December 31, 2019 | | | December 31, 2020 | |
| | Derivative Assets | | | Derivative Liabilities | | | Derivative Assets | | | Derivative Liabilities | |
| | Notional Amount | | | Balance Sheet Location | | Fair Value | | | Notional Amount | | | Balance Sheet Location | | Fair Value | | | Notional Amount | | | Balance Sheet Location | | Fair Value | | | Notional Amount | | | Balance Sheet Location | | Fair Value | |
| | (dollars in thousands) | | | (dollars in thousands) | | | (dollars in thousands) | | | (dollars in thousands) | |
Derivatives designated as hedging instruments | | | | | | | | | | | | | | | | | | | | | | | | | | | | | | | | | | |
Interest rate contracts | | | 150,000 | | | Other Assets | | $ | 2,911 | | | $ | — | | | Other Liabilities | | $ | — | | | $ | 150,000 | | | Other Assets | | $ | 7,618 | | | $ | — | | | Other Liabilities | | $ | — | |
Total derivatives designated as hedging instruments | | | | | | | | $ | 2,911 | | | | | | | | | $ | — | | | | | | | | | $ | 7,618 | | | | | | | | | $ | — | |
| | | | | | | | | | | | | | | | | | | | | | | | | | | | | | | | | | | | | | | | |
Derivatives not designated as hedging instruments | | | | | | | | | | | | | | | | | | | | | | | | | | | | | | | | | | |
Loan related derivative contracts | | | | | | | | | | | | | | | | | | | | | | | | | | | | | | | | | | | | | | | | |
Interest rate swaps with customers | | | 241,187 | | | Other Assets | | $ | 12,980 | | | | — | | | Other Liabilities | | $ | — | | | | 409,493 | | | Other Assets | | $ | 38,415 | | | | — | | | Other Liabilities | | $ | — | |
Mirror swaps with counterparties | | | — | | | Other Assets | | | — | | | | 241,187 | | | Other Liabilities | | | 12,980 | | | | — | | | Other Assets | | | — | | | | 409,493 | | | Other Liabilities | | | 38,415 | |
Risk participation agreements out to counterparties | | | 19,000 | | | Other Assets | | | 21 | | | | — | | | Other Liabilities | | | — | | |
Risk participation agreements in with counterparties | | | — | | | Other Assets | | | — | | | | 88,489 | | | Other Liabilities | | | 250 | | |
Risk participation agreements-out to counterparties | | | | 26,580 | | | Other Assets | | | 51 | | | | — | | | Other Liabilities | | | — | |
Risk participation agreements-in with counterparties | | | | — | | | Other Assets | | | — | | | | 104,956 | | | Other Liabilities | | | 496 | |
Total derivatives not designated as hedging instruments | | | | | | | | $ | 13,001 | | | | | | | | | $ | 13,230 | | | | | | | | | $ | 38,466 | | | | | | | | | $ | 38,911 | |
| | December 31, 2018 | | | December 31, 2019 | |
| | Derivative Assets | | | Derivative Liabilities | | | Derivative Assets | | | Derivative Liabilities | |
| | Notional Amount | | | Balance Sheet Location | | Fair Value | | | Notional Amount | | | Balance Sheet Location | | Fair Value | | | Notional Amount | | | Balance Sheet Location | | Fair Value | | | Notional Amount | | | Balance Sheet Location | | Fair Value | |
| | (dollars in thousands) | | | (dollars in thousands) | | | (dollars in thousands) | | | (dollars in thousands) | |
Derivatives designated as hedging instruments | | | | | | | | | | | | | | | | | | | | | | | | | | | | | | | | | | |
Interest rate contracts | | | 150,000 | | | Other Assets | | $ | 1,970 | | | $ | — | | | Other Liabilities | | $ | — | | | $ | 150,000 | | | Other Assets | | $ | 2,911 | | | $ | — | | | Other Liabilities | | $ | — | |
Total derivatives designated as hedging instruments | | | | | | | | $ | 1,970 | | | | | | | | | $ | — | | | | | | | | | $ | 2,911 | | | | | | | | | $ | — | |
| | | | | | | | | | | | | | | | | | | | | | | | | | | | | | | | | | | | | | | | |
Derivatives not designated as hedging instruments | | | | | | | | | | | | | | | | | | | | | | | | | | | | | | | | | | |
Loan related derivative contracts | | | | | | | | | | | | | | | | | | | | | | | | | | | | | | | | | | | | | | | | |
Interest rate swaps with customers | | | 150,489 | | | Other Assets | | $ | 5,782 | | | $ | — | | | Other Liabilities | | $ | — | | | | 241,187 | | | Other Assets | | $ | 12,980 | | | $ | — | | | Other Liabilities | | $ | — | |
Mirror swaps with counterparties | | | — | | | Other Assets | | | — | | | | 150,489 | | | Other Liabilities | | | 5,782 | | | | — | | | Other Assets | | | — | | | | 241,187 | | | Other Liabilities | | | 12,980 | |
Risk participation agreements out to counterparties | | | 19,000 | | | Other Assets | | | 28 | | | | — | | | Other Liabilities | | | — | | |
Risk participation agreements in with counterparties | | | — | | | Other Assets | | | — | | | | 63,825 | | | Other Liabilities | | | 179 | | |
Risk participation agreements-out to counterparties | | | | 19,000 | | | Other Assets | | | 21 | | | | — | | | Other Liabilities | | | — | |
Risk participation agreements-in with counterparties | | | | — | | | Other Assets | | | — | | | | 88,489 | | | Other Liabilities | | | 250 | |
Total derivatives not designated as hedging instruments | | | | | | | | $ | 5,810 | | | | | | | | | $ | 5,961 | | | | | | | | | $ | 13,001 | | | | | | | | | $ | 13,230 | |
The following tables presents the effect of cash flow hedge accounting on AOCI as of the periods presented:
| | Amount of Gain or (Loss) Recognized in OCI | | | Amount of Gain or (Loss) Recognized in OCI Included Component | | | Amount of Gain or (Loss) Recognized in OCI Excluded Component | | | Location of Gain or (Loss) | | Amount of Gain or (Loss) Reclassified from AOCI into Income | | | Amount of Gain or (Loss) Reclassified from AOCI into Income Included Component | | | Amount of Gain or (Loss) Reclassified from AOCI into Income Excluded Component | | |
| | 2019 | | | | | 2019 | | |
| | (dollars in thousands) | | | | | (dollars in thousands) | | |
Interest rate contracts | | $ | 984 | | | $ | 2,120 | | | $ | (1,136 | ) | | Interest Income | | $ | (194 | ) | | $ | — | | | $ | (194 | ) | |
Total | | $ | 984 | | | $ | 2,120 | | | $ | (1,136 | ) | | | | $ | (194 | ) | | $ | — | | | $ | (194 | ) | |
| | | | | | | | | | | | | | | | | | | | | | | | | | | | For the Year Ended December 31, 2020 | |
| | Amount of Gain or (Loss) Recognized in OCI | | | Amount of Gain or (Loss) Recognized in OCI Included Component | | | Amount of Gain or (Loss) Recognized in OCI Excluded Component | | | Location of Gain or (Loss) | | Amount of Gain or (Loss) Reclassified from AOCI into Income | | | Amount of Gain or (Loss) Reclassified from AOCI into Income Included Component | | | Amount of Gain or (Loss) Reclassified from AOCI into Income Excluded Component | | | Amount of Gain or (Loss) Recognized in OCI | | | Amount of Gain or (Loss) Recognized in OCI Included Component | | | Amount of Gain or (Loss) Recognized in OCI Excluded Component | | | Location of Gain or (Loss) | | Amount of Gain or (Loss) Reclassified from AOCI into Income | | | Amount of Gain or (Loss) Reclassified from AOCI into Income Included Component | | | Amount of Gain or (Loss) Reclassified from AOCI into Income Excluded Component | |
| | 2018 | | | | | 2018 | | | | | | | | | | | | | | | | | | | | | | | | | | | |
| | (dollars in thousands) | | | | | (dollars in thousands) | | | (dollars in thousands) | | | | | (dollars in thousands) | |
Interest rate contracts | | $ | 1,002 | | | $ | — | | | $ | 1,002 | | | Interest Income | | $ | (43 | ) | | $ | — | | | $ | (43 | ) | | $ | 4,723 | | | $ | 5,650 | | | $ | (927 | ) | | Interest Income | | $ | 1,879 | | | $ | 2,074 | | | $ | (195 | ) |
Total | | $ | 1,002 | | | $ | — | | | $ | 1,002 | | | | | $ | (43 | ) | | $ | — | | | $ | (43 | ) | |
| | | | | | | | | | | | | | | | | | | | | | | | | | | |
| | | | | | | | | | | | | | | | | | | | | | | | | | | |
| | | For the Year Ended December 31, 2019 | |
| | | Amount of Gain or (Loss) Recognized in OCI | | | Amount of Gain or (Loss) Recognized in OCI - Included Component | | | Amount of Gain or (Loss) Recognized in OCI - Excluded Component | | | Location of Gain or (Loss) | | Amount of Gain or (Loss) Reclassified from AOCI into Income | | | Amount of Gain or (Loss) Recognized in OCI - Included Component | | | Amount of Gain or (Loss) Recognized in OCI - Excluded Component | |
| | | (dollars in thousands) | | | | | (dollars in thousands) | |
Interest rate contracts | | | $ | 984 | | | $ | 2,120 | | | $ | (1,136 | ) | | Interest Income | | $ | (150 | ) | | $ | — | | | $ | (150 | ) |
During 2019, theThe Company estimates that an additional $295,000$2.5 million will be reclassified out of AOCI into earnings, as a reductionan increase to interest income.income over the next twelve months.
The following table presents the effect of the Company’s derivative financial instruments on the Income Statementconsolidated statements of income as of the periods presented:
| Year Ended December 31, 2019 | | | Year Ended December 31, 2018 | |
| Interest Income | | | Interest Income | |
| (dollars in thousands) | | | (dollars in thousands) | |
Total amount of income presented in the income statement in which the effects of fair value or cash flow hedges are recorded | $ | (194 | ) | | $ | (43 | ) |
The effects of fair value and cash flow hedging: | | | | | | | |
Gain or (loss) on cash flow hedging relationships in Subtopic 815-20 | | | | | | | |
Interest rate contracts | | | | | | | |
Amount of gain or (loss) reclassed from AOCI into income | $ | (194 | ) | | $ | (43 | ) |
Amount of gain or (loss) reclassed from AOCI into income - Included Component | | — | | | | — | |
Amount of gain or (loss) reclassed from AOCI into income - Excluded Component | $ | (194 | ) | | $ | (43 | ) |
| | | | | | | | |
| | For the Year Ended December 31, 2020 | | | For the Year Ended December 31, 2019 | |
| | Interest Income | | | Interest Income | |
| | (dollars in thousands) | | | (dollars in thousands) | |
Total amount of income presented in the statements of income in which the effects of cash flow hedges are recorded | | $ | 1,879 | | | $ | (150 | ) |
Gain or (loss) on cash flow hedging relationships in Subtopic 815-20 | | | | | | | | |
Interest rate contracts: | | | | | | | | |
Amount of gain (loss) reclassed from AOCI into income | | $ | 1,879 | | | $ | (150 | ) |
Amount of loss reclassed from AOCI into income - Included Component | | | 2,074 | | | | — | |
Amount of loss reclassed from AOCI into income - Excluded Component | | $ | (195 | ) | | $ | (150 | ) |
The following table presents the effect of the Company’s derivative financial instruments that are not designated as hedging instruments on the Income Statement consolidated statements of incomeas of the periods presented:
| | | | Amount of Gain or (Loss) Recognized in Income on Derivative | |
| | | | Year Ended December 31 | | | Year Ended December 31 | | | Year Ended December 31 | |
| | | | 2019 | | | 2018 | | | 2017 | |
| | Location of Gain or (Loss) | | (dollars in thousands) | |
Other contracts | | Other income | | $ | 311 | | | $ | 276 | | | $ | 426 | |
Total | | | | $ | 311 | | | $ | 276 | | | $ | 426 | |
| | | | Amount of Gain or (Loss) Recognized in Income on Derivative | |
| | | | Year Ended December 31 | |
| | | | 2020 | | | 2019 | | 2018 | |
| | Location of Gain or (Loss) | | (dollars in thousands) | |
Other contracts | | Other income | | $ | 155 | | | $ | 311 | | $ | 276 | |
Credit-risk-related Contingent Features
By using derivatives,entering into derivative transactions, the Company is exposed to credit risk to the extent that counterparties to the derivative contracts do not perform as required. Should a counterparty fail to perform under the terms of a derivative contract, the Company’s credit exposure on interest rate swaps is limited to the net positive fair value and accrued interest of all swaps with each counterparty. The Company seeks to minimize counterparty credit risk through credit approvals, limits, monitoring procedures, and obtaining collateral, where appropriate. Institutional counterparties must have an investment grade credit rating and be approved by the Company’s Board of Directors. As such, management believes the risk of incurring credit losses on derivative contracts with institutional counterparties is remote.
The Company has agreements with its derivative counterparties that contain a provision where if the Company defaults on any of its indebtedness, including default where repayment of the indebtedness has not been accelerated by the lender, then the Company could also be declared in default on its derivative obligations. In addition, the Company also has agreements with certain of its derivative counterparties that contain a provision where if the Company fails to maintain its status as a well-capitalizedwell- capitalized institution, then the counterparty could terminate the derivative position(s), and the Company would be required to settle its obligations under the agreements.
As of December 31, 2019 and December 31, 2018, the fair value of derivatives in a net liability position, which includes accrued interest but excludes any adjustment for nonperformance risk, related to these agreements was $9.6 million and $811,000, respectively. As of December 31, 2019 and December 31, 2018, the Company has minimum collateral posting thresholds with certain of its derivative counterparties and has posted cash collateral of $10.4 million and $260,000, respectively. If the Company had breached any of these provisions at December 31, 2019 or December 31, 2018, it could have been required to settle its obligations under the agreements at their termination value of $ 9.6 million and $811,000, respectively.
Balance Sheet Offsetting
Certain financial instruments may be eligible for offset in the consolidated balance sheet and/or subject to master netting arrangements or similar agreements. The Company’s derivative transactions with institutional counterparties are generally executed under International Swaps and Derivative Association (“ISDA”) master agreements which include “right of set-off” provisions. In such cases there is generally a legally enforceable right to offset recognized amounts and there may be an intention to settle such amounts on a net basis. Generally, the Company does not offset such financial instruments for financial reporting purposes.
The following tables present the information about financial instruments that are eligible for offset in the consolidated balance sheetConsolidated Balance Sheets as December 31, 20192020 and 2019:
| | | | Gross Amounts Not Offset | | | | | |
| | Gross Amounts Recognized | | | Gross Amounts Offset | | | Net Amounts Recognized | | | Financial Instruments | | | Collateral Pledged (Received) | | | Net Amount | |
| December 31, 2020 | |
| (dollars in thousands) | |
Offsetting of Derivative Assets | | | | | | | | | | | | | | | | | | | | | | | | |
Derivative Assets | | $ | 46,084 | | | $ | — | | | $ | 46,084 | | | $ | 7,649 | | | $ | — | | | $ | 38,435 | |
| | | | | | | | | | | | | | | | | | | | | | | | |
Offsetting of Derivative Liabilities | | | | | | | | | | | | | | | | | | | | | | | | |
Derivative Liabilities | | $ | 38,911 | | | $ | — | | | $ | 38,911 | | | $ | 7,649 | | | $ | 30,724 | | | $ | 538 | |
| | | | | | | | | |
| | | | Gross Amounts Not Offset | | | | | |
| | Gross Amounts Recognized | | | Gross Amounts Offset | | | Net Amounts Recognized | | | Financial Instruments | | | Collateral Pledged (Received) | | | Net Amount | |
| December 31, 2019 | |
| (dollars in thousands) | |
Offsetting of Derivative Assets | | | | | | | | | | | | | | | | | | | | | | | | |
Derivative Assets | | $ | 15,912 | | | $ | — | | | $ | 15,912 | | | $ | 3,128 | | | $ | - | | | $ | 12,784 | |
| | | | | | | | | | | | | | | | | | | | | | | | |
Offsetting of Derivative Liabilities | | | | | | | | | | | | | | | | | | | | | | | | |
Derivative Liabilities | | $ | 13,230 | | | $ | — | | | $ | 13,230 | | | $ | 3,128 | | | $ | 9,645 | | | $ | 457 | |
As of December 31, 2020 and December 31, 2018:2019, the fair value of derivatives in a net liability position, which includes accrued interest but excludes any adjustment for nonperformance risk, related to these agreements was $30.7 million and $9.6 million, respectively. As of December 31, 2020 and December 31, 2019, the Company has minimum collateral posting thresholds with certain of its derivative counterparties and has posted cash collateral of $29.9 million and $10.4 million, respectively, against these agreements. If the Company had breached any of these provisions at December 31, 2020 or December 31, 2019, it could have been required to settle its obligations under the agreements at their termination value of $30.7 million and $9.6 million, respectively.
| | | | Gross Amounts Not Offset | | | | | |
| | Gross Amounts of Recognized | | | Gross Amounts Offset | | | Net Amounts Recognized | | | Financial Instruments | | | Collateral Pledged (Received) | | | Net Amount | |
| December 31, 2019 | |
| (dollars in thousands) | |
Offsetting of Derivative Assets | | | | | | | | | | | | | | | | | | | | | | | | |
Derivative Assets | | $ | 15,912 | | | $ | — | | | $ | 15,912 | | | $ | 3,128 | | | $ | — | | | $ | 12,784 | |
| | | | | | | | | | | | | | | | | | | | | | | | |
Offsetting of Derivative Liabilities | | | | | | | | | | | | | | | | | | | | | | | | |
Derivative Liabilities | | $ | 13,230 | | | $ | — | | | $ | 13,230 | | | $ | 3,128 | | | $ | 9,645 | | | $ | 457 | |
| | | | | | | | | |
| | | | Gross Amounts Not Offset | | | | | |
| | Gross Amounts of Recognized | | | Gross Amounts Offset | | | Net Amounts Recognized | | | Financial Instruments | | | Collateral Pledged (Received) | | | Net Amount | |
| December 31, 2018 | |
| (dollars in thousands) | |
Offsetting of Derivative Assets | | | | | | | | | | | | | | | | | | | | | | | | |
Derivative Assets | | $ | 7,780 | | | $ | — | | | $ | 7,780 | | | $ | 3,099 | | | $ | (743 | ) | | $ | 3,938 | |
| | | | | | | | | | | | | | | | | | | | | | | | |
Offsetting of Derivative Liabilities | | | | | | | | | | | | | | | | | | | | | | | | |
Derivative Liabilities | | $ | 5,961 | | | $ | — | | | $ | 5,961 | | | $ | 3,099 | | | $ | 260 | | | $ | 2,602 | |
24.22.
| FAIR VALUE MEASUREMENTS |
The following is a summary of the carrying values and estimated fair values of the Company’s significant financial instruments as of the dates indicated:
| | December 31, 2019 | | | December 31, 2018 | | | December 31, 2020 | | | December 31, 2019 | |
| | Carrying Value | | | Estimated Fair Value | | | Carrying Value | | | Estimated Fair Value | | | Carrying Value | | | Estimated Fair Value | | | Carrying Value | | | Estimated Fair Value | |
| | (dollars in thousands) | | | (dollars in thousands) | |
Financial assets | | | | | | | | | | | | | | | | | | | | | | | | | | | | | | | | |
Cash and cash equivalents | | $ | 61,335 | | | $ | 61,335 | | | $ | 18,473 | | | $ | 18,473 | | | $ | 75,785 | | | $ | 75,785 | | | $ | 61,335 | | | $ | 61,335 | |
Securities available for sale | | | 140,330 | | | | 140,330 | | | | 168,163 | | | | 168,163 | | | | 237,030 | | | | 237,030 | | | | 140,330 | | | | 140,330 | |
Securities held to maturity | | | 258,172 | | | | 264,114 | | | | 282,869 | | | | 281,310 | | | | 247,672 | | | | 260,139 | | | | 258,172 | | | | 264,114 | |
Loans, net | | | 2,208,548 | | | | 2,160,087 | | | | 1,543,004 | | | | 1,484,905 | | | | 3,117,632 | | | | 3,092,021 | | | | 2,208,548 | | | | 2,160,087 | |
Loans held for sale | | | 1,546 | | | | 2,051 | | | | — | | | | — | | | | 6,909 | | | | 7,101 | | | | 1,546 | | | | 2,051 | |
FHLB Boston stock | | | 7,854 | | | | 7,854 | | | | 6,844 | | | | 6,844 | | | | 5,734 | | | | 5,734 | | | | 7,854 | | | | 7,854 | |
Accrued interest receivable | | | 7,052 | | | | 7,052 | | | | 5,762 | | | | 5,762 | | | | 9,514 | | | | 9,514 | | | | 7,052 | | | | 7,052 | |
Mortgage servicing rights | | | 1,321 | | | | 1,526 | | | | 666 | | | | 941 | | | | 1,219 | | | | 1,219 | | | | 1,321 | | | | 1,526 | |
Interest rate contracts | | | 2,911 | | | | 2,911 | | | | 1,970 | | | | 1,970 | | | | 7,618 | | | | 7,618 | | | | 2,911 | | | | 2,911 | |
Loan level interest rate swaps | | | 12,980 | | | | 12,980 | | | | 5,782 | | | | 5,782 | | | | 38,415 | | | | 38,415 | | | | 12,980 | | | | 12,980 | |
Risk participation agreements out to counterparties | | | 21 | | | | 21 | | | | 28 | | | | 28 | | | | 51 | | | | 51 | | | | 21 | | | | 21 | |
| | | | | | | | | | | | | | | | | | | | | | | | | | | | | | | | |
Financial liabilities | | | | | | | | | | | | | | | | | | | | | | | | | | | | | | | | |
Deposits | | | 2,358,878 | | | | 2,358,089 | | | | 1,811,410 | | | | 1,809,051 | | | | 3,403,083 | | | | 3,403,832 | | | | 2,358,878 | | | | 2,358,089 | |
Short-term borrowings | | | 135,691 | | | | 135,744 | | | | 90,000 | | | | 90,000 | | |
Long-term borrowings | | | — | | | | — | | | | 3,409 | | | | 3,363 | | |
Borrowings | | | | 32,992 | | | | 34,284 | | | | 135,691 | | | | 135,744 | |
Loan level interest rate swaps | | | 12,980 | | | | 12,980 | | | | 5,782 | | | | 5,782 | | | | 38,415 | | | | 38,415 | | | | 12,980 | | | | 12,980 | |
Risk participation agreements in with counterparties | | | 250 | | | | 250 | | | | 179 | | | | 179 | | | | 496 | | | | 496 | | | | 250 | | | | 250 | |
The Company follows ASC 820, “Fair Value Measurements and Disclosures,” for financial assets and liabilities. ASC 820 defines fair value, establishes a framework for measuring fair value, and expands disclosure requirements about fair value measurements. ASC 820, among other things, emphasizes that fair value is a market-based measurement, not an entity-specific measurement, and states that a fair value measurement should be determined based on the assumptions the market participants would use in pricing the asset or liability. In addition, ASC 820 specifies a hierarchy of valuation techniques based on whether the types of valuation information (“inputs”) are observable or unobservable. Observable inputs reflect market data obtained from independent sources, while unobservable inputs reflect the Company’s market assumptions. These two types of inputs have created the following fair value hierarchy:
Level 1 – Quoted prices for identical assets or liabilities in active markets.
| • | Level 1 – Quoted prices for identical assets or liabilities in active markets. |
Level 2 – Quoted prices for similar assets or liabilities in active markets; quoted prices for identical or similar assets or liabilities in inactive markets; and model-derived valuations in which all significant inputs and significant value drivers are observable in active markets.
| • | Level 2 – Quoted prices for similar assets or liabilities in active markets; quoted prices for identical or similar assets or liabilities in inactive markets; and model-derived valuations in which all significant inputs and significant value drivers are observable in active markets. |
Level 3 – Valuations derived from techniques in which one or more significant inputs or significant value drivers are unobservable in the markets and which reflect the Company’s market assumptions.
| • | Level 3 – Valuations derived from techniques in which one or more significant inputs or significant value drivers are unobservable in the markets and which reflect the Company’s market assumptions. |
Under ASC 820, fair values are based on the price that would be received to sell an asset or paid to transfer a liability in an orderly transaction between market participants at the measurement date. When available, the Company uses quoted market prices to determine fair value. If quoted prices are not available, fair value is based upon valuation techniques, such as matrix pricing or other models that use, where possible, current market-based or independently sourced market parameters, such as interest rates. If observable market-based inputs are not available, the Company uses unobservable inputs to determine appropriate valuation adjustments using methodologies applied consistently over time.
Valuation techniques based on unobservable inputs are highly subjective and require judgments regarding significant matters, such as the amount and timing of future cash flows and the selection of discount rates that may appropriately reflect market and credit risks.
Changes in these judgments often have a material impact on the fair value estimates. In addition, since these estimates are as of a specific point in time, they are susceptible to material near-term changes. The fair values disclosed do not reflect any premium or discount that could result from offering significant holdings of financial instruments at bulk sale, nor do they reflect the possible tax ramifications or estimated transaction costs. Changes in economic conditions may also dramatically affect the estimated fair values.
The Company uses fair value measurements to record fair value adjustments to certain assets and liabilities and to determine fair value disclosures. Securities available for sale, derivative instruments, and hedges are recorded at fair value on a recurring basis. Additionally, from time to time, the Company may be required to record at fair value other assets on a nonrecurring basis, such as loans held for sale, mortgage servicing rights, other real estate owned, and collateral dependent impaired loans. In accordance with the requirements of ASU 2016-01, theThe Company uses an exit price notion for its fair value disclosures.
The following tables summarize certain assets reported at fair value on a recurring basis:
| | Fair Value as of December 31, 2019 | | | Fair Value as of December 31, 2020 | |
| | Level 1 | | | Level 2 | | | Level 3 | | | Total | | | Level 1 | | | Level 2 | | | Level 3 | | | Total | |
| | (dollars in thousands) | | | (dollars in thousands) | |
Measured on a recurring basis | | | | | | | | | | | | | | | | | | | | | | | | | | | | | | | | |
Securities available for sale | | | | | | | | | | | | | | | | | | | | | | | | | | | | | | | | |
U.S. GSE obligations | | $ | — | | | $ | 37,848 | | | $ | — | | | $ | 37,848 | | | $ | — | | | $ | 23,617 | | | $ | — | | | $ | 23,617 | |
Mortgage-backed securities | | | — | | | | 102,482 | | | | — | | | | 102,482 | | | | — | | | | 210,630 | | | | — | | | | 210,630 | |
Corporate debt securities | | | — | | | | — | | | | — | | | | — | | | | — | | | | 2,783 | | | | — | | | | 2,783 | |
Other assets | | | | | | | | | | | | | | | | | | | | | | | | | | | | | | | | |
Interest rate swaps with customers | | | — | | | | 12,980 | | | | — | | | | 12,980 | | | | — | | | | 38,415 | | | | — | | | | 38,415 | |
Risk participation agreements out to counterparties | | | — | | | | 21 | | | | — | | | | 21 | | | | — | | | | 51 | | | | — | | | | 51 | |
Interest rate contracts | | | — | | | | 2,911 | | | | — | | | | 2,911 | | | | — | | | | 7,618 | | | | — | | | | 7,618 | |
Other liabilities | | | | | | | | | | | | | | | | | | | | | | | | | | | | | | | | |
Mirror swaps with counterparties | | | — | | | | 12,980 | | | | — | | | | 12,980 | | | | — | | | | 38,415 | | | | — | | | | 38,415 | |
Risk participation agreements in with counterparties | | | — | | | | 250 | | | | — | | | | 250 | | | | — | | | | 496 | | | | — | | | | 496 | |
| | Fair Value as of December 31, 2018 | | | Fair Value as of December 31, 2019 | |
| | Level 1 | | | Level 2 | | | Level 3 | | | Total | | | Level 1 | | | Level 2 | | | Level 3 | | | Total | |
| | (dollars in thousands) | | | (dollars in thousands) | |
Measured on a recurring basis | | | | | | | | | | | | | | | | | | | | | | | | | | | | | | | | |
Securities available for sale | | | | | | | | | | | | | | | | | | | | | | | | | | | | | | | | |
U.S. GSE obligations | | $ | — | | | $ | 74,039 | | | $ | — | | | $ | 74,039 | | | $ | — | | | $ | 37,848 | | | $ | — | | | $ | 37,848 | |
Mortgage-backed securities | | | — | | | | 89,268 | | | | — | | | | 89,268 | | | | — | | | | 102,482 | | | | — | | | | 102,482 | |
Corporate debt securities | | | — | | | | 4,856 | | | | — | | | | 4,856 | | |
Other assets | | | | | | | | | | | | | | | | | | | | | | | | | | | | | | | | |
Interest rate swaps with customers | | | — | | | | 5,782 | | | | — | | | | 5,782 | | | | — | | | | 12,980 | | | | — | | | | 12,980 | |
Risk participation agreements out to counterparties | | | — | | | | 28 | | | | — | | | | 28 | | | | — | | | | 21 | | | | — | | | | 21 | |
Interest rate contracts | | | — | | | | 1,970 | | | | — | | | | 1,970 | | | | — | | | | 2,911 | | | | — | | | | 2,911 | |
Other liabilities | | | | | | | | | | | | | | | | | | | | | | | | | | | | | | | | |
Mirror swaps with counterparties | | | — | | | | 5,782 | | | | — | | | | 5,782 | | | | — | | | | 12,980 | | | | — | | | | 12,980 | |
Risk participation agreements in with counterparties | | | — | | | | 179 | | | | — | | | | 179 | | | | — | | | | 250 | | | | — | | | | 250 | |
The following table presents the carrying value of assets held at December 31, 2020 and 2019, which were measured at fair value on a non-recurring basis:
| | December 31, 2019 | | | December 31, 2020 | |
| | Level 1 | | | Level 2 | | | Level 3 | | | Total | | | Level 1 | | | Level 2 | | | Level 3 | | | Total | |
| | (dollars in thousands) | | | (dollars in thousands) | |
Items recorded at fair value on a non-recurring basis | | | | | | | | | | | | | | | | | | | | | | | | | | | | | | | | |
Assets | | | | | | | | | | | | | | | | | | | | | | | | | | | | | | | | |
Collateral dependent impaired loans | | $ | — | | | $ | — | | | $ | 2,541 | | | $ | 2,541 | | |
Mortgage servicing rights | | | $ | — | | | $ | — | | | $ | 1,219 | | | $ | 1,219 | |
Loans held for sale | | | 1,546 | | | | — | | | | — | | | | 1,546 | | | | 6,909 | | | | — | | | | — | | | | 6,909 | |
Individually evaluated collateral dependent loans | | | | — | | | | — | | | | 672 | | | | 672 | |
Other real estate owned | | | — | | | | — | | | | 163 | | | | 163 | | | | — | | | | — | | | | 1,820 | | | | 1,820 | |
Total | | $ | 1,546 | | | $ | — | | | $ | 2,704 | | | $ | 4,250 | | | $ | 6,909 | | | $ | — | | | $ | 3,711 | | | $ | 10,620 | |
| | December 31, 2019 | |
| | Level 1 | | | Level 2 | | | Level 3 | | | Total | |
| | (dollars in thousands) | |
Items recorded at fair value on a non-recurring basis | | | | | | | | | | | | | | | | |
Assets | | | | | | | | | | | | | | | | |
Loans held for sale | | | 1,546 | | | | — | | | | — | | | | 1,546 | |
Individually evaluated collateral dependent loans | | | — | | | | — | | | | 2,541 | | | | 2,541 | |
Other real estate owned | | | — | | | | — | | | | 163 | | | | 163 | |
Total | | $ | 1,546 | | | $ | — | | | $ | 2,704 | | | $ | 4,250 | |
CollateralIndividually evaluated collateral dependent impaired loans. Collateral dependent loans are carried at the lower of cost or fair value of the collateral less estimated costs to sell which approximates fair value. The Company uses the appraisal value of the collateral and applies certain adjustments depending on the nature, quality, and type of collateral securing the loan.
Loans held for sale. Loans held for sale are carried at the lower of fair value or carrying value (unpaid principal and unamortized loans fees).
Other Real Estate Owned.These properties are carried at fair value less estimated costs to sell. There were no
Mortgage servicing rights. These assets measuredare carried at the fair value on a non-recurring basis duringdetermined by estimating the year ended December 31, 2018.present value of future net cash flows, taking into consideration market loan prepayment speeds, discount rates, servicing costs, and other economic factors.
There were no0 transfers between fair value levels for the years ended December 31, 20192020 and 2018.2019.
The following is a description of the principal valuation methodologies used by the Company to estimate the fair values of its financial instruments.
Investment Securities
For investment securities, fair values are primarily based upon valuations obtained from a national pricing service which uses matrix pricing with inputs that are observable in the market or can be derived from, or corroborated by, observable market data. When available, quoted prices in active markets for identical securities are utilized.
Loans Held for Sale
For loans held for sale, fair values are estimated using projected future cash flows, discounted at rates based upon either trades of similar loans or mortgage-backed securities, or at current rates at which similar loans would be made to borrowers with similar credit ratings and for similar remaining maturities.
Loans
For most categories of loans, fair values are estimated using projected future cash flows, discounted at rates based upon current rates at which similar loans would be made to borrowers with similar credit ratings, and for similar remaining maturities. Projected estimated cash flows are adjusted for prepayment assumptions, liquidity premium assumptions, and credit loss assumptions. Loans that are deemed to be impaired in accordance with ASC 310, “Receivables,” are valued based upon the lower of cost or fair value of the underlying collateral.
FHLB of Boston Stock
The fair value of FHLB of Boston stock equals its carrying value since such stock is only redeemable at its par value.
Deposits
The fair value of non-maturity deposit accounts is the amount payable on demand at the reporting date. This amount does not take into account the value of the Bank’sCompany’s long-term relationships with core depositors. The fair value of fixed-maturity certificates of deposit is estimated using a replacement cost of funds approach and is based upon rates currently offered for deposits of similar remaining maturities.
Long-Term Borrowings
For long-term borrowings, fair values are estimated using future cash flows, discounted at rates based upon current costs for debt securities with similar terms and remaining maturities.
Other Financial Assets and Liabilities
Cash and cash equivalents, accrued interest receivable, and short-term borrowings have fair values which approximate their respective carrying values because these instruments are payable on demand or have short-term maturities and present relatively low credit risk and interest rate risk.
Derivative Instruments and Hedges
The valuation of these instruments is determined using widely accepted valuation techniques including discounted cash flow analysis on the expected cash flows of each derivative. This analysis reflects the contractual terms of the derivatives, including the period to maturity, and uses observable market-based inputs, including interest rate curves and implied volatilities. The BankCompany incorporates credit valuation adjustments to appropriately reflect nonperformance risk in the fair value measurements. In adjusting the fair value of its derivative contracts for the effect of nonperformance risk, the BankCompany has considered the impact of netting and any applicable credit enhancements, such as collateral postings.
Off-Balance-Sheet Financial Instruments
In the course of originating loans and extending credit, the BankCompany will charge fees in exchange for its commitment. While these commitment fees have value, the BankCompany has not estimated their value due to the short-term nature of the underlying commitments and their immateriality.
Values Not Determined
In accordance with ASC 820, the Company has not estimated fair values for non-financial assets such as banking premises and equipment, goodwill, the intangible value of the Bank’sCompany’s portfolio of loans serviced for itself, and the intangible value inherent in the Bank’sCompany’s deposit relationships (i.e., core deposits), among others. Accordingly, the aggregate fair value amounts presented do not represent the underlying value of the Company.
25.23.
| Quarterly Results of Operations (unaudited) |
2019 Quarters | | Fourth | | | Third | | | Second | | | First | | |
2020 Quarters | | | Fourth | | | Third | | | Second | | | First | |
| | (dollars in thousands, except share data) | | | (dollars in thousands, except share data) | |
Interest and Dividend Income | | $ | 26,415 | | | $ | 26,336 | | | $ | 24,470 | | | $ | 19,118 | | | $ | 35,870 | | | $ | 36,881 | | | $ | 30,531 | | | $ | 26,095 | |
Interest Expense | | | 4,807 | | | | 5,285 | | | | 4,694 | | | | 2,857 | | | | 1,789 | | | | 1,919 | | | | 1,742 | | | | 3,695 | |
Net Interest and Dividend Income | | | 21,608 | | | | 21,051 | | | | 19,776 | | | | 16,261 | | | | 34,081 | | | | 34,962 | | | | 28,789 | | | | 22,400 | |
Provision for (Release of) Loan Losses | | | 331 | | | | 2,170 | | | | 596 | | | | (93 | ) | |
Net Interest and Dividend Income after Provision for Loan Losses | | | 21,277 | | | | 18,881 | | | | 19,180 | | | | 16,354 | | |
Provision for (Release of) Credit Losses | | | | (120 | ) | | | 2,000 | | | | 14,430 | | | | 2,000 | |
Net Interest and Dividend Income after Provision for Credit Losses | | | | 34,201 | | | | 32,962 | | | | 14,359 | | | | 20,400 | |
Noninterest Income | | | 9,933 | | | | 10,366 | | | | 8,145 | | | | 7,957 | | | | 10,802 | | | | 10,933 | | | | 8,972 | | | | 8,818 | |
Noninterest Expense | | | 21,428 | | | | 18,863 | | | | 21,513 | | | | 16,373 | | | | 27,127 | | | | 25,445 | | | | 25,587 | | | | 19,925 | |
Income Before Taxes | | | 9,782 | | | | 10,384 | | | | 5,812 | | | | 7,938 | | |
Income (Loss) Before Taxes | | | | 17,876 | | | | 18,450 | | | | (2,256 | ) | | | 9,293 | |
Income Taxes | | | 2,673 | | | | 2,708 | | | | 1,540 | | | | 1,740 | | | | 4,862 | | | | 5,021 | | | | (540 | ) | | | 2,061 | |
Net Income | | $ | 7,109 | | | $ | 7,676 | | | $ | 4,272 | | | $ | 6,198 | | |
Net Income (Loss) | | | $ | 13,014 | | | $ | 13,429 | | | $ | (1,716 | ) | | $ | 7,232 | |
Share Data: | | | | | | | | | | | | | | | | | | | | | | | | | | | | | | | | |
Average Shares Outstanding, Basic | | | 4,939,973 | | | | 4,815,020 | | | | 4,682,109 | | | | 4,072,805 | | | | 6,897,450 | | | | 6,918,692 | | | | 5,912,889 | | | | 5,397,040 | |
Average Shares Outstanding, Diluted | | | 4,980,439 | | | | 4,842,965 | | | | 4,715,724 | | | | 4,106,658 | | | | 6,970,542 | | | | 6,954,324 | | | | 5,912,889 | | | | 5,432,099 | |
Basic Earnings Per Share | | $ | 1.43 | | | $ | 1.58 | | | $ | 0.91 | | | $ | 1.51 | | |
Diluted Earnings Per Share | | $ | 1.42 | | | $ | 1.57 | | | $ | 0.90 | | | $ | 1.49 | | |
Basic Earnings (Loss) Per Share | | | $ | 1.88 | | | $ | 1.94 | | | $ | (0.29 | ) | | $ | 1.34 | |
Diluted Earnings (Loss) Per Share | | | $ | 1.86 | | | $ | 1.93 | | | $ | (0.29 | ) | | $ | 1.33 | |
2018 Quarters | | Fourth | | | Third | | | Second | | | First | |
| | (dollars in thousands, except share data) | |
Interest and Dividend Income | | $ | 18,385 | | | $ | 17,602 | | | $ | 16,936 | | | $ | 16,132 | |
Interest Expense | | | 1,975 | | | | 1,431 | | | | 1,082 | | | | 979 | |
Net Interest and Dividend Income | | | 16,410 | | | | 16,171 | | | | 15,854 | | | | 15,153 | |
Provision for (Release of) Loan Losses | | | 715 | | | | 457 | | | | (79 | ) | | | 409 | |
Net Interest and Dividend Income after Provision for Loan Losses | | | 15,695 | | | | 15,714 | | | | 15,933 | | | | 14,744 | |
Noninterest Income | | | 8,038 | | | | 8,929 | | | | 7,844 | | | | 8,178 | |
Noninterest Expense | | | 16,842 | | | | 15,879 | | | | 15,765 | | | | 15,501 | |
Income Before Taxes | | | 6,891 | | | | 8,764 | | | | 8,012 | | | | 7,421 | |
Income Taxes | | | 1,585 | | | | 2,105 | | | | 1,901 | | | | 1,616 | |
Net Income | | $ | 5,306 | | | $ | 6,659 | | | $ | 6,111 | | | $ | 5,805 | |
Share Data: | | | | | | | | | | | | | | | | |
Average Shares Outstanding, Basic | | | 4,065,681 | | | | 4,064,620 | | | | 4,059,927 | | | | 4,053,355 | |
Average Shares Outstanding, Diluted | | | 4,102,546 | | | | 4,101,378 | | | | 4,094,489 | | | | 4,071,975 | |
Basic Earnings Per Share | | $ | 1.29 | | | $ | 1.62 | | | $ | 1.49 | | | $ | 1.42 | |
Diluted Earnings Per Share | | $ | 1.28 | | | $ | 1.61 | | | $ | 1.48 | | | $ | 1.41 | |
2019 Quarters | | Fourth | | | Third | | | Second | | | First | |
| | (dollars in thousands, except share data) | |
Interest and Dividend Income | | $ | 26,415 | | | $ | 26,336 | | | $ | 24,470 | | | $ | 19,118 | |
Interest Expense | | | 4,807 | | | | 5,285 | | | | 4,694 | | | | 2,857 | |
Net Interest and Dividend Income | | | 21,608 | | | | 21,051 | | | | 19,776 | | | | 16,261 | |
Provision for (Release of) Loan Losses | | | 331 | | | | 2,170 | | | | 596 | | | | (93 | ) |
Net Interest and Dividend Income after Provision for Loan Losses | | | 21,277 | | | | 18,881 | | | | 19,180 | | | | 16,354 | |
Noninterest Income | | | 9,933 | | | | 10,366 | | | | 8,145 | | | | 7,957 | |
Noninterest Expense | | | 21,428 | | | | 18,863 | | | | 21,513 | | | | 16,373 | |
Income Before Taxes | | | 9,782 | | | | 10,384 | | | | 5,812 | | | | 7,938 | |
Income Taxes | | | 2,673 | | | | 2,708 | | | | 1,540 | | | | 1,740 | |
Net Income | | $ | 7,109 | | | $ | 7,676 | | | $ | 4,272 | | | $ | 6,198 | |
Share Data: | | | | | | | | | | | | | | | | |
Average Shares Outstanding, Basic | | | 4,939,973 | | | | 4,815,020 | | | | 4,682,109 | | | | 4,072,805 | |
Average Shares Outstanding, Diluted | | | 4,980,439 | | | | 4,842,965 | | | | 4,715,724 | | | | 4,106,658 | |
Basic Earnings Per Share | | $ | 1.43 | | | $ | 1.58 | | | $ | 0.91 | | | $ | 1.51 | |
Diluted Earnings Per Share | | $ | 1.42 | | | $ | 1.57 | | | $ | 0.90 | | | $ | 1.49 | |
26.24.
| Condensed Financial Statements of Parent Company |
The condensed balance sheets of Cambridge Bancorp, the Parent Company, as of December 31, 2019 2020and 20182019 and the condensed statements of income and cash flows for each of the years in the three-year period ended December 31, 20192020 are presented below. The statements of changes in shareholders’ equity are identical to the consolidated statements of changes in shareholders’ equity and are therefore not presented here.
Condensed Balance Sheet
| | December 31, | | | December 31, | |
| | 2019 | | | 2018 | | | 2020 | | | 2019 | |
| | (dollars in thousands) | | | (dollars in thousands) | |
ASSETS | | | | | | | | | | | | | | | | |
Cash and cash equivalents | | $ | 1,680 | | | $ | 4,412 | | | $ | 1,920 | | | $ | 1,680 | |
Goodwill | | | | 33 | | | | — | |
Other assets | | | 13 | | | | — | | | | 260 | | | | 13 | |
Investment in subsidiary | | | 284,868 | | | | 162,614 | | | | 399,519 | | | | 284,868 | |
Total assets | | $ | 286,561 | | | $ | 167,026 | | | $ | 401,732 | | | $ | 286,561 | |
SHAREHOLDERS’ EQUITY | | | | | | | | | | | | | | | | |
Shareholders’ equity | | $ | 286,561 | | | $ | 167,026 | | | $ | 401,732 | | | $ | 286,561 | |
Total shareholders’ equity | | $ | 286,561 | | | $ | 167,026 | | | $ | 401,732 | | | $ | 286,561 | |
Condensed Statements of Income
| | For the Year Ended December 31, | | | For the Year Ended December 31, | |
| | 2019 | | | 2018 | | | 2017 | | | 2020 | | | 2019 | | | 2018 | |
| | (dollars in thousands) | | | (dollars in thousands) | |
Income | | | | | | | | | | | | | | | | | | | | | | | | |
Dividends from subsidiary | | $ | 10,732 | | | $ | 8,615 | | | $ | 8,052 | | | $ | 21,639 | | | $ | 10,732 | | | $ | 8,615 | |
Total income | | | 10,732 | | | | 8,615 | | | | 8,052 | | | | 21,639 | | | | 10,732 | | | | 8,615 | |
Expenses | | | | | | | | | | | | | | | | | | | | | | | | |
Interest expense | | | | 444 | | | | — | | | | — | |
Other expenses | | | 132 | | | | 116 | | | | — | | | | 110 | | | | 132 | | | | 116 | |
Total expenses | | | 132 | | | | 116 | | | | — | | | | 554 | | | | 132 | | | | 116 | |
Income before income taxes and equity in undistributed income of subsidiary | | | 10,600 | | | | 8,499 | | | | 8,052 | | | | 21,085 | | | | 10,600 | | | | 8,499 | |
Income tax benefit | | | (36 | ) | | | (32 | ) | | | — | | | | (153 | ) | | | (36 | ) | | | (32 | ) |
Income of parent company | | | 10,636 | | | | 8,531 | | | | 8,052 | | | | 21,238 | | | | 10,636 | | | | 8,531 | |
Equity in undistributed income of subsidiary | | | 14,621 | | | | 15,350 | | | | 6,764 | | | | 10,721 | | | | 14,621 | | | | 15,350 | |
Net income | | $ | 25,257 | | | $ | 23,881 | | | $ | 14,816 | | | $ | 31,959 | | | $ | 25,257 | | | $ | 23,881 | |
Condensed Statements of Cash Flows
| | For the Year Ended December 31, | | | For the Year Ended December 31, | |
| | 2019 | | | 2018 | | | 2017 | | | 2020 | | | 2019 | | | 2018 | |
| | (dollars in thousands) | | | (dollars in thousands) | |
CASH FLOWS FROM OPERATING ACTIVITIES: | | | | | | | | | | | | | | | | | | | | | | | | |
Net income | | $ | 25,257 | | | $ | 23,881 | | | $ | 14,816 | | | $ | 31,959 | | | $ | 25,257 | | | $ | 23,881 | |
Adjustments to reconcile net income to net cash provided by operating activities | | | | | | | | | | | | | | | | | | | | | | | | |
Deferred income tax (benefit)/expense | | | | (153 | ) | | | — | | | | — | |
Change in other assets, net | | | (13 | ) | | | — | | | | — | | | | 3,032 | | | | (13 | ) | | | — | |
Change in other liabilities, net | | | | 444 | | | | — | | | | — | |
Undistributed income of subsidiary | | | (14,621 | ) | | | (15,350 | ) | | | (6,764 | ) | | | (10,721 | ) | | | (14,621 | ) | | | (15,350 | ) |
Net cash provided by operating activities | | | 10,623 | | | | 8,531 | | | | 8,052 | | | | 24,561 | | | | 10,623 | | | | 8,531 | |
CASH FLOWS FROM INVESTING ACTIVITIES: | | | | | | | | | | | | | | | | | | | | | | | | |
Cash paid in business combinations | | | (3,525 | ) | | | — | | | | — | | | | (534 | ) | | | (3,525 | ) | | | — | |
Investment in subsidiary | | | (38,202 | ) | | | — | | | | — | | | | — | | | | (38,202 | ) | | | — | |
Net cash (used in)/provided by investing activities | | | (41,727 | ) | | | — | | | | — | | | | (534 | ) | | | (41,727 | ) | | | — | |
CASH FLOWS FROM FINANCING ACTIVITIES: | | | | | | | | | | | | | | | | | | | | | | | | |
Proceeds from the issuance of common stock | | | 38,576 | | | | 761 | | | | 1,522 | | | | 452 | | | | 38,576 | | | | 761 | |
Repurchase of common stock | | | (687 | ) | | | (574 | ) | | | (470 | ) | | | (556 | ) | | | (687 | ) | | | (574 | ) |
Redemption of subordinate debt | | | | (10,600 | ) | | | — | | | | — | |
Cash dividends paid on common stock | | | (9,517 | ) | | | (8,041 | ) | | | (7,582 | ) | | | (13,083 | ) | | | (9,517 | ) | | | (8,041 | ) |
Net cash provided by/(used in) financing activities | | | 28,372 | | | | (7,854 | ) | | | (6,530 | ) | | | (23,787 | ) | | | 28,372 | | | | (7,854 | ) |
Net increase (decrease) in cash | | | (2,732 | ) | | | 677 | | | | 1,522 | | | | 240 | | | | (2,732 | ) | | | 677 | |
Cash at beginning of year | | | 4,412 | | | | 3,735 | | | | 2,213 | | | | 1,680 | | | | 4,412 | | | | 3,735 | |
Cash at end of year | | $ | 1,680 | | | $ | 4,412 | | | $ | 3,735 | | | $ | 1,920 | | | $ | 1,680 | | �� | $ | 4,412 | |
SUPPLEMENTAL DISCLOSURES OF CASH FLOW INFORMATION: | | | | | | | | | | | | | |
Significant non-cash transactions | | | | | | | | | | | | | |
Common Stock issued to shareholders due to merger | | | $ | 87,163 | | | $ | 59,417 | | | $ | — | |
Report of Independent RegisteredRegistered Public Accounting Firm
To the ShareholdersStockholders and the Board of Directors
Bancorp:Bancorp
Opinion on the Consolidated Financial Statements
We have audited the accompanying consolidated balance sheetssheet of Cambridge Bancorp and subsidiaries (the Company) as of December 31, 2019 and 2018,2020, the related consolidated statements of income, comprehensive income, (loss), changes in shareholders’stockholders’ equity, and cash flows for each of the years in the three‑year periodthen ended December 31, 2019, and the related notes (collectively referred to as the consolidated financial statements). In our opinion, the consolidated financial statements present fairly, in all material respects, the financial position of the Company as of December 31, 2019 and 2018,2020, and the results of its operations and its cash flows for each of the years in the three‑year periodthen ended December 31, 2019, in conformity with U.S.accounting principles generally accepted accounting principles.in the United States of America.
We have also have audited, in accordance with the standards of the Public Company Accounting Oversight Board (United States) (PCAOB), the Company’s internal control over financial reporting as of December 31, 2019,2020, based on criteria established in Internal Control –- Integrated Framework (2013) issued by the Committee of Sponsoring Organizations of the Treadway Commission (COSO) and our report dated March 16, 202015, 2021 expressed an unqualified opinion on the effectiveness of the Company’sCompany's internal control over financial reporting.
Basis for Opinion
These consolidated financial statements are the responsibility of the Company’s management. Our responsibility is to express an opinion on these consolidatedthe Company's financial statements based on our audits.audit. We are a public accounting firm registered with the PCAOB and are required to be independent with respect to the Company in accordance with the U.S. federal securities laws and the applicable rules and regulations of the Securities and Exchange Commission and the PCAOB.
We conducted our auditsaudit in accordance with the standards of the PCAOB. Those standards require that we plan and perform the audit to obtain reasonable assurance about whether the consolidated financial statements are free of material misstatement, whether due to error or fraud. Our auditsaudit included performing procedures to assess the risks of material misstatement of the consolidated financial statements, whether due to error or fraud, and performing procedures that respond to those risks. Such procedures included examining, on a test basis, evidence regarding the amounts and disclosures in the consolidated financial statements. Our auditsaudit also included evaluating the accounting principles used and significant estimates made by management, as well as evaluating the overall presentation of the consolidated financial statements. We believe that our audits provideaudit provides a reasonable basis for our opinion.
Critical Audit Matters
The critical audit matters communicated below are matters arising from the current period audit of the financial statements that were communicated or required to be communicated to the Company’s Audit Committee and that: (1) relate to accounts or disclosures that are material to the financial statements and (2) involved our especially challenging, subjective, or complex judgments. The communication of critical audit matters does not alter in any way our opinion on the financial statements, taken as a whole, and we are not, by communicating the critical audit matters below, providing a separate opinion on the critical audit matters or on the accounts or disclosures to which they relate.
Adoption of Accounting Standards Update No. 2016-13, Financial Instruments-Credit Losses
Critical Audit Matter Description
As described in Note 3 to the financial statements, on January 1, 2020, the Company adopted Accounting Standards Update (ASU) No. 2016-13, Financial Instruments-Credit Losses, which introduces a Current Expected Credit Losses (CECL) model to estimate credit losses over the remaining expected life of the Company’s loan portfolio, rather than the incurred loss model applied in prior periods. Estimates of expected credit losses under the CECL model are based on relevant information about past events, current conditions, and reasonable and supportable forward-looking forecasts regarding the collectability of the loan portfolio.
To estimate expected loan credit losses, the Company implemented new credit loss systems aligned with the CECL model and determined:
| • | the method of calculation to be used; |
| • | the role of peer loss data and the appropriate peer group; |
| • | the economic factor(s) indicative of expected losses; |
| • | the length of the reasonable and supportable forecast period; |
| • | estimated loan cash flows and corresponding expected duration of loans; |
| • | the method of determining and applying qualitative factors. |
We determined that performing procedures relating to these aspects of the Company’s adoption of ASU 2016-13 is a critical audit matter. The principal considerations for our determination are (i) the application of significant judgment and estimation on the part of management, which in turn led to a high degree of auditor judgment and subjectivity in performing procedures and evaluating audit evidence obtained, and (ii) significant audit effort was necessary in evaluating management’s methodology, significant assumptions and calculations.
How the Critical Audit Matter Was Addressed in the Audit
Addressing the matter involved performing procedures and evaluating audit evidence in connection with forming our overall opinion on the financial statements. These procedures included, among others:
| • | tests of the design and operating effectiveness of management’s controls covering the key assumptions and judgments of its CECL estimation model, and the selection and application of new accounting policies; |
| • | tests of the Company’s methodology for the determination of its peer group and the completeness and accuracy of information included in peer group data and how it is used in the Company’s allowance for credit loss calculation; |
| • | tests of the model loan cash flow and qualitative factor determinations. |
Allowance for Credit Losses – Qualitative Factors
Critical Audit Matter Description
As described in Notes 2 and 7 to the financial statements, the Company has recorded an allowance for credit losses for its loan portfolio in the amount of $36.0 million as of December 31, 2020, representing management’s estimate of credit losses over the remaining expected life of the Company’s loan portfolio as of that date. Management determined this amount, and corresponding provision for credit loss expense, pursuant to the application of Accounting Standards Codification Topic 326, Financial Instruments – Credit Losses which was adopted by the Company on January 1, 2020.
The Company’s methodology to determine its allowance for credit losses incorporates qualitative assessments of current loan portfolio and economic conditions and the application of forecasted economic conditions. We determined that performing procedures relating to these components of the Company’s methodology is a critical audit matter. The principal considerations for our determination are (i) the application of significant judgment and estimation on the part of management, which in turn led to a high degree of auditor judgment and subjectivity in performing procedures and evaluating audit evidence obtained, and (ii) significant audit effort was necessary in evaluating management’s methodology, significant assumptions and calculations.
How the Critical Audit Matter was addressed in the Audit
Addressing the matter involved performing procedures and evaluating audit evidence in connection with forming our overall opinion on the financial statements. These procedures included testing the effectiveness of controls relating to the Company’s determination of qualitative factors and forecasted economic conditions. These procedures also included, among others, testing management’s process for determining the qualitative reserve component, evaluating the appropriateness of management’s methodology relating to the qualitative reserve component and testing the completeness and accuracy of data utilized by management.
/s/ KPMG LLPWolf & Company, P.C.
Boston, Massachusetts
March 15, 2021
We have served as the Company’s auditor since 2006.
Boston, Massachusetts
March 16, 2020
2020.
Report of Independent Registered Public Accounting Firm
To the Shareholders and the Board of Directors
Opinion on the Internal Control Over Financial Reporting
We have audited Cambridge Bancorp and subsidiaries’ (the Company)“Company”) internal control over financial reporting as of December 31, 2019,2020, based on criteria established inInternal Control – Integrated Framework (2013)issued by the Committee of Sponsoring Organizations of the Treadway Commission.Commission in 2013. In our opinion, the Company maintained, in all material respects, effective internal control over financial reporting as of December 31, 2019,2020, based on criteria established in Internal Control – Integrated Framework (2013) issued by the Committee of Sponsoring Organizations of the Treadway Commission.Commission in 2013.
We have also have audited, in accordance with the standards of the Public Company Accounting Oversight Board (United States) (PCAOB)(“PCAOB”), the December 31, 2020 consolidated balance sheetsfinancial statements of the Company as of December 31, 2019 and 2018, the related consolidated statements of income, comprehensive income (loss), changes in shareholders’ equity, and cash flows for each of the years in the three-year period ended December 31, 2019, and the related notes (collectively, the consolidated financial statements), and our report dated March 16, 202015, 2021 expressed an unqualified opinion on those consolidated financial statements.opinion.
Basis for Opinion
The Company’s management is responsible for maintaining effective internal control over financial reporting and for its assessment of the effectiveness of internal control over financial reporting included in the accompanying Management’s Report on Internal Control overOver Financial Reporting.Reporting. Our responsibility is to express an opinion on the Company’s internal control over financial reporting based on our audit. We are a public accounting firm registered with the PCAOB and are required to be independent with respect to the Company in accordance with the U.S. federal securities laws and the applicable rules and regulations of the Securities and Exchange Commission and the PCAOB.
We conducted our audit in accordance with the standards of the PCAOB. Those standards require that we plan and perform the audit to obtain reasonable assurance about whether effective internal control over financial reporting was maintained in all material respects. Our audit of internal control over financial reporting included obtaining an understanding of internal control over financial reporting, assessing the risk that a material weakness exists, and testing and evaluating the design and operating effectiveness of internal control based on the assessed risk. Our audit also included performing such other procedures as we considered necessary in the circumstances. We believe that our audit provides a reasonable basis for our opinion.
Definition and Limitations of Internal Control Over Financial Reporting
A company’s internal control over financial reporting is a process designed to provide reasonable assurance regarding the reliability of financial reporting and the preparation of financial statements for external purposes in accordance with generally accepted accounting principles. A company’s internal control over financial reporting includes those policies and procedures that (1) pertain to the maintenance of records that, in reasonable detail, accurately and fairly reflect the transactions and dispositions of the assets of the company; (2) provide reasonable assurance that transactions are recorded as necessary to permit preparation of financial statements in accordance with generally accepted accounting principles, and that receipts and expenditures of the company are being made only in accordance with authorizations of management and directors of the company; and (3) provide reasonable assurance regarding prevention or timely detection of unauthorized acquisition, use or disposition of the company’scompany's assets that could have a material effect on the financial statements.
Because of its inherent limitations, internal control over financial reporting may not prevent or detect misstatements. Also, projections of any evaluation of effectiveness to future periods are subject to the risk that controls may become inadequate because of changes in conditions, or that the degree of compliance with the policies or procedures may deteriorate.deteriorate
/s/ Wolf & Company, P.C.
Boston, Massachusetts
March 15, 2021
Report of Independent Registered Public Accounting Firm
To the Shareholders and Board of Directors
Cambridge Bancorp:
Opinion on the Consolidated Financial Statements
We have audited the accompanying consolidated balance sheet of Cambridge Bancorp and subsidiaries (the Company) as of December 31, 2019, the related consolidated statements of income, comprehensive income, changes in shareholders’ equity, and cash flows for each of the years in the two‑year period ended December 31, 2019, and the related notes (collectively, the consolidated financial statements). In our opinion, the consolidated financial statements present fairly, in all material respects, the financial position of the Company as of December 31, 2019, and the results of its operations and its cash flows for each of the years in the two‑year period ended December 31, 2019, in conformity with U.S. generally accepted accounting principles.
Basis for Opinion
These consolidated financial statements are the responsibility of the Company’s management. Our responsibility is to express an opinion on these consolidated financial statements based on our audits. We are a public accounting firm registered with the Public Company Accounting Oversight Board (United States) (PCAOB) and are required to be independent with respect to the Company in accordance with the U.S. federal securities laws and the applicable rules and regulations of the Securities and Exchange Commission and the PCAOB.
We conducted our audits in accordance with the standards of the PCAOB. Those standards require that we plan and perform the audit to obtain reasonable assurance about whether the consolidated financial statements are free of material misstatement, whether due to error or fraud. Our audits included performing procedures to assess the risks of material misstatement of the consolidated financial statements, whether due to error or fraud, and performing procedures that respond to those risks. Such procedures included examining, on a test basis, evidence regarding the amounts and disclosures in the consolidated financial statements. Our audits also included evaluating the accounting principles used and significant estimates made by management, as well as evaluating the overall presentation of the consolidated financial statements. We believe that our audits provide a reasonable basis for our opinion.
/s/ KPMG LLP
We served as the Company’s auditor from 2006 to 2019.
Boston, Massachusetts
March 16, 2020
Item 9. Changes in and Disagreements With AccountantsAccountants on Accounting and Financial Disclosure.
None.
On March 16, 2020, the Company’s Audit Committee dismissed KPMG LLP (“KPMG”) as the Company’s independent registered public accounting firm for the fiscal year ending December 31, 2020, and all quarterly periods therein. The Company’s Audit Committee participated in and approved the decision to change its independent registered public accounting firm.
The audit reports of KPMG on the consolidated financial statements of the Company as of and for the years ended December 31, 2019 and 2018 did not contain an adverse opinion or disclaimer of opinion, and were not qualified or modified, or expected to be modified or qualified, as to uncertainty, audit scope, or accounting principles.
During the fiscal years ended December 31, 2019 and 2018 and the subsequent interim period through March 16, 2020, there were no: (1) disagreements with KPMG on any matter of accounting principles or practices, financial statement disclosure, or auditing scope or procedures, which disagreements, if not resolved to KPMG’s satisfaction, would have caused KPMG to make reference in connection with its opinion to the subject matter, or (2) reportable events under Item 304(a)(1)(v) of Regulation S-K.
Also, on March 16, 2020, the Company engaged Wolf & Company, P.C. (“Wolf & Company”) as the Company’s independent registered public accounting firm starting with the fiscal year ending December 31, 2020. The engagement was approved by the Company’s Audit Committee. During the fiscal years ended December 31, 2019 and 2018, and the subsequent interim period prior to the engagement of Wolf & Company, the Company did not consult with Wolf & Company regarding any of the matters or events set forth in Item 304(a)(2)(i) and (ii) of Regulation S-K.
Item 9A. Controls and Procedures.
Disclosure Controls and Procedures
As required by Rules 13a-15 and 15d-15 of the Securities Exchange Act of 1934, the Company has evaluated, with the participation of management, including the Chief Executive Officer and the Chief Financial Officer, as of the end of the period covered by this report, the effectiveness of the design and operation of its disclosure controls and procedures.
Based on such evaluation, the Chief Executive Officer and Chief Financial Officer have concluded that such disclosure controls and procedures were effective as of December 31, 20192020 in ensuring that material information required to be disclosed by the Company, including its consolidated subsidiaries:
| a) | was made known to the certifying officers by others within the Company and its consolidated subsidiaries in the reports that it files or submits under the Exchange Act; and |
| b) | is recorded, processed, summarized, and reported within the time periods specified in the Securities Exchange Commission rules and forms. |
On a quarterly basis, the Company evaluates the disclosure controls and procedures and may, from time to time, make changes aimed at enhancing their effectiveness and to ensure that the Company’s systems evolve with its business.
Changes in Internal Controls over Financial Reporting
The Company adopted ASU 2016-13 and related amendments during the quarter ended March 31, 2020 and implemented additional controls for calculating the allowance for credit losses. There have beenwere no other changes in the Company’s internal controlscontrol over financial reporting that have materially affected, or are reasonably likely to materially affect, the Company’s internal controlscontrol over financial reporting in 2019.2020.
Management’s Report on Internal Control Over Financial Reporting
The management of the Company is responsible for establishing and maintaining adequate internal control (as defined in Rule 13a-15(f) under the Securities Exchange Act of 1934, as amended) over financial reporting. The Company’s internal control over financial reporting is a process designed to provide reasonable assurance to the Company’s Chief Executive Officer and Chief Financial Officer regarding the reliability of financial reporting and preparation of the Company’s financial statements in accordance with accounting principles generally accepted in the U.S.
In designing and evaluating the Company’s disclosure controls and procedures, the Company and its management recognize that any controls and procedures, no matter how well designed and operated, can provide only a reasonable assurance of achieving the desired control objectives, and management was required to apply its judgment in evaluating and implementing possible controls and
procedures. Therefore, even those systems determined to be effective can provide only reasonable assurance with respect to financial statement preparation and presentation and may not prevent or detect misstatements. Also, projections of any evaluation of effectiveness to future periods are subject to the risk that controls may become inadequate because of changes in conditions or that the degree of compliance with the policies or procedures may deteriorate.
The Company’s management assessed the effectiveness of the Company’s internal control over financial reporting as of December 31, 2019.2020. In making this assessment, management used the criteria set forth in Internal Control—Integrated Framework (2013) issued by the Committee of Sponsoring Organizations of the Treadway Commission (“COSO”). Based on management’s assessment, the Company believes that, as of December 31, 2019,2020, the Company’s internal control over financial reporting is effective based on the criteria established by Internal Control—Integrated Framework (2013) issued by COSO.
KPMG LLP,Wolf & Company, P.C, an independent registered public accounting firm, has audited the Company’s consolidated financial statements included in this Annual Report on Form 10-K and, as part of its audit, has issued its report, included herein on page 105, on the effectiveness of the Company’s internal control over financial reporting.
Item 9B. Other Information.
None.
PART III
Item 10. Directors, Executive Officers and Corporate Governance.
The information required by this Item is incorporated herein by reference to the captions “Proposal 1: Election of Directors,” “Committees of the Board of Directors– Audit Committee,” “Information about the Company’s Executive Officers Who are not Directors,” and “Code of Ethics” in the Company’s definitive proxy statement for the 20202021 Annual Meeting of Shareholders (the “Proxy Statement”), which will be filed with the SEC no later than 120 days after the end of the fiscal year covered by this Annual Report on Form 10-K.
Item 11. Executive Compensation.
The information required by this Item is incorporated herein by reference to the captions “Compensation Discussion and Analysis,” “Director Compensation,” “Executive Compensation Tables,” “Compensation Committee Interlocks and Insider Participation,” and “Compensation Committee Report” in the Company’s Proxy Statement, which are incorporated herein by reference.
Item 12. Security Ownership of Certain Beneficial Owners and Management and Related Stockholder Matters.
The information required by this Item is incorporated herein by reference to the caption “Security Ownership of Certain Beneficial Owners and Management” and “Securities Authorized for Issuance Under Equity Compensation Plans” in the Proxy Statement.
Item 13. Certain Relationships and Related Transactions, and Director Independence.
The information required by this Item is incorporated herein by reference to the captions “Transactions with Related Persons” and “Corporate Governance – Board of Directors Independence” in the Company’s Proxy Statement.
Item 14. Principal Accounting Fees and Services.
The information required by this Item is incorporated herein by reference to the caption “Independent Registered Public Accounting Firm Fees and Services” in the Proxy Statement.
PART IV
Item 15. Exhibits, Financial Statement Schedules.
(a) Documents filed as a Part of this Annual Report on Form 10-K:
(1) Financial Statements—Included in Item 8 of this Annual Report on Form 10-K.
Audited Consolidated Financial Statements
Consolidated Balance Sheets as of December 31, 20192020 and 20182019 | 50 |
Consolidated Statements of Income for the Years Ended December 31, 2020, 2019, 2018, and 20172018 | 51 |
Consolidated Statements of Comprehensive Income for the Years Ended December 31, 2020, 2019, 2018, and 20172018 | 52 |
Consolidated Statements of Shareholders’ Equity for the Years Ended December 31, 2020, 2019, 2018, and 20172018 | 53 |
Consolidated Statements of Cash Flows for the Years Ended December 31, 2020, 2019, 2018, and 20172018 | 54 |
Notes to Consolidated Financial Statements | 55 |
Report of Independent Registered Public Accounting Firm | 10579
|
(2) Financial Statement Schedules
1. | Financial Statements. The financial statements of the Company required in response to this item are listed in response to Part II, Item 8 of this Annual Report on Form 10-K. |
2. | Financial Statement Schedules. There are no financial statement schedules that are required to be filed as part of this form since they are not applicable, or the information is included in the consolidated financial statements. |
3. | Exhibits. The following exhibits are included as part of this Form 10-K. |
(3) Index to Exhibits.
Exhibit Number | | Description |
| | |
2.1 | | Agreement and Plan of Merger, dated December 5, 2018, by and between Cambridge Bancorp, Cambridge Trust Company and Optima Bank & Trust Company (incorporated by reference to Exhibit 2.1 of the Form 8-K filed with the SEC on December 6, 2018) |
| | |
2.2 | | Agreement and Plan of Merger, dated December 5, 2019, by and between Cambridge Bancorp, Cambridge Trust Company, Wellesley Bancorp, Inc., and Wellesley Bank (incorporated by reference to Exhibit 2.1 of the Form 8-K filed with the SEC on December 5, 2019) |
| | |
3.1 | | Articles of Organization (incorporated by reference to Exhibit 3.1 of the Form 8-K filed with the SEC on June 19, 2018) |
| | |
3.2 | | Amended and Restated Bylaws (incorporated by reference to Exhibit 3.2 of Amendment No. 2 of the Registration Statement File No. 1-38184 on Form 10 filed with the SEC on October 4, 2017) |
| | |
4.1 | | Specimen stock certificate (incorporated by reference to Exhibit 4.1 of Amendment No. 2 of the Registration Statement File No. 1-38184 on Form 10 filed with the SEC on October 4, 2017) |
| | |
4.2* 4.2#
| | Description of Cambridge Bancorp Securities Registered under Section 12 of the Securities Exchange Act of 1934. |
| | |
10.1** | | Cambridge Bancorp Amended 1993 Stock Option Plan (incorporated by reference to Exhibit 10.1 of Amendment No. 2 of the Registration Statement File No. 1-38184 on Form 10 filed with the SEC on October 4, 2017)
|
| | |
10.1(a) **
| | Cambridge Bancorp Amended 1993 Stock Option Plan—Form of Restricted Stock Agreement (incorporated by reference to Exhibit 10.1(a) of Amendment No. 2 of the Registration Statement File No. 1-38184 on Form 10 filed with the SEC on October 4, 2017)
|
| | |
10.1(b) **
| | Cambridge Bancorp Amended 1993 Stock Option Plan—Form of Restricted Stock Unit Agreement (incorporated by reference to Exhibit 10.1(b) of Amendment No. 2 of the Registration Statement File No. 1-38184 on Form 10 filed with the SEC on October 4, 2017)
|
| | |
10.6 10.5**
| | Cambridge Trust Company Amended and Restated Supplemental Executive Retirement Agreement for Denis K. Sheahan, dated July 7, 2017 (incorporated by reference to Exhibit 10.6 of Amendment No. 2 of the Registration Statement File No. 1-38184 on Form 10 filed with the SEC on October 4, 2017) |
| | |
10.710.6** | | Cambridge Trust Company Supplemental Executive Retirement Agreement for Lynne M. Burrow, dated February 27, 2008 (incorporated by reference to Exhibit 10.7 of Amendment No. 2 of the Registration Statement File No. 1-38184 on Form 10 filed with the SEC on October 4, 2017)
|
| | |
10.8**
| | Cambridge Trust Company Supplemental Executive Retirement Agreement for Albert R. Rietheimer, dated February 21, 2008 (incorporated by reference to Exhibit 10.8 of Amendment No. 2 of the Registration Statement File No. 1-38184 on Form 10 filed with the SEC on October 4, 2017)
|
| | |
10.9**
| | Cambridge Trust Company Supplemental Executive Retirement Agreement for Michael A. Duca, dated August 14, 2008 (incorporated by reference to Exhibit 10.9 of Amendment No. 2 of the Registration Statement File No. 1-38184 on Form 10 filed with the SEC on October 4, 2017)
|
| | |
10.10**
| | First Amendment to Cambridge Trust Company Supplemental Executive Retirement Agreement for Michael A Duca, dated December 22, 2016 (incorporated by reference to Exhibit 10.10 of Amendment No. 2 of the Registration Statement File No. 1-38184 on Form 10 filed with the SEC on October 4, 2017)
|
| | |
10.11**
| | Cambridge Trust Company Supplemental Executive Retirement Agreement for Martin B. Millane, Jr., dated January 1, 2016 (incorporated by reference to Exhibit 10.11 of Amendment No. 2 of the Registration Statement File No. 1-38184 on Form 10 filed with the SEC on October 4, 2017) |
| | |
10.1210.7** | | Change in Control Agreement with Denis K. Sheahan, dated December 21, 2015 (incorporated by reference to Exhibit 10.12 of Amendment No. 2 of the Registration Statement File No. 1-38184 on Form 10 filed with the SEC on October 4, 2017) |
| | |
10.1310.8** | | Change in Control Agreement with Lynne M. Burrow, dated September 16, 2008 (incorporated by reference to Exhibit 10.13 of Amendment No. 2 of the Registration Statement File No. 1-38184 on Form 10 filed with the SEC on October 4, 2017) |
| | |
10.14**
| | Agreement with Mr. Michael Carotenuto, dated April 26, 2019 (incorporated by reference to Exhibit 10.1 of the Form 8-K filed with the SEC on April 29, 2019) |
| | |
10.1510.9** | | Agreement with Mr. Martin Millane, dated April 26, 2019 (incorporated by reference to Exhibit 10.2 of the Form 8-K filed with the SEC on April 29, 2019) |
| | |
10.1610.10** | | Change in Control Agreement with Mark D. Thompson, dated September 17, 2017 (incorporated by reference to Exhibit 10.1 of the Form 8-K filed with the SEC on November 30, 2017) |
| | |
10.17*10.11** | | Change in Control Agreement with Ms. Jennifer Pline, dated April 26, 2019 (incorporated by reference to Exhibit 10.3 of the Form 8-K filed with the SEC on April 29, 2019) |
| | |
Exhibit
Number
| | Description
|
10.18*10.12** | | Change in Control Agreement with Daniel R. Morrison, dated December 5, 2018 (incorporated by reference to Exhibit 10.18 of the Form 10-K filed with the SEC on March 18, 2019) |
| | |
10.19** | | Cambridge Trust Company Supplemental Executive Retirement Agreement for Mark D. Thompson, dated September 25, 2017 (incorporated by reference to Exhibit 99.1 of the Form 8-K filed with the SEC on November 30, 2017) |
| | |
10.20**
| | Offer Letter for Mark D. Thompson, dated September 17, 2017 (incorporated by reference to Exhibit 10.18 of the Form 10-K filed with the SEC on March 21, 2018)
|
| | |
10.21**
| | Offer Letter for Jennifer A. Pline, dated November 7, 2016 (incorporated by reference to Exhibit 10.19 of the Form 10-K filed with the SEC on March 21, 2018)
|
| | |
10.22** | | Cambridge Trust Company Supplemental Executive Retirement Agreement for Jennifer A. Pline, dated January 30, 2017 (incorporated by reference to Exhibit 10.22 of the Form 10-K filed with the SEC on March 18, 2019) |
| | |
10.23*10.29** | | Offer Letter for Daniel R. Morrison,Consulting Agreement with Mark D. Thompson, dated December 5, 201821, 2020 (incorporated by reference to Exhibit 10.2310.1 of the Form 10-K80K filed with the SEC on March 18, 2019)December 23, 2020)
|
| | |
10.24*10.30#** | | Offer Letter for Pamela A. Morrison,Thomas J. Fontaine, dated December 5, 2018 (incorporated by reference to Exhibit 10.24 of the Form 10-K filed with the SEC on March 18, 2019)2019 |
| | |
10.25*10.31#** | | Offer Letter for William D. Young,Change in Control Agreement with Thomas J. Fontaine, dated December 5, 2018 (incorporated by reference to Exhibit 10.25 of the Form 10-K filed with the SEC on March 18, 2019)2019
|
| | |
10.26*10.32#** | | Long-Term Incentive Plan, effective January 1, 2018 (incorporated by reference to Exhibit 10.21Cambridge Trust Company Supplemental Executive Retirement Agreement for Thomas J. Fontaine, dated December 5, 2019
|
| | | |
21# | | Subsidiaries of the Form 10-Q filed with the SEC on August 9, 2018)Registrant | |
| | |
23.1# | | Consent of Wolf & Company P.C. dated March 15, 2021 |
| | |
10.27**23.2# | | Short-Term Incentive Plan (effective January 1, 2019) (incorporated by reference to Exhibit 10.20Consent of the Form 10-Q filed with the SEC on May 9, 2019)KPMG LLP dated March 15, 2021
|
| | |
10.28** 31.1#
| | Long-Term Incentive Plan (effective January 1, 2019) (incorporated by reference to Exhibit 10.21 of the Form 10-Q filed with the SEC on May 9, 2019)
|
| | |
21*
| | Subsidiaries of the Registrant
|
| | |
23.1*
| | Consent of KPMG LLP dated March 16, 2020
|
| | |
31.1*
| | Certification of Principal Executive Officer Pursuant to Rules 13a-14(a) and 15d-14(a) under the Securities Exchange Act of 1934, as Adopted Pursuant to Section 302 of the Sarbanes-Oxley Act of 2002 |
| | |
31.2* 31.2#
| | Certification of Principal Financial Officer Pursuant to Rules 13a-14(a) and 15d-14(a) under the Securities Exchange Act of 1934, as Adopted Pursuant to Section 302 of the Sarbanes-Oxley Act of 2002 |
| | |
32.1* 32.1#
| | Certification of Principal Executive Officer Pursuant to 18 U.S.C. Section 1350, as Adopted Pursuant to Section 906 of the Sarbanes-Oxley Act of 2002 |
| | |
32.2* 32.2#
| | Certification of Principal Financial Officer Pursuant to 18 U.S.C. Section 1350, as Adopted Pursuant to Section 906 of the Sarbanes-Oxley Act of 2002 |
| | |
101.INS | | Inline XBRL Instance DocumentDocument- the instance document does not appear in the Interactive data File because XBRL tags are embedded within the Inline XBRL |
| | |
101.SCH | | Inline XBRL Taxonomy Extension Schema Document |
| | |
101.CAL | | Inline XBRL Taxonomy Extension Calculation Linkbase Document |
| | |
101.DEF | | Inline XBRL Taxonomy Extension Definition Linkbase Document |
| | |
101.LAB | | Inline XBRL Taxonomy Extension DefinitionLabel Linkbase Document |
| | |
101.PRE | | Inline XBRL Taxonomy Extension Presentation Linkbase Document |
| | |
104 | | Cover page interactive data file (formatted as inline XBRL and contained in Exhibit 101)_ |
** | Management Compensatory plans or arrangements. |
Item 16. Form 10-K Summary.
None.
SIGNATURESSIGNATURES
Pursuant to the requirements of the Securities Exchange Act of 1934, the registrant has duly caused this report to be signed on its behalf by the undersigned thereunto duly authorized.
| CAMBRIDGE BANCORP |
| | |
March 16, 202015, 2021 | By: | /s/ Denis K. Sheahan |
| | Denis K. Sheahan |
| | Chairman, President & Chief Executive Officer |
| | |
March 16, 202015, 2021 | | |
| By: | /s/ Michael F. Carotenuto |
| | Michael F. Carotenuto |
| | Chief Financial Officer |
Pursuant to the requirements of the Securities Exchange Act of 1934, as amended, this Report has been signed below by the following persons on behalf of the Registrant in the capacities and on the dates indicated.
Name | | Title | | Date |
| | | | |
/s/ Denis K. Sheahan | | Chairman, President & Chief Executive Officer | | March 16, 2020 15, 2021 |
Denis K. Sheahan | | (Principal Executive Officer) | | |
| | | | |
/s/ Michael F. Carotenuto | | Chief Financial Officer | | March 1615, 20202021 |
Michael F. Carotenuto | | (Principal Financial Officer and Principal Accounting Officer) | | |
| | | | |
/s/ Jeanette G. Clough | | Director | | March 16, 202015, 2021 |
Jeanette G. Clough | | | | |
| | | | |
/s/ Thomas J. Fontaine | | Executive Vice President and | | March 15, 2021 |
Thomas J. Fontaine | | Chief Banking Officer | | |
| | | | |
/s/ Christine Fuchs | | Director | | March 1615, 20202021 |
Christine Fuchs | | | | |
| | | | |
/s/ Sarah G. GreenSimon R. Gerlin | | Director | | March 16, 202015, 2021 |
Sarah G. GreenSimon R. Gerlin
| | | | |
| | | | |
/s/ Pamela A. Hamlin | | Director | | March 16, 202015, 2021 |
Pamela A. Hamlin | | | | |
| | | | |
/s/ Kathryn M. Hinderhofer | | Director | | March 15, 2021 |
Kathryn M. Hinderhofer | | | | |
| | | | |
/s/ Edward F. Jankowski | | Director | | March 16, 202015, 2021 |
Edward F. Jankowski | | | | |
| | | | |
/s/ Hambleton Lord | | Director | | March 16, 202015, 2021 |
Hambleton Lord | | | | |
| | | | |
/s/ Thalia M. Meehan | | Director | | March 16, 202015, 2021 |
Thalia M. Meehan | | | | |
| | | | |
/s/ Daniel R. Morrison | | Chief Executive Officer New | | March 16, 202015, 2021 |
Daniel R. Morrison | | Hampshire Market and Director | | |
| | | | |
/s/ Leon A. Palandjian | | Director | | March 16, 202015, 2021 |
Leon A. Palandjian | | | | |
| | | | |
/s/ Laila S. Partridge | | Director | | March 16,202015,2021 |
Laila S. Partridge | | | | |
| | | | |
/s/ Jody A. Rose | | Director | | March 16, 202015, 2021 |
Jody A. Rose | | | | |
| | | | |
/s/ Cathleen A. Schmidt | | Director | | March 16, 202015, 2021 |
Cathleen A. Schmidt | | | | |
| | | | |
/s/ R. Gregg Stone | | Director | | March 16, 202015, 2021 |
R. Gregg Stone | | | | |
| | | | |
/s/ Mark D. Thompson | | President and Director
| | March 16, 202015, 2021 |
Mark D. Thompson | | | | |
| | | | |
/s/ Linda A. Whitlock
| | Director
| | March 16, 2020
|
Linda A. Whitlock
| | | | |
112113