UNITED STATES
SECURITIES AND EXCHANGE COMMISSION
WASHINGTON, D.C. 20549
FORM 10-K
(Mark One)
| |
☒ | ANNUAL REPORT PURSUANT TO SECTION 13 OR 15(d) OF THE SECURITIES EXCHANGE ACT OF 1934 |
For the fiscal year ended December 31 2020, 2022
OR
| |
☐ | TRANSITION REPORT PURSUANT TO SECTION 13 OR 15(d) OF THE SECURITIES EXCHANGE ACT OF 1934 |
For the transition period from toto
Commission file number: 0-12255
Yellow Corporation
(Exact name of registrant as specified in its charter)
| | |
Delaware |
| 48-0948788 |
(State or other jurisdiction of |
| (I.R.S. Employer |
incorporation or organization) |
| Identification No.) |
|
|
|
10990 Roe Avenue, Overland Park, Kansas501 Commerce Street, Suite 1120, Nashville, Tennessee
|
| 6621137203
|
(Address of principal executive offices) |
| (Zip Code) |
(913) (913) 696-6100
(Registrant’s telephone number, including area code)
Securities registered pursuant to Section 12(b) of the Act:
| | |
Title of each class | Trading Symbol(s) | Name of each exchange on which registered |
Common Stock, $0.01 par value per share | YELL | The NASDAQ Stock Market LLC |
Securities registered pursuant to Section 12(g) of the Act: NONE
Indicate by check mark if the registrant is a well-known seasoned issuer as defined in Rule 405 of the Securities Act.
Yes ☐ ☐No No ☒
Indicate by check mark if the registrant is not required to file reports pursuant to Section 13 or 15(d) of the Exchange Act.
Yes ☐ ☐No No ☒
Indicate by check mark whether the registrant (1) has filed all reports required to be filed by Section 13 or 15(d) of the Securities Exchange Act of 1934 during the preceding 12 months (or for such shorter period that the registrant was required to file such reports), and (2) has been subject to such filing requirements for the past 90 days.
Yes☒ No ☐
Indicate by check mark whether the registrant has submitted electronically every Interactive Data File required to be submitted pursuant to Rule 405 of Regulation S-T during the preceding 12 months (or for such shorter period that the registrant was required to submit such files)
Yes☒ No ☐
Indicate by check mark whether the registrant is a large accelerated filer, an accelerated filer, a non-accelerated filer, a smaller reporting company, or an emerging growth company. See the definitions of “large accelerated filer,” “accelerated filer,” “smaller reporting company,” and “emerging growth company” in Rule 12b-2 of the Exchange Act.
Large accelerated filer
| | ☐
| | Accelerated filer
| | ☒
|
Non-accelerated filer
| | ☐
| | Smaller reporting company
| | ☐
| |
Large accelerated filer |
| ☐ |
| Accelerated filer |
| ☒ |
Non-accelerated filer |
| ☐ |
| Smaller reporting company |
| ☐ |
|
|
|
| Emerging growth company |
| ☐ | |
If an emerging growth company, indicate by check mark if the registrant has elected not to use the extended transition period for complying with any new or revised financial accounting standards provided pursuant to Section 13(a) of the Exchange Act. ☐
Indicate by check mark whether the registrant has filed a report on and attestation to its management’s assessment of the effectiveness of its internal control over financial reporting under Section 404(b) of the Sarbanes-Oxley Act (15 U.S.C. 7262(b)) by the registered public accounting firm that prepared or issued its audit report. ☒
If securities are registered pursuant to Section 12(b) of the Act, indicate by check mark whether the financial statements of the registrant included in the filing reflect the correction of an error to previously issued financial statements. ☐
Indicate by check mark whether any of those error corrections are restatements that required a recovery analysis of incentive-based compensation received by any of the registrant’s executive officers during the relevant recovery period pursuant to §240.10D-1(b). ☐
Indicate by check mark whether the registrant is a shell company (as defined in Rule 12b-2 of the Exchange Act). Yes ☐ No ☒
As of June 30, 2020,2022, the aggregate market value of the registrant’s common stock held by non-affiliates of the registrant was $63.1$104.0 million based on the closing price as reported on the NASDAQ Global Select Market.
Indicate the number of shares outstanding of each of the issuer’s classes of common stock, as of the latest practicable date.
| | |
Class |
| Outstanding at February 5, 20216, 2023 |
Common Stock, $0.01 par value per share |
| 51,179,77751,808,732 shares
|
DOCUMENTS INCORPORATED BY REFERENCE
Pursuant to General Instruction G to Form 10-K, information required by Part III of this Form 10-K, either is incorporated herein by reference to a definitive proxy statement filed with the SEC no later than 120 days after the end of the fiscal year covered by this Form 10-K or will be included in an amendment to this Form 10-K filed with the SEC no later than 120 days after the end of the fiscal year covered by this Form 10-K.
| | | | | |
Auditor Name: | KPMG LLP | Auditor Location: | Kansas City, MO | Auditor Firm ID: | 185 |
INDEX
INDEX
2
Cautionary Note on Forward-Looking Statements
This entire report, including (among other items) Item 1, “Business,” Item 1A, “Risk Factors,” and Item 7, “Management’s Discussion and Analysis of Financial Condition and Results of Operations” and other documents incorporated herein by reference includes forward-looking statements (each a “forward-looking statement”) within the meaning of Section 27A of the Securities Act of 1933, as amended (the “Securities Act”), and Section 21E of the Securities Exchange Act of 1934, as amended (the “Exchange Act”). Forward-looking statements include those preceded by, followed by or including the words “will,” “may,” “should,” “expect,” “intend,” “anticipate,” “believe,” “project,” “forecast,” “propose,” “plan,” “designed,” “estimate,” “enable” and similar expressions. Those forward-looking statements speak only as of the date of this report. We disclaim any obligation to update those statements, except as applicable law may require us to do so, and we caution you not to rely unduly on them. We have based those forward-looking statements on our current expectations and assumptions about future events, which may prove to be inaccurate. While our management considers those expectations and assumptions to be reasonable, they are inherently subject to significant business, economic, competitive, regulatory (including environmental), legal and other risks, contingencies and uncertainties, most of which are difficult to predict and many of which are beyond our control. Therefore, actual results may differ materially and adversely from those expressed in any forward-looking statements. Factors that might cause or contribute to such differences include, but are not limited to, those we discuss in this report under the section entitled “Risk Factors” in Item 1A and the section entitled “Liquidity“Financial Condition, Liquidity and Capital Resources” in Item 7, “Management’s Discussion and Analysis of Financial Condition and Results of Operations,” and in other reports we file with the Securities and Exchange Commission (the “SEC”). The factors we discuss in this report are not necessarily all the important factors that could affect us. Unpredictable or unknown factors we have not discussed in this report also could have material adverse effects on actual results of matters that are the subject of our forward-looking statements. We do not intend to update our description of important factors each time a potentially important factor arises. We advise our existing and potential security holders that they should (1) be aware that important factors to which we do not refer in this report could affect the accuracy of our forward-looking statements and (2) use caution and common sense when considering our forward-looking statements.
3
PART I
Item 1. Business
General Description of the Business
Yellow Corporation (also referred to as “Yellow,” the “Company,” “we,” “us” or “our”) is a holding company that, through its operating subsidiaries, offers its customers a wide range of transportation services. In February 2021, YRC Worldwide Inc. completed a name change to Yellow Corporation. We have one of the largest, most comprehensive less-than-truckload (“LTL”) networks in North America with local, regional, national and international capabilities. Through our team of experienced service professionals, we offer expertise in LTL shipments and flexible supply chain solutions, ensuring customers can ship industrial, commercial and retail goods with confidence.
Yellow Corporation provides for the movement of industrial, commercial and retail goods through ourCorporation's LTL subsidiaries includinginclude USF Holland LLC (“Holland”), New Penn Motor Express LLC (“New Penn”), USF Reddaway Inc. (“Reddaway”), YRC Inc. and YRC Freight Canada Company (both doing business as, and herein referred to as, “YRC Freight”). Our LTL companies provide local, regional, national and international services through a consolidated network of facilities located primarily across North America.the United States and Canada. We also offer regional, next-day ground services through Yellow Logistics, Inc. (“Yellow Logistics” and f/k/a network of facilities located across North America. Through HNRY Logistics, Inc. (“HNRY Logistics”), our customer-specific logistics solutions provider, we specializespecializing in truckload, residential, and warehouse solutions.
Incorporated in Delaware, and headquartered in Overland Park, Kansas, we employed approximately 30,000 people as of December 31, 2020.2022. The mailing address of our headquartersprincipal executive office is 10990 Roe Avenue, Overland Park, Kansas 66211,501 Commerce Street, Suite 1120, Nashville, Tennessee 37203, and our telephone number is (913) 696-6100. Our website is www.myyellow.com. Through the “SEC Filings” link under the “Investors”“Investors & News” tab on our website, we make our filings available as soon as reasonably practicable after they are electronically filed with or furnished to the SEC, including our Annual Report on Form 10-K, Quarterly Reports on Form 10-Q, Current Reports on Form 8-K, Proxy Statements on Schedule 14A, filings required under Section 16 of the Securities Exchange Act and any amendments to those reports filed or furnished pursuant to Section 13(a) or 15(d) of the Exchange Act. All of these filings may be viewed or printed from our website free of charge.
Narrative Description of the Business
The Company offers a full range of services for the transportation of industrial, commercial and retail goods in national, regional and international markets, primarily through the operation of owned or leased equipment in its North American ground distribution network. Transportation services are provided for various categories of goods, which may include (among others) apparel, appliances, automotive parts, chemicals, food, furniture, glass, machinery, metal, metal products, non-bulk petroleum products, rubber, textiles, wood and other manufactured products or components. The Company provides both LTL services, which combine shipments from multiple customers on a single trailer, and truckload services. Deliveries are predominately LTL shipments with truckload services offered to maximize equipment utilization and reduce empty miles (the distance empty or partially full trailers travel to balance the network). The Company also provides higher-margin specialized services, including guaranteed expedited services, time-specific deliveries, cross-border services, coast-to-coast air delivery, exhibit services, product returns, temperature-sensitive shipment protection and government material shipments.
The Company operates throughout North America with one of the largest networks of LTL service centers, equipment and transportation professionals, offering flexible and efficient supply chain solutions serving various customer needs. The Company is a transportation provider to the United States federal government. The Company also provides logistics solutions for customer-specific needs with custom projects, consolidation and distribution, reverse logistics, and residential white glove service offerings. A substantial majority of our services are provided wholly within the United States.
Each of our LTL operating subsidiaries has employees who are represented by the International Brotherhood of Teamsters (“IBT”). These employees represented approximately 82% of our workforce at December 31, 2022. Salaries, wages and employee benefits for both union and non-union employees compose over half of our operating costs.
The Company’s employees are dedicated to operating its extensive network which transported approximately 17.414.2 million shipments in 2020.2022. On December 31, 2020,2022, the Company’s revenue fleet was comprised of approximately 13,50012,700 tractors, including approximately 10,40011,700 owned tractors and 3,1001,000 leased tractors, and approximately 41,90042,000 trailers, including approximately 29,60034,800 owned trailers and 12,3007,200 leased trailers. The Company’s network includes 332308 strategically located
service facilities including 176166 owned facilities with approximately 11,30010,000 doors and 156142 leased facilities with approximately 8,8009,100 doors, in addition to six warehouses managed by our logistics solution provider, HNRYYellow Logistics.
Parent Company
Yellow Corporation, headquarteredCorporation's principal executive office is in Nashville, Tennessee. The Company has a field resource center in Overland Park, Kansas that provides centrally-managed support to our operating companies that spans a variety of functions, including
4
sales and marketing, information technology, human resources, finance and accounting, legal, transportation management, revenue management, risk management, procurement, and security.
Competition
Our companies operateThe Company operates in a highly competitive environment. Our competitors include global, integrated freight transportation services providers, global freight forwarders, national freight services providers (including intermodal providers), regional orand interregional carriers, third-party logistics providers, and small, intraregional transportation companies. The entire trucking industry also faces emerging competition from online technology firms that specialize in load-matching services and large customers that may use their significant scale advantages to offer transportation solutionsservices to their suppliers and customers.
Our companiesThe Company also havehas competitors within several different modes of transportation including: LTL, truckload, air and ocean cargo, intermodal rail, parcel and package companies, transportation consolidators, reverse logistics firms, and privately-owned fleets.
Ground-based transportation includes private fleets and “for-hire” provider groups. The private provider segment consists of private fleets owned by companies that move their own goods and materials. The “for-hire” groups are classified based on the typical shipment sizes that they handle. Truckload refers to providers transporting shipments that generally fill an entire dry van, and LTL refers to providers transporting goods from multiple shippers in a single trailer.
LTL transportation providers consolidate numerous shipments (generally ranging from 100 to 20,000 pounds) from varying businesses at service centers within close proximity to where those shipments originated. Utilizing expansive networks of pickup and delivery operations around local service centers, shipments are moved between origin and destination using distribution centers when necessary, where consolidation and deconsolidation of shipments occur. Depending on the distance shipped, LTL carriers are often classified into one of four sub-groups:
| • Regional - Average distance is typically fewer than 500 miles with a focus on one- and two-day delivery times. Regional transportation companies can move shipments directly to their respective destination centers, which increases service reliability and avoids costs associated with intermediate handling. •Interregional- Average distance is usually between 500 and 1,000 miles with a focus on two- and three-day delivery times. There is a competitive overlap between regional and national providers in this category, as each group sees the interregional segment as a growth opportunity, and few providers focus exclusively on this sector. •National - Average distance is typically in excess of 1,000 miles with focus on two- to five-day delivery times. National providers rely on intermediate shipment handling through a network of facilities, which require numerous satellite service centers, multiple distribution centers and a relay network. To gain service and cost advantages, they often ship directly between service centers, minimizing intermediate handling. •International - Providing freight forwarding and final-mile delivery services to companies shipping to and from multiple regions around the world. This service can be offered through a combination of owned assets or through a purchased transportation model and may involve just one leg of a shipment’s movement between countries. •
| Regional - Average distance is typically fewer than 500 miles with a focus on one- and two-day delivery times. Regional transportation companies can move shipments directly to their respective destination centers, which increases service reliability and avoids costs associated with intermediate handling.
|
| •
| Interregional - Average distance is usually between 500 and 1,000 miles with a focus on two- and three-day delivery times. There is a competitive overlap between regional and national providers in this category, as each group sees the interregional segment as a growth opportunity, and few providers focus exclusively on this sector.
|
| •
| National - Average distance is typically in excess of 1,000 miles with focus on two- to five-day delivery times. National providers rely on intermediate shipment handling through a network of facilities, which require numerous satellite service centers, multiple distribution centers and a relay network. To gain service and cost advantages, they often ship directly between service centers, minimizing intermediate handling.
|
| •
| International - Providing freight forwarding and final-mile delivery services to companies shipping to and from multiple regions around the world. This service can be offered through a combination of owned assets or through a purchased transportation model and may involve just one leg of a shipment’s movement between countries.
|
The Company provides services in all four sub-groups in North America with a heavy concentration of services in the United States. We directly compete in the regional market and use intracompany and external interline relationships to provide service to the interregional and national transportation marketplace. HNRYYellow Logistics is our non-asset-based provider of transportation solutions and competes with asset-based carriers, third-party logistics (“3PL”) firms, forwarders and global integrated freight transportation service providers. Each brandThe Company competes against a number of providers in these markets, from small firms with one or two vehicles to global competitors with thousands of physical assets and non-asset-based logistics solutions. While we have competitors with a similar multi-dimensional approach, there are few in the traditional LTL segment with as comprehensive an offering in those categories as our family of brandsbrand provides.
5
Asset-based LTL carriers utilize 3PL firms. These asset-light service providers are both our customers and competitors. As customers, these firms aggregate truck shipment demand and distribute that demand across the transportation sector. Asset-based LTL carriers are the providers of shipping capacity to 3PL companies and thus our LTL offerings can benefit from the relationships with 3PL firms. As competitors, 3PLs often control shipper relationships and can shift shipment volumes away from specific carriers. Certain 3PLs3PL firms have completed purchases of asset-based LTL carriers and certain LTL carriers have completed purchases of 3PLs,3PL firms, both of which have and will continue to alter the competitive landscape.
Several technology firms have introduced or are in the process of introducing, load-matching technologies for heavyweight freight. Whereas these firms operate similar to a third-party logistics firm, they allow any carrier, of any size, to bid on specific shipment opportunities. They aggregate independent operators, into streamlined solutions, giving shippers an easier means of engaging what has been a highly fragmented segment of trucking. Successfully winning a bid opportunity could be based on a truck’s proximity to the pick-up location, price, or other factors. Just as in the 3PL scenario, we view these as potential opportunities as well as a competitive risk.
Large shippers with significant freight volume scale and advanced technologies offer transportation management services to their suppliers and customers. These companies often operate their own private fleets and can merge asset and non-asset based transportation solutions to create a competitive, market-facing offer.
Competitive cost of entry into the asset-based LTL sector on a small scale, within a limited service area, is relatively low (although more so than in other sectors of the transportation industry). The larger the service area, the greater the barriers to entry, due primarily to the need for additional equipment and facilities associated with broader geographic service coverage. Broader market coverage in the competitive transportation landscape also requires increased technology investment and the ability to capture cost efficiencies from shipment density (scale), making new market entry on a national basis more difficult. Lastly, our industry has been consistently faced with challenges in competing for human capital resources, including those inherent in driver retention and hiring.
TechnologicalForeign companies have begun to invest in U.S. transportation and supply chain companies. Some of these companies are large, multi-national firms with significant resources across a broad spectrum of the global logistics sector.
Significant technological investments to improve network efficiency and optimize asset utilization can provide carriers with cost advantages. Further development of density-based pricing strategies require carriers to continue to make investments in scanning and measuring technologies. We have already taken significant steps toward implementing these various types of technologies, and other competitors in our industry have made and are also makingcontinue to make investments in these technologies at varying speeds.
Regulation
Our operating companies and other interstate motor carriers were substantially deregulated following the enactment of the Motor Carrier Act of 1980, the Trucking Industry Regulatory Reform Act of 1994, the Federal Aviation Administration Authorization of 1994 and the ICC Termination Act of 1995. Prices and services are now largely free of regulatory controls, although the states retained the right to require compliance with safety and insurance requirements, and interstate motor carriers remain subject to regulatory controls imposed by agencies within the U.S. Department of Transportation.
Our companies areCompany is subject to regulatory and legislative changes, which can affect our economics and those of our competitors. Some regulatory changes could potentially impact the pool of available drivers and the costs of compensation of drivers. Various federal and state agencies regulate us, and our operations are also subject to various federal, foreign, state, provincial and local environmental laws and regulations dealing with transportation, storage, presence, use, disposal and handling of hazardous materials, emissions related to the use of petroleum-based fuels, fuel efficiency, discharge of storm-water and underground fuel storage tanks. Our drivers and facility employees are protected by occupational safety and health regulations and our drivers are subject to hours of service regulations. Some regulatory changes could potentially impact the pool of available drivers or otherwise increase our costs of operations. We are also subject to security regulations intended to combat terrorism imposed by the U.S. Department of Homeland Security and other federal and state agencies.agencies that are intended to combat terrorism. See the Risk Factors section related to our compliance with laws and regulations in Item 1A of this report.
Environmental Matters
Our operations are subject to U.S. federal, foreign, state, provincial and local regulations with regard to air and water quality and other environmental matters. We believe that we are in substantial compliance with these regulations. Regulation in this area continues to evolve and changes in standards of enforcement of existing regulations, as well as the enactment and enforcement of new legislation or regulation, may require us and our customers to modify, supplement or replace equipment or facilities or to change or discontinue present methods of operation.
Our operating companies store fuel and lubricating oils for use in our revenue equipment in approximately 206174 underground storage tanks located throughout the United States.U.S. Maintenance of such underground storage tanks is regulated at the federal and, in some cases, state level. The underground storage tanks are required to have leak detection systems and are required to be extracted upon our exiting the property.
6
During 2020,2022, we spent approximately $7.7$10.6 million to comply with U.S. federal, state and local provisions regulating the discharge of materials into the environment or otherwise relating to the protection of the environment (collectively, “Environmental Regulations”). In 2021,2023, we expect to spend approximately $8.5$10.8 million to comply with the Environmental Regulations. Based
upon current information, we believe that our compliance with Environmental Regulations will not have a material adverse effect upon our capital expenditures, results of operations and competitive position because we have either made adequate reserves for such compliance expenditures or the cost for such compliance is expected to be small in comparison with our overall expenses.
The Comprehensive Environmental Response, Compensation and Liability Act (known as the “Superfund Act”) imposes liability for the release of a “hazardous substance” into the environment. Superfund Act liability is imposed without regard to fault and even if the waste disposal was in compliance with then-current laws and regulations. With the joint and several liabilities imposed under the Superfund Act, a potentially responsible party (“PRP”) may be required to pay more than its proportional share of any required environmental remediation. Several of our subsidiaries have been identified as PRPs at various sites discussed below. The U.S. Environmental Protection Agency (the “EPA”) and appropriate state agencies are supervising investigative and cleanup activities at these sites.
The former Yellow Transportation (now a part of YRC Freight) has been alleged to be a PRP for two locations: Angeles Chemical Co., Santa Fe Springs, CA and Alburn Incinerator, Inc., Chicago, IL, which is included in the Lake Calumet Cluster Site. The EPA has issued YRC Freight a Request for Information (“RFI”) regarding Omega Chemical Corporation Superfund Site – Operable Unit 2, Santa Fe Springs, CA. With respect to these sites, there is little, if any evidence that YRC Freight contributed to any contamination and these allegations are not believed to present material exposure, but YRC Freight has entered into a tolling agreement with the Omega Chemical PRP Organized Group.
The former Roadway Express (now a part of YRC Freight) has been alleged to be a PRP for three locations: Ward Transformer, Raleigh, NC, Roosevelt Irrigation District, Phoenix, AZ and Berry's Creek, Carlstadt, NJ. There is little, if any, evidence connecting YRC Freight with either the Ward Transformer site or to the Roosevelt Irrigation District’s contaminated groundwater wells and any potential exposure is believed to be immaterial. The EPA and a number of potentially responsible partiesPFPs have performed a Remedial Investigation and Feasibility Study (“RI/FS”) and the EPA has issued a record of decision for an interim remedy for the Berry’s Creek Study Area (“BCSA”). The EPA has requested that YRC Freight participate in designing the remedy (the “Remedial Design”) for the BCSA. YRC Freight does not believe that it is a PRP for the BCSA and has, therefore, declined to participate in the Remedial Design.
The EPA has issued the Company an RFI regarding current and former Yellow Transportation and Roadway Express (now YRC Freight) facilities adjacent to or in close proximity of Newtown Creek, NY and its tributaries. None of the Company’s operating companies have been named as a PRP in this matter, but YRC Freight has entered into a tolling agreement with the Newtown Creek Group (“NCG”). The NCG is comprised of five companies and the City of New York who, per Consent Order, have agreed to perform a RI/FS under the supervision of the EPA. The EPA’s website regarding this matter provides status updates of site investigations and study.
USF RedStar LLC, a non-operating subsidiary, has been alleged to be a PRP at fourthree locations: Booth Oil, N. Tonawanda, NY and threetwo separate landfills in Byron, NY and Moira, NY and Baltimore, MD.NY. Holland has been alleged to be a PRP in an RFI for one location, Horton Sales Piedmont Site, Greenville County, SC. YRC Freight has been alleged to be a PRP at one landfill in Baltimore, MD.
Although the outcome of any legal matter is subject to uncertainties, based on our current knowledge, we believe the potential combined costs at all of the above sites will not be significant and we believethat we have made adequate reserves for complying with future EPA demands at such sites.
While PRPs in Superfund Act actions have joint and several liabilities for all costs of remediation, it is not possible at this time to quantify our ultimate exposure because the projects are either in the investigative or early remediation stage. Based upon current information, we do not believe that probable or reasonably possible expenditures in connection with the sites described above are likely to have a material adverse effect on our financial condition or results of operations because:
• To the extent necessary, we have established adequate reserves to cover the estimate we presently believe will be our liability with respect to the matter; •We and our subsidiaries have only limited or de minimis involvement in the sites based upon volumetric calculations; •Other PRPs involved in the sites have substantial assets and may reasonably be expected to pay a larger share of the cost of remediation; and 7
| •
| To the extent necessary, we have established adequate reserves to cover the estimate we presently believe will be our liability with respect to the matter;
|
| •
| We and our subsidiaries have only limited or de minimis involvement in the sites based upon volumetric calculations;
|
| •
| Other PRPs involved in the sites have substantial assets and may reasonably be expected to pay a larger share of the cost of remediation; and
|
| •
| We believe that our ultimate liability is relatively small compared with our overall expenses.
|
We are subject to various other governmental proceedings and regulations, including foreign regulations, relating to environmental matters, and are investigating potential violations of Environmental Regulations with respect to certain sites, but we do not believe that any of these matters or investigations is likely to have a material adverse effect on our business, financial condition, liquidity or results of operations.
Economic Factors and Seasonality
Our business is subject to a number of general economic factors that may have a material adverse effect on the results of our operations, many of which are largely out of our control. These include supply chain interruptions, the impact of recessionary economic cycles, andas well as downturns in our customers’ business cycles, particularly in market segments and industries, such as retail and manufacturing, where we have a significant concentration of customers. Economic conditions may adverselymaterially affect our customers’ business levels, the amount of transportation services they need and their ability to pay for our services. We operate in a highly price-sensitive and competitive industry, making industry pricing actions, quality of customer service, effective asset utilization and cost control major competitive factors.
The impact of the coronavirus disease (“COVID-19”) outbreak had a considerable impact on our 2020 consolidated financial statements. See the Risk Factors section related to our forward-looking considerations in Item 1A of this report.
All of our revenues are subject to seasonal variations which are common in the trucking industry. CustomersGenerally, most of the first quarter and the latter part of the fourth quarter are the seasonally weakest while the second and third quarters are the seasonally strongest, as customers tend to reduce shipments just prior to and after the winter holiday season. Operating expenses as a percent of revenue tend to be higher, and operating cash flows as a percent of revenue tend to be lower in the winter months, primarily due to colder weather and seasonally lower levels of shipments and the seasonal timing of expenditures. Generally, most of the first quarter and the latter part of the fourth quarter are the seasonally weakest while the second and third quarters are the seasonally strongest. The availability and cost of labor and other operating cost inputs, such as fuel, equipment maintenance and equipment replacements, can significantly impact our overall cost, competitive position within our industry and our resulting earnings and cash flows.
Consumer and corporate purchasing behaviors may also change due to cyclical economic conditions or changes in consumer trends. For example, consumer retail shopping experienced a significant shift in market share from brick-and-mortar distribution to online purchasing and direct-to-consumer warehouse fulfillment. ThisThe Company believes that this shift was notably accelerated due to COVID-19. These changes can permanently altercontinue to impact distribution patterns, warehousing and inventory carrying volumes, and subsequent use of LTL.
Human Capital Resources
People and Culture
The Company’sCompany's commitment to human capital resources is evidenced through ouran intentional focus on our people.most important customer, our employees. Their safety and wellness, both physical and psychological, ismental, are our top priority as we strive to create a culture of collaboration, inclusion, integrity, leadership,accountability, and respect. We believe the Company’sCompany's success is firmly built uponin serving our external customers will depend on our commitment to these values, giving us theand our ability to attract, develop, and retain quality talent. It is this abilitydiversely talented individuals.
We will create an inclusive and aspiration to be an employer of choice among diverse, quality talent that drives us to cultivate the culture we envision of andiversely engaged inclusive workplaceworkforce where our people haveemployees experience a sense of purpose, belonging, and can better focus on executingownership of their work. Strategically utilizing the unique experiences and perspectives of our nearly 30,000 employees, including approximately 24,000 unionized employees, along with their industry-specific knowledge and skills will improve our operational capacity, our organizational performance, and, most importantly, our workplace culture.
Our employee-led Diversity, Equity, Inclusion and Belonging ("DEIB") Council collaborates with our workforce to develop concrete, strategic goals, driving innovation,objectives that prioritize and delivering ondrive accountability for the development of equitable policies, practices, and programs that are people and culture-focused. The DEIB Council proactively identifies, engages with, and advocates for diverse ideas, interests, and perspectives to center and provide platforms for historically oppressed groups.
Likewise, the Company named a Vice President of Workforce Diversity to guide people and culture efforts who in collaboration with the DEIB Council, provides strategic direction, sets organizational objectives, and leads DEIB initiatives and programs. We have been honored to receive several awards and form partnerships highlighting our employees' efforts supporting our commitment to our customers. diversity and inclusion including Top Company for Women to Work for in Transportation, Military Friendly Employer, the National Defense Transportation Association Pathfinder Society Award, ATA 2022 Diversity, Equity & Inclusion Change Leader Award , and the U.S. Army Partnership for Your Success (PaYS) program.
Safety and Wellness
The skills, diverse experiences, and industry knowledge of our approximately 30,000 employees significantly benefit our operations and performance.
The Company is safety focused; hazards in the workplacenumber one core value for Yellow has always been safety. Hazards are actively identified and management tracks incidents so remedial actions can be taken.controlled. As a team, we hold ourselves accountable to taking care of ourkeep ourselves and others safe, including customers and each other.the general public. We actively provide
8
As discussed throughout this filing, mostleadership and frontline development to meet regulatory requirements and promote a culture of our employees are covered by our various collective bargaining agreements. As such, the Company is dedicated to managing our labor relations for those employees covered by collective bargaining agreementssafety in all we do. Our recognition systems reinforce safe behaviors with a focus on exposure control as well as those whoinjury and collision reduction. A safety governance structure from the terminal level to the Board of Directors is in place to oversee strategic initiatives related to safety policies, practices, and protocols.
Training and Development
Our CDL Apprenticeship program provides paid training for current employees or newly hired employees. In addition to classroom preparation for a commercial driver's license, students are not.given behind-the-wheel skills development to prepare for a career in trucking. The Yellow Driving Academies have expanded to 21 locations across the U.S. to address the nationwide shortage of experienced drivers. The comprehensive training is registered through the Department of Labor and is compliant with the Federal Motor Carrier Safety Administration ("FMCSA") Entry-Level Driver Training requirements. Student training emphasizes safe driving habits through extended on road skills training.
The Company is committedIn addition to efforts to increase diversity within our partnerships and our workforce and has establisheddriver training program, Yellow also received the Association for Talent Development’s 2022 BEST award for the third year in a supplier diversity policy as wellrow. This award recognizes organizations that demonstrate enterprise-wide success as a diversity, equity, inclusion, and belonging (“DEIB”) steering committee to guide these efforts. The supplier diversity policy commits the Company to providing fair and reasonable access to business opportunities without regard to status, structure, or ownership. We believe this program has the potential to help create better partnerships, stronger customers, and economic growth for our community members. The Company’s DEIB steering committee, comprisedresult of a representative group of employees within the organization, will provide strategic direction, set organizational objectives, and lead diversity, equity, inclusion, and belonging initiatives and programs.employee talent development.
The COVID-19 pandemic has highlighted new and different challenges to work through to honor our commitment to keep our employees healthy and safe. In response to the pandemic, the Company has taken actions to protect our valued employees so they can more safely perform their work.
Item 1A. Risk Factors
In addition to the risks and uncertainties described elsewhere in this report or in our other SEC filings, the following risk factors should be considered carefully in evaluating us. These risks could have a material adverse effect on our business, financial condition (including our liquidity), results of operations and cash flows.
Business Risks
If our relationship with our employees and unions were to deteriorate, we may be faced with labor disruptions or stoppages or general uncertainty by our customers, which could have a material adverse effect on our business, financial condition, results of operations and cash flows, result in a loss of customers, and place us at a disadvantage relative to competitors.
Each of our operating subsidiaries has employees who are represented by the International Brotherhood of Teamsters (“IBT”). These employees represented approximately 79% of our workforce at December 31, 2020. Salaries, wages and employee benefits for both union and non-union employees compose over half of our operating costs. Each of our YRC Freight, New Penn and Holland subsidiaries employ most of their unionized employees under the terms of a common master collective bargaining agreement and related supplemental agreements that remain in effect through March 31, 2024, and Reddaway employs most of their unionized employees under a collective bargaining agreement that expires March 31, 2021. The IBT also represents a number of employees at YRC Freight in Canada under more localized agreements, which have wages, benefit contributions and other terms and conditions that we believe better fit the cost structure and operating models of this entity.
Our subsidiaries are regularly subject to grievances, arbitration proceedings and other claims concerning alleged past and current non-compliance with applicable labor law and collective bargaining agreements. We cannot predict the outcome of any of these matters. These matters, if resolved in a manner unfavorable to us, could have a material adverse effect on our business, financial condition, liquidity and results of operations.
We are subject to general economic factors that are largely out of our control, any of which could have a material adverse effect on our business, financial condition, results of operations and cash flows.
Our business is subject to a number of general economic factors, including the health of the industrial economy, global trade tensions, global or national health epidemics and pandemics, such as the widespread outbreak of COVID-19,and fluctuating interest rates, among others that may adversely affect our business, financial condition and results of operations, many of which are largely out of our control. These factors include recessionary economic cycles and downturns in customers’ business cycles and changes in their business practices, particularly in market segments and industries, such as retail and manufacturing, where we have a significant concentration of customers. Economic conditions may adversely affect our customers’ business levels, the amount of transportation services they need and their ability to pay for our services. Because a portion of our costs are fixed, it may be difficult for us to quickly adjust our cost structure proportionally with fluctuations in volume levels. Customers encountering adverse economic conditions represent a greater potential for loss, and we may be required to increase our reserve for bad debt losses. Further, we depend on our suppliers for equipment, parts and services that are critical to our business. A disruption in the availability of these supplies or a material increase in their cost due to adverse economic conditions or financial constraints of our suppliers could adversely impact our business, financial condition, results of operations and cash flows.
The widespread outbreak
Regarding our operating costs, inflationary pressures occurred throughout 2022 and are expected to persist in the near term. We cannot predict future economic conditions, fuel price fluctuations, revenue equipment resale values, or how consumer confidence and shipping volumes could be affected by such conditions.
Difficulties attracting and retaining qualified drivers could result in increases in driver compensation and purchased transportation costs and could adversely affect our growth potential and profitability.
We need to attract new qualified drivers and may face difficulty doing so. Like many in the trucking industry, it is important to our business that we retain the necessary number of an illness or any other communicable disease,qualified drivers to operate efficiently. Regulatory requirements, including the effectsCompliance Safety Accountability program (“CSA”) of pandemics,the FMCSA, have reduced the number of eligible employee drivers and independent contractors and may continue to do so in the future. Future Company driver shortages may result in less than optimal use of rail and over-the-road purchased transportation, which may result in higher costs to the Company and which use is limited under our collective bargaining agreement with the International Brotherhood of Teamsters ("IBT"). The compensation we offer our drivers is subject to market conditions, and we may find it necessary to increase driver compensation, including both wages and benefits, in future periods if we must attract new drivers. In addition, we and our industry suffer from a high driver turnover rate. Driver turnover requires us to continually recruit a substantial number of drivers in order to operate existing revenue
9
equipment. If we are unable to continue to retain drivers and attract new drivers when needed, we could be required to adjust our compensation packages, increase our use of purchased transportation, or let tractors sit idle, any of which would adversely affect our growth potential and profitability.
If our relationship with our employees and unions were to deteriorate, we may be faced with increased labor costs, labor disruptions or stoppages or general uncertainty by our customers, which could have a material adverse effect on our business, financial condition, results of operations and cash flows, result in a loss of customers, and place us at a disadvantage relative to competitors.
Each of our operating subsidiaries has employees who are represented by the IBT. These employees represented approximately 82% of our workforce at December 31, 2022. Salaries, wages and employee benefits for both union and non-union employees compose over half of our operating costs, which for union employees include multi-employer pension and health and welfare plans. The labor and benefit expenses associated with the union employees are subject to regular negotiation with the IBT primarily upon the expiration of union labor agreements. Each of our YRC Freight, New Penn, Holland and Reddaway subsidiaries employ most of their unionized employees under the terms of a common master collective bargaining agreement and related supplemental agreements that remain in effect through March 31, 2024. The IBT also represents a number of employees at YRC Freight in Canada under more localized agreements, which have wages, benefit contributions and other public health crisis,terms and conditions that we believe better fit the cost structure and operating models of this entity.
Our subsidiaries are regularly subject to grievances, arbitration proceedings and other claims concerning alleged past and current non-compliance with applicable labor law and collective bargaining agreements. We cannot predict the outcome of any of these matters. These matters, if resolved in a manner unfavorable to us, could have a material adverse effect on our business, financial condition, liquidity and results of operations.
We depend on the services of key employees and the loss of any substantial number of these individuals or an inability to hire additional personnel could adversely affect us.
Our success is dependent upon our ability to attract and retain skilled employees, particularly personnel with significant management and leadership skills. If we are unable to attract and retain skilled key employees, we may be unable to accomplish the objectives set forth in our business and strategic plans. Further, compensation for many of these key employees is limited by the terms of our UST Tranche A Loan Credit Agreement (the “Tranche A UST Credit Agreement”) entered into by the Company and certain of its subsidiaries, as wellguarantors (the “Term Guarantors”), with The Bank of New York Mellon, as regulatory measures implementedadministrative agent and collateral agent, and the UST Tranche B Term Loan Credit Agreement (the “Tranche B UST Credit Agreement”) entered into by the Company and Term Guarantors, with The Bank of New York Mellon, as administrative agent and collateral agent (the Tranche A UST Credit Agreement and the Tranche B UST Credit Agreement are collectively referred to herein as, the “UST Credit Agreements”).
We depend on third-party capacity providers, and service instability from these transportation providers could increase our operating costs and reduce our ability to offer intermodal services, which could adversely affect our revenue, results of operations, and customer relationships.
Our intermodal operations use railroads and some third-party drayage carriers to transport freight for our customers, and intermodal dependence on railroads could increase as intermodal services expand. In certain markets, rail service is limited to a few railroads or even a single railroad. Intermodal providers have experienced poor service from providers of rail-based services in responsethe past. Our ability to such events,provide intermodal services in certain traffic lanes would be reduced or eliminated if the railroads' services became unstable. Railroads could reduce their services in the future, which could increase the cost of the rail-based services we provide and could reduce the reliability, timeliness, efficiency, and overall attractiveness of our rail-based intermodal services. Furthermore, price increases could result in higher costs to us, which we may be unable to pass on to our customers and could result in the reduction or elimination of our ability to offer intermodal services. In addition, we may not be able to negotiate additional contracts with railroads to expand our capacity, add additional routes, obtain multiple providers, or obtain railroad services at current cost levels, any of which could limit our ability to provide this service.
We operate in a highly competitive industry, and our business will suffer if we are unable to adapt to competitive pressures which could have a material adverse effect on our business, financial condition, results of operations and cash flows.
Numerous competitive factors could adversely affect our business, financial condition, results of operations and cash flows. These factors include the following:
10
•We compete with many other transportation service providers of varying sizes and types, many of which have a lower cost structure, more and/or newer equipment and greater capital resources than we do or have other competitive advantages;
•Some of our competitors periodically reduce their prices to gain business, especially during times of reduced growth rates in the economy, which limits our ability to maintain or increase prices or maintain or grow our business;
•Our customers may negotiate rates or contracts that minimize or eliminate our ability to offset fuel prices through fuel surcharges;
•Many customers reduce the number of carriers they use by selecting so-called “core carriers” as approved transportation service providers, and in some instances, we may not be selected;
•Many customers periodically accept bids from multiple carriers for their shipping needs, which may depress prices or result in the loss of some business has beento competitors;
•The trend towards consolidation in the ground transportation industry may create other large carriers with greater financial resources and couldother competitive advantages relating to their size;
•Advances in technology require increased investments to remain competitive and our customers may not be negativelywilling to accept higher prices to cover the cost of these investments;
•Brand recognition and strength is of ongoing importance and can be impacted, suddenly or over time, by factors such as adverse publicity and environmental, social and governance (“ESG”) perceptions or profile ratings in the widespread outbreakrapidly evolving field of an illnessESG analysis which is likely to gain significance if greenhouse gas or similar disclosure regulations become effective;
•Competition from non-asset-based logistics and freight brokerage companies may adversely affect our customer relationships and prices; and
•As a union carrier, we may have a competitive disadvantage compared to non-union carriers with lower costs and greater operating flexibility.
We may not realize the expected benefits and cost savings from operational changes and performance improvement initiatives.
We initiate operational changes and process improvements to reduce costs and improve financial performance. These changes and initiatives typically include evaluating management talent, reducing overhead costs, closing facilities, making upgrades to our technology, eliminating non-core assets and unnecessary activities and implementing changes of operations under our labor agreements. There is no assurance that any other communicable disease or other public health crisis. Measures intended to prevent the spread of a health epidemic could alsochanges and improvements will be successful, that their implementation may not have an adverse effect on our business.
The COVID-19 pandemic has, and may continue to, adversely impact economic activity and conditions worldwide and created significant volatility and disruption to financial markets. Efforts to control the spread of COVID-19 have led governments and other authorities to impose restrictions such as travel bans and limits, quarantines, shelter-in-place orders, increased border and port controls, and closures and shutdowns which have resulted in business closures and disrupted supply chains worldwide. The COVID-19 pandemic and measures taken to prevent its spread have, at certain times, negatively impacted demand for our services, and thus our shipment and tonnage levels, and has prevented us from delivering some freight in our network due to recipients that have closed their businesses to deliveries during the COVID-19 pandemic.
Specifically, the global outbreak of COVID-19 has had a significant negative impact on our 2020operating results including shipping volumes at certain times,or that we will not have to initiate additional changes and it may continueimprovements in order to do so in future reporting periods. Furthermore,achieve the continuation of COVID-19
related socialprojected benefits and economic disruptions may lead to other events which could negatively impact our operations, including limited availability of drivers and other key employees, reductions in operating efficiencies and increased security risks due to employees working remotely, reductions in the supply of necessary capital equipment, industry-wide excess capacity or rate reductions, reductions in the supply of capital equipment, an increase in our pension funding obligations due to market volatility, the credit-worthiness of our customers, or volatile financial credit markets.cost savings.
Given the amount of economic uncertainty, including uncertainty about how and when federal, state and local governments will lift business and travel restrictions or put new restrictions in place, it is difficult to predict how long we may experience negative trends. The continuing impact of the COVID-19 pandemic on our business is highly uncertain and will depend on future developments, including the duration and severity of the pandemic, government restrictions imposed in response to the pandemic, and the development and availability of effective treatments and vaccines. An extended period of economic disruption and resulting declines in industrial production and manufacturing, consumer spending, and demand for our services, as well as the ability of our customers and other business partners to fulfill their obligations, could have a material adverse effect on our financial condition, results of operations and cash flows.
We are exposed to, and may be adversely affected by, interruptions to our computer and information technology systems and sophisticated cyber-attacks.
We rely on our information technology systems and networks in connection with many of our business activities. Some of these networks and systems are managed by third-party service providers and are not under our direct control. Our operations routinely involve receiving, storing, processing and transmitting sensitive information pertaining to our business, customers, suppliers, employees and other sensitive matters. As with most companies, we have experienced cyber-attacks, attempts to breach our systems and other similar incidents, none of which have been material. Any future cyber incidents could, however, materially disrupt operational systems; result in loss of proprietary or competitively sensitive information; compromise personally identifiable information regarding customers or employees; delay our ability to deliver service to customers; and jeopardize the security of our facilities. A cyber incident could be caused by malicious outsiders or insiders using sophisticated methods to circumvent firewalls, encryption and other security defenses. Because techniques used to obtain unauthorized access or to sabotage systems change frequently and generally are not recognized until they are launched against a target, we may be unable to anticipate these techniques or to implement adequate preventative measures. Information technology security threats, including security breaches, computer malware and other cyber-attacks, are increasing in both frequency and sophistication and could create financial liability, subject us to legal or regulatory sanctions or damage our reputation with customers, suppliers and other stakeholders. With some of our employees working from home during the COVID-19 pandemic, there may be increased opportunities for unauthorized access and cyber-attacks. Security breaches could also result in a violation of U.S. and international privacy and other laws and subject the Company to various litigations and proceedings. We continuously seek to maintain a robust program of information security and controls, but the impact of a material information technology event could have a material adverse effect on our competitive position, reputation, results of operations, financial condition and cash flows.
We are subject to business risks and increasing costs associated with the transportation industry that are largely out of our control, any of which could have a material adverse effect on our business, financial condition, results of operations and cash flows.
We are subject to business risks and increasing costs associated with the transportation industry that are largely out of our control, any of which could adversely affect our business, financial condition and results of operations. The factors contributing to these risks and costs include increasing equipment and operational costs, weather, fuel prices, interest rates, insurance premiums, self-insurance levels, letters of credit required to support outstanding claims, license and registration fees, potential harm by security measures associated with anti-terrorism concerns and excess capacity in the transportation industry, as well as the other factors discussed in this risk factor section. Further, we periodically need to upgrade or change our technology systems, which may be costly and could disrupt or reduce the efficiency of our operations.
Difficulties attracting and retaining qualified drivers could result in increases in driver compensation and purchased transportation costs and could adversely affect our profitability.
We need to attract new qualified drivers and may face difficulty doing so. Like many in the trucking industry, it is important to our business that we retain the necessary number of qualified drivers to operate efficiently. Regulatory requirements, including the Compliance Safety Accountability program (“CSA”) of the Federal Motor Carrier Safety Administration (“FMCSA), have reduced the number of eligible employee drivers and independent contractors and may continue to do so in the future. Future Company driver shortages may result in less than optimal use of rail and over-the-road purchased transportation, which may result in higher costs to the Company and which use is limited under our collective bargaining agreement with the IBT. The compensation we offer our drivers is subject to market conditions, and we may find it necessary to increase driver compensation in future periods if we must attract new drivers. In addition, we and our industry suffer from a high driver turnover rate. Driver turnover requires us to continually recruit a substantial number of drivers in order to operate existing revenue equipment. If we
are unable to continue to retain drivers and attract new drivers when needed, we could be required to adjust our compensation packages, increase our use of purchased transportation, or let tractors sit idle, any of which would adversely affect our growth potential and profitability.
We operate in a highly competitive industry, and our business will suffer if we are unable to adapt to competitive pressures whichhave significant ongoing capital expenditure requirements that could have a material adverse effect on our business, financial condition, results of operations and cash flows.flows if we are unable to generate sufficient cash from operations.
Our business is capital intensive and we will need to continue to update our fleet. If we are unable to generate sufficient cash over an extended period of time from operations to fund our capital requirements, we may have to limit our growth, utilize our existing liquidity, or enter into additional financing arrangements, including leasing arrangements, or operate our revenue equipment (including tractors and trailers) for longer periods resulting in increased maintenance costs, any of which could negatively impact our results of operations and other financial measures. If our cash from operations and existing financing arrangements is not sufficient to fund our current and longer-term capital expenditure requirements, then we may not be able to obtain additional financing at all or on terms acceptable to us.
Numerous competitive factors could adverselySeasonality and the impact of weather affect our business,operations and profitability.
As is common in the trucking industry, our revenues are subject to seasonal variations. During late fourth quarter and early first quarter each year, we normally would expect operating expenses as a percent of revenue to increase and operating cash flows as a percent of revenue to decrease as compared to the rest of the year. The seasonal impact is primarily due to inclement weather,
11
seasonally lower levels of shipments, and the seasonal timing of expenditures. We anticipate these seasonal trends will continue to impact our financial results and liquidity. Climate conditions and volatile changes in weather conditions, including extreme heat or cold, could increase the risk of wildfires, floods, blizzards, hurricanes and other weather-related disasters or climate condition changes, which could impact our ability to timely meet, or increase the cost of meeting, our obligations, impacting our financial results.
Changes in fuel prices and shortages of fuel can have a material adverse effect on the results of operations and profitability.
To lessen the effect of fluctuating fuel prices on our margins, we utilize a fuel surcharge program with our customers. These programs are common in the trucking industry and involve adjusting amounts charged to customers as fuel prices fluctuate. In the short term, under our present fuel surcharge program, rising fuel costs generally benefit us while falling fuel costs have a negative impact on our results of operations, though these effects are typically moderated over time. However, rapid material changes in the index upon which we base our program or our cost of fuel could significantly impact our revenue and operating income, resulting in a material adverse effect on our financial condition, results of operations and cash flows. These factors include the following:
| •
| We compete with many other transportation service providers of varying sizes and types, many of which have a lower cost structure, more and/or newer equipment and greater capital resources than we do or have other competitive advantages;
|
| •
| Some of our competitors periodically reduce their prices to gain business, especially during times of reduced growth rates in the economy, which limits our ability to maintain or increase prices or maintain or grow our business;
|
| •
| Our customers may negotiate rates or contracts that minimize or eliminate our ability to offset fuel prices through fuel surcharges;
|
| •
| Many customers reduce the number of carriers they use by selecting so-called “core carriers” as approved transportation service providers, and in some instances, we may not be selected;
|
| •
| Many customers periodically accept bids from multiple carriers for their shipping needs, which may depress prices or result in the loss of some business to competitors;
|
| •
| The trend towards consolidation in the ground transportation industry may create other large carriers with greater financial resources and other competitive advantages relating to their size;
|
| •
| Advances in technology require increased investments to remain competitive and our customers may not be willing to accept higher prices to cover the cost of these investments;
|
| •
| Competition from non-asset-based logistics and freight brokerage companies may adversely affect our customer relationships and prices; and
|
| •
| As a union carrier, we may have a competitive disadvantage compared to non-union carriers with lower costs and greater operating flexibility.
|
Our pension expenseIn addition, fuel shortages and petroleum product rationing could increase significantly and have a material adverse impact on our operations and profitability.
Damage to our corporate reputation may cause our business to suffer.
Our business depends, in part, on our ability to maintain the positive image of our brand. Service, performance, and safety issues, whether actual or perceived and whether as a result of our actions or those of our third-party contract carriers and their drivers and owner operators or other third-party service providers, could adversely impact our customers’ image of our brands and result in the loss of business. Adverse publicity regarding labor relations, legal matters, cybersecurity and data privacy concerns, environmental and sustainability issues, other ESG matters and analyses, and similar matters, even when based on erroneous information, could have a negative impact on our reputation and may result in the loss of customers and our inability to secure new customer relationships. Damage to our reputation and loss of brand equity could reduce demand for our services and, thus, have an adverse effect on our business, financial condition, results of operations, and cash flows.
Our subsidiaries began making contributionsfinancial condition, as well as require additional resources to most ofrebuild our reputation and restore the multi-employer pension funds (the “funds”) beginning June 1, 2011 at the rate of 25% of the contribution rate in effect on July 1, 2009. Any fund that did not allow our subsidiaries to begin making contributions at a reduced rate elected to either (i) apply the amount of the contributions toward paying down previously deferred contributions under our Contribution Deferral Agreement, or (ii) have the amount of the contributions placed in escrow until such time when the fund is able to accept re-entry at the reduced rate.
If contributions to the funds do not reach certain goals (including those required not to enter endangered or critical status or those required by a fund’s funding improvement or rehabilitation plan), our pension expenses and required cash contributions could further increase upon the expirationvalue of our collective bargaining agreements and, as a result, could materially adversely affect our business, financial condition and results of operations. Decreases in investment returns that are not offset by contributions could also increase our obligations under such plans.brands.
Our LTL brands also contribute to various separate multi-employer health and welfare plans for employees that are covered by our collective bargaining agreements.
Based on information obtained from public filings and from plan administrators and trustees, we believe our portion of the contingent liability in the case of a full withdrawal from or termination of all of the multi-employer pension plans would be an estimated $8 billion. If we were subject to withdrawal liability with respect to a multi-employer plan, the Employment Retirement Income Security Act of 1974, as amended, provides that a withdrawing employer can pay the obligation in a lump sum or over time based upon an annual payment that is the highest contribution rate to the relevant plan multiplied by the average of the three highest consecutive years measured in contribution base units, which, in some cases, could be up to 20 years. Even so, our applicable subsidiaries have no current intention of taking any action that would subject us to payment of material withdrawal obligations; however, we cannot provide any assurance that such obligations will not arise in the future which would have a material adverse effect on our business, financial condition, liquidity and results of operations.
Ongoing self-insurance and claims expenses could have a material adverse effect on our business, financial condition, results of operations and cash flows.
Our future insurance and claims expenses might exceed historical levels. We currently self-insure for a majority of our claims exposure resulting from workers’ compensation, third-party liability claims, and cargo, supplemented by high deductible purchased insurance. If the number or severity of claims for which we are self-insured increases, our business, financial condition and results of operations could be adversely affected, and we may have to post additional letters of credit or cash collateral to state workers’ compensation authorities or insurers to support our insurance policies, which may adversely affect our liquidity. If we lose our ability to self-insure or have to increase retention limits to offset rising insurance premium costs our insurance costs could materially increase, and we may find it difficult to obtain adequate levels of insurance coverage.
Our self-insured retention limits can make our insurance and claims expense higher and/or more volatile. We accrue for the costs of the uninsured portion of pending claims based on the nature and severity of individual claims and historical claims development trends. Estimating the number and severity of claims, as well as related judgment or settlement amounts is inherently difficult. This, along with legal expenses associated with claims, incurred but not reported claims, and other uncertainties can cause unfavorable differences between actual self-insurance costs and our reserve estimates.
In general, our insurance coverage with respect to each of workers’ compensation, property damage and liability claims, and cargo claims is subject to policy limits. Although we believe our aggregate insurance policy limits are sufficient to cover reasonably expected claims, it is possible that one or more claims could exceed those limits. In this case, we would bear the excess expense, in addition to the amount of our self-insurance retention. Our insurance and claims expense could increase, or we could find it necessary to raise our self-insured retention or decrease our aggregate coverage limits when our policies are renewed or replaced.
Current or future litigation may adversely affect our business, financial condition, results of operations and cash flows.
We have been and continue to be involved in legal proceedings, claims and other litigation that arise in the ordinary course of business. Litigation may be related to labor and employment, competitive matters, third-party liability claims, safety and contract
12
compliance, environmental liability, our past financial restructurings and other matters. We discuss legal proceedings in the “Commitments, Contingencies, and Uncertainties” footnote to our Consolidated Financial Statements included elsewhere in this Annual Report on Form 10-K as well as in “Environmental Matters” in Part I hereof. Some or all of our expenditures to defend, settle or litigate these matters may not be covered by insurance or could impact our cost and ability to obtain insurance in the future. Litigation can be expensive, lengthy and disruptive to normal business operations, including to our management due to the increased time and resources required to respond to and address the litigation. The results of complex legal proceedings are often uncertain and difficult to predict. An unfavorable outcome of any particular matter or any future legal proceedings could have a material adverse effect on our business, financial condition, results of operations and cash flows. In the future, we could incur judgments or enter into settlements of claims that could harm our financial condition, results of operations and cash flows.
We operate in an industry subject to extensive government regulations, and costs of compliance with, or liability for violation of, existing or future regulations could significantly increase our costs of doing business.
The U.S. Departments of Transportation and Homeland Security and various federal, state, local and foreign agencies exercise broad powers over our business, generally governing such activities as authorization to engage in motor carrier operations, safety and permits to conduct transportation business. Our drivers are also subject to hours-of-service rules of the FMCSA. In the future, we may become subject to new or more restrictive regulations that the FMCSA, Departments of Transportation and Homeland Security, the Occupational Safety and Health Administration, the EPA, the SEC, or other authorities impose, including regulations relating to engine exhaust emissions, greenhouse gas emissions, environmental or other disclosures, the hours of service that our drivers may provide in any one-time period, security and other matters. Compliance with these regulations could substantially impair productivity and increase our costs.
The FMCSA’s CSA program is a motor carrier data-driven oversight program under which drivers and fleets are evaluated based on certain safety-related standards. Carriers’ safety and fitness ratings under CSA include the on-road safety performance of the carriers’ drivers. At any given time, there are also other proposals for safety relatedsafety-related standards that are pending legislative or administrative approval or adoption. If additional or more stringent standards are adopted, such may result in a reduction of the pool of qualified drivers available for employment by us. If we experience safety and fitness violations, our safety and fitness scores could be adversely impacted and our fleet could be ranked poorly as compared to our peers. A reduction in our safety and fitness scores or those of our drivers could also reduce our competitiveness in relation to other companies that have higher scores. Additionally, competition for qualified drivers with favorable safety ratings may increase and thus result in increases in driver-related recruiting and compensation costs.
Like many motor carriers, we compensate our drivers based primarily on mileage rate and activity-based formulas. The state of California adopted legislation that sets forth requirements for the payment of a separate hourly wage for “nonproductive” time worked by 13 piece-rate employees, and separate payment for compensable rest and recovery periods to those employees. Specifically, that legislation, effective since January 1, 2016, codified three basic statutory requirements for the payment of employees on a piece-rate basis: (i) employees must be separately compensated at their regular rate for the time during which they take rest and recovery breaks; (ii) employees must be separately compensated for “other nonproductive time,” which is defined as “time under the employer’s control, exclusive of rest and recovery periods, that is not directly related to the activity being compensated on a piece-rate basis;” and (iii) this “other nonproduction time” time must be compensated at an hourly rate no less than the applicable minimum wage. The application of this legislation to the Company and its operations has increased our operating costs, including labor costs and legal exposure.
Current or future litigationWe may adversely affect our business, financial condition, results of operations and cash flows.
We have been and continue to be involved in legal proceedings, claims and other litigation that arise in the ordinary course of business. Litigation may be related to labor and employment, competitive matters, third-party liability claims, safety and contract compliance, environmental liability, our past financial restructurings and other matters. We discuss legal proceedings in the “Commitments, Contingencies, and Uncertainties” footnote to our consolidated financial statements included elsewhere in this
Annual Report on Form 10-K as well as in “Environmental Matters” in Part I hereof. Some or allexperience disruptions of our expenditures to defend, settle or litigate these matters may not be covered by insurance or could impact our costcomputer and ability to obtain insurance in the future. Litigation can be expensive, lengthyinformation technology systems, privacy breaches and disruptive to normal business operations, including to our management due to the increased time and resources required to respond to and address the litigation. The results of complex legal proceedings are often uncertain and difficult to predict. An unfavorable outcome of any particular matter or any future legal proceedings could have a material adverse effect on our business, financial condition, results of operations and cash flows. In the future, we could incur judgments or enter into settlements of claims that could harm our financial condition, results of operations and cash flows.
In addition, in December 2018, the United States on behalf of the United States Department of Defense filed a complaint (the “DOD Complaint”) against the Company alleging that the Company violated the False Claims Act by overcharging the Department of Defense for freight carrier services by failing to comply with the contractual terms of freight contracts between the Department of Defense and the Company and related government procurement rules. In January 2019, a purported class action lawsuit (the “Securities Class Action”) was filed against the Company and certain of our current and former officers. The Securities Class Action complaint generally alleges that the Company made false and misleading statements relating to its freight billing practices as alleged in the Department of Defense complaint described above. In February 2021, the parties to the Securities Class Action reached an agreement in principle to settle the matter for an immaterial amount. That agreement remains subject to certain conditions, including execution of a definitive settlement agreement and court approval. In February 2021, two putative shareholders filed an action derivatively and on behalf of the Company (the “Shareholder Derivative Action”) naming certain individuals as defendants and the Company as the nominal defendant. The complaint alleges that the Company was exposed to harm by the individual defendants’ purported conduct concerning its freight-billing practices as alleged in the DOD Complaint and the Securities Class Action.
Although the Company believes it has meritorious defenses and intends to vigorously defend these actions, the DOD Complaint, the Securities Class Action and the Shareholder Derivative Action each assert claims that, if resolved against us and the other defendants, could give rise to substantial damages, and an unfavorable outcome or settlement may result in a significant monetary judgment or award against us or a significant monetary payment by us, and could have a material adverse effect on our business, financial conditions and results of operations.
We are subject to various environmental regulations and climate change initiatives, and costs of compliance with, or liabilities for violations of, existing or future laws, regulations and initiatives could significantly increase our costs of doing business.
Our operations are subject to Environmental Regulations dealing with, among other things, the handling of hazardous materials, underground fuel storage tanks, and the discharge and retention of storm water. We operate in industrial areas, where truck terminals and other industrial activities are located, and where groundwater or other forms of environmental contamination may have occurred. Our operations involve the risks of fuel spillage or seepage, environmental damage and hazardous waste disposal, among others. If we are involved in a spill or other accident involving hazardous substances, or if we are found to be in violation of applicable environmental laws or regulations, it could significantly increase our cost of doing business. Under specific environmental laws and regulations, we could be held responsible for all of the costs relating to any contamination at our past or present terminals and at third-party waste disposal sites. If we fail to comply with applicable environmental laws and regulations, we could be subject to substantial fines or penalties and to civil and criminal liability.
In addition, as climate change initiatives become more prevalent, federal, state and local governments and our customers are promulgating solutions for these issues. The increased focus on greenhouse gas emission reductions and corporate environmental sustainability may result in new regulations and customer requirements that could negatively affect us. This could cause us to incur additional direct costs or to make changes to our operations in order to comply with any new regulations and customer requirements. We could also lose revenue if our customers divert business from us because we have not complied with their sustainability requirements. These costs, changes and loss of revenue could have a material adverse effect on our business, financial condition, liquidity and results of operations.
We may not realize the expected benefits and cost savings from operational changes and performance improvement initiatives.
We initiate operational changes and process improvements to reduce costs and improve financial performance. These changes and initiatives typically include evaluating management talent, reducing overhead costs, closing facilities, making upgrades to our technology, eliminating non-core assets and unnecessary activities and implementing changes of operations under our labor agreements. There is no assurance that any changes and improvements will be successful, that their implementation may not have an adverse impact on our operating results or that we will not have to initiate additional changes and improvements in order to achieve the projected benefits and cost savings.
A significant privacy breach or IT system disruptionsophisticated cyber-attacks, which could adversely affect our business and we may be required to increase our spending on data and system security.security costs.
We rely on information technology networks and systems, including the Internet, to process, transmit and store electronic information, and to manage or support a variety of business processes and activities. In addition, the provision of service to our customers and the operation of our networks and systems involve the storage and transmission of proprietary information and sensitive or confidential data, including personal information of customers, employees and others.
Our information technology These systems, some of which are managed by third-parties, may be susceptible to damage, disruptions or shutdowns due to failures during the process of upgrading or replacing software, databases, or components thereof, power outages, hardware failures, computer viruses, attacks by computer hackers,cyber-attacks (including denial of service, ransom or other attacks), malicious insiders, telecommunication failures, user errors or catastrophic events. Hackers, acting individually or
We seek to maintain a robust program of information security and controls. However, information technology security threats are increasing in coordinated groups, may also launch distributed denial of service attacks or ransom or other coordinated attacks that may cause service outages or other interruptions in our businessboth frequency and access to our data. In addition, breaches in security could expose us, our customers, our suppliers, our employees, or the individuals affected, to a risk of loss or misuse of proprietary information and sensitive or confidential data.
The techniques used to obtain unauthorized access, disable or degrade service or sabotage systems change frequently, may be difficult to detect for a long time and often are not recognized until launched against a target.sophistication. As a result, we may be unable to anticipate these techniquesthreats or to implement adequate preventative measures. Additionally, with a portion of our employees working from home during the COVID-19 pandemic, there may be increased opportunities for unauthorized access and cyber-attacks.
13
Security breaches and information technology disruptions could create financial liability, disrupt our operations, damage our reputation with customers, suppliers and other stakeholders, result in loss or misuse of proprietary or competitively sensitive information, compromise personally identifiable information, delay our ability to deliver services to customers, and jeopardize the security of our facilities. Breaches and disruptions could also result in a violation of U.S. and international privacy and other laws and subject us to litigation and other legal and regulatory proceedings or sanctions. Any of these occurrences could result in disruptions in our operations, the loss of existing or potential customers damage toand have a material adverse effect on our brandcompetitive position, results of operations, financial condition and reputation, and litigation and potential liability for the Company.cash flows. In addition, the cost and operational consequences of implementing further data or system protection measures could be significant and our efforts to deter, identify, mitigate and/or eliminate any security breaches may not be successful.
We are dependent onThe continuing impact of the servicesCOVID-19 pandemic or any other widespread outbreak of key employees and the loss of any substantial number of these individualsan illness, communicable disease, or an inabilitypublic health crisis, as well as regulatory measures implemented in response to hire additional personnelsuch events, could adversely affect us.
Our success is dependent upon our ability to attract and retain skilled employees, particularly personnel with significant management and leadership skills. If we are unable to attract and retain skilled key employees, we may be unable to accomplish the objectives set forth in our business and strategic plans. Further, compensation for these key employees is limited by the terms of our UST Tranche A Loan Credit Agreement (the “Tranche A UST Credit Agreement”) entered into by the Company and certain of its subsidiaries, as guarantors (the “Term Guarantors”), with The Bank of New York Mellon, as administrative agent and collateral agent, and the UST Tranche B Term Loan Credit Agreement (the “Tranche B UST Credit Agreement” and together with the Tranche A UST Credit Agreement, the “UST Credit Agreements”).
We have significant ongoing capital expenditure requirements that could have a material adverse effect on our business, financial condition, results of operations and cash flowsflows.
To the extent COVID-19 restrictions remain or are renewed, or if other public health events occur, governments and authorities could impose restrictions such as travel bans and limits, quarantines, shelter-in-place orders, increased border and port controls, and closures and shutdowns, which have previously resulted in global business disruptions. In 2021, the United States President issued an executive order requiring COVID-19 vaccinations of employees of federal contractors and subcontractors. As a result of legal challenges, the order is not currently being enforced. If the order or any such other standard or mandate becomes effective or enforceable and applicable to us, we are unablecould be required to generate sufficient cash from operations.
Our business is capital intensive. For 2020, our capital expenditures focused primarily on revenue equipment, investments in information technology and improvements to land and structures. Our capital expenditures for each of the years ended December 31, 2020 and 2019 were $140.6 million and $143.2 million, respectively. These amounts were principally used to fund the purchase of used tractors and trailers, to refurbish enginesmandate COVID-19 or other vaccines for our revenue fleet,covered employees and/or implement a costly testing program. Any such requirements could adversely impact on our ability to attract and capitalized costs forretain drivers or other employees, serve our network facilities and technology infrastructure. We will needcustomers, or continue certain aspects of our business. Any public health crisis may lead to continue to update our fleet. If we are unable to generate sufficient cash over an extended period of time from operations to fund our capital requirements, we may have to limit our growth, utilize our existing liquidity, or enter into additional financing arrangements, including leasing arrangements, or operate our revenue equipment (including tractors and trailers) for longer periods resulting in increased maintenance costs, any ofother events which could negatively impact our resultsoperations, including limited availability of operationsdrivers and other key employees, reductions in operating efficiencies or supplies, increased security risks due to employees working remotely, industry-wide excess capacity or rate reductions, an increase in our pension funding obligations due to market volatility, the credit-worthiness of our customers, or volatile financial measures. If our cash from operations and existing financing arrangements are not sufficient to fund our current and longer-term capital expenditure requirements, then we may not be able to obtain additional financing at all or on terms acceptable to us.
Seasonality and the impact of weather affect our operations and profitability.
As is common in the trucking industry, our revenues are subject to seasonal variations. During late fourth quarter and early first quarter each year, we normally would expect operating expenses as a percent of revenue to increase and operating cash flows as a percent of revenue to decrease as compared to the restcredit markets. Any of the year. The seasonal impact is primarily due to inclement weather, seasonally lower levels of shipments, and the seasonal timing of expenditures. We anticipate these seasonal trends will continue to impact our financial results and liquidity.
Changes in fuel prices and shortages of fuel can have a material adverse effect on the results of operations and profitability.
To lessen the effect of fluctuating fuel prices on our margins, we utilize a fuel surcharge program with our customers. These programs are common in the trucking industry and involve adjusting amounts charged to customers as fuel prices fluctuate. In the short term, under our present fuel surcharge program, rising fuel costs generally benefit us while falling fuel costs have a negative impact on our results of operations, though these effects are typically moderated over time. However, rapid material changes in the index upon which we base our program or our cost of fuel could significantly impact our revenue and operating income, resulting in a material adverse effect on our financial condition, results of operations and cash flows.
In addition, fuel shortages and petroleum product rationingforegoing could have a material adverse impact on our operations and profitability.business, financial conditions, or results of operations.
We face risks associated with doing business in foreign countries.
We conduct a portion of our operations in Canada and, to a lesser extent, Mexico. As a participating carrier in the Customs and Trade Partnership Against Terrorism (“C-TPAT”) program, we and our contractors are able to cross into these countries more efficiently, thereby avoiding substantial delays. If we should lose the ability to participate in the C-TPAT program, we could experience significant border delays which could have a negative impact on our ability to remain competitive and operate efficiently in those countries.
In addition, we are subject to certain risks inherent in doing business in foreign countries, including, but not limited to, compliance with the requirements of applicable anti-bribery laws (including the U.S. Foreign Corrupt Practices Act), political instability, controls on the repatriation of cash, currency fluctuations and the imposition of tariffs, import and export controls and other non-tariff barriers.
Financial and Liquidity Risks
Our failure to comply with the covenants in the documents governing our existing and future indebtedness could materially adversely affect our financial condition and liquidity.
The documents governing our indebtedness contain financial covenants, affirmative covenants requiring us to take certain actions and negative covenants restricting our ability to take certain actions. In July 2020, we entered into the UST Credit Agreements and amended our $600 million term loan agreement (“Term Loan Agreement”) and our $450 million asset-backed loan facility (the “ABL Facility”). The UST Credit Agreements and the Term Loan Agreement each require that we maintain $125.0 million of Liquidity until the first date on which our trailing twelve month (TTM) Adjusted EBITDA on the last day of a fiscal quarter ending on or after September 30, 2020 is greater than $200.0 million. Our TTM Adjusted EBITDA as of December 31, 2020 was $191.9 million. In addition, the UST Credit Agreements and Term Loan Agreement require a minimum trailing-twelve-month ("TTM") Adjusted EBITDA commencing withmeasured quarterly. Management expects, based on actual and forecasted operating results, that the fiscal quarter ending December 31, 2021, to not be less than $100.0 millionCompany will meet this covenant requirement for the four quarters ending December 31, 2021, $150.0 million forperiod it became effective and the four quarters ending March 31, 2022 and $200.0 million for the four quarters ending June 30, 2022 and each quarter thereafter.next twelve months. The UST Credit Agreements also require us and our affiliates to comply with certain requirements in connection with the Coronavirus Aid, Relief, and Economic Security Act (the “CARES Act”), including (i) until one year from the initial funding under the UST Tranche B Term Loan Credit Agreement we must maintain our employment levels as of March 24, 2020, to the extent practicable, and in any case we may not reduce our employment levels by more than 10% from the levels on March 24, 2020, (ii) limitations on executive compensation and (iii)(ii) until 12 months following the repayments of the UST Credit Agreements, we may not pay any dividends or make any other capital distributions with respect to our common stock.
In the near term, our ability to meet the minimum Liquidity requirement while it is applicable is dependent on no further unexpected material decline in our operating results as a result of an overall decrease in economic activity from the continuing impact of COVID-19 or for some other unforeseen reason. Over the longer term, our ability to meet the minimum Adjusted EBITDA requirement after December 31, 2021 is dependent on an improvement in our operating results from continued improvements of the national economy restoring economic activity and operating improvements we may continue to implement. Our ability to satisfy these financialindebtedness covenants could be impacted by significant adverse conditions beyond our control, changes in global trade policies or increased contraction in the general economy. If we are unable to achieve the results required to comply with the applicable financial covenants, we may be required to take specific actions to reduce operating costs, as well as specific initiatives in the areas of pricing and customer engagement, and other operational actions to improve productivity and efficiency, as well as increased volume. If we are unable to satisfy our financial covenants or obtain a waiver or an amendment
14
from our lenders, or take other remedial measures, we will be in default under our credit facilities, which would enable lenders thereunder to accelerate the repayment of amounts outstanding and exercise remedies with respect to the collateral. If our lenders under our credit facilities demand payment, we will not have sufficient cash to repay such indebtedness. In addition, a default under our credit facilities or the lenders exercising their remedies thereunder could trigger cross-default provisions in our other indebtedness and certain other operating agreements as well as increase our funding obligations under our pension
plans. Our ability to amend our credit facilities or otherwise obtain waivers from our lenders depends on matters that are outside of our control and there can be no assurance that we will be successful in that regard. In addition, any covenant breach or event of default could harm our credit rating and our ability to obtain financing on acceptable terms. The occurrence of any of these events could have a material adverse effect on our financial condition and liquidity.
Our indebtedness and cash interest payment obligations, lease obligations and pension funding obligations, as well as our liquidity position, could adversely affect our financial flexibility and our competitive position.
As of December 31, 2020,2022, we had $1,284.0 million in aggregate principal amount of outstanding indebtedness. We also have,various material debt, pension and will continue to have, substantial lease obligations. As of December 31, 2020, our expected minimum cash payments for our operating leases for 2021 are $142.5 million, and our total operating lease obligations payable through 2031 are $350.8 million. We expectas described within the footnotes to the Consolidated Financial Statements. These obligations and liquidity limitations could:
•increase our required contributionsvulnerability to adverse changes or persistent slow growth in 2021 undergeneral economic, industry and competitive conditions;
•require us to dedicate a portion of our multi-employercash flow from operations to make principal and interest payments on our indebtedness, leases and pension fundsfunding obligations, thereby reducing the availability of our cash flow to fund working capital, capital expenditures and non-union single-employer pension plans will be approximately $113.8 million. Our indebtedness,other general corporate purposes;
•limit our flexibility in planning for, or reacting to, changes in our business and the industry in which we operate;
•restrict us from taking advantage of business opportunities;
•make it more difficult to satisfy our financial obligations and meet future stepped up financial covenants in our credit facilities;
•place us at a competitive disadvantage compared to our competitors that have less debt, lease obligations, and pension funding obligations could continueobligations; and
•limit our ability to
have an impactborrow additional funds for working capital, capital expenditures, acquisitions, debt service requirements, execution of our business strategy or other general corporate purposes on
our business. Our principal sources of liquidity are cash and cash equivalents, available borrowings under our ABL Facility and any prospective cash flow from operations. As of December 31, 2020, our availability under our ABL facility was $43.7 million and our Managed Accessibility was $4.0 million. “Managed Accessibility” represents the maximum amount we would access on the ABL Facility and is adjusted for eligible receivables plus eligible borrowing base cash measured as of December 31, 2020. If eligible receivables fall below the threshold management uses to measure availability, which is 10% of the borrowing line, the credit agreement governing the ABL Facility permits adjustments from eligible borrowing base cash to restricted cash prior to the compliance measurement date. Cash and cash equivalents and Managed Accessibility totaled $440.2 million satisfactory terms or at December 31, 2020.For example, these obligations and liquidity limitations could:
| all. •
| increase our vulnerability to adverse changes or persistent slow growth in general economic, industry and competitive conditions;
|
| •
| require us to dedicate a portion of our cash flow from operations to make principal and interest payments on our indebtedness, leases and pension funding obligations, thereby reducing the availability of our cash flow to fund working capital, capital expenditures and other general corporate purposes;
|
| •
| limit our flexibility in planning for, or reacting to, changes in our business and the industry in which we operate;
|
| •
| restrict us from taking advantage of business opportunities;
|
| •
| make it more difficult to satisfy our financial obligations and meet future stepped up financial covenants in our credit facilities;
|
| •
| place us at a competitive disadvantage compared to our competitors that have less debt, lease obligations, and pension funding obligations; and
|
| •
| limit our ability to borrow additional funds for working capital, capital expenditures, acquisitions, debt service requirements, execution of our business strategy or other general corporate purposes on satisfactory terms or at all.
|
Our ability to service all of our indebtedness and satisfy all of our other obligations depends on many factors beyond our control, and if we cannot generate enough cash to service our indebtedness and satisfy such other obligations, we may be forced to take one or more actions, which may not be successful.
Cash flows from operations are a principal source of funding for us. Our business may not generate cash flow from operations in an amount sufficient to fund our liquidity needs. If our cash flows are insufficient to service our indebtedness and satisfy our other obligations, we may be forced to reduce or delay capital expenditures, sell assets, seek additional capital or restructure or refinance our indebtedness or other financial obligations. Our ability to restructure or refinance our indebtedness will depend on the condition of the capital and credit markets and our financial condition at such time. Any refinancing of our indebtedness could be at higher interest rates. In addition, any refinancing of our indebtedness or restructuring of our other obligations may require us to comply with more onerous covenants, which could further restrict our business operations and limit our financial flexibility. In addition, the terms of existing or future debt agreements may restrict us from adopting some of these alternatives. Any failure to make payments of interest and principal on our outstanding indebtedness or satisfy our other financial obligations on a timely basis would likely result in a lowering of our credit rating, which could harm our ability to incur additional indebtedness. These alternative measures may not be successful and, as a result, our liquidity and financial condition could be adversely affected and we may not be able to meet our scheduled debt service obligations. If for any reason we are unable to meet our debt service obligations, we would be in default under the terms of the agreements governing our outstanding debt.
Restrictive covenants in the documents governing our existing and future indebtedness may limit our current and future operations, particularly our ability to respond to changes in our business or to pursue our business strategies.
The documents governing our existing indebtedness contain, and the documents governing any future indebtedness will likely contain, a number of restrictive covenants that impose significant operating and financial restrictions, including restrictions on
our ability to take actions that we believe may be in our interest. The documents governing our existing indebtedness, among other things, limit our ability to:
| • incur or guarantee additional indebtedness; •make certain restricted payments or investments; •enter into agreements that restrict distributions from restricted subsidiaries; •sell or otherwise dispose of assets, including capital stock of restricted subsidiaries; •enter into transactions with affiliates; 15
•enter into sale/leaseback transactions; •compensate certain executives; •pay dividends or make any other capital distributions with respect to our Common Stock, as discussed under Risks Related to Our Common Stock; •purchase shares of our Common Stock in the public market; •merge, consolidate or sell substantially all of our assets; and •make certain investments and acquire certain assets. •
| incur or guarantee additional indebtedness;
|
| •
| make certain restricted payments or investments;
|
| •
| enter into agreements that restrict distributions from restricted subsidiaries;
|
| •
| sell or otherwise dispose of assets, including capital stock of restricted subsidiaries;
|
| •
| enter into transactions with affiliates;
|
| •
| enter into sale/leaseback transactions;
|
| •
| change employment levels in early 2021, subject to certain stated limits;
|
| •
| compensate certain executives;
|
| •
| pay dividends or make any other capital distributions with respect to our Common Stock, as discussed under Risks Related to Our Common Stock;
|
| •
| purchase shares of our Common Stock in the public market;
|
| •
| merge, consolidate or sell substantially all of our assets; and
|
| •
| make certain investments and acquire certain assets.
|
The restrictions could adversely affect our ability to:
| • finance our operations; •make strategic acquisitions or investments or enter into alliances; •withstand a future downturn in our business or the economy in general; •attract and retain skilled key employees; •engage in business activities, including future opportunities, that may be in our interest; and •plan for or react to market conditions or otherwise execute our business strategies. •
| finance our operations;
|
| •
| make strategic acquisitions or investments or enter into alliances;
|
| •
| withstand a future downturn in our business or the economy in general;
|
| •
| attract and retain skilled key employees;
|
| •
| engage in business activities, including future opportunities, that may be in our interest; and
|
| •
| plan for or react to market conditions or otherwise execute our business strategies.
|
Our ability to obtain future financing or to sell assets could be adversely affected because substantially all of our assets have been pledged as collateral for the benefit of the holders of our indebtedness.
Risks Related to Our Common Stock
The price of our Common Stock may fluctuate significantly, and this may make it difficult to resell our Common Stock when holders want or at prices they find attractive.
The market price for our Common Stock has been highly volatile and subject to significant fluctuations. We expect the market price of our Common Stock to continue to be volatile and subject to these fluctuations in response to a wide variety of factors, including the following:
| • fluctuations in stock market prices and trading volumes of securities of similar companies; •general market conditions and overall fluctuations in U.S. equity markets; •large blocks of stockholders selling via automated trading systems; •variations in our operating results, or the operating results of our competitors; •changes in our financial guidance, if any, or securities analysts’ estimates of our financial performance; •sales of large blocks of our Common Stock, including sales by our executive officers, directors and significant stockholders; •additions or departures of any of our key personnel; •announcements related to litigation; •changing legal or regulatory developments in the United States and other countries; and •commentary about us or our stock price by the financial press and in online investor communities. •
| fluctuations in stock market prices and trading volumes of securities of similar companies;
|
| •
| general market conditions and overall fluctuations in U.S. equity markets;
|
| •
| large blocks of stockholders selling via automated trading systems;
|
| •
| variations in our operating results, or the operating results of our competitors;
|
| •
| changes in our financial guidance, if any, or securities analysts’ estimates of our financial performance;
|
| •
| sales of large blocks of our Common Stock, including sales by our executive officers, directors and significant stockholders;
|
| •
| additions or departures of any of our key personnel;
|
| •
| announcements related to litigation;
|
| •
| changing legal or regulatory developments in the United States and other countries; and
|
| •
| commentary about us or our stock price by the financial press and in online investor communities.
|
In addition, the stock markets from time to time experience price and volume fluctuations that may be unrelated or disproportionate to the operating performance of companies and that may be extreme. These fluctuations may adversely affect the trading price of our Common Stock, regardless of our actual operating performance.
Future issuances of our Common Stock or equity-related securities in the public market could adversely affect the trading price of our Common Stock and our ability to raise funds in new stock offerings.
In the future, we may issue additional shares of our Common Stock to raise capital or in connection with a restructuring or refinancing of our indebtedness. In addition, approximately 2.81.4 million shares of our Common Stock remain available and are reserved for issuance, exercise of outstanding stock options and vesting of outstanding share units. Under our 2019 Incentive and Equity Award Plan (the “2019 Plan”), we have registered under the Securities Act all of the shares of Common Stock that we
may issue upon the exercise of our outstanding options and the vesting of outstanding share units and on account of future awards made under the 2019 Plan. Our 2020 Employee Stock Purchase Plan has approximately 3.02.6 million shares of Common Stock reserved for eligible employee participants. All of these registered shares generally can be freely sold in the public market upon issuance. If a large number of these shares are sold in the public market, the sales could reduce the trading price of our Common Stock.
We cannot predict the size of future issuances or the effect, if any, that such issuances may have on the market price for our Common Stock. Sales of significant amounts of our Common Stock or equity-related securities in the public market, or the
16
perception that such sales may occur, could adversely affect prevailing trading prices of our Common Stock and could impair our ability to raise capital through future offerings of equity or equity-related securities. Further sales of shares of our Common Stock or the availability of shares of our Common Stock for future sale or in connection with hedging and arbitrage activity that may develop with respect to our Common Stock, could adversely affect the trading price of our Common Stock.
We are not permitted to pay dividends on our Common Stock in the foreseeable future.
We are not permitted to pay any dividends on shares of our Common Stock in the foreseeable future due to the documents governing our indebtedness. We intend to retain any future earnings to fund operations, invest in capital requirements, to service debt and other obligations, such as lease and pension funding requirements, and to use for other corporate needs. Further, we do not anticipate that we will pay any dividends on shares of our Common Stock in the foreseeable future.
We can issue shares of preferred stock that may adversely affect the rights of holders of our Common Stock.
Our certificate of incorporation currently authorizes the issuance of 7.5 million shares of preferred stock. Our Board of Directors is authorized to approve the issuance of one or more series of preferred stock without further authorization of our shareholders and to fix the number of shares, the designations, the relative rights and the limitations of any series of preferred stock. As a result, our Board, without shareholder approval, could authorize the issuance of preferred stock with voting, conversion and other rights that could proportionately reduce, minimize or otherwise adversely affect the voting power and other rights of holders of our Common Stock or other series of preferred stock or that could have the effect of delaying, deferring or preventing a change in our control.
Not applicable.
17
Item 2. Properties
At December 31, 2020,2022, we operated a total of 332308 transportation service facilities located across North America. Of this total, we own 176166 and we lease 156,142, generally with lease terms ranging from one month to ten years with right of renewal options. The number of customer freight servicing doors totaled approximately 20,100,19,100, of which approximately 11,30010,000 are at owned facilities and approximately 8,8009,100 are at leased facilities. The transportation service centers vary in size ranging from one to three doors at small local facilities to 426 doors at the largest consolidation and distribution facility. We also occupy general office buildings in several locations and six fully managed warehouse facilities primarily through leasing agreements. Our owned transportation service facilities and office buildings serve as collateral under our credit agreements.
We believe our facilities and equipment, subject to our expectations for capital spending, are adequate to meet current business requirements in 2021.2022. Refer to “Item 7. Management’s Discussion and Analysis of Financial Condition and Results of Operations” for a more detailed discussion of expectations regarding capital spending in 2021.spending.
Top 10 Service Facilities by Number of Doors at December 31, 20202022
| | | | | |
Location |
| Doors |
| Owned/Leased |
|
Chicago Heights, IL |
| 426 |
| Owned |
|
Winston-Salem, NC |
| 349 |
| Owned |
|
Bloomington, CA |
| 325 |
| Leased |
|
Maybrook, NY |
| 304 |
| Owned |
|
Harrisburg, PA |
| 281 |
| Owned |
|
Charlotte, NC |
| 274 |
| Leased |
|
Dallas, TXAtlanta, GA
|
| 261227
|
| OwnedLeased
|
|
Atlanta, GACincinnati, OH
|
| 227216
|
| LeasedOwned
|
|
Cincinnati, OHGreenville, SC
|
| 216214
|
| Owned |
|
Greenville, SCNashville, TN
|
| 214213
|
| Owned |
|
Item 3. Legal Proceedings
We discuss legal proceedings in the “Commitments, Contingencies and Uncertainties” footnote, Note 11, of our consolidated financial statements included in this Annual Report on Form 10-K as well as in “Environmental Matters” Section in Part I hereof.
Item 4. Mine Safety Disclosures
Not applicable.
18
Information about our Executive Officers
| | |
Name | Age | Position(s) Held |
|
|
|
Darren D. Hawkins | 5253
| Chief Executive Officer of the Company (since April 2018); President and Chief Operating Officer of the Company (January 2018-April 2018), President (February 2014-December 2017), Senior Vice President - Sales and Marketing (January 2013-February 2014) of YRC Freight; Director of Operations (December 2011-January 2013) and Director of Sales (January 2009-December 2011) for Con-Way Freight, a subsidiary of Con-Way, Inc.; various positions of increasing responsibility with Yellow Transportation, Inc. (1991-2009). |
|
|
|
Daniel L. Olivier
| 4850
| Interim Chief Financial Officer of the Company (since October 2020); Vice President of Financial Planning and Analysis of the Company (November 2019-October 2020); Vice President, Finance of Holland (2008-2020).
|
Jason Bergman | 5052
| Chief Commercial Officer of the Company (since July 2019); Chief Commercial Officer of Dicom Transportation Group (courier and expedited transportation services) (2017-2019); executive Vice President of Global Transport for BDP International (transportation logistics) (2014-2016); Vice President, Strategic Sales, North America for Damco (global logistics) (2013-2014).
|
Leah K. Dawson | 4143
| Executive Vice President, General Counsel and Secretary of the Company (since October 2020), Assistant General Counsel and Assistant Secretary of the Company (2012-2020); Attorney at the law firm of Bryan Cave Leighton Paisner LLP (2010-2012); Attorney at the law firm of Dentons LLP (2005-2010).
|
James R. FaughtDarrel J. Harris
| 4048
| President and Chief AccountingOperating Officer of the Company (since October 2020), ViceNovember 2021); President and Controller (February 2020-November 2020), Director of Financial Reporting of the Company (2017-2020)(April 2021-November 2021); Director of Financial Reporting of Safe Fleet (2014-2017), Accounting Director/Assistant Controller of Watco Companies LLC (2013-2014); Accounting Manager of Watco Companies LLC (2012-2013). |
Darrel J. Harris
| 46
| Executive Vice President, Strategic Initiatives of the Company (since November 2020)(November 2020-April 2021); Chief Executive Officer of Xpress Global Systems Inc. (2016-2020); Vice President and General Manager of CRST International (2014-2016); Senior Vice President, Sales and Marketing of Vitran Logistics (2012-2013); Managing Director, Positions of increasing responsibility of FedEx Freight Inc. (2000-2012). |
| | |
Thomas J. O’Connor
| 60
| Chief Operating Officer of the Company (since June 2019; President of YRC Freight (January 2018-October 2019); President of Reddaway (January 2007-December 2017; President of USF Bestway (subsidiary of the Company) (2005-2007); Vice President Western Division and officer (1999-2005), District Manager (1995-1999) and various management positions of increasing responsibility (1982-1995) of Roadway Express,with FedEx Freight, Inc., most recently Managing Director (2000-2012).
|
Jason T. RinggenbergAnnlea Rumfola
| 5553
| Chief Information Officer of the Company (since March 2017)January 2023); Sr.Cardinal Health, Inc. (health care solutions, logistics and supplies): Senior Vice President, CIO Medical Segment (April 2018–December 2022), Senior Vice President, Divisional CIO Pharmaceutical Segment (2015-2018), Vice President, IT Pharmaceutical Distribution and Chief Information Officer of YRC Freight (April 2014-March 2017);Pharma-Modernization Program (2013-2015), Vice President, IT Nuclear Pharmacy Services (2009-2013), various positions of increasing responsibility with Accenture, most recently Managing Director of North American Freight (June 1992-April 2014)(1991-2009). |
|
|
|
Scott D. Ware
| 60
| Chief Network Officer of the Company (since October 2019); President of Holland and Chief Network Officer of the Company (October 2018-October 2019); President (2012-2018), Vice President Operations and Linehaul (2009-2012) and Vice President Linehaul (2007-2009) of Holland; Director of Linehaul of SAIA Inc. (2002-2007); Director of Linehaul of JEVIC (2000-2002); various industry management roles with Preston, Overnite, Con-Way and Spartan Express (1985-2000).
|
|
|
|
|
|
|
|
| |
| |
|
19
PART II
Item 5. Market for Registrant’s Common Equity, Related Stockholder Matters and Issuer Purchases of Equity Securities
As of February 5, 2021, 3026, 2023, 141 stockholders of record held Yellow Corporation common stock. The NASDAQ Global Select Market quotes prices for our common stock under the symbol “YELL”, after a recent change from the symbol “YRCW.”
. We do not anticipate that we will pay any dividends on shares of our common stock in the foreseeable future. Further, our TL Agreements (as defined in Item 7 below) in place as of December 31, 2020,2022, restrict the ability of the Company to declare dividends on its outstanding capital stock.stock or execute stock share buybacks.
Quarterly Financial Information (unaudited)
| | 2020 | |
(in millions, except per share and share data) | | First Quarter | | | Second Quarter | | | Third Quarter | | | Fourth Quarter | |
Operating revenue | | $ | 1,150.4 | | | $ | 1,015.4 | | | $ | 1,183.4 | | | $ | 1,164.5 | |
Gains on property disposals, net | | | (39.3 | ) | | | (6.0 | ) | | | — | | | | — | |
Operating income (loss) | | | 28.0 | | | | (4.6 | ) | | | 19.4 | | | | 13.7 | |
Net income (loss) | | | 4.3 | | | | (37.1 | ) | | | (2.0 | ) | | | (18.7 | ) |
Diluted income (loss) per share(a) | | | 0.12 | | | | (1.09 | ) | | | (0.04 | ) | | | (0.37 | ) |
| | 2019 | |
(in millions, except per share and share data) | | First Quarter | | | Second Quarter | | | Third Quarter | | | Fourth Quarter | |
Operating revenue | | $ | 1,182.3 | | | $ | 1,272.6 | | | $ | 1,256.8 | | | $ | 1,159.5 | |
(Gains) losses on property disposals, net | | | 1.6 | | | | (6.2 | ) | | | 1.0 | | | | (10.1 | ) |
Operating income (loss) | | | (31.7 | ) | | | 14.3 | | | | 23.8 | | | | 9.8 | |
Net income (loss) | | | (49.1 | ) | | | (23.6 | ) | | | (16.0 | ) | | | (15.3 | ) |
Diluted income (loss) per share(a) | | | (1.48 | ) | | | (0.71 | ) | | | (0.48 | ) | | | (0.46 | ) |
| (a)
| Diluted income (loss) per share amounts were computed independently for each of the quarters presented. The sum of the quarters may differ from the total annual amount primarily due to change in the number of outstanding shares in the year and the impact of the if-converted method used to calculate earnings per share.
|
Common Stock Performance
Set forth below is a line graph comparing the quarterly percentage change in the cumulative total stockholder return of the Company’s common stock against the cumulative total return of the S&P Composite-500 Stock Index and the Dow Jones Transportation Average Stock Index for the period of five years commencing December 31, 20152017 and ending December 31, 2020.2022.
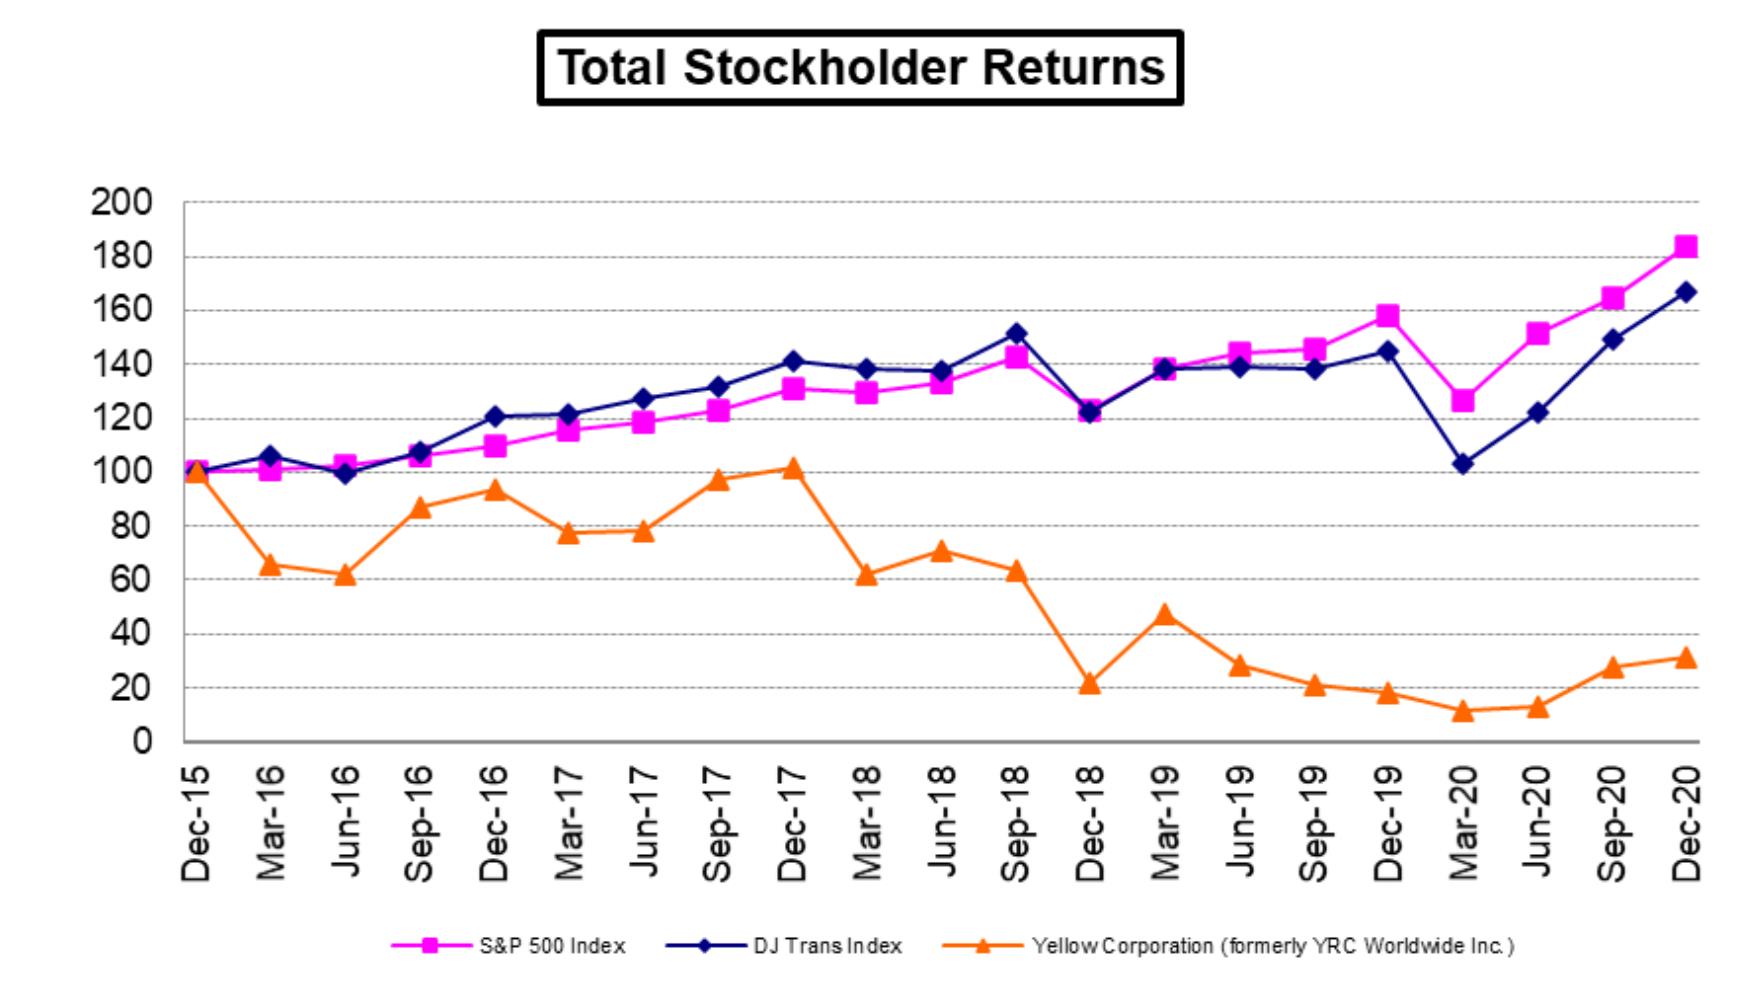
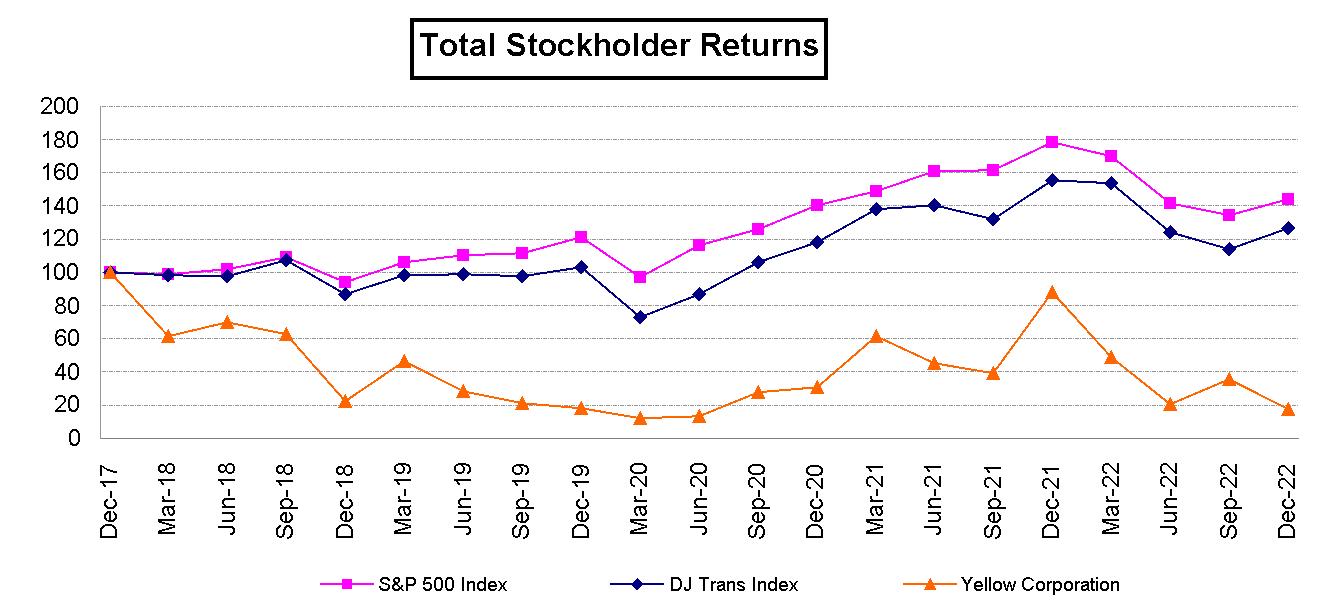
Item 6. Selected Financial Data
Our selected financial data below should be read in conjunction with “Management’s Discussion and Analysis of Financial Condition and Results of Operations” and “Financial Statements and Supplementary Data” included in this Form 10-K.[Reserved]
(dollars in millions, except per share data. shares in thousands) | | 2020 | | | 2019 | | | 2018 | | | 2017 | | | 2016 | |
For the Year | | | | | | | | | | | | | | | | | | | | |
Operating revenue | | $ | 4,513.7 | | | $ | 4,871.2 | | | $ | 5,092.0 | | | $ | 4,891.0 | | | $ | 4,697.5 | |
Operating income | | | 56.5 | | | | 16.2 | | | | 142.9 | | | | 119.0 | | | | 144.5 | |
Net income (loss) | | | (53.5 | ) | | | (104.0 | ) | | | 20.2 | | | | (10.8 | ) | | | 21.5 | |
Acquisition of property and equipment | | | (140.6 | ) | | | (143.2 | ) | | | (145.4 | ) | | | (103.3 | ) | | | (100.6 | ) |
Proceeds from disposal of property and equipment | | | 56.1 | | | | 25.9 | | | | 36.4 | | | | 8.8 | | | | 35.1 | |
Net cash provided by operating activities | | | 122.5 | | | | 21.5 | | | | 224.8 | | | | 60.7 | | | | 103.8 | |
Net cash used in investing activities | | | (84.5 | ) | | | (117.3 | ) | | | (109.0 | ) | | | (94.5 | ) | | | (50.9 | ) |
Net cash provided by (used in) financing activities | | | 330.8 | | | | (22.6 | ) | | | (33.9 | ) | | | (96.2 | ) | | | (73.2 | ) |
At Year-End | | | | | | | | | | | | | | | | | | | | |
Total assets | | $ | 2,185.8 | | | $ | 1,831.6 | | | $ | 1,617.1 | | | $ | 1,585.5 | | | $ | 1,770.0 | |
Total debt | | | 1,225.4 | | | | 862.2 | | | | 874.9 | | | | 906.1 | | | | 997.1 | |
Total shareholders’ deficit | | | (223.3 | ) | | | (441.2 | ) | | | (305.5 | ) | | | (353.5 | ) | | | (416.2 | ) |
Per Share Measurements | | | | | | | | | | | | | | | | | | | | |
Basic per share data: | | | | | | | | | | | | | | | | | | | | |
Net income (loss) | | $ | (1.28 | ) | | $ | (3.13 | ) | | $ | 0.61 | | | $ | (0.33 | ) | | $ | 0.66 | |
Average common shares outstanding | | | 41,694 | | | | 33,252 | | | | 32,983 | | | | 32,685 | | | | 32,416 | |
Diluted per share data: | | | | | | | | | | | | | | | | | | | | |
Net income (loss) | | $ | (1.28 | ) | | $ | (3.13 | ) | | $ | 0.60 | | | $ | (0.33 | ) | | $ | 0.65 | |
Average common shares outstanding | | | 41,694 | | | | 33,252 | | | | 33,859 | | | | 32,685 | | | | 33,040 | |
Other Data | | | | | | | | | | | | | | | | | | | | |
Number of employees (a) | | | 30,000 | | | | 29,000 | | | | 31,000 | | | | 32,000 | | | | 32,000 | |
Operating ratio (b) | | | 98.7 | % | | | 99.7 | % | | | 97.2 | % | | | 97.6 | % | | | 96.9 | % |
20
(a)
| Rounded to the nearest thousand.
|
(b)
| Operating ratio is calculated as (i) 100 percent (ii) minus the result of dividing operating income by operating revenue or (iii) plus the result of dividing operating loss by operating revenue and expressed as a percentage.
|
Item 7. Management’s Discussion and Analysis of Financial Condition and Results of Operations
This Item 7, “Management’s Discussion and Analysis of Financial Condition and Results of Operations,” “MD&A”, contains forward-looking statements within the meaning of Section 27A of the Securities Act and Section 21E of the Exchange Act. See the introductory section immediately prior to “Part I” and Risk Factors in “Item 1A” of this report regarding these statements.
Overview
This MD&A includes the following sections:
Our Business: a brief description of our business and a discussion of how we assess our operating results
Consolidated Results of Operations: an analysis of our consolidated results of operations for the years ended December 31, 2020, 20192022, 2021 and 20182020
Certain Non-GAAP Financial Measures: an analysis of our results using certain non-GAAP financial measures, for the years ended December 31, 2020, 20192022, 2021 and 20182020
Financial Condition, Liquidity and Capital Resources: a discussion of our major sources and uses of cash as well as an analysis of our cash flows and aggregatecertain contractual obligations and commercial commitments
Our Business
Yellow Corporation is a holding company that, through its operating subsidiaries, offers our customers a wide range of transportation services. The Company has one of the largest, most comprehensive LTL networks in North America with local, regional, national and international capabilities. Through its team of experienced service professionals, the Company offers industry-leading expertise in LTL shipments and flexible supply chain solutions, ensuring customers can ship industrial, commercial and retail goods with confidence.
We measure the performance of our business using several metrics, but rely primarily upon (without limitation) operating revenue, operating income (loss), and operating ratio. We also use certain non-GAAP financial measures as secondary measures to assess our operating performance.
| • Operating Revenue: Our operating revenue has two primary components: volume (commonly evaluated using tonnage, tonnage per day, number of shipments, shipments per day or weight per shipment) and yield or price (commonly evaluated using picked up revenue, revenue per hundredweight or revenue per shipment). Yield includes fuel surcharge revenue, which is common in the trucking industry and represents an amount charged to customers that adjusts with changing fuel prices. We base our fuel surcharges on the U.S. Department of Energy fuel index and adjust them weekly. Rapid material changes in the index or our cost of fuel can positively or negatively impact our revenue and operating income as a result of changes in our fuel surcharge. We believe that fuel surcharge is an accepted and important component of the overall pricing of our services to our customers. Without an industry-accepted fuel surcharge program, our base pricing for our transportation services would require changes. We believe the distinction between base rates and fuel surcharge has diminished over time, and it is impractical to clearly separate all the different factors that influence the price that our customers are willing to pay. In general, under our present fuel surcharge program, we believe rising fuel costs are beneficial to us and falling fuel costs are detrimental to us in the short term, the effects of which are mitigated over time. •Operating Income (Loss): Operating income (loss) is operating revenue less operating expenses. •Operating Ratio: Operating ratio is a common operating performance measure used in the trucking industry. It is calculated as (i) 100 percent (ii) minus the result of dividing operating income by operating revenue or (iii) plus the result of dividing operating loss by operating revenue, and is expressed as a percentage. •Non-GAAP Financial Measures: We use EBITDA and Adjusted EBITDA, which are non-GAAP financial measures, to assess the following: oEBITDA: a non-GAAP measure that reflects our earnings before interest, taxes, depreciation, and amortization expense. EBITDA is used for internal management purposes as a financial measure that reflects our core operating performance. 21
oAdjusted EBITDA: a non-GAAP measure that reflects EBITDA, and further adjusts for letter of credit fees, equity-based compensation expense, net gains or losses on property disposals, restructuring charges, transaction costs related to issuances of debt, non-recurring consulting fees, non-cash impairment charges and the gains or losses from permitted dispositions, discontinued operations, and certain non-cash expenses, charges and losses (provided that if any of such non-cash expenses, charges or losses represents an accrual or reserve for potential cash items in any future period, the cash payment in respect thereof in such future period will be subtracted from Adjusted EBITDA in such future period to the extent paid). All references to “Adjusted EBITDA” throughout this section and the rest of this report refer to “Adjusted EBITDA” calculated under our UST Credit Agreements and the Term Loan Agreement, as amended, (collectively, the TL Agreements) (defined therein as “Consolidated EBITDA”) unless otherwise specified. Consolidated EBITDA is also a defined term in our ABL Facility and the definition there aligns with the prior definition of Consolidated EBITDA under the Prior Term Loan Agreement (defined in the Notes to Consolidated Financial Statements). Adjusted EBITDA is used for internal management purposes as a financial measure that reflects our core operating performance, to measure compliance with financial covenants in our TL Agreements and to determine certain management and employee bonus compensation. •
| Operating Revenue: Our operating revenue has two primary components: volume (commonly evaluated using tonnage, tonnage per day, number of shipments, shipments per day or weight per shipment) and yield or price (commonly evaluated using picked up revenue, revenue per hundredweight or revenue per shipment). Yield includes fuel surcharge revenue, which is common in the trucking industry and represents an amount charged to customers that adjusts with changing fuel prices. We base our fuel surcharges on the U.S. Department of Energy fuel index and adjust them weekly. Rapid material changes in the index or our cost of fuel can positively or negatively impact our revenue and operating income as a result of changes in our fuel surcharge. We believe that fuel surcharge is an accepted and important component of the overall pricing of our services to our customers. Without an industry accepted fuel surcharge program, our base pricing for our transportation services would require changes. We believe the distinction between base rates and fuel surcharge has blurred over time, and it is impractical to clearly separate all the different factors that influence the price that our customers are willing to pay. In general, under our present fuel surcharge program, we believe rising fuel costs are beneficial to us and falling fuel costs are detrimental to us in the short term, the effects of which are mitigated over time.
|
| •
| Operating Income (Loss): Operating income (loss) is operating revenue less operating expenses.
|
| •
| Operating Ratio: Operating ratio is a common operating performance measure used in the trucking industry. It is calculated as (i) 100 percent (ii) minus the result of dividing operating income by operating revenue or (iii) plus the result of dividing operating loss by operating revenue, and is expressed as a percentage.
|
| •
| Non-GAAP Financial Measures: We use EBITDA and Adjusted EBITDA, which are non-GAAP financial measures, to assess the following:
|
| o
| EBITDA: a non-GAAP measure that reflects our earnings before interest, taxes, depreciation, and amortization expense. EBITDA is used for internal management purposes as a financial measure that reflects our core operating performance.
|
| o
| Adjusted EBITDA: a non-GAAP measure that reflects EBITDA, and further adjusts for letter of credit fees, equity-based compensation expense, net gains or losses on property disposals, restructuring charges, transaction costs related to issuances of debt, non-recurring consulting fees, non-cash impairment charges and the gains or losses from permitted dispositions, discontinued operations, and certain non-cash expenses, charges and losses (provided that if any of such non-cash expenses, charges or losses represents an accrual or reserve for potential cash items in any future period, the cash payment in respect thereof in such future period will be subtracted from Adjusted EBITDA in such future period to the extent paid). All references to “Adjusted EBITDA” throughout this section and the rest of this report refer to “Adjusted EBITDA” calculated under our UST Credit Agreements and the Term Loan Agreement, as amended, (collectively, the TL Agreements) (defined therein as “Consolidated EBITDA”) unless otherwise specified. Consolidated EBITDA is also a defined term in our ABL Facility and the definition there aligns with the prior definition of Consolidated EBITDA under the Prior Term Loan Agreement. Adjusted EBITDA is used for internal management purposes as a financial measure that reflects our core operating performance, to measure compliance with financial covenants in our TL Agreements and to determine certain management and employee bonus compensation.
|
We believe our presentation of EBITDA and Adjusted EBITDA is useful to investors and other users as these measures represent key supplemental information our management uses to compare and evaluate our core underlying business results, particularly in light of our leverage position and the capital-intensive nature of our business. Further, EBITDA is a measure that is commonly used by other companies in our industry and provides a comparison for investors to evaluate the performance of the companies in the industry. Additionally, Adjusted EBITDA helps investors to understand how the company is tracking against our financial covenants in our TL Agreements as this measure is calculated as defined in our TL Agreements and serves as a driving component of our key financial covenants.
Our non-GAAP financial measures have the following limitations:
| o EBITDA does not reflect the interest expense or the cash requirements necessary to service interest or fund principal payments on our outstanding debt; oAdjusted EBITDA does not reflect the interest expense or the cash requirements necessary to service interest or fund principal payments on our outstanding debt, letter of credit fees, restructuring charges, transaction costs related to the issuance of debt, non-cash expenses, charges or losses, or nonrecurring consulting fees, among other items; oAlthough depreciation and amortization are non-cash charges, the assets being depreciated and amortized will generally need to be replaced in the future and EBITDA and Adjusted EBITDA do not reflect any cash requirements for such replacements; oEquity-based compensation is an element of our long-term incentive compensation package, although Adjusted EBITDA excludes employee equity-based compensation expense when presenting our ongoing operating performance for a particular period; and oOther companies in our industry may calculate Adjusted EBITDA differently than we do, potentially limiting its usefulness as a comparative measure. o
| EBITDA does not reflect the interest expense or the cash requirements necessary to service interest or fund principal payments on our outstanding debt;
|
| o
| Adjusted EBITDA does not reflect the interest expense or the cash requirements necessary to service interest or fund principal payments on our outstanding debt, letter of credit fees, restructuring charges, transaction costs related to the issuance of debt, non-cash expenses, charges or losses, or nonrecurring consulting fees, among other items;
|
| o
| Although depreciation and amortization are non-cash charges, the assets being depreciated and amortized will generally need to be replaced in the future and EBITDA and Adjusted EBITDA do not reflect any cash requirements for such replacements;
|
| o
| Equity-based compensation is an element of our long-term incentive compensation package, although Adjusted EBITDA excludes employee equity-based compensation expense when presenting our ongoing operating performance for a particular period; and
|
| o
| Other companies in our industry may calculate Adjusted EBITDA differently than we do, potentially limiting its usefulness as a comparative measure.
|
Because of these limitations, our non-GAAP measures should not be considered a substitute for performance measures calculated in accordance with GAAP. We compensate for these limitations by relying primarily on our GAAP results and use our non-GAAP measures as secondary measures.
Business Strategy Overview
Our strategy isremains focused on providing exemplary super-regional service as we near completion of our multi-year enterprise transformation to optimize and structurally improve our network that includes more than 300 strategically located terminals throughout North America. The transformation is expected to increase asset utilization, expand service offerings,enhance network efficiencies, create cost savings and leverage operational flexibilities gained with our 2019 labor agreement, consolidate disparate company systems onto a single platform and rationalize the more than 300 physical locations in the network while maintaining geographic coverage. The result will be to operate Yellow as one Yellow company, one Yellow network, under one Yellow brandbrand.
We completed our LTL companies’ migration to a common technology platform in early 2022, and our focus transitioned to the integration of our four disparate linehaul networks into a single national network. The combination of our four individual linehaul networks currently tied to our legacy national and regional carrier brands will result in greater density as freight moves throughout our network from origin to destination terminals. Also, the local terminal pickup and delivery optimization efforts will eliminate
22
the overlapping coverage and customer interactions that provides great super-regional service.currently exist between our legacy national and regional carrier brands. When completed, this operational transformation will result in enhanced customer service, cost savings opportunities from reduced miles and productivity gains, and will create additional capacity without adding incremental physical infrastructure. In September, we successfully implemented phase one of the network optimization in the western U.S. Phase one included integrating 89 legacy YRC Freight and Reddaway terminals, and the results are meeting our expectations as customers are benefitting by having one driver pick-up and deliver both regional and long-haul shipments. We remain focused on applying lessons learned from phase one and completing the network optimization in 2023.
Capital investment remains a top priority for us. Our UST Credit Agreements haveus and will continue to enable us to significantly increase the amount of capital we are able to invest in revenue equipment to improve the age of our fleet as there is an immediate return in improved fuel miles per gallon and reduced vehicle maintenance expense. To properly execute on our transformation plan, we areremain committed to investing in our fleet, and in technology in order tosolutions that enhance the customerour customers’ experience and improve our operational flexibilities. We expect to spend somewhere between $450 millionflexibility and $550 million on capital investments during 2021.efficiencies.
Consolidated Results of Operations
Presented below are consolidated results. In preparing this analysis, the Company determined that the Chief Operating Decision Maker (“CODM”) is the Chief Executive Officer who manages the business, regularly reviews financial information and allocates resources. The Company began operating under one segment in 2020. The consolidated results are consistent with historical consolidated reporting and have not been recast.
20202022 Compared to 20192021
The table below provides summary consolidated financial information and amounts as a percentage of operating revenue for the years ended December 31:
| | | | | | | | | | | | | | | Percent Change | | | | | | | | | | | | | Percent Change | |
| | 2020 | | | 2019 | | | 2020 vs. 2019 | | | 2022 | | | 2021 | | | 2022 vs. 2021 | |
(in millions) | | $ | | % | | | $ | | % | | | % | | | $ | | % | | | $ | | % | | | % | |
Operating Revenue | | $ | 4,513.7 | | 100.0 | | | $ | 4,871.2 | | 100.0 | | | | (7.3 | )% | | $ | 5,244.7 | | 100.0 | | | $ | 5,121.8 | | 100.0 | | | | 2.4 | % |
Operating Expenses: | | | | | | | | | | | | | | | | | | | | | | | | | | | |
Salaries, wages and employee benefits | | | 2,770.1 | | 61.4 | | | | 2,963.7 | | 60.8 | | | | (6.5 | )% | | | 2,808.3 | | 53.5 | | | | 2,921.7 | | 57.0 | | | | (3.9 | )% |
Fuel, operating expenses and supplies | | | 719.1 | | 15.9 | | | | 889.0 | | 18.3 | | | | (19.1 | )% | | | 1,076.6 | | 20.5 | | | | 858.1 | | 16.8 | | | | 25.5 | % |
Purchased transportation | | | 638.8 | | 14.2 | | | | 614.2 | | 12.6 | | | | 4.0 | % | | | 748.5 | | 14.3 | | | | 800.2 | | 15.6 | | | | (6.5 | )% |
Depreciation and amortization | | | 134.9 | | 3.0 | | | | 152.4 | | 3.1 | | | | (11.5 | )% | | | 143.4 | | 2.7 | | | | 143.6 | | 2.8 | | | | (0.1 | )% |
Other operating expenses | | | 239.6 | | 5.3 | | | | 241.2 | | 5.0 | | | | (0.7 | )% | | | 308.1 | | 5.9 | | | | 293.9 | | 5.7 | | | | 4.8 | % |
Gains on property disposals, net | | | (45.3 | ) | | (1.0 | ) | | | (13.7 | ) | | (0.3 | ) | | NM* | | |
Impairment charges | | | — | | | — | | | | 8.2 | | | 0.2 | | | NM* | | |
(Gains) Losses on property disposals, net | | | | (38.0 | ) | | (0.7 | ) | | | 0.7 | | | 0.0 | | | NM* | |
Total operating expenses | | | 4,457.2 | | | 98.7 | | | | 4,855.0 | | | 99.7 | | | | (8.2 | )% | | | 5,046.9 | | | 96.2 | | | | 5,018.2 | | | 98.0 | | | | 0.6 | % |
Operating Income | | | 56.5 | | | 1.3 | | | | 16.2 | | | 0.3 | | | NM* | | | | 197.8 | | | 3.8 | | | | 103.6 | | | 2.0 | | | | 90.9 | % |
Nonoperating Expenses: | | | | | | | | | | | | | | | | | | | | | | | | | | | | | |
Nonoperating expenses, net | | | 129.6 | | | 2.9 | | | | 124.5 | | | 2.6 | | | | 4.1 | % | | | 171.3 | | | 3.3 | | | | 209.6 | | | 4.1 | | | | (18.3 | )% |
Income (loss) before income taxes | | | (73.1 | ) | | (1.6 | ) | | | (108.3 | ) | | (2.2 | ) | | | (32.5 | )% | |
Income tax expense (benefit) | | | (19.6 | ) | | (0.4 | ) | | | (4.3 | ) | | (0.1 | ) | | NM* | | |
Net income (loss) | | $ | (53.5 | ) | | (1.2 | ) | | $ | (104.0 | ) | | (2.1 | ) | | | (48.6 | )% | |
Income (Loss) before income taxes | | | | 26.5 | | 0.5 | | | | (106.0 | ) | | (2.1 | ) | | NM* | |
Income tax expense | | | | 4.7 | | | 0.1 | | | | 3.1 | | | 0.1 | | | | 51.6 | % |
Net Income (Loss) | | | $ | 21.8 | | | 0.4 | | | $ | (109.1 | ) | | (2.1 | ) | | NM* | |
(*) not meaningful
Results
The industry was in a tight capacity environment through the majority of operations during 2020 were impacted by2022 with fewer drivers available to meet shipping demands, which has led to price increases charged to customers and an increase in the outbreakcost of COVID-19 as shipping volumespurchased transportation. During 2022, the Company executed a yield strategy to achieve appropriate pricing per shipment for freight that optimized our network capacity. The execution of this strategy led to increased revenue per shipment and decreased from typical levels mainly during the second quarter, especially in certain markets that have seen greater case levels of COVID-19. Downward pressure on dieselshipment counts. The Company’s yield growth, including fuel prices reduced the amount of fuel surcharge revenues, which are typically priced into our services. Partially offsetting these decreases, during the second half of 2020 reduced shipping capacity relative to overall shipment demand createdsurcharges, produced a favorable pricing environment across the industry. As such, our consolidated operating revenue decreased $357.5increase of $122.9 million during 2020 when compared to 2019.
Due2021, with an internal focus of retaining the optimal freight mix relative to human capital availability throughout 2022. Partially offsetting the trends in shipping volumes and shortages for certain labor resources,positive yield growth, the Company maintained a lower headcount than historical levels to match shipmentexperienced shipping volume trends during the year. Lower headcount levels were also impacted by an imbalance in the available pool of qualified drivers versus overall shipment demand, which is an industry trend. In addition, the Company’s 2020 results reflect decreases from 2019 in variable expenses, including fuel and maintenance, among others. Offsetting these variable expense decreases the Company paid higher contractual wage and benefit rates for union employees. Total operating expenses decreased $397.8 million, for the year ended December 31, 2020 compared to 2019,2021. Additionally, material changes in our expenses year over year are discussed below.
Salaries, wages and employee benefits. Salaries, wages and employee benefits decreased $113.4 million primarily due to a $70.9 million decrease in employee wages and related benefits as a result of fewer hours and a reduction in headcount, corresponding with shipping volume decreases. Additionally, short-term incentive compensation expense decreased $32.5 million based on operating results versus the plan’s target. Workers’ compensation expense decreased $30.9 million compared to 2021 primarily due to favorable development on prior year claims, resulting from fewer claims as well as reduced ultimate settlement amounts. These decreases in variable expenses. Further material changes are provided below.were partially offset by contractual wage rate increases for union employees.
Fuel, operating expenses and supplies. Fuel, operating expenses and supplies decreased $169.9increased $218.5 million, primarily due to a $100.3$134.7 million decreaseincrease in fuel expense, which was a result of lowerresulting from higher fuel prices andpartially offset by fewer miles driven. Additional decreases resulted from cost reduction efforts,Uncollectible receivables increased $33.6 million over 2021, and we incurred additional expenses in order to execute phase one of our network transformation including a $21.0$17.7 million reductionincrease in professional services,facility maintenance, a $17.3$16.2 million decrease in other operating expenses,increase for travel and a $16.4 million decreaseentertainment in other employee expenses and an $11.0a $7.3 million decreaseincrease in vehicle maintenance.professional services.
23
Purchased transportation. Purchased transportation decreased $51.7 million primarily due to targeted efforts by the Company to mitigate certain impacts from significant rate increases and other factors noted above. While the cost of purchased transportation has increased, $24.6overall utilization by the Company has declined leading to an overall decrease. Utilization has decreased in over-the-road transportation, $55.7 million, as well as vehicle rentals, $46.7 million. These decreases were partially offset by an increase of $30.8 million in third-party costs due to the growth in customer-specific logistics solutions and an increase of $23.0 million in rail purchased transportation expense.
Other operating expenses. Other operating expenses increased $14.2 million primarily due to a $19.9$9.8 million increase in over-the-road purchased transportation due to increased rates which have been impacted by driver shortages,cargo claims expense and a $16.9$5.3 million increasesettlement charge in third-party costs due to growth in customer-specific logistics solutions partially offset by a $6.0 million decrease from reduced usageassociation with the Department of local purchased transportation and a $6.4 million decrease in long-term vehicle rentals.Defense claim.
Gains on property disposals, net. Net gains on disposals of property were $45.3$38.0 million during 20202022 as compared to $13.7net losses of $0.7 million in 2019. The gains in 2020 and 20192021 which were primarily related to the sale of real properties.properties, including a $28.1 million gain from the sale of one excess property during 2022.
Impairment charges. During 2019, we recorded an $8.2 million impairment charge in the first quarter that reflected the write-down of an intangible asset as a result of rebranding strategies, leading to discontinued use of that tradename.
Nonoperating expense, net. IncludedNonoperating expenses, net decreased $38.3 million, primarily related to non-union pension settlement charges of $64.7 million in the overall increase2021, primarily driven by a partial pension annuitization during December 2021 compared to non-union pension charges of approximately 4.1%$12.1 million in 2022. This is offset by an increase in interest expenses that is partially offset by the reduction related to a 2019 debt extinguishment. Interest expense increased $24.7of $12.1 million, primarily due to a $11.7 million increase inhigher interest and associated amortization related to the UST Loans entered into during July 2020 and a $10.3 million increase in Term Loan interest due to higher rates and amortization. In 2019, the Company incurred $11.2 million of nonoperating expense related to the extinguishment of debt with no such charge in 2020.rates.
Income tax. The Company’s effective tax rate for the years ended December 31, 20202022 and 20192021 was 26.8%17.7% and 4.0%(2.9)%, respectively. Significant items impacting the 2020The Company’s 2022 effective tax rate include a benefit recognized due to application of the exception to the rules regarding intraperiod tax allocation,a benefitdiffered from the reversaldomestic federal statutory rate as a result of liabilityitems permanently nondeductible for an uncertainfederal income tax position resulting from statute expiration,purposes, changes in applicable state tax rates, differences between foreign and aUnited States tax rates and the change in the valuation allowance established for the net deferred tax asset balance at December 31, 2020.allowance. As of December 31, 20202022 and 2019,2021, the Company had a full valuation allowance against our domestic net deferred tax assets.
24
The table below summarizes the key revenue metrics for the years ended December 31:
| | | | | | | | | | | | |
| | 2022 | | | 2021 | | | Percent Change(a) | |
Workdays | | | 252.5 | | | | 252.0 | | | | |
| | | | | | | | | |
Operating Ratio | | | 96.2 | | | | 98.0 | | | 1.8pp | |
| | | | | | | | | |
LTL picked up revenue (in millions) | | $ | 4,711.9 | | | $ | 4,615.2 | | | | 2.1 | % |
LTL tonnage (in thousands) | | | 7,691 | | | | 9,520 | | | | (19.2 | )% |
LTL tonnage per workday (in thousands) | | | 30.46 | | | | 37.78 | | | | (19.4 | )% |
LTL shipments (in thousands) | | | 13,853 | | | | 16,707 | | | | (17.1 | )% |
LTL shipments per workday (in thousands) | | | 54.86 | | | | 66.30 | | | | (17.2 | )% |
LTL picked up revenue per hundred weight | | $ | 30.63 | | | $ | 24.24 | | | | 26.4 | % |
LTL picked up revenue per hundred weight (excluding fuel surcharge) | | $ | 24.39 | | | $ | 21.12 | | | | 15.5 | % |
LTL picked up revenue per shipment | | $ | 340 | | | $ | 276 | | | | 23.1 | % |
LTL picked up revenue per shipment (excluding fuel surcharge) | | $ | 271 | | | $ | 241 | | | | 12.5 | % |
LTL weight per shipment (in pounds) | | | 1,110 | | | | 1,140 | | | | (2.6 | )% |
| | | | | | | | | |
Total picked up revenue (in millions)(b) | | $ | 5,153.0 | | | $ | 5,077.7 | | | | 1.5 | % |
Total tonnage (in thousands) | | | 9,826 | | | | 12,427 | | | | (20.9 | )% |
Total tonnage per workday (in thousands) | | | 38.92 | | | | 49.31 | | | | (21.1 | )% |
Total shipments (in thousands) | | | 14,213 | | | | 17,178 | | | | (17.3 | )% |
Total shipments per workday (in thousands) | | | 56.29 | | | | 68.17 | | | | (17.4 | )% |
Total picked up revenue per hundred weight | | $ | 26.22 | | | $ | 20.43 | | | | 28.3 | % |
Total picked up revenue per hundred weight (excluding fuel surcharge) | | $ | 21.08 | | | $ | 17.88 | | | | 17.9 | % |
Total picked up revenue per shipment | | $ | 363 | | | $ | 296 | | | | 22.7 | % |
Total picked up revenue per shipment (excluding fuel surcharge) | | $ | 291 | | | $ | 259 | | | | 12.7 | % |
Total weight per shipment (in pounds) | | | 1,383 | | | | 1,447 | | | | (4.4 | )% |
| | 2020 | | | 2019 | | | Percent Change(a) |
Workdays | | | 253.0 | | | | 251.5 | | | | | |
| | | | | | | | | | | | |
Operating Ratio | | | 98.7 | | | | 99.7 | | | 1.0pp | |
LTL picked up revenue (in millions) | | $ | 4,100.1 | | | $ | 4,457.2 | | | | (8.0 | )% |
LTL tonnage (in thousands) | | | 9,845 | | | | 10,314 | | | | (4.5 | )% |
LTL tonnage per workday (in thousands) | | | 38.91 | | | | 41.01 | | | | (5.1 | )% |
LTL shipments (in thousands) | | | 16,982 | | | | 18,246 | | | | (6.9 | )% |
LTL shipments per workday (in thousands) | | | 67.12 | | | | 72.55 | | | | (7.5 | )% |
LTL picked up revenue per hundred weight | | $ | 20.82 | | | $ | 21.61 | | | | (3.6 | )% |
LTL picked up revenue per hundred weight (excluding fuel surcharge) | | $ | 18.78 | | | $ | 19.05 | | | | (1.4 | )% |
LTL picked up revenue per shipment | | $ | 241 | | | $ | 244 | | | | (1.2 | )% |
LTL picked up revenue per shipment (excluding fuel surcharge) | | $ | 218 | | | $ | 215 | | | | 1.1 | % |
LTL weight per shipment (in pounds) | | | 1,159 | | | | 1,131 | | | | 2.6 | % |
| | | | | | | | | | | | |
Total picked up revenue (in millions)(b) | | $ | 4,487.7 | | | $ | 4,831.3 | | | | (7.1 | )% |
Total tonnage (in thousands) | | | 12,589 | | | | 12,946 | | | | (2.8 | )% |
Total tonnage per workday (in thousands) | | | 49.76 | | | | 51.47 | | | | (3.3 | )% |
Total shipments (in thousands) | | | 17,446 | | | | 18,653 | | | | (6.5 | )% |
Total shipments per workday (in thousands) | | | 68.96 | | | | 74.17 | | | | (7.0 | )% |
Total picked up revenue per hundred weight | | $ | 17.82 | | | $ | 18.66 | | | | (4.5 | )% |
Total picked up revenue per hundred weight (excluding fuel surcharge) | | $ | 16.13 | | | $ | 16.50 | | | | (2.3 | )% |
Total picked up revenue per shipment | | $ | 257 | | | $ | 259 | | | | (0.7 | )% |
Total picked up revenue per shipment (excluding fuel surcharge) | | $ | 233 | | | $ | 229 | | | | 1.6 | % |
Total weight per shipment (in pounds) | | | 1,443 | | | | 1,388 | | | | 4.0 | % |
Percent change based on unrounded figures and not the rounded figures presented.
(b)Does not equal financial statement revenue due to revenue recognition adjustments between accounting periods and the impact of other revenue.
(a) | | | | | | | | | (in millions) | | 2022 | | | 2021 | | (b) Reconciliation of operating revenue to total picked up revenue: | | | | | | | Operating revenue | | $ | 5,244.7 | | | $ | 5,121.8 | | Change in revenue deferral and other | | | (91.7 | ) | | | (44.1 | ) | Total picked up revenue | | $ | 5,153.0 | | | $ | 5,077.7 | |
| Percent change based on unrounded figures and not the rounded figures presented.
|
(b)
| Does not equal financial statement revenue due to revenue recognition adjustments between accounting periods and the impact of other revenue.
|
25
(in millions) | | 2020 | | | 2019 | |
(b) Reconciliation of operating revenue to total picked up revenue: | | | | | | | | |
Operating revenue | | $ | 4,513.7 | | | $ | 4,871.2 | |
Change in revenue deferral and other | | | (26.0 | ) | | | (39.9 | ) |
Total picked up revenue | | $ | 4,487.7 | | | $ | 4,831.3 | |
2019
2021 Compared to 20182020
The table below provides summary consolidated financial information and amounts as a percentage of operating revenue for the years ended December 31:
| | | | | | | | | | | | | | | Percent Change | | | | | | | | | | | | | Percent Change | |
| | 2019 | | | 2018 | | | 2019 vs. 2018 | | | 2021 | | | 2020 | | | 2021 vs. 2020 | |
(in millions) | | $ | | % | | | $ | | % | | | % | | | $ | | % | | | $ | | % | | | % | |
Operating Revenue | | $ | 4,871.2 | | | 100.0 | | | $ | 5,092.0 | | | 100.0 | | | | (4.3 | )% | | $ | 5,121.8 | | 100.0 | | | $ | 4,513.7 | | 100.0 | | | | 13.5 | % |
Operating Expenses: | | | | | | | | | | | | | | | | | | | | | | | | | | | | | |
Salaries, wages and employee benefits | | | 2,963.7 | | 60.8 | | | | 2,950.0 | | 57.9 | | | | 0.5 | % | | | 2,921.7 | | 57.0 | | | | 2,770.1 | | 61.4 | | | | 5.5 | % |
Fuel, operating expenses and supplies | | | 889.0 | | 18.3 | | | | 940.2 | | 18.5 | | | | (5.4 | )% | | | 858.1 | | 16.8 | | | | 719.1 | | 15.9 | | | | 19.3 | % |
Purchased transportation | | | 614.2 | | 12.6 | | | | 683.2 | | 13.4 | | | | (10.1 | )% | | | 800.2 | | 15.6 | | | | 638.8 | | 14.2 | | | | 25.3 | % |
Depreciation and amortization | | | 152.4 | | 3.1 | | | | 147.7 | | 2.9 | | | | 3.2 | % | | | 143.6 | | 2.8 | | | | 134.9 | | 3.0 | | | | 6.4 | % |
Other operating expenses | | | 241.2 | | 5.0 | | | | 248.8 | | 4.9 | | | | (3.1 | )% | | | 293.9 | | 5.7 | | | | 239.6 | | 5.3 | | | | 22.7 | % |
Gains on property disposals, net | | | (13.7 | ) | | (0.3 | ) | | | (20.8 | ) | | (0.4 | ) | | | (34.1 | )% | |
Impairment charges | | | 8.2 | | | 0.2 | | | | — | | | — | | | NM* | | |
(Gains) Losses on property disposals, net | | | | 0.7 | | 0.0 | | | | (45.3 | ) | | (1.0 | ) | | NM* | |
Total operating expenses | | | 4,855.0 | | | 99.7 | | | | 4,949.1 | | | 97.2 | | | | (1.9 | )% | | | 5,018.2 | | | 98.0 | | | | 4,457.2 | | | 98.7 | | | | 12.6 | % |
Operating Income | | | 16.2 | | | 0.3 | | | | 142.9 | | | 2.8 | | | | (88.7 | )% | | | 103.6 | | | 2.0 | | | | 56.5 | | | 1.3 | | | NM* | |
Nonoperating Expenses: | | | | | | | | | | | | | | | | | | | | | | | | | | | | | |
Nonoperating expenses, net | | | 124.5 | | | 2.6 | | | | 111.6 | | | 2.2 | | | | 11.6 | % | | | 209.6 | | | 4.1 | | | | 129.6 | | | 2.9 | | | | 61.7 | % |
Income (loss) before income taxes | | | (108.3 | ) | | (2.2 | ) | | | 31.3 | | | 0.6 | | | NM* | | |
Loss before income taxes | | | | (106.0 | ) | | (2.1 | ) | | | (73.1 | ) | | (1.6 | ) | | | 45.0 | % |
Income tax expense (benefit) | | | (4.3 | ) | | (0.1 | ) | | | 11.1 | | | 0.2 | | | NM* | | | | 3.1 | | | 0.1 | | | | (19.6 | ) | | (0.4 | ) | | NM* | |
Net income (loss) | | $ | (104.0 | ) | | (2.1 | ) | | $ | 20.2 | | | 0.4 | | | NM* | | |
Net Loss | | | $ | (109.1 | ) | | (2.1 | ) | | $ | (53.5 | ) | | (1.2 | ) | | | 103.9 | % |
(*) not meaningful
Our
The industry in 2021 was in a tight capacity environment with fewer drivers available to meet shipping demands, which has led to price increases charged to customers and an increase in the cost of purchased transportation. During 2021, especially during the second half, the Company executed a yield strategy to achieve appropriate pricing per shipment for freight that optimized our network capacity. The execution of this strategy led to increased revenue per shipment and decreased shipment counts. The Company’s yield growth, including fuel surcharges, produced a consolidated operating revenue decreased $220.8increase of $608.1 million for the year ended December 31, 2019 compared to 2018. The decrease in revenue is primarily attributed2020, with an internal focus of retaining the optimal freight mix relative to a decrease in tonnage and fuel surcharge revenue, while partially offset by an increase in basehuman capital availability throughout 2021. Partially offsetting the positive yield excluding fuel surcharge.
Operating expenses decreased $94.1 million, forgrowth, the year ended December 31, 2019Company experienced shipping volume decreases compared to 2018, primarily due to lower purchased transportation expense2020. Further, the results of operations in 2020 were impacted by the outbreak of COVID-19 as shipping volumes decreased from typical levels and lower fuel, operating expensesnegatively impacted the pricing environment at certain times and supplies,in certain markets.
The Company’s results reflect these yield growth-driven revenue increases partially offset by increased purchased transportation expenses, fuel expense and variable expenses including salaries, wages and benefits. Further material changes are provided below.
Salaries, wages and employee benefits.
Salaries, wages and employee benefits. Salaries, wages and employee benefits increased $13.7$151.6 million primarily due to contractual wage rate increases and to a lesser extent salary and overtime wage increases. Additionally, there was an increase of $30.9 million in short-term incentive compensation predominantly for exceeding targeted financial results in 2021 and an increase of $29.0 million in employee benefits that corresponded with medical plan spending and other benefit cost trends.
Fuel, operating expenses and supplies. Fuel, operating expenses and supplies increased $139.0 million, primarily due to a $35.5$78.1 million increase in benefits costs which was largely driven by a $25.8 increase in union vacation expense due to restoration of benefits from the passage of the five-year national master contract (“New NMFA”), a $15.7 million increase in workers’ compensation expense, and a $6.8 million increase in salaries expense. These increases were partially offset by a $32.9 million reduction in short-term incentive compensation and an $11.3 million decrease in wages expense as a result of tonnage decreases that reduced the number of hours needed to process freight which were partially offset by contractual rate increases due to the New NMFA.
Fuel, operating expenses and supplies. Fuel, operating expenses and supplies decreased $51.2 million, primarily due to a $48.1 million decrease in fuel expense, which was largely a result of lowerhigher fuel prices andpartially offset by fewer miles driven. Additional increases included a $14.6 million increase in software expenses and other operating expenses, a $12.6 million increase for rebranding and other advertising expenses, a $10.5 million increase for travel and entertainment in other employee expenses and a $10.1 million increase in professional services. The majority of these increases were impacted by cost control measures which decreased variable expenses during 2020.
Purchased transportation. Purchased transportation decreased $69.0increased $161.4 million primarily due to significant rate increases as noted above. These increases were noted in most of our modes of purchased transportation and include a $68.3$50.6 million decreaseincrease in rail andpurchased transportation expense, a $50.5 million increase in over-the-road purchased transportation expense as a result of reduced tonnage, a $9.3 million decrease from reduced usage of local purchased transportation, and a $5.9 million decrease in short-term vehicle rents. These decreases were partially offset by an $18.5$49.3 million increase in third-party costs due to the expansiongrowth in third-partycustomer-specific logistics solutions. These increases were partially offset by a decrease in vehicle rentals.
26
Other operating expenses. Other operating expenses decreased $7.6increased $54.3 million primarily due to a decrease$38.8 million increase in third-party liability claims expense mostly due to unfavorable development of $4.2prior year claims and a $13.4 million increase in cargo claims expense, and a $4.0 million reduction in operating taxes as a result of fewer miles driven.expense.
Gains on property disposals, net. Net gainslosses on disposals of property were $13.7$0.7 million during 20192021 as compared to $20.8net gains of $45.3 million in 2018. The gains in 2019 and 20182020 which were primarily related to the sale of real properties, including a $29.3properties.
Nonoperating expense, net. Included in the overall increase of $80.0 million gain from the sale of one excess property during 2018.
Impairmentis an increase in non-union pension settlement charges. During the first quarter of 2019, the company recorded and an $8.2increase in interest expenses. Non-union pension settlement charges increased $61.1 million, impairment charge that reflects the write-down of an intangible asset as a result of rebranding strategies, leading to the discontinued use of a tradename.
Nonoperating expenses, net. Nonoperating expenses increased $12.9 million for the year ended December 31, 2019 compared to 2018 primarily due to an $11.2a partial pension annuitization during December 2021 that resulted in a non-cash settlement charge of approximately $54.9 million. Interest expense increased $14.8 million, expense in 2019 relatedprimarily due to the extinguishment of debt with no such charge in 2018, a $5.4$24.1 million increase in interest expense dueand associated amortization related to higher interest rates and outstanding debt balancesthe UST Loans entered into during 2019,July 2020 which werewas partially offset by a $6.3$15.9 million decrease in non-union pension costs due mainly to a reduction in non-cash pension settlement expenses.Term Loan interest.
Income tax. The Company’s effective tax rate for the years ended December 31, 20192021 and 20182020 was 4.0%(2.9)% and 35.5%26.8%, respectively. Significant items impactingThe primary driver of our 2021 effective tax rate differing from the 2019domestic federal statutory tax rate included a provision for net state and foreign taxes, certain permanent items, and awas the change in the valuation allowance established for theour domestic net deferred tax asset balance atas of December 31, 2019.2021. The 2021 effective tax rate was not impacted by the exception to intraperiod tax allocation in a similar manner as the 2020 effective tax rate due to the Company’s adoption of the change to the relevant accounting standard on January 1, 2021, as further discussed in Note 8 to the consolidated financial statements included in Part II, Item 8 of this Annual Report on Form 10-K. As of December 31, 20192021 and 2018,2020, the Company had a full valuation allowance against our domestic net deferred tax assets.
The table below summarizes the key revenue metrics for the years ended December 31:
| | | | | | | | | | | | |
| | 2021 | | | 2020 | | | Percent Change(a) | |
Workdays | | | 252.0 | | | | 253.0 | | | | |
| | | | | | | | | |
Operating Ratio | | | 98.0 | | | | 98.7 | | | 0.7 pp | |
| | | | | | | | | |
LTL picked up revenue (in millions) | | $ | 4,615.2 | | | $ | 4,100.1 | | | | 12.6 | % |
LTL tonnage (in thousands) | | | 9,520 | | | | 9,845 | | | | (3.3 | )% |
LTL tonnage per workday (in thousands) | | | 37.78 | | | | 38.91 | | | | (2.9 | )% |
LTL shipments (in thousands) | | | 16,707 | | | | 16,982 | | | | (1.6 | )% |
LTL shipments per workday (in thousands) | | | 66.30 | | | | 67.12 | | | | (1.2 | )% |
LTL picked up revenue per hundred weight | | $ | 24.24 | | | $ | 20.82 | | | | 16.4 | % |
LTL picked up revenue per hundred weight (excluding fuel surcharge) | | $ | 21.12 | | | $ | 18.78 | | | | 12.5 | % |
LTL picked up revenue per shipment | | $ | 276 | | | $ | 241 | | | | 14.4 | % |
LTL picked up revenue per shipment (excluding fuel surcharge) | | $ | 241 | | | $ | 218 | | | | 10.5 | % |
LTL weight per shipment (in pounds) | | | 1,140 | | | | 1,159 | | | | (1.7 | )% |
| | | | | | | | | |
Total picked up revenue (in millions)(b) | | $ | 5,077.7 | | | $ | 4,487.7 | | | | 13.1 | % |
Total tonnage (in thousands) | | | 12,427 | | | | 12,589 | | | | (1.3 | )% |
Total tonnage per workday (in thousands) | | | 49.31 | | | | 49.76 | | | | (0.9 | )% |
Total shipments (in thousands) | | | 17,178 | | | | 17,446 | | | | (1.5 | )% |
Total shipments per workday (in thousands) | | | 68.17 | | | | 68.96 | | | | (1.1 | )% |
Total picked up revenue per hundred weight | | $ | 20.43 | | | $ | 17.82 | | | | 14.6 | % |
Total picked up revenue per hundred weight (excluding fuel surcharge) | | $ | 17.88 | | | $ | 16.13 | | | | 10.9 | % |
Total picked up revenue per shipment | | $ | 296 | | | $ | 257 | | | | 14.9 | % |
Total picked up revenue per shipment (excluding fuel surcharge) | | $ | 259 | | | $ | 233 | | | | 11.2 | % |
Total weight per shipment (in pounds) | | | 1,447 | | | | 1,443 | | | | 0.3 | % |
| | 2019 | | | 2018 | | | Percent Change(a) |
Workdays | | | 251.5 | | | | 252.0 | | | | | |
| | | | | | | | | | | | |
Operating Ratio | | | 99.7 | | | | 97.2 | | | (2.5 pp) | |
LTL picked up revenue (in millions) | | $ | 4,457.2 | | | $ | 4,687.9 | | | | (4.9 | )% |
LTL tonnage (in thousands) | | | 10,314 | | | | 11,025 | | | | (6.5 | )% |
LTL tonnage per workday (in thousands) | | | 41.01 | | | | 43.75 | | | | (6.3 | )% |
LTL shipments (in thousands) | | | 18,246 | | | | 19,492 | | | | (6.4 | )% |
LTL shipments per workday (in thousands) | | | 72.55 | | | | 77.35 | | | | (6.2 | )% |
LTL picked up revenue per hundred weight | | $ | 21.61 | | | $ | 21.26 | | | | 1.6 | % |
LTL picked up revenue per hundred weight (excluding fuel surcharge) | | $ | 19.05 | | | $ | 18.64 | | | | 2.2 | % |
LTL picked up revenue per shipment | | $ | 244 | | | $ | 241 | | | | 1.6 | % |
LTL picked up revenue per shipment (excluding fuel surcharge) | | $ | 215 | | | $ | 211 | | | | 2.2 | % |
LTL weight per shipment (in pounds) | | | 1,131 | | | | 1,131 | | | | (0.1 | )% |
| | | | | | | | | | | | |
Total picked up revenue (in millions)(b) | | $ | 4,831.3 | | | $ | 5,048.2 | | | | (4.3 | )% |
Total tonnage (in thousands) | | | 12,946 | | | | 13,662 | | | | (5.2 | )% |
Total tonnage per workday (in thousands) | | | 51.47 | | | | 54.21 | | | | (5.1 | )% |
Total shipments (in thousands) | | | 18,653 | | | | 19,851 | | | | (6.0 | )% |
Total shipments per workday (in thousands) | | | 74.17 | | | | 78.77 | | | | (5.8 | )% |
Total picked up revenue per hundred weight | | $ | 18.66 | | | $ | 18.48 | | | | 1.0 | % |
Total picked up revenue per hundred weight (excluding fuel surcharge) | | $ | 16.50 | | | $ | 16.21 | | | | 1.8 | % |
Total picked up revenue per shipment | | $ | 259 | | | $ | 254 | | | | 1.9 | % |
Total picked up revenue per shipment (excluding fuel surcharge) | | $ | 229 | | | $ | 223 | | | | 2.6 | % |
Total weight per shipment (in pounds) | | | 1,388 | | | | 1,376 | | | | 0.8 | % |
Percent change based on unrounded figures and not the rounded figures presented.
(b)Does not equal financial statement revenue due to revenue recognition adjustments between accounting periods and the impact of other revenue.
| | | | | | | | | (in millions) | | 2021 | | | 2020 | | (b) Reconciliation of operating revenue to total picked up revenue: | | | | | | | Operating revenue | | $ | 5,121.8 | | | $ | 4,513.7 | | Change in revenue deferral and other | | | (44.1 | ) | | | (26.0 | ) | Total picked up revenue | | $ | 5,077.7 | | | $ | 4,487.7 | |
27
(a)
| Percent change based on unrounded figures and not the rounded figures presented.
|
(b)
| Does not equal financial statement revenue due to revenue recognition adjustments between accounting periods and the impact of other revenue.
|
(in millions) | | 2019 | | | 2018 | |
(b) Reconciliation of operating revenue to total picked up revenue: | | | | | | | | |
Operating revenue | | $ | 4,871.2 | | | $ | 5,092.0 | |
Change in revenue deferral and other | | | (39.9 | ) | | | (43.8 | ) |
Total picked up revenue | | $ | 4,831.3 | | | $ | 5,048.2 | |
Certain Non-GAAP Financial Measures
As previously discussed in the “Our Business” section, we use certain non-GAAP financial measures to assess performance including EBITDA and Adjusted EBITDA. We believe our presentation of EBITDA and Adjusted EBITDA is useful to investors and other users as these measures represent key supplemental information our management uses to compare and evaluate our core underlying business results, particularly in light of our leverage position and the capital-intensive nature of our business. These secondary measures should be considered in addition to the results prepared in accordance with GAAP, but should not be considered a substitute for, or superior to, our GAAP financial measures.
Adjusted EBITDA
The reconciliation of net income (loss)loss to EBITDA and EBITDA to Adjusted EBITDA for the years ended December 31:
| | | | | | | | | | | | |
(in millions) | | 2022 | | | 2021 | | | 2020 | |
Reconciliation of net income (loss) to Adjusted EBITDA: | | | | | | | | | |
Net income (loss) | | $ | 21.8 | | | $ | (109.1 | ) | | $ | (53.5 | ) |
Interest expense, net | | | 161.6 | | | | 150.4 | | | | 135.6 | |
Income tax expense (benefit) | | | 4.7 | | | | 3.1 | | | | (19.6 | ) |
Depreciation and amortization | | | 143.4 | | | | 143.6 | | | | 134.9 | |
EBITDA | | | 331.5 | | | | 188.0 | | | | 197.4 | |
Adjustments for TL Agreements: | | | | | | | | | |
(Gains) losses on property disposals, net | | | (38.0 | ) | | | 0.7 | | | | (45.3 | ) |
Non-cash reserve changes (a) | | | (2.5 | ) | | | 11.6 | | | | 2.9 | |
Letter of credit expense | | | 8.4 | | | | 8.5 | | | | 7.3 | |
Permitted dispositions and other | | | 0.4 | | | | 0.8 | | | | 0.3 | |
Equity-based compensation expense | | | 5.3 | | | | 4.4 | | | | 4.7 | |
Non-union pension settlement charges | | | 12.1 | | | | 64.7 | | | | 3.6 | |
Other, net | | | 1.2 | | | | 3.0 | | | | 3.5 | |
Expense amounts subject to 10% threshold (b): | | | | | | | | | |
Department of Defense settlement charge | | | 5.3 | | | | — | | | | — | |
COVID-19 | | | — | | | | — | | | | 3.9 | |
Other, net | | | 19.4 | | | | 24.3 | | | | 17.3 | |
Adjusted EBITDA prior to 10% threshold | | | 343.1 | | | | 306.0 | | | | 195.6 | |
Adjustments pursuant to TTM calculation (b) | | | — | | | | — | | | | (3.7 | ) |
Adjusted EBITDA | | $ | 343.1 | | | $ | 306.0 | | | $ | 191.9 | |
(in millions) | | 2020 | | | 2019 | | | 2018 | |
Reconciliation of net income (loss) to Adjusted EBITDA: | | | | | | | | | | | | |
Net income (loss) | | $ | (53.5 | ) | | $ | (104.0 | ) | | $ | 20.2 | |
Interest expense, net | | | 135.6 | | | | 109.9 | | | | 104.5 | |
Income tax expense (benefit) | | | (19.6 | ) | | | (4.3 | ) | | | 11.1 | |
Depreciation and amortization | | | 134.9 | | | | 152.4 | | | | 147.7 | |
EBITDA | | | 197.4 | | | | 154.0 | | | | 283.5 | |
Adjustments for TL Agreements: | | | | | | | | | | | | |
Gains on property disposals, net | | | (45.3 | ) | | | (13.7 | ) | | | (20.8 | ) |
Non-cash reserve changes (a) | | | 2.9 | | | | 16.1 | | | | — | |
Impairment charges | | | — | | | | 8.2 | | | | — | |
Letter of credit expense | | | 7.3 | | | | 6.5 | | | | 6.6 | |
Permitted dispositions and other | | | 0.3 | | | | (0.9 | ) | | | 0.3 | |
Equity-based compensation expense | | | 4.7 | | | | 6.3 | | | | 6.3 | |
Loss on extinguishment of debt | | | — | | | | 11.2 | | | | — | |
Non-union pension settlement charge | | | 3.6 | | | | 1.8 | | | | 10.9 | |
Other, net | | | 3.5 | | | | 2.9 | | | | 0.1 | |
Expense amounts subject to 10% threshold (b): | | | | | | | | | | | | |
COVID-19 | | | 3.9 | | | | — | | | | — | |
Other, net | | | 17.3 | | | | 18.2 | | | | 20.9 | |
Adjusted EBITDA prior to 10% threshold | | | 195.6 | | | | 210.6 | | | | 307.8 | |
Adjustments pursuant to TTM calculation (b) | | | (3.7 | ) | | | — | | | | — | |
Adjusted EBITDA | | $ | 191.9 | | | $ | 210.6 | | | $ | 307.8 | |
Non-cash reserve changes reflect the net non-cash reserve charge for union and nonunion vacation, with such non-cash reserve adjustment to be reduced by cash charges in a future period when paid.
(b)Pursuant to the TL Agreements, Adjusted EBITDA limits certain adjustments in aggregate to 10% of the trailing-twelve-month ("TTM") consolidated Adjusted EBITDA, prior to the inclusion of amounts subject to the 10% threshold, for each period ending. Such adjustments include, but are not limited to, restructuring charges, integration costs, severance, and non-recurring charges. The limitation calculation is updated quarterly based on TTM Adjusted EBITDA, and any necessary adjustment resulting from this limitation, if applicable, will be presented here. The sum of the quarters may not necessarily equal TTM Adjusted EBITDA due to the expiration of adjustments from prior periods.
(a)
| Non-cash reserve changes reflect the net non-cash reserve charge for union and nonunion vacation (which includes the impact of the New NMFA for the one week of restored vacation), with such non-cash reserve adjustment to be reduced by cash charges in a future period when paid.
|
(b)
| Pursuant to the TL Agreements, Adjusted EBITDA limits certain adjustments in aggregate to 10% of the trailing-twelve-month ("TTM") consolidated Adjusted EBITDA, prior to the inclusion of amounts subject to the 10% threshold, for each period ending. Such adjustments include, but are not limited to, restructuring charges, integration costs, severance, and non-recurring charges. The limitation calculation is updated quarterly based on TTM Adjusted EBITDA, and any necessary adjustment resulting from this limitation, if applicable, will be presented here.
|
Financial Condition, Liquidity and Capital Resources
The following sections provide aggregated information regarding our financial condition, liquidity and capital resources. As of December 31, 20202022 and 20192021 our total debt was $1,225.4$1,538.0 million and $862.2$1,554.5 million, respectively.
Liquidity
Our principal sources of liquidity are cash and cash equivalents, available borrowings under our ABL Facility and any prospective net cash flow from operations. As of December 31, 2020,2022 and 2021, our cash and cash equivalents was $439.3$235.1 million and $310.7 million, respectively.
On October 31, 2022, we completed an amendment to our ABL agreement which extended the term to January 9, 2026 and includes a springing maturity commencing thirty days prior to the maturity of any of the Term Debt, the UST Tranche A Facility Indebtedness, or the UST Tranche B Facility Indebtedness. The amended facility has an increased capacity of $50 million up to $500 million. The facility has an interest rate of Secured Overnight Financing Rate ("SOFR") + 1.75%.
28
As of December 31, 2020,2022, our maximum availabilityAvailability under our ABL Facility was $43.7$47.7 million, and our managed accessibilityManaged Accessibility was $4.0$6.7 million. Maximum availabilityAvailability is derived by reducing the amount that may be advanced against eligible receivables plus eligible borrowing base cash by certain reserves imposed by the ABL Agent and our $353.3$361.8 million of outstanding letters of credit. Our Managed Accessibility of $4.0 million represents the maximum amount we would access on the ABL Facility and is adjusted for eligible receivables plus eligible borrowing base cash measured as of December 31, 2020.2022. If eligible receivables fall below the threshold management uses to measure availability, which is 10% of the borrowing line, the credit agreement governing the ABL Facility permits adjustments from eligible borrowing base cash to restricted cash prior to the compliance measurement date, which for the year-end 2022 is as of January 15, 2021. As of January 15, 2021, we had less than 10% of the borrowing line in eligible receivables and moved $3.1 million of cash into restricted cash, as permitted under the ABL Facility, which effectively put our cash13, 2023. Cash and cash equivalents and Managed Accessibility to $440.2totaled $241.8 million as ofat December 31, 2020.2022.
As of December 31, 2019,2021, our availabilityAvailability under our ABL Facility was $37.7 million. Of the $37.7$93.1 million, in availability,and our Managed Accessibility was $0.2$48.1 million. Our cashCash and cash equivalents and Managed Accessibility was $80.4totaled $358.8 million as ofat December 31, 2019.2021.
The table below summarizes cash and cash equivalents and Managed Accessibility at December 31:
| (in millions) | | 2020 | | | 2019 | | | 2018 | | | 2022 | | | 2021 | |
Cash and cash equivalents | | $ | 439.3 | | | $ | 109.2 | | | $ | 227.6 | | | $ | 235.1 | | | $ | 310.7 | |
Less: amounts placed into restricted cash subsequent to year-end | | | (3.1 | ) | | | (29.0 | ) | | | (25.0 | ) | | | — | | | | — | |
Managed Accessibility | | | 4.0 | | | | 0.2 | | | | 1.2 | | | | 6.7 | | | | 48.1 | |
Total cash and cash equivalents and Managed Accessibility | | $ | 440.2 | | | $ | 80.4 | | | $ | 203.8 | | | $ | 241.8 | | | $ | 358.8 | |
On January 3, 2023, the outstanding balance of the A&R CDA debt was paid in full, and in compliance with the terms of that agreement reducing our cash and cash equivalents by $66.3 million.
Outside of funding normal operations, which includes making contractual contributions to various multi-employer pension funds and payments on equipment leases, our principal uses of cash include making contributions to our various multi-employer pension funds and single-employer pension plans, and meeting our other cash obligations, including, but notis limited to paying principal and interest on our funded debt, payments on equipment leases and investments in capital expenditures.
Covenants
The TL Agreements include a financial covenant requirement for
Under the UST Loans and Credit Agreement, the Company has a quarterly requirement to maintain a minimum Liquidity. The Company is in compliance with the applicable financial covenant as of December 31, 2020.
The Company has a requirement to maintain minimum Liquidity of $125.0 million. This Liquidity requirement is relieved at the end of the first quarter in which the Company’strailing-twelve-month ("TTM") Adjusted EBITDA forof $200.0 million through the trailing twelve-month period is greater than $200.0 million. With Liquidity asmaturity of December 31, 2020 of $440.2 million, UST loan availability,these agreements. Management expects, based on actual and forecasted operating results, management expects the Company will meet this covenant requirement for the next twelve months.
Beginning with the fiscal quarter ended December 31, 2021, the Company has a requirement to maintain a trailing twelve-month Adjusted EBITDA of $100.0 million. Management expects, based on forecasted operating results, the Company will meet this covenant requirement for the period it becomes effectiveCash Flows
The Company's cash flow activities are summarized in the next twelve months.
Cash Flow
Fortable below, for the years ended December 31:
| | | | | | | | | | | | |
(in millions) | | 2020 | | | 2019 | | | 2018 | |
Net cash provided by operating activities | | $ | 122.5 | | | $ | 21.5 | | | $ | 224.8 | |
Net cash used in investing activities | | | (84.5 | ) | | | (117.3 | ) | | | (109.0 | ) |
Net cash provided by (used in) financing activities | | | 330.8 | | | | (22.6 | ) | | | (33.9 | ) |
| | | | | | | | | | | | |
| | | | | | | | | |
(in millions) | | 2022 | | | 2021 | | | 2020 | |
Net cash provided by (used in) operating activities | | $ | 121.3 | | | $ | 10.2 | | | $ | 122.5 | |
Net cash provided by (used in) investing activities | | | (146.1 | ) | | | (494.0 | ) | | | (84.5 | ) |
Net cash provided by (used in) financing activities | | | (51.0 | ) | | | 320.6 | | | | 330.8 | |
Operating Cash Flow
The increase in cash provided by operating activities for the year ended December 31, 20202022 compared to the year ended December 31, 2019 is2021 was primarily relatedattributable to deferrals ofan $222.7 million increase in the change in cash flow from accounts receivable during 2022 and a $130.9 million increase in net income. Additionally, operating cash flows decreased $52.6 million due to a decrease non-union pension settlement charges which was offset by a $139.8 million net decrease in cash flows and various payments recorded asother working capital changes included in other operating liabilities.
The change in other operating liabilities during 2020 was $117.2 million, which includes accrued payroll tax deferrals. Under the CARES Act, we are deferring payment of certain employer payroll taxes incurred in 2020 that resulted in $85.6 million of liabilities as of December 31, 2020, with 50% due December 31, 2021 and 50% due December 31, 2022 as detailed in our Contractual Cash Obligations table. For the year ended 2020 the Company incurred $42.4 million of interest expenses that were paid-in-kind. Lastly, our operating cash flows from a reduction in lease payments was $20.1 million driven by a decrease in the number ofcash provided by operating lease agreements for revenue equipment and changes in payment timing.
Cash flow from operations decreased by $203.3 million to $21.5 millionactivities for the year ended December 31, 20192021 compared to $224.8 million for the year ended December 31, 2018. The decrease2020 was primarily attributable to a $118.3 million increase in accounts receivable during 2021. This growth is consistent with the positive yield growth as discussed in our Consolidated Results of Operations, and also reflects the timing of our collections. Additionally, operating cash flows decreased due to $42.8 million in payments of certain deferred employer payroll taxes, which was offset by a net increase in cash flow is primarily related to a $124.2 million decrease in net income, and the remaining difference is primarily related to timing differences inflows from various other working capital accounts.changes included in other operating liabilities.
29
Investing Cash Flow
The decrease of $32.8$347.9 million of cash used in investing activities for the year ended December 31, 20202022 compared to the year ended December 31, 20192021 was largely driven by lower outflows on revenue equipment acquisitions and higher cash proceeds from the sale of real property as well as a reduction toproperty.
The increase of $409.5 million of cash outflows of revenue equipment acquisitions. Cash used by investing cash flows is expected to increase in 2021 due to increased capital expenditures as the Company anticipates utilizing funds from the UST Credit Agreements, as discussed below in Capital Expenditures.
Cash used in investing activities was $117.3 million in 2019for the year ended December 31, 2021 compared to $109.0 million in 2018, primarily due to a net decrease inthe year ended December 31, 2020 was largely driven by outflows on revenue equipment acquisitions and by lower cash proceeds from the disposalsale of property and equipment of $10.5 million.real property.
Financing Cash Flow
Net cash used in financing activities for 2022 was $51.0 million, which consists primarily of amounts repaid on our Term Loan.
Net cash provided by financing activities for 20202021 was $330.8$320.6 million, compared to $22.6 million used in 2019. The increase in cash iswhich consists primarily related toof amounts drawn on our UST Credit Agreements. Net cash used in financing activities for 2019 was $22.6 million, which consists primarily of $579.0 million in repayments of our long-term debt, offset by the issuance of $570.0 million of long-term debt for the Term Loan, in addition to $12.7 million in deferred debt issuance costs incurred.
Capital Expenditures
Our capital expenditures focus primarily on the replacement of revenue equipment, investments in information technology and improvements to land and structures. Our business is capital intensive with significant investments in tractors, trailers, refurbished engines, information technology and service center facilities. We determine the amount and timing of capital expenditures based on numerous factors, including availability and attractiveness of financing, anticipated liquidity levels, anticipated financial returns and other factors.
The table below summarizes our actual net capital expenditures (net of proceeds from disposals) by type of investment for the years ended December 31:
| (in millions) | | 2020 | | | 2019 | | | 2018 | | | 2022 | | | 2021 | | | 2020 | |
Acquisition of property and equipment | | | | | | | | | | | | | | | | | | | | | |
Revenue equipment | | $ | 86.8 | | | $ | 88.6 | | | $ | 79.8 | | | $ | 105.9 | | | $ | 412.1 | | | $ | 86.8 | |
Land and structures | | | 8.6 | | | | 13.2 | | | | 13.9 | | | | 19.1 | | | | 22.5 | | | | 8.6 | |
Technology equipment and software | | | 33.6 | | | | 36.0 | | | | 38.3 | | | | 48.4 | | | | 55.6 | | | | 33.6 | |
Other | | | 11.6 | | | | 5.4 | | | | 13.4 | | | | 18.4 | | | | 7.4 | | | | 11.6 | |
Total capital expenditures | | | 140.6 | | | | 143.2 | | | | 145.4 | | | | 191.8 | | | | 497.6 | | | | 140.6 | |
Proceeds from disposal of property and equipment | | | | | | | | | | | | | | | | | | | | | |
Land and structures | | | (52.6 | ) | | | (22.9 | ) | | | (32.1 | ) | | | (42.9 | ) | | | (1.1 | ) | | | (52.6 | ) |
Revenue equipment, technology equipment and software and other | | | (3.5 | ) | | | (3.0 | ) | | | (4.3 | ) | | | (2.8 | ) | | | (2.5 | ) | | | (3.5 | ) |
Total proceeds | | | (56.1 | ) | | | (25.9 | ) | | | (36.4 | ) | | | (45.7 | ) | | | (3.6 | ) | | | (56.1 | ) |
Total net capital expenditures | | $ | 84.5 | | | $ | 117.3 | | | $ | 109.0 | | | $ | 146.1 | | | $ | 494.0 | | | $ | 84.5 | |
Our capital expenditures for revenue equipment were used primarily to fund the purchase of tractors, trailers and containers and to refurbish engines for our revenue fleet.
As of December 31, 2020, we entered into revenue equipment purchase commitments totaling approximately $141.6 million with such payments to be made over the first six months of 2021. We expect capital expenditures in 2021 to be in the range of $450
million to $550 million, with planned investments in tractors, trailers, technology, box trucks, containers, liftgates and other assets.
fleet. We also acquire our equipment through operating leases which will vary based on current and anticipated liquidity and lease financing options. For the yearyears ended December 31, 2020,2022 and 2021, we entered intofocused on revenue equipment capital expenditures, as detailed above, and not entering new operating lease commitments for revenue equipment totaling $0.6 million, with such payments to be made over an average lease term of 4 years with a capital equivalent value of $0.7 million.leases. As of December 31, 2020,2022, our undiscounted operating lease obligations through 20312036 totaled $350.8 million and are expected to decrease in the next twelve months as we plan to reduce leasing activity and increase revenue equipment acquisitions.$198.6 million.
For the year ended December 31, 2019, we entered into new operating lease commitments for revenue equipment totaling $111.0 million, with such payments to be made over an average lease term of 4 years with a capital equivalent value of $131.8 million. As of December 31, 2019, our operating lease obligations through 2030 totaled $451.1 million.
Contractual Obligations and Other Commercial Commitments
The following sections provide certain aggregated information regarding our contractual obligations and commercial commitments as of December 31, 2020.2022 with a focus on obligations and commitments not disclosed elsewhere in this report.
Non-Union 30
Contractual Cash Obligations
Material contractual obligations arising in the normal course of business primarily consist of long-term debt and interest payments, operating leases, pension deferral principal and interest payments, and workers' compensation and third-party liability claim obligations. The following table reflects our material cash outflows that we are contractually obligated to make related to long-term debt, including interest, and operating leases as of December 31, 2022:
| | | | | | | | | | | | | | | | | | | | |
| | Payments Due by Period | |
(in millions) | | Total | | | Less than
1 year | | | 1-3
years | | | 3-5
years | | | After
5 years | |
ABL Facility(a) | | $ | 24.2 | | | $ | 7.4 | | | $ | 14.8 | | | $ | 2.0 | | | $ | — | |
Term Loan(b) | | | 671.8 | | | | 68.0 | | | | 603.8 | | | | — | | | | — | |
UST Loans(c) | | | 829.9 | | | | 37.1 | | | | 792.8 | | | | — | | | | — | |
Lease financing obligations(d) | | | 259.0 | | | | 45.1 | | | | 84.8 | | | | 77.7 | | | | 51.4 | |
Pension deferral obligations(e) | | | 66.3 | | | | 66.3 | | | | — | | | | — | | | | — | |
Operating leases(f) | | | 198.6 | | | | 67.0 | | | | 57.7 | | | | 34.3 | | | | 39.6 | |
Total | | $ | 2,049.8 | | | $ | 290.9 | | | $ | 1,553.9 | | | $ | 114.0 | | | $ | 91.0 | |
(a)The ABL Facility includes future payments for the letter of credit and unused line fees and are not included on the Company’s consolidated balance sheets.
(b)The Term Loan includes principal and interest payments but excludes unamortized discounts.
(c)The UST Loans includes principal and interest payments, including paid-in-kind interest.
(d)The lease financing obligations consist primarily of interest payments.
(e)Pension Obligationsdeferral obligations includes principal and interest payments on the Second A&R CDA. On January 3, 2023, the outstanding balance of the A&R CDA was paid in full, and in compliance with the terms of that agreement reducing our obligations by $66.3 million.
(f)Operating leases represent future payments under contractual lease arrangements primarily for revenue equipment and land and structures.
We sponsor defined benefitexpect cash contributions, if required at all, for our non-union sponsored pension plans for certain employees not covered by collective bargaining agreements. The qualified plans, which include the Yellow Corporation Pension Plan, the Roadway LLC Pension Planto be nominal in 2023 and the YRC Retirement Pension Plan (collectively held in the YRC Worldwide Inc. Master Pension Plans Trust or “Trust”) cover approximately 9,000 participants including those currently receiving benefits and those who have left the Company with deferred benefits. On January 1, 2004, the existing qualified benefit plans were closed to new participants. On July 1, 2008, the benefityears thereafter. Additional details on self-insurance accruals for participants were frozen. These plans have been and could be further amended in the future when deemed appropriate and when such amendmentsclaims are consistent with the Company’s continued long-term strategy of de-risking these pension plans and improving the overall funded status.
During the year ended December 31, 2020, our net pension income was $6.5 million, which included a $3.6 million expense recognition of settlements from lump sum payouts during the year. Our cash contributions were $36.5 million during the year ended December 31, 2020. Using our current plan assumptions for the discount rate of 2.81% and an updated assumed 5.00% return on assets, as discussed below, we expect to record income of $5.6 million for the year ended December 31, 2021. Additional information on these pension plans is included in our discussion of Single Employer Pension Plans under the “Critical Accounting Policy” section, which includes specific details on the underlying key estimates and the associated sensitivity analysis, and is also available in Note 42 to the consolidated financial statements included in Part II, Item 8 of this Annual Report on Form 10-K.
Due to the historically underfunded nature of these plans we managed our investment portfolio to hedge risks, but primarily focused on risk seeking assets that would provide an opportunity to close the net funded deficit. With the net funded status now fully funded, meaning the aggregate fair value of the assets exceeds the aggregate projected benefit obligation, as of December 31, 2020 we are reducing the percentage of the portfolio comprised of risk seeking assets and increasing the amount of hedge assets. As such, we have lowered our 2021 expected rate of return to 5.0% based on an improved funded position and a lower risk profile. In addition, we will continue to review our expected long-term rate of return on an annual basis and revise appropriately.
We expect cash contributions, inclusive of those for our non-union sponsored pension plans, to be $4.7 million in 2021 and no significant annual contributions in years thereafter. We have tested the sensitivities of the expected future cash contributions under scenarios in which the future actual asset returns fall short of or exceed the 5.0% assumption by 1.0% per year and in which the future interest rates decrease or increase 100 basis points from January 1, 2020 levels. Under these scenarios, the total cash contributions would remain unchanged over the next five years.
Contractual Cash Obligations
The following table reflects cash outflows that we are contractually obligated to make as of December 31, 2020:
| | Payments Due by Period | |
(in millions) | | Total | | | Less than 1 year | | | 1-3 years | | | 3-5 years | | | After 5 years | |
ABL Facility(a) | | $ | 29.0 | | | $ | 8.8 | | | $ | 17.7 | | | $ | 2.5 | | | $ | — | |
Term Loan(b) | | | 797.9 | | | | 52.8 | | | | 105.4 | | | | 639.7 | | | | — | |
UST Loan Tranche A(c) | | | 358.6 | | | | 4.7 | | | | 9.8 | | | | 344.1 | | | | — | |
UST Loan Tranche B(d) | | | 117.7 | | | | 11.4 | | | | 22.9 | | | | 83.4 | | | | — | |
Lease financing obligations(e) | | | 342.8 | | | | 43.2 | | | | 88.5 | | | | 83.5 | | | | 127.6 | |
Pension deferral obligations(f) | | | 78.5 | | | | 6.6 | | | | 71.9 | | | | — | | | | — | |
Employer payroll taxes(g) | | | 85.6 | | | | 42.8 | | | | 42.8 | | | | — | | | | — | |
Workers’ compensation and third-party liability claims obligations(h) | | | 345.2 | | | | 103.0 | | | | 110.9 | | | | 45.4 | | | | 85.9 | |
Operating leases(i) | | | 350.8 | | | | 142.5 | | | | 147.7 | | | | 33.7 | | | | 26.9 | |
Other contractual obligations(j) | | | 18.2 | | | | 15.8 | | | | 2.2 | | | | 0.2 | | | | — | |
Capital expenditure obligations(k) | | | 153.3 | | | | 153.3 | | | | — | | | | — | | | | — | |
Total contractual obligations | | $ | 2,677.6 | | | $ | 584.9 | | | $ | 619.8 | | | $ | 1,232.5 | | | $ | 240.4 | |
(a)
| The ABL Facility includes future payments for the letter of credit and unused line fees and are not included on the Company’s consolidated balance sheets.
|
(b)
| The Term Loan includes principal and interest payments but excludes unamortized discounts.
|
(c)
| The UST Loan Tranche A includes principal and interest payments, including paid-in-kind interest.
|
(d)
| The UST Loan Tranche B includes principal and interest payments.
|
(e)
| The lease financing obligations consist primarily of interest payments.
|
(f)
| Pension deferral obligations includes principal and interest payments on the Second A&R CDA.
|
(g)
| Employer payroll taxes include amounts permitted for deferral by the CARES Act.
|
(h)
| The workers’ compensation, property damage and liability claims obligations represent our estimate of future payments for these obligations, not all of which are contractually required.
|
(i)
| Operating leases represent future payments under contractual lease arrangements primarily for revenue equipment.
|
(j)
| Other contractual obligations include future service agreements and certain maintenance agreements and are not included on the Company’s consolidated balance sheets.
|
(k)
| Capital expenditures and other obligations primarily include noncancelable orders for revenue equipment the Company will either purchase or lease. If leased, the cash obligations will be scheduled over the multi-year term of the lease and ROU assets and liabilities will be recorded upon lease execution.
|
Other Commercial Commitments
The following table reflects other commercial commitments or potential cash outflows that may result from a contingent event, such as a need to borrow short-term funds due to insufficient cash flow.
| | | | | | | | | | | | | | | | | | | | |
| | Amount of Commitment Expiration Per Period | |
(in millions) | | Total | | | Less than
1 year | | | 1-3
years | | | 3-5
years | | | After
5 years | |
ABL Facility availability(a) | | $ | 47.7 | | | $ | — | | | $ | 47.7 | | | $ | — | | | $ | — | |
Letters of credit(b) | | | 361.8 | | | | — | | | | 361.8 | | | | — | | | | — | |
Surety bonds(c) | | | 93.2 | | | | 60.5 | | | | 32.7 | | | | — | | | | — | |
Total commercial commitments | | $ | 502.7 | | | $ | 60.5 | | | $ | 442.2 | | | $ | — | | | $ | — | |
| | Amount of Commitment Expiration Per Period | |
(in millions) | | Total | | | Less than 1 year | | | 1-3 years | | | 3-5 years | | | After 5 years | |
ABL Facility availability(a) | | $ | 43.7 | | | $ | — | | | $ | — | | | $ | 43.7 | | | $ | — | |
Letters of credit(b) | | | 353.3 | | | | — | | | | — | | | | 353.3 | | | | — | |
Surety bonds(c) | | | 108.2 | | | | 68.8 | | | | 39.4 | | | | — | | | | — | |
Total commercial commitments | | $ | 505.2 | | | $ | 68.8 | | | $ | 39.4 | | | $ | 397.0 | | | $ | — | |
Availability under the ABL Facility is derived by reducing the amount that may be advanced against eligible receivables plus eligible borrowing base cash by certain reserves imposed by the ABL Agent and our outstanding letters of credit.
(b)Letters of credit outstanding are generally required as collateral to support self-insurance programs and do not represent additional liabilities as the underlying self-insurance accruals are already included in our consolidated balance sheets.
(c)Surety bonds are generally required for workers’ compensation to support self-insurance programs, which include certain bonds that do not have an expiration date but are redeemable on demand, and do not represent additional liabilities as the underlying self-insurance accruals are already included in our consolidated balance sheets.
(a)
| Availability under the ABL Facility is derived by reducing the amount that may be advanced against eligible receivables plus eligible borrowing base cash by certain reserves imposed by the ABL Agent and our outstanding letters of credit.
|
(b)
| Letters of credit outstanding are generally required as collateral to support self-insurance programs and do not represent additional liabilities as the underlying self-insurance accruals are already included in our consolidated balance sheets.
|
(c)
| Surety bonds are generally required for workers’ compensation to support self-insurance programs, which include certain bonds that do not have an expiration date but are redeemable on demand, and do not represent additional liabilities as the underlying self-insurance accruals are already included in our consolidated balance sheets.
|
Off-Balance Sheet Arrangements
We have no off-balance sheet arrangements except for other contractual obligations for service agreements and capital purchases, letters of credit and surety bonds, which are reflected in the above tables.tables, and normal course service agreements and capital purchases.
31
Critical Accounting Policies
Preparation of our consolidated financial statements requires accounting policies that involve significant estimates and judgments regarding the amounts included in the consolidated financial statements and disclosed in the accompanying notes to the consolidated financial statements. We continually review the appropriateness of our accounting policies and the accuracy of our estimates including discussion with the Audit & Ethics Committee of our Board of Directors whothat may make recommendations to management regarding these policies. Even with a thorough process, estimates must be adjusted based on changing circumstances and new information. Actual results could differ from those estimates. Management has identified the policies further described in the notes to the consolidated financial statements included in Item 8 of this report, described below as requiring significant judgment and having a potential material impact to our consolidated financial statements.
Self-Insurance for Claims
We are self-insured up to certain limits for workers’ compensation and third-party liability claims. We measure the liabilities associated with workers’ compensation and third-party liability claims primarily through actuarial methods performed by an independent third-party.third party. Actuarial methods include estimates for the undiscounted liability for claims reported, for claims incurred but not reported and for certain future administrative costs. These estimates are based on historical loss experiencedevelopment factors and judgments about the present and expected levels of costs per claim and the time required to settle claims. The effect of future inflation for costs is considered in the actuarial analysis. Actual claims may vary from these estimates due to a number of factors, including but not limited to, accident frequency and severity, claims management, changes in healthcare costs, legal and judicial developments, and overall economic conditions. We discount the actuarial calculations of claims liabilities for each calendar year to present value based on the average U.S. Treasury rate, during the calendar year of occurrence, for maturities that match the initial expected payout of the liabilities. As of December 31, 20202022 and 2019,2021, we had $323.3$325.2 million and $335.6$354.5 million accrued for outstanding claims, respectively. Additional details on self-insurance accruals for claims are also available in Note 2 to the consolidated financial statements included in Part II, Item 8 of this Annual Report on Form 10-K.
Single EmployerNon-Union Pension Plans
The Company sponsors defined benefit pension plans for certain employees not covered by collective bargaining agreements. The qualified plans cover approximately 4,600 participants including those currently receiving benefits and those who have left the Company with deferred benefits. On January 1, 2004, the existing qualified benefit plans were closed to new participants. Effective July 1, 2008, we froze the qualified and nonqualified defined benefit pension plans for all participating employees not covered by collective bargaining agreements. Given the frozen status of the plans, the key estimates in determining pension cost are discount rate and return on plan assets, each of which are discussed below. Additional information on these pension plans is included above in our discussion of Non-Union Pension Obligations under the “Contractual Obligations and Other Commercial Commitments” section, which includes specific details on our management of the investment portfolio that impacts plan assets and the assumption for the expected return, and is also available in Note 4 to the consolidated financial statements included in Part II, Item 8 of this Annual Report on Form 10-K.
Discount Rate
The discount rate refers to the interest rate used to discount the estimated future benefit payments to their present value, also referred to as the benefit obligation. The discount rate allows us to estimate what it would cost to settle the pension obligations as of the measurement date, December 31, and impacts the following year’s annual pension expense. We determine the discount rate by selecting a portfolio of high qualityhigh-quality non-callable bonds with interest payments and maturities generally consistent with our expected benefit payments.
Changes in the discount rate can impact our overall net pension asset,position on the balance sheet, however, plans to reduce the percentage of thehedge assets in our asset portfolio comprised of risk seeking assets and increasing the amount of hedge assets, workswork to partially mitigate this impact with changes in asset returns. A 100-basis-point decrease in our discount rate would increase our net pension assetposition on the consolidated balance sheet by approximately $3.7$45.4 million. That same change would decrease our net pension expense by approximately $7.9$1.2 million, driven bydue to the offsetting impact to the return on assets. The discount rate can fluctuate considerably over periods depending on overall economic conditions that impact long-term corporate bond yields. At December 31, 20202022 and 2019,2021, we used a discount rate to determine benefit obligations of 2.81%5.70% and 3.56%3.08%, respectively.
Return on Plan Assets
The assumption for expected return on plan assets represents a long-term assumption of our portfolio performance that can impact our annual pension expense. With $1,190.7$487.9 million of plan assets at December 31, 2022 for the Company’s funded pension plans, a 100-basis-point decrease in the assumption for expected rate of return on assets would increase the net annual pension expense by approximately $9.7$4.6 million and would have no effect on the overfundednet pension assets nor the underfunded pension liabilityposition reflected on the consolidated balance sheet at December 31, 2020.2022.
In determining the expected rate of return on assets, we consider our historical experience in the plans’ investment portfolio, historical market data and long-term historical relationships as well as a review of other objective indices including current market
32
factors such as inflation and interest rates. Due to the historically underfunded nature of these plans we previously managed our investment portfolio to hedge risks, but primarily focused on risk-seeking assets that would provide an opportunity to close the net funded deficit thus, the Company selected an expected rate of return on assets of 7.0% effective for the 2021 valuations. Based on the improved funded status in comparison to historic levels, which impacts the risk profile of the asset portfolio and various market factors, we selected an expected rate of return on assets of 7.0%5.0% effective for the 2020 and 2019 valuations. As detailed below, we2022 valuation. We have reviewed our expected long-term rate of return based upon several factors, including the substantial improvement to the overall funded status on our qualified and nonqualified defined benefit pension plans.
With the net funded status now fully funded we are reducing the percentage of the portfolio comprised of risk seeking assets and increasing the amount of hedge assets. As such, we have lowered our 2021 expected rate of return to 5.0% based on an improved funded position and a lower risk profile. In addition, we will continue to review our expected long-term rate of return on an annual basis and revise appropriately.those detailed above.
Plan Assets Measurement
At December 31, 2020,2022, our plan assets included $285.3$245.2 million of investments that are measured at net asset value (“NAV”) per share (or its equivalent) using the practical expedient in accordance with the fair value measurement and $45.3$27.3 million of Level 3 investments. Level 3 market values are based on inputs that are supported by little or no market activity and are significant to the fair value of the investment. These investments are subject to estimation to determine fair value which is used to determine components of our annual pension expense and the net asset.
Multi-Employer Pension Plans
We contribute to over 30 separate multi-employer pension plans for employees covered by our collective bargaining agreements (approximately 79% of total employees of Yellow Corporation and its subsidiaries). Our collective bargaining agreements with the unions determine the amount of our contributions to these plans. The pension plans provide defined benefits to retired participants. We do not directly manage the multi-employer pension plans to which we contribute. The trusts covering these plans are generally managed by trustees, half of whom the unions appoint and half of whom various contributing employers appoint.
In 2006, the Pension Protection Act (“PPA”) became law and modified both the applicable Internal Revenue Code, as it applies to multi-employer pension plans, and the Employment Retirement Income Security Act of 1974, as amended. Federal law establishes minimum funding requirements for multi-employer pension plans. The funding status of these plans is determined by many factors.
In 2014, the Multi-Employer Pension Reform Act (“MPRA”) became law which modified the ability to suspend accrued benefits of plans facing insolvency by adding a new zone status of Critical and Declining.
If any of the multi-employer pension plans that we contribute to fail to:
| •
| meet minimum funding requirements,
|
| •
| meet a required funding improvement or rehabilitation plan that the PPA may require for certain of our underfunded plans,
|
| •
| obtain from the Internal Revenue Service (“IRS”) certain changes to or a waiver of the requirements in how the applicable plan calculates its funding levels, or
|
| •
| reduce pension benefits to a level where the requirements are met,
|
we could be required to make additional contributions to these multi-employer pension plans.
If any of our multi-employer pension plans enters critical status or worse and our contributions are not sufficient to satisfy any rehabilitation plan schedule, the PPA could require us to make additional surcharge contributions to the multi-employer pension plan in the amount of five to ten percent of the existing contributions required by our labor agreement for the remaining term of the labor agreement.
If we fail to make our required contributions to a multi-employer pension plan under a funding improvement or rehabilitation plan, it would expose us to penalties including potential withdrawal liability. If the benchmarks that an applicable funding improvement or rehabilitation plan provides for a multi-employer pension plan are not met by the end of a prescribed period, the IRS could impose an excise tax on us and the plan’s other contributing employers. These excise taxes are not contributed to the deficient funds, but rather are deposited in the United States general treasury funds.
Dependingposition reflected on the amount involved, a requirement to increase contributions beyond our contractually agreed rate or the imposition of an excise tax on us could have a material adverse impact on our business, financial condition, liquidity, and results of operations.
Funded Status of the Multi-Employer Pension Plans and Contingent Withdrawal Liabilities
We receive an Annual Funding Notice and, for certain plans, a Notice of Critical Status that provide an indication of the plan’s financial health. The plan administrators and trustees of multi-employer pension plans do not, however, routinely provide us with detailed, current information regarding their financials. Much of our information regarding the plan financials historically has been (i) obtained from public filings using publicly available plan asset values, which are often dated, and (ii) based on the limited information available from plan administrators or trustees, which has not been independently validated.
Based on information obtained from public filings and from plan administrators and trustees, we believe our portion of the contingent liability in the case of a full withdrawal or termination from all of the multi-employer pension plans to which we contribute would be an estimated $8 billion on a pre-tax basis. We have no current intention of taking any action that would subject us to payment of material withdrawal liability.
We are aware that many of the multi-employer pension plans to which we contribute are in critical or critical and declining status, as further detailed in Note 4 to the consolidated financial statements included in Part II, Item 8 of this Annual Report on Form 10-K.
Revenue Recognition and Revenue-related Reserves
The Company’s revenues are primarily derived from the transportation services we provide through the delivery of goods over the duration of a shipment. Upon receipt of the bill of lading, the contract existence criteria is met as evidenced by a legally enforceable agreement between two parties where collectability is probable, thus creating the distinct performance obligation. The Company has elected to expense initial direct costs as incurred because the average shipment cycle is less than one week. The Company recognizes revenue and substantially all the purchased transportation expenses on a gross basis because we direct the use of the transportation service provided and remain responsible for the complete and proper shipment.
Inherent within our revenue recognition practices are estimates for revenue associated with shipments in transit and future adjustments to revenue and accounts receivable for collectability and billing adjustments, which are included in our consolidated balance sheets as a reduction to “Accounts receivable”.sheet.
For shipments in transit, we record revenue based on the percentage of service completed as of the period end and recognize delivery costs as incurred. The percentage of service completed for each shipment is based on how far along in the shipment cycle each shipment is in relation to standard transit days. The total revenue earned is accumulated for all shipments in transit at a particular period end and recorded as operating revenue. The magnitude of the impacts of in transit adjustment estimates to the consolidated financial statements are limited due to the short duration, generally less than one week, of the average shipment cycle.33
The Company’s revenue-related reserves will primarily consist of an allowance for doubtful accounts and rerate reserves. We record an allowance for doubtful accounts based on expected future losses. When estimating the expected future losses, we consider historical uncollectible amounts, known factors surrounding specific customers, as well as overall collection trends. Given the nature of our transportation services, future adjustments may arise which creates variability when establishing the transaction price used to recognize revenue. Rerate reserves, which are common for LTL carriers, are established during a robust process to capture incorrect ratings that require adjustment and could be identified based on many factors, including weight and commodity verifications.
Item 7A. Quantitative and Qualitative Disclosures About Market Risk
We have exposure to a variety of market risks, including the effects of interest rates, fuel prices, and foreign exchange rates.
Interest Rates
To provide adequate funding through seasonal business cycles and minimize overall borrowing costs, we utilize both fixed rate and variable rate financial instruments with varying maturities. At December 31, 2020,2022, we had approximately 19%14% of our outstanding debt at fixed rates.
The table below provides information regarding the weighted average effective interest rates on our fixed-rate debt as of December 31, 2020.2022.
| | | | | | | | | | | | | | | | | | | | | | | | | | | | |
(in millions) | | 2023 | | | 2024 | | | 2025 | | | 2026 | | | 2027 (a) | | | Thereafter | | | Total | |
Fixed-rate debt | | $ | 19.0 | | | $ | 4.4 | | | $ | 4.1 | | | $ | 0.6 | | | $ | — | | | $ | 199.0 | | | $ | 227.1 | |
Interest rate | | | 17.1 | % | | | 17.9 | % | | | 17.9 | % | | | 17.8 | % | | | 18.1 | % | | | 18.1 | % | | | |
(in millions) | | 2021 | | | 2022 | | | 2023 | | | 2024 | | | 2025 | | | Thereafter | | | Total | |
Fixed-rate debt | | $ | 2.8 | | | $ | 17.3 | | | $ | 4.9 | | | $ | 2.4 | | | $ | 0.2 | | | $ | 211.8 | | | $ | 239.4 | |
Interest rate | | | 16.7 | % | | | 16.8 | % | | | 17.3 | % | | | 17.6 | % | | | 17.7 | % | | | 18.0 | % | | | | |
Fixed-rate debt payments in 2027 and beyond and are comprised of interest payments on our lease financing obligations.
A significant portion of the outstanding variable rate debt is currently determined by various USD LIBOR rates subject to a floor of 1.0% plus fixed margins ranging from 3.5% to 7.5%. Based on a 3-month1-month USD LIBOR, a 100 basis point change in the interest rates that applied during the year to our variable rate long-term debt would not have a material impact to either our interest expense or our net income (loss) before taxes. Our evaluation of this exposure included consideration of relevant circumstances, inclusive of the 1.0% floor.
We expect
In March 2021, the UK Financial Conduct Authority (the “FCA”), which regulates the London Interbank Offered Rate, or LIBOR, issued an announcement on the future cessation or loss of representativeness of LIBOR benchmark settings currently published by ICE Benchmark Administration. That announcement confirmed that LIBOR will either cease to be provided by any administrator or will no longer be representative after December 31, 2021 for all non-USD LIBOR reference rates, and for 1W and 2M USD LIBOR and after June 30, 2023 for other USD LIBOR reference rates. The Company has historically utilized the USD LIBOR rates that are expected to be available and representative through June 30, 2023. When the USD LIBOR rate will beis discontinued during 2021 andthe Company will utilize a suitable replacement rate as outlined in our debt agreements. We do not believe that the discontinuation of LIBOR as a reference rate in our debt agreements will have a material adverse effect on our financial position or materially affect our interest expense.
Fuel Prices
The Company currently has fuel surcharge programs in place. These programs are well established within the industry and customer acceptance of fuel surcharges remains high. Since the amount of fuel surcharge is generally based on average, national diesel fuel prices and is reset weekly, our exposure to fuel price volatility is reduced. In general, under our present fuel surcharge programs, we believe that while rising fuel prices are beneficial to us and falling fuel prices are detrimental to us in the short term, the effects are mitigated over time. We cannot predict the extent to which volatile fluctuations in fuel prices will continue in the future or the extent to which fuel surcharges could be collected to offset fuel-price increases.
Foreign Exchange Rates
Revenue, operating expenses, assets and liabilities of our Canadian operations are often denominated in local currency, thereby creating limited exposure to fluctuations in exchange rates. The risks related to foreign currency exchange rates have not been and are not expected to be significant to our consolidated financial position or results of operations.
34
Item 8. Financial Statements and Supplementary Data
CONSOLIDATED BALANCE SHEETS
Yellow Corporation and Subsidiaries
| (Amounts in millions except share and per share data) | | December 31, 2020 | | | December 31, 2019 | | | December 31, 2022 | | | December 31, 2021 | |
| | | | | | | |
Assets | | | | | | | | | | | | | | |
Current Assets: | | | | | | | | | | | | | | |
Cash and cash equivalents | | $ | 439.3 | | | $ | 109.2 | | | $ | 235.1 | | | $ | 310.7 | |
Restricted amounts held in escrow | | | 38.7 | | | | 0 | | | | 3.9 | | | | 4.1 | |
Accounts receivable, less allowances of $13.8 and $11.4, respectively | | | 505.0 | | | | 464.4 | | |
Accounts receivable, less allowances of $23.7 and $13.2, respectively | | | | 599.7 | | | | 663.7 | |
Prepaid expenses and other | | | 46.8 | | | | 44.6 | | | | 75.4 | | | | 65.0 | |
Total current assets | | | 1,029.8 | | | | 618.2 | | | | 914.1 | | | | 1,043.5 | |
Property and Equipment: | | | | | | | | | | | | | | |
Cost | | | 2,795.5 | | | | 2,761.6 | | | | 3,109.0 | | | | 3,164.6 | |
Less – accumulated depreciation | | | (2,031.3 | ) | | | (1,991.3 | ) | | | (1,940.0 | ) | | | (2,032.3 | ) |
Net property and equipment | | | 764.2 | | | | 770.3 | | | | 1,169.0 | | | | 1,132.3 | |
Deferred income taxes, net | | | 0.9 | | | | 0.6 | | | | 0.3 | | | | 1.4 | |
Pension | | | 63.2 | | | | 6.1 | | | | 34.5 | | | | 40.5 | |
Operating lease right-of-use assets | | | 276.0 | | | | 386.0 | | | | 139.7 | | | | 184.8 | |
Other assets | | | 51.7 | | | | 50.4 | | | | 21.7 | | | | 23.1 | |
Total Assets | | $ | 2,185.8 | | | $ | 1,831.6 | | | $ | 2,279.3 | | | $ | 2,425.6 | |
Liabilities and Shareholders’ Deficit | | | | | | | | | | | | | | |
Current Liabilities: | | | | | | | | | | | | | | |
Accounts payable | | $ | 160.7 | | | $ | 163.7 | | | $ | 188.6 | | | $ | 178.4 | |
Wages, vacations and employee benefits | | | 214.6 | | | | 195.9 | | | | 221.4 | | | | 252.5 | |
Current operating lease liabilities | | | 114.2 | | | | 120.8 | | | | 53.1 | | | | 76.5 | |
Claims and insurance accruals | | | 108.2 | | | | 120.4 | | | | 116.6 | | | | 125.9 | |
Other accrued taxes | | | 68.6 | | | | 25.8 | | | | 27.9 | | | | 72.8 | |
Other current and accrued liabilities | | | 30.4 | | | | 21.3 | | | | 37.6 | | | | 45.7 | |
Current maturities of long-term debt | | | 4.0 | | | | 4.1 | | | | 71.8 | | | | 72.3 | |
Total current liabilities | | | 700.7 | | | | 652.0 | | | | 717.0 | | | | 824.1 | |
Other Liabilities: | | | | | | | | | | | | | | |
Long-term debt, less current portion | | | 1,221.4 | | | | 858.1 | | | | 1,466.2 | | | | 1,482.2 | |
Pension and postretirement | | | 16.7 | | | | 236.5 | | | | 134.0 | | | | 88.2 | |
Operating lease liabilities | | | 172.6 | | | | 246.3 | | | | 94.6 | | | | 118.9 | |
Claims and other liabilities | | | 297.7 | | | | 279.9 | | | | 249.0 | | | | 275.7 | |
Commitments and contingencies | | | | | | | | | | | | | | |
Shareholders’ Deficit: | | | | | | | | | | | | | | |
Cumulative preferred stock, $1 par value per share - authorized 5,000,000 shares | | | — | | | | — | | |
Common stock, $0.01 par value per share - authorized 95,000,000 shares, issued 50,192,000 and 33,715,000 shares, respectively | | | 0.5 | | | | 0.3 | | |
Cumulative preferred stock, $1 par value per share - authorized 5,000,000 shares | | | | — | | | | — | |
Common stock, $0.01 par value per share - authorized 95,000,000 shares, issued 51,601,000 and 50,955,000 shares, respectively | | | | 0.5 | | | | 0.5 | |
Capital surplus | | | 2,383.6 | | | | 2,332.9 | | | | 2,393.4 | | | | 2,388.3 | |
Accumulated deficit | | | (2,365.9 | ) | | | (2,312.4 | ) | | | (2,453.2 | ) | | | (2,475.0 | ) |
Accumulated other comprehensive loss | | | (148.8 | ) | | | (369.3 | ) | | | (229.5 | ) | | | (184.6 | ) |
Treasury stock, at cost (410 shares) | | | (92.7 | ) | | | (92.7 | ) | |
Treasury stock, at cost | | | | (92.7 | ) | | | (92.7 | ) |
Total shareholders’ deficit | | | (223.3 | ) | | | (441.2 | ) | | | (381.5 | ) | | | (363.5 | ) |
Total Liabilities and Shareholders’ Deficit | | $ | 2,185.8 | | | $ | 1,831.6 | | | $ | 2,279.3 | | | $ | 2,425.6 | |
The accompanying notes are an integral part of these statements.
35
CONSOLIDATED STATEMENTS OF CONSOLIDATED OPERATIONS
Yellow Corporation and Subsidiaries
For the Years Ended December 31
| (Amounts in millions except per share data; shares in thousands) | | 2020 | | | 2019 | | | 2018 | | | 2022 | | | 2021 | | | 2020 | |
Operating Revenue | | $ | 4,513.7 | | | $ | 4,871.2 | | | $ | 5,092.0 | | | $ | 5,244.7 | | | $ | 5,121.8 | | | $ | 4,513.7 | |
Operating Expenses: | | | | | | | | | | | | | | | | | | | | | |
Salaries, wages and employee benefits | | | 2,770.1 | | | | 2,963.7 | | | | 2,950.0 | | | | 2,808.3 | | | | 2,921.7 | | | | 2,770.1 | |
Fuel, operating expenses and supplies | | | 719.1 | | | | 889.0 | | | | 940.2 | | | | 1,076.6 | | | | 858.1 | | | | 719.1 | |
Purchased transportation | | | 638.8 | | | | 614.2 | | | | 683.2 | | | | 748.5 | | | | 800.2 | | | | 638.8 | |
Depreciation and amortization | | | 134.9 | | | | 152.4 | | | | 147.7 | | | | 143.4 | | | | 143.6 | | | | 134.9 | |
Other operating expenses | | | 239.6 | | | | 241.2 | | | | 248.8 | | | | 308.1 | | | | 293.9 | | | | 239.6 | |
Gains on property disposals, net | | | (45.3 | ) | | | (13.7 | ) | | | (20.8 | ) | |
Impairment charges | | | 0 | | | | 8.2 | | | | 0 | | |
(Gains) losses on property disposals, net | | | | (38.0 | ) | | | 0.7 | | | | (45.3 | ) |
Total operating expenses | | | 4,457.2 | | | | 4,855.0 | | | | 4,949.1 | | | | 5,046.9 | | | | 5,018.2 | | | | 4,457.2 | |
Operating Income | | | 56.5 | | | | 16.2 | | | | 142.9 | | | | 197.8 | | | | 103.6 | | | | 56.5 | |
Nonoperating Expenses: | | | | | | | | | | | | | | | | | | | | | |
Interest expense | | | 135.9 | | | | 111.2 | | | | 105.8 | | | | 162.9 | | | | 150.7 | | | | 135.9 | |
Loss on extinguishment of debt | | | 0 | | | | 11.2 | | | | 0 | | |
Non-union pension and postretirement benefits | | | (6.3 | ) | | | 3.1 | | | | 9.4 | | | | 10.5 | | | | 59.3 | | | | (6.3 | ) |
Other, net | | | 0 | | | | (1.0 | ) | | | (3.6 | ) | | | (2.1 | ) | | | (0.4 | ) | | | — | |
Nonoperating expenses, net | | | 129.6 | | | | 124.5 | | | | 111.6 | | | | 171.3 | | | | 209.6 | | | | 129.6 | |
Income (Loss) before income taxes | | | (73.1 | ) | | | (108.3 | ) | | | 31.3 | | |
Income (loss) before income taxes | | | | 26.5 | | | | (106.0 | ) | | | (73.1 | ) |
Income tax expense (benefit) | | | (19.6 | ) | | | (4.3 | ) | | | 11.1 | | | | 4.7 | | | | 3.1 | | | | (19.6 | ) |
Net Income (Loss) | | $ | (53.5 | ) | | $ | (104.0 | ) | | $ | 20.2 | | | $ | 21.8 | | | $ | (109.1 | ) | | $ | (53.5 | ) |
| | | | | | | | | | | | | | | | | | | | | |
Average Common Shares Outstanding - Basic | | | 41,694 | | | | 33,252 | | | | 32,983 | | | | 51,346 | | | | 50,720 | | | | 41,694 | |
Average Common Shares Outstanding - Diluted | | | 41,694 | | | | 33,252 | | | | 33,859 | | | | 52,233 | | | | 50,720 | | | | 41,694 | |
| | | | | | | | | | | | | | | | | | | | | |
Earnings (Loss) Per Share - Basic | | $ | (1.28 | ) | | $ | (3.13 | ) | | $ | 0.61 | | |
Earnings (Loss) Per Share - Diluted | | $ | (1.28 | ) | | $ | (3.13 | ) | | $ | 0.60 | | |
Income (Loss) Per Share - Basic | | | $ | 0.42 | | | $ | (2.15 | ) | | $ | (1.28 | ) |
Income (Loss) Per Share - Diluted | | | $ | 0.42 | | | $ | (2.15 | ) | | $ | (1.28 | ) |
The accompanying notes are an integral part of these statements.
36
CONSOLIDATED STATEMENTS OF CONSOLIDATED COMPREHENSIVE INCOME (LOSS)
Yellow Corporation and Subsidiaries
For the Years Ended December 31
| (in millions) | | 2020 | | | 2019 | | | 2018 | | | 2022 | | | 2021 | | | 2020 | |
Net income (loss) | | $ | (53.5 | ) | | $ | (104.0 | ) | | $ | 20.2 | | |
Net Income (Loss) | | | $ | 21.8 | | | $ | (109.1 | ) | | $ | (53.5 | ) |
Other comprehensive income (loss): | | | | | | | | | | | | | | | | | | | | | |
Pension, net of tax: | | | | | | | | | | | | | | | | | | | | | |
Net actuarial gains (losses) and other adjustments | | | 204.6 | | | | (51.7 | ) | | | 1.0 | | |
Settlement adjustment | | | 2.7 | | | | 1.8 | | | | 10.9 | | |
Net actuarial gains (losses) | | | | (62.4 | ) | | | (112.7 | ) | | | 204.6 | |
Settlement adjustments | | | | 12.1 | | | | 64.7 | | | | 2.7 | |
Amortization of prior net losses | | | 12.7 | | | | 12.9 | | | | 14.6 | | | | 8.6 | | | | 12.1 | | | | 12.7 | |
Amortization of prior net service credit | | | (0.4 | ) | | | (0.4 | ) | | | (0.4 | ) | | | (0.4 | ) | | | (0.4 | ) | | | (0.4 | ) |
Changes in foreign currency translation | | | 0.9 | | | | 0.4 | | | | (2.6 | ) | |
Changes in foreign currency translation, net of tax | | | | (2.8 | ) | | | 0.5 | | | | 0.9 | |
Other comprehensive income (loss) | | | 220.5 | | | | (37.0 | ) | | | 23.5 | | | | (44.9 | ) | | | (35.8 | ) | | | 220.5 | |
Comprehensive income (loss) | | $ | 167.0 | | | $ | (141.0 | ) | | $ | 43.7 | | |
Comprehensive Income (Loss) | | | $ | (23.1 | ) | | $ | (144.9 | ) | | $ | 167.0 | |
The accompanying notes are an integral part of these statements.
37
CONSOLIDATED STATEMENTS OF CONSOLIDATED CASH FLOWS
Yellow Corporation and Subsidiaries
For the Years Ended December 31
(in millions) | | 2020 | | | 2019 | | | 2018 | |
Operating Activities: | | | | | | | | | | | | |
Net income (loss) | | $ | (53.5 | ) | | $ | (104.0 | ) | | $ | 20.2 | |
Adjustments to reconcile net income (loss) to cash flows from operating activities: | | | | | | | | | | | | |
Depreciation and amortization | | | 134.9 | | | | 152.4 | | | | 147.7 | |
Lease amortization and accretion expense | | | 160.9 | | | | 168.0 | | | | 0 | |
Lease payments | | | (135.0 | ) | | | (155.1 | ) | | | 0 | |
Paid-in-kind interest | | | 42.4 | | | | 0 | | | | 0 | |
Debt-related amortization | | | 17.5 | | | | 6.7 | | | | 2.7 | |
Equity-based compensation and employee benefits expense | | | 21.8 | | | | 18.6 | | | | 20.3 | |
Non-union pension settlement charge | | | 3.6 | | | | 1.8 | | | | 10.9 | |
Gains on property disposals, net | | | (45.3 | ) | | | (13.7 | ) | | | (20.8 | ) |
Loss on extinguishment of debt | | | 0 | | | | 11.2 | | | | 0 | |
Impairment charges | | | 0 | | | | 8.2 | | | | 0 | |
Deferred income tax benefit, net | | | (14.9 | ) | | | (3.0 | ) | | | (1.1 | ) |
Other noncash items, net | | | 0.9 | | | | (0.3 | ) | | | 2.2 | |
Changes in assets and liabilities, net: | | | | | | | | | | | | |
Accounts receivable | | | (40.4 | ) | | | 7.1 | | | | 16.6 | |
Accounts payable | | | (3.6 | ) | | | (14.8 | ) | | | 6.1 | |
Other operating assets | | | (23.9 | ) | | | (1.5 | ) | | | 5.4 | |
Other operating liabilities | | | 57.1 | | | | (60.1 | ) | | | 14.6 | |
Net cash provided by operating activities | | | 122.5 | | | | 21.5 | | | | 224.8 | |
Investing Activities: | | | | | | | | | | | | |
Acquisition of property and equipment | | | (140.6 | ) | | | (143.2 | ) | | | (145.4 | ) |
Proceeds from disposal of property and equipment | | | 56.1 | | | | 25.9 | | | | 36.4 | |
Net cash used in investing activities | | | (84.5 | ) | | | (117.3 | ) | | | (109.0 | ) |
Financing Activities: | | | | | | | | | | | | |
Issuance of long-term debt, net | | | 374.8 | | | | 570.0 | | | | 0 | |
Repayment of long-term debt | | | (31.4 | ) | | | (579.0 | ) | | | (31.9 | ) |
Debt issuance costs | | | (12.0 | ) | | | (12.7 | ) | | | 0 | |
Payments for tax withheld on equity-based compensation | | | (0.6 | ) | | | (0.9 | ) | | | (2.0 | ) |
Net cash provided by (used in) financing activities | | | 330.8 | | | | (22.6 | ) | | | (33.9 | ) |
Net Increase (Decrease) In Cash and Cash Equivalents and Restricted Amounts Held in Escrow | | | 368.8 | | | | (118.4 | ) | | | 81.9 | |
Cash and Cash Equivalents and Restricted Amounts Held in Escrow, Beginning of Year | | | 109.2 | | | | 227.6 | | | | 145.7 | |
Cash and Cash Equivalents and Restricted Amounts Held in Escrow, End of Year | | $ | 478.0 | | | $ | 109.2 | | | $ | 227.6 | |
Supplemental Cash Flow Information: | | | | | | | | | | | | |
Interest paid | | $ | (67.6 | ) | | $ | (106.8 | ) | | $ | (101.2 | ) |
Letter of credit fees paid | | | (7.1 | ) | | | (6.8 | ) | | | (7.0 | ) |
Income tax paid | | | (1.2 | ) | | | (3.7 | ) | | | (5.5 | ) |
| | | | | | | | | | | | |
(in millions) | | 2022 | | | 2021 | | | 2020 | |
Operating Activities: | | | | | | | | | |
Net income (loss) | | $ | 21.8 | | | $ | (109.1 | ) | | $ | (53.5 | ) |
Adjustments to reconcile net income (loss) to cash flows from operating activities: | | | | | | | | | |
Depreciation and amortization | | | 143.4 | | | | 143.6 | | | | 134.9 | |
Lease amortization and accretion expense | | | 95.7 | | | | 133.3 | | | | 160.9 | |
Lease payments | | | (98.8 | ) | | | (134.4 | ) | | | (135.0 | ) |
Paid-in-kind interest | | | 12.8 | | | | 9.3 | | | | 42.4 | |
Debt-related amortization | | | 23.6 | | | | 22.9 | | | | 17.5 | |
Equity-based compensation and employee benefits expense | | | 13.5 | | | | 16.1 | | | | 21.8 | |
Non-union pension settlement charges | | | 12.1 | | | | 64.7 | | | | 3.6 | |
(Gains) losses on property disposals, net | | | (38.0 | ) | | | 0.7 | | | | (45.3 | ) |
Deferred income taxes, net | | | (0.4 | ) | | | (0.5 | ) | | | (14.9 | ) |
Other non-cash items, net | | | (1.2 | ) | | | 0.7 | | | | 0.9 | |
Changes in assets and liabilities, net: | | | | | | | | | |
Accounts receivable | | | 64.0 | | | | (158.7 | ) | | | (40.4 | ) |
Accounts payable | | | 7.8 | | | | 16.8 | | | | (3.6 | ) |
Other operating assets | | | (15.5 | ) | | | (28.1 | ) | | | (23.9 | ) |
Other operating liabilities | | | (119.5 | ) | | | 32.9 | | | | 57.1 | |
Net cash provided by (used in) operating activities | | | 121.3 | | | | 10.2 | | | | 122.5 | |
Investing Activities: | | | | | | | | | |
Acquisition of property and equipment | | | (191.8 | ) | | | (497.6 | ) | | | (140.6 | ) |
Proceeds from disposal of property and equipment | | | 45.7 | | | | 3.6 | | | | 56.1 | |
Net cash provided by (used in) investing activities | | | (146.1 | ) | | | (494.0 | ) | | | (84.5 | ) |
Financing Activities: | | | | | | | | | |
Issuance of long-term debt, net | | | — | | | | 325.2 | | | | 374.8 | |
Repayment of long-term debt | | | (48.4 | ) | | | (3.8 | ) | | | (31.4 | ) |
Debt issuance costs | | | (1.7 | ) | | | (0.2 | ) | | | (12.0 | ) |
Payments for tax withheld on equity-based compensation | | | (0.9 | ) | | | (0.6 | ) | | | (0.6 | ) |
Net cash provided by (used in) financing activities | | | (51.0 | ) | | | 320.6 | | | | 330.8 | |
Net Increase (Decrease) In Cash and Cash Equivalents and Restricted Amounts Held in Escrow | | | (75.8 | ) | | | (163.2 | ) | | | 368.8 | |
Cash and Cash Equivalents and Restricted Amounts Held in Escrow, Beginning of Period | | | 314.8 | | | | 478.0 | | | | 109.2 | |
Cash and Cash Equivalents and Restricted Amounts Held in Escrow, End of Period | | $ | 239.0 | | | $ | 314.8 | | | $ | 478.0 | |
| | | | | | | | | | | | |
Supplemental Cash Flow Information: | | | | | | | | | |
Interest paid | | $ | (127.4 | ) | | $ | (116.8 | ) | | $ | (67.6 | ) |
The accompanying notes are an integral part of these statements.
38
CONSOLIDATED STATEMENTS OF CONSOLIDATED SHAREHOLDERS’ DEFICIT
Yellow Corporation and Subsidiaries
For the Years Ended December 31
| | Preferred Stock | | Common Stock | | Capital Surplus | | Accumulated Deficit | | Accumulated Other Comprehensive Loss | | Treasury Stock, At Cost | | Total Shareholders' Deficit | |
Balances at December 31, 2017 | | $ | 0 | | $ | 0.3 | | $ | 2,323.3 | | $ | (2,228.6 | ) | $ | (355.8 | ) | $ | (92.7 | ) | $ | (353.5 | ) |
Equity-based compensation | | | 0 | | | — | | | 4.3 | | | — | | | — | | | — | | | 4.3 | |
Net income | | | — | | | — | | | — | | | 20.2 | | | — | | | — | | | 20.2 | |
Pension, net of tax: | | | | | | | | | | | | | | | | | | | | | | |
Amortization of prior net losses | | | 0 | | | — | | | — | | | — | | | 14.6 | | | — | | | 14.6 | |
Amortization of prior service credit | | | 0 | | | — | | | — | | | — | | | (0.4 | ) | | — | | | (0.4 | ) |
Settlement adjustment | | | — | | | — | | | — | | | — | | | 10.9 | | | — | | | 10.9 | |
Net actuarial gain (loss) | | | — | | | — | | | — | | | — | | | 1.0 | | | — | | | 1.0 | |
Foreign currency translation | | | — | | | — | | | — | | | — | | | (2.6 | ) | | — | | | (2.6 | ) |
Balances at December 31, 2018 | | $ | 0 | | $ | 0.3 | | $ | 2,327.6 | | $ | (2,208.4 | ) | $ | (332.3 | ) | $ | (92.7 | ) | $ | (305.5 | ) |
Equity-based compensation | | | 0 | | | — | | | 5.3 | | | — | | | — | | | — | | | 5.3 | |
Net loss | | | 0 | | | — | | | — | | | (104.0 | ) | | — | | | — | | | (104.0 | ) |
Pension, net of tax: | | | | | | | | | | | | | | | | | | | | | | |
Amortization of prior net losses | | | 0 | | | — | | | — | | | — | | | 12.9 | | | — | | | 12.9 | |
Amortization of prior service credit | | | 0 | | | — | | | — | | | — | | | (0.4 | ) | | — | | | (0.4 | ) |
Settlement adjustment | | | 0 | | | — | | | — | | | — | | | 1.8 | | | — | | | 1.8 | |
Net actuarial gain (loss) | | | — | | | — | | | — | | | — | | | (51.7 | ) | | — | | | (51.7 | ) |
Foreign currency translation | | | — | | | — | | | — | | | — | | | 0.4 | | | — | | | 0.4 | |
Balances at December 31, 2019 | | $ | 0 | | $ | 0.3 | | $ | 2,332.9 | | $ | (2,312.4 | ) | $ | (369.3 | ) | $ | (92.7 | ) | $ | (441.2 | ) |
Equity-based compensation | | | 0 | | | — | | | 4.2 | | | — | | | — | | | — | | | 4.2 | |
Equity issuance - UST commitment fee | | | — | | | 0.2 | | | 46.5 | | | — | | | — | | | — | | | 46.7 | |
Net loss | | | 0 | | | — | | | — | | | (53.5 | ) | | — | | | — | | | (53.5 | ) |
Pension, net of tax: | | | | | | | | | | | | | | | | | | | | | | |
Amortization of prior net losses | | | 0 | | | — | | | — | | | — | | | 12.7 | | | — | | | 12.7 | |
Amortization of prior service credit | | | 0 | | | — | | | — | | | — | | | (0.4 | ) | | — | | | (0.4 | ) |
Settlement adjustment | | | 0 | | | — | | | — | | | — | | | 2.7 | | | — | | | 2.7 | |
Net actuarial gain (loss) | | | — | | | — | | | — | | | — | | | 204.6 | | | — | | | 204.6 | |
Foreign currency translation | | | — | | | — | | | — | | | — | | | 0.9 | | | — | | | 0.9 | |
Balances at December 31, 2020 | | $ | 0 | | $ | 0.5 | | $ | 2,383.6 | | $ | (2,365.9 | ) | $ | (148.8 | ) | $ | (92.7 | ) | $ | (223.3 | ) |
| | | | | | | | | | | | | | | | | | | | | | |
(in millions) | | Preferred Stock | | Common Stock | | Capital Surplus | | Accumulated Deficit | | Accumulated Other Comprehensive Loss | | Treasury Stock, At Cost | | Total Shareholders' Deficit | |
Balances at December 31, 2019 | | $ | — | | $ | 0.3 | | $ | 2,332.9 | | $ | (2,312.4 | ) | $ | (369.3 | ) | $ | (92.7 | ) | $ | (441.2 | ) |
Equity-based compensation | | | — | | | — | | | 4.2 | | | — | | | — | | | — | | | 4.2 | |
Equity issuance - UST commitment fee | | | — | | | 0.2 | | | 46.5 | | | — | | | — | | | — | | | 46.7 | |
Net loss | | | — | | | — | | | — | | | (53.5 | ) | | — | | | — | | | (53.5 | ) |
Pension, net of tax: | | | | | | | | | | | | | | | |
Amortization of prior net losses | | | — | | | — | | | — | | | — | | | 12.7 | | | — | | | 12.7 | |
Amortization of prior service credit | | | — | | | — | | | — | | | — | | | (0.4 | ) | | — | | | (0.4 | ) |
Settlement adjustment | | | | | | | | | | | 2.7 | | | | | 2.7 | |
Net actuarial gain | | | | | | | | | | | 204.6 | | | | | 204.6 | |
Foreign currency translation, net of tax | | | — | | | — | | | — | | | — | | | 0.9 | | | — | | | 0.9 | |
Balances at December 31, 2020 | | $ | — | | $ | 0.5 | | $ | 2,383.6 | | $ | (2,365.9 | ) | $ | (148.8 | ) | $ | (92.7 | ) | $ | (223.3 | ) |
Equity-based compensation | | | — | | | — | | | 4.7 | | | — | | | — | | | — | | | 4.7 | |
Net loss | | | — | | | — | | | — | | | (109.1 | ) | | — | | | — | | | (109.1 | ) |
Pension, net of tax: | | | | | | | | | | | | | | | |
Amortization of prior net losses | | | — | | | — | | | — | | | — | | | 12.1 | | | — | | | 12.1 | |
Amortization of prior service credit | | | — | | | — | | | — | | | — | | | (0.4 | ) | | — | | | (0.4 | ) |
Settlement adjustment | | | — | | | — | | | — | | | — | | | 64.7 | | | — | | | 64.7 | |
Net actuarial loss | | | | | | | | | | | (112.7 | ) | | | | (112.7 | ) |
Foreign currency translation, net of tax | | | — | | | — | | | — | | | — | | | 0.5 | | | — | | | 0.5 | |
Balances at December 31, 2021 | | $ | — | | $ | 0.5 | | $ | 2,388.3 | | $ | (2,475.0 | ) | $ | (184.6 | ) | $ | (92.7 | ) | $ | (363.5 | ) |
Equity-based compensation | | | — | | | — | | | 5.1 | | | — | | | — | | | — | | | 5.1 | |
Net income | | | — | | | — | | | — | | | 21.8 | | | — | | | — | | | 21.8 | |
Pension, net of tax: | | | | | | | | | | | | | | | |
Amortization of prior net losses | | | — | | | — | | | — | | | — | | | 8.6 | | | — | | | 8.6 | |
Amortization of prior service credit | | | — | | | — | | | — | | | — | | | (0.4 | ) | | — | | | (0.4 | ) |
Settlement adjustment | | | — | | | — | | | — | | | — | | | 12.1 | | | — | | | 12.1 | |
Net actuarial loss | | | — | | | — | | | — | | | — | | | (62.4 | ) | | — | | | (62.4 | ) |
Foreign currency translation, net of tax | | | — | | | — | | | — | | | — | | | (2.8 | ) | | — | | | (2.8 | ) |
Balances at December 31, 2022 | | $ | — | | $ | 0.5 | | $ | 2,393.4 | | $ | (2,453.2 | ) | $ | (229.5 | ) | $ | (92.7 | ) | $ | (381.5 | ) |
The accompanying notes are an integral part of these statements.
39
NOTES TO CONSOLIDATED FINANCIAL STATEMENTS
Yellow Corporation and Subsidiaries
1. Description of Business
Yellow Corporation (also referred to as “Yellow,” the “Company,” “we,” “us” or “our”) is a holding company that, through its operating subsidiaries, offers its customers a wide range of transportation services. In February 2021, YRC Worldwide Inc. completed a name change to Yellow Corporation. We have one of the largest, most comprehensive less-than-truckload (“LTL”) networks in North America with local, regional, national and international capabilities. Through our team of experienced service professionals, we offer expertise in LTL shipments and flexible supply chain solutions, ensuring customers can ship industrial, commercial and retail goods with confidence.
Yellow Corporation provides for the movement of industrial, commercial and retail goods through our LTL subsidiaries including USF Holland LLC (“Holland”), New Penn Motor Express LLC (“New Penn”), USF Reddaway Inc. (“Reddaway”), YRC Inc. and YRC Freight Canada Company (both doing business as, and herein referred to as, “YRC Freight”). Our LTL companies provide regional, national and international services through a consolidated network of facilities located primarily across the United States Canada, and Puerto Rico.Canada. We also offer services through HNRYYellow Logistics, Inc. (“HNRYYellow Logistics”), our customer-specific logistics solutions provider, specializing in truckload, residential, and warehouse solutions.
As of December 31, 2020, approximately 79% of ourThe Company's labor force is subject to collective bargaining agreements, which predominantly expire on March 31, 2024.
2. Accounting Policies
Accounting policies refer to specific accounting principles and the methods of applying those principles to fairly present our financial position and results of operations in accordance with generally accepted accounting principles. The policies discussed below include those that management has determined to be the most appropriate in preparing our consolidated financial statements.
Basis of Presentation
The accompanying consolidated financial statements include the accounts of Yellow Corporation and its wholly owned subsidiaries. All significant intercompany accounts and transactions have been eliminated in consolidation. We report on a calendar year basis. The quarters of Holland and Reddaway consist of thirteen weeks that end on a Saturday either before or after the end of March, June and September, whereas all other operating company quarters end on the natural calendar quarter end.
Use of Estimates
Management makes estimates and assumptions when preparing the financial statements in conformity with U.S. generally accepted accounting principles which affect the amounts reported in the financial statements and accompanying notes. Actual results could differ from those estimates.
Reclassifications
Certain reclassifications have been made to prior year’s balances to conform with current year presentation.
Segments and Disaggregation of Revenue
The Company provides LTL services through a single integrated organization based upon the joining of our national and regional operations during the enterprise transformation. The Company’s revenue is primarily derived from transporting LTL shipments in North America and specifically in the United States, andbut we also offer other services such as truckload services, customer specific logistics solutions, as discussed above, and other services. The Chief Operating Decision Maker (“CODM”) is the Chief Executive Officer who manages the business, regularly reviews financial information and allocates resources. Our CODM began evaluating performance and business results, as well as making resource and operating decisions under the single segment view as a result of the business transformation that began during 2019.services (collectively "Other revenue" in table below).
As such, theThe Company has determined it has 1one reporting segment and the composition of our revenue is summarized below with LTL shipments defined as shipments less than 10,000 pounds that move in our network.
Consolidated (in millions) | | 2020 | | | 2019 | | | 2018 | |
LTL revenue | | $ | 4,093.3 | | | $ | 4,494.0 | | | $ | 4,690.6 | |
Other revenue | | | 420.4 | | | | 377.2 | | | | 401.4 | |
Total revenue | | $ | 4,513.7 | | | $ | 4,871.2 | | | $ | 5,092.0 | |
| | | | | | | | | | | | |
(in millions) | | Year Ended December 31, 2022 | | | Year Ended December 31, 2021 | | | Year Ended December 31, 2020 | |
LTL revenue | | $ | 4,719.3 | | | $ | 4,605.9 | | | $ | 4,093.3 | |
Other revenue(a) | | | 525.4 | | | | 515.9 | | | | 420.4 | |
Total revenue | | $ | 5,244.7 | | | $ | 5,121.8 | | | $ | 4,513.7 | |
(a)Other revenue is primarily comprised of truckload shipments.
Cash and Cash Equivalents
Cash and cash equivalents include demand deposits and highly liquid investments purchased with maturities of three months or less. Under the Company’s cash management system, checks issued but not presented to banks frequently result in book overdraft balances for accounting purposes which are classified within accounts payable in the accompanying consolidated balance sheets. The change in book overdrafts areis reported as a component of operating cash flows for accounts payable as they do not represent bank overdrafts.
40
Fair Value of Financial Instruments
From timeFair value is defined as the price that would be received to time, we hold financial assets heldsell an asset or paid to transfer a liability in an orderly transaction between market participants at the measurement date. The levels of inputs used to measure fair value are:
•Level 1 — Quoted prices for identical instruments in active markets;
•Level 2 — Quoted prices for similar instruments in active markets; quoted prices for identical or similar instruments in markets that are not active; and model-derived valuations in which consistsall significant inputs are observable in active markets; and
•Level 3 — Valuations based on inputs that are unobservable, generally utilizing pricing models or other valuation techniques that reflect management’s judgment and estimates.
The carrying value of restricted cash heldand cash equivalents, accounts receivable and accounts payable approximates their fair value due to the short-term nature of these instruments.
The fair value of our long-term debt is included in escrow. Note 5 to the Consolidated Financial Statements.
The fair value of our pension plan assets is included in Note 4 to the Consolidated Financial Statements.
Restricted cash amounts held in escrow are either cash or, at times, invested in money market accounts and are recorded at fair value based on quoted market prices and have typically been level 1 fair value assets. Assets are considered level 1 if their valuations are based on quoted prices in active markets for identical assets or liabilities that the entity has the ability to access. As of December 31, 20202022 and 20192021 we had $38.7$3.9 million and 0$4.1 million restricted amounts held in escrow, respectively. The carrying value of cash
Credit and cash equivalents, accounts receivable and accounts payable approximates their fair value due to the short-term nature of these instruments.Other Concentration Risks
The fair value of our long-term debt is included in Note 5 to the consolidated financial statements.
Concentration of Credit Risks and Other
We sellprovide services and extend credit based on an evaluation of the customer’s financial condition, without requiring collateral. Exposure to losses on receivables is principally dependent on each customer’s financial condition. We monitor our exposure for credit losses and maintain allowances for anticipated losses.
At December 31, 2020,2022, approximately 79%82% of our labor force was subject to collective bargaining agreements. In 2019, we agreed to a new labor agreement that, among other things, extendextended the expiration date of our primary labor agreement from March 31, 2019 to March 31, 2024. ThisThe agreement also updated the contribution rates under the multi-employer pension planplans to which we contribute.contribute as discussed in Note 4 to the consolidated financial statements. The newcurrent agreement providedprovides for wage and benefits increases through the term of the agreement. Finally, the new agreement providedprovides for certain changes to work rules and our use of purchased transportation.
Revenue Recognition and Revenue-related Reserves
The Company’s revenues are primarily derived from the transportation services we provide through the delivery of goods over the duration of a shipment. Upon receipt of theThe bill of lading the contract existence criteria is met as evidenced by a legally enforceable agreement between two parties, and where collectability is probable thus creatingthis document serves as the distinct performance obligation.contract as our basis to recognized revenue under ASC 606- Revenue Recognition. The Company has elected to expense initial direct costs as incurred because the average shipment cycle is less than one week. The Company recognizes revenue and substantially all the purchased transportation expenses on a gross basis becauseas we control the service provided to our customer. We direct the use of the transportation service provided and remain responsible for the complete and proper shipment. We recognize revenue for our performance obligations under our customer contracts over time, as our customers receive the benefits of our services in accordance with ASC 606- Revenue Recognition.
Inherent within our revenue recognition practices are estimates for revenue associated with shipments in transit and future adjustments to revenue and accounts receivable for collectability and billing adjustments, which are included in our consolidated balance sheets as a reduction to “Accounts receivable”.
transit. For shipments in transit, we record revenue based on the percentage of service completed as of the period end and recognize delivery costs as incurred. The percentage of service completed for each shipment is based on how far along in the shipment cycle each shipment is in relation to standard transit days. The totalestimated portion of revenue earned is accumulated for all shipments in transit is accumulated at a particular period end and recordedrecognized as operating revenue. The magnitude of the impactssignificance of in transit adjustment estimatesshipments to the consolidated financial statements areis limited due to the short duration, generally less than one week, of the average shipment cycle. At December 31, 2022 and 2021, our consolidated financial statements included reductions to operating revenue and accounts receivable to reflect in transit shipments of $32.3 million and $41.3 million, respectively.
The Company’s revenue-related
41
Revenue-related Reserves
Given the nature of our transportation services, adjustments may arise which create variability when establishing the transaction price used to recognize revenue. We have a high volume of performance obligations with similar characteristics; therefore we primarily use historical trends to arrive at estimated reserves. Rerate reserves, will primarily consistwhich are common for LTL carriers, are established during a process to capture initial ratings that may require adjustment and may be identified based on many factors, including subsequent weight and commodity verifications. Although the majority of an allowance for doubtfulrerating occurs in the same month as the original rating, a portion occurs during subsequent periods. At December 31, 2022 and 2021, our consolidated financial statements included a rerate reserve as a reduction to revenue and accounts receivable of $22.5 million and rerate reserves. $14.1 million, respectively.
Expected Credit Losses
We record an allowance for doubtful accountsexpected credit losses based on expected future losses. When estimating the expected future losses, we consider historical uncollectible amounts, known factors surrounding specific customers, as well as overall collection trends. Given the nature of our transportation services, future adjustments may arise which creates variability when establishing the transaction price used to recognize revenue. Rerate reserves, which are common for LTL carriers, are established during a robust process to capture incorrect ratings that require adjustment and could be identified based on many factors, including weight and commodity verifications. Our allowance for doubtful accountsexpected credit losses totaled $13.8$23.7 million and $11.4$13.2 million as of December 31, 20202022 and 2019,2021, respectively.
Given the nature of our transportation services, future adjustments may arise which creates variability when establishing the transaction price used to recognize revenue. We have a high volume of performance obligations with similar characteristics, therefore we primarily use historical trends to arrive at estimated reserves. Although the majority of rerating occurs in the same month as the original rating, a portion occurs during subsequent periods. At December 31, 2020 and 2019, our consolidated financial statements included a rerate reserve as a reduction to “Accounts Receivable” of $12.6 million and $7.9 million, respectively.
For shipments in transit, we record revenue based on the percentage of service completed as of the period end and recognize delivery costs as incurred. The percentage of service completed for each shipment is based on how far along in the shipment cycle each shipment is in relation to standard transit days. At December 31, 2020 and 2019, our consolidated financial statements included deferred revenue as a reduction to “Accounts Receivable” of $31.9 million and $25.2 million, respectively.
Beginning January 1, 2018, the Company adopted ASU 2014-09, Revenue from Contracts with Customers
using a modified retrospective approach. There was no cumulative effect adjustment recorded.
Self-Insurance Accruals for Claims
Claims and insurance accruals, both current and long-term, primarily reflect the estimated settlement cost of claims for workers’ compensation and property damage and liability claims (also referred to as third-party liability claims), and include cargo loss and damage not covered by insurance. We establish and modify reserve estimates for workers’ compensation and property damage andthird-party liability claims primarily based upon actuarial analyses prepared by independent actuaries. These reserves are discounted to present value using a risk-free rate based on the year of occurrence. The risk-free rate is the U.S. Treasury rate for maturities that match the expected payout of such claims and was 0.5%2.8%, 2.0%0.4% and 2.6%0.5% for workers’ compensation claims incurred as of December 31, 2020, 20192022, 2021 and 2018,2020, respectively. The rate was 0.5%2.7%, 2.1%0.2% and 2.5%0.5% for property damage andthird-party liability claims incurred as of December 31, 2020, 20192022, 2021 and 2018,2020, respectively. The process of determining reserve requirements utilizes historical trendsloss development factors and involves an evaluation of accident frequency and severity, claims management, changes in health care costs and certain future administrative costs. The effect of future inflation for costs is considered in the actuarial analysis. Adjustments to previously established reserves are included in operating results in the year of adjustment.
Expected aggregate undiscounted amounts and material changes to these amounts related to workers’ compensation and property damage and liability claims, or third-party liability claims, as of December 31 are presented below:
| (in millions) | | Workers’ Compensation | | | Third-Party Liability Claims | | | Total | | | Workers’
Compensation | | | Third-Party
Liability
Claims | | | Total | |
Undiscounted settlement cost estimate at December 31, 2018 | | $ | 287.8 | | | $ | 73.6 | | | $ | 361.4 | | |
Estimated settlement cost for 2019 claims | | | 103.3 | | | | 35.2 | | | | 138.5 | | |
Undiscounted settlement cost estimate at December 31, 2020 | | | $ | 275.2 | | | $ | 70.0 | | | | 345.2 | |
Estimated settlement cost for 2021 claims | | | | 92.4 | | | | 38.1 | | | | 130.5 | |
Claim payments, net of recoveries | | | (95.9 | ) | | | (36.1 | ) | | | (132.0 | ) | | | (94.8 | ) | | | (41.0 | ) | | | (135.8 | ) |
Change in estimated settlement cost for prior claim years | | | (9.6 | ) | | | 1.1 | | | | (8.5 | ) | | | (5.5 | ) | | | 38.6 | | | | 33.1 | |
Undiscounted settlement cost estimate at December 31, 2019 | | $ | 285.6 | | | $ | 73.8 | | | $ | 359.4 | | |
Estimated settlement cost for 2020 claims | | | 95.0 | | | | 36.4 | | | | 131.4 | | |
Undiscounted settlement cost estimate at December 31, 2021 | | | $ | 267.3 | | | $ | 105.7 | | | $ | 373.0 | |
Estimated settlement cost for 2022 claims | | | | 84.3 | | | | 36.6 | | | | 120.9 | |
Claim payments, net of recoveries | | | (88.1 | ) | | | (53.6 | ) | | | (141.7 | ) | | | (86.5 | ) | | | (76.8 | ) | | | (163.3 | ) |
Change in estimated settlement cost for prior claim years | | | (17.3 | ) | | | 13.4 | | | | (3.9 | ) | | | (20.4 | ) | | | 36.9 | | | | 16.5 | |
Undiscounted settlement cost estimate at December 31, 2020 | | $ | 275.2 | | | $ | 70.0 | | | $ | 345.2 | | |
Discounted settlement cost estimate at December 31, 2020 | | $ | 254.9 | | | $ | 68.4 | | | $ | 323.3 | | |
Undiscounted settlement cost estimate at December 31, 2022 | | | $ | 244.7 | | | $ | 102.4 | | | $ | 347.1 | |
Discounted settlement cost estimate at December 31, 2022 | | | $ | 225.7 | | | $ | 99.5 | | | $ | 325.2 | |
In addition to the amounts above, accrued settlement cost amounts for cargo claims and other insurance related amounts, none of which are discounted, totaled $11.1$16.4 million and $13.7$17.1 million at December 31, 20202022 and 2019,2021, respectively.
42
Estimated cash payments to settle claims, exclusive of cargo claims, which were incurred on or before December 31, 2020,2022, for the next five years and thereafter are as follows:
| | | | | | | | | | | | |
(in millions) | | Workers’
Compensation | | | Third-Party
Liability
Claims | | | Total | |
2023 | | $ | 70.0 | | | $ | 36.2 | | | $ | 106.2 | |
2024 | | | 43.3 | | | | 27.7 | | | | 71.0 | |
2025 | | | 28.1 | | | | 18.0 | | | | 46.1 | |
2026 | | | 18.2 | | | | 10.8 | | | | 29.0 | |
2027 | | | 13.2 | | | | 5.5 | | | | 18.7 | |
Thereafter | | | 71.9 | | | | 4.2 | | | | 76.1 | |
Total | | $ | 244.7 | | | $ | 102.4 | | | $ | 347.1 | |
(in millions) | | Workers’ Compensation | | | Third-Party Liability Claims | | | Total | |
2021 | | $ | 78.1 | | | $ | 24.9 | | | $ | 103.0 | |
2022 | | | 47.4 | | | | 19.9 | | | | 67.3 | |
2023 | | | 31.3 | | | | 12.3 | | | | 43.6 | |
2024 | | | 20.6 | | | | 6.9 | | | | 27.5 | |
2025 | | | 14.9 | | | | 3.0 | | | | 17.9 | |
Thereafter | | | 82.9 | | | | 3.0 | | | | 85.9 | |
Total | | $ | 275.2 | | | $ | 70.0 | | | $ | 345.2 | |
Equity-Based Compensation
We have various equity-based employee compensation plans, which are described more fully in Note 7 to our consolidated financial statements. We recognize compensation costs for non-vested shares based on the grant date fair value. For our equity grants, with no performance requirement, we recognize compensation cost on a straight-line basis over the requisite service period based on the grant-date fair value. For our performance-based awards, the Company expenses the grant date fair value of the awards which are probable of being earned in the performance period over the respective service period.
Property and Equipment
The following is a summary of the components of our property and equipment at cost at December 31:
| | | | | | | | |
(in millions) | | 2022 | | | 2021 | |
Land | | $ | 230.7 | | | $ | 235.4 | |
Structures | | | 782.8 | | | | 798.0 | |
Revenue equipment | | | 1,455.2 | | | | 1,537.1 | |
Technology equipment and software | | | 412.9 | | | | 372.3 | |
Other, including miscellaneous field operations equipment | | | 227.4 | | | | 221.8 | |
Total property and equipment, at cost | | $ | 3,109.0 | | | $ | 3,164.6 | |
(in millions) | | 2020 | | | 2019 | |
Land | | $ | 235.7 | | | $ | 239.9 | |
Structures | | | 780.3 | | | | 788.4 | |
Revenue equipment | | | 1,236.8 | | | | 1,228.2 | |
Technology equipment and software | | | 321.5 | | | | 291.7 | |
Other, including miscellaneous field operations equipment | | | 221.2 | | | | 213.4 | |
Total property and equipment, at cost | | $ | 2,795.5 | | | $ | 2,761.6 | |
We carry property and equipment at cost less accumulated depreciation. We compute depreciation using the straight-line method based on the following service lives:
| | Years
|
Structures
|
| 10 - 30
| Years |
Revenue equipment
| Structures |
| 10 - 2030 |
Revenue equipment |
| 10 - 20 |
Technology equipment and software | |
| 3 - 7 |
Other | |
| 3 - 10 |
For the years ended December 31, 2020, 20192022, 2021 and 2018,2020, depreciation expense was $133.0$136.9 million, $150.5$137.1 million and $145.9$133.0 million, respectively.
We charge maintenance and repairs to expense as incurred and betterments are capitalized. The cost of replacement tires is expensed at the time those tires are placed into service, as is the case with other repair and maintenance costs. Leasehold improvements are capitalized and amortized over the shorter of their useful lives or the remaining lease term.
Our capital expenditures forfocus primarily on the years ended December 31, 2020replacement of revenue equipment, investments in information technology and 2019 were $140.6 millionimprovements to land and $143.2 million, respectively. These amounts were principally used to fund the purchase of used tractors and trailers, refurbish engines for our revenue fleet, acquire containers and improve our technology infrastructure.
structures. In addition to purchasing new revenue equipment, we also rebuild the engines of our tractors (at certain time or mile intervals). Because rebuilding an engine increases its useful life, we capitalize these costs and depreciate over the remaining useful life of the unit. The cost of engines on newly acquired revenue equipment is capitalized and depreciated over the estimated useful life of the related equipment.
Our investment in technology equipment and software consists primarily of freight movement, automation, administrative, and related software. The Company capitalizes certain costs associated with developing or obtaining internal-use software. Capitalizable costs include external direct costs of materials and services utilized in developing or obtaining the software and payroll and payroll-related costs for employees directly associated with the development of the project.
43
Long-lived assets, which include property and equipment, are reviewed for impairment when events or changes in circumstances indicate that the carrying amount of anthe asset group may not be recoverable. If impairment indicators are present and the estimated future undiscounted cash flows expected to be generated by that asset or asset group are less than the carrying value of the long-lived assets, the carrying value would be reduced to the estimated fair value.
In connection with its network optimization, without sacrificing geographical service coverage or anticipated impact to customers, Yellow plans to close and sell excess owned facilities that have overlapping service territories. In the fourth quarter of 2022, the Company closed on the sale of one of these terminals for a price of approximately $31.0 million and a resulting gain of approximately $28.1 million. The net proceeds were used to pay down a portion of the term loan. As a part of our ongoing enterprise transformation, the Company exited certain properties during the second half of 2022. Based on market conditions, certain owned properties which were exited are being actively marketed for sale to third parties. Of these properties, those which are actively marketed but not yet sold have immaterial net book value, but are accounted for as held-for-sale and presented within property and equipment at December 31, 2022.
Leases
Leases
The Company determines if a contractual agreement is a lease or contains a lease at inception. We leaseThe Company leases certain revenue equipment and real estate, predominantly through operating leases, and we have an immaterial number of leases in which we are a lessor. Operating leases are expensed on a straight-line basis over the life of the lease beginning on the lease commencement date. We determineThe Company determines the lease term by assuming the exercise of renewal options that are reasonably certain. The lease term is used to determine whether a lease is finance or operating and is used to calculate rent expense. Additionally, the depreciable life of leased assets and leasehold improvements is limited by the expected lease term. Operating lease balances are classified as operating lease right-of-use (“ROU”) assets and current and long-term operating lease liabilities on our consolidated balance sheet. WeThe Company elected the short-term lease recognition exemption and short-term leases, which have an initial term of 12 months or less, are not included in our ROU assets, or corresponding lease liabilities. Lastly, the Company has an immaterial amount of finance leases that are included in property and equipment, other current liabilities, and other long-term liabilities on our consolidated balance sheet.leases.
ROU assets represent ourthe Company’s right to use an underlying asset for the lease term and lease liabilities represent our obligation to make lease payments arising from the lease. Operating lease ROU assets and liabilities are recognized at commencement date based on the present value of lease payments over the lease term. As most of ourthe Company’s leases do not provide an implicit rate, we use our incremental borrowing rate adjusted for duration and other factors to represent the rate we would have to pay to borrow on a collateralized basis based on the information available at commencement date in determining the present value of lease payments. Our lease terms may include options to extend or terminate the lease and we will adjust the life of the lease when it is reasonably certain that we will exercise these options.
Key assumptions include discount rate, the impact of purchase options and renewal options on our lease term, as well as the assessment of residual value guarantees. We haveThe Company has lease agreements with lease and non-lease components, which are generally accounted for as a single lease component. We have variable lease components, including lease payments with payment escalation based on the Consumer Price Index, and other variable items, such as common area maintenance and taxes.
OurThe Company’s revenue equipment leases generally have purchase options. However, in most circumstances we are not typically certain of exercising the purchase option as we may sign a new lease, return the equipment to the lessor, or exercise the option as circumstances dictate. At the time we determine to exercise such purchase options, we remeasure the lease liability inclusive of the updated lease terms. Our revenue equipment leases often contain residual value guarantees, but they are not reflected in our lease liabilities as our lease rates are such that residual value guarantees are not expected to be owed at the end of our leases. Wrecked units are expensed in full upon damage and paid out to the lessor.
OurThe Company’s real estate leases will often have an option to extend the lease, but we are typically not reasonably certain of exercising options to extend as we have the ability to move to more advantageous locations over time, relocate to other leased and owned locations, or discontinue service from particular locations over time as customer demand changes.
Beginning January 1, 2019, At the Company adopted ASU 2016-02, Leases using a modified retrospective approach. The adoption of this standard impacted our consolidated balance sheet throughtime we determine to exercise such renewal, we remeasure the recognition of $378.8 million in ROU assets and liabilities as of January 1, 2019. Lease deposits in the amount of $25.4 million were reclassified from “Other assets” to a reduction of “Operating lease liabilities” per the consolidated balance sheet upon adoptionliability inclusive of the standard.updated lease terms.
Income Taxes
The Company uses the asset and liability method to reflect income taxes on these consolidated financial statements, which results in the recognition of deferred tax assets and liabilities by applying enacted tax rates to the differences between the carrying value of existing assets and liabilities and their respective tax basis and to loss carryforwards. Tax credit carryforwards are recorded as deferred tax assets. The effect on deferred tax assets and liabilities of a change in tax rates is recognized in income in the period that the change occurs. The Company assesses the validityrecoverability of deferred tax assets, and lossoperating losses and tax credit
44
carryforwards and provides valuation allowances when it determines it is more likely than not that such assets, operating losses or credits will not be realized. We have not recognized deferred taxes relative to foreign subsidiaries’ earnings that are deemed to be permanently reinvested. Any related taxesincome tax associated with such earnings are not material.
Newly-Adopted Accounting Standards
In August 2018, We account for residual income tax effects in accumulated other comprehensive income using the Financial Accounting Standards Board (“FASB”) issued Accounting Standards Update (“ASU”) 2018-14, Compensation - Retirement Benefits - Defined Benefit Plans - General (Subtopic 715-20): Disclosure Framework - Changes toportfolio method and will release the Disclosure Requirements for Defined Benefit Plans. The standard amends Accounting Standards Codification 715 to modifyresidual tax effect when the disclosure requirements for employers that sponsorentire portfolio of defined benefit pension and other post-retirement plans. The new standard became effective for the Company with our annual period ended December 31, 2020. ASU 2018-14 was required to be applied on a retrospective basis to all periods presented. Adoption of this guidance did not have a material impact on the Company’s consolidated financial statements, but it resulted in revised disclosures related to our defined benefit plans.plans is terminated.
Impact of Recently-IssuedNewly Adopted Accounting Standards
In December 2019, the FASB issued ASU 2019-12, Income Taxes (Topic 740): Simplifying the Accounting for Income Taxes. The amendments of ASU 2019-12 are meant to simplify and reduce the cost of accounting for income taxes.
ASU 2019-12 also removes certain exceptions to the general principles in Topic 740 including elimination of an exception to the general intraperiod tax allocation principle, and also clarifies and amends existing guidance to improve consistent application. ASU 2019-12 is effective for public companies for annual periods beginning after December 15, 2020, including interim periods within those fiscal years. Adoption of this guidance will be prospectively applied and the impact on the Company’s consolidated financial statements and notes to the consolidated financial statements will depend upon facts and circumstances not currently known or able to be reasonably anticipated, including tax matters that may require the applicationNone of the intraperiod tax allocation rules. Refer to Note 8 for additional details. Application of the exception to the intraperiod tax allocation rules was a factor in 2020 and certain previous years. Beginning in 2021, it will no longer be a relevant factor.
While there are additional recently issued accounting standards that are applicable to the Company, none of these standards are expected to have a material impact on our consolidated financial statements and accompanying notes.
3. Other Assets and Other Accrued Taxes
The primary components of Other assets at December 31 are as follows:
(in millions) | | 2020 | | | 2019 | |
Unamortized UST debt costs - undrawn portion | | $ | 24.1 | | | $ | — | |
Intangible assets, net | | | 13.1 | | | | 15.0 | |
Other (a) | | | 14.5 | | | | 35.4 | |
Total | | $ | 51.7 | | | $ | 50.4 | |
(a)
| Other includes insurance receivables (which are offset by amounts to be paid for claims in excess of self-insured retention), long-term deposits, and other immaterial assets of varying types.
|
The primary components of Other accrued taxes at December 31 are as follows:
| | | | | | | | |
(in millions) | | 2022 | | | 2021 | |
Deferred employer payroll taxes | | $ | — | | | $ | 42.8 | |
Other (a) | | | 27.9 | | | | 30.0 | |
Total | | $ | 27.9 | | | $ | 72.8 | |
(in millions) | | 2020 | | | 2019 | |
Current portion of employer payroll taxes | | $ | 42.8 | | | $ | — | |
Other (a) | | | 25.8 | | | | 25.8 | |
Total | | $ | 68.6 | | | $ | 25.8 | |
Other includes liabilities related to operating taxes and licenses, employer payroll taxes, real estate taxes, and other immaterial tax liabilities of varying types.
(a)
| Other includes liabilities related to operating taxes and licenses, real estate taxes, and other immaterial tax liabilities of varying types.
|
Under the Coronavirus Aid, Relief, and Economic Security Act (the “CARES Act”), the Company is deferringdeferred payment of certain employer payroll taxes that resultedtaxes. Approximately half of these deferred payments were paid in $85.6 million of liabilities as of December 31, 2020, with 50% due December 31, 2021 and 50% duethe remaining amount was paid in December 31, 2022. The current portion is included in the table above and the long-term portion of the deferred employer payroll tax liability is included in claims and other liabilities on the Company’s consolidated balance sheets.
4. Employee Benefits
Qualified and Nonqualified Defined BenefitNon-Union Pension Plans
Yellow Corporation and certain of our operating subsidiaries sponsor qualified and nonqualified defined benefit pension plans for certain employees not covered by collective bargaining agreements, (approximately 9,000which as of December 31, 2022 includes approximately 4,600 current, former and retired employees)employees. These domestic, qualified non-union pension plans include the Yellow Corporation Pension Plan, the Roadway LLC Pension Plan, and the Yellow Retirement Pension Plan (formerly known as the YRC Retirement Pension Plan) (collectively, the "Plans"). Qualified and nonqualified pension benefits are based on years of service and the employees’ covered earnings. Employees covered by collective bargaining agreements participate in various multi-employer pension plans to which the Company contributes, as discussed separately below. The domestic Company defined benefit pension plansPlans closed to new participants effective January 1, 2004 and benefit accruals for participants were frozen effective July 1, 2008. Our actuarial valuation measurement date for our pension plansthe Plans is December 31.
Our long-term strategy has been focused on de-risking these pension plansthe Plans and improving the overall funded status. In 2017,prior years, the Company amendedhas worked to execute this strategy through efforts that included amending the domestic pension plansPlans to provide an automatic commencement of benefit at age 65, regardless of employment status, in an effort to reduce our long-term pension obligations and ongoing annual pension expense. At the same time, the Yellow Corporation Pension Plan was amended to permit the payment of lump sum benefit payments for those participants who reached age 65. Effective January 1, 2018, the Yellow Corporation Pension Planexpense, and one plan was amended to permit the payment of lump sum benefit payments for all participants. These amendments triggered immaterial non-cash settlement charges of $3.6 million and $10.9 millionthat are included in 2020 and 2018, respectively,certain tabular disclosures below, due to the amount of lump sum benefit payments distributed from plan assets. The lump sum benefit payments reduce pension obligations and are funded from existing plan assets. The non-cash settlement charge resultscharges result from the requirement to expense the unrecognized actuarial losses associated with the lump sum settlements, which are reflected in nonoperating expenses. These charges had no effect on total equity because the actuarial losses were already recognized in accumulated other comprehensive loss. Accordingly, the effect on retained earnings was offset by a corresponding reduction in accumulated other comprehensive loss. Additionally,
On December 6, 2021, the closurePlans entered into a contract for a group annuity to transfer the obligation to pay the remaining retirement benefits of certain specific plan participants in the Plans to a smallhighly rated insurance company (the “2021 Partial Pension Annuitization"). Upon issuance of the group annuity contracts, the value of each affected retiree’s benefit obligation was irrevocably guaranteed by the insurer. The plan for Canadian employees in 2019participants did not have any changes to their benefits as a result of the transfer. By irrevocably transferring the obligations to the insurer, the Company reduced its overall pension projected benefit obligation by approximately $243 million. The purchase of group annuity contracts was funded directly by assets of the Plans of approximately $253 million.
45
Prior to the 2021 Partial Pension Annuitization, the Plans had approximately 8,500 participants. The 2021 Partial Pension Annuitization eliminated the Plan's obligations to pay retirement benefits to approximately 3,700 participants and resulted in lump sum benefit paymentsannual savings for the Plans, including for Pension Benefit Guarantee Corporation premiums. Consistent with our long-term strategy, the Company and annuity purchase premium transfers. These payments triggeredthe Plans expect to continue to look for opportunities to manage the domestic, qualified non-union pension plans obligations, which may include additional settlements in future years.
As a result of the 2021 Partial Pension Annuitization, the Company recorded a non-cash, non-operating settlement chargeloss during the fourth quarter of $1.8 million. Like other non-cash settlement charges, this2021 of approximately $54.9 million reflecting the accelerated recognition of unamortized losses in these plans from the obligation that was reflected in nonoperating expenses, with a corresponding offset in accumulated other comprehensive loss.settled.
During the year ended December 31, 2020,2022 our pension expense was $6.5$10.2 million, which includes a $3.6$12.1 million expense recognition of settlements from lump sum payouts during the year, as detailed above. Our cash contributions were $36.5 million during the year ended December 31, 2020.year. Using our current plan assumptions for the discount rate of 2.81%5.70% and an updated assumed 5.00%7.00% return on assets we expect to record incomeexpense of $5.6$8.8 million for the year ended December 31, 2021.2023, which excludes expenses of settlement from lump sum payments.
Funded Status
The reconciliation of the beginning and ending balances of the projected benefit obligation and the fair value of plan assets for the years ended December 31, 20202022 and 2019,2021, and the funded status at December 31, 20202022 and 2019,2021, is as follows:
| (in millions) | | 2020 | | | 2019 | | | 2022 | | | 2021 | |
Change in benefit obligation: | | | | | | | | | | | | | | |
Benefit obligation at beginning of year | | $ | 1,128.8 | | | $ | 1,073.2 | | | $ | 813.3 | | | $ | 1,142.3 | |
Interest cost | | | 37.1 | | | | 45.7 | | | | 23.7 | | | | 30.7 | |
Benefits paid | | | (102.1 | ) | | | (96.7 | ) | |
Benefits paid, including lump sum and annuity transfers | | | | (80.3 | ) | | | (353.0 | ) |
Actuarial (gain) loss | | | 78.5 | | | | 106.5 | | | | (171.2 | ) | | | (6.7 | ) |
Other | | | — | | | | 0.1 | | | | — | | | | — | |
Benefit obligation at year end | | $ | 1,142.3 | | | $ | 1,128.8 | | | $ | 585.5 | | | $ | 813.3 | |
Change in plan assets: | | | | | | | | | | | | | | |
Fair value of plan assets at prior year end | | $ | 900.0 | | | $ | 874.9 | | | $ | 767.4 | | | $ | 1,190.7 | |
Actual return on plan assets | | | 356.3 | | | | 112.1 | | | | (199.8 | ) | | | (71.4 | ) |
Employer contributions | | | 36.5 | | | | 9.7 | | | | 0.6 | | | | 1.1 | |
Benefits paid | | | (102.1 | ) | | | (96.7 | ) | |
Benefits paid, including lump sum and annuity transfers | | | | (80.3 | ) | | | (353.0 | ) |
Fair value of plan assets at year end | | $ | 1,190.7 | | | $ | 900.0 | | | $ | 487.9 | | | $ | 767.4 | |
Funded status at year end | | $ | 48.4 | | | $ | (228.8 | ) | | $ | (97.6 | ) | | $ | (45.9 | ) |
The overfunded status of the plans of $48.4 million at December 31, 2020 andnet underfunded status of the plans of $228.8$97.6 million and $45.9 million at December 31, 20192022 and 2021, respectively are recognized in the consolidated balance sheets as shown in the table below. NaNNo plan assets are expected to be returned to the Company during the year ending December 31, 2021.2023.
Amounts recognized in the consolidated balance sheets for these pension plans at December 31 are as follows:
| | | | | | | | |
(in millions) | | 2022 | | | 2021 | |
Noncurrent assets | | $ | 34.5 | | | $ | 40.5 | |
Current liabilities | | | (0.5 | ) | | | (0.6 | ) |
Noncurrent liabilities | | | (131.6 | ) | | | (85.8 | ) |
Total | | $ | (97.6 | ) | | $ | (45.9 | ) |
(in millions) | | 2020 | | | 2019 | |
Noncurrent assets | | $ | 63.2 | | | $ | 6.1 | |
Current liabilities | | | 0.7 | | | | 1.0 | |
Noncurrent liabilities | | | 14.1 | | | | 233.9 | |
Total | | $ | 48.4 | | | $ | (228.8 | ) |
Amounts recognized in accumulated other comprehensive loss at December 31 consist of:
| (in millions) | | 2020 | | | 2019 | | | 2022 | | | 2021 | |
Net actuarial loss | | $ | 171.5 | | | $ | 406.1 | | | $ | 248.9 | | | $ | 207.3 | |
Net prior service credit | | | (9.4 | ) | | | (9.8 | ) | | | (8.4 | ) | | | (8.9 | ) |
Total | | $ | 162.1 | | | $ | 396.3 | | | $ | 240.5 | | | $ | 198.4 | |
As shown above, included in accumulated other comprehensive loss at December 31, 2020,2022, are unrecognized actuarial losses of $162.1$248.9 million ($152.5239.3 million, net of tax).
46
Information for pension plans with an accumulated benefit obligation (“ABO”) in excess of plan assets and plan assets that exceed ABO at December 31, 20202022 and 20192021 is as follows:
| | | | | | | | | | | | |
| | At December 31, 2022 | |
(in millions) | | ABO Exceeds
Assets | | | Assets Exceed
ABO | | | Total | |
Projected benefit obligation | | $ | 553.4 | | | $ | 32.1 | | | $ | 585.5 | |
Accumulated benefit obligation | | | 553.4 | | | | 32.1 | | | | 585.5 | |
Fair value of plan assets | | | 421.5 | | | | 66.4 | | | | 487.9 | |
| | | | | | | | | | | | |
| | At December 31, 2021 | |
(in millions) | | ABO Exceeds
Assets | | | Assets Exceed
ABO | | | Total | |
Projected benefit obligation | | $ | 759.3 | | | $ | 54.0 | | | $ | 813.3 | |
Accumulated benefit obligation | | | 759.3 | | | | 54.0 | | | | 813.3 | |
Fair value of plan assets | | | 673.2 | | | | 94.2 | | | | 767.4 | |
Assumptions
| | At December 31, 2020 | |
(in millions) | | ABO Exceeds Assets | | | Assets Exceed ABO | | | Total | |
Projected benefit obligation | | $ | 482.9 | | | $ | 659.4 | | | $ | 1,142.3 | |
Accumulated benefit obligation | | | 482.9 | | | | 659.4 | | | | 1,142.3 | |
Fair value of plan assets | | | 468.1 | | | | 722.6 | | | | 1,190.7 | |
| | At December 31, 2019 | |
(in millions) | | ABO Exceeds Assets | | | Assets Exceed ABO | | | Total | |
Projected benefit obligation | | $ | 960.9 | | | $ | 167.9 | | | $ | 1,128.8 | |
Accumulated benefit obligation | | | 960.9 | | | | 167.9 | | | | 1,128.8 | |
Fair value of plan assets | | | 726.0 | | | | 174.0 | | | | 900.0 | |
Assumptions
Weighted average actuarial assumptions used to determine benefit obligations at December 31:
| | 2020 | | | 2019 | |
Discount rate | | | 2.81 | % | | | 3.56 | % |
| | | | | | | | |
| | 2022 | | | 2021 | |
Discount rate | | | 5.70 | % | | | 3.08 | % |
Weighted average assumptions used to determine net periodic benefit cost for the years ended December 31:
| | | | | | | | | | | | |
| | 2022 | | | 2021 | | | 2020 | |
Discount rate | | | 3.08 | % | | | 2.81 | % | | | 3.56 | % |
Expected rate of return on assets | | | 5.0 | % | | | 5.0 | % | | | 7.0 | % |
Mortality table (a) | | Pri-2012
(MP-2021 Scale, Custom) | | | Pri-2012
(MP-2021 Scale, Custom) | | | Pri-2012
(MP-2020 Scale, Custom) | |
| | 2020 | | | 2019 | | | 2018 | |
Discount rate | | | 3.56 | % | | | 4.44 | % | | | 3.77 | % |
Expected rate of return on assets | | | 7.0 | % | | | 7.0 | % | | | 7.0 | % |
Mortality table (a) | | Pri-2012 (MP-2020 Scale, Custom) | | | Pri-2012 (MP-2019 Scale, Custom) | | | RP-2014 (MP-2016 Scale, Custom) | |
The 2022, 2021 and 2020 mortality tables were based on a custom mortality improvement scale to reflect expectations of underlying plan participants.
(a)
| The 2020, 2019 and 2018 mortality tables were based on a custom mortality improvement scale to reflect expectations of underlying plan participants.
|
The discount rate refers to the interest rate used to discount the estimated future benefit payments to their present value, also referred to as the benefit obligation. The discount rate allows us to estimate what it would cost to settle the pension obligations as of the measurement date, December 31, and is used as the interest rate factor in the following year’s pension cost. We determine the discount rate by selecting a portfolio of high qualityhigh-quality noncallable bonds such that the coupons and maturities exceed or are similar to our expected benefit payments.
In determining the expected rate of return on assets, we consider our historical experience in the plans’ investment portfolio, historical market data and long-term historical relationships, as well as a review of other objective indices including current market factors such as inflation and interest rates. Due to the historically underfunded nature of these plans, we managed ourthe investment portfolio was allocated to hedge risks, but primarily focused on riskmore return seeking assets that would provide an opportunity to closeinvestments, and the net funded deficit. Based on various market factors, weCompany selected an expected rate of return on assets of 7.0%7.0% effective for the 2020 and 2019 valuations.
With the net funded status fully funded, meaning the aggregate fair value of the assets exceeds the aggregate projected benefit obligation, as of December 31, 2020 we are reducing the percentage of the portfolio comprised of risk seeking assets and increasing the amount of hedge assets. As such, we have lowered our 2021 expected rate of return2023 valuation, compared to 5.0% based on an improved
funded position and a lower risk profile. In addition, these changes should impact the prospective asset allocation detailed below by reducing equities.5.0% for 2022. We will continue to review our expected long-term rate of return on an annual basis, and if and when appropriate, revise appropriately.that assumption. The pension trust holds no Company securities.
Our asset allocation as of December 31, 20202022 and 2019,2021, and targeted long-term asset allocation for the plans are as follows:
| | | 2020 | | | 2019 | | | Target | | | 2022 | | | 2021 | | | Target | |
Equities | | | 60 | % | | | 33 | % | | | 38 | % | | | 26 | % | | | 32 | % | | | 19 | % |
Debt Securities | | | 31 | % | | | 30 | % | | | 30 | % | | | 48 | % | | | 49 | % | | | 45 | % |
Absolute Return | | | 9 | % | | | 37 | % | | | 32 | % | | | 26 | % | | | 19 | % | | | 36 | % |
Future Contributions and Benefit Payments
We expect cash contributions, if required at all, for allthe defined benefit pension plans that the Company sponsors to be $4.7 million in 2021nominal for 2023 and 0 significant annual contributions in years thereafter. The average remaining life expectancy of plan participants is approximately 21 years.
47
Expected benefit payments from our qualified and non-qualified defined benefit pension plansthe Plans to participants for each of the next five years and the total cumulative benefit payments for the following five years ended December 31 are as follows:
| (in millions) | | 2021 | | | 2022 | | | 2023 | | | 2024 | | | 2025 | | | 2026-2030 | | | 2023 | | | 2024 | | | 2025 | | | 2026 | | | 2027 | | | 2028-2032 | |
Expected benefit payments | | $ | 92.6 | | | $ | 88.8 | | | $ | 83.7 | | | $ | 82.0 | | | $ | 82.8 | | | $ | 354.1 | | | $ | 59.2 | | | $ | 57.9 | | | $ | 57.6 | | | $ | 54.4 | | | $ | 52.8 | | | $ | 229.4 | |
Pension and Other Post-retirement Costs
The components of our net periodic pension cost, other post-retirement costs and other amounts recognized in other comprehensive loss (income) before tax for the years ended December 31, 2020, 20192022, 2021 and 20182020 were as follows:
| (in millions) | | 2020 | | | 2019 | | | 2018 | | | 2022 | | | 2021 | | | 2020 | |
Net periodic benefit cost: | | | | | | | | | | | | | | | | | | | | | |
Interest cost | | $ | 37.1 | | | $ | 45.7 | | | $ | 44.1 | | | $ | 23.7 | | | $ | 30.7 | | | $ | 37.1 | |
Expected return on plan assets | | | (61.1 | ) | | | (57.3 | ) | | | (60.0 | ) | | | (33.8 | ) | | | (48.0 | ) | | | (61.1 | ) |
Amortization of prior net losses | | | 14.3 | | | | 12.8 | | | | 14.6 | | | | 8.6 | | | | 12.1 | | | | 14.3 | |
Amortization of prior net service credit | | | (0.4 | ) | | | (0.4 | ) | | | (0.4 | ) | | | (0.4 | ) | | | (0.4 | ) | | | (0.4 | ) |
Settlement adjustment | | | 3.6 | | | | 1.8 | | | | 10.9 | | |
Settlement - Annuitization(s) | | | | — | | | | 54.9 | | | | — | |
Settlements - All Others | | | | 12.1 | | | | 9.8 | | | | 3.6 | |
Net periodic pension cost (benefit) | | $ | (6.5 | ) | | $ | 2.6 | | | $ | 9.2 | | | $ | 10.2 | | | $ | 59.1 | | | $ | (6.5 | ) |
Other changes in plan assets and benefit obligations recognized in other comprehensive loss (income): | | | | | | | | | | | | | | | | | | | | | |
Net actuarial (gains) losses and other adjustments | | $ | (216.7 | ) | | $ | 51.9 | | | $ | (0.9 | ) | | $ | 62.4 | | | $ | 112.7 | | | $ | (216.7 | ) |
Settlement adjustment | | | (3.6 | ) | | | (1.8 | ) | | | (10.9 | ) | |
Settlement - Annuitization(s) | | | | — | | | | (54.9 | ) | | | — | |
Settlements - All Others | | | | (12.1 | ) | | | (9.8 | ) | | | (3.6 | ) |
Amortization of prior net losses | | | (14.3 | ) | | | (12.8 | ) | | | (14.6 | ) | | | (8.6 | ) | | | (12.1 | ) | | | (14.3 | ) |
Amortization of prior net service credit | | | 0.4 | | | | 0.4 | | | | 0.4 | | | | 0.4 | | | | 0.4 | | | | 0.4 | |
Total recognized in other comprehensive loss (income) | | $ | (234.2 | ) | | $ | 37.7 | | | $ | (26.0 | ) | | $ | 42.1 | | | $ | 36.3 | | | $ | (234.2 | ) |
Total recognized in net periodic benefit cost and other comprehensive loss (income) | | $ | (240.7 | ) | | $ | 40.3 | | | $ | (16.8 | ) | | $ | 52.3 | | | $ | 95.4 | | | $ | (240.7 | ) |
During the years ended December 31, 2020, 20192022 and 2018 the2021, there was no income tax expense (benefit) related to pension amounts in other comprehensive income. During the year ended December 31, 2020 the income tax expense related to pension amounts in other comprehensive (income) loss was $14.6 million, $(0.3) million and $(0.1) million, respectively.$14.6 million.
Gains and Losses
Gains and losses occur due to changes in the amount of either the projected benefit obligation or plan assets from experience being different than assumed and from changes in assumptions. We recognize an amortization of the net gain or loss as a component of net pension cost forduring a year if, as of the beginning of the year, that net gain or loss exceeds ten percent of the greater of the benefit obligation or the market-related value of plan assets. If an amortization is required, it equals the amount of net gain or loss that exceeds the ten percent corridor, amortized over the average remaining life expectancy of plan participants.
As of December 31, 2020, the pension plans have net losses of $171.5 million and a projected benefit obligation of $1,142.3 million. The average remaining life expectancy of plan participants is approximately 19 years. For 2021, we expect to amortize approximately $12.3 million of the net loss. The comparable annual amortization amounts for the years ended December 31, 2020 and 2019 were $14.3 million and $12.8 million, respectively.
Fair Value Measurement
Our pension assets are stated at fair value. Fair value is the price that would be received to sell an asset or paid to transfer a liability in an orderly transaction between market participants at the measurement date. The fair value of Level 1 assets are based on quoted market prices. The majority of the Level 1 assets presented in the table below include common stock of both U.S. and, to a lesser extent, international companies, and mutual funds, which are actively traded and priced in the market. The fair value of Level 2 assets are based on other significant observable inputs, including quoted prices for similar securities. The Level 2 assets presented in the below table consist primarily of fixed income and absolute return funds where values are based on the quoted prices of similar securities and observable market data. Level 3 assets are those where the fair value is determined based on unobservable inputs. The Level 3 assets consist primarily of private equities, and the assets are either priced at cost less cash distributions for recent asset purchases, third-party valuations or discounted cash flow methods. Assets that are not considered Level 1, 2 or 3 assets are valued at the net asset value (“NAV”) of the underlying investments held, as determined by the fund managers.
The methods and assumptions used by third-party pricing sources may include a variety of factors, such as recently executed transactions, existing contracts, economic conditions, industry or market developments, and overall credit ratings. These estimated fair values may differ significantly from the values that would have been used had a ready market for these investments existed and as such, differences could be material. The availability of observable data is monitored by plan management to assess
48
appropriate classification of financial instruments within the fair value hierarchy. Depending upon the availability of such inputs, specific securities may transfer between levels. In such instances, the transfer is reported at the end of the reporting period. For example, the pension plans had one significant asset previously recorded at NAV at December 31, 2019 that completed an initial public offering during 2020 and is now recorded as Level 1.
The tables below detail by level, within the fair value hierarchy, the pension assets at fair value as of December 31, 20202022 and December 31, 2019:2021:
| | | | | | | | | | | | | | | | |
| | Pension Assets at Fair Value as of December 31, 2022 | |
(in millions) | | Total | | | Level 1 | | | Level 2 | | | Level 3 | |
Equities | | $ | 2.5 | | | $ | 2.5 | | | $ | — | | | $ | — | |
Private equities | | | 19.1 | | | | — | | | | — | | | | 19.1 | |
Fixed income: | | | | | | | | | | | | |
Corporate and other | | | 8.2 | | | | — | | | | — | | | | 8.2 | |
Government | | | 158.7 | | | | 63.2 | | | | 95.5 | | | | — | |
Interest bearing | | | 54.2 | | | | 53.0 | | | | 1.2 | | | | — | |
Investments measured at NAV(a) | | | 245.2 | | | | — | | | | — | | | | — | |
Total plan assets | | $ | 487.9 | | | $ | 118.7 | | | $ | 96.7 | | | $ | 27.3 | |
| | | | | | | | | | | | | | | | |
| | Pension Assets at Fair Value as of December 31, 2021 | |
(in millions) | | Total | | | Level 1 | | | Level 2 | | | Level 3 | |
Equities | | $ | 59.0 | | | $ | 59.0 | | | $ | — | | | $ | — | |
Private equities | | | 18.6 | | | | — | | | | — | | | | 18.6 | |
Fixed income: | | | | | | | | | | | | |
Corporate and other | | | 81.4 | | | | — | | | | 73.4 | | | | 8.0 | |
Government | | | 206.2 | | | | 8.2 | | | | 198.0 | | | | — | |
Interest bearing | | | 58.9 | | | | 57.5 | | | | 1.4 | | | | — | |
Investments measured at NAV(a) | | | 343.3 | | | | | | | | | | |
Total plan assets | | $ | 767.4 | | | $ | 124.7 | | | $ | 272.8 | | | $ | 26.6 | |
| | Pension Assets at Fair Value as of December 31, 2020 | |
(in millions) | | Total | | | Level 1 | | | Level 2 | | | Level 3 | |
Equities | | $ | 518.9 | | | $ | 518.4 | | | $ | 0.5 | | | $ | — | |
Private equities | | | 36.9 | | | | — | | | | — | | | | 36.9 | |
Fixed income: | | | | | | | | | | | | | | | | |
Corporate and other | | | 32.1 | | | | 6.0 | | | | 17.7 | | | | 8.4 | |
Government | | | 250.5 | | | | 55.4 | | | | 195.1 | | | | — | |
Interest bearing | | | 67.0 | | | | 8.7 | | | | 58.3 | | | | — | |
Investments measured at NAV(a) | | | 285.3 | | | | | | | | | | | | | |
Total plan assets | | $ | 1,190.7 | | | $ | 588.5 | | | $ | 271.6 | | | $ | 45.3 | |
Certain investments that are measured at fair value using the NAV per share (or its equivalent) practical expedient have not been categorized in the fair value hierarchy.
| | Pension Assets at Fair Value as of December 31, 2019 | |
(in millions) | | Total | | | Level 1 | | | Level 2 | | | Level 3 | |
Equities | | $ | 67.0 | | | $ | 66.6 | | | $ | 0.4 | | | $ | — | |
Private equities | | | 36.4 | | | | — | | | | — | | | | 36.4 | |
Fixed income: | | | | | | | | | | | | | | | | |
Corporate and other | | | 29.0 | | | | 2.2 | | | | 18.4 | | | | 8.4 | |
Government | | | 204.2 | | | | 53.3 | | | | 150.9 | | | | — | |
Interest bearing | | | 27.2 | | | | 15.0 | | | | 12.2 | | | | — | |
Investments measured at NAV(a) | | | 536.2 | | | | | | | | | | | | | |
Total plan assets | | $ | 900.0 | | | $ | 137.1 | | | $ | 181.9 | | | $ | 44.8 | |
(a)
| Certain investments that are measured at fair value using the NAV per share (or its equivalent) practical expedient have not been categorized in the fair value hierarchy.
|
The table below presents the activity of our assets measured at fair value on a recurring basis using significant unobservable inputs (Level 3):
| | | | | | | | | | | | |
(in millions) | | Private Equities | | | Fixed income | | | Total Level 3 | |
Balance at December 31, 2020 | | $ | 36.9 | | | $ | 8.4 | | | $ | 45.3 | |
Purchases | | | 1.0 | | | | 0.8 | | | | 1.8 | |
Sales | | | (24.4 | ) | | | (1.3 | ) | | | (25.7 | ) |
Unrealized losses | | | 5.1 | | | | 0.1 | | | | 5.2 | |
Balance at December 31, 2021 | | $ | 18.6 | | | $ | 8.0 | | | $ | 26.6 | |
Sales | | | (0.8 | ) | | | (1.5 | ) | | | (2.3 | ) |
Unrealized gain | | | 1.3 | | | | 1.7 | | | | 3.0 | |
Balance at December 31, 2022 | | $ | 19.1 | | | $ | 8.2 | | | $ | 27.3 | |
49
(in millions) | | Private Equities | | | Fixed income | | | Total Level 3 | |
Balance at December 31, 2018 | | $ | 43.4 | | | $ | 0.9 | | | $ | 44.3 | |
Purchases | | | — | | | | 8.1 | | | | 8.1 | |
Sales | | | (16.7 | ) | | | (0.8 | ) | | | (17.5 | ) |
Realized gains | | | 1.9 | | | | — | | | | 1.9 | |
Unrealized gains | | | 7.8 | | | | 0.2 | | | | 8.0 | |
Balance at December 31, 2019 | | $ | 36.4 | | | $ | 8.4 | | | $ | 44.8 | |
Transfers in | | | 19.4 | | | | — | | | | 19.4 | |
Purchases | | | — | | | | 1.6 | | | | 1.6 | |
Sales | | | (7.7 | ) | | | (1.4 | ) | | | (9.1 | ) |
Unrealized losses | | | (11.2 | ) | | | (0.2 | ) | | | (11.4 | ) |
Balance at December 31, 2020 | | $ | 36.9 | | | $ | 8.4 | | | $ | 45.3 | |
The following table sets forth a summary of the assets for which a reported NAV is used to estimate the fair value as of December 31, 2020:2022:
| | | | | | | | | | | | |
| | Fair value estimated using Net Asset Value per Share |
(in millions) | | Fair Value | | | Unfunded
Commitments | | | Redemption
Frequency | | Redemption Notice
Period |
Private equities (a) | | $ | 65.6 | | | $ | 4.7 | | | Redemptions not permitted |
Fixed income (b) | | | 23.6 | | | | — | | | Redemptions not permitted |
Equities (c) | | | 114.0 | | | | — | | | Daily, Monthly, Quarterly | | 5-60 days |
Absolute return (d) | | | 42.0 | | | | — | | | Monthly, Quarterly, Semi-Annually | | 5-180 days |
Total | | $ | 245.2 | | | | | | | | |
| | Fair value estimated using Net Asset Value per Share |
(in millions) | | Fair Value | | | Unfunded Commitments | | | Redemption Frequency | | Redemption Notice Period |
Private equities (a) | | $ | 119.0 | | | $ | 1.5 | | | Redemptions not permitted |
Fixed income (b) | | | 30.5 | | | | — | | | Monthly, Quarterly | | 35-90 days |
Equities (c) | | | 58.3 | | | | — | | | Monthly | | 3-30 days |
Absolute return (d) | | | 77.5 | | | | — | | | Monthly, Quarterly | | 3-75 days |
Total | | $ | 285.3 | | | | | | | | | |
Consists of private equity investments in pharmaceuticals and companies primarily in the technology and healthcare sectors.
| (b) Consists of investment in debt securities, secured and unsecured, including collateralized loan obligations of global companies, primarily across the U.S. and Europe. While certain fixed income investments allow redemptions, others do not. (c)Consists of public equity investments in U.S. and non-U.S. markets. (d)Consists of investments in publicly traded securities including long and short positions in equities and exchange traded funds, equity index options, corporate and convertible debt securities and other derivatives on equities, commodities and interest rates. (a)
| Consists of private equity investments in pharmaceuticals and companies primarily in the technology and healthcare sectors.
|
(b)
| Consists of investment in debt securities, secured and unsecured, including collateralized loan obligations of global companies, primarily across the U.S. and Europe. While certain fixed income investments allow redemptions, others do not.
|
(c)
| Consists of public equity investments in U.S. and non-U.S. markets.
|
(d)
| Consists of investments in global markets, including derivative securities of equity and fixed income indexes, commodities and interest rates.
|
The following table sets forth a summary of the assets for which a reported NAV is used to estimate the fair value as of December 31, 2019:2021:
| | | | | | | | | | | | |
| | Fair value estimated using Net Asset Value per Share |
(in millions) | | Fair Value | | | Unfunded
Commitments | | | Redemption
Frequency | | Redemption Notice
Period |
Private equities (a) | | $ | 122.7 | | | $ | 7.5 | | | Redemptions not permitted |
Fixed income (b) | | | 41.5 | | | | — | | | Monthly, Quarterly | | 35-90 days |
Equities (c) | | | 59.0 | | | | — | | | Monthly, Quarterly | | 3-60 days |
Absolute return (d) | | | 120.1 | | | | — | | | Monthly, Quarterly | | 5-90 days |
Total | | $ | 343.3 | | | | | | | | |
| | Fair value estimated using Net Asset Value per Share |
(in millions) | | Fair Value | | | Unfunded Commitments | | | Redemption Frequency | | Redemption Notice Period |
Private equities (a) | | $ | 127.0 | | | $ | 1.7 | | | Redemptions not permitted |
Fixed income (b) | | | 231.4 | | | | 4.1 | | | Redemptions not permitted |
Equities (c) | | | 81.9 | | | | — | | | Daily, Monthly | | 0-30 days |
Absolute return (d) | | | 95.9 | | | | — | | | Monthly, Quarterly | | 3-75 days |
Total | | $ | 536.2 | | | | | | | | | |
Consists of private equity investments in pharmaceuticals and companies primarily in the technology and healthcare sectors.
| (b) Primarily consists of investments in royalty payments from marketers of pharmaceuticals and related debt securities. (c)Consists of public equity investments in U.S. and non-U.S. markets. (d)Consists of investments in global markets, including derivative securities of equity and fixed income indexes, commodities and interest rates. (a)
| Consists of private equity investments in pharmaceuticals and companies primarily in the technology and healthcare sectors.
|
(b)
| Primarily consists of investments in royalty payments from marketers of pharmaceuticals and related debt securities.
|
(c)
| Consists of public equity investments in U.S. and non-U.S. markets.
|
(d)
| Consists of investments in global markets, including derivative securities of equity and fixed income indexes, commodities and interest rates.
|
Historically, the investment strategy for private equities has consisted of direct investments or investments through limited partnerships with managers who purchase interests in non-public companies. In addition, the typical investment strategies of the fixed income and equity funds was based on fundamental and quantitative analysis and consisted of long and hedged strategies. Lastly, the general strategy of the absolute return funds consisted of alternative investment techniques, including derivative instruments and other unconventional assets, to achieve an absolute return rate.
Multi-Employer Plans
We contributeThe Company contributes to various separate multi-employer health, welfare and pension plans for employees that are covered by our collective bargaining agreements (approximately 79%82% of total employees of the Company and its subsidiaries). The collective bargaining agreements determine the amounts of these contributions. The health and welfare plans provide medical relatedmedical-related benefits to active employees and retirees. The pension plans provide retirement benefits to retired participants. We recognize multi-employer pension cost within ‘Salaries,salaries, wages and employee benefits’benefits for the contractually required contributions for the period and recognize as a liability any contributions due and unpaid at period end. We do not directly manage the multi-employer plans to which we contribute. These pension plans' assets and liabilities are not included in our consolidated balance sheets. The trusts covering these plans are generally managed by trustees, half of whom the unions appoint and half of whom various contributing employers appoint.
We expensed the following amounts related to these plans for the years ended December 31:
| (in millions) | | 2020 | | | 2019 | | | 2018 | | | 2022 | | | 2021 | | | 2020 | |
Health and welfare | | $ | 488.7 | | | $ | 503.5 | | | $ | 499.3 | | | $ | 490.0 | | | $ | 485.2 | | | $ | 488.7 | |
Pension | | | 123.6 | | | | 127.6 | | | | 115.5 | | | | 111.1 | | | | 114.5 | | | | 123.6 | |
Total | | $ | 612.3 | | | $ | 631.1 | | | $ | 614.8 | | | $ | 601.1 | | | $ | 599.7 | | | $ | 612.3 | |
50
The following table provides additional information related to our participation in individually significant multi-employer pension plans:
| | | | | | | | | | | | |
| | | | | | | | | | | | Expiration Date |
| | | | | | | | Funding | | | | of Collective- |
| | | | Pension Protection Zone Status(b) | | Improvement or | | Employer | | Bargaining |
Pension Fund(a) | | EIN Number | | 2022 | | 2021 | | Rehabilitation Plan | | Surcharge Imposed | | Agreement |
Central States, Southeast and Southwest Areas Pension Fund | | 36-6044243 | | Critical and
Declining | | Critical and
Declining | | Yes | | No | | 3/31/2024 |
Teamsters National 401(k) Savings Plan(c) | | 52-1967784 | | N/A | | N/A | | N/A | | No | | 3/31/2024 |
Road Carriers Local 707 Pension Fund | | 51-6106510 | | Critical and
Declining | | Critical and
Declining | | Yes | | No | | 3/31/2024 |
Teamsters Local 641 Pension Fund | | 22-6220288 | | Critical and
Declining | | Critical and
Declining | | Yes | | No | | 3/31/2024 |
a)The determination of individually significant multi-employer plans is based on our contributions to the plans relative to our total contributions over the periods presented, as well as our contributions to the plans relative to the total contributions that the individual plans received during the periods presented.
b)The Pension Protection Zone Status indicated herein is based on information that the Company obtained from the plans’ Forms 5500. Unless otherwise noted, the most recent PPA zone status available for 2022 and 2021 is for the
year ended December 31, 2020:plan’s year-end during calendar years 2021 and 2020, respectively. Among other factors, plans in the critical or critical and declining zone are generally less than 65 percent funded, plans in the endangered zone are less than 80 percent funded, and plans in the green zone are at least 80 percent funded. | | | | | | | | | | | | Expiration Date |
| | | | | | | | Funding | | | | of Collective- |
| | | | Pension Protection Zone Status(b) | | Improvement or | | Employer | | Bargaining |
Pension Fund(a) | | EIN Number | | 2020 | | 2019 | | Rehabilitation Plan | | Surcharge Imposed | | Agreement |
Central States, Southeast and Southwest Areas Pension Fund | | 36-6044243 | | Critical and Declining | | Critical and Declining | | Yes | | No | | 3/31/2024 |
Teamsters National 401(k) Savings Plan(c) | | 52-1967784 | | N/A | | N/A | | N/A | | No | | 3/31/2024 |
Road Carriers Local 707 Pension Fund | | 51-6106510 | | Critical and Declining | | Critical and Declining | | Yes | | No | | 3/31/2024 |
Teamsters Local 641 Pension Fund | | 22-6220288 | | Critical and Declining | | Critical and Declining | | Yes | | No | | 3/31/2024 |
The policies of the Western Conference of Teamsters Pension Trust precluded the Company from reentering the plan on June 1, 2011. The plan did not assess a withdrawal liability and has not done so since June 1, 2011. Based on our most recent letter of understanding which has extended through 2024, no liability has been assessed. Contributions related to the employees previously covered by this plan are now being made to the Teamsters National 401(k) Plan.
(a)
| The determination of individually significant multi-employer plans is based on our contributions to the plans relative to our total contributions over the periods presented, as well as our contributions to the plans relative to the total contributions that the individual plans received during the periods presented.
|
(b)
| The Pension Protection Zone Status indicated herein is based on information that the Company obtained from the plans’ Forms 5500. Unless otherwise noted, the most recent PPA zone status available for 2020 and 2019 is for the plan’s year-end during calendar years 2019 and 2018, respectively. Among other factors, plans in the critical or critical and declining zone are generally less than 65 percent funded, plans in the endangered zone are less than 80 percent funded, and plans in the green zone are at least 80 percent funded.
|
(c)
| The policies of the Western Conference of Teamsters Pension Trust precluded the Company from reentering the plan on June 1, 2011. The plan did not assess a withdrawal liability and has not done so since June 1, 2011. Contributions related to the employees previously covered by this plan are now being made to the Teamsters National 401(k) Plan.
|
The Company was listed in the Central States, Road Carriers Local 707 Pension Fund and Teamsters Local 641 Pension Fund’s Forms 5500 as providing more than 5 percent of the total contributions for 20192022 and 2018.2021.
We contributed a total of $115.0$111.5 million, $128.8$115.4 million and $112.6$115.0 million in cash to the multi-employer pension funds for the years ended December 31, 2022, 2021 and 2020, 2019 and 2018, respectively. The following table provides the pension amounts contributed by fund for those funds that are considered to be individually significant for the years ended December 31:
(in millions) | | 2020 | | | 2019 | | | 2018 | |
Central States, Southeast and Southwest Areas Pension Fund | | $ | 69.0 | | | $ | 77.7 | | | $ | 70.7 | |
Teamsters National 401(k) Savings Plan | | | 17.5 | | | | 19.0 | | | | 14.7 | |
Road Carriers Local 707 Pension Fund | | | 1.9 | | | | 2.5 | | | | 2.2 | |
Teamsters Local 641 Pension Fund | | | 1.9 | | | | 2.1 | | | | 1.8 | |
| | | | | | | | | | | | |
(in millions) | | 2022 | | | 2021 | | | 2020 | |
Central States, Southeast and Southwest Areas Pension Fund | | $ | 63.0 | | | $ | 68.4 | | | $ | 69.0 | |
Teamsters National 401(k) Savings Plan | | | 21.7 | | | | 18.9 | | | | 17.5 | |
Road Carriers Local 707 Pension Fund | | | 1.9 | | | | 1.9 | | | | 1.9 | |
Teamsters Local 641 Pension Fund | | | 1.7 | | | | 1.9 | | | | 1.9 | |
In 2006,March 2021, the Pension Protection Act (“PPA”) became law and modified both the applicable Internal Revenue Code, as it applies to multi-employer pension plans, and the Employment Retirement Income SecurityAmerican Rescue Plan Act of 1974, as amended. Federal law establishes minimum funding requirements2021 (the “ARPA”) was passed, which includes, among many other provisions, significant financial assistance for eligible, underfunded multi-employer pension plans. The funding status of these plans is determined by many factors. In 2014, the MPRA became law which modified the ability to suspend accrued benefits of plans facing insolvency by adding a new zone status of Critical and Declining.
If any of ourCompany believes that several multi-employer pension plans fail to meet minimum funding requirements, meet a required funding improvement or rehabilitation plan that the PPA may require for certain of our underfunded plans, obtain from the IRS certain changes to or a waiver of the requirements in how the applicable plan calculates its funding levels, or reduce pension benefits to a level where the requirements are met, then we could be required to make additional contributions to the pension plan. If any of our multi-
employer pension plans enters critical status or worse and our contributions are not sufficient to satisfy any rehabilitation plan schedule, the PPA could require us to make additional surcharge contributions to the multi-employer pension plan in the amount of 5 to 10 percent of the existing contributions requiredemployees covered by our labor agreement for the remaining term of the labor agreement.
In 2016 and 2015,collective bargaining agreements are eligible, including the Central States, Southeast and Southwest Pension Plan and Road Carriers Local 707Areas Pension Fund filed anand the Teamsters Local 641 Pension Fund. The special financial assistance provided by the ARPA is designed to cover the payments of accrued pension benefits through the 2051 plan year and is not subject to any repayment obligations. The Pension Benefit Guaranty Corporation ("PBGC") has issued the application under MPRA withrequirements for special financial assistance and additional guidance, and has begun providing approvals to certain plans. To date we have not been impacted and based upon our understanding of these regulations and guidance, the DepartmentCompany does not anticipate any material short-term impacts of Treasury requestingthis financial assistance. On January 12, 2023, Central States announced that they had received $35.8 billion in funding from the approval of a benefit suspension plan, which was denied. In 2016,American Rescue Plan. The Company is monitoring applications submitted by the New York State Teamsters Conference Pension and Retirement Fund filed a suspension application which was approved and implemented October 2017. The plan requires annual future employer contribution increases of 3.5% to the plan.relevant multi-employer pension plans.
If we fail to make our required contributions to a multi-employer plan, under a funding improvement or rehabilitation plan, it would expose us to penalties including potential withdrawal liability. If the benchmarks that an applicable funding improvementliabilities. The Company has no intention of triggering such withdrawal liabilities due to contributions or rehabilitation plan provides are not met by the end of a prescribed period, the IRS could impose an excise tax on us and the plan’s other contributing employers. These excise taxes are not contributed to the deficient funds, but rather are deposited in the United States general treasury funds.otherwise.
A requirement to materially increase contributions beyond our contractually agreed rate or the imposition of an excise tax on us could have a material adverse impact on the financial results and liquidity of the Company.
401(k) Savings Plans
We sponsor the YRC Worldwide Inc.Yellow Corporation 401(k) Plan and the Reddaway Hourly 401(k) Plan, which are defined contribution plans primarily for employees that our collective bargaining agreements do not cover. The plans permit participants to make contributions to the plans and permit the employer of participants to make contributions on behalf of the participants. Additionally, the Reddaway Hourly 401(k) Plan allows for a non-elective employer contribution. Including non-elective
51
employer contributions, total employer contributions were $3.7$8.9 million in 2020, $12.82022, $6.7 million in 20192021 and $13.3$3.7 million in 2018.2020. Our employees covered under collective bargaining agreements may also participate in union-sponsored 401(k) plans.
Annual Incentive Awards
The Company provides an annual cash incentive compensation plan (Annual Incentive Plan, or AIP) to certain salaried employees across various levels of the organization which is based on factors such as operating revenues and Adjusted EBITDA achieved for the year, compared to targeted operating results. Results from operations include performance incentive compensation expense of $10.0$8.2 million in 2022, $33.1 million in 2021 and $10.0 million in 2020, and $29.8 million in 2018. There were 0 such expenses in 2019. Performance incentive expensesprimarily for 2018 were accrued and paid subsequent to year end.the AIP.
5. Debt and Financing
Our outstanding debt as of December 31, 20202022 and December 31, 20192021 consisted of the following:
| | | | | | | | | | | | | | | | | | | | | | | | |
As of December 31, 2022 (in millions) | | Par Value | | | Discount | | | Commitment
Fee | | | Debt
Issuance
Costs | | | Book Value | | | Effective
Interest
Rate | |
UST Loan Tranche A(a) | | $ | 325.7 | | | $ | — | | | $ | (8.2 | ) | | $ | (2.2 | ) | | $ | 315.3 | | (b) | | 6.3 | % |
UST Loan Tranche B | | | 400.0 | | | | — | | | | (11.0 | ) | | | (2.9 | ) | | | 386.1 | | (b) | | 6.5 | % |
Term Loan (a) | | | 569.1 | | | | (8.4 | ) | | | — | | | | (3.9 | ) | | | 556.8 | | (c) | | 9.5 | % |
ABL Facility | | | — | | | | — | | | | — | | | | — | | | | — | | | N/A | |
Secured Second A&R CDA | | | 23.5 | | | | — | | | | — | | | | — | | | | 23.5 | | | | 7.7 | % |
Unsecured Second A&R CDA | | | 42.5 | | | | — | | | | — | | | | — | | | | 42.5 | | | | 7.7 | % |
Lease financing obligations | | | 213.9 | | | | — | | | | — | | | | (0.1 | ) | | | 213.8 | | (d) | | 17.6 | % |
Total debt | | $ | 1,574.7 | | | $ | (8.4 | ) | | $ | (19.2 | ) | | $ | (9.1 | ) | | $ | 1,538.0 | | | | |
Current maturities of Term Loan | | | — | | | | — | | | | — | | | | — | | | | — | | | | |
Current maturities of Secured and Unsecured Second A&R CDA | | | (66.0 | ) | | | — | | | | — | | | | — | | | | (66.0 | ) | | | |
Current maturities of lease financing obligations | | | (5.8 | ) | | | — | | | | — | | | | — | | | | (5.8 | ) | | | |
Long-term debt, less current portion | | $ | 1,502.9 | | | $ | (8.4 | ) | | $ | (19.2 | ) | | $ | (9.1 | ) | | $ | 1,466.2 | | | | |
As of December 31, 2020 (in millions) | | Par Value | | | Discount | | | Commitment Fee | | | Debt Issuance Costs | | | Book Value | | | Effective Interest Rate | |
Term Loan | | $ | 613.0 | | | $ | (21.0 | ) | | $ | — | | | $ | (9.3 | ) | | $ | 582.7 | | (a) | | 9.5 | % |
ABL Facility | | | 0 | | | | 0 | | | | — | | | | 0 | | | | 0 | | | N/A | |
UST Loan Tranche A(b) | | | 302.3 | | | | — | | | | (17.7 | ) | | | (4.6 | ) | | | 280.0 | | (c) | | 6.5 | % |
UST Loan Tranche B | | | 74.8 | | | | — | | | | (4.4 | ) | | | (1.2 | ) | | | 69.2 | | (c) | | 6.5 | % |
Secured Second A&R CDA | | | 24.1 | | | | 0 | | | | — | | | | (0.1 | ) | | | 24.0 | | | | 7.7 | % |
Unsecured Second A&R CDA | | | 43.9 | | | | 0 | | | | — | | | | (0.1 | ) | | | 43.8 | | | | 7.7 | % |
Lease financing obligations | | | 225.9 | | | | 0 | | | | — | | | | (0.2 | ) | | | 225.7 | | (d) | | 17.2 | % |
Total debt | | $ | 1,284.0 | | | $ | (21.0 | ) | | $ | (22.1 | ) | | $ | (15.5 | ) | | $ | 1,225.4 | | | | | |
Current maturities of Unsecured Second A&R CDA | | | (1.4 | ) | | | 0 | | | | 0 | | | | 0 | | | | (1.4 | ) | | | | |
Current maturities of lease financing obligations | | | (2.6 | ) | | | 0 | | | | 0 | | | | 0 | | | | (2.6 | ) | | | | |
Long-term debt, less current portion | | $ | 1,280.0 | | | $ | (21.0 | ) | | $ | (22.1 | ) | | $ | (15.5 | ) | | $ | 1,221.4 | | | | | |
The Par Value and the Book Value both reflect the accumulated cash funds that have been drawn, plus the accumulated paid-in-kind interest.
(b)Variable interest rate based on the Eurodollar rate, which is currently determined by the 1, 2, 3 or 6-month USD LIBOR, with a floor of 1.0%, plus a fixed margin of 3.5%.
(c)Variable interest rate based on the Eurodollar rate, which is currently determined by the 1, 3 or 6-month USD LIBOR, with a floor of 1.0%, plus a fixed margin of 7.5%.
(d)Interest rate for lease financing obligations is derived from the difference between total rent payment and calculated principal amortization over the life of lease agreements. The remaining term of these obligations ranges between 2024 and 2032 with right of renewal options available.
| | | | | | | | | | | | | | | | | | | | | | | | | As of December 31, 2021 (in millions) | | Par Value | | | Discount | | | Commitment Fee | | | Debt
Issuance
Costs | | | Book Value | | | Effective
Interest
Rate | | UST Loan Tranche A(a) | | $ | 311.4 | | | $ | — | | | $ | (12.9 | ) | | $ | (3.4 | ) | | | 295.1 | | (b) | | 6.4 | % | UST Loan Tranche B | | | 400.0 | | | | — | | | | (17.3 | ) | | | (4.5 | ) | | | 378.2 | | (b) | | 6.5 | % | Term Loan | | | 612.5 | | | | (15.0 | ) | | | — | | | | (6.6 | ) | | | 590.9 | | (c) | | 9.5 | % | ABL Facility | | | — | | | | — | | | | — | | | | — | | | | — | | | N/A | | Secured Second A&R CDA | | | 24.1 | | | | — | | | | — | | | | — | | | | 24.1 | | | | 7.7 | % | Unsecured Second A&R CDA | | | 42.5 | | | | — | | | | — | | | | (0.1 | ) | | | 42.4 | | | | 7.7 | % | Lease financing obligations | | | 224.0 | | | | — | | | | — | | | | (0.2 | ) | | | 223.8 | | (d) | | 17.4 | % | Total debt | | $ | 1,614.5 | | | $ | (15.0 | ) | | $ | (30.2 | ) | | $ | (14.8 | ) | | $ | 1,554.5 | | | | | Current maturities of Unsecured Second A&R CDA | | | (1.5 | ) | | | — | | | | — | | | | — | | | | (1.5 | ) | | | | Current maturities of Secured and Unsecured Second A&R CDA | | | (66.6 | ) | | | — | | | | — | | | | 0.1 | | | | (66.5 | ) | | | | Current maturities of lease financing obligations | | | (4.3 | ) | | | — | | | | — | | | | — | | | | (4.3 | ) | | | | Long-term debt, less current portion | | $ | 1,542.1 | | | $ | (15.0 | ) | | $ | (30.2 | ) | | $ | (14.7 | ) | | $ | 1,482.2 | | | | |
52
(a)
| Variable interest rate based on the Eurodollar rate, which is currently determined by the 1, 3 or 6-month LIBOR, with a floor of 1.0%, plus a fixed margin of 7.5%.
|
(b)
| The Par Value and the Book Value both reflect the accumulated cash funds that have been drawn and the accumulated paid-in-kind interest, which was $2.3 million as of December 31, 2020.
|
(c)
| Variable interest rate based on the Eurodollar rate, which is currently determined by the 1, 2, 3 or 6-month LIBOR, with a floor of 1.0%, plus a fixed margin of 3.5%.
|
(d)
| Interest rate for lease financing obligations is derived from the difference between total rent payment and calculated principal amortization over the life of lease agreements.
|
As of December 31, 2019 (in millions) | | Par Value | | | Discount | | | Commitment Fee | | | Debt Issuance Costs | | | Book Value | | | Effective Interest Rate | |
Term Loan | | $ | 600.0 | | | $ | (28.1 | ) | | $ | — | | | $ | (12.0 | ) | | $ | 559.9 | | | | 10.5 | % |
ABL Facility | | | 0 | | | | 0 | | | | — | | | | 0 | | | | 0 | | | N/A | |
Secured Second A&R CDA | | | 26.0 | | | | 0 | | | | — | | | | (0.1 | ) | | | 25.9 | | | | 7.9 | % |
Unsecured Second A&R CDA | | | 45.2 | | | | 0 | | | | — | | | | (0.1 | ) | | | 45.1 | | | | 7.9 | % |
Lease financing obligations | | | 231.6 | | | | 0 | | | | — | | | | (0.3 | ) | | | 231.3 | | (d) | | 16.5 | % |
Total debt | | $ | 902.8 | | | $ | (28.1 | ) | | $ | — | | | $ | (12.5 | ) | | $ | 862.2 | | | | | |
Current maturities of Unsecured Second A&R CDA | | | (1.4 | ) | | | 0 | | | | 0 | | | | 0 | | | | (1.4 | ) | | | | |
Current maturities of lease financing obligations | | | (2.7 | ) | | | 0 | | | | 0 | | | | 0 | | | | (2.7 | ) | | | | |
Long-term debt, less current portion | | $ | 898.7 | | | $ | (28.1 | ) | | $ | — | | | $ | (12.5 | ) | | $ | 858.1 | | | | | |
US Treasury Loan
On July 7, 2020, the Company and certain of its subsidiaries, as guarantors (the “Term Guarantors”), entered into the UST Tranche A Term Loan Credit Agreement (the “Tranche A UST Credit Agreement”) with The Bank of New York Mellon, as administrative agent and collateral agent and the UST Tranche B Term Loan Credit Agreement (the “Tranche B UST Credit Agreement” and together with the Tranche A UST Credit Agreement, the “UST Credit Agreements”) with The Bank of New York Mellon, as administrative agent and collateral agent, pursuant to which the United States Treasury (“UST”) committed to an aggregate of $700.0$700.0 million to the Company pursuant to the CARES Act. The obligations of the Company under the UST Credit Agreements are unconditionally guaranteed by the Term Guarantors.
The UST Credit Agreements have maturity dates of September 30, 2024, with a single payment at maturity of the outstanding balance. The Tranche A UST Credit Agreement consists of a $300.0$300.0 million term loan and bears interest at a rate of Eurodollar rate (subject to a floor of 1.0%1.0%) plus a margin of 3.5%3.5% per annum, consisting of 1.50%1.50% in cash and the remainder paid-in-kind. Proceeds from the Tranche A UST Credit Agreement will primarily bewere used to meet the Company’s contractual obligations and maintain working capital. The Tranche B UST Credit Agreement consists of a $400.0$400.0 million term loan and bears interest at a rate of Eurodollar rate (subject to a floor of 1.0%1.0%) plus a margin of 3.5%3.5% per annum, paid in cash. Proceeds from the Tranche B UST Credit Agreement will bewere used predominantly for the acquisition of tractors and trailers. Each agreement requires that the Company must maintain minimum “Liquidity” (defined in the UST Credit Agreements to indicate that such amount is calculated as the Company’s unrestricted cash on hand plus the amount of “Availability” (as defined in the loan agreement for the ABL Facility (as defined below)) to the extent such Availability could be borrowed under the ABL Facility) of $125.0 million and a minimum Adjusted EBITDA commencing with the fiscal quarter ending December 31, 2021, to be not less than $100.0 million for the four quarters ending December 31, 2021, $150.0 million for the four quarters ending March 31, 2022, and $200.0 million for the four quarters ending June 30, 2022 and each quarter thereafter. Obligations under the UST Credit Agreements are secured by a perfected first priority security interest in the escrow or controlled account supporting the respective UST Credit Facility, certain tractors and trailers (in the case of the Tranche B UST Credit Agreement) and a perfected junior priority security interest (subject in each case to permitted liens) in substantially all other assets of the Company and the Term Guarantors, subject to certain exceptions.
The UST Credit Agreements have been and will bewere funded through a series of draws made over time as the proceeds are utilized for the purposes outlined by the agreements. Funds drawn on the UST Credit Agreements we initially segregated into restricted accounts and those funds were included in “Restricted amounts held in escrow” in the December 31, 2020 consolidated balance sheet. As of December 31, 2021 and 2022 amounts had been fully withdrawn from the UST Credit Agreements. Borrowings are subject to the various requirements stated in the UST Credit Agreements. As of December 31, 2020, $300.0 million of funds have been drawn on the Tranche A Credit Agreement and $74.8 million of funds have been drawn on the Tranche B UST Credit Agreement. The funds drawn after December 31, 2020, of $176.5 million, on the Tranche B UST Credit Agreement are further described in Note 13 to our consolidated financial statements.
Funds drawn on the UST Credit Agreements are initially segregated into restricted accounts and is included in “Restricted amounts held in escrow” in the accompanying consolidated balance sheet.
The Company issued 15,943,753 shares of common stock as consideration related to the UST Credit Agreements, which has impacted both the capital surplus and common stock, for the par value per share. Accordingly, the fair value of those shares at issuance of approximately $46.7$46.7 million washas been recorded as a commitment fee that will bereducing the par value of debt as of December 31, 2022 and 2021 and is being amortized into interest expense on a straight-line basis over the term of the availability of the UST funds, which ends on September 30, 2024. The Company classified the unamortized commitment fee both as a non-current asset, included within other assets, and as a reduction to long-term debt and financing, less current portion, for the remaining balance associated with the undrawn UST funds and the drawn UST funds, respectively, on our consolidated balance sheet. Prospectively, as the Company draws funds, a portion of the commitment fee will be reclassified from other assets to a reduction to long-term debt and financing, less current portion, based on the amount of UST funds drawn compared to total UST funds available. As of December 31, 2020, a total of $22.1 million of unamortized commitment fees are classified as a reduction to long-term debt and financing and the residual unamortized balance of $19.1 million remains in other assets.
As a result of entering into the UST Credit Agreements, the Company incurred $12.2$12.2 million in debt issuance costs for the origination, legal and related fees. The debt issuance costs will bereduces the par value of the debt and is being amortized into interest expense on a straight-line basis over the term of the UST funds, which ends September 30, 2024. The
Under the UST Credit Agreements and Term Loan (discussed below), the Company classifiedhas a quarterly requirement to maintain a minimum trailing-twelve-month ("TTM") Adjusted EBITDA of $200.0 million through the debt issuance costs both as a non-current asset, included within other assets,maturity of these agreements. Management expects, based on actual and as a reduction to long-term debt and financing, less current portion,forecasted operating results, the Company will meet this covenant requirement for the remaining balances associated with the undrawn UST Funds and the drawn UST funds, respectively, on our consolidated balance sheet. Prospectively, as the Company draws funds, a portion of the debt issuance costs will be reclassified from other assets to a reduction to long-term debt and financing, less current portion, based on the amount of UST funds drawn compared to total UST funds available. next twelve months.As of December 31, 2020, a total of $5.8 million of unamortized debt issuance costs are classified as a reduction to long-term debt and financing and the residual unamortized balance of $5.0 million remains in other assets.
Adjusted EBITDA, defined in our UST Credit Agreements and the Term Loan Agreement (defined below), as amended, (collectively, the “TL Agreements”) as “Consolidated EBITDA,” is a measure that reflects our earnings before interest, taxes, depreciation, and amortization expense, and is further adjusted for, among other things, letter of credit fees, equity-based compensation expense, net gains or losses on property disposals, restructuring charges, transaction costs related to issuances of debt, non-recurring consulting fees, non-cash impairment charges, integration costs, severance, non-recurring charges, the gains or losses from permitted dispositions, discontinued operations, and certain non-cash expenses, charges and losses (provided that if any of such non-cash expenses, charges or losses represents an accrual or reserve for potential cash items in any future period, the cash payment in respect thereof in such future period will be subtracted from Adjusted EBITDA in such future period to the extent paid). Certain expenses that qualify as adjustments are capped at 10.0%10.0% of the trailing-twelve-month Adjusted EBITDA, in aggregate. Adjustments subject to the 10.0%10.0% cap include, but are not limited to, restructuring charges, integration costs, severance, and non-recurring charges. Additionally, all net gains from the disposition of properties are excluded from the definition of Adjusted EBITDA. Therefore any gains previously recognized in Adjusted EBITDA, as that term was previously
53
defined in our filings with the Securities and Exchange Commission (the “SEC”), in accordance with its definition in the Prior Term Loan Agreement, will not be included in the calculation of Adjusted EBITDA under the TL Agreements.
Term Loan
On September 11, 2019, the Company and certain of its subsidiaries, as guarantors (the “Term Guarantors”), amended and restated the existing credit facilities under the credit agreement dated February 13, 2014 (the “Prior Term Loan Agreement”) and entered into a $600.0$600.0 million term loan agreement (“Term Loan”) with funds managed by Apollo Global Management, LLC acting collectively as lead lender, and Alter Domus, as administrative agent and collateral agent. The obligations of the Company under the agreement governing (the “Term Loan Agreement”) are unconditionally guaranteed by the Term Guarantors.
The Term Loan has a maturity date of June 30, 2024, with a single payment due at maturity of the outstanding balance. The Term Loan initially bore interest at Eurodollar rate (subject to a floor of 1.0%1.0%) plus a margin of 7.5%7.5% per annum, payable at least quarterly in cash, subject to a 1.0%1.0% margin step down in the event the Company achieves greater than $400.0$400.0 million in trailing-twelve-month Adjusted EBITDA. Obligations under the Term Loan are secured by a perfected first priority security interest in (subject to permitted liens) assets of the Company and the Term Guarantors, including but not limited to all of the Company’s wholly owned terminals, tractors and trailers, subject to certain limited exceptions.
On April 7, 2020, the Company and certain of its subsidiaries entered into Amendment No. 1 (the “First Term Loan Amendment”) to the Term Loan Agreement as a result of expected future covenant and liquidity tightening due to unprecedented economic deterioration. Beginning the last two weeks of March 2020, our industry and the economy at-large experienced an unexpected and significant decline in economic activity due to the impact of the 2019 coronavirus disease (“COVID-19”) and the resulting business shutdown and shelter-in-place orders made across North America by various governmental entities and private enterprises. The First Term Loan Amendment principally provided additional liquidity allowing the Company to defer quarterly interest payments for the quarter ended March 31, 2020 and the quarter ending June 30, 2020 with almost all of such interest to be paid-in-kind. The First Term Loan Amendment also provided for a waiver with respect to the Adjusted EBITDA financial
covenant during each fiscal quarter during the fiscal year ending December 31, 2020. The interest rate was retroactively reset to a fixed 14%14% during the first six months of 2020.
On July 7, 2020, the Company and the Term Guarantors entered into Amendment No. 2 (the “Second Term Loan Amendment”) to the Term Loan Agreement. The material terms of the Second Term Loan Amendment include, among other things, a consent to the refinancing and conforming changes to the description of collateral set forth in the UST Credit Agreements, permanently capitalizing previously paid-in-kind interest on borrowings under the Term Loan Agreement, and that all future interest shall accrue at Eurodollar rate plus a margin of 7.5%7.5% per annum and 6.5%6.5% per annum in the case of alternative base rate borrowings paid in cash. Additionally, the Company is subject to certain financial covenant requirements that are also detailed above withidentical to those of the UST Treasury Loan description, and as such must maintain minimum Liquidity of $125.0 million and a minimum Adjusted EBITDA commencing with the fiscal quarter ending December 31, 2021, to be not less than $100.0 million for the four quarters ending December 31, 2021, $150.0 million for the four quarters ending March 31, 2022 and $200.0 million for the four quarters ending June 30, 2022 and each quarter thereafter.credit agreements.
$450 Million ABL Facility
On February 13, 2014, we entered into our $450$450 million asset-based loan facility (the “ABL Facility”) from a syndicate of banks arranged by Citizens Bank N.A. (formerly known as RBS Citizens, N.A.) (the “ABL Agent”), Merrill Lynch, Pierce, Fenner & Smith and CIT Finance LLC. The Company and our subsidiaries, YRC Freight, Reddaway, Holland and New Penn are borrowers under the ABL Facility, and certain of the Company’s domestic subsidiaries are guarantors thereunder.
Availability under the ABL Facility is derived by reducing the amount that may be advanced against eligible receivables plus eligible borrowing base cash by certain reserves imposed by the ABL Agent and our outstanding letters of credit and revolving loans. Eligible borrowing base cash is cash that is deposited from time to time into a segregated restricted account and is included in “Restricted amounts held in escrow” in the accompanying consolidated balance sheet.
At our option, borrowings under the ABL Facility bear interest at either: (i) the applicable USD LIBOR rate plus 2.25%2.25%, as amended, or (ii) the base rate (as defined in the ABL Facility) plus 1.25%1.25%, as amended. Letter of credit fees equal to the applicable USD LIBOR margin in effect, 2.25%2.25% as amended, are charged quarterly in arrears on the average daily stated amount of all letters of credit outstanding during the quarter. Unused line fees are charged quarterly in arrears (such unused line fee percentage is equal to 0.375%0.375% per annum if the average revolver usage is less than 50% or 0.25%0.25% per annum if the average revolver usage is greater than 50%).
The ABL Facility is secured by a perfected first priority security interest (subject to permitted liens) in accounts receivable, cash, deposit accounts and other assets related to accounts receivable of the Company and the other loan parties and an additional second priority security interest (subject to permitted liens) in substantially all remaining assets of the borrowers and the guarantors other than the CDA collateral.
54
The ABL Facility contains conditions, representations and warranties, events of default and indemnification provisions that are customary for financings of this type, including, but not limited to, a springing minimum fixed charge coverage ratio covenant, borrowing base reporting, limitations on incurrence of debt, investments, liens on assets, certain sale and leaseback transactions, transactions with affiliates, mergers, consolidations, purchases and sales of assets, and restricted payments. Certain provisions relating to investments, restricted payments and capital expenditures are relaxed upon meeting specified payment conditions or debt repayment conditions.
On July 7, 2020,October 31, 2022, the Company and certain of its subsidiaries entered into Amendment No. 67 (the “ABL"ABL Treasury Amendment”Amendment") in which the maturity date of the ABL Facility was extended to January 9, 20242026 and it included a consentspringing maturity commencing thirty days prior to the refinancing and conforming changes tomaturity of any of the description of collateral set forth inTerm Debt, the UST Credit Agreements as well asTranche A Facility Indebtedness, or the UST Tranche B Facility Indebtedness. The amended facility has an increaseincreased capacity of 0.5%$50 million up to applicable margin to borrowings$500 million and an interest rate of Secured Overnight Financing Rate ("SOFR") + 1.75%.
As of December 31, 2022, our Availability under our ABL Facility was $47.7 million, and our Managed Accessibility was $6.7 million. Availability is derived by reducing the amount that may be advanced against eligible receivables plus eligible borrowing base cash by certain reserves imposed by the ABL Agent and our $361.8 million of outstanding letters of credit. Our Managed Accessibility represents the maximum amount we would access on the ABL Facility (which increaseand is already reflected above).adjusted for eligible receivables plus eligible borrowing base cash measured as of December 31, 2022. If eligible receivables fall below the threshold management uses to measure availability, which is 10% of the borrowing line, the Credit Agreement governing the ABL Facility permits adjustments from eligible borrowing base cash to restricted cash prior to the applicable compliance measurement date, which for the year-end 2022 is as of January 13, 2023. Cash and cash equivalents and Managed Accessibility was $241.8 million as of December 31, 2022.
As of December 31, 2021, our Availability under our ABL Facility was $93.1 million, and our Managed Accessibility was $48.1 million. Cash and cash equivalents and Managed Accessibility was $358.8 million as of December 31, 2021.
The table below summarizes cash and cash equivalents and Managed Accessibility at December 31:
| | | | | | | | |
(in millions) | | 2022 | | | 2021 | |
Cash and cash equivalents | | $ | 235.1 | | | $ | 310.7 | |
Less: amounts placed into restricted cash subsequent to year-end | | | — | | | | — | |
Managed Accessibility | | | 6.7 | | | | 48.1 | |
Total cash and cash equivalents and Managed Accessibility | | $ | 241.8 | | | $ | 358.8 | |
Second Amended and Restated Contribution Deferral Agreement
Pursuant to the terms of the collective bargaining agreement with the IBT, the Company’s subsidiaries began making contributions to the Funds (defined below) for the month beginning June 1, 2011 at the rate of 25%25% of the contribution rate in effect on July 1, 2009. Certain of our subsidiaries are parties to the Amended and Restated Contribution Deferral Agreement (the “A&R CDA”) with certain multiemployer pension funds named therein (collectively, the “Funds”) pursuant to which we are permitted to continue to defer pension payments and deferred interest owed to such Funds as of July 22, 2011 (each, “Deferred Pension Payments” and “Deferred Interest”). The A&R CDA was last amended in January 2018 (herein referred to as the “Amended Second A&R CDA”). The Deferred Pension Payments and Deferred Interest bear interest at a floating rate as set forth in the Amended Second A&R CDA as well as annual scheduled amortization equal to 2.0%2.0% of the amount outstanding as of November 30 of each applicable year. The Amended Second A&R CDA further provides for first lien on certain security first priority real estate collateral and a maturity date of December 31, 2022 on the Deferred Pension Payments and Deferred Interest obligations.
On January 3, 2023, the outstanding balance of the A&R CDA was paid in full, and in compliance with the terms of the agreement.
55
Maturities
The principal maturities over the next five years and thereafter of total debt as of December 31, 20202022 was as follows:
| | | | | | | | | | | | | | | | | | | | | | | | | | | | |
(in millions) | | UST Tranche A(a) | | | UST Tranche B | | | Term Loan | | | ABL Facility | | | Second A&R
CDA | | | Lease Financing
Obligations(b) | | | Total | |
2023 | | $ | — | | | $ | — | | | $ | — | | | $ | — | | | $ | 66.0 | | | $ | 5.8 | | | $ | 71.8 | |
2024 | | | 325.7 | | | | 400.0 | | | | 569.1 | | | | — | | | | — | | | | 4.4 | | | | 1,299.2 | |
2025 | | | — | | | | — | | | | — | | | | — | | | | — | | | | 4.1 | | | | 4.1 | |
2026 | | | — | | | | — | | | | — | | | | — | | | | — | | | | 0.6 | | | | 0.6 | |
2027 | | | — | | | | — | | | | — | | | | — | | | | — | | | | — | | | | — | |
Thereafter | | | — | | | | — | | | | — | | | | — | | | | — | | | | 199.0 | | | | 199.0 | |
Total | | $ | 325.7 | | | $ | 400.0 | | | $ | 569.1 | | | $ | — | | | $ | 66.0 | | | $ | 213.9 | | | $ | 1,574.7 | |
(in millions) | | Term Loan | | | ABL Facility | | | UST Tranche A(b) | | | UST Tranche B | | | Second A&R CDA | | | Lease Financing Obligations(a) | | | Total | |
2021 | | $ | 0 | | | $ | 0 | | | $ | 0 | | | $ | 0 | | | $ | 1.4 | | | $ | 2.5 | | | $ | 3.9 | |
2022 | | | 0 | | | | 0 | | | | 0 | | | | 0 | | | | 66.6 | | | | 4.1 | | | | 70.7 | |
2023 | | | 0 | | | | 0 | | | | 0 | | | | 0 | | | | 0 | | | | 4.9 | | | | 4.9 | |
2024 | | | 613.0 | | | | 0 | | | | 302.3 | | | | 74.8 | | | | 0 | | | | 2.4 | | | | 992.5 | |
2025 | | | 0 | | | | 0 | | | | 0 | | | | 0 | | | | 0 | | | | 0.2 | | | | 0.2 | |
Thereafter | | | 0 | | | | 0 | | | | 0 | | | | 0 | | | | 0 | | | | 211.8 | | | | 211.8 | |
Total | | $ | 613.0 | | | $ | 0 | | | $ | 302.3 | | | $ | 74.8 | | | $ | 68.0 | | | $ | 225.9 | | | $ | 1,284.0 | |
A portion of the applicable interest is paid-in-kind, which may impact the relevant principal maturities prospectively.
(b)Lease financing obligations subsequent to 2027 of $199.0 million consist primarily of interest payments.
(a)
| Lease financing obligations subsequent to 2025 of $211.8 million consist primarily of interest payments.
|
(b)
| A portion of the applicable interest is paid-in-kind, which may impact the relevant principal maturities prospectively.
|
Fair Value Measurement
The book value and estimated fair values of our long-term debt, including current maturities and other financial instruments, are summarized as follows:
| | | December 31, 2020 | | | December 31, 2019 | | | December 31, 2022 | | | December 31, 2021 | |
(in millions) | | Book Value | | | Fair Value | | | Book Value | | | Fair Value | | | Book Value | | Fair Value | | Book Value | | Fair Value | |
UST Loans | | | $ | 701.4 | | | $ | 703.6 | | | $ | 673.3 | | | $ | 636.5 | |
Term Loan | | $ | 582.7 | | | $ | 611.0 | | | $ | 559.9 | | | $ | 559.3 | | | | 556.8 | | | | 523.6 | | | | 590.9 | | | | 612.9 | |
UST Loans | | | 349.2 | | | | 322.0 | | | | — | | | | — | | |
Second A&R CDA | | | 67.8 | | | | 67.8 | | | | 71.0 | | | | 71.7 | | | | 66.0 | | | | 66.3 | | | | 66.5 | | | | 66.6 | |
Lease financing obligations | | | 225.7 | | | | 225.8 | | | | 231.3 | | | | 233.7 | | | | 213.8 | | | | 213.7 | | | | 223.8 | | | | 223.7 | |
Total debt | | $ | 1,225.4 | | | $ | 1,226.6 | | | $ | 862.2 | | | $ | 864.7 | | | $ | 1,538.0 | | | $ | 1,507.2 | | | $ | 1,554.5 | | | $ | 1,539.7 | |
The fair values of the Term Loan and Second A&R CDA were estimated based on thinly traded, but observable prices (level two inputs for fair value measurements). The fair value of the UST Loans is estimated using certain inputs that are unobservable (level three input for fair value measurement), which are based on the discounted amount of future cash flows using our current estimated incremental rate of borrowing for similar liabilities or assets. The fair value of the lease financing obligations are estimated using a publicly traded secured loan with similar characteristics (level three input for fair value measurement).
Liquidity
Our principal sources56
6. Leases
| | | | | | | | | | |
Leases (in millions) | | | | December 31, 2022 | | | December 31, 2021 | |
Assets | | | | | | | | |
Operating lease right-of-use assets | | | | $ | 139.7 | | | $ | 184.8 | |
Liabilities | | | | | | | | |
Current | | | | | | | | |
Current operating lease liabilities | | | | $ | 53.1 | | | $ | 76.5 | |
Noncurrent | | | | | | | | |
Operating lease liabilities | | | | | 94.6 | �� | | | 118.9 | |
Total lease liabilities | | | | $ | 147.7 | | | $ | 195.4 | |
| | | | | | | | | | |
Lease Cost (in millions) | | | | Year Ended December 31, 2022 | | | Year Ended December 31, 2021 | |
Operating lease cost(a) | | | | $ | 95.7 | | | $ | 133.3 | |
Short-term cost(b) | | | | 27.3 | | | 30.1 | |
Variable lease cost(b) | | | | 9.6 | | | 10.8 | |
Total lease cost | | | | $ | 132.6 | | | $ | 174.2 | |
(a)Operating lease cost represent non-cash amortization of
liquidity are cashROU assets and
cash equivalents, available borrowings under our ABL Facilityaccretion of the discounted lease liabilities and
any prospective net cash flow from operations. As of December 31, 2020, our cash and cash equivalents were $439.3 million.As of December 31, 2020, our maximum availability under our ABL Facility was $43.7 million, and our managed accessibility is $4.0 million. Maximum availability is derived by reducing the amount that may be advanced against eligible receivables plus eligible borrowing base cash by certain reserves imposed by the ABL Agent and our $353.3 million of outstanding letters of credit. Our Managed Accessibility of $4.0 million represents the maximum amount we would accesssegregated on the ABL Facilitystatement of consolidated cash flows.
(b)These costs are classified as operating expense and
is adjusted for eligible receivables plus eligible borrowing base cash measured as of December 31, 2020. If eligible receivables fall below the threshold management uses to measure availability, which is 10% of the borrowing line, the Credit Agreement governing the ABL Facility permits adjustments from eligible borrowing base cash to restricted cash prior to the compliance measurement date of January 15, 2021. As of January 15, 2021, we had less than 10% of the borrowing line in eligible receivables and moved $3.1 million of cash into restricted cash, as permitted under the ABL Facility, which effectively put our cash and cash equivalents and Managed Accessibility to $440.2 million as of December 31, 2020.As of December 31, 2019, our availability under our ABL Facility was $37.7 million. Of the $37.7 million in availability, Managed Accessibility was $0.2 million. Our cash and cash equivalents and Managed Accessibility was $80.4 million as of December 31, 2019.
recorded primarily within purchased transportation.
The table below summarizes cash and cash equivalents and Managed Accessibility at December 31:
(in millions) | | 2020 | | | 2019 | |
Cash and cash equivalents | | $ | 439.3 | | | $ | 109.2 | |
Less: amounts placed into restricted cash subsequent to year-end | | | (3.1 | ) | | | (29.0 | ) |
Managed Accessibility | | | 4.0 | | | | 0.2 | |
Total cash and cash equivalents and Managed Accessibility | | $ | 440.2 | | | $ | 80.4 | |
Covenants
The Company has a covenant requirement to maintain Liquidity of $125.0 million until the first date on which trailing twelve-month Adjusted EBITDA is greater than $200.0 million. The Company is in compliance with the applicable covenant as of December 31, 2020. With Liquidity as of December 31, 2020, UST loan availability, and forecasted operating results, management expects the Company will meet this covenant requirement for the next twelve months.
Beginning with the fiscal quarter ended December 31, 2021, the Company has a requirement to maintain a trailing twelve-month Adjusted EBITDA of $100.0 million. Management expects based on forecasted operating results the Company will meet this covenant requirement for the period it becomes effective in the next twelve months.
6. Leases
Leases (in millions) | | | | December 31, 2020 | | | December 31, 2019 | |
Assets | | | | | | | | | | |
Operating lease right-of-use assets | | | | $ | 276.0 | | | $ | 386.0 | |
Liabilities | | | | | | | | | | |
Current | | | | | | | | | | |
Current operating lease liabilities | | | | $ | 114.2 | | | $ | 120.8 | |
Noncurrent | | | | | | | | | | |
Operating lease liabilities | | | | | 172.6 | | | | 246.3 | |
Total lease liabilities | | | | $ | 286.8 | | | $ | 367.1 | |
Lease Cost (in millions) | | | | Year Ended December 31, 2020 | | | Year Ended December 31, 2019 | |
Operating lease cost(a) | | | | $ | 160.9 | | | $ | 168.0 | |
Short-term cost(b) | | | | 16.3 | | | 14.2 | |
Variable lease cost(b) | | | | 9.7 | | | 5.9 | |
Total lease cost | | | | $ | 186.9 | | | $ | 188.1 | |
(a)
| Operating lease cost represent non-cash amortization of ROU assets and accretion of the discounted lease liabilities and is segregated on the statement of consolidated cash flows.
|
(b)
| These costs are classified and recorded within purchased transportation; fuel, operating expenses and supplies.
|
| | | | |
Remaining Maturities of Lease Liabilities (in millions) | | Operating Leases | |
2023 | | $ | 67.0 | |
2024 | | | 34.6 | |
2025 | | | 23.1 | |
2026 | | | 18.8 | |
2027 | | | 15.5 | |
After 2027 | | | 39.6 | |
Total lease payments | | $ | 198.6 | |
Less: Imputed interest | | | 50.9 | |
Present value of lease liabilities | | $ | 147.7 | |
Remaining Maturities of Lease Liabilities | | Operating Leases | |
2021 | | $ | 142.5 | |
2022 | | | 95.0 | |
2023 | | | 52.7 | |
2024 | | | 22.9 | |
2025 | | | 10.8 | |
After 2025 | | | 26.9 | |
Total lease payments | | $ | 350.8 | |
Less: Interest | | | 64.0 | |
Present value of lease liabilities | | $ | 286.8 | |
| | | | | | | | |
Lease Term and Discount Rate | | 2022 | | | 2021 | |
Weighted-average remaining lease term - operating leases (years) | | | 5.4 | | | | 4.0 | |
Weighted-average discount rate - operating leases | | | 10.7 | % | | | 11.6 | % |
Lease Term and Discount Rate (years and percent) | | Weighted-Average Remaining Lease Term | | | Weighted-Average Discount Rate | |
Operating leases | | | 3.3 | | | 12.1% | |
| | | | | | |
Other Information (in millions) | Year Ended December 31, 2022 | | Year Ended December 31, 2021 | |
Cash paid for amounts included in the measurement of lease liabilities | | | | |
Operating cash flows from operating leases | $ | 95.3 | | $ | 136.3 | |
Leased assets obtained in exchange for new operating lease liabilities | | 7.7 | | | 18.3 | |
Other Information (in millions) | Year Ended December 31, 2020 | | Year Ended December 31, 2019 | |
Cash paid for amounts included in the measurement of lease liabilities | | | | | | |
Operating cash flows from operating leases | $ | 134.0 | | $ | 154.6 | |
Leased assets obtained in exchange for new operating lease liabilities | | 13.5 | | | 129.7 | |
For the year ended December 31, 2020, we entered into new operating lease commitments for revenue equipment totaling $0.6 million, with such payments to be made over the average lease term of 4 years with a capital equivalent of $0.7 million. As of December 31, 2020, our operating lease obligations for 2021 are $142.5 million and our operating lease obligations through 2031 total $350.8 million.
7. Equity-Based Compensation Plans
We reserved 2.5 million shares for issuance to key management personnel and directors under the 2019 Incentive and Equity Award Plan, in addition to the 5.0 million shares reserved for the Amended and Restated 2011 Incentive and Equity Award Plan. As of December 31, 2020, 2.82022, 1.4 million shares remain available for future issuance under these plans. The plans permit the issuance of restricted stock and stock units, as well as options, stock appreciation rights, and performance stock and performance stock unit awards. Awards under the plan can be generally satisfied in cash or shares at the discretion of the Board of Directors. According to the plan provisions, the stock units provide the holders the right to receive one share of our Common Stock upon vesting (and distribution) of one stock unit. The plan requires the exercise price of any option granted may not be less than the fair market value of a share of our Common Stock on the date of grant.
Additionally, we reserved 3.0 million shares for issuance to employees under the 2020 employee stock purchase plan.
Performance Based Awards
In 2019, the Company granted performance stock and performance stock unit awards to key management personnel and directors, respectively, under its 2011 and 2019 Incentive and Equity Award Plans. In addition to meeting service conditions, these awards were to vest upon the attainment As of a 30-day volume-weighted average share price; however, no awards were earned based upon the actual share prices. As such, theseDecember 31, 2022, 2.6 million shares have been included in the shares that remain available for future issuance under these plans, as disclosed above. For the years ended December 31, 2020this plan.
57
Restricted Stock and 2019, the Company recorded compensation expense for these stock awards of $1.8 million and $2.6 million, respectively.Stock Units
Restricted Stock
A summary of the activity of our unvested restricted stock and stock unit awards are presented in the following table:
| | Shares/units (in thousands) | | | Weighted Average Grant-Date Fair Value | | | | | | | | | |
Unvested at December 31, 2017 | | | 1,307 | | | $ | 11.55 | | |
Granted | | | 730 | | | | 9.35 | | |
Vested and distributed | | | (457 | ) | | | 10.91 | | |
Forfeited | | | (164 | ) | | | 11.31 | | |
Unvested at December 31, 2018 | | | 1,416 | | | $ | 10.65 | | |
Granted | | | 437 | | | | 5.39 | | |
Vested and distributed | | | (779 | ) | | | 9.16 | | |
Forfeited | | | (81 | ) | | | 10.74 | | |
| | | Shares/units
(in thousands) | | | Weighted
Average
Grant-Date
Fair Value | |
Unvested at December 31, 2019 | | | 993 | | | $ | 9.50 | | | | 993 | | | $ | 9.50 | |
Granted | | | 1,656 | | | | 2.12 | | | | 1,656 | | | | 2.12 | |
Vested and distributed | | | (820 | ) | | | 5.44 | | | | (820 | ) | | | 5.44 | |
Forfeited | | | (258 | ) | | | 2.96 | | | | (258 | ) | | | 2.96 | |
Unvested at December 31, 2020 | | | 1,571 | | | $ | 4.90 | | | | 1,571 | | | | 4.90 | |
Granted | | | | 1,151 | | | | 7.21 | |
Vested and distributed | | | | (709 | ) | | | 5.28 | |
Forfeited | | | | (239 | ) | | | 3.21 | |
Unvested at December 31, 2021 | | | | 1,774 | | | | 6.48 | |
Granted | | | | 662 | | | | 9.39 | |
Vested and distributed | | | | (580 | ) | | | 5.69 | |
Forfeited | | | | (81 | ) | | | 9.80 | |
Unvested at December 31, 2022 | | | | 1,775 | | | $ | 7.65 | |
AllAs of December 31, 2022, all of the members of the Board of Directors have deferred receipt of the Common Stock underlying some or all of the restricted stock units they have been awarded until a later date, such as when the director ceases to serve on the Board or, under certain circumstances, upon a change of control. Thus, while some of these restricted stock units have vested, the directors have not yet received the underlying Common Stock. For the years ended December 31, 2020, 2019,2022, 2021, and 2018,2020, the total number of restricted stock units that are vested but for which the underlying Common Stock has not been distributed was 580,000, 500,000,800,000, 570,000, and 660,000,580,000, respectively; these shares are shown as unvested in the above table.
The intrinsic value of unvested shares as of December 31, 20202022 was $7.0$4.5 million. The Company records expense on a straight-line basis over the vesting term. For the years ended December 31, 2020, 20192022, 2021 and 2018,2020, the Company recorded compensation expense for restricted stock and stock unit awards of $2.9$4.9 million, $3.6$3.8 million, and $6.2$2.9 million, respectively. Unrecognized compensation expense related to restricted stock and stock unit awards of $1.6$5.8 million at December 31, 20202022 is expected to be recognized over a weighted-average period of 0.71.4 years.
The vesting provisions for the restricted stock and stock unit awards and the related number of shares granted during the year ended December 31 are as follows:
| | | Shares/units (in thousands) | | | Shares/units (in thousands) | |
Vesting Terms | | 2020 | | | 2019 | | | 2018 | | | 2022 | | | 2021 | | | 2020 | |
50% immediately and 50% on the 1 year anniversary of grant date | | | 0 | | | | 162 | | | | 0 | | |
33.3% within 30 days and 33.3% on the 1 and 2 year anniversary of grant date | | | | 151 | | | | 494 | | | | 12 | |
20% per year for five years | | | | 150 | | | | 492 | | | | — | |
100% immediately | | | 129 | | | | 186 | | | | 132 | | | | 77 | | | | 135 | | | | 129 | �� |
33.3% per year for three years | | | 15 | | | | 89 | | | | 452 | | |
33.3% after 30 days and 33.3% on the 1 and 2 year anniversary of grant date | | | 12 | | | | 0 | | | | 0 | | |
25% immediately and 25% on the 1, 2 and 3 year anniversary of grant date | | | 1,500 | | | | 0 | | | | 0 | | | | — | | | | — | | | | 1,500 | |
100% on July 31, 2018 | | | 0 | | | | 0 | | | | 146 | | |
Other various vesting terms | | | | 284 | | | | 30 | | | | 15 | |
Total restricted stock and stock units granted | | | 1,656 | | | | 437 | | | | 730 | | | | 662 | | | | 1,151 | | | | 1,656 | |
The fair value of non-vested shares is determined based on the closing trading price of our shares on the grant date. The fair value of shares vested and distributed during the years ended December 31, 2022, 2021 and 2020 2019 and 2018 was $4.5$3.3 million, $7.1$3.7 million, and $5.0$4.5 million, respectively.
The outstanding awards under our stock compensation plans are considered participating securities in our earnings (loss) per share calculation. See Note 10 for additional details.58
8. Income Taxes
Deferred tax assets (liabilities) were comprised of the following at December 31:
| | | | | | | | |
(in millions) | | 2022 | | | 2021(a) | |
Depreciation | | $ | (146.8 | ) | | $ | (104.5 | ) |
Operating lease right-of-use assets | | | (35.1 | ) | | | (42.1 | ) |
Other, including debt and interest | | | (19.5 | ) | | | (16.4 | ) |
Deferred tax liabilities | | | (201.4 | ) | | | (163.0 | ) |
Claims and insurance | | | 90.6 | | | | 88.6 | |
Net operating loss carryforwards | | | 229.7 | | | | 202.5 | |
Section 163(j) interest limitation carryforwards | | | 50.3 | | | | 11.2 | |
Employee benefit accruals | | | 66.9 | | | | 55.6 | |
Lease financing obligations | | | 53.3 | | | | 50.8 | |
Operating lease liabilities | | | 39.3 | | | | 46.3 | |
Employer payroll taxes | | | — | | | | 9.7 | |
Other, including debt and interest | | | 17.1 | | | | 27.8 | |
Deferred tax assets | | | 547.2 | | | | 492.5 | |
Valuation allowance | | | (345.5 | ) | | | (328.1 | ) |
Net deferred tax assets | | | 201.7 | | | | 164.4 | |
Net deferred tax asset | | $ | 0.3 | | | $ | 1.4 | |
(in millions) | | 2020 | | | 2019 | |
Depreciation | | $ | (83.8 | ) | | $ | (99.5 | ) |
Operating lease right-of-use assets | | | (65.3 | ) | | | (93.7 | ) |
Deferred revenue | | | (3.3 | ) | | | (6.3 | ) |
Intangibles | | | (2.9 | ) | | | (3.4 | ) |
State taxes | | | (19.6 | ) | | | (19.6 | ) |
Other, including debt and interest | | | (22.3 | ) | | | (16.0 | ) |
Deferred tax liabilities | | | (197.2 | ) | | | (238.5 | ) |
Claims and insurance | | | 84.4 | | | | 89.9 | |
Net operating loss carryforwards | | | 216.7 | | | | 210.7 | |
Employee benefit accruals | | | 23.9 | | | | 94.8 | |
Sale/leaseback transactions | | | 53.0 | | | | 55.5 | |
Operating lease liabilities | | | 68.7 | | | | 93.8 | |
Employer payroll taxes | | | 20.0 | | | | — | |
Other, including debt and interest | | | 37.0 | | | | 28.4 | |
Deferred tax assets | | | 503.7 | | | | 573.1 | |
Valuation allowance | | | (305.6 | ) | | | (334.0 | ) |
Net deferred tax assets | | | 198.1 | | | | 239.1 | |
Net deferred tax asset | | $ | 0.9 | | | $ | 0.6 | |
Certain reclasses have been made to the 2021 balances in this table to conform to the 2022 presentation.
The net deferred tax assetYellow Corporation is the parent of $0.9 million and $0.6 million asan affiliated group of December 31, 2020 and 2019, respectively, is included ascorporations which join in the filing of a separate line item of the accompanyingU.S. federal consolidated balance sheets. Current income tax payable was $1.9 millionreturn. Additionally, the Company files income tax returns in each state jurisdiction which imposes an income tax. The Company also files income tax returns in Canada and $1.6 million asits provinces and other foreign jurisdictions; our other foreign jurisdictions income tax activity is immaterial. Cash paid, net of December 31, 2020 and 2019, respectively, andrefunds received, for income taxes is included in “Other current and accrued liabilities” in the accompanying consolidated balance sheets.nominal for all years presented.
As of December 31, 2020,2022, the Company has remaining federal net operating loss carryforwards of approximately $753.1$846.2 million. Deemed ownership changes that occurred in January 2014 and in prior years imposed annual and cumulative limits under the Internal Revenue Code on the utilization of these carryforwards. These limits are not expected to inhibit the Company’s ability to utilize these losses over their carry forward periods. Carryforwards of $684.6$655.0 million incurred prior to 2018 expire between 2030 and 2037.2037. Pursuant to the Tax Cuts and Jobs Act of 2017, net operating losses incurred after 2017 are available to be carried forward indefinitely. As of December 31, 2020,2022, the Company has only nominal amounts of general business and other credit carryforwards, which will likely not be utilized and will expire between 2027 and 2031 if not used.
As of December 31, 20202022 and 2019,2021, a valuation allowance of $305.6$345.5 million and $334.0$328.1 million, respectively, has been established for deferred tax assets because, based on available sources of future taxable income, it is more likely than not that those assets will not be realized.
A reconciliation between income taxes at the federal statutory rate and the consolidated effective tax rate follows for the years ended December 31:
| | | | | | | | | | | | |
| | 2022 | | | 2021 | | | 2020 | |
Federal statutory rate | | | 21.0 | % | | | 21.0 | % | | | 21.0 | % |
State income taxes, net | | | 6.0 | % | | | (1.1 | %) | | | (1.2 | %) |
Foreign tax rate differential | | | 5.6 | % | | | (1.3 | %) | | | (1.0 | %) |
Non-deductible debt costs | | | 8.7 | % | | | (2.2 | %) | | | (1.6 | %) |
Non-deductible compensation | | | 4.6 | % | | | (0.5 | %) | | | (1.0 | %) |
Other permanent differences | | | 4.9 | % | | | (0.3 | %) | | | 0.3 | % |
Effect of law and rate changes | | | (54.8 | %) | | | (4.6 | %) | | | (4.6 | %) |
Valuation allowance | | | 21.0 | % | | | (14.1 | %) | | | (15.1 | %) |
Benefit from intraperiod tax allocation | | | (— | %) | | | — | % | | | 20.0 | % |
Net change in unrecognized tax benefits | | | (0.1 | )% | | | 0.3 | % | | | 8.9 | % |
Other, net (primarily prior year return to provision) | | | 0.8 | % | | | (0.1 | %) | | | 1.1 | % |
Effective tax rate | | | 17.7 | % | | | (2.9 | %) | | | 26.8 | % |
59
| | 2020 | | | 2019 | | | 2018 | |
Federal statutory rate | | | 21.0 | % | | | 21.0 | % | | | 21.0 | % |
State income taxes, net | | | (1.2 | %) | | | (0.7 | %) | | | 14.1 | % |
Foreign tax rate differential | | | (1.0 | %) | | | (2.6 | %) | | | 12.1 | % |
Permanent differences | | | (2.3 | %) | | | (0.6 | %) | | | 8.3 | % |
Valuation allowance | | | (19.7 | )% | | | (17.7 | )% | | | (17.5 | )% |
Benefit from intraperiod tax allocation | | | 20.0 | % | | | 0 | % | | | 0 | % |
Net change in unrecognized tax benefits | | | 8.9 | % | | | 0.6 | % | | | (0.9 | )% |
Other, net (primarily prior year return to provision) | | | 1.1 | % | | | 4.0 | % | | | (1.6 | )% |
Effective tax rate | | | 26.8 | % | | | 4.0 | % | | | 35.5 | % |
The income tax provision (benefit) consisted of the following for the years ended December 31:
| (in millions) | | 2020 | | | 2019 | | | 2018 | | | 2022 | | | 2021 | | | 2020 | |
Current: | | | | | | | | | | | | | | | | | | | | | |
Federal | | $ | (6.2 | ) | | $ | 0 | | | $ | 0 | | | $ | — | | | $ | — | | | $ | (6.2 | ) |
State | | | 0.4 | | | | (3.3 | ) | | | 5.4 | | | | 2.4 | | | | 1.4 | | | | 0.4 | |
Foreign | | | 1.1 | | | | 2.0 | | | | 6.8 | | | | 2.7 | | | | 2.2 | | | | 1.1 | |
Current income tax expense (benefit) | | | (4.7 | ) | | | (1.3 | ) | | | 12.2 | | | | 5.1 | | | | 3.6 | | | | (4.7 | ) |
| | | | | | | | | | | | | | | | | | | | | |
Deferred: | | | | | | | | | | | | | | | | | | | | | |
Federal | | | (9.4 | ) | | | 0 | | | | 0 | | | | — | | | | — | | | | (9.4 | ) |
State | | | (5.2 | ) | | | 0 | | | | 0 | | | | — | | | | — | | | | (5.2 | ) |
Foreign | | | (0.3 | ) | | | (3.0 | ) | | | (1.1 | ) | | | (0.4 | ) | | | (0.5 | ) | | | (0.3 | ) |
Deferred income tax benefit | | | (14.9 | ) | | | (3.0 | ) | | | (1.1 | ) | | | (0.4 | ) | | | (0.5 | ) | | | (14.9 | ) |
| | | | | | | | | | | | | | | | | | | | | |
Income tax expense (benefit) | | $ | (19.6 | ) | | $ | (4.3 | ) | | $ | 11.1 | | | $ | 4.7 | | | $ | 3.1 | | | $ | (19.6 | ) |
| | | | | | | | | | | | | | | | | | | | | |
Based on the income (loss) before income taxes: | | | | | | | | | | | | | | | | | | | | | |
Domestic | | $ | (77.4 | ) | | $ | (104.7 | ) | | $ | 13.6 | | | $ | 19.0 | | | $ | (111.3 | ) | | $ | (77.4 | ) |
Foreign | | | 4.3 | | | | (3.6 | ) | | | 17.7 | | | | 7.5 | | | | 5.3 | | | | 4.3 | |
Income (Loss) before income taxes | | $ | (73.1 | ) | | $ | (108.3 | ) | | $ | 31.3 | | | $ | 26.5 | | | $ | (106.0 | ) | | $ | (73.1 | ) |
The Company applies the intraperiod tax allocation rules to allocate income taxes among continuing operations, other comprehensive income (loss), and additional paid-in capital when our situation meets the criteria as prescribed in the rule. Accounting Standards Update (ASU) 2019-12, Income Taxes (Topic 740) Simplifying the Accounting for Income Taxes became effective and was adopted prospectively by the Company on January 1, 2021. ASU 2019-12removed the exception to the intraperiod tax allocation rules on a prospective basis; as such, there was no domestic deferred benefit recognized in periods subsequent to 2020. During 2020, the Company recognized $14.6$14.6 million of deferred benefit in the consolidated statement of consolidated operations and an equal and offsetting deferred tax expense in other comprehensive income (loss) included in the consolidated statement of consolidated comprehensive income (loss) due to the application of the exception within the intraperiod tax allocation rules. This allocation hashad no effect on total tax provision or total valuation allowance. There was 0 domestic deferred benefit recognized in 2019 or 2018, as the exception did not apply.
Uncertain Tax Positions
A rollforward of the total amount of unrecognized tax benefits for the years ended December 31 is as follows:
| (in millions) | | 2020 | | | 2019 | | | 2022 | | | 2021 | |
Unrecognized tax benefits at January 1 | | $ | 58.5 | | | $ | 59.2 | | | $ | 40.4 | | | $ | 40.7 | |
| | | | | | | | | | | | | | |
Increases related to: | | | | | | | | | | | | | | |
Tax positions taken during a prior period | | | 0 | | | | 0 | | | | 0.1 | | | | — | |
Tax positions taken during the current period | | | 0.3 | | | | 0.5 | | | | 0.3 | | | | 0.3 | |
| | | | | | | | | | | | | | |
Decreases related to: | | | | | | | | | | | | | | |
Tax positions taken during a prior period | | | (0.2 | ) | | | (0.1 | ) | | | — | | | | — | |
Lapse of applicable statute of limitations | | | (17.9 | ) | | | (1.1 | ) | | | (7.3 | ) | | | (0.6 | ) |
| | | | | | | | | | | | | | |
Unrecognized tax benefits at December 31 | | $ | 40.7 | | | $ | 58.5 | | | $ | 33.5 | | | $ | 40.4 | |
At December 31, 20202022 and 2019,2021, there are $3.3$3.0 million and $9.8$3.0 million, respectively, of benefits that, if recognized, would affect the effective tax rate. The differences between these amounts and the amounts appearing in the table above represent unrecognized tax benefits which have been netted against deferred tax assets for net operating loss carryforwards and not recorded to the liability for unrecognized tax benefits. During the yearyears ended December 31, 20202022 and December 31, 2021 we paid 0no amounts to settle audits. During the year ended December 31, 2019, we paid inconsequential amounts of tax and interest to settle state audits of tax years 2010 through 2014 for certain of our subsidiaries, and we reduced our previously recorded liability for unrecognized tax benefits accordingly.
During 2019, the60
The Company experienced only nominal activitiesactivity with regard to interest on the uncertain tax positions.positions for both 2022 and 2021. The Company accrued 0no penalties relative to uncertain tax positions in either 20202022 or 2019.2021. The Company has elected to treat interest and penalties on uncertain tax positions as “Interest expense” and “Other operating expenses”, respectively.
It is reasonably possible that the existing unrecognized tax benefits may decrease over the next twelve months by as much as $0.7$0.5 million because of developments in examinations, or from the expiration of statutes of limitation.
Tax years that remain subject to examination for our major tax jurisdictions as of December 31, 2020:2022:
| | |
Statute remains open | | 2014-2019
| 2014-2021 |
Tax years not examined | | 2014-2020
| 2014-2022 |
DuringIn 2020, the CARES Act was enacted in response to the COVID-19 pandemic. The CARES Act containscontained numerous income tax provisions, such as relaxing the limitations on the deductibility of interest and the carryback of net operating losses for specific periods. The Company has performed an analysis of these provisions and due to the unavailability of excess taxable income in the current or carry back periods, and the application of a valuation allowance to deferred tax assets, the Company's effective income tax rate and its tax provision are currently unaffected by the income tax provisions of the CARES Act.
On August 16, 2022, the United States enacted the Inflation Reduction Act (the “IRA”). The IRA included provisions related to aspects of corporate income taxes. We do not currently expect the IRA to have a significant impact on the Company’s effective income tax rate nor its provision for income taxes.
9. Shareholders’ Deficit
The following reflects the activity in the shares of our common stock for the years ended December 31:
| Common Shares (in thousands) | | 2020 | | | 2019 | | | 2018 | | | 2022 | | 2021 | | 2020 | |
Beginning balance | | | 33,715 | | | | 33,090 | | | | 32,733 | | | | 50,955 | | | | 50,192 | | | | 33,715 | |
Equity issuance - UST commitment fee | | | 15,944 | | | | - | | | | - | | | | — | | | | — | | | | 15,944 | |
Issuance of equity awards, net | | | 533 | | | | 625 | | | | 357 | | | | 646 | | | | 763 | | | | 533 | |
Ending balance | | | 50,192 | | | | 33,715 | | | | 33,090 | | | | 51,601 | | | | 50,955 | | | | 50,192 | |
The shares issued to the UST are subject to a Voting Trust Agreement (the “Voting Trust Agreement”)voting trust agreement entered on July 9, 2020 which provides that all shares of the Company’s common stock owned by the UST shall be delivered to a voting trust and voted
in proportion as all other common stock owned by the UST shall be delivered to a voting trust and voted in proportion as all other common stock shares are voted, subject to certain exceptions defined therein. Additionally, prior to one year after the date of the Voting Trust Agreement, the shares may not be transferred without either the Company’s consent or other certain exceptions defined therein.
The Company issued to the IBT 1 share of Series A Voting Preferred Stock that entitles the holder to elect 2 directors to the Company’s Board of Directors.
Our TL Agreements in place as of December 31, 2020, restrict the ability of the Company to declare dividends on its outstanding capital stock or execute share buybacks.
10. Earnings (Loss) Per Share
We calculate basic earnings (loss) per share by dividing our net earningsincome (loss) available to common shareholders by our weighted-average shares outstanding at the end of the period. TheWhen appropriate, the calculation for diluted earnings (loss) per share adjusts the weighted average shares outstanding for our dilutive unvested shares and stock units using the treasury stock method. Our calculations for basic and dilutive earnings (loss) per share for the years ended December 31 are as follows:
(dollars in millions, except per share data, shares and stock units in thousands) | | 2020 | | | 2019 | | | 2018 | |
Basic and dilutive net income (loss) | | $ | (53.5 | ) | | $ | (104.0 | ) | | $ | 20.2 | |
| | | | | | | | | | | | |
Basic weighted average shares outstanding | | | 41,694 | | | | 33,252 | | | | 32,983 | |
Effect of dilutive securities: | | | | | | | | | | | | |
Unvested shares and stocks units(a) | | | — | | | | — | | | | 876 | |
Dilutive weighted average shares outstanding | | | 41,694 | | | | 33,252 | | | | 33,859 | |
| | | | | | | | | | | | |
Basic earnings (loss) per share(b) | | $ | (1.28 | ) | | $ | (3.13 | ) | | $ | 0.61 | |
Diluted earnings (loss) per share(b) | | $ | (1.28 | ) | | $ | (3.13 | ) | | $ | 0.60 | |
| | | | | | | | | | | | |
(dollars in millions, except per share data, shares and stock units in thousands) | | 2022 | | | 2021 | | | 2020 | |
Basic and dilutive net income (loss) | | $ | 21.8 | | | $ | (109.1 | ) | | $ | (53.5 | ) |
| | | | | | | | | |
Basic weighted average shares outstanding | | | 51,346 | | | | 50,720 | | | | 41,694 | |
Effect of dilutive securities: | | | | | | | | | |
Unvested shares and stocks units(a) | | | 887 | | | | — | | | | — | |
Dilutive weighted average shares outstanding | | | 52,233 | | | | 50,720 | | | | 41,694 | |
| | | | | | | | | |
Basic earnings (loss) per share(b) | | $ | 0.42 | | | $ | (2.15 | ) | | $ | (1.28 | ) |
Diluted earnings (loss) per share(b) | | $ | 0.42 | | | $ | (2.15 | ) | | $ | (1.28 | ) |
a)Includes unvested shares of Common Stock, unvested stock units, and vested stock units for which the underlying Common Stock has not been distributed.
b)Earnings (loss) per share is based on unrounded figures and not the rounded figures presented.
(a)
| Includes unvested shares of Common Stock, unvested stock units, and vested stock units for which the underlying Common Stock has not been distributed.
|
(b)
| Earnings (loss) per share is based on unrounded figures and not the rounded figures presented.
|
Given our net loss position for the years ended December 31, 20202021 and 2019,2020, there are 0no dilutive securities for these periods.
On July 9, 2020, the Company issued 15,943,753 shares of common stock to the UST in connection with the execution of the UST Credit Agreements. These shares have been included in the average common shares outstanding used to calculate loss per share for the year ended December 31, 2020 from the date the shares were issued.
Our anti-dilutive securities for the years ended December 31 are as follows:
61
| | | | | | | | | | | | |
(shares in thousands) | | 2022 | | | 2021 | | | 2020 | |
Anti-dilutive unvested shares and options | | | 552 | | | | 172 | | | | 123 | |
(shares in thousands) | | 2020 | | | 2019 | | | 2018 | |
Anti-dilutive unvested shares and options | | | 123 | | | | 610 | | | | 51 | |
11. Commitments, Contingencies, and Uncertainties
Department of Defense Complaint
In December 2018, the United States on behalf of the United States Department of Defense filed a complaint in Intervention against the Company (and two other defendants) in the U.S. District in the Western District of New York captioned United States ex rel. James Hannum v. YRC Freight, Inc.; Roadway Express, Inc.; and Yellow Transportation, Inc., Civil Action No. 08-0811(A). The complaint alleges that the Company violated the False Claims Act by overcharging the Department of Defense for freight carrier services by failing to comply with the contractual terms of freight contracts between the Department of Defense and the Company and related government procurement rules. The complaint also alleges claims for unjust enrichment and breach of contract. Under the False Claims Act, the complaint seeks treble damages, civil penalties, attorneys’ fees and costs of suit, all in unspecified amounts. The remaining common causes of action seek an undetermined amount for an alleged breach of contract or alternatively causes constituting unjust enrichment or a payment by mistake. The Company has moved to dismiss the case, and the court heard oral arguments on the motion on August 12, 2019. On July 17, 2020, the Magistrate Judge to whom the case had been referred issued a Report and Recommendation recommending that the District Judge grant the Company’s motion to dismiss in part with respect to one claim and deny it in all other respects. On July 31, 2020 the Company filed its Objections to the Report and Recommendation with the District Court. Management believes the Company has meritorious defenses against
the remaining counts and intends to vigorously defend this action. We are unable to estimate the possible loss, or range of possible loss, associated with these claims at this time.
Class Action Securities Complaint
In January 2019, a purported class action lawsuit captioned Christina Lewis v. YRC Worldwide Inc., et al., Case No. 1:19-cv-00001, was filed in the United States District Court for the Northern District of New York against the Company and certain of our current and former officers. The complaint was filed on behalf of persons who purchased or otherwise acquired the Company’s publicly traded securities between March 10, 2014 and December 14, 2018. The complaint generally alleged that the defendants had violated Sections 10(b) and 20(a) of the Securities Exchange Act of 1934 by making false and misleading statements relating to the Company’s freight billing practices as alleged in the Department of Defense complaint described above. The action included claims for damages, including interest, and an award of reasonable costs and attorneys’ fees. The co-lead plaintiffs filed an amended complaint on June 14, 2019, and the defendants moved to dismiss it on July 15, 2019. On March 27, 2020, the court granted defendants’ motion to dismiss in its entirety and entered judgment closing the case. The co-lead plaintiffs filed a notice of appeal to the U.S. Court of Appeals for the Second Circuit on April 27, 2020. That appeal is pending and has been fully briefed. On December 16, 2020, the parties to the appeal filed an informative notice to inform the Second Circuit that they would engage in mediation to explore whether the case can be resolved. In February 2021, the parties to the appeal reached an agreement in principle to settle the matter for an immaterial amount, which agreement remains subject to certain conditions, including execution of a definitive settlement agreement and court approval. On February 10, 2021, the Second Circuit granted the parties’ joint motion to stay the appeal and remand the case to the District Court for consideration once the parties have documented the proposed settlement and presented it to the court for approval.
Shareholder Derivative Complaint
In February 2021, two putative shareholders filed an action derivatively and on behalf of the Company naming Douglas A. Carty, Raymond J. Bromark, William R. Davidson, Matthew A. Doheny, Robert L Friedman, James E. Hoffman, Michael J. Kneeland, Patricia M. Nazemetz, James F. Winestock, Jamie G. Pierson, Darren D. Hawkins, James L. Welch and Stephanie D. Fisher individually as defendants and the Company as the nominal defendant. The case, captioned Bhandari, et al. v. Carty, et al., Case No. 2021-0090-SG, was filed in the Court of Chancery in the State of Delaware. The complaint alleges that the Company was exposed to harm by the individual defendants’ purported conduct concerning its freight-billing practices as alleged in the Department of Defense complaint and the class action securities complaint described above. The complaint asserts that the individual defendants breached their fiduciary duties and were unjustly enriched as a result of their purported conduct. Claims similar to those raised in Bhandari had been raised in two shareholder derivative cases that were previously disclosed by the Company and have been dismissed.
Other Legal Matters
We are involved in litigation or proceedings that arise in ordinary business activities. When possible, we insure against these risks to the extent we deem prudent, but no assurance can be given that the nature or amount of such insurance will be sufficient to fully indemnify us against liabilities arising out of pending and future legal proceedings. Many of these insurance policies contain self-insured retentions in amounts we deem prudent. Based on our current assessment of information available as of the date of these consolidated financial statements, we believe that our consolidated financial statements include adequate provisions for estimated costs and losses that may be incurred within the litigation and proceedings to which we are a party.
12. Related Party Transactions
We are deemed a related party under the applicable accounting standards with the United StatedStates federal government as a result of entering the UST Credit Agreements in 2020 and the associated issuance of common stock to the UST. In the ordinary course of business, the Company has continued to regularly transact with various authorities associated with the United States federal government (the “U.S. government”) and to also operate in an industry subject to various U.S. government regulations. These transactions and regulatory oversight relationships include the Company providing a full range of transportation services to various U.S. government entities and the Company being subject to certain applicable U.S. government regulations such as those of the U.S. Departments of Transportation and Homeland Security, as examples.
13. Subsequent Events62
On January 4, 2021, the Company received $176.5 million of funds on a draw of the Tranche B UST Credit Agreement. These funds are required to be used to fund the purchase of tractors and trailers. Our Tranche B UST Credit Agreement is more fully described in Note 5.
Report of Independent Registered Public Accounting Firm
To the Shareholders and Board of Directors
Yellow Corporation:
Opinion on the Consolidated Financial Statements
We have audited the accompanying consolidated balance sheets of Yellow Corporation and subsidiaries (the Company) as of December 31, 20202022 and 2019,2021, the related consolidated statements of consolidated operations, comprehensive income (loss), shareholders’ deficit, and cash flows for each of the years in the three‑yearthree-year period ended December 31, 2020,2022, and the related notes (collectively, the consolidated financial statements). In our opinion, the consolidated financial statements present fairly, in all material respects, the financial position of the Company as of December 31, 20202022 and 2019,2021, and the results of its operations and its cash flows for each of the years in the three‑yearthree-year period ended December 31, 2020,2022, in conformity with U.S. generally accepted accounting principles.
We also have audited, in accordance with the standards of the Public Company Accounting Oversight Board (United States) (PCAOB), the Company’s internal control over financial reporting as of December 31, 2020,2022, based on criteria established in Internal Control – Integrated Framework (2013) issued by the Committee of Sponsoring Organizations of the Treadway Commission, and our report dated February 11, 20219, 2023 expressed an unqualified opinion on the effectiveness of the Company’s internal control over financial reporting.
Change in Accounting Principle
As discussed in Note 2 to the consolidated financial statements, the Company has changed its method of accounting for leases as of January 1, 2019 due to the adoption of Accounting Standards Codification 842, Leases.
Basis for Opinion
These consolidated financial statements are the responsibility of the Company’s management. Our responsibility is to express an opinion on these consolidated financial statements based on our audits. We are a public accounting firm registered with the PCAOB and are required to be independent with respect to the Company in accordance with the U.S. federal securities laws and the applicable rules and regulations of the Securities and Exchange Commission and the PCAOB.
We conducted our audits in accordance with the standards of the PCAOB. Those standards require that we plan and perform the audit to obtain reasonable assurance about whether the consolidated financial statements are free of material misstatement, whether due to error or fraud. Our audits included performing procedures to assess the risks of material misstatement of the consolidated financial statements, whether due to error or fraud, and performing procedures that respond to those risks. Such procedures included examining, on a test basis, evidence regarding the amounts and disclosures in the consolidated financial statements. Our audits also included evaluating the accounting principles used and significant estimates made by management, as well as evaluating the overall presentation of the consolidated financial statements. We believe that our audits provide a reasonable basis for our opinion.opinion.
63
Critical Audit Matter
The critical audit matter communicated below is a matter arising from the current period audit of the consolidated financial statements that was communicated or required to be communicated to the audit committee and that: (1) relates to accounts or disclosures that are material to the consolidated financial statements and (2) involved our especially challenging, subjective, or complex judgments. The communication of a critical audit matter does not alter in any way our opinion on the consolidated financial statements, taken as a whole, and we are not, by communicating the critical audit matter below, providing a separate opinion on the critical audit matter or on the accounts or disclosures to which it relates.
Measurement of Self-Insurance Accruals for ClaimsSelf-insurance accruals
As described in Note 2 to the consolidated financial statements, the Company establishes accruals for workers’ compensation and property damage and liability claims based upon actuarial analyses prepared by independent actuaries. The Company has recorded accruals for workers’ compensation claims of $254.9$225.7 million and property damage and liability claims of $68.4$99.5 million as of December 31, 2020.2022. The accruals for workers’ compensation and property damage and liability claims are based upon individual case estimates and actuarial estimates for loss development factors based upon past experience. These estimates are based on historical loss experience and judgments about the present and expected levels of costs per claim and the time required to settle claims.
We identified the evaluation of the measurementestimate of the Company’s self-insurance accruals for workers’ compensation and property damage and liability claims as a critical audit matter because of thematter. Subjective auditor judgment and specialized skills necessaryand knowledge were required to evaluate the Company’sselection of actuarial methods and assumptions used in estimating the auditor judgment required to assessaccruals for claims. Specifically, evaluating the underlyingloss development factor assumptions used in the actuarial analysis. The significant assumptions underlying the Company’s actuarial analysis are the determinationinvolved a high degree of loss development factorscomplexity and incurred but not reported claims, which are based on historical accident frequency and severity.subjectivity.
The following are the primary procedures we performed to address this critical audit matter. We evaluated the design and tested the operating effectiveness of certain internal controls related to the critical audit matter. This includedCompany’s self-insurance process, including controls related to (1)over the selection of actuarial methods and (2) the development of the significant assumptions used to calculate the accrual, including claims paid and incurred data used to determine the loss development factors and incurred but not reported claims. We compared selections of claims paid and incurred data for workers’ compensation and property damage and liability claims, used as a basis for the determination of loss development factors and incurred but not reported claims, tofactor assumptions used in estimating the relevant underlying documentation such as third party accident reports, medical records, bank statements, and internal approvals.self-insurance accruals for claims. We also involved actuarial professionals with specialized skills and knowledge who assisted in:
• assessing the actuarial methods used by the Company for consistency with generally accepted actuarial standards •evaluating the Company’s ability to estimate self-insurance accruals by comparing its historical estimates based on actuarial methods with actual claim activity •evaluating the Company’s actuarial loss development factor assumptions underlying the accruals for consistency with the Company’s historical reported and paid loss development •developing an independent range for claim accruals using the Company’s historical loss data and independently developed actuarial assumptions and comparing those expectations to the Company’s claim accruals.
| −
| assessing the actuarial methods used by the Company for consistency with generally accepted actuarial standards;
|
| −
| evaluating the Company’s ability to estimate self-insurance accruals by comparing its historical estimates with actual claim activity; and
|
| −
| evaluating the significant assumptions made by the Company underlying the accruals by developing independent expectations and comparing those expectations to the Company’s accruals.
|
/s/ KPMG LLP
We have served as the Company’s auditor since 2002.
Kansas City, Missouri
February 11, 20219, 2023
64
Report of Independent Registered Public Accounting Firm
To the Shareholders and Board of Directors
Yellow Corporation:
Opinion on Internal Control Over Financial Reporting
We have audited Yellow Corporation and subsidiaries’subsidiaries' (the Company) internal control over financial reporting as of December 31, 2020,2022, based on criteria established inInternal Control – Integrated Framework (2013)issued by the Committee of Sponsoring Organizations of the Treadway Commission. In our opinion, the Company maintained, in all material respects, effective internal control over financial reporting as of December 31, 2020,2022, based on criteria established in Internal Control – Integrated Framework (2013) issued by the Committee of Sponsoring Organizations of the Treadway Commission.
We also have audited, in accordance with the standards of the Public Company Accounting Oversight Board (United States) (PCAOB), the consolidated balance sheets of the Company as of December 31, 20202022 and 2019,2021, the related consolidated statements of consolidated operations, comprehensive income (loss), shareholders’ deficit, and cash flows for each of the years in the three-year period ended December 31, 2020,2022, and the related notes (collectively, the consolidated financial statements), and our report dated February 11, 20219, 2023 expressed an unqualified opinion on those consolidated financial statements.
Basis for Opinion
The Company’s management is responsible for maintaining effective internal control over financial reporting and for its assessment of the effectiveness of internal control over financial reporting, included in the accompanying Management’sManagement's Report on Internal Control over Financial Reporting appearing under Item 9A of the December 31, 2020 annual report on Form 10-K.Reporting. Our responsibility is to express an opinion on the Company’s internal control over financial reporting based on our audit. We are a public accounting firm registered with the PCAOB and are required to be independent with respect to the Company in accordance with the U.S. federal securities laws and the applicable rules and regulations of the Securities and Exchange Commission and the PCAOB.
We conducted our audit in accordance with the standards of the PCAOB. Those standards require that we plan and perform the audit to obtain reasonable assurance about whether effective internal control over financial reporting was maintained in all material respects. Our audit of internal control over financial reporting included obtaining an understanding of internal control over financial reporting, assessing the risk that a material weakness exists, and testing and evaluating the design and operating effectiveness of internal control based on the assessed risk. Our audit also included performing such other procedures as we considered necessary in the circumstances. We believe that our audit provides a reasonable basis for our opinion.
Definition and Limitations of Internal Control Over Financial Reporting
A company’s internal control over financial reporting is a process designed to provide reasonable assurance regarding the reliability of financial reporting and the preparation of financial statements for external purposes in accordance with generally accepted accounting principles. A company’s internal control over financial reporting includes those policies and procedures that (1) pertain to the maintenance of records that, in reasonable detail, accurately and fairly reflect the transactions and dispositions of the assets of the company; (2) provide reasonable assurance that transactions are recorded as necessary to permit preparation of financial statements in accordance with generally accepted accounting principles, and that receipts and expenditures of the company are being made only in accordance with authorizations of management and directors of the company; and (3) provide reasonable assurance regarding prevention or timely detection of unauthorized acquisition, use, or disposition of the company’s assets that could have a material effect on the financial statements.
Because of its inherent limitations, internal control over financial reporting may not prevent or detect misstatements. Also, projections of any evaluation of effectiveness to future periods are subject to the risk that controls may become inadequate because of changes in conditions, or that the degree of compliance with the policies or procedures may deteriorate.
/s/ KPMG LLP
Kansas City, Missouri
February 11, 20219, 2023
65
Item 9. Changes in and Disagreements with Accountants on Accounting and Financial Disclosure
Not applicable.
Item 9A. Controls and Procedures
Evaluation of Disclosure Controls and Procedures
As required by the Exchange Act, we maintain disclosure controls and procedures designed to ensure that information we are required to disclose in reports that we file or submit under the Exchange Act, is recorded, processed, summarized and reported within the time periods specified in the SEC’s rules and forms. Our disclosure controls and procedures include, without limitation, controls and procedures designed to ensure that information we are required to disclose in reports that we file or submit under the Exchange Act is accumulated and communicated to our management, including our principal executive and principal financial officers, as appropriate to allow timely decisions regarding required disclosure. Our management, with the participation of our principal executive and financial officers, has evaluated our disclosure controls and procedures as of December 31, 20202022 and has concluded that our disclosure controls and procedures were effective as of December 31, 2020.2022.
Changes in Internal Control Over Financial Reporting
There were no changes in our internal controls over financial reporting that occurred during the fiscal quarter ended December 31, 20202022 that have materially affected, or are reasonably likely to materially affect our internal controls over financial reporting.
Management’s Report on Internal Control Over Financial Reporting
The Company’s management is responsible for establishing and maintaining effective internal control over our financial reporting, which is designed to provide reasonable assurance regarding the reliability of financial reporting and the preparation of consolidated financial statements for external purposes in accordance with generally accepted accounting principles.
Our management assessed the effectiveness of our system of internal control over financial reporting as of December 31, 20202022 based on the framework established in Internal Control - Integrated Framework (2013) issued by the Committee of Sponsoring Organizations of the Treadway Commission.
Based on its assessment using those criteria, our management concluded that, as of December 31, 2020,2022, our system of internal control over financial reporting was effective.
KPMG LLP, the independent registered public accounting firm that audited our December 31, 20202022 consolidated financial statements, has issued an audit report on our system of internal control over financial reporting. The KPMG LLP audit report is included herein.
Item 9B. Other Information
None.
Item 9C. Disclosure Regarding Foreign Jurisdictions that Prevent Inspections
None.
66
PART III
Item 10. Directors, Executive Officers and Corporate Governance
Pursuant to General Instruction G to Form 10-K, the information required by this item, other than information regarding (i) our executive officers, which is incorporated by reference to Part I of this Form 10-K under the heading “Executive“Information about our Executive Officers, of the Registrant,” and (ii) our code of ethics, which is described below and titled the “Code of Business Conduct,” is included under the captions “Directors to be Elected by our Stockholders,” “Directors Selected by the Holder of our Series A Preferred Stock,” “Stockholder Proposals and Director Nomination for 20212022 Annual Meeting,” “Structure and Functioning of the Board Audit & Ethics Committee,” and “Section 16(a) Beneficial Ownership Reporting Compliance” in our Proxy Statement related to the 20212022 Annual Meeting of Stockholders and is incorporated herein by reference.
Code of Business Conduct
We have adopted a written Code of Business Conduct that applies to all of our directors, officers and employees, including our principal executive officer, principal financial officer and principal accounting officer. It is available under “Board Committee Charters“Governance” and Code of Business Conduct”therein under "Documents & Charters" on our website located at www.myyellow.com. We intend to disclose any amendments or waivers to our Code of Business Conduct by posting such information on our website located at www.myyellow.com, other than technical, administrative or non-substantive amendments, and any waivers, including implicit waivers, from any provision of our Code of Business Conduct that applies to our principal executive officer, principal financial officer, principal accounting officer or controller, which information will be disclosed via SEC filing.
Item 11. Executive Compensation
Pursuant to General Instruction G to Form 10-K, the information required by this item is included under the captions “Compensation Committee Interlocks and Insider Participation,” “Director Compensation,” “Compensation Discussion and Analysis,” “Compensation Committee Report” and “Executive Compensation” in our Proxy Statement related to the 20212023 Annual Meeting of Stockholders and is incorporated herein by reference.
Item 12. Security Ownership of Certain Beneficial Owners and Management and Related Shareholder Matters
Pursuant to General Instruction G to Form 10-K, the information required by this item is included under the captions “Security Ownership of Management and Directors,” “Security Ownership of Certain Beneficial Owners” and “Equity Compensation Plan Information” in our Proxy Statement related to the 20212023 Annual Meeting of Stockholders and is incorporated herein by reference.
Item 13. Certain Relationships and Related Transactions, and Director Independence
Pursuant to General Instruction G to Form 10-K, the information required by this item is included under the captions “Structure and Functioning of the Board” and “Certain Relationships and Related Transactions” in our Proxy Statement related to the 20212023 Annual Meeting of Stockholders and is incorporated herein by reference.
Item 14. Principal Accountant Fees and Services
Pursuant to General Instruction G to Form 10-K, the information required by this item is included under the caption “Audit and Audit-Related Fees” in our Proxy Statement related to the 20212023 Annual Meeting of Stockholders and is incorporated herein by reference.
67
PART IV
Item 15. Exhibits and Financial Statement Schedules
(a)(1) Financial Statements
The consolidated financial statements of the Company included under Item 8 - Financial Statements and Supplementary Data.
(a)(3) Exhibits
| | |
3.1.1 |
| Amended and Restated Certificate of Incorporation of the Company (incorporated by reference to Exhibit 3.1 to Current Report on Form 8-K, filed on September 16, 2011, File No. 000-12255). |
|
|
|
3.1.2 | | Certificate of Elimination of Series B Convertible Preferred Stock (incorporated by reference to Exhibit 3.2 to Current Report on Form 8-K, filed on December 1, 2011, File No. 000-12255).
|
| | |
3.1.3
| | Certificate of Designations Preferences, Powers and Rights of ClassSeries A ConvertibleVoting Preferred Stock (incorporated by reference to Exhibit 3.1 to Current Report on Form 8-K, filed on January 31, 2014,July 25, 2011, File No. 000-12255). |
|
|
|
3.1.4 3.1.3
|
| Certificate of Amendment to the Certificate of Incorporation of the Company (incorporated by reference to Exhibit 3.1 to Current Report on Form 8-K, filed on March 17, 2014, File No. 000-12255). |
|
|
|
3.1.5 3.1.4
|
| Certificate of Ownership and Merger, effective February 4, 2021, changing the name of the Company to Yellow Corporation (incorporated by reference to Exhibit 3.1 to Current Report on Form 8-K, filed on February 4, 2021, File No. 000-12255). |
|
|
|
3.2 |
| Second Amended and Restated Bylaws of the Company, adopted as of September 16, 2011February 4, 2021 (incorporated by reference to Exhibit 3.2 to Current Report on Form 8-K, filed on February 4, 2021, File No. 000-12255). |
|
|
|
(4) Instruments Defining the Right of Security Holders, Including Indentures |
|
|
|
4.1* |
| Description of Common Stock |
|
|
|
(10) Material Contracts
| | |
|
|
|
10.1.1 |
| National Master Freight Agreement, effective April 1, 2008, among the International Brotherhood of Teamsters, YRC Inc. (formerly, Yellow Transportation, Inc. and Roadway Express, Inc.), USF Holland Inc. and New Penn Motor Express, Inc. (incorporated by reference to Exhibit 10.1 to Current Report on Form 8-K, filed on February 11, 2008, File No. 000-12255). |
|
|
|
10.1.2 |
| Amended and Restated Memorandum of Understanding on the Job Security Plan, dated July 9, 2009, among the International Brotherhood of Teamsters, YRC Inc., USF Holland Inc. and New Penn Motor Express, Inc. (incorporated by reference to Exhibit 10.1 to Current Report on Form 8-K, filed on July 14, 2009, File No. 000-12255). |
|
|
|
10.1.3 |
| Agreement for the Restructuring of the YRC Worldwide Inc. Operating Companies and related Term Sheet/Proposal (the “Restructuring Plan”), dated September 24, 2010, among the International Brotherhood of Teamsters, YRC Inc., USF Holland Inc. and New Penn Motor Express, Inc. (incorporated by reference to Exhibit 10.1 to Current Report on Form 8-K, filed on September 29, 2010, File No. 000-12255). |
|
|
|
10.1.4 |
| Certification and Amendment (dated December 31, 2010) and Certification and Second Amendment (dated February 28, 2011) to the Restructuring Plan Term Sheet (incorporated by reference to Exhibit 10.3.4 to Annual Report on Form 10-K for the year ended December 31, 2010, File No. 000-12255). |
|
|
|
10.1.5 |
| Extension of the Agreement for the Restructuring of the YRC Worldwide Inc. Operating Companies, dated February 7, 2014, by and among YRC Inc. (d/b/a YRC Freight), USF Holland Inc., New Penn Motor Express, Inc., USF Reddaway Inc. and the Teamsters National Freight Industry Negotiating Committee of the International Brotherhood of Teamsters (incorporated by reference to Exhibit 10.1 to Current Report on Form 8-K, filed on February 10, 2014, File No. 000-12255). |
|
|
|
68
| | |
|
| only) (incorporated by reference to Exhibit 10.1 to Quarterly Report on Form 10-Q for the quarter ended June 30, 2019, File No. 000-12255). |
|
|
|
10.2.1 |
| Second Amended and Restated Contribution Deferral Agreement, dated as of January 31, 2014, among YRC Inc., USF Holland Inc., New Penn Motor Express, Inc. and USF Reddaway Inc., collectively as primary obligors, the Trustees for the Central States, Southeast and Southwest Areas Pension Fund, the Wilmington Trust Company, as agent, and the other funds party thereto (incorporated by reference to Exhibit 10.1 to the Current Report on Form 8-K, filed on January 31, 2014, File No. 000-12255). |
|
|
|
10.2.2 |
| Letter Agreement, dated as of January 29, 2014 and effective as of January 31, 2014, among Central States, Southeast and Southwest Areas Pension Fund, YRC, Inc., USF Holland Inc., New Penn Motor Express, Inc., USF Reddaway Inc., as primary obligors, YRC Worldwide Inc., as primary guarantor, and certain additional guarantors (incorporated by reference to Exhibit 10.2 to Current Report on Form 8-K, filed on January 31, 2014, File No. 000-12255). |
|
|
|
10.2.3 |
| Amendment No. 1 to Second Amended and Restated Contribution Deferral Agreement among YRC Inc., USF Holland LLC, New Penn Motor Express LLC and USF Reddaway Inc., collectively as primary obligors, the Trustees for the Central States, Southeast and Southwest Areas Pension Fund, the Wilmington Trust Company, as agent, and the other funds party thereto (incorporated by reference to Exhibit 10.1 to Current Report on Form 8-K, filed on January 31,, 2018, File No. 000-12255). |
|
|
|
10.3.1 |
| Amended and Restated Credit Agreement, dated as of September 11, 2019, by and among the Company, as borrower, the subsidiaries of the borrower party thereto from time to time, the lenders from time to time party thereto, and Cortland Products Corp., as administrative agent and collateral agent for the lenders (incorporated by reference to Exhibit 10.1 to Quarterly Report on Form 10-Q for the quarter ended September 30, 2019, File No. 000-12255). |
|
|
|
10.4.1† 10.3.2
|
| Amendment No. 1 to Amended and Restated Credit Agreement, dated April 7, 2020, by and among the Company, as borrower, the subsidiaries of the borrower party thereto from time to time, the lenders from time to time party thereto, and Cortland Products Corp. (n/k/a Alter Domus Products Corp.), as administrative agent and collateral agent for the lenders (incorporated by reference to Exhibit 10.1 to the Quarterly Report on Form 10-Q for the quarter ended March 31, 2020, File No. 000-12255). |
|
|
|
10.3.3 |
| Amendment No. 2 to Amended and Restated Credit Agreement, dated July 7, 2020, by and among the Company, as borrower, the subsidiaries of the borrower party thereto from time to time, the lenders from time to time party thereto, and Alter Domus Products Corp., as administrative agent and collateral agent for the lenders (incorporated by reference to Exhibit 10.6 to the Quarterly Report on Form 10-Q for the quarter ended September 30, 2020, File No. 000-12255). |
|
|
|
10.4.1† |
| Loan and Security Agreement, dated as of February 13, 2014, among the Company, as administrative borrower, the other borrowers named therein, the guarantors named therein, certain financial institutions, as lenders, and RBS Citizens Business Capital a division of RBS Asset Finance, Inc., a subsidiary of RBS Citizens, N.A., as agent, and RBS Citizens, N.A., Merrill Lynch, Pierce, Fenner & Smith and CIT Finance LLC, as joint lead arrangers and joint bookrunners (incorporated by reference to Exhibit 10.11 to Annual Report on Form 10-K for the year ended December 31, 2013, File No. 000-12255). |
|
|
|
10.4.2 |
| Amendment No. 1 to Loan and Security Agreement, dated as of September 23, 2015, by and among the Company, certain of the Company’s subsidiaries party thereto, the lenders party thereto and RBS Citizens Business Capital, as agent (incorporated by reference to Exhibit 10.2 to Current Report on Form 8-K, filed on September 25, 2015, File No. 000-12255). |
|
|
|
10.4.3 |
| Amendment No. 2 to Loan and Security Agreement, dated as of June 28, 2016, by and among the Company, certain of the Company’s subsidiaries party thereto, the lenders party thereto and Citizens Business Capital as agent (incorporated by reference to Exhibit 10.1 to Current Report on Form 8-K, filed on June 30, 2016, File No. 000-12255). |
|
|
|
10.4.4 |
| Amendment No. 3 to Loan and Security Agreement by and among the Company, certain of the Company’s subsidiaries party thereto, the lenders party thereto and Citizens Business Capital as agent (incorporated by reference to Exhibit 10.2 to Current Report on Form 8-K, filed on January 31, 2018, File No. 000-12255). |
|
|
|
10.4.5 |
| Amendment No. 5 to Loan and Security Agreement by and among the Company, certain of the Company’s subsidiaries party thereto, the lenders party thereto and Citizens Business Capital as agent (incorporated by |
69
| | |
|
| reference to Exhibit 10.2 to Quarterly Report on Form 10-Q for the quarter-ended September 30, 2019, File No. 000-12255). |
|
|
|
10.4.6 |
| Amendment No. 6 to Loan and Security Agreement by and among the Company, certain of the Company’s subsidiaries party thereto, the lenders party thereto and Citizens Business Capital as agent (incorporated by reference to Exhibit 10.5 to Quarterly Report on Form 10-Q for the quarter-ended September 30, 2020, File No. 000-12255). |
|
|
|
10.4.7 |
| Amendment No. 7 to Loan and Security Agreement by and among the Company, certain of the Company’s subsidiaries party thereto, the lenders party thereto and Citizens Business Capital as agent (incorporated by reference to Exhibit 10.1 to Quarterly Report on Form 10-Q for the quarter-ended September 30, 2022, File No. 000-12255). |
|
|
|
10.5 |
| UST Tranche A Term Loan Credit Agreement, dated July 7, 2020, by and among the Company, as borrower, the subsidiaries of the borrower party thereto from time to time, the lenders from time to time party thereto, and The Bank of New York Mellon, as administrative agent and collateral agent for the lenders. (incorporated by reference to Exhibit 10.3 to Quarterly Report on Form 10-Q for the quarter-ended September 30, 2020, File No. 000-12255). |
|
|
|
10.6 |
| UST Tranche B Term Loan Credit Agreement, dated July 7, 2020, by and among the Company, as borrower, the subsidiaries of the borrower party thereto from time to time, the lenders from time to time party thereto, and The Bank of New York Mellon, as administrative agent and collateral agent for the lenders. (incorporated by reference to Exhibit 10.4 to Quarterly Report on Form 10-Q for the quarter-ended September 30, 2020, File No. 000-12255). |
|
|
|
10.7 |
| Share Issuance Agreement, dated June 30, 2020, between the Company and the United States Department of the Treasury (incorporated by reference to Exhibit 10.1 to the Current Report on Form 8-K filed on July 7, 2020, File No. 000-12255). |
|
|
|
10.8 |
| Voting Rights Agreement, dated July 9, 2020, among the Company, the United States Department of the Treasury, and The Bank of New York Mellon, as trustee. (incorporated by reference to Exhibit 10.1 to Quarterly Report on Form 10-Q for the quarter-ended September 30, 2020, File No. 000-12255). |
|
|
|
10.9 |
| Registration Rights Agreement, dated July 9, 2020, between the Company and the United States Department of the Treasury. (incorporated by reference to Exhibit 10.2 to Quarterly Report on Form 10-Q for the quarter-ended September 30, 2020, File No. 000-12255). |
|
|
|
(10) Management Contracts, Compensatory Plans and Arrangements |
|
|
|
10.5.1 10.10.1
|
| YRC Worldwide Inc. FourthYellow Corporation Fifth Amended and Restated Director Compensation Plan, effective February 28, 2020 (incorporated by reference to Exhibit 10.5.1 to Annual Report on Form 10-K for the year ended December 31, 2019, File No. 000-12255).January 22, 2022.
|
|
|
|
10.10.2 | | |
10.5.2
|
| Form of Director Restricted Stock Unit Agreement for Non-Employee Director (incorporated by reference to Exhibit 10.2 to Quarterly Report on Form 10-Q for the quarter ended June 30, 2015, File No. 000-12255). |
| | |
10.5.3 |
| Form of One-Time Restricted Stock Unit Award Agreement for Non-Employee Director (incorporated by reference to Exhibit 10.5.3 to Annual Report on Form 10-K for the year ended December 31, 2018, File No. 000-12255).
|
10.11 | | |
10.6
|
| Form of Indemnification Agreement between the Company and each of its directors and executive officers (incorporated by reference to Exhibit 10.5 to Current Report on Form 8-K, filed on March 15, 2007, File No. 000-12255). |
|
|
|
10.7.1 10.12
| | YRC Worldwide Inc. 2011 Incentive and Equity Award Plan (incorporated by reference to Exhibit 99.1 to Registration Statement on Form S-8, filed on November 30, 2011, File No. 333-178223).
|
| | |
10.7.2
| | YRC Worldwide Inc. Amended and Restated 2011 Incentive and Equity Award Plan (incorporated by reference to Exhibit 10.7 to Quarterly Report on Form 10-Q for the quarter ended March 31, 2014, File No. 000-12255).
|
| | |
10.7.3
| | YRC Worldwide Inc. 2019 Incentive and Equity Award Plan (incorporated by reference to Exhibit 10.2 to Annual Report on Form 10-K for the year ended December 31, 2019, File No. 000-12255). |
|
|
|
10.8.1 10.13.1
| | Form of Restricted Stock Agreement under YRC Worldwide Inc. 2011 Incentive and Equity Award Plan and successor plans thereto (incorporated by reference to Exhibit 10.1 to Current Report on Form 8-K, filed on March 13, 2015, File No. 000-12255).
|
| | |
10.8.2
| | Form of Restricted Stock Agreement under YRC Worldwide Inc. 2011 Incentive and Equity Award Plan for 2019 performance awards on or after February 11, 2019 (incorporated by reference to Exhibit 10.8.2 to Annual Report on Form 10-K for the year ended December 31, 2018, File No. 000-12255).
|
| | |
10.8.3
| | Form of Restricted Stock Agreement for performance awards under YRC Worldwide Inc. 2019 Incentive and Equity Award Plan (incorporated by reference to Exhibit 10.8.3 to Annual report on Form 10-K for the year ended December 31, 2018, File No. 000-12255).
|
| | |
10.8.4
| | Restricted Stock Agreement between YRC Worldwide Inc. and James L. Welch, dated February 13, 2018 (incorporated by reference to Exhibit 10.2 to Current Report on Form 8-K, filed on February 15, 2018, File No. 000-12255).
|
10.8.5
| | Form of Restricted Stock Agreement under YRC Worldwide Inc. 2019 Incentive and Equity Award Plan for 2019 CEO Grant (incorporated by reference to Exhibit 10.2 to Quarterly Report on Form 10-Q for the quarter ended March 31, 2019, File No. 000-12255.)
|
| | |
10.9.1
| | YRC Worldwide Inc. Supplemental Executive Pension Plan, effective January 1, 2005 (incorporated by reference to Exhibit 10.1 to Current Report on Form 8-K, filed on July 25, 2006, File No. 000-12255). |
|
|
|
10.9.2 10.13.2
|
| Amendment to YRC Worldwide Inc. Supplemental Executive Pension Plan (incorporated by reference to Exhibit 10.3 to Current Report on Form 8-K, filed on July 8, 2008, File No. 000-12255). |
|
|
|
10.9.3 10.13.3
|
| Second Amendment to YRC Worldwide Inc. Supplemental Executive Pension Plan (incorporated by reference to Exhibit 10.30.3 to Annual Report on Form 10-K for the year ended December 31, 2011, File No. 000-12255). |
|
|
|
10.10.1 10.14.1
|
| Yellow Corporation Pension Plan, as amended and restated as of January 1, 2004 (incorporated by reference to Exhibit 10.27 to Annual Report on Form 10-K for the year ended December 31, 2003, File No. 000-12255). |
|
|
|
70
| | |
10.10.2 10.14.2
|
| Amendment No. 1 to Yellow Corporation Pension Plan, as amended and restated as of January 1, 2004 (incorporated by reference to Exhibit 10.2 to Quarterly Report on Form 10-Q for the quarter ended September 30, 2005, File No. 000-12255). |
|
|
|
10.10.3 10.14.3
|
| Amendment No. 2 to Yellow Corporation Pension Plan, as amended and restated as of January 1, 2004 (incorporated by reference to Exhibit 10.28.3 to Annual Report on Form 10-K for the year ended December 31, 2010, File No. 000-12255). |
|
|
|
10.10.4 10.14.4
|
| Amendment No. 3 to Yellow Corporation Pension Plan, as amended and restated as of January 1, 2004 (incorporated by reference to Exhibit 10.2 to Current Report on Form 8-K, filed on July 8, 2008, File No. 000-12255). |
|
|
|
10.10.5 10.14.5
|
| Amendment No. 4 to Yellow Corporation Pension Plan, as amended and restated as of January 1, 2004 (incorporated by reference to Exhibit 10.22.5 to Annual Report on Form 10-K for the year ended December 31, 2008, File No. 000-12255). |
|
|
|
10.10.610.14.6 |
| Amendment No. 5 and Amendment No. 6 to Yellow Corporation Pension Plan, as amended and restated as of January 1, 2004 (incorporated by reference to Exhibit 10.28.6 to Annual Report on Form 10-K for the year ended December 31, 2009, File No. 000-12255). |
|
|
|
10.10.7 10.14.7
|
| Amendment No. 7 to Yellow Corporation Pension Plan, as amended and restated as of January 1, 2004 (incorporated by reference to Exhibit 10.7 to Quarterly Report on Form 10-Q for the quarter ended June 30, 2010, File No. 000-12255). |
|
|
|
10.13 10.15
| | YRC Worldwide Inc. Second Union Employee Option Plan (incorporated by reference to Exhibit 10.1 to Current Report on Form 8-K, filed on March 5, 2010, File No. 000-12255).
|
| | |
10.14
| | Severance Agreement, dated as of May 1, 2018, between Darren D. Hawkins and the Company (incorporated by reference to Exhibit 10.5 to Quarterly Report on Form 10-Q for the quarter ended March 31, 2018, File No. 000-12255). |
|
|
|
10.15 10.16
| | Severance Agreement, dated January 2, 2020 between Stephanie D. Fisher and the Company (incorporated by reference to Exhibit 10.15 to Annual Report on Form 10-K for the year ended December 31, 2019, File No. 000-12255).
|
| | |
10.16
| | YRC Worldwide Amended and Restated Severance Plan, dated March 9, 2020 (incorporated by reference to Exhibit 10.16 to Annual Report on Form 10-K for the year ended December 31, 2019, File No. 000-12255). |
|
|
|
10.17 |
| Form of Retention Agreement (incorporated by reference to Exhibit 10.1 to Current Report on Form 8-K filed on October 5, 2020). |
|
|
|
21.1* 10.18
|
| Yellow Corporation 2021 Bonus Plan (incorporated by reference to Exhibit 10.1 to Current Report on Form 8-K filed on February 25, 2021, File No. 000-12255) |
|
|
|
10.19 |
| Yellow Corporation Form of Restricted Stock Unit Agreement under YRC Worldwide Inc. 2019 Incentive and Equity Award Plan and successor plans thereto (incorporated by reference to Exhibit 10.2 to Current Report on Form 8-K filed on February 25, 2021, File No. 000-12255) |
|
|
|
10.20 |
| Severance Agreement and Release, dated April 23, 2021 between Thomas J. O’Conner and the Company (incorporated by reference to Exhibit 10.1 to Quarterly Report on Form 10-Q for the quarter ended March 31, 2021, File No. 000-12255). |
|
|
|
10.21 |
| Severance Agreement and Release, dated April 14, 2021 between Scott D. Ware and the Company (incorporated by reference to Exhibit 10.2 to Quarterly Report on Form 10-Q for the quarter ended March 31, 2021, File No. 000-12255). |
|
|
|
10.22 |
| Yellow Corporation 2020 Employee Stock Purchase Plan (incorporated by reference to Exhibit 99.1 to Registration Statement on Form S-8, filed on November 2, 2020, File No. 333-249800). |
|
|
|
10.23* |
| Form of Performance Stock Unit Agreement |
|
|
|
10.24** |
| Severance Agreement and Release, dated January 17, 2023, between James R. Faught and the Company (incorporated by reference to Exhibit 10.1 to Current Report on Form 8-K filed on January 23, 2023, File No. 000-12255). |
|
|
|
21.1* |
| Subsidiaries of the Company. |
|
|
|
23.1* |
| Consent of KPMG LLP, Independent Registered Public Accounting Firm. |
|
|
|
31.1* |
| Certification of Darren D. Hawkins pursuant to Exchange Act Rules 13a-14 and 15d-14, as adopted pursuant to Section 302 of the Sarbanes-Oxley Act of 2002. |
71
*
| Indicates documents filed herewith.
|
†
| Confidential portions of this exhibit have been filed separately with the SEC pursuant to a request for confidential treatment.
|
* Indicates documents filed herewith.
** Certain schedules and similar attachments have been omitted. The Company agrees to furnish a supplemental copy of any omitted schedule or attachment to the SEC upon request.
† Confidential portions of this exhibit have been filed separately with the SEC pursuant to a request for confidential treatment.
Item 16. Form 10-K Summary
Not applicable.
72
SIGNATURES
Pursuant to the requirements of Section 13 or 15(d) of the Securities Exchange Act of 1934, the registrant has duly caused this report to be signed on its behalf by the undersigned, thereunto duly authorized.
| | | | |
|
| Yellow Corporation |
|
|
|
Date: February 11, 20219, 2023 |
| By: |
| /s/ Darren D. Hawkins |
|
|
|
| Darren D. Hawkins |
|
|
|
| Chief Executive Officer |
POWER OF ATTORNEY
Know all people by these presents, that each person whose signature appears below constitutes and appoints Darren D. Hawkins and Leah K. Dawson, and each of them, his or her true and lawful attorney-in-fact and agent, with full power of substitution and resubstitution, for him or her and in his or her name, place and stead, in any and all capacities, to sign any amendments to this annual report on Form 10-K, and to file the same, with all exhibits thereto, with the Securities and Exchange Commission, granting unto said attorney-in-fact and agent full power and authority to do and perform each and every act and thing requisite and necessary to be done in and about the premises, as fully and to all intents and purposes as he or she might or could do in person, hereby confirming all that said attorney-in-fact and agent, or his substitute, may lawfully do or cause to be done by virtue hereof.
Pursuant to the requirements of the Securities Exchange Act of 1934, this report has been signed below by the following persons on behalf of the registrant and in the capacities and on the dates indicated.
| | | | |
/s/ Darren D. Hawkins |
| Chief Executive Officer and Director |
| February 11, 20219, 2023 |
Darren D. Hawkins |
|
|
|
|
|
|
|
|
|
/s/ Daniel L. OliverOlivier |
| Interim Chief Financial Officer
|
| February 11, 20219, 2023 |
Daniel L. OliverOlivier |
| (Principal Financial Officer and Principal Accounting Officer) |
|
|
|
|
|
|
|
/s/ James R. Faught
| | Chief Accounting Officer
| | February 11, 2021
|
James R. Faught
| | | | |
| | | | |
/s/ Douglas A. Carty |
| Director |
| February 11, 20219, 2023 |
Douglas A. Carty |
|
|
|
|
|
|
|
|
|
/s/ William R. Davidson
| | Director
| | February 11, 2021
|
William R. Davidson
| | | | |
| | | | |
/s/ Matthew A. Doheny |
| Director |
| February 11, 20219, 2023 |
Matthew A. Doheny |
|
|
|
|
|
|
|
|
|
/s/ Javier L. Evans |
| Director |
| February 9, 2023 |
Javier L. Evans |
|
|
|
|
|
|
|
|
|
/s/ James E. Hoffman |
| Director |
| February 11, 2021 | |
James E. Hoffman
| | | | 9, 2023 |
James E. Hoffman |
|
|
|
|
|
|
|
|
|
/s/ Shaunna D. Jones |
| Director |
| February 9, 2023 |
Shaunna D. Jones |
|
|
|
|
|
|
|
|
|
/s/ Susana Martinez |
| Director |
| February 9, 2023 |
Susana Martinez |
|
|
|
|
|
|
|
|
|
/s/ David S. McClimon |
| Director |
| February 9, 2023 |
David S. McClimon |
|
|
|
|
|
|
|
|
|
/s/ Patricia M. Nazemetz |
| Director |
| February 11, 2021 | |
Patricia M. Nazemetz
| | | | 9, 2023 |
Patricia M. Nazemetz |
|
|
|
|
/s/ Susana Martinez
|
| Director
|
| February 11, 2021
| |
Susana Martinez
| | | |
|
| | | | |
/s/ Shaunna D. Jones
| | Director
| | February 11, 2021
| |
Shaunna D. Jones
| | | | |
| | | | |
/s/ David S. McClimon
| | Director
| | February 11, 2021
| |
David S. McClimon
| | | | |
| | | | |
/s/ Chris T. Sultemeier |
| Director |
| February 11, 2021 | |
Chris T. Sultemeier
| | | | 9, 2023 |
Chris T. Sultemeier |
|
|
|
|
|
|
|
|
|
7673