SECURITIES AND EXCHANGE COMMISSION
WASHINGTON, D.C. 20549
FORM 10-K
☒xANNUAL REPORT PURSUANT TO SECTION 13 OR 15(d) OF THE SECURITIES EXCHANGE ACT OF 1934
| ANNUAL REPORT PURSUANT TO SECTION 13 OR 15(d) OF THE SECURITIES EXCHANGE ACT OF 1934
|
For the fiscal year ended December 31,
20202023
OR
☐oTRANSITION REPORT PURSUANT TO SECTION 13 OR 15(d) OF THE SECURITIES EXCHANGE ACT OF 1934
| TRANSITION REPORT PURSUANT TO SECTION 13 OR 15(d) OF THE SECURITIES EXCHANGE ACT OF 1934
|
For the transition period from __________ to __________
COMMISSION FILE NUMBER: 001-31817
(Exact name of registrant as specified in its charter)
| | | | | |
| Maryland | 42-1241468 |
(State or other jurisdiction of
incorporation or organization)
| (I.R.S. Employer
Identification Number)
|
| |
44 South Bayles Avenue, Port Washington, NY
2529 Virginia Beach Blvd. Virginia Beach, Virginia | 11050-3765
23452 |
(Address of principal executive offices) | (Zip Code) |
Registrant’s
Registrant's telephone number, including area code:
(516) 767-6492(757) 627-9088
Securities registered pursuant to Section 12(b) of the Act:
| | | | | | | | | | | | | | |
Title of each class | | Trading Symbol(s) | | Name of each exchange on which registered | Trading Symbol(s)
|
Common Stock, $0.06 par value
| New York Stock Exchange
| CDR
|
7-1/4% Series B Cumulative Redeemable Preferred Stock, $25.00 Liquidation Value | | CDRpB | | New York Stock Exchange | CDRpB
|
6-1/2% Series C Cumulative Redeemable Preferred Stock, $25.00 Liquidation Value | | CDRpC | | New York Stock Exchange | CDRpC
|
Securities registered pursuant to Section 12(g) of the Act:
None
Indicate by check mark if the registrant is a well-known seasoned issuer, as defined in Rule 405 of the Securities Act. Yes ☐o No ☒x Indicate by check mark if the registrant is not required to file reports pursuant to Section 13 or Section 15(d) of the Act. Yes ☐o No ☒x Indicate by check mark whether the registrant (1) has filed all reports required to be filed by Section 13 or 15(d) of the Securities Exchange Act of 1934 during the preceding 12 months (or for such shorter period that the registrant was required to file such reports) and (2) has been subject to such filing requirements for the past 90 days. Yes ☒x No ☐o Indicate by check mark whether the registrant has submitted electronically every Interactive Data File required to be submitted pursuant to Rule 405 of Regulation S-T (§232.405 of this chapter) during the preceding 12 months (or for such shorter period that the registrant was required to submit such files). Yes ☒x No ☐o Indicate by check mark whether the registrant is a large accelerated filer, an accelerated filer, a non-accelerated filer, or a smaller reporting company, or an emerging growth company. See the definitions of
“large"large accelerated filer,
” “accelerated" "accelerated filer,
” “smaller" "smaller reporting company,
”" and
“emerging"emerging growth
company”company" in Rule 12b-2 of the Exchange Act.:
| | | | | | | | | | | |
| Large accelerated filer | ☐
o | | Accelerated filer | ☒
o |
| | | | |
Non-accelerated filer | ☐
x | | Smaller reporting company | ☐
x |
| | | | |
Emerging growth company | ☐
| | | o |
If an emerging growth company, indicate by check mark if the registrant has elected not to use the extended transition period for complying with any new or revised financial accounting standards provided pursuant to Section 13(a) of the Exchange Act. ☐o Indicate by check mark whether the registrant has filed a report on and attestation to its managementmanagement's assessment of the effectiveness of its internal control over financial reporting under Section 404(b) of the Sarbanes-Oxley Act (15 U.S.C 7262(b)) by the registered public accounting firm that prepared or issued its audit report. o
If securities are registered pursuant to Section 12(b) of the Act, indicate by check mark whether the financial statements of the registrant included in the filing reflect the correction of an error to previously issued financial statements. ☐
Indicate by check mark whether any of those error corrections are restatements that required a recovery analysis of incentive-based compensation received by any of the registrant's executive officers during the relevant recovery period pursuant to §240.10D-1(b). o
Indicate by check mark whether the registrant is a shell company (as defined in Rule 12b-2 of the Exchange Act). Yes .Yes ☐o No ☒xBased on the closing sales price on June 30, 2020 of $6.56 per share, the aggregate market value of the voting stock held by non-affiliates of the registrant was approximately $84,667,000.
The number of shares outstanding of the
registrant’sregistrant's Common Stock $.06 par value was
13,569,32913,718,169 on
FebruaryMarch 1,
2021.2024.
DOCUMENTS INCORPORATED BY
REFERENCE:PortionsREFERENCE
None.
CEDAR REALTY TRUST, INC.
TABLE OF CONTENTS
CAUTIONARY STATEMENT ON FORWARD-LOOKING STATEMENTS
This Annual Report on Form 10-K
.
CEDAR REALTY TRUST, INC.
TABLE OF CONTENTS
Forward-Looking Statements
Certain statements made in this Annual Report on Form 10-K or incorporated by reference herein are “forward-looking statements” (the "Form 10-K") of Cedar Realty Trust, Inc. (the "Company") contains "forward-looking statements" within the meaning of Section 27A of the Securities Act of 1933, as amended, and Section 21E of the Securities Exchange Act of 1934, as amended and, as such, may involve known and unknown(the "Exchange Act") that are subject to risks, uncertainties and other factors which may cause the actual results, performance or achievements of Cedar Realty Trust, Inc. (the “Company”) to be materially different from future results, performance or achievements expressed or implied by such forward-looking statements. Forward-looking statements, which are based on certain assumptions and describe the Company’sCompany's future plans, strategies and expectations, are generally identifiable by use of the words “may”"may", “will”"will", “should”"should", “estimates”"estimates", “projects”"projects", “anticipates”"anticipates", “believes”"believes", “expects”"expects", “intends”"intends", “future”"future", and words of similar import, or the negative thereof. These statements are not guarantees of future performance and are subject to risks, uncertainties and other factors, some of which are beyond our control, are difficult to predict and could cause actual results to differ materially from those expressed or forecasted in the forward-looking statements.
Forward-looking statements that were true at the time made may ultimately prove to be incorrect or false. You are cautioned to not place undue reliance on forward-looking statements, which reflect our management's view only as of the date of this Form 10-K. We undertake no obligation to update or revise forward-looking statements to reflect changed assumptions, the occurrence of unanticipated events or changes to future operating results.
Factors that could cause actual results, performance or achievements to differ materially from current expectationsany forward-looking statements made in this Form 10-K include, but are not limited to: (i)
•the economic, politicalrisk that shareholder litigation in connection with the Transactions (as defined herein) may result in significant costs of defense, indemnification and social impactliability;
•the use of and uncertainty relatingdemand for retail space;
•general and economic business conditions, including those affecting the ability of individuals to spend in retail shopping centers and/or the COVID-19 pandemic, including: (a) the effectiveness or lack of effectiveness of governmental relief in providing assistance to large and small businesses, particularly including our retail tenantsrate and other retailers, that have suffered significant declinesterms on which we are able to lease our properties;
•the loss or bankruptcy of the Company's tenants;
•the state of the U.S. economy generally, or specifically in revenues as a resultthe Northeast where our properties are geographically concentrated;
•consumer spending and confidence trends;
•availability, terms and deployment of mandatory business shut-downs, “shelter-in-place” or “stay-at-home” orderscapital;
•the degree and social distancing practices, as well as individuals adversely impacted by the COVID-19 pandemic, (b) the duration of any such orders or other formal recommendations for social distancing and the speed and extent to which revenuesnature of our retail tenants recover following the lifting of any such orderscompetition;
•changes in governmental regulations, accounting rules, tax rates and similar matters;
•adverse economic or recommendations, (c) the potential impact of any such events on the obligationsreal estate developments in our markets of the Company’s tenants to make rent and other payments or honor other commitments under existing leases, (d) the potential adverse impact on returns from redevelopment projects, (e) to the extent we were seeking to sell properties in the near term, significantly greater uncertainty regarding our ability to do so at attractive prices, and (f) the broader impact of the severe economic contraction and increase in unemployment that has occurred in the short term and negative consequences that will occur if these trends are not quickly reversed; (ii) Northeast;
•the ability and willingness of the Company’sCompany's tenants and other third parties to satisfy their obligations under their respective contractual arrangements with the Company; (iii) the loss or bankruptcy of the Company’s tenants, particularly in light of the adverse impact to the financial health of many retailers that has occurred and continues to occur as a result of the COVID-19 pandemic; (iv)
•the ability and willingness of the Company’sCompany's tenants to renew their leases with the Company upon expiration, expiration;
•the Company’sCompany's ability to re-lease its properties on the same or better terms in the event of nonrenewalnon-renewal or in the event the Company exercises its right to replace an existing tenant, and obligations the Company may incur in connection with the replacement of an existing tenant, particularly, in light of the adverse impact to the financial health of many retailers that has occurred and continues to occur as a result of the COVID-19 pandemic, and the significant uncertainty as to when and the conditions under which potential tenants will be able to operate physical retail locations in future; (v) macroeconomic conditions, such as a disruption of or lack of access to capital markets and the adverse impact of the recent significant decline in the Company’s share price from prices prior to the spread of the COVID-19 pandemic; (vi) tenant;
•litigation risks generally;
•financing risks, such as the Company’sCompany's inability to obtain new financing or refinancing on favorable terms as the result of market volatility or instability; (vii)instability and increases in the Company’sCompany's borrowing costs as a result of changes in interest rates and other factors, including the potential phasing out of LIBOR after 2021; (viii) factors;
•the impact of the Company’sCompany's leverage on operating performance; (ix)
•risks related to the market for retail space generally, including reductions in consumer spending, variability in retailer demand for leased space, adverse impact of e-commerce, ongoing consolidation in the retail sector and changes in economic conditions and consumer confidence; (x)
•risks endemic to real estate and the real estate industry generally; (xi)
•the adverse effect any future pandemic, endemic or outbreak of infectious disease, and mitigation efforts to control their spread;
•competitive risks; (xii)
•risks to our information systems - or those of our tenants or vendors - from service interruption, misappropriation of data, breaches of security, or other cyber-related attacks;
•risks related to the geographic concentration of the Company’sCompany's properties in the Washington, D.C. to Boston corridor; (xiii) Northeast;
•damage to the Company’sCompany's properties from catastrophic weather and other natural events, and the physical effects of climate change; (xiv)
•the inabilityrisk that an uninsured loss on the Company's properties or a loss that exceeds the limits of the Company's insurance policies could subject the Company to realize anticipated returns from its redevelopment activities; (xv) uninsured losses; (xvi) lost capital or revenue on those properties;
•the Company’srisk that continued increases in the cost of necessary insurance could negatively impact the Company's profitability;
•the Company's ability and willingness to maintain its qualification as a REIT in light of economic, market, legal, tax and other considerations;
•the ability of our operating partnership, Cedar Realty Trust Partnership, L.P., and (xvii) information technology security breaches. For further discussioneach of factors that could materially affect our other partnerships and limited liability companies to be classified as partnerships or disregarded entities for federal income tax purposes;
•the outcomeimpact of forward-lookinge-commerce on our tenants' business; and
•inability to generate sufficient cash flows due to market conditions, competition, uninsured losses, changes in tax or other applicable laws.
Forward-looking statements
see “Risk Factors” in this
report and other documents that the Company files with the Securities and Exchange Commission from time to time.Form 10-K should be read in light of these factors. Except for ongoing obligations to disclose material information as required by the federal securities laws, the Company undertakes no obligation to release publicly any revisions to any forward-looking statements to reflect events or circumstances after the date hereof or to reflect the occurrence of unanticipated events. All of the above factors are difficult to predict, contain uncertainties that may materially affect the Company’sCompany's actual results and may be beyond the Company’sCompany's control. New factors emerge from time to time, and it is not possible for the Company’sCompany's management to predict all such factors or to assess the effects of each factor on the Company’sCompany's business. Accordingly, there can be no assurance that the Company’sCompany's current expectations will be realized.
Item 1. Business
and PropertiesCedar Realty Trust, Inc. (the “Company”)
The Company is a real estate investment trust
(“REIT”("REIT") that focuses
primarily on
ownership, operationowning and
redevelopment ofoperating income producing retail properties with a primary focus on grocery-anchored shopping centers
primarily in
high-density urban markets from Washington, D.C. to Boston.the Northeast. At December 31,
2020,2023, the Company owned
and managed a portfolio of
54 operating19 properties
(excluding properties “held for sale”) totaling
8.12.8 million square feet of gross leasable area
(“GLA”("GLA"). The portfolio was
89.1%89.6% leased and
88.1%86.4% occupied at December 31,
2020.2023.
The Company, organized
as a Maryland corporation in 1984, has elected to be taxed as a
real estate investment trust (“REIT”)REIT under applicable provisions of the Internal Revenue Code of 1986, as amended (the
“Code”"Code"). To qualify as a REIT under those provisions, the Company must have a preponderant percentage of its assets invested in, and income derived from, real estate and related sources. The
Company’s objectives are to provide to its stockholdersCompany is a
professionally-managedcommercial real estate
portfolio consisting primarily ofinvestment company that owns income-producing retail properties with a primary focus on grocery-anchored
shopping centers from Washington, D.C. to Boston, which will provide substantial cash flow, currently and in the future, taking into account an acceptable modest risk profile, and which will present opportunities for additional growth in income and capital appreciation.centers.
The Company organized as a Maryland corporation, has established an umbrella partnership structure through the contribution of substantially all of its assets to Cedar Realty Trust Partnership, L.P. (the “Operating Partnership”"Operating Partnership"), organized as a limited partnership under the laws of Delaware. The Operating Partnership is the entity through which the Company conducts substantially all of its business and owns (either directly or through subsidiaries) substantially all of its assets. Prior to consummation of the Transactions, the Operating Partnership.Partnership had limited partners other than the Company, but their limited partnership interests in the Operating Partnership were settled pursuant to the Merger Agreement, as described below. At December 31, 2020,2023, the Company, which is a subsidiary of WHLR (as defined herein), owned a 99.4% general and limited partnership100.0% interest in, and was the sole general partner of, the Operating Partnership.
The limited partners’ interest inCompany, the Operating Partnership, (0.6% at December 31, 2020) is representedtheir subsidiaries and affiliated partnerships are separate legal entities. For ease of reference, the terms "we", "our", "us", "Company" and "Operating Partnership" (including their respective subsidiaries and affiliates) refer to the business and properties of all these entities, unless the context otherwise requires.
Asset Sale and Merger
On March 2, 2022, the Company entered into definitive agreements for the sale of the Company and its assets in a series of related all-cash transactions. Specifically, the Company and certain of its subsidiaries entered into an asset purchase and sale agreement (the "Asset Purchase Agreement") with DRA Fund X-B LLC and KPR Centers LLC (together with their respective designees, the "Grocery-Anchored Purchasers") for the sale of a portfolio of 33 grocery-anchored shopping centers for cash (the "Grocery-Anchored Portfolio Sale"). In addition, the Company entered into an agreement and plan of merger (the "Merger Agreement") with Wheeler Real Estate Investment Trust, Inc. ("WHLR") and certain of its affiliates pursuant to which, following closing of the Grocery-Anchored Portfolio Sale, WHLR acquired the balance of the Company's shopping center assets by Operating Partnership Units (“OP Units”way of an all-cash merger transaction (the "Merger").
The transactions contemplated by the Asset Purchase Agreement and the Merger Agreement are collectively referred to as the "Transactions". The carrying amountTransactions were unanimously approved by the Company's former Board of such interest is adjustedDirectors and were approved by the Company's common stockholders at a special meeting of stockholders held on May 27, 2022.
On July 7, 2022, the
endCompany and certain of
each reporting period to an amount equal toits subsidiaries completed the
limited partners’ ownership percentageGrocery-Anchored Portfolio Sale and the East River Park and Senator Square redevelopment asset sales for total gross proceeds of approximately $879 million, including the assumed debt. There were no material relationships among the Company, the Grocery-Anchored Purchasers, or any of their respective affiliates. On August 22, 2022, the Company completed the Merger. Each outstanding share of common stock of the Company and outstanding common unit of the Operating
Partnership’s net equity. The 81,000 OP Units outstanding at December 31, 2020 are economically equivalentPartnership held by persons other than the Company immediately prior to
shares of the
Company’s common stock. The holders of OP Units haveMerger were canceled and converted into the right to
exchange their OP Units for the same numberreceive a cash payment of
shares$9.48 per share or unit. As a result of the
Company’s common stock or, at the Company’s option, for cash.On November 25, 2020, the Company effected a 1-for-6.6 reverse stock splitMerger, WHLR acquired all of the issued and outstanding shares of common stock. Each 6.6 shares of the Company's issuedcommon stock, which ceased to be publicly traded on the New York Stock Exchange ("NYSE"). The Company's outstanding 7.25% Series B Preferred Stock and 6.50% Series C Preferred Stock remain outstanding and continue to trade on the NYSE. In addition, prior to consummation of the Merger, the Company's Board of Directors declared a special dividend on shares of the Company's outstanding common stock were combined into oneand OP Units of $19.52 per share, payable to holders of record of the Company's common stock. The number of authorized sharesstock and the par value of the common stock were not changed. In addition, the Company amended the Limited Partnership Agreement of our Operating Partnership to effect a corresponding reverse split of the partnership interests of the Operating Partnership. In accordance with accounting principles generally accepted in the United States (“GAAP”), all shares of common stock, restricted stock units, OP Units and per share/unit information that are presented in this Form 10-K were adjusted to reflectat the reverse splitclose of business on a retroactive basis for all periods presented.
August 19, 2022.
The Company derives substantially all of its revenues from rents and operating expense reimbursements received pursuant to long-term leases. The
Company’sCompany's operating results therefore depend on the ability of its tenants to make the payments required by the terms of their leases. The Company focuses its investment activities on grocery-anchored shopping centers. The Company believes that, because of the need of consumers to purchase food and other staple goods and services generally available at such centers, its type of
“necessities-based”"necessities-based" properties should provide relatively stable revenue flows even during difficult economic times.
Human Capital Management
Our Team
All individuals that provide services to the Company are employees of WHLR and participate in WHLR's compensation, benefits, professional development and other programs. For a discussion of WHLR's human capital management, please see WHLR's 2023 Annual Report on Form 10-K.
Business Objectives and Investment Strategy
Our primary business objective is to maximize the value of our portfolio. We intend to achieve this objective utilizing the following investment strategies:
•Focus on necessity-based retail. Own and operate retail properties that serve the essential day-to-day shopping needs of the surrounding communities. These necessity-based centers attract high levels of daily traffic resulting in cross-selling of goods and services from our tenants. The majority of our tenants provide non-cyclical consumer goods and services that are less impacted by fluctuations in the economy. We believe these centers that provide essential goods and services such as groceries result in a stable, lower-risk portfolio of retail investment properties.
•Focus on secondary and tertiary markets with strong demographics and demand. Our properties are in markets that have strong demographics such as population density, population stability, consistent tenant sales trends and growth in household income. We seek to identify new tenants and renew leases with existing tenants in these locations that support the need for necessity-based retail and limited new supply. We aim to identify and pursue attractive investment opportunities in regions with low taxes and a pro-business environment.
•Increase operating income through leasing strategies and expense management. We employ intensive lease management strategies to optimize occupancy. Management has extensive expertise in acquiring and managing under-performing properties and increasing operating income through more effective leasing strategies and expense management. Our leases generally require the tenant to reimburse us for a substantial portion of the expenses incurred in operating, maintaining, repairing, and managing the shopping center and the common areas, along with the associated insurance costs and real estate taxes. In many cases, the tenant is either fully or partially responsible for all maintenance of the property, thereby limiting our financial exposure towards maintaining the center and increasing our net income. We refer to this arrangement as a "triple net lease."
•Selectively utilize our capital to improve retail properties. We intend to make capital investments where the risk adjusted returns on such capital is accretive to our stockholders. We allocate capital to value-added improvements of retail properties to increase rents, extend long-term leases with anchor tenants and increase occupancy. We selectively allocate capital to revenue enhancing projects that we believe will improve the market position of a given property.
•Recycling and sensible management of our property portfolio. We intend to sell non-income producing land parcels or non-core assets utilizing sales proceeds to deleverage the balance sheet and invest in higher yielding opportunities. Properties may be slated for disposition based upon management's periodic review of our portfolio, and approval by our Board of Directors.
•Strategy for optimizing capital structure.The Company seeks to mitigate risk and optimize its capital structure through continuous focus on maintaining prudent leverage and lengthy average debt maturities, as well as access to a diverse selection of capital sources, including the Operating Partnership, their subsidiariessecured and affiliated partnershipsunsecured debt markets, unsecured lines of credit, and other sources.
•Strategy for integrating acquisitions. As the Company undertakes acquisitions, we seek to thoughtfully integrate the acquired properties and any software and personnel to maximize efficiencies both at the property and corporate level.
Governmental Regulations Affecting Our Properties
We and our properties are separate legal entities. For easesubject to a variety of reference,federal, state and local environmental, health, safety, tax and similar laws. The application of these laws to a specific property that we own depends on a variety of property-specific circumstances, including the terms “we”, “our”, “us”, “Company”current and “Operating Partnership” (including their respective subsidiariesformer uses of the property, the building materials used at the property and affiliates) referthe physical layout of the property. Neither existing environmental, health, safety and similar laws nor the costs of our compliance with these laws has had a material adverse effect on our financial condition or results of operations, and management does not believe they will for the fiscal year ending December 31, 2024. In addition, we have not incurred, and do not expect to incur, any material costs or liabilities due to environmental contamination at properties we currently own or have owned in the past. However, we cannot predict the impact of new
or changed laws or regulations on properties we currently own or may acquire in the future. We have no current plans for substantial capital expenditures with respect to compliance with environmental, health, safety and similar laws and we carry environmental insurance that covers a number of environmental risks for most of our properties.
Competition
Numerous commercial developers and real estate companies compete with us with respect to the business andleasing of properties. Some of these competitors may possess greater capital resources than we do, although we do not believe that any single competitor or group of competitors in any of the primary markets where our properties of all these entities, unless the context otherwise requires. The Company’s executive offices are located are dominant in that market. This competition may interfere with our ability to attract and retain tenants, leading to increased vacancy rates and/or reduced rents and adversely affect our ability to minimize operating expenses.
Retailers at 44 South Bayles Avenue, Port Washington, New York 11050-3765 (telephone 516-767-6492)our properties also face increasing competition from online retailers, outlet stores, discount shopping clubs, superstores, and other forms of sales and marketing of goods and services, such as direct mail. This competition could contribute to lease defaults and insolvency of tenants.
Climate
Some of our properties could be subject to natural or other disasters. In addition, we may acquire properties that are located in areas that are subject to natural disasters, such as earthquakes and droughts. Properties could also be affected by increases in the frequency or severity of tornadoes, hurricanes or other severe weather, whether such increases are caused by global climate changes or other factors. The occurrence of natural disasters or severe weather conditions can increase investment costs to repair or replace damaged properties, increase operating costs, increase future property insurance costs, and/or negatively impact the tenant demand for lease space. If insurance is unavailable to us, or is unavailable on acceptable terms, or if our insurance is not adequate to cover business interruption or losses from such events, our earnings, liquidity and/or capital resources could be adversely affected. While several of our properties are located in areas that have experienced hurricanes, tornados, severe rain storms, or snow during the past two years, there has been no substantial damage or change in operations related to weather events.
Insurance
The Company carries comprehensive liability, property, fire, flood, wind, extended coverage, business interruption and rental loss insurance covering all of the properties in its portfolio under an insurance policy, in addition to other coverages, such as trademark and pollution coverage that may be appropriate for certain of its properties. Additionally, the Company carries a directors', officers', entity and employment practices liability insurance policy that covers such claims made against the Company and its directors and officers. The Company believes the policy specifications and insured limits are appropriate and adequate for its properties given the relative risk of loss, the cost of the coverage and industry practice; however, its insurance coverage may not be sufficient to fully cover losses.Increases in the occurrence of natural disasters and severe weather patterns have led to a consistent increase in overall rates, deductibles and valuations from insurance carriers, which have resulted in increased costs of necessary insurance required to protect our assets.
Available Information
We are subject to the reporting requirements of the Exchange Act. Therefore, we file reports, proxy statements and other information with the Securities and Exchange Commission (the "SEC"). The Company alsoSEC maintains property management, construction management and/or leasing offices at several of its shopping-center properties. a website (www.sec.gov) that contains reports, proxy and information statements, and other information regarding issuers that file electronically with the SEC, including us.
The
Company’sCompany's investor relations website can be accessed
under the "Investors" tab at
www.cedarrealtytrust.com,https://ir.cedarrealtytrust.com/, where a copy of the
Company’sCompany's Forms 10-K, 10-Q, 8-K and other filings with the
Securities and Exchange Commission (“SEC”)SEC can be obtained free of charge. These SEC filings are added to the website as soon as reasonably practicable.
The Company’s Code of Ethics, corporate governance guidelines and committee charters are also available on the website. Information on the website is not part of this Form 10-K.
Real Estate Summary
| | | | | | | | | | | | | | Average | | | | | |
| | Year | | | | | | | Percent | | | base rent per | | | | | Selected | |
Property Description | | acquired | | | GLA | | | occupied | | | leased sq. ft. | | | Grocer Anchor | | Other Anchors |
Connecticut | | | | | | | | | | | | | | | | | | | | |
Bethel Shopping Center | | | 2013 | | | | 101,105 | | | | 95.1 | % | | $ | 23.49 | | | Big Y | | Dollar Tree |
Brickyard Plaza | | | 2004 | | | | 227,598 | | | | 99.2 | % | | | 8.79 | | | | | Home Depot |
| | | | | | | | | | | | | | | | | | | | Kohl's |
| | | | | | | | | | | | | | | | | | | | Michaels |
| | | | | | | | | | | | | | | | | | | | PetSmart |
Groton Shopping Center | | | 2007 | | | | 130,264 | | | | 100.0 | % | | | 12.29 | | | Aldi | | TJ Maxx |
| | | | | | | | | | | | | | | | | | | | Goodwill |
| | | | | | | | | | | | | | | | | | | | Planet Fitness |
| | | | | | | | | | | | | | | | | | | | Dollar Tree |
| | | | | | | | | | | | | | | | | | | | Pet Supplies Plus |
Jordan Lane | | | 2005 | | | | 177,504 | | | | 72.2 | % | | | 12.87 | | | Stop & Shop | | Crunch Fitness |
| | | | | | | | | | | | | | | | | | | | Dollar Tree |
New London Mall | | | 2009 | | | | 259,566 | | | | 89.5 | % | | | 13.16 | | | Shop Rite | | Marshalls |
| | | | | | | | | | | | | | | | | | | | Home Goods |
| | | | | | | | | | | | | | | | | | | | PetSmart |
Oakland Commons | | | 2007 | | | | 90,100 | | | | 100.0 | % | | | 6.37 | | | Walmart | | Bristol Ten Pin |
Southington Center | | | 2003 | | | | 155,842 | | | | 98.5 | % | | | 7.90 | | | Walmart | | NAMCO |
| | | | | | | | | | | | | | | | | | | | Southington Wine & Spirit |
Total Connecticut | | | | | | | 1,141,979 | | | | 92.5 | % | | | 11.68 | | | | | |
| | | | | | | | | | | | | | | | | | | | |
Delaware | | | | | | | | | | | | | | | | | | | | |
Christina Crossing | | | 2017 | | | | 119,446 | | | | 90.7 | % | | | 19.59 | | | Shop Rite | | |
| | | | | | | | | | | | | | | | | | | | |
Maryland / Washington, D.C. | | | | | | | | | | | | | | | | | | | | |
East River Park | | | 2015 | | | | 150,038 | | | | 91.6 | % | | | 20.66 | | | Safeway | | District of Columbia |
| | | | | | | | | | | | | | | | | | | | CVS |
Oakland Mills | | | 2005 | | | | 57,008 | | | | 92.6 | % | | | 11.59 | | | LA Mart | | |
Patuxent Crossing (f/k/a San Souci Plaza) (a) | | | 2009 | | | | 264,134 | | | | 82.3 | % | | | 11.00 | | | McKay's Market and Café | | Marshalls |
| | | | | | | | | | | | | | | | | | | | Home Goods |
| | | | | | | | | | | | | | | | | | | | World Gym |
| | | | | | | | | | | | | | | | | | | | JOANN Fabrics |
| | | | | | | | | | | | | | | | | | | | Dollar Tree |
Senator Square | | | 2018 | | | | 42,941 | | | | 100.0 | % | | | 28.56 | | | | | Unity Health Care |
| | | | | | | | | | | | | | | | | | | | Dollar Tree |
Shoppes at Arts District | | | 2016 | | | | 35,676 | | | | 100.0 | % | | | 37.53 | | | Yes! Organic Market | | Busboys and Poets |
Valley Plaza | | | 2003 | | | | 190,939 | | | | 49.8 | % | | | 9.91 | | | | | Ollie's Bargain Outlet |
| | | | | | | | | | | | | | | | | | | | Tractor Supply |
Yorktowne Plaza | | | 2007 | | | | 136,197 | | | | 65.6 | % | | | 12.43 | | | Food Lion | | Dollar Tree |
Total Maryland / Washington, D.C. | | | | | | | 876,933 | | | | 76.5 | % | | | 15.60 | | | | | |
| | | | | | | | | | | | | | | | | | | | |
Massachusetts | | | | | | | | | | | | | | | | | | | | |
Fieldstone Marketplace | | 2005/2012 | | | | 150,123 | | | | 84.3 | % | | | 12.04 | | | Shaw's | | Work Out World |
| | | | | | | | | | | | | | | | | | | | Dollar Tree |
| | | | | | | | | | | | | | | | | | | | Family Dollar |
Franklin Village Plaza | | 2004/2012 | | | | 305,937 | | | | 86.6 | % | | | 21.06 | | | Stop & Shop | | Marshalls |
| | | | | | | | | | | | | | | | | | | | NRG Labs |
Kings Plaza | | | 2007 | | | | 168,243 | | | | 82.2 | % | | | 8.65 | | | | | Fun Z Trampoline Park |
| | | | | | | | | | | | | | | | | | | | Ocean State Job Lot |
| | | | | | | | | | | | | | | | | | | | Savers |
| | | | | | | | | | | | | | | | | | | | Dollar General |
Norwood Shopping Center | | | 2006 | | | | 87,406 | | | | 93.2 | % | | | 10.85 | | | Big Y | | Planet Fitness |
| | | | | | | | | | | | | | | | | | | | Dollar Tree |
The Shops at Suffolk Downs | | | 2005 | | | | 121,187 | | | | 98.8 | % | | | 14.55 | | | Stop & Shop | | Dollar Tree |
| | | | | | | | | | | | | | | | | | Target (b) | | |
| | | | | | | | | | | | | | Average | | | | | |
| | Year | | | | | | | Percent | | | base rent per | | | | | Selected |
Property Description | | acquired | | | GLA | | | occupied | | | leased sq. ft. | | | Grocer Anchor | | Other Anchors |
Massachusetts (continued) | | | | | | | | | | | | | | | | | | | | |
Timpany Plaza | | | 2007 | | | | 182,799 | | | | 67.4 | % | | | 10.20 | | | | | Big Lots |
| | | | | | | | | | | | | | | | | | | | Gardner Theater |
| | | | | | | | | | | | | | | | | | | | Tractor Supply |
| | | | | | | | | | | | | | | | | | | | Dollar Tree |
Webster Commons | | | 2007 | | | | 98,984 | | | | 96.7 | % | | | 11.85 | | | | | Big Lots |
| | | | | | | | | | | | | | | | | | | | Planet Fitness |
| | | | | | | | | | | | | | | | | | | | CVS |
| | | | | | | | | | | | | | | | | | | | Aubuchon Hardware |
Total Massachusetts | | | | | | | 1,114,679 | | | | 85.2 | % | | | 14.02 | | | | | |
| | | | | | | | | | | | | | | | | | | | |
New Jersey | | | | | | | | | | | | | | | | | | | | |
Pine Grove Plaza | | | 2003 | | | | 79,306 | | | | 42.5 | % | | | 15.04 | | | Acme Markets (b) | | Dollar Tree |
The Shops at Bloomfield Station | | | 2016 | | | | 63,844 | | | | 84.1 | % | | | 19.20 | | | Super Foodtown | | |
Washington Center Shoppes | | | 2001 | | | | 157,300 | | | | 92.8 | % | | | 11.39 | | | Acme Markets | | Planet Fitness |
Total New Jersey | | | | | | | 300,450 | | | | 77.7 | % | | | 13.71 | | | | | |
| | | | | | | | | | | | | | | | | | | | |
New York | | | | | | | | | | | | | | | | | | | | |
Carman's Plaza | | | 2007 | | | | 195,485 | | | | 58.9 | % | | | 22.26 | | | Key Foods | | Department of Motor Vehicle |
| | | | | | | | | | | | | | | | | | | | Popcorn Beauty |
| | | | | | | | | | | | | | | | | | | | Dollar Tree |
Pennsylvania | | | | | | | | | | | | | | | | | | | | |
Academy Plaza | | | 2001 | | | | 137,415 | | | | 89.3 | % | | | 15.76 | | | Acme Markets | | Rite Aid |
Camp Hill | | | 2002 | | | | 430,198 | | | | 96.9 | % | | | 15.82 | | | Giant Foods | | Boscov's |
| | | | | | | | | | | | | | | | | | | | LA Fitness |
| | | | | | | | | | | | | | | | | | | | Barnes & Noble |
| | | | | | | | | | | | | | | | | | | | Staples |
Colonial Commons | | | 2011 | | | | 410,432 | | | | 92.0 | % | | | 13.53 | | | Giant Foods (c) | | Dick's Sporting Goods |
| | | | | | | | | | | | | | | | | | | | Home Goods |
| | | | | | | | | | | | | | | | | | | | Ross Dress For Less |
| | | | | | | | | | | | | | | | | | | | Marshalls |
| | | | | | | | | | | | | | | | | | | | JoAnn Fabrics |
| | | | | | | | | | | | | | | | | | | | David's Furniture |
| | | | | | | | | | | | | | | | | | | | Old Navy |
| | | | | | | | | | | | | | | | | | | | Dollar Tree |
Crossroads II (a) | | | 2008 | | | | 133,717 | | | | 97.2 | % | | | 19.67 | | | Giant Foods | | Dollar Tree |
Fairview Commons | | | 2007 | | | | 52,964 | | | | 77.5 | % | | | 10.69 | | | Grocery Outlet | | Dollar Tree |
Fishtown Crossing | | | 2001 | | | | 127,265 | | | | 88.0 | % | | | 17.39 | | | IGA Supermarket | | Pep Boys |
| | | | | | | | | | | | | | | | | | | | Dollar Tree |
| | | | | | | | | | | | | | | | | | | | Dollar General |
Girard Plaza | | | 2019 | | | | 35,688 | | | | 100.0 | % | | | 16.29 | | | Save A Lot | | Dollar General |
Gold Star Plaza | | | 2006 | | | | 71,720 | | | | 95.5 | % | | | 8.94 | | | Redner's | | Dollar Tree |
Golden Triangle | | | 2003 | | | | 202,790 | | | | 89.2 | % | | | 13.22 | | | | | LA Fitness |
| | | | | | | | | | | | | | | | | | | | Marshalls |
| | | | | | | | | | | | | | | | | | | | Staples |
| | | | | | | | | | | | | | | | | | | | Immunotek |
| | | | | | | | | | | | | | | | | | | | Walgreens |
| | | | | | | | | | | | | | | | | | | | Dollar Tree |
Halifax Plaza | | | 2003 | | | | 51,510 | | | | 100.0 | % | | | 13.65 | | | Giant Foods | | Rite Aid |
Hamburg Square | | | 2004 | | | | 102,058 | | | | 96.7 | % | | | 6.50 | | | Redner's | | Chesaco RV |
Lawndale Plaza | | | 2015 | | | | 92,773 | | | | 100.0 | % | | | 18.57 | | | Shop Rite | | |
Meadows Marketplace | | 2004/2012 | | | | 91,518 | | | | 91.3 | % | | | 15.95 | | | Giant Foods | | |
Newport Plaza | | | 2003 | | | | 64,489 | | | | 100.0 | % | | | 12.85 | | | Giant Foods | | Rite Aid |
Northside Commons | | | 2008 | | | | 69,136 | | | | 100.0 | % | | | 10.41 | | | Redner's | | Dollar Tree |
Palmyra Shopping Center | | | 2005 | | | | 111,051 | | | | 87.9 | % | | | 7.54 | | | Weis Markets | | Goodwill |
| | | | | | | | | | | | | | Average | | | | | |
| | Year | | | | | | | Percent | | | base rent per | | | | | Selected |
Property Description | | acquired | | | GLA | | | occupied | | | leased sq. ft. | | | Grocer Anchor | | Other Anchors |
Pennsylvania (continued) | | | | | | | | | | | | | | | | | | | | |
Quartermaster Plaza | | | 2014 | | | | 456,602 | | | | 89.3 | % | | | 14.79 | | | BJ's Wholesale Club | | Home Depot |
| | | | | | | | | | | | | | | | | | | | Planet Fitness |
| | | | | | | | | | | | | | | | | | | | Staples |
| | | | | | | | | | | | | | | | | | | | PetSmart |
| | | | | | | | | | | | | | | | | | | | Walgreens |
Riverview Plaza | | | 2003 | | | | 113,922 | | | | 71.2 | % | | | 21.82 | | | | | Pep Boys |
| | | | | | | | | | | | | | | | | | | | Staples |
South Philadelphia | | | 2003 | | | | 193,085 | | | | 76.3 | % | | | 12.06 | | | Shop Rite | | Ross Dress For Less |
| | | | | | | | | | | | | | | | | | | | LA Fitness |
| | | | | | | | | | | | | | | | | | | | Kid City |
Swede Square | | | 2003 | | | | 100,809 | | | | 91.1 | % | | | 16.86 | | | Grocery Outlet | | LA Fitness |
The Point | | | 2000 | | | | 262,072 | | | | 87.0 | % | | | 14.72 | | | Giant Foods | | Burlington |
| | | | | | | | | | | | | | | | | | | | Barton's Home Outlet |
| | | | | | | | | | | | | | | | | | | | Staples |
| | | | | | | | | | | | | | | | | | | | Dollar Tree |
Trexler Mall | | | 2005 | | | | 336,687 | | | | 98.2 | % | | | 11.01 | | | | | Kohl's |
| | | | | | | | | | | | | | | | | | | | Urban Air |
| | | | | | | | | | | | | | | | | | | | Lehigh Wellness Partners |
| | | | | | | | | | | | | | | | | | | | Maxx Fitness |
| | | | | | | | | | | | | | | | | | | | Marshalls |
| | | | | | | | | | | | | | | | | | | | Home Goods |
| | | | | | | | | | | | | | | | | | | | Dollar Tree |
Trexlertown Plaza | | | 2006 | | | | 325,171 | | | | 94.5 | % | | | 14.26 | | | Giant Foods | | Hobby Lobby |
| | | | | | | | | | | | | | | | | | | | Burlington |
| | | | | | | | | | | | | | | | | | | | Big Lots |
| | | | | | | | | | | | | | | | | | | | Tractor Supply |
Total Pennsylvania | | | | | | | 3,973,072 | | | | 91.5 | % | | | 14.12 | | | | | |
| | | | | | | | | | | | | | | | | | | | |
Virginia | | | | | | | | | | | | | | | | | | | | |
Coliseum Marketplace | | | 2005 | | | | 106,648 | | | | 98.6 | % | | | 15.13 | | | Kroger | | Michaels |
Elmhurst Square | | | 2006 | | | | 66,254 | | | | 89.0 | % | | | 9.88 | | | Food Lion | | |
General Booth Plaza | | | 2005 | | | | 71,639 | | | | 100.0 | % | | | 15.30 | | | Food Lion | | |
Kempsville Crossing | | | 2005 | | | | 79,512 | | | | 94.6 | % | | | 12.05 | | | Walmart | | The Iron Asylum |
Oak Ridge Shopping Center | | | 2006 | | | | 38,700 | | | | 100.0 | % | | | 11.05 | | | Food Lion | | |
Total Virginia | | | | | | | 362,753 | | | | 96.4 | % | | | 13.16 | | | | | |
| | | | | | | | | | | | | | | | | | | | |
Total (89.1% leased at December 31, 2020) | | | | 8,084,797 | | | | 88.1 | % | | $ | 14.04 | (d) | | | | |
| | | | | | | | | | | | | | | | | | | | |
(a)
| The Company has a 40% ownership interest in the San Souci Plaza joint venture and a 60% ownership interest in the Crossroads II joint venture. Based on partnership promotes, additional equity interests, and/or other terms of the related joint venture agreements, the Company currently recognizes the results of operations of these joint ventures in excess of its stated percentage ownership.
|
(b)
| Tenant is a shadow anchor and is not included in GLA, percent occupied, and average base rent per leased sq.ft.
|
(c)
| Giant Foods retains the leasehold obligation, as Hobby Lobby is a subtenant and currently occupying the space.
|
(d)
| Average base rent is calculated as the aggregate, annualized contractual minimum rent for all occupied spaces divided by the aggregate GLA of all occupied spaces as of December 31, 2020. Tenant concessions are reflected in this measure except for a limited number of short-term (generally one to three months) free rent concessions provided to new tenants that took occupancy prior to the end of the reporting period but within the concession period. Average base rent would have been $13.82 per square foot if all such free rent concessions were reflected.
|
Tenant Concentration
| | Number | | | | | | | | | | | | | | | Annualized | | | Percentage | |
| | of | | | | | | | Percentage | | | Annualized | | | base rent | | | annualized | |
Tenant | | stores | | | GLA | | | of GLA | | | base rent | | | per sq. ft. | | | base rents | |
Top twenty-five tenants (a): | | | | | | | | | | | | | | | | | | | | | | | | |
Giant Foods | | | 8 | | | | 538,000 | | | | 6.7 | % | | $ | 9,132,000 | | | $ | 16.97 | | | | 9.1 | % |
Shop Rite | | | 4 | | | | 252,000 | | | | 3.1 | % | | | 4,092,000 | | | | 16.24 | | | | 4.1 | % |
Stop & Shop | | | 3 | | | | 211,000 | | | | 2.6 | % | | | 2,884,000 | | | | 13.67 | | | | 2.9 | % |
Dollar Tree | | | 21 | | | | 224,000 | | | | 2.8 | % | | | 2,430,000 | | | | 10.85 | | | | 2.4 | % |
LA Fitness | | | 4 | | | | 158,000 | | | | 2.0 | % | | | 2,110,000 | | | | 13.35 | | | | 2.1 | % |
Big Y | | | 2 | | | | 106,000 | | | | 1.3 | % | | | 2,006,000 | | | | 18.92 | | | | 2.0 | % |
Home Depot | | | 2 | | | | 253,000 | | | | 3.1 | % | | | 1,977,000 | | | | 7.81 | | | | 2.0 | % |
Staples | | | 5 | | | | 106,000 | | | | 1.3 | % | | | 1,812,000 | | | | 17.09 | | | | 1.8 | % |
BJ's Wholesale Club | | | 1 | | | | 118,000 | | | | 1.5 | % | | | 1,760,000 | | | | 14.92 | | | | 1.8 | % |
Food Lion | | | 4 | | | | 163,000 | | | | 2.0 | % | | | 1,559,000 | | | | 9.56 | | | | 1.6 | % |
Marshalls | | | 6 | | | | 170,000 | | | | 2.1 | % | | | 1,447,000 | | | | 8.51 | | | | 1.4 | % |
Planet Fitness | | | 5 | | | | 99,000 | | | | 1.2 | % | | | 1,283,000 | | | | 12.96 | | | | 1.3 | % |
Walmart | | | 3 | | | | 192,000 | | | | 2.4 | % | | | 1,193,000 | | | | 6.21 | | | | 1.2 | % |
Redner's | | | 3 | | | | 159,000 | | | | 2.0 | % | | | 1,160,000 | | | | 7.30 | | | | 1.2 | % |
Kohl's | | | 2 | | | | 147,000 | | | | 1.8 | % | | | 1,031,000 | | | | 7.01 | | | | 1.0 | % |
Home Goods | | | 4 | | | | 105,000 | | | | 1.3 | % | | | 1,002,000 | | | | 9.54 | | | | 1.0 | % |
District of Columbia | | | 1 | | | | 34,000 | | | | 0.4 | % | | | 932,000 | | | | 27.41 | | | | 0.9 | % |
Shaw's | | | 1 | | | | 68,000 | | | | 0.8 | % | | | 925,000 | | | | 13.60 | | | | 0.9 | % |
Boscovs | | | 1 | | | | 159,000 | | | | 2.0 | % | | | 877,000 | | | | 5.52 | | | | 0.9 | % |
Walgreens | | | 2 | | | | 29,000 | | | | 0.4 | % | | | 875,000 | | | | 30.17 | | | | 0.9 | % |
Kroger | | | 1 | | | | 58,000 | | | | 0.7 | % | | | 863,000 | | | | 14.88 | | | | 0.9 | % |
PetSmart | | | 3 | | | | 63,000 | | | | 0.8 | % | | | 857,000 | | | | 13.60 | | | | 0.9 | % |
Dick's Sporting Goods | | | 1 | | | | 56,000 | | | | 0.7 | % | | | 784,000 | | | | 14.00 | | | | 0.8 | % |
CVS | | | 2 | | | | 20,000 | | | | 0.2 | % | | | 783,000 | | | | 39.15 | | | | 0.8 | % |
Burlington Coat Factory | | | 2 | | | | 84,000 | | | | 1.0 | % | | | 760,000 | | | | 9.05 | | | | 0.8 | % |
Sub-total top twenty-five tenants | | | 91 | | | | 3,572,000 | | | | 44.2 | % | | | 44,534,000 | | | | 12.47 | | | | 44.6 | % |
Remaining tenants | | | 693 | | | | 3,548,000 | | | | 43.9 | % | | | 55,426,000 | | | | 15.62 | | | | 55.4 | % |
Sub-total all tenants (b) | | | 784 | | | | 7,120,000 | | | | 88.1 | % | | $ | 99,960,000 | | | $ | 14.04 | | | | 100.0 | % |
Vacant space | | N/A | | | | 965,000 | | | | 11.9 | % | | | | | | | | | | | | |
Total | | | 784 | | | | 8,085,000 | | | | 100.0 | % | | | | | | | | | | | | |
| | | | | | | | | | | | | | | | | | | | | | | | |
(a)
| Several of the tenants listed above share common ownership with other tenants:
|
(1) Giant Foods, Stop & ShopInvestors and Food Lion,others should note that we currently announce material information using SEC filings and (2) Marshalls, Home Goods, and TJ Maxx (GLA of 30,000; annualized base rent of $315,000).
(b)
| Comprised of large tenants (10,000 or more GLA) and small tenants as follows:
|
| | | | | | Percentage | | | | | | | Annualized | | | Percentage | |
| | Occupied | | | of occupied | | | Annualized | | | base rent | | | annualized | |
| | GLA | | | GLA | | | base rent | | | per sq. ft. | | | base rents | |
Spaces ≥ 10,000 GLA | | | 5,285,000 | | | | 74.2 | % | | $ | 60,221,000 | | | $ | 11.40 | | | | 60.2 | % |
Spaces < 10,000 GLA | | | 1,835,000 | | | | 25.8 | % | | | 39,739,000 | | | | 21.65 | | | | 39.8 | % |
Total | | | 7,120,000 | | | | 100.0 | % | | $ | 99,960,000 | | | $ | 14.04 | | | | 100.0 | % |
| | | | | | | | | | | | | | | | | | | | |
Lease Expirations
Total Portfolio | |
| | | | | | | | | | | | | | Annualized | | | Percentage | |
| | Number | | | | | | | Percentage | | | expiring | | | of annualized | |
Year of lease | | of leases | | | GLA | | | of GLA | | | base rents | | | expiring | |
expiration | | expiring | | | expiring | | | expiring | | | per sq. ft. | | | base rents | |
Month-To-Month | | | 45 | | | | 146,000 | | | | 2.1 | % | | $ | 16.83 | | | | 2.5 | % |
2021 | | | 112 | | | | 591,000 | | | | 8.3 | % | | | 17.03 | | | | 10.1 | % |
2022 | | | 105 | | | | 549,000 | | | | 7.7 | % | | | 16.84 | | | | 9.2 | % |
2023 | | | 89 | | | | 592,000 | | | | 8.3 | % | | | 14.88 | | | | 8.8 | % |
2024 | | | 97 | | | | 788,000 | | | | 11.1 | % | | | 14.71 | | | | 11.6 | % |
2025 | | | 103 | | | | 1,220,000 | | | | 17.1 | % | | | 13.76 | | | | 16.8 | % |
2026 | | | 51 | | | | 496,000 | | | | 7.0 | % | | | 14.94 | | | | 7.4 | % |
2027 | | | 39 | | | | 318,000 | | | | 4.5 | % | | | 14.04 | | | | 4.5 | % |
2028 | | | 33 | | | | 354,000 | | | | 5.0 | % | | | 11.47 | | | | 4.1 | % |
2029 | | | 37 | | | | 663,000 | | | | 9.3 | % | | | 13.10 | | | | 8.7 | % |
2030 | | | 35 | | | | 564,000 | | | | 7.9 | % | | | 9.26 | | | | 5.2 | % |
Thereafter | | | 38 | | | | 839,000 | | | | 11.8 | % | | | 13.31 | | | | 11.2 | % |
All tenants | | | 784 | | | | 7,120,000 | | | | 100.0 | % | | $ | 14.04 | | | | 100.0 | % |
| | | | | | | | | | | | | | | | | | | | |
| | | | | | | | | | | | | | | | | | | | |
Spaces ≥ 10,000 GLA | |
| | | | | | | | | | | | | | Annualized | | | Percentage | |
| | Number | | | | | | | Percentage | | | expiring | | | of annualized | |
Year of lease | | of leases | | | GLA | | | of GLA | | | base rents | | | expiring | |
expiration | | expiring | | | expiring | | | expiring | | | per sq. ft. | | | base rents | |
Month-To-Month | | | 2 | | | | 34,000 | | | | 0.6 | % | | $ | 6.74 | | | | 0.4 | % |
2021 | | | 11 | | | | 340,000 | | | | 6.4 | % | | | 13.09 | | | | 7.4 | % |
2022 | | | 12 | | | | 267,000 | | | | 5.1 | % | | | 12.42 | | | | 5.5 | % |
2023 | | | 13 | | | | 417,000 | | | | 7.9 | % | | | 11.52 | | | | 8.0 | % |
2024 | | | 19 | | | | 587,000 | | | | 11.1 | % | | | 11.59 | | | | 11.3 | % |
2025 | | | 26 | | | | 926,000 | | | | 17.5 | % | | | 11.70 | | | | 18.0 | % |
2026 | | | 13 | | | | 381,000 | | | | 7.2 | % | | | 12.34 | | | | 7.8 | % |
2027 | | | 11 | | | | 218,000 | | | | 4.1 | % | | | 11.67 | | | | 4.2 | % |
2028 | | | 10 | | | | 280,000 | | | | 5.3 | % | | | 9.27 | | | | 4.3 | % |
2029 | | | 14 | | | | 583,000 | | | | 11.0 | % | | | 12.11 | | | | 11.7 | % |
2030 | | | 10 | | | | 487,000 | | | | 9.2 | % | | | 7.37 | | | | 6.0 | % |
Thereafter | | | 14 | | | | 765,000 | | | | 14.5 | % | | | 12.14 | | | | 15.4 | % |
All tenants | | | 155 | | | | 5,285,000 | | | | 100.0 | % | | $ | 11.40 | | | | 100.0 | % |
| | | | | | | | | | | | | | | | | | | | |
| | | | | | | | | | | | | | | | | | | | |
Spaces < 10,000 GLA | |
| | | | | | | | | | | | | | Annualized | | | Percentage | |
| | Number | | | | | | | Percentage | | | expiring | | | of annualized | |
Year of lease | | of leases | | | GLA | | | of GLA | | | base rents | | | expiring | |
expiration | | expiring | | | expiring | | | expiring | | | per sq. ft. | | | base rents | |
Month-To-Month | | | 43 | | | | 112,000 | | | | 6.1 | % | | $ | 19.89 | | | | 5.6 | % |
2021 | | | 101 | | | | 251,000 | | | | 13.7 | % | | | 22.37 | | | | 14.1 | % |
2022 | | | 93 | | | | 282,000 | | | | 15.4 | % | | | 21.02 | | | | 14.9 | % |
2023 | | | 76 | | | | 175,000 | | | | 9.5 | % | | | 22.89 | | | | 10.1 | % |
2024 | | | 78 | | | | 201,000 | | | | 11.0 | % | | | 23.83 | | | | 12.1 | % |
2025 | | | 77 | | | | 294,000 | | | | 16.0 | % | | | 20.23 | | | | 15.0 | % |
2026 | | | 38 | | | | 115,000 | | | | 6.3 | % | | | 23.55 | | | | 6.8 | % |
2027 | | | 28 | | | | 100,000 | | | | 5.4 | % | | | 19.20 | | | | 4.8 | % |
2028 | | | 23 | | | | 74,000 | | | | 4.0 | % | | | 19.80 | | | | 3.7 | % |
2029 | | | 23 | | | | 80,000 | | | | 4.4 | % | | | 20.25 | | | | 4.1 | % |
2030 | | | 25 | | | | 77,000 | | | | 4.2 | % | | | 21.21 | | | | 4.1 | % |
Thereafter | | | 24 | | | | 74,000 | | | | 4.0 | % | | | 25.42 | | | | 4.7 | % |
All tenants | | | 629 | | | | 1,835,000 | | | | 100.0 | % | | $ | 21.65 | | | | 100.0 | % |
The Company’s Properties
The following tables summarizepress releases. In the future, we will continue to use these channels to distribute material information relating to the Company’s portfolio as of December 31, 2020:
| | Number of | | | | | | | Percentage | |
State | | properties | | | GLA | | | of GLA | |
Pennsylvania | | | 23 | | | | 3,973,072 | | | | 49.1 | % |
Connecticut | | | 7 | | | | 1,141,979 | | | | 14.1 | % |
Massachusetts | | | 7 | | | | 1,114,679 | | | | 13.8 | % |
Maryland / Washington, D.C. | | | 7 | | | | 876,933 | | | | 10.8 | % |
Virginia | | | 5 | | | | 362,753 | | | | 4.5 | % |
New Jersey | | | 3 | | | | 300,450 | | | | 3.7 | % |
New York | | | 1 | | | | 195,485 | | | | 2.4 | % |
Delaware | | | 1 | | | | 119,446 | | | | 1.5 | % |
Total portfolio | | | 54 | | | | 8,084,797 | | | | 100.0 | % |
The terms of the Company’s retail leases generally vary from tenancies at will to 25 years, excluding renewal options. Anchor tenant leases are typically for 10 to 25 years, with one or more renewal options available to the lessee upon expiration of the initial lease term. By contrast, smaller store leases are typically negotiated for five-year terms. The longer terms of major tenant leases serve to protectabout the Company, against significant vacancies and may also utilize public conference calls, webcasts, our website and/or various social media sites to assure the presence of strong tenants which draw consumers to its centers. The shorter terms of smaller store leases allowcommunicate important information about the Company, under appropriate circumstances to adjust rental rates periodicallykey personnel, trends, corporate initiatives and where possible, to upgradeother matters. Information that we post on our website or adjuston social media channels could be deemed material; therefore, we encourage investors, the overall tenant mix.
Most leases contain provisions requiringmedia, our tenants, to pay their pro rata share of real estate taxes, insurancebusiness partners and certain operating costs. Some leases also provide that tenants pay percentage rent based upon sales volume generally in excess of certain negotiated minimums.
Excluding properties held for sale or sold, Giant Food Stores, LLC, Stop & Shop, Inc. and Food Lion, LLC, each of which is owned by Ahold N.V., a Netherlands corporation, leased an aggregate of approximately 11% of the Company’s GLA at December 31, 2020, and accounted for an aggregate of approximately 13% of the Company’s total revenues during 2020. No other tenant leased more than 10% of GLA at December 31, 2020, or contributed more than 10% of total revenues during 2020.
Executive Offices
The Company’s executive offices are located at 44 South Bayles Avenue, Port Washington, New York, pursuant to a lease that expires in February 2021. The Company is currently in negotiations on a short-term extension at its current executive office, while exploring long-term options.
Competition
The Company believes that competition for the acquisition and operation of grocery-anchored shopping centers is highly fragmented. It faces competition from institutional investors, public and private REITs, owner‑operators engagedothers interested in the acquisition, ownership, redevelopment and leasing of shopping centers,Company to review the information posted on our website as well as from numerous local, regional and national real estate developers and owners in each of its markets. It also faces competition in leasing available spaceon LinkedIn at its properties to prospective tenants. Competition for tenants varies depending upon the characteristics of each local market in which the Company owns and manages properties. The Company believes that the principal competitive factors in attracting tenants in its market are location, price and other lease terms, the presence of anchor tenants, the mix, quality and sales results of other tenants, and maintenance, appearance, access and traffic patterns of its properties.
Governmental Regulations
Compliance with various governmental regulations has an impact on our business, including our capital expenditures, earnings and competitive position, which can be material. We incur costs to monitor and take actions to comply with governmental regulations that are applicable to our business, which include, among others, federal securities laws and regulations, applicable stock exchange requirements, REIT and other tax laws and regulations, environmental and health and safety laws and regulations, local zoning, usage and other regulations relating to real property, the Americans with Disabilities Act of 1990 and laws and regulations applicable to our investment management business, including the U.S. Investment Advisers Act of 1940, the Alternative Investment Fund Managers
Directive, 2011/61/EU and related laws and regulations. See “Item 1A – Risk Factors” for a discussion of material risks to us, including,https://www.linkedin.com/company/wheeler-real-estate-investment-trust/. Any updates to the extent material,list of social media channels we may use to our competitive position, relating to governmental regulations, and see “Item 7. Management’s Discussion and Analysis of Financial Condition and Results of Operation” together with our consolidated financial statements, including the related notes included therein, for a discussion ofcommunicate material information relevant to an assessmentwill be posted on the Investor Relations page of our financial condition and resultswebsite at https://ir.cedarrealtytrust.com/.
Table of operations, including, to the extent material, the effects that compliance with governmental regulations may have upon our capital expenditures and earnings.ContentsEnvironmental Matters
Under various federal, state, and local laws, ordinances and regulations, an owner or operator of real estate may be required to investigate and clean up hazardous or toxic substances or other contaminants at property owned, leased, managed or otherwise operated by such person, and may be held liable to a governmental entity or to third parties for property damage, and for investigation and cleanup costs in connection with such contamination. The cost of investigation, remediation or removal of such substances may be substantial, and the presence of such substances, or the failure to properly remediate such conditions, may adversely affect the owner’s, lessor’s or operator’s ability to sell or rent such property or to arrange financing using such property as collateral. In connection with the ownership, operation, redevelopment and management of real estate, the Company may potentially become liable for removal or remediation costs, as well as certain other related costs and liabilities, including governmental fines and injuries to persons and/or property. Generally, the Company’s tenants must comply with environmental laws and meet any remediation requirements. In addition, leases typically impose obligations on tenants to indemnify the Company from any compliance costs the Company may incur as a result of environmental conditions on the property caused by the tenant. However, if a lease does not require compliance and/or indemnification, or if a tenant fails to or cannot comply, the Company could be forced to pay these costs.
The Company believes that environmental studies conducted at the time of acquisition with respect to its properties did not reveal any material environmental liabilities for which the Company is responsible and that would have a material adverse effect on its business, results of operations or liquidity. However, no assurances can be given that existing environmental studies with respect to any of the properties reveal all environmental liabilities, that any prior owner of or tenant at a property did not create a material environmental condition not known to the Company, or that a material environmental condition does not otherwise exist at any one or more of its properties. If a material environmental condition does in fact exist, it could have an adverse impact upon the Company’s financial condition, results of operations and liquidity.
Human Capital Management
The Company believes our employees are our greatest asset, and we pride ourselves on the diversity they bring to the Company. As of December 31, 2020, The Company had 63 full-time employees and one part-time employee.
The Company’s compensation program is designed to attract and reward talented individuals who possess the skills necessary to support our business objectives and assist in the achievement of our strategic goals. All of the Company’s full-time employees are provided with a comprehensive benefits and wellness package which includes paid time off and parental leave, medical, dental and vision insurance, disability, life insurance, 401(k) matching, and other benefits. The Company encourages professional development and internal mobility.
The Company also feels that one of the keys to our success is the Company’s ability to benefit from a wide range of opinions and experiences. The Company believes the best way to accomplish this is through promoting diversity across all layers of our organization. As of December 31, 2020, 56% of the Company’s mid-level, non-executive managers were female, as well as 36% of the Company’s executive team. In addition, as of December 31, 2020, 61% of the Company’s employee population was female.
Item 1A.
| Item 1A. Risk Factors |
Set forth below
We are a smaller reporting company as defined by Rule 12b-2 of the risk factors thatExchange Act and are not required to provide the information under this item.
Item 1B. Unresolved Staff Comments: None
Item 1C. Cybersecurity
Cybersecurity Risk Management and Strategy
The Company depends on the proper functioning, availability and security of its information systems, including financial, data processing, communications and operating systems. Several information systems are software applications provided by third parties. Although risks from cybersecurity threats have to date not materially affected, and we
do not believe
they are
materialreasonably likely to
our investors. Each of these risk factors could adverselymaterially affect,
us, our business
operatingstrategy, results
of operations or financial condition,
ability to servicelike other companies in our
debt and make distributions to our stockholders, as well as the value of our common stock and other securities. In addition to the following disclosures, please refer to the other information contained in this Annual Report on Form 10-K including the accompanying consolidated financial statements and related notes. Some statements in this Annual Report on Form 10-K, including statements in the following risk factors, constitute forward-looking statements. Please refer to the section entitled “Cautionary Language Regarding Forward Looking Statements”.These risk factors are not exhaustive. We operate in a competitive and rapidly changing environment. New risk factors emergeindustry, we could, from time to time, experience threats and it is not possible for us to predict all risk factors, nor can we assess the impact of such risk factors on our business or the extent to which any factor, or combination of factors, may affect our business. Investors should also refer to our Quarterly Reports on Form 10-Q and Current Reports on Form 8-K for future periods for material updates to these risk factors.
Risks Related to Our Business and Properties
Our properties consist primarily of grocery-anchored shopping centers. Our performance therefore is linked to economic conditions in the market for retail space generally.
Our properties consist primarily of grocery-anchored shopping centers, and our performance therefore is linked to economic conditions in the market for retail space generally. This means that we are subject to the risks that affect the retail environment generally, including the levels of consumer spending, the willingness of retailers to lease space in our shopping centers, tenant bankruptcies, the impact of e-commerce on the demand for retail space, ongoing consolidation in the retail sector, and changes in economic conditions and consumer confidence. A downturn in the U.S. economy and reduced consumer spending due to sustained levels of high unemployment or other factors could (i) negatively impact our tenants’ ability to meet their lease obligations due to poor operating results, lack of liquidity or other reasons, and therefore decrease the revenue generated by our properties and/or the value of our properties, (ii) affect our ability to lease space and negotiate and maintain favorable rents, and (iii)reduce the demand for leasing space in our shopping centers, which could result in a decline in our occupancy percentage and reduction in rental revenues.
The COVID-19 pandemic has had, and could continue to have, a material adverse effect on our and our tenants’ businesses, financial condition, results of operations, cash flow, liquidity and ability to satisfy debt service obligations.
During the first quarter of 2020, a novel strain of coronavirus (“COVID-19”) began spreading globally, with the outbreak being classified as a pandemic by the World Health Organization on March 11, 2020. The COVID-19 pandemic has caused, and could continue to cause, significant disruptions to the U.S. and global economy, and has contributed to significant volatility and negative pressure in financial markets. In the United States, federal, state and local governmental responses seeking to contain or mitigate the pandemic have included “shelter-in-place” and “stay-at-home” orders, mandatory shutdowns of “non-essential” businesses, social distancing practices and/or restrictions on construction projects, all of which have adversely impacted our business and that of our tenants.
Our retail tenants depend on in-person interactions with their customers to generate unit-level profitability, and the COVID-19 pandemic andsecurity incidents related governmental imposed restrictions have decreased, and may continue to decrease, customer willingness to frequent our tenants’ businesses, which may result in their inability to maintain profitability and make timely rental payments to us under their leases or to otherwise seek lease modifications or to declare bankruptcy. We own properties across the United States, including in some of the states that have been significantly impacted by the COVID-19 pandemic, such as New York, New Jersey, Massachusetts and Pennsylvania. We collected approximately 94%, 91% and 77%, of contractual base rents and monthly tenant reimbursements for the quarters ended December 31, 2020, September 30, 2020 and June 30, 2020, respectively. We currently remain in active discussions and negotiations with our impacted tenants and anticipate the need to grant rent concessions or other lease-related relief, such as the deferral of lease payments for a period of time to be paid over the remaining term of the lease. The nature and financial impact of such rent relief is currently unknown as negotiations are in progress.
Moreover, the ongoing COVID-19 pandemic and restrictions intended to prevent and mitigate its spread could have additional adverse effects on our business, including with regards to:
| •
| the ability and willingness of our tenants to renew their leases upon expiration;
|
| •
| our ability to re-lease properties on the same or better terms in the event of non-renewal or in the event we exercise our right to replace an existing tenant, and obligations we may incur in connection with the replacement of an existing tenant;
|
| •
| the price of our common stock, which could lead to our common stock to be delisted from the NYSE;
|
| •
| the adverse impact of current economic conditions on the market value of our real estate portfolio and consequently on our estimated value per share;
|
| •
| anticipated returns from development and redevelopment projects, which have been temporarily delayed;
|
| •
| to the extent we were seeking to sell properties in the near term, significantly greater uncertainty regarding our ability to do so at attractive prices;
|
| •
| the broader impact of the severe economic contraction due to the COVID-19 pandemic, the resulting increase in unemployment that has occurred in the short-term and its effect on consumer behavior, and negative consequences that will occur if these trends are not timely reversed;
|
| •
| state, local or industry-initiated efforts, such as a rent freeze for tenants or a suspension of a landlord’s ability to enforce evictions, which may affect our ability to collect rent or enforce remedies for the failure to pay rent;
|
| •
| severe disruption and instability in the global financial markets or deteriorations in credit and financing conditions, which could make it difficult for us to access debt and equity capital on attractive terms, or at all, and impact our ability to fund business activities and repay liabilities on a timely basis;
|
| •
| our ability to pay down, refinance, restructure or extend our indebtedness as it becomes due, and our potential inability to comply with the financial covenants of our credit facility and other debt agreements, which could result in a default and potential acceleration of indebtedness and impact our ability to make additional borrowings under our credit facility or otherwise in the future; and
|
| •
| potential reduction in our operating effectiveness as employees work remotely or if key personnel become unavailable due to illness or other personal circumstances related to COVID-19, as well as increased cybersecurity risks related to the use of remote technology.
|
We have reduced our common quarterly dividend in an effort to preserve cash due to current economic uncertainty and we may choose to do the same in the future. Additionally, we may in the future choose to pay distributions in our stock rather than solely in cash, which may result in our stockholders having a tax liability with respect to such distributions that exceeds the amount of cash received, if any.
While the rapid developments regarding the COVID-19 pandemic preclude any prediction as to its ultimate adverse impact, the current economic, political and social environment presents material risks and uncertainties with respect to our and our tenants’ business, financial condition, results of operations, cash flows, liquidity and ability to satisfy debt service obligations.
The geographic concentration of our properties in the Washington, D.C. to Boston corridor exposes us to greater economic risks than if the distribution of our properties encompassed a broader region.
Our performance depends on the economic conditions in markets where our properties are geographically concentrated. Our properties are located largely in the region that straddles the Washington, D.C. to Boston corridor, which exposes us to greater economic risks than if our properties were more diversely located (in particular, 23 of our properties are located in Pennsylvania). Any adverse economic or real estate developments resulting from the regulatory environment, business climate, weather or other conditions in such regions could have an adverse impact on our business.
Anchor tenants are crucial to the success of our retail properties and vacated anchor space directly and indirectly affects our rental revenues.
Our properties consist primarily of grocery-anchored shopping centers. Anchor tenants pay a significant portion of the total rents at a property and contribute to the success of other tenants by drawing large numbers of customers to a property. Vacated anchor space not only directly reduces rental revenues, but, if not re-tenanted with a tenant with comparable consumer attraction, could adversely affect the rest of the property primarily through the loss of customer drawing power. In addition, in the event that certain anchor tenants cease to occupy a property, such an action results in a significant number of other tenants having the contractual right to terminate their leases, or pay a reduced rent based on a percentage of the tenant's sales, at the affected property, which could adversely affect the future income from such property, also known as “co-tenancy.”
Our performance and value are subject to risks associated with real estate assets and with the real estate industry.
Our performance and value are subject to risks associated with real estate assets and with the real estate industry, including, among other things, risks related to adverse changes in national, regional and local economic and market conditions. Our continued ability to make expected distributions to our stockholders depends on our ability to generate sufficient revenues to meet operating expenses, future debt service and capital expenditure requirements. Events and conditions generally applicable to owners and operators of real property that are beyond our control may decrease cash available for distribution and the value of our properties.
These events and conditions include, but may not be limited to, the following:
| •
| local oversupply, increased competition or declining demand for real estate;
|
| •
| local economic conditions, which may be adversely impacted by business layoffs, industry slow‑downs, natural disasters and other factors;
|
| •
| weather conditions that may increase or decrease energy costs and other weather-related expenses;
|
| •
| non-payment or deferred payment of rent or other charges by tenants, either as a result of tenant-specific financial conditions, or general economic events or circumstances adversely affecting consumer disposable income or credit;
|
| •
| vacancies or an inability to rent space on acceptable terms;
|
| •
| increased operating costs, including real estate taxes, insurance premiums, utilities, costs associated with the need to periodically renovate and re-lease space, and repairs and maintenance;
|
| •
| volatility and/or increases in interest rates, or the non-availability of funds in the credit markets in general;
|
| •
| increased costs of complying with current, new or expanded governmental regulations;
|
| •
| the relative illiquidity of real estate investments;
|
| •
| changing market demographics;
|
| •
| changing traffic patterns; and
|
| •
| an inability to refinance maturing debt in acceptable amounts and/or on acceptable terms.
|
In the event of default by a tenant, we may experience delays in enforcing, as well as incur substantial costs to enforce, our rights as a landlord. In addition, costs associated with our operations, such as real estate and personal property taxes, insurance, and mortgage payments, generally are not reduced even as occupancy or rental rates decrease, tenants fail to pay base and additional rent or other circumstances cause a reduction in income. As a result, our financial performance, cash flow from operations and our ability to make distributions to our stockholders may be adversely affected.
As substantially all of our revenue is derived from rental income, failure of tenants to pay rent or delays in arranging leases and occupancy at our properties could seriously harm our operating results and financial condition.
Substantially all of our revenue is derived from rental income from our properties. Downturns in the economy generally or in our tenants’ business may weaken our tenants’ financial condition and result in, among other things, delayed lease commencement, failure to make rental payments when due, non-extension of leases upon expiration, insolvency or bankruptcy. Any leasing delays, failure to make rental or other payments when due, or tenant bankruptcies, could result in the termination of tenants’ leases, which would have a negative impact on our operating results. In addition, adverse market and economic conditions and competition may impede our ability to renew leases or re-let space as leases expire, which could harm our business and operating results.
Our business may be seriously harmed if a major tenant fails to renew its lease(s) or vacates one or more properties and prevents us from re-leasing such premises by continuing to pay base rent for the balance of the lease terms. In addition, the loss of such a major tenant could result in lease terminations or reductions in rent by other tenants at the affected properties, as provided in their respective leases. Excluding properties held for sale or sold, no tenant leased more than 10% of GLA at December 31, 2020 or contributed more than 10% of total revenues during 2020, except for Giant Food Stores, LLC, Stop & Shop, Inc. and Food Lion, LLC, each of which is owned by Ahold N.V., a Netherlands corporation, which leased an aggregate of approximately 11% of our GLA at December 31, 2020, and accounted for an aggregate of approximately 13% of our total revenues, during 2020.
We may be restricted from re-leasing space based on existing exclusivity lease provisions with some of our tenants. In these cases, the leases contain provisions giving the tenant the exclusive right to sell particular types of merchandise or provide specific types of services within the particular retail center, which limits the ability of other tenants within that center to sell such merchandise or provide such services. When re-leasing space after a vacancy by one of such other tenants, such lease provisions may limit the number and types of prospective tenants for the vacant space. The failure to re-lease space or to re-lease space on satisfactory terms could harm operating results.
We face potential material adverse effects from tenant bankruptcies.
Any bankruptcy filings by, or relating to, one of our tenants or a lease guarantor would generally bar efforts by us to collect pre-bankruptcy debts from that tenant, or lease guarantor, unless we receive an order permitting us to do so from the bankruptcy court. A bankruptcy by a tenant or lease guarantor could delay efforts to collect past due balances, and could ultimately preclude full or, in fact, any collection of such sums. If a lease is affirmed by the tenant in bankruptcy, all pre-bankruptcy balances due under the lease must generally be paid in full. However, if a lease is disaffirmed by a tenant in bankruptcy, we would have only an unsecured claim for damages, which would be paid normally only to the extent that funds are available, and only in the same percentage as is paid to all other members of the same class of unsecured creditors. In addition, we may be unable to replace the tenant at current rental rates. It is
possible, and indeed likely, that we would recover substantially less than, or in fact no portion of, the full value of any unsecured claims we hold, and would be required to write off any straight-line rent receivable recorded for such tenant, which may in turn harm our financial condition.
Our development and redevelopment activities may not yield anticipated returns, which would harm our operating results and reduce funds available for distributions to stockholders.
We have limited experience in substantially developing and redeveloping properties in our markets. Development and redevelopment projects entail considerable risks, including:
| •
| time lag between commencement and completion, leaving us exposed to higher-than-estimated construction costs, including labor and material costs, as well as changes in the overall rental markets;
|
| •
| failure or inability to obtain construction or permanent financing on favorable terms;
|
| •
| inability to sell properties we identify for sale as part of a capital recycling strategy;
|
| •
| expenditure of money and time on projects that may never be completed;
|
| •
| inability to secure key anchor or other tenants;
|
| •
| inability to achieve projected rental rates or anticipated pace of lease-up;
|
| •
| inability to obtain various government and other approvals;
|
| •
| delays in completion relating to weather, labor disruptions, construction or zoning delays; and
|
| •
| higher costs incurred than originally estimated.
|
In addition, the entitlement and development of real estate entails extensive approval processes, sometimes involving multiple regulatory jurisdictions. It is common for a project to require multiple approvals, permits and consents from U.S. federal, state and local governing and regulatory bodies. Compliance with these and other regulations and standards is time intensive and costly and may require additional long range infrastructure review and approvals which can add to project cost. In addition, development of properties containing delineated wetlands may require one or more permits from the U.S. federal government and/or state and local governmental agencies. Any of these issues can materially affect the cost, timing and economic viability of our development and redevelopment projects.
Moreover, properties we redevelop or acquire may fail to achieve the occupancy or rental rates we project, within the time frames we project, at the time we make the decision to invest, which may result in the properties’ failure to achieve the returns we projected. Our pre-acquisition evaluation of the physical condition of each new investment may not detect certain defects or identify necessary repairs until after the property is acquired, which could significantly increase our total acquisition costs or decrease cash flow from the property. In addition, our investigation of a property or building prior to our acquisition, and any representations we may receive from the seller of such building or property, may fail to reveal various liabilities, which could reduce the cash flow from the property or increase our acquisition cost.
At times, we may also be required to use unionized construction workers or to pay the prevailing wage in a jurisdiction to unionized workers. Due to the highly labor intensive and price competitive nature of the construction business, the cost of unionization and/or prevailing wage requirements for new developments or redevelopments could be substantial. Unionization and prevailing wage requirements could adversely affect a project’s profitability. In addition, union activity or a union workforce could increase the risk of a strike, which would adversely affect our ability to meet our construction timetables, which could adversely affect our reputation and our results of operations.
Additionally, new real estate under development activities typically require substantial time and attention from management, and the time frame required for development, construction and lease-up of these properties could require several years to realize any significant cash return. The foregoing risks could cause the development of properties to hinder the Company’s growth and have an adverse effect on its results of operations and cash flows.
Developing and redeveloping properties will require significant capital investment, which may be funded through debt and equity financing, implementing a capital recycling strategy, entering into a joint venture arrangement with respect to one or more properties, or suspending or reducing distributions to our stockholders.
Property ownership through joint ventures could limit our control of those investments and reduce their expected return.
As of December 31, 2020, we owned two of our operating properties through consolidated joint ventures. Our joint ventures, and joint ventures we may enter into in the future, may involve risks not present with respect to our wholly owned properties, including the following:
| •
| we may share decision-making authority with our joint venture partners regarding certain major decisions affecting the ownership or operation of the joint venture and the joint venture property, such as, but not limited to, (1) additional capital contribution requirements, (2) signing of major leases, (3) obtaining debt financing, and (4) obtaining consent prior to the sale or transfer of our interest in the joint venture to a third party, which may prevent us from taking actions that are opposed by our joint venture partners;
|
| •
| our joint venture partners might become bankrupt or fail to fund their share of required capital contributions, which may increase our financial commitment to the joint venture;
|
| •
| our joint venture partners may have business interests or goals with respect to the property that conflict with our business interests and goals, which could increase the likelihood of disputes regarding the ownership, management or disposition of the property;
|
| •
| disputes may develop with our joint venture partners over decisions affecting the property or the joint venture, which may result in litigation or arbitration that would increase our expenses and distract our officers and/or trustees from focusing their time and effort on our business, and possibly disrupt the day-to-day operations of the property such as by delaying the implementation of important decisions until the conflict is resolved; and
|
| •
| the activities of a joint venture could adversely affect our ability to qualify as a REIT.
|
“New Technology” developments may negatively impact our tenants and our business.
We may be adversely affected by developments in new technology, such as e-commerce, which may cause the business of certain of our tenants to become substantially diminished or functionally obsolete. As a result of such developments, our tenants may be unable to pay rent, become insolvent, file for bankruptcy protection, close their stores, or terminate their leases. The use of the Internet by consumers continues to gain in popularity and the migration toward new technology commerce is expected to continue.
Recent annual increases in online sales have also caused many retailers to sell products online on their websites with pick-ups at a store or warehouse or through deliveries, which may have the effect of decreasing the reported amount of their in-store sales and the amount of rent we are able to collect from them. With respect to grocer tenants, on-line grocery orders have become increasingly available, particularly in urban areas, but have not yet become a major factor affecting grocers in our portfolio. We cannot predict with certainty how growth in e-commerce, including same-day grocery delivery services, will impact the demand for space at our properties or how much revenue will be generated at “bricks and mortar” store locations in the future. If we are unable to anticipate and respond promptly to trends in retailer and consumer behavior, our occupancy levels and financial results could suffer.
Competition may impede our ability to renew leases or re‑let spaces as leases expire, as well as impede our further growth, which could harm our business and operating results.
We face competition from similarly positioned retail centers within our respective trade areas that may affect our ability to renew leases or re-let space as leases expire, as well as impede our further growth. Certain national retail chain bankruptcies and resulting store closings/lease disaffirmations have generally resulted in increased available retail space which, in turn, has resulted in increased competitive pressure to renew tenant leases upon expiration and to find new tenants for vacant space at such properties. In addition, any new competitive properties that are developed within the trade areas of our existing properties may result in increased competition for customer traffic and creditworthy tenants. Increased competition for tenants may require us to make tenant and/or capital improvements to properties beyond those that we would otherwise have planned to make. Any unbudgeted tenant and/or capital improvements we undertake may reduce cash that would otherwise be available for distributions to stockholders. Ultimately, to the extent we are unable to renew leases or re-let space as leases expire, our business and operations could be negatively impacted.
Numerous commercial developers and real estate companies compete with us seeking properties for acquisition within our existing target markets. While we continue to evaluate the market for available properties, our ability to acquire properties on favorable terms is subject to a number of risks. We may be unable to acquire a desired property because of competition from other well-capitalized real estate investors, including other REITs and institutional investment funds. This competition may operate to reduce the properties available for acquisition in these markets, reduce the rate of return on these properties, and interfere with our ability to attract and retain tenants. High barriers to entry in the Washington, D.C. to Boston corridor due to mature economies, road patterns, density of population, restrictions on development, and high land costs, coupled with large numbers of often overlapping government jurisdictions, may make it difficult for us to continue to grow in these areas.
Mortgage debt obligations could expose us to the possibility of foreclosure, which could result in the loss of our investment in a property or group of properties subject to mortgage debt.
If a property or group of properties is mortgaged to secure payment of debt and we are unable to meet mortgage payments, the holder of the mortgage or lender could foreclose on the property, resulting in a loss of our investment. Alternatively, if we decide to sell assets in the current market to raise funds to repay matured debt, it is possible that these properties will be disposed of at a loss.
Our properties may be subject to impairment charges.
On a periodic basis, we assess whether there are any indicators that the value of our held-for-use real estate assets and other investments may be impaired. Held-for-use real estate assets are impaired only if the estimate of the aggregate future cash flows (undiscounted and without interest charges) to be generated by the property are less than the carrying value of the property. The estimate of cash flows considers factors such as expected future operating income, capital expenditures, trends and prospects, the effects of demand, tenant-operator performance, competition and other factors. If we are evaluating the potential sale of an asset or development alternatives, the future cash flow considerations include the most likely course of action at the balance sheet date based on current plans, intended holding periods and available marketthird-party vendors' information including a market discount rate applied to the estimated future proceeds. We are required to make subjective assessments as to whether there are impairments in the value of our real estate assets and other investments. These assessments have a direct impact on our earnings because recording an impairment charge results in an immediate negative adjustment to earnings. There can be no assurance that we will not take additional charges in the future related to the impairment of our assets. Any future impairment could have a material adverse effect on our results of operations in the period in which the charge is taken.
Our capital migration strategy entails various risks.
We intend to sell properties and reinvest those proceeds in the acquisition of higher quality properties in our target markets, the development and redevelopment of our properties, or use the proceeds to pay down debt. While we hope to minimize the dilutive effect of these sales on our earnings, in the near term the returns on the disposed assets are likely to exceed the returns we are able to achieve through the reinvestment of those proceeds. Also, in the event we are unable to sell these assets for amounts equal to or in excess of their current carrying values, we would be required to recognize an impairment charge. Any such impairment charges or earnings dilution could materially and adversely affect our business, financial condition, operating results and cash flows and the market price of our publicly traded securities.
Future acquisitions may result in disruptions to our business, may strain management resources and may result in earnings per share and stockholder dilution.
If we acquire a business involving multiple properties, we will be required to integrate the operations, personnel and accounting and information systems, of the acquired business and train, retain and motivate any key personnel from the acquired business. In addition, acquisitions of or investments in companies may cause disruptions in our operations and divert management’s attention away from day-to-day operations, which could impair our relationships with our current tenants and employees. The issuance of equity or debt securities in connection with any acquisition or investment could be substantially dilutive to our stockholders.
Commercial real estate investments are relatively illiquid.
Real estate investments are relatively illiquid. Our ability to promptly sell one or more properties in our portfolio in response to changing economic, financial and investment conditions is limited. The real estate market is affected by many factors, such as general economic conditions, supply and demand, availability of financing, interest rates and other factors that are beyond our control. We cannot be certain that we will be able to sell any property for the price and other terms we seek, or that any price or other terms offered by a prospective purchaser would be acceptable to us. We also cannot estimate with certainty the length of time needed to find a willing purchaser and to complete the sale of a property. We may be required to expend funds to correct defects or to make improvements before a property can be sold. Factors that impede our ability to dispose of properties could adversely affect our financial condition and operating results.
Our business could be negatively affected by stockholder activism, which could impact the trading price and volatility of our common stock.
In recent years, proxy contests and other forms of stockholder activism have been directed against numerous public companies, including us. If a proxy contest or an unsolicited takeover proposal was made with respect to us, we could incur significant costs in defending the Company, which would have an adverse effect on our financial results. Stockholder activists may also seek to involve
themselves in the governance, strategic direction and operations of the Company. If individuals are elected to our board of directors with a specific agenda, even though less than a majority, our ability to effectively and timely implement our current initiatives and execute on our long-term strategy may be adversely affected. While we continually and actively engage with stockholders and consider their views on business and strategy, stockholder activism consumes a significant amount of management’s attention and other company resources and diverts the attention of management and our employees from our business.
Any perceived uncertainties as to our future direction resulting from such stockholder activism or proxy contest could result in the loss of potential business opportunities, be exploited by our competitors, cause concern to our current or potential customers, and make it more difficult to attract and retain qualified personnel and business partners, all of which could adversely affect our business. Furthermore, actions of activist stockholders may cause significant fluctuations in our stock price based on temporary or speculative market perceptions or other factors that do not necessarily reflect the underlying fundamentals and prospects of our business.
Risks Related to Our Liquidity and Financial Condition
The level of our indebtedness and any constraints on credit may impede our operating performance, and put us at a competitive disadvantage.
The level of our indebtedness may harm our business and operating results by (1) requiring us to use a substantial portion of our available liquidity to pay required debt service and/or repayments or establish additional reserves, which would reduce amounts available for distributions, (2) placing us at a competitive disadvantage compared to competitors that have less debt or debt at more favorable terms, (3) making us more vulnerable to economic and industry downturns and reducing our flexibility in responding to changing business and economic conditions, and (4) limiting our ability to borrow more money for operations or capital expenditures. In addition, increases in interest rates may impede our operating performance and put us at a competitive disadvantage. Further, payments of required debt service or amounts due at maturity, or creation of additional reserves under loan agreements, could adversely affect our liquidity. Our organizational documents do not limit the level or amount of debt that we may incur, no do we have a policy limiting our debt to any particular level.
We may be adversely affected by changes in the London Interbank Offered Rate (“LIBOR”) reporting practices
As of December 31, 2020, we had (1) approximately $150.0 million of variable-rate debt outstanding, which consists of our unsecured revolving credit facility and a term loan, and (2) $425.0 million for which we have interest rate swap agreements that convert LIBOR rates to fixed rates. In July 2017, the Financial Conduct Authority (“FCA”) that regulates LIBOR announced it intends to stop compelling banks to submit rates for the calculation of LIBOR after 2021. As a result, the Federal Reserve Board and the Federal Reserve Bank of New York organized the Alternative Reference Rates Committee ("ARRC") which identified the Secured Overnight Financing Rate ("SOFR") as its preferred alternative to USD-LIBOR in derivatives and other financial contracts. We are not able to predict when LIBOR will cease to be available or when there will be sufficient liquidity in the SOFR markets. Any changes adopted by the FCA or other governing bodies in the method used for determining LIBOR may result in a sudden or prolonged increase or decrease in reported LIBOR. If that were to occur, our interest payments could change. In addition, uncertainty about the extent and manner of future changes may result in interest rates and/or payments that are higher or lower than if LIBOR were to remain available in its current form.
Any volatility or instability in the credit markets could adversely affect our ability to obtain new financing or to refinance existing indebtedness.
Any instability in the credit markets may negatively impact our ability to access debt financing, to arrange property‑specific financing or to refinance our existing debt as it matures on favorable terms or at all. As a result, we may be forced to seek potentially less attractive financings, including equity investments, on terms that may not be favorable to us. In doing so, we may be compelled to dilute the interests of existing stockholders that could also adversely reduce the trading price of our common stock.
We may be exposed to additional risks through our hedging activities, including the risks that a counterparty will not perform and that the hedge will not yield the economic benefits we anticipate.
To manage our exposure to variable interest rate risk, we use derivative instruments that involve risk, such as the risk that counterparties may fail to honor their obligations under these arrangements, or that these arrangements may not be effective in reducing our exposure to interest rate changes. There can be no assurance that our hedging arrangements will qualify for hedge accounting or that our hedging activities will have the desired beneficial impact on our results of operations. If we decide to terminate a hedging agreement, there could be significant costs and cash requirements involved to fulfill our obligations under the hedging agreement. Failure to effectively hedge against interest rate changes may adversely affect our results of operations.
In addition, under the REIT qualification provisions of the Code, income we could receive from certain hedging transactions may be treated as non-qualifying income for purposes of the REIT gross income tests. As a result of these rules, we may need to limit or entirely avoid otherwise advantageous hedging techniques.
The financial covenants in our loan agreements may restrict our operating or acquisition activities, which may harm our financial condition and operating results.
The financial covenants in our loan agreements may restrict our operating or acquisition activities, which may harm our financial condition and operating results. Our unsecured credit facilities and the mortgages on our properties contain customary negative covenants, such as those that limit our ability, without the prior consent of the lender, to sell or otherwise transfer any ownership interest, to further mortgage the applicable property, to enter into leases, or to discontinue insurance coverage. Our ability to borrow under our unsecured revolving credit facility is subject to compliance with these financial and other covenants, including restrictions on the maximum availability, which is based on the adjusted net operating income of designated unencumbered properties, the payment of dividends, and overall restrictions on the amount of indebtedness we can incur. If we breach covenants in our debt agreements, the lenders could declare a default and require us to repay the debt immediately and, if the debt is secured, take possession of the property or properties securing the loan.
BUSINESS CONTINUITY RISKS
As a relatively small public REIT, our general and administrative expenses constitute a larger percentage of our total revenues than those of many of our peers.
Our revenues for the year ended December 31, 2020 were $135.5 million. Because our company is smaller than many other publicly-traded REITs, our general and administrative expenses are, and will continue to be, a larger percentage of our total revenues than those of such peers. If we are unable to successfully execute on our strategy and grow our business, our general and administrative expenses will continue to have a greater effect on our financial performance and reduce the amount of cash flow available to distribute to our stockholders.
Natural disasters and severe weather conditions could have an adverse impact on our cash flow and operating results.
Some of our properties could be subject to potential natural or other disasters. In addition, we may acquire properties that are located in areas which are subject to natural disasters. Properties could also be affected by increases in the frequency or severity of hurricanes or other storms, whether such increases are caused by global climate changes or other factors. The occurrence of natural disasters or severe weather conditions can increase investment costs to repair or replace damaged properties, increase operating costs, increase future property insurance costs, and/or negatively impact the tenant demand for lease space. If insurance is unavailable to us, or is unavailable on acceptable terms, or if our insurance is not adequate to cover business interruption or losses from such events, our earnings, liquidity and/or capital resources could be adversely affected.
Potential losses may not be covered by insurance.
Potential losses may not be covered by insurance. We carry comprehensive liability, fire, flood, extended coverage and rental loss insurance under a blanket policy covering all of our properties. We believe the policy specifications and insured limits are appropriate and adequate given the relative risk of loss, the cost of the coverage and industry practice. We do not carry insurance for losses related to war, nuclear accidents, and nuclear, biological and chemical occurrences from terrorist’s acts. Some of the insurance, such as those covering losses due to wind, floods and earthquakes, is subject to limitations involving large deductibles or co-payments and policy limits that may not be sufficient to cover losses. The availability of insurance coverage may decrease and the prices for insurance may increase as a consequence of significant losses incurred by the insurance industry and other factors outside our control. As a result, we may be unable to renew or duplicate our current insurance coverage in adequate amounts or at reasonable prices. In addition, insurance companies may no longer offer coverage against certain types of losses, such as losses due to terrorist acts and toxic mold, or, if offered, the expense of obtaining these types of insurance may not be justified. Additionally, certain tenants have termination rights in respect of certain casualties. If we receive casualty proceeds, we may not be able to reinvest such proceeds profitably or at all, and we may be forced to recognize taxable gain on the affected property. If we experience losses that are uninsured or that exceed policy limits, we could lose the capital invested in the damaged properties as well as the anticipated future cash flows from those properties. Tenants may not properly maintain their insurance policies or have the ability to pay the deductibles associated with such policies. In addition, if the damaged properties are subject to recourse indebtedness, we would continue to be liable for the indebtedness, even if these properties were irreparably damaged.
Future terrorist attacks and shooting incidents could harm the demand for, and the value of, our properties.
Future terrorist attacks, such as the number of highly publicized terrorists acts and shootings that have occurred at domestic and international retail properties, could harm the demand for, and the value of, our properties. Terrorist attacks could directly impact the value of our properties through damage, destruction, loss or increased security costs, and the availability of insurance for such acts may be limited or may be subject to substantial cost increases. If such an incident were to occur at one of our properties, we may be subject to significant liability claims. While we attempt to mitigate this risk through insurance coverage and the employment of third party security services where we feel conditions warrant, we cannot guarantee that losses would not exceed applicable insurance coverages, thereby adversely affecting our results of operations and our ability to meet our obligations, including distributions to our stockholders. To the extent that our tenants are impacted by future attacks, their ability to continue to honor obligations under their existing leases could be adversely affected.
Use of social media may adversely impact our reputation and business.
There has been a significant increase in the use of social media platforms, including weblogs, social media websites and other forms of Internet-based communications, which allow individuals access to a broad audience, including our significant business constituents. The availability of information through these platforms is virtually immediate as is its impact and may be posted at any time without affording us an opportunity to redress or correct it timely. This information may be adverse to our interests, may be inaccurate and may harm our reputation, brand image, goodwill, performance, prospects or business. Furthermore, these platforms increase the risk of unauthorized disclosure of material non-public information regarding our company.
REGULATORY AND LITIGATION RISKS
We could incur significant costs related to government regulation and litigation over environmental matters and various other federal, state and local regulatory requirements.
All real property and the operations conducted on real property are subject to federal, state and local laws, ordinances and regulations relating to hazardous materials, environmental protection and human health and safety. Accordingly, we or our tenants may be required to investigate and clean up certain hazardous or toxic substances released on properties we own or operate, and also may be required to pay other related costs. Our leases typically impose obligations on our tenants to indemnify us for any compliance costs we may incur as a result of environmental conditions on the property caused by the tenant. If a tenant fails to or is unable to comply, we could be forced to pay these costs. If not addressed, environmental conditions could impair our ability to sell or re-lease the affected properties in the future, result in lower sales prices or rent payments, and restrict our ability to borrow funds using the affected properties as collateral.
We could incur significant costs related to government regulations and litigation over environmental matters. Under various federal, state and local laws, ordinances and regulations, an owner or operator of real estate may be required to investigate and clean up hazardous or toxic substances or other contaminants at property owned, leased, managed or otherwise operated by such person, and may be held liable to a governmental entity or to third parties for property damage, and for investigation, remediation and cleanup costs in connection with such contamination. The cost of investigation, remediation or removal of such substances may be substantial, and the presence of such substances, or the failure to properly remediate such conditions, may adversely affect the owner’s, lessor’s or operator’s ability to sell or rent such property or to arrange financing using such property as collateral. We may be liable without regard to whether we knew of, or were responsible for, the environmental contamination and with respect to properties we have acquired, whether the contamination occurred before or after the acquisition.
We believe environmental studies conducted at the time of acquisition with respect to all of our properties did not reveal any material environmental liabilities for which the Company is responsible, and we are unaware of any subsequent environmental matters that would have created a material liability. If one or more of our properties were not in compliance with federal, state and local laws, including environmental laws, we could be required to incur additional costs to bring the property into compliance. If we incur substantial costs to comply with such requirements, our business and operations could be adversely affected. If we fail to comply with such requirements, we might additionally incur governmental fines or private damage awards. There can be no assurance that existing requirements will not change or that future requirements will not require us to make significant unanticipated expenditures that will adversely impact our business and operations.
The Americans with Disabilities Act of 1990 (the “ADA”) could require us to take remedial steps with respect to our properties.
Our existing properties, as well as properties we may acquire, may be required to comply with Title III of the ADA. We may incur significant costs to comply with the ADA, as amended, and similar laws, which require that all public accommodations meet federal
requirements related to access and use by disabled persons, and with various other federal, state and local regulatory requirements, such as state and local fire and life safety requirements.
Risks Related to Our Qualification as a REIT and other Tax Matters
If we fail to continue to qualify as a REIT, our distributions will not be deductible, and our income will be subject to taxation, thereby reducing earnings available for distribution.
If we do not continue to qualify as a REIT, our distributions will not be deductible, and our income will be subject to taxation, reducing earnings available for distribution. We have elected to be taxed as a REIT under the Code. A REIT will generally not be subject to federal and substantially all state and local income taxation on that portion of its income that qualifies as REIT taxable income, to the extent that it distributes at least 90% of its taxable income to its stockholders and complies with certain other requirements. In addition, we would be subject to a 4% excise tax if we fail to distribute sufficient income to meet a minimum distribution test based on our ordinary income, capital gain and aggregate undistributed income from prior years. If we cease to qualify as a REIT, we will also be subject to state and local income taxes in certain of the jurisdictions in which our properties are located. In addition, tax laws would no longer require us to pay any distributions to our stockholders. Unless we are entitled to relief under specific statutory provisions, we could not elect to be taxed as a REIT again for the four taxable years following the year during which we were disqualified. Even if we qualify as a REIT for federal income tax purposes, we may be subject to certain state and local income and franchise taxes and to federal income and excise taxes on our undistributed taxable income.
We intend to make distributions to stockholders to comply with the requirements of the Code. However, differences in timing between the recognition of taxable income and the actual receipt of cash could require us to sell assets, borrow funds or pay a portion of the dividend in common stock to meet the 90% distribution requirement of the Code. Certain assets generate substantial differences between taxable income and income recognized in accordance with accounting principles generally accepted in the United States (“GAAP”). Such assets include, without limitation, operating real estate that was acquired through structures that may limit or completely eliminate the depreciation deduction that would otherwise be available for income tax purposes. As a result, the Code requirement to distribute a substantial portion of our otherwise net taxable income in order to maintain REIT status could cause us to (1) distribute amounts that could otherwise be used for future acquisitions, capital expenditures or repayment of debt, (2) borrow on unfavorable terms, (3) sell assets on unfavorable terms, or (4) if necessary, pay a portion of our common dividend in common stock. If we fail to obtain debt or equity capital in the future, it could limit our operations and our ability to grow, which could have a material adverse effect on the value of our common stock.
Complying with REIT requirements may cause us to forego otherwise attractive opportunities and limit our growth opportunities.
In order to qualify as a REIT for U.S. federal income tax purposes, we must continually satisfy tests concerning, among other things, our sources of income, the nature of our investments in commercial real estate and related assets, the amounts we distribute to stockholders and the ownership of our stock. We may also be required to make distributions to stockholders at disadvantageous times or when we do not have funds readily available for distribution. Thus, compliance with REIT requirements may hinder our ability to operate solely on the basis of maximizing profits.
Frequent asset sales could trigger adverse tax consequences.
Tax laws applicable to REITs require that we hold our properties for investment, rather than primarily for sale in the ordinary course of business, which may cause us to forego or defer sales of properties that otherwise would be in our best interest. Therefore, we may be unable to adjust our portfolio mix promptly in response to market conditions, which may adversely affect our financial position.
To qualify as a REIT, we must comply with requirements regarding our assets and our sources of income. We may be unable to comply with these requirements, ultimately jeopardizing our qualification as a REIT, or we may be subject to a 100% tax on any resultant gain if we sell assets that are treated as dealer property or inventory.
In addition, the sale of our properties may generate gains for tax purposes which, if not adequately deferred through “like kind exchanges” under Section 1031 of the Code or other tax deference strategies, could require us to pay income taxes or make additional distributions to our stockholders, thus reducing our capital available for investment in other properties, or if the proceeds of such sales are already invested in other properties, require us to obtain additional funds to pay such taxes or make such distributions, in either such case to permit us to maintain our status as a REIT.
Failure to qualify as a domestically-controlled REIT could subject our non-U.S. stockholders to adverse federal income tax consequences.
We will be a domestically-controlled REIT if, at all times during a specified testing period, less than 50% in value of its shares are held directly or indirectly by non-U.S. stockholders. Because our shares are publicly traded, we cannot guarantee that we will, in fact, be a domestically-controlled REIT. If we fail to qualify as a domestically-controlled REIT, our non-U.S. stockholders that otherwise would not be subject to federal income tax on the gain attributable to a sale of our shares would be subject to taxation upon such a sale if either (a) the shares were not considered to be “regularly traded” under applicable Treasury regulations on an established securities market, such as the NYSE, or (b) the shares were considered to be “regularly traded” on an established securities market and the selling non-U.S. stockholder owned, actually or constructively, more than 10% in value of the outstanding shares at any time during specified testing periods. If gain on the sale or exchange of our shares was subject to taxation for these reasons, the non-U.S. stockholder would be subject to federal income tax with respect to any gain on a net basis in a manner similar to the taxation of a taxable U.S. stockholder, subject to any applicable alternative minimum tax and special alternative minimum tax in the case of nonresident alien individuals, and corporate non-U.S. stockholders may be subject to an additional branch profits tax.
We may choose to make distributions in our own stock, in which case you may be required to pay income taxes without receiving any cash dividends.
In connection with our qualification as a REIT, we are required to annually distribute to our stockholders at least 90% of our REIT taxable income (which does not equal net income, as calculated in accordance with GAAP), determined without regard to the deduction for dividends paid and excluding net capital gain. In order to satisfy this requirement, we may make distributions that are payable in cash and/or shares of our stock (which could account for up to 90% of the aggregate amount of such distributions) at the election of each stockholder. Taxable stockholders receiving such distributions will be required to include the full amount of such distributions as ordinary dividend income to the extent of our current or accumulated earnings and profits, as determined for U.S. federal income tax purposes. As a result, U.S. stockholders may be required to pay income taxes with respect to such distributions in excess of the cash portion of the distribution received. Accordingly, U.S. stockholders receiving a distribution of our shares may be required to sell shares received in such distribution or may be required to sell other stock or assets owned by them, at a time that may be disadvantageous, in order to satisfy any tax imposed on such distribution. If a U.S. stockholder sells the stock that it receives as part of the distribution in order to pay this tax, the sales proceeds may be less than the amount it must include in income with respect to the distribution, depending on the market price of our stock at the time of the sale. Furthermore, with respect to certain non-U.S. stockholders, we may be required to withhold U.S. tax with respect to such distribution, including in respect of all or a portion of such distribution that is payable in stock, by withholding or disposing of part of the shares included in such distribution and using the proceeds of such disposition to satisfy the withholding tax imposed. In addition, if a significant number of our stockholders determine to sell shares of our stock in order to pay taxes owed on dividend income, such sale may put downward pressure on the market price of our stock.
Various tax aspects of such a taxable cash/stock distribution are uncertain and have not yet been addressed by the Internal Revenue Service (“IRS”). No assurance can be given that the IRS will not impose requirements in the future with respect to taxable cash/stock distributions, including on a retroactive basis, or assert that the requirements for such taxable cash/stock distributions have not been met.
Dividends paid by REITs generally do not qualify for reduced tax rates.
Generally, dividends payable by REITs do not qualify for reduced tax rates under the Code. For the calendar year 2018, the maximum federal individual tax rate for nonqualified dividends payable is 37.0%; qualified dividends from most C corporations received by individuals are subject to a reduced maximum federal rate of 20%. In addition to these rates, certain high income individuals may be subject to an additional 3.8% tax on certain investment income, including dividends and capital gains. As a REIT, our distributions to individual stockholders generally are not eligible for the reduced rates and are, consequently, taxed at ordinary income rates. Effective for taxable years beginning after December 31, 2017 and before January 1, 2026, those U.S. stockholders that are individuals, trusts or estates may deduct 20% of their dividends from REITs (excluding qualified dividend income and capital gains dividends). For those U.S. stockholders in the top marginal tax bracket of 37%, the deduction for REIT dividends yields an effective income tax rate of 29.6% (exclusive of the net investment income tax) on REIT dividends. The more favorable federal tax rates applicable to regular corporate dividends may result in the stock of REITs being perceived to be less attractive than the stock of corporations that pay dividends qualifying for reduced rates of tax, which may adversely affect the value of the stock of REITs.
Changes to the federal, state and municipality tax laws could have a significant negative impact on the overall economy, our tenants, and our business.
At any time, the federal income tax laws or regulations governing REITs or the administrative interpretations of those laws or regulations may be amended. We cannot predict when or if any new federal income tax law, regulation or administrative interpretation, or any amendment to any existing federal income tax law, regulation or administrative interpretation, will be adopted, promulgated or become effective and any such law, regulation or interpretation may take effect retroactively. A shortfall in tax revenues for states and municipalities in which we operate may lead to changes in state and municipalities tax laws. We and our stockholders could be adversely affected by any such change in, or any new, federal income tax law, regulation, or administrative interpretation.
In December 2017 the Tax Cuts and Jobs Act (the “TCJA”) was signed into law. The provisions of the TCJA are far-reaching and generally applied to taxable years beginning after December 31, 2017, while many provisions, in particular those affecting individual taxpayers, expire at the end of 2025. As a result of the changes implemented by the TCJA, our taxable income and the amount of distributions to our stockholders required in order to maintain our REIT status, and our relative tax advantage as a REIT, may significantly change. As a REIT, we are required to distribute at least 90% of our taxable income to our stockholders annually. Among other things, the TCJA:
| •
| reduced the corporate income tax rate from 35% to 21% (including taxable REIT subsidiaries of which ours currently do not have significant taxable income);
|
| •
| reduced the rate of U.S. federal withholding tax on distributions made to non-U.S. stockholders by a REIT that are attributable to gains from the sale or exchange of U.S. real property interests from 35% to 21%;
|
| •
| limited the deduction for net interest expense incurred by a business to 30% of the “adjusted taxable income” of the taxpayer, except, among others, certain real property businesses electing to not be subject to the limitation. Making this election requires the electing real property trade or business to depreciate non-residential real property, residential rental property, and qualified improvement property over a longer period using the alternative depreciation system. We have not yet determined whether to make any such available elections;
|
| •
| mandated the use of the less favorable alternative depreciation system to depreciate real property in the event a real property business elects to avoid the interest deduction restriction above;
|
| •
| reduced the benefits of like-kind exchanges that defer capital gains for tax purposes to only exchanges of real property;
|
| •
| reduced the highest marginal income tax rate for individuals to 37.0% from 39.6% (excluding, in each case, the 3.8% Medicare tax on net investment income);
|
| •
| reduced the net operating loss deduction to 80% of taxable income (where taxable income is determined without regard to the net operating loss deduction itself), generally eliminated net operating loss carrybacks and allows unused net operating losses to be carried forward;
|
| •
| generally allows a deduction for individuals equal to 20% of certain income from pass-through entities, including ordinary dividends distributed by a REIT (excluding capital gain dividends and qualified dividend income), generally resulting in a maximum effective federal income tax rate applicable to such dividends of 29.6% compared to 37.0% (excluding, in each case, the 3.8% Medicare tax on net investment income); and
|
| •
| established limits on certain deductions for individuals, including deductions for state and local income taxes, and eliminates deductions for miscellaneous itemized deductions (including certain investment expenses).
|
The TCJA is a complex revision to the U.S. federal income tax laws with contrasting impacts on different categories of taxpayers and industries, and will require subsequent rulemaking and interpretation in a number of areas. The long-term impact of the TCJA on the overall economy and the real estate industry cannot be predicted at this early stage. Furthermore, the TCJA may negatively impact certain of our tenants’ operating results, financial condition, and future business plans. There can be no assurance that the TCJA will not negatively impact our operating results, financial condition, and future business operations.
Stockholders are urged to consult with their own tax advisors with respect to the impact that the TCJA and other legislation may have on their investment and the status of legislative, regulatory or administrative developments and proposals and their potential effect on their investment in our shares.
Risks Related to Our Organization and Structure
Our charter and Maryland law contain provisions that may delay, defer or prevent a change of control transaction and depress our stock price.
Our charter and Maryland law contain provisions that may delay, defer or prevent a change of control transaction and depress the price of our common stock. The charter, subject to certain exceptions, authorizes directors to take such actions as are necessary and desirable relating to qualification as a REIT, and to limit any person to beneficial ownership of no more than 9.9% of the outstanding shares of our common stock. This ownership limit may delay or impede a transaction or a change of control that might involve a premium price for our common stock or otherwise be in the best interests of stockholders. Our Board of Directors, in its sole discretion, may exempt a proposed transferee from the ownership limit, but not grant an exemption from the ownership limit to any proposed transferee whose direct or indirect ownership could jeopardize our status as a REIT. These restrictions on transferability and ownership will not apply if our Board of Directors determines that it is no longer in our best interests to continue to qualify as, or to be, a REIT. Our Board of Directors has waived the ownership limit to permit certain institutional investors to own common stock in excess of the ownership limit and may grant additional waivers in the future as long as the Company is able to maintain its REIT status. This concentration of ownership could deprive other stockholders of an opportunity to receive a premium for their shares of common stock as part of a sale of our Company and ultimately might affect the market price of our common stock.
We may authorize and issue stock and OP Units without stockholder approval. Our charter authorizes the Board of Directors to issue additional shares of common or preferred stock, to issue additional OP Units, to classify or reclassify any unissued shares of common or preferred stock, and to set the preferences, rights and other terms of such classified or unclassified shares. We have agreed not to use our preferred stock for anti-takeover purposes or in connection with a stockholder rights plan unless we obtain stockholder approval. Certain provisions of the Maryland General Corporation Law (the “MGCL”) may have the effect of inhibiting a third party from making a proposal to acquire us or of impeding a change of control under circumstances that otherwise could provide the holders of shares of our common stock with the opportunity to realize a premium over the then-prevailing market price of such shares, including:
| •
| “business combination” provisions that, subject to limitations, prohibit certain business combinations between us and an “interested stockholder” (defined generally as any person or an affiliate thereof who beneficially owns 10% or more of the voting power of our shares) for five years after the most recent date on which the stockholder becomes an interested stockholder, and thereafter imposes special appraisal rights and special stockholder voting requirements on these combinations; and
|
| •
| “control share” provisions that provide that our “control shares” (defined as shares that, when aggregated with other shares controlled by the stockholder, entitle the stockholder to exercise one of three increasing ranges of voting power in electing directors) acquired in a “control share acquisition” (defined as the direct or indirect acquisition of ownership or control of control shares) have no voting rights except to the extent approved by our stockholders by the affirmative vote of at least two-thirds of all the votes entitled to be cast on the matter, excluding all interested shares.
|
We have opted out of these provisions of the MGCL. However, the Board of Directors may, by resolution, elect to opt in to the business combination provisions of the MGCL, and we may, by amendment to our bylaws, opt in to the control share provisions of the MGCL.
Our ability to pay dividends is limited by the requirements of Maryland law.
Our ability to pay dividends on our common stock is limited by the laws of the State of Maryland. Under applicable Maryland law, a Maryland corporation generally may not make a distribution if, after giving effect to the distribution, the corporation would not be able to pay its debts as they become due in the usual course of business, or the value of the corporation’s total assets would be less than the sum of its total liabilities plus, unless the corporation’s charter provides otherwise, the amount that would be needed, if the corporation were dissolved at the time of the distribution, to satisfy the preferential rights upon dissolution of stockholders whose preferential rights are superior to those receiving the distribution. Accordingly, we generally may not make a distribution on our common stock if, after giving effect to the distribution, we would not be able to pay our debts as they become due in the usual course of business or our total assets would be less than the sum of our total liabilities plus, unless the terms of such class or series provide otherwise, the amount that would be needed to satisfy the preferential rights upon dissolution of the holders of shares of any class or series of preferred stock then outstanding, if any, with preferences senior to those of our common stock.
Our Board of Directors may change our strategy without stockholder approval.
Our Board of Directors may change our strategy with respect to capitalization, investment, distributions and/or operations. Our Board of Directors may establish investment criteria or limitations as it deems appropriate, but currently does not limit the number or types of properties in which we may seek to invest or the concentration of investments in any one geographic region or the amount of development or redevelopment activity occurring across our portfolio. Although our Board of Directors has no present intention to revise or amend our strategies and policies, it may do so at any time without a vote by our stockholders. Accordingly, the results of decisions made by our Board of Directors and implemented by management could adversely affect our financial condition or results of operations, including our ability to distribute cash to stockholders or qualify as a REIT.
The rights of stockholders to take action against our directors and officers are limited.
Maryland law provides that a director or officer has no liability in that capacity if he or she satisfies his or her duties to us and our stockholders. As permitted by the MGCL, our charter limits the liability of our directors and officers to us and our stockholders for monetary damages, except for liability resulting from actual receipt of an improper benefit or profit in money, property or service, or a final judgment based upon a finding of active and deliberate dishonesty by the director or officer that was material to the cause of action adjudicated.
In addition, our charter and bylaws, as well as indemnification agreements that we have entered into with certain of our officers require us to indemnify our directors and officers, among others, for actions taken by them in those capacities to the maximum extent permitted by Maryland law. As a result, we and our stockholders may have more limited rights against our directors and officers than might otherwise exist for companies organized in other jurisdictions. Accordingly, in the event that actions taken in good faith by any of our directors or officers impede the performance of our company, your ability to recover damages from such director or officer will be limited. In addition, we will be obligated to advance the defense costs incurred by our directors and officers with indemnification agreements, and may, at the discretion of our Board of Directors, advance the defense costs incurred by our employees and other agents, in connection with legal proceedings.
Risks Related to Ownership of Our Common Stock
The market value of our debt and equity securities is subject to various factors that may cause significant fluctuations or volatility.
As with other publicly traded securities, the market price of our publicly traded securities depends on various factors which may change from time-to time and are often out of our control. Among the conditions that may affect the market price of our publicly traded securities are the following:
| •
| the extent of institutional investor interest in us;
|
| •
| the market perception of our business compared to other REITS;
|
| •
| the market perception of retail REITs, in general, compared to other investment alternatives;
|
| •
| our financial condition and performance, including changes in our funds from operations, operating funds from operations or earnings estimates;
|
| •
| the market’s perception of our growth potential and potential future cash dividends;
|
| •
| publication of research reports about us or our industry by securities analysts;
|
| •
| speculation in the press or investment community;
|
| •
| the passage of legislation or other regulatory developments that adversely affect us, our tax status, or our industry;
|
| •
| our credit or analyst ratings;
|
| •
| any future issuances of equity or debt securities;
|
| •
| any future repurchases of equity securities;
|
| •
| our failure to satisfy the listing requirements of the NYSE
|
| •
| our failure to comply with the requirements of the Sarbanes-Oxley Act;
|
| •
| additions or departures of key management personnel;
|
| •
| strategic actions by us or our competitors, such as acquisitions or restructurings;
|
| •
| an increase in market interest rates;
|
| •
| our ability to access the capital markets to raise additional capital;
|
| •
| and general economic and financial market conditions.
|
These factors may cause the market price of our common stock to decline, in some cases regardless of our financial condition, results of operations, business or prospects. Effective April 28, 2020, the average closing price of our common stock was less than $1.00 over the prior 30-consecutive trading day period, and as a result, we received notice from the NYSE that our stock could be delisted.
Due to unprecedented market-wide declines as a result of the ongoing COVID-19 pandemic, the NYSE notice advised that we had until December 31, 2020 to regain compliance with the minimum share price requirement. On November 27, 2020, we completed a 1-for-6.6 reverse stock split of our common stock that resulted in the price of our common stock exceeding $1.00 per share and remaining above that level for at least the following 30 trading days, thereby curing the NYSE default. The reverse stock split did not require a stockholders’ vote.
It is impossible to ensure that the market price of our common stock will not fall in the future. A decrease in the market price of our common stock could reduce our ability to raise additional equity in the public markets. Selling common stock at a decreased market price would have a dilutive impact on existing stockholders.
Economic conditions in the U.S. economy in general, and any uncertainty in the credit markets and retail environment, could adversely affect our ability to continue to pay dividends or cause us to reduce the amount of our dividends.
We paid dividends totaling $0.53 per share during 2020, and paid dividends totaling $1.32 per share during 2019 and 2018. We reduced our common quarterly dividend in 2020 in an effort to preserve cash due to the current economic uncertainty. Any prolonged downturn in the state of the U.S. economy, weakness in capital markets and/or difficult retail environment may cause us to further reduce, or suspend, the payment of dividends, which could, among other things, affect our ability to qualify as a REIT for federal income tax purposes.
Future offerings of debt securities, which would be senior to our common and preferred stock, or equity securities, which would dilute the interests of our existing stockholders and may be senior to our existing common stock, may adversely affect the market prices of our common and preferred stock.
In the future, we may attempt to increase our capital resources by making additional offerings of debt or equity securities, including senior or subordinated notes and classes of preferred or common stock. Holders of debt securities or shares of preferred stock will generally be entitled to receive interest payments or distributions, both current and in connection with any liquidation or sale, prior to the holders of our common stock. Furthermore, offerings of common stock or other equity securities may dilute the holdings of our existing stockholders. We are not required to offer any such equity securities to existing stockholders on a preemptive basis, and future offerings of debt or equity securities, or perceptions that such offerings may occur, may reduce the market prices of our common and preferred stock or the distributions that we pay with respect to our common stock. Because we may generally issue any such debt or equity securities in the future without obtaining the consent of our stockholders, our stockholders bear the risk of our future offerings reducing the market prices of our common and preferred stock and diluting their proportionate ownership.
GENERAL RISKS
We face risks relating to cybersecurity attacks, loss of confidential information and other business disruptions.
We rely extensively on computer systems to manage our business and process transactions. Our business is at risk from and may be impacted by cybersecurity attacks, including attempts to gain unauthorized access to our confidential data, and other electronic security breaches. Such cyber-attackscybersecurity attacks can range from individual attempts to gain unauthorized access to our information technology systems to more sophisticated security threats. While we employ a number of measures to prevent, detect and mitigate these threats, including password protection, backup servers and annual penetration testing, there is no guarantee such efforts will be successful in preventing a cyber-attack. Cybersecurity incidents, depending on their nature and scope,cybersecurity attack. A cybersecurity attack could potentially lead tocompromise the compromise of confidential information improper use of our systemsemployees, tenants and networks, manipulationvendors. A successful cybersecurity attack could disrupt and destruction of data, system downtimes and operational disruptions, which in turn couldotherwise adversely affect our reputation, competitivenessbusiness operations.
Assessment, identification and resultsmanagement of operations. In the event a security breach or failure resultscybersecurity related risks are integrated into our overall risk management process. Cybersecurity related risks are included in the disclosurerisk universe we evaluate to assess top risks to the Company at least annually. To the extent our processes identify a heightened cybersecurity related risk, risk owners are assigned to develop risk mitigation plans, which are then tracked to completion.
Cybersecurity Governance
Our Board of sensitive tenant orDirectors considers cybersecurity risk as part of its risk oversight function and has delegated oversight of cybersecurity risk strategy and governance and of other third-party data, orinformation technology risks to the transmissionAudit Committee of harmful/malicious codethe Board of Directors (the "Audit Committee"). The Audit Committee reports to the full Board of Directors regarding its activities, including those related to cybersecurity. Senior management, including the Company's CEO, CFO, and General Counsel, is responsible for assessing and managing cybersecurity risk, and provides briefings regarding the assessment and management of such risk to the Audit Committee, which then reports, as necessary, to the Board of Directors. Although members of our senior management do not have direct cybersecurity expertise obtained through certifications, their experience managing the Company, which includes consulting and coordinating as necessary with a third parties, we couldparty information technology expert referred to below, enables them to effectively assess and manage material risks from cybersecurity threats.
The Company retained an information technology expert third party company to assist in managing relevant risks. In particular, the Company outsources its information technology function and monitoring to a third party provider whereby it benefits from a professionally managed network monitoring, management, maintenance, detection and response system and a 24/7 security operations center with both onsite and remote support services. Any cybersecurity incident would be
subjectreported to
liability or claims.Furthermore, it is possible that our computer systems, including our back-up systems, could be subject to damage or interruption from power outages, computer and telecommunications failures, computer viruses, catastrophic events such as fires, hurricanes, earthquakes and tornadoes, and intentional and inadvertent acts and errorsthe Company promptly by our employees. If our computer systems ceasethird party consultant and material and potentially material incidents would be assessed by management and the Audit Committee for remediation and future prevention and detection.
The Company, at least annually, updates its policies or procedures that could help mitigate cybersecurity risks. Notwithstanding the extensive approach we take to function properly or are damaged,cybersecurity, we may have to makenot be successful in preventing or mitigating a significant investment to repair or replace them, and we may suffer interruptions in our operations in the interim. Any material interruption in our computer systems or issues with the ongoing implementation of newly adopted IT solutions maycybersecurity incident that could have a material adverse effect on our businessus. The Company has incorporated cybersecurity coverage in its insurance policies; however, there is no assurance that the insurance the Company maintains will cover all cybersecurity breaches or resultsthat policy limits will be sufficient to cover all related losses.
Item 2. Properties
Real Estate Portfolio
The following table presents an overview of our
operations.
Our success dependsproperties, based on key personnel whose continued service is not guaranteed.information as of December 31, 2023:
| | | | | | | | | | | | | | | | | | | | | | | | | | | | | | | | | | | | | | | | | | | | | | | | | | |
| Property | | Location | | Number of Tenants (1) | | Total
Leasable
Square
Feet | | Percentage
Leased (1) | | Percentage
Occupied | | Total
Occupied
Square
Feet | | Annualized
Base
Rent (2) | | Annualized
Base Rent
per
Occupied
Square Foot |
| Brickyard Plaza | | Berlin, CT | | 10 | | | 227,598 | | | 97.8 | % | | 97.8 | % | | 222,598 | | | $ | 2,024,000 | | | $ | 9.09 | |
| Carll's Corner | | Bridgeton, NJ | | 5 | | | 116,532 | | | 19.4 | % | | 19.4 | % | | 22,554 | | | 267,000 | | | 11.84 | |
| Coliseum Marketplace | | Hampton, VA | | 9 | | | 106,648 | | | 94.9 | % | | 94.9 | % | | 101,198 | | | 1,217,000 | | | 12.03 | |
| Fairview Commons | | New Cumberland, PA | | 11 | | | 50,119 | | | 87.7 | % | | 87.7 | % | | 43,969 | | | 512,000 | | | 11.63 | |
| Fieldstone Marketplace | | New Bedford, MA | | 10 | | | 193,970 | | | 75.5 | % | | 71.7 | % | | 139,139 | | | 1,655,000 | | | 11.90 | |
| Gold Star Plaza | | Shenandoah, PA | | 7 | | | 71,720 | | | 100.0 | % | | 100.0 | % | | 71,720 | | | 642,000 | | | 8.95 | |
| Golden Triangle | | Lancaster, PA | | 19 | | | 202,790 | | | 98.4 | % | | 98.4 | % | | 199,605 | | | 2,619,000 | | | 13.12 | |
| Hamburg Square | | Hamburg, PA | | 7 | | | 102,058 | | | 100.0 | % | | 100.0 | % | | 102,058 | | | 689,000 | | | 6.75 | |
| Kings Plaza | | New Bedford, MA | | 17 | | | 168,243 | | | 98.5 | % | | 98.5 | % | | 165,743 | | | 1,444,000 | | | 8.71 | |
| Oakland Commons | | Bristol, CT | | 2 | | | 90,100 | | | 100.0 | % | | 100.0 | % | | 90,100 | | | 574,000 | | | 6.37 | |
| Oregon Avenue (3) | | Philadelphia, PA | | — | | | — | | | — | % | | — | % | | — | | | — | | | — | |
| Patuxent Crossing | | California, MD | | 27 | | | 264,068 | | | 81.6 | % | | 81.6 | % | | 215,589 | | | 2,646,000 | | | 12.27 | |
| Pine Grove Plaza | | Brown Mills, NJ | | 13 | | | 79,306 | | | 77.6 | % | | 77.6 | % | | 61,526 | | | 742,000 | | | 12.05 | |
| South Philadelphia | | Philadelphia, PA | | 10 | | | 221,511 | | | 88.1 | % | | 68.3 | % | | 151,388 | | | 1,432,000 | | | 9.46 | |
| Southington Center | | Southington, CT | | 11 | | | 155,842 | | | 100.0 | % | | 100.0 | % | | 155,842 | | | 1,288,000 | | | 8.27 | |
| Timpany Plaza | | Gardner, MA | | 14 | | | 182,799 | | | 81.8 | % | | 63.3 | % | | 115,735 | | | 1,121,000 | | | 9.68 | |
| Trexler Mall | | Trexlertown, PA | | 22 | | | 342,541 | | | 99.7 | % | | 98.9 | % | | 338,788 | | | 3,710,000 | | | 10.95 | |
| Washington Center Shoppes | | Sewell, NJ | | 29 | | | 157,300 | | | 97.5 | % | | 95.9 | % | | 150,800 | | | 1,895,000 | | | 12.56 | |
| Webster Commons | | Webster, MA | | 9 | | | 98,984 | | | 100.0 | % | | 100.0 | % | | 98,984 | | | 1,278,000 | | | 12.91 | |
| Total | | | | 232 | | | 2,832,129 | | | 89.6 | % | | 86.4 | % | | 2,447,336 | | | $ | 25,755,000 | | | $ | 10.52 | |
(1)Our success dependsReflects leases executed through December 31, 2023 that commence subsequent to the end of the current reporting period.
(2)Annualized base rent per occupied square foot assumes base rent as of the end of the current reporting period and excludes the impact of tenant concessions and rent abatements.
(3)Includes property where a redevelopment opportunity exists.
Major Tenants
The following table sets forth information regarding the ten largest tenants in our operating portfolio based on annualized base rent as of December 31, 2023:
| | | | | | | | | | | | | | | | | | | | | | | | | | | | | | | | | | | | | | |
| Tenants | | Category | | Annualized
Base Rent | | % of
Total
Annualized
Base Rent | | Total
Occupied
Square Feet | | Percent
Total
Leasable
Square Feet | | Annualized
Base Rent
per Occupied
Square Foot |
| TJX Companies (1) | | Discount Retailer | | $ | 1,220,000 | | | 4.74 | % | | 133,000 | | | 4.70 | % | | $ | 9.17 | |
| Kohl's | | Discount Retailer | | 1,031,000 | | | 4.00 | % | | 147,000 | | | 5.19 | % | | 7.01 | |
| Shaw's | | Grocery | | 925,000 | | | 3.59 | % | | 68,000 | | | 2.40 | % | | 13.60 | |
| Dollar Tree (2) | | Discount Retailer | | 865,000 | | | 3.36 | % | | 96,000 | | | 3.39 | % | | 9.01 | |
| Walmart | | Grocery | | 843,000 | | | 3.27 | % | | 150,000 | | | 5.30 | % | | 5.62 | |
| Shoprite | | Grocery | | 801,000 | | | 3.11 | % | | 54,000 | | | 1.91 | % | | 14.83 | |
| Redner's | | Grocery | | 747,000 | | | 2.90 | % | | 106,000 | | | 3.74 | % | | 7.05 | |
| Home Depot | | Home Improvement | | 742,000 | | | 2.88 | % | | 103,000 | | | 3.64 | % | | 7.20 | |
| Lehigh Valley Health | | Medical | | 723,000 | | | 2.81 | % | | 43,000 | | | 1.52 | % | | 16.81 | |
| Urban Air | | Entertainment | | 570,000 | | | 2.21 | % | | 61,000 | | | 2.15 | % | | 9.34 | |
| Total | | | | $ | 8,467,000 | | | 32.88 | % | | 961,000 | | | 33.93 | % | | $ | 8.81 | |
(1)Line item comprises 3 Marshalls stores and 2 HomeGoods stores.
(2)Line item comprises 8 Dollar Tree stores and 1 Family Dollar store.
Lease Expirations
The following table sets forth information with respect to the effortslease expirations of key personnel, whose continued service is not guaranteed. Key personnel could be lost because we could not offer, among other things, competitive compensation programs. Ifour properties as of December 31, 2023:
| | | | | | | | | | | | | | | | | | | | | | | | | | | | | | | | | | | | | | | | | | | | |
| Lease Expiration Period | | Number of
Expiring
Leases | | Total
Expiring
Square
Footage | | % of Total
Expiring
Square
Footage | | % of Total
Occupied
Square
Footage
Expiring | | Expiring
Annualized
Base Rent | | % of Total
Annualized
Base Rent | | Expiring
Base Rent
per Occupied
Square Foot |
| Available | | — | | | 384,793 | | | 13.59 | % | | — | | | — | | | — | | | — | |
| Month-To-Month | | 6 | | | 28,914 | | | 1.02 | % | | 1.18 | % | | $ | 268,000 | | | 1.04 | % | | $ | 9.27 | |
| 2024 | | 25 | | | 146,730 | | | 5.18 | % | | 6.00 | % | | 2,188,000 | | | 8.49 | % | | 14.91 | |
| 2025 | | 31 | | | 287,770 | | | 10.16 | % | | 11.76 | % | | 2,586,000 | | | 10.04 | % | | 8.99 | |
| 2026 | | 23 | | | 91,401 | | | 3.23 | % | | 3.73 | % | | 1,511,000 | | | 5.87 | % | | 16.53 | |
| 2027 | | 30 | | | 247,677 | | | 8.75 | % | | 10.12 | % | | 3,211,000 | | | 12.47 | % | | 12.96 | |
| 2028 | | 43 | | | 530,786 | | | 18.74 | % | | 21.69 | % | | 5,505,000 | | | 21.37 | % | | 10.37 | |
| 2029 | | 21 | | | 242,397 | | | 8.56 | % | | 9.90 | % | | 2,357,000 | | | 9.15 | % | | 9.72 | |
| 2030 | | 13 | | | 256,008 | | | 9.04 | % | | 10.46 | % | | 1,642,000 | | | 6.38 | % | | 6.41 | |
| 2031 | | 7 | | | 86,835 | | | 3.07 | % | | 3.55 | % | | 1,014,000 | | | 3.94 | % | | 11.68 | |
| 2032 | | 6 | | | 39,509 | | | 1.40 | % | | 1.61 | % | | 821,000 | | | 3.19 | % | | 20.78 | |
| Thereafter | | 27 | | | 489,309 | | | 17.26 | % | | 20.00 | % | | 4,652,000 | | | 18.06 | % | | 9.51 | |
| Total | | 232 | | | 2,832,129 | | | 100.00 | % | | 100.00 | % | | $ | 25,755,000 | | | 100.00 | % | | $ | 10.52 | |
The Company's Properties
The terms of the Company's retail leases generally vary from tenancies at will to 25 years, excluding renewal options. Anchor tenant leases are typically for 10 to 25 years, with one or more
of our senior executives or key employees are unable to continue in their present positions or if their employment contracts are terminated or not renewed, we may not be able to replace them easily or at all. Competition for key personnel is intense, and such experienced individuals in our industry are in short supply. The loss of services of key personnel could materially and adversely affect our operations because of diminished relationships with lenders, sources of equity capital, construction companies, and existing and prospective tenants, and the ability to conduct our business and operations without material disruption.We could be subject to litigation that may negatively impact our cash flows, financial condition and results of operations.
From time to time, we may be a defendant in lawsuits and regulatory proceedings relating to our business. Duerenewal options available to the inherent uncertaintieslessee upon expiration of litigationthe initial lease term. By contrast, smaller store leases are typically negotiated for five-year terms. The longer terms of major tenant leases serve to protect the Company against significant vacancies and regulatory proceedings, we cannot accurately predictto assure the ultimate outcomepresence of any such litigationstrong tenants which draw consumers to its centers. The shorter terms of smaller store leases allow the Company under appropriate circumstances to adjust rental rates periodically and, where possible, to upgrade or proceedings. We could experience a negative impactadjust the overall tenant mix.
Most leases contain provisions requiring tenants to our cash flows, financial conditionpay their pro rata share of real estate taxes, insurance and resultscertain operating costs. Some leases also provide that tenants pay percentage rent based upon sales volume generally in excess of operations duecertain negotiated minimums.
WHLR performs property management and leasing services for the Company pursuant to
an unfavorable outcome.the Wheeler Real Estate Company Management Agreement. See Note 16 of "Notes to Consolidated Financial Statements" included in Item 8 below for further information. Item 3.
| Item 3. Legal Proceedings |
The Company is not presently involved
See Note 10 of "Notes to Consolidated Financial Statements" included in any litigation, nor,Item 8 below for information relating to its knowledge, is any litigation threatened againstlegal proceedings.
Item 4. Mine Safety Disclosures: Not applicable
Part II.
Item 5. Market for Registrant's Common Equity, Related Stockholder Matters and Issuer Purchases of Equity Securities:
Market Information and Holders
As a result of the
Company or its subsidiaries,Merger, WHLR acquired all of the outstanding shares of the Company's common stock, which
is either not covered by the Company’s liability insurance, or, in management’s opinion, would result in a material adverse effectceased to be publicly traded on the
Company’s financial position or results of operations.Item 4.
| Mine Safety Disclosures: Not applicable
|
Part II.
Item 5.
| Market for Registrant’s Common Equity, Related Stockholder Matters and Issuer Purchases of Equity Securities
|
Market Information
NYSE. The Company had 13,529,969 shares of common stockCompany's outstanding held by approximately 140 stockholders of record at December 31, 2020. The Company believes it has more than approximately 5,000 beneficial holders of its common stock. The Company’s shares7.25% Series B Preferred Stock and 6.50% Series C Preferred Stock remain outstanding and continue to trade on the NYSE underNYSE.
Dividends
In order to continue qualifying as a REIT, the
symbol “CDR”.Stockholder Return Performance Presentation
Company is required to distribute at least 90% of its "REIT taxable income", as defined in the Code. The Company paid common stock dividends during 2022 and preferred stock dividends during 2022 and 2023. The following line graph sets forthtable presents the income tax status of distributions per share paid to our common stockholders and preferred stockholders:
| | | | | | | | | | | | | | |
| | Years ended December 31, |
| | 2023 | | 2022 |
| Common Stock | | | | |
| Dividend paid per share | | $ | — | | | $ | 19.586 | |
| Ordinary income | | 0 | % | | 0 | % |
| Capital gains | | 0 | % | | 0 | % |
| Return of capital | | 0 | % | | 100 | % |
| | | | |
| Series B Preferred Stock | | | | |
| Dividend paid per share | | $ | 1.813 | | | $ | 1.813 | |
| Ordinary income | | 0 | % | | 0 | % |
| Capital gains | | 5 | % | | 0 | % |
| Return of capital | | 95 | % | | 100 | % |
| | | | |
| Series C Preferred Stock | | | | |
| Dividend paid per share | | $ | 1.625 | | | $ | 1.625 | |
| Ordinary income | | 0 | % | | 0 | % |
| Capital gains | | 5 | % | | 0 | % |
| Return of capital | | 95 | % | | 100 | % |
Item 6. Reserved
Item 7. Management's Discussion and Analysis of Financial Condition and Results of Operations
The following discussion summarizes the significant factors affecting our consolidated operating results, financial condition, liquidity and cash flows as of and for the
period January 1, 2016 through December 31, 2020, a comparison of the percentage change in the cumulative total stockholder return on the Company’s common stock compared to the cumulative total return of the Russell 2000 index and the National Association of Real Estate Investment Trusts All Equity REIT Index (“NAREIT All Equity REIT Index”). The graph assumes that the shares of the Company’s common stock were bought at the price of $100 per share and that the value of the investment in each of the Company’s common stock and the indices was $100 at the beginning of the period. The graph further assumes the reinvestment of dividends when paid.
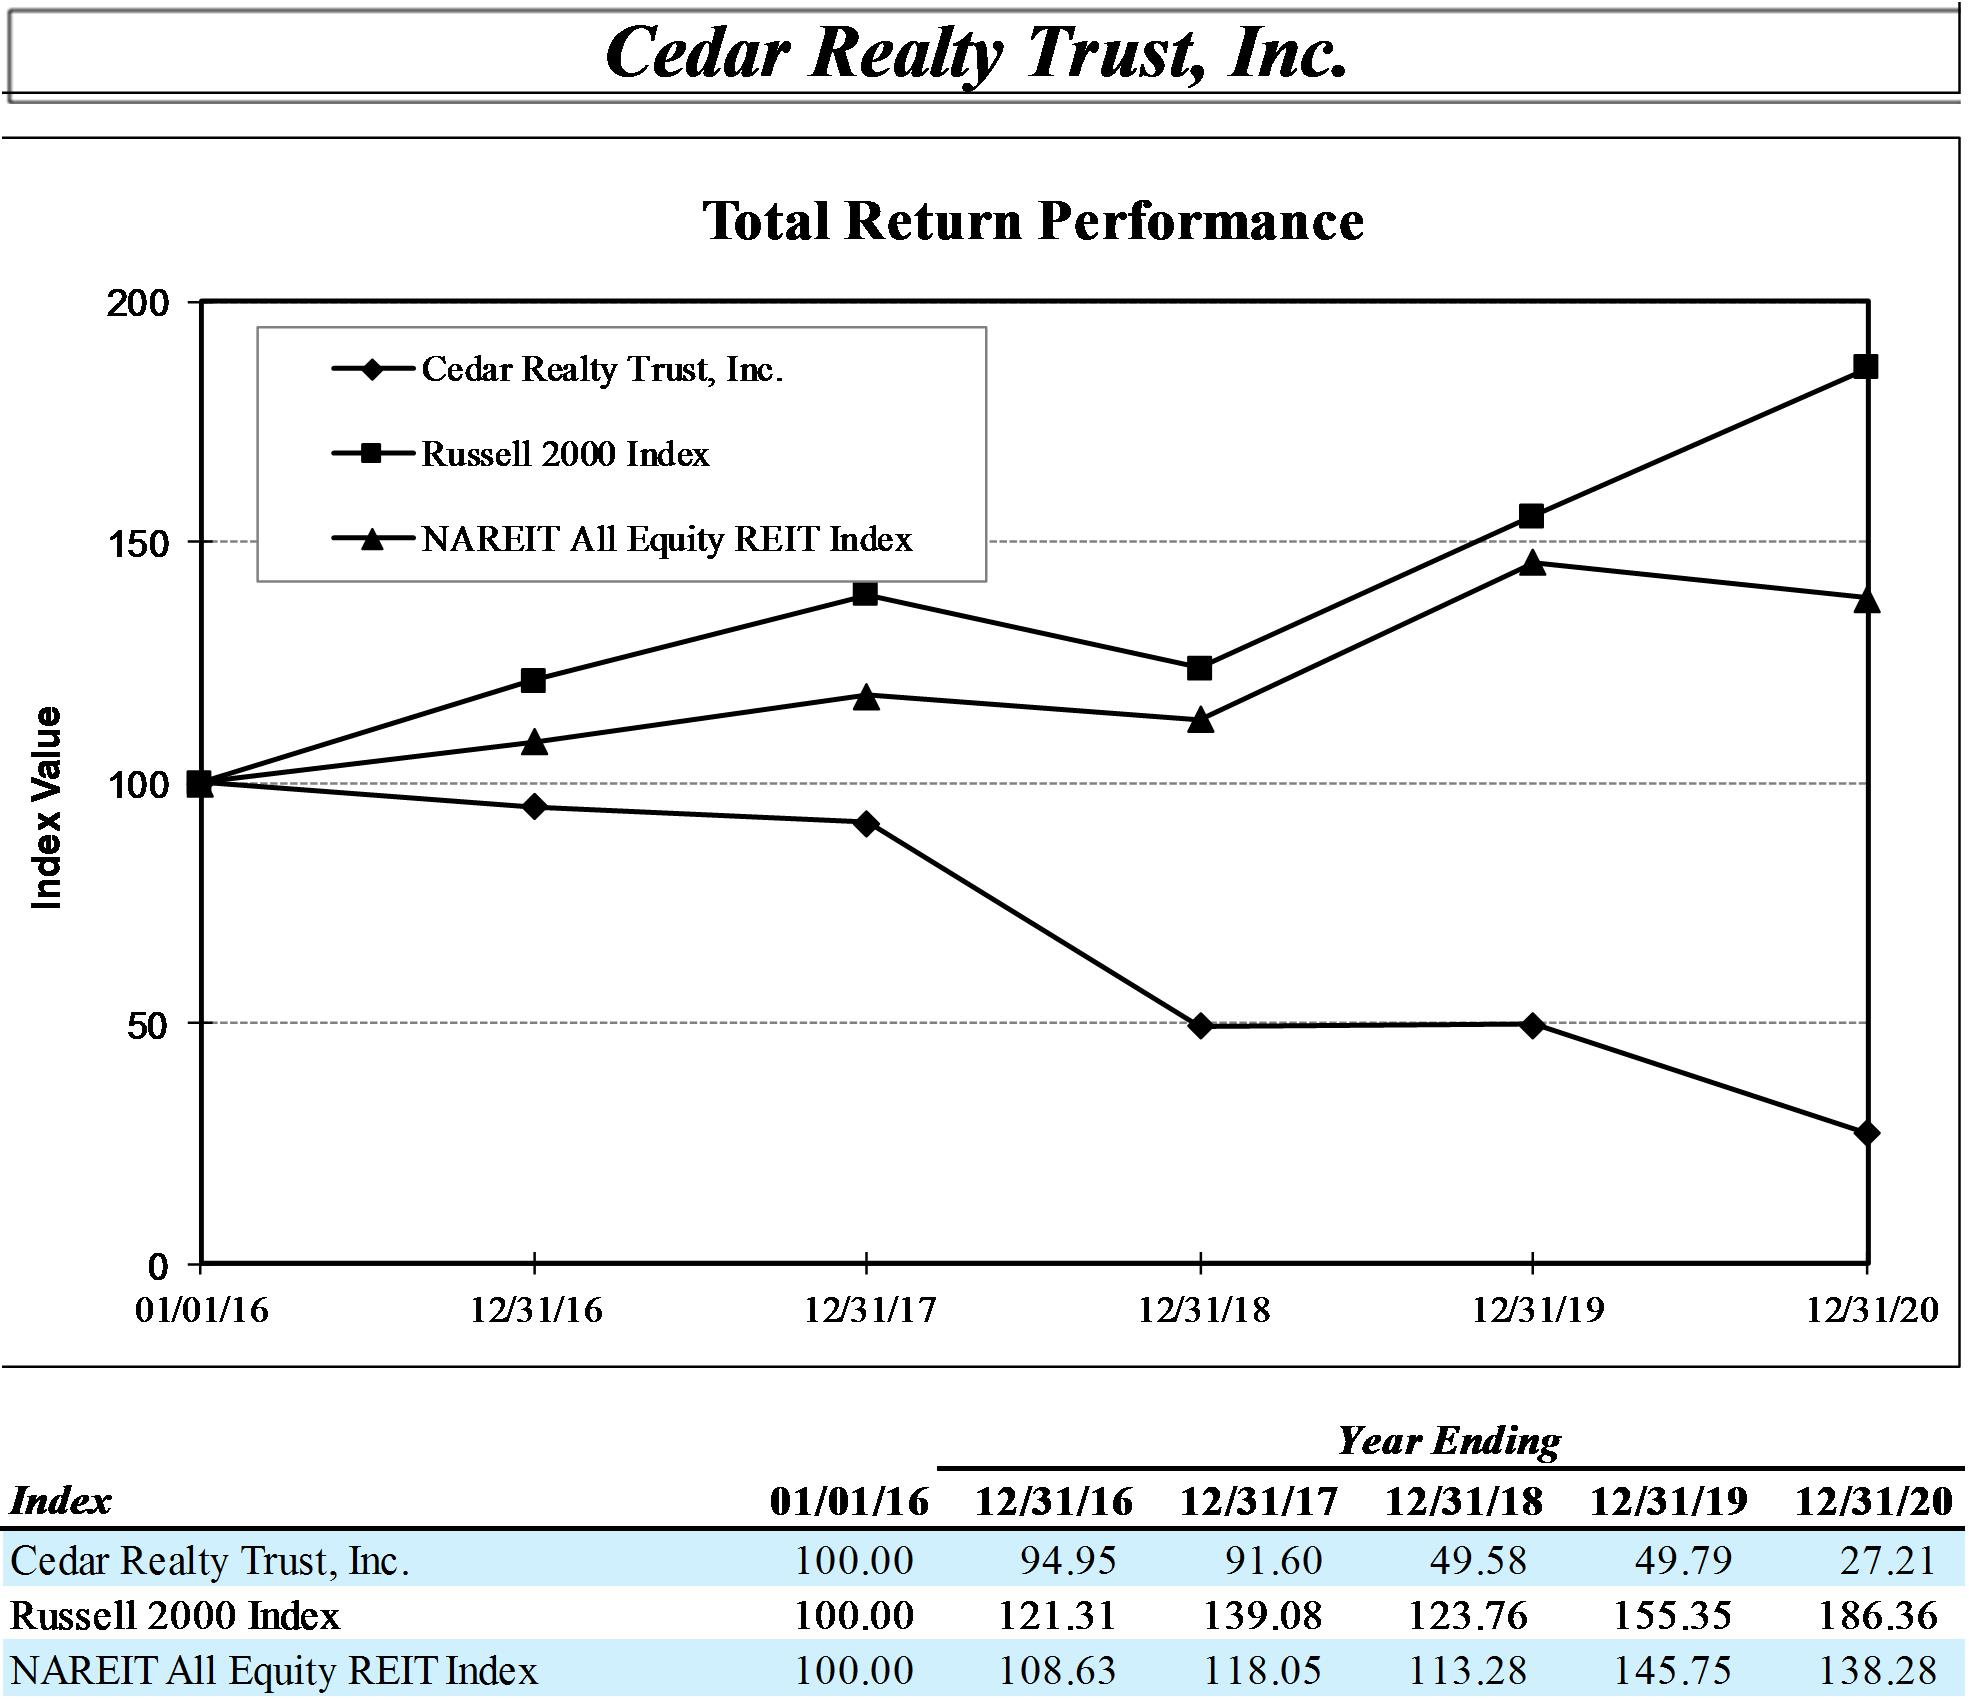
Item 6.
| Selected Financial Data
|
| | Years ended December 31, | |
| | 2020 | | | 2019 | | | 2018 | | | 2017 | | | 2016 | |
Operations data: | | | | | | | | | | | | | | | | | | | | |
Total revenues | | $ | 135,538,000 | | | $ | 144,083,000 | | | $ | 152,020,000 | | | $ | 146,008,000 | | | $ | 151,086,000 | |
Expenses: | | | | | | | | | | | | | | | | | | | | |
Property operating expenses | | | 45,596,000 | | | | 48,347,000 | | | | 47,894,000 | | | | 44,329,000 | | | | 44,515,000 | |
General and administrative | | | 16,865,000 | | | | 18,804,000 | | | | 16,915,000 | | | | 16,907,000 | | | | 18,154,000 | |
Acquisition pursuit costs | | | - | | | | - | | | | - | | | | 156,000 | | | | 3,426,000 | |
Depreciation and amortization | | | 48,412,000 | | | | 45,861,000 | | | | 40,053,000 | | | | 40,115,000 | | | | 40,787,000 | |
Total expenses | | | 110,873,000 | | | | 113,012,000 | | | | 104,862,000 | | | | 101,507,000 | | | | 106,882,000 | |
Other: | | | | | | | | | | | | | | | | | | | | |
Gain on sales | | | 4,396,000 | | | | 2,942,000 | | | | 4,864,000 | | | | 7,099,000 | | | | 59,000 | |
Impairment charges | | | (7,607,000 | ) | | | (8,938,000 | ) | | | (20,689,000 | ) | | | (9,538,000 | ) | | | (6,347,000 | ) |
Total other | | | (3,211,000 | ) | | | (5,996,000 | ) | | | (15,825,000 | ) | | | (2,439,000 | ) | | | (6,288,000 | ) |
| | | | | | | | | | | | | | | | | | | | |
Operating income | | | 21,454,000 | | | | 25,075,000 | | | | 31,333,000 | | | | 42,062,000 | | | | 37,916,000 | |
| | | | | | | | | | | | | | | | | | | | |
Non-operating income and expense: | | | | | | | | | | | | | | | | | | | | |
Interest expense | | | (21,974,000 | ) | | | (23,509,000 | ) | | | (22,146,000 | ) | | | (22,199,000 | ) | | | (26,529,000 | ) |
Early extinguishment of debt costs | | | - | | | | - | | | | (4,829,000 | ) | | | (210,000 | ) | | | (2,623,000 | ) |
Total non-operating income and expense | | | (21,974,000 | ) | | | (23,509,000 | ) | | | (26,975,000 | ) | | | (22,409,000 | ) | | | (29,152,000 | ) |
| | | | | | | | | | | | | | | | | | | | |
| | | | | | | | | | | | | | | | | | | | |
Net (loss) income | | | (520,000 | ) | | | 1,566,000 | | | | 4,358,000 | | | | 19,653,000 | | | | 8,764,000 | |
| | | | | | | | | | | | | | | | | | | | |
Net (income) loss attributable to noncontrolling interests | | | (552,000 | ) | | | (490,000 | ) | | | (469,000 | ) | | | (510,000 | ) | | | 179,000 | |
| | | | | | | | | | | | | | | | | | | | |
Net (loss) income attributable to Cedar Realty Trust, Inc. | | | (1,072,000 | ) | | | 1,076,000 | | | | 3,889,000 | | | | 19,143,000 | | | | 8,943,000 | |
| | | | | | | | | | | | | | | | | | | | |
Preferred stock dividends and redemption costs | | | (10,752,000 | ) | | | (10,752,000 | ) | | | (14,370,000 | ) | | | (21,542,000 | ) | | | (14,408,000 | ) |
| | | | | | | | | | | | | | | | | | | | |
Net (loss) attributable to common shareholders | | $ | (11,824,000 | ) | | $ | (9,676,000 | ) | | $ | (10,481,000 | ) | | $ | (2,399,000 | ) | | $ | (5,465,000 | ) |
| | | | | | | | | | | | | | | | | | | | |
Net (loss) per common share attributable to common shareholders (basic and diluted): | | $ | (0.92 | ) | | $ | (0.78 | ) | | $ | (0.83 | ) | | $ | (0.25 | ) | | $ | (0.50 | ) |
| | | | | | | | | | | | | | | | | | | | |
Dividends to common shareholders | | $ | 7,147,000 | | | $ | 17,808,000 | | | $ | 18,301,000 | | | $ | 17,681,000 | | | $ | 17,049,000 | |
Per common share | | $ | 0.53 | | | $ | 1.32 | | | $ | 1.32 | | | $ | 1.32 | | | $ | 1.32 | |
| | | | | | | | | | | | | | | | | | | | |
Weighted average number of common shares - basic and diluted | | | 13,104,000 | | | | 13,082,000 | | | | 13,397,000 | | | | 12,753,000 | | | | 12,375,000 | |
Item 6.
| Selected Financial Data (continued)
|
| | | | | | | | | | | | | | | | | | | | |
| | Years ended December 31, | |
Balance sheet data: | | 2020 | | | 2019 | | | 2018 | | | 2017 | | | 2016 | |
| | | | | | | | | | | | | | | | | | | | |
Real estate, net | | $ | 1,098,909,000 | | | $ | 1,125,345,000 | | | $ | 1,146,713,000 | | | $ | 1,192,656,000 | | | $ | 1,183,359,000 | |
Real estate held for sale/conveyance | | | 9,498,000 | | | | 13,230,000 | | | | 11,592,000 | | | | - | | | | - | |
Other assets | | | 68,844,000 | | | | 67,050,000 | | | | 64,596,000 | | | | 59,762,000 | | | | 50,162,000 | |
Total assets | | $ | 1,177,251,000 | | | $ | 1,205,625,000 | | | $ | 1,222,901,000 | | | $ | 1,252,418,000 | | | $ | 1,233,521,000 | |
| | | | | | | | | | | | | | | | | | | | |
Debt obligations | | $ | 624,274,000 | | | $ | 630,575,000 | | | $ | 624,834,000 | | | $ | 580,125,000 | | | $ | 607,745,000 | |
Other liabilities | | | 65,519,000 | | | | 60,975,000 | | | | 39,351,000 | | | | 42,182,000 | | | | 43,779,000 | |
Total liabilities | | | 689,793,000 | | | | 691,550,000 | | | | 664,185,000 | | | | 622,307,000 | | | | 651,524,000 | |
| | | | | | | | | | | | | | | | | | | | |
Equity: | | | | | | | | | | | | | | | | | | | | |
Cedar Realty Trust, Inc. shareholders' equity | | | 483,498,000 | | | | 510,561,000 | | | | 555,425,000 | | | | 628,336,000 | | | | 580,740,000 | |
Noncontrolling interests | | | 3,960,000 | | | | 3,514,000 | | | | 3,291,000 | | | | 1,775,000 | | | | 1,257,000 | |
Total equity | | | 487,458,000 | | | | 514,075,000 | | | | 558,716,000 | | | | 630,111,000 | | | | 581,997,000 | |
| | | | | | | | | | | | | | | | | | | | |
Total liabilities and equity | | $ | 1,177,251,000 | | | $ | 1,205,625,000 | | | $ | 1,222,901,000 | | | $ | 1,252,418,000 | | | $ | 1,233,521,000 | |
| | | | | | | | | | | | | | | | | | | | |
Other data: | | | | | | | | | | | | | | | | | | | | |
Funds From Operations ("FFO") (a) | | $ | 39,848,000 | | | $ | 42,073,000 | | | $ | 45,241,000 | | | $ | 40,032,000 | | | $ | 41,067,000 | |
Operating Funds From Operations ("Operating FFO") (a) | | $ | 40,331,000 | | | $ | 40,769,000 | | | $ | 53,577,000 | | | $ | 48,325,000 | | | $ | 49,241,000 | |
| | | | | | | | | | | | | | | | | | | | |
Cash flows provided by (used in): | | | | | | | | | | | | | | | | | | | | |
Operating activities | | $ | 42,580,000 | | | $ | 53,675,000 | | | $ | 57,900,000 | | | $ | 57,093,000 | | | $ | 59,247,000 | |
Investing activities | | $ | (18,369,000 | ) | | $ | (22,342,000 | ) | | $ | (14,938,000 | ) | | $ | (45,497,000 | ) | | $ | 48,763,000 | |
Financing activities | | $ | (25,321,000 | ) | | $ | (30,563,000 | ) | | $ | (48,204,000 | ) | | $ | (10,139,000 | ) | | $ | (109,923,000 | ) |
| | | | | | | | | | | | | | | | | | | | |
Square feet of GLA | | | 8,085,000 | | | | 8,328,000 | | | | 8,729,000 | | | | 9,010,000 | | | | 9,128,000 | |
Percent occupied | | | 88.1 | % | | | 91.5 | % | | | 90.7 | % | | | 91.3 | % | | | 89.9 | % |
Average annualized base rent per square foot | | $ | 14.04 | | | $ | 14.02 | | | $ | 13.78 | | | $ | 13.51 | | | $ | 13.50 | |
| (a)
| See Item 7 - "Management Discussion and Analysis of Financial Condition and Results of Operations" for a reconciliation of FFO and Operating FFO to net (loss) income attributable to common shareholders.
|
Item 7.
| Management’s Discussion and Analysis of Financial Condition and Results of Operations
|
periods presented below. The following discussion should be read in conjunction with the Company’sCompany's consolidated financial statements and related notes thereto included elsewhere in this report.
Form 10-K.
In addition to historical information, this discussion and analysis contains forward-looking statements based on current expectations that involve risks, uncertainties and assumptions, such as our plans, objectives, expectations and intentions as further described under the caption above entitled "Cautionary Statement on Forward-Looking Statements." Our actual results or other events and the timing of events may differ materially from those anticipated in these forward-looking statements as a result of various factors, including those set forth in the caption above entitled "Cautionary Statement on Forward-Looking Statements."
The Company is a
fully-integrated real estate investment trust that focuses
primarily on
ownership, operationowning and
redevelopment ofoperating income producing retail properties with a primary focus on grocery-anchored shopping centers in
high- density urban markets from Washington, D.C. to Boston.the Northeast. At December 31,
2020,2023, the Company owned
and managed a portfolio of
54 operating19 properties
(excluding properties “held for sale”) totaling
8.12.8 million square feet of GLA. The portfolio was
89.1%89.6% leased and
88.1%86.4% occupied at December 31,
2020.2023.
The Company, organized as a Maryland corporation, has established an umbrella partnership structure through the contribution of substantially all of its assets to the Operating Partnership, organized as a limited partnership under the laws of Delaware. The
Operating Partnership is the entity through which the Company conducts substantially all of its business
and owns (either directly or through
the Operating Partnership.subsidiaries) substantially all of its assets. At December 31,
2020,2023, the Company,
which is a subsidiary of WHLR, owned a
99.4% general and limited partnership100.0% interest in, and was the sole general partner of, the Operating Partnership.
The limited partners’ interest in the Operating Partnership (0.6% at December 31, 2020) is represented by Operating Partnership Units (“OP Units”). The carrying amount of such interest is adjusted at the end of each reporting period to an amount equal to the limited partners’ ownership percentage of the Operating Partnership’s net equity. The 81,000 OP Units outstanding at December 31, 2020 are economically equivalent to shares of the Company’s common stock. The holders of OP Units have the right to exchange their OP Units for the same number of shares of the Company’s common stock or, at the Company’s option, for cash.On November 25, 2020, the Company effected a 1-for-6.6 reverse stock split of the issued and outstanding shares of common stock. Each 6.6 shares of the Company's issued and outstanding common stock were combined into one share of the Company's common stock. The number of authorized shares and the par value of the common stock were not changed. In addition, the Company amended the Limited Partnership Agreement of our Operating Partnership to effect a corresponding reverse split of the partnership interests of the Operating Partnership. In accordance with GAAP, all shares of common stock, restricted stock units, OP Units and per share/unit information that are presented in this Form10-K were adjusted to reflect the reverse split on a retroactive basis for all periods presented.
The Company derives substantially all of its revenues from rents and operating expense reimbursements received pursuant to
long-term leases. The
Company’sCompany's operating results therefore depend on the ability of its tenants to make the payments required by the terms of their leases. The Company focuses its investment activities on grocery-anchored shopping centers. The Company believes that, because of the need of consumers to purchase food and other staple goods and services generally available at such centers, its type of
“necessities-based”"necessities-based" properties should provide relatively stable revenue flows even during difficult economic times.
2020 Significant Circumstances
Asset Sale and
TransactionsCOVID-19 Pandemic
As a result of COVID-19,Merger
On March 2, 2022, the Company has received numerous rent relief requests, most often inentered into definitive agreements for the formsale of rent deferrals. The Company has evaluated, and continues to evaluate, each tenant rent relief request on an individual basis, considering a number of factors. Not all tenant requests have resulted in modification agreements, nor is the Company forgoingand its contractual rights underassets in a series of related all-cash transactions. Specifically, the Company and certain of its lease agreements. The Company hassubsidiaries entered into lease modifications that deferred approximately $3.2 millionan asset purchase and waived approximately $1.5 million of rental income for 2020, respectively. To date,sale agreement (the "Asset Purchase Agreement") with DRA Fund X-B LLC and KPR Centers LLC (together with their respective designees, the weighted average payback period of deferred rent is approximately 10 months, beginning at various time commencing in July 2020 through March 2021. The Company has collected approximately 94%, 91% and 77% of contractual base rents and monthly tenant reimbursements"Grocery-Anchored Purchasers") for the quarters ended December 31, 2020, September 30, 2020sale of a portfolio of 33 grocery-anchored shopping centers for cash (the "Grocery-Anchored Portfolio Sale"). In addition, the Company entered into an agreement and June 30, 2020, respectively. plan of merger (the "Merger Agreement") with WHLR and certain of its affiliates pursuant to which, following closing of the Grocery-Anchored Portfolio Sale, WHLR acquired the balance of the Company's shopping center assets by way of an all-cash merger transaction (the "Merger").
The Company currently remains in active discussionstransactions contemplated by the Asset Purchase Agreement and negotiations with its impacted tenants and anticipates the needMerger Agreement are collectively referred to grant additional rent concessions or other lease-related relief, such as the deferral"Transactions." The Transactions were unanimously approved by the Company's former Board of lease paymentsDirectors and were approved by the Company's common stockholders at a special meeting of stockholders held on May 27, 2022.
On July 7, 2022, the Company and certain of its subsidiaries completed the Grocery-Anchored Portfolio Sale and the East River Park and Senator Square redevelopment asset sales for
a periodtotal gross proceeds of
time to be paid overapproximately $879 million, including the
remaining termassumed debt. There were no material relationships among the Company, the Grocery-Anchored Purchasers, or any of their respective affiliates. On August 22, 2022, the Company completed the Merger. Each outstanding share of common stock of the
lease. The natureCompany and
financial impactoutstanding common unit of
such additional rent relief is currently unknown as negotiations are in progress. The extent to which COVID-19 impacts the
Company’s business, operations and financial results will depend on numerous evolving factors thatOperating Partnership held by persons other than the Company
is not ableimmediately prior to
predict at this time.the Merger were canceled and converted into the right to receive a cash payment of $9.48 per share or unit. As a result of the COVID-19 pandemic,Merger, WHLR acquired all of the outstanding shares of the Company's common stock, which ceased to be publicly traded on the New York Stock Exchange ("NYSE"). The Company's outstanding 7.25% Series B Preferred Stock and 6.50% Series C Preferred Stock remain outstanding and continue to trade on the NYSE. In addition, prior to consummation of the Merger, the Company's Board of Directors declared a special dividend on shares of the Company's outstanding common stock and OP Units of $19.52 per share, payable to holders of record of the Company's common stock and OP Units at the close of business on August 19, 2022.
In connection with the Transactions, the Company tookincurred transaction costs of $59.0 million for the following actions:year ended December 31, 2022, included in the accompanying consolidated statement of operations, of which $33.5 million relates to employee severance payments.
| •
| In March 2020, the Company borrowed an aggregate $75.0 million under its revolving credit facility to preserve financial flexibility. In August 2020, the Company repaid substantially all of this borrowing.
|
2023 Significant Circumstances and Transactions
| •
| In April 2020 and July 2020, the Company’s Board of Directors declared a quarterly common dividend of $0.066 per share, reduced from $0.330 per share from the February 2020 dividend, which preserves $3.6 million of cash per quarter.
|
| •
| Dramatically reduced near-term redevelopment and other non-essential capital expenditures. In addition, the Company reduced general and administrative costs by $1.9 million in 2020 versus 2019.
|
| •
| Transitioned all but a limited number of essential employees to remote work and does not anticipate any adverse impact on its ability to continue to operate its business. Currently, the Company has a limited number of employees coming into offices as needed and has employees visiting properties only as necessary to ensure that the properties with essential businesses that are open and operating are able to conduct business and serve their communities.
|
Real Estate
On July
23, 2020,11, 2023, the Company
entered into a commercial lease agreement (the “Lease”) with the Government of the District of Columbia (the “District”), for the lease by the District of approximately 240,000 square feet of office space in a new six-storysold an outparcel building
adjacent to
be constructed by the Company at Senator Square. The building is planned to house the new office headquarters for the District of Columbia’s Department of General Services’ (“DGS”) 700-member workforce. The term of the Lease is 20 years and 10 months, to commence upon substantial completion and delivery to DGS. The Company anticipates commencement of construction to occur in the first quarter of 2021 and currently estimates that the space will be delivered during the end of the fourth quarter 2022.Upon completion of the building, the District will be obligated to pay initial annual net rent of approximately $5.4 million per year, subject to a 2.5% annual escalator on each anniversary of rent commencement, plus certain operating costs, property taxes and amortization of tenant improvements together totaling approximately an additional $8.1 million per year, for an aggregate total annual rent of approximately $13.5 million. The Lease provides for a free rent period of 10 months immediately following rent commencement. The Lease also provides the District with a tenant credit of approximately $6.8 million to be applied, at the District’s election, against either annual rent or any other tenant payment obligations including tenant improvement costs, in excess of the tenant improvement allowance. Pursuant to the Lease, the landlord will contribute up to $155 per rentable square foot toward the cost of tenant improvements, to be amortized over 240 months. In addition, the Lease provides that the Company will contribute $9.38 per rentable square foot in additional tenant improvement allowance between the 10th and 12th Lease years, upon the District’s timely election. The obligations of the District under the Lease are subject to annual budget appropriation.
As of December 31, 2020, Carll’sCarll's Corner, located in Bridgeton, New Jersey and The Commons, locatedfor $3.0 million, resulting in Dubois, Pennsylvania, have been classified as “real estate held for sale” on the accompanying consolidated balance sheet.
On January 31, 2020, the Company agreed to a cash payment in consideration for permitting a dark anchor tenant to terminate its lease prior to the contractual expiration at Metro Square. As a result of this termination, revenues for the nine months ended September 30, 2020, included approximately $7.1$2.7 million of other income.
During 2020, the Company sold the properties listed below:
| | | | Date | | Sales | | | Gain on | |
Property | | Location | | Sold | | Price | | | Sale | |
2020 | | | | | | | | | | | | |
Metro Square | | Owings Mills, MD | | 7/9/2020 | | $ | 4,288,000 | | | $ | - | |
Oakland Mills outparcel building | | Columbia, MD | | 9/17/2020 | | | 1,050,000 | | | | 643,000 | |
Glen Allen Shopping Center | | Glen Allen, VA | | 10/8/2020 | | | 8,540,000 | | | | 1,780,000 | |
Pine Grove Plaza outparcel building | | Brown Mills, NJ | | 11/2/2020 | | | 1,100,000 | | | | 565,000 | |
Suffolk Plaza | | Suffolk, VA | | 12/10/2020 | | | 6,950,000 | | | | 1,408,000 | |
| | | | | | $ | 21,928,000 | | | $ | 4,396,000 | |
During the year ended December 31, 2020, the Company recorded impairment charges of $7.6 million in relation to properties classified as real estate held for sale,gain, which areis included in continuing operations in the accompanying consolidated statement of operations.
Unsecured Revolving Credit Facility and Term Loans
On August 4, 2020, the Company amended its existing $300 million unsecured credit facility and term loans. After such amendments, the Company’s financial ratios and borrowing base are now all computed using trailing four quarters as opposed to the current quarter annualized and interest rate swaps that are a hedge of existing debt are now excluded from the definition of debt.
Common Stock
On November 25, 2020, the Company effected a 1-for-6.6 reverse stock split of the issued and outstanding shares of common stock. Each 6.6 shares of the Company's issued and outstanding common stock were combined into one share of the Company's common stock. The number of authorized shares and the par value of the common stock were not changed. In addition, the Company amended the Limited Partnership Agreement of our Operating Partnership to effect a corresponding reverse split of the partnership interests of the Operating Partnership. In accordance with GAAP, all shares of common stock, restricted stock units, OP Units and per share/unit information that are presented in this Form 10-K were adjusted to reflect the reverse split on a retroactive basis for all periods presented.
2019 Significant Transactions
Acquisition
On June 19, 2019, the Company purchased Girard Plaza, a shopping center adjacent to its South Philadelphia property, located in Philadelphia, Pennsylvania. The purchase price for the property was $8.5 million, which has been allocated to real estate assets and liabilities.
Dispositions
On February 15, 2019, the Company sold Maxatawny Marketplace, located in Maxatawny, Pennsylvania. The sales price for the property was $10.3 million, which resulted in a gain on sale of $0.1 million, which has been included in continuing operations in the accompanying consolidated statement of operations.
On June 26, 2019, the Company sold Fort Washington Center, located in Fort Washington, Pennsylvania. The sales price for the property was $9.0 million, which resulted in a gain on sale of $2.8 million, which has been included in continuing operations in the accompanying consolidated statement of operations.
Real Estate Held for Sale
As of December 31, 2019, Carll’s Corner, located in Bridgeton, New Jersey, Suffolk Plaza, located in Suffolk, Virginia and The Commons, located in Dubois, Pennsylvania, have been classified as “real estate held for sale” on the accompanying consolidated balance sheet. During 2019, an impairment charge of $8.9 million has been recorded in connection with a property held for sale, which has been included in continuing operationsoperating income in the accompanying consolidated statements of operations.
Equity
Timpany Plaza Loan Agreement
On December 18, 2018, the Company’s Board of Directors approved a stock repurchase program, which authorizedSeptember 12, 2023, the Company to purchase up to $30.0entered into a term loan agreement with Cornerstone Bank for $11.56 million at a fixed rate of 7.27% with interest-only payments due monthly for the first twelve months (the "Timpany Plaza Loan Agreement"). Commencing on September 12, 2024, until the maturity date of September 12, 2028, monthly principal and interest payments will be made based on a 30-year amortization schedule calculated based on the principal amount as of that time. On the closing date, the Company received $9.06 million of the Company’s common stock$11.56 million, and the remaining $2.5 million will be received upon the satisfaction of certain lease-related contingencies within one year of the agreement date. The Timpany Plaza Loan Agreement is collateralized by the Timpany Plaza shopping center.
Related Party Transactions
With the completion of the Company's merger with WHLR, the Company became a subsidiary of WHLR. WHLR performs property management and leasing services for the Company pursuant to the Wheeler Real Estate Company Management Agreement. The management fee is 4% of gross operating income, and leasing commissions range from 3% to 6%. During the years ended December 31, 2023 and 2022, the Company paid WHLR $2.1 million and $1.0 million, respectively, for these services. The Operating Partnership and WHLR's operating partnership, Wheeler REIT, L.P., are party to a cost sharing and reimbursement agreement, pursuant to which the parties agreed to share costs and expenses associated with certain employees, certain facilities and property, and certain arrangements with third parties (the "Cost Sharing Agreement"). The related party amounts due to WHLR at December 31, 2023 and 2022 are comprised of:
| | | | | | | | | | | |
| December 31, |
| 2023 | | 2022 |
| Financings and real estate taxes | $ | 7,166,000 | | | $ | 7,166,000 | |
| Management fees | 225,000 | | | 110,000 | |
| Leasing commissions | 161,000 | | | 85,000 | |
| Cost Sharing Agreement allocations (a) | 548,000 | | | — | |
| Other | (6,000) | | | (33,000) | |
| Total | $ | 8,094,000 | | | $ | 7,328,000 | |
(a)Includes allocations for executive compensation and directors' liability insurance. In 2022, WHLR did not make any allocations to the Company for these services due to certain limitations set forth in the open market or through private transactions, subject to market conditions. The stock repurchase program expired on December 18, 2019. During 2019, the Company repurchased approximately 311,000 shares at a weighted average price per share of $22.03. Since approval of the plan on December 18, 2018, the Company repurchased 428,000 shares at a weighted average price per share of $21.45.Cost Sharing Agreement.
Summary of Critical Accounting Policies
The preparation of the consolidated financial statements in conformity with GAAP requires the Company to make estimates and judgments that affect the reported amounts of assets and liabilities, revenues and expenses, and related disclosures of contingent assets and liabilities. On an ongoing basis, management evaluates its estimates, including those related to revenue recognition and the allowance for doubtful accounts receivable, real estate investments and purchase accounting allocations related thereto, asset impairment, and derivatives used to hedge interest-rate risks. Management’sManagement's estimates are based both on information that is currently available and on various other assumptions management believes to be reasonable under the circumstances. Actual results could differ from those estimates and those estimates could be different under varying assumptions or conditions.
The Company has identified the following critical accounting policies, the application of which requires significant judgments and estimates:
Rental income with scheduled rent increases is recognized using the straight-line method over the respective terms of the leases. The aggregate excess of rental revenue recognized on a straight-line basis over base rents under applicable lease provisions is included
in straight-line rents receivable on the consolidated balance sheet. Leases also generally contain provisions under which the tenants reimburse the Company for a portion of property operating expenses and real estate taxes incurred; such income is recognized in the periods earned. In addition, certain operating leases contain contingent rent provisions under which tenants are required to pay a percentage of their sales in excess of a specified amount as additional rent. The Company defers recognition of contingent rental income until those specified targets are met.
The Company must make estimates as to the collectability of its accounts receivable related to base rent, straight-line rent, expense reimbursements and other revenues. Management analyzes accounts receivable by considering tenant creditworthiness, current economic conditions, and changes in
tenants’tenants' payment patterns when evaluating the adequacy of the allowance for doubtful accounts receivable. These estimates have a direct impact on net income, because a higher bad debt allowance would result in lower net income, whereas a lower bad debt allowance would result in higher net income.
Real estate investments are carried at cost less accumulated depreciation. The provision for depreciation is calculated using the straight-line method based on estimated useful lives. Expenditures for maintenance, repairs and betterments that do not materially prolong the normal useful life of an asset are charged to operations as incurred. Expenditures for betterments that substantially extend the useful lives of real estate assets are capitalized.
Real estate investments include costs of development and redevelopment activities, and construction in progress. Capitalized costs, including interest and other carrying costs during the construction and/or renovation periods, are included in the cost of the related asset and charged to operations through depreciation over the asset's estimated useful life. The Company is required to make subjective estimates as to the useful lives of its real estate assets for purposes of determining the amount of depreciation to reflect on an annual basis. These assessments have a direct impact on net income. A shorter estimate of the useful life of an asset would have the effect of increasing depreciation expense and lowering net income, whereas a longer estimate of the useful life of an asset would have the effect of reducing depreciation expense and increasing net income.
A variety of costs are incurred in the acquisition, development and leasing of a property, such as pre-construction costs essential to the development of the property, development costs, construction costs, interest costs, real estate taxes, salaries and related costs, and other costs incurred during the period of development. After a determination is made to capitalize a cost, it is allocated to the specific component of a project that is benefited. The Company ceases capitalization on the portions substantially completed and occupied, or held available for occupancy, and capitalizes only those costs associated with the portions under construction. The Company considers a construction project as substantially completed and held available for occupancy upon the completion of tenant improvements, but not later than one year from cessation of major development activity. Determination of when a development project is substantially complete and capitalization must cease involves a degree of judgment.
The effect of a longer capitalization period would be to increase capitalized costs and would result in higher net income, whereas the effect of a shorter capitalization period would be to reduce capitalized costs and would result in lower net income.The Company allocates the fair value of real estate acquired to land, buildings and improvements. In addition, the fair value of in-place leases is allocated to intangible lease assets and liabilities. The fair value of the tangible assets of an acquired property is determined by valuing the property as if it were vacant, which value is then allocated to land, buildings and improvements based on
management’smanagement's determination of the fair values of such assets. In valuing an acquired
property’sproperty's intangibles, factors considered by management include an estimate of carrying costs during the expected lease-up periods, such as real estate taxes, insurance, other operating expenses, and estimates of lost rental revenue during the expected lease-up periods based on its evaluation of current market demand. Management also estimates costs to execute similar leases, including leasing commissions, tenant improvements, legal and other related costs.
The values of acquired
above-marketabove market and
below-marketbelow market leases are recorded based on the present values (using discount rates which reflect the risks associated with the leases acquired) of the differences between the contractual amounts to be received and
management’smanagement's estimate of market lease rates, measured over the terms of the respective leases that management deemed appropriate at the time of the acquisitions. Such valuations include a consideration of the
non-cancellablenon-cancelable terms of the respective leases as well as any applicable renewal period(s). The fair values associated with
below-marketbelow market rental renewal options are determined based on the
Company’sCompany's experience and the relevant facts and circumstances that existed at the time of the acquisitions. The values of
above-market
above market leases are amortized to rental income over the terms of the respective non-cancelable lease periods. The portion of the values of below-marketbelow market leases associated with the original non-cancelable lease terms are amortized to rental income over the terms of the respective non-cancelable lease periods. The portion of the values of the leases associated with below-marketbelow market renewal options that are likely of exercise are amortized to rental income over the respective renewal periods. The value of other intangible assets (including leasing commissions, tenant improvements, etc.) is amortized to expense over the applicable terms of the respective leases. If a lease were to be terminated prior to its stated expiration or not renewed, all unamortized amounts relating to that lease would be recognized in operations at that time.
Management is required to make subjective assessments in connection with its valuation of real estate acquisitions. These assessments have a direct impact on net income because (1)
above-marketabove market and
below-marketbelow market lease intangibles are amortized to rental income and (2) the value of other intangibles is amortized to expense. Accordingly, higher allocations to
below-marketbelow market lease liability and other intangibles would result in higher rental income and amortization expense, whereas lower allocations to
below-marketbelow market lease liability and other intangibles would result in lower rental income and amortization expense.
Management reviews each real estate investment for impairment whenever events or circumstances indicate that the carrying value of a real estate investment may not be recoverable. The review of recoverability is based on an estimate of the future cash flows that are expected to result from the real estate
investment’sinvestment's use and eventual disposition. These estimates of cash flows consider factors such as expected future operating income, trends and prospects, as well as the effects of leasing demand, competition and other factors. If an impairment event exists due to the projected inability to recover the carrying value of a real estate investment, an impairment loss is recorded to the extent that the carrying value exceeds estimated fair value. A real estate investment held for sale is carried at the lower of its carrying amount or estimated fair value, less the cost of a potential sale. Depreciation and amortization are suspended during the period the property is held for sale. Management is required to make subjective assessments as to whether there are impairments in the value of its real estate properties. These assessments have a direct impact on net income, because an impairment loss is recognized in the period that the assessment is made.
New Accounting Pronouncements
See Note 2 of
Notes"Notes to Consolidated Financial
StatementsStatements" included in Item 8 below for information relating to new accounting pronouncements.
Comparison of 20202023 to 20192022
| | | | | | | | | | Change | |
| | 2020 | | | 2019 | | | Dollars | | | Percent | |
| Years ended December 31, | | | Years ended December 31, | | Change |
| 2023 | | | 2023 | | 2022 | | Dollars | | Percent |
Revenues | | $ | 135,538,000 | | | $ | 144,083,000 | | | $ | (8,545,000 | ) | | -5.9% | | Revenues | $ | 34,632,000 | | | $ | | $ | 34,297,000 | | | $ | | $ | 335,000 | | | 1.0% | | 1.0% |
Property operating expenses | | | (45,596,000 | ) | | | (48,347,000 | ) | | | 2,751,000 | | | -5.7% | | Property operating expenses | (13,153,000) | | | (14,360,000) | | (14,360,000) | | | 1,207,000 | | 1,207,000 | | | (8.4)% | | (8.4)% |
Property operating income | | | 89,942,000 | | | | 95,736,000 | | | | (5,794,000 | ) | | | | |
General and administrative | | | (16,865,000 | ) | | | (18,804,000 | ) | | | 1,939,000 | | | -10.3% | |
| Corporate general and administrative | |
| Corporate general and administrative | |
| Corporate general and administrative | | (3,192,000) | | | (10,099,000) | | | 6,907,000 | | | (68.4)% |
Depreciation and amortization | | | (48,412,000 | ) | | | (45,861,000 | ) | | | (2,551,000 | ) | | 5.6% | | Depreciation and amortization | (10,918,000) | | | (9,645,000) | | (9,645,000) | | | (1,273,000) | | (1,273,000) | | | 13.2% | | 13.2% |
| Gain on sale | | Gain on sale | 2,662,000 | | | — | | | 2,662,000 | | | n/a |
| Impairment charges | | Impairment charges | — | | | (9,350,000) | | | 9,350,000 | | | n/a |
| Transaction costs | | Transaction costs | — | | | (58,959,000) | | | 58,959,000 | | | n/a |
| Interest expense, net | | Interest expense, net | (8,024,000) | | | (10,894,000) | | | 2,870,000 | | | (26.3)% |
| Income (loss) from continuing operations | |
| Discontinued operations: | |
| Discontinued operations: | |
| Discontinued operations: | |
| Income from discontinued operations | |
| Income from discontinued operations | |
| Income from discontinued operations | | — | | | 14,302,000 | | | (14,302,000) | | | (100.0)% |
| Impairment charges | | Impairment charges | — | | | (16,629,000) | | | 16,629,000 | | | n/a |
Gain on sales | | | 4,396,000 | | | | 2,942,000 | | | | 1,454,000 | | | n/a | | Gain on sales | — | | | 125,500,000 | | 125,500,000 | | | (125,500,000) | | (125,500,000) | | | n/a | | n/a |
Impairment charges | | | (7,607,000 | ) | | | (8,938,000 | ) | | | 1,331,000 | | | n/a | |
Interest expense | | | (21,974,000 | ) | | | (23,509,000 | ) | | | 1,535,000 | | | -6.5% | |
Net (loss) income | | | (520,000 | ) | | | 1,566,000 | | | | (2,086,000 | ) | | | | |
Net (income) attributable to noncontrolling interests | | | (552,000 | ) | | | (490,000 | ) | | | (62,000 | ) | | | | |
Net (loss) income attributable to Cedar Realty Trust, Inc. | | $ | (1,072,000 | ) | | $ | 1,076,000 | | | $ | (2,148,000 | ) | | | | |
| | | | | | | | | | | | | | | | |
| Net income | |
| Net income attributable to noncontrolling interests | |
| Net income attributable to noncontrolling interests | |
| Net income attributable to noncontrolling interests | | — | | | (132,000) | | | 132,000 | | | n/a |
| Net income attributable to Cedar Realty Trust, Inc. | |
Revenues were lowerhigher primarily as a result of the negative impact(1) an increase of the COVID-19 pandemic, which resulted in (1) a decrease of $5.4$1.6 million in rental revenues and expense recoveries and a decrease of $1.8 million in straight-line rental and the amortization of intangible lease liabilities revenues attributable to same-centersame center properties, which is partially offset by (2) a decrease of $5.5 million in rental revenues and expense recoveries and a decrease of $1.2 million in straight-line rental and the amortization of intangible lease liabilities revenues attributable to redevelopment properties. In addition, there was a decrease of $2.1$0.9 million in rental revenues and expense recoveries attributable to properties that were sold or held for sale in 20192022 not deemed to be discontinued operations, and 2018. These negative results were partially offset by (1) $7.1 million(3) a decrease in revenue in the quarter ended March 31, 2020 relating to a dark anchor tenant terminating its lease prior to the contractual expiration in 2020 at Metro Square, and (2) an increaseother income of $0.4 million in rental revenues and expense recoveries attributable to a property acquiredone-time transactions for properties that were sold in 2019.2022. Property operating expenses were lower primarily as a result of (1) a decrease of $2.0 million in property operating expenses attributable to redevelopment properties, (2) a decrease of $0.6 million in property operating expenses attributable to properties that
were sold or held for sale during 2022 not deemed to be discontinued operations, (2) a decrease of $0.4 million attributable to one-time property operating expenses for properties that were sold in 2020 and 2019,2022, and (3) a decrease of $0.3 million in property operating expenses attributable to same-center properties, partially offset by an increase of $0.2 million in property operating expenses attributable to a property acquired in 2019.same center properties.
General
Corporate general and administrative costs were lower primarily as a result of (1) cost savingsa decrease of $1.1$4.5 million as a result of the COVID-19 pandemic, predominatelyin payroll related to the cancellation of leasing conventions along with the related travel expenses andcosts, (2) a decrease of $0.9$2.4 million in legalother general and administrative costs, (3) a decrease of $0.4 million in accounting fees, all of which are predominantly related to the completion of the Grocery-Anchored Portfolio Sale and the Merger, partially offset by (4) an increase of $0.4 million in professional fees. Depreciation and amortization expenses were higher as a result of (1) accelerated depreciation of tenant improvements and leasing commissions of $4.2 million as a result of tenants vacating their spaces, (2) accelerated depreciation of $2.1 million in the quarter ended March 31, 2020 relating to the demolition of certain existing buildings at a redevelopment property, (3) an increase of $1.3 million attributable to same-center properties, and (4) a $0.7 million write-off in the quarter ended March 31, 2020 arising from a lease termination for permitting a dark anchor to terminate its lease prior to the contractual expiration at a property that was classified held for sale in 2020, by (1) a decrease of $5.0 million attributable to redevelopment properties, and (2) a decrease of $0.6 million attributable to properties that were sold or held for sale in 2020 and 2019.same center properties. Gain on salessale in 2020 relates to the sale of (1) Glen Allen Shopping Center, located in Glen Allen, Virginia, (2) Suffolk Plaza, located in Suffolk, Virginia, (3) an outparcel building at Oakland Mills, located in Columbia, Maryland, and (4) an outparcel building at Pine Grove Plaza, located in Brown Mills, New Jersey. Gain on sales in 20192023 relates to the sale of Maxatawny Marketplace,the outparcel building adjacent to Carll's Corner, located in Maxatawny, Pennsylvania and Fort Washington Center,Bridgeton, New Jersey.
Impairment charges in 2022 relate to Riverview Plaza, located in Fort Washington, Pennsylvania.Impairment charges Philadelphia, Pennsylvania, which was sold that same year, and the Company's then-investment in 2020 relates to Metrothe unconsolidated joint venture and the then-note receivable associated with Senator Square located in Owings Mills, Maryland, and The Commons, locatedWashington D.C., both of which assets were sold in Dubois Pennsylvania. Impairment charges.the Grocery-Anchored Portfolio Sale.
Transaction costsin 20192022 relate to The Commons, located in Dubois, Pennsylvania.costs incurred related to the Grocery-Anchored Portfolio Sale and the Merger. Interest expense, net was lower as a result of (1) a decrease in the overall weighted average interest rate which resulted inamortization expense of deferred financing costs of $5.7 million, (2) a decrease in interest expense of $1.8 million, and (2) an increase in capitalized interest of $1.0 million, partially offset by increase in the overall weighted average principal balance which resulted in an increasea decrease in interest expense of $1.3 million.as higher as a result$4.6 million, partially offset by (3) the interest rate swaps termination gain in 2022 of $3.4 million, (4) an increase in the overall weighted average interest rate. Comparison of 2019 to 2018
| | | | | | | | | | Change | |
| | 2019 | | | 2018 | | | Dollars | | | Percent | |
Revenues | | $ | 144,083,000 | | | $ | 152,020,000 | | | $ | (7,937,000 | ) | | -5.2% | |
Property operating expenses | | | (48,347,000 | ) | | | (47,894,000 | ) | | | (453,000 | ) | | 0.9% | |
Property operating income | | | 95,736,000 | | | | 104,126,000 | | | | (8,390,000 | ) | | | | |
General and administrative | | | (18,804,000 | ) | | | (16,915,000 | ) | | | (1,889,000 | ) | | 11.2% | |
Depreciation and amortization | | | (45,861,000 | ) | | | (40,053,000 | ) | | | (5,808,000 | ) | | 14.5% | |
Gain on sales | | | 2,942,000 | | | | 4,864,000 | | | | (1,922,000 | ) | | n/a | |
Impairment charges | | | (8,938,000 | ) | | | (20,689,000 | ) | | | 11,751,000 | | | n/a | |
Interest expense | | | (23,509,000 | ) | | | (22,146,000 | ) | | | (1,363,000 | ) | | 6.2% | |
Early extinguishment of debt costs | | | — | | | | (4,829,000 | ) | | | 4,829,000 | | | n/a | |
Net income | | | 1,566,000 | | | | 4,358,000 | | | | (2,792,000 | ) | | | | |
Net (income) attributable to noncontrolling interests | | | (490,000 | ) | | | (469,000 | ) | | | (21,000 | ) | | | | |
Net income attributable to Cedar Realty Trust, Inc. | | $ | 1,076,000 | | | $ | 3,889,000 | | | $ | (2,813,000 | ) | | | | |
Revenues were lower primarily as a result of (1) $5.4 million relating to a dark anchor tenant terminating its lease prior to the contractual expirationrate, which resulted in 2018 at West Bridgewater Plaza, (2) a decrease of $3.4 million in rental revenues and expense recoveries attributable to properties that were sold or held for sale in 2019 and 2018, (3) a decrease of $0.8 million in rental revenues and expense recoveries attributable to same-center properties which was driven by the adoption of the new lease accounting standard (see Note 2 – “Issued and Adopted Accounting Pronouncements”), and (4) a decrease of $0.1 million in rental revenues and expense recoveries attributable to redevelopment properties, partially offset by (1) an increase of $1.7 million in rental revenues and expense recoveries attributable to properties acquired in 2019 and 2018, and (2) an increase of other income of $0.4 million.
Property operating expenses were higher primarily as a result of (1) an increase of $1.1 million in property operating expenses attributable to properties acquired in 2019 and 2018, and (2) an increase of $0.6 million in property operating expenses attributable to the Company’s redevelopment properties, partially offset by (1) a decrease of $0.8 million in property operating expenses attributable to properties that were sold or held for sale in 2019 and 2018, and (2) a decrease of $0.7 million in property operating expenses
attributable to same-center properties which was driven by the adoption of the new lease accounting standard (see Note 2 – “Issued and Adopted Accounting Pronouncements”).
General and administrative costs were higher primarily as a result of (1) an increase in payrollinterest expense of $2.8 million predominantly relating to the adoption of the new lease accounting standard in 2019 which no longer permits the capitalization of initial direct leasing costs, and (2) an increase in legal and professional fees of $0.6 million, partially offset by the reversal of $1.5 million of accrued expenses related to the termination of the prior Chief Operating Officer.
Depreciation and amortization expenses were higher primarily as a result (1) accelerated depreciation of $4.3 million in 2019 relating to the demolition of certain existing buildings at redevelopment properties, (2) an increase of $1.5 million attributable to same-center properties, (3) an increase of $1.2 million attributable to redevelopment properties, and (4) an increase of $0.5 million attributable to properties acquired in 2019 and 2018, partially offset by a decrease of $1.6 million attributable to properties that were sold or held for sale in 2019 and 2018.
Gain on sales in 2019 relates to the sale of Maxatawny Marketplace, located in Maxatawny, Pennsylvania and Fort Washington Center, located in Fort Washington, Pennsylvania. Gain on sale in 2018 relates to the sale of Mechanicsburg Center, located in Mechanicsburg, Pennsylvania.
Impairment charges in 2019 relate to The Commons, located in Dubois, Pennsylvania. Impairment charges in 2018 relate to (1) West Bridgewater Plaza, located in West Bridgewater, Pennsylvania totaling $9.4$3.0 million, and (2) Carll’s Corner, located(5) capitalized interest in Bridgeton, New Jersey totaling $11.3 million2022 of $1.0 million.
Interest expense
was higherDiscontinued operations for 2022 include the results of operations, impairments and gain on sales for properties treated as a result of an increase in the overall weighted average interest rate. discontinued operations.Early extinguishment of debt costs in 2018 relates to defeasement fees and the accelerated write-off of unamortized costs associated with the prepayment of certain mortgage loans payable.
Same-Property Net Operating Income
Same-property net operating income
(“("same-property
NOI”NOI") is a widely-used non-GAAP financial measure for REITs that the Company believes, when considered with financial statements prepared in accordance with GAAP, is useful to
investorsinvestors. The Company defines same-property NOI as
property revenues (rental and other revenues) less property and related expenses (property operation and maintenance and real estate taxes). Because same-property NOI excludes general and administrative expenses, depreciation and amortization, interest expense, interest income, provision for income taxes, gain or loss on sale or capital expenditures and leasing costs and impairment charges, it provides
an indication ofa performance measure, that when compared year over year, reflects the
recurring cash generated by the Company’s properties by excluding certain non-cash revenues and expenses
as well as other infrequent itemsdirectly associated with owning and operating commercial real estate properties and the impact to operations from trends in occupancy rates, rental rates and operating costs, providing perspective not immediately apparent from net income. The Company uses same-property NOI to evaluate its operating performance since same-property NOI allows the Company to evaluate the impact of factors, such as
occupancy levels, lease
termination income which tends to fluctuate more than rents from year to year.structure, lease rates and tenant base, have on the Company's results, margins and returns. Properties are included in same-property NOI if they are owned and operated for the entirety of both periods being compared, except for properties undergoing significant redevelopment and expansion until such properties have stabilized, and properties classified as held for sale. Consistent with the capital treatment of such costs under GAAP, tenant improvements, leasing commissions and other direct leasing costs are excluded from same-property NOI.
The most directly comparable GAAP financial measure is consolidated operating income. Same-property NOI should not be considered as an alternative to consolidated operating income prepared in accordance with GAAP or as a measure of liquidity. Further, same-property NOI is a measure for which there is no standard industry definition and, as such, it is not consistently defined or reported on among the
Company’sCompany's peers, and thus may not provide an adequate basis for comparison among REITs.
The following table reconciles same-property NOI to the
Company’sCompany's consolidated operating
income:income (loss) (the most directly comparable GAAP financial measure): | | Years ended December 31, | |
| | 2020 | | | 2019 | |
Operating income | | $ | 21,454,000 | | | $ | 25,075,000 | |
Add (deduct): | | | | | | | | |
General and administrative | | | 16,865,000 | | | | 18,804,000 | |
Gain on sales | | | (4,396,000 | ) | | | (2,942,000 | ) |
Impairment charges | | | 7,607,000 | | | | 8,938,000 | |
Depreciation and amortization | | | 48,412,000 | | | | 45,861,000 | |
Straight-line rents | | | 1,208,000 | | | | (405,000 | ) |
Amortization of intangible lease liabilities | | | (1,373,000 | ) | | | (2,827,000 | ) |
Other adjustments | | | (426,000 | ) | | | (571,000 | ) |
NOI related to properties not defined as same-property | | | (22,703,000 | ) | | | (20,432,000 | ) |
Same-property NOI | | $ | 66,648,000 | | | $ | 71,501,000 | |
| | | | | | | | |
Number of same properties | | | 45 | | | | 45 | |
Same-property occupancy, end of period | | | 90.0 | % | | | 91.0 | % |
Same-property leased, end of period | | | 91.2 | % | | | 93.1 | % |
Same-property average base rent, end of period | | $ | 13.69 | | | $ | 13.71 | |
| | | | | | | | | | | |
| | Years ended December 31, |
| | 2023 | | 2022 |
| Operating income (loss) | $ | 10,031,000 | | | $ | (68,116,000) | |
| Add (deduct): | | | |
| Corporate general and administrative | 3,192,000 | | | 10,099,000 | |
| Gain on sale | (2,662,000) | | | — | |
| Transaction costs | — | | | 58,959,000 | |
| Impairment charges | — | | | 9,350,000 | |
| Depreciation and amortization | 10,918,000 | | | 9,645,000 | |
| Straight-line rents | (854,000) | | | (77,000) | |
| Above (below) market lease amortization, net | (336,000) | | | (896,000) | |
| Other non-property revenue | (426,000) | | | (258,000) | |
| NOI related to properties not defined as same-property | (106,000) | | | (495,000) | |
| Same-property NOI | $ | 19,757,000 | | | $ | 18,211,000 | |
| | | |
| Number of same properties | 19 | | 19 |
| Same-property occupancy, end of year | 86.4 | % | | 82.3 | % |
| Same-property leased, end of year | 89.6 | % | | 86.2 | % |
| Same-property average base rent, end of year | $ | 10.52 | | | $ | 10.28 | |
Same-property NOI for the comparable years
decreased 6.8%increased 8.5% as a result of
the negative impact of the COVID-19 pandemic which reducedincreased rental revenues
for the same-property portfolio.and decreased property operating expenses in 2023.
The following is a summary of the
Company’sCompany's retail leasing activity during
2020: | | | | | | | | | | | | | | | | | | | | | | Tenant | | |
| | | | | | | | | | New rent | | | Prior rent | | | Cash basis | | | improvements | | |
| | Leases | | | | | | | per | | | per | | | % | | | per | | |
| | signed | | | GLA | | | sq.ft. ($) | | | sq.ft. ($) | | | change | | | sq.ft. ($) | | |
Renewals | | | 91 | | | | 820,700 | | | | 14.68 | | | | 14.54 | | | | 0.9 | % | | | 0.96 | | |
New Leases - Comparable | | | 28 | | | | 131,600 | | | | 13.69 | | | | 14.40 | | | | -4.9 | % | | | 20.74 | | (a) |
New Leases - Non-Comparable (b) | | | 2 | | | | 10,700 | | | | 14.16 | | | n/a | | | n/a | | | | 28.98 | | (a) |
Total (c) | | | 121 | | | | 963,000 | | | | 14.54 | | | n/a | | | n/a | | | | 3.97 | | |
| | | | | | | | | | | | | | | | | | | | | | | | | |
| (a)
| Includes both tenant allowance and landlord work. Excludes first generation space.
|
| | | | | | | | | | | |
| | Year ended December 31, 2023 | | Six months ended December 31, 2022 |
| Renewals (a): | | | |
| Leases renewed with rate increase (sq feet) | 182,111 | | | 124,875 | |
| Leases renewed with rate decrease (sq feet) | — | | | 29,223 | |
| Leases renewed with no rate change (sq feet) | 7,643 | | | 64,950 | |
| Total leases renewed (sq feet) | 189,754 | | | 219,048 | |
| | | |
| Leases renewed with rate increase (count) | 20 | | | 12 | |
| Leases renewed with rate decrease (count) | — | | | 2 | |
| Leases renewed with no rate change (count) | 3 | | | 3 | |
| Total leases renewed (count) | 23 | | | 17 | |
| | | |
| Option exercised (count) | 5 | | | 2 | |
| | | |
| Weighted average on rate increases (per sq foot) | $ | 0.77 | | | $ | 1.91 | |
| Weighted average on rate decreases (per sq foot) | $ | — | | | $ | (0.28) | |
| Weighted average on all renewals (per sq foot) | $ | 0.74 | | | $ | 1.05 | |
| | | |
| Weighted average change over prior rates | 6.85 | % | | 10.26 | % |
| | | |
| New Leases (a) (b): | | | |
| New leases (sq feet) | 224,175 | | | 159,213 | |
| New leases (count) | 26 | | | 14 | |
| Weighted average rate (per sq foot) | $ | 12.77 | | | $ | 10.70 | |
| (b)(a)Lease data presented is based on average rate per square foot over the renewed or new lease term.
| Includes leases signed at first generation and expansion spaces.
|
| (c)(b)The Company does not include ground leases entered into for the purposes of new lease sq feet and weighted average rate (per sq foot) on new leases.
| Legal fees and leasing commissions averaged a combined total of $1.14 per square foot.
|
Liquidity and Capital Resources
The Company funds operating expenses and other short-term liquidity requirements, including debt service and loan maturities, tenant improvements, and leasing commissions, preferred and common dividend distributions and distributions to minority interest partners, if made, primarily from its operations.operations and the $9.4 million in restricted cash as of December 31, 2023. The Company may also use its revolving credit facilitydoes not have any scheduled debt maturities for the year ending December 31, 2024. The Company is working to increase revenue by improving occupancy, which includes backfilling vacant anchor spaces and replacing defaulted tenants. Tenant improvements and leasing commissions for these purposes. The Company expects to fund long-term liquidity requirements for property acquisitions, redevelopment costs, capital improvements,efforts will be partially funded by restricted cash, strategic disposition of assets and maturing debt initially with its revolving credit facility, and ultimately through a combinationfinancing of issuing and/or assuming additional debt, the sale of equity securities, the issuance of additional OP Units, and/or the sale of properties. Although
On October 28, 2022, the Company believes it has accessentered into a term loan agreement with Guggenheim Real Estate, LLC for $110.0 million at a fixed rate of 5.25% with interest-only payments due monthly (the "Term Loan Agreement, 10 properties"). Wheeler REIT, L.P. provided a limited recourse indemnity in connection with such loan. Commencing on December 10, 2027, until the maturity date of November 10, 2032, monthly principal and interest payments will be made based on a 30-year amortization schedule calculated based on the principal amount as of that time. The Term Loan Agreement, 10 properties is collateralized by 10 properties and proceeds were used to secured and unsecured financing, there can be no assurance thatpaydown the Company's loan agreement with KeyBank National Association for $130.0 million (the "KeyBank Credit Agreement").
On December 21, 2022, the Company will have accessentered into a term loan agreement with Citi Real Estate Funding Inc. for $25.0 million at a fixed rate of 6.35% with interest-only payments due monthly through maturity on January 6, 2033 (the "Patuxent Crossing/Coliseum
Marketplace Loan Agreement"). The Patuxent Crossing/Coliseum Marketplace Loan Agreement is collateralized by 2 properties and proceeds were used to
financing for development projects, financing for additional construction projects, or proceeds from refinancing of existing debt.As a resultsatisfy the remaining obligation of the COVID-19 pandemic which has created significant economic uncertainty,KeyBank Credit Agreement and released the remaining collateral under that agreement.
On September 12, 2023, the Company
tookentered into a term loan agreement with Cornerstone Bank for $11.56 million at a fixed rate of 7.27% with interest-only payments due monthly for the
following actions: (1) in March 2020,first twelve months (the "Timpany Plaza Loan Agreement"). Commencing on September 12, 2024, until the
Company borrowed an aggregate $75.0 million under its revolving credit facility to preserve financial flexibility, (2) in April, Julymaturity date of September 12, 2028, monthly principal and
October 2020,interest payments will be made based on a 30-year amortization schedule calculated based on the
Company’s Boardprincipal amount as of
Directors declared a quarterly common dividend of $0.066 per share, reduced from $0.330 per share fromthat time. On the
February 2020 dividend, which preserves $3.6 million of cash per quarter, and (3) dramatically reduced near-term redevelopment and other non-essential capital expenditures.
Effective April 28, 2020, the average closing price of the Company’s common stock had been less than $1.00 over the prior 30-consecutive trading day period, and as a result,date, the Company received notice from the NYSE that the Company had until December 31, 2020 to regain compliance with the minimum share price requirement. The threat of delisting and/or a delisting$9.06 million of the Company’s common stock could have adverse effects, such as restricting$11.56 million, and the Company’s ability to obtain equity financing. On November 25, 2020, to regain compliance withremaining $2.5 million will be received upon the minimum NYSE share price requirement, the Company effected a 1-for-6.6 reverse stock splitsatisfaction of certain lease-related contingencies within one year of the issued and outstanding shares of common stock. Each 6.6 shares of the Company's issued and outstanding common stock were combined into one share of the Company's common stock.agreement date. The number of authorized shares and the par value of the common stock were not changed. In addition, the Company amended the Limited PartnershipTimpany Plaza Loan Agreement of our Operating Partnership to effect a corresponding reverse split of the partnership interests of the Operating Partnership.
On August 4, 2020, the Company amended its existing $300 million unsecured credit facility and term loans. After such amendments, the Company’s financial ratios and borrowing base are now all computed using the trailing four quarters as opposed to the current quarter annualized and interest rate swaps that are a hedge of existing debt are now excluded from the definition of debt. The $300 million unsecured credit facility consists of (1) a $250 million revolving credit facility, and (2) a $50 million term loan. The revolving credit facility may be extended, at the Company’s option, for an additional one-year period, subject to customary conditions. Under an accordion feature, the facility can be increased to $750 million, subject to customary conditions and lending commitments. Interest on borrowings under the unsecured credit facility and term loans are based on the Company’s leverage ratio.
The Company’s unsecured credit facility and term loans contain financial covenants including, but not limited to, maximum debt leverage, maximum secured debt, minimum fixed charge coverage, and minimum net worth. In addition, the facility contains restrictions including, but not limited to, limits on indebtedness, certain investments and distributions. The Company’s failure to comply with the covenants or the occurrence of an event of default under the facilities could result in the acceleration of the related debt and exercise of other lender remedies. Although the credit facility is unsecured, borrowing availability is based on unencumbered property adjusted net operating income for the trailing twelve months, as defined in the agreements. As of the date of filing this Form 10-K, the Company had $175.0 million outstanding and $56.7 million available for additional borrowings under its revolving credit facility, and was in compliance with all financial covenants. However, the COVID-19 pandemic may negatively impact the Company’s future ability to remain compliant with all financial covenants, including the ability to generate sufficient unencumbered property adjusted net operating income to support current borrowings (See “Item 1A – Risk Factors” above). The Company’s unencumbered property adjusted net operating income was not significantly impactedcollateralized by the COVID-19 pandemic until the quarter ended June 30, 2020. Accordingly, not until the quarter ended March 31, 2021, will the unencumbered property adjusted net operating income for the trailing twelve months fully reflect the negative impact of the COVID-19 pandemic.
Timpany Plaza shopping center.
Debt
and finance lease obligations are composed of the following at December 31,
2020: | | | | December 31, 2020 | |
| | | | | | | | Contractual | |
| | Maturity | | Balance | | | interest rates | |
Description | | dates | | outstanding | | | weighted-average | |
Fixed-rate mortgage | | Jun 2026 | | $ | 45,645,000 | | | 3.9% | |
Finance lease obligation | | Sep 2050 | | | 5,631,000 | | | 5.3% | |
Unsecured credit facilities: | | | | | | | | | | |
Variable-rate: | | | | | | | | | | |
Revolving credit facility | | Sep 2021 (a) | | | 175,000,000 | | | 2.7%(b) | |
Term loan | | Sep 2022 | | | 50,000,000 | | | 1.9% | |
Fixed-rate (c): | | | | | | | | | | |
Term loan | | Feb 2022 | | | 50,000,000 | | | 3.3% | |
Term loan | | Sep 2022 | | | 50,000,000 | | | 3.5% | |
Term loan | | Apr 2023 | | | 100,000,000 | | | 3.5% | |
Term loan | | Sep 2024 | | | 75,000,000 | | | 3.9% | |
Term loan | | Jul 2025 | | | 75,000,000 | | | 4.8% | |
| | | | | 626,276,000 | | | 3.4% | |
Unamortized issuance costs | | | | | (2,002,000 | ) | | | | |
| | | | $ | 624,274,000 | | | | | |
| (a)
| The revolving credit facility is subject to a one-year extension at the Company’s option.
|
2023 and collateralized by 13 properties: | (b)
| The interest rate on the revolving credit facility consists of LIBOR plus a credit spread based on the Company’s leverage ratio. The Company has an interest rate swap agreement expiring in February 2021, which converts the LIBOR rate to a fixed
|
| | | | | | | | | | | | | | | | | | | | |
| | | | | December 31, 2023 |
| Description | | Maturity
dates | | Balance outstanding | | Contractual
interest rates
weighted-average |
| Fixed-rate secured term loans: | | | | | | |
| Timpany Plaza | | Sep 2028 | | $ | 9,060,000 | | | 7.3% |
| Term loan, 10 properties | | Nov 2032 | | 110,000,000 | | | 5.3% |
| Patuxent Crossing/Coliseum Marketplace | | Jan 2033 | | 25,000,000 | | | 6.4% |
| | | | 144,060,000 | | | 5.6% |
| Unamortized issuance costs | | | | (3,566,000) | | | |
| | | | | $ | 140,494,000 | | | |
| | rate of 3.9% on $75.0 million of the facility, and a variable-rate of 1.8% on the remaining $100.0 million of the facility, resulting in a blended interest rate of 2.7% at December 31, 2020.
|
(c) The interest rates on these termTerm loans consist of LIBOR plus a credit spread based onpayable may require the Company’s leverage ratio,Company to deposit certain replacement and other reserves with its lenders. Such "restricted cash" is generally available only for property-level requirements for which the Company has interest rate swap agreements which convert the LIBOR ratesreserves have been established and are not available to fixed rates. Accordingly, these term loans are presented as fixed-rate debt.
The following table details the Company’s debt and finance lease obligation maturities at December 31, 2020:
| | | | | | | | | | | | | | | | | | | | | | | | | | | | |
| | Mortgage Loan | | | Finance Lease | | | Revolving | | | Term | | | | | | | Unamortized | | | | | |
Year | | Payable | | | Obligation | | | Credit Facility | | | Loans | | | Total | | | Issuance Costs | | | Total | |
2021 | | $ | 1,074,000 | | | $ | 35,000 | | | | 175,000,000 | | (a) | $ | - | | | $ | 176,109,000 | | | $ | (647,000 | ) | | $ | 175,462,000 | |
2022 | | | 1,116,000 | | | | 37,000 | | | | - | | | | 150,000,000 | | | | 151,153,000 | | | | (499,000 | ) | | | 150,654,000 | |
2023 | | | 1,160,000 | | | | 39,000 | | | | - | | | | 100,000,000 | | | | 101,199,000 | | | | (274,000 | ) | | | 100,925,000 | |
2024 | | | 1,206,000 | | | | 41,000 | | | | - | | | | 75,000,000 | | | | 76,247,000 | | | | (207,000 | ) | | | 76,040,000 | |
2025 | | | 1,253,000 | | | | 44,000 | | | | - | | | | 75,000,000 | | | | 76,297,000 | | | | (115,000 | ) | | | 76,182,000 | |
Thereafter | | | 39,836,000 | | | | 5,435,000 | | | | - | | | | - | | | | 45,271,000 | | | | (260,000 | ) | | | 45,011,000 | |
| | $ | 45,645,000 | | | $ | 5,631,000 | | | $ | 175,000,000 | | | $ | 400,000,000 | | | $ | 626,276,000 | | | $ | (2,002,000 | ) | | $ | 624,274,000 | |
| (a)
| The revolving credit facility is subject to a one-year extension at the Company's option.
|
The Company’s revolving credit facility expires in September 2021, and is subject to a one-year extension at the Company’s option. In addition, the Company is exploring obtaining secured debt on certain properties to address some,fund other property-level or all, of the Company’s debt maturities in 2022.
Company-level obligations.
In order to continue qualifying as a REIT, the Company is required to distribute at least 90% of its
“REIT"REIT taxable
income”income", as defined in the
Internal Revenue Code of 1986, as amended (the “Code”).Code. The Company paid common
stock dividends during 2022 and preferred stock dividends during
2019,2022 and 2023, and has continued to declare
and pay common and preferred stock dividends
during 2020. Whilethrough the
Company intends to continue paying regular quarterly dividends, futurefirst quarter of 2024. Future dividend declarations will continue to be at the discretion of the Board of Directors, and will depend on the cash flow and financial condition of the Company, capital requirements, annual distribution requirements under the REIT provisions of the Code, and such other factors as the Board of Directors may deem relevant.
Additionally, the Board of Directors may reduce, as it did with the May 2020 common stock dividend of $0.066 per common share, or suspend payment of dividends to retain cash and reduce debt obligations and/or to fund redevelopments and other capital needs. The Company intends to continue to operate its business in a manner that will allow it to qualify as a REIT for U.S. federal income tax requirements.
Contractual Obligations and Commercial Commitments
The following table sets forth the
Company’sCompany's significant debt repayment, interest,
finance and operating lease obligations at December 31,
2020: | Maturity Date | |
| 2021 | | | 2022 | | | 2023 | | | 2024 | | | 2025 | | | Thereafter | | | Total | |
Debt: | | | | | | | | | | | | | | | | | | | | | | | | | | | |
Mortgage loan payable | $ | 1,074,000 | | | | 1,116,000 | | | $ | 1,160,000 | | | $ | 1,206,000 | | | $ | 1,253,000 | | | $ | 39,836,000 | | | $ | 45,645,000 | |
Unsecured revolving credit facility (a) | | 175,000,000 | | | | - | | | | - | | | | - | | | | - | | | | - | | | | 175,000,000 | |
Unsecured term loans | | - | | | | 150,000,000 | | | | 100,000,000 | | | | 75,000,000 | | | | 75,000,000 | | | | - | | | | 400,000,000 | |
Interest payments (b) | | 18,450,000 | | | | 13,735,000 | | | | 9,326,000 | | | | 7,249,000 | | | | 3,592,000 | | | | 527,000 | | | | 52,879,000 | |
Finance lease obligation (principal and interest) | | 333,000 | | | | 333,000 | | | | 333,000 | | | | 333,000 | | | | 333,000 | | | | 10,394,000 | | | | 12,059,000 | |
Operating lease obligations | | 1,113,000 | | | | 1,112,000 | | | | 1,112,000 | | | | 1,114,000 | | | | 993,000 | | | | 28,554,000 | | | | 33,998,000 | |
Total | $ | 195,970,000 | | | $ | 166,296,000 | | | $ | 111,931,000 | | | $ | 84,902,000 | | | $ | 81,171,000 | | | $ | 79,311,000 | | | $ | 719,581,000 | |
(a)
| The revolving credit facility is subject to a one-year extension at the Company's option.
|
2023:(b)
| Represents interest payments expected to be incurred on the Company's debt obligations as of December 31, 2020, including interest that may subsequently be capitalized. The interest rates used in this calculation in regards to the unsecured revolving credit facility and term loan not subject to interest rate swap agreements consist of LIBOR plus a credit spread based on the Company’s leverage ratio as of December 31, 2020, with the rate in effect at December 31, 2020 being assumed to remain in effect until their maturities. The interest rates used in this calculation in regards to the unsecured term loans subject to interest rate swap agreements consists of LIBOR plus a credit spread based on the Company’s leverage ratio as of December 31, 2020, for which the Company has converted the LIBOR rates to fixed rates.
|
| | | | | | | | | | | | | | | | | | | | | | | | | | | | | | | | | | | | | | | | | |
| Maturity Date |
| 2024 | | 2025 | | 2026 | | 2027 | | 2028 | | Thereafter | | Total |
| Debt: | | | | | | | | | | | | | |
| Secured term loans | $ | 74,000 | | | $ | 306,000 | | | $ | 329,000 | | | $ | 481,000 | | | $ | 9,456,000 | | | $ | 133,414,000 | | | $ | 144,060,000 | |
| Interest payments (a) | 8,154,000 | | | 8,117,000 | | | 8,094,000 | | | 8,069,000 | | | 7,880,000 | | | 28,553,000 | | | 68,867,000 | |
| Operating lease obligations | 179,000 | | | 179,000 | | | 179,000 | | | 179,000 | | | 179,000 | | | 7,673,000 | | | 8,568,000 | |
| Total | $ | 8,407,000 | | | $ | 8,602,000 | | | $ | 8,602,000 | | | $ | 8,729,000 | | | $ | 17,515,000 | | | $ | 169,640,000 | | | $ | 221,495,000 | |
(a)Represents interest payments expected to be incurred on the Company's debt obligations as of December 31, 2023.
In addition, the Company has $0.4 million outstanding construction commitments totaling approximately $4.5 million at December 31, 2020.2023.
Off-Balance Sheet Arrangements
Other than the items disclosed in the Contractual Obligations and Commercial Commitments sectiontable above, the Company had no off-balance sheet arrangements as of December 31, 20202023 that are reasonably likely to have a current or future material effect on the Company’sCompany's financial condition, revenues or expenses, results of operations, liquidity, capital expenditures or capital resources.
Net Cash Flows
| | | Years ended December 31, | | | Years ended December 31, |
| | 2020 | | | 2019 | | | 2018 | | | 2023 | | 2022 |
Cash flows provided by (used in): | | | | | | | | | | | | |
Operating activities | | $ | 42,580,000 | | | $ | 53,675,000 | | | $ | 57,900,000 | |
| Operating activities | |
| Operating activities | |
Investing activities | | $ | (18,369,000 | ) | | $ | (22,342,000 | ) | | $ | (14,938,000 | ) |
Financing activities | | $ | (25,321,000 | ) | | $ | (30,563,000 | ) | | $ | (48,204,000 | ) |
Net cash provided by operating activities, before net changes in operating assets and liabilities, was $57.5 million, $56.1 million, and $66.7$8.7 million for 2020, 20192023. Net cash used in operating activities, before net changes in operating assets and 2018, respectively. liabilities, was $(28.9) million for 2022. The increase between 2020 and 2019 was primarily a result of the Company accepting a paymentreduction in costs associated with the completion of $8.0 million in consideration for permitting a dark anchor tenant to terminate its lease prior toboth the contractual expiration in 2020, which was partially offset by (1) the negative impact of the COVID-19 pandemic in 2020,Grocery-Anchored Portfolio Sale and (2) property dispositions in 2020 and 2019. The decrease between 2019 and 2018 was primarily a result of (1) the Company accepting a payment of $4.3 million in consideration for permitting a dark anchor tenant to terminate its lease prior to the contractual expiration in 2018, (2) an increase in cash paid for interest, and (3) property dispositions in 2019 and 2018.Merger.
Net cash flows used in(used in) provided by investing activities were primarily the result of the Company’sCompany's property disposition activities property acquisitions and expenditures for property improvements. During 2020,2023, the Company incurred expenditures$6.5 million of $39.6 millionexpenditures for property improvements, which was partially offset by $21.2$2.8 million in net proceeds related to the sale of the outparcel building adjacent to Carll's Corner, located in Bridgeton, New Jersey. During 2022, the Company received $667.4 million in proceeds from the Grocery-Anchored Portfolio Sale and $31.9 million in proceeds from the sale of properties. During 2019, the Company incurred expenditures of $31.9 million for property improvements, and acquired a property for $9.1 million,Riverview Plaza, which was partially offset by $18.7$22.4 million in proceeds from the sales of properties. expenditures for property improvements.
Financing Activities
During
2018,2023, the Company
incurred expendituresmade payments of
$30.4 million for property improvements and issued a $3.5 million mortgage note receivable, which was partially offset by $19.1 million in proceeds from the sale of properties.Financing Activities
During 2020, the Company repaid a $75.0 million term loan, had $17.9$10.8 million of preferred and common stock distributions, had $1.1 milliondividends, payments of mortgage repayments, and paid $0.3$0.4 million of debt financing costs, which were partially offset by net advances of $69.0$9.1 million under the revolving credit facility.received from a new term loan. During 2019,2022, the Company paid $28.6made $408.1 million of preferred and common stock distributions, had $6.8a $300.0 million of common stock repurchases, and had $1.0term loan payoff, $130.7 million of mortgage repayments, which was partially offset by net borrowingspayments of $6.0$66.0 million under the revolving credit facility. During 2018, the Company had $80.3facility, payments of $7.4 million of repayments of mortgage obligations, paid $50.0 million to partially redeem shares of its Series B Preferred Stock, had $29.6 million of preferred and common stock distributions, had $5.2 million of payment for early extinguishment of debt costs, had $2.3 million of common stock repurchases, and $0.7 million of payments for debt financing costs, $1.4 million of distributions to limited partners, and the purchase of a minority interest in a joint venture for $1.0 million, which waswere partially offset by a $75.0$265.0 million borrowing under ain new term loan,loans and net borrowingsa $3.4 million benefit as a result of $45.0 million under the revolving credit facility.
interest rate swap terminations.
Funds From Operations
Funds From Operations (“FFO”
We use funds from operations ("FFO") is, a widely recognized supplemental non-GAAP measure, utilizedas an alternative measure of our operating performance, specifically as it relates to evaluate the financial performanceresults of a REIT. The Company presentsoperations and liquidity. We compute FFO in accordance with the definition adoptedstandards established by the National AssociationBoard of Real Estate Investment Trusts (“Nareit”)Governors of Nareit in its March 1995 White Paper (as amended in November 1999, April 2002 and December 2018). As defined by Nareit, generally defines FFO asrepresents net income (determined(computed in accordance with GAAP), excluding gains (losses)(or losses) from sales of property, plus real estate properties,estate-related depreciation and amortization (excluding amortization of loan origination costs), plus impairment write-downs on real estate properties directly attributable to decreases in the value of depreciable real estate, plus real estate related depreciationlong-lived assets and amortization, andafter adjustments for unconsolidated partnerships and joint ventures to reflect FFO on the same basis. The Company considersventures. Most industry analysts and equity REITs, including us, consider FFO to be an appropriate supplemental measure of its financialoperating performance because, it captures features particular toby excluding gains or losses on dispositions and excluding depreciation, FFO is a helpful tool that can assist in the comparison of the operating performance of a company’s real estate performance by recognizing thatbetween periods, or as compared to different companies. Management uses FFO as a supplemental measure to conduct and evaluate our business because there are certain limitations associated with using GAAP net income alone as the primary measure of our operating performance. Historical cost accounting for real estate generally appreciatesassets in accordance with GAAP implicitly assumes that the value of real estate assets diminishes predictably over time, while historically real estate values have risen or maintains residual valuefallen with market conditions. Accordingly, we believe FFO provides a valuable alternative measurement tool to a much greater extent than other depreciable assets.GAAP when presenting our operating results.
The Company also considers Operating Funds From Operations (“Operating FFO”) to be an additional meaningful financial measureWe believe the computation of financial performance because it excludesFFO in accordance with Nareit's definition includes certain items the Company doesthat are not believe are indicative of its corethe results provided by our operating portfolio and affect the comparability of our period-over-period performance. These items include, but are not limited to, legal settlements, non-cash share-based compensation expense, non-cash amortization on loans and acquisition costs. Therefore, in addition to FFO, management uses Adjusted FFO ("AFFO"), which we define to exclude such items. Management believes that these adjustments are appropriate in determining AFFO as they are not indicative of the operating performance such as non-capitalized acquisition pursuit costs, amounts relatingof our assets. In addition, we believe that AFFO is a useful supplemental measure for the investing community to early extinguishment of debt and preferred stock redemption costs, management transition costs and certain redevelopment costs. The Company believes Operating FFO further assistsuse in comparing the Company’s performance across reporting periods on a consistent basis by excluding such items.
FFO and Operating FFO should be reviewed with net income attributableus to common shareholders, the most directly comparable GAAP financial measure, when trying to understand the Company’s operating performance. FFO and Operating FFO do not represent cash generated from operating activities and should not be considered as an alternative to net income attributable to common shareholders or to cash flow from operating activities. The Company’s computations of FFO and Operating FFO may differ from the computations utilized by other REITs and, accordingly, may notas many REITs provide some form of adjusted or modified FFO. However, there can be no assurance that AFFO presented by us is comparable to suchthe adjusted or modified FFO of other REITs.
A reconciliation of net (loss)
income attributable to common shareholders to FFO and
Operating FFOAFFO for the years ended December 31,
2020, 20192023 and
20182022 is as follows:
| | Years ended December 31, | |
| | 2020 | | | 2019 | | | 2018 | |
Net (loss) attributable to common shareholders | | $ | (11,824,000 | ) | | $ | (9,676,000 | ) | | $ | (10,481,000 | ) |
Real estate depreciation and amortization | | | 48,297,000 | | | | 45,677,000 | | | | 39,858,000 | |
Limited partners' interest | | | (66,000 | ) | | | (57,000 | ) | | | (28,000 | ) |
Gain on sales | | | (4,396,000 | ) | | | (2,942,000 | ) | | | (4,864,000 | ) |
Impairment charges | | | 7,607,000 | | | | 8,938,000 | | | | 20,689,000 | |
Consolidated minority interests: | | | | | | | | | | | | |
Share of income | | | 618,000 | | | | 547,000 | | | | 497,000 | |
Share of FFO | | | (388,000 | ) | | | (414,000 | ) | | | (430,000 | ) |
FFO applicable to diluted common shares | | | 39,848,000 | | | | 42,073,000 | | | | 45,241,000 | |
Redevelopment costs (a) | | | 483,000 | | | | 196,000 | | | | — | |
Reversal of management transition costs (b) | | | — | | | | (1,500,000 | ) | | | — | |
Preferred stock redemption costs | | | — | | | | — | | | | 3,507,000 | |
Financing costs (c) | | | — | | | | — | | | | 4,829,000 | |
Operating FFO applicable to diluted common shares | | $ | 40,331,000 | | | $ | 40,769,000 | | | $ | 53,577,000 | |
| | | | | | | | | | | | |
FFO per diluted common share | | $ | 2.88 | | | $ | 3.05 | | | $ | 3.22 | |
Operating FFO per diluted common share | | $ | 2.91 | | | $ | 2.95 | | | $ | 3.81 | |
Weighted average number of diluted common shares (d): | | | | | | | | | | | | |
Common shares and equivalents | | | 13,758,000 | | | | 13,728,000 | | | | 13,994,000 | |
OP Units | | | 81,000 | | | | 83,000 | | | | 65,000 | |
| | | 13,839,000 | | | | 13,811,000 | | | | 14,059,000 | |
| (a)
| Includes redevelopment project costs expensed pursuant to GAAP such as certain demolition and lease termination costs.
|
| (b)
| General and administrative expenses were reduced as a result of the reversal of previously accrued expenses associated with the termination of the prior Chief Operating Officer. As original estimated expenses were added back to operating FFO when recorded in 2016, the reversal of such expenses have been deducted from Operating FFO.
|
| | | | | | | | | | | |
| | Years ended December 31, |
| | 2023 | | 2022 |
| Net (loss) income attributable to common shareholders | $ | (8,745,000) | | | $ | 33,279,000 | |
| Real estate depreciation and amortization | 10,918,000 | | | 19,318,000 | |
| Limited partners' interest | — | | | 132,000 | |
| Gain on sales | (2,662,000) | | | (125,500,000) | |
| Impairment charges | — | | | 25,979,000 | |
| FFO applicable to diluted common shares | (489,000) | | | (46,792,000) | |
| Transaction costs (a) | — | | | 58,959,000 | |
| AFFO applicable to diluted common shares | $ | (489,000) | | | $ | 12,167,000 | |
| | | |
| FFO per diluted common share | $ | (0.04) | | | $ | (3.40) | |
| AFFO per diluted common share | $ | (0.04) | | | $ | 0.88 | |
| Weighted average number of diluted common shares (b): | | | |
| Common shares and equivalents | 13,718,000 | | | 13,717,000 | |
| OP Units | — | | | 44,000 | |
| | 13,718,000 | | | 13,761,000 | |
| (c)(a)Includes costs incurred in connection with the Grocery-Anchored Portfolio Sale and Merger.
| Represents extinguishment of debt costs.
|
| (d)(b)The weighted average number of diluted common shares used to compute FFO and AFFO applicable to diluted common shares includes OP Units, unvested restricted stock units and unvested restricted shares/units that are excluded from the computation of diluted EPS.
| The weighted average number of diluted common shares used to compute FFO and Operating FFO applicable to diluted common shares includes OP Units, unvested restricted stock units and unvested restricted shares that are excluded from the computation of diluted EPS.
|
Inflation
Inflation, has been relatively low in recent years (including our three most recent fiscal years)Deflation and has not had a significant detrimental impact on the Company’s resultsEconomic Condition Considerations
The U.S. is experiencing elevated levels of
operations. There have been mixed indications of an increase in inflation,
in the U.S. economy. If inflation rates increase, substantiallywhich could continue or worsen. Substantially all of the
Company’sCompany's tenant leases contain provisions designed to partially mitigate the negative impact of inflation in the near term. Such lease provisions include clauses that require tenants to reimburse the Company for inflation-sensitive costs such as real estate taxes,
insurance and many of the operating expenses it incurs.
SignificantIn addition, many of our leases are for terms of less than ten years, which permits us to seek increased rents upon re-rental at market rates. However, significant inflation rate increases over a prolonged period of time may have a material adverse impact on the
Company’sCompany's business.
Conversely, deflation could lead to downward pressure on rents and other sources of income.
Interest rate increases could result in higher incremental borrowing costs for the Company and our tenants. The duration of the Company's indebtedness and our relatively low exposure to floating rate debt have mitigated the direct impact of inflation and interest rate increases. The degree and pace of these changes have had and may continue to have impacts on our business.
Item 7A.
| Item 7A. Quantitative and Qualitative Disclosures About Market Risk |
One
We are a smaller reporting company as defined by Rule 12b-2 of the principal market risks facingExchange Act and are not required to provide the Company is the riskinformation under this item.
Table of interest rate changes, primarily through its variable-rate revolving credit facility and term loans. The Company’s objectives with respect to interest rate risk are to limit the impact of interest rate changes on operations and cash flows, and to lower its overall borrowing costs. To achieve these objectives, the Company may borrow at either fixed rates or at variable rates and enter into derivative financial instruments, such as interest rate swaps, to mitigate its interest rate risk. The Company does not enter into derivative or interest rate transactions for speculative purposes. The Company is not directly subject to foreign currency risk.The Company has entered into forward interest rate swap agreements which convert the LIBOR rates to fixed rates for certain unsecured term loans. At December 31, 2020, the Company had $18.9 million included in accounts payable and accrued liabilities on the consolidated balance sheet relating to the fair value of the interest rate swaps applicable to certain unsecured term loans.
At December 31, 2020, long-term debt consisted of a fixed-rate mortgage loan payable, a finance lease obligation, unsecured term loans, and the Company’s unsecured variable-rate credit facility. Excluding unamortized premiums and debt issuance costs, the average interest rate on the $476.3 million of fixed-rate debt outstanding was 3.9%, with maturities at various dates through 2050. The average interest rate on the $150.0 million of variable-rate debt outstanding, which consists of a portion of the unsecured revolving credit facility and a term loan, was 1.8%. With respect to the $150.0 million of variable-rate debt, if contractual interest rates either increase or decrease by 100 bps, the Company’s interest cost would increase or decrease respectively by approximately $1.5 million per annum.
With respect to the Company’s fixed rate mortgage and unsecured term loans, changes in interest rates generally do not affect the Company’s interest expense as these notes are at fixed rates for extended terms. Because the Company presently intends to hold its existing fixed-rate debt either to maturity or until the sale of the associated property, these fixed-rate notes pose an interest rate risk to the Company’s results of operations and its working capital position only upon the refinancing of that indebtedness. The Company’s possible risk is from increases in long-term interest rates that may occur as this may increase the cost of refinancing maturing fixed-rate debt. In addition, the Company may incur prepayment penalties or defeasance costs when prepaying or defeasing debt.
Contents
Item 8.
| Item 8. Financial Statements and Supplementary Data |
| | | | | |
| | 45-46
|
| | |
| | 47
|
| | |
| | 48
|
| | |
| | 49
|
| | |
| | 50-51
|
| | |
| | 52
|
| | |
| | 53-73
|
| | |
| | |
| |
| | 74-76
|
All other schedules have been omitted because the required information is not present, is not present in amounts sufficient to require submission of the schedule, or is included in the consolidated financial statements or notes thereto.
Report of Independent Registered Public Accounting Firm
To the Shareholders and the Board of Directors and Stockholders of
Virginia Beach, Virginia
Opinion on the
Consolidated Financial Statements
We have audited the accompanying consolidated balance sheets of Cedar Realty Trust, Inc.
(the "Company") as of December 31,
20202023 and
2019,2022, and the related consolidated statements of operations, comprehensive income, equity, and cash flows for
each of the
three years
in the period ended December 31,
2020,2023 and 2022, and the related notes
and
schedule listed in the index at Item 15(a)schedules (collectively referred to as the
“consolidated"consolidated financial
statements”statements"). In our opinion, the consolidated financial statements present fairly, in all material respects, the financial position of the Company
atas of December 31,
20202023 and
2019,2022, and the results of its operations and its cash flows for
each of the
three years
in the period ended December 31,
2020,2023 and 2022, in conformity with
U.S.accounting principles generally accepted
accounting principles.We also have audited, in accordance with the standardsUnited States of the Public Company Accounting Oversight Board (United States) (PCAOB), the Company's internal control over financial reporting as of December 31, 2020, based on criteria established in Internal Control-Integrated Framework issued by the Committee of Sponsoring Organizations of the Treadway Commission (2013 framework), and our report dated February 11, 2021 expressed an unqualified opinion thereon.
America.
These
consolidated financial statements are the responsibility of the Company's management. Our responsibility is to express an opinion on the
Company’sCompany's consolidated financial statements based on our audits. We are a public accounting firm registered with the
PCAOBPublic Company Accounting Oversight Board (United States) ("PCAOB") and are required to be independent with respect to the Company in accordance with the U.S. federal securities laws and the applicable rules and regulations of the Securities and Exchange Commission and the PCAOB.
We conducted our audits in accordance with the standards of the PCAOB. Those standards require that we plan and perform the audit to obtain reasonable assurance about whether the consolidated financial statements are free of material misstatement, whether due to error or fraud. The Company is not required to have, nor were we engaged to perform, an audit of its internal control over financial reporting. As part of our audits, we are required to obtain an understanding of internal control over financial reporting, but not for the purpose of expressing an opinion on the effectiveness of the Company's internal control over financial reporting. Accordingly, we express no such opinion.
Our audits included performing procedures to assess the risks of material misstatement of the
consolidated financial statements, whether due to error or fraud, and performing procedures that respond to those risks. Such procedures included examining, on a test basis, evidence regarding the amounts and disclosures in the
consolidated financial statements. Our audits also included evaluating the accounting principles used and significant estimates made by management, as well as evaluating the overall presentation of the
consolidated financial statements. We believe that our audits provide a reasonable basis for our opinion.
The critical audit matter communicated below is a matter arising from the current period audit of the
consolidated financial statements that was communicated or required to be communicated to the audit committee and that: (1) relates to accounts or disclosures that are material to the
consolidated financial statements and (2) involved our especially challenging, subjective, or complex judgments. The communication of the critical audit matter does not alter in any way our opinion on the consolidated financial statements, taken as a whole, and we are not, by communicating the critical audit matter below, providing a separate opinion on the critical audit matter or on the
accountaccounts or
disclosuredisclosures to which it relates.
| | | Evaluation of Real Estate for Impairment of Real Estate Investments | |
| Description of the Matter
| | The Company’s real estate, net totaled $1.10 billion as of December 31, 2020. As explained in Note 2 to the consolidated financial statements, the Company reviews each real estate investment held for use for impairment whenever events or circumstances indicate that the carrying value of a real estate investment may not be recoverable.
Auditing management’s impairment assessment was complex and involved a high degree of subjectivity due to the significant estimation required in determining the future estimated undiscounted net cash flows expected to be generated from assets with indicators of impairment. The estimated undiscounted cash flows are sensitive to assumptions such as expected future operating income, trends and prospects, as well as the effects of leasing demand, capital expenditures, competition and other factors,which are forward-looking and could be affected by future economic and market conditions.
|
Description of Matter
| How We Addressed the Matter in Our Audit
| | We obtained an understanding, evaluated the design, and tested the operating effectiveness of internal controls over management’s impairment process. This included testing controls over management’s review of the estimated undiscounted cash flows, including the significant assumptions and data used to develop the cash flows.
Our testing of the Company’s impairment assessment included, among other procedures, evaluating the appropriateness of the assumptions used to develop the estimated undiscounted cash flows. We utilized information obtained from market participants and recent industry market surveys to evaluate the assumptions used in the Company’s analyses. We held discussions with management regarding recent leasing activity and current and historical tenant credit quality and payment trends to understand the probability of future events that could affect the cash flow assumptions. We also searched for and evaluated information that corroborated or contradicted the Company’s assumptions. In addition, we tested the completeness and accuracy of the data that was used in management’s analyses.
|
At December 31, 2023, the Company's net real estate totaled $201.7 million. As more fully described in Note 2 to the consolidated financial statements, the Company evaluates its real estate investments for impairment whenever events or changes in circumstances indicate that the carrying value of a real estate investment may not be recoverable. Management evaluates various qualitative factors in determining whether events or changes in circumstances indicate that the carrying amount of a real estate investment may not be recoverable.Auditing the Company's impairment assessment involved subjectivity due to the estimation required to assess significant assumptions utilized in the recoverability of the real estate based on undiscounted operating income and residual values, such as assumptions related to renewal and renegotiations of current leases, estimates of new leases on vacant spaces, and estimates of operating costs.
How We Addressed the Matter in Our Audit
To test the Company's evaluation of net real estate for impairment, we performed audit procedures that included, among others, assessing the methodologies applied, evaluating the significant assumptions discussed above and testing the completeness and accuracy of the underlying data used in the analysis. We compared the recoverability calculated to the remaining net book value of the assets to ensure recoverability for the properties' remaining useful lives. We compared the significant assumptions used by
management to relevant market information and other applicable sources. As part of our evaluation, we performed sensitivity analyses of significant assumptions to evaluate the changes in the undiscounted cash flows of the related property that would result from changes in the assumptions.
/s/
ERNST & YOUNGCherry Bekaert LLP
We have served as the
Company’sCompany's auditor since
1984.New York, New York
February 11, 2021
2022.
Virginia Beach, Virginia
March 5, 2024
CONSOLIDATED BALANCE SHEETS | | December 31, | |
| | 2020 | | | 2019 | |
ASSETS | | | | | | | | |
Real estate: | | | | | | | | |
Land | | $ | 284,694,000 | | | $ | 293,456,000 | |
Buildings and improvements | | | 1,242,784,000 | | | | 1,221,750,000 | |
| | | 1,527,478,000 | | | | 1,515,206,000 | |
Less accumulated depreciation | | | (428,569,000 | ) | | | (389,861,000 | ) |
Real estate, net | | | 1,098,909,000 | | | | 1,125,345,000 | |
| | | | | | | | |
Real estate held for sale | | | 9,498,000 | | | | 13,230,000 | |
Cash and cash equivalents | | | 1,637,000 | | | | 2,747,000 | |
Receivables | | | 21,952,000 | | | | 22,164,000 | |
Other assets and deferred charges, net | | | 45,255,000 | | | | 42,139,000 | |
TOTAL ASSETS | | $ | 1,177,251,000 | | | $ | 1,205,625,000 | |
| | | | | | | | |
LIABILITIES AND EQUITY | | | | | | | | |
Mortgage loan payable | | $ | 45,385,000 | | | $ | 46,370,000 | |
Finance lease obligation | | | 5,340,000 | | | | 5,364,000 | |
Unsecured revolving credit facility | | | 175,000,000 | | | | 106,000,000 | |
Unsecured term loans | | | 398,549,000 | | | | 472,841,000 | |
Accounts payable and accrued liabilities | | | 56,580,000 | | | | 50,502,000 | |
Unamortized intangible lease liabilities | | | 8,939,000 | | | | 10,473,000 | |
Total liabilities | | | 689,793,000 | | | | 691,550,000 | |
| | | | | | | | |
Commitments and contingencies | | | - | | | | - | |
| | | | | | | | |
Equity: | | | | | | | | |
Cedar Realty Trust, Inc. shareholders' equity: | | | | | | | | |
Preferred stock | | | 159,541,000 | | | | 159,541,000 | |
Common stock ($0.06 par value, 150,000,000 shares authorized, 13,530,000 and 13,488,000 shares, issued and outstanding, respectively) | | | 812,000 | | | | 809,000 | | |
Treasury stock (447,000 and 465,000 shares, respectively, at cost) | | | (15,133,000 | ) | | | (16,311,000 | ) |
Additional paid-in capital | | | 879,790,000 | | | | 877,256,000 | |
Cumulative distributions in excess of net income | | | (522,696,000 | ) | | | (503,725,000 | ) |
Accumulated other comprehensive (loss) | | | (18,816,000 | ) | | | (7,009,000 | ) |
Total Cedar Realty Trust, Inc. shareholders' equity | | | 483,498,000 | | | | 510,561,000 | |
Noncontrolling interests: | | | | | | | | |
Minority interests in consolidated joint ventures | | | 1,053,000 | | | | 435,000 | |
Limited partners' OP Units | | | 2,907,000 | | | | 3,079,000 | |
Total noncontrolling interests | | | 3,960,000 | | | | 3,514,000 | |
Total equity | | | 487,458,000 | | | | 514,075,000 | |
TOTAL LIABILITIES AND EQUITY | | $ | 1,177,251,000 | | | $ | 1,205,625,000 | |
| | | | | | | | |
| | | | | | | | | | | |
| | December 31, |
| | 2023 | | 2022 |
| ASSETS | | | |
| Real estate: | | | |
| Land | $ | 69,085,000 | | | $ | 69,111,000 | |
| Buildings and improvements | 299,080,000 | | | 294,999,000 | |
| | 368,165,000 | | | 364,110,000 | |
| Less accumulated depreciation | (166,489,000) | | | (157,468,000) | |
| Real estate, net | 201,676,000 | | | 206,642,000 | |
| | | | |
| | | |
| | | |
| Cash and cash equivalents | 6,518,000 | | | 3,899,000 | |
| Restricted cash | 9,390,000 | | | 9,564,000 | |
| Receivables, net | 6,357,000 | | | 6,135,000 | |
| Deferred costs and other assets, net | 9,141,000 | | | 7,924,000 | |
| TOTAL ASSETS | $ | 233,082,000 | | | $ | 234,164,000 | |
| | | | |
| LIABILITIES AND EQUITY | | | |
| Loans payable, net | $ | 140,494,000 | | | $ | 131,462,000 | |
| Accounts payable, accrued expenses, and other liabilities | 8,382,000 | | | 10,094,000 | |
| Due to Wheeler Real Estate Investment Trust, Inc. | 8,094,000 | | | 7,328,000 | |
| Below market lease intangibles, net | 2,655,000 | | | 3,078,000 | |
| Total liabilities | 159,625,000 | | | 151,962,000 | |
| | | | |
| Commitments and contingencies (Note 10) | | | | | |
| | | | |
| Equity: | | | |
| Preferred stock | 159,541,000 | | | 159,541,000 | |
| Common stock ($0.06 par value, 150,000,000 shares authorized, 13,718,000 shares, issued and outstanding) | 823,000 | | | 823,000 | |
| Additional paid-in capital | 868,323,000 | | | 868,323,000 | |
| Cumulative distributions in excess of net income | (955,230,000) | | | (946,485,000) | |
| Total equity | 73,457,000 | | | 82,202,000 | |
| TOTAL LIABILITIES AND EQUITY | $ | 233,082,000 | | | $ | 234,164,000 | |
See accompanying notes to consolidated financial statements
47
��
CONSOLIDATED STATEMENTS OF OPERATIONS
| | | |
| | |
| | Years ended December 31, | | Years ended December 31, |
| | 2020 | | | 2019 | | | 2018 | |
REVENUES | | | | | | | | | | | | |
| REVENUES | |
| REVENUES | |
Rental revenues | | $ | 127,171,000 | | | $ | 142,719,000 | | | $ | 147,236,000 | |
Other | | | 8,367,000 | | | | 1,364,000 | | | | 4,784,000 | |
| Rental revenues | |
| Rental revenues | |
| Other revenues | |
| Other revenues | |
| Other revenues | |
| Total revenues | |
| Total revenues | |
Total revenues | | | 135,538,000 | | | | 144,083,000 | | | | 152,020,000 | |
EXPENSES | | | | | | | | | | | | |
| EXPENSES | |
| EXPENSES | |
| Operating, maintenance and management | |
| Operating, maintenance and management | |
Operating, maintenance and management | | | 25,545,000 | | | | 27,593,000 | | | | 27,771,000 | |
Real estate and other property-related taxes | | | 20,051,000 | | | | 20,754,000 | | | | 20,123,000 | |
General and administrative | | | 16,865,000 | | | | 18,804,000 | | | | 16,915,000 | |
| Real estate and other property-related taxes | |
| Real estate and other property-related taxes | |
| Corporate general and administrative | |
| Corporate general and administrative | |
| Corporate general and administrative | |
| Depreciation and amortization | |
| Depreciation and amortization | |
Depreciation and amortization | | | 48,412,000 | | | | 45,861,000 | | | | 40,053,000 | |
Total expenses | | | 110,873,000 | | | | 113,012,000 | | | | 104,862,000 | |
| Total expenses | |
| Total expenses | |
| | |
| | |
| | | | | | | | | | | | |
OTHER | | | | | | | | | | | | |
Gain on sales | | | 4,396,000 | | | | 2,942,000 | | | | 4,864,000 | |
| OTHER | |
| OTHER | |
| Gain on sale | |
| Gain on sale | |
| Gain on sale | |
| Transaction costs | |
| Transaction costs | |
| Transaction costs | |
| Impairment charges | |
| Impairment charges | |
Impairment charges | | | (7,607,000 | ) | | | (8,938,000 | ) | | | (20,689,000 | ) |
Total other | | | (3,211,000 | ) | | | (5,996,000 | ) | | | (15,825,000 | ) |
| Total other | |
| Total other | |
| | | | | | | | | | | | |
OPERATING INCOME | | | 21,454,000 | | | | 25,075,000 | | | | 31,333,000 | |
| | |
| | |
| OPERATING INCOME (LOSS) | |
| OPERATING INCOME (LOSS) | |
| OPERATING INCOME (LOSS) | |
| | |
| | |
| | | | | | | | | | | | |
NON-OPERATING INCOME AND EXPENSES | | | | | | | | | | | | |
Interest expense | | | (21,974,000 | ) | | | (23,509,000 | ) | | | (22,146,000 | ) |
Early extinguishment of debt costs | | | - | | | | - | | | | (4,829,000 | ) |
| NON-OPERATING INCOME AND EXPENSES | |
| NON-OPERATING INCOME AND EXPENSES | |
| Interest expense, net | |
| Interest expense, net | |
| Interest expense, net | |
| Total non-operating income and expenses | |
| Total non-operating income and expenses | |
Total non-operating income and expenses | | | (21,974,000 | ) | | | (23,509,000 | ) | | | (26,975,000 | ) |
| | | | | | | | | | | | |
NET (LOSS) INCOME | | | (520,000 | ) | | | 1,566,000 | | | | 4,358,000 | |
| | | | | | | | | | | | |
Net (income) loss attributable to noncontrolling interests: | | | | | | | | | | | | |
Minority interests in consolidated joint ventures | | | (618,000 | ) | | | (547,000 | ) | | | (497,000 | ) |
| | |
| NET INCOME (LOSS) FROM CONTINUING OPERATIONS | |
| NET INCOME (LOSS) FROM CONTINUING OPERATIONS | |
| NET INCOME (LOSS) FROM CONTINUING OPERATIONS | |
| | |
| | |
| | |
| DISCONTINUED OPERATIONS | |
| DISCONTINUED OPERATIONS | |
| DISCONTINUED OPERATIONS | |
| Income from discontinued operations | |
| Income from discontinued operations | |
| Income from discontinued operations | |
| Impairment charges | |
| Impairment charges | |
| Impairment charges | |
| Gain on sales | |
| Gain on sales | |
| Gain on sales | |
| Total income from discontinued operations | |
| Total income from discontinued operations | |
| Total income from discontinued operations | |
| | |
| | |
| | |
| NET INCOME | |
| NET INCOME | |
| NET INCOME | |
| | |
| | |
| | |
| Net income attributable to noncontrolling interests: | |
| Net income attributable to noncontrolling interests: | |
| Net income attributable to noncontrolling interests: | |
| Limited partners' interest in Operating Partnership | | | 66,000 | | | | 57,000 | | | | 28,000 | |
Total net (income) attributable to noncontrolling interests | | | (552,000 | ) | | | (490,000 | ) | | | (469,000 | ) |
| | | | | | | | | | | | |
NET (LOSS) INCOME ATTRIBUTABLE TO CEDAR REALTY TRUST, INC. | | | (1,072,000 | ) | | | 1,076,000 | | | | 3,889,000 | |
| Limited partners' interest in Operating Partnership | |
| | Limited partners' interest in Operating Partnership | |
| Total net income attributable to noncontrolling interests | |
| Total net income attributable to noncontrolling interests | |
| Total net income attributable to noncontrolling interests | |
| | |
| | |
| | |
| NET INCOME ATTRIBUTABLE TO CEDAR REALTY TRUST, INC. | |
| NET INCOME ATTRIBUTABLE TO CEDAR REALTY TRUST, INC. | |
| NET INCOME ATTRIBUTABLE TO CEDAR REALTY TRUST, INC. | |
| | |
| | |
| | | | | | | | | | | | |
Preferred stock dividends | | | (10,752,000 | ) | | | (10,752,000 | ) | | | (10,863,000 | ) |
Preferred stock redemption costs | | | - | | | | - | | | | (3,507,000 | ) |
| Preferred stock dividends | |
| Preferred stock dividends | |
| | | | | | | | | | | | |
NET (LOSS) ATTRIBUTABLE TO COMMON SHAREHOLDERS | | $ | (11,824,000 | ) | | $ | (9,676,000 | ) | | $ | (10,481,000 | ) |
| | | | | | | | | | | | |
NET (LOSS) PER COMMON SHARE ATTRIBUTABLE TO COMMON SHAREHOLDERS (BASIC AND DILUTED): | | $ | (0.92 | ) | | $ | (0.78 | ) | | $ | (0.83 | ) |
| | |
| NET (LOSS) INCOME ATTRIBUTABLE TO COMMON SHAREHOLDERS | |
| NET (LOSS) INCOME ATTRIBUTABLE TO COMMON SHAREHOLDERS | |
| NET (LOSS) INCOME ATTRIBUTABLE TO COMMON SHAREHOLDERS | |
| | |
| | |
| | |
| NET (LOSS) INCOME PER COMMON SHARE ATTRIBUTABLE TO COMMON SHAREHOLDERS (BASIC AND DILUTED): | |
| NET (LOSS) INCOME PER COMMON SHARE ATTRIBUTABLE TO COMMON SHAREHOLDERS (BASIC AND DILUTED): | |
| NET (LOSS) INCOME PER COMMON SHARE ATTRIBUTABLE TO COMMON SHAREHOLDERS (BASIC AND DILUTED): | |
| Continuing operations | |
| Continuing operations | |
| Continuing operations | |
| Discontinued operations | |
| Discontinued operations | |
| Discontinued operations | |
| | |
| | |
| | |
| | |
| | |
| | | | | | | | | | | | |
Weighted average number of common shares - basic and diluted | | | 13,104,000 | | | | 13,082,000 | | | | 13,397,000 | |
| | | | | | | | | | | | |
| Weighted average number of common shares - basic and diluted | |
| Weighted average number of common shares - basic and diluted | |
See accompanying notes to consolidated financial statements
CONSOLIDATED STATEMENTS OF COMPREHENSIVE INCOME
| | Years ended December 31, | |
| | 2020 | | | 2019 | | | 2018 | |
| | | | | | | | | | | | |
Net (loss) income | | $ | (520,000 | ) | | $ | 1,566,000 | | | $ | 4,358,000 | |
| | | | | | | | | | | | |
Unrealized (loss) gain on change in fair value of cash flow hedges | | | (11,878,000 | ) | | | (14,286,000 | ) | | | 1,518,000 | |
| | | | | | | | | | | | |
Comprehensive (loss) income | | | (12,398,000 | ) | | | (12,720,000 | ) | | | 5,876,000 | |
| | | | | | | | | | | | |
Comprehensive (income) attributable to noncontrolling interests | | | (481,000 | ) | | | (404,000 | ) | | | (490,000 | ) |
| | | | | | | | | | | | |
Comprehensive (loss) income attributable to Cedar Realty Trust, Inc. | | $ | (12,879,000 | ) | | $ | (13,124,000 | ) | | $ | 5,386,000 | |
| | | | | | | | | | | | |
| | | | | | | | | | | | | |
| Years ended December 31, |
| 2023 | | 2022 | | |
| | | | | |
| Net income | $ | 2,007,000 | | | $ | 44,163,000 | | | |
| | | | | |
| Unrealized gain on change in fair value of cash flow hedges | — | | | 8,321,000 | | | |
| | | | | |
| Comprehensive income | 2,007,000 | | | 52,484,000 | | | |
| | | | | |
| Comprehensive income attributable to noncontrolling interests | — | | | (195,000) | | | |
| | | | | |
| Comprehensive income attributable to Cedar Realty Trust, Inc. | $ | 2,007,000 | | | $ | 52,289,000 | | | |
See accompanying notes to consolidated financial statements
CONSOLIDATED
STATEMENTSTATEMENTS OF EQUITY
Years ended December 31,
2020, 20192023 and
20182022 | | | | | | | | | | | | | | | | | | | | | | | | | | Cumulative | | | Accumulated | | | | | |
| | | | | | | | | | | | | | | | | | Treasury | | | Additional | | | distributions | | | other | | | | | | | | | | | | | | | Treasury
stock,
at cost | | Additional
paid-in
capital | | Cumulative
distributions
in excess of
net income | | Accumulated
other
comprehensive
(income) loss | | Total |
| | Preferred stock | | | Common stock | | | stock, | | | paid-in | | | in excess of | | | comprehensive | | | | | |
| | Shares | | | Amount | | | Shares | | | Amount | | | at cost | | | capital | | | net income | | | income (loss) | | | Total | |
BALANCE, DECEMBER 31, 2017 | | | 8,450,000 | | | $ | 207,508,000 | | | | 13,836,000 | | | $ | 830,000 | | | $ | (18,463,000 | ) | | $ | 879,711,000 | | | $ | (446,944,000 | ) | | $ | 5,694,000 | | | $ | 628,336,000 | |
Net (loss) income | | | — | | | | — | | | | — | | | | — | | | | — | | | | — | | | | 3,889,000 | | | | — | | | | 3,889,000 | |
| | |
| | |
| | Balance, December 31, 2021 | |
| | Balance, December 31, 2021 | |
| | Balance, December 31, 2021 | |
| Net income | | Net income | — | | — | | 44,031,000 | | — | | 44,031,000 |
Unrealized gain on change in fair value of cash flow hedges | | | — | | | | — | | | | — | | | | — | | | | — | | | | — | | | | — | | | | 1,497,000 | | | | 1,497,000 | | Unrealized gain on change in fair value of cash flow hedges | — | | — | | 8,258,000 |
Share-based compensation, net | | | — | | | | — | | | | (17,000 | ) | | | (1,000 | ) | | | 1,891,000 | | | | 1,461,000 | | | | — | | | | — | | | | 3,351,000 | | Share-based compensation, net | — | | — | | (103,000) | | (6,000) | | 13,266,000 | | (12,300,000) | | — | | 960,000 |
Redemptions of Series B Shares | | | (2,000,000 | ) | | | (47,967,000 | ) | | | — | | | | — | | | | — | | | | 1,458,000 | | | | (3,507,000 | ) | | | — | | | | (50,016,000 | ) |
Common stock sales, net of issuance expenses | | | — | | | | — | | | | — | | | | — | | | | — | | | | 9,000 | | | | — | | | | — | | | | 9,000 | |
Common stock repurchases | | | — | | | | — | | | | (117,000 | ) | | | (7,000 | ) | | | — | | | | (2,322,000 | ) | | | — | | | | — | | | | (2,329,000 | ) |
| Purchase of OP Units | | Purchase of OP Units | — | | — |
Preferred stock dividends | | | — | | | | — | | | | — | | | | — | | | | — | | | | — | | | | (10,863,000 | ) | | | — | | | | (10,863,000 | ) | Preferred stock dividends | — | | — | | (10,752,000) | | — | | (10,752,000) |
Distributions to common shareholders/noncontrolling interests | | | — | | | | — | | | | — | | | | — | | | | — | | | | — | | | | (18,301,000 | ) | | | — | | | | (18,301,000 | ) |
Redemption of OP Units | | | — | | | | — | | | | — | | | | — | | | | — | | | | — | | | | — | | | | — | | | | — | |
Issuance of OP Units | | | — | | | | — | | | | — | | | | — | | | | — | | | | — | | | | — | | | | — | | | | — | |
Reallocation adjustment of limited partners' interest | | | — | | | | — | | | | — | | | | — | | | | — | | | | (148,000 | ) | | | — | | | | — | | | | (148,000 | ) |
BALANCE, DECEMBER 31, 2018 | | | 6,450,000 | | | | 159,541,000 | | | | 13,702,000 | | | | 822,000 | | | | (16,572,000 | ) | | | 880,169,000 | | | | (475,726,000 | ) | | | 7,191,000 | | | | 555,425,000 | |
Prior period adjustment - adoption of lease accounting standard | | | — | | | | — | | | | — | | | | — | | | | — | | | | — | | | | (515,000 | ) | | | — | | | | (515,000 | ) |
BALANCE, DECEMBER 31, 2018, RESTATED | | | 6,450,000 | | | | 159,541,000 | | | | 13,702,000 | | | | 822,000 | | | | (16,572,000 | ) | | | 880,169,000 | | | | (476,241,000 | ) | | | 7,191,000 | | | | 554,910,000 | |
Net (loss) income | | | — | | | | — | | | | — | | | | — | | | | — | | | | — | | | | 1,076,000 | | | | — | | | | 1,076,000 | |
Unrealized (loss) on change in fair value of cash flow hedges | | | — | | | | — | | | | — | | | | — | | | | — | | | | — | | | | — | | | | (14,200,000 | ) | | | (14,200,000 | ) |
Share-based compensation, net | | | — | | | | — | | | | 95,000 | | | | 6,000 | | | | 261,000 | | | | 3,862,000 | | | | — | | | | — | | | | 4,129,000 | |
Common stock sales, net of issuance expenses | | | — | | | | — | | | | 2,000 | | | | — | | | | — | | | | 23,000 | | | | — | | | | — | | | | 23,000 | |
Common stock repurchases | | | — | | | | — | | | | (311,000 | ) | | | (19,000 | ) | | | — | | | | (6,825,000 | ) | | | — | | | | — | | | | (6,844,000 | ) |
Preferred stock dividends | | | — | | | | — | | | | — | | | | — | | | | — | | | | — | | | | (10,752,000 | ) | | | — | | | | (10,752,000 | ) |
Distributions to common shareholders/noncontrolling interests | | | — | | | | — | | | | — | | | | — | | | | — | | | | — | | | | (17,808,000 | ) | | | — | | | | (17,808,000 | ) |
Redemption of OP Units | | | — | | | | — | | | | — | | | | — | | | | — | | | | — | | | | — | | | | — | | | | — | |
Reallocation adjustment of limited partners' interest | | | — | | | | — | | | | — | | | | — | | | | — | | | | 27,000 | | | | — | | | | — | | | | 27,000 | |
BALANCE, DECEMBER 31, 2019 | | | 6,450,000 | | | | 159,541,000 | | | | 13,488,000 | | | | 809,000 | | | | (16,311,000 | ) | | | 877,256,000 | | | | (503,725,000 | ) | | | (7,009,000 | ) | | | 510,561,000 | |
Net income (loss) | | | — | | | | — | | | | — | | | | — | | | | — | | | | — | | | | (1,072,000 | ) | | | — | | | | (1,072,000 | ) |
Unrealized (loss) on change in fair value of cash flow hedges | | | — | | | | — | | | | — | | | | — | | | | — | | | | — | | | | — | | | | (11,807,000 | ) | | | (11,807,000 | ) |
Share-based compensation, net | | | — | | | | — | | | | 40,000 | | | | 3,000 | | | | 1,178,000 | | | | 2,528,000 | | | | — | | | | — | | | | 3,709,000 | |
Common stock sales, net of issuance expenses | | | — | | | | — | | | | 2,000 | | | | — | | | | — | | | | 13,000 | | | | — | | | | — | | | | 13,000 | |
Preferred stock dividends | | | — | | | | — | | | | — | | | | — | | | | — | | | | — | | | | (10,752,000 | ) | | | — | | | | (10,752,000 | ) |
| Acquisition of minority interests | | Acquisition of minority interests | — | | — | | (1,000,000) | | — | | (1,000,000) |
Distributions to common shareholders/noncontrolling interests | | | — | | | | — | | | | — | | | | — | | | | — | | | | — | | | | (7,147,000 | ) | | | — | | | | (7,147,000 | ) | Distributions to common shareholders/noncontrolling interests | — | | — | | (397,300,000) | | — | | (397,300,000) |
Reallocation adjustment of limited partners' interest | | | — | | | | — | | | | — | | | | — | | | | — | | | | (7,000 | ) | | | — | | | | — | | | | (7,000 | ) | Reallocation adjustment of limited partners' interest | — | | — | | 622,000 | | — | | 622,000 |
BALANCE, DECEMBER 31, 2020 | | | 6,450,000 | | | $ | 159,541,000 | | | | 13,530,000 | | | $ | 812,000 | | | $ | (15,133,000 | ) | | $ | 879,790,000 | | | $ | (522,696,000 | ) | | $ | (18,816,000 | ) | | $ | 483,498,000 | |
| Common stock sales, net of issuance expenses | | Common stock sales, net of issuance expenses | — | | — | | 1,000 | | — | | 1,000 |
| Common stock issuance | | Common stock issuance | — | | — | | 114,000 | | 7,000 | | — | | (7,000) | | — |
| Common stock repurchases | | Common stock repurchases | — | | — | | (13,669,000) | | (821,000) | | — | | 821,000 | | — |
| Common stock issued to Wheeler Real Estate Investment Trust, Inc. | | Common stock issued to Wheeler Real Estate Investment Trust, Inc. | — | | — | | 13,718,000 | | 823,000 | | — | | (823,000) | | — |
| Balance, December 31, 2022 | |
| Net income | |
| Preferred stock dividends | |
| Balance, December 31, 2023 | |
CONSOLIDATED
STATEMENTSTATEMENTS OF EQUITY
Years ended December 31,
2020, 20192023 and
20182022
| | Noncontrolling Interests | | | | | |
| | Minority | | | | | | | | | | | | | | | Noncontrolling Interests | | |
| | interests in | | | Limited | | | | | | | | | | | Minority interests in consolidated joint ventures | | Limited partners' interest in Operating Partnership | | Total | | Total
equity |
| | consolidated | | | partners' | | | | | | | Total | |
| | joint ventures | | | OP Units | | | Total | | | equity | |
BALANCE, DECEMBER 31, 2017 | | $ | (609,000 | ) | | $ | 2,384,000 | | | $ | 1,775,000 | | | $ | 630,111,000 | |
Net (loss) income | | | 497,000 | | | | (28,000 | ) | | | 469,000 | | | | 4,358,000 | |
| | Balance, December 31, 2021 | |
| | Balance, December 31, 2021 | |
| | Balance, December 31, 2021 | |
| Net income | |
Unrealized gain on change in fair value of cash flow hedges | | | — | | | | 21,000 | | | | 21,000 | | | | 1,518,000 | |
Share-based compensation, net | | | — | | | | — | | | | — | | | | 3,351,000 | |
Redemptions of Series B Shares | | | — | | | | — | | | | — | | | | (50,016,000 | ) |
Common stock sales, net of issuance expenses | | | — | | | | — | | | | — | | | | 9,000 | |
Common stock repurchases | | | — | | | | — | | | | — | | | | (2,329,000 | ) |
| Purchase of OP Units | |
Preferred stock dividends | | | — | | | | — | | | | — | | | | (10,863,000 | ) |
Distributions to common shareholders/noncontrolling interests | | | — | | | | (90,000 | ) | | | (90,000 | ) | | | (18,391,000 | ) |
Redemption of OP Units | | | — | | | | (7,000 | ) | | | (7,000 | ) | | | (7,000 | ) |
Issuance of OP Units | | | — | | | | 975,000 | | | | 975,000 | | | | 975,000 | |
Reallocation adjustment of limited partners' interest | | | — | | | | 148,000 | | | | 148,000 | | | | — | |
BALANCE, DECEMBER 31, 2018 | | | (112,000 | ) | | | 3,403,000 | | | | 3,291,000 | | | | 558,716,000 | |
Prior period adjustment - adoption of lease accounting standard | | | — | | | | — | | | | — | | | | (515,000 | ) |
BALANCE, DECEMBER 31, 2018, RESTATED | | | (112,000 | ) | | | 3,403,000 | | | | 3,291,000 | | | | 558,201,000 | |
Net (loss) income | | | 547,000 | | | | (57,000 | ) | | | 490,000 | | | | 1,566,000 | |
Unrealized (loss) on change in fair value of cash flow hedges | | | — | | | | (86,000 | ) | | | (86,000 | ) | | | (14,286,000 | ) |
Share-based compensation, net | | | — | | | | — | | | | — | | | | 4,129,000 | |
Common stock sales, net of issuance expenses | | | — | �� | | | — | | | | — | | | | 23,000 | |
Common stock repurchases | | | — | | | | — | | | | — | | | | (6,844,000 | ) |
Preferred stock dividends | | | — | | | | — | | | | — | | | | (10,752,000 | ) |
Distributions to common shareholders/noncontrolling interests | | | — | | | | (111,000 | ) | | | (111,000 | ) | | | (17,919,000 | ) |
Redemption of OP Units | | | — | | | | (43,000 | ) | | | (43,000 | ) | | | (43,000 | ) |
Reallocation adjustment of limited partners' interest | | | — | | | | (27,000 | ) | | | (27,000 | ) | | | — | |
BALANCE, DECEMBER 31, 2019 | | | 435,000 | | | | 3,079,000 | | | | 3,514,000 | | | | 514,075,000 | |
Net income (loss) | | | 618,000 | | | | (66,000 | ) | | | 552,000 | | | | (520,000 | ) |
Unrealized (loss) on change in fair value of cash flow hedges | | | — | | | | (71,000 | ) | | | (71,000 | ) | | | (11,878,000 | ) |
Share-based compensation, net | | | — | | | | — | | | | — | | | | 3,709,000 | |
Common stock sales, net of issuance expenses | | | — | | | | — | | | | — | | | | 13,000 | |
Preferred stock dividends | | | — | | | | — | | | | — | | | | (10,752,000 | ) |
| Acquisition of minority interests | |
Distributions to common shareholders/noncontrolling interests | | | — | | | | (42,000 | ) | | | (42,000 | ) | | | (7,189,000 | ) |
Reallocation adjustment of limited partners' interest | | | — | | | | 7,000 | | | | 7,000 | | | | — | |
BALANCE, DECEMBER 31, 2020 | | $ | 1,053,000 | | | $ | 2,907,000 | | | $ | 3,960,000 | | | $ | 487,458,000 | |
| Common stock sales, net of issuance expenses | |
| Common stock issuance | |
| Common stock repurchases | |
| Common stock issued to Wheeler Real Estate Investment Trust, Inc. | |
| Balance, December 31, 2022 | |
| Net income | |
| Preferred stock dividends | |
| Balance, December 31, 2023 | |
See accompanying notes to consolidated financial statements
CONSOLIDATED STATEMENTS OF CASH FLOWS
| | | |
| | |
| | Years ended December 31, | | Years ended December 31, |
| | 2020 | | | 2019 | | | 2018 | |
OPERATING ACTIVITIES | | | | | | | | | | | | |
Net (loss) income | | $ | (520,000 | ) | | $ | 1,566,000 | | | $ | 4,358,000 | |
Adjustments to reconcile net (loss) income to net cash provided by operating activities: | | | | | | | | | | | | |
| OPERATING ACTIVITIES | |
| OPERATING ACTIVITIES | |
| Net income | |
| Net income | |
| Net income | |
| Adjustments to reconcile net income to net cash provided by operating activities: | |
| Adjustments to reconcile net income to net cash provided by operating activities: | |
| Adjustments to reconcile net income to net cash provided by operating activities: | |
| Gain on sales | |
| Gain on sales | |
Gain on sales | | | (4,396,000 | ) | | | (2,942,000 | ) | | | (4,864,000 | ) |
Impairment charges | | | 7,607,000 | | | | 8,938,000 | | | | 20,689,000 | |
Extinguishment of debt costs | | | — | | | | — | | | | 4,829,000 | |
| Impairment charges | |
| Impairment charges | |
Straight-line rents and expenses, net | | | 1,279,000 | | | | (265,000 | ) | | | (1,142,000 | ) |
Provision for doubtful accounts | | | 1,478,000 | | | | 412,000 | | | | 2,273,000 | |
| Straight-line rents and expenses, net | |
| Straight-line rents and expenses, net | |
| Credit adjustments on operating lease receivables | |
| Credit adjustments on operating lease receivables | |
| Credit adjustments on operating lease receivables | |
Depreciation and amortization | | | 48,412,000 | | | | 45,861,000 | | | | 40,053,000 | |
Amortization of intangible lease liabilities, net | | | (1,373,000 | ) | | | (2,827,000 | ) | | | (4,361,000 | ) |
| Depreciation and amortization | |
| Depreciation and amortization | |
| Above (below) market lease amortization, net | |
| Above (below) market lease amortization, net | |
| Above (below) market lease amortization, net | |
Expense relating to share-based compensation, net | | | 3,723,000 | | | | 4,117,000 | | | | 3,763,000 | |
Amortization of premium on mortgage loans payable | | | — | | | | — | | | | (80,000 | ) |
| Expense relating to share-based compensation, net | |
| Expense relating to share-based compensation, net | |
| Amortization of deferred financing costs | |
| Amortization of deferred financing costs | |
Amortization of deferred financing costs | | | 1,331,000 | | | | 1,286,000 | | | | 1,224,000 | |
Changes in operating assets and liabilities, net of effects of acquisitions and dispositions: | | | | | | | | | | | | |
Rents and other receivables | | | (2,811,000 | ) | | | (812,000 | ) | | | (3,902,000 | ) |
Prepaid expenses and other | | | (9,216,000 | ) | | | (3,037,000 | ) | | | (6,591,000 | ) |
Accounts payable and accrued liabilities | | | (2,934,000 | ) | | | 1,378,000 | | | | 1,651,000 | |
Net cash provided by operating activities | | | 42,580,000 | | | | 53,675,000 | | | | 57,900,000 | |
| Changes in operating assets and liabilities, net of effects of acquisitions and dispositions: | |
| Changes in operating assets and liabilities, net of effects of acquisitions and dispositions: | |
| Receivables, net | |
| Receivables, net | |
| Receivables, net | |
| Deferred costs and other assets, net | |
| Deferred costs and other assets, net | |
| Deferred costs and other assets, net | |
| Accounts payable, accrued expenses, and other liabilities | |
| Accounts payable, accrued expenses, and other liabilities | |
| Accounts payable, accrued expenses, and other liabilities | |
| Net cash provided by (used in) operating activities | |
| Net cash provided by (used in) operating activities | |
| Net cash provided by (used in) operating activities | |
| | |
| | |
| | | | | | | | | | | | |
INVESTING ACTIVITIES | | | | | | | | | | | | |
| INVESTING ACTIVITIES | |
| INVESTING ACTIVITIES | |
| Expenditures for real estate improvements | |
| Expenditures for real estate improvements | |
Expenditures for real estate improvements | | | (39,551,000 | ) | | | (31,910,000 | ) | | | (30,377,000 | ) |
Net proceeds from sales of real estate | | | 21,182,000 | | | | 18,651,000 | | | | 19,118,000 | |
Acquisition of real estate | | | — | | | | (9,083,000 | ) | | | (179,000 | ) |
Issuance of mortgage note receivable | | | — | | | | — | | | | (3,500,000 | ) |
Net cash (used in) investing activities | | | (18,369,000 | ) | | | (22,342,000 | ) | | | (14,938,000 | ) |
| Net proceeds from sales of real estate | |
| Net proceeds from sales of real estate | |
| Contributions to unconsolidated joint venture | |
| Contributions to unconsolidated joint venture | |
| Contributions to unconsolidated joint venture | |
| Net cash (used in) provided by investing activities | |
| Net cash (used in) provided by investing activities | |
| Net cash (used in) provided by investing activities | |
| | |
| | |
| | | | | | | | | | | | |
FINANCING ACTIVITIES | | | | | | | | | | | | |
| FINANCING ACTIVITIES | |
| FINANCING ACTIVITIES | |
| Repayments under revolving credit facility | |
| Repayments under revolving credit facility | |
Repayments under revolving credit facility | | | (104,000,000 | ) | | | (21,000,000 | ) | | | (123,500,000 | ) |
Advances under revolving credit facility | | | 173,000,000 | | | | 27,000,000 | | | | 168,500,000 | |
Repayment under term loan | | | (75,000,000 | ) | | | — | | | | — | |
Advance under term loan | | | — | | | | — | | | | 75,000,000 | |
| Advances under revolving credit facility | |
| Advances under revolving credit facility | |
| Repayment of term note | |
| Repayment of term note | |
| Repayment of term note | |
| Proceeds (termination payment) related to interest rate swap | |
| Proceeds (termination payment) related to interest rate swap | |
| Proceeds (termination payment) related to interest rate swap | |
| Mortgage proceeds | |
| Mortgage proceeds | |
| Mortgage proceeds | |
Mortgage repayments | | | (1,067,000 | ) | | | (1,027,000 | ) | | | (80,330,000 | ) |
Payment of early extinguishment of debt costs | | | — | | | | — | | | | (5,159,000 | ) |
Payments of debt financing costs | | | (326,000 | ) | | | — | | | | (705,000 | ) |
| Mortgage repayments | |
| Mortgage repayments | |
| Payments of deferred financing costs | |
| Payments of deferred financing costs | |
| Payments of deferred financing costs | |
| Noncontrolling interests: | |
| Noncontrolling interests: | |
Noncontrolling interests: | | | | | | | | | | | | |
Distributions to limited partners | | | (42,000 | ) | | | (111,000 | ) | | | (90,000 | ) |
Redemption of OP Units | | | — | | | | (43,000 | ) | | | (7,000 | ) |
Redemption on preferred stock | | | — | | | | — | | | | (50,016,000 | ) |
Common stock sales less issuance expenses, net | | | 13,000 | | | | 22,000 | | | | 9,000 | |
Common stock repurchases | | | — | | | | (6,844,000 | ) | | | (2,329,000 | ) |
| Distributions to limited partners | |
| Distributions to limited partners | |
| Acquisition of joint venture minority interest share | |
| Acquisition of joint venture minority interest share | |
| Acquisition of joint venture minority interest share | |
| Redemption of OP units | |
| Redemption of OP units | |
| Redemption of OP units | |
| Preferred stock dividends | |
| Preferred stock dividends | |
Preferred stock dividends | | | (10,752,000 | ) | | | (10,752,000 | ) | | | (11,276,000 | ) |
Distributions to common shareholders | | | (7,147,000 | ) | | | (17,808,000 | ) | | | (18,301,000 | ) |
Net cash (used in) financing activities | | | (25,321,000 | ) | | | (30,563,000 | ) | | | (48,204,000 | ) |
| Distributions to common shareholders | |
| Distributions to common shareholders | |
| Net cash used in financing activities | |
| Net cash used in financing activities | |
| Net cash used in financing activities | |
| | | | | | | | | | | | |
Net (decrease) increase in cash, cash equivalents and restricted cash | | | (1,110,000 | ) | | | 770,000 | | | | (5,242,000 | ) |
| | |
| | |
| Net increase in cash, cash equivalents and restricted cash | |
| Net increase in cash, cash equivalents and restricted cash | |
| Net increase in cash, cash equivalents and restricted cash | |
| Cash, cash equivalents and restricted cash at beginning of year | |
| Cash, cash equivalents and restricted cash at beginning of year | |
Cash, cash equivalents and restricted cash at beginning of year | | | 2,747,000 | | | | 1,977,000 | | | | 7,219,000 | |
Cash, cash equivalents and restricted cash at end of year | | $ | 1,637,000 | | | $ | 2,747,000 | | | $ | 1,977,000 | |
| Cash, cash equivalents and restricted cash at end of year | |
| Cash, cash equivalents and restricted cash at end of year | |
| | |
| | |
| | | | | | | | | | | | |
Reconciliation to consolidated balance sheets: | | | | | | | | | | | | |
| Reconciliation to consolidated balance sheets: | |
| Reconciliation to consolidated balance sheets: | |
| Cash and cash equivalents | |
| Cash and cash equivalents | |
Cash and cash equivalents | | $ | 1,637,000 | | | $ | 2,747,000 | | | $ | 1,977,000 | |
Restricted cash | | | — | | | | — | | | | — | |
| Restricted cash | |
| Restricted cash | |
Cash, cash equivalents and restricted cash | | $ | 1,637,000 | | | $ | 2,747,000 | | | $ | 1,977,000 | |
| Cash, cash equivalents and restricted cash | |
| Cash, cash equivalents and restricted cash | |
See
See accompanying notes to consolidated financial statements52
Notes to Consolidated Financial Statements
December 31, 20202023
Note 1. Business and Organization
Cedar Realty Trust, Inc. (the "Company")
The Company is a
real estate investment trust ("REIT")REIT that focuses
primarily on
ownership, operationowning and
redevelopment ofoperating income producing retail properties with a primary focus on grocery-anchored shopping centers
primarily in
high-density urban markets from Washington, D.C. to Boston.the Northeast. At December 31,
2020,2023, the Company owned
and managed a portfolio of
54 operating19 properties. Seven of these properties
(excluding properties “held for sale”).Cedar Realty Trustare located in Pennsylvania, four in Massachusetts, three in Connecticut, three in New Jersey, one in Maryland and one in Virginia.
The Company, organized as a Maryland corporation, has established an umbrella partnership structure through the contribution of substantially all of its assets to the Operating Partnership,
L.P. (the "Operating Partnership")organized as a limited partnership under the laws of Delaware. The Operating Partnership is the entity through which the Company conducts substantially all of its business and owns (either directly or through subsidiaries) substantially all of its assets. At December 31,
2020,2023, the Company,
which is a subsidiary of WHLR, owned a
99.4% general and limited partnership100.0% interest in, and was the sole general partner of, the Operating Partnership.
The limited partners’ interest in the Operating Partnership (0.6% at December 31, 2020) is represented by partnership units in the Operating Partnership (“OP Units”). The carrying amount of such interest is adjusted at the end of each reporting period to an amount equal to the limited partners’ ownership percentage of the Operating Partnership’s net equity. The 81,000 OP Units are economically equivalent to the Company’s common stock. The holders of OP Units have the right to exchange their OP Units for the same number of shares of the Company’s common stock or, at the Company’s option, for cash. Unless specifically noted otherwise, all references to OP Units exclude limited partnership units held by the Company. As used herein, the "Company" refers to Cedar Realty Trust, Inc. and its subsidiaries on a consolidated basis, including the Operating Partnership or, where the context so requires, Cedar Realty Trust, Inc. only.
Asset Sale and Merger
On March 2, 2022, the Company entered into definitive agreements for the sale of the Company and its assets in a series of related all-cash transactions. Specifically, the Company and certain of its subsidiaries entered into the Asset Purchase Agreement with the Grocery-Anchored Purchasers for the sale of a portfolio of 33 grocery-anchored shopping centers for cash. In addition, the Company entered into the Merger Agreement with WHLR and certain of its affiliates pursuant to which, following closing of the Grocery-Anchored Portfolio Sale, WHLR acquired the balance of the Company's shopping center assets by way of an all-cash merger transaction. The Transactions were unanimously approved by the Company's former Board of Directors and were approved by the Company's common stockholders at a special meeting of stockholders held on May 27, 2022.
On July 7, 2022, the Company and certain of its subsidiaries completed the Grocery-Anchored Portfolio Sale and the East River Park and Senator Square redevelopment asset sales for total gross proceeds of approximately $879 million, including the assumed debt. There were no material relationships among the Company, the Grocery-Anchored Purchasers, or any of their respective affiliates. On August 22, 2022, the Company completed the Merger. Each outstanding share of common stock of the Company and outstanding common unit of the Operating Partnership held by persons other than the Company immediately prior to the Merger were canceled and converted into the right to receive a cash payment of $9.48 per share or unit. As a result of the Merger, WHLR acquired all of the outstanding shares of the Company's common stock, which ceased to be publicly traded on the NYSE. The Company's outstanding 7.25% Series B Preferred Stock and 6.50% Series C Preferred Stock remain outstanding and continue to trade on the NYSE. In addition, prior to consummation of the Merger, the Company's Board of Directors declared a special dividend on shares of the Company's outstanding common stock and OP Units of $19.52 per share, payable to holders of record of the Company's common stock and OP Units at the close of business on August 19, 2022.
In connection with the Transactions, the Company incurred transaction costs of $59.0 million for the year ended December 31, 2022, included in the accompanying consolidated statement of operations, of which $33.5 million relates to employee severance payments.
Note 2. Summary of Significant Accounting Policies
Reverse Stock Split
On November 25, 2020, the Company effected a 1-for-6.6 reverse stock split of the issued and outstanding shares of common stock. Each 6.6 shares of the Company's issued and outstanding common stock were combined into one share of the Company's common stock. The number of authorized shares and the par value of the common stock were not changed. In addition, the Company amended the Limited Partnership Agreement of our Operating Partnership to effect a corresponding reverse split of the partnership interests of the Operating Partnership. In accordance with accounting principles generally accepted in the United States (“GAAP”), all shares of common stock, restricted stock units, OP Units and per share/unit information that are presented in this Form 10-K were adjusted to reflect the reverse split on a retroactive basis for all periods presented.
Principles of Consolidation/Basis of Preparation
The consolidated financial statements include the accounts and operations of the Company, the Operating Partnership, its subsidiaries, and certain joint venture partnerships in which it participates. The Company consolidates all variable interest entities (“VIEs”("VIEs") for which it is the primary beneficiary. Generally, a VIE is an entity with one or more of the following characteristics: (1) the total equity investment at risk is not sufficient to permit the entity to finance its activities without additional subordinated financial support, (2) as a group, the holders of the equity investment at risk (a) lack the power through voting or similar rights to make decisions about the entity’sentity's activities that significantly impact the entity’sentity's performance, (b) have no obligation to absorb the expected losses of the entity, or (c) have no right to receive the expected residual returns of the entity, or (3) the equity investors have voting rights that are not proportional to their economic interests, and substantially all of the entity’sentity's activities either involve, or are conducted on behalf of, an investor that has disproportionately fewer voting rights. A VIE is required to be consolidated by its primary
Cedar Realty Trust, Inc.
Notes to Consolidated Financial Statements
December 31, 2023
beneficiary. The primary beneficiary of a VIE has (1) the power to direct the activities that most significantly impact the
entity’sentity's economic performance, and (2) the obligation to absorb losses of the VIE or the right to receive benefits from the VIE that could be significant to the VIE.
Significant judgments related to these determinations include estimates about the current values, performance of real estate held by these VIEs, and general market conditions.The Financial Accounting Standards Board (“FASB”) issued guidance which amended the consolidation requirements, including introducing a separate consolidation analysis specific to limited partnerships and other similar entities. Under the analysis, limited
Limited partnerships and other similar entities
will beare considered variable interest entities unless the limited partners hold substantive kick-out rights or participating rights.
The guidance was adopted on January 1, 2016. The Company evaluated its existing joint venture property at San Souci Plaza based on the new guidance, determined the entity to be a variable interest entity, and continued to consolidate the entity. At December 31, 2020, this VIE owned real estate with a carrying value of $25.4 million and 0 mortgage loan payable.53
Cedar Realty Trust, Inc.
Notes to Consolidated Financial Statements
December 31, 2020
The Company has aCrossroads II, 60%-owned joint venture originally formed to develop the project known as Crossroads II. This joint venture iswas consolidated as it iswas deemed to be a VIE and the Company iswas the primary beneficiary. The Company (1) guaranteed all related debt, (2) doesdid not require its partners to fund additional capital requirements, (3) hashad an economic interest greater than its voting proportion and (4) directsdirected the management activities that significantly impactimpacted the performance of the joint venture. At December 31, 2020, this VIE owned real estate with a carrying value of $36.9 million and 0 mortgage loan payable.
See Note 3, Real Estate, for additional details.
The accompanying financial statements are prepared on the accrual basis in accordance with
accounting principles generally accepted in the United States (“GAAP”),GAAP, which requires management to make estimates and assumptions that affect the disclosure of contingent assets and liabilities, the reported amounts of assets and liabilities at the date of the financial statements, and the reported amounts of revenue and expenses during the periods covered by the financial statements. Actual results could differ from these estimates.
Real estate investments are carried at cost less accumulated depreciation. The provision for depreciation is calculated using the straight-line method based upon the estimated useful lives of the respective assets of between 3 and 40 years, with buildings being depreciated at the upper end of the range. Depreciation expense,
net of discontinued operations, amounted to
$43.6 million, $41.8$10.0 million and
$36.1$8.5 million for
2020, 20192023 and
2018,2022, respectively. Expenditures for betterments that substantially extend the useful lives of the assets are capitalized. Expenditures for maintenance, repairs, and betterments that do not substantially prolong the normal useful life of an asset are charged to operations as incurred.
Real estate investments include costs of development and redevelopment activities, and construction in progress. Capitalized costs, including interest and other carrying costs during the construction and/or renovation periods, are included in the cost of the related asset and charged to operations through depreciation over the
asset’sasset's estimated useful life.
A variety of costs are incurred in the development and leasing of a property, such as pre-construction costs essential to the development of the property, development costs, construction costs, interest costs, real estate taxes, salaries and related costs, and other costs incurred during the period of development. After a determination is made to capitalize a cost, it is allocated to the specific component of a project that is benefited. The Company ceases capitalization on the portions substantially completed and occupied, or held available for occupancy, and capitalizes only those costs associated with the portions under development. The Company considers a construction project to be substantially completed and held available for occupancy upon the completion of tenant improvements, but not later than one year from cessation of major construction activity.The Company allocates the fair value of real estate acquired to land, buildings and improvements. In addition, the fair value of in-place leases is allocated to intangible lease assets and liabilities. The fair value of the tangible assets of an acquired property is determined by valuing the property as if it were vacant, which value is then allocated to land, buildings and improvements based on
management’smanagement's determination of the fair values of these assets. In valuing an acquired
property’sproperty's intangibles, factors considered by management include an estimate of carrying costs during the expected lease-up periods, such as real estate taxes, insurance, other operating expenses, and estimates of lost rental revenue during the expected lease-up periods based on its evaluation of current market demand. Management also estimates costs to execute similar leases, including leasing commissions, tenant improvements, legal and other related costs.
The values of acquired above-marketabove market and below-marketbelow market leases are recorded based on the present values (using discount rates which reflect the risks associated with the leases acquired) of the differences between the contractual amounts to be received and management’smanagement's estimate of market lease rates, measured over the terms of the respective leases that management deemed appropriate at the time of the acquisitions. Such valuations include consideration of the non-cancellablenon-cancelable terms of the respective leases as well as any applicable renewal periods. The fair values associated with below-marketbelow market rental renewal options are determined based on the Company’sCompany's experience and the relevant facts and circumstances that existed at the time of the acquisitions. The values of above-marketabove market leases are amortized to rental income over the terms of the respective non-cancelable lease periods. The portion of the values of below-marketbelow market leases associated with the original non-cancelable lease terms are amortized to rental income over the terms of the respective non-cancelable lease periods. The portion of the values of the leases associated with below-marketbelow market renewal options that are likely of exercise are amortized to rental income over the respective renewal periods. The value of other intangible assets (including leasing commissions, tenant improvements, etc.) is amortized to expense over the applicable terms of the respective leases. If a lease were to
Cedar Realty Trust, Inc.
Notes to Consolidated Financial Statements
December 31, 2023
be terminated prior to its stated expiration or not renewed, all unamortized amounts relating to that lease would be recognized in operations at that time.
Management reviews each real estate investment for impairment whenever events or circumstances indicate that the carrying value of a real estate investment may not be recoverable. The review of recoverability of real estate investments held for use is based on
54
Cedar Realty Trust, Inc.
Notes to Consolidated Financial Statements
December 31, 2020
an estimate of the future cash flows that are expected to result from the real estate investment’sinvestment's use and eventual disposition. These cash flows consider factors such as expected future operating income, trends and prospects, as well as the effects of leasing demand, capital expenditures, competition and other factors. If an impairment event exists due to the projected inability to recover the carrying value of a real estate investment, an impairment loss is recorded to the extent that the carrying value exceeds estimated fair value.
Effective January 1, 2018, the
Properties Held for Sale
The Company
may decide to sell properties that are held for use. The Company records these properties as held for sale when management has
adopted the guidance on gains and losses from the derecognition of nonfinancial assets. This guidance applies to all nonfinancial assets (including real estate) for which the counterparty is not a customer and also clarifies that all businesses are derecognized using the deconsolidation guidance. Additionally, it defines an in substance nonfinancial asset as a financial asset that is promisedcommitted to a counterparty inplan to sell the assets, actively seeks a contract in which substantially allbuyer for the assets, and the consummation of the fair value of the asset promised in the contractsale is concentrated in nonfinancial assets, which excludes cash or cash equivalentsconsidered probable and liabilities. The Company believes these criteria for all real estate sold were met during 2019 and 2018. Under prior guidance, sales of real estate were recognized only when sufficient down payments had been obtained, possession and other attributes of ownership had been transferred to the buyer and the Company had no significant continuing involvement. The Company believes these criteria were met for all real estate sold during 2017.Properties Held For Sale
The Company follows the guidance for reporting discontinued operations, whereby a disposal of an individual property or group of properties is required to be reported in “discontinued operations” only if the disposal represents a strategic shift that has, or will have, a major effect on the Company’s operations and financial results. The results of operations for those properties not meeting such criteria are reported in “continuing operations” in the consolidated statements of operations.
expected within one year.
The carrying values of the assets and liabilities of properties determined to be held for sale, principally the net book values of the real estate and the related mortgage loans payable expected to be assumed by the buyers, are reclassified as
“held"held for
sale”sale" on the
Company’sCompany's consolidated balance sheets at the time such determinations are made, on a prospective basis only.
In addition, the Company anticipates that sales of all such properties remaining classified as “held for sale” at the balance sheet date will be concluded within one year from such date.The Company, when applicable, conducts a continuing review of the values for all properties
“held"held for
sale”sale" based on
finalestimated sales prices and sales contracts entered into. Impairment charges/reversals, if applicable, are based on a comparison of the carrying values of the properties with either (1) actual sales prices less costs to sell for properties sold, or contract amounts
less costs to sell for properties in the process of being sold, (2) estimated sales prices, less costs to sell, based on discounted cash flow analyses, if no contract amounts are being negotiated (see Note 4,
- “FairFair Value
Measurements”)Measurements), or (3) with respect to land parcels, estimated sales prices, less costs to sell, based on comparable sales completed in the selected market areas. Prior to the
Company’sCompany's determination to dispose of properties, which are subsequently reclassified to
“held"held for
sale”sale", the Company
performedperforms recoverability analyses based on the estimated undiscounted cash flows that
wereare expected to result from the real estate
investments’investments' use and eventual disposal. The projected undiscounted cash flows of each property reflects that the carrying value of each real estate investment would be recovered.
However, as a result of the properties’Properties meeting the
“held"held for
sale”sale" criteria,
such properties wereare written down to the lower of their carrying value and estimated fair values less costs to sell.
The Company follows the guidance for reporting discontinued operations, whereby a disposal of an individual property or group of properties is required to be reported in "discontinued operations" only if the disposal represents a strategic shift that has, or will have, a major effect on the Company's operations and financial results. The results of operations for those properties not meeting such criteria are reported in "continuing operations" in the consolidated statements of operations.
Cash and Cash Equivalents / Restricted Cash
Cash and cash equivalents consist of cash in banks and short-term investments with original maturities when purchased of less than ninety
days, and include cash at consolidated joint ventures of $0.2 million and $0.3 million at December 31, 2020 and 2019, respectively.days.
The terms of
mortgagethe secured term loans
payable may require the Company to deposit certain replacement and other reserves with its lenders. Such
“restricted cash”"restricted cash" is generally available only for property-level requirements for which the reserves have been established.
55
Cedar Realty Trust, Inc.
Notes to Consolidated Financial Statements
December 31, 2020
Restricted cash represents amounts held by lenders for real estate taxes, insurance, reserves for capital improvements, leasing costs and tenant security deposits.
The accounting guidance for fair value measurement establishes a fair value hierarchy that prioritizes observable and unobservable inputs used to measure fair value into three levels:
| •
| Level 1 – Inputs to the valuation methodology are quoted prices (unadjusted) for identical assets or liabilities in active markets.
|
| •Level 1 – Inputs to the valuation methodology are quoted prices (unadjusted) for identical assets or liabilities in active markets.• | Level 2 – Inputs to the valuation methodology include quoted prices for similar assets and liabilities in active markets, and inputs that are observable for the asset or liability, either directly or indirectly, for substantially the full term of the financial instrument.
|
| •
| Level 3 – Inputs to the valuation methodology are unobservable and significant to the fair value measurement.
|
Cedar Realty Trust, Inc.
Notes to Consolidated Financial Statements
December 31, 2023
•Level 2 – Inputs to the valuation methodology include quoted prices for similar assets and liabilities in active markets, and inputs that are observable for the asset or liability, either directly or indirectly, for substantially the full term of the financial instrument.
•Level 3 – Inputs to the valuation methodology are unobservable and significant to the fair value measurement.
The fair value hierarchy gives the highest priority to Level 1 inputs and the lowest priority to Level 3 inputs. In determining fair value, the Company utilizes valuation techniques that maximize the use of observable inputs and minimize the use of unobservable inputs to the extent possible while also considering counterparty credit risk in the assessment of fair value.
Revenue Recognition and Receivables
Management has determined that
The Company's underlying assets relating to rental revenue activity is solely retail space. The Company retains substantially all of the Company’srisks and benefits of ownership of these underlying assets and accounts for these leases with its various tenants areas operating leases. The Company combines lease and nonlease components in lease contracts, which includes combining base rent and tenant reimbursement revenue.
Rental income with scheduled rent increases is recognized using the straight-line method over the respective non-cancelable terms of the leases. The aggregate excess of rental revenue recognized on a straight-line basis over the contractual base rents is included in receivables on the consolidated balance sheet. Leases also generally contain provisions under which the tenants reimburse the Company for a portion of property operating expenses and real estate taxes incurred, generally attributable to their respective allocable portions of gross leasable area. Such income is recognized in the periods earned. In addition, a limited number of operating leases contain contingent rent provisions under which tenants are required to pay, as additional rent, a percentage of their sales in excess of a specified amount.
The Company's leases generally require the tenant to reimburse the Company for a substantial portion of its expenses incurred in operating, maintaining, repairing, insuring and managing the shopping center and common areas (collectively defined as Common Area Maintenance or "CAM" expenses). This significantly reduces the Company's exposure to increases in costs and operating expenses resulting from inflation or other outside factors. These reimbursements are considered nonlease components which the Company combines with the lease component. The Company calculates the tenant's share of operating costs by multiplying the total amount of the operating costs by the tenant's pro-rata percentage of square footage to total square footage of the property. The Company also receives monthly payments for these reimbursements from substantially all its tenants throughout the year. The Company recognizes tenant reimbursements as variable lease income.
The Company defers recognition of contingent rental income until those specified sales targets are met. Revenues also include items such as lease termination fees, which tend to fluctuate more than rents from year to year. Termination fees are fees that the Company has agreed to accept in consideration for permitting certain tenants to terminate their lease prior to the contractual expiration. The Company recognizes lease termination
income whenfees, which are included in revenues on the
following conditions are met: (1)consolidated statements of operations, in the year that the lease
termination agreement has been executed, (2)is terminated and collection of the
fee is reasonably assured. Upon early lease termination,
fee is determinable, (3) all the Company’s landlord services pursuant to the terminated lease have been rendered, and (4) collectability of the lease termination fee is assured.In November 2018, the FASB clarified the existing accounting treatment relating to receivables arising from operating leases, stating that such receivables are not within the scope of the expected credit loss standard and that impairment of receivables arising from operating leases should be accounted for in accordance with the recently-adopted lease accounting standard. This required the Company asrecords losses related to unrecovered intangibles and other assets.
The Company determines an allowance for the uncollectible portion of
January 1, 2019,accrued rents and accounts receivable based upon customer credit-worthiness (including expected recovery of a claim with respect to
review its existing lease portfolio to determine if all future lease payments are probable of collectionany tenants in bankruptcy), historical bad debt levels, and
if the Company determined that all future lease payments are not probable of collection, the Company will account for these leases on a cash basis. This required that allcurrent economic trends. All amounts that were historically recorded as bad debt expense, and previously included in operating expenses in the
Company’sCompany's consolidated statement of operations,
are now
be recorded as a
direct reduction of rental revenues.
In accordance with this guidance, $8.3 million and $2.4 million of rental revenue relating to certain leases that were no longer deemed probable of collection were not recorded as rental revenue for the years ended December 31, 2020 and 2019, respectively. Of these amounts, $1.4 million and $0.3 million, respectively, represented deferred rent receivables that were written-off for the years ended December 31, 2020 and 2019. Prior to January 1, 2019, the Company made estimates as to the collectability of its accounts receivable related to base rent, straight-line rent, percentage rent, expense reimbursements and other revenues. When management analyzed accounts receivable and evaluated the adequacy of the allowance for doubtful accounts, it considered such things as historical bad debts, tenant creditworthiness, current economic trends, current developments relevant to a tenant’s business specifically and to its business category generally, and changes in tenants’ payment patterns. The allowance for doubtful accounts was $1.4 million and $0.6 million at December 31, 2020 and 2019, respectively. The provision for doubtful accounts (included in operating, maintenance and management expenses) was $1.5 million, $0.4 million and $2.2 million in 2020, 2019 and 2018, respectively. The
Company’sCompany's primary business is the
ownership and operation of grocery-anchored shopping centers.centers. The Company reviews operating and financial information for each property on an individual basis and, accordingly, each property represents an individual operating segment. The Company evaluates financial performance using property operating income, which consists of rental income and other property income, less operating expenses and real estate taxes.
No individual property constitutes more than 10% of the56
Cedar Realty Trust, Inc.
Notes to Consolidated Financial Statements
December 31, 2020
Company’s revenues or property operating income, and theThe Company has no operations outside of the United States of America. Therefore, the Company has aggregated its properties into 1one reportable segment as the properties share similar long-term economic characteristics and have other similarities including the fact that they are operated using consistent business strategies, are typically located in major metropolitan areas,similar markets, and have similar tenant mixes.
Cedar Realty Trust, Inc.
Notes to Consolidated Financial Statements
December 31, 2023
Lease Commitments
The Company determines if an arrangement is a lease at inception. Operating leases, in which the Company is the lessee, are included in deferred costs and other assets, net, and accounts payable, accrued expenses, and other liabilities on the Company's consolidated balance sheets.
Right-of-use ("ROU") assets represent the right to use an underlying asset for the lease term and the lease liabilities represent the Company's obligation to make lease payments arising from the lease. Operating lease ROU assets and liabilities are recognized at commencement date based on the present value of lease payments over the lease term. As most of the Company's leases do not provide an implicit rate, the Company uses its incremental borrowing rate based on the information available at commencement date in determining the present value of lease payments. The operating lease ROU assets include any lease payments made and excludes lease incentives. The Company's lease terms may include options to extend the lease when it is reasonably certain that the Company will exercise that option. Lease expense for lease payments is recognized on a straight-line basis over the lease term.
The Company combines lease and associated nonlease components. The lease components are the majority of its leasing arrangements and the Company accounts for the combined component as an operating lease. In the event the Company modifies existing ground leases or enters into new ground leases, such leases may be classified as finance leases.
Transaction Costs
All costs associated with the Grocery-Anchored Portfolio Sale and the Merger, were expensed as incurred.
The Company, organized in 1984, has elected to be taxed as a
REITreal estate investment trust ("REIT") under the
Internal Revenue Code of 1986, as amended (the “Code”).Code. A REIT will generally not be subject to federal income taxation on that portion of its income that qualifies as REIT taxable income, to the extent that it distributes at least 90% of such REIT taxable income to its stockholders and complies with certain other requirements. As of December 31,
2020,2023, the Company was in compliance with all REIT requirements.
The Company follows a two-step approach for evaluating uncertain federal, state and local tax positions. Recognition (step one) occurs when an enterprise concludes that a tax position, based solely on its technical merits, is more-likely-than-not to be sustained upon examination. Measurement (step two) determines the amount of benefit that more-likely-than-not will be realized upon settlement. Derecognition of a tax position that was previously recognized would occur when a company subsequently determines that a tax position no longer meets the more-likely-than-not threshold of being sustained. The Company has not identified any uncertain tax positions which would require an accrual.
Derivative Financial Instruments
The
Prior to the Merger, the Company occasionally
utilizesutilized derivative financial instruments, principally interest rate swaps, to manage its exposure to fluctuations in interest rates. The Company
hashad established policies and procedures for risk assessment, and the approval, reporting and monitoring of derivative financial instruments. Derivative financial instruments
musthad to be effective in reducing the
Company’sCompany's interest rate risk exposure in order to qualify for hedge accounting. When the terms of an underlying transaction
arewere modified, or when the underlying hedged item
ceasesceased to exist, all changes in the fair value of the instrument
arewere marked-to-market with changes in value included in net income for each period until the derivative financial instrument
maturesmatured or
iswas settled. Any derivative financial instrument used for risk management that
doesdid not meet the hedging criteria
iswas marked-to-market with the changes in value included in net income.
The Company has not entered into, and does not plan to enter into, derivative financial instruments for trading or speculative purposes. During 2017, the Company’sCompany's shareholders approved the 2017 Stock Incentive Plan (the “2017 Plan”"2017 Plan"), which replaced the Company’sCompany's 2012 Stock Incentive Plan (the “2012 Plan”"2012 Plan"). As of the effective date of the 2017 Plan, the Company may not grant any further awards under the 2012 Plan. The 2017 Plan establishes the procedures for the granting of, among other things, restricted stock awards. On May 1, 2019, the Company’sCompany's shareholders approved an amendment to the 2017 Plan, which increased the maximum number of shares of the Company’sCompany's common stock that may be issued pursuant to the 2017 Plan by 303,000 shares, to a new total of 909,000 shares (see Note 14, – “Share-Based Compensation”)Share-Based Compensation), and the maximum number of shares that may be granted to a participant in any calendar year may not exceed 76,000. All grants issued pursuant to the 2017 Plan generally vest (1) at the end of designated time
Cedar Realty Trust, Inc.
Notes to Consolidated Financial Statements
December 31, 2023
periods for time-based grants, or (2) upon the completion of a designated period of performance for performance-based grants and satisfaction of performance criteria. Time–based grants are valued according to the market price for the
Company’sCompany's common stock at the date of grant. For performance-based grants, the Company generally engages an independent appraisal company to determine the value of the shares at the date of grant, taking into account the underlying contingency risks associated with the performance criteria. The value of all grants are being expensed on a straight-line basis over their respective vesting periods (irrespective of achievement of the market performance-based grants) adjusted, as applicable, for forfeitures. For restricted share grants subject to graded vesting, the amounts expensed are at least equal to the measured expense of each vested tranche. Based on the terms of the 2017 Plan, those grants of restricted shares that are contributed to the Rabbi Trusts are classified as treasury stock on the
Company’sCompany's consolidated balance sheet.
57
Cedar Realty Trust, Inc.
Notes to Consolidated Financial Statements
December 31, 2020
The 2017 Plan was terminated in connection with the Merger.
Supplemental Consolidated Statements of Cash Flows Information
| | Years ended December 31, | |
| | 2020 | | | 2019 | | | 2018 | |
| Years ended December 31, | |
| Years ended December 31, | |
| Years ended December 31, | |
| 2023 | |
| Supplemental disclosure of cash activities: | |
| Supplemental disclosure of cash activities: | |
Supplemental disclosure of cash activities: | | | | | | | | | | | | |
Cash paid for interest | | $ | 23,208,000 | | | $ | 23,859,000 | | | $ | 22,191,000 | |
| Cash paid for interest | |
| Cash paid for interest | |
| Supplemental disclosure of non-cash activities: | |
| Supplemental disclosure of non-cash activities: | |
Supplemental disclosure of non-cash activities: | | | | | | | | | | | | |
Capitalization of interest and financing costs | | | 2,674,000 | | | | 1,649,000 | | | | 1,528,000 | |
Buildings and improvements included in accounts payable and accrued liabilites | | | 2,976,000 | | | | 3,669,000 | | | | 521,000 | |
Recognition of right-of-use assets and related lease liabilities | | | 703,000 | | | | 13,778,000 | | | | — | |
Issuance of OP Units in connection with a land parcel acquisition | | | — | | | | — | | | | 975,000 | |
| Capitalization of interest and financing costs | |
| Capitalization of interest and financing costs | |
| Buildings and improvements included in accounts payable, accrued expenses, and other liabilities | |
| Buildings and improvements included in accounts payable, accrued expenses, and other liabilities | |
| Buildings and improvements included in accounts payable, accrued expenses, and other liabilities | |
| Payoff of mortgages through mortgage assumptions | |
| Payoff of mortgages through mortgage assumptions | |
| Payoff of mortgages through mortgage assumptions | |
Recently Issued
and Adopted Accounting Pronouncements
In
May 2014,November 2023, the
FASBFinancial Accounting Standards Board ("FASB") issued guidance which
amends the accounting for revenue recognition. Under the amended guidance,requires disclosure of incremental segment information on both an
entity will recognize revenue when it transfers promised goods or services to customers in an amount that reflects the consideration to which a company expects to be entitled to and receive in exchange for those goods or services. Leases are specifically excluded from this guidance and will be governed by the applicable lease codification. The guidance, effective January 1, 2018, did not have a material effect on the Company’s consolidated financial statements.In August 2016, the FASB issued guidance that clarifies how an entity should classify certain cash receipts and cash payments on its statement of cash flows. The guidance established that an entity will classify cash payments for debt prepayment or extinguishment costs as financing cash flows. In addition, the guidance provides entities with an alternative to consider regarding the nature of the source of distributions that an investor receives from an equity method investment when classifying distributions received in its cash flow statement (the nature of the distribution approach). Alternatively, entities can elect to classify the distributions received from equity method investees based on the cumulative earnings approach. The guidance, effective January 1, 2018, did not have a material effect on the Company’s consolidated financial statements.
In November 2016, the FASB issued guidance that requires entities to show the changes in the total of cash, cash equivalents and restricted cash in the statement of cash flows. When cash, cash equivalents and restricted cash are presented in more than one line item on the balance sheet, the new guidance requires a reconciliation of the totals in the statement of cash flows to the related captions on the balance sheet. This reconciliation can be presented either on the face of the statement of cash flows or in the notes to the financial statements. The guidance, effective January 1, 2018, did not have a material effect on the Company’s consolidated financial statements.
In May 2017, the FASB issued guidance which clarifies when changes to the terms or conditions of a share-based payment award must be accounted for as a modification. Under the new guidance, an entity will not apply modification accounting if the award’s fair value, vesting conditions, and the classification of the award as equity or a liability are the same immediately before and after the change. The guidance, effective January 1, 2018, did not have a material effect on the Company’s consolidated financial statements.
In February 2016, the FASB issued guidance amending the existing accounting standards for lease accounting, including requiring lessees to recognize most leases on their balance sheets and making targeted changes to lessor accounting. The guidance, effective for annual and interim reporting periods beginning on or after December 15, 2018, requires lessees to apply a dual approach, classifying leases as either finance or operating leases based on the principle of whether or not the lease is effectively a financed purchase of the leased asset by the lessee. This classification will determine whether the lease expense is recognized based on an effective interest method or on a straight-line basis over the term of the lease. The Company is not required to reassess the classification of existing ground leases where it is the lessee and therefore these leases will continue to be accounted for as operating leases. A lessee is also required to record a right-of-use asset and a lease liability for all leases with a term of greater than twelve months regardless of their classification. Leases with a term of twelve months or less continue to be accounted for pursuant to existing guidance for operating leases. Based on the Company’s future obligations under its ground lease and executive office lease agreements for which the Company is the lessee, the newly adopted guidance resulted in the recognition of (1) right-of-use assets of $14.6 million included in other assets and deferred charges, net, and (2) right-of-use liabilities of $14.6 million included in accounts payable and accrued liabilities, on the Company’s consolidated balance sheet as of January 1, 2019. In the event the Company modifies existing ground leases or enters into new ground leases after adoption of the new standard, such leases may be classified as finance leases. Additionally, the guidance requires that lessees and lessors capitalize, as initial direct costs, only those costs that are incurred due to the execution of a lease. Under this guidance,
58
Cedar Realty Trust, Inc.
Notes to Consolidated Financial Statements
December 31, 2020
allocated payroll costs and other costs that are incurred regardless of whether the lease is obtained will no longer be capitalized as initial direct costs and instead will be expensed as incurred. During 2019, the Company expensed $2.8 million of leasing costs which would have previously been capitalized.
The FASB provided lessors with a practical expedient, elected by class of underlying asset, to account for lease and non-lease components as a single lease component if certain criteria are met. Lessors that make these elections are required to provide additional disclosures. The FASB provided an additional (and optional) transition method that allows entities to initially apply the guidance at the adoption date (January 1, 2019) and recognize a cumulative-effect adjustment to the opening balance of retained earnings in the period of adoption. The Company applied both these practical expedients upon adoption. The practical expedient allowed the Company to not separate expenses reimbursed by customers from the associated rental revenue if certain criteria were met. The Company assessed these criteria and concluded that the timing and pattern of transfer for rental revenue and the associated rental expense recoveries are the same and, as the leases qualify as operating leases, the Company accounted for and presented rents and expense recoveries as a single component under rental revenues in the consolidated statement of operations for 2019.
In November 2018, the FASB clarified the existing accounting treatment relating to receivables arising from operating leases, stating that such receivables are not within the scope of the expected credit loss standard and that impairment of receivables arising from operating leases should be accounted for in accordance with the recently-adopted lease accounting standard. This required the Company to review its existing lease portfolio to determine if all future lease payments are probable of collection and, if the Company determined that all future lease payments are not probable of collection, the Company will account for these leases on a cash basis. This required that all amounts that were historically recorded as bad debt expense, and previously included in operating expenses in the Company’s consolidated statement of operations, now be recorded as a direct reduction of rental revenues. As permitted by the standard upon adoption, the Company recorded a $0.5 million prior-period adjustment to opening equity which the Company has reflected in the consolidated statement of equity for 2019.
In June 2016, the FASB issued guidance which enhances the methodology of measuring expected credit losses to include the use of forward-looking information to better calculate credit loss estimates. The guidance will apply to most financial assets measured at amortized cost and certain other instruments, including accounts receivable, loans, held-to-maturity debt securities, net investments in leases, and off-balance-sheet credit exposures. The guidance will require that the Company estimatecontinue to disclose existing segment information required by FASB Accounting Standards Codification Topic 280, as well as significant segment expenses and other segment items that are regularly provided to the lifetime expected credit loss with respect to these receivables and record allowances that, when deducted from the balance of the receivables, represent the net amounts expected to be collected.chief operating decision maker ("CODM"). The Company will also be required to disclose information aboutthe title and position of the CODM and how it developed the allowances, including changesCODM uses reported measures of segment profit or loss in assessing segment performance and deciding how to allocate resources. The guidance will be effective for the Company's fiscal year beginning on January 1, 2024 and interim periods within the Company's fiscal year beginning on January 1, 2025. The Company is currently in the factors that influenced the Company’s estimateprocess of expected credit losses and the reasons for those changes. The guidance was effective January 1, 2020, andevaluating the guidance, didbut does not believe it will have a material effect on the Company’sCompany's consolidated financial statements.
In April 2020,
Other accounting standards that have been recently issued or proposed by the FASB issuedor other standard-setting bodies are not currently applicable to the Company or are not expected to have a question-and-answer document (the “Lease Modification Q&A”) focusedsignificant impact on the applicationCompany’s financial position, results of lease accounting guidance to lease concessions provided as a result of a novel strain of coronavirus (“COVID-19”). Under existing lease guidance,operations and cash flows.
Note 3. Real Estate
Investment in unconsolidated joint venture
On May 5, 2021, the Company
would haveformed a joint venture with Goldman Sachs Urban Investment Group and Asland Capital Partners (the "Joint Venture") for the construction of an approximately 258,000 square foot six-story commercial building in Washington, D.C. consisting of approximately 240,000 square feet of office space which is 100% leased to
determine, on a lease by lease basis, if a lease concessionthe Washington, D.C., Department of General Services for its headquarters and approximately 18,000 square feet of street-level retail. On August 5, 2022, the Joint Venture was
the result of a new arrangement reachedsold in connection with the
tenant (treated with the lease modification accounting framework) or if a lease concession was under the enforceable rights and obligations within the existing lease agreement (precluded from applying the lease modification accounting framework). The Lease Modification Q&A clarifies that entities may elect to not evaluate whether lease-related relief that lessors provide to mitigate the economic effects of COVID-19 on lessees is a lease modification under ASC 842. Instead, an entity that elects not to evaluate whether a concession directly related to COVID-19 is a modification can then elect whether to apply the modification guidance (i.e. assume the relief was always contemplated by the contract or assume the relief was not contemplated by the contract). Both lessees and lessors may make this election.Grocery-Anchored Portfolio Sale. The Company
evaluatedcontributed approximately $4.8 million of capital to the Joint Venture through its
election on a disaggregated basis, with such election applied consistently to leases with similar characteristics and similar circumstances.During 2020,tenure.
2022 Acquisition
On June 28, 2022, the Company provided lease concessions to certain tenants in response to the impact of COVID-19,acquired a 40% minority ownership percentage in the form of rent deferrals.Crossroads II joint venture for $1.0 million. The Company has made an election to account for such lease concessions consistent with how those concessions would be accounted for under ASC 842 if enforceable rights and obligations for those concessions had already existedCompany's ownership interest in Crossroads II was included in the leases. This election is available for concessions related to the effectsGrocery-Anchored Portfolio Sale that occurred on July 7, 2022.
Notes to Consolidated Financial Statements
December 31,
2020Substantially all of2023
Dispositions
Excluding the
Company’s concessions to date provide for a deferral of payments with no substantive changes to the consideration in the original lease. These deferrals affect the timing, but not the amount, of the lease payments. The Company is accounting for these deferrals as if no changes to the lease were made. Under this accounting, the Company increases its receivables as tenant payments accrueGrocery-Anchored Portfolio Sale, during 2023 and
continues to recognize rental income. During 2020, the Company has entered into lease modifications that deferred approximately $3.2 million, of which $2.4 million relates to deferrals that the Company continued to recognize rental income. In addition, during 2020, the Company has entered into agreements that waived approximately $1.5 million of rent. Note 3. Real Estate
Real estate activity for 2020 and 2019 is composed of the following:
| | Years ended December 31, | |
| | 2020 | | | 2019 | |
Cost | | | | | | | | |
Balance, beginning of year | | $ | 1,515,206,000 | | | $ | 1,508,682,000 | |
Properties transferred to held for sale | | | (22,512,000 | ) | | | (36,265,000 | ) |
Property acquisitions | | | — | | | | 9,333,000 | |
Outparcel dispositions | | | (840,000 | ) | | | — | |
Asset write-offs | | | — | | | | (3,633,000 | ) |
Improvements and betterments | | | 35,624,000 | | | | 37,089,000 | |
Balance, end of the year | | $ | 1,527,478,000 | | | $ | 1,515,206,000 | |
| | | | | | | | |
Accumulated depreciation | | | | | | | | |
Balance, beginning of the year | | $ | 389,861,000 | | | $ | 361,969,000 | |
Properties transferred held for sale | | | (3,947,000 | ) | | | (10,143,000 | ) |
Outparcel dispositions | | | (90,000 | ) | | | — | |
Asset write-offs | | | — | | | | (3,107,000 | ) |
Depreciation expense | | | 42,745,000 | | | | 41,142,000 | |
Balance, end of the year | | $ | 428,569,000 | | | $ | 389,861,000 | |
| | | | | | | | |
Net book value | | $ | 1,098,909,000 | | | $ | 1,125,345,000 | |
| | | | | | | | |
| |
At December 31, 2020, Franklin Village Plaza was pledged as collateral for a mortgage loan payable. See Note 8 - “Mortgage Loans Payable and Credit Facilities”.
2019 Acquisition
On June 19, 2019, the Company purchased Girard Plaza, a shopping center adjacent to its South Philadelphia property, located in Philadelphia, Pennsylvania. The purchase price for the property was $8.5 million, which has been allocated to real estate assets and liabilities.
60
Cedar Realty Trust, Inc.
Notes to Consolidated Financial Statements
December 31, 2020
Dispositions
During 2020, 2019 and 2018,2022, the Company sold the properties listed below:
| | | | Date | | Sales | | | Gain on | |
Property | | Location | | Sold | | Price | | | Sale | |
2020 | | | | | | | | | | | | |
Metro Square | | Owings Mills, MD | | 7/9/2020 | | $ | 4,288,000 | | | $ | - | |
Oakland Mills outparcel building | | Columbia, MD | | 9/17/2020 | | | 1,050,000 | | | | 643,000 | |
Glen Allen Shopping Center | | Glen Allen, VA | | 10/8/2020 | | | 8,540,000 | | | | 1,780,000 | |
Pine Grove Plaza outparcel building | | Brown Mills, NJ | | 11/2/2020 | | | 1,100,000 | | | | 565,000 | |
Suffolk Plaza | | Suffolk, VA | | 12/10/2020 | | | 6,950,000 | | | | 1,408,000 | |
| | | | | | $ | 21,928,000 | | | $ | 4,396,000 | |
2019 | | | | | | | | | | | | |
Maxatawny Marketplace | | Maxatawny, PA | | 2/15/2019 | | $ | 10,330,000 | | | $ | 101,000 | |
Fort Washington Center | | Fort Washington, PA | | 6/26/2019 | | | 9,048,000 | | | | 2,841,000 | |
| | | | | | $ | 19,378,000 | | | $ | 2,942,000 | |
2018 | | | | | | | | | | | | |
Mechanicsburg Center | | Mechanicsburg, PA | | 8/28/2018 | | $ | 16,100,000 | | | $ | 4,864,000 | |
West Bridgewater Plaza | | West Bridgewater, MA | | 9/28/2018 | | | 3,500,000 | | | | - | |
| | | | | | $ | 19,600,000 | | | $ | 4,864,000 | |
| | | | | | | | | | | | | | | | | | | | | | | | | | |
| Property | | Location | | Date
Sold | | Sales
Price | | Gain on Sale/
Impairment |
| 2023 | | | | | | | | |
| Carll's Corner outparcel building | | Bridgeton, NJ | | 7/11/2023 | | $ | 3,000,000 | | | $ | 2,662,000 | |
| | | | | | | | | |
| 2022 | | | | | | | | |
| Riverview Plaza | | Philadelphia, PA | | 5/16/2022 | | $ | 34,000,000 | | | $ | (361,000) | |
| | | | | | | | |
| | | | | | | | |
| | | | | | | | |
| | | | | | | | |
| | | | | | | | |
| | | | | | | | |
The Company recorded impairment charges
Impairments
Impairments of
$7.2 million relating to Metro Square during 2020, and $9.4 million
relatingfor the year ended December 31, 2022 also include those related to
West Bridgewater Plaza during 2018, whichthe Company's then-investment in the unconsolidated joint venture and the then-note receivable associated with Senator Square. These impairments are included in
continuing operations in the accompanying consolidated statements of operations.Real Estate Held for Sale
As of December 31, 2020, Carll’s Corner, located in Bridgeton, New Jersey, and The Commons, located in Dubois Pennsylvania, have been classified as “real estate held for sale” on the accompanying consolidated balance sheet.
During, 2020, the Company recorded impairment charges of $0.4 million in connection with The Commons. In addition, the Company recorded an impairment charge of $8.9 million in connection with The Commons in 2019 and $11.3 million in connection with Carll’s Corner in 2018. These impairment charges have been included in continuing operationsoperating loss in the accompanying consolidated statement of operations.
Development Asset
Discontinued Operations
On July 23, 2020,7, 2022, the Company entered intoand certain of its subsidiaries completed the Grocery-Anchored Portfolio Sale and the East River Park and Senator Square redevelopment asset sales for total gross proceeds of approximately $879 million, including the assumed debt. The assets sold in these transactions were:
| | | | | | | | | | | | | | | | | | | | |
| Property Name | | Location | | Property Name | | Location |
| Academy Plaza | | Philadelphia, PA | | New London Mall | | New London, CT |
| Bethel Shopping Center | | Bethel, CT | | Newport Plaza | | Newport, PA |
| Carmans Plaza | | Massapequa, NY | | Northside Commons | | Campbelltown, PA |
| Christina Crossing | | Wilmington, DE | | Norwood Shopping Center | | Norwood, MA |
| Colonial Commons | | Harrisburg, PA | | Oak Ridge Shopping Center | | Suffolk, VA |
| Crossroads II | | Bartonsville, PA | | Oakland Mills | | Columbia, MD |
| East River Park | | Washington, DC | | Palmyra Shopping Center | | Palmyra, PA |
| Elmhurst Square | | Portsmouth, VA | | Quartermaster Plaza | | Philadelphia, PA |
| Fishtown Crossing | | Philadelphia, PA | | Senator Square | | Washington, DC |
| Franklin Village Plaza | | Franklin, MA | | Shoppes at Arts District | | Hyattsville, MD |
| General Booth Plaza | | Virginia Beach, VA | | Swede Square | | E. Norriton Township, PA |
| Girard Plaza | | Philadelphia, PA | | The Point | | Harrisburg, PA |
| Groton Shopping Center | | Groton, CT | | The Shops as Bloomfield Station | | Bloomfield, NJ |
| Halifax Plaza | | Halifax, PA | | The Shops at Suffolk Downs | | Revere, MA |
| Jordan Lane | | Wethersfield, PA | | Trexlertown Plaza | | Trexlertown, PA |
| Kempsville Crossing | | Virginia Beach, VA | | Valley Plaza | | Hagerstown, MD |
| Lawndale Plaza | | Philadelphia, PA | | Yorktowne Plaza | | Cockeysville, MD |
| Meadows Marketplace | | Hummelstown, PA | | | | |
The Grocery-Anchored Portfolio Sale represented a commercial lease agreement (the “Lease”) withstrategic shift and had a material effect on the Government of the District of Columbia (the “District”), for the lease by the District of office space in a new six-story building to be constructed byCompany's operations and financial results, and, therefore, the Company at Senator Square. The building is planned to housedetermined that it was deemed a discontinued operation. Accordingly, the new office headquartersportfolio of 33 grocery-anchored shopping centers were classified as held for sale and the Districtresults of Columbia’s Departmenttheir operations were classified as discontinued operations in 2022.
Table of General Services’ (“DGS”) 700-member workforce. The term of the Lease is 20 years and 10 months, to commence upon substantial completion and delivery to DGS. The Company anticipates commencement of construction to occur in the first quarter of 2021 and currently estimates that the space will be delivered during the end of the fourth quarter 2022.Upon completion of the building, the District will be obligated to pay initial annual net rent of approximately $5.4 million per year, subject to a 2.5% annual escalator on each anniversary of rent commencement, plus certain operating costs, property taxes and amortization of tenant improvements together totaling approximately an additional $8.1 million per year, for an aggregate total annual rent of approximately $13.5 million. The Lease provides for a free rent period of 10 months immediately following rent commencement. The Lease also provides the District with a tenant credit of approximately $6.8 million to be applied, at the District’s election, against either annual rent or any other tenant payment obligations including tenant improvement costs, in excess of the tenant improvement allowance. Pursuant to the Lease, the landlord will contribute up to $155 per rentable square foot toward the cost of tenant improvements, to be amortized over 240 months. In addition, the Lease provides that the Company will contribute $9.38 per rentable square foot in
61
Contents
Notes to Consolidated Financial Statements
December 31,
2020additional tenant improvement allowance between2023
The following is a summary of income from discontinued operations:
| | | | | | | | | | | | | |
| Years ended December 31, |
| 2023 | | 2022 | | |
| REVENUES | | | | | |
| Rental revenues | $ | — | | | $ | 44,130,000 | | | |
| Other revenues | — | | | 184,000 | | | |
| Total revenues | — | | | 44,314,000 | | | |
| EXPENSES | | | | | |
| Operating, maintenance and management | — | | | 9,557,000 | | | |
| Real estate and other property-related taxes | — | | | 6,749,000 | | | |
| Corporate general and administrative | — | | | 469,000 | | | |
| Depreciation and amortization | — | | | 9,726,000 | | | |
| Total expenses | — | | | 26,501,000 | | | |
| | | | | | |
| | | | | | |
| OPERATING INCOME | — | | | 17,813,000 | | | |
| | | | | | |
| NON-OPERATING INCOME AND EXPENSES | | | | | |
| Interest expense, net | — | | | (3,511,000) | | | |
| Total non-operating income and expenses | — | | | (3,511,000) | | | |
| | | | | | |
| INCOME FROM DISCONTINUED OPERATIONS | — | | | 14,302,000 | | | |
| | | | | | |
| Impairment charges | — | | | (16,629,000) | | | |
| Gain on sales | — | | | 125,500,000 | | | |
| | | | | | |
| TOTAL INCOME FROM DISCONTINUED OPERATIONS | $ | — | | | $ | 123,173,000 | | | |
Net cash provided by operating activities from discontinued operations was $0.0 million and $25.9 million for the 10thyears ended December 31, 2023 and 12th Lease2022, respectively. Net cash provided by investing activities from discontinued operations was $0.0 million and $651.5 million for the years upon the District’s timely election. The obligations of the District under the Lease are subject to annual budget appropriation.ended December 31, 2023 and 2022, respectively.
Note 4. Fair Value Measurements
The carrying amounts of cash and cash equivalents, restricted cash, rents and other receivables, certain other assets, accounts payable,
accrued expenses and
accruedother liabilities, and variable-rate debt approximate their fair value due to their terms and/or short-term nature. The fair value of the
Company’sCompany's investments and liabilities related to deferred compensation were determined to be Level 1 within the valuation hierarchy, and were based on independent values provided by financial institutions.
The fair value of the
Company’sCompany's fixed rate
mortgage loan wassecured term loans were estimated using available market information and discounted cash flow analyses based on borrowing rates the Company believes it could obtain with similar terms and maturities. As of December 31,
20202023 and
December 31, 2019,2022, the fair value of the
Company’sCompany's fixed rate
mortgage loan payable, which was determined to be Level 3 within the valuation hierarchy, was $47.0 million and $47.0 million, respectively; the carrying value of such loan was $45.4 million and $46.4 million, respectively. As of December 31, 2020 and December 31, 2019, respectively, the aggregate fair values of the Company’s unsecured revolving credit facility andsecured term loans,
approximated the carrying values. In addition, the fair values of the Company’s mortgage note receivable and finance lease obligation, which were determined to be Level 3 within the valuation hierarchy,
approximated theirwas $131.4 million and $131.8 million, respectively, and the carrying
values as of December 31, 2020 and December 31, 2019, respectively.The valuation of the liabilities for the Company’s interest rate swaps, which are measured on a recurring basis, were determined to be Level 2 within the valuation hierarchy, and were based on independent values provided by financial institutions. Such valuations were determined using widely accepted valuation techniques, including discounted cash flow analyses, on the expected cash flows of each derivative. The analyses reflect the contractual terms of the swaps, including the period to maturity, and user-observable market-based inputs, including interest rate curves (“significant other observable inputs”). The fair value calculation also includes an amount for risk of non-performance using “significant unobservable inputs” such as estimates of current credit spreads to evaluate the likelihood of default. The Company has concluded that, as of December 31, 2020, the fair value associated with the “significant unobservable inputs” relating to the Company’s risk of non-performance was insignificant to the overall fair value of the interest rate swap agreementssuch loans, was $140.5 million and as a result, that the relevant inputs for purposes of calculating the fair value of the interest rate swap agreements, in their entirety, were based upon “significant other observable inputs”.
$131.5 million, respectively.
Nonfinancial assets and liabilities measured at fair value in the consolidated financial statements consist of real estate held for sale, which, if applicable, are measured on a nonrecurring basis, and have been determined to be (1) Level 2 within the valuation hierarchy, where applicable, based on the respective contracts of sale, adjusted for closing costs and expenses, or (2) Level 3 within the valuation hierarchy, where applicable, based on estimated sales prices, adjusted for closing costs and expenses, determined by
Cedar Realty Trust, Inc.
Notes to Consolidated Financial Statements
December 31, 2023
discounted cash flow analyses, income capitalization analyses or a sales comparison approach if no contracts had been concluded. The discounted cash flow and income capitalization analyses include all estimated cash inflows and outflows over a specific holding period and, where applicable, any estimated debt premiums. These cash flows were composed of unobservable inputs which included forecasted rental revenues and expenses based upon existing in-place leases, market conditions and expectations for growth. Capitalization rates and discount rates utilized in these analyses were based upon observable rates that the Company believed to be within a reasonable range of current market rates for the respective properties. The sales comparison approach is utilized for certain land values and includes comparable sales that were completed in the selected market areas. The comparable sales utilized in these analyses were based upon observable per acre rates that the Company believes to be within a reasonable range of current market rates for the respective properties.
Valuations were prepared using internally-developed valuation models. These valuations are reviewed and approved, during each reporting period, by
As a
diverse groupresult of
management, as deemed necessary, including personnel from the
acquisition, accounting, finance, operations, development and leasing departments, and the valuations are updated as appropriate. In addition,Grocery-Anchored Portfolio Sale, the Company
may engage third-party valuation experts to assist with the preparation of certain of its valuations.62
Cedar Realty Trust, Inc.
Notes to Consolidated Financial Statements
December 31, 2020
The following tables show the hierarchy for thosehas no interest rate swap and deferred compensation assets measured at fair value on a recurring basisor liabilities as of December 31, 20202023 and 2022.
For the year ended December 31,
2019, respectively: | | December 31, 2020 | |
Description | | Level 1 | | | Level 2 | | | Level 3 | | | Total | |
Investments related to deferred | | | | | | | | | | | | | | | | |
compensation liabilities (a) | | $ | 948,000 | | | $ | — | | | $ | — | | | $ | 948,000 | |
Deferred compensation liabilities (b) | | $ | 952,000 | | | $ | — | | | $ | — | | | $ | 952,000 | |
Interest rate swaps liability (b) | | $ | — | | | $ | 18,927,000 | | | $ | — | | | $ | 18,927,000 | |
| | | | | | | | | | | | | | | | |
| | | | | | | | | | | | | | | | |
| | December 31, 2019 | |
Description | | Level 1 | | | Level 2 | | | Level 3 | | | Total | |
Investments related to deferred | | | | | | | | | | | | | | | | |
compensation liabilities (a) | | $ | 823,000 | | | $ | — | | | $ | — | | | $ | 823,000 | |
Deferred compensation liabilities (b) | | $ | 824,000 | | | $ | — | | | $ | — | | | $ | 824,000 | |
Interest rate swaps asset (a) | | $ | — | | | $ | 136,000 | | | $ | — | | | $ | 136,000 | |
Interest rate swaps liability (b) | | $ | — | | | $ | 7,180,000 | | | $ | — | | | $ | 7,180,000 | |
| | | | | | | | | | | | | | | | |
(a) Included in other assets and deferred charges, net, in the accompanying consolidated balance sheets. | |
(b) Included in accounts payable and accrued liabilities in the accompanying consolidated balance sheets. | |
As2022, the Company recorded impairments of December 31, 2020, real estate held for sale on$9.4 million related to Riverview Plaza, located in Philadelphia, Pennsylvania, which was sold that same year, and the Company's then-investment in the unconsolidated joint venture and the then-note receivable associated with Senator Square located in Washington D.C., both of which assets were sold in the Grocery-Anchored Portfolio Sale. These charges are included in impairment charges in the consolidated balance sheet consistedstatement of (1) 1 retail property, totaling $2.1 million, whichoperations. The fair value of the assets was determined to be Level 3 asset under the hierarchy, and was measured at2. Such assets have an aggregate fair value less cost to sell on a non- recurring basis using a direct capitalization approach, consisting of a capitalization rate$0.0 million as of 8.5%, and (2) 1 retail property, totaling $7.4 million, which was determined to be Level 3 asset under the hierarchy, and was measured at fair value less cost to sell on a non-recurring basis using a discounted cash flow approach, consisting of a capitalization rate of 11.5% and a discount rate of 8.0%.
December 31, 2022. Note 5. Concentration of Credit Risk
Financial instruments that potentially subject the Company to concentrations of credit risk consist primarily of cash and cash equivalents in excess of insured amounts and tenant receivables. The Company places its cash and cash equivalents with high quality financial institutions. Management performs ongoing credit evaluations of its tenants and requires certain tenants to provide security deposits and/or suitable guarantees.
Excluding properties
held for sale and sold, Giant Food Stores, LLC, Stop & Shop, Inc. and Food Lion, LLC, each of which is owned by Ahold N.V., a Netherlands corporation,included in discontinued operations, there were no tenants that accounted for an aggregate of
approximately 13%, 12% and 11%more than 10% of the
Company’sCompany's total revenues during
2020, 20192023 and
2018, respectively.2022.
For the year ended December 31, 2023, one property constitutes approximately 14.6% of the Company's revenues and five properties constitute approximately 90.4% of the Company's property operating income in the aggregate.
The
Company’sCompany's properties are located largely in the
region straddling the Washington, D.C. to Boston corridor,Northeast, which exposes it to greater economic risks than if the properties it owned were located in a greater number of geographic regions (in particular,
237 of the
Company’sCompany's properties are located in Pennsylvania).
63
Note 6. Receivables, net
Receivables, net at December 31, 2023 and 2022 are composed of the following:
| | | | | | | | | | | |
| December 31, |
| 2023 | | 2022 |
| Rents and other receivables, net | $ | 1,894,000 | | | $ | 2,904,000 | |
| Straight-line rents, net | 4,463,000 | | | 3,231,000 | |
| $ | 6,357,000 | | | $ | 6,135,000 | |
As of December 31, 2023 and 2022, the Company's allowance for uncollectible receivables totaled $0.5 million and $2.6 million, respectively.
Notes to Consolidated Financial Statements
Note
6. ReceivablesReceivables7. Deferred Costs and Other Assets, net
Deferred costs and other assets, net, at December 31,
20202023 and
20192022 are composed of the following:
| | December 31, | |
| | 2020 | | | 2019 | |
Rents and other receivables, net (a) | | $ | 6,541,000 | | | $ | 5,061,000 | |
Mortgage note receivable | | | 3,500,000 | | | | 3,500,000 | |
Straight-line rents, net | | | 11,911,000 | | | | 13,603,000 | |
| | $ | 21,952,000 | | | $ | 22,164,000 | |
| | | | | | | | | | | |
| | December 31, |
| | 2023 | | 2022 |
| Lease origination costs | $ | 5,501,000 | | | $ | 4,747,000 | |
| Right-of-use assets | 2,059,000 | | | 2,062,000 | |
| Prepaid expenses | 1,504,000 | | | 1,029,000 | |
| | | |
| | | |
| Other | 77,000 | | | 86,000 | |
| Total other assets and deferred charges, net | $ | 9,141,000 | | | $ | 7,924,000 | |
| (a)
| Includes $1.9 million of net receivables related to deferred rent as a result of COVID-19 as of December 31, 2020.
|
Note 7. Other Assets and Deferred Charges, Net
Other assets and deferred charges, net, at December 31, 2020 and 2019 are composed of the following:
| | December 31, | |
| | 2020 | | | 2019 | |
Lease origination costs (a) | | $ | 22,331,000 | | | $ | 19,947,000 | |
Right-of-use assets (b) | | | 13,828,000 | | | | 13,638,000 | |
Prepaid expenses | | | 6,906,000 | | | | 6,048,000 | |
Investments related to share-based compensation | | | 948,000 | | | | 823,000 | |
Unsecured revolving credit facility financing costs | | | 623,000 | | | | 1,021,000 | |
Leasehold improvements, furniture and fixtures | | | 85,000 | | | | 200,000 | |
Interest rate swaps | | | — | | | | 136,000 | |
Other | | | 534,000 | | | | 326,000 | |
Total other assets and deferred charges, net | | $ | 45,255,000 | | | $ | 42,139,000 | |
| (a)
| Lease origination costs include the unamortized balance of intangible lease assets resulting from purchase accounting allocations of $5.5 million (cost of $19.4 million and accumulated amortization of $13.9 million) and $6.6 million (cost of $19.9 million and accumulated amortization of $13.3 million) as of December 31, 2020 and 2019, respectively.
|
| (b)
| In connection with of the new lease accounting standard (see Note 2 – “Issued and Adopted Accounting Pronouncements”), the Company recorded right-of-use assets and liabilities based on its future obligation under its ground lease and executive office lease agreements for which the Company is the lessee.
|
Deferred charges are amortized over the terms of the related agreements. Amortization expense related to deferred charges (including amortizationcosts, net of deferred financing costs included in non-operating income and expense)discontinued operations, amounted to $6.2 million, $5.3$1.0 million and $5.2$1.1 million for 2020, 2019,2023 and 2018,2022, respectively. The unamortized balances of deferred lease origination costs is net of accumulated amortization of $37.1$10.7 million and $10.6 million at December 31, 2020. In addition, deferred financing costs relating to the unsecured revolving credit facility is net of accumulated amortization of $2.1 million at December 31, 2020.2023 and 2022, respectively. Deferred lease origination costs and deferred financing costs relating to the unsecured revolving credit facility will be charged to future operations as follows:
64
| | | | | |
| | Lease
origination
costs |
| 2024 | $ | 874,000 | |
| 2025 | 806,000 | |
| 2026 | 747,000 | |
| 2027 | 700,000 | |
| 2028 | 568,000 | |
| Thereafter | 1,806,000 | |
| | $ | 5,501,000 | |
Notes to Consolidated Financial Statements
| | Lease | | | Unsecured revolving | |
| | origination | | | credit facility | |
| | costs | | | financing costs | |
2021 | | $ | 2,436,000 | | | $ | 623,000 | |
2022 | | | 2,094,000 | | | | — | |
2023 | | | 1,805,000 | | | | — | |
2024 | | | 1,467,000 | | | | — | |
2025 | | | 1,196,000 | | | | — | |
Thereafter | | | 13,333,000 | | | | — | |
| | $ | 22,331,000 | | | $ | 623,000 | |
Note 8. Mortgage Loans Payable, and Unsecured Credit Facilities
net
Debt
and finance lease obligations areis composed of the following at December 31,
20202023 and
2019: | | | | December 31, 2020 | | | December 31, 2019 | |
| | | | | | | | Contractual | | | | | | | Contractual | |
| | Maturity | | Balance | | | interest rates | | | Balance | | | interest rates | |
Description | | dates | | outstanding | | | weighted-average | | | outstanding | | | weighted-average | |
Fixed-rate mortgage | | Jun 2026 | | $ | 45,645,000 | | | 3.9% | | | $ | 46,679,000 | | | 3.9% | |
Finance lease obligation | | Sep 2050 | | | 5,631,000 | | | 5.3% | | | | 5,665,000 | | | 5.3% | |
Unsecured credit facilities: | | | | | | | | | | | | | | | | | | |
Variable-rate: | | | | | | | | | | | | | | | | | | |
Revolving credit facility | | Sep 2021 (a) | | | 175,000,000 | | | 2.7%(b) | | | | 106,000,000 | | | 3.2% | |
Term loan | | Sep 2022 | | | 50,000,000 | | | 1.9% | | | | 50,000,000 | | | 3.3% | |
Fixed-rate (c): | | | | | | | | | | | | | | | | | | |
Term loan | | Feb 2022 | | | 50,000,000 | | | 3.3% | | | | 50,000,000 | | | 3.0% | |
Term loan | | Sep 2022 | | | 50,000,000 | | | 3.5% | | | | 50,000,000 | | | 2.8% | |
Term loan | | Apr 2023 | | | 100,000,000 | | | 3.5% | | | | 100,000,000 | | | 3.2% | |
Term loan | | Sep 2024 | | | 75,000,000 | | | 3.9% | | | | 75,000,000 | | | 3.7% | |
Term loan | | Jul 2025 | | | 75,000,000 | | | 4.8% | | | | 75,000,000 | | | 4.6% | |
Term loan | | n/a | | | - | | | - | | | | 75,000,000 | | | 3.6% | |
| | | | | 626,276,000 | | | 3.4% | | | | 633,344,000 | | | 3.5% | |
Unamortized issuance costs | | | | | (2,002,000 | ) | | | | | | | (2,769,000 | ) | | | | |
| | | | $ | 624,274,000 | | | | | | | $ | 630,575,000 | | | | | |
| (a)
| The revolving credit facility is subject to a one-year extension at the Company’s option
|
| (b)
| The interest rate on the revolving credit facility consists of LIBOR plus a credit spread based on the Company’s leverage ratio. The Company has an interest rate swap agreement expiring in February 2021, which converts the LIBOR rate to a fixed rate of 3.9% on $75.0 million of the facility, and a variable-rate of 1.8% on the remaining $100.0 million of the facility, resulting in a blended interest rate of 2.7% at December 31, 2020.
|
| (c)
| The interest rates on these term loans consist of LIBOR plus a credit spread based on the Company’s leverage ratio, for which the Company has interest rate swap agreements which convert the LIBOR rates to fixed rates. Accordingly, these term loans are presented as fixed-rate debt.
|
Unsecured Revolving Credit Facility2022 and Term Loans
The Company has a $300 million unsecured credit facility that consists of (1) a $250 million revolving credit facility, expiring on September 8, 2021, and (2) a $50 million term loan, expiring on September 8, 2022. The revolving credit facility may be extended, at the Company’s option, for an additional one-year period, subject to customary conditions. On August 4, 2020, the Company amended its existing $300 million unsecured credit facility and term loans. After such amendments, the Company’s financial ratios and borrowing base are now all computed using the trailing four quarters as opposed to the current quarter annualized and interest rate swaps that are a hedge of existing debt are now excluded from the definition of debt. Under an accordion feature, the facility can be increased to $750 million, subject to customary conditions and lending commitments. Interest on borrowings under the revolving credit facility component can range from LIBOR plus 135 basis points (“bps”) to 195 bps (165 bpscollateralized by 13 properties at December 31, 2020)2023 and interest on borrowings under the term loan component can range from LIBOR plus 130 to 190 bps (160 bps12 properties at December 31, 2020), each based on2022:
| | | | | | | | | | | | | | | | | | | | | | | | | | | | | | | | |
| | | | | December 31, 2023 | | December 31, 2022 |
| Description | | Maturity
dates | | Balance outstanding | | Contractual
interest rates
weighted-average | | Balance outstanding | | Contractual
interest rates
weighted-average |
| Fixed-rate secured term loans: | | | | | | | | | | |
| Timpany Plaza | | Sep 2028 | | $ | 9,060,000 | | | 7.3% | | $ | — | | | n/a |
| Term loan, 10 properties | | Nov 2032 | | 110,000,000 | | | 5.3% | | 110,000,000 | | | 5.3% |
| Patuxent Crossing/Coliseum Marketplace | | Jan 2033 | | 25,000,000 | | | 6.4% | | 25,000,000 | | | 6.4% |
| | | | 144,060,000 | | | 5.6% | | 135,000,000 | | | 5.5% |
| Unamortized issuance costs | | | | (3,566,000) | | | | | (3,538,000) | | | |
| | | | | $ | 140,494,000 | | | | | $ | 131,462,000 | | | |
On July 11, 2022, in connection with the
Company’s leverage ratio. 65
Cedar Realty Trust, Inc.
Notes to Consolidated Financial Statements
December 31, 2020
The details ofGrocery-Anchored Portfolio Sale, the remaining unsecured term loans are as follows:
Amount | | | Maturity date | | Interest range |
$ | 50,000,000 | | | February 2022 | | LIBOR + 130 bps to 190 bps |
$ | 50,000,000 | | | September 2022 | | LIBOR + 130 bps to 190 bps |
$ | 100,000,000 | | | April 2023 | | LIBOR + 165 bps to 225 bps |
$ | 75,000,000 | | | September 2024 | | LIBOR + 170 bps to 225 bps |
$ | 75,000,000 | | | July 2025 | | LIBOR + 170 bps to 225 bps |
The Company’sCompany's then-existing unsecured credit facility and term loans contain financial covenants including, but not limited to, maximum debt leverage, maximum secured debt, minimum fixed charge coverage,were paid off and minimum net worth. In addition,terminated, and the facility contains restrictions including, but not limited to, limits on indebtedness, certain investmentsthen-existing mortgage loans payable were assumed by the Grocery-Anchored Purchasers.
KeyBank Credit Agreement
On August 22, 2022, the Company entered into the KeyBank Credit Agreement for $130.0 million and distributions. The Company’s failure to complywas collateralized by all of the Company's remaining 19 properties following the Transactions. As of December 31, 2022, the KeyBank Credit Agreement was repaid with the covenants orproceeds from the occurrenceTerm Loan Agreement, 10 properties and Patuxent Crossing/Coliseum Marketplace Loan Agreement.
Term Loan Agreement, 10 properties
On October 28, 2022, the Company entered into the Term Loan Agreement, 10 properties for $110.0 million at a fixed rate of an event5.25% with interest-only payments due monthly. Wheeler REIT, L.P. provided a limited recourse indemnity in connection with such loan. Commencing on December 10, 2027, until the maturity date of default underNovember 10, 2032, monthly principal and interest payments will be made based on a 30-year amortization schedule calculated based on the facilities could result inprincipal amount as of that time. The Term Loan Agreement, 10 properties is collateralized by 10 properties, consisting of Brickyard Plaza, Fairview Commons, Gold Star Plaza, Golden Triangle, Hamburg Square, Pine Grove Plaza, Southington Center, Trexler Mall, Washington Center and Webster Commons, and proceeds were used to paydown the accelerationCompany's KeyBank Credit Agreement.
Patuxent Crossing/Coliseum Marketplace Loan Agreement
On December 21, 2022, the Company entered into the Patuxent Crossing/Coliseum Marketplace Loan Agreement for $25.0 million at a fixed rate of 6.35% with interest-only payments due monthly through maturity on January 6, 2033. The Patuxent Crossing/Coliseum Marketplace Loan Agreement is collateralized by 2 properties, consisting of Patuxent Crossing and Coliseum Marketplace, and proceeds were used to satisfy the remaining obligation of the related debtKeyBank Credit Agreement and exercisereleased the remaining collateral under that agreement.
Timpany Plaza Loan Agreement
On September 12, 2023, the Company entered into the Timpany Plaza Loan Agreement for $11.56 million at a fixed rate of other lender remedies. Although7.27% with interest-only payments due monthly for the credit facility is unsecured, borrowing availability isfirst twelve months. Commencing on September 12, 2024, until the maturity date of September 12, 2028, monthly principal and interest payments will be made based on unencumbered property adjusted net operating income fora 30-year amortization schedule calculated based on the trailing twelve months,principal amount as defined inof that time. On the agreements. Asclosing date, the Company received $9.06 million of the date$11.56 million, and the remaining $2.5 million will be received upon the satisfaction of filing this Form 10-K,certain lease-related contingencies within one year of the Company had $175.0 million outstanding and $56.7 available for additional borrowings under its revolving credit facility, and was in compliance with all financial covenants. Additionally, the COVID-19 pandemic may negatively impact the Company’s future ability to remain compliant with all financial covenants, including the ability to generate sufficient unencumbered property adjusted net operating income to support current borrowings.agreement date. The Company’s unencumbered property adjusted net operating income was not significantly impactedTimpany Plaza Loan Agreement is collateralized by the COVID-19 pandemic until the quarter ended June 30, 2020. Accordingly, not until the quarter ended MarchTimpany Plaza shopping center.
Cedar Realty Trust, Inc.
Notes to Consolidated Financial Statements
December 31, 2021, will the unencumbered property adjusted net operating income for the trailing twelve months fully reflect the negative impact of the COVID-19 pandemic2023
Scheduled. Scheduled Principal Payments
Scheduled principal payments on
a mortgage loan payable, finance lease obligation, unsecuredsecured term loans
and the unsecured credit facility at December 31,
2020,2023, due on various dates from
20212024 to
2050,2033, are as follows:
| | | | | | | | | | | | | | | | | | | | | | | | | | | | |
| | Mortgage Loan | | | Finance Lease | | | Revolving | | | Term | | | | | | | Unamortized | | | | | |
Year | | Payable | | | Obligation | | | Credit Facility | | | Loans | | | Total | | | Issuance Costs | | | Total | |
2021 | | $ | 1,074,000 | | | $ | 35,000 | | | | 175,000,000 | | (a) | $ | - | | | $ | 176,109,000 | | | $ | (647,000 | ) | | $ | 175,462,000 | |
2022 | | | 1,116,000 | | | | 37,000 | | | | - | | | | 150,000,000 | | | | 151,153,000 | | | | (499,000 | ) | | | 150,654,000 | |
2023 | | | 1,160,000 | | | | 39,000 | | | | - | | | | 100,000,000 | | | | 101,199,000 | | | | (274,000 | ) | | | 100,925,000 | |
2024 | | | 1,206,000 | | | | 41,000 | | | | - | | | | 75,000,000 | | | | 76,247,000 | | | | (207,000 | ) | | | 76,040,000 | |
2025 | | | 1,253,000 | | | | 44,000 | | | | - | | | | 75,000,000 | | | | 76,297,000 | | | | (115,000 | ) | | | 76,182,000 | |
Thereafter | | | 39,836,000 | | | | 5,435,000 | | | | - | | | | - | | | | 45,271,000 | | | | (260,000 | ) | | | 45,011,000 | |
| | $ | 45,645,000 | | | $ | 5,631,000 | | | $ | 175,000,000 | | | $ | 400,000,000 | | | $ | 626,276,000 | | | $ | (2,002,000 | ) | | $ | 624,274,000 | |
| | | | | |
| 2024 | $ | 74,000 | |
| 2025 | 306,000 | |
| 2026 | 329,000 | |
| 2027 | 481,000 | |
| 2028 | 9,456,000 | |
| Thereafter | 133,414,000 | |
| | $ | 144,060,000 | |
| (a)
| The revolving credit facility is subject to a one-year extension at the Company's option.
|
Derivative Financial Instruments
At December 31, 2020,
The Company terminated its outstanding interest rate swaps as part of the
Company had $18.9Grocery-Anchored Portfolio Sale for a $3.4 million
benefit, which is included in
accounts payable and accrued liabilitiesinterest expense, net on the consolidated
balance sheet relating tostatement of operations for the
fair value of the interest rate swaps applicable to the unsecured term loans discussed above.year ended December 31, 2022. Charges and/or credits relating to the changes in the fair value of the interest rate swaps
arewere made to accumulated other comprehensive
income (loss), noncontrolling interests (minority interests in consolidated joint ventures andloss, limited
partners’ interest),partners' interest, or operations (included in interest expense), as applicable. Over time, the unrealized gains and losses recorded in accumulated other comprehensive loss
will bewere reclassified into earnings as an increase or reduction to interest expense in the same periods in which the hedged interest payments
affectaffected earnings.
The Company estimates that approximately $6.9 million of accumulated other comprehensive loss will be reclassified as a charge to earnings within the next twelve months.66
Cedar Realty Trust, Inc.
Notes to Consolidated Financial Statements
December 31, 2020
The following is a summary of the derivative financial instruments held by the Company at December 31, 2020 and December 31, 2019:
December 31, 2020 |
Designation/ | | | | | | | | Fair | | | Maturity | | Balance sheet |
Cash flow | | Derivative | | Count | | | value | | | dates | | location |
Qualifying | | Interest rate swaps | | | 7 | | | $ | 18,927,000 | | | 2021-2025 | | Accounts payable and accrued liabilities |
| | | | | | | | | | | | | | |
December 31, 2019 |
Designation/ | | | | | | | | Fair | | | Maturity | | Balance sheet |
Cash flow | | Derivative | | Count | | | value | | | dates | | location |
Qualifying | | Interest rate swaps | | | 2 | | | $ | 136,000 | | | 2020-2023 | | Other assets and deferred charges, net |
Qualifying | | Interest rate swaps | | | 6 | | | $ | 7,180,000 | | | 2021-2025 | | Accounts payable and accrued liabilities |
| | | | | | | | | | | | | | |
The notional values of the interest rate swaps held by the Company at December 31, 2020 and December 30, 2019 were $425.0 million and $425.0 million, respectively.
The following presents the effect of the Company’sCompany's derivative financial instruments on the consolidated statements of operations and the consolidated statements of equity 2020, 2019for the years ended 2023 and 2018,2022, respectively:
| | | | (Loss) gain recognized in other | |
| | | | comprehensive (loss) income | |
| | | | (effective portion) | |
Designation/ | | | | Years ended December 31, | |
Cash flow | | Derivative | | 2020 | | | 2019 | | | 2018 | |
Qualifying | | Interest rate swaps | | $ | (17,940,000 | ) | | $ | (13,090,000 | ) | | $ | 2,185,000 | |
| | | | | | | | | | | | | | |
| | | | Gain (loss) recognized in other | |
| | | | comprehensive (loss) income | |
| | | | reclassified into earnings (effective portion) | |
| | | | Years ended December 31, | |
| | Classification | | 2020 | | | 2019 | | | 2018 | |
| | Continuing Operations | | $ | (6,062,000 | ) | | $ | 1,196,000 | | | $ | 667,000 | |
| | | | | | | | | | | | | | | | | | | | |
| | | | Gain recognized in other
comprehensive income (loss)
(effective portion) |
Designation/
Cash flow | | Derivative | | Years ended December 31, |
| | 2023 | | 2022 |
| Qualifying | | Interest rate swaps | | $ | — | | | $ | 6,001,000 | |
| | | | | | | |
| | | | (Loss) recognized in other
comprehensive income (loss)
reclassified into earnings (effective portion) |
| | | | | Years ended December 31, |
| | | Classification | | 2023 | | 2022 |
| | | Continuing Operations | | $ | — | | | $ | (2,320,000) | |
As of December 31, 2020, the Company believes it has no significant risk associated with non-performance of the financial institutions which are the counterparties to its derivative contracts.
Note 9. Intangible Lease Asset/Liability
Unamortized intangible lease liabilities that relate to
below-marketbelow market leases amounted to
$8.9$2.7 million and
$10.5$3.1 million at December 31,
20202023 and December 31,
2019,2022, respectively. Unamortized intangible lease assets that relate to
above-marketabove market leases amounted to
$0.2$0.0 million and
$0.4$0.1 million at December 31,
20202023 and December 31,
2019,2022, respectively.
67
Notes to Consolidated Financial Statements
The unamortized balance of intangible lease liabilities at December 31,
20202023 is net of accumulated amortization of
$32.3$43.3 million, and will be credited to future operations as follows:
2021 | | $ | 931,000 | |
2022 | | | 865,000 | |
2023 | | | 794,000 | |
| 2024 | | | 630,000 | |
2025 | | | 619,000 | |
| 2026 | |
| 2027 | |
| 2028 | |
Thereafter | | | 5,100,000 | |
| | $ | 8,939,000 | |
| | | | |
Note 10. Commitments and Contingencies
The Company is a party to certain legal actions arising in the normal course of business. Management does not expect there to be adverse consequences from these actions that would be material to the Company’s consolidated financial statements.
Under various federal, state, and local laws, ordinances, and regulations, an owner or operator of real estate may be required to investigate and clean up hazardous or toxic substances, or petroleum product releases, at its properties. The owner may be liable to governmental entities or to third parties for property damage, and for investigation and cleanup costs incurred by such parties in connection with any contamination. Generally, the Company’s tenants must comply with environmental laws and meet any remediation requirements. In addition, leases typically impose obligations on tenants to indemnify the Company from any compliance costs the Company may incur as a result of environmental conditions on the property caused by the tenant. However, if a lease does not require compliance, or if a tenant fails to or cannot comply, the Company could be forced to pay these costs. Management is unaware of any environmental matters that would have a material impact on the Company’s consolidated financial statements.
The Company’s executive offices are located at 44 South Bayles Avenue, Port Washington, New York. The terms of the lease, which will expire in February 2021, provide for future minimum rents of $0.1 million in 2021.
The Company is the lessee under several ground lease
agreements and its executive office lease
agreements. In accordance withagreement. The executive office lease agreement was terminated during the
adoptionthird quarter of
the new lease accounting standard (see Note 2 – “Issued and Adopted Accounting Pronouncements”), the Company recorded right-of-use assets and related lease liabilities for these leases as of January 1, 2019.2022. As of December 31,
2020,2023, the
Company’sCompany's weighted average remaining lease term is approximately
30.747.8 years and the weighted average discount rate used to calculate the
Company’sCompany's lease liability is approximately
5.7%8.6%. Rent expense under the
Company’sCompany's ground lease and executive office lease agreements was approximately
$1.8 million, $1.7$0.2 million and
$1.1$0.3 million for
2020, 20192023 and
2018,2022, respectively.
The following table represents a reconciliation of the
Company’sCompany's undiscounted future minimum lease payments for its ground lease and executive office lease agreements applicable to
right-of-uselease liabilities as of December 31,
2020:2023:2021 | | $ | 1,113,000 | |
2022 | | | 1,112,000 | |
2023 | | | 1,112,000 | |
| 2024 | | | 1,114,000 | |
2025 | | | 993,000 | |
| 2026 | |
| 2027 | |
| 2028 | |
Thereafter | | | 28,554,000 | |
Total undiscounted future minimum lease payments | | | 33,998,000 | |
Future minimum lease payments, discount | | | (19,921,000 | ) |
Right-of-use liabilities | | $ | 14,077,000 | |
| Lease liabilities | |
68
Insurance
The Company carries comprehensive liability, property, fire, flood, wind, extended coverage, business interruption and rental loss insurance covering all of the properties in its portfolio under an insurance policy, in addition to other coverages, such as trademark and pollution coverage that may be appropriate for certain of its properties. Additionally, the Company carries a directors', officers', entity and employment practices liability insurance policy that covers such claims made against the Company and its directors and officers. The Company believes the policy specifications and insured limits are appropriate and adequate for its properties given the relative risk of loss, the cost of the coverage and industry practice; however, its insurance coverage may not be sufficient to fully cover losses.
Regulatory and Environmental
As the owner of the buildings on our properties, the Company could face liability for the presence of hazardous materials (e.g., asbestos or lead) or other adverse conditions (e.g., poor indoor air quality) in its buildings. Environmental laws govern the presence, maintenance, and removal of hazardous materials in buildings, and if the Company does not comply with such laws, it could face fines for such noncompliance. Also, the Company could be liable to third parties (e.g., occupants of the buildings) for damages related to exposure to hazardous materials or adverse conditions in its buildings, and the Company could incur material expenses with respect to abatement or remediation of hazardous materials or other adverse conditions in its buildings. In addition, some of the Company's tenants routinely handle and use hazardous or regulated substances and wastes as part of their operations at our properties, which are subject to regulation. Such environmental and health and safety laws and regulations could subject the Company or its tenants to
Notes to Consolidated Financial Statements
December 31, 20202023
liability resulting from these activities. Environmental liabilities could affect a tenant's ability to make rental payments to the Company, and changes in laws could increase the potential liability for noncompliance. This may result in significant unanticipated expenditures or may otherwise materially and adversely affect the Company's operations. The Company is not aware of any material contingent liabilities, regulatory matters or environmental matters that may exist.
Litigation
The Company is involved in various legal proceedings in the ordinary course of its business, including, but not limited to commercial disputes. The Company believes that such litigation, claims and administrative proceedings will not have a material adverse impact on its financial position or its results of operations. The Company records a liability when it considers the loss probable and the amount can be reasonably estimated. In addition, the below legal proceedings are in process:
As described in Note 1, on March 2, 2022, the Company entered into definitive agreements for the Transactions, which provided for the sale of the Company and its assets in a series of related all-cash transactions. On April 8, 2022, several purported holders of the Company's outstanding preferred stock filed a putative class action complaint against the Company, the Board of Directors prior to the Merger, and WHLR in Montgomery County Circuit Court, Maryland entitled Sydney, et al. v. Cedar Realty Trust, Inc., et al., (Case No. C-15-CV-22-001527).
On May 6, 2022, the Plaintiffs in Sydney filed a motion for a preliminary injunction. Also on May, 6, 2022, a purported holder of the Company's outstanding preferred stock filed a separate putative class action complaint against the Company and the Board of Directors prior to the Merger in the United States District Court for the District of Maryland, entitled Kim v. Cedar Realty Trust, Inc., et al., Civil Action No. 22-cv-01103. On May 11, 2022, the Company, the former Board of Directors of the Company and WHLR removed the Sydney action to the United States District Court for the District of Maryland, Case No. 8:22-cv-01142-GLR. On May 16, 2022, the court ordered that a hearing on the Sydney Plaintiffs' motion for preliminary injunction be held on June 22, 2022. On June 2, 2022, the Plaintiffs in Kim also filed a motion for a preliminary injunction. The court consolidated the motions for preliminary injunction.
On June 23, 2022, following a hearing, the court issued an order denying both motions for preliminary injunction, holding that the Plaintiffs in both cases were unlikely to succeed on the merits and that Plaintiffs had not established that they would suffer irreparable harm if the injunction was denied.
By order dated July 11, 2022, the court consolidated the Sydney and Kim cases and set an August 24, 2022 deadline for the Plaintiffs in both cases to file a consolidated amended complaint. Plaintiffs filed their amended complaint on August 24, 2022. The amended complaint alleges on behalf of a putative class of holders of the Company's preferred stock, among other things, claims for breach of contract against the Company and the former Board of Directors with respect to the articles supplementary governing the terms of the Company's preferred stock, breach of fiduciary duty against the former Board of Directors, and tortious interference and aiding and abetting breach of fiduciary duty against WHLR. On October 7, 2022, Defendants moved to dismiss the amended complaint. Plaintiffs opposed the motion to dismiss and filed a motion to certify a question of law to Maryland's Supreme Court. On August 1, 2023, the court issued a decision and order granting Defendants' motions to dismiss, without leave to amend, and denying Plaintiffs' motion to certify a question of law to the Maryland Supreme Court. The Plaintiffs appealed the dismissal to the United States Court of Appeals for the Fourth Circuit, Case No. 23-1905, docketed on August 30, 2023. The appeal has been fully briefed. At this juncture, the outcome of the litigation remains uncertain.
On July 11, 2022, a purported holder of the Company's outstanding preferred stock filed a complaint against the Company and the Board of Directors prior to the Merger in the United States District Court for the Eastern District of New York, entitled High Income Securities Fund v. Cedar Realty Trust, Inc., et al., No. 2:22-cv-4031. The complaint alleged that the Defendants violated Section 10(b) of the Exchange Act and SEC Rule 10b-5 promulgated thereunder by making false and misleading statements and omissions, and that the former Board of Directors are control persons under Section 20(a) of the Exchange Act. On September 25, 2023, the Court granted Defendants' motion to dismiss the complaint with prejudice, and the time within which the Plaintiff could have appealed such decision has passed.
On October 14, 2022, a purported holder of the Company's outstanding preferred stock filed a putative class action against the Company, the Board of Directors prior to the Merger, and WHLR in Nassau County Supreme Court, New York entitled Krasner v. Cedar Realty Trust, Inc., et al., (Case No. 613985/2022). The complaint alleges on behalf of a putative class of holders of the Company's preferred stock, among other things, claims for breach of contract against the Company and the former Board of Directors with respect to the articles supplementary governing the terms of the Company's preferred stock, breach of fiduciary duty against the
Cedar Realty Trust, Inc.
Notes to Consolidated Financial Statements
December 31, 2023
former Board of Directors, and tortious interference and aiding and abetting breach of fiduciary duty against WHLR. The complaint seeks, among other relief, an award of monetary damages, attorneys' fees, and expert fees. The Defendants filed motions in the Nassau County action to dismiss or stay the case based both on the pendency of the lawsuit in Maryland in which the same claims were asserted by other preferred stockholders and on the merits. The court held a hearing on the motions on October 27, 2023, and on December 4, 2023 granted the motions to dismiss based on the pendency of the lawsuit in Maryland without addressing the merits.
Note 11.
Shareholders’Shareholders' Equity
The Company’sCompany's 7.25% Series B Cumulative Redeemable Preferred Stock “"Series B Preferred Stock”Stock" has no stated maturity, is not convertible into any other security of the Company, and is redeemable, in whole or in part, at the Company’sCompany's option beginning May 22, 2017 at a price of $25.00 per share plus accrued and unpaid distributions. The Company’sCompany's 6.50% Series C Cumulative Redeemable Preferred Stock “"Series C Preferred Stock”Stock" has no stated maturity, is not convertible into any other security of the Company, and is redeemable at the Company’sCompany's option beginning August 24, 2022 at a price of $25.00 per share plus accrued and unpaid distributions. The Company is authorized to issue up to 12,500,000 shares of preferred stock. The following tables summarize details about the
Company’sCompany's preferred stock:
| | Series B
Preferred Stock | |
| Par value | |
| Par value | |
| Par value | |
| Liquidation value | |
| Liquidation value | |
| Liquidation value | |
| | Series B | | | Series C | | | | | | | | | |
| | Preferred Stock | | | Preferred Stock | | | | | | | | | |
Par value | | $ | 0.01 | | | $ | 0.01 | | | | | | | | | |
Liquidation value | | $ | 25.00 | | | $ | 25.00 | | | | | | | | | |
| | |
| | | | | | | | | | | | | | | | |
| | December 31, 2020 | | | December 31, 2019 | |
| | Series B | | | Series C | | | Series B | | | Series C | | December 31, 2023 | | December 31, 2022 |
| | Preferred Stock | | | Preferred Stock | | | Preferred Stock | | | Preferred Stock | | | Series B
Preferred Stock | | Series C
Preferred Stock | | Series B
Preferred Stock | | Series C
Preferred Stock |
Shares authorized | | | 1,450,000 | | | | 6,450,000 | | | | 1,450,000 | | | | 6,450,000 | |
Shares issued and outstanding | | | 1,450,000 | | | | 5,000,000 | | | | 1,450,000 | | | | 5,000,000 | |
Balance | | $ | 34,767,000 | | | $ | 124,774,000 | | | $ | 34,767,000 | | | | 124,774,000 | |
On January 12, 2018, the Company redeemed 2,000,000 shares of Series B Preferred Stock at a price of $25.00 per share for an aggregate of $50.0 million, plus all accrued and unpaid dividends up to (but excluding) the redemption date.
Common Stock
On November 25, 2020, the Company effected a 1-for-6.6 reverse stock split of the issued and outstanding shares of common stock. Each 6.6 shares of the Company's issued and outstanding common stock were combined into one share of the Company's common stock. The number of authorized shares and the par value of the common stock were not changed. In addition, the Company amended the Limited Partnership Agreement of our Operating Partnership to effect a corresponding reverse split of the partnership interests of the Operating Partnership. In accordance with GAAP, all shares of common stock, restricted stock units, OP Units and per share/unit information that are presented in this Form 10-K were adjusted to reflect the reverse split on a retroactive basis for all periods presented.
On December 18, 2018, the Company’s Board of Directors approved a stock repurchase program, which authorized the Company to purchase up to $30.0 million of the Company’s common stock in the open market or through private transactions, subject to market conditions. The stock repurchase program expired on December 18, 2019. During 2018, the Company repurchased approximately 117,000 shares at a weighted average price per share of $19.91. During 2019, the Company repurchased an additional 311,000 shares at a weighted average price per share of $22.03. Since approval of the plan on December 18, 2018, the Company has repurchased 428,000 shares at a weighted average price per share of $21.45.
The Company
hashad a Dividend Reinvestment and Direct Stock Purchase Plan
(“DRIP”("DRIP") which
offersoffered a convenient method for shareholders to invest cash dividends and/or make optional cash payments to purchase shares of the
Company’sCompany's common stock. Such purchases
arewere at 100% of market value. There were no significant transactions under the DRIP during
2020, 2019 and 2018.2022. At December 31,
2020,2022, there
remained 427,000were no shares authorized under the
DRIP.
69
Cedar Realty Trust, Inc.
Notes to Consolidated Financial Statements
December 31, 2020
DRIP since the DRIP was terminated in connection with the Transactions.
The following table provides a summary of dividends declared and paid per share:
| | | Years ended December 31, | | | Years ended December 31, |
| | 2020 | | | 2019 | | | 2018 | | | 2023 | | 2022 |
Common stock | | $ | 0.528 | | | $ | 1.320 | | | $ | 1.320 | |
7.25% Series B Preferred Stock | | $ | 1.812 | | | $ | 1.812 | | | $ | 1.812 | |
6.50% Series C Preferred Stock | | $ | 1.625 | | | $ | 1.625 | | | $ | 1.625 | |
On August 9, 2022, the Company's Board of Directors declared a special dividend on shares of the Company's outstanding common stock of $19.52 per share, payable to holders of record of the Company's common stock at the close of business on August 19, 2022.
Cedar Realty Trust, Inc.
Notes to Consolidated Financial Statements
December 31, 2023
On August 26, 2022, the Company paid merger consideration of $9.48 per share on shares of the Company's outstanding common stock.
At December 31,
20202023 and
2019,2022, there were $1.2 million and $1.2 million, respectively, of accrued preferred stock dividends.
On January 15, 2021, the Company’s Board of Directors declared a dividend of $0.066 per share with respect to its common stock. At the same time, the Board declared a dividend of $0.453125 and $0.406250 per share with respect to the Company’s Series B Preferred Stock and Series C Preferred Stock, respectively. The distributions are payable on February 22, 2021 to shareholders of record on February 10, 2021.
Rental revenues for
2020, 20192023 and
2018,2022, respectively, are comprised of the following:
| | Years ended December 31, | |
| | 2020 | | | 2019 | | | 2018 | |
Base rents | | $ | 95,987,000 | | | $ | 105,041,000 | | | $ | 107,630,000 | |
Expense recoveries | | | 29,241,000 | | | | 33,475,000 | | | | 33,378,000 | |
Percentage rent | | | 1,778,000 | | | | 971,000 | | | | 725,000 | |
Straight-line rents | | | (1,208,000 | ) | | | 405,000 | | | | 1,142,000 | |
Amortization of intangible lease liabilities, net | | | 1,373,000 | | | | 2,827,000 | | | | 4,361,000 | |
Total rents | | $ | 127,171,000 | | | $ | 142,719,000 | | | $ | 147,236,000 | |
| | | | | | | | | | | | |
| | | | | | | | | | | |
| Years ended December 31, |
| 2023 | | 2022 |
| Base rents | $ | 23,902,000 | | | $ | 23,997,000 | |
| Expense recoveries - variable lease revenue | 7,705,000 | | | 8,001,000 | |
| Percentage rent - variable lease revenue | 479,000 | | | 531,000 | |
| Straight-line rents | 854,000 | | | 77,000 | |
| Above (below) market lease amortization, net | 336,000 | | | 896,000 | |
| 33,276,000 | | | 33,502,000 | |
| Credit adjustments on operating lease receivables | 711,000 | | | (539,000) | |
| Total rental revenues | $ | 33,987,000 | | | $ | 32,963,000 | |
The Company
reviews the collectability of charges under its tenant operating leases on a regular basis, taking into consideration changes in factors such as the tenant's payment history, the financial condition of the tenant, business conditions in the industry in which the tenant operates and economic conditions in the area where the property is located. In the event that collectability with respect to any tenant changes, the Company recognizes
lease termination income when the following conditions are met: (1) the lease termination agreement has been executed, (2) the lease termination fee is determinable, (3) all the Company’s landlord services pursuantan adjustment to rental income. The Company's review of collectability of charges under its operating leases includes any accrued rental revenues related to the
terminated lease have been rendered, and (4) collectabilitystraight-line method of
the lease termination fee is assured. On January 31, 2020, the Company agreed to a cash payment in consideration for permitting a dark anchor tenant to terminate its lease prior to the contractual expiration at Metro Square. As a result of this termination, revenues for 2020, included approximately $7.1 million of other income. In April 2018, the Company accepted a cash payment of $4.3 million in consideration for permitting a dark anchor tenant to terminate its lease prior to the contractual expiration. As a result of this termination, revenues for 2018 includes $5.4 million, consisting of (1) $3.8 million of other income (the $4.3 million cash payment reduced by $0.5 million straight-line rent receivable) and (2) $1.5 million accelerated intangible lease liability amortization.reporting rental revenue.
Annual future base rents due to be received under non-cancelable operating leases in effect at December 31,
20202023 are approximately as
follows (excluding those base rents applicable to properties classified as real estate held for sale):follows:2021 | | $ | 93,213,000 | |
2022 | | | 85,973,000 | |
2023 | | | 85,650,000 | |
| 2024 | | | 75,194,000 | |
2025 | | | 62,652,000 | |
| 2026 | |
| 2027 | |
| 2028 | |
Thereafter | | | 334,634,000 | |
| | $ | 737,316,000 | |
| $ | |
Total future minimum rents do not include expense recoveries for real estate taxes and operating costs, or percentage rents based upon
tenants’tenants' sales volume.
Such additional revenue amounts aggregated approximately $31.1 million, $34.4 million and $34.1 million for 2020, 2019 and 2018, respectively. Such amounts do not include amortization of intangible lease liabilities.
70
Cedar Realty Trust, Inc.
Notes to Consolidated Financial Statements
December 31, 2020
Note 13. 401(k) Retirement Plan
The Company hashad a 401(k) retirement plan (the “Plan”"Plan"), which permitspermitted all eligible employees to defer a portion of their compensation under the Code. Pursuant to the provisions of the Plan, the Company maycould make discretionary contributions on behalf of eligible employees. The Company made contributions to the Plan of $375,000, $387,000, and $371,000$145,000 for 2020, 2019, and 2018, respectively.2022. The Plan was terminated as a result of the Company's merger with WHLR.
Cedar Realty Trust, Inc.
Notes to Consolidated Financial Statements
December 31, 2023
Note 14. Share-Based Compensation The following tables set forth certain share-based compensation information for
2020, 2019,2023 and
2018,2022, respectively:
| | Years ended December 31, | |
| | 2020 | | | 2019 | | | 2018 | |
Expense relating to share/unit grants | | $ | 3,954,000 | | | $ | 4,496,000 | | | $ | 4,217,000 | |
Amounts capitalized | | | (231,000 | ) | | | (379,000 | ) | | | (454,000 | ) |
Total charged to operations | | $ | 3,723,000 | | | $ | 4,117,000 | | | $ | 3,763,000 | |
| | | | | | | | | | | | |
| | | | | | Weighted average | | | | | |
| | Shares | | | grant date value | | | | | |
Unvested shares/units, December 31, 2019 | | | 645,000 | | | $ | 27.92 | | | | | |
Restricted share grants | | | 63,000 | | | $ | 17.48 | | | | | |
Vested during period | | | (59,000 | ) | | $ | 37.73 | | | | | |
Forfeitures/cancellations | | | (7,000 | ) | | $ | 40.38 | | | | | |
Unvested shares/units, December 31, 2020 | | | 642,000 | | | $ | 25.86 | | | | | |
| | | | | | | | | | | |
| | Years ended December 31, |
| | 2023 | | 2022 |
| Expense relating to share/unit grants | $ | — | | | $ | 1,662,000 | |
| Amounts capitalized | — | | | (54,000) | |
| Total charged to operations | $ | — | | | $ | 1,608,000 | |
At December 31,
2020, approximately 0.3 million2023 and 2022, there were no shares
remained available for grants pursuant to the
Company's 2017
Stock Incentive Plan
and, at that date, there remained an aggregate of $5.8 million applicable to all grants and awards to be expensed over a weighted average period of 2.1 years.since this plan was terminated in connection with the Merger.
During
2020,2022, there were
63,0007,000 time-based restricted shares issued with a weighted average grant date fair value of
$17.48$26.31 per share.
During 2019, there were 79,000 time-based restricted shares issued, with a weighted average grant date fair value of $21.25 per share. Excluding the grants relating to the Company’s President and CEO (see below), during 2018, there were 92,000 time-based restricted shares issued, with a weighted average grant date fair value of $32.54 per share.The total fair
valuesvalue of shares vested during
2020, 2019, and 2018 were $938,000, $485,000, and $7,556,000, respectively.2022 was $11.9 million.
Former President and CEO Employment Contract
Upon employment on June 15, 2011, the Company’s President and CEO received restricted share grants totaling 378,800 shares, one-half of which was time-based, vesting upon the seventh anniversary of the date of grant (June 15, 2018), and the other half market performance-based, to be earned if the total annual return on an investment in the Company’s common stock (“TSR”) was at least an average of 6.5% per year for the seven years ended June 15, 2018.
On June 15, 2018,
approximately 189,400 time-based shares vested and approximately 189,400 market performance-based shares were forfeited as the
market performance criteria was not achieved.On June 15, 2018, in connection with a new amended and restated employment agreement, the Company’s PresidentCompany's then-President and CEO received an approximate 152,000 time-based restricted share grant at a market price of $28.91. However, as a result of an existing limitation within the 2017 Plan, only approximately 114,000 shares were granted on June 15, 2018, with the remaining 38,000 shares granted on January 1, 2019. All 152,000 time-based restricted shares will vest upon the fifth anniversary of the effective date of the employment agreement (June 15, 2023), subject to the Company’s President and CEO continuous employment with the Company through such date, subject to certain exceptions. Consistent with such time-based restricted grant awards to other participants, dividends will be paid on these shares.
71
Cedar Realty Trust, Inc.
Notes to Consolidated Financial Statements
December 31, 2020
In addition, on June 15, 2018, the Company’s President and CEO was also granted a market performance-based equity award of approximately 227,000227,272 restricted stock units (“RSUs”("RSUs") and approximately 227,000227,272 dividend equivalent rights ("DERs") of the Company. Each RSU represents a contingent right to receive one share of common sharestock if certain market performance criteria are achieved. Each DER accrues and will be deemed to be reinvested into the Company's common stock for which payment will only be made for the portion of the market performance-based equity award that are earned and vest. During the three years ending June 15, 2021 (the “Interim"Interim Performance Period”Period"), a maximum of approximately 114,000113,636 shares can bewere earned. Any portion of the market performance basedperformance-based equity award that iswas not earned as of the end of the Interim Performance Period willwas to be carried forward for calculation for the five years ending June 15, 2023 (the “Full"Full Performance Period”Period"). The percentage of the market performance-based equity award to be earned willwas to be determined based on the Company’s averageCompany's annual TSRreturn on an investment in the Company's common stock ("TSR") over the Interim Performance Period and/or over the Full Performance Period as follows: if average annual TSR (1) is below 4%, the percentage of grant earned would be 0%, (2) equals 4%, the percentage of grant earned would be 33.3%, (3) equals 6.5%, the percentage of grant earned would be 66.7%, and (4) equals 10% or above, the percentage of grant earned would be 100%. Linear interpolation shallwas to be applied to determine the percentage of the market performance-based equity award that is earned where the average annual TSR over the performance period falls between the percentages set forth above. An independent appraisal determined the value of theBased on market performance-based equity awardperformance for the interim and full performance periods to be $21.78 and $19.60 per share, respectively, compared to a market price at the date of grant of $28.91 per share.
The dividend equivalent rights will accrue and will be deemed to be reinvested into the Company’s common stock and payment with respect to the dividend equivalent rights will be deferred until the end of the Interim Performance Period, orit was determined the Full Performance
Period, asCompany's then-President and CEO earned 113,636 shares. Accordingly, on July 20, 2021, the case may be,Company issued 113,636 common shares to coincidethe then-President and CEO and paid him $0.3 million for the related DERs.
On August 22, 2022, due to a change in control of the Company in connection with the vesting, if any,Transactions, the RSUs fully vested. On August 26, 2022, the Company's then-President and CEO received an aggregate cash payment of $3.3 million, representing the market performance-based equity award. Payment will only be madeaggregate per share merger consideration and per share special dividend amount attributable to the vested RSUs, along with $0.5 million for the portion of the market performance-based equity award that is earned and vests.related DERs.
Note 15. Earnings Per Share
Basic earnings per share (“EPS”("EPS") is calculated by dividing net income (loss) attributable to the Company’sCompany's common shareholders by the weighted average number of common shares outstanding for the period including participating securities (restricted shares that have non-forfeitable rights to receive dividends issued pursuant to the Company’sCompany's share-based compensation program are considered participating securities). Unvested restricted shares that are participating securities are not allocated net losses and/or any excess of dividends declared over net income, as such amounts are allocated entirely to the common shareholders. For 2020, 20192023 and 2018,2022, the
Cedar Realty Trust, Inc.
Notes to Consolidated Financial Statements
December 31, 2023
Company had 0.4 million, 0.40.0 million and 0.50.2 million, respectively, of weighted average unvested restricted shares outstanding. The following table provides a reconciliation of the numerator and denominator of the EPS calculations for the 2020, 20192023 and 2018,2022, respectively:
| | | Years ended December 31, | | | Years ended December 31, |
| | 2020 | | | 2019 | | | 2018 | | | 2023 | | 2022 |
Numerator | | | | | | | | | | | | | Numerator | | | |
Net (loss) income | | $ | (520,000 | ) | | $ | 1,566,000 | | | $ | 4,358,000 | |
| Net income (loss) from continuing operations | |
Preferred stock dividends | | | (10,752,000 | ) | | | (10,752,000 | ) | | | (10,863,000 | ) |
Preferred stock redemption costs | | | - | | | | - | | | | (3,507,000 | ) |
Net (income) attributable to noncontrolling interests | | | (552,000 | ) | | | (490,000 | ) | | | (469,000 | ) |
| Net loss attributable to noncontrolling interests | |
Net earnings allocated to unvested shares | | | (238,000 | ) | | | (558,000 | ) | | | (628,000 | ) |
Net (loss) attributable to vested common shares | | $ | (12,062,000 | ) | | $ | (10,234,000 | ) | | $ | (11,109,000 | ) |
| Loss from continuing operations, net of noncontrolling interest, attributable to vested common shares | |
| Income from discontinued operations, net of noncontrolling interests, attributable to vested common shares | |
| Net (loss) income attributable to vested common shares | |
Denominator | | | | | | | | | | | | | Denominator | | | |
Weighted average number of vested common shares outstanding, basic and diluted | | | 13,104,000 | | | | 13,082,000 | | | | 13,397,000 | |
| Net (loss) income per common share attributable to common shareholders (basic and diluted): | | Net (loss) income per common share attributable to common shareholders (basic and diluted): | | | |
| Continuing operations | |
| Discontinued operations | |
| | | | | | | | | | | | |
Net (loss) per common share attributable to common shareholders, basic and diluted | | $ | (0.92 | ) | | $ | (0.78 | ) | | $ | (0.83 | ) |
Fully-diluted EPS reflects the potential dilution that could occur if securities or other contracts to issue common stock were exercised or converted into shares of common stock. For
2020, 2019 and 2018, 0 restricted stock units2023, there were no market performance-based equity awards issued or outstanding. For 2022, no RSUs would have been issuable under the
Company’s PresidentCompany's then-President and
CEOCEO's market performance-based equity award (see Note 14,
– “Share-Based Compensation”)Share-Based Compensation) had the measurement
periodsperiod ended on December 31,
2020, 20192022, and
2018, respectively. Therefore,therefore, this market performance-based equity award had no impact in calculating diluted EPS for
2020, 2019 and 2018.this period. Net loss attributable to noncontrolling interests of the Operating Partnership has been excluded from the numerator and the related OP Units have been excluded from the denominator for the purpose of calculating diluted EPS as there would have been no
dilutive effect had such amounts been included. The weighted average number of OP Units outstanding was
81,000, 83,0000 and
65,00044,000 for
2020, 20192023 and
2018,2022, respectively.
72
Note 16. Related Party Transactions
With the completion of the Company's merger with WHLR, the Company became a subsidiary of WHLR. WHLR performs property management and leasing services for the Company pursuant to the Wheeler Real Estate Company Management Agreement. The management fee is 4% of gross operating income, and leasing commissions range from 3% to 6%. During the years ended December 31, 2023 and 2022, the Company paid WHLR $2.1 million and $1.0 million, respectively, for these services. The Operating Partnership and WHLR's operating partnership, Wheeler REIT, L.P., are party to the Cost Sharing Agreement. The related party amounts due to WHLR at December 31, 2023 and 2022 are comprised of:
| | | | | | | | | | | |
| December 31, |
| 2023 | | 2022 |
| Financings and real estate taxes | $ | 7,166,000 | | | $ | 7,166,000 | |
| Management fees | 225,000 | | | 110,000 | |
| Leasing commissions | 161,000 | | | 85,000 | |
| Cost Sharing Agreement allocations (a) | 548,000 | | | — | |
| Other | (6,000) | | | (33,000) | |
| Total | $ | 8,094,000 | | | $ | 7,328,000 | |
Notes to Consolidated Financial Statements
December 31,
2020Note 16. Selected Quarterly Financial Data (unaudited)
2023 | | Quarter ended | |
| | March 31 | | | June 30 | | | September 30 | | | December 31 | |
2020 | | | | | | | | | | | | | | | | |
Revenues | | $ | 42,485,000 | | | $ | 28,620,000 | | | $ | 31,175,000 | | | $ | 33,258,000 | |
Net (loss) income | | $ | (2,098,000 | ) | | $ | (6,009,000 | ) | | $ | 1,404,000 | | | $ | 6,183,000 | |
Net (loss) income attributable to common shareholders | | $ | (4,934,000 | ) | | $ | (8,785,000 | ) | | $ | (1,421,000 | ) | | $ | 3,316,000 | |
Per common share (basic and diluted) (a) | | $ | (0.39 | ) | | $ | (0.67 | ) | | $ | (0.11 | ) | | $ | 0.25 | |
| | | | | | | | | | | | | | | | |
2019 | | | | | | | | | | | | | | | | |
Revenues | | $ | 36,883,000 | | | $ | 35,660,000 | | | $ | 35,912,000 | | | $ | 35,628,000 | |
Net income (loss) | | $ | 2,989,000 | | | $ | 5,544,000 | | | $ | 2,947,000 | | | $ | (9,914,000 | ) |
Net income (loss) attributable to common shareholders | | $ | 194,000 | | | $ | 2,695,000 | | | $ | 92,000 | | | $ | (12,657,000 | ) |
Per common share (basic and diluted) (a) | | $ | 0.00 | | | $ | 0.20 | | | $ | (0.00 | ) | | $ | (0.98 | ) |
| | | | | | | | | | | | | | | | |
| |
(a)
| Differences between the sum of the four quarterly per share amounts and the annual per share amounts, if any, are attributable to the effect of the weighted average outstanding share calculation for the respective periods.
|
Note 17. Subsequent Events
In determining subsequent events, management reviewed all activity from
On January
1, 2021 through23, 2024, the
dateCompany's Board of
filing this Annual ReportDirectors declared a dividend of $0.453125 and $0.406250 per share with respect to the Company's Series B Preferred Stock and Series C Preferred Stock, respectively. The dividends were paid on
Form 10-K. February 20, 2024 to shareholders of record on February 9, 2024.
On February 29, 2024, the Company entered into a revolving credit agreement with KeyBank National Association to draw up to $9.5 million (the "Revolving Credit Agreement"). The interest rate under the Revolving Credit Agreement is the daily SOFR, plus applicable margins of 0.10% plus 2.75%. Interest payments are due monthly, and principal is due at maturity on February 28, 2025. The Revolving Credit Agreement may be extended, at the Company's option, for up to two additional three-month periods, subject to customary conditions. The Revolving Credit Agreement is collateralized by 6 properties, consisting of Carll's Corner, Fieldstone Marketplace, Oakland Commons, Kings Plaza, Oregon Avenue and South Philadelphia, and proceeds will be used for capital expenditures and tenant improvements for such properties.
Schedule II
Valuation and Qualifying Accounts
| | | | | | | | | | | | | | | | | | | | | | | | | | |
| | Balance at | | Charged to | | Deductions | | Balance at |
| | beginning | | costs and | | from | | end |
| Description | | of year | | expense | | reserves | | of year |
| Allowance for doubtful accounts: | | | | | | | | |
| Year ended December 31, 2023 | | $ | 2,565,000 | | | $ | (711,000) | | | $ | (1,385,000) | | | $ | 469,000 | |
| Year ended December 31, 2022 | | $ | 4,971,000 | | | $ | 539,000 | | | $ | (2,945,000) | | | $ | 2,565,000 | |
Cedar Realty Trust, Inc.
Real Estate and Accumulated Depreciation | | | | | | | | | | | | Year built/ | | | Gross | | | Initial cost to the Company | |
| | | | Year | | | Percent | | | Year last | | | leasable | | | | | | | Building and | |
Property | | State | | acquired | | | owned | | | renovated | | | area | | | Land | | | Improvements | |
Academy Plaza | | PA | | | 2001 | | | 100% | | | 1965/2013 | | | | 137,415 | | | $ | 2,406,000 | | | $ | 9,623,000 | |
Big Y Shopping Center | | CT | | | 2013 | | | 100% | | | | 2007 | | | | 101,105 | | | | 11,272,000 | | | | 23,395,000 | |
Camp Hill | | PA | | | 2002 | | | 100% | | | 1958/2005 | | | | 430,198 | | | | 4,460,000 | | | | 17,857,000 | |
Carmans Plaza | | NY | | | 2007 | | | 100% | | | 1954/2007 | | | | 195,485 | | | | 8,539,000 | | | | 35,804,000 | |
Christina Crossing | | DE | | | 2017 | | | 100% | | | | 2008 | | | | 119,446 | | | | 4,341,000 | | | | 23,227,000 | |
Coliseum Marketplace | | VA | | | 2005 | | | 100% | | | 1987/2012 | | | | 106,648 | | | | 2,924,000 | | | | 14,416,000 | |
Colonial Commons | | PA | | | 2011 | | | 100% | | | 2011/2013 | | | | 410,432 | | | | 9,367,000 | | | | 37,496,000 | |
Crossroads II | | PA | | | 2008 | | | 60% | | | | 2009 | | | | 133,717 | | | | 15,383,000 | | | | - | |
East River Park | | DC | | | 2015 | | | 100% | | | 1946-1996 | | | | 150,038 | | | | 9,143,000 | | | | 30,893,000 | |
Elmhurst Square | | VA | | | 2006 | | | 100% | | | 1961-1983 | | | | 66,254 | | | | 1,371,000 | | | | 5,994,000 | |
Fairview Commons | | PA | | | 2007 | | | 100% | | | 1976/2003 | | | | 52,964 | | | | 858,000 | | | | 3,568,000 | |
Fieldstone Marketplace | | MA | | 2005/2012 | | | 100% | | | 1988/2003 | | | | 150,123 | | | | 5,229,000 | | | | 21,440,000 | |
Fishtown Crossing | | PA | | | 2001 | | | 100% | | | | 1988 | | | | 127,265 | | | | 2,942,000 | | | | 11,769,000 | |
Franklin Village Plaza (a) | | MA | | 2004/2012 | | | 100% | | | 1987/2005 | | | | 305,937 | | | | 14,270,000 | | | | 61,915,000 | |
General Booth Plaza | | VA | | | 2005 | | | 100% | | | | 1985 | | | | 71,639 | | | | 1,935,000 | | | | 9,493,000 | |
Girard Plaza | | PA | | | 2019 | | | 100% | | | | 1950’s/2010 | | | | 35,688 | | | | 4,685,000 | | | | 4,648,000 | |
Gold Star Plaza | | PA | | | 2006 | | | 100% | | | | 1988 | | | | 71,720 | | | | 1,644,000 | | | | 6,519,000 | |
Golden Triangle | | PA | | | 2003 | | | 100% | | | 1960/2005 | | | | 202,790 | | | | 2,320,000 | | | | 9,713,000 | |
Groton Shopping Center | | CT | | | 2007 | | | 100% | | | | 1969 | | | | 130,264 | | | | 3,070,000 | | | | 12,320,000 | |
Halifax Plaza | | PA | | | 2003 | | | 100% | | | | 1994 | | | | 51,510 | | | | 1,412,000 | | | | 5,799,000 | |
Hamburg Square | | PA | | | 2004 | | | 100% | | | 1993/2010 | | | | 102,058 | | | | 1,153,000 | | | | 4,678,000 | |
Jordan Lane | | CT | | | 2005 | | | 100% | | | 1969/1991 | | | | 177,504 | | | | 4,291,000 | | | | 21,176,000 | |
Kempsville Crossing | | VA | | | 2005 | | | 100% | | | 1985/2013 | | | | 79,512 | | | | 2,207,000 | | | | 11,000,000 | |
Kings Plaza | | MA | | | 2007 | | | 100% | | | 1970/1994 | | | | 168,243 | | | | 2,413,000 | | | | 12,604,000 | |
Lawndale Plaza | | PA | | | 2015 | | | 100% | | | | 1998 | | | | 92,773 | | | | 3,635,000 | | | | 21,854,000 | |
Meadows Marketplace | | PA | | 2004/2012 | | | 100% | | | | 2005 | | | | 91,518 | | | | 1,914,000 | | | | - | |
Newport Plaza | | PA | | | 2003 | | | 100% | | | | 1996 | | | | 64,489 | | | | 1,721,000 | | | | 7,758,000 | |
New London Mall | | CT | | | 2009 | | | 100% | | | 1967/1997 | | | | 259,566 | | | | 14,891,000 | | | | 24,967,000 | |
Northside Commons | | PA | | | 2008 | | | 100% | | | | 2009 | | | | 69,136 | | | | 3,332,000 | | | | - | |
Norwood Shopping Center | | MA | | | 2006 | | | 100% | | | 1965/2013 | | | | 87,406 | | | | 1,874,000 | | | | 8,453,000 | |
Oak Ridge Shopping Center | | VA | | | 2006 | | | 100% | | | | 2000 | | | | 38,700 | | | | 960,000 | | | | 4,254,000 | |
Oakland Commons | | CT | | | 2007 | | | 100% | | | 1962/2013 | | | | 90,100 | | | | 2,504,000 | | | | 15,662,000 | |
Oakland Mills | | MD | | | 2005 | | | 100% | | | 1960's/2004 | | | | 57,008 | | | | 1,611,000 | | | | 6,292,000 | |
Palmyra Shopping Center | | PA | | | 2005 | | | 100% | | | 1960/2012 | | | | 111,051 | | | | 1,488,000 | | | | 6,566,000 | |
Pine Grove Plaza | | NJ | | | 2003 | | | 100% | | | 2001/2002 | | | | 79,306 | | | | 2,010,000 | | | | 6,489,000 | |
Quartermaster Plaza | | PA | | | 2014 | | | 100% | | | | 2004 | | | | 456,602 | | | | 37,031,000 | | | | 54,210,000 | |
River View Plaza | | PA | | | 2003 | | | 100% | | | 1991/1998 | | | | 113,922 | | | | 9,718,000 | | | | 40,356,000 | |
San Souci Plaza | | MD | | | 2009 | | | 40% | | | 1985 - 1997 | | | | 264,134 | | | | 14,849,000 | | | | 18,445,000 | |
Senator Square | | DC | | | 2018 | | | 100% | | | 1946 - 2005 | | | | 42,941 | | | | - | | | | 5,327,000 | |
Shoppes at Arts District | | DC | | | 2016 | | | 100% | | | | 2011 | | | | 35,676 | | | | 2,247,000 | | | | 18,616,000 | |
South Philadelphia | | PA | | | 2003 | | | 100% | | | 1950/2003 | | | | 193,085 | | | | 8,222,000 | | | | 36,314,000 | |
Southington Center | | CT | | | 2003 | | | 100% | | | 1972/2000 | | | | 155,842 | | | | - | | | | 11,834,000 | |
Swede Square | | PA | | | 2003 | | | 100% | | | 1980/2012 | | | | 100,809 | | | | 2,268,000 | | | | 6,232,000 | |
The Brickyard | | CT | | | 2004 | | | 100% | | | 1990/2012 | | | | 227,598 | | | | 7,632,000 | | | | 29,308,000 | |
The Point | | PA | | | 2000 | | | 100% | | | 1972/2012 | | | | 262,072 | | | | 2,700,000 | | | | 10,800,000 | |
The Shops at Bloomfield Station | | NJ | | | 2016 | | | 100% | | | | 2015 | | | | 63,844 | | | | 625,000 | | | | 17,674,000 | |
The Shops at Suffolk Downs | | MA | | | 2005 | | | 100% | | | 2005/2011 | | | | 121,187 | | | | 7,580,000 | | | | 11,089,000 | |
Timpany Plaza | | MA | | | 2007 | | | 100% | | | 1970's-1989 | | | | 182,799 | | | | 3,412,000 | | | | 19,240,000 | |
Trexler Mall | | PA | | | 2005 | | | 100% | | | 1973/2013 | | | | 336,687 | | | | 6,932,000 | | | | 32,815,000 | |
Trexlertown Plaza | | PA | | | 2006 | | | 100% | | | 1990/2011 | | | | 325,171 | | | | 13,349,000 | | | | 23,867,000 | |
Valley Plaza | | MD | | | 2003 | | | 100% | | | 1975/1994 | | | | 190,939 | | | | 1,950,000 | | | | 7,766,000 | |
Washington Center Shoppes | | NJ | | | 2001 | | | 100% | | | 1979/1995 | | | | 157,300 | | | | 2,061,000 | | | | 7,314,000 | |
Webster Plaza | | MA | | | 2007 | | | 100% | | | 1960's-2004 | | | | 98,984 | | | | 3,551,000 | | | | 18,412,000 | |
Yorktowne Plaza | | MD | | | 2007 | | | 100% | | | 1970/2000 | | | | 136,197 | | | | 5,940,000 | | | | 25,505,000 | |
Other | | n/a | | n/a | | | 100% | | | n/a | | | | - | | | | 1,965,000 | | | | - | |
Total Portfolio | | | | | | | | | | | | | | | | | 8,084,797 | | | $ | 285,607,000 | | | $ | 892,766,000 | |
| | | | | | | | | | | | | | | | | | | | | | | | | | | | | | | | |
| Property | | Encumbrances | | Gross
leasable
area | | Initial cost to the Company | | Subsequent
cost
capitalized (c) |
| | | Land | | Building and
Improvements | |
| Brickyard Plaza | | (a) | | 227,598 | | | $ | 7,632,000 | | | $ | 29,308,000 | | | $ | (812,000) | |
| Carll's Corner | | | | 116,532 | | | 3,034,000 | | | 15,293,000 | | | (12,541,000) | |
| Coliseum Marketplace | | (b) | | 106,648 | | | 2,924,000 | | | 14,416,000 | | | (2,936,000) | |
| Fairview Commons | | (a) | | 50,119 | | | 858,000 | | | 3,568,000 | | | 462,000 | |
| Fieldstone Marketplace | | | | 193,970 | | | 5,229,000 | | | 21,440,000 | | | (3,206,000) | |
| Gold Star Plaza | | (a) | | 71,720 | | | 1,644,000 | | | 6,519,000 | | | (115,000) | |
| Golden Triangle | | (a) | | 202,790 | | | 2,320,000 | | | 9,713,000 | | | 12,162,000 | |
| Hamburg Square | | (a) | | 102,058 | | | 1,153,000 | | | 4,678,000 | | | 6,571,000 | |
| Kings Plaza | | | | 168,243 | | | 2,413,000 | | | 12,604,000 | | | 2,611,000 | |
| Oakland Commons | | | | 90,100 | | | 2,504,000 | | | 15,662,000 | | | (4,668,000) | |
| Oregon Avenue | | | | — | | | 2,247,000 | | | 18,616,000 | | | (16,969,000) | |
| Patuxent Crossing | | (b) | | 264,068 | | | 14,849,000 | | | 18,445,000 | | | 1,916,000 | |
| Pine Grove Plaza | | (a) | | 79,306 | | | 2,010,000 | | | 6,489,000 | | | 652,000 | |
| South Philadelphia | | | | 221,511 | | | 8,222,000 | | | 36,314,000 | | | (8,670,000) | |
| Southington Center | | (a) | | 155,842 | | | — | | | 11,834,000 | | | 1,464,000 | |
| Timpany Plaza | | $9,060,000 | | 182,799 | | | 3,412,000 | | | 19,240,000 | | | (3,801,000) | |
| Trexler Mall | | (a) | | 342,541 | | | 6,932,000 | | | 32,815,000 | | | 13,705,000 | |
| Washington Centers Shoppes | | (a) | | 157,300 | | | 2,061,000 | | | 7,314,000 | | | 7,617,000 | |
| Webster Commons | | (a) | | 98,984 | | | 3,551,000 | | | 18,412,000 | | | (1,518,000) | |
| Other | | n/a | | — | | | 1,965,000 | | | — | | | (1,399,000) | |
| Total Portfolio | | | | 2,832,129 | | | $ | 74,960,000 | | | $ | 302,680,000 | | | $ | (9,475,000) | |
| | | | | | | | | | | | | | | | | | | | | | | | | | | | | | | | | | | | | | | | | | | | |
| | | Gross amount at which carried at
December 31, 2023 | | Accumulated
depreciation | | Year built/
Year last
renovated | | Year
acquired | | Depreciation
life |
| (continued) | | | | | |
| Property | | Land | | Building and
improvements | | Total | | | | |
| Brickyard Plaza | | $ | 7,648,000 | | | $ | 28,480,000 | | | $ | 36,128,000 | | | $ | 14,894,000 | | | 1990/2012 | | 2004 | | 3 - 40 years |
| Carll's Corner | | 220,000 | | | 5,566,000 | | | 5,786,000 | | | 4,756,000 | | | 1960s-1999 | | 2007 | | 3 - 40 years |
| Coliseum Marketplace | | 3,586,000 | | | 10,818,000 | | | 14,404,000 | | | 7,182,000 | | | 1987/2012 | | 2005 | | 3 - 40 years |
| Fairview Commons | | 858,000 | | | 4,030,000 | | | 4,888,000 | | | 1,964,000 | | | 1976/2003 | | 2007 | | 3 - 40 years |
| Fieldstone Marketplace | | 5,167,000 | | | 18,296,000 | | | 23,463,000 | | | 12,593,000 | | | 1988/2003 | | 2005/2012 | | 3 - 40 years |
| Gold Star Plaza | | 1,644,000 | | | 6,404,000 | | | 8,048,000 | | | 3,018,000 | | | 1988 | | 2006 | | 3 - 40 years |
| Golden Triangle | | 2,320,000 | | | 21,875,000 | | | 24,195,000 | | | 12,063,000 | | | 1960/2005 | | 2003 | | 3 - 40 years |
| Hamburg Square | | 1,153,000 | | | 11,249,000 | | | 12,402,000 | | | 5,263,000 | | | 1993/2010 | | 2004 | | 3 - 40 years |
| Kings Plaza | | 2,408,000 | | | 15,220,000 | | | 17,628,000 | | | 5,970,000 | | | 1970/1994 | | 2007 | | 3 - 40 years |
| Oakland Commons | | 2,504,000 | | | 10,994,000 | | | 13,498,000 | | | 6,654,000 | | | 1962/2013 | | 2007 | | 3 - 40 years |
| Oregon Avenue | | 2,141,000 | | | 1,753,000 | | | 3,894,000 | | | 177,000 | | | 2011 | | 2016 | | 3 - 40 years |
| Patuxent Crossing | | 13,211,000 | | | 21,999,000 | | | 35,210,000 | | | 11,563,000 | | | 1985-1997 | | 2009 | | 3 - 40 years |
| Pine Grove Plaza | | 1,622,000 | | | 7,529,000 | | | 9,151,000 | | | 4,062,000 | | | 2001/2002 | | 2003 | | 3 - 40 years |
| South Philadelphia | | 8,222,000 | | | 27,644,000 | | | 35,866,000 | | | 22,627,000 | | | 1950/2003 | | 2003 | | 3 - 40 years |
| Southington Center | | — | | | 13,298,000 | | | 13,298,000 | | | 6,591,000 | | | 1972/2000 | | 2003 | | 3 - 40 years |
| Timpany Plaza | | 3,368,000 | | | 15,483,000 | | | 18,851,000 | | | 8,349,000 | | | 1970's-1989 | | 2007 | | 3 - 40 years |
| Trexler Mall | | 6,932,000 | | | 46,520,000 | | | 53,452,000 | | | 21,946,000 | | | 1973/2013 | | 2005 | | 3 - 40 years |
| Washington Centers Shoppes | | 2,000,000 | | | 14,992,000 | | | 16,992,000 | | | 7,719,000 | | | 1979/1995 | | 2001 | | 3 - 40 years |
| Webster Commons | | 4,081,000 | | | 16,364,000 | | | 20,445,000 | | | 8,892,000 | | | 1960's-2004 | | 2007 | | 3 - 40 years |
| Other | | — | | | 566,000 | | | 566,000 | | | 206,000 | | | n/a | | n/a | | n/a |
| Total Portfolio | | $ | 69,085,000 | | | $ | 299,080,000 | | | $ | 368,165,000 | | | $ | 166,489,000 | | | | | | | |
Real Estate and Accumulated Depreciation | | | | | | Gross amount at which carried at | | | | | | |
(continued) | | Subsequent | | | December 31, 2020 | | | | | | |
| | cost | | | | | | | Building and | | | | | | | Accumulated | | |
Property | | capitalized (b) | | | Land | | | improvements | | | Total | | | depreciation | | |
Academy Plaza | | $ | 6,107,000 | | | $ | 2,406,000 | | | $ | 15,730,000 | | | $ | 18,136,000 | | | $ | 6,651,000 | | |
Big Y Shopping Center | | | 361,000 | | | | 10,268,000 | | | | 24,760,000 | | | | 35,028,000 | | | | 5,560,000 | | |
Camp Hill | | | 40,626,000 | | | | 4,093,000 | | | | 58,850,000 | | | | 62,943,000 | | | | 24,270,000 | | |
Carmans Plaza | | | 18,641,000 | | | | 8,421,000 | | | | 54,563,000 | | | | 62,984,000 | | | | 17,896,000 | | |
Christina Crossing | | | 1,603,000 | | | | 4,341,000 | | | | 24,830,000 | | | | 29,171,000 | | | | 3,595,000 | | |
Coliseum Marketplace | | | 5,629,000 | | | | 3,586,000 | | | | 19,383,000 | | | | 22,969,000 | | | | 8,465,000 | | |
Colonial Commons | | | 7,846,000 | | | | 9,367,000 | | | | 45,342,000 | | | | 54,709,000 | | | | 16,580,000 | | |
Crossroads II | | | 29,734,000 | | | | 17,671,000 | | | | 27,446,000 | | | | 45,117,000 | | | | 8,147,000 | | |
East River Park | | | 7,514,000 | | | | 9,398,000 | | | | 38,152,000 | | | | 47,550,000 | | | | 6,558,000 | | |
Elmhurst Square | | | 1,251,000 | | | | 1,371,000 | | | | 7,245,000 | | | | 8,616,000 | | | | 2,668,000 | | |
Fairview Commons | | | 452,000 | | | | 858,000 | | | | 4,020,000 | | | | 4,878,000 | | | | 1,470,000 | | |
Fieldstone Marketplace | | | 3,386,000 | | | | 5,167,000 | | | | 24,888,000 | | | | 30,055,000 | | | | 10,740,000 | | |
Fishtown Crossing | | | 9,676,000 | | | | 2,843,000 | | | | 21,544,000 | | | | 24,387,000 | | | | 5,417,000 | | |
Franklin Village Plaza (a) | | | 6,494,000 | | | | 14,681,000 | | | | 67,998,000 | | | | 82,679,000 | | | | 19,215,000 | | |
General Booth Plaza | | | (132,000 | ) | | | 1,935,000 | | | | 9,361,000 | | | | 11,296,000 | | | | 3,522,000 | | |
Girard Plaza | | | 52,000 | | | | 4,685,000 | | | | 4,700,000 | | | | 9,385,000 | | | | 405,000 | | |
Gold Star Plaza | | | 755,000 | | | | 1,644,000 | | | | 7,274,000 | | | | 8,918,000 | | | | 3,409,000 | | |
Golden Triangle | | | 12,824,000 | | | | 2,320,000 | | | | 22,537,000 | | | | 24,857,000 | | | | 10,288,000 | | |
Groton Shopping Center | | | 8,552,000 | | | | 3,113,000 | | | | 20,829,000 | | | | 23,942,000 | | | | 6,453,000 | | |
Halifax Plaza | | | 562,000 | | | | 1,347,000 | | | | 6,426,000 | | | | 7,773,000 | | | | 3,059,000 | | |
Hamburg Square | | | 6,332,000 | | | | 1,153,000 | | | | 11,010,000 | | | | 12,163,000 | | | | 4,210,000 | | |
Jordan Lane | | | 1,122,000 | | | | 4,291,000 | | | | 22,298,000 | | | | 26,589,000 | | | | 8,744,000 | | |
Kempsville Crossing | | | (2,754,000 | ) | | | 2,207,000 | | | | 8,246,000 | | | | 10,453,000 | | | | 3,399,000 | | |
Kings Plaza | | | 1,684,000 | | | | 2,408,000 | | | | 14,293,000 | | | | 16,701,000 | | | | 4,489,000 | | |
Lawndale Plaza | | | 1,091,000 | | | | 3,635,000 | | | | 22,945,000 | | | | 26,580,000 | | | | 4,783,000 | | |
Meadows Marketplace | | | 11,959,000 | | | | 1,914,000 | | | | 11,959,000 | | | | 13,873,000 | | | | 4,324,000 | | |
Newport Plaza | | | 586,000 | | | | 1,682,000 | | | | 8,383,000 | | | | 10,065,000 | | | | 3,948,000 | | |
New London Mall | | | 4,797,000 | | | | 8,807,000 | | | | 35,848,000 | | | | 44,655,000 | | | | 15,186,000 | | |
Northside Commons | | | 10,108,000 | | | | 3,379,000 | | | | 10,061,000 | | | | 13,440,000 | | | | 2,863,000 | | |
Norwood Shopping Center | | | 1,017,000 | | | | 1,874,000 | | | | 9,470,000 | | | | 11,344,000 | | | | 3,447,000 | | |
Oak Ridge Shopping Center | | | 471,000 | | | | 960,000 | | | | 4,725,000 | | | | 5,685,000 | | | | 1,878,000 | | |
Oakland Commons | | | (344,000 | ) | | | 2,504,000 | | | | 15,318,000 | | | | 17,822,000 | | | | 5,904,000 | | |
Oakland Mills | | | 1,088,000 | | | | 1,530,000 | | | | 7,461,000 | | | | 8,991,000 | | | | 3,088,000 | | |
Palmyra Shopping Center | | | 2,082,000 | | | | 1,488,000 | | | | 8,648,000 | | | | 10,136,000 | | | | 3,731,000 | | |
Pine Grove Plaza | | | 579,000 | | | | 1,622,000 | | | | 7,456,000 | | | | 9,078,000 | | | | 3,386,000 | | |
Quartermaster Plaza | | | 3,548,000 | | | | 37,031,000 | | | | 57,758,000 | | | | 94,789,000 | | | | 13,019,000 | | |
Riverview Plaza | | | 9,598,000 | | | | 10,872,000 | | | | 48,800,000 | | | | 59,672,000 | | | | 20,002,000 | | |
San Souci Plaza | | | 5,182,000 | | | | 13,406,000 | | | | 25,070,000 | | | | 38,476,000 | | | | 13,092,000 | | |
Senator Square | | | 2,485,000 | | | | - | | | | 7,812,000 | | | | 7,812,000 | | | | 1,145,000 | | |
Shoppes at Arts District | | | 75,000 | | | | 2,247,000 | | | | 18,691,000 | | | | 20,938,000 | | | | 3,338,000 | | |
South Philadelphia | | | 17,210,000 | | | | 10,363,000 | | | | 51,383,000 | | | | 61,746,000 | | | | 23,388,000 | | |
Southington Center | | | 1,704,000 | | | | - | | | | 13,538,000 | | | | 13,538,000 | | | | 5,429,000 | | |
Swede Square | | | 8,254,000 | | | | 2,272,000 | | | | 14,482,000 | | | | 16,754,000 | | | | 6,309,000 | | |
The Brickyard | | | 4,821,000 | | | | 7,648,000 | | | | 34,113,000 | | | | 41,761,000 | | | | 12,923,000 | | |
The Point | | | 19,534,000 | | | | 2,996,000 | | | | 30,038,000 | | | | 33,034,000 | | | | 13,507,000 | | |
The Shops at Bloomfield Station | | | 393,000 | | | | 625,000 | | | | 18,067,000 | | | | 18,692,000 | | | | 3,097,000 | | |
The Shops at Suffolk Downs | | | 10,547,000 | | | | 7,580,000 | | | | 21,636,000 | | | | 29,216,000 | | | | 7,942,000 | | |
Timpany Plaza | | | 2,366,000 | | | | 3,368,000 | | | | 21,650,000 | | | | 25,018,000 | | | | 7,006,000 | | |
Trexler Mall | | | 13,691,000 | | | | 6,932,000 | | | | 46,506,000 | | | | 53,438,000 | | | | 16,945,000 | | |
Trexlertown Plaza | | | 31,032,000 | | | | 15,674,000 | | | | 52,574,000 | | | | 68,248,000 | | | | 14,866,000 | | |
Valley Plaza | | | 1,903,000 | | | | 1,950,000 | | | | 9,669,000 | | | | 11,619,000 | | | | 4,490,000 | | |
Washington Center Shoppes | | | 6,891,000 | | | | 2,000,000 | | | | 14,266,000 | | | | 16,266,000 | | | | 6,315,000 | | |
Webster Plaza | | | 4,035,000 | | | | 4,082,000 | | | | 21,916,000 | | | | 25,998,000 | | | | 7,353,000 | | |
Yorktowne Plaza | | | 2,560,000 | | | | 5,801,000 | | | | 28,204,000 | | | | 34,005,000 | | | | 10,323,000 | | |
Other | | | 1,525,000 | | | | 878,000 | | | | 2,612,000 | | | | 3,490,000 | | | | 332,000 | | |
Total Portfolio | | $ | 349,105,000 | | | $ | 284,694,000 | | | $ | 1,242,784,000 | | | $ | 1,527,478,000 | | | $ | 428,569,000 | | |
Cedar Realty Trust, Inc.
Schedule III
Real Estate and Accumulated Depreciation
The changes in real estate and accumulated depreciation for the years ended December 31, 2020, 20192023 and 2018,2022, respectively, are as follows:
Cost | | 2020 | | | 2019 | | | 2018 | |
Balance, beginning of the year | | $ | 1,515,206,000 | | | $ | 1,508,682,000 | | | $ | 1,534,599,000 | |
Properties transferred to held for sale | | | (22,512,000 | ) | | | (36,265,000 | ) | | | (61,505,000 | ) |
Property acquisitions | | | — | | | | 9,333,000 | | | | 6,481,000 | |
Outparcel dispositions | | | (840,000 | ) | | | — | | | | — | |
Improvements and betterments | | | 35,624,000 | | | | 37,089,000 | | | | 29,107,000 | |
Asset write-offs | | | — | | | | (3,633,000 | ) | | | — | |
Balance, end of the year | | $ | 1,527,478,000 | | (c) | $ | 1,515,206,000 | | | $ | 1,508,682,000 | |
| | | | | | | | | | | | |
Accumulated depreciation | | | | | | | | | | | | |
Balance, beginning of the year | | $ | 389,861,000 | | | $ | 361,969,000 | | | $ | 341,943,000 | |
Properties transferred to held for sale | | | (3,947,000 | ) | | | (10,143,000 | ) | | | (14,886,000 | ) |
Outparcel dispositions | | | (90,000 | ) | | | — | | | | — | |
Depreciation expense (d) | | | 42,745,000 | | | | 41,142,000 | | | | 34,912,000 | |
Asset write-offs | | | — | | | | (3,107,000 | ) | | | — | |
Balance, end of the year | | $ | 428,569,000 | | | $ | 389,861,000 | | | $ | 361,969,000 | |
| | | | | | | | | | | | |
Net book value | | $ | 1,098,909,000 | | | $ | 1,125,345,000 | | | $ | 1,146,713,000 | |
| (a)
| Amount of encumbrance totals $45.6 million at December 31, 2020.
|
| (b)
| Negative amounts represent write-offs of fully depreciated assets.
|
| | | | | | | | | | | | | | |
| Cost | | 2023 | | 2022 |
| Balance, beginning of the year | | $ | 364,110,000 | | | $ | 369,827,000 | |
| Properties transferred to/from held for sale | | — | | | (11,495,000) | |
| Disposals | | (2,401,000) | | | — | |
| Property impairments | | — | | | (16,629,000) | |
| Improvements and betterments | | 6,456,000 | | | 22,407,000 | |
| Balance, end of the year | | $ | 368,165,000 | | (d) | $ | 364,110,000 | |
| | | | | |
| Accumulated depreciation | | | | |
| Balance, beginning of the year | | $ | 157,468,000 | | | $ | 155,250,000 | |
| Properties transferred to/from held for sale | | — | | | (15,339,000) | |
| Disposals | | (945,000) | | | — | |
| Depreciation expense (e) | | 9,966,000 | | | 17,557,000 | |
| Balance, end of the year | | $ | 166,489,000 | | | $ | 157,468,000 | |
| | | | | |
| Net book value | | $ | 201,676,000 | | | $ | 206,642,000 | |
| (c)(a)Properties secure the Term Loan Agreement, 10 properties.
| At December 31, 2020, the aggregate cost for federal income tax purposes was approximately $25.6 million greater than the Company's recorded values.
|
| (d)(b)Properties secure the Patuxent Crossing/Coliseum Marketplace Loan Agreement.
| Depreciation is provided over the estimated useful lives of the buildings and improvements, which range from 3 to 40 years.
|
Item 9.(c)Negative amounts represent write-offs of fully depreciated assets and impairments.
| Changes in and Disagreements with Accountants on Accounting and Financial Disclosure
|
(d)At December 31, 2023, the aggregate cost for federal income tax purposes was approximately $86.3 million greater than the Company's recorded values.
(e)Depreciation is provided over the estimated useful lives of the buildings and improvements, which range from 3 to 40 years.
Item 9. Changes in and Disagreements with Accountants on Accounting and Financial Disclosure: None
Item 9A.
| Item 9A. Controls and Procedures |
Evaluation of
Disclosure Controls and Procedures
The Company maintains
Our management, under the supervision and with the participation of our principal executive officer and principal financial officer, has evaluated the effectiveness of our disclosure controls and procedures
(as defined in
Rules 13a-15(e) and 15d-15(e)ensuring that the information required to be disclosed in our filings under the Securities Exchange Act of 1934, as amended,
(the “Exchange Act”) designed to ensure that information required to be disclosed in its filings under the Exchange Act is
recorded, processed, summarized and reported within the time periods specified in the
SEC's rules and
regulations of the Securitiesforms, including ensuring that such information is accumulated and
Exchange Commission (“SEC”). In this regard, the Company has formed a Disclosure Committee currently comprised of several of the Company’scommunicated to our management, as appropriate, to allow timely decisions regarding required disclosure. Based on such evaluation, our principal executive
officers as well as certain other employees with knowledge of informationofficer and principal financial officer have concluded that,
may be considered in the SEC reporting process. The Committee has responsibility for the development and assessment of the financial and non-financial information to be included in the reports filed with the SEC, and assists the Company’s Chief Executive Officer and Chief Financial Officer in connection with their certifications contained in the Company’s SEC filings. The Committee meets regularly and reports to the Audit Committee on a quarterly or more frequent basis. The Company’s Chief Executive Officer and Chief Financial Officer have evaluated its disclosure controls and procedures as of December 31,
2019, and have concluded that2023, such disclosure controls and procedures
are effective.Duringwere effective to provide reasonable assurance that information required to be disclosed by us in our filings under the three months ended December 31, 2020, there have been no changesSecurities Exchange Act of 1934, as amended, is recorded, processed, summarized, and reported within the time periods specified in the Company’s internal controls over financial reporting or in other factors that have materially affected, or are reasonably likelySEC's rules and forms and to materially affect, these internal controls over financial reporting. In designing and evaluating the disclosure controls and procedures, management recognized that any controls and procedures, no matter how well designed and operated, can provide only reasonable assurance of achieving the desired control objectives,that such information is accumulated and communicated to our management, necessarily wasincluding our principal executive officer and principal financial officer, as appropriate to allow timely decisions regarding required to apply its judgment in evaluating the cost-benefit relationship of possible controls and procedures.
disclosure.
Management Annual Report on Internal Control Over Financial Reporting
The Company’s
Our management is responsible for establishing and maintaining adequate internal control over financial reporting. The Company’s internalInternal control system wasover financial reporting, as defined in rules promulgated under the Exchange Act, is a process designed by, or under the supervision of, our CEO and CFO and effected by our Board of Directors, management and other personnel to provide reasonable assurance regarding the reliability of financial reporting and the preparation of financial statements for external purposes in accordance with GAAP. Internal control over financial reporting includes those policies and procedures that:
•pertain to the Company’smaintenance of records that in reasonable detail accurately and fairly reflect the transactions and dispositions of our assets;
•provide reasonable assurance that transactions are recorded as necessary to permit preparation of financial statements in accordance with GAAP, and that our receipts and expenditures are being made only in accordance with authorizations of our management and our Board of DirectorsDirectors; and
•provide reasonable assurance regarding the preparation and fair presentationprevention or timely detection of publishedunauthorized acquisition, use or disposition of our assets that could have a material effect on our financial statements.
Our internal control over financial reporting is evaluated on a regular basis by personnel in our organization. The overall goals of these various evaluation activities are to monitor our internal control over financial reporting and to make modifications as necessary, as disclosure and internal controls are intended to be dynamic systems that change (including improvements and corrections) as conditions warrant.
Management conducted an assessment of the effectiveness of our company's internal control over financial reporting as of December 31, 2023, utilizing the framework established in "INTERNAL CONTROL-INTEGRATED FRAMEWORK" issued by the Committee of Sponsoring Organizations of the Treadway Commission (2013). Based on this assessment, management has determined that our internal controls over financial reporting as of December 31, 2023 were effective.
All internal control systems, no matter how well designed, have inherent limitations. Therefore, even those systems determined to be effective can provide only reasonable assurance with respect to financial statement preparation and presentation.
The Company’s management assessed the effectiveness of the Company’s internal control over financial reporting as of December 31, 2020. In making this assessment, it used the criteria set forth by the Committee of Sponsoring Organizations of the Treadway Commission (“COSO”) in “Internal Control – 2013 Integrated Framework”. Based on such assessment, management believes that, as of December 31, 2020, the Company’s internal control over financial reporting is effective based on those criteria.
Ernst & Young LLP, the Company’s independent registered public accounting firm, has issued an opinion on the Company’s internal control over financial reporting, which appears elsewhere in this report.
Report of Independent Registered Public Accounting Firm
To the Shareholders and the Board of Directors of Cedar Realty Trust, Inc.
Opinion on Internal Control Over Financial Reporting
We have audited Cedar Realty Trust, Inc.’s internal control over financial reporting as of December 31, 2020, based on criteria established in Internal Control—Integrated Framework issued by the Committee of Sponsoring Organizations of the Treadway Commission (2013 framework) (the COSO criteria). In our opinion, Cedar Realty Trust, Inc. maintained, in all material respects, effective internal control over financial reporting as of December 31, 2020, based on the COSO criteria.
We also have audited, in accordance with the standards of the Public Company Accounting Oversight Board (United States) (PCAOB), the consolidated balance sheets of the Company as of December 31, 2020 and 2019, the related consolidated statements of operations, comprehensive income, equity and cash flows for each of the three years in the period ended December 31, 2020, and the related notes and schedule listed in the Index at Item 15(a) and our report dated February 11, 2021 expressed an unqualified opinion thereon.
Basis for Opinion
The Company’s management is responsible for maintaining effective internal control over financial reporting and for its assessment of the effectiveness of internal control over financial reporting included in the accompanying Item 9A. Controls and Procedures – “Management Report on Internal Control Over Financial Reporting”. Our responsibility is to express an opinion on the Company’s internal control over financial reporting based on our audit. We are a public accounting firm registered with the PCAOB and are required to be independent with respect to the Company in accordance with the U.S. federal securities laws and the applicable rules and regulations of the Securities and Exchange Commission and the PCAOB.
We conducted our audit in accordance with the standards of the PCAOB. Those standards require that we plan and perform the audit to obtain reasonable assurance about whether effective internal control over financial reporting was maintained in all material respects.
Our audit included obtaining an understanding of internal control over financial reporting, assessing the risk that a material weakness exists, testing and evaluating the design and operating effectiveness of internal control based on the assessed risk, and performing such other procedures as we considered necessary in the circumstances. We believe that our audit provides a reasonable basis for our opinion.
Definition and Limitations of Internal Control Over Financial Reporting
A company’s internal control over financial reporting is a process designed to provide reasonable assurance regarding the reliability of financial reporting and the preparation of financial statements for external purposes in accordance with generally accepted accounting principles. A company’s internal control over financial reporting includes those policies and procedures that (1) pertain to the maintenance of records that, in reasonable detail, accurately and fairly reflect the transactions and dispositions of the assets of the company; (2) provide reasonable assurance that transactions are recorded as necessary to permit preparation of financial statements in accordance with generally accepted accounting principles, and that receipts and expenditures of the company are being made only in accordance with authorizations of management and directors of the company; and (3) provide reasonable assurance regarding prevention or timely detection of unauthorized acquisition, use, or disposition of the company’s assets that could have a material effect on the financial statements.
Because of its inherent limitations, internal control over financial reporting may not prevent or detect misstatements. Also, projections of any evaluation of effectiveness to future periods are subject to the risk that controls may become inadequate because of changes in conditions, or that the degree of compliance with the policies or procedures may deteriorate.
|
/s/ ERNST & YOUNG LLP
|
|
New York, New York
|
February 11, 2021
|
Items 9B.
| Other Information
|
None.
Part III.
InThis Form 10-K does not include an attestation report of our independent registered public accounting firm regarding internal controls over financial reporting. Management's report was not subject to attestation by our independent registered public accounting firm in accordance with SEC rules.
Item 9B. Other Information:
During the rules of the SEC, certain information required by Part III is omitted and is incorporated by reference into this Form 10-K from the Company’s definitive proxy statement, which we expect to file in March 2021 (and in any event not later than 120 days after the closethree months ended December 31, 2023, none of our fiscal year),officers or directors adopted or terminated any contract, instruction or written plan for the 2021 Annual Meetingpurchase or sale of Shareholders,our securities that was intended to be filed pursuant tosatisfy the affirmative defense conditions of Rule 10b5-1(c) or any "non-Rule 10b5-1 trading arrangement," as defined in Item 408 of Regulation 14A.S-K.
Item 9C. Disclosure Regarding Foreign Jurisdictions that Prevent Inspections: Not applicable
Part III.
Item 10. Directors, Executive Officers and Corporate Governance
The affairs of the Company are managed by the Board of Directors. Directors are elected annually by the Company's sole holder of its common stock, and serve until a successor has been elected or approved.
Code of Ethics and Governance Principles
The Company is operating under WHLR's Code of Business Conduct and Ethics and Corporate Governance Principles, each of which are available on our website, all under separate headings as allowed by the NYSE Governance Requirements. The Company will post any amendments to or waivers from its Code of Business Conduct and Ethics (to the extent applicable to the Company's Chief Executive Officer and Chief Financial Officer) on its website. The Code of Business Conduct and Ethics is available at ir.whlr.us under "Governance - Governance Documents."
The Company is relying on the general exemption to the requirement to have an audit committee provided in Rule 10A-3. WHLR satisfies the requirements of Rule 10A-3 with respect to its common stock listed on NASDAQ. The Company is 100% beneficially owned by WHLR. The Company has listed on the NYSE only non-convertible, non-participating preferred securities.
Members of the Board of Directors
As of December 31, 2023, the members of the Board of Directors are identified below:
| | |
Item 10.Directors |
Directors, Executive Officers and Corporate Governance
Kerry G. Campbell |
| Paula J. Poskon |
| E.J. Borrack |
| M. Andrew Franklin |
| Crystal Plum |
This item is incorporated by reference
Kerry G. Campbell
Chairman of the Board of Directors; Independent Director
Age — 58
Director since 2022
Mr. Campbell was appointed to the definitive proxy statementBoard of Directors in August 2022 and serves as its Chair. Ms. Campbell also serves on the Board of Directors of WHLR. Mr. Campbell is the principal of a financial litigation and investment management consulting firm, Kerry Campbell LLC, where since February 2014, he has served as a financial expert witness for arbitrations and litigations and provided consulting services to financial institutions and investors. His firm has been retained by institutional investors, high net worth investors and large global diversified financial institution.
Mr. Campbell received an M.B.A in Finance from the University of Chicago Booth Graduate School of Business and a Bachelor of Science in Finance summa cum laude from Fordham University Gabelli School of Business. Mr. Campbell is an Approved FINRA Dispute Resolution Arbitrator, a Chartered Financial Analyst®, a CERTIFIED FINANCIAL PLANNER™, an Accredited Investment Fiduciary Analyst™ and a Securities Experts Roundtable Member.
Mr. Campbell has been chosen as a director based on his 30 plus years of extensive and diverse financial industry experience, together with his experience as a financial expert witness on behalf of defendants and plaintiffs in arbitrations and litigations.
E.J. Borrack
Independent Director
Age — 59
Director since 2022
E.J. Borrack was appointed to the Board of Directors in August 2022. Ms. Borrack also serves on the Board of Directors of WHLR. Since 2013, she has been the General Counsel of The Stilwell Group, a group of private investment partnerships with a focus on activist investing in financially-related, small-cap companies. Previously, she was the Chief Compliance Officer of two SEC registered investment advisers. She was also the General Counsel of Wealthfront during that company's start-up phase. Prior to that, Ms. Borrack worked on complex commercial litigation matters as an associate at law firms in New York City and Philadelphia.
Ms. Borrack graduated from the University of Pennsylvania Law School and has a B.A. in English from the University of Pennsylvania.
Ms. Borrack has been chosen as a director based on her breadth of experience working on issues involving complex commercial litigation, regulatory compliance, securities regulation, and corporate governance.
Paula J. Poskon
Independent Director
Age — 59
Director since 2022
Ms. Poskon was appointed to the Board of Directors in August 2022. Ms. Poskon is the President of STOV Advisory Services LLC ("STOV"), which offers professional consulting and advisory services to company executives and institutional investors in the areas of real estate, capital markets, investor relations, and diversity and inclusion. She founded STOV in July 2016. For the past 15 years of her two decades of capital markets experience, Ms. Poskon specialized in real estate investment trusts.
Ms. Poskon graduated from the Wharton School at the University of Pennsylvania with a Bachelor of Science in Economics with a concentration in Accounting and a Master of Business Administration in Finance with a concentration in Strategic Management and considerable coursework in real estate finance.
Ms. Poskon has been chosen as a director based on her more than 20 years of capital markets experience in equity research and investment banking, the majority of which was focused on public REITs.
M. Andrew Franklin and Crystal Plum
Mr. Franklin and Ms. Plum are also officers of the Company, and their biographies are included below. Mr. Franklin has been chosen as a director based on his extensive experience in the real estate industry and knowledge of WHLR, the Company’s parent. Ms. Plum has been chosen as a director based on her experience with corporate accounting and financial matters and her knowledge of WHLR.
Executive Officers
M. Andrew Franklin
Director, Chief Executive Officer and President since August 2022
Age — 43
Andrew Franklin was appointed as Chief Executive Officer and President and Director in August 2022, in connection with consummation of the Company's merger with WHLR. He was also appointed as Chief Executive Officer and President of WHLR in 2021 Annual Meetingand previously served as their Interim Chief Executive Officer since July 2021, Chief Operating Officer since February 2018, and Senior Vice President of Shareholders,Operations since January 2017. Mr. Franklin has over 23 years of commercial real estate experience. Mr. Franklin is a graduate of the University of Maryland, with a Bachelor of Science degree in Finance.
Crystal Plum
Director, Chief Financial Officer and Treasurer since August 2022
Age — 42
Crystal Plum was appointed as Chief Financial Officer, Treasurer and Director in August 2022, in connection with consummation of the Company's merger with WHLR. She previously served as Corporate Secretary of the Company until November 2023. Ms. Plum was also appointed as Chief Financial Officer of WHLR in February 2020 and previously served as their Vice
President of Financial Reporting and Corporate Accounting from March 2018 to February 2020 and as their Director of Financial Reporting from September 2016 to March 2018. Prior to that time, she served as Manager at Dixon Hughes Goodman LLP from September 2014 to August 2016 and as Supervisor at Dixon Hughes Goodman LLP from 2008 to September 2014. Ms. Plum has experience reviewing and performing audits, reviews, compilations and tax engagements for a diverse group of clients, as well as banking experience. Ms. Plum is a Certified Public Accountant and has a Bachelor of Science in Business Administration — Accounting and Finance from Old Dominion University.
Director Compensation
Directors who are employees or officers of our Company do not receive any compensation for their services. For fiscal year 2023, non-employee and non-officer directors were entitled to annual cash compensation in the amount of $50,000 for their services as directors, with an additional annual cash retainer of $40,000 for service as Chair, to be filed pursuantpaid quarterly.
We reimburse each of our directors for his or her expenses incurred in connection with attendance at Board of Directors and committee meetings.
The following table summarizes our directors' compensation for 2023:
| | | | | | | | | | | | | | | | | | | | | | | | | | |
| Name | | Fees Earned
or Paid
in Cash ($) | | Stock Awards
($) (1) | | All Other
Compensation ($) | | Total ($) |
| Kerry G. Campbell | | 90,000 | | | — | | | — | | | 90,000 | |
| Paula J. Poskon | | 50,000 | | | — | | | — | | | 50,000 | |
| E.J. Borrack | | 50,000 | | | — | | | — | | | 50,000 | |
| M. Andrew Franklin | | — | | | — | | | — | | | — | |
| Crystal Plum | | — | | | — | | | — | | | — | |
(1)As of December 31, 2023, none of the directors held any equity awards on account of their service on the Board of Directors.
Compliance with Section 16(a) of the Exchange Act
Section 16(a) of the Exchange Act requires the Company's directors, executive officers, and beneficial owners of more than 10% of our common stock to Regulation 14A.file reports with the SEC indicating their holdings of, and transactions in, the Company's equity securities. Based solely on a review of copies of these reports, we believe that all of our executive officers, directors, and 10% owners timely complied with all Section 16(a) filing requirements for fiscal 2023.
Item 11.
| Item 11. Executive Compensation |
This item is incorporated by reference
Compensation Tables
Summary Compensation Table
The table below summarizes the total compensation for the fiscal years indicated paid or awarded to each of our named executive officers, calculated in accordance with SEC rules and regulations:
| | | | | | | | | | | | | | | | | | | | | | | | | | | | | | | | | | | | | | |
| Name | | Fiscal
Year | | Salary (1)
($) | | Bonus (2)
($) | | Stock
Awards (3)
($) | | All Other
Compensation
($) | | Total
($) |
| M. Andrew Franklin (4) | | 2023 | | 159,000 | | | 70,000 | | | — | | | — | | | 229,000 | |
| Chief Executive Officer | | 2022 | | — | | | — | | | — | | | — | | | — | |
| and President | | | | | | | | | | | | |
| Crystal Plum (4) | | 2023 | | 99,000 | | | 44,000 | | | — | | | — | | | 143,000 | |
| Chief Financial | | 2022 | | — | | | — | | | — | | | — | | | — | |
| Officer | | | | | | | | | | | | |
(1)Amounts shown for Mr. Franklin and Ms. Plum are salary allocations made from WHLR to the definitive proxy statementCompany in accordance with the Cost Sharing Agreement.
(2)Amounts shown for Mr. Franklin and Ms. Plum are bonus allocations made from WHLR to the Company in accordance with the Cost Sharing Agreement.
(3)This column represents the grant date fair value of stock awards granted under the Company's Stock Incentive Plans. The number of shares granted is calculated in accordance with Financial Accounting Standards Board, Accounting Standards Codification Topic 718 ("FASB ASC Topic 718"), not including any estimates of forfeitures related to service-based vesting conditions.
(4)Each of Mr. Franklin and Ms. Plum were appointed to each of their positions with the Company in August 2022 upon the closing of the Merger. Mr. Franklin and Ms. Plum are compensated by WHLR and the Company did not reimburse WHLR for any related compensation costs in 2022.
Grants of Plan-Based Awards for Year Ended December 31, 2023
There were no grants of plan-based awards for the 2021 Annual Meetingyear ended December 31, 2023.
Outstanding Equity Awards at Fiscal Year Ended December 31, 2023
There were no outstanding equity awards at December 31, 2023.
Potential Payments Upon Termination or Change in Control
Mr. Franklin and Ms. Plum
As of Shareholders,December 31, 2023, Mr. Franklin's employment agreement with WHLR provides for benefits upon a change in control of WHLR, which is the parent of the Company. In the event that Mr. Franklin terminates his employment with "Good Reason" following a "Change in Control" or is terminated by WHLR without "Cause" (as such terms are defined in his employment agreement) and such termination occurred within six months of a change in control, Mr. Franklin would generally be entitled to a lump sum payment equal to 2.99 times his annual base salary ($400,000), less mandatory deductions, payable within ninety calendar days of the termination (and, in the case of such a termination without Cause, a bonus amount based on any bonus determined by WHLR's Board of Directors and payable to other executives of WHLR during the twelve months after the change in control). In addition, Mr. Franklin would be filedentitled to health care coverage pursuant to Regulation 14A.COBRA at Mr. Franklin's expense for up to eighteen months.
As of December 31, 2023, Ms. Plum was not party to any arrangements with the Company or WHLR that provide for benefits payable upon a termination of employment or change in control.
Item 12.
| Item 12. Security Ownership of Certain Beneficial Owners and Management and Related Stockholder Matters |
This item
Based upon our records and the information reported in filings with the SEC, the following were beneficial owners of more than 5% of our shares of Common Stock as of December 31, 2023:
| | | | | | | | | | | | | | |
| Name and Address of Beneficial Owner | | Number of Shares
Beneficially Owned | | Percentage of Class
Beneficially Owned (1) |
Wheeler Real Estate Investment Trust, Inc. 2529 Virginia Beach Boulevard Virginia Beach, VA 23452 | | 13,718,169 | | | 100.0 | % |
(1)Based upon 13,718,169 shares of Common Stock outstanding on December 31, 2023. All beneficial ownership identified on this table is incorporatedheld by reference to the definitive proxy statement for the 2021 Annual Meetingbeneficial owner with sole voting power and sole investment power.
| | | | | | | | | | | | | | | | | | | | | | | | | | |
Name of
NEO or
Director | | Number of
Series B Shares
Beneficially Owned | | Percentage of
Series B Shares
Beneficially Owned | | Number of
Series C Shares
Beneficially Owned | | Percentage of
Series C Shares
Beneficially Owned |
| Kerry G. Campbell | | — | | | * | | — | | | * |
| Paula J. Poskon | | — | | | * | | — | | | * |
| E.J. Borrack | | — | | | * | | — | | | * |
| M. Andrew Franklin | | 2,890 | | | * | | 1,900 | | | * |
| Crystal Plum | | — | | | * | | — | | | * |
| Directors and Executive Officers as a Group | | 2,890 | | | * | | 1,900 | | | * |
*Less than 1%
Item 13.
| Item 13. Certain Relationships and Related Transactions and Director Independence |
This item
Related Party Policies and Related Party Transactions
WHLR's Code of Business Conduct and Ethics requires that our directors and officers deal with the Company on an arms-length basis in any related party transaction. All transactions between us and any of our directors, named executive officers or other vice presidents, or between us and any entity in which any of our directors, named executive officers or other vice presidents is incorporatedan officer or director or has an ownership interest, must be pre-approved by referencethe Board of Directors.
With the completion of the Company's merger with WHLR, the Company became a subsidiary of WHLR. WHLR performs property management and leasing services for the Company pursuant to the definitive proxy statementWheeler Real Estate Company Management Agreement. The management fee is 4% of gross operating income, and leasing commissions range from 3% to 6%. During the years ended December 31, 2023 and 2022, the Company paid WHLR $2.1 million and $1.0 million, respectively, for these services. The Operating Partnership and WHLR's operating partnership, Wheeler REIT, L.P., are party to the 2021 Annual MeetingCost Sharing Agreement. The related party amounts due to WHLR at December 31, 2023 and 2022 are comprised of:
| | | | | | | | | | | |
| December 31, |
| 2023 | | 2022 |
| Financings and real estate taxes | $ | 7,166,000 | | | $ | 7,166,000 | |
| Management fees | 225,000 | | | 110,000 | |
| Leasing commissions | 161,000 | | | 85,000 | |
| Cost Sharing Agreement allocations (a) | 548,000 | | | — | |
| Other | (6,000) | | | (33,000) | |
| Total | $ | 8,094,000 | | | $ | 7,328,000 | |
(a)Includes allocations for executive compensation and directors' liability insurance. In 2022, WHLR did not make any allocations to the Company for these services due to certain limitations set forth in the Cost Sharing Agreement.
Determinations of Shareholders, to be filed pursuant to Regulation 14A.Director Independence
The Board of Directors currently consists of five members. The Chair of the Board of Directors is Kerry G. Campbell. The Board of Directors reviews the independence of each director yearly. During this review, the Board of Directors considers whether there are any transactions and relationships between any director (and his or her immediate family and affiliates) and the Company and its management that are inconsistent with a determination that the director is independent in light of applicable law and listing standards. The Company believes that under the applicable rules and regulations of the New York Stock Exchange, Mr. Campbell, Ms. Poskon, and Ms. Borrack are independent. Mr. Franklin and Ms. Plum are not independent because they are officers of the Company.
Item 14.
| Item 14. Principal Accountant Fees and Services |
This item is incorporated by reference
The Company's independent registered public accounting firm was Cherry Bekaert LLP in 2023 and Ernst & Young LLP and Cherry Bekaert LLP in 2022. The following table summarizes fees paid to our independent registered public accounting firms for the years ended December 31, 2023 and 2022:
| | | | | | | | | | | | | | |
| Type of Fee | | 2023 | | 2022 |
| Audit Fees (1) | | $ | 297,000 | | | $ | 282,000 | |
| Audit Related Fees | | — | | | — | |
| Tax Fees (2) | | — | | | 183,000 | |
| All Other Fees | | — | | | — | |
| Total | | $ | 297,000 | | | $ | 465,000 | |
(1)Audit fees were incurred for professional services in connection with the audit of our consolidated financial statements for the years ended December 31, 2023 and 2022, for internal control over financial reporting for the year ended December 31, 2022, reviews of our interim consolidated financial statements which are included in each of our quarterly reports on Form 10-Q for the years ended December 31, 2023 and 2022, and certain accounting consultations.
(2)Tax fees for 2022 include tax compliance and preparation, and tax consulting services related to tax planning.
Prior to the
definitive proxy statement forcompletion of the
2021 Annual MeetingMerger on August 22, 2022, Cedar's then-Audit Committee reviewed and approved the fees of
Shareholders, to be filed pursuant to Regulation 14A.the Company's independent registered public accounting firm in accordance with its policies and procedures. Following the completion of the Merger, the Audit Committee was disbanded and WHLR's Audit Committee serves as the Company's audit committee, which reviewed and approved all of the 2022 and 2023 fees of the Company's independent registered public accounting firm in accordance with its policies and procedures.
Part IV
Item 15.
| Item 15. Exhibits and Financial Statement Schedules |
| (a)1. Financial Statements | 1. Financial Statements
|
The response to this portion of Item 15 is included in Item 8 of this report.
| 2.Financial Statement Schedules | Financial Statement Schedules
|
The response to this portion of Item 15 is included in Item 8 of this report.
3.Exhibits
| | | | | | | | | | | | | | |
| | | Incorporated by Reference |
| Item | | 3. | Exhibits
|
Item
| | Title or Description | Form | Filing Date |
| | | | |
| 2.1.a | | | Current Report on Form 8-K | March 3, 2022 |
3.1.a
| | | | |
| 2.1.b | | | Annual Report on Form 10-K | March 2, 2023 |
| | | | |
| 2.1.c | | | Annual Report on Form 10-K | March 2, 2023 |
| | | | |
| 2.1.d | | | Annual Report on Form 10-K | March 2, 2023 |
| | | | |
| 2.2.a | | Agreement and Plan of Merger, dated as of March 2, 2022, by and among Wheeler Real Estate Investment Trust, Inc., Wheeler Merger Sub, Inc., WHLR OP Merger Sub LLC, Cedar Realty Trust, Inc., and Cedar Realty Trust Partnership, L.P. | Current Report on Form 8-K | March 3, 2022 |
| | | | |
| 2.2.b | | First Amendment to Merger Agreement, dated as of April 19, 2022, by and among Wheeler Real Estate Investment Trust, Inc., Wheeler Merger Sub, Inc., WHLR OP Merger Sub LLC, Cedar Realty Trust, Inc., and Cedar Realty Trust Partnership, L.P. | Proxy Statement on Schedule 14A | April 21, 2022 |
| | | | |
| 2.2.c | | Second Amendment to Merger Agreement, entered into as of August 9, 2022, by and among Wheeler Real Estate Investment Trust, Inc., WHLR Merger Sub, Inc., WHLR OP Merger Sub LLC, Cedar Realty Trust, Inc., and Cedar Realty Trust Partnership, L.P. | Current Report on Form 8-K | August 12, 2022 |
| | | | |
| 3.1.a | | | Annual Report on Form 10-K for the year ended December 31, 2013. | February 25, 2014 |
| | | | |
3.1.b | | | Registration Statement on Form 8-A filed on | August 18, 2017.2017 |
| | | | |
3.1.c | | | Current Report on Form 8-K filed on | August 22, 2017.2017 |
| | | | |
| | | | | | | | | | | | | | |
| | | Incorporated by Reference |
3.1.d
Item | | Title or Description | Form | Filing Date |
| 3.1.d | | | Current Report on Form 8-K filed on | December 15, 2017.2017 |
| | | | |
3.1.e | | | Current Report on Form 8-K filed on | May 7, 2018.2018 |
| | | | |
3.1.f | | | Current Report on Form 8-K filed on | November 27, 2020.2020 |
| | | | |
3.1.g | | | Current Report on Form 8-K filed on | November 27, 2020.2020 |
| | | | |
3.2 | | | Current Report on Form 8-K filed on | November 2, 2020.2020 |
| | | | |
3.3.a
4.1† | | |
| | |
3.3.b
| | Amendment No. 1 to Agreement of Limited Partnership of Cedar Shopping Centers Partnership, L.P., incorporated by reference to Exhibit 3.5 of the Registration Statement on Form S-11/A filed on October 14, 2003.
|
| | |
3.3.c
| | Amendment No. 2 to Agreement of Limited Partnership of Cedar Shopping Centers Partnership, L.P., incorporated by reference to Exhibit 3.3.c of Form 10-K for the year ended December 31, 2004.
|
| | |
3.3.d
| | Amendment No. 3 to Agreement of Limited Partnership of Cedar Shopping Centers Partnership, L.P., incorporated by reference to Exhibit 3.3.d of Form 10-K for the year ended December 31, 2006.
|
| | |
3.3.e
| | Amendment No. 4 to Agreement of Limited Partnership of Cedar Shopping Centers Partnership, L.P., incorporated by reference to Exhibit 3.2 of Form 10-Q for the quarterly period ended September 30, 2010.
|
| | |
3.3.f
| | Amendment No. 5 to Agreement of Limited Partnership of Cedar Realty Trust Partnership, L.P., incorporated by reference to Exhibit 3.2 of Form 8-K filed on May 16, 2012.
|
| | |
3.3.g
| | Amendment No. 6 to Agreement of Limited Partnership of Cedar Realty Trust Partnership, L.P., incorporated by reference to Exhibit 3.2 of Form 8-K filed on May 29, 2012.
|
| | |
Item
| | Title or Description
|
3.3.h
| | Amendment No. 7 to Agreement of Limited Partnership of Cedar Realty Trust Partnership, L.P., incorporated by reference to Exhibit 3.2 of Form 8-K filed on September 14, 2012.
|
| | |
3.3.i
| | Amendment No. 8 to Agreement of Limited Partnership of Cedar Realty Trust Partnership, L.P., incorporated by reference to Exhibit 3.3 of Form 8-K filed on November 21, 2012.
|
| | |
3.3.j
| | Amendment No. 9 to Agreement of Limited Partnership of Cedar Realty Trust Partnership, L.P., incorporated by reference to Exhibit 3.2 of Form 8-K filed on February 11, 2013.
|
| | |
3.3.k
| | Amendment No. 10 to Agreement of Limited Partnership of Cedar Realty Trust Partnership, L.P., incorporated by reference to Exhibit 3.3 of Form 8-K filed on August 22, 2017.
|
| | |
3.3.1
| | Amendment No. 11 to Agreement of Limited Partnership of Cedar Realty Trust Partnership, L.P., incorporated by reference to Exhibit 3.2 of Form 8-K filed on December 15, 2017.
|
| | |
3.3.m
| | Amendment No. 12 to Agreement of Limited Partnership of Cedar Realty Trust Partnership, L.P.
|
| | |
4.1
| | Description of the Registrant’sRegistrant's Securities Registered Pursuant to Section 12 of the Securities Exchange Act of 1934, incorporated by reference to Exhibit 4.1 of Form 10-K for the year ended December 31, 2019.1934. | | |
| | | | |
10.1.a.1*
10.1 | | |
10.1.a.2*
| | First Amendment to Cedar Realty Trust, Inc. 2012 Stock Incentive Plan.
|
10.1.b.1*
| | Cedar Realty Trust, Inc. 2017 Stock Incentive Plan, incorporated by reference to Annex A of the Definitive Proxy Statement filed on March 23, 2017.
|
| | |
10.1.b.2*
| | First Amendment to Cedar Realty Trust, Inc. 2017 Stock Incentive Plan, incorporated by reference to Annex A of the Definitive Proxy Statement filed on March 29, 2019.
|
| | |
10.1.b.3*
| | Second Amendment to Cedar Realty Trust, Inc. 2017 Stock Incentive Plan.
|
| | |
10.2.a*
| | 2005 Cedar Shopping Centers, Inc. Deferred Compensation Plan, incorporated by reference to Exhibit 10.1 of Form 8-K filed on December 22, 2005.
|
| | |
10.2.b*
| | Amendment No. 1 to the 2005 Cedar Shopping Centers, Inc. Deferred Compensation Plan, effectiveLoan Agreement, dated as of December 21, 2006, incorporated by reference to Exhibit 10.2.b of Form 10-K for the year ended December 31, 2006.
|
| | |
10.2.c*
| | Amendment No. 2 to the 2005 Cedar Shopping Centers, Inc. Deferred Compensation Plan, effective as of December 11, 2007, incorporated by reference to Exhibit 10.2.c of Form 10-K for the year ended December 31, 2007.
|
| | |
10.2.d*
| | Amendment No. 3 to the 2005 Cedar Shopping Centers, Inc. Deferred Compensation Plan, effective as of December 16, 2008, incorporated by reference to Exhibit 10.2.d of Form 10-K for the year ended December 31, 2008.
|
| | |
10.2.e*
| | Amendment No. 4 to the 2005 Cedar Shopping Centers, Inc. Deferred Compensation Plan, effective as of June 30, 2011, incorporated by reference to Exhibit 10.4 of Form 10-Q for the quarterly period ended September 30, 2011.
|
| | |
10.2.f*
| | Amendment No. 5 to the 2005 Cedar Realty Trust, Inc. Deferred Compensation Plan, effective as of December 14, 2011, incorporated by reference to Exhibit 10.2.f of Form 10-K for the year ended December 31, 2011.
|
| | |
10.2.g*
| | Amendment No. 6 to the 2005 Cedar Realty Trust, Inc. Deferred Compensation Plan, effective as of December 12, 2012, incorporated by reference to Exhibit 10.2.g of Form 10-K for the year ended December 31, 2012.
|
| | |
10.2.h*
| | Amendment No. 7 to the 2005 Cedar Realty Trust, Inc. Deferred Compensation Plan, effective as of December 24, 2013, incorporated by reference to Exhibit 10.2.h of Form 10-K for the year ended December 31, 2013.
|
| | |
Item
| | Title or Description
|
10.3.a*
| | Amended and Restated Employment Agreement between Cedar Realty Trust, Inc. and Bruce J. Schanzer, dated effective as of June 15, 2018, incorporated by reference to Exhibit 10.1 of Form 8-K filed on June 18, 2018.
|
| | |
10.3.b*
| | Amended and Restated Employment Agreement between Cedar Realty Trust, Inc. and Philip Mays, dated effective as of June 6, 2018, incorporated by reference to Exhibit 10.1 of Form 8-K filed on January 3, 2019.
|
| | |
10.3.c*
| | Amended and Restated Employment Agreement between Cedar Realty Trust, Inc. and Robin McBride Zeigler, dated effective as of April 1, 2019, incorporated by reference to Exhibit 10.1 of Form 10-Q for the quarterly period ended September 30, 2019.
|
| | |
10.4.a.1
| | Fourth Amended and Restated Loan Agreement (the “Loan Agreement”)August 22, 2022, by and amongbetween Cedar Realty Trust Partnership, L.P., as Borrower, KeyBank National Association as Administrative Agent, KeyBanc Capital Markets as Lead Arranger and other lending institutions which are or may become parties toBookrunner, and the Loan Agreement, and KeyBank National Association (as Administrative Agent), dated as of September 8, 2017, incorporated by reference to Exhibit 10.1 ofLenders party thereto.
| Current Report on Form 10-Q for the quarterly period ended September 30, 2017.8-K | August 25, 2022 |
| | | | |
| 10.2 | | | Current Report on Form 8-K | August 25, 2022 |
| 10.4.a.2
| | First Amendment to Fourth Amended and Restated Loan Agreement, dated as of July 24, 2018, incorporated by reference to Exhibit 10.2 of Form 10-Q for the quarterly period ended June 30, 2018.
| |
| 10.3 | | |
10.4.a.3
| | |
| | |
10.4.b.1
| | Third Amended and Restated Loan Agreement (the “Loan Agreement”) by and amongWheeler Real Estate Investment Trust, Inc., Cedar Realty Trust, Inc., Cedar Realty Trust Partnership, L.P., KeyBank National Association and other lending institutions which are or may become parties to the Loan Agreement, and KeyBank National Association (as Administrative Agent), dated ascertain subsidiaries of July 24, 2018, incorporated by reference to Exhibit 10.1 of Form 10-Q for the quarterly period ended June 30, 2018.
|
| | |
10.4.b.2
| | First Amendment to Third Amended and Restated Loan Agreement, dated as of August 4, 2020, incorporated by reference to Exhibit 10.2 of Form 10-Q for the quarterly period ended September 30, 2020.
|
| | |
10.4.c.1
| | Loan Agreement (the “Loan Agreement”) by and among Cedar Realty Trust Partnership, L.P., Regions Bank and other lending institutions which are or may become parties to the Loan Agreement, and KeyBank National Association (as Administrative Agent), dated as of April 26, 2016 incorporated by reference to Exhibit 10.2 ofL.P.
| Current Report on Form 10-Q for the quarterly period ended March 31, 2016.8-K | August 25, 2022 |
| | | | |
10.4.c.2
10.4 | | | Current Report on Form 10-Q for the quarterly period ended September 30, 2016.8-K | October 31, 2022 |
| | | | |
10.4.c.3
10.5 | | | Current Report on Form 10-Q for the quarterly period ended June 30, 2018.8-K | December 22, 2022 |
| | | | |
10.4.c.4
14.1† | | | | Third Amendment to Loan Agreement, dated as of August 4, 2020, incorporated by reference to Exhibit 10.3 of Form 10-Q for the quarterly period ended September 30, 2020.
|
| | | | |
10.5
21.1† | | |
| | |
21.1
| | List of Subsidiaries of the Registrant | | |
| | | | |
23.1
31.1† | | |
| | |
31.1
| | Rule 13a-14(a) Certification of Chief Executive Officer | | |
| | | | |
31.2
31.2† | | | | |
| | | | |
32.1
32.1† | | | | |
| | | | | | | | | | | | | | |
| | | Incorporated by Reference |
| Item | | Title or Description | Form | Filing Date |
| 32.2
| | | |
| 32.2† | | | | |
| | |
| Item
| Title or Description
|
97.1† | | | | |
| | | | |
| 101.INS | | Inline XBRL Instance Document – the instance document does not appear in the Interactive Data File because iXBRLtags are embedded within the Inline XBRL document. | | |
| | | | |
101.SCH | | Inline XBRL Taxonomy Extension Schema Document | | |
| | | | |
101.CAL | | Inline XBRL Taxonomy Extension Calculation Linkbase Document | | |
| | | | |
101.DEF | | Inline XBRL Taxonomy Extension Definition Linkbase Document | | |
| | | | |
101.LAB | | Inline XBRL Taxonomy Extension Label Linkbase Document | | |
| | | | |
101.PRE | | Inline XBRL Taxonomy Extension Presentation Linkbase Document | | |
| | | | |
104 | | Cover Page Interactive Data File (formatted as Inline XBRL and contained in Exhibit 101) |
| | |
| | |
| | |
*
| Management contracts or compensatory plans required to be filed pursuant to Rule 601 of Regulation S-K.
|
† Filed or furnished herewith. | (b)*Pursuant to Item 601(b)(2) of Regulation S-K, certain exhibits have been omitted. The registrant hereby agrees to furnish a copy of any omitted exhibit to the SEC upon request by the SEC.
| Exhibits
|
(b)Exhibits
The response to this portion of Item 15 is included in Item 15(a)(3) above.
| (c)The following financial statement schedules are filed as part of the report: | The following financial statement schedules are filed as part of the report:
|
The response to this portion of Item 15 is included in Item 15(a)(2) above.
Item 16.
| Form 10-K Summary
|
Item 16. Form 10-K Summary: None
Pursuant to the requirements of the Securities Exchange Act of 1934, the registrant has duly caused this report to be signed on its behalf by the undersigned thereunto duly authorized.
| | | | | | | | |
/s/ BRUCE J. SCHANZERM. ANDREW FRANKLIN | | /s/ PHILIP R. MAYS CRYSTAL PLUM |
Bruce J. Schanzer
M. Andrew Franklin | | Philip R. Mays
Crystal Plum |
Chief Executive Officer and President (principal executive officer)Principal Executive Officer) | | Senior Executive Vice President,
Chief Financial Officer (Principal Financial Officer and Treasurer |
| | (principal financial officer)
|
| | |
/s/ GASPARE J. SAITTA, II
| | |
Gaspare J. Saitta, II
| | |
Vice President and ChiefPrincipal Accounting Officer
| | |
(principal accounting officer)
| | Officer) |
February 11, 2021
March 5, 2024
Pursuant to the requirements of the Securities Exchange Act of 1934, this report has been signed by the following persons on behalf of the registrant and in the capacities and as of the date indicated.
| | | | | | | | |
/s/ ABRAHAM EISENSTATM. ANDREW FRANKLIN | | /s/ GREGG GONSALVES CRYSTAL PLUM |
Abraham Eisenstat
M. Andrew Franklin | | Gregg Gonsalves
Crystal Plum |
Chief Executive Officer, President and Director
(Principal Executive Officer) | | Chief Financial Officer and Director (Principal Financial Officer and Principal Accounting Officer) |
| | |
| /s/ KERRY G. CAMPBELL | | /s/ E.J. BORRACK |
/s/ PAMELA N. HOOTKIN
Kerry G. Campbell | | /s/ SABRINA L. KANNER
E.J. Borrack |
Pamela N. Hootkin
Chair of Board | | Sabrina L. Kanner
Director |
| Director
| | Director
| /s/ PAULA J. POSKON | | |
/s/ STEVEN G. ROGERS
Paula J. Poskon | | | /s/ BRUCE J. SCHANZER
Steven G. Rogers
Director | | | Bruce J. Schanzer
Director
| | Director
|
/s/ ROGER M. WIDMANN
| | |
Roger M. Widmann
| | |
Director
| | |
| | |
February 11, 2021
85
March 5, 2024