|
|
|
|
|
|
|
|
|
|
1
| • our ability to stay abreast of, and effectively comply with, new or modified laws and regulations that currently apply or become applicable to our business and our beliefs regarding our compliance therewith; • global and domestic economic conditions affecting us or our customers; • our ability to overcome challenges facing the automotive industry ecosystem, including inventory supply problems, global supply chain challenges, changes to trade policies and other macroeconomic issues; • our ability to maintain an effective system of internal controls necessary to accurately report our financial results and prevent fraud; • our expectations regarding cash generation and the sufficiency of our cash to fund our operations; • the future trading prices of our Class A common stock; • our expectation that we will realize the benefits of deferred tax assets; • our expected returns on investments; • the impact of our expense reduction efforts during the second quarter of 2020; • our outlook for our Restricted Listings product; • our expectations regarding future fee reductions for customers; and • the ongoing impacts of the COVID-19 pandemic.
|
|
|
|
|
|
You should not rely upon forward‑looking statements as predictions of future events. We have based the forward‑looking statements contained in this report primarily on our current expectations and projections about future events and trends that we believe may affect our business, financial condition, operating results, and growth prospects. The outcome of the events described in these forward‑looking statements is subject to risks, uncertainties, and other factors described in the section titled “Risk Factors” and elsewhere in this report. Moreover, we operate in a very competitive and rapidly changing environment. New risks and uncertainties emerge from time to time, and it is not possible for us to predict all risks and uncertainties that could have an impact on the forward‑looking statements contained in this report. Further, our forward‑looking statements do not reflect the potential impact of any future acquisitions, mergers, dispositions or joint ventures in which we may be involved, or investments we may make. We cannot assure you that the results, events, and circumstances reflected in the forward‑looking statements will be achieved or occur, and actual results, events, or circumstances could differ materially from those described in the forward‑looking statements.
The forward‑looking statements made in this report relate only to events as of the date on which the statements are made. We undertake no obligation to update any forward‑looking statementsstatement made in this report to reflect events or circumstances after the date of this report or to reflect new information or the occurrence of unanticipated events, except as required by law.
2
PART I
Item 1. Business.
BUSINESSOverview
Overview
CarGurus, Inc. is a global,multinational, online automotive platform for buying and selling vehicles that is building upon its industry-leading listings marketplace connecting buyerswith both digital retail solutions and sellers of newthe CarOffer digital wholesale platform. The CarGurus platform gives consumers the confidence to buy and/or sell a vehicle either online or in-person, and used cars. Usingit gives dealerships the power to accurately price, instantly acquire, effectively market, and quickly sell vehicles, all with a nationwide reach. We use proprietary technology, search algorithms and innovative data analytics we believe we are buildingto bring trust, transparency and competitive pricing to the world’s most trusted and transparent automotive marketplace and creating a differentiated automotive search experience for consumers. Our trusted marketplace empowers consumers with unbiased third‑party validation on pricing and dealer reputation as well as other information that aids them in finding “Great Deals from Top-Rated Dealers.” Our selection provides the largest number of car listings available on any major U.S. online automotive marketplace.shopping experience. In addition to the United States, we operate online marketplaces under the CarGurus brand in Canada and the United Kingdom. WeIn the United States and United Kingdom, we also operate twothe Autolist and PistonHeads online marketplaces, respectively, as independent brands: PistonHeadsbrands.
In 2006, Langley Steinert founded CarGurus on the premise of bringing trust and transparency to the automotive marketplace. Our online marketplace platform provides ease of access to prices of vehicles and dealer ratings both of which are imperative to a consumer’s vehicle purchase. By providing car-shoppers with the tools and insights necessary for their automotive journey, CarGurus has garnered a large and engaged user base with whom our dealers can transact. Our ready-to-shop audience of 29.1 million average monthly visitors in the U.S. has attracted 24,567 paying dealers to list inventory on our U.S. online marketplace as of December 31, 2022. Over time, we have seen an evolution of dealer and consumer wants and needs as we enter a more digitally-enabled world. To best meet our customers’ needs, we evolved our Listings business to a transaction-enabled platform by introducing products that allow consumers to not only embark on a convenient self-selective purchasing journey with a seamless online to in-store transition but also to efficiently sell their car online from the comfort of their home. Dealers now have the ability to reach customers outside of their immediate geographic footprint and source inventory nationwide from both consumers and other dealers. This expanded suite of offerings can help increase our dealers’ return on investment, or ROI, adding even more scale to our marketplace network. While, we have evolved to an end-to-end transaction-enabled platform where consumers can shop, finance, buy, and sell, and dealers can source, market, and sell vehicles, our ultimate goal remains the same: to empower our customers by giving them all the tools and information they need to buy or sell any car, anywhere, at the right price and in the right way for them. At CarGurus, we give people the power to reach their destination.
Prior to the first quarter of 2022, we had two reportable segments – United KingdomStates and Autolist inInternational. Effective as of the first quarter of 2022, we revised our segment reporting from two reportable segments to one reportable segment. Effective as of the fourth quarter of 2022, we revised our segment reporting from one reportable segment to two reportable segments – U.S. Marketplace and Digital Wholesale. The U.S. Marketplace segment derives revenues from marketplace services for customers within the United States. The Digital Wholesale segment derives revenues from our Dealer-to-Dealer and Instant Max Cash Offer, or IMCO, services and products sold on our CarOffer platform. See Note 13 to our consolidated financial statements appearing elsewhere in this Annual Report on Form 10-K for further segment reporting and geographical information.
Consumers' CarGurus Journey
Shop: A core principlecar purchase is a milestone in a consumer’s life – whether it is the first set of keys or parting from a memory-filled vehicle. However, shopping for a vehicle can be frustrating instead of empowering. Enter CarGurus, where we provide trust and transparency to the CarGurus marketplace is transparency. For consumers considering used vehicles,process for consumers. As the consumer moves to purchase a vehicle, we aggregate vehicle inventory from dealers and apply our proprietary analysis to generate a Deal Rating as one of: Great Deal, Good Deal, Fair Deal, High Priced, or Overpriced. Deal Rating illustrates how competitive a listing is compared to similar cars recently sold in the same region in recent history.region. We determine Deal Rating principally on the basis of both our proprietary Instant Market Value, or IMV, algorithm, which determines the market value of a used vehicle in a local market, and Dealer Rating, a measure of a dealer’s reputation as determined by reviews of that dealer from our user community. As the only major U.S. online automotive marketplace that defaults to sorting organic search results based on a used car’s Deal Rating, we enable consumers to find the most relevantappropriate car for their needs. For new cars, we help our users understand deal quality by providing price analysis and our Dealer Rating. We also provide our users with information that historically has not been widely available, such as Price History, Time on Site, and Vehicle History.
3
Finance & Buy: Once a consumer has found a listing they intend to pursue, we provide an omni-channel approach to the purchase of a vehicle partially or principally online. Our digital retail products such as Digital Deal provide the consumer with a self-selected car-buying journey to tailor their experience to their specific needs. Consumers can build a near penny-perfect deal with either dealer or vehicle specific finance and insurance products, and then place a deposit on their vehicle of choice, and/or take delivery of the vehicle all while experiencing a seamless online to in-store experience. We believe this approach throughout the end-to-end consumer experience brings greater trust, transparency, trust, and efficiency to a consumer’s entire car research and buying process,shopping experience, leading to higher engagementhighly-engaged, more confident and satisfied shoppers.
Sell: According to recent consumer research, almost 70% of car-buying shoppers will trade in or sell a vehicle during their car-shopping journey. Our acquisition of 51% interest in CarOffer, LLC, or CarOffer, in January 2021, with the ability to buy the remaining equity interest in the company in the second half of 2024, enabled the launch of CarGurus Instant Max Cash Offer, or IMCO. IMCO provides the consumer with the ability to complete this part of the process entirely online through a trusted and transparent experience. Consumers who are trading-in or selling vehicles receive the most competitive offer sourced from our in-network dealers. Consumers benefit from the volume of participating dealerships in the CarGurus/CarOffer network, as well as the 24/7 automated matching provided by CarOffer's proprietary matrix technology, or the Buying Matrix, which enables a hands-off approach to find the consumer the best deal at any time. Once the customer has accepted their offer, they can further customize their intake experience by arranging a pick-up either at their home or a drop-off location of their choice within participating states. With an expansive dealer network, consumers can have the confidence that they are truly finding the best deal for their vehicle instantly.
Dealers' CarGurus Journey
Source: Made possible by the acquisition of CarOffer, we entered the digital wholesale space enabling dealers to acquire inventory in a convenient and efficient manner. CarOffer is an automated instant wholesale vehicle trade platform that is disrupting the traditional wholesale auction model. CarOffer's technology enables dealers to bid, transact, inspect and transport vehicles seamlessly and efficiently without geographic limitations. Any dealer, including those who are customers of the CarGurus website, can enroll on the CarOffer platform at no additional cost. The Buying Matrix allows dealers on the platform to buy and sell vehicles using limit orders, saving dealers the time and expense of going to an auction to acquire vehicles via the traditional in-person physical auction model. Through inspections on sales, dealers can be confident their purchase meets their expectations while they reap the benefits of focusing their resources and attention on other elements of their businesses. As CarOffer continues to activate more informed consumer who is better prepareddealers, we expect dealers will see a corresponding increase of inventory on the platform, further enabling liquidity, selection, and business efficiencies. Additionally, the CarOffer platform enabled us to purchase at the dealership.
Our large, engaged, and predominantly mobile user base presents an attractive audience of in‑market consumers for our dealers. By presenting consumers with data such as our Deal Ratings, Price History, Time on Site, and Vehicle History,launch IMCO nationwide, which we believe our consumer audience is comprised of more informed, ready-to-purchase shoppers. By connecting dealers with such consumers, we believe weexpect over time will provide dealers with an efficient customer acquisition channelaccess to a fresh source of consumer trade-in inventory and attractive returnswill provide even further liquidity on the CarOffer platform. Similar to a dealer-to-dealer purchase, CarOffer handles inspections, transportation, titles, and payments in one bill of sale from the consumer. CarOffer’s platform provides a solution for a dealer looking to minimize reliance on in-person or online auctions to source their marketing spend with us. vehicle inventory while assuring they are paying a fair price, which has led to rapid growth and adoption within the dealer community.
Market: Dealers can list their inventory in ouron CarGurus’ marketplace for free or with a subscription to one of our paid Listings packages. Non-paying dealers receive a limited number of anonymized email connections and access to a subset of the tools on our Dealer Dashboard at no cost. A dealer with a paid subscription receives connections with consumers that are not anonymous and are made through a wider variety of methods, including phone calls, email, managed text and chat, links to the dealer’s website, and map directions to its dealerships. The primary objective of our traffic acquisition and site improvement efforts is to generate greater volumes ofquality high-intent consumer leads to dealers. Leads are a subcategory of connections that we define as user inquiries via our marketplace to dealers by phone calls, email, or managed text and chat interactions. We define connections as interactions between consumers and dealers via our marketplace through phone calls, email, managed text and chat, and clicks to access the dealer’s website and map directions to the dealership. Dealers with our paid Listings packages are able to display their dealer name, address, and dealership information on their listings on our websites to gain brand recognition, which promotes walk‑inwalk-in traffic to the dealer.dealership. Paying dealers also have access to tools on the Dealer Dashboard as well as other digital retail add-on product offerings which enable dealers to expand their geographic footprint to reach a larger consumer audience while gaining efficiencies by streamlining the car sales process. Through our ready-to-purchase consumer audience, our paying dealers ultimately have a consistent and compelling ROI through our variety of product offerings.
4
Sell: By presenting consumers with data such as our Deal Ratings, Price History, Time on Site, Vehicle History and financing options we believe our consumer audience is comprised of more informed, ready-to-purchase shoppers. By connecting dealers with such consumers, we believe we provide dealers with access to an efficient customer acquisition channel with the highest-intent shoppers generating the highest ROI. Further, as consumer needs evolve to customizing aspects of their vehicle purchase, we provide dealers, through a variety of digital offerings, the means to cater to consumers on a personalized level. Consumers can choose to complete their self-selected car-shopping journey with Digital Deal and other digital offerings that we provide through our partnership with dealers, enabling an individualized shopping experience from financing options to placing a deposit. We also provide paying dealers with full access to our Dealer Dashboard, including inventory pricing tools informed by real‑real time market conditions, which helps them more effectively price, merchandise, and sell their cars. With CarOffer, we have also integrated insights regarding wholesale pricing among the dealer community. The ability to compare wholesale pricing with retail pricing ultimately allows dealers to price a car with more accuracy, winning loyal consumers with trust and transparency. These combined offerings allow dealers to efficiently drive their business to success from all aspects of sourcing, marketing, and selling. Our success in our partnership with dealers is evidenced by the number of paying dealers – 23,93424,567 paying dealers as of December 31, 20202022 – in our marketplace in the U.S. marketplace.
Our scaledCarGurus Value Proposition
With the majority of dealers in the United States listing inventory on our platform and our consumer-friendly deal ratings, we have built the most visited online automotive marketplace model drivesin the United States (Source: SimilarWeb, Traffic Report, Q4 2022, USA)and we believe that our scale creates powerful network effects.effects that reinforce the competitive strength of our business model. This powerful network has only strengthened since our acquisition of CarOffer. The combination of Digital Retail, Digital Wholesale and Listings creates powerful synergies for our dealer customers. Dealers can leverage this one-stop shop to acquire inventory from both consumers and dealers, list the vehicle on our marketplace and sell it utilizing our digital retail capabilities. CarGurus’ industry-leading inventory selection offered on our website from our U.S. dealers attracts a large and engaged consumer audience. The value of robust connections to this audience incentivizes dealers to purchase our paid Listings packages. Displaying listings from more paying dealers provides consumers with more dealer information and methods to contact them. More consumers – 36.229.1 million average monthly U.S. unique users in 2020 – and2022. The robust connections – 63.4 million in the U.S. in 2020 –from our high-intent consumer audience drive greater value toand a higher return on investment for our paying dealers on our platform.dealer. Driven by these network effects, we continue to amass more data points, which we use to continuously improvefurther strengthen our traffic acquisition efforts and marketplace search algorithms, the accuracyquality of Deal Ratings, our user experience, the quality of our partnership with dealers to provide innovative digital offerings and ultimately,much more. As we continue to innovate and progress our offerings to meet both consumer and dealer needs, we strive to uphold and improve the quality of the connections between consumers and dealers.
3
We generate marketplace subscription revenue from dealers through subscriptionsand become the preferred platform for all steps of the vehicle acquisition and sale process, ultimately giving dealers and consumers the power to our products, including our paid Listings packages (which include optional features and enhancements such as Area Boost) and products marketed under our Real-time Performance Marketing suite, or RPM, including our Dealer Display advertising and audience targeting products. We also generate advertising and other revenue from auto manufacturers and other auto‑related brand advertisers, as well as revenue from non-dealer products such as through our consumer financing partnerships and our peer-to-peer marketplace. Our financial performance over the last several years exemplifies the strength of our marketplace. In 2020, we generated net income of $77.6 million and our Adjusted EBITDA, a non-GAAP financial measure, was $160.8 million, compared to net income of $42.1 million and Adjusted EBITDA of $77.0 million in 2019 and net income of $65.2 million and Adjusted EBITDA of $49.7 million in 2018. See “Management’s Discussion and Analysis of Financial Condition and Results of Operations — Adjusted EBITDA” for more information regarding our use of Adjusted EBITDA and a reconciliation of Adjusted EBITDA to our net income.reach their destination.
ConsumerConsumers' Challenges
As consumers determinecomplete the end-to-end car they would like to purchase,shopping journey, the key questions they ask are:
| • Am I getting a fair price for my trade-in? • Should I purchase a vehicle with my trade-in? • What type of vehicle should I buy? • Where can I buy a car like this? • What is a fair price for this particular type of vehicle? • Have others had a good experience buying from this dealer? • How much of the purchase process can I transact online? • Can I obtain financing for this car, and at what cost? • What if this dealer is not local to my area? 5
|
|
|
|
|
|
|
|
|
|
|
|
In answering these questions, consumers historically had limited access to unbiasedtransparent information on specific vehicles, car pricing, and dealer reputation. Further, consumers who wanted to trade in their vehicle or wanted to complete select elements of their car shopping journey online typically had very limited options. Every vehiclecar-shopping journey is a unique experience, and so for consumers searching for a car, itembarking on this journey, there is difficult to aggregate the relevant inventory of available cars across sellers, a difficulty exacerbated by the lack of consistency in the way that dealers characterizeabsence of consistent information on pricing for both selling and purchasing vehicles. Selling a car’s attributes. Traditionally, dealers had more information about car prices thanvehicle was time-consuming and exhausting for consumers did, as consumers had limited resourcesthey traveled dealer to dealer to ensure they were receiving a fair and tools to determine an appropriate price.accurate price for their vehicle. Selecting the right dealer was also challenging for consumers as dealer reputations were historically based primarily on word‑of‑mouth.word-of-mouth. The lack of clear, unbiased, transparent information made it difficult for consumers to effectively compare vehicles, find the vehicles that best suited their needs and transact with well-regarded dealers. In addition, especially as a consequencefollowing the height of the COVID-19 pandemic, consumers are also increasingly interested in understanding which aspects of their buying journey they can carry out entirelycomplete online including whether they pre-qualifyand are looking for financing onways to customize their journey to incorporate both online and in-person components.
Dealers' Challenges
Dealers have had to face a vehicle purchase before travelingnew set of challenges over the past few years as a result of the COVID-19 pandemic and the subsequent semiconductor chip shortage impacting auto manufacturers' production levels. The shortage of both used and new car inventory and rapidly evolving wholesale prices caused dealers to a dealership.
Dealer Challenges
invest in additional methods to source wholesale vehicles all while dealers have been adapting to the shift from physical to digital marketplaces as consumer needs and wants continue to evolve and competition from online-retailers increases. Dealers need to remain competitive in their offers for consumer trade-ins, as consumers have increasing means to source multiple offers in this highly competitive and digitally-enabled market. The economics of dealerships depend largely on vehicle acquisition costs, sales volume, and customer acquisition efficiency. To achieve a high return on their marketing investments, dealers must find in‑market consumers; yet because car purchasesin-market consumers. Dealers additionally need to be strategic about selling vehicles before they are infrequent, only a small percentage of consumers are shopping for a car at any given point in time.“aged inventory.” Traditional marketing channels that dealers utilize, including television, radio, and newspaper, can effectively target locally but are inefficient in targeting the relatively smallnarrow percentage of high-intent consumers who are actively in the marketready to buypurchase and potentially trade-in a car.vehicle both locally and outside a dealership's immediate geographic footprint. In addition, with used car pricing isbeing fluid because it is based ondue to rapidly shifting supply and demand dynamics. Dealersdynamics, dealers need to find ways to manage constantly changing inventory and adjust pricing and purchasing strategies to adapt to frequently changing market conditions. conditions as evidenced by the past few years.
Our Strengths
We believe that our competitive advantages are based on the following key strengths:
Trusted Marketplace for Consumers. We provide consumers with unbiasedtransparent information, intuitive search results, and other tools that aidsaid them in their car-shopping journey. Furthermore, consumers can have confidence in finding “Great Dealsa fair value in the vehicles they search for in our marketplaces since less than one-third of eligible vehicle listings on CarGurus.com earn a Great Deal or Good Deal rating. We also enable bids on vehicle trade-ins and sales from Top-Rated Dealers.”the thousands of dealers in the CarGurus/CarOffer network, assuring consumers that they are receiving the best offer on their vehicle. We offer the largest online selection of new and used car listings of any major U.S. online automotive marketplace. We aggregate and analyze these listings using proprietary technology and data along with innovative data analytics to create a differentiated automotive search experience for consumers. We believe that providing a transparent consumer experience with unbiased information has instilled trust in us among our users, helping usconsumers to become the most visited online automotive marketplace in the United States according to data
4
bring them great deals from Comscore.top-rated dealers. In 2020,2022, we experienced over 90.977.7 million average monthly sessions in the United States. We believe this user traffic, an indicator of consumer satisfaction and engagement, is critical to our marketplace success and will continue to strengthen our market position. We attract our audience from a diverse range of acquisition channels including, but not limited to, direct navigation, mobile applications, email, organic search, paid search advertising, social media advertising, displayon-site advertising, audience targeting, and brand advertising campaigns. In addition, we focus our efforts on attracting users that we believe are near a car purchasing decision, resulting in a higher quality audience to which our dealers can market. For our United States marketplace, in 2020 we generated 63.4 million connections and 38.3 million leads, compared with 65.3 million connections and 38.5 million leads in 2019. We define (i) connections as interactions between consumers and dealers via our marketplace through phone calls, email, managed text and chat, and clicks to access the dealer’s website and map directions to the dealership and (ii) leads as user inquiries via our marketplace to dealers by phone calls, email, or managed text and chat.
Proprietary Search Algorithms and Data‑DrivenData-Driven Approach. We have built an extensive repository of data on cars, prices, dealers, and the interactions between consumers and dealers that is the result of many years of data aggregation and regression modeling. Our proprietary search algorithms and data analytics allow us to use this valuable data to bring greater transparency to our platform. The primary product of this analysis is our determination of a used car’s IMV, which, together with Dealer Rating, drives our Deal Rating. We calculate IMV by applying more than 20 ranking signals and more than 100 normalization rules to tens of millions of data points, including the make, model, trim, year, features, condition, history, geographic location, and mileage of the car. With our acquisition of CarOffer in 2021, we have extended our proprietary search algorithms and data analytics to include the Buying Matrix, providing unique insights to dealers regarding their purchases in the wholesale space as well as up-to-date pricing information for the consumers they are servicing. We apply the knowledge gained from analyzing the substantial volume of connections between consumers and dealers on our platform to build new features for our consumers, IMV technology features on the Dealer Dashboard and new products for our dealers. These enhancements enable more informed consumers and dealers from the start of their car journey to the end.
6
Strong Value Proposition to Dealers. We believe that our marketplace offers an efficient customer acquisition channel for dealers, helping them achieve attractive returns on their marketing spend with us. With the acquisition of CarOffer, we increased efficiencies for dealers to source vehicles from both consumers and dealers with the 24/7 online Buying Matrix. We provide our dealer base with connections to prospective car buyers; most of these connections have historically been for used cars.cars, and to prospective car sellers. The primary objective of our traffic acquisition and site improvements is to generate greater volumes ofhigh quality consumer leads to our dealers. These leads include phone calls, email, and managed text and chat interactions for dealers, which we believe yield the highest value engagement for dealers. Dealers are able to leverage our large consumer audience, our digital retail offerings and consumer trade-in services to provide more quality leads to their dealership, providing the highest return on their investment. We provide all dealers with tools that are informed by real‑timereal-time market conditions that help them acquire inventory, merchandise, and sell their cars, and our paying dealers get access to additional valuable information from our Pricing Tool and Market Analysis tool.tools. Additionally, with digital retail offerings we help level the online offering playing field for our dealer partners who are unable to provide these solutions to consumers on their own and/or wish to utilize our largest consumer audience to sell additional inventory with CarGurus' digital retail offerings. Our strong value proposition to the dealer community is evidenced by our 6% 4% growth in quarterly average revenue per subscribing dealer, or QARSD,, in the United States in the fourth quarter of 20202022 compared to the fourth quarter of 2019.2021.
Network Effects Driven by Scale. With the majority of dealers in the United States listing inventory on our platform and having built the most visited online automotive marketplace in the United States, we believe that our scale creates powerful network effects that reinforce the competitive strength of our business model. Our large consumer audience increases our appeal to dealers and incentivizes more dealers to subscribe to our paid Listings packages to access the numerous benefits unavailable to non‑paying dealers. Displaying listings from more paying dealers on our websites provides consumers with more dealer information and methods to contact those dealers. More consumers and connections drive greater value and a higher return to paying dealers’ marketing spend on our platform. Driven by these network effects, we continue to amass data points, which we use to further strengthen our traffic acquisition efforts and marketplace search algorithms, the utility of analysis complementing each listing, the quality of our user experience, the value of connections between consumers and dealers, and the efficacy of our dealer digital marketing products.
Attractive Financial Model. We have a strong track record of revenue growth, profitability, and capital efficiency. We generated revenue of $551.5$1,655.0 million in 2020, $588.92022 compared to $951.4 million in 2019, and $454.1 million in 2018,2021, representing a year-over-year decline of 6% in 2020 – which we primarily attribute to the approximately $50 million impact of fee reductions that we provided to our paying dealers during the second quarter of 2020 in response to the COVID-19 pandemic – and a year-over-year increase of 30%74%. 37% of our revenue generated in 2019. 2022 was attributable to the U.S. Marketplace segment compared to 62% in 2021. 60% of our revenue generated in 2022 was attributable to the Digital Wholesale segment compared to 33% in 2021. A significant portion of our revenue is recurring due to the subscription nature of our products, including from our Listings packages, our Real-time Performance Marketing, or RPM, and our Dealer Displaydigital advertising and audience targeting products. Furthermore,suite. At the same time, our revenue base is highly diversified due to the fragmentedsubscription nature of the automotiveour listings business, transactional nature of our digital wholesale business and our diverse dealer industry.base. We also have been able to grow and invest in our future growth while improvingas a result of our highly profitable foundational Listings business. The profitability due toof the operating leverage inListings business and the liquidity of our business model. On a consolidated basis, whilebalance sheet, helps drive growth and innovation as we build out our revenue declined 6% in 2020 and grew 30% in 2019, our Adjusted EBITDA grew 109% in 2020 and 55% in 2019. As a percentagevision of revenue, our Adjusted EBITDA margin expanded to 29% in 2020creating an end-to-end transaction-enabled automotive platform. We ended 2022 with $469.5 million of cash on hand up from 13% in 2019 and from 11% in 2018. In the United States, which is our most developed market, while our revenue declined by 6% in 2020 and grew by 27% in 2019, we increased our income from operations to $120.8$231.9 million in 2020 from $73.9 million in 2019 and $58.4 million in 2018.2021.
5
Experienced Management Team with Culture of Innovation. Our founder, Executive Chairman and Chairman of our Board of Directors, Langley Steinert, co‑foundedco-founded and was previously chairman of TripAdvisor, an online marketplace for travel‑relatedtravel-related content based on the mission of using technology and a data‑drivendata-driven approach to provide transparency for consumers’ travel planning. Led by Mr. Steinert and a management team with extensive experience guiding technology companies in evolving industries – including Jason Trevisan, our Chief Executive Officer and Sam Zales, our President and Chief Operating Officer – we bring the same commitment to fostering a culture of innovation and delivering data-driven transparency to the automotive market.market.
Our Products and Services
U.S. Marketplace and Other
Impacts ofOur product offerings described below are available for the COVID-19 PandemicU.S. CarGurus marketplace; their availability on our Businessother marketplaces varies. We also offer paid listings subscriptions for dealers and dealer advertising products for the PistonHeads website, as well as paid listings subscriptions for dealers for the Autolist website.
Consumer Experience
The outbreak in 2020 of the novel strain of coronavirus that surfaced in Wuhan, China in December 2019 and was subsequently declared a pandemic by the World Health Organization, or COVID-19, resulted in a global slowdown of economic activity including worldwide travel restrictions, prohibitions of non-essential work activities, disruption and shutdown of businesses and uncertainty in global financial markets, all of which resulted in the COVID-19 pandemic having an impact on our financial performance in fiscal year 2020. As the COVID-19 pandemic endures and continues to have an impact on global economic activity, the extent to which the COVID-19 pandemic will adversely impact our future business operations, financial performance and results of operations is uncertain and will depend on many factors outside of our control. For a further discussion of the risks, uncertainties and actions taken in response to the COVID-19 pandemic, refer to Item 1A “Risk Factors” and Item 7 “Management's Discussion and Analysis of Financial Condition and Results of Operations”.
Our Products
Consumer Marketplace
We provide consumers with an online automotive marketplace where they can search for new and used car listings from our dealers. With our U.S. marketplace’s peer-to-peer offering, consumers also have access to additional car listings from private sellers,dealers and are able to sell their carcars to dealers and other consumers. Through our marketplace, we provide consumers with information that helps them find the most relevant car for their needs. A user accesses our marketplace through our websites or by using our mobile applications. Most users specify whether they are searching for a used, certified pre‑owned, or new carscar and then provide their desired vehicle make and model and their postal code. Our product offerings described below are available through the U.S. CarGurus marketplace; their availability on our other marketplaces varies. We also offer paid listings subscriptions for dealers and display advertising products through the PistonHeads website, as well as paid listings subscriptions for dealers through the Autolist website.
Used and Certified Pre‑Owned Cars
Using our proprietary search algorithms, we immediately display the results of the consumer’s search, ranked by Deal Rating, on a search results page, or SRP. Eligible used car listings in our marketplace are assigned one of five Deal Ratings: Great Deal, Good Deal, Fair Deal, High Priced, or Overpriced. A Deal Rating illustrates how competitive a listing is compared to similar cars sold in the same region in recent history. A listing’s Deal Rating is based primarily upon the IMV of the vehicle and the Dealer Rating of the dealer.
7
Instant Market Value. IMV is a proprietary algorithm that assesses the market value of a used vehicle in a local market and is a key input for determining a vehicle’s Deal Rating. The IMV algorithm is the product of many years of regression modeling utilizing tens of millions of used car data points. IMV takes into account a number of factors, including comparable currently listed and previously sold used cars in the local market and vehicle details including make, model, trim, year, features, condition, history, and mileage. OurThe IMV algorithm uses more than 20 ranking signals and more than 100 normalization rules that distill unstructured data from hundreds of sources across thousands of dealers.
Dealer Ratings. Dealer Ratings are derived from user‑generated content from our users’ experiences with dealers with which they have connected. To promote high‑quality reviews, we require that a user havehas interacted with the dealer via our marketplace to submit a review. We believe this requirement, together with additional qualification standards, results in a more valuable Dealer Rating. Dealer Rating is an important component of a listing’s Deal Rating and, as a result, can impact the organic search position of a listing.
6
Search Results Page. In addition to each car’s Deal Rating, our SRP provides users with other useful information, including the difference between the listing price and the IMV that we have determined for the car, mileage, Dealer Rating, and dealer location for paying dealers. We provide in‑depth search filters, including price, year, mileage, trim, color, options, condition, body style, miles per gallon, seating capacity, vehicle ownership history, usage history, seller type, and days on market, among others, which we believe deliver the most comprehensive search capability among major U.S. online automotive marketplaces. We also provide our users with additional features to aid their search, including similar vehicle recommendations, side‑by‑side vehicle comparisons, expert reviews, and user rankings. Our platform also gives users the ability to save searches and receive alerts that keep them informed of relevant developments in the market, including newly available inventory and price changes to cars they are monitoring.
Vehicle Detail Page. If a user clicks on one of the listings on the SRP, the user is taken to that listing’s vehicle detail page, or VDP. VDPs are designed to provide numerous photos and a comprehensive description of the vehicle, dealer name, address, and dealership information for paying dealers, detailed dealer reviews, methods to contact the dealer, payment calculators, and helpful information about the vehicle, including:
| • Price History. Changes to a vehicle’s price on our platform. We also offer price change alerts to consumers on searches they have saved, which allow them to respond quickly to changes in the market. • Time on Site. Length of time a vehicle has been on our platform and how many users have saved the vehicle to their list of favorite listings, indicators of the likely demand for the vehicle. • Vehicle History. Title check, accident check, number of owners, and fleet status of the vehicle, giving consumers data that helps them better understand the vehicle’s condition.
|
|
|
|
|
|
New Cars
Search results for new car listings are sorted by price of inventory matching the user’s search, with the lowest priced listings sorted first. Our new car VDPs include our Dealer Rating and many of the other features of our used car listings, such as Price History and Time on Site. Deal Rating is not applicable to new car listings because it utilizes data not relevant to new cars. Instead, we analyze data on manufacturers’ suggested retail prices, or MSRPs, and recent sales of similar new vehicles, accounting for trade-ins, incentives, and other factors that can affect the price of a new car, to provide users with comparative price information.
Sell My Car
We also allow our consumers to list their cars in both our peer-to-peer marketplaceand consumer-to-dealer marketplaces in the United States. Our peer-to-peer offering, Sell My Car, offering enables individual car owners to easily merchandise their vehicles, determine an appropriate selling price with our proprietary price guidance, and manage their listings and communications with prospective buyers from our audience. We collect a fee when the sellera consumer lists a vehicle on the peer-to-peer marketplace. See “— Digital Wholesale” below for a description of our consumer-to-dealer offering, IMCO.
Autolist
Autolist
Autolist provides consumers an online automotive marketplace through mobile applications on iOS and Android phones, as well as a website. The platform includes inventory from top automotive dealers across the U.S. and gives consumers quick access to manage their search on the go with real-time alerts of newly available inventory and changes that occur on carsvehicles and saved searches they have configured. An independent editorial staff produces content to keep consumers informed on the latest vehicles and trends in the automotive market.
8
PistonHeads
PistonHeads
PistonHeads is a U.K. automotive marketplace, forum, and editorial site geared towards automotive enthusiasts. The platform allows consumers to search across a broad range of dealer and private seller listings, engage with other automotive enthusiasts through forums, and stay informed about automotive news through editorial articles and expert reviews. Paying U.K. dealers who list on the CarGurus platform automatically have their inventory added to the PistonHeads site for greater consumer reach.
7
Dealer MarketplaceOfferings
Listings
Listings
Our marketplace connects dealers to a large audience of informed and engaged consumers. We offer multiple types of marketplace Listings subscriptions to dealers throughfor the CarGurus marketplace in the U.S. platform (availability varies on our other marketplaces): Restricted Listings, which is free, and various levels of Listings packages, each of which requires a paid subscription.
| their own VDPs.
|
|
|
|
Dealer Dashboard and Merchandising Tools
All dealers with inventory on CarGurus may access the following Dealer Dashboard features and merchandising tools:
| • Performance Summary. Provides dealers with real‑time and historical data concerning the connections and consumer exposure they have received in our marketplace and through our digital marketing products. This enables dealers to analyze connections and SRP and VDP views at a granular level to inform the dealer’s sales and merchandising efforts. • Dealer Insights. Provides pricing analysis of the dealer’s inventory, as well as a summary of a vehicle’s missing information such as price, photos, or trim. This information helps dealers better merchandise their vehicles. • User Review Management. Allows dealers to track and manage – but not edit or manipulate – their dealer reviews from our users. Dealers can respond to users, report potentially fraudulent reviews, and publish positive reviews to social media platforms for broader exposure. • Dealer Mobile App. Allows dealers to access core Dealer Dashboard functionality via an iOS and Android mobile app. Includes reporting on leads, access to several tools, and mobile app notifications that can be customized by the dealer. 9
|
|
|
|
|
|
Dealers subscribing to a paid Listings package also have access to the following additional features and tools:
| • Pricing Tool. Helps dealers evaluate the impact of pricing changes for each used vehicle in their inventory and the resulting impact on the car’s Deal Rating, empowering dealers to make informed pricing decisions based on market data in their local area. • Market Analysis. Informs dealers of local market trends in used cars, such as the most searched makes and models in their local market. This information helps dealers align with local consumer preferences and inform strategies for increasing inventory turnover and efficient vehicle acquisition. • IMV Scan. Allows dealers to scan a vehicle identification number, or VIN, using their smartphone, and receive information on the IMV of the vehicle in order to support dealers in deciding what to pay for a vehicle at a wholesale auto auction. IMV Scan is built into the CarGurus mobile app and is currently available to U.S. dealers that pay for our Enhanced, Featured or Featured Priority Listings packages. • LeadAI. Helps dealers to identify the highest intent users who have submitted leads on their inventory. LeadAI evaluates onsite user behavior to identify, score, and label "Hot" and "Warm" leads within the Dealer Dashboard Leads Report. This feature is available to all dealers subscribing to Enhanced, Featured, and Featured Priority packages.
|
|
|
|
8
|
|
Digital Marketing Products
We offer dealers subscribing to one of our Enhanced, Featured or Featured Priority Listings packages access to additional advertising products marketed primarily under our RPM digital advertising suite. With RPM, dealers can reach our large and engaged automotive shopping audience, through display advertising that appears in our CarGurus marketplace, on other sites on the internet and/or on Facebook, a high-converting social platform.media platforms. RPM helps dealers build brand awareness and acquire customers to their website and dealership. Advertisements can be targeted by the user’s geography, search history, CarGurus website activity (including showing users relevant vehicles from a subscribing dealer’s inventory that they have not yet discovered on our marketplace), and a number of other targeting factors. This product suite allows dealers to increase their visibility with in-market consumers and drive qualified traffic to their websites.
Pricing and Packaging
CarGurus’ core offering isWe offer our Listings product suite which offersthrough a tiered set of packages. Listings are priced inon a fixed monthly, quarterly, semiannual, or annual subscription fee that isbasis based on the connection performancedealer’s inventory size, region, and our assessment of the ROI we expect to deliver for each dealer type, including factors such as location, inventory size and vehicle type.deliver. For improved performance, dealers can purchase higher Listings suite levels and add-ons available at an existing Listings suite level. Dealers may be renewed at higher rates commensurate with growth and updated performance expectations. RPM is also packaged insold as a tiered solution,subscription, and priced as a percentage of Listings while accounting for factors such as dealership characteristics and performance expectations.
Auto Manufacturer and Other Advertiser Products
Our platform offers auto manufacturers and others the ability to purchase display advertising on our sites to execute targeted marketing strategies:
|
|
|
|
|
|
|
|
Digital Retail and Consumer Finance
In recent years, both consumer demand and dealer receptiveness to digital retail has increased, as consumers have become more comfortable transacting some or all of their car buying processprocesses online. We are focused on addressing the needs of both consumers and dealers in this growing segment of automotive digital retail.
9
Consumer Finance
Finance in Advance
Through our partnerships with automotive lending companies, we allow eligible consumers on our U.S. websitemarketplace to pre-qualify for financing on cars from dealerships that offer financing from these partners. We primarily generate revenue from these partnerships based on the number of funded loans from consumers who pre-qualify with our lending partners through our site. We believe this program both provides more transparency to car shoppers about actual payments to be offered at the dealership specific to participating lenders, as well as delivers highly qualified car shopper leads to participating dealers.
Digital Deal
Digital Retail
We continue to offer consumers the ability to transact additional elements of their car buying experience through our websites as they seek to complete more of this process online. For example, our shoppers can ‘start purchase’ from a VDP on eligible listings and utilize purchase options, including but not limited to estimating a car’s trade-in value, deciding payment options, and selecting finance and insurance products. Additionally,products, and placing a reservation deposit. Digital Deal generates revenue by charging fees to addressdealerships to enroll in the unique circumstancesprogram and from partnerships based on the number of funded loans from consumers.
10
Area Boost
We offer the COVID-19 pandemic, we offerability for dealerships to expand their VDP geographic footprint to non-local customers via dealer home delivery services. Revenue is generated through fees charged to the dealership to enable listings beyond the default geographical radius. We believe this program provides additional vehicle options to car shoppers open to home delivery services while promoting participating dealers’ delivery capabilities and increasing non-local VDP views. As a prerequisite to enrolling in Area Boost, new dealerships are required to sign up for Digital Deal.
Auto Manufacturer and Other Advertiser Products
Our platform offers auto manufacturers and others the ability to merchandisepurchase advertising on both our sites and third‑party websites, including social media platforms, to execute targeted marketing strategies:
Wholesale
As the automotive industry continues to move further online, it has become even more important for dealers not only to sell their vehicles effectively at retail, but also to acquire the right inventory in the first place via wholesale transactions. In recent years, wholesale vehicle sales have begun shifting online and those trends have accelerated as a result of the COVID-19 pandemic. The traditional in-person physical auction model is being supplanted with online transactions that are easier, faster, and reduce the effect of geographic constraints.
During 2020, we conducted a pilot of our CarGurus Offers product that enabled dealers to purchase inventory directly from consumers who visited our site. The consumer entered their vehicle information on the Sell MyNew Car front page, Used Car front page, and Research Center.
In January 2021, we completed our acquisition of a 51% ownership interest in CarOffer, LLC,allow manufacturers to target specific automobile segments, such as SUV, sedan, hybrid, luxury, truck, and minivan.
International
We also facilitate high-intent consumers to engage with automotive dealers in both Canada and the U.K. Like our U.S. offerings, CarGurus provides consumers in Canada and the U.K. with a transparent shopping experience, using our proprietary algorithms to determine market specific valuations for vehicles, and ordinating our organic search results based on Deal Ratings.
In Canada, CarGurus is a leading automotive marketplace that provides consumers a transparent shopping experience whether they are looking for a new or used car. In the U.K., CarGurus is a leading marketplace for dealers’ listings of used vehicles, providing consumers with one of the broadest selections of inventory in the U.K. We also provide automotive shoppers rich expert review content, an active forum for automotive discussion, and offer privately owned inventory through the PistonHeads website.
Digital Wholesale
Dealer-to-Dealer
As the automotive industry continues to move further online, it has become even more important for dealers not only to sell their vehicles effectively at retail, but also to acquire the right inventory in the first place via wholesale transactions. In recent years, wholesale vehicle sales have begun shifting online and those trends have accelerated as a result of the COVID-19 pandemic. The industry continues to see an increase in online transactions that are easier, faster, and reduce the effect of geographic constraints.
In January 2021, we completed our acquisition of a 51% ownership interest in CarOffer, a modern-day automotive inventory transaction platform that allows dealers and dealer groups to buy, sell, and trade online with automation and ease. The acquisition added wholesale vehicle acquisition and selling capabilities to our portfolio of dealer offerings, creating a powerful digital solution for dealers to sell and acquire vehicles at both retail and wholesale. Unlike traditional vehicle auctions which require manual bidding and vehicle evaluation, the Buying Matrix enables buying dealers to create standing buy orders and provides instant offers to selling dealers.
11
IMCO
In 2021, we launched a new consumer offering, IMCO, which allows consumers to sell their vehicles to dealers entirely online. This offering, which is now available to approximately 93% of the U.S. population, provides dealers with access to a fresh source of trade-in inventory and helps ensure liquidity amongst CarOffer’s platform. Through IMCO, consumers who are trading-in or selling vehicles enter easy-to-answer questions regarding their vehicle and are instantly presented with the most competitive offer sourced from in-network dealers. Once the customer has saved their offer, they can further customize their experience by arranging a location of their choice to have the vehicle picked-up and transported. In this model, CarOffer processes the transaction directly and collects transaction and other fees from the dealer.
In 2022 we continued to optimize and evolve our consumer-to-dealer offering to improve the consumer experience and performance. We launched online pickup scheduling, which allows consumers to schedule their vehicle pickup through our simple online tool. We ran a pilot of drop-off locations where consumers could opt to drop their vehicle off rather than have it picked up at their home. We optimized the consumer experience with more data and information to help consumers make confident decisions, and integrated a virtual inspection process to allow consumers to pre-inspect their vehicle in order to streamline the pickup process. We ended 2022 with a consumer NPS of 88 for sellers who completed a transaction.
Marketing and Brand
Consumer Marketing
CarGurus iscontinues to be the most visited online automotive marketplace in the United States, with more than 90.977.7 million and 36.229.1 million average monthly sessions and unique users, respectively in 2020.2022. We have built our engaged audience on the strength of our user experience, leveraging the power of technology and remain focused on delivering an industry-leading consumer marketplace.data to bring trust and transparency to the automotive platform. Our intuitive search experience, combined with the largest inventory of any major U.S. online automotive marketplace and relevant content, updates, and transaction-enabled tools, provide unparalleled transparency and decision-support to consumers during their car search to help them shop, buy, finance and sell with confidence.confidence and ease. The strength of our consumer experience is one of our most powerful marketing tools, with “word95% of mouth” representing the second-most cited influence on consumers decision to visit CarGurus despite our substantial investments in paid marketing. This leading consumer experience also enablessellers stating they would recommend CarGurus to perform very wella friend and 90% of sellers stating they would recommend starting their purchase online with search engines, generating a significant volume ofCarGurus. CarGurus also attracts free website traffic from high-intent car shoppers.shoppers through search engines.
A key pillar of our consumer marketing efforts is what we call algorithmic traffic acquisition. We employ a team of strategists, engineers and data scientists that optimizes our user acquisition through search engines,engine performance marketing, social media, and other digital marketing channels and has tested over one billion keywords on various search engines as well as sophisticated, personalized remarketing,re-marketing, to nurture high-intent consumers toward finding their right car. Theinterested in auto-shopping. We continuously integrate new efficient channels and advance the sophistication of our data-driven algorithmic traffic acquisition, continues to advance, with an ongoing focus on increasingly data-drivenvalue-driven campaigns that driveproduce high return on advertising spend. We believe our expertise in this area constitutes a competitive advantage over less sophisticated competitors and those who outsource these capabilities.
In parallel with our sophisticated paid and organic traffic acquisition efforts, we invest significant resources in optimizing our site experience and retention marketing efforts throughefforts; this includes email and app notifications, to help consumers find the right car for them, and connect with a dealer to make a purchase.purchase or sell their car online. Rigorous conversion rate optimization efforts help increase the ROI on our advertising spend. Our increasing focus on merchandising that drives more shoppers to connect with dealers with high subscription expansion opportunity createsis intended to create a virtuous cycle of improved monetization that allows for reinvestment in further improvements to our consumer experience.
We augment our performance marketing, conversion rate optimization and retention marketing efforts with brand‑brand building efforts. Our brand marketing efforts compriseare primarily comprised of (i) investments in media, including television, and online video as well asand digital social, (ii) expressing our unique brand value proposition throughout our core site experience, app and organic social channels, as well asand (iii) an activealways on public relations program that allows us to gain significant, high-credibilityhigh credibility earned media coverage. Despite a shorter tenure, and lower investment in brand marketing than our primary competitors, and a hyper competitive industry, we have made significant progress toward closinggrown and maintained our brand awareness gaps since launching brand marketing in 2017 and2017. We believe that we are well‑well positioned to continue to strengthen our brand by continuing to invest in brand-building efforts and refining the articulation of our unique value proposition. As we close thecontinue to drive brand awareness gap compared to our core competitors,and consideration, we see significant opportunity to shift our brand focus fromdrive reach to driving greaterwith new consumers leveraging new channels and tactics, and a deeper understanding of and preference for our brand, further accelerating the strong consumer engagement and word of mouth benefits we already enjoy.
12
Dealer Marketing
The primary goals of our dealer marketing initiatives are to acquire dealers not yet in our marketplace, convert non‑paying dealers into paying dealers, retain our existing paying dealers, and increase annual subscription revenuesproduct adoption and usage from our paying dealers. Our dealer marketing efforts aim to:
| • Educate Dealers on the End-to-End Inventory Solutions We Offer, the Quality of Our Audience and Products, and Attractive ROI. We educate dealers on the increased breadth of solutions we offer, including wholesale buying and selling of inventory, marketing via our core Listings products and other tools, and our growing suite of retailing solutions. We promote the quality of our audience by touting our industry‑leading audience, our strong user engagement, and the large number of connections that we facilitate through our marketplace.We also highlight to dealers how unique features of our platform, such as our consumer financing features and proprietary IMV analytics, yield consumers that we believe are more informed and better prepared to purchase at the dealership, which can lead to a higher ROI for the dealers’ marketing spend. • Provide Thought Leadership that Educates Dealers on Industry Trends. We generate content on market trends and best practices in digital advertising that is shared through webinars, dealer forums, dealer advisory councils, our websites, and our participation in industry conferences and events. From time to time, we also host thought leadership events in local markets to continue to share our insights and help build our brand among dealerships. Since the height of the COVID-19 pandemic, we have also helped address their ever changing challenges by sharing the latest research and data-driven insights on how shopper behavior continues to evolve. • Provide Best Practices to Assist Dealers in Becoming More Successful. We provide ongoing communications through email, webinars, white papers, testimonials, and videos, which show dealers how to use our products to position their inventory for success on our platform and beyond, as well as broader guidance on marketing, sales, operations, and other aspects of running a more profitable dealership. We maintain consistent communication with dealers via email, events and our Dealer Dashboard to ensure awareness of account performance and recent product updates, and we empower our |
|
|
|
|
|
|
11
Sales
Our sales team is responsible for bringing dealers onto our marketplace and converting non-paying dealers to paid subscriptions. We have built an efficient inside sales and account management team of approximately 260 employees worldwide who sell our marketplace productsteams with resources to franchisedirectly provide education and independent dealers. We have built a field sales team that works with strategic franchise and national dealership groups in large metropolitan areas in the U.S., Canada and the U.K. In addition, we have advertising sales employees based in the U.S. and Canada.
We have a comprehensive dealer account management process to assist dealers in becoming successful in our marketplace. We assign a Customer Success Associate to every new paying Listings dealer to assist with onboarding and integration with any relevant software systems. The designated Customer Success Associate spends time educating dealers on a range of topics, including effectively using the Dealer Dashboard, tracking sales, and measuring ROI for their marketing spend. After the onboarding period, a Dealer Relations Account Manager is designated to assist the dealer in utilizing our tools and maximizing ROI from our offerings, including effectively pricing vehicles, vehicle merchandising, and keeping inventory up to date with complete vehicle information. We believe our active communication with our dealers fosters customer satisfaction and increases customer retention.
People and Talent
Our investment in our greatest asset – our people – is integralassistance to our core values, evidenced bydealer partners.
As of December 31, 2020, we had 827 full‑time employees, 74 of whom were based outside the United States. None of our employees is represented by a labor union or covered by a collective bargaining agreement.
Culture, Values and Standards
Our company culture has developed out of our data‑driven and innovative approach to the automotive market. We leverage dataother marketing channels to drive innovation across all facets of our business and continuously optimizedealer engagement with our products and processes to serve our consumers,platforms. This can include automated, personalized marketing about how dealers advertisers,can improve vehicle pricing and partners. Our approach emphasizes original thought, impact, and collaboration across our organization, and we recognize and award employees who drive positive results across these constituencies. We invest in creating a work environment that facilitates partnership among our employees and promotes diversity, equity, inclusion and belonging. In that spirit, we have identified our core values as follows:
|
|
|
|
|
|
|
|
|
|
|
|
12
Diversity, Inclusion and Belonging and Equal Employment Policy
We are an equal opportunity employer and strive to build and nurture a culture where inclusiveness is a reflex, not an initiative. With support from our Diversity, Inclusion and Belonging Advisory Team, we are committed to fostering diversity, equity, inclusion and belonging, as well as building a workplace where everyone can thrive. Our commitment to these principles helps us attract and retainmerchandising by using the best talent, enables employees to realize their full potential and drives high performance through innovation and collaboration. In 2020, with respect to employees who chose to self-identify, we increased our female workforce in the U.S. from 30.9% to 32.3%. We saw increasestools in our female workforce at almost every level indashboard, performance insights around the U.S., including technicalleads and senior management roles.connections they are receiving, and prompts to respond to reviews and manage their reputation. We also increased our representation of all underrepresented racial minorities in the U.S. from 23.3% to 25.9%.
Compensation and Benefits
The success of our business is fundamentally connected to the well-being of our people. Accordingly, we provide our eligible employees with competitive wages and access to flexible and convenient medical programs intended to meet their needs and the needs of their families. In addition to standard medical coverage, we offer the following benefits to our U.S. employees (availability internationally varies): dental and vision coverage, health savings and flexible spending accounts, paid time off, flexible work schedulesmonitor dealer feedback on a case-by-case basis, employee assistance programs, short term and long term disability insurance and term life insurance, as well as paid access to certain family care resources. In response to the COVID-19 pandemic, we implemented changes that we determined were in the best interest of our employees, as well as the communities in which we operate, and which comply with government regulations. These changes included requiring our employees to work from home for several months.
Employee Engagement
In order to ensure that we are meeting our people and talent objectives we conduct an employee engagement survey at least annually to help our management team gain insight into and gauge employees’ feelings, attitudes, and behaviors around working at CarGurus. Our latest survey, completed in December 2020, had a participation rate of over 87% of our employees worldwide and the survey results indicated that we excel in areas including manager empathy, alignment to company goals and belonging. Based on employee feedback, we also identified certain company-wide focus areas, including with respect to improving the resources and benefits we can provide for our employees as they continue to work outside of our offices during the COVID-19 pandemic, which we agree is important to our long-term success. Our culture has led to strong employee satisfaction and pride that has been recognized across the globe, as evidenced with the following awards: Built In Boston’s “Best Places to Work” in 2019, 2020 and 2021; the Mass TLC “Tech Top 50” Company Culture in 2020; Fortune’s “Best Places to Work” in 2019; Computerworld’s “Best Places to Work in IT” in 2019 and 2020; Boston Business Journal’s “Best Places to Work” for five years in a row from 2015 to 2019; and Boston Globe’s “Top Place to Work” in 2014, 2015, 2016 and 2018.
Training and Development
Our people and talent strategy is essential for our ability to continue to develop and market innovative products and customer solutions. We continually invest in our employees’ career growth and provide employees with a wide range of development opportunities, including face-to-face, virtual, social and self-directed learning, mentoring, coaching, and external development. In 2020, more than 96% of our employees participated in learning and development activities worldwide.
Technology and Product Development
We are a technology company focused on innovative, actionable data analysis. We design our mobile and web products to create a transparent experience for both consumers and dealers. We believe in rapid development, release frequent updates and have internal tools and automation that allow us to efficiently evolve our products. Our software is built using a combination of internally developed software, third‑party software and services, and open source software.
Our Search Technology
Our search and ranking technology is served by a proprietary in‑memory search index solution that is scalable, fast, and extensible. We have highly flexible interfaces that allow dealers to automatically add their inventory to our index, enabling us to quickly integrate hundreds of inventory sources with minimal effort and easily support inventory growth.
13
Our Mobile Technology
We have designed our marketplace to appeal to mobile users by developing our products with a mobile‑first mindset. All of our search results pages use a single‑page application type approachthrough surveys and product engagement to eliminate page reloads and improve responsiveness. We also use techniques to load content onto a user’s mobile device more efficiently.assess areas for further development or dealer education.
Competition
Our Integrations
We make available several application program interfaces and web widgets that integrate with customer relationship management and inventory management solutions, among other platforms. These integrations allow dealers to incorporate designated data and tools into the fabric of their marketing and customer engagement strategies. For example, our Deal Rating Badges are used on dealerwebsites, which show our Deal Rating for cars that have been rated as a Great Deal, Good Deal, or Fair Deal. Our Deal Rating serves as trusted, third‑party validation on dealer websites.
Infrastructure
Our development servers and U.S. and Canadian websites are hosted at third-party data centers near Boston, Massachusetts, as well as through third-party cloud services in the U.S. Our European websites are hosted on third-party cloud computing services near each of London, England and Dublin, Ireland. We use third-party content distribution networks to cache and serve many portions of our sites at locations across the globe. We monitor and test at the application, host, network, and full site levels to maintain availability and promote performance. We use third-party cloud computing services for many data processing jobs and backup/recovery services.
Competition
We face competition to attract consumers and paying dealers to our marketplaces and services and to attract advertisers to purchase our advertising products and services. Our competitors offer various marketplaces, products, and services that compete with us. Some of these competitors include:
| • major U.S. online automotive marketplaces: AutoTrader.com, Cars.com and TrueCar.com; • other U.S. automotive websites, such as Edmunds.com, KBB.com and Carfax.com; • online automotive marketplaces and websites in our international markets; • online dealerships, such as Carvana.com and Vroom.com; • sites operated by individual automobile dealers; • internet search engines; • social media marketplaces; • peer-to-peer marketplaces, such as Craigslist.com; and 13 • vehicle auction companies, including digital wholesale platforms: ACVauctions.com, Karglobal.com and E.inc.
|
|
|
|
|
|
|
|
|
|
|
|
|
|
|
|
Competition for Consumers and Dealers
We compete for consumer visits with other online automotive marketplaces, free listing services, general search engines, online dealerships and dealers’ websites. We compete for consumers primarily on the basis of the quality of the consumer experience.experience and the breadth of offerings that we are able to provide. We believe we compete favorably on user experience due to the number of our vehicle listings, the transparency of the information we provide on cars, prices, and dealers, the intuitive nature of our user interface, and our mobile user experience, among other factors.
We compete for dealers’ marketing spend with offline customer acquisition channels, other online automotive marketplaces, dealers’ own customer acquisition efforts on search engines and social media marketplaces, and other internet sites, online dealerships and vehicle auction companies that attract consumers and dealers searching for vehicles.vehicles, as applicable. We compete primarily on the basis of the ROI that our marketplace provides.offers and the synergies provided by the combination of our foundational listings business with digital wholesale and digital retail offerings. We believe we compete favorably due to our large user audience, high user engagement, and the volume and quality of connections we provide to well‑informedwell-informed consumers, which results in an attractive ROI for dealers.
14
Competition for Advertisers
We compete for a share of advertisers’ total marketing budgets against media sites, websites dedicated to helping consumers shop for cars, major internet portals, search engines, and social media sites, among others. We also compete for a share of advertisers’ overall marketing budgets with traditional media, such as television, radio, magazines, newspapers, automotive publications, billboards, and other offline advertising channels. We compete for advertising spend based on the marketing ROI that our marketplace provides. We believe we compete favorably due to our large user audience size, high user engagement, and the effectiveness and relevance of our advertising products.
Seasonality
Across the retail automotive industry, consumer purchases are typically greatest in the first three quarters of each year, due in part to the introduction of new vehicle models from manufacturers and the seasonal nature of consumer spending. Additionally, the volume of wholesale vehicle sales can fluctuate from quarter to quarter caused by several factors, including the timing of used vehicles available for sale from selling customers, the seasonality of the retail market for used vehicles and/or inventory challenges in the automotive industry, which affect the demand side of the wholesale industry. Macroeconomic conditions, such as slower growth or recession, higher interest rates, high unemployment, consumer confidence in the economy, consumer debt levels, the ongoing military conflict between Russia and Ukraine, foreign currency exchange rate fluctuations and other matters that influence consumer spending and preferences, can also impact the volume of wholesale vehicle sales, as was evidenced by the global semiconductor chip shortage. The Digital Wholesale segment operating results have reflected the general seasonality of the wholesale vehicle sales market and macroeconomic conditions of the automotive industry. The U.S. Marketplace segment operating results have reflected the macroeconomic conditions of the automotive industry. However, to date, the U.S. Marketplace segment operating results have not been materially impacted by the general seasonality of the automotive industry. This could possibly change once our business and markets mature.
Sales
Our sales team is responsible for bringing dealers onto our marketplace, converting non-paying dealers to paid subscriptions and increasing dealer participation in new products that CarGurus is bringing to market. We have built an efficient sales and service team of approximately 320 employees worldwide who sell our marketplace products to franchise and independent dealers. We have built a field sales team that works with strategic franchise and national dealership groups in large metropolitan areas in the U.S., Canada, and the U.K. In addition, we have advertising sales employees based in the U.S. and Canada.
We have a comprehensive dealer account management process to assist dealers in becoming successful in our marketplace. We assign an Account Manager to paying Listings dealers to develop strong relationships and customer satisfaction. The designated Account Manager spends time educating dealers at every stage of their lifecycle as a paying customer. They advise dealers on a range of topics, including how to effectively use their CarGurus products and merchandise their inventory, track sales, measure ROI for their marketing spend and identify ways to grow their profits. We believe our active communication with our dealers fosters customer satisfaction and increases customer retention.
CarOffer also has a team of approximately 149 sales and service employees based in Texas, which is dedicated to driving transactions for the business as well as enrolling new dealers on the CarOffer platform.
14
People and Talent
Our investment in our greatest asset – our people – is integral to our core values, evidenced by our inclusion of employee engagement and cultural efforts as components of our 2022 strategic and organizational initiatives. Our Board of Directors oversees our people and talent efforts and views building our culture – from employee development and retention to diversity, equity, inclusion and belonging initiatives – as key to driving long-term value for our business and helping mitigate risks.
As of December 31, 2022, we had 1,403 full-time employees, 87 of whom were based outside the United States and 348 of whom were employed through CarOffer. None of our employees are represented by a labor union or covered by a collective bargaining agreement.
Culture, Values and Standards
Our company culture has developed out of our data-driven and innovative approach to the automotive market. We leverage data to drive innovation across all facets of our business and continuously optimize our products and processes to serve our consumers, dealers, advertisers, and partners. Our approach emphasizes original thought, impact, and collaboration across our organization, and we recognize and award employees who drive positive results across these constituencies. We invest in creating a work environment that facilitates partnership among our employees and promotes diversity, equity, inclusion and belonging. In that spirit, we have identified our core values as follows:
Diversity, Equity, Inclusion and Belonging and Equal Employment Policy
We are an equal opportunity employer and strive to build and nurture a culture where inclusiveness is a reflex, not an initiative. With support from our Diversity, Equity, Inclusion and Belonging Advisory Team, we seek to foster diversity, equity, inclusion and belonging, and to build a workplace where everyone can thrive. Our commitment to these efforts helps us attract and retain the best talent, enables employees to realize their full potential and drives high performance through innovation and collaboration. In 2022, based on data from U.S. CarGurus employees who chose to self-identify (87.3%), we increased representation among women and non-binary employees (35.1% to 37.4%) and traditionally marginalized racial/ethnic groups (30.1% to 34.4%) within our U.S. workforce. We also saw year-over-year increases in the U.S. among women and non-binary employees in technical (25.9% to 26.2%) and among traditionally marginalized racial/ethnic groups in technical roles (45.7% to 49.4%) and management-level roles (19.4% to 21.6%).
15
Compensation and Benefits
The success of our business is fundamentally connected to the well-being of our people. Accordingly, we provide our eligible employees with competitive wages and access to flexible and convenient medical programs intended to meet their needs and the needs of their families. In addition to standard medical coverage, we offer the following benefits to our U.S. employees (availability internationally varies): dental and vision coverage, health savings and flexible spending accounts, paid time off, flexible hybrid work schedules or remote work on a case-by-case basis, employee assistance programs, short term and long-term disability insurance and term life insurance, as well as company paid access to certain wellness and family care resources.
Employee Engagement
Each year, we conduct an employee engagement survey to help our management team gain insight into and gauge employees’ feelings, attitudes, and behaviors around working at CarGurus. Our latest survey, completed in September 2022, had a participation rate of approximately 90% of our eligible employees worldwide. The survey results indicated that we excelled in areas like manager empathy and support, as well as key indicators of belonging – including fairly considering each other's ideas and feeling respected as a member of our community. Based on employee feedback, we also identified several company-wide opportunity areas to improve engagement and drive long-term success. Our culture and commitment to building a workplace where we can all thrive has been recognized externally with the following awards: Built In Boston’s “Best Places to Work” in 2019, 2020, 2021, 2022 and 2023;Boston Business Journal’s “Best Places to Work” in 2015, 2016, 2017, 2018, 2019, 2021, and 2022; Boston Globe’s “Top Place to Work” in 2014, 2015, 2016, 2018, and 2022; and multiple awards from Comparably including “Best Perks & Benefits” in 2021 and 2022, “Best Work-Life Balance” in 2021 and 2022, and "Best Company Culture” in 2022.
Training and Development
Our people and talent strategy is essential for our ability to continue to develop and market innovative products and customer solutions. We continually invest in our employees’ career growth and provide our team with a wide range of development opportunities, including mandatory quarterly compliance training courses as well as one-on-one, virtual, social and self-directed learning, mentoring, coaching, and external development. In 2022, nearly 100% of our employees participated in learning and development activities.
Technology and Product Development
We are a technology company focused on innovative, actionable data analysis. We design our mobile and web products to create a transparent experience for both consumers and dealers. We believe in rapid development, release frequent updates and have internal tools and automation that allow us to efficiently evolve our products. Our software is built using a combination of internally developed software, third-party software and services, and open source software.
Our Search Technology
Our search and ranking technology is served by a proprietary in‑memory search index solution that is scalable, fast, and extensible. We have highly flexible interfaces that allow dealers to automatically add their inventory to our index, enabling us to quickly integrate hundreds of inventory sources with minimal effort and easily support inventory growth.
Our Mobile Technology
We have designed our marketplace to appeal to mobile users by developing our products with a mobile‑first mindset. All of our search results pages use a single‑page application type approach to eliminate page reloads and improve responsiveness. We also use techniques to load content onto a user’s mobile device more efficiently.
Our Integrations
We make available several application program interfaces and web widgets that integrate with customer relationship management and inventory management solutions, among other platforms. These integrations allow dealers to incorporate designated data and tools into the fabric of their marketing and customer engagement strategies. For example, our Deal Rating Badges are used on dealer websites, which show our Deal Rating for cars that have been rated as a Great Deal, Good Deal, or Fair Deal. Our Deal Rating serves as trusted, third‑party validation on dealer websites.
16
Infrastructure
Our development servers and U.S. and Canadian websites are hosted at a third-party data centers in the U.S. near Dallas, Texas, as well as through third-party cloud services in the U.S. Our European websites are hosted on third-party cloud computing services near each of London, England and Dublin, Ireland. We use third-party content distribution networks to cache and serve many portions of our sites at locations across the globe. We monitor and test at the application, host, network, and full site levels to maintain availability and promote performance. We use third-party cloud computing services for many data processing jobs and backup/recovery services.
Intellectual Property
We protect our intellectual property through a combination of patents, copyrights, trademarks, service marks, domain names, trade secret protections, confidentiality procedures, and contractual restrictions.
We have one issued U.S. patent with an expiration date of May 2034, two one pending U.S. patent applications,application, and onetwo pending international patent application.applications. These applications cover proprietary technology that relates to various functionalities on our platform, generally in connection with pricing, ranking and detecting fraud in online listings. We intend to pursue additional patent protection to the extent we believe it would be beneficial to our competitive position.
We have a number of registered and unregistered trademarks, including “CarGurus,” the CarGurus logo, the CG logo, and related marks, which we have registered as trademarks in the U.S. and certain other jurisdictions. We pursue additional trademark registrations to the extent we believe doing so would be beneficial to our competitive position. Additionally, CarOffer has a number of registered and unregistered trademarks, including “CarOffer” and the CarOffer logo, and related marks, which CarOffer has registered as trademarks in the U.S. CarOffer pursues additional trademark registrations to the extent it believes doing so would be beneficial to its competitive position. Our and CarOffer’s registered trademarks remain enforceable in the countries in which they are registered for as long as we and CarOffer, as applicable, continue to use the marks, and pay the fees to maintain the registrations, in those countries.
We are the registered holder of several domestic and international domain names that include “CarGurus” and variations of our trade names.
In addition to the protection provided by our intellectual property rights, we enter into confidentiality and proprietary rights agreements with our employees and relevant consultants, contractors, and business partners. We control the use of our proprietary technology and intellectual property through provisions in contracts with our customers and partners and our general and product-specific terms of use on our websites.
Regulatory
Various aspects of our business are, may become, or may be viewed by regulators from time to time as subject, directly or indirectly, to U.S. federal, state, local and foreign laws and regulations. In particular, the advertising and sale of new or used motor vehicles is highly regulated by the states and jurisdictions in which we do business. Although we do not sell motor vehicles and we believe that vehicle listings on our sites are not themselves advertisements, regulatory authorities or third parties could take the position that some of the laws or regulations applicable to dealers or to the manner in which motor vehicles are advertised and sold generally are directly applicable to our business. These advertising laws and regulations, which often originated decades before the emergence of the internet, are frequently subject to multiple interpretations, are not uniform across jurisdictions, sometimes impose inconsistent requirements with respect to new or used motor vehicles, and the manner in which they should be applied to our business model is not always clear. Regulators or other third parties could take, and on some occasions have taken, the position that our marketplace or related products violate applicable brokering, bird‑dog,birddog, consumer protection, or advertising laws or regulations.
Our wholesale operations through CarOffer are regulated by the states in which we operate and by the U.S. federal government. These activities may also be subject to state and local licensing requirements. Additionally, we may be subject to regulation by individual state dealer licensing authorities and state consumer protection agencies.
In order to operate in this regulated environment, we develop our products and services with a view toward appropriately managing the risk that our regulatory compliance, or the regulatory compliance of the dealers whose inventory is listed on our websites, could be challenged.
17
We consider applicable advertising and consumer protection laws and regulations in designing our products and services. With respect to paid advertising, other than Featured Listings, Featured Priority Listings and Dealer Display advertising and audience targeting products marketed under our Real-time Performance MarketingRPM digital advertising suite, we believe that most of the content displayed on the websites we operate does not constitute paid advertising for the sale of motor vehicles. Nevertheless, we endeavor to design our website content in a manner that would comply with relevant advertising regulations and consumer protection laws if, and to the extent that, the content is considered to be vehicle sales advertising.
15
Our websites and mobile applications enable us, dealers, and users to send and receive text messages and other mobile phone communications, which requires us to comply with the Telephone Consumer Protection Act, or TCPA, in the U.S. The TCPA, as interpreted and implemented by the Federal Communications Commission, or the FCC, and federal and state courts, imposes significant restrictions on utilization of telephone calls and text messages to residential and mobile telephone numbers as a means of communication, particularly when the prior express consent of the person being contacted has not been obtained.
In addition, we are subject to numerous federal, national, state, and local laws and regulations in the United States and around the world regarding privacy and the collection, processing, storage, sharing, disclosure, use, cross-border transfer, and protection of personal information and other data. While the scope of these laws and regulations is changing and remains subject to differing interpretations, we seek to comply with industry standards and all applicable laws, policies, legal obligations, and industry codes of conduct relating to privacy and data protection. We are also subject to the terms of our privacy policies and privacy-related obligations to third parties.
Corporate Information
We were originally organized on November 10, 2005 as a Massachusetts limited liability company under the name “Nimalex LLC.” Effective July 15, 2006, we changed our name to “CarGurus LLC.” On June 26, 2015, we converted from a Delaware limited liability company into a Delaware corporation and changed our name to “CarGurus, Inc.”
Our principal executive offices are located at 2 Canal Park, 4th Floor, Cambridge, Massachusetts 02141, and our telephone number is (617) 354-0068. Our U.S. website is www.cargurus.com.
CarGurus, the CarGurus logo, and other trademarks or service marks of CarGurus appearing in this Annual Report on Form 10-K are the property of CarGurus, Inc. Trade names, trademarks, and service marks of other companies appearing in this Annual Report on Form 10-K are the property of their respective holders. We have omitted the ® and ™ designations, as applicable, for the trademarks used in this Annual Report on Form 10-K.
Additional Information
The following filings are available on our investor relations website after we file them with the Securities and Exchange Commission, or the SEC: Annual Reports on Form 10-K, Quarterly Reports on Form 10-Q, andCurrent Reports on Form 8-K, Proxy Statements for our annual meetings of stockholders.stockholders and any amendments to those reports or statements. These filings are also available for download free of charge on our investor relations website. Our investor relations website is located at http://investors.cargurus.com.
We webcast our earnings calls and certain events that we participate in or host with members of the investment community on our investor relations website. Additionally, we provide news and announcements regarding our financial performance, including SEC filings, investor events, press and earnings releases, on our investor relations website. Corporate governance information, including our policies concerning business conduct and ethics, is also available on our investor relations website under the heading “Governance.” No content from any of our websites is intended to be incorporated by reference into this Annual Report on Form 10-K or in any other report or document we file with the SEC, and any reference to our websites is intended to be an inactive textual reference only.
16
18
Item 1A. Risk Factors.
Investing in our Class A common stock involves a high degree of risk. You should carefully consider the risks and uncertainties described below, together with all of the other information contained in this Annual Report on Form 10-K, including “Management’s Discussion and Analysis of Financial Condition and Results of Operations” and our audited consolidated financial statements and related notes, before evaluating our business. Our business, financial condition, operating results, cash flow, and prospects could be materially and adversely affected by any of these risks or uncertainties. In that event, the trading price of our Class A common stock could decline. See “Special Note Regarding Forward‑Looking Statements.”
Risks Related to Our Business and Industry
Our business has been, and we expect it to continue to be, adversely affected by the COVID-19 pandemic.
The COVID-19 pandemic has caused an international health crisis and resulted in significant disruptions to the global economy as well as businesses and capital markets around the world. Our operations have been materially adversely affected by a range of factors related to the COVID-19 pandemic. In March, we closed all of our offices and began requiring our employees to work remotely until further notice, which has disrupted and may continue to disrupt how we operate our business. In addition, in an effort to limit the spread of COVID-19, many countries, as well as states and localities in the United States, implemented or mandated and continue to implement or mandate significant restrictions on travel and commerce, shelter-in-place or stay-at-home orders, and business closures. Fluctuation in infection rates in the regions in which we operate has resulted in periodic changes in restrictions that vary from region to region and may require rapid response to new or reinstated orders. Many of these orders resulted in, and may continue to result in, restrictions on the ability of consumers to buy and sell automobiles by restricting operations at dealerships and/or by closing or reducing the services provided by certain service providers upon which dealerships rely. In addition, these restrictions and continued concern about the spread of the disease have impacted car shopping by consumers and disrupted the operations of car dealerships, which has adversely affected and may continue to adversely affect the market for automobile purchases.
The automotive industry is also facing inventory supply problems, especially for used vehicles. The industry has experienced, and may continue to experience, a decline in used-car inventory for a number of reasons attributable to the COVID-19 pandemic, including: (i) fewer trade-ins from diminished vehicle sales; (ii) lease extensions on vehicles that consumers would have otherwise returned to the dealership; and (iii) the closure of or restrictions on the operations of wholesale auctions limiting dealers’ ability to source stock and/or replenish inventory. Further, these auction closures and the limited supply of inventory have led to an increase in bids per vehicle and corresponding increases to wholesale auction prices. As the price of replenishing inventory through wholesale auctions has increased, dealers have increased, and may continue to increase, the prices they charge consumers. A high volume of price increases on vehicle sales at a rapid rate could impact our proprietary Instant Market Values, or IMV, and distribution of Deal Ratings. In addition, if our paying dealers continue to operate at reduced inventory levels or with increased costs, they may reduce or be unwilling to increase their advertising spend with us and/or may terminate their subscriptions at the conclusion of the committed term. Our ability to add new paying dealers or increase our fees with dealers may be impeded if dealers perceive they have less of a need for our products and services because of their limited inventory. Inventory challenges in the automotive industry have adversely impacted, and could continue to adversely impact, the amount of inventory on our websites, which could contribute to a decline in the number of consumer visits to our websites and/or the number of connections between consumers and dealers through our marketplaces. These inventory-related issues resulting from the COVID-19 pandemic may materially and adversely impact our business, financial condition and results of operations.
As a result of the travel and commerce restrictions and the impact on their businesses, a number of our dealer customers temporarily closed or are operating on a reduced capacity, and many dealerships are facing significant financial challenges. Such closures and circumstances led some paying dealers to cancel their subscriptions and/or reduce their spending with us, which has had and may continue to have a material adverse effect on our revenues and on our business. Additionally, in response to the increasing cancelations and the drop in consumer demand at the beginning of the COVID-19 pandemic, we reduced our spending on brand advertising and traffic acquisition, which resulted in fewer consumers using our platform during the year ended December 31, 2020, which in turn has, and may continue to, materially and adversely affect our business. While we have since restored a portion of that historical consumer spend, we may not in the future fully restore prior spending levels if we elect to redirect our investments elsewhere, including in favor of new product development. If such a strategy were not to result in the benefits that we expect, our business could be harmed. Our business relies on the ability of consumers to borrow funds to acquire automobiles and banks and other financing companies may limit or restrict lending to consumers as a result of the economic impacts of the COVID-19 pandemic, which may also materially and adversely affect our business.
17
Further, because of the significant financial challenges that dealerships have faced and continue to face as a result of the COVID-19 pandemic, we took measures to help our paying dealers maintain their business health during the COVID-19 pandemic. We proactively reduced the subscription fees for paying dealers by at least 50% on all marketplace subscriptions for the April and May 2020 service periods, as well as provided a fee reduction on all June 2020 marketplace subscriptions of 20% for paying dealers in the United States and Canada and 50% for paying dealers in the United Kingdom. As a result, the level of fees we received from paying dealers materially decreased during the year ended December 31, 2020, resulting in a material decline in our revenue and a material adverse effect to our business. In addition, despite our proactive fee reductions during the second quarter of 2020, we experienced increased customer cancellation rates and slowed paying dealer additions during such period, which materially and adversely affected our business for the year ended December 31, 2020. During the December 2020 and February 2021 service periods, we also waived marketplace subscription fees for paying dealers in the United Kingdom impacted by additional national lockdowns. We may again in the future experience slowed paying dealer additions and as a result may decide to re-institute further billings relief as we continue to assess the effects of the COVID-19 pandemic on our paying dealers and business operations. During the COVID-19 pandemic, we have also experienced, and may continue to experience, increased account delinquencies from dealer customers challenged by the COVID-19 pandemic that failed to pay us on time or at all.
These effects from the COVID-19 pandemic on our revenue caused us to implement certain cost-savings measures across our business, which have disrupted, and may continue to disrupt, our business and operations. For example, during the second quarter of 2020, we initiated a cost-savings initiative that included a reduction in our workforce, a limitation in discretionary spend across our business and our ceasing of certain international operations and expansion efforts. We also reduced consumer marketing across both algorithmic traffic acquisition and brand spend during the year ended December 31, 2020 in comparison to the prior year in an effort to reduce expenses and as a result of suppressed dealer inventory and resulting reduced demand for leads from dealers. Despite these measures, we may not achieve the costs savings or attract consumer visits at the levels we expect, which would adversely impact our cash flows and financial condition. These expense reduction activities, and any future cost savings actions that we may take, may yield unintended consequences, such as loss of key employees, undesired attrition, and the risk that we may not achieve the anticipated cost savings at the levels we expect, any of which may have a material adverse effect on our results of operations and/or financial condition. If the COVID-19 pandemic materially impacts our revenues in the future, we may also decide that additional disruptive measures are necessary to reduce our operating expenses.
The global nature of the COVID-19 pandemic has also had, and will continue to have, a significant impact on our international businesses. The crisis has halted our growth in existing markets and our expansion into additional markets. In particular, we ceased marketplace operations in Germany, Italy, and Spain, and halted any new international expansion efforts, which we believe will allow us to focus our financial and human capital resources on our more established international markets in Canada and the United Kingdom. Failure by us to succeed in these two markets, however, would materially and adversely affect our business and potential growth.
We continue to monitor and assess the effects of the COVID-19 pandemic on our commercial operations, including the impact on our revenue. However, we cannot at this time accurately predict what effects these conditions will ultimately have on our operations due to uncertainties relating to the duration of the pandemic, the extent and effectiveness of governmental responses and other preventative, treatment and containment actions or developments, including the distribution of recently approved vaccines, shifts in behavior going forward, and the length or severity of the travel and commerce restrictions imposed by relevant governmental authorities. Nor can we predict the adverse impact on the global economies and financial markets in which we operate, which may have a significant negative impact on our business, financial condition and results of operations.
Our business is substantially dependent on our relationships with dealers. If a significant number of dealers terminate their subscription agreements with us, and/or dealer closures or consolidations occur that reduce demand for our products, our business and financial results would be materially and adversely affected.
Our primaryA significant source of our revenue consists of subscription fees paid to us by dealers for access to enhanced features on our automotive marketplaces. Our subscription agreements with dealers generally may be terminated by us with 30 days’ notice and by dealers with 30 days’ notice atprior to the endcommencement of the committedapplicable renewal term. The majority of our contracts with dealers currently provide for one-month committed terms and do not contain contractual obligations requiring a dealer to maintain its relationship with us beyond the committed term. Accordingly, these dealersA dealer may cancel their subscriptions with us in accordance with the terms of their subscription agreements. A dealer’s decisionbe influenced by several factors to cancel its subscription with us, may be influenced by several factors, including national and regional dealership associations, national and local regulators, automotive manufacturers, consumer groups, and consolidated dealer groups. If any of these influential groups indicate that dealers should not enter into or maintain subscription agreements with us, dealers could share this belief could become shared by dealers and we may lose a number of our paying dealers. If a significant number of our paying dealers terminate their subscriptions with us, our business and financial results would be materially and adversely affected.
18Additionally, in the past, the number of United States dealers has declined due to dealership closures and consolidations as a result of industry dynamics and macroeconomic issues. When dealers consolidate, the services they previously purchased separately are often purchased by the combined entity in a lesser quantity or for a lower aggregate price than before, leading to volume compression and loss of revenue. Further dealership consolidations or closures could reduce the aggregate demand for our products and services. If dealership closures and consolidations occur in the future, our business and financial results could be materially and adversely affected.
If we fail to maintain or increase the number of dealers that pay subscription fees to us, or fail to maintain or increase the fees paid to us for subscriptions, our business and financial results would be materially and adversely affected.
As a result of the COVID-19 pandemic, many paying dealers cancelledcanceled their subscriptions with us (including, in some cases, with our permission prior to the end of the applicable contract term and notice period), which has caused a material adverse impact on our revenues, and it is possible that such dealers will not re-subscribe and that additional dealers will cancel their subscriptions in the future for a variety of reasons, including as they continue to experiencea result of the continuing effects of the COVID-19 pandemic.pandemic and other macroeconomic issues, such as increased interest rates and other matters that influence consumer spending. If paying dealers do not receive the volume of consumer connections that they expect during their subscription period, do not experience the level of car sales they expect from those connections, or fail to attribute consumer connections or sales to our platform, they may terminate their subscriptions atprior to the conclusioncommencement of the committedapplicable renewal term. If we fail to maintain or expand our base of paying dealers or fail to maintain or increase the level of fees that we receive from them, our business and financial results would be materially and adversely affected.
We allow dealers to list their inventory in CarGurusCarGurus' marketplaces for free; however, we impose certain limitations on such free listings, such as capping the number of leads that non-paying dealers in the U.S. may receive within a 30-day period, not displaying non-paying dealer identity and contact information, and prohibiting access to the paid features of our marketplaces. We continue to adapt our free listings product, Restricted Listings, in our CarGurus marketplaces and inlistings. In the future, we may decide to impose additional restrictions on Restricted Listings or modify the services available to non-paying dealers. These changes to our Restricted Listings product may result in less inventory being displayed to consumers, which may impair our efforts to attract consumers, and cause paying and non-paying dealers to receive fewer leads and connections, which may make it more difficult for us to convert suchnon-paying dealers to paying dealers or maintain or expand our base of paying dealers. If dealers do not subscribe to our paid offerings at the rates we expect, our business and financial results would be materially and adversely affected.
Our business is subject to risks related to the larger automotive industry ecosystem, which could have a material adverse effect on our business, revenue, results of operations, and financial condition.
Decreases in consumer demand could adversely affect the market for automobile purchases and, as a result, reduce the number of consumers using our platform. Consumer purchases of new and used automobiles generally decline during recessionary periods and other periods in which disposable income is adversely affected. Purchases of new and used automobiles are typically discretionary for consumers and have been, and may continue to be, affected by negative trends in the economy, including: the ongoing effects of the COVID-19 pandemic, the cost of energy and gasoline; the availability and cost of credit; increased interest rates; reductions in business and consumer confidence; stock market volatility; and increased unemployment.
Further, in recent years the market for motor vehicles has experienced rapid changes in technology and consumer demands. Self-driving technology, ride sharing, transportation networks, and other fundamental changes in transportation could impact consumer
19
demand for the purchase of automobiles. A reduction in the number of automobiles purchased by consumers could adversely affect dealers and car manufacturers and lead to a reduction in other spending by these groups, including targeted incentive programs.
In addition, our business has been and may continue to be negatively affected by challenges to the larger automotive industry ecosystem, including global supply chain challenges, the effects of the global semiconductor chip shortage, changes to trade policies, including tariff rates and customs duties, trade relations between the United States and China and other macroeconomic issues, including the ongoing effects of the COVID-19 pandemic and increased interest rates. Increasing global inflation rates have spurred a cycle of monetary policy tightening, including through central bank increases to key short-term lending rates. Both the availability and cost of credit are factors affecting consumer confidence, which is a critical driver of vehicle sales for our consumers and dealers. Additionally, vehicle affordability for our consumers is becoming more challenging due to a combination of factors, including elevated vehicle pricing resulting from inflationary cost increases and vehicle production constraints, and increasing vehicle finance costs due to increased interest rates. These factors could have a material adverse effect on our business, revenue, results of operations, and financial condition.
If the CarOffer business and/or our combined offerings do not continue to grow, our revenue and business would be significantly harmed.
A significant amount of our revenue is now derived from the wholesale sale of automobiles and IMCO. Continued achievement of our transaction synergies and our ability to continue to grow the CarOffer business and the revenue associated with it depends on a number of factors, including, but not limited to, our ability to continue to: expand the number of dealers engaging on the CarOffer platform; retain existing customers and increase the share of wholesale transactions which they complete on the CarOffer platform; attract prospective customers who have historically purchased or sold vehicles through physical auctions and may choose not to transact online; and successfully compete with competitors, including other online vehicle auction companies and large, national offline vehicle auction companies that are expanding into the online channel and have launched online auctions in connection with their physical auctions. Additionally, our ability to continue to grow IMCO and the revenue associated with it also depends on a number of factors, including, but not limited to, our ability to continue to: effectively scale and market IMCO; attract prospective consumers to sell their vehicles online through IMCO; and successfully compete with competitors, including online dealerships. If our anticipated transaction synergies do not fully materialize, or the CarOffer business and/or IMCO fail to continue to grow at the rate we expect, our revenue and business would be significantly harmed.
Industry conditions such as a significant change in retail vehicle prices or a decline in the used vehicle inventory supply coming to the wholesale market could also adversely impact CarOffer’s business and growth. For example, if retail prices for used vehicles rise relative to retail prices for new vehicles, it could make buying a new vehicle more attractive to consumers than buying a used vehicle, which could result in reduced used vehicle wholesale sales on the CarOffer platform. Used vehicle dealers may also decide to retail more of their vehicles on their own, which could adversely impact the volume of vehicles offered for sale on the CarOffer platform. We also face inventory risk in connection with vehicles acquired by CarOffer via arbitration, including the risk of inventory obsolescence, a decline in values, and significant inventory write-downs or write-offs. Such inventory risk would be higher if arbitrations increase, which is more likely to occur in connection with declining wholesale market conditions.
Furthermore, activity on the CarOffer platform has in the past fluctuated, and may again in the future fluctuate, from period to period based on macroeconomic conditions and changing demand requirements, which could adversely impact our revenue, results of operations, and financial condition for such period(s). Macroeconomic issues, including increased interest rates and lower consumer confidence, could also adversely impact dealer demand for sourcing inventory and therefore lead to a reduction in the number of vehicle wholesale sales on the CarOffer platform and/or transacted via IMCO, which would adversely impact CarOffer’s business and financial results. Additionally, inventory challenges in the automotive industry, including for reasons attributable to the COVID-19 pandemic, have contributed and could continue to contribute to a decrease in the supply of vehicles coming to the wholesale market and reduce the number of vehicles sold on the CarOffer platform and/or transacted via IMCO. An inability by CarOffer to retain customers and/or increase or find alternative sources of vehicle supply would adversely impact our revenue and business.
If dealers or other advertisers reduce their advertising spending with us, and we are unable to replace the reduced advertising spending, our advertising revenue and business would be harmed.
A significant amountportion of our revenue is derived from advertising revenues generated primarily through short-term advertising sales, including displayon-site advertising and audience targeting services, to dealers, auto manufacturers, and other auto-related brand advertisers. We compete for this advertising revenue with other online automotive marketplaces and with television, print media, and other traditional advertising channels. Our ability to attract and retain advertisers and to generate advertising revenue depends on a number of factors, including our ability to: increase the number of consumers using our marketplaces; compete effectively for advertising spending with other online automotive marketplaces; continue to develop our advertising products; keep pace with changes in technology and the practices and offerings of our competitors; and offer an attractive ROI to our advertisers for their advertising spend with us.
Our agreements with dealers for display advertising generally include terms ranging from one month to one year and may be terminated by us with 30 days’ notice and by dealers with 30 days’ notice at the endAs a result of the committed term. The contracts do not contain contractual obligations requiring an advertiser to maintain its relationship with us beyond the committed term. Certain of our other advertising contracts, including those with auto manufacturers, typically do not have ongoing commitments to advertise in our marketplaces beyond a committed term. As a resulteffects of the COVID-19 pandemic, some advertisers have cancelledcanceled or reduced their advertising with us which has caused a material adverse impact on our revenues, and it is possible that advertising customers will continue to cancel or reduce their advertising with us as they continue to experiencein the future for a variety of reasons, including the effects of the COVID-19 pandemic.pandemic and other macroeconomic issues, such as increased interest rates and other matters that influence consumer spending. In addition, a reductionthe year-over-year decline in the number of consumer visits to our sites as a result of the COVID-19
20
pandemic or otherwise resulted in the delivery of fewer impressions for our advertising customers than anticipated duringyear-over-year for the year ended December 31, 2020,2022, which has caused, and may continue to cause, an adverse impact on our advertising revenues. We may not succeed in capturing a greater share of our advertisers’ spending if we are unable to convince advertisers of the effectiveness or superiority of our advertising servicesofferings as compared to alternative channels. If current advertisers reduce their advertising spending with us and we are unable to replace such reduced advertising spending, our advertising revenue and business and financial results would be harmed.
If we are unable to provide a compelling vehicle search experience to consumers throughon our platform, the number of connections between consumers and dealers using our marketplaces may decline and our business and financial results would be materially and adversely affected.
If we fail to continue to provide a compelling vehicle search experience to consumers, the number of connections between consumers and dealers through our marketplaces could decline, which in turn could lead dealers to suspend listing their inventory in our marketplaces, cancel their subscriptions, or reduce their spending with us. If dealers pause or cancel listing their inventory in our marketplaces, we may not be able to attract a large consumer audience, which may cause other dealers to pause or cancel their use of our marketplaces. This reduction in the number of dealers using our marketplaces would likely materially and adversely affect our marketplaces and our business and financial results. As consumers increasingly use their mobile devices to access the internet and our marketplaces, our success depends, in part, on our ability to provide consumers with a robust and user-friendly experience through their mobile devices. We believe that our ability to provide a compelling vehicle search experience, both on desktop computers and through mobile devices, is subject to a
19
number of factors, including our ability to: maintain attractive marketplaces for consumers and dealers; continue to innovate and introduce products for our marketplaces; launch new products that are effective and have a high degree of consumer engagement; display a wide variety of automobile inventory to attract more consumers to our websites; provide mobile applications that engage consumers; maintain the compatibility of our mobile applications with operating systems, such as iOS and Android, and with popular mobile devices running such operating systems; and access and analyze a sufficient amount of data to enable us to provide relevant information to consumers, including pricing information and accurate vehicle details.
We rely on internet search engines to drive traffic to our websites, and if we fail to appear prominently in the search results, our traffic would decline and our business would be adversely affected.
We rely, in part, on internet search engines such as Google, Bing, and Yahoo! to drive traffic to our websites. The number of consumers we attract to our marketplaces from search engines is due in part to how and where our websites rank in unpaid search results. These rankings can be affected by a number of factors, many of which are not under our direct control and may change frequently. For example, when a consumer searches for a vehicle in an internet search engine, we rely on a high organic search ranking of our webpages to refer the consumer to our websites. Our competitors’ internet search engine optimization efforts may result in their websites receiving higher search result rankings than ours, or internet search engines could change their methodologies in a way that would adversely affect our search result rankings. If internet search engines modify their methodologies in ways that are detrimental to us, if our efforts to improve our search engine optimization are unsuccessful or less successful than our competitors’ internet search engine optimization efforts, our ability to attract a large consumer audience could diminish and traffic to our marketplaces could decline. In addition, internet search engine providers could provide dealer and pricing information directly in search results, align with our competitors, or choose to develop competing products. Reductions in our own search advertising spend or more aggressive spending by our competitors could also cause us to incur higher advertising costs and/or reduce our market visibility to prospective users. Our websites have experienced fluctuations in organic and paid search result rankings in the past, and we anticipate fluctuations in the future. Any reduction in the number of consumers directed to our websites through internet search engines could harm our business and operating results.
Any inability by us to develop new products, or achieve widespread consumer and dealer adoption of those products, could negatively impact our business and financial results.
Our success depends on our continued innovation to provide products that make our marketplaces, websites, and mobile applications useful for consumers and dealers or that otherwise provide value to consumers and dealers. For example, during 2022 we scaled IMCO in furtherance of our evolution to a transaction-enabled platform. We also continue to develop digital retail offerings, including those that expand a dealer’s geographic footprint and others that bring additional elements of the car buying experience online through our websites. A failure by us to capture the benefits that we expect from our rollout of IMCO and these digital retail investments could have an adverse effect on our business and financial results.
We also anticipate that over time we may reach a point whenour investments in our current products aremay become less productive and the growth of our revenue will require more focus on developing new products for consumers and dealers.products. These new products must be widely adopted by consumers and dealers in order for us to continue to attract consumers to our marketplaces and dealers to our products and services. Accordingly, we must continually invest resources in product, technology, and development in order to improve the attractiveness and comprehensiveness of our marketplaces and their related products and effectively incorporate new internet and mobile technologies into them.marketplaces. Our ability to engage in these activities may decline as a result of the impact of the COVID-19 pandemicmacroeconomic effects and ourany cost-savings initiatives on our business. These product, technology, and development expenses may include costs of hiring additional personnel and retaining our current employees, engaging third-party service providers and conducting other research and development activities. There can be no assurance that innovations to our products like IMCO, or the development of future products, will increase consumer or dealer engagement, achieve market acceptance, create additional revenue or become profitable. In addition, revenue relating to new products is typically unpredictable and our new products may have lower gross margins, lower retention rates, and higher marketing and sales costs than our existing products. We are likely to continue to modify our pricing models for both existing and new products so that our prices for our offerings reflect the value those offerings are providing to consumers and dealers. Our pricing models may not effectively reflect the value of products to dealers, and, if we are unable to provide marketplaces and products that consumers and dealers want to use, they may reduce or cease the use of our marketplaces and products. Without innovative marketplaces and related products, we may be unable to attract additional, unique consumers or retain current consumers, which could affect the number of dealers that become paying dealers and the number of advertisers that want to advertise in our marketplaces, as well as the amounts that they are willing to pay for our products, which could, in turn, negatively impact our business and financial results.
We rely on internet search engines to drive traffic to our websites, and if we fail to appear prominently in the search results, our traffic would decline and our business would be adversely affected.
We rely, in part, on internet search engines such as Google, Bing, and Yahoo! to drive traffic to our websites. The number of consumers we attract to our marketplaces from search engines is due in part to how and where our websites rank in unpaid search results. These rankings can be affected by a number of factors, many of which are not under our direct control and may change frequently. For example, when a consumer searches for a vehicle in an internet search engine, we rely on a high organic search ranking of our webpages to refer the consumer to our websites. Our competitors’ internet search engine optimization efforts may result in their websites receiving higher search result rankings than ours, or internet search engines could change their methodologies and/or introduce competing products in a way that would adversely affect our search result rankings. If internet search engines modify their methodologies in ways that are detrimental to us, as they have done from time to time, or if our efforts to improve our search engine optimization are unsuccessful or
21
less successful than our competitors’ efforts, our ability to attract a large consumer audience could diminish, traffic to our marketplaces could decline and the number of leads that we send to our dealers could be adversely impacted. Additionally, competing products from internet search engine providers, such as those that provide dealer and vehicle pricing and other information directly in search results, could also adversely impact traffic to our websites and the number of leads that we are able to send to our dealers. Our business would also be adversely affected if internet search engine providers choose to align with our competitors. Reductions in our own search advertising spend or more aggressive spending by our competitors could also cause us to incur higher advertising costs and/or reduce our market visibility to prospective users. Our websites have experienced fluctuations in organic and paid search result rankings in the past, and we anticipate fluctuations in the future. Any reduction in the number of consumers directed to our websites through internet search engines could harm our business and operating results.
We may be unable to maintain or grow relationships with data providers, or may experience interruptions in the data they provide, which may create a less valuable or transparent shopping experience and negatively affect our business and operating results.
We obtain data from many third-party data providers, including inventory management systems, automotive website providers, customer relationship management systems, dealer management systems, governmental entities, and third-party data licensors. Our business relies on our ability to obtain data for the benefit of consumers and dealers using our marketplaces. For example, our success in each market is dependent in part upon our ability to obtain and maintain inventory data and other vehicle information for those markets. The large amount of inventory and vehicle information available in our marketplaces is critical to the value we provide for consumers. The loss or interruption of such inventory data or other vehicle information could
20
decrease the number of consumers using our marketplaces. We could experience interruptions in our data access for a number of reasons, including difficulties in renewing our agreements with data providers, changes to the software used by data providers, efforts by industry participants to restrict access to data, and increased fees we may be charged by data providers and the effects of the COVID-19 pandemic.providers. Our marketplaces could be negatively affected if any current provider terminates its relationship with us or our service from any provider is interrupted. If there is a material disruption in the data provided to us, the information that we provide to consumers and dealers using our marketplaces may be limited. In addition, the quality, accuracy, and timeliness of this information may suffer, which may lead to a less valuable and less transparent shopping experience for consumers using our marketplaces and could negatively affect our business and operating results.
The failure to build, maintain and protect our brands would harm our ability to attract a large consumer audience and to expand the use of our marketplaces by consumers and dealers.
While we are focused on building our brand recognition, maintaining and enhancing our brands will depend largely on the success of our efforts to maintain the trust of consumers and dealers and to deliver value to each consumer and dealer using our marketplaces. Our ability to protect our brands is also impacted by the success of our efforts to optimize our significant brand spend and overcome the intense competition in brand marketing across our industry, including competitors that may imitate our messaging. In addition, as a result of suppressed dealer inventory and resulting reduced demand for leads by dealers since the onset of the COVID-19 pandemic, we have reduced our brand spend in comparison to our pre-COVID-19 pandemic levels, and it is possible that we may decide to continue to suppress our brand spend in the future decide to further suppress such spend depending on the continued impact of the COVID-19 pandemic.macroeconomic conditions. If consumers believe that we are not focused on providing them with a better automobile shopping experience, or if we fail to overcome brand marketing competition and maintain a differentiated value proposition in consumers’ minds, our reputation and the strength of our brands may be adversely affected.
Complaints or negative publicity about our business practices and culture, our management team and employees, our marketing and advertising campaigns, our compliance with applicable laws and regulations, the integrity of the data that we provide to consumers, data privacy and security issues, third party content and conduct on our websites and other aspects of our business, irrespective of their validity, could diminish consumers’ and dealers’ confidence and participation in our marketplaces and could adversely affect our brands. There can be no assurance that we will be able to maintain or enhance our brands, and failure to do so would harm our business growth prospects and operating results.
Portions of our platform enable consumers and dealers using our marketplaces to communicate with one another and other persons seeking information or advice on the internet. Claims of defamation or other injury could be made against us for content posted on our websites. In addition, negative publicity and user sentiment generated as a result of fraudulent or deceptive conduct by users of our marketplaces could damage our reputation, reduce our ability to attract new users or retain our current users, and diminish the value of our brands.
Our pastrecent, rapid growth is not indicative of our future growth, and our ability to grow our revenue growth rate in the future is uncertain, including due to the impact of the COVID-19 pandemic.potential macroeconomic effects.
Our revenue decreasedincreased to $551.5$1,655.0 million for the year ended December 31, 20202022 from $588.9$951.4 million for the year ended December 31, 2019,2021, representing a 6% decrease between such periods – which we primarily attribute to the approximately $50 million impact of fee reductions that we provided to our paying dealers during the second quarter of 2020 in response to the COVID-19 pandemic – and increased to $588.9 million for the year ended December 31, 2019 from $454.1 million for the year ended December 31, 2018, representing a 30%74% increase between such periods. Our revenue in 2021the future may not grow at such a rate and beyond may continue tocould potentially be impacted by macroeconomic issues, such as declining wholesale vehicle prices, the COVID-19 pandemic.war in Ukraine and Russian sanctions, increased interest rates, lower consumer confidence, consumer debt levels and other matters that influence consumer spending and preferences. In addition, we will not be able to grow as expected, or at all, if we fail to: increase the number of consumers using our marketplaces; attract new consumers to sell their vehicles online through IMCO; maintain and expand the number of dealers that subscribe to our marketplaces and maintain and increase the fees that they are paying; expand the number of dealers engaging on the CarOffer platform and increase the share of wholesale transactions which they complete on such platform; attract and retain advertisers placing advertisements in our marketplaces; further improve the quality of our marketplaces and introduce high quality new products; and increase the number of connections between consumers and dealers using our marketplaces and connections to paying dealers, in particular. If our revenue declines further or fails to grow, investors’ perceptions of our business may be adversely affected, and the market price of our Class A common stock could decline.
22
We may require additional capital to pursue our business objectives and respond to business opportunities, challenges, or unforeseen circumstances. If we are unable to generate sufficient cash flows or if capital is not available to us, our business, operating results, financial condition, and prospects could be adversely affected.
If we are unable to generate sufficient cash flows, we would require additional capital to pursue our business objectives and respond to business opportunities, challenges, or unforeseen circumstances, including the continuing effects of the COVID-19 pandemic and other macroeconomic issues as well as to make marketing expenditures to improve our brand awareness, develop new products, further improve our platform and existing products, enhance our operating infrastructure, and acquire complementary businesses and technologies. Accordingly, we may need to engage in equity or debt financings to secure additional funds.funds, in addition to our revolving credit facility associated with the Credit Agreement (as defined below) (the "2022 Revolver"). However, additional funds may not be available when we need them on terms that are acceptable to us or at all. Volatility in the equity and credit markets particularly as a result of the COVID-19 pandemic, may also have an adverse effect on our ability to obtain equity or debt financing. If we are unableAn inability to obtain adequate financing or financing on terms satisfactory to us when we require it could significantly limit our ability to continue to pursue our business objectives and to respond to business opportunities, challenges, or unforeseen circumstances, could be significantly limited, and may adversely affect our business, operating results, financial condition, and prospects could be adversely affected.prospects.
21
Our international operations involve risks that may differ from, or are in addition to, our domestic operational risks.
WhileIn addition to the United States, we ceased operations of our marketplaces in Germany, Italy and Spain and stopped development of emerging marketplaces, we continue to operate marketplaces in the United Kingdom and Canada, which are less familiar competitive environments and involve various risks, including the need to invest significant resources and the likelihood that returns on such investments will not be achieved for several years, or possibly at all. We expect to continue to incurhave incurred losses in prior periods in the United Kingdom and Canada and may incur losses there again in the future. We also face various other challenges.
challenges in those jurisdictions. For example, in the United Kingdom and Canada, we were not the first market entrant, and our competitors may be more established or otherwise better positioned than we are to succeed.succeed in the United Kingdom and Canada. Our competitors may offer services to dealers that make dealers dependent on them, such as hosting dealers’ websites and providing inventory feeds for dealers, which would make it difficult to attract dealers to our marketplaces. Dealers may also be parties to agreements with other dealers and syndicates that prevent them from being able to access our marketplaces. Any of these barriers could impede our operations in our international markets, which could affect our business and potential growth.
In addition to English, we have made portions of our marketplaces available in French and Spanish. We may have difficulty in modifying our technology and content for use in non-English-speaking market segments or gaining acceptance by users in non-English-speaking market segments. Our ability to manage our business and conduct our operations internationally requires considerable management attention and resources, and is subject to the particular challenges of supporting a business in an environment of multiple languages, cultures, customs, legal and regulatory systems, alternative dispute resolution systems, and commercial infrastructures. Operating internationally may subject us to different risks or increase our exposure in connection with current risks, including risks associated with: recruiting, managing and retaining qualified multilingual employees, including sales personnel; adapting our websites and mobile applications to conform to local consumer behavior; increased competition from local websites and mobile applicationsproviders and potential preferences by local populations for local providers; compliance with applicable foreign laws and regulations, including different privacy, censorship, and liability standards and regulations, and different intellectual property laws; providing solutions in different languages and for different cultures, which may require that we modify our solutions and features so they are culturally relevant in different countries; the enforceability of our intellectual property rights; credit risk and higher levels of payment fraud; compliance with anti-bribery laws, including compliance with the Foreign Corrupt Practices Act and the United Kingdom Bribery Act; currency exchange rate fluctuations; adverse changes in trade relationships among foreign countries and/or between the United States and such countries, including as related to the United Kingdom’s exit from the European Union, or the EU, commonly referred to as “Brexit”;countries; double taxation of our international earnings and potentially adverse tax consequences arising from the tax laws of the United States or the foreign jurisdictions in which we operate; and higher costs of doing business internationally.
Dealer closures or consolidations could reduce demand for our products, which may decrease our revenue.
In the past, the number of United States dealers has declined due to dealership closures and consolidations as a result of factors such as global economic downturns and we expect this has occurred and will continue to occur as a result of the COVID-19 pandemic. When dealers consolidate, the services they previously purchased separately are often purchased by the combined entity in a lesser quantity or for a lower aggregate price than before, leading to volume compression and loss of revenue. Further dealership consolidations or closures could reduce the aggregate demand for our products and services. If dealership closures and consolidations occur in the future, our business, financial position and results of operations could be materially and adversely affected.
We depend on key personnel to operate our business, and if we are unable to retain, attract and integrate qualified personnel, or if we experience turnover of our key personnel, our ability to develop and successfully grow our business could be materially and adversely affected.
We believe our success has depended, and continues to depend, on the efforts and talents of our executives and employees. Our future success depends on our continuing ability to attract, develop, motivate, and retain highly qualified and skilled employees. Qualified individuals are in high demand,Since the onset of the COVID-19 pandemic, we have encountered increased rates of turnover of our employee base and encountered intense competition for retaining and attracting qualified and skilled employees. Accordingly, we have incurred, and we may continue to incur, significant costs to attract new employees and retain them,existing ones, and we may in the future become less competitive in attracting and retaining employees as a result of ourany expense reduction efforts due to the COVID-19 pandemic. that we may initiate.
In addition, any unplanned turnover, reduced involvement, or our failure to develop an adequate succession plan for any of our executive officers or key employees, or the reduction in their involvement in the management of our business, could materially adversely affect our ability to execute our business plan and strategy, and we may not be able to find adequate replacements on a timely basis, or at all. Our executive officers and other employees are at-will, employees, which means they may terminate their employment relationships with us at any time, and their knowledge of our business and industry would be extremely difficult to replace. We cannot ensure that we will be able to retain the services of any members of our senior management or other key employees. For example, effective on October 3, 2022 and December 2, 2022, respectively, Scot Fredo, our former Chief Financial Officer, and Yann Gellot, our former Senior Vice President, Finance and Principal Accounting Officer, resigned. If we do not succeed in attracting well-qualified employees or retaining and motivating existing employees, our business could be materially and adversely affected.
22
In January 2021, Additionally, we announced the promotion of Jason Trevisan from Chief Financial Officer and President, International to the role of Chief Executive Officer, and the transition of Langley Steinert from Chief Executive Officer to Executive Chairman. Additionally, Scot Fredo, our former Senior Vice President, Financial Planning & Analysis, was appointed to succeed Jason Trevisan in the role of Chief Financial Officer. We may face risks related to thesethe transitions that recently occurred in our senior management team, such as the departures of Messrs. Fredo and Gellot, and other future transitions in our leadership, team, including the disruption of our operations and the depletion of our institutional knowledge base.
23
We may be subject to disputes regarding the accuracy of Instant Market Values, Deal Ratings, Dealer Ratings, New Car Price Guidance and other features of our marketplaces.
We provide consumers using our CarGurus marketplacesplatform and dealers using our CarOffer platform with our proprietary IMV, Deal Ratings, and Dealer Ratings, as well as other features to help them evaluate vehicle listings, including price guidance for new car listings, or New Car Price Guidance. Our valuation models depend on the inventory listed on our sites as well as public information regarding automotive sales. If the inventory on our sitesites declines significantly, or if the number of automotive sales declines significantly or used car sales prices become volatile, whether as a result of the COVID-19 pandemicmacroeconomic effects or otherwise, our valuation models may not perform as expected. Revisions to or errors in our automated valuation models, or the algorithms that underlie them, may cause the IMV, the Deal Rating, New Car Price Guidance, or other features to vary from our expectations regarding the accuracy of these tools. In addition, from time to time, regulators, consumers, dealers and other industry participants may question or disagree with our IMV, Deal Rating, Dealer Rating or New Car Price Guidance. Any such questions or disagreements could result in distraction from our business or potentially harm our reputation, could result in a decline in consumers’ confidence in, or use of, our marketplaces and could result in legal disputes.
We are subject to a complex framework of laws and regulations, many of which are unsettled, still developing and contradictory, which have in the past, and could in the future, subject us to claims, challenge our business model, or otherwise harm our business.
Various aspects of our business are, may become, or may be viewed by regulators from time to time as subject, directly or indirectly, to United States federal, state and local laws and regulations, and to foreign laws and regulations.
Local Motor Vehicle Sales, Advertising and Brokering, and Consumer Protection Laws
The advertising and sale of new and used motor vehicles is highly regulated by the jurisdictions in which we do business. Although we do not sell motor vehicles, and although we believe that vehicle listings on our sites are not themselves advertisements, regulatoryRegulatory authorities or third parties could take the position that some of the laws or regulations applicable to dealers or to the manner in which motor vehicles are advertised and sold generally are directly applicable to our business. These advertising laws and regulations are frequently subject to multiple interpretations and are not uniform from jurisdiction to jurisdiction, sometimes imposing inconsistent requirements with respect to new or used motor vehicles. If our marketplaces and related products are determined to not comply with relevant regulatory requirements, we or dealers could be subject to civil and criminal penalties, including fines, or the award of significant damages in class actions or other civil litigation, as well as orders interfering with our ability to continue providing our marketplaces and related products and services in certain jurisdictions. In addition, even absent such a determination, to the extent dealers are uncertain about the applicability of such laws and regulations to our business, we may lose, or have difficulty increasing the number of paying dealers, which would affect our future growth.
If regulators or other third parties take the position that our marketplaces or related products violate applicable dealer licensing, brokering, bird-dog, consumer protection, consumer finance or advertising laws or regulations, responding to such allegations could be costly, could require us to pay significant sums in settlements, could require us to pay civil and criminal penalties, including fines, could interfere with our ability to continue providing our marketplaces and related products in certain jurisdictions, or could require us to make adjustments to our marketplaces and related products or the manner in which we derive revenue from dealers using our platform, any or all of which could result in substantial adverse publicity, termination of subscriptions by dealers, decreased revenues, distraction for our employees, increased expenses, and decreased profitability.
Federal Laws and Regulations
The United States Federal Trade Commission, or the FTC, has the authority to take actions to remedy or prevent acts or practices that it considers to be unfair or deceptive and that affect commerce in the United States. If the FTC takes the position in the future that any aspect of our business, including our advertising and privacy practices, constitutes an unfair or deceptive act or practice, responding to such allegations could require us to defend our practices and pay significant damages, settlements, and civil penalties, or could require us to make adjustments to our marketplaces and related products and services, any or all of which could result in substantial adverse publicity, distraction for our employees, loss of participating dealers, lost revenues, increased expenses, and decreased profitability.
23
Our platforms enable us, dealers, and users to send and receive text messages and other mobile phone communications. The Telephone Consumer Protection Act, or the TCPA, as interpreted and implemented by the United States Federal Communications Commission, or the FCC, and federal and state courts, impose significant restrictions on utilization of telephone calls and text messages to residential and mobile telephone numbers as a means of communication, particularly if the prior express consent of the person being contacted has not been obtained. Violations of the TCPA may be enforced by the FCC, by state attorneys general, or by others through litigation, including class actions. Furthermore, several provisions of the TCPA, as well as applicable rules and orders, are open to multiple interpretations, and compliance may involve fact-specific analyses.
Any failure by us, or the third parties on which we rely, to adhere to, or successfully implement, appropriate processes and procedures in response to existing or future laws and regulations could result in legal and monetary liability, fines and penalties, or damage to our reputation in the marketplace, any of which could have a material adverse effect on our business, financial condition, and results of operations. Even if the claims are meritless, we may be required to expend resources and pay costs to defend against regulatory actions or third-party claims. Additionally, any change to applicable laws or their interpretations that further restricts the way consumers and dealers interact through our platforms, or any governmental or private enforcement actions related thereto, could adversely affect our ability to attract customers and could harm our business, financial condition, results of operations, and cash flows.
24
Antitrust and Other Laws
Antitrust and competition laws prohibit, among other things, any joint conduct among competitors that would lessen competition in the marketplace. A governmental or private civil action alleging the improper exchange of information, or unlawful participation in price maintenance or other unlawful or anticompetitive activity even if unfounded, could be costly to defend and could harm our business, results of operations, financial condition, and cash flows.
Claims could be made against us under both United States and foreign laws, including claims for defamation, libel, invasion of privacy, false advertising, intellectual property infringement, or claims based on other theories related to the nature and content of the materials disseminated by our marketplaces and on portions of our websites. Our defense against any of these actions could be costly and involve significant time and attention of our management and other resources. If we become liable for information transmitted in our marketplaces, we could be directly harmed and we may be forced to implement new measures to reduce our exposure to this liability.
The foregoing description of laws and regulations to which we are or may be subject is not exhaustive, and the regulatory framework governing our operations is subject to continuous change. We are, and we will continue to be, exposed to legal and regulatory risks including with respect to privacy, tax, law enforcement, content, intellectual property, competition, and other matters. The enactment of new laws and regulations or the interpretation of existing laws and regulations, both domestically and internationally, may affect the operation of our business, directly or indirectly, which could result in substantial regulatory compliance costs, civil or criminal penalties, including fines, adverse publicity, loss of subscribing dealers, lost revenues, increased expenses, and decreased profitability. Further, investigations by governmental agencies, including the FTC, into allegedly anticompetitive, unfair, deceptive or other business practices by us or dealers using our marketplaces, could cause us to incur additional expenses and, if adversely concluded, could result in substantial civil or criminal penalties and significant legal liability, or orders requiring us to make adjustments to our marketplaces and related products and services.
We rely on third-party service providers and strategic partners for many aspects of our business, and any failure to maintain these relationships or to successfully integrate certain third-party platforms could harm our business.
Our success depends upon our relationships with third parties, including, among others: our payment processor; our data center hosts; our information technology providers; our data providers for inventory and vehicle information; and our partners for vehicle transportation, inspection and other logistics associated with our CarOffer business is subjectand IMCO. If these third parties experience difficulty meeting our requirements or standards, have adverse audit results, violate the terms of our agreements or applicable law, fail to risks relatedobtain or maintain applicable licenses, or if the relationships we have established with such third parties expire or otherwise terminate, it could make it difficult for us to the larger automotive industry ecosystem,operate some aspects of our business, which could havedamage our business and reputation. In addition, if such third-party service providers or strategic partners were to cease operations, temporarily or permanently, face financial distress or other business disruptions, increase their fees, or if our relationships with these providers or partners deteriorate or terminate, whether as a material adverse effectresult of macroeconomic conditions or otherwise, we could suffer increased costs and we may be unable to provide similar services until an equivalent provider could be found or we could develop replacement technology or operations. For example, primarily in connection with our Dealer-to-Dealer transactions, we utilize a third-party payment processor that collects customer payments on our behalf and remits them to us, as well as provides payments in advance for certain selling dealers. If our relationship with this third-party payment processor were to deteriorate or terminate, we would have to identify a succeeding payment processor or assume in-house facilitation of these services, which could disrupt our business and adversely affect our revenue, results of operations, and financial condition.
Decreases Furthermore, if we are unsuccessful in consumer demand could adversely affect the market for automobile purchases and, as a result, reduce the number of consumers using our platform. Consumer purchases of new and used automobiles generally decline during recessionary periods and other periods in which disposable income is adversely affected andidentifying or finding high-quality partners, if we believe thatfail to negotiate cost-effective relationships with them, or if we have entered such a period as a result of the COVID-19 pandemic. Purchases of new and used automobiles are typically discretionary for consumers and have been, and may continue to be, affected by negative trends in the economy, including: the effects of the COVID-19 pandemic, the cost of energy and gasoline; the availability and cost of credit; rising interest rates; reductions in business and consumer confidence; stock market volatility; and increased unemployment.
Further, in recent years the market for motor vehicles has experienced rapid changes in technology and consumer demands. Self-driving technology, ride sharing, transportation networks, and other fundamental changes in transportation including those arising as a result of the COVID-19 pandemic could impact consumer demand for the purchase of automobiles. A reduction in the number of automobiles purchased by consumers could adversely affect dealers and car manufacturers and lead to a reduction in other spending byineffectively manage these groups, including targeted incentive programs.
In addition, our business may be negatively affected by challenges to the larger automotive industry ecosystem, including global supply chain challenges, changes to trade policies, including tariff rates and customs duties, trade relations between the United States and China and other macroeconomic issues, including the ongoing effects of the COVID-19 pandemic. These factorsrelationships, it could have a materialan adverse effectimpact on our business revenue, results of operations, and financial condition.results.
24
Making decisionsOur enterprise systems require that we believeintegrate the platforms hosted by certain third-party service providers. We are responsible for integrating these platforms and updating them to maintain proper functionality. Issues with these integrations, our failure to properly update third-party platforms or any interruptions to our internal enterprise systems could harm our business by causing delays in the best interests of our marketplaces may cause usability to forgo short-term gains in pursuit of potential but uncertain long-term growth.quote, activate service and bill new and existing customers on our platform.
In the past, we have forgone, and we will in the future continue to forgo, certain expansion or short-term revenue opportunities that we do not believe are in the long-term best interests of our marketplaces, even if such decisions negatively impact our results of operations in the short term. For example, during select monthly service periods in 2020 we provided paying dealers with marketplace subscriptions at no cost or at a discount in an effort to help our paying dealers maintain their business health during the COVID-19 pandemic. However, such strategies may not result in the long-term benefits that we expect, in which case our user traffic and engagement, business, and financial results could be harmed.
A significant disruption in service on our websites or mobile applications could damage our reputation and result in a loss of consumers, which could harm our business, brands, operating results, and financial condition.
Our brands, reputation, and ability to attract consumers, dealers, and advertisers depend on the reliable performance of our technology infrastructure and content delivery. We have experienced, and we may in the future experience, interruptions with our systems. Interruptions in these systems whether due to system failures, computer viruses, ransomware, physical or electronic break-ins, or otherwise, could affect the security or availability of our marketplaces, on our websites and mobile applications, and prevent or inhibit the ability of dealers and consumers to access our marketplaces. For example, past disruptions have impacted our ability to activate customer accounts and manage our billing activities in a timely manner. Such interruptions could alsohave resulted, and may in the future result, in third parties accessing our confidential and proprietary information, including our intellectual property. Problems with the reliability or security of our systems could harm our reputation, harm our ability to protect our confidential and proprietary information, result in a loss of consumers and dealers, and result in additional costs.
Substantially all of the communications, network, and computer hardware used to operate our platforms is located in the Eastern region of the United States, near Boston, Massachusetts, and internationally near each of London, England, Dublin, Ireland and Dublin, Ireland.Frankfurt, Germany. These facilities include hosting through Amazon Web Services, a provider of cloud infrastructure services. Although we can host our U.S. CarGurus’
25
marketplace from two alternative locations in the United States and we believe our systems are redundant, there may be exceptions for certain hardware or software. In addition, we do not own or control the operation of these facilities. Any disruptions or other operational performance problems with these facilities or problems faced by their operators, including our cloud infrastructure service provider, could result in material interruptions in our services, adversely affect our reputation and results of operations, and subject us to liability. We also use third-party hosting services to back up some data but do not maintain redundant systems or facilities for some of the services. A disruption to one or more of these systems has caused, and may in the future cause, us to experience an extended period of system unavailability, which could negatively impact our relationship with consumers, customers and advertisers. Our systems and operations are vulnerable to damage or interruption from fire, flood, power loss, telecommunications failure, terrorist attacks, acts of war, electronic andbreaches, cyber-attacks, phishing attempts, errors by employees, physical break-ins, computer viruses, earthquakes, and similar events. The occurrence of any of these events could result in damage to our systems and hardware or could cause them to fail. In addition, we may not have sufficient protection or recovery plans in certain circumstances.
Problems faced by our third-party web hosting providers could adversely affect the experience consumers have while using our marketplaces. Our third-party web hosting providers could close their facilities without adequate notice. Any financial difficulties, up to and including bankruptcy, faced by our third-party web hosting providers or any of the service providers whose services they use, which may be exacerbated as a result of the COVID-19 pandemic, may have negative effects on our business, the nature and extent of which are difficult to predict. If our third-party web hosting providers are unable to keep up with our capacity needs, our business could be harmed.
Any errors, defects, disruptions, or other performance or reliability problems with our network operations could cause interruptions in access to our marketplaces as well as delays and additional expense in arranging new facilities and services and fixing or replacing any affected systems or hardware and could harm our reputation, business, operating results, and financial condition. Although we carry insurance, it may not be sufficient to compensate us for the potentially significant losses, including the potential harm to the future growth of our business, that may result from interruptions in our service as a result of system failures.
We, and our third-party service providers, collect, process, store, transfer, share, disclose, and use consumer information and other data, and our actual or perceived failure, or the actual or perceived failure of our third-party service provides, to protect such information and data or respect users’ privacy could damageexpose us to liability and adversely affect our reputation and brands and harm our business and operating results.
Some functions of our marketplaces involve the storage and transmission of consumers’ information, such as IP addresses, contact information of users who connect with dealers, credit applications and other financial data, and profile information of users who create accounts on our marketplaces, as well as dealers’ information. We also process and store personal and confidential information of our vendors, partners, and employees.employees, and we employ third-party service providers, such as payment processing providers, who also regularly have access to customer and consumer data. Some of this information may be private, and security breaches against us or our third-party service providers could expose us to a risk of loss or exposure of this information, which could result in potential liability, litigation, and remediation costs. For example, hackers could steal our users’ profile passwords, names, email addresses, phone numbers, and other personal information. We rely on encryption and authentication technology licensed from third parties to effect secure transmission of such information, and we also rely on our third-party service providers to use sufficient security measures to protect such information. Despite all of our efforts to protect this information and data, none of our security measures or those of our third-party service providers provide absolute security, and they may not be effective in preventing a future failure of our systems. Like all information systems and technology, our websites, mobile applications, and information systems, and those of our third-party service providers, are subject to computer viruses, break-ins, phishing attacks, attempts to overload the systems with denial-of-service or other attacks, ransomware, and similar incidents or disruptions from unauthorized use of our or our third-party service providers’ computer systems, any of which could lead to interruptions, delays, or website shutdowns, and could cause loss of critical data and the unauthorized disclosure,
25
access, acquisition, alteration, and use of personal or other confidential information. If we or our third-party service providers experience compromises to ourdata security that result in website or mobile application performance or availability problems, the complete shutdown of our websites or mobile applications, or the loss or unauthorized disclosure, access, acquisition, alteration, or use of confidential information, consumers, customers, advertisers, partners, vendors, and employees may lose trust and confidence in us, and consumers may decrease the use of our websites or stop using our websites entirely, dealers may stop or decrease their subscriptions with us, and advertisers may decrease or stop advertising on our websites.
Further, outside parties have attempted and will likely continue to attempt to fraudulently induce employees, consumers, or advertisers to disclose sensitive information in order to gain access to our information or our consumers’, dealers’, advertisers’, and employees’ information. As cyber-attacks increase in frequency and sophistication, our cyber-security and business continuitydisaster recovery plans may not be effective in anticipating, preventing and effectively responding to all potential cyber-risk exposures. In addition, because the techniques used to obtain unauthorized access, disable or degrade service, or sabotage systems change frequently, often are not recognized until after having been launched against a target, and may originate from less regulated and remote areas around the world, we may be unable to proactively address these techniques or to implement adequate preventative measures.
Any or all of the issues above could adversely affect our brand reputation, negatively impact our ability to attract new consumers and increase engagement by existing consumers, cause existing consumers to curtailreduce or stop the use of our marketplaces or close their accounts, cause existing dealers and advertisers to cancel their contracts, cause employees to terminate their employment, cause employment candidates to be unwilling to pursue employment opportunities or accept employment offers, and and/or subject us to governmental or third-party lawsuits, investigations, regulatory fines, or other actions or liability, thereby harming our business, results of operations, and financial condition. Although we carry privacy, data breach and network security liability insurance, we cannot be certain that our coverage will be adequate for liabilities actually incurred or sufficient to compensate us for the potentially significant losses, or that insurance will continue to be available to us on economically reasonable terms or at all.
26
There are numerous federal, national, state, and local laws and regulations in the United States and around the world regarding privacy and the collection, processing, storage, sharing, disclosure, use, cross-border transfer, and protection of personal information and other data. These laws and regulations are evolving, are subject to differing interpretations, may be costly to comply with, may result in regulatory fines or penalties, may subject us to third-party lawsuits, may be inconsistent between countries and jurisdictions, and may conflict with other requirements.
We seek to comply with industry standards and are subject to the terms of our privacy policies and privacy-related obligations to third parties, as well as all applicable laws and regulations relating to privacy and data protection. However, it is possible that these obligations may be interpreted and applied in new ways or in a manner that is inconsistent from one jurisdiction to another and may conflict with other rules or our practices and that new regulations could be enacted. Several proposals have recently become effective or are pending, as applicable, before federal, state, local, and foreign legislative and regulatory bodies that could significantly affect our business, includingwhich we refer to collectively as the Privacy Regulations. The Privacy Regulations include, but are not limited to, the EU's General Data Protection Regulation in the EU, or the GDPR, which went into effect on May 25, 2018,and the California Consumer Privacy Act, orAct. Certain of the CCPA, which went into effect on January 1, 2020, and the California Privacy Rights Act, or the CPRA, which goes into effect January 1, 2023. The GDPR and CCPA in particularRegulations have already required, and along with the CPRA,certain others may further require, us to change our policies and procedures and may in the future require us to make changes to our marketplaces and other products. These and other requirements could reduce demand for our marketplaces and other offerings, require us to take on more onerous obligations in our contracts and restrict our ability to store, transfer, and process data, which may seriously harm our business. Similarly, Brexit and the Schrems II decision of the Court of Justice of the EU, which effectively invalided the EU-U.S. Privacy Shield Framework, may require us to change our policies and procedures and, if we are not in compliance, may also seriously harm our business. We may not be entirely successful in our efforts to comply with the evolving regulations to which we are subject due to various factors within our control, such as limited internal resource allocation, or outside our control, such as a lack of vendor cooperation, new regulatory interpretations, or lack of regulatory guidance in respect of certain GDPR, CCPA, or CPRAPrivacy Regulations and other statutory requirements.
Any failure or perceived failure by us to comply with United States and international data protection laws and regulations, our privacy policies, or our privacy-related obligations to consumers, customers, employees and other third parties, or any compromise of security that results in the unauthorized release or transfer of sensitive information,data, which could include personal information or other user data, may result in governmental investigations, enforcement actions, regulatory fines, litigation, criminal penalties, or public statements against us by consumer advocacy groups or others, and could cause consumers and dealers to lose trust in us, which could significantly impact our brand reputation and have an adverse effect on our business. Additionally, if any third party that we share information with experiences a security breach or fails to comply with its privacy-related legal obligations or commitments to us, such matters may put employee, consumer or dealer information at risk and could in turn expose us to claims for damages or regulatory fines or penalties and harm our reputation, business, and operating results.
26
Our ability to attract consumers to our own websites and to provide certain services to our customers depends on the collection of consumer data from various sources, which may be restricted by consumer choice, privacy restrictions, and developments in laws, regulations and industry standards.
The success of our consumer marketing and the delivery of internet advertisements for our customers depends on our ability to leverage data, including data that we collect from our customers, data we receive from our publisher partners and third parties, and data from our operations. Using cookies and non-cookie-based technologies, such as mobile advertising identifiers, we collect information about the interactions of users with our customers’ and publishers’ digital properties (including, for example, information about the placement of advertisements and users’ shopping or other interactions with our customers’ websites or advertisements). Our ability to successfully leverage such data depends on our continued ability to access and use such data, which could be restricted by a number of factors, including: increasing consumer adoption of “do not track” mechanisms as a result of legislation including GDPR, CCPA, and CPRA;legislation; privacy restrictions imposed by web browser developers, advertising partners or other software developers that impair our ability to understand the preferences of consumers by limiting the use of third-party cookies or other tracking technologies or data indicating or predicting consumer preferences; and new developments in, or new interpretations of, privacy laws, regulations and industry standards.
Each of these developments could materially impact our ability to collect consumer data and deliver relevant internet advertisements to attract consumers to our websites or to deliver targeted advertising for our advertising customers. If we are unsuccessful in evolving our advertising and marketing strategies to adapt to and mitigate these evolving consumer data limitations, our business results could be materially impacted.
We have been, and may again be, subject to intellectual property disputes, which are costly to defend and could harm our business and operating results.
We have been, and expect in the future to be, subject to claims and litigation alleging that we or content on our websites infringe others’ intellectual property rights, including the trademarks, copyrights, patents, and other intellectual property rights of third parties, including from our competitors or non-practicing entities. We may also learn of possible infringement to our trademarks, copyrights, patents, and other intellectual property. In addition, we could be subject to lawsuits where consumers and dealers posting content on our websites disseminate materials that infringe the intellectual property rights of third parties.
Patent and other intellectual property litigation may be protracted and expensive, and the results are difficult to predict and may result in significant settlement costs or payment of substantial damages. Many potential litigants, including patent holding companies, have the ability to dedicate substantially greater resources to enforce their intellectual property rights and to defend claims that may be brought against them. Furthermore, a successful claimant could secure a judgment that requires us to stop offering some features or prevents us from conducting our business as we have historically done or may desire to do in the future. We might also be required to seek a license and pay royalties for the use of such intellectual property, which may not be available
27
on commercially acceptable terms, or at all. Alternatively, we may be required to modify our marketplaces and features, while we develop non-infringing substitutes, which could require significant effort and expense and may ultimately not be successful.
In addition, we use open source software in our platform and will use open source software in the future. From time to time, we may face claims from companies that incorporate open source software into their products, claimingregarding ownership of, or demanding release of, the source code, the open source software, or derivative works that were developed using such software, or otherwise seeking to enforce the terms of the applicable open source license. These claims could also result in litigation, require us to purchase a costly license or require us to devote additional product, technology, and development resources to change our platforms or services, any of which would have a negative effect on our business and operating results.
Even if these matters do not result in litigation or are resolved in our favor or without significant cash settlements, these matters, and the time and resources necessary to litigate or resolve them, could harm our business, our operating results, and our reputation.
Failure to adequately protect our intellectual property could harm our business and operating results.
Our business depends on our intellectual property, the protection of which is crucial to the success of our business. We rely on a combination of patent, trademark, trade secret, and copyright law and contractual restrictions to protect our intellectual property. In addition, we attempt to protect our intellectual property, technology, and confidential information by requiring our employees and consultants to enter into confidentiality and assignment of inventions agreements and third parties to enter into nondisclosure agreements as we deem appropriate. Despite our efforts to protect our proprietary rights, unauthorized parties may attempt to copy aspects of our platform’s features, software, and functionality or obtain and use information that we consider proprietary.
27
Competitors may adopt trademarks or trade names similar to ours, thereby harming our ability to build brand identity and possibly leading to user confusion. In addition, there could be potential trade name or trademark infringement claims broughtasserted against us by owners of other registered or unregistered trademarks logos or slogans, for our use of registered or unregistered trademarks, logos or slogans, or third-party trademarks that incorporate variations of our trademarks. We have registered the CARGURUS and CG logos, as well as the word-mark CARGURUS, in the U.S., Canada, and the United Kingdom. Additionally, CarOffer has a number of registered and unregistered trademarks, including “CarOffer” and the CarOffer logo, and related marks, which CarOffer has registered as trademarks in the U.S.
We currently hold the “CarGurus.com” internet domain name and various other related domain names relating to our brands. The regulation of domain names is subject to change. Regulatory bodies could establish additional top-level domains, appoint additional domain name registrars, or modify the requirements for holding domain names. As a result, we may not be able to acquire or maintain all domain names that use the names of our brands. In addition, third parties have created and may in the future create copycat or squatter domains to deceive consumers, which could harm our brands, interfere with our ability to register domain names, and result in additional costs.
We may be unable to halt the operations of websites that aggregate or misappropriate our data.
From time to time, third parties may misappropriate our data through website scraping, robots, or other means and aggregate this data with data from other sources. In addition, copycat websites may misappropriate data in our marketplaces and attempt to imitate our brands or the functionality of our websites. If we become aware of such activities, we intend to employ technological or legal measures in an attempt to halt their operations. However, weWe may be unable to detect and remedy all such activities in a timely manner. In some cases, our available remedies may not beand adequate to protect us against the impact of such operations.manner. Regardless of whether we can successfully enforce our rights against these third parties, any measures that we may take could require us to expend significant financial or other resources, which could harm our business, results of operations, and financial condition. In addition, to the extent that such activity creates confusion among consumers or advertisers, our brands and business could be harmed.
Seasonality and other factors may cause fluctuations in our operating results and our marketing spend.
Across the retail automotive industry, consumer purchases are typically greatest in the first three quarters of each year, due in part to the introduction of new vehicle models from manufacturers and the seasonal nature of consumer spending, and our consumer-marketing spend generally fluctuates accordingly. As consumer automotive purchases slow in the fourth quarter, our rate of marketing spend typically also slows. This seasonality has not been immediately apparent historically due to the overall growth of other operating expenses. In addition, any reduction of our marketing spend in response to COVID-19-relatedCOVID-19 or other macroeconomic-related expense management or otherwise, and shifts in demand from dealers and consumers could impact the efficiency of our marketing spend. For example, a larger portion of our advertising may run during peak holiday seasonality for retail advertisers, inflating our media costs. As our growth rates moderate or cease, the impact of these seasonality trends and other influences on our results of operations could become more pronounced. In addition, the volume of wholesale vehicle sales fluctuates from quarter to quarter as a result of macroeconomic issues, which may have a corresponding impact on our results of operations. This variability is caused by several factors including the timing of used vehicles available for sale from selling customers, the seasonality of the retail market for used vehicles and/or inventory challenges in the automotive industry, which affect the demand side of the wholesale industry. This variability has affected our Digital Wholesale segment in the past, and may continue to in the future.
Failure to deal effectively with fraud or other illegal activity could lead to potential legal liability, harm our business, cause us to lose paying dealer customers and adversely affect our reputation, financial performance and prospects for growth.business.
Based on the nature of our business, we are exposed to potential fraudulent and illegal activity in our marketplaces, including: listings of automobiles that are not owned by the purported dealer or that the dealer has no intention of selling at the listed price; receipt of fraudulent leads that we may send to our dealers; and deceptive practices in our peer-to-peer marketplace. The measures we have in place to detect and limit the occurrence of such fraudulent and illegal activity in our marketplaces may not always be effective or account
28
for all types of fraudulent or other illegal activity. Further,activity now or in the measures that we use to detect and limit the occurrence of fraudulent and illegal activity must be dynamic, as technologies and ways to commit fraud and illegal activity are continually evolving.future. Failure to limit the impact of fraudulent and illegal activity on our websites could lead to potential legal liability, harm our business, cause us to lose paying dealer customers and adversely affect our reputation, financial performance and prospectsgrowth prospects.
We have identified a material weakness in our internal control over financial reporting. If we are unable to remediate this material weakness, we may not be able to accurately or timely report our financial condition or results of operations, which may adversely affect our business and the market price of our common stock.
We have identified a material weakness in our internal control over financial reporting. If we are unable to remediate this material weakness, we may not be able to accurately or timely report our financial condition or results of operations, which may adversely affect our business and the market price of our Class A common stock. A material weakness is a deficiency, or a combination of deficiencies, in internal control over financial reporting, such that there is a reasonable possibility that a material misstatement of our annual or interim financial statements will not be prevented or detected on a timely basis. We have identified deficiencies in controls at our CarOffer subsidiary. These deficiencies include controls over (i) certain IT general controls for growth.systems that are relevant to the preparation of our financial statements and (ii) our financial statement close process, which in the aggregate constitute a material weakness. While this material weakness did not result in a material misstatement of our financial statements, it could impact the effectiveness of our segregation of duties controls, as well as the effectiveness of IT-dependent controls, which could result in misstatement(s) impacting financial statement accounts and disclosures, resulting in a material misstatement of our annual or interim financial statements that we would have failed to prevent or detect. As a result of this material weakness, our management concluded that our disclosure controls and procedures were not effective as of December 31, 2022.
We are in the process of implementing a remediation plan designed to improve our internal control over financial reporting to remediate this material weakness. This remediation plan includes implementation of additional controls and procedures, including timely performance of user access and change management reviews, as well as an effective review of journal entries and accounts reconciliations. We cannot assure you that the measures we have taken to date, and actions we may take in the future, will be sufficient to remediate the control deficiencies that led to the material weakness in our internal control over financial reporting or that they will prevent or avoid potential future material weaknesses. If we are unable to successfully remediate the material weakness in our internal control over financial reporting, the accuracy and timing of our financial reporting may be adversely affected, investors could lose confidence in the accuracy and completeness of our financial reports, the market price of our Class A common stock could decline, we could be subject to sanctions or investigations by Nasdaq, the SEC or other regulatory authorities, and our ability to access the capital markets could be limited.
Our 2022 Revolver contains certain covenants and other restrictions on our actions that may limit our operational flexibility or otherwise adversely affect our results of operations.
The terms of our 2022 Revolver include a number of covenants that limit our ability to, among other things, grant or incur liens, incur additional indebtedness, make certain restricted investments or payments, enter into certain mergers and acquisitions or engage in certain asset sales, subject in each case to certain exceptions. In addition, our 2022 Revolver also subjects us to financial covenants in respect of minimum liquidity and requires that we maintain a net leverage ratio. The terms of our 2022 Revolver may restrict our current and future operations and could adversely affect our ability to finance our future operations or capital needs. Complying with these covenants may make it more difficult for us to successfully execute our business strategy and compete against companies which are not subject to such restrictions. Further, interest rate fluctuations may materially adversely affect our results of operations and financial conditions due to the variable interest rate on our 2022 Revolver, in the event that we draw down funds thereunder.
A failure by us to comply with the covenants or payment requirements specified in our 2022 Revolver could result in an event of default, which would give the lenders the right to terminate their commitments to provide loans under our 2022 Revolver and to declare any borrowings outstanding, together with any accrued and unpaid interest and fees, to be immediately due and payable. If any debt under our 2022 Revolver were to be accelerated, we may not have sufficient cash or be able to borrow sufficient funds to refinance the debt or sell sufficient assets to repay the debt, which could immediately adversely affect our business, cash flows, results of operations, and financial condition. Even if we were able to obtain new financing, it may not be on commercially reasonable terms or on terms that are acceptable to us. As of December 31, 2022, there were no amounts outstanding under our 2022 Revolver.
Risks Related to Our Class A Common Stock
Our founder controls a majority of the voting power of our outstanding capital stock, and, therefore, has control over key decision-making and could control our actions in a manner that conflicts with the interests of other stockholders.
Primarily by virtue of his holdings in shares of our Class B common stock, which has a ten-to-one voting ratio compared to our Class A common stock, Langley Steinert, our founder, Chairman of the Board and Executive Chairman, is able to exercise voting rights with respect to a majority of the voting power of our outstanding capital stock and therefore has the ability to control the outcome of matters submitted to our stockholders for approval, including the election of directors and any merger, consolidation, or sale of all or substantially all of our assets. This concentrated control could delay, defer, or prevent a change of control, merger, consolidation, or sale of all or substantially all of our assets that our other stockholders support, or conversely this concentrated control could result in the
29
consummation of such a transaction that our other stockholders do not support. This concentrated control could also discourage a potential investor from acquiring our Class A
28
common stock, which might harm the trading price of our Class A common stock. In addition, Mr. Steinert has significant influence in the management and major strategic investments of our company as a result of his positionsposition as Executive Chairman, and his ability to control the election or replacement of our directors. As Chairman of the Board and our Executive Chairman, Mr. Steinert owes a fiduciary duty to our stockholders and must act in good faith in a manner he reasonably believes to be in the best interests of our stockholders. If Mr. Steinert’s status as an officer and a director is terminated, his fiduciary duties to our stockholders will also terminate, but his voting power as a stockholder will not be reduced as a result of such termination unless such termination is either made voluntarily by Mr. Steinert or due to Mr. Steinert’s death, or if the sum of the number of shares of our capital stock held by Mr. Steinert, by any Family Member of Mr. Steinert, and by any Permitted Entity of Mr. Steinert (as such capitalized terms are defined in our amended and restated certificate of incorporation)incorporation attached to this Annual Report on Form 10-K as Exhibit 3.1), assuming the exercise and settlement in full of all outstanding options and convertible securities and calculated on an as-converted to Class A common stock basis, is less than 9,091,484 shares.shares. As a stockholder, even a controlling stockholder, Mr. Steinert is entitled to vote his shares in his own interests, which may not always be aligned with the interests of our other stockholders.
We believe that Mr. Steinert’s continued control of a majority of the voting power of our outstanding capital stock is beneficial to us and is in the best interests of our stockholders. In the event that Mr. Steinert no longer controls a majority of the voting power, whether as a result of the disposition of some or all his shares of Class A or Class B common stock, the conversion of the Class B common stock into Class A common stock in accordance with its terms, or otherwise, our business or the trading price of our Class A common stock may be adversely affected.
The multiple class structure of our common stock has the effect of concentrating voting control with our founder and certain other holders of our Class B common stock, which will limit or preclude the ability of our stockholders to influence corporate matters.
Our Class B common stock has ten votes per share and our Class A common stock has one vote per share. Our founder and certain of his affiliates hold a substantial number of the outstanding shares of our Class B common stock and therefore hold a substantial majority of the voting power of our outstanding capital stock. Because of the ten-to-one voting ratio between our Class B and Class A common stock, the holders of our Class B common stock collectively control a majority of the combined voting power of our common stock and therefore are able to control all matters submitted to our stockholders for approval so long as the shares of Class B common stock represent at least 9.1% of all outstanding shares of our Class A and Class B common stock. This concentrated control will limit or preclude the ability of our other stockholders to influence corporate matters for the foreseeable future.
Transfers Additionally, transfers by holders of Class B common stock will generally result in those transferred shares converting into Class A common stock, subject to limited exceptions, such as certain transfers effected for estate planning or charitable purposes. The conversion of Class B common stock into Class A common stock has had and will continue to have the effect, over time, of increasing the relative voting power of those holders of Class B common stock who retain such shares. If, for example, Mr. Steinert retains a significant portion of his holdings of Class B common stock, he could continue to control a majority of the combined voting power of our outstanding capital stock.
The trading price of our Class A common stock has been and may continue to be volatile and the value of our stockholders’ investment in our stock could decline.
The trading price of our Class A common stock has been and may continue to be volatile and fluctuate substantially. The trading price of our Class A common stock depends on a number of factors, including those described in this “Risk Factors” section, many of which are beyond our control and may not be related to our operating performance. Factors that could cause fluctuations in the trading price of our Class A common stock include the following: changes in the operating performance and stock market valuations of other technology companies generally, or those in our industry in particular; sales of shares of our Class A common stock by us or our stockholders; adverse changes to recommendations regarding our stock by securities analysts that cover us; failure of securities analysts to maintain coverage of us, changes in financial estimates by any securities analysts who follow our company, or our failure to meet these estimates or the expectations of investors; announcements by us or our competitors of new products; the public’s reaction to our issuances of earnings guidance or other public announcements and filing; real or perceived inaccuracies in our key metrics; actions of an activist stockholder; actual or anticipated changes in our operating results or fluctuations in our operating results or developments in our business, our competitors’ businesses, or the competitive landscape generally; litigation involving us or investigations by regulators into our operations or those of our competitors; developments or disputes concerning our proprietary rights; announced or completed acquisitions of businesses or technologies by us or our competitors; new laws or regulations or new interpretations of existing laws or regulations applicable to our business; changes in accounting standards, policies, or guidelines; any significant change in our management; changes in the automobile industry; and general economic conditions, including as related to the COVID-19 pandemic.
29
Our status as a “controlled company” could make our Class A common stock less attractive to some investors or otherwise harm the trading price of our Class A common stock.
More than 50% of our voting power is held by Mr. Steinert. As a result, we are a “controlled company” under the corporate governance rules for Nasdaq-listed companies and may elect not to comply with certain Nasdaq corporate governance requirements. We rely and have relied on certain or all of these exemptions. Accordingly, should the interests of our controlling stockholder differ from those of other stockholders, the other stockholders may not have the same protections afforded to stockholders of companies that are subject to all of the corporate governance rules for Nasdaq-listed companies. Our status as a controlled company could make our Class A common stock less attractive to some investors or otherwise harm our stock price.
The trading price of our Class A common stock has been and may continue to be volatile and the value of our stockholders’ investment in our stock could decline.
The trading price of our Class A common stock has been and may continue to be volatile and fluctuate substantially. The trading price of our Class A common stock depends on a number of factors, including those described in this “Risk Factors” section, many of which are beyond our control and may not be related to our operating performance. Factors that could cause fluctuations in the trading price of our Class A common stock include the following: changes in the operating performance and stock market valuations of other technology companies generally, or those in our industry in particular; sales of shares of our Class A common stock by us or our stockholders; adverse changes to recommendations regarding our stock by covering securities analysts; failure of securities analysts to maintain coverage of us, changes in financial estimates by any securities analysts who follow our company, or our failure to meet these estimates or the expectations of investors; announcements by us or our competitors of new products; the public’s reaction to our issuances of earnings guidance or other public announcements and filing; real or perceived inaccuracies in our key metrics; actions of an activist stockholder; actual or anticipated changes in our operating results or fluctuations in our operating results or developments in our business, our competitors’ businesses, or the competitive landscape generally; litigation involving us or investigations by regulators into our operations or those of our competitors; developments or disputes concerning our proprietary rights; announced or completed acquisitions of businesses or technologies by us or our competitors; new laws or regulations or new interpretations of existing laws or
30
regulations applicable to our business; changes in accounting standards, policies, or guidelines; any significant change in our management; changes in the automobile industry; the COVID-19 pandemic; and general economic conditions.
We cannot guarantee that our share repurchase program will be fully implemented or that it will enhance stockholder value, and share repurchases could affect the price of our Class A common stock.
In December 2022, our board of directors authorized a share repurchase program (the "Share Repurchase Program") pursuant to which we may, from time to time, purchase shares of our Class A common stock for an aggregate purchase price not to exceed $250 million, with an expiration date of December 31, 2023. Repurchases under the program may be made through a variety of methods, including but not limited to open market purchases, privately negotiated transactions and transactions that may be effected pursuant to one or more plans under Rule 10b5-1 and/or Rule 10b-18 of the Exchange Act, and are subject to market and business conditions, levels of available liquidity, cash requirements for other purposes, regulatory, and other relevant factors. The timing, pricing, and size of share repurchases will depend on a number of factors, including, but not limited to, price, corporate and regulatory requirements, and general market and economic conditions. The repurchase program does not obligate us to repurchase any dollar amount or number of shares, and the program may be suspended or discontinued at any time, which may result in a decrease in the price of our Class A common stock.
Repurchases under our Share Repurchase Program will decrease the number of outstanding shares of our Class A common stock and therefore could affect the price of our Class A common stock and increase its volatility. The existence of our Share Repurchase Program could also cause the price of our Class A common stock to be higher than it would be in the absence of such a program and could reduce the market liquidity for our Class A common stock. Additionally, repurchases under our Share Repurchase Program will diminish our cash reserves, which could impact our ability to further develop our business and service our indebtedness. There can be no assurance that any share repurchases will enhance stockholder value because the market price of our Class A common stock may decline below the levels at which we repurchased such shares. Any failure to repurchase shares after we have announced our intention to do so may negatively impact our reputation and investor confidence in us and may negatively impact our Class A common stock price. Although our Share Repurchase Program is intended to enhance long-term stockholder value, short-term price fluctuations could reduce the program’s effectiveness.
General Risk Factors
We are unable to predict the extent to which the ongoing global COVID-19 pandemic may adversely impact our business operations, financial performance and results of operations.
For the past three years the COVID-19 pandemic and efforts to control its spread have resulted in, and may continue to or at a later time result in, significant disruptions to the global economy as well as businesses and capital markets around the world. Our operations have been and may continue to be materially adversely affected by a range of factors related to the COVID-19 pandemic that are not within our control, including the various restrictions imposed by cities, counties, states and countries on our employees, customers, partners and suppliers designed to limit the spread of COVID-19. The ultimate extent of the impact of the pandemic will depend on future developments that remain highly uncertain and cannot currently be predicted, including outbreaks of new variants and the availability and effectiveness of vaccines.
Our operations have been and may continue to be materially adversely affected by a range of factors related to the COVID-19 pandemic, including periodic changes in restrictions that vary from region to region in which we operate and may require rapid response to new or reinstated orders. Many of these orders resulted in, and, to the extent reinstated, may in the future result in changes to our on-site work policies and staffing and restrictions on the ability of consumers to buy and sell automobiles by restricting operations at dealerships and/or by closing or reducing the services provided by certain service providers upon which dealerships rely. In addition, these restrictions and continued concern about the spread of the disease have impacted car shopping by consumers and disrupted the operations of car dealerships, which has adversely affected and may continue to adversely affect the market for automobile purchases.
These effects from the COVID-19 pandemic on our revenue caused us to implement certain cost-savings measures across our business, which previously disrupted our business and operations. Any future cost-savings measures implemented by us due to macroeconomic issues, may affect our future business and operations and yield unintended consequences, such as loss of key employees, increased costs in hiring new employees, undesired attrition, and the risk that we may not achieve anticipated cost savings at the levels we expect, any of which may have a material adverse effect on our results of operations and/or financial condition.
We continue to monitor and assess the ongoing effects of the COVID-19 pandemic on our commercial operations, including the impact on our revenue. We cannot at this time accurately predict what effects these conditions will ultimately have on our operations or on the global economies and financial markets in which we operate, which may have a significant negative impact on our business, financial condition and results of operations.
31
We participate in a highly competitive market, and pressure from existing and new companies may adversely affect our business and operating results.
We face significant competition from companies that provide listings, car-shopping information, lead generation, marketing, wholesale, and digital car-buying and -selling services designed to help consumers and dealers shop for cars and to enable dealers to reach these consumers. Our competitors include include: online automotive marketplaces and websites,websites; internet search engines, digital marketing providers, peer to peer marketplaces,engines; peer-to-peer marketplaces; social media marketplaces; sites operated by automobile dealers,dealers; online dealerships; and online dealerships.vehicle auction companies. We compete with these and other companies for a share of dealers’ overall marketing budget for online and offline media marketing spend and we compete with these and other companies in attracting consumers to our websites. To the extent that dealers view alternative marketing and media strategies to be superior to our marketplaces, we may not be able to maintain or grow the number of dealers subscribing to, and advertising on, our marketplaces, and our business and financial results may be adversely affected. We also expect that new competitors will continue to enter the online automotive retail industryand wholesale industries with competing marketplaces, products, and services, and that existing competitors will expand to offer competing products or services, which could have an adverse effect on our business and financial results.
Our competitors could significantly impede our ability to expand the number of dealers using our marketplaces or could offer discounts that could significantly impede our ability to maintain our pricing structure. Our competitors may also develop and market new technologies that render our existing or future platforms and associated products less competitive, unmarketable, or obsolete. In addition, if our competitors develop platforms with similar or superior functionality to ours, or if our web traffic declines, we may need to decrease our subscription and advertising fees. If we are unable to maintain our current pricing structure due to competitive pressures, our revenue would likely be reduced and our financial results would be negatively affected.
Our Furthermore, our existing and potential competitors may have significantly more financial, technical, marketing, and other resources than we have, which may allow them to offer more competitive pricing and the ability to devote greater resources to the development, promotion, and support of their marketplaces, products, and services. They may also have more extensive automotive industry relationships than we have, longer operating histories, and greater name recognition. In addition, these competitors may be able to respond more quickly with technological advances and to undertake more extensive marketing or promotional campaigns than we can. To the extent that any competitor has existing relationships with dealers or auto manufacturers for marketing or data analytics solutions, those dealers and auto manufacturers may be unwilling to partner with us. If we are unable to compete with these competitors, the demand for our marketplaces and related products and services could substantially decline.
We rely on third-party service providers and strategic partners for many aspects of our business, and any failure to maintain these relationships or to successfully integrate certain third-party platforms could harm our business.
Our success depends upon our relationships with third parties, including, among others, our payment processor, our data center hosts, our information technology providers and our data providers for inventory and vehicle information. If these third parties experience difficulty meeting our requirements or standards, have adverse audit results, violate the terms of our agreements or applicable law, fail to obtain or maintain applicable licenses, or if the relationships we have established with such third parties expire or otherwise terminate, it could make it difficult for us to operate some aspects of our business, which could damage our business and reputation. In addition, if such third-party service providers or strategic partners were to cease operations, temporarily or permanently, face financial distress or other business disruptions, increase their fees, or if our relationships with these providers or partners deteriorate or terminate, whether as a result of the COVID-19 pandemic or otherwise, we could suffer increased costs and we may be unable to provide consumers with content or provide similar services until an equivalent provider could be found or we could develop replacement technology or operations. In addition, if we are unsuccessful in identifying or finding high-quality partners, if we fail to negotiate cost-effective relationships with them, or if we ineffectively manage these relationships, it could have an adverse impact on our business and financial results.
30
Our enterprise systems require that we integrate the platforms hosted by certain third-party service providers. We are responsible for integrating these platforms and updating them to maintain proper functionality. Issues with these integrations, our failure to properly update third-party platforms or any interruptions to our internal enterprise systems could harm our business by causing delays in our ability to quote, activate service and bill new and existing customers on our platform.
We must maintain proper and effective internal controlscontrol over financial reporting and any failure to maintain the adequacy of these internal controls may adversely affect investor confidence in our company and, as a result, the value of our Class A common stock.
We are required, pursuant to Section 404 and the related rules adopted by the SEC, to furnish a report by management on, among other things, the effectiveness of our internal control over financial reporting on an annual basis. This assessment includes disclosure of any material weaknesses identified by our management in our internal control over financial reporting. During the evaluation and testing process, if we identify and fail to remediate one or more material weaknesses in our internal control over financial reporting, we will be unable to assert that our internal controls are effective.
such as those described above. In addition, our independent registered public accounting firm must attest to the effectiveness of our internal control over financial reporting under Section 404. Our independent registered public accounting firm may issue a report that is adverse to us in the event it is not satisfied with the level at which our controls are documented, designed or operating. We may not be able to remediate the material weakness described above and/or any future material weaknesses that may be identified, or to complete our evaluation, testing and required remediation in a timely fashion. We are also required to disclose significant changes made to our internal control procedures on a quarterly basis. Our compliance with Section 404 requires that we incur substantial accounting expense and expend significant management efforts.
Any failure to maintain internal control over financial reporting could severely inhibit our ability to accurately report our financial condition or results of operations. If we are unable to assert that our internal control over financial reporting is effective or our independent registered public accounting firm is unable to express an opinion on the effectiveness of our internal control over financial reporting when it is required to issue such opinion, we could lose investor confidence in the accuracy and completeness of our financial reports, the market price of our Class A common stock could decline, and we could be subject to sanctions or investigations by Nasdaq, the SEC or other regulatory authorities. Failure to remedy the material weakness described above and/or any future material weaknesses that may be identified, or to implement or maintain other effective control systems required of public companies, could also restrict our future access to the capital markets.
We expect our results of operations to fluctuate on a quarterly and annual basis.
Our revenue and results of operations could vary significantly from period to period and may fail to match expectations as a result of a variety of factors, some of which are outside of our control, including the continued effects of the COVID-19 pandemic.pandemic and other macroeconomic issues, such as increased interest rates. Our results may vary as a result of fluctuations in the number of dealers subscribing to our marketplaces, and the size and seasonal variability of our advertisers’ marketing budgets.budgets, and the impact of vehicle arbitrations in a given period in connection with our IMCO product and the wholesale sale of automobiles. As a result of the potential variations in our revenue and results of operations, period-to-period comparisons may not be meaningful and the results of any one period should not be relied on as an indication of future performance. In addition, our results of operations may not meet the expectations of investors or public marketcovering analysts, who follow us, which may adversely affect the trading price of our Class A common stock.
32
We could be subject to adverse changes in tax laws, regulations and interpretations, plus challenges to our tax positions.
We are subject to taxation in the United States and certain other jurisdictions in which we operate. Changes in applicable tax laws or regulations may be proposed or enacted that could materially and adversely affect our effective tax rate, tax payments, results of operations, financial condition and cash flows. In addition, tax laws and regulations are complex and subject to varying interpretations. There is also uncertainty over sales tax liability as a result of therecent U.S. Supreme Court’s decision in South Dakota v. Wayfair, Inc.,Court and Massachusetts Supreme Court decisions, which could precipitate reactions by legislators, regulators and courts that could adversely increase our tax administrative costs and tax risk, and negatively affect our overall business, results of operations, financial condition and cash flows.We are also regularly subject to audits by tax authorities. For example, we are currently under federal employment tax audit for tax years 2016 – 2018; New York State sales and uses tax audit for tax years 2014 – 2020 and Ohio State commercial activity tax audit for tax years 2013 – 2019. Any adverse development or outcome in connection with theseany such tax audits, and any other audits or litigation, could materially and adversely impact our effective tax rate, tax payments, results of operations, financial condition and cash flows.
Confidentiality agreements may not adequately prevent disclosureThe Russian invasion of our trade secretsUkraine and the retaliatory measures imposed by the U.S., U.K., European Union and other proprietary information.countries and the responses of Russia to such measures have caused significant disruptions to domestic and foreign economies.
In order to protect our technologiesThe Russia and processes, we relyUkraine conflict had an immediate impact on the global economy resulting in part on confidentiality agreements with our employees, independent contractors,higher prices for oil and other advisors. These agreementscommodities, including vehicle components. Economic sanctions and bans, together with Russia's own retaliatory measures have disrupted supply chains and economic markets. The global impact of these measures is continually evolving and the future impact cannot be predicted with certainty. In particular, the Russia and Ukraine conflict has further impacted the ability of certain manufacturers to produce new vehicles and new vehicle parts, which may not effectively prevent disclosure of confidential information, including trade secrets, and may not provide an adequate remedyresult in the event of unauthorized disclosure of confidential information. To the extent that our employees, contractors, or other third parties with whom we do business use intellectual property owned by others in their work for us, disputes may arise ascontinued disruptions to the rightssupply of new and used vehicles. Further, there is no assurance that when the Russia and Ukraine conflict ends, countries will not continue to relatedimpose sanctions and bans.
While these events have not materially interrupted our operations, these or future developments resulting know-howfrom the Russia and inventions. In addition, any changes in,Ukraine conflict, such as a cyberattack on the U.S. or unexpected interpretationsour suppliers, could disrupt our operations, our customers' operations, or the activity of intellectual property laws may compromiseconsumers on our ability to enforce our trade secret and intellectual property rights. Costly and time-consuming litigation could be necessary to enforce and determine the scope of our proprietary rights, and failure to obtain or maintain protection of our trade secrets or other proprietary information could harm our business, results of operations, reputation, and competitive position.websites.
31
33
Item 1B. Unresolved Staff Comments.
Not applicable.
Item 2. Properties.
We do not own any real property. Our principal executive offices are located in Cambridge, Massachusetts where we lease a total of approximately 185,064 square feet of space in various parcels in three buildings.buildings with lease terms through 2033. We also lease office space in Addison, Texas, Dublin, Ireland, and San Francisco, California for our CarOffer, European and Autolist operations, respectively. We sublease two of our leased office spaces for part of the remaining terms of the leases. Our U.S. Marketplace segment utilizes the offices in Cambridge Massachusetts and San Francisco, California. Our Digital Wholesale segment utilizes the office in Addison, Texas. The Other category of segment reporting utilizes the office in Dublin, Ireland. We believe that our current facilities are suitable and adequate to meet our current needs. We believe that suitable additional space or substitute space will be available in the future to accommodate our operations as needed. In January 2021, CarOffer, LLC, our majority-owned subsidiary, entered into a sublease for office space at 15601 Dallas Parkway in Addison, Texas, which we expect CarOffer to occupy in March 2021 for its operations. In 2019, we entered into a lease for office space at 1001 Boylston Street in Boston, Massachusetts, which we expect to occupy in 2023.2024.
Item 3. Legal Proceedings.
From time to time we may become involved in legal proceedings or be subject to claims arising in the ordinary course of our business. We are not presently subject to any pending or threatened litigation that we believe, if determined adversely to us, would individually, or taken together, would reasonably be expected to have a material adverse effect on our business or financial results.
Item 4. Mine Safety Disclosures.
Not applicable.
3234
PART II
Item 5. Market for Registrant’s Common Equity, Related Stockholder Matters and Issuer Purchases of Equity Securities.
Market Information for Common Stock
Our Class A common stock has been listed on the Nasdaq Global Select Market under the symbol “CARG” since October 12, 2017. Prior to that date, there was no public trading market for our Class A common stock. Our initial public offering, or IPO, was priced at $16.00 per share on October 11, 2017.
On February 10, 2021,28, 2023, the last reported sale price of our Class A common stock on the Nasdaq Global Select Market was $35.61$17.05 per share.
Holders
Holders
As of February 4, 2021,21, 2023, we had 34six record holders of record of our Class A common stock. The actual number of stockholders is greater than this number of record holders, and includes stockholders who are beneficial owners but whose shares are held in street name by brokers and other nominees. The number of record holders of record does not include stockholders whose shares may be held in trust by other entities.
Dividends
Dividends
We have never declared or paid any cash dividends on our common stock. We currently anticipate that we will retain future earnings to fund development and growth of our business, and we do not anticipate paying cash dividends in the foreseeable future.
35
Performance Graph
This performance graph shall not be deemed “soliciting material” or to be “filed” with the Securities and Exchange Commission for purposes of Section 18 of the Securities Exchange Act of 1934, as amended, or the Exchange Act, or otherwise be subject to the liabilities under that section, and shall not be deemed to be incorporated by reference into any filing of CarGurus, Inc. under the Exchange Act or the Securities Act of 1933, as amended.
33
The following graph shows a comparison from October 12,December 31, 2017 (the date our Class A common stock commenced trading on the Nasdaq Global Select Market) through December 31, 20202022 of the cumulative total return for our Class A common stock, the Nasdaq Composite Index and the S&P 500 Index. On December 31, 2017, the last reported sale price of our Class A common stock on the Nasdaq Global Select Market was $29.98 per share. All values assume a $100 initial cash investment and data for the Nasdaq Composite Index and the S&P 500 Index assume reinvestment of dividends, if any. Such returns are based on historical results and are not intended to suggest future performance.
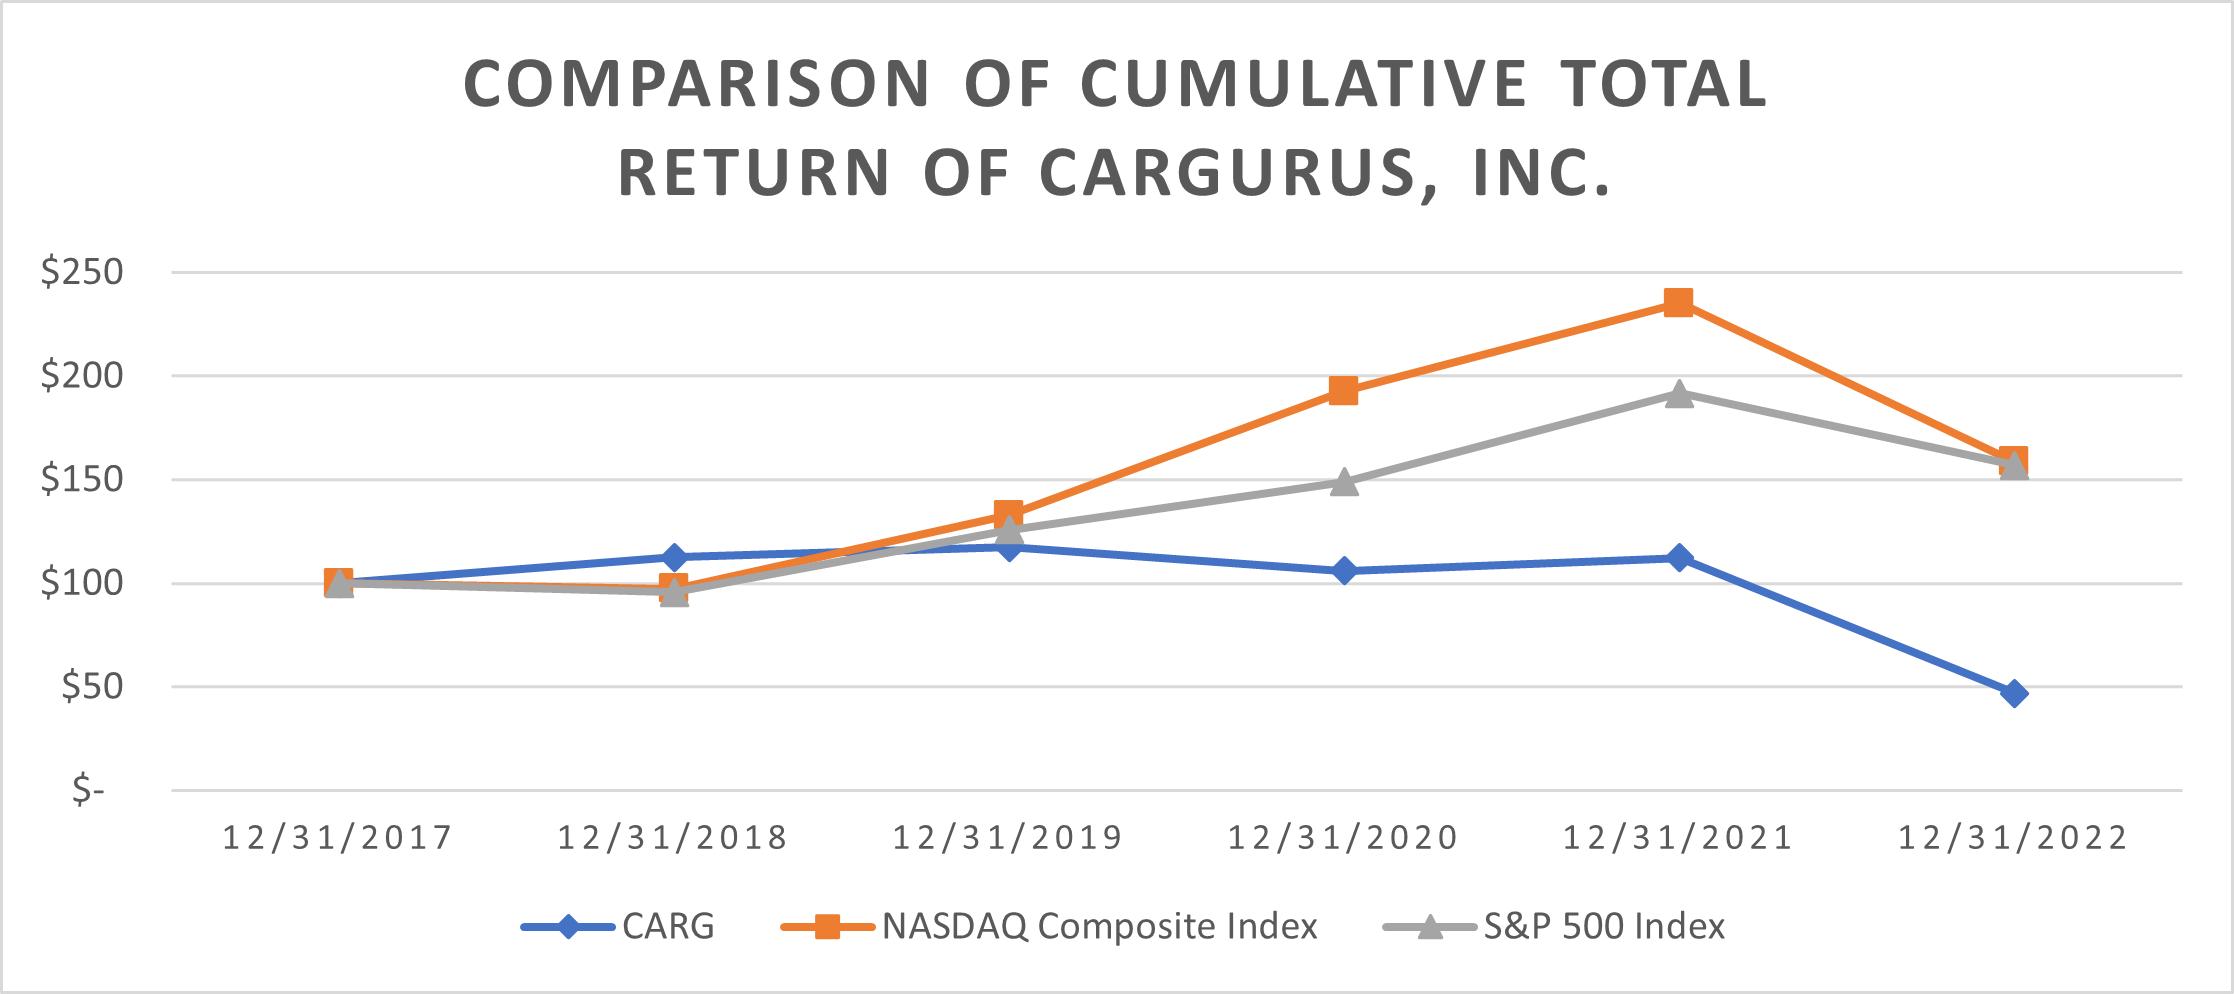

|
| 12/31/2017 |
|
| 12/31/2018 |
|
| 12/31/2019 |
|
| 12/31/2020 |
|
| 12/31/2021 |
|
| 12/31/2022 |
| ||||||
CARG |
|
| 100 |
|
|
| 113 |
|
|
| 117 |
|
|
| 106 |
|
|
| 112 |
|
|
| 47 |
|
S&P 500 Index |
|
| 100 |
|
|
| 96 |
|
|
| 126 |
|
|
| 149 |
|
|
| 192 |
|
|
| 157 |
|
Nasdaq Composite Index |
|
| 100 |
|
|
| 97 |
|
|
| 133 |
|
|
| 192 |
|
|
| 235 |
|
|
| 159 |
|
36
|
| 10/12/2017 |
|
| 12/31/2017 |
|
| 12/31/2018 |
|
| 12/31/2019 |
|
| 12/31/2020 |
| |||||
CARG |
|
| 100 |
|
|
| 109 |
|
|
| 122 |
|
|
| 128 |
|
|
| 115 |
|
S&P 500 Index |
|
| 100 |
|
|
| 105 |
|
|
| 101 |
|
|
| 132 |
|
|
| 157 |
|
Nasdaq Computer Index |
|
| 100 |
|
|
| 105 |
|
|
| 102 |
|
|
| 139 |
|
|
| 202 |
|
Recent Sales of Unregistered Securities
None.
Purchases of Equity Securities
None.The following table summarizes information about our purchases of our equity securities for each of the months during the year ended December 31, 2022:
Period |
| Total Number of Shares of Common Stock Purchased |
|
| Weighted Average Price Paid per Share of Common Stock(1) |
|
| Total Number of Shares of Common Stock Purchased as Part of Publicly Announced Plans or Programs(2)(3) |
|
| Maximum Approximate Dollar Value of Shares of Common Stock that May Yet be Purchased Under the Plans or Programs |
| ||||
December 1, 2022 through December 31, 2022 |
|
| 1,350,473 |
|
| $ | 13.84 |
|
|
| 1,350,473 |
|
| $ | 231,309 |
|
Total |
|
| 1,350,473 |
|
| $ | 13.84 |
|
|
| 1,350,473 |
|
|
|
| |
Item 6. Selected Consolidated Financial Data.Reserved.
Not applicable.
3437
Item 7. Management’s Discussion and Analysis of Financial Condition and Results of Operations.
You should read the following discussion and analysis of our financial condition and results of operations together with our consolidated financial statements and the related notes and other financial information included elsewhere in this report. Some of the information contained in this discussion and analysis or elsewhere in this report,Annual Report on Form 10-K, including information with respect to our plans and strategy for our business and our performance and future success, includes forward‑looking statements that involve risks and uncertainties. See “Special Note Regarding Forward-Looking Statements.” You should review the “Risk Factors” section of this Annual Report on Form 10-K for a discussion of important factors that could cause actual results to differ materially from the results described in or implied by the forward‑looking statements contained in the following discussion and analysis.
In this discussion, we use financial measures that are considered non‑GAAP financial measures under Securities and Exchange Commission rules. These rules regarding non-GAAP financial measures require supplemental explanation and reconciliation, which are included elsewhere in this Annual Report on Form 10-K. Investors should not consider non‑GAAP financial measures in isolation from or in substitution for, financial information presented in compliance with United States generally accepted accounting principles, or GAAP.
This section of this Annual Report on Form 10-K discusses 20202022 and 20192021 items and year-to-year comparisons between 2022 and 2021. This section of this Annual Report on Form 10-K also discusses 2021 and 2020 segment revenue and 2019.segment operating income (loss) from operations and year-to-year comparisons between 2021 and 2020 segment revenue and segment operating income (loss) from operations. Discussions of 2018all other 2020 items and year-to-year comparisons between 20192021 and 20182020 can be found in “Management’s Discussion and Analysis of Financial Condition and Results of Operations” in Part II, Item 7 of our Annual Report on Form 10-K for the fiscal year ended December 31, 2019.2021. The period‑to‑period comparison of financial results is not necessarily indicative of future results.
Company Overview
CarGurus, Inc. is a global,multinational, online automotive platform for buying and selling vehicles that is building upon its industry-leading listings marketplace connecting buyerswith both digital retail solutions and sellers of newthe CarOffer digital wholesale platform. The CarGurus platform gives consumers the confidence to buy and/or sell a vehicle either online or in-person, and used cars. Usingit gives dealerships the power to accurately price, instantly acquire, effectively market, and quickly sell vehicles, all with a nationwide reach. We use proprietary technology, search algorithms and innovative data analytics we believe we are buildingto bring trust, transparency and competitive pricing to the world’s most trusted and transparent automotive marketplace and creating a differentiated automotive search experience for consumers. Our trusted marketplace empowers consumers with unbiased third‑party validation on pricing and dealer reputation as well as other information that aids them in finding “Great Deals from Top-Rated Dealers.”shopping experience.
We are headquartered in Cambridge, Massachusetts and were incorporated in the State of Delaware on June 26, 2015.
We operate principally in the United States. In the United States, we also operate as independent brands the Autolist online marketplace, which we wholly own, and CarOffer digital wholesale marketplace, in which we hold a 51% equity interest. In addition to the United States, we operate online marketplaces under the CarGurus brand in Canada and the United Kingdom. We also operated online marketplaces in Germany, Italy, and Spain until we ceased the operations of each of these marketplaces in the second quarter of 2020. In the United States and the United Kingdom, we also operate as an independent brand the Autolist and PistonHeads online marketplaces, respectively, as independent brands. marketplace, which we wholly own.
We have subsidiaries in the United States, Canada, Ireland, and the United Kingdom. Additionally,Kingdom and, prior to the first quarter of 2022, we havehad two reportable segments – United States and International. Effective as of the first quarter of 2022, we revised our segment reporting from two reportable segments to one reportable segment. Effective as of the fourth quarter of 2022, we revised our segment reporting from one reportable segment to two reportable segments – U.S. Marketplace and Digital Wholesale. See Note 1413 of ourthe consolidated financial statements included elsewhere in this Annual Report on Form 10-K for more information on ourfurther segment reporting and geographical information.
We derive our revenue from marketplace revenue, wholesale revenue, and product revenue. Marketplace revenue is included in the U.S. Marketplace segment and Other category of segment reporting. Wholesale revenue and product revenue are included in the Digital Wholesale segment. We generate marketplace subscriptionrevenue primarily from (i) dealer subscriptions to our Listings packages, Real-time Performance Marketing, or RPM, digital advertising suite, and Digital Retail, (ii) advertising revenue from dealers primarily through Listings and Dealer Display subscriptions, and advertising and other revenue from automobileauto manufacturers and other auto‑related brand advertisers, as well asand (iii) revenue from partnerships with financing services companiescompanies. We generate wholesale revenue primarily from (i) transaction fees earned from facilitating the purchase and sale of vehicles between dealers, or Dealer-to-Dealer transactions, (ii) transaction fees earned from sale of vehicles to dealers that we acquire at other marketplaces, and (iii) transaction fees earned from performing inspection and transportation services, inclusive of Dealer-to-Dealer transactions, other marketplace to dealer transactions, and IMCO transactions (as defined below). We generate product revenue primarily from (i) aggregate proceeds received from the sale of vehicles to dealers that were acquired directly from customers, or CarGurus Instant Max Cash Offer, or IMCO transactions, and (ii) proceeds received from the sale of vehicles that were acquired through arbitration.
We38
For the year ended December 31, 2022, we generated revenue of $551.5$1,655.0 million, in 2020 and $588.9a 74% increase from $951.4 million in 2019, representing a year-over-year decrease of 6%.revenue for the year ended December 31, 2021.
In 2020,For the year ended December 31, 2022, we generated consolidated net income of $77.6$79.0 million and ourConsolidated Adjusted EBITDA was $160.8of $187.7 million, compared to aconsolidated net income of $42.1$110.4 million and Consolidated Adjusted EBITDA of $270.3 million for the year ended December 31, 2021.
See “Consolidated Adjusted EBITDA, Adjusted EBITDA, and Adjusted EBITDA of $77.0 million in 2019. See “Adjusted EBITDA”attributable to redeemable noncontrolling interest” below for more information regarding our use of Adjusted EBITDA,, a non-GAAP financial measure, and a reconciliation of Adjusted EBITDA to our consolidated net income.
COVID-19 Update
In December 2019, a novel strain of coronavirus, now referredFor the past three years, the COVID-19 pandemic and efforts to as COVID-19, surfaced and in 2020 was declared a pandemic by the World Health Organization after spreading globally. This pandemic has caused an international health crisis andcontrol its spread have resulted in significant disruptions to the global economy as well as businesses and capital markets around the world. The ultimate extent of the impact of the pandemic will depend on future developments that remain highly uncertain and cannot currently be predicted, including outbreaks of new variants and the availability and effectiveness of vaccines.
TheOur operations have been affected by a range of factors related to the COVID-19 pandemic, including periodic changes in restrictions that vary from region to region in which we operate and its adverse effects have become widespread in the locations where we, and our customers, suppliers and third-party business partners conduct business and as a result, we have experienced disruptions in our operations. For example, in March 2020, we closed all of our offices (including our corporate headquarters) and began requiring our employeesmay require rapid response to work remotely until further notice. In addition, in an effort to limit the spread of COVID-19, many countries, as well as states and localities in the United States, implementednew or mandated and continue to implement or mandate significant restrictions on travel and commerce, shelter-in-place or stay-at-home orders, and business closures.reinstated orders. Many
35
of these orders resulted in changes to our on-site work policies and staffing and restrictions on the ability of consumers to buy and sell automobiles by restricting operations at dealerships and/or by closing or reducing the services provided by certain service providers upon which dealerships rely.In addition, these restrictions and continued concern about the spread of the disease have impacted car shopping by consumers and disrupted the operations of car dealerships, which has adversely affected the market for automobile purchases. While consumer demand has improved since the initial impact of the COVID-19 pandemic, the automotive industry is experiencing, and may continue to experience, inventory supply problems, especially resulting from wholesale used-car auction closures and escalating auction prices, which have adversely affected the level of used-car inventory held by our paying dealers and displayed on our websites.
As a result of the travel and commerce restrictions and the impact on their businesses, for periods during the year ended December 31, 2020 a number of our dealer customers temporarily closed or operated on a reduced capacity, and many dealerships remain temporarily closed, continue to operate on a reduced capacity, and/or otherwise face significant financial challenges.Such closures and circumstances led some paying dealers to cancel their subscriptions and/or reduce their spending with us, which has had and may continue to have a material adverse effect on our revenues and our business. We also experienced an increase in account delinquencies from dealer customers challenged by the COVID-19 pandemic that failed to pay us on time or at all.
Further, because of the significant financial challenges that dealerships have faced and continue to face as a result of the COVID-19 pandemic, we took measures to help our paying dealers maintain their business health during the COVID-19 pandemic. We proactively reduced the subscription fees for paying dealers by at least 50% on all marketplace subscriptions for the April and May 2020 service periods, as well as provided a fee reduction on all June 2020 marketplace subscriptions of 20% for paying dealers in the United States and Canada and 50% for paying dealers in the United Kingdom. These fee reductions resulted in a modification to contracts with initial contractual periods greater than one month. For any contract modified, we calculated the remaining transaction price and allocated the consideration over the remaining performance obligations. These fee reductions materially and adversely impacted revenue for the year ended December 31, 2020, resulting in an approximately $50 million decrease in marketplace subscription revenue. During the December 2020 and February 2021 service periods, we also suspended charging subscription fees for subscribing dealers in the United Kingdom. These fee reductions did not materially impact revenue for the year ended December 31, 2020 and are not expected to materially impact revenue for the year ending December 31, 2021. We continue to monitor and assess the effects of the COVID-19 pandemic on our paying dealers and may in the future take additional measures to help our paying dealers maintain their business health during the COVID-19 pandemic.
These effects from the COVID-19 pandemic on our revenue caused us to implement certain cost-savings measures across our business. For example, during the second quarter of 2020, we initiated a cost-savings initiative that included a reduction in our workforce of approximately 13%, restricted future hiring, and limited discretionary spend acrossbusiness, which previously disrupted our business including by eliminating, reducing or pausing certain vendor relationships and ceasing certain international operations and expansion efforts. operations.In particular, we ceased marketplace operations in Germany, Italy, and Spain, and halted any new international expansion efforts, which we believe allows us to focus our financial and human capital resources on our more established international markets in Canada and the United Kingdom. We also reduced consumer marketing across both algorithmic traffic acquisition and brand spend during the year ended December 31, 2020 in comparison to the year ended December 31, 2019 in an effort to reduce expenses and as a result of suppressed dealer inventory and the resulting reduced demand for leads by dealers.
In May 2020, cancellations by paying dealers began to stabilize, which we believe resulted from the resumption of consumer activity as well as the fee reductions that we provided to our customers. In July 2020, we returned to normal contractual billings in all markets until subscription fees were reduced again for the December 2020 and February 2021 service periods for paying dealers in the United Kingdom. Additionally, we increased our consumer marketing expenses as consumer activity increased and governments began to implement phased re-opening policies.
We continue to monitor and assess the ongoing effects of the COVID-19 pandemic on our commercial operations, including the future impact on our revenue. However, we cannot at this time accurately predict what effects these conditions will ultimately have on our future revenue and operations. See the “Risk Factors” section of this Annual Report on Form 10-K for further discussion of the impacts of the COVID-19 pandemic on our business.
Key Business Metrics
We regularly review a number of metrics, including the key metrics listed below, to evaluate our business, measure our performance, identify trends affecting our business, formulate financial projections, and make operating and strategic decisions. We believe it is important to evaluate these metrics for the United States and International segments.geographic regions. The
36
International segmentregion derives revenues from marketplace subscriptions, advertising services, and other revenuesrevenue from customers outside of the United States. International markets perform differently from the United States market due to a variety of factors, including our operating history in each market, our rate of investment, market size, market maturity, competition and other dynamics unique to each country.
39
Monthly Unique Users
For each of our websites (excluding the CarOffer website), we define a monthly unique user as an individual who has visited any such website within a calendar month, based on data as measured by Google Analytics. We calculate average monthly unique users as the sum of the monthly unique users of each of our websites in a given period, divided by the number of months in that period. We count a unique user the first time a computer or mobile device with a unique device identifier accesses any of our websites during a calendar month. If an individual accesses a website using a different device within a given month, the first access by each such device is counted as a separate unique user. If an individual uses multiple browsers on a single device and/or clears their cookies and returns to our site within a calendar month, multiple users would be recorded.each such visit is counted as a separate unique user. We view our average monthly unique users as a key indicator of the quality of our user experience, the effectiveness of our advertising and traffic acquisition, and the strength of our brand awareness. Measuring unique users is important to us and we believe it provides useful information to our investors because our marketplace subscription revenue depends, in part, on our ability to provide dealers with connections to our users and exposure to our marketplace audience. We define connections as interactions between consumers and dealers on our marketplace through phone calls, email, managed text and chat, and clicks to access the dealer’s website or map directions to the dealership.
|
| Year Ended December 31, |
| |||||
Average Monthly Unique Users |
| 2020 |
|
| 2019 |
| ||
|
| (in thousands) |
| |||||
United States |
|
| 36,228 |
| (1) |
| 36,804 |
|
International |
|
| 8,335 |
|
|
| 10,353 |
|
Total |
|
| 44,563 |
|
|
| 47,157 |
|
|
| |||||||||||||||||||||||||||||||||||||||||||||||||||||||||||||||
Monthly Sessions
We define monthly sessions as the number of distinct visits to our websites (excluding the CarOffer website) that take place each month within a given time frame, as measured and defined by Google Analytics. We calculate average monthly sessions as the sum of the monthly sessions in a given period, divided by the number of months in that period. A session is defined as beginning with the first page view from a computer or mobile device and ending at the earliest of when a user closes their browser window, after 30 minutes of inactivity, or each night at midnight (i) Eastern Time for our United States and Canada websites, other than the Autolist website, (ii) Pacific Time for the Autolist website, and (iii) Greenwich Mean Time for our U.K. websites, and (iv) Central European Time (or Central European Summer Time when daylight savings is observed) for our Germany, Italy, and Spain websites, which ceased operations in the second quarter of 2020.websites. A session can be made up of multiple page views and visitor actions, such as performing a search, visiting vehicle detail pages, and connecting with a dealer. We believe that measuring the volume of sessions in a time period, when considered in conjunction with the number of unique users in that time period, is an important indicator to us of consumer satisfaction and engagement with our marketplace, and we believe it provides useful information to our investors because the more satisfied and engaged consumers we have, the more valuable our service is to dealers.
|
| Year Ended December 31, |
| |||||
Average Monthly Sessions |
| 2020 |
|
| 2019 |
| ||
|
| (in thousands) |
| |||||
United States |
|
| 90,909 |
| (1) |
| 99,412 |
|
International |
|
| 19,326 |
|
|
| 24,955 |
|
Total |
|
| 110,235 |
|
|
| 124,367 |
|
|
|
37
|
| Year Ended December 31, |
| |||||
Average Monthly Sessions |
| 2022 |
|
| 2021 |
| ||
|
| (in thousands) |
| |||||
United States |
|
| 77,724 |
|
|
| 79,316 |
|
International |
|
| 15,219 |
|
|
| 17,309 |
|
Total |
|
| 92,943 |
|
|
| 96,625 |
|
Number of Paying Dealers
We define a paying dealer as a dealer account with an active, paid marketplace subscription at the end of a defined period. The number of paying dealers we have is important to us and we believe it provides valuable information to investors because it is indicative of the value proposition of our marketplace products, as well as our sales and marketing success and opportunity, including our ability to retain paying dealers and develop new dealer relationships.
|
| As of December 31, |
|
| As of December 31, |
| ||||||||||
Number of Paying Dealers |
| 2020 |
|
| 2019 (2) |
|
| 2022 |
|
| 2021 |
| ||||
United States |
|
| 23,934 |
| (1) |
| 26,289 |
|
|
| 24,567 |
|
|
| 23,860 |
|
International |
|
| 6,697 |
|
|
| 7,329 |
|
|
| 6,740 |
|
|
| 6,770 |
|
Total |
|
| 30,631 |
|
|
| 33,618 |
|
|
| 31,307 |
|
|
| 30,630 |
|
40 Transactions We define Transactions within the Digital Wholesale segment as the number of vehicles processed from car dealers, consumers, and other marketplaces through the CarOffer website within the applicable period. Transactions consists of each unique vehicle (based on vehicle identification number) that reaches "sold and invoiced" status on the CarOffer website within the applicable period, including vehicles sold to car dealers, vehicles sold at third-party auctions, vehicles ultimately sold to a different buyer, and vehicles that are returned to their owners without completion of a sale transaction. We exclude vehicles processed within CarOffer's intra-group trading solution (Group Trade) from the definition of Transactions, and we only count any unique vehicle once even if it reaches sold status multiple times. Digital Wholesale includes Dealer-to-Dealer Transactions and IMCO Transactions. We view Transactions as a key business metric, and we believe it provides useful information to investors, because it provides insight into growth and revenue for the Digital Wholesale segment. Transactions drive a significant portion of Digital Wholesale segment revenue. We believe growth in Transactions demonstrates consumer and dealer utilization and our market share penetration in the Digital Wholesale segment.
|
| ||||||||||||||||||||||||||||||||||||
|
|
Quarterly Average Revenue per Subscribing Dealer (QARSD)
WeWe define QARSD, which is measured at the end of a fiscal quarter, as the marketplace subscription revenue primarily from subscriptions to our Listings packages and RPM digital advertising suite during that trailing quarter divided by the average number of paying dealers in that marketplace during the quarter. We calculate the average number of paying dealers for a period by adding the number of paying dealers at the end of such period and the end of the prior period and dividing by two. This information is important to us, and we believe it provides useful information to investors, because we believe that our ability to grow QARSD is an indicator of the value proposition of our products and the return on investment, or ROI, that our paying dealers realize from our products. In addition, increases in QARSD, which we believe reflect the value of exposure to our engaged audience in relation to subscription cost, are driven in part by our ability to grow the volume of connections to our users and the quality of those connections, which result in increased opportunity to upsell package levels and cross-sell additional products to our paying dealers.
|
| At December 31, |
|
| As of December 31, |
| ||||||||||
Quarterly Average Revenue per Subscribing Dealer (QARSD) |
| 2020 |
|
| 2019 |
|
| 2022 |
|
| 2021 |
| ||||
United States |
| $ | 5,304 |
|
| $ | 5,016 |
|
| $ | 5,842 |
|
| $ | 5,633 |
|
International |
| $ | 1,060 |
|
| $ | 1,265 |
|
| $ | 1,522 |
|
| $ | 1,546 |
|
Consolidated |
| $ | 4,382 |
|
| $ | 4,215 |
|
| $ | 4,921 |
|
| $ | 4,731 |
|
Consolidated Adjusted EBITDA, Adjusted EBITDA, and Adjusted EBITDA attributable to redeemable noncontrolling interest
To provide investors with additional information regarding our financial results, we monitor and have presented within this Annual Report, on Form 10-KConsolidated Adjusted EBITDA, Adjusted EBITDA, and Adjusted EBITDA attributable to redeemable noncontrolling interest, each of which is a non‑GAAP financial measure. Thismeasures. These non‑GAAP financial measure ismeasures are not based on any standardized methodology prescribed by United States generally accepted accounting principles, or GAAP, and isare not necessarily comparable to any similarly titled measures presented by other companies.
We define Consolidated Adjusted EBITDA as consolidated net income, adjusted to exclude: depreciation and amortization, impairment of long-lived assets, stock‑based compensation expense, acquisition-related expenses, restructuring expenses, other income, net, and the provision for (benefit from)income taxes.
We define Adjusted EBITDA as Consolidated Adjusted EBITDA adjusted to exclude Adjusted EBITDA attributable to redeemable noncontrolling interest.
We define Adjusted EBITDA attributable to redeemable noncontrolling interest as net (loss) income attributable to redeemable noncontrolling interest, adjusted to exclude: depreciation and amortization, impairment of long-lived assets, stock‑based compensation expense, other expense (income), net, and provision for income taxes. These exclusions are adjusted for redeemable noncontrolling interest of 38% by taking the noncontrolling interest's full financial results and multiplying each line item in the reconciliation by 38%. We note that we use 38%, versus 49%, to allocate the share of income (loss) because it represents the portion attributable to the redeemable noncontrolling interest. The 38% is exclusive of CO Incentive Units, Subject Units, and 2021 Incentive Units (as each term is defined in Note 2 to our consolidated financial statements appearing elsewhere in this Annual Report on Form 10-K) liability classified awards which do not participate in the share of income/(loss).
41
We have presented Consolidated Adjusted EBITDA and Adjusted EBITDA within this Annual Report, on Form 10-K because it is athey are key measuremeasures used by our management and board of directors to understand and evaluate our operating performance, generate future operating plans, and make strategic decisions regarding the allocation of capital. In particular, we believe that the exclusion of certain items in calculating Consolidated Adjusted EBITDA and Adjusted EBITDA can produce a useful measure for period‑to‑period comparisons of our business. We have presented Adjusted EBITDA attributable to redeemable noncontrolling interest because it is used by our management to reconcile Consolidated Adjusted EBITDA to Adjusted EBITDA. It represents the portion of Consolidated Adjusted EBITDA that is attributable to our noncontrolling interest. Adjusted EBITDA attributable to redeemable noncontrolling interest is not intended to be reviewed on its own.
We use Consolidated Adjusted EBITDA and Adjusted EBITDA to evaluate our operating performance and trends and make planning decisions. We believe Consolidated Adjusted EBITDA helpsand Adjusted EBITDA help identify underlying trends in our business that could otherwise be masked by the effect of the expenses that we exclude. Accordingly, we believe that Consolidated Adjusted EBITDA providesand Adjusted EBITDA provide useful information to investors and others in understanding and evaluating our operating results, enhancing the overall understanding of our past performance and future prospects, and allowing for greater transparency with respect to key financial metrics used by our management in its financial and operational decision‑making. In addition, we evaluate ourWe use Adjusted EBITDA in relationattributable to redeemable noncontrolling interest to reconcile Consolidated Adjusted EBITDA to Adjusted EBITDA. It enables an investor to gain a clearer understanding of the portion of Consolidated Adjusted EBITDA that is attributable to our revenue. We refer to this asnoncontrolling interest.
Our Consolidated Adjusted EBITDA, margin and define it as Adjusted EBITDA, divided by total revenue.
38
Ourand Adjusted EBITDA isattributable to redeemable noncontrolling interest, are not prepared in accordance with GAAP, and should not be considered in isolation of, or as an alternative to, measures prepared in accordance with GAAP. There are a number of limitations related to the use of Consolidated Adjusted EBITDA, Adjusted EBITDA, and Adjusted EBITDA attributable to redeemable noncontrolling interest rather than consolidated net income and net (loss) income attributable to redeemable noncontrolling interest, respectively, which isare the most directly comparable GAAP equivalent.equivalents. Some of these limitations are:
|
|
|
|
|
|
|
|
|
|
|
|
|
|
42
TheFor the years ended December 31, 2022 and 2021, the following table presents a reconciliation of Consolidated Adjusted EBITDA and Adjusted EBITDA to consolidated net income, the most directly comparable measure calculated in accordance with GAAP for each of the periods presented.
|
| Year Ended December 31, |
| |||||
|
| 2022 |
|
| 2021 |
| ||
|
| (in thousands) |
| |||||
Reconciliation of Consolidated Adjusted EBITDA and Adjusted EBITDA: |
|
|
|
|
|
| ||
Consolidated net income |
| $ | 78,954 |
|
| $ | 110,373 |
|
Depreciation and amortization |
|
| 45,334 |
|
|
| 40,476 |
|
Impairment of long-lived assets |
|
| 165 |
|
|
| 3,128 |
|
Stock-based compensation expense |
|
| 33,682 |
|
|
| 77,710 |
|
Acquisition-related expenses |
|
| — |
|
|
| 709 |
|
Other income, net |
|
| (2,884 | ) |
|
| (1,092 | ) |
Provision for income taxes |
|
| 32,408 |
|
|
| 38,987 |
|
Consolidated Adjusted EBITDA |
|
| 187,659 |
|
|
| 270,291 |
|
Adjusted EBITDA attributable to redeemable noncontrolling interest |
|
| 1,006 |
|
|
| 20,784 |
|
Adjusted EBITDA |
| $ | 186,653 |
|
| $ | 249,507 |
|
For the years ended December 31, 2022 and 2021, the following table presents a reconciliation of Adjusted EBITDA attributable to redeemable noncontrolling interest to net (loss) income attributable to redeemable noncontrolling interest, the most directly comparable measure calculated in accordance with GAAP, for each of the periods presented.
|
| Year Ended December 31, |
| |||||
|
| 2022 |
|
| 2021 |
| ||
|
| (in thousands) |
| |||||
Reconciliation of Adjusted EBITDA attributable to redeemable noncontrolling interest: |
|
|
|
|
|
| ||
Net (loss) income attributable to redeemable noncontrolling interest |
| $ | (5,433 | ) |
| $ | 1,129 |
|
Depreciation and amortization (1) |
|
| 11,702 |
|
|
| 10,827 |
|
Impairment of long-lived assets (1) |
|
| 63 |
|
|
| — |
|
Stock-based compensation expense (1) |
|
| (7,312 | ) |
|
| 8,410 |
|
Other expense, net (1) |
|
| 2,007 |
|
|
| 231 |
|
(Benefit from) provision for income taxes (1) |
|
| (21 | ) |
|
| 187 |
|
Adjusted EBITDA attributable to redeemable noncontrolling interest |
| $ | 1,006 |
|
| $ | 20,784 |
|
|
| Year Ended December 31, |
| |||||
|
| 2020 |
|
| 2019 |
| ||
|
| (in thousands) |
| |||||
Reconciliation of Adjusted EBITDA: |
|
|
|
|
|
|
|
|
Net income |
| $ | 77,553 |
|
| $ | 42,146 |
|
Depreciation and amortization |
|
| 11,342 |
|
|
| 7,817 |
|
Stock-based compensation expense |
|
| 45,321 |
|
|
| 34,301 |
|
Acquisition-related expenses |
|
| 2,906 |
|
|
| 549 |
|
Restructuring expenses (1) |
|
| 3,514 |
|
|
| — |
|
Other income, net |
|
| (1,354 | ) |
|
| (4,383 | ) |
Provision for (benefit from) income taxes |
|
| 21,557 |
|
|
| (3,441 | ) |
Adjusted EBITDA |
| $ | 160,839 |
|
| $ | 76,989 |
|
|
|
Components of Consolidated Income Statements
Revenue
We derive our revenue from two sources: (1) marketplace subscription revenue, which consistswholesale revenue, and product revenue. Marketplace revenue is included in the U.S. Marketplace segment and Other category of segment reporting. Wholesale revenue and product revenue are included in the Digital Wholesale segment. We generate marketplace revenue primarily offrom (i) dealer subscriptions to our Listings packages, RPM, digital advertising suite, and Dealer Display subscriptions, and (2) advertising and other revenue, which consists primarily of displayDigital Retail, (ii) advertising revenue from auto manufacturers and other auto‑related brand advertisers, as well asand (iii) revenue from partnerships with financing services companies. We generate wholesale revenue primarily from (i) transaction fees earned from Dealer-to-Dealer transactions, (ii) transaction fees earned from sale of vehicles to dealers that we acquire at other marketplaces, and (iii) transaction fees earned from performing inspection and transportation services, inclusive of Dealer-to-Dealer transactions, other marketplace to dealer transactions, and IMCO transactions. We generate product revenue primarily from (i) aggregate proceeds received from the sale of vehicles that were acquired through IMCO transactions, and (ii) proceeds received from the sale of vehicles that were acquired through arbitration.
3943
Marketplace Subscription Revenue
We offer multiple types of marketplace Listings packages to our dealers throughfor our CarGurus U.S. platform (availability varies on our other marketplaces): Restricted Listings, (formerly referred to as Basic Listings), which is free; and various levels of Listings packages, which each require a paid subscription under a monthly, quarterly, semiannual, or annual subscription basis.
Our subscriptions for customers generally auto-renew on a monthly basis and are cancellable by dealers with 30 days’days' advance notice atprior to the endcommencement of the committed term, although during the second quarter of 2020 we did not require 30 days’ advance notice of termination from dealers who cancelled as a result of the COVID-19 pandemic.applicable renewal term. Subscription pricing is determined based on a dealer’s inventory size, region, and our assessment of the connections and ROIreturn on investment ("ROI") the platform will provide them and is subject to discounts and/or fee reductions that we may offer from time to time. We also offer all dealers on ourthe platform access to our Dealer Dashboard, which includes a performance summary, Dealer Insights tool, and user review management platform. Only dealers subscribing to a paid Listings package also have access to the Pricing Tool, Market Analysis tool and our IMV Scan tool.
We offer paid Listings packages for the Autolist and PistonHeads websites.
In addition to displaying inventory in our marketplace and providing access to the Dealer Dashboard, we offer dealers subscribing to certain of our Listings packages other subscription advertising and customer acquisition products and enhancements including Dealer Display, which is marketed under our Real-time Performance MarketingRPM digital advertising suite. With Dealer Display,Through RPM, dealers can buy display advertising that appears in our marketplace, on other sites on the internet, and/ and/or on Facebook, a highly convertinghigh-converting social platform.media platforms. Such advertisements can be targeted by the user’s geography, search history, CarGurus website activity (including showing a consumer relevant vehicles from a dealer’s inventory that the consumer has not yet discovered on our marketplace), and a number of other targeting factors, allowing dealers to increase their visibility with in-market consumers and drive qualified traffic for dealers.
We also offer paid Listings packages for the Autolist website and paid Listings and displaydealer advertising products for the PistonHeads website.
As a resultWe also offer dealers subscribing to certain of our Listings packages other subscription advertising and customer acquisition products and enhancements such as Digital Retail, which allows shoppers to complete much of the COVID-19 pandemic, we experiencedvehicle-purchase process online through the Dealers’ Listings page. Digital Retail is comprised of (i) the Digital Deal Platform, which gives dealers higher quality leads through upfront consumer-provided information, (ii) Area Boost/Geo Expansion, which expands the visibility of a material adverse impact on our marketplace revenue as paying dealers cancelled their subscriptions with us (including, in some cases, with our permission prior to the end of the applicable contract term and notice period) and due to the fee reductions that we provided to customers for the April, May and June service periods in response to the COVID-19 pandemic, which resulted in reductionsdealer’s inventory in the overall transaction price. In May 2020, cancellations by paying dealers began to stabilize,search results beyond its local market, and (iii) Hard Pull Financing, which we believe resulted from the resumptionprovides loan information.
Marketplace revenue also consists of consumer activity as well as the fee reductions that we provided to our customers. In July 2020, we returned to normal contractual billings in all markets until subscription fees were reduced again for the December 2020 and February 2021 service periods for paying dealers in the United Kingdom.
Advertising and Other Revenue
Advertising and other revenue consists primarily of non-dealer display advertising revenue from auto manufacturers and other auto-related brand advertisers sold on a cost per thousand impressions, or CPM basis. An impression is an advertisement loaded on a web page. In addition to advertising sold on a CPM basis, we also have advertising sold on a cost per click basis, or CPC basis. Pricing is primarily based on advertisement size and position on our websites and mobile applications. Auto manufacturers and other brand advertisers can execute advertising campaigns that are targeted across a wide variety of parameters, including demographic groups, behavioral characteristics, specific auto brands, categories such as Certified Pre-Owned, and segments such as hybrid vehicles. We do not provide minimum impression guarantees or other types of minimum guarantees in our contracts with customers. Advertising is also sold indirectly through revenue sharing arrangements with advertising exchange partners.
AdvertisingWe also offer non-dealer advertising products for the Autolist and otherPistonHeads websites.
Marketplace revenue also includes revenue from partnerships with certain financing services companies pursuant to which we enable eligible consumers on our CarGurus U.S. website to pre-qualify for financing on cars from dealerships that offer financing through such companies. We primarily generate revenue from these partnerships based on the number of funded loans from consumers who pre-qualify with our lending partners through our site.
Wholesale Revenue
The Buying Matrix on the CarOffer platform enables buying dealers to create standing buy orders and provides instant offers to selling dealers. Wholesale revenue includes transaction fees earned from Dealer-to-Dealer transactions, where we collect fees from both the buying and selling dealers. We also offer non-dealer display products forsell vehicles to dealers that we acquire at other marketplaces, where we collect a transaction fee from the Autolistbuying dealers.
Wholesale revenue also includes fees earned from performing inspection and PistonHeads websites.transportation services, where we collect fees from the buying dealer. Inspection and transportation service revenue is inclusive of Dealer-to-Dealer transactions, other marketplace to dealer transactions, and IMCO transactions.
As44
Wholesale revenue also includes arbitration in which the vehicle is rematched to a result ofnew buyer and not acquired by us. Arbitration is the COVID-19 pandemic, we experienced a material adverse impact on our advertising revenue as some advertisers cancelled or reduced their advertising with us (including, in certain cases, with our permission prior to the end of the applicable contract term). In May 2020, cancellationsprocess by advertising customers began to stabilize, which we believe resultedinvestigate and resolve claims from buying dealers.
Wholesale revenue also includes fees earned from certain guarantees offered to dealers (which include 45-Day Guarantee and OfferGuard products), where we collect fees from the resumptionbuying dealer or selling dealer, as applicable.
Product Revenue
The Buying Matrix on the CarOffer platform enables consumers who are selling vehicles to be instantly presented with an offer. Product revenue includes the aggregate proceeds received from the sale of consumer activity.vehicles through IMCO transactions, including vehicle sale price and transaction fees collected from the buying dealers. Product revenue also includes proceeds received from the sale of vehicles acquired through arbitration, including vehicle sale price and transaction fees collected from buying dealers. Arbitration is the process by which we investigate and resolve claims from buying dealers. We control the vehicle in these transactions and therefore act as the principal.
40
In addition, a reduction in consumer visits to our sites during the COVID-19 pandemic resulted in the delivery of fewer impressions for our advertising customers than anticipated, which caused an adverse impact on our advertising revenue. This impact was partially offset by the increase in consumer visits over the remainder of the year to our sites as we increased our consumer marketing expenses in response to the recovery in consumer car shopping activity.
Revenue from partnerships with financing services companies was not adversely impacted by the COVID-19 pandemic.
For a description of our revenue accounting policies, see “— Critical Accounting Policies and Significant Estimates.”
Cost of Revenue
Marketplace Cost of Revenue
Marketplace cost of revenue primarily consists of costsincludes expenses related to supporting and hosting our productmarketplace service offerings. These costsexpenses include personnel and related expenses for our customer support team, including salaries, benefits, incentive compensation, and stock-based compensation for our customer support team andcompensation; third-party service provider costsexpenses such as advertising, data center and networking expenses, allocated overhead costs, depreciation expense associated with our property and equipment, andexpenses; amortization of developed technology; amortization of capitalized website development costs.development; amortization of hosting arrangements; and allocated overhead expenses. We allocate overhead costs,expenses, such as rent and facility costs,expenses, information technology costs,expense, and employee benefit costs,expense, to all departments based on headcount. As such, general overhead expenses are reflected in cost of revenue and each operating expense category. Despite our implementation
Wholesale Cost of Revenue
Wholesale cost of revenue includes expenses related to supporting and hosting wholesale service offerings, including Dealer-to-Dealer transactions and vehicles sold to dealers acquired at other marketplaces, on the Expense Reduction Plan, we expect theseBuying Matrix on the CarOffer platform. These expenses include vehicle transportation and inspection expenses; net losses on vehicles related to increaseguarantees offered to dealers through Dealer-to-Dealer transactions; personnel and related expenses for employees directly involved in the fulfillment and support of transactions, including salaries, benefits, incentive compensation and stock-based compensation; third-party service provider expenses; amortization of developed technology; amortization of capitalized website development; and allocated overhead expenses. We allocate overhead expenses, such as we continuerent and facility expenses, information technology expense, and employee benefit expense, to scale our businessall departments based on headcount. As such, general overhead expenses are reflected in cost of revenue and introduce new products.each operating expense category.
Product Cost of Revenue
Product cost of revenue includes expenses related to vehicles sold to dealers through IMCO transactions and vehicles sold to dealers acquired through arbitration. These costs include the cost of the vehicle and transportation expenses.
Operating Expenses
Sales and Marketing
Sales and marketing expenses consist primarily of personnel and related expenses for our sales and marketing team, including salaries, benefits, incentive compensation, commissions, and stock-based compensation, and travel costs; costscompensation; expenses associated with consumer marketing, such as traffic acquisition, brand building, and public relations activities; costsexpenses associated with dealer marketing, such as content marketing, customer and promotional events, and industry events; consulting services; software subscription expenses; travel expenses; amortization of internal-use software;hosting arrangements; and allocated overhead costs.expenses. A portion of our commissions that are related to obtaining a new contract isare capitalized and amortized over the estimated benefit period of customer relationships. All other sales and marketing costsexpenses are expensed as incurred. We expect sales and marketing expenses to fluctuate from quarter to quarter as we respond to the COVID-19 pandemic and changes in the macroeconomic and competitive landscapelandscapes affecting our existing dealers, consumer audience and brand awareness, which will impact our quarterly results of operations.
45
Product, Technology, and Development
Product, technology, and development expenses, which include research and development costs, consist primarily of personnel and related expenses for our research and development team, including salaries, benefits, incentive compensation, and stock-based compensationcompensation; software subscription expenses; consulting services; and allocated overhead costs.expenses. Other than website development, and internal-use software, costs as well as other costs that qualify for capitalization,and hosting arrangement expenses, research and development costsexpenses are expensed as incurred. Despite our implementation of the Expense Reduction Plan, weWe expect product, technology, and development expenses to increase as we invest in additional engineering resourcing to develop new solutions and make improvements to our existing platform.
General and Administrative
General and administrative expenses consist primarily of personnel and related expenses for our executive, finance, legal, people & talent, and administrative teams, including salaries, benefits, incentive compensation, and stock-based compensation, in addition to the costscompensation; expenses associated with professional fees for audit, tax, external legal, accounting and other consulting services, insurance premiums,services; payment processing and billing costs,expenses; insurance expenses; software subscription expenses; and allocated overhead costs.expenses. General and administrative costsexpenses are expensed as the products and services are provided. Despite our implementation of the Expense Reduction Plan, weincurred. We expect general and administrative expenses to increase as we continue to scale our business.
Depreciation and Amortization
Depreciation and amortization expenses consist of depreciation on property and equipment and amortization of intangible assets.assets and internal-use software.
41
Other Income, Net
Other income, net consists primarily of interest income earned on our cash, cash equivalents and investments, sublease income and net foreign exchange gains and losses.losses and interest expense.
Provision for (Benefit from) Income Taxes
We are subject to federal and state income taxes in the United States and taxes in foreign jurisdictions in which we operate. We have recordedFor the years ended December 31, 2022 and 2021, a provision for income taxes for the year ended December 31, 2020was recognized as a result of ourthe consolidated taxable income position and recognized a benefit from income taxes for the year ended December 31, 2019 as a result of stock-based compensation benefits recorded. position.
We recognize deferred tax assets and liabilities based on temporary differences between the financial reporting and income tax bases of assets and liabilities using statutory rates. enacted tax rates in effect for the year in which the temporary differences are expected to be recovered or settled.
We regularly assess the need to recordrecognize a valuation allowance against net deferred tax assets if, based upon the available evidence, it is more likely than not that some or all of the deferred tax assets will not be realized. Our valuation allowances against our net deferred tax assets asAs of December 31, 20202022 and 20192021, valuation allowances were both immaterial.
We assess our income tax positions and recognize an income tax benefit or expense based upon our evaluation of the facts, circumstances, and information available at the reporting date. For the year ended December 31, 2022, income tax expense and liability related to uncertain tax positions, exclusive of immaterial interest or penalties related to uncertain tax provisions, was $0.6 million, which would favorably affect our effective tax rate, if recognized. For the year ended December 31, 2021, no income tax expense and liability related to uncertain tax positions was recognized.
46
Results of Operations
The following table sets forthFor the years ended December 31, 2022 and 2021, our selected consolidated income statements data for each ofare as follows:
|
| Year Ended December 31, |
| |||||
|
| 2022 |
|
| 2021 |
| ||
|
| (dollars in thousands) |
| |||||
Revenue: |
|
|
|
|
|
| ||
Marketplace |
| $ | 658,771 |
|
| $ | 636,942 |
|
Wholesale |
|
| 237,635 |
|
|
| 195,127 |
|
Product |
|
| 758,629 |
|
|
| 119,304 |
|
Total revenue |
|
| 1,655,035 |
|
|
| 951,373 |
|
Cost of revenue: |
|
|
|
|
|
| ||
Marketplace |
|
| 56,040 |
|
|
| 47,689 |
|
Wholesale |
|
| 176,446 |
|
|
| 127,679 |
|
Product |
|
| 764,996 |
|
|
| 118,647 |
|
Total cost of revenue |
|
| 997,482 |
|
|
| 294,015 |
|
Gross profit |
|
| 657,553 |
|
|
| 657,358 |
|
Operating expenses: |
|
|
|
|
|
| ||
Sales and marketing |
|
| 336,708 |
|
|
| 290,574 |
|
Product, technology, and development |
|
| 123,768 |
|
|
| 106,423 |
|
General and administrative |
|
| 73,117 |
|
|
| 97,678 |
|
Depreciation and amortization |
|
| 15,482 |
|
|
| 14,415 |
|
Total operating expenses |
|
| 549,075 |
|
|
| 509,090 |
|
Income from operations |
|
| 108,478 |
|
|
| 148,268 |
|
Other income, net: |
|
|
|
|
|
| ||
Interest income |
|
| 3,845 |
|
|
| 120 |
|
Other (expense) income, net |
|
| (961 | ) |
|
| 972 |
|
Total other income, net |
|
| 2,884 |
|
|
| 1,092 |
|
Income before income taxes |
|
| 111,362 |
|
|
| 149,360 |
|
Provision for income taxes |
|
| 32,408 |
|
|
| 38,987 |
|
Consolidated net income |
|
| 78,954 |
|
|
| 110,373 |
|
Net (loss) income attributable to redeemable noncontrolling interest |
|
| (5,433 | ) |
|
| 1,129 |
|
Net income attributable to CarGurus, Inc. |
| $ | 84,387 |
|
| $ | 109,244 |
|
For the periods indicated. The period‑to‑period comparison of financial results is not necessarily indicative of future results.years ended December 31, 2022 and 2021, our segment revenue and our segment income (loss) from operations are as follows:
|
| Year Ended December 31, |
| |||||
|
| 2020 |
|
| 2019 |
| ||
|
| (dollars in thousands) |
| |||||
Revenue: |
|
|
|
|
|
|
|
|
Marketplace subscription |
| $ | 484,978 |
|
| $ | 526,043 |
|
Advertising and other |
|
| 66,473 |
|
|
| 62,873 |
|
Total revenue |
|
| 551,451 |
|
|
| 588,916 |
|
Cost of revenue |
|
| 42,706 |
|
|
| 36,300 |
|
Gross profit |
|
| 508,745 |
|
|
| 552,616 |
|
Operating expenses: |
|
|
|
|
|
|
|
|
Sales and marketing |
|
| 256,979 |
|
|
| 393,844 |
|
Product, technology, and development |
|
| 85,726 |
|
|
| 69,462 |
|
General and administrative |
|
| 62,166 |
|
|
| 50,434 |
|
Depreciation and amortization |
|
| 6,118 |
|
|
| 4,554 |
|
Total operating expenses |
|
| 410,989 |
|
|
| 518,294 |
|
Income from operations |
|
| 97,756 |
|
|
| 34,322 |
|
Other income, net: |
|
|
|
|
|
|
|
|
Interest income |
|
| 1,075 |
|
|
| 2,984 |
|
Other income, net |
|
| 279 |
|
|
| 1,399 |
|
Total other income, net |
|
| 1,354 |
|
|
| 4,383 |
|
Income before income taxes |
|
| 99,110 |
|
|
| 38,705 |
|
Provision for (benefit from) income taxes |
|
| 21,557 |
|
|
| (3,441 | ) |
Net income |
| $ | 77,553 |
|
| $ | 42,146 |
|
|
| Year Ended December 31, |
| |||||
|
| 2022 |
|
| 2021 |
| ||
|
| (dollars in thousands) |
| |||||
Segment Revenue |
|
|
|
|
|
| ||
U.S. Marketplace |
| $ | 614,136 |
|
| $ | 594,602 |
|
Digital Wholesale |
|
| 996,264 |
|
|
| 314,431 |
|
Other |
|
| 44,635 |
|
|
| 42,340 |
|
Total |
| $ | 1,655,035 |
|
| $ | 951,373 |
|
Segment Income (loss) from Operations |
|
|
|
|
|
| ||
U.S. Marketplace |
| $ | 125,796 |
|
| $ | 151,343 |
|
Digital Wholesale |
|
| (9,174 | ) |
|
| 7,189 |
|
Other |
|
| (8,144 | ) |
|
| (10,264 | ) |
Total |
| $ | 108,478 |
|
| $ | 148,268 |
|
|
| Year Ended December 31, |
| |||||
|
| 2020 |
|
| 2019 |
| ||
|
| (dollars in thousands) |
| |||||
Additional Financial Data |
|
|
|
|
|
|
|
|
Revenue |
|
|
|
|
|
|
|
|
United States |
| $ | 519,835 |
|
| $ | 555,007 |
|
International |
|
| 31,616 |
|
|
| 33,909 |
|
Total |
| $ | 551,451 |
|
| $ | 588,916 |
|
Income (Loss) from Operations |
|
|
|
|
|
|
|
|
United States |
| $ | 120,836 |
|
| $ | 73,872 |
|
International |
|
| (23,080 | ) |
|
| (39,550 | ) |
Total |
| $ | 97,756 |
|
| $ | 34,322 |
|
The following table sets forth47
For the years ended December 31, 2022 and 2021, our selected consolidated income statements data as a percentage of total revenue for each ofare as follows (amounts in the periods indicated.
|
| Year Ended December 31, |
| |||||
|
| 2020 |
|
| 2019 |
| ||
Revenue: |
|
|
|
|
|
|
|
|
Marketplace subscription |
|
| 88 | % |
|
| 89 | % |
Advertising and other |
|
| 12 |
|
|
| 11 |
|
Total revenue |
|
| 100 | % |
|
| 100 | % |
Cost of revenue |
|
| 8 |
|
|
| 6 |
|
Gross profit |
|
| 92 |
|
|
| 94 |
|
Operating expenses: |
|
|
|
|
|
|
|
|
Sales and marketing |
|
| 47 |
|
|
| 67 |
|
Product, technology, and development |
|
| 16 |
|
|
| 12 |
|
General and administrative |
|
| 11 |
|
|
| 9 |
|
Depreciation and amortization |
|
| 1 |
|
|
| 1 |
|
Total operating expenses |
|
| 75 |
|
|
| 88 |
|
Income from operations |
|
| 18 |
|
|
| 6 |
|
Other income, net: |
|
|
|
|
|
|
|
|
Interest income |
|
| 0 |
|
|
| 1 |
|
Other income, net |
|
| 0 |
|
|
| 0 |
|
Total other income, net |
|
| 0 |
|
|
| 1 |
|
Income before income taxes |
|
| 18 |
|
|
| 7 |
|
Provision for (benefit from) income taxes |
|
| 4 |
|
|
| (1 | ) |
Net income |
|
| 14 | % |
|
| 7 | % |
|
| Year Ended December 31, |
| |||||
|
| 2020 |
|
| 2019 |
| ||
Additional Financial Data |
|
|
|
|
|
|
|
|
Revenue |
|
|
|
|
|
|
|
|
United States |
|
| 94 | % |
|
| 94 | % |
International |
|
| 6 |
|
|
| 6 |
|
Total |
|
| 100 | % |
|
| 100 | % |
Income (Loss) from Operations |
|
|
|
|
|
|
|
|
United States |
|
| 22 | % |
|
| 13 | % |
International |
|
| (4 | ) |
|
| (7 | ) |
Total |
|
| 18 | % |
|
| 6 | % |
Note amounts in tables abovetable may not sum due to rounding.rounding):
|
| Year Ended December 31, |
| |||||
|
| 2022 |
|
| 2021 |
| ||
Revenue: |
|
|
|
|
|
| ||
Marketplace |
|
| 40 | % |
|
| 67 | % |
Wholesale |
|
| 14 |
|
|
| 21 |
|
Product |
|
| 46 |
|
|
| 13 |
|
Total revenue |
|
| 100 |
|
|
| 100 |
|
Cost of revenue: |
|
|
|
|
|
| ||
Marketplace |
|
| 3 |
|
|
| 5 |
|
Wholesale |
|
| 11 |
|
|
| 13 |
|
Product |
|
| 46 |
|
|
| 12 |
|
Total cost of revenue |
|
| 60 |
|
|
| 31 |
|
Gross profit |
|
| 40 |
|
|
| 69 |
|
Operating expenses: |
|
|
|
|
|
| ||
Sales and marketing |
|
| 20 |
|
|
| 31 |
|
Product, technology, and development |
|
| 7 |
|
|
| 11 |
|
General and administrative |
|
| 4 |
|
|
| 10 |
|
Depreciation and amortization |
|
| 1 |
|
|
| 2 |
|
Total operating expenses |
|
| 33 |
|
|
| 54 |
|
Income from operations |
|
| 7 |
|
|
| 16 |
|
Other income, net: |
|
|
|
|
|
| ||
Interest income |
|
| 0 |
|
|
| 0 |
|
Other (expense) income, net |
|
| (0 | ) |
|
| 0 |
|
Total other income, net |
|
| 0 |
|
|
| 0 |
|
Income before income taxes |
|
| 7 |
|
|
| 16 |
|
Provision for income taxes |
|
| 2 |
|
|
| 4 |
|
Consolidated net income |
|
| 5 |
|
|
| 12 |
|
Net (loss) income attributable to redeemable noncontrolling interest |
|
| (0 | ) |
|
| 0 |
|
Net income attributable to CarGurus, Inc. |
|
| 5 |
|
|
| 11 |
|
43For the years ended December 31, 2022 and 2021, our segment revenue as a percentage of total revenue and our segment income (loss) from operations as a percentage of segment revenue are as follows (amounts in the table may not sum due to rounding):
|
| Year Ended December 31, |
| |||||
|
| 2022 |
|
| 2021 |
| ||
Segment Revenue |
|
|
|
|
|
| ||
U.S. Marketplace |
|
| 37 | % |
|
| 62 | % |
Digital Wholesale |
|
| 60 |
|
|
| 33 |
|
Other |
|
| 3 |
|
|
| 4 |
|
Total |
|
| 100 | % |
|
| 100 | % |
Segment Income (loss) from Operations |
|
|
|
|
|
| ||
U.S. Marketplace |
|
| 20 | % |
|
| 25 | % |
Digital Wholesale |
|
| (1 | ) |
|
| 2 |
|
Other |
|
| (18 | ) |
|
| (24 | ) |
Total |
|
| 7 | % |
|
| 16 | % |
48
Year Ended December 31, 20202022 Compared to Year Ended December 31, 20192021
Revenue
Revenue by Source
|
| Year Ended December 31, |
|
| Change |
|
| Year Ended December 31, |
|
| Change |
| ||||||||||||||||||||
|
| 2020 |
|
| 2019 |
|
| Amount |
|
| % |
|
| 2022 |
|
| 2021 |
|
| Amount |
|
| % |
| ||||||||
|
| (dollars in thousands) |
|
| (dollars in thousands) |
| ||||||||||||||||||||||||||
Revenue |
|
|
|
|
|
|
|
|
|
|
|
|
|
|
|
|
|
|
|
|
|
|
|
|
| |||||||
Marketplace subscription |
| $ | 484,978 |
|
| $ | 526,043 |
|
| $ | (41,065 | ) |
|
| (8 | )% | ||||||||||||||||
Advertising and other |
|
| 66,473 |
|
|
| 62,873 |
|
|
| 3,600 |
|
|
| 6 |
| ||||||||||||||||
Marketplace |
| $ | 658,771 |
|
| $ | 636,942 |
|
| $ | 21,829 |
|
|
| 3 | % | ||||||||||||||||
Wholesale |
|
| 237,635 |
|
|
| 195,127 |
|
|
| 42,508 |
|
|
| 22 |
| ||||||||||||||||
Product |
|
| 758,629 |
|
|
| 119,304 |
|
|
| 639,325 |
|
|
| 536 |
| ||||||||||||||||
Total |
| $ | 551,451 |
|
| $ | 588,916 |
|
| $ | (37,465 | ) |
|
| (6 | )% |
| $ | 1,655,035 |
|
| $ | 951,373 |
|
| $ | 703,662 |
|
|
| 74 | % |
Percentage of total revenue: |
|
|
|
|
|
|
|
|
|
|
|
|
|
|
|
|
|
|
|
|
|
|
|
|
|
|
|
| ||||
Marketplace subscription |
|
| 88 | % |
|
| 89 | % |
|
|
|
|
|
|
|
| ||||||||||||||||
Advertising and other |
|
| 12 |
|
|
| 11 |
|
|
|
|
|
|
|
|
| ||||||||||||||||
Marketplace |
|
| 40 | % |
|
| 67 | % |
|
|
|
|
|
| ||||||||||||||||||
Wholesale |
|
| 14 |
|
|
| 21 |
|
|
|
|
|
|
| ||||||||||||||||||
Product |
|
| 46 |
|
|
| 13 |
|
|
|
|
|
|
| ||||||||||||||||||
Total |
|
| 100 | % |
|
| 100 | % |
|
|
|
|
|
|
|
|
|
| 100 | % |
|
| 100 | % |
|
|
|
|
|
| ||
Overall revenue decreased $37.5increased $703.7 million, or 6%74%, in the year ended December 31, 20202022 compared to the year ended December 31, 2019. 2021.
Marketplace subscription revenue decreased by 8% and advertising and other revenue increased by 6%.
Marketplace subscription revenue decreased $41.1$21.8 million, or 3%, in the year ended December 31, 20202022 compared to the year ended December 31, 20192021 and represented 88%40% of total revenue for the year ended December 31, 20202022 and 89% of total revenue for the year ended December 31, 2019. This decrease in marketplace subscription revenue was attributable primarily to the approximately $50 million impact of fee reductions that we provided to our paying dealers during the second quarter of 2020 in response to the COVID-19 pandemic. Of the approximately $50 million in billing concessions, approximately $47 million resulted in revenue reductions during the second quarter of 2020, with the remaining impact spread over the life of the contract term. We also provided fee reductions to paying dealers for the December 2020 and February 2021 service periods. These fee reductions resulted in reductions in the overall transaction price. The decrease in marketplace subscription revenue was also attributable to a 9% decrease in the number of United States and International paying dealers, to 30,631 as of December 31, 2020 from 33,618 as of December 31, 2019 as paying dealers cancelled their subscriptions with us (including, in some cases, with our permission prior to the end of the applicable contract term and notice period) primarily as a result of the impact of the COVID-19 pandemic.
Advertising and other revenue increased $3.6 million in the year ended December 31, 2020 compared to the year ended December 31, 2019 and represented 12%67% of total revenue for the year ended December 31, 20202021. The increase was due primarily to a $30.9 million increase in Listings revenue, as a result of a 4% growth in our QARSD for paying dealers to $4,921 for the three months ended December 31, 2022 from $4,731 for the three months ended December 31, 2021. The increase in QARSD was due primarily to signing on new dealers with higher average monthly recurring revenue and 11%revenue expansion through product upgrades for existing dealers. The increase in marketplace revenue was offset in part by a $9.3 million decrease in advertising revenue as a result of economic conditions and lower spend by our advertisers.
Wholesale revenue increased $42.5 million, or 22%, in the year ended December 31, 2022 compared to the year ended December 31, 2021 and represented 14% of total revenue for the year ended December 31, 2019.2022 and 21% of total revenue for the year ended December 31, 2021. The increase was due primarily to a $7.4 million21% increase in other revenue primarily dueTransactions to revenue190,594 for the year ended December 31, 2022 from partnerships with financing services companies.157,062 for the year ended December 31, 2021 The increase in advertising and other revenue was offset by a $3.8 million decreaseTransactions resulted in advertisingan increase in transaction fee revenue as some advertisers cancelled or reduced their advertising with us (including,well as an increase in some cases, with our permission priortransportation revenue, inspection revenue, and guarantee revenue. Fee increases also contributed to the end of the applicable contract term) primarily as a result of the impact of the COVID-19 pandemic.increase in transportation revenue.
Revenue by Segment
|
| Year Ended December 31, |
|
| Change |
| ||||||||||
|
| 2020 |
|
| 2019 |
|
| Amount |
|
| % |
| ||||
|
| (dollars in thousands) |
| |||||||||||||
Revenue |
|
|
|
|
|
|
|
|
|
|
|
|
|
|
|
|
United States |
| $ | 519,835 |
|
| $ | 555,007 |
|
| $ | (35,172 | ) |
|
| (6 | )% |
International |
|
| 31,616 |
|
|
| 33,909 |
|
|
| (2,293 | ) |
|
| (7 | ) |
Total |
| $ | 551,451 |
|
| $ | 588,916 |
|
| $ | (37,465 | ) |
|
| (6 | )% |
Percentage of total revenue: |
|
|
|
|
|
|
|
|
|
|
|
|
|
|
|
|
United States |
|
| 94 | % |
|
| 94 | % |
|
|
|
|
|
|
|
|
International |
|
| 6 |
|
|
| 6 |
|
|
|
|
|
|
|
|
|
Total |
|
| 100 | % |
|
| 100 | % |
|
|
|
|
|
|
|
|
44
United StatesProduct revenue decreased $35.2increased $639.3 million, or 6%536%, in the year ended December 31, 20202022 compared to the year ended December 31, 2019.This decrease in United States2021 and represented 46% of the total revenue for the year ended December 31, 2022 and 13% of total revenue for the year ended December 31, 2021. The increase was attributabledue primarily to a $546.4 million increase in proceeds received from the approximately $47 million impactsale of fee reductions that we provided to our paying dealers during the second quarter of 2020 in response to the COVID-19 pandemic. These fee reductions resulted in reductions in the overallvehicles through IMCO transactions, including vehicle sale price and transaction price.The decrease in United States revenue was also attributable toa 9% decrease in United States paying dealers as paying dealers cancelled their subscriptions with us (including, in certain cases, with our permission prior to the end of the applicable contract term and notice period) primarilyfees, as a result of the impactIMCO offering becoming available to approximately 93% of the COVID-19 pandemic. This decreaseU.S. population. The increase in product revenue was offsetalso due in part by theto a $92.9 million increase in United Statesproceeds received from the sale of vehicles acquired through arbitration, including vehicle sale price and transaction fees, as a result of increased arbitration claims due primarily to increased volume.
49
Segment Revenue
|
| Year Ended December 31, |
|
| Change |
| ||||||||||
|
| 2022 |
|
| 2021 |
|
| Amount |
|
| % |
| ||||
|
| (dollars in thousands) |
| |||||||||||||
Revenue |
|
|
|
|
|
|
|
|
|
|
|
| ||||
U.S. Marketplace |
| $ | 614,136 |
|
| $ | 594,602 |
|
| $ | 19,534 |
|
|
| 3 | % |
Digital Wholesale |
|
| 996,264 |
|
|
| 314,431 |
|
|
| 681,833 |
|
|
| 217 |
|
Other |
|
| 44,635 |
|
|
| 42,340 |
|
|
| 2,295 |
|
|
| 5 |
|
Total |
| $ | 1,655,035 |
|
| $ | 951,373 |
|
| $ | 703,662 |
|
|
| 74 | % |
Percentage of total revenue: |
|
|
|
|
|
|
|
|
|
|
|
| ||||
U.S. Marketplace |
|
| 37 | % |
|
| 62 | % |
|
|
|
|
|
| ||
Digital Wholesale |
|
| 60 |
|
|
| 33 |
|
|
|
|
|
|
| ||
Other |
|
| 3 |
|
|
| 4 |
|
|
|
|
|
|
| ||
Total |
|
| 100 | % |
|
| 100 | % |
|
|
|
|
|
| ||
U.S. Marketplace segment revenue from partnerships with financing services companies of $7.7 million.
International revenue decreased $2.3increased $19.5 million, or 7%3%, in the year ended December 31, 20202022 compared to the year ended December 31, 2019. 2021 and represented 37% of total revenue for the year ended December 31, 2022 and 62% of total revenue for the year ended December 31, 2021. This increase was due primarily to a $28.6 million increase in Listings revenue, as a result of a 4% growth in our U.S. QARSD for paying dealers to $5,842 at December 31, 2022 from $5,633 at December 31, 2021. The increase in U.S. QARSD was due primarily to signing on new dealers with higher average monthly recurring revenue and revenue expansion through product upgrades for existing dealers. The increase in U.S. Marketplace segment revenue was offset in part by a $9.7 million decrease in internationaladvertising revenue as a result of economic conditions and lower spend by our advertisers.
Digital Wholesale segment revenue, which is comprised of wholesale revenue and product revenue, increased $681.8 million, or 217%, in the year ended December 31, 2022 compared to the year ended December 31, 2021 and represented 60% of total revenue for the year ended December 31, 2022 and 33% of total revenue for the year ended December 31, 2021. Wholesale revenue increased $42.5 million in the year ended December 31, 2022, compared to the year ended December 31, 2021. The increase in wholesale revenue was attributabledue primarily to a 21% increase in Transactions to 190,594 for the approximately $3 million impact ofyear ended December 31, 2022 from 157,062 for the year ended December 31, 2021. The increase in Transactions resulted in an increase in transaction fee reductions that we provided to our paying dealers during the second quarter of 2020revenue as well as an increase in responsetransportation revenue, inspection revenue, and guarantee revenue. Fee increases also contributed to the COVID-19 pandemic. We also provided fee reductions to paying dealers for the December 2020 and February 2021 service periods. These fee reductions resultedincrease in reductionstransportation revenue. Product revenue increased $639.3 million in the overall transaction price.year ended December 31, 2022 compared to the year ended December 31, 2021. The decreaseincrease in internationalproduct revenue was also attributabledue primarily to a 9% decrease$546.4 million increase in proceeds received from the numbersale of International paying dealers as paying dealers cancelled their subscriptions with us (vehicles through IMCO transactions, including in certain cases, with our permission prior to the end of the applicable contract termvehicle sale price and notice period) primarilytransaction fees, as a result of the impactIMCO offering becoming available to approximately 93% of the COVID-19 pandemic.U.S. population. The increase in product revenue was also due in part to a $92.9 million increase in proceeds received from the sale of vehicles acquired through arbitration, including vehicle sale price and transaction fees, as a result of increased arbitration claims due primarily to increased volume.
Cost of Revenue
|
| Year Ended December 31, |
|
| Change |
|
| Year Ended December 31, |
|
| Change |
| ||||||||||||||||||||
|
| 2020 |
|
| 2019 |
|
| Amount |
|
| % |
|
| 2022 |
|
| 2021 |
|
| Amount |
|
| % |
| ||||||||
|
| (dollars in thousands) |
|
| (dollars in thousands) |
| ||||||||||||||||||||||||||
Cost of revenue |
| $ | 42,706 |
|
| $ | 36,300 |
|
| $ | 6,406 |
|
|
| 18 | % |
|
|
|
|
|
|
|
|
|
|
|
| ||||
Percentage of total revenue |
|
| 8 | % |
|
| 6 | % |
|
|
|
|
|
|
|
| ||||||||||||||||
Marketplace |
| $ | 56,040 |
|
| $ | 47,689 |
|
| $ | 8,351 |
|
|
| 18 | % | ||||||||||||||||
Wholesale |
|
| 176,446 |
|
|
| 127,679 |
|
|
| 48,767 |
|
|
| 38 |
| ||||||||||||||||
Product |
|
| 764,996 |
|
|
| 118,647 |
|
|
| 646,349 |
|
|
| 545 |
| ||||||||||||||||
Total |
| $ | 997,482 |
|
| $ | 294,015 |
|
| $ | 703,467 |
|
|
| 239 | % | ||||||||||||||||
Percentage of total revenue: |
|
|
|
|
|
|
|
|
|
|
|
| ||||||||||||||||||||
Marketplace |
|
| 3 | % |
|
| 5 | % |
|
|
|
|
|
| ||||||||||||||||||
Wholesale |
|
| 11 |
|
|
| 13 |
|
|
|
|
|
|
| ||||||||||||||||||
Product |
|
| 46 |
|
|
| 12 |
|
|
|
|
|
|
| ||||||||||||||||||
Total |
|
| 60 | % |
|
| 31 | % |
|
|
|
|
|
| ||||||||||||||||||
CostOverall cost of revenue increased $6.4$703.5 million, or 239%, in the year ended December 31, 2022 compared to the year ended December 31, 2021.
50
Marketplace cost of revenue increased $8.4 million, or 18%, in the year ended December 31, 20202022 compared to the year ended December 31, 2019. 2021 and represented 3% of total revenue for the year ended December 31, 2022 and 5% of total revenue for the year ended December 31, 2021. The increase was due primarily to a $3.1$4.6 million increase in fees related to provisioning advertising campaigns on our websites from changing to more effective but slightly higher cost service providers and a $2.0$3.4 million increase in data center and hosting costs, a $1.7 million costs.increase in amortization due to the write-off of international websites in connection with the Expense Reduction Plan and amortization of website development costs,
and a $1.6 million increase primarily related to a reduction of vendor rebates. These increases were offset in part by a $1.8 million decrease in salaries and employee-related costs due to a 31% decrease in average headcount primarily in connection with the Expense Reduction Plan. The increase for the year ended December 31, 2020 is inclusive ofWholesale cost of revenue associated with Autolist of $0.9 million.
Operating Expenses
Sales and Marketing Expenses
|
| Year Ended December 31, |
|
| Change |
| ||||||||||
|
| 2020 |
|
| 2019 |
|
| Amount |
|
| % |
| ||||
|
| (dollars in thousands) |
| |||||||||||||
Sales and marketing |
| $ | 256,979 |
|
| $ | 393,844 |
|
| $ | (136,865 | ) |
|
| (35 | )% |
Percentage of total revenue |
|
| 47 | % |
|
| 67 | % |
|
|
|
|
|
|
|
|
Sales and marketing expenses decreased $136.9increased $48.8 million, or 35%38%, in the year ended December 31, 20202022 compared to the year ended December 31, 2019.2021 and represented 11% of total revenue for the year ended December 31, 2022 and 13% of total revenue for the year ended December 31, 2021. The decreaseincrease was due primarily to an increase in Dealer-to-Dealer transactions which resulted an increase in transportation expenses, inspection expenses, third-party service provider expenses, and guarantee expenses. Cost increases also contributed to the increase in transportation expenses. The increase in wholesale cost of revenue was also driven by an increase in amortization of capitalized website development.
Product cost of revenue increased $646.3 million, or 545%, in the year ended December 31, 2022 compared to the year ended December 31, 2021 and represented 46% of the total revenue for the year ended December 31, 2022 and 12% of total revenue for the year ended December 31, 2021. The increase was due primarily to a $131.6$535.5 million increase in expenses related to vehicles sold to dealers through IMCO transactions as a result of an increase in IMCO transactions. The increase in IMCO transactions was due primarily to the offering becoming available to approximately 93% of the U.S. population. The increase in product cost of revenue was also due in part to a $110.8 million increase in expenses related to vehicles sold to dealers acquired through arbitration as a result of increased arbitration claims due primarily to increased volume.
Operating Expenses
Sales and Marketing Expenses
|
| Year Ended December 31, |
|
| Change |
| ||||||||||
|
| 2022 |
|
| 2021 |
|
| Amount |
|
| % |
| ||||
|
| (dollars in thousands) |
| |||||||||||||
Sales and marketing |
| $ | 336,708 |
|
| $ | 290,574 |
|
| $ | 46,134 |
|
|
| 16 | % |
Percentage of total revenue |
|
| 20 | % |
|
| 31 | % |
|
|
|
|
|
| ||
Sales and marketing expenses increased $46.1 million, or 16%, in the year ended December 31, 2022 compared to the year ended December 31, 2021. The increase was due primarily to a $38.8 million increase in marketing expenses, primarily related to the marketing of IMCO in the first three quarters of 2022, search engine performance marketing as part of our efforts to increase site traffic due to a result of increased dealer inventory compared to the year ended December 31, 2021, and creative expenses for future marketing campaigns. The increase was also due in part to a $19.8 million increase in salaries and employee-related expense, exclusive of stock-based compensation expense and commissions expenses, which decreased $5.1 million and $2.1 million, respectively. The increase in salaries and employee-related expense was due primarily to a 21% increase in headcount. The decrease in advertising costs, a $2.3 millionstock-based compensation was due primarily to the revaluation of liability-based stock awards. The decrease in travel relatedcommissions expense was due primarily to higher capitalization on commissions as a result of compensation plan changes, net of sales growth. The increase in sales and marketing expenses was also due in part to a $1.7 million increase in software subscription expenses, inclusive of amortization of hosting arrangements, a $1.2 million increase in allocated insurance and legal expenses, a $2.2$1.1 million decreaseincrease in consultingtravel expenses, and recruiting expenses, a $2.0$0.8 million decreaseincrease in employee expenses dueassociated with the return to employees working remotely,office. The increase in sales and a $1.5 million decrease in marketing costs related to events and vendor expenses. These decreases wereexpense was offset in part by a $1.5$10.8 million increasedecrease in employee severance and related benefits expense due to the Expense Reduction Plan and a $1.0 million increase in rentbrand awareness advertising costs due to additional office space at 55 Cambridge Parkway,decreased spend as a result of a change in Cambridge, Massachusetts.advertising strategy toward the end of 2022.
45
Product, Technology, and Development Expenses
|
| Year Ended December 31, |
|
| Change |
|
| Year Ended December 31, |
|
| Change |
| ||||||||||||||||||||
|
| 2020 |
|
| 2019 |
|
| Amount |
|
| % |
|
| 2022 |
|
| 2021 |
|
| Amount |
|
| % |
| ||||||||
|
| (dollars in thousands) |
|
| (dollars in thousands) |
| ||||||||||||||||||||||||||
Product, technology, and development |
| $ | 85,726 |
|
| $ | 69,462 |
|
| $ | 16,264 |
|
|
| 23 | % |
| $ | 123,768 |
|
| $ | 106,423 |
|
| $ | 17,345 |
|
|
| 16 | % |
Percentage of total revenue |
|
| 16 | % |
|
| 12 | % |
|
|
|
|
|
|
|
|
|
| 7 | % |
|
| 11 | % |
|
|
|
|
|
| ||
51
Product, technology, and development expenses increased $16.3$17.3 million, or 23%16%, in the year ended December 31, 20202022 compared to the year ended December 31, 2019.2021. The increase was due primarily to a $11.1$20.4 million increase in salaries and employee-related costs,expenses, exclusive of stock-based compensation, expense, which increased $5.6decreased $2.7 million. The increase in salaries and employee-related costs and stock-based compensation expenseexpenses was due primarily to a 19%16% increase in average headcountheadcount. The decrease in stock-based compensation was due primarily to support our growth plans and product innovations.the revaluation of liability-based stock awards. The increase in product, technology, and development expenses for the year ended December 31, 2020was also due in part to a $2.1$3.7 million increase in rent costs dueconsulting expenses, a $1.6 million increase in software subscription expenses, a $0.6 million increase in employee expenses associated with the return to additional office space at 55 Cambridge Parkway,and a $0.5 million increase in Cambridge, Massachusetts. These increases weretravel expenses. The increase in product, technology, and development expenses was offset in part by a $1.1$7.9 million decrease in employee expenses due to employees working remotely, $0.5 million decrease in consulting and recruiting expenses, a decrease of $0.4 million in travel expenses,resulting from increased capitalized projects and a decrease in other product, technology, andprior year impairment of website development expenses as a result of the Expense Reduction Plan. The increase for the year ended December 31, 2020 is inclusive of product, technology, and development expenses associated with the integration and development of Autolist technology of $5.3 million.costs.
General and Administrative Expenses
|
| Year Ended December 31, |
|
| Change |
| ||||||||||
|
| 2020 |
|
| 2019 |
|
| Amount |
|
| % |
| ||||
|
| (dollars in thousands) |
| |||||||||||||
General and administrative |
| $ | 62,166 |
|
| $ | 50,434 |
|
| $ | 11,732 |
|
|
| 23 | % |
Percentage of total revenue |
|
| 11 | % |
|
| 9 | % |
|
|
|
|
|
|
|
|
|
| Year Ended December 31, |
|
| Change |
| ||||||||||
|
| 2022 |
|
| 2021 |
|
| Amount |
|
| % |
| ||||
|
| (dollars in thousands) |
| |||||||||||||
General and administrative |
| $ | 73,117 |
|
| $ | 97,678 |
|
| $ | (24,561 | ) |
|
| (25 | )% |
Percentage of total revenue |
|
| 4 | % |
|
| 10 | % |
|
|
|
|
|
| ||
General and administrative expenses increased $11.7decreased $24.6 million, or 23%25%, in the year ended December 31, 20202022 compared to the year ended December 31, 2019.2021. The increasedecrease was due primarily to a $2.6$37.0 million decrease in stock-based compensation. The decrease in stock-based compensation was due to the revaluation of liability-based stock awards. The decrease in general and administrative expenses was offset in part by a $6.0 million increase in salaries and employee-related costs,expenses, exclusive of stock-based compensation expense, which increased $4.9 million.compensation. The increase in salaries and employee-related costs and stock-based compensation expenseexpenses was due primarily to a 5%23% increase in average headcount to support our expanded operations as we continue to grow our business.headcount. The increase in general and administrative expensesdecrease was also due in part to a $2.4 million increase in tax payments, a $1.1 million increase in legal expenses primarily due to acquisition-related expenses and a $1.0 million increase in insurance expenses. The increase for the year ended December 31, 2020 was offset in part by a decrease$2.2 million increase in various generalaudit, tax, legal and administrativeconsulting expenses, as a result of cost-savings efforts we implemented$1.1 million increase in response to the COVID-19 pandemic.Thesoftware subscription expenses, a $0.8 million increase for the year ended December 31, 2020 is inclusive of generalin indirect tax expenses, a $0.6 million increase in bad debt expense, and administrative expenses associated with Autolist of $2.1 million.a $0.5 million increase in payment processing and billing expense.
Depreciation and Amortization Expenses
|
| Year Ended December 31, |
|
| Change |
|
| Year Ended December 31, |
|
| Change |
| ||||||||||||||||||||
|
| 2020 |
|
| 2019 |
|
| Amount |
|
| % |
|
| 2022 |
|
| 2021 |
|
| Amount |
|
| % |
| ||||||||
|
| (dollars in thousands) |
|
| (dollars in thousands) |
| ||||||||||||||||||||||||||
Depreciation and amortization |
| $ | 6,118 |
|
| $ | 4,554 |
|
| $ | 1,564 |
|
|
| 34 | % |
| $ | 15,482 |
|
| $ | 14,415 |
|
| $ | 1,067 |
|
|
| 7 | % |
Percentage of total revenue |
|
| 1 | % |
|
| 1 | % |
|
|
|
|
|
|
|
|
|
| 1 | % |
|
| 2 | % |
|
|
|
|
|
| ||
Depreciation and amortization expenses increased $1.6$1.1 million, or 34%7%, in the year ended December 31, 20202022 compared to the year ended December 31, 2019,2021. The increase was due primarily to an increase in amortization of intangible assets related tointernal-use software projects that went into service during the acquired intangible assets from Autolist and an increase in depreciation related to the leasehold improvements associated with additional office space leased at 55 Cambridge Parkway in Cambridge, Massachusetts.year ended December 31, 2022.
46
Other Income, net
|
| Year Ended December 31, |
|
| Change |
| ||||||||||
|
| 2020 |
|
| 2019 |
|
| Amount |
|
| % |
| ||||
| �� | (dollars in thousands) |
| |||||||||||||
Other income, net |
|
|
|
|
|
|
|
|
|
|
|
|
|
|
|
|
Interest income |
| $ | 1,075 |
|
| $ | 2,984 |
|
| $ | (1,909 | ) |
|
| (64 | )% |
Other income |
|
| 279 |
|
|
| 1,399 |
|
|
| (1,120 | ) |
|
| (80 | ) |
Total other income, net |
| $ | 1,354 |
|
| $ | 4,383 |
|
| $ | (3,029 | ) |
|
| (69 | )% |
Percentage of total revenue: |
|
|
|
|
|
|
|
|
|
|
|
|
|
|
|
|
Interest income |
|
| 0 | % |
|
| 1 | % |
|
|
|
|
|
|
|
|
Other income |
|
| 0 |
|
|
| 0 |
|
|
|
|
|
|
|
|
|
Total other income, net |
|
| 0 | % |
|
| 1 | % |
|
|
|
|
|
|
|
|
|
| Year Ended December 31, |
|
| Change |
| ||||||||||
|
| 2022 |
|
| 2021 |
|
| Amount |
|
| % |
| ||||
|
| (dollars in thousands) |
| |||||||||||||
Other income, net |
|
|
|
|
|
|
|
|
|
|
|
| ||||
Interest income |
| $ | 3,845 |
|
| $ | 120 |
|
| $ | 3,725 |
|
|
| 3104 | % |
Other (expense) income |
|
| (961 | ) |
|
| 972 |
|
|
| (1,933 | ) |
|
| (199 | ) |
Total other income, net |
| $ | 2,884 |
|
| $ | 1,092 |
|
| $ | 1,792 |
|
|
| 164 | % |
Percentage of total revenue: |
|
|
|
|
|
|
|
|
|
|
|
| ||||
Interest income |
|
| 0 | % |
|
| 0 | % |
|
|
|
|
|
| ||
Other (expense) income |
|
| (0 | ) |
|
| 0 |
|
|
|
|
|
|
| ||
Total other income, net |
|
| 0 | % |
|
| 0 | % |
|
|
|
|
|
| ||
Other income, net decreased $3.0increased $1.8 million, or 69%164%, in the year ended December 31, 20202022 compared to the year ended December 31, 2019.2021. The $1.9$3.7 million decreaseincrease in interest income was due primarily to lower investmentsthe investment in and return on certificatesnew money market accounts as a result of deposit during the year ended December 31, 2020. The $1.1 million decrease in other income, net was primarily due to a $0.9 million decrease in a foreign currency gain. In the year ended December 31, 2019, we had a foreign currency gain associated with an intercompany receivable related to the acquisition of PistonHeads.
Provision for (Benefit From) Income Taxes
|
| Year Ended December 31, |
|
| Change | |||||||||
|
| 2020 |
|
| 2019 |
|
| Amount |
|
| % | |||
|
| (dollars in thousands) | ||||||||||||
Provision for (benefit from) income taxes |
| $ | 21,557 |
|
| $ | (3,441 | ) |
| $ | (24,998 | ) |
| NM |
Percentage of total revenue |
|
| 4 | % |
|
| (1 | )% |
|
|
|
|
|
|
The difference in provision for (benefit from) income taxes recorded during the years ended December 31, 2020 and 2019, was principally due to lower income before income taxes for the year ended December 31, 2019 and $10.9 million excess stock-based compensation benefits recordedinterest rate increases during the year ended December 31, 2019, as2022. The $1.9 million decrease in other (expense) income was due primarily to $1.5 million increase in realized and unrealized loss associated with the strengthening of the dollar against certain foreign currencies.
52
Provision for Income Taxes
|
| Year Ended December 31, |
|
| Change |
| ||||||||||
|
| 2022 |
|
| 2021 |
|
| Amount |
|
| % |
| ||||
|
| (dollars in thousands) |
| |||||||||||||
Provision for income taxes |
| $ | 32,408 |
|
| $ | 38,987 |
|
| $ | (6,579 | ) |
|
| (17 | )% |
Percentage of total revenue |
|
| 2 | % |
|
| 4 | % |
|
|
|
|
|
| ||
Provision for income taxes decreased $6.6 million, or 17% in year ended December 31, 2022 compared to the higher income before income taxes for the year ended December 31, 2020,2021. The decrease in provision for income taxes recognized during the year ended December 31, 2021 was due primarily to decreased profitability. This was offset by benefits generated undera $1.5 million tax expense related to excess stock-based compensation deductions recognized during 2022, compared to $0.4 million tax expense recognized during 2021. Furthermore, a $3.9 million tax expense was recognized during 2022 in connection with the Coronavirus Aid, Relief, and Economic Security Act.Section 162(m) excess officer compensation limitation, compared to $2.0 million tax expense recognized during 2021.
Segment Income (Loss)(loss) from Operations by Segment
|
| Year Ended December 31, |
|
| Change |
| ||||||||||
|
| 2020 |
|
| 2019 |
|
| Amount |
|
| % |
| ||||
|
| (dollars in thousands) |
| |||||||||||||
United States |
| $ | 120,836 |
|
| $ | 73,872 |
|
| $ | 46,964 |
|
|
| 64 | % |
International |
|
| (23,080 | ) |
|
| (39,550 | ) |
|
| 16,470 |
|
|
| 42 |
|
Total |
| $ | 97,756 |
|
| $ | 34,322 |
|
| $ | 63,434 |
|
|
| 185 | % |
Percentage of segment revenue: |
|
|
|
|
|
|
|
|
|
|
|
|
|
|
|
|
United States |
|
| 23 | % |
|
| 13 | % |
|
|
|
|
|
|
|
|
International |
|
| (73 | )% |
|
| (117 | )% |
|
|
|
|
|
|
|
|
|
| Year Ended December 31, |
|
| Change |
| ||||||||||
|
| 2022 |
|
| 2021 |
|
| Amount |
|
| % |
| ||||
|
| (dollars in thousands) |
| |||||||||||||
Segment Income (loss) from Operations |
|
|
|
|
|
|
|
|
|
|
|
| ||||
U.S. Marketplace |
| $ | 125,796 |
|
| $ | 151,343 |
|
| $ | (25,547 | ) |
|
| (17 | )% |
Digital Wholesale |
|
| (9,174 | ) |
|
| 7,189 |
|
|
| (16,363 | ) |
|
| (228 | ) |
Other |
|
| (8,144 | ) |
|
| (10,264 | ) |
|
| 2,120 |
|
|
| 21 |
|
Total |
| $ | 108,478 |
|
| $ | 148,268 |
|
| $ | (39,790 | ) |
|
| (27 | )% |
Percentage of segment revenue: |
|
|
|
|
|
|
|
|
|
|
|
| ||||
U.S. Marketplace |
|
| 20 | % |
|
| 25 | % |
|
|
|
|
|
| ||
Digital Wholesale |
|
| (1 | ) |
|
| 2 |
|
|
|
|
|
|
| ||
Other |
|
| (18 | ) |
|
| (24 | ) |
|
|
|
|
|
| ||
Total |
|
| 7 | % |
|
| 16 | % |
|
|
|
|
|
| ||
United StatesU.S. Marketplace segment income from operations increased $47.0decreased $25.5 million, or 64%17%, in the year ended December 31, 20202022 compared to the year ended December 31, 2019. This increase2021 and represented 20% of U.S. Marketplace segment revenue for the year ended December 31, 2022 and 25% of U.S. Marketplace segment revenue for the year ended December 31, 2021. The decrease was due to decreasesincreases in revenue of $19.5 million, offset by increases in cost of revenue of $10.1 million and increases in operating expenses of $88.4 million related to cost savings efforts in connection with the COVID-19 pandemic, offset by decreases in revenue of $35.2 million and increases cost of revenue of $6.2$34.9 million.
International lossDigital Wholesale segment income from operations decreased $16.5$16.4 million, or 42%228%, in the year ended December 31, 20202022 compared to the year ended December 31, 2019. 2021 and represented 1% of Digital Wholesale segment revenue for the year ended December 31, 2022 and 2% of Digital Wholesale segment revenue for the year ended December 31, 2021. The decrease was due to decreases in operating expenses of $18.9 million due to ceasing of operations in certain markets and cost savings related to the Expense Reduction Plan, offset by decreasesincreases in revenue of $2.3$681.8 million, andoffset by increases in cost of revenue of $0.1$692.5 million and increases in operating expenses of $5.7 million.
53
Year Ended December 31, 2021 Compared to Year Ended December 31, 2020
47Revenue
Segment Revenue
|
| Year Ended December 31, |
|
| Change |
| ||||||||||
|
| 2021 |
|
| 2020 |
|
| Amount |
|
| % |
| ||||
|
| (dollars in thousands) |
| |||||||||||||
Segment Revenue |
|
|
|
|
|
|
|
|
|
|
|
| ||||
U.S. Marketplace |
| $ | 594,602 |
|
| $ | 519,835 |
|
| $ | 74,767 |
|
|
| 14 | % |
Digital Wholesale |
|
| 314,431 |
|
|
| — |
|
|
| 314,431 |
|
| NM(1) |
| |
Other |
|
| 42,340 |
|
|
| 31,616 |
|
|
| 10,724 |
|
|
| 34 |
|
Total |
| $ | 951,373 |
|
| $ | 551,451 |
|
| $ | 399,922 |
|
|
| 73 | % |
Percentage of segment revenue: |
|
|
|
|
|
|
|
|
|
|
|
| ||||
U.S. Marketplace |
|
| 62 | % |
|
| 94 | % |
|
|
|
|
|
| ||
Digital Wholesale |
|
| 33 |
|
| NM(1) |
|
|
|
|
|
|
| |||
Other |
|
| 4 |
|
|
| 6 |
|
|
|
|
|
|
| ||
Total |
|
| 100 | % |
|
| 100 | % |
|
|
|
|
|
| ||
U.S. Marketplace segment revenue increased $74.8 million, or 14%, in the year ended December 31, 2021 compared to the year ended December 31, 2020 and represented 62% of segment revenue for the year ended December 31, 2021 and 94% of total revenue for the year ended December 31, 2020. The increase was due to approximately $44 million in revenue reductions during the second quarter of 2020 as a result of the impact of fee reductions that we provided to our United States paying dealers during such quarter in response to the COVID-19 pandemic. The increase was also due in part to product upgrades for existing dealers and signing on new dealers with higher average monthly recurring revenue.
Digital Wholesale segment revenue increased $314.4 million in the year ended December 31, 2021 compared to the year ended December 31, 2020 and represented 33% of segment revenue for the year ended December 31, 2021. The increase was primarily due to our acquisition of a 51% interest in CarOffer and launch of our IMCO offering in 2021.
Segment Income (loss) from Operations
|
| Year Ended December 31, |
|
| Change |
| ||||||||||
|
| 2021 |
|
| 2020 |
|
| Amount |
|
| % |
| ||||
|
| (dollars in thousands) |
| |||||||||||||
Segment Income (loss) from Operations |
|
|
|
|
|
|
|
|
|
|
|
| ||||
U.S. Marketplace |
| $ | 151,343 |
|
| $ | 120,836 |
|
| $ | 30,507 |
|
|
| 25 | % |
Digital Wholesale |
|
| 7,189 |
|
|
| — |
|
|
| 7,189 |
|
| NM(1) |
| |
Other |
|
| (10,264 | ) |
|
| (23,080 | ) |
|
| 12,816 |
|
|
| 56 |
|
Total |
| $ | 148,268 |
|
| $ | 97,756 |
|
| $ | 50,512 |
|
|
| 52 | % |
Percentage of segment revenue: |
|
|
|
|
|
|
|
|
|
|
|
| ||||
U.S. Marketplace |
|
| 25 | % |
|
| 23 | % |
|
|
|
|
|
| ||
Digital Wholesale |
|
| 2 |
|
| NM(1) |
|
|
|
|
|
|
| |||
Other |
|
| (24 | ) |
|
| (73 | ) |
|
|
|
|
|
| ||
Total |
|
| 16 | % |
|
| 18 | % |
|
|
|
|
|
| ||
U.S. Marketplace segment income from operations increased $30.5 million, or 25%, in the year ended December 31, 2021 compared to the year ended December 31, 2020 and represented 25% of U.S. Marketplace segment revenue for the year ended December 31, 2021 and 23% of U.S. Marketplace segment revenue for the year ended December 31, 2020. The increase was due to increases in revenue of $74.8 million, offset by increases in cost of revenue of $7.4 million and increases in operating expenses of $36.9 million.
Digital Wholesale segment income from operations increased $7.2 million in the year ended December 31, 2021 compared to the year ended December 31, 2020 and represented 2% of Digital Wholesale segment revenue for the year ended December 31, 2021. The increase was primarily due to our acquisition of a 51% interest in CarOffer and launch of our IMCO offering in 2021.
54
Liquidity and Capital Resources
Cash, Cash Equivalents and Investments
AtAs of December 31, 2020 and 2019,2022, our principal sources of liquidity were cash and cash equivalents of $190.3$469.5 million. As of December 31, 2021, our principal sources of liquidity were cash and cash equivalents of $231.9 million and $59.9 million, respectively, and investments in certificates of deposit with terms of greater than 90 days but less than one year of $100.0 million and $111.7 million, respectively.$90.0 million.
Sources and Uses of Cash
OurDuring the years ended December 31, 2022 and 2021, our cash flows from operating, investing, and financing activities, as reflected in the consolidated statements of cash flows, are summarized in the following table:as follows:
|
| Year Ended December 31, |
| |||||
|
| 2020 |
|
| 2019 |
| ||
|
| (in thousands) |
| |||||
Net cash provided by operating activities |
| $ | 156,743 |
|
| $ | 70,116 |
|
Net cash used in investing activities |
|
| (16,895 | ) |
|
| (22,257 | ) |
Net cash used in financing activities |
|
| (10,085 | ) |
|
| (14,693 | ) |
Impact of foreign currency on cash |
|
| 440 |
|
|
| (1 | ) |
Net increase in cash, cash equivalents, and restricted cash |
| $ | 130,203 |
|
| $ | 33,165 |
|
|
| Year Ended December 31, |
| |||||
|
| 2022 |
|
| 2021 |
| ||
|
| (in thousands) |
| |||||
Net cash provided by operating activities |
| $ | 256,106 |
|
| $ | 98,292 |
|
Net cash provided by (used in) investing activities |
|
| 72,730 |
|
|
| (68,149 | ) |
Net cash (used in) provided by financing activities |
|
| (92,620 | ) |
|
| 17,808 |
|
Impact of foreign currency on cash |
|
| (364 | ) |
|
| (597 | ) |
Net increase in cash, cash equivalents, and restricted cash |
| $ | 235,852 |
|
| $ | 47,354 |
|
Our operations have been financed primarily from operating activities. WeDuring the years ended December 31, 2022 and 2021, we generated cash from operating activities of $156.7$256.1 million during 2020 and $70.1$98.3 million, during 2019.respectively.
We believe that our existing sources of liquidity, including access to our 2022 Revolver, will be sufficient to fund our operations for at least the next 12 months from the date of the filing of this Annual Report on Form 10-K. During the second quarter of 2020 in connection with the COVID-19 pandemic, we implemented the Expense Reduction Plan, pursuant to which we reduced our workforce, ceased operation of certain international marketplaces, halted expansion efforts in any new international markets, and implemented targeted reductions in sales and marketing expenses, including across both algorithmic traffic acquisition and brand spend, and discretionary operating expenses. Our future capital requirements will depend on many factors, including, but not limited to: the further impact of the COVID-19 pandemic,pandemic; our revenue, costsrevenue; expenses associated with our sales and marketing activities and the support of our product, technology, and development efforts,efforts; expenses associated with our facilities build-out under our 1001 Boylston Street lease that do not qualify for landlord reimbursement; payments received in advance from a third-party payment processor; activity under our Share Repurchase Program; and our investments in international markets,markets. Our long-term future capital requirements will depend on many factors, including the future cash requirements described above, as well as the potential exercise of a call right to acquire all, and not less than all, of the remaining equity interests in CarOffer and the timingrepresentative of the holders of the remaining equity will have a put right to sell to us, all, and extentnot less than all, of our cost savings relatedthe remaining equity interests of CarOffer. Details of this acquisition are more fully described in Note 2 to the Expense Reduction Plan.these consolidated financial statements. Cash from operations could also be affected by various risks and uncertainties, including, but not limited to, themacroeconomic effects of the COVID-19 pandemic and other risks detailed in the “Risk Factors” section of this Annual Report on Form 10-K.
On September 26, 2022, we entered into a Credit Agreement with PNC Bank, National Association, as administrative agent and collateral agent and an L/C Issuer (as defined in the Credit Agreement), and the other lenders, L/C Issuers and parties thereto from time to time, or the Credit Agreement. The Credit Agreement consists of a revolving credit facility, or the 2022 Revolver, which allows us to borrow up to $400.0 million, $50.0 million of which may be comprised of a letter of credit sub-facility. The borrowing capacity under the Credit Agreement may be increased in accordance with the terms and subject to the adjustments as set forth in the Credit Agreement. For example, the borrowing capacity may be increased by an amount up to the greater of $250.0 million or 100% of Four Quarter Consolidated EBITDA (as defined in the Credit Agreement) if certain criteria are met and subject to certain restrictions. Any such increase requires lender approval. Proceeds of any borrowings may be used for general corporate purposes. The 2022 Revolver is scheduled to mature on September 26, 2027. As of December 31, 2022, there were no borrowings and no letters of credit outstanding under the 2022 Revolver.
55
On December 8, 2022, we announced that our Board of Directors authorized the Share Repurchase Program, pursuant to which we may, from time to time, purchase shares of our Class A common stock for an aggregate purchase price not to exceed $250 million. Share repurchases under the Share Repurchase Program may be made through a variety of methods, including but not limited to open market purchases, privately negotiated transactions and transactions that may be effected pursuant to one or more plans under Rule 10b5-1 and/or Rule 10b-18 of the Exchange Act. The Share Repurchase Program does not obligate us to repurchase any minimum dollar amount or number of shares. The Share Repurchase Program has an expiration date of December 31, 2023, and prior to its expiration may be modified, suspended, or discontinued by our Board of Directors at any time without prior notice. All repurchased shares under the Share Repurchase Program will be retired. We expect to fund share repurchases through cash on hand and cash generated from operations. During the year ended December 31, 2022, we repurchased and retired 1,350,473 shares for $18,691, at an average cost of $13.84 per share under this authorization. As of December 31, 2022, we had remaining authorization to purchase up to $231,309 of our common stock under the Share Repurchase Program.
To the extent that existing cash, cash equivalents, and investments and cash from operationsour borrowing capacity under the 2022 Revolver are insufficient to fund our future activities, we may need to raise additional funds through a public or private equity or debt financing. Additional funds may not be available on terms favorable to us, or at all, including dueall. See “Risk Factors—Risks Related to increased volatility in theOur Business and Industry— We may require additional capital markets attributable to the COVID-19pursue our business objectives and respond to business opportunities, challenges, or unforeseen circumstances. If we are unable to generate sufficient cash flows or if capital is not available to us, our business, operating results, financial condition, and prospects could be adversely affected pandemic.”.
Operating Activities
Cash provided by operating activities of $156.7$256.1 million during 2020 the year ended December 31, 2022 was due primarily to consolidated net income of $77.6$79.0 million, adjusted for $45.1$54.8 million of stock-based compensation expense, $22.2$45.3 million of deferred taxes, $11.6depreciation and amortization, $11.1 million of amortization of deferred contract costs, $11.3and $1.8 million of provision for doubtful accounts, offset in part by $22.1 million of deferred taxes. Cash provided by operating activities was also attributable to a $153.0 million decrease in accounts receivable and a $14.4 million decrease in inventory. The increases in cash flow from operations were partially offset by a $35.4 million decrease in accounts payable, a $25.1 million decrease in accrued expenses, accrued income taxes, and other liabilities, a $13.7 million increase in deferred contract costs, a $6.6 million increase in prepaid expenses, prepaid income taxes, and other assets, a $0.5 million decrease in lease obligations, and a $0.5 million decrease in deferred revenue.
Cash provided by operating activities of $98.3 million during the year ended December 31, 2021 was due primarily to consolidated net income of $110.4 million, adjusted for $53.5 million of stock-based compensation expense, $40.5 million of depreciation and amortization, $12.7 million of amortization of deferred contract costs, $6.2 million of deferred taxes, $3.1 million of impairment of long-lived assets, and $1.9$1.0 million of provision for doubtful accounts. Cash provided by operating activities was also attributable to a $7.5$35.8 million increase in accrued expenses, accrued income taxes, and other liabilities, a $3.9$35.4 million decreaseincrease in accounts receivable,payable, a $3.7 million increase in deferred revenue, and a $3.5$1.0 million decreaseincrease in prepaid expenses, prepaid income taxes, and other assets.lease obligations. The increases in cash flow from operations were partially offset by a $15.1 million decrease in accounts payable, and a $11.4 million increase in deferred contract costs.
Cash provided by operating activities of $70.1 million during 2019 was due primarily to net income of $42.1 million, adjusted for $34.3 million of stock-based compensation expense, $8.4 million of amortization of deferred contract costs and $7.8 million of depreciation and amortization, partially offset by $3.7 million of deferred taxes. Cash provided by operating activities was also attributable to a $4.3 million increase in accounts payable, a $2.8 million increase in accrued expenses, accrued income taxes, and other liabilities and a $1.2 million increase in deferred revenue, partially offset by a $16.0 million increase in deferred contract costs, a $9.6$174.8 million increase in accounts receivable due primarily to the acquisition of a 51% interest in CarOffer, a $17.3 million increase in inventory, a $7.7 million increase in gross deferred contract costs, and a $1.5$5.1 million decreaseincrease in lease obligations.prepaid expenses, prepaid income taxes, and other assets.
48
Investing Activities
Cash provided by investing activities of $72.7 million during the year ended December 31, 2022 was due to $90 million of maturities in certificates of deposit, offset in part by $11.3million of capitalization of website development costs and $5.9 million of purchases of property and equipment.
Cash used in investing activities of $16.9$68.1 million during 2020 the year ended December 31, 2021 waswas due to $21.1$64.3 million of acquisition cash payments, net of cash acquired, $4.6$7.7 million of purchases of property and equipment, and $6.2 million related to the capitalization of website development costs, and $3.0 million of purchases of property and equipment, offset in part by $111.7$130.0 million of maturities in certificates of deposit, net of investments in certificates of deposit of $100.0 million$120.0 million..
Cash used in investing activities of $22.3 million during 2019 was due to $19.1 million of acquisition cash payments, $11.2 million of purchases of property and equipment and $3.0 million related to the capitalization of website development costs. This was offset by $188.9 million of maturities of certificates of deposit, net of investments in certificates of deposit of $177.8 million.56
Financing Activities
Financing Activities
Cash used in financing activities of $10.1$92.6 million during 2020 the year ended December 31, 2022 was due primarily to a $40.3 million decrease in gross advance payments received from third-party payment processor, $19.9 million of payment of tax distributions to redeemable noncontrolling interest holders, $16.0 million of payment of withholding taxes on net share settlements of restricted stock units, $14.4 million of payment for the repurchase of our Class A common stock under the Share Repurchase Program, and $2.6 million of payment of deferred financing costs, partially offset by $0.7 million of proceeds from the issuance of common stock upon exercise of stock options.
Cash provided by financing activities of $17.8 million during the year ended December 31, 2021 was due primarily to $46.8 million increase in gross advance payments received from third-party payment processor and $0.7 million related to the proceeds from the issuance of common stock upon exercise of stock options, partially offset by payment of withholding taxes on net share settlements of restricted stock units, of $11.2$15.4 million partially offset by $1.1and CarOffer's repayment of a line of credit of $14.3 million related to the proceeds from the issuance of common stock related to the exercise of vested stock options.
Cash used in financing activities of $14.7 million during 2019 was due primarily to the payment of withholding taxes and option costs on net share settlements of restricted stock units and stock options of $16.5 million, partially offset by $1.8 million related to the proceeds from the exercise of stock options.
Contractual Obligations and Known Future Cash Requirements
Contractual Obligations and Commitments
We do not have any debt or material finance obligations as of December 31, 2020. All of our property, equipment, and internal-use software have been purchased with cash, with the exception of amounts relatedRefer to unpaid property and equipment and internal-use software as disclosed in the consolidated statements of cash flows and immaterial amounts related to obligations under one finance lease as of December 31, 2020. We have no material long‑term purchase obligations outstanding with any vendors or third parties.
Leases
Our primary operating lease obligations consist of various leases for office space in: Boston, Massachusetts; Cambridge, Massachusetts; San Francisco, California; and Dublin, Ireland. We also have an operating lease obligation for data center space in Needham, Massachusetts.
Our leases have various lease terms expected to continue through 2038. The terms of our Massachusetts and San Francisco lease agreements provide for rental payments that increase on an annual basis. The leases in Boston, Massachusetts and Cambridge, Massachusetts have associated letters of credit, which are recorded as restricted cash within the consolidated balance sheet. At December 31, 2020 and 2019, restricted cash was $10,627 and $10,803, respectively, and primarily related to cash held at a financial institution in an interest-bearing cash account as collateral for the letters of credit related to the contractual provisions for the Company’s building leases. At December 31, 2020 and 2019, portions of restricted cash were classified as short-term assets and long-term assets.
On January 25, 2021, the Company entered into a lease for approximately 61,826 square feet of office space in Addison, Texas. Details of this acquisition are more fully described in Note 169 of our consolidated financial statements includedappearing elsewhere in Item 8 of this Annual Report on Form 10-K.
Set forth below is information concerning10-K for our known contractual obligations at December 31, 2020and commitments.
Seasonality
Across the retail automotive industry, consumer purchases are typically greatest in the first three quarters of each year, due in part to the introduction of new vehicle models from manufacturers and the seasonal nature of consumer spending. Additionally, the volume of wholesale vehicle sales can fluctuate from quarter to quarter caused by several factors, including the timing of used vehicles available for sale from selling customers, the seasonality of the retail market for used vehicles and/or inventory challenges in the automotive industry, which affect the demand side of the wholesale industry.
Macroeconomic conditions, such as slower growth or recession, higher interest rates, high unemployment, consumer confidence in the economy, consumer debt levels, the ongoing military conflict between Russia and Ukraine, foreign currency exchange rate fluctuations and other matters that are fixedinfluence consumer spending and determinable.preferences, can also impact the volume of wholesale vehicle sales, as was evidenced by the global semiconductor chip shortage.
|
| Total |
|
| Less than 1 year |
|
| 1 to 3 years |
|
| 3 to 5 years |
|
| More than 5 years |
| |||||
|
| (in thousands) |
| |||||||||||||||||
Operating lease obligations |
| $ | 342,559 |
|
| $ | 14,424 |
|
| $ | 28,892 |
|
| $ | 45,118 |
|
| $ | 254,125 |
|
Total contractual obligations |
| $ | 342,559 |
|
| $ | 14,424 |
|
| $ | 28,892 |
|
| $ | 45,118 |
|
| $ | 254,125 |
|
49
The table above includes leases signed butDigital Wholesale segment operating results have reflected the general seasonality of the wholesale vehicle sales market and macroeconomic conditions of the automotive industry. The U.S. Marketplace segment operating results have reflected the macroeconomic conditions of the automotive industry. However, to date, the U.S. Marketplace segment operating results have not yet commenced asbeen materially impacted by the general seasonality of December 31, 2020the automotive industry. This could possibly change once our business and is basedmarkets mature.
As a result, revenue and cost of revenue related to volume will fluctuate accordingly on expected commencement dates.a quarterly basis. Typical seasonality trends may not be observed in periods where other external factors more significantly impact the wholesale industry.
Acquisitions
On January 14, 2021 we completed the acquisition of a 51% interest in CarOffer, LLC, an automated instant vehicle trade platform based in Plano, Texas. Details of this acquisition are more fully described in Note 16 of our consolidated financial statements included in Item 8 of this Annual Report on Form 10-K.
Off‑Balance Sheet Arrangements
As of December 31, 20202022 and 2019,2021, we did not have any off‑balanceoff-balance sheet arrangements, other than leases signed but not commenced, or material leases that are less than twelve months in duration, that have or are reasonably likely to have a current or future material effect on our financial condition, changes in financial condition, revenues or expenses, results of operations, liquidity, capital expenditures, or capital resources.
Critical Accounting Policies and Significant Estimates
The preparation of the consolidated financial statements in conformity with GAAP requires usmanagement to make estimates and assumptions that affect the reported amounts of assets and liabilities, and the disclosure of contingent assets and liabilities at the date of the financial statements, and the reported amounts of revenue and expenses during the reporting period.
57
Although we regularly assess these estimates, actual results could differ materially from these estimates. We base our estimates on historical experience and various other assumptions that we believe to be reasonable under the circumstances. Actual results may differ from ourmanagement’s estimates if these results differ from historical experience, or other assumptions do not turn out to be substantially accurate, even if such assumptions are reasonable when made. Changes in estimates are recordedrecognized in the period in which they become known.
SignificantCritical estimates relied upon in preparing the consolidated financial statements include the determination of sales allowance and variable consideration in our revenue recognition, allowance for doubtful accounts, the expensing andimpairment of long-lived assets, the capitalization of product, technology, and development costs for website development, and internal-use software and hosting arrangements, the valuation of acquired assets and liabilities, the valuation and recoverability of goodwill and intangible assets and other long-lived assets,goodwill, the valuation of redeemable noncontrolling interest, the recoverability of our net deferred tax assets and related valuation allowance, the valuation of inventory, and stock-based compensation.the valuation of equity and liability-classified compensation awards. Accordingly, we consider these to be our critical accounting policies,estimates, and believe that of our significant accounting policies, which are described in Note 2 to the notes to our consolidated financial statements included in Item 8 of this Annual Report on Form 10-K, these involve a greaterthe greatest degree of judgment and complexity.
Revenue Recognition – Sales Allowance and Variable Consideration
SourcesOur accounting policy relating to revenue recognition reflects the impact of the adoption of Accounting Standards Codification 606, Revenue
from Contracts with Customers, or ASC 606, which is discussed further in the Notes to the Consolidated Financial Statements. As prescribed by ASC 606, we recognize revenue based on a five-step approach. We derive our revenue from two sources: (1) marketplace subscription revenue, which consistswholesale revenue, and product revenue. Marketplace revenue is included in the U.S. Marketplace segment and Other category of segment reporting. Wholesale revenue and product revenue are included in the Digital Wholesale segment. We generate marketplace revenue primarily offrom (i) dealer subscriptions to our Listings packages, RPM, digital advertising suite, and Dealer Display subscriptions, and (2) advertising and other revenue, which consists primarily of displayDigital Retail, (ii) advertising revenue from auto manufacturers and other auto‑related brand advertisers, as well asand (iii) revenue from partnerships with financing services companies.
Marketplace Subscription Revenue
We offer multiple typesgenerate wholesale revenue primarily from (i) transaction fees earned from Dealer-to-Dealer transactions, (ii) transaction fees earned from sale of marketplace Listings packagesvehicles to our dealers through our CarGurus U.S. platform (availability varies on our other marketplaces): Restricted Listings (formerly referred to as Basic Listings), which is free; and various levels of Listings packages, which each require a paid subscription under a monthly, quarterly, semiannual, or annual subscription basis.
Our subscriptions for customers generally auto-renew on a monthly basis and are cancellable by dealers with 30 days’ advance notice at the end of the committed term, although during the second quarter of 2020 we did not require 30 days’ advance notice of termination from dealers who cancelled as a result of the COVID-19 pandemic. Subscription pricing is determined based on a dealer’s inventory size, region, and our assessment of the connections and ROI the platform will provide them and is subject to discounts and/or fee reductions that we may offeracquire at other marketplaces, and (iii) transaction fees earned from timeperforming inspection and transportation services, inclusive of Dealer-to-Dealer transactions, other marketplace to time.dealer transactions, and IMCO transactions. We also offer all dealers on our platform access to our Dealer Dashboard, which includes a performance summary, Dealer Insights tool, and user review management platform. Only dealers subscribing to a paid Listings package also have access to the Pricing Tool, Market Analysis tool and our IMV Scan tool.
50
Dealer customers do not have the right to take possession of our software.
In addition to displaying inventory in our marketplace and providing access to the Dealer Dashboard, we offer dealers subscribing to certain of our Listings packages other subscription advertising and customer acquisition products and enhancements, including Dealer Display, which is marketed under our Real-time Performance Marketing suite. With Dealer Display, dealers can buy display advertising that appears in our marketplace, on other sites on the internet and/or on Facebook, a highly converting social media platform. Such advertisements can be targeted by the user’s geography, search history, CarGurus website activity (including showing a consumer relevant vehiclesgenerate product revenue primarily from a dealer’s inventory that the consumer has not yet discovered on our marketplace), and a number of other targeting factors, allowing dealers to increase their visibility with in-market consumers and drive qualified traffic for dealers.
Payment is typically due on first day of each calendar month and is recorded as accounts receivable or short-term deferred revenue when payment is received in advance of services being delivered to the customers.
We also offer paid Listings packages for the Autolist website and paid Listings and display products for the PistonHeads website.
Advertising and Other Revenue
Advertising and other revenue consists primarily of non-dealer display advertising revenue from auto manufacturers and other auto-related brand advertisers sold on a cost per thousand impressions, or CPM, basis. An impression is an advertisement loaded on a web page. In addition to advertising sold on a CPM basis, we also have advertising sold on a cost per click basis. Auto manufacturers and other brand advertisers can execute advertising campaigns that are targeted across a wide variety of parameters, including demographic groups, behavioral characteristics, specific auto brands, categories such as Certified Pre-Owned, and segments such as hybrid vehicles. We do not provide minimum impression guarantees or other types of minimum guarantees in our contracts with customers. Pricing is primarily based on advertisement size and position on our websites and mobile applications, and fees are billed monthly in arrears. Unbilled accounts receivable relate to services rendered in the current period, but generally not invoiced until the subsequent period.
We sell advertising directly to auto manufacturers and other auto related brand advertisers, as well as indirectly through revenue sharing arrangements with advertising exchange partners. Company-sold advertising is not subject to revenue sharing arrangements. Company-sold advertising revenue is recognized based on the gross amount charged to the advertiser. Partner-sold advertising revenue is recognized based on the net amount of revenue(i) aggregate proceeds received from the content partners.
Revenue from advertising sold directly by us is recorded on a gross basis because we are the principal in the arrangement, control the ad placementsale of vehicles that were acquired through IMCO transactions, and timing of the campaign, and establish the selling price. We enter into contractual arrangements directly with advertisers and are directly responsible for the fulfillment of the contractual terms including any remedy for issues with such fulfillment.
Advertising revenue subject to revenue sharing agreements between us and advertising exchange partners is recognized based on the net amount of revenue(ii) proceeds received from the partner. The advertising partner is responsible for fulfillment, including the acceptabilitysale of vehicles that were acquired through arbitration. Critical accounting estimates associated with each of the services delivered. In partner-sold advertising arrangements, the advertising partner has a direct contractual relationship with the advertiser. There is no contractual relationship between us and the advertiser for partner-sold transactions. When an advertising three revenue sources are outlined below.exchange partner sells advertisements, the partner is responsible for fulfilling the advertisements, and accordingly, we have determined the advertising partner is the principal in the arrangement. Additionally, for auction-based partner agreements, we have latitude in establishing the floor price, but the final price established by the exchange server is at market rates.
Customers are billed monthly in arrears and payment terms are generally thirty to sixty days from the date invoiced.
Advertising and other revenue also includes revenue from partnerships with certain financing services companies pursuant to which we enable eligible consumers on our CarGurus U.S. website to pre-qualify for financing on cars from dealerships that offer financing through such companies. We primarily generate revenue from these partnerships based on the number of funded loans from consumers who pre-qualify with our lending partners through our site.
We also offer non-dealer display products for the Autolist and PistonHeads websites.
51
Revenue Recognition
Accounting Standards Codifications, or ASC, Topic 606, Revenue from Contracts with Customers, or ASC 606, outlines a comprehensive five-step revenue recognition model based on the principle that an entity should recognize revenue to depict the transfer of promised goods or services to customers in an amount that reflects the consideration to which the entity expects to be entitled in exchange for those goods or services. To achieve this core principle, we apply the following five steps:
|
|
|
|
|
|
|
|
|
|
Marketplace Subscription Revenue
For dealer listings, we provide a single similar service each day for a period of time. Each time increment (i.e., one day), rather than the underlying activities, is distinct and substantially the same and therefore our performance obligation is to provide a series of daily activities over the contract term. Similar to the dealer listings, the dealer display advertising is considered a promise to provide a single similar service each day. Each time increment is distinct and substantially the same and therefore our performance obligation is to provide a series of daily activities over the contract term.
Total consideration for marketplace subscription revenue is stated within the contracts. There are no contractual cash refund rights, but credits may be issued to a customer at our sole discretion. Dealer customers do not have the right to take possession of our software. At the portfolio level, there is also variable consideration that needs to be included in the transaction price. Variable consideration consists of sales allowances, usage fees, and concessions that change the transaction price of the unsatisfied or partially unsatisfied performance obligation. We recognize that there are times when there is a customer satisfaction issue or other circumstancecircumstances that will lead to a credit. Due to the known possibility of future credits, a monthly sales allowance review is performed to defer revenue at a portfolio level for such future adjustments in the period of incurrence. We establish sales allowances at the time of revenue recognition based on our history of adjustments and credits provided to our customers. In assessing the adequacy of the sales allowance, we evaluate our history of adjustments and credits made through the date of the issuance of the financial statements. Estimated sales adjustments, credits and losses may vary from actual results which could lead to material adjustments to the financial statements. Sales allowances are recorded as a reduction to revenue in the consolidated income statements.
Performance obligations are satisfied over time as the customer simultaneously receives and consumes the benefit of the service. Revenue is recognized ratably over the subscription period beginning on the date we start providing services to the customer under the contract. Revenue is presented net of any taxes collected from customers.
Advertising and Other Revenue
For advertising revenue, the performance obligation is to publish the agreed upon campaign on our websites and load the related impressions.
Advertising contracts state the transaction price within the agreement with payment generally being based on the number of clicks or impressions delivered on our websites. Total consideration is based on output and deemed variable consideration constrained by an agreed upon delivery schedule.schedule and is allocated to the period in which the service was rendered. Additionally, there are generally no contractual cash refund rights. Certain contracts do contain the right for credits in situations in which impressions are not displayed in compliance with contractual specifications. At an individual contract level, we may give a credit for a customer satisfaction issue or other circumstance. Due to the known possibility of future credits, a monthly review is performed to defer revenue at an individual contract level for such future adjustments in the period of incurrence.
As consideration is driven by Although these credits have not been material and have not changed significantly over the number of impressions delivered on our websites, the consideration for eachhistorical period, is allocatedestimated sales adjustments credits and losses may vary from actual results which could lead to material adjustments to the period in which the service was rendered.financial statements.
52
Performance obligations for company-sold advertising revenue and partner-sold advertising revenue are satisfied over time as impressions are delivered. Revenue is recognized based on the total number of impressions delivered within the specified period. Revenue from advertising sold directly by us is recognized based on the gross amount charged to the advertiser and advertising revenue sold by partners is recognized based on the net amount of revenue received from the content partners. Revenue is presented net of any taxes collected from customers.
Other marketplace revenue includes revenue from contracts for which the performance obligation is a series of distinct services with the same level of effort daily. For these contracts, primarily related to our partnerships with financing services companies, we estimate the value of the variable consideration in determining the transaction price and allocate it to the performance obligation. Revenue is estimated and recognized on a ratable basis over the contractual term. We reassess the estimate of variable consideration at each reporting period.
Contracts with Multiple Performance Obligations58
We periodically enter into arrangements that include Listings and Dealer Display within marketplace subscription revenue. These contracts include multiple promises that we evaluate to determine if the promisesWithin wholesale transactions, there are separate performance obligations. Performance obligations are identified based on services totypically no contractual cash refund rights, but credits may be transferredissued to a customer that are distinct withinat our sole discretion and refunds may be required by law in the contextcase of a vehicle defect. At the contractual terms. Once the performance obligations have been identified, we determine the transaction price, which includes estimating the amount ofportfolio level, there is also variable consideration that needs to be included in the transaction price, if any. If required,price. Variable consideration consists of sales allowances and concessions that change the transaction price of the unsatisfied or partially unsatisfied performance obligation. We recognize that there are times when there is allocateda customer satisfaction issue or other circumstance that will lead to each performance obligationa credit or arbitration. We establish sales allowances at the time of revenue recognition based on our history of adjustments and credits provided to our customers. In assessing the adequacy of the sales allowance, we evaluate our history of adjustments and credits made through the date of the issuance of the financial statements. Upon recognizing a sales transaction, we estimate the amount of transaction price that will be reversed in a subsequent period and record a reserve for returns and cancellations in other current liabilities in the contractconsolidated income statements. Estimated sales adjustments, credits and losses may vary from actual results which could lead to material adjustments to the financial statements.
Within product transactions, there are typically no contractual cash refund rights, but credits may be issued to a customer at our sole discretion. At the portfolio level, there is also variable consideration that needs to be included in the transaction price. Variable consideration consists of sales allowances and concessions that change the transaction price of the unsatisfied or partially unsatisfied performance obligation. We recognize that there are times when there is a customer satisfaction issue or other circumstance that will lead to a credit or arbitration. We establish sales allowances at the time of revenue recognition based on a relative standalone selling price method asour history of adjustments and credits provided to our customers. In assessing the performance obligation is being satisfied. For our arrangements that include Listings and Dealer Display, the performance obligations were satisfied over a consistent period of time and therefore the allocations did not impact the revenue recognized.
Costs to Obtain a Contract
Commissions paid to sales representatives and payroll taxes are considered costs to obtain a contract. Under ASC 606, the costs to obtain a contract require capitalization and amortization of those costs over the period of benefit. Although the guidance specifies the accounting for an individual contract with a customer, as a practical expedient, we have opted to apply the guidance to a portfolio of contracts with similar characteristics. We have opted to apply another practical expedient to immediately expense the incremental cost of obtaining a contract when the underlying related asset would have been amortized over one year or less. As such, we applied this practical expedient to advertising contracts as the term is one year or less and these contracts do not renew automatically. The practical expedient is not applicable to marketplace subscription contracts as the period of benefit including renewals is anticipated to be greater than one year as commissions paid on contract renewals are not commensurate with the commissions paid on the initial contract. The assets are periodically assessed for impairment.
For marketplace subscription customers, the commissions paid on contracts with new customers, in addition to any commission amount related to incremental sales, are capitalized and amortized over the estimated benefit periodadequacy of the customer relationship taking into account factors such as peer estimatessales allowance, we evaluate our history of technology livesadjustments and customer lives as well as our own historical data. Commissions paidcredits made through the date of the issuance of the financial statements. Upon recognizing a sales transaction, we estimate the amount of transaction price that are not directly relatedwill be reversed in a subsequent period and record a reserve for returns and cancellations in other current liabilities in the consolidated income statements. Estimated sales adjustments, credits and losses may vary from actual results which could lead to obtaining a new contract are expensed as incurred.
Additionally, we allocate employer payroll tax expensematerial adjustments to the commission expense in proportion to the overall payroll taxes paid during the respective period. As such, capitalized payroll taxes are amortized in the same manner as the underlying capitalized commissions.
The assets recognized for costs to obtain a contract were $20.0 million and $20.1 million as of December 31, 2020, and December 31, 2019, respectively. Amortization expense recognized during the years ended December 31, 2020 and 2019 related to costs to obtain a contract were $11.6 million and $8.4 million, respectively.financial statements.
Accounts Receivable and– Allowance for Doubtful Accounts
Accounts receivable are recorded based on the amount due from the customer and do not bear interest.
We are exposed to credit losses primarily through our trade accounts receivable. We offset gross trade accounts receivable with an allowance for doubtful accounts. The allowance for doubtful accounts is our best estimate of the amount of probable credit losses in our existing accounts receivable and is based upon historical loss trends, the number of days that billings are past due, an evaluation of the potential risk of loss associated with specific accounts, current economic trends and conditions, and reasonable and supportable forecasts of economic conditions.
53
Amounts are charged against the allowance after all means of collection have been exhausted, the potential for recovery is considered remote and when it is determined that expected credit losses may occur. We do not have any off‑balance sheet credit exposure related to our customers. Provisions for allowances for doubtful accounts are recorded in general and administrative expense within the consolidated income statements. Unbilled accounts receivable are recorded for services rendered in the current period, but generally not invoiced until the subsequent period.
We also consider current economic trends when evaluating the adequacy of the allowance for doubtful accounts. If circumstances relating to specific customers change, or unanticipated changes occur in the general business environment, particularly as it affects auto dealers, such as the impacts of the COVID-19 pandemic, our estimateestimates of the recoverability of receivables could be further adjusted.
In light of the COVID-19 pandemic, we assessed the implications on accounts receivable and increased its allowance for doubtful accounts to $616 as of December 31, 2020 as compared to $240 as of December 31, 2019. The increase in account delinquencies due to the COVID-19 pandemic resulted in $1,930 of bad debt expense and $1,554 of write offs, net of recoveries for the year ended December 31, 2020.
Below is a summary of the changes in our allowance for doubtful accounts for the years ended December 31, 2020 and 2019:
|
| Balance at Beginning of Period |
|
| Provision |
|
| Write–offs, net of recoveries |
|
| Balance at End of Period |
| ||||
Year ended December 31, 2020 |
| $ | 240 |
|
| $ | 1,930 |
|
| $ | (1,554 | ) |
| $ | 616 |
|
Year ended December 31, 2019 |
|
| 479 |
|
|
| 1,091 |
|
|
| (1,330 | ) |
|
| 240 |
|
Impairment of Long‑Lived Assets– Impairment
We evaluate the recoverability of long‑livedlong-lived assets, such as property and equipment and intangible assets, for impairment at least annually and whenever events or changes in circumstances indicate that the carrying value of an asset may not be recoverable. During this review, we re‑evaluate the significant assumptions used in determining the original cost and estimated lives of long‑livedlong-lived assets. Although the assumptions may vary from asset to asset, they generally include operating results, changes in the use of the asset, cash flows, and other indicators of value. Management then determines whether the remaining useful life continues to be appropriate, or whether there has been an impairment of long‑lived assets based primarily upon whether expected future undiscounted cash flows are sufficient to support the assets’ recovery. Recoverability of these assets is measured by comparison of the carrying amount of the asset to the future undiscounted cash flows the asset is expected to generate. If the asset is considered to be impaired, the amount of any impairment is measured as the difference between the carrying value and the fair value of the impaired asset.
For the year ended December 31, 2020, we did not identify any impairment of long‑lived assets other than $1.2 million of write-offs in capitalized website development costs, of which $0.8 million related to the exit of certain international markets. For the year ended December 31, 2019, we did not identify any impairment of long-lived assets.
Capitalized Website Development and Internal-Use Software Costs– Capitalization
We capitalize certain costs associated with the development of our websites and internal‑use software products after the preliminary project stage is complete and until the software is ready for its intended use. Research and development costs incurred during the preliminary project stage or costs incurred for data conversion activities, training, maintenance, and general and administrative or overhead costs are expensed as incurred. Capitalization begins when the preliminary project stage is complete, management authorizes and commits to the funding of the software project with the required authority, it is probable the project will be completed, the software will be used to perform the functions intended and certain functional and quality standards have been met. Qualified costs incurred during the operating stage of our software applications relating to upgrades and enhancements are capitalized to the extent it is probable that they will result in added functionality, while costs that cannot be separated between maintenance of, and minor upgrades and enhancements to, websites and internal‑use software are expensed as incurred.
Capitalized website development and capitalized internal-use software development costs are amortized on a straight‑line basis over antheir estimated useful life of three years beginning with the time when the product is ready for intended use. Amounts amortized are presented through cost of revenue.
We evaluate the useful lives of these assets on an annual basiswhen each asset is ready for its intended use, and testsat least annually thereafter to ensure three years remains appropriate. We also test for impairment at least annually and whenever events or changes in circumstances occur that could impact the recoverability of these assets.
54
During Impairment is evaluated as discussed in the years ended December 31, 2020 and 2019, we capitalized $6.4 million and $4.2 million of website development costs, respectively. We recorded amortization expense associated with our capitalized website development costs of $3.3 million, including write offs of $0.8 million of capitalized website development costs related to the exit of certain international markets, and $1.6 million for the years ended December 31, 2020 and 2019, respectively.“Long-Lived Assets - Impairment” section above.
Since the adoption of ASU 2018-15, Intangibles Hosting Arrangements – Goodwill and Other – Internal-Use Software (Subtopic 350-24): Customer’s Accounting for Implementation Costs Incurred in a Cloud Computing Arrangement that is a Service Contract (ASU 2018-15), on January 1, 2019, we evaluate upfront costs including Capitalization
Capitalized implementation set-up or other costs (collectively, implementation costs) for hosting arrangements under the internal-use software framework. Costs related to preliminary project activities and post implementation activities are expensed as incurred, whereas costs incurred in the development stage are generally capitalized. Capitalized implementation costs are amortized on a straight‑line basis over an estimated useful life of the term of the hosting arrangement, taking into consideration several other factors such as, but not limited to, options to extend the hosting arrangement or options to terminate the hosting arrangement, beginning with the time when the software is ready for intended use. Amounts amortized are presented through operating expense, rather than depreciation or amortization.
59
We evaluate the useful lives of these assets on an annual basiswhen each asset is ready for its intended use, and testsat least annually thereafter to ensure the selected useful life remains appropriate. We also test for impairment at least annually and whenever events or changes in circumstances occur that could impact the recoverability of these assets. Impairment is evaluated as discussed in the “Long-Lived Assets - Impairment” section above.
During the years ended December 31, 2020 and 2019, we launched separate initiatives designed to evaluate and enhance our enterprise applications. During the year ended December 31, 2020 we capitalized $0.3 million of implementation costs in other non-current assets. During the year ended December 31, 2019 we capitalized $2.6 million and $0.6 million of implementation costs in other non-current assets and in prepaid expenses, prepaid income taxes and other current assets, respectively. We recorded amortization expense associated with our internal-use software of $0.7 million and $0.1 million for the years ended December 31, 2020 and 2019, respectively.
Business Combinations
Valuation of Acquired Assets and Liabilities – Valuation
We measure all consideration transferred in a business combination at its acquisition-date fair value. Consideration transferred is determined by the acquisition-date fair value of assets transferred, liabilities assumed, including contingent consideration obligations, as applicable. We measure goodwill as the excess of the consideration transferred over the net of the acquisition-date amounts of assets acquired less liabilities assumed.
We make significant assumptions and estimates in determining the fair value of the acquired assets and liabilities as of the acquisition date, especially the valuation of intangible assets and certain tax positions. We record estimates as of the acquisition date
Intangible Assets – Valuation and reassess the estimates at each reporting period up to one year after the acquisition date. Changes in estimates made prior to finalization of purchase accounting are recorded to goodwill.Recoverability
Intangible Assets
Intangible assets are recordedrecognized at their estimated fair value at the date of acquisition. Fair value is determined based on inputs and assumptions such as discount rates, rates of return on assets, and long-term sales growth rates.
We amortize intangible assets over their estimated useful lives on a straight-line basis. Amortization is recorded overUseful lives are established based on analysis of all pertinent factors such as: the relevant estimatedexpected use of the asset, expected useful lives ranging from threeof related assets, provisions that may limit the useful life, historical experience with similar arrangements, effects of economic factors, demand, competition, obsolescence, and maintenance required to eleven years. maintain the future cash flows.
We evaluate the useful lives of these assets as of the acquisition date and at least annually thereafter to ensure the selected useful life remains appropriate.
We monitor our long-lived assets for impairment indicators on an annualongoing basis in accordance with GAAP, and test for impairment at least annually and whenever events or changes in circumstances occur that could impact the recoverability of these assets. IfImpairment is evaluated as discussed in the estimate of an intangible asset’s remaining useful life is changed, we amortize the remaining carrying value of the intangible asset prospectively over the revised remaining useful life.“Long-Lived Assets - Impairment” section above.
For the years ended December 31, 2020Goodwill – Valuation and 2019, we did not identify any impairment of our intangible assets.Recoverability
Goodwill
Goodwill is recordedrecognized when consideration paid in a purchase acquisition exceeds the fair value of the net assets acquired. Goodwill is not amortized, but rather is tested for impairment annually or more frequently if facts and circumstances warrant a review. Conditions that could trigger a more frequent impairment assessment include, but are not limited to, a significant adverse change in certain agreements, significant underperformance relative to historical or projected future operating results, an economic downturn affecting automotive marketplaces, increased competition, a significant reduction in our stock price for a sustained period or a reduction of our market capitalization relative to net book value.
55
We haveevaluate impairment annually on October 1 by comparing the estimated fair value of each reporting unit to its carrying value. For the first three quarters of fiscal year 2022, we determined that we havehad two reporting units, United Statesunits: Marketplace and International, as of and for the year ended December 31, 2020.CarOffer. We elected to bypass the optional qualitative test for impairment and proceed to Step 1, which is a quantitative impairment test. We evaluate impairment annually on October 1 by comparing the estimated fair value of each reporting unit to its carrying value. We estimate fair value using a market approach, based on market multiples derived from public companies that we identify as peers. In 2020,As of October 1, 2022, we calculated the fair value of our reporting units using the market approach, which required us to estimate theestimated forecasted revenue and estimategross margin for fiscal year 2022, and estimated revenue and gross margin market multiples using publicly available information for each of our reporting units. Developing these assumptions required the use of significant judgment and estimates. Actual results may differ from these forecasts.
ForSubsequent to our evaluation of impairment on October 1, 2022, we revised our reporting units from two reporting units, Marketplace and CarOffer, to four reporting units, U.S. Marketplace, Digital Wholesale, United Kingdom Marketplace, and Canada Marketplace. Because of the yearschange in reporting units, we performed an additional goodwill impairment evaluation as of December 31. A consistent methodology was utilized, calculating the fair value of our reporting units using the market approach described previously. Revenue and gross margin actuals were utilized for the year ended December 31, 20202022, and 2019,estimated revenue and gross margin market multiples were utilized based upon publicly available information for each of the reporting units. Developing these assumptions required the use of judgment and estimates. Actual results may differ from these forecasts.
60
Redeemable Noncontrolling Interest – Valuation
In connection with our acquisition of a 51% interest in CarOffer on January 14, 2021, redeemable noncontrolling interest was recognized at fair value computed using the Least Square Monte Carlo Simulation approach. Significant inputs to the model included market price of risk, volatility, correlation and risk-free rate.
Subsequent to our acquisition of the 51% interest on January 14, 2021, the redeemable noncontrolling interest is measured at the greater of the amount that would be paid if settlement occurred as of the balance sheet date based on the contractually defined redemption value and its carrying amount adjusted for net income (loss) attributable to the noncontrolling interest and tax distributions to redeemable noncontrolling interest holders.
Income Taxes – Recoverability of Deferred Tax Assets and Related Valuation Allowance
We are subject to federal and state income taxes in the United States and taxes in foreign jurisdictions in which we didoperate. Judgment is required in determining our worldwide income tax provision. In the ordinary course of a global business, there are many transactions and calculations where the ultimate outcome is uncertain. Although we believe our estimates are reasonable, there is no assurance that the final outcome of these matters will not identify any impairmentbe different from that which is reflected in our historical income tax provisions and accruals. Such differences could have a material impact on our income tax provision and net income in the period in which such determination is made.
Significant judgment is also involved regarding the application of income tax laws and regulations to estimate the effective income tax rates. As a result, our goodwill.actual annual effective income tax rates and related income tax liabilities may differ materially from our interim estimated effective tax rates and related income tax liabilities. Any resulting differences are recognized in the period they become known.
Income Taxes
We account for income taxes in accordance with the asset and liability method. Under this method, deferred tax assets and liabilities are recognized based on temporary differences between the financial reporting and income tax bases of assets and liabilities using statutory rates. In addition, thisenacted tax rates in effect for the year in which the temporary differences are expected to be recovered or settled.
This method requires a valuation allowance against net deferred tax assets if, based upon the available evidence, it is more likely than not that some or all of the deferred tax assets will not be realized. In performing this analysis, we consider future taxable income and ongoing prudent and feasible tax planning strategies to assess realizability. Actual results may differ from these forecasts. Valuation allowances are reassessed periodically to determine whether it is more likely than not that the tax benefits will be realized in the future and if any existing valuation allowance should be released.
We account for uncertain tax positions recognized in the consolidated financial statements by prescribing a more‑likely‑than‑not threshold for financial statement recognition and measurement of a tax position taken or expected to be taken in a tax return. Interest and penalties, if applicable, related to uncertainWe assess our income tax positions would be recognizedbased upon management’s evaluation of the facts, circumstances, and information available at the reporting date. The tax position is measured as a componentthe largest amount of income tax expense. We have no recorded liabilities for uncertainbenefit or expense that is greater than 50% likely of being realized upon ultimate settlement with the taxing authority during examination. The ultimate resolution of these tax positions asmay be greater or less than the liabilities recognized.
Inventory – Valuation
Inventory is valued at the lower of December 31, 2020cost or net realizable value. Cost is determined based on specific identification. In recording inventory at the lower of cost or net realizable value, we estimate potential future losses on inventory on hand based on historical losses and 2019.market trends. Estimated potential future losses on inventory may vary from actual results which could lead to material adjustments to the financial statements.
The Tax Cuts and Jobs Act subjects a U.S. shareholderStock-Based Compensation – Valuation
For RSUs granted subject to tax on global intangible low-taxed income, or GILTI, earned by certain foreign subsidiaries. An entity can make an accounting policy election, per the FASB Staff Q&A, Topic 740, No. 5, Accounting for Global Intangible Low-Taxed Income, either to recognize deferred taxes for temporary basis differences expected to reverse as GILTI in future years or to provide for the tax expense related to GILTI in the year the tax is incurred as a period expense only. We elected to account for GILTI as a period cost in the year the tax is incurred.
Stock‑Based Compensation
For stock-based awards issued under our stock-based compensation plans,market-based vesting conditions, the fair value of each award is determined on the date of grant. We recognize compensation expense for service-based awards on a straight-line basis overgrant using the requisite service period for each separate vesting portionMonte Carlo simulation lattice model. The determination of the award, with the amount of compensation expense recognized at any date at least equaling the portion of the grant-date fair value using this model is affected by our stock price performance relative to the companies listed on the S&P 500, and a number of assumptions including volatility, correlation coefficient, risk-free interest rate and expected dividends. RSUs previously granted subject to market-based vesting conditions vest upon achievement of specified levels of market conditions. During the award that is vested at that date.year ended December 31, 2022, we modified our market-based performance awards to contain only service-based vesting conditions in line with our other restricted stock unit awards. As a result, there are no market-based RSUs outstanding as of December 31, 2022.
61
For RSUsstock options granted, subsequent to the IPO, the fair value is determined based on the closing price of our Class A common stock as reported on the Nasdaq Global Select Market on the date of grant.grant using the Black‑Scholes option‑pricing model. The determination of the fair value is affected by our stock price and a number of assumptions including expected dividend yield, expected volatility, risk-free interest rate and expected term. For expected volatility, we use a blended volatility to combine the historical volatility of trading with the volatility for a peer group of companies as we do not have historical stock prices for a period that is at least equal to the expected term. Stock options granted generally have a term of ten years from the date of grant and generally vest over a four-year requisite service period.
We issue sharesFor liability-classified awards, the fair value was determined on the date of issuance using a Least Square Monte Carlo simulation model. Liability-classified awards are remeasured to fair value each period until settlement. Until March 31, 2022, the Least Square Monte Carlo simulation model was used for stock option exercises and RSUs outremeasurement. During the three months ended June 30, 2022, we refined our model for determining the fair value of our shares availableliability-classified awards as a result of obtaining gross profit actuals through the trailing twelve-months ended June 30, 2022 measurement period for issuance. No options were granted during the yearsfirst call option. Since March 31, 2022, the fair value has typically been determined using a Monte Carlo simulation model. During the year ended December 31, 20202022, we determined not to exercise our call right to acquire up to an additional 25% of the fully diluted capitalization of CarOffer. The valuation of these liability awards is now derived from our 2024 call right and 2019.
We account for forfeitures when they occur.CarOffer’s 2024 put right. The tax effectdetermination of differences between tax deductions related to stock compensationthe fair value is affected by CarOffer’s equity value, EBITDA, and the corresponding financial statement expense compensation are recorded to tax expense. Excess tax benefits recognized on stock‑based compensation expense are classified as an operating activityParent Capital (as defined in the consolidated statementsCarOffer Operating Agreement, included as Exhibit 10.27 to the Annual Report on Form 10-K as of cash flows.December 31, 2021 filed on February 25, 2022) that drive the exercise price of future call/put rights, as well as a number of assumptions including market price of risk, volatility, correlation, and risk-free interest rate. As a result of the EBITDA and Excess Parent Capital projections for CarOffer as of December 31, 2022, a Monte Carlo simulation model was not required as of December 31, 2022. We will continue to assess our valuation approach quarterly.
During 2020, we recorded immaterial tax demerits related to stock-based compensation as compared to $11.1 million of excess tax benefits related to stock-based compensation during 2019.
Recently Issued Accounting Pronouncements
Information concerning recently issued accounting pronouncements may be found in Note 2 to our consolidated financial statements appearing elsewhere in this Annual Report on Form 10-K.
5662
Item 7A. Quantitative and Qualitative Disclosures about Market Risk.
Market risk represents the risk of loss that may affect our financial position due to adverse changes in financial market prices and rates. We are exposed to market risks as described below.
Interest Rate Risk
WeAs of December 31, 2022, our exposure to market risk associated with changes in interest rates relates primarily to our 2022 Revolver, which allows us to borrow up to $400.0 million. The applicable interest rate is, at our option, based on a number of different benchmark rates and applicable spreads, as determined by the Consolidated Secured Net Leverage Ratio. A fluctuation in interest rates does not have an impact on interest expense unless the 2022 Revolver is drawn upon. Such impact would also be dependent on the amount of the draw. As of December 31, 2022, there were no borrowings and no letters of credit outstanding under the 2022 Revolver.
As of December 31, 2021, we did not have any long‑term borrowings asborrowings.
As of December 31, 2020 or 2019.
We2022, we had cash and cash equivalents $469.5 million, which consisted of bank deposits and money market funds. As of December 31, 2021, we had cash, cash equivalents, and investments of $290.3$321.9 million, and $171.6 million at December 31, 2020 and 2019, respectively, which consistconsisted of bank deposits, money market funds and certificates of deposit with maturity dates ranging from six to nine months.
Such interest-earning instruments carry a degree of interest rate risk. Given recent changes in the interest rate environment and in an effort to ensure liquidity, we expect lowervariable returns from our investmentscash equivalents for the foreseeable future. To date, fluctuations resulting from changes in the interest rate environment in interest income have not been material to the operations of the business.
We do not enter into investments for trading or speculative purposes and have not used any derivative financial instruments to manage our interest rate risk exposure.
Inflation Risk
We do not believe that inflation has had a material effect on our business, financial condition, or results of operations to date. However, if our costs were to become subject to significant inflationary pressures, we may not be able to fully offset such higher costs through price increases. Our inability or failure to do so could harm our business, operating results, and financial condition.
Foreign Currency Exchange Risk
Historically, because our operations and sales have been primarily in the United States, we have not faced any significant foreign currency risk. As of December 31, 20202022 and 2019,2021, we havehad foreign currency exposures in the British pound, the Euro and the Canadian dollar, although such exposure is not significant.was immaterial.
Our foreign subsidiaries have intercompany accountstransactions that are eliminated upon consolidation, and these accountstransactions expose us to foreign currency exchange rate fluctuations. Exchange rate fluctuations on short‑term intercompany accountstransactions are recordedrecognized within other (expense) income, net in ourthe consolidated income statements under the heading other income, net. Long-termstatements. Exchange rate fluctuations on long-term intercompany accountstransactions are recorded in our consolidated balance sheets under the headingrecognized within accumulated other comprehensive income.(loss) income in the consolidated balance sheets.
As we seek to grow our international operations in Canada and the United Kingdom, our risks associated with fluctuation in currency rates may become greater, and we will continue to reassess our approach to managing these risks.
5763
Item 8. Financial Statements and Supplementary Data.
CarGurus, Inc.
Index to Consolidated Financial Statements
5864
Report of Independent Registered Public Accounting Firm
To the Stockholders and the Board of Directors of CarGurus, Inc.
Opinion on the Financial Statements
We have audited the accompanying consolidated balance sheets of CarGurus, Inc. (the Company) as of December 31, 20202022 and 2019,2021, the related consolidated statements of income, comprehensive income, redeemable noncontrolling interest and stockholders' equity and cash flows for each of the three years in the period ended December 31, 2020,2022, and the related notes (collectively referred to as the “consolidated financial statements”). In our opinion, the consolidated financial statements present fairly, in all material respects, the financial position of the Company at December 31, 20202022 and 2019,2021, and the results of its operations and its cash flows for each of the three years in the period ended December 31, 2020,2022, in conformity with U.S. generally accepted accounting principles.
We also have audited, in accordance with the standards of the Public Company Accounting Oversight Board (United States) (PCAOB), the Company's internal control over financial reporting as of December 31, 2020,2022, based on criteria established in Internal Control-Integrated Framework issued by the Committee of Sponsoring Organizations of the Treadway Commission (2013 framework) and our report dated February 11, 2021March 1, 2023 expressed an unqualifiedadverse opinion thereon.
Basis for Opinion
These financial statements are the responsibility of the Company's management. Our responsibility is to express an opinion on the Company’s financial statements based on our audits. We are a public accounting firm registered with the PCAOB and are required to be independent with respect to the Company in accordance with the U.S. federal securities laws and the applicable rules and regulations of the Securities and Exchange Commission and the PCAOB.
We conducted our audits in accordance with the standards of the PCAOB. Those standards require that we plan and perform the audit to obtain reasonable assurance about whether the financial statements are free of material misstatement, whether due to error or fraud. Our audits included performing procedures to assess the risks of material misstatement of the financial statements, whether due to error or fraud, and performing procedures that respond to those risks. Such procedures included examining, on a test basis, evidence regarding the amounts and disclosures in the financial statements. Our audits also included evaluating the accounting principles used and significant estimates made by management, as well as evaluating the overall presentation of the financial statements. We believe that our audits provide a reasonable basis for our opinion.
Critical Audit Matters
The critical audit matters communicated below are matters arising from the current period audit of the financial statements that were communicated or required to be communicated to the audit committee and that: (1) relate to accounts or disclosures that are material to the financial statements and (2) involved our especially challenging, subjective or complex judgments. The communication of critical audit matters does not alter in any way our opinion on the consolidated financial statements, taken as a whole, and we are not, by communicating the critical audit matters below, providing separate opinions on the critical audit matters or on the accounts or disclosures to which they relate.
Revenue Recognition | ||
Description of the Matter | For the year ended December 31,
|
5965
How We Addressed the Matter in Our Audit | We obtained an understanding, evaluated the design and tested the operating effectiveness of controls over certain of the Company’s revenue recognition process, including controls designed to mitigate the risk of override of controls. This included testing controls over management’s review of manual journal entries and revenue related account reconciliations. We substantively tested the Company’s revenue recognized for the year ended December 31, | |
| ||
Description of the Matter | As
| |
|
|
| ||
|
Auditing the Company's accounting for | |
How We Addressed the Matter in Our Audit | We obtained an understanding, evaluated the design and tested the operating effectiveness of controls over the Company’s valuation of Our audit procedures to test the estimated fair value We also performed a sensitivity analysis of the significant assumptions to evaluate the change in the fair values that would result from changes in the assumptions. |
/s/ Ernst & Young LLP
We have served as the Company’s auditor since 2016.
Boston, Massachusetts
February 11, 2021March 1, 2023
6166
CarGurus, Inc.
Consolidated Balance Sheets
(in thousands, except share and per share data)
|
| At December 31, |
|
| As of December 31, |
| ||||||||||
|
| 2020 |
|
| 2019 |
|
| 2022 |
|
| 2021 |
| ||||
Assets |
|
|
|
|
|
|
|
|
|
|
|
|
|
| ||
Current assets: |
|
|
|
|
|
|
|
|
|
|
|
|
|
| ||
Cash and cash equivalents |
| $ | 190,299 |
|
| $ | 59,920 |
|
| $ | 469,517 |
|
| $ | 231,944 |
|
Investments |
|
| 100,000 |
|
|
| 111,692 |
|
|
| — |
|
|
| 90,000 |
|
Accounts receivable, net of allowance for doubtful accounts of $616 and $240, respectively |
|
| 18,235 |
|
|
| 22,124 |
| ||||||||
Accounts receivable, net of allowance for doubtful accounts of $1,809 and |
|
| 46,817 |
|
|
| 189,324 |
| ||||||||
Inventory |
|
| 5,282 |
|
|
| 19,656 |
| ||||||||
Prepaid expenses, prepaid income taxes and other current assets |
|
| 12,385 |
|
|
| 15,424 |
|
|
| 21,972 |
|
|
| 16,430 |
|
Deferred contract costs |
|
| 10,807 |
|
|
| 9,544 |
|
|
| 8,541 |
|
|
| 9,045 |
|
Restricted cash |
|
| 250 |
|
|
| 250 |
|
|
| 5,237 |
|
|
| 6,709 |
|
Total current assets |
|
| 331,976 |
|
|
| 218,954 |
|
|
| 557,366 |
|
|
| 563,108 |
|
Property and equipment, net |
|
| 27,483 |
|
|
| 27,950 |
|
|
| 40,128 |
|
|
| 32,210 |
|
Intangible assets, net |
|
| 10,862 |
|
|
| 3,920 |
|
|
| 53,054 |
|
|
| 83,915 |
|
Goodwill |
|
| 29,129 |
|
|
| 15,207 |
|
|
| 157,467 |
|
|
| 158,287 |
|
Operating lease right-of-use assets |
|
| 60,835 |
|
|
| 59,986 |
|
|
| 56,869 |
|
|
| 60,609 |
|
Restricted cash |
|
| 10,377 |
|
|
| 10,553 |
|
|
| 9,378 |
|
|
| 9,627 |
|
Deferred tax assets |
|
| 19,774 |
|
|
| 42,713 |
|
|
| 35,488 |
|
|
| 13,378 |
|
Deferred contract costs, net of current portion |
|
| 9,189 |
|
|
| 10,514 |
|
|
| 8,853 |
|
|
| 5,867 |
|
Other non-current assets |
|
| 2,673 |
|
|
| 3,826 |
|
|
| 8,499 |
|
|
| 4,573 |
|
Total assets |
| $ | 502,298 |
|
| $ | 393,623 |
|
| $ | 927,102 |
|
| $ | 931,574 |
|
Liabilities and stockholders’ equity |
|
|
|
|
|
|
|
| ||||||||
Liabilities, redeemable noncontrolling interest and stockholders’ equity |
|
|
|
|
|
| ||||||||||
Current liabilities: |
|
|
|
|
|
|
|
|
|
|
|
|
|
| ||
Accounts payable |
| $ | 21,563 |
|
| $ | 36,731 |
|
| $ | 32,529 |
|
| $ | 66,153 |
|
Accrued expenses, accrued income taxes and other current liabilities |
|
| 24,751 |
|
|
| 18,262 |
|
|
| 39,193 |
|
|
| 78,586 |
|
Deferred revenue |
|
| 9,137 |
|
|
| 9,984 |
|
|
| 12,249 |
|
|
| 12,784 |
|
Operating lease liabilities |
|
| 11,085 |
|
|
| 8,781 |
|
|
| 14,762 |
|
|
| 13,186 |
|
Total current liabilities |
|
| 66,536 |
|
|
| 73,758 |
|
|
| 98,733 |
|
|
| 170,709 |
|
Operating lease liabilities |
|
| 58,810 |
|
|
| 60,818 |
|
|
| 51,656 |
|
|
| 57,519 |
|
Deferred tax liabilities |
|
| 291 |
|
|
| 284 |
|
|
| 54 |
|
|
| 58 |
|
Other non–current liabilities |
|
| 3,075 |
|
|
| 1,908 |
|
|
| 5,301 |
|
|
| 23,639 |
|
Total liabilities |
|
| 128,712 |
|
|
| 136,768 |
|
|
| 155,744 |
|
|
| 251,925 |
|
Commitments and contingencies (Note 10) |
|
|
|
|
|
|
|
| ||||||||
Commitments and contingencies (Note 9) |
|
|
|
|
| |||||||||||
Redeemable noncontrolling interest |
|
| 36,749 |
|
|
| 162,808 |
| ||||||||
Stockholders’ equity: |
|
|
|
|
|
|
|
|
|
|
|
|
|
| ||
Preferred stock, $0.001 par value; 10,000,000 shares authorized; 0 shares issued and outstanding |
|
| — |
|
|
| — |
| ||||||||
Class A common stock, $0.001 par value; 500,000,000 shares authorized; 94,310,309 and 91,819,649 shares issued and outstanding at December 31, 2020 and 2019, respectively |
|
| 94 |
|
|
| 92 |
| ||||||||
Class B common stock, $0.001 par value; 100,000,000 shares authorized; 19,076,500 and 20,314,644 shares issued and outstanding at December 31, 2020 and 2019, respectively |
|
| 19 |
|
|
| 20 |
| ||||||||
Preferred stock, $0.001 par value per share; 10,000,000 shares authorized; |
|
| — |
|
|
| — |
| ||||||||
Class A common stock, $0.001 par value per share; 500,000,000 shares |
|
| 102 |
|
|
| 102 |
| ||||||||
Class B common stock, $0.001 par value per share; 100,000,000 shares |
|
| 16 |
|
|
| 16 |
| ||||||||
Additional paid–in capital |
|
| 242,181 |
|
|
| 205,234 |
|
|
| 413,092 |
|
|
| 387,868 |
|
Retained earnings |
|
| 129,412 |
|
|
| 51,859 |
|
|
| 323,043 |
|
|
| 129,258 |
|
Accumulated other comprehensive income (loss) |
|
| 1,880 |
|
|
| (350 | ) | ||||||||
Accumulated other comprehensive loss |
|
| (1,644 | ) |
|
| (403 | ) | ||||||||
Total stockholders’ equity |
|
| 373,586 |
|
|
| 256,855 |
|
|
| 734,609 |
|
|
| 516,841 |
|
Total liabilities and stockholders’ equity |
| $ | 502,298 |
|
| $ | 393,623 |
| ||||||||
Total liabilities, redeemable noncontrolling interest and stockholders’ equity |
| $ | 927,102 |
|
| $ | 931,574 |
| ||||||||
The accompanying notes are an integral part of these consolidated financial statements.
6267
CarGurus, Inc.
Consolidated Income Statements
(in thousands, except share and per share data)
|
| Year Ended December 31, |
| |||||||||
|
| 2022 |
|
| 2021 |
|
| 2020 |
| |||
Revenue |
|
|
|
|
|
|
|
|
| |||
Marketplace |
| $ | 658,771 |
|
| $ | 636,942 |
|
| $ | 551,451 |
|
Wholesale |
|
| 237,635 |
|
|
| 195,127 |
|
|
| — |
|
Product |
|
| 758,629 |
|
|
| 119,304 |
|
|
| — |
|
Total revenue |
|
| 1,655,035 |
|
|
| 951,373 |
|
|
| 551,451 |
|
Cost of revenue(1) |
|
|
|
|
|
|
|
|
| |||
Marketplace |
|
| 56,040 |
|
|
| 47,689 |
|
|
| 42,706 |
|
Wholesale |
|
| 176,446 |
|
|
| 127,679 |
|
|
| — |
|
Product |
|
| 764,996 |
|
|
| 118,647 |
|
|
| — |
|
Total cost of revenue |
|
| 997,482 |
|
|
| 294,015 |
|
|
| 42,706 |
|
Gross profit |
|
| 657,553 |
|
|
| 657,358 |
|
|
| 508,745 |
|
Operating expenses: |
|
|
|
|
|
|
|
|
| |||
Sales and marketing |
|
| 336,708 |
|
|
| 290,574 |
|
|
| 256,979 |
|
Product, technology, and development |
|
| 123,768 |
|
|
| 106,423 |
|
|
| 85,726 |
|
General and administrative |
|
| 73,117 |
|
|
| 97,678 |
|
|
| 62,166 |
|
Depreciation and amortization |
|
| 15,482 |
|
|
| 14,415 |
|
|
| 6,118 |
|
Total operating expenses |
|
| 549,075 |
|
|
| 509,090 |
|
|
| 410,989 |
|
Income from operations |
|
| 108,478 |
|
|
| 148,268 |
|
|
| 97,756 |
|
Other income, net: |
|
|
|
|
|
|
|
|
| |||
Interest income |
|
| 3,845 |
|
|
| 120 |
|
|
| 1,075 |
|
Other (expense) income, net |
|
| (961 | ) |
|
| 972 |
|
|
| 279 |
|
Total other income, net |
|
| 2,884 |
|
|
| 1,092 |
|
|
| 1,354 |
|
Income before income taxes |
|
| 111,362 |
|
|
| 149,360 |
|
|
| 99,110 |
|
Provision for income taxes |
|
| 32,408 |
|
|
| 38,987 |
|
|
| 21,557 |
|
Consolidated net income |
|
| 78,954 |
|
|
| 110,373 |
|
|
| 77,553 |
|
Net (loss) income attributable to redeemable noncontrolling interest |
|
| (5,433 | ) |
|
| 1,129 |
|
|
| — |
|
Net income attributable to CarGurus, Inc. |
| $ | 84,387 |
|
| $ | 109,244 |
|
| $ | 77,553 |
|
Accretion of redeemable noncontrolling interest to redemption value |
|
| (109,398 | ) |
|
| 109,398 |
|
|
| — |
|
Net income (loss) attributable to common stockholders |
| $ | 193,785 |
|
| $ | (154 | ) |
| $ | 77,553 |
|
Net income (loss) per share attributable to common stockholders: (Note 11) |
|
|
|
|
|
|
|
|
| |||
Basic |
| $ | 1.64 |
|
| $ | (0.00 | ) |
| $ | 0.69 |
|
Diluted |
| $ | 0.62 |
|
| $ | (0.00 | ) |
| $ | 0.68 |
|
Weighted–average number of shares of common stock used in |
|
|
|
|
|
|
|
|
| |||
Basic |
|
| 118,474,991 |
|
|
| 117,142,062 |
|
|
| 112,854,524 |
|
Diluted |
|
| 128,150,974 |
|
|
| 117,142,062 |
|
|
| 113,849,815 |
|
|
| Year Ended December 31, |
| |||||||||
|
| 2020 |
|
| 2019 |
|
| 2018 |
| |||
Revenue |
| $ | 551,451 |
|
| $ | 588,916 |
|
| $ | 454,086 |
|
Cost of revenue(1) |
|
| 42,706 |
|
|
| 36,300 |
|
|
| 24,811 |
|
Gross profit |
|
| 508,745 |
|
|
| 552,616 |
|
|
| 429,275 |
|
Operating expenses: |
|
|
|
|
|
|
|
|
|
|
|
|
Sales and marketing |
|
| 256,979 |
|
|
| 393,844 |
|
|
| 315,939 |
|
Product, technology, and development |
|
| 85,726 |
|
|
| 69,462 |
|
|
| 47,866 |
|
General and administrative |
|
| 62,166 |
|
|
| 50,434 |
|
|
| 39,475 |
|
Depreciation and amortization |
|
| 6,118 |
|
|
| 4,554 |
|
|
| 2,804 |
|
Total operating expenses |
|
| 410,989 |
|
|
| 518,294 |
|
|
| 406,084 |
|
Income from operations |
|
| 97,756 |
|
|
| 34,322 |
|
|
| 23,191 |
|
Other income, net: |
|
|
|
|
|
|
|
|
|
|
|
|
Interest income |
|
| 1,075 |
|
|
| 2,984 |
|
|
| 2,283 |
|
Other income, net |
|
| 279 |
|
|
| 1,399 |
|
|
| 10 |
|
Total other income, net |
|
| 1,354 |
|
|
| 4,383 |
|
|
| 2,293 |
|
Income before income taxes |
|
| 99,110 |
|
|
| 38,705 |
|
|
| 25,484 |
|
Provision for (benefit from) income taxes |
|
| 21,557 |
|
|
| (3,441 | ) |
|
| (39,686 | ) |
Net income |
| $ | 77,553 |
|
| $ | 42,146 |
|
| $ | 65,170 |
|
Net income per share attributable to common stockholders: (Note 12) |
|
|
|
|
|
|
|
|
|
|
|
|
Basic |
| $ | 0.69 |
|
| $ | 0.38 |
|
| $ | 0.60 |
|
Diluted |
| $ | 0.68 |
|
| $ | 0.37 |
|
| $ | 0.57 |
|
Weighted–average number of shares of common stock used in computing net income per share attributable to common stockholders: |
|
|
|
|
|
|
|
|
|
|
|
|
Basic |
|
| 112,854,524 |
|
|
| 111,450,443 |
|
|
| 108,833,028 |
|
Diluted |
|
| 113,849,815 |
|
|
| 113,431,850 |
|
|
| 113,364,712 |
|
|
|
The accompanying notes are an integral part of these consolidated financial statements.
6368
CarGurus, Inc.
Consolidated Statements of Comprehensive Income
(in thousands)
|
| Year Ended December 31, |
| |||||||||
|
| 2020 |
|
| 2019 |
|
| 2018 |
| |||
Net income |
| $ | 77,553 |
|
| $ | 42,146 |
|
| $ | 65,170 |
|
Other comprehensive income (loss): |
|
|
|
|
|
|
|
|
|
|
|
|
Foreign currency translation adjustment |
|
| 2,230 |
|
|
| (421 | ) |
|
| (157 | ) |
Comprehensive income |
| $ | 79,783 |
|
| $ | 41,725 |
|
| $ | 65,013 |
|
|
| Year Ended December 31, |
| |||||||||
|
| 2022 |
|
| 2021 |
|
| 2020 |
| |||
Consolidated net income |
| $ | 78,954 |
|
| $ | 110,373 |
|
| $ | 77,553 |
|
Other comprehensive income: |
|
|
|
|
|
|
|
|
| |||
Foreign currency translation adjustment |
|
| (1,241 | ) |
|
| (2,283 | ) |
|
| 2,230 |
|
Consolidated comprehensive income |
|
| 77,713 |
|
|
| 108,090 |
|
|
| 79,783 |
|
Comprehensive (loss) income attributable to redeemable noncontrolling |
|
| (5,433 | ) |
|
| 1,129 |
|
|
| — |
|
Comprehensive income attributable to CarGurus, Inc. |
| $ | 83,146 |
|
| $ | 106,961 |
|
| $ | 79,783 |
|
The accompanying notes are an integral part of these consolidated financial statements.
6469
CarGurus, Inc.
Consolidated Statements of Redeemable Noncontrolling Interest and Stockholders’ Equity
(in thousands, except share data)
|
| Class A Common Stock |
|
| Class B Common Stock |
|
| Additional Paid–in |
|
| (Accumulated Deficit) Retained |
|
| Accumulated Other Comprehensive |
|
| Total Stockholders’ |
| ||||||||||||||
|
| Shares |
|
| Amount |
|
| Shares |
|
| Amount |
|
| Capital |
|
| Earnings |
|
| Income (Loss) |
|
| Equity |
| ||||||||
Balance at December 31, 2017 |
|
| 77,884,754 |
|
| $ | 78 |
|
|
| 28,226,104 |
|
| $ | 28 |
|
| $ | 185,190 |
|
| $ | (58,499 | ) |
| $ | 228 |
|
| $ | 127,025 |
|
Net income |
|
| — |
|
|
| — |
|
|
| — |
|
|
| — |
|
|
| — |
|
|
| 65,170 |
|
|
| — |
|
|
| 65,170 |
|
Stock–based compensation expense |
|
| — |
|
|
| — |
|
|
| — |
|
|
| — |
|
|
| 21,284 |
|
|
| — |
|
|
| — |
|
|
| 21,284 |
|
Issuance of common stock upon exercise of stock options |
|
| 3,186,489 |
|
|
| 3 |
|
|
| 10,690 |
|
|
| — |
|
|
| 3,629 |
|
|
| — |
|
|
| — |
|
|
| 3,632 |
|
Issuance of common stock upon vesting of restricted stock units |
|
| 1,781,201 |
|
|
| 2 |
|
|
| — |
|
|
| — |
|
|
| (2 | ) |
|
| — |
|
|
| — |
|
|
| — |
|
Payment of withholding taxes on net share settlements of equity awards |
|
| (658,931 | ) |
|
| — |
|
|
| — |
|
|
| — |
|
|
| (25,885 | ) |
|
| — |
|
|
| — |
|
|
| (25,885 | ) |
Cumulative adjustment from adoption of revenue recognition standard |
|
| — |
|
|
| — |
|
|
| — |
|
|
| — |
|
|
| — |
|
|
| 3,042 |
|
|
| — |
|
|
| 3,042 |
|
Conversion of common stock |
|
| 7,534,710 |
|
|
| 7 |
|
|
| (7,534,710 | ) |
|
| (7 | ) |
|
| — |
|
|
| — |
|
|
| — |
|
|
| — |
|
Foreign currency translation adjustment |
|
| — |
|
|
| — |
|
|
| — |
|
|
| — |
|
|
| — |
|
|
| — |
|
|
| (157 | ) |
|
| (157 | ) |
Balance at December 31, 2018 |
|
| 89,728,223 |
|
|
| 90 |
|
|
| 20,702,084 |
|
|
| 21 |
|
|
| 184,216 |
|
|
| 9,713 |
|
|
| 71 |
|
|
| 194,111 |
|
Net income |
|
| — |
|
|
| — |
|
|
| — |
|
|
| — |
|
|
| — |
|
|
| 42,146 |
|
|
| — |
|
|
| 42,146 |
|
Stock–based compensation expense |
|
| — |
|
|
| — |
|
|
| — |
|
|
| — |
|
|
| 35,682 |
|
|
| — |
|
|
| — |
|
|
| 35,682 |
|
Issuance of common stock upon exercise of stock options |
|
| 838,928 |
|
|
| — |
|
|
| — |
|
|
| — |
|
|
| 1,807 |
|
|
| — |
|
|
| — |
|
|
| 1,807 |
|
Issuance of common stock upon vesting of restricted stock units |
|
| 1,317,736 |
|
|
| 1 |
|
|
| — |
|
|
| — |
|
|
| (1 | ) |
|
| — |
|
|
| — |
|
|
| — |
|
Payment of withholding taxes on net share settlements of equity awards |
|
| (452,678 | ) |
|
| — |
|
|
| — |
|
|
| — |
|
|
| (16,470 | ) |
|
| — |
|
|
| — |
|
|
| (16,470 | ) |
Conversion of common stock |
|
| 387,440 |
|
|
| 1 |
|
|
| (387,440 | ) |
|
| (1 | ) |
|
| — |
|
|
| — |
|
|
| — |
|
|
| — |
|
Foreign currency translation adjustment |
|
| — |
|
|
| — |
|
|
| — |
|
|
| — |
|
|
| — |
|
|
| — |
|
|
| (421 | ) |
|
| (421 | ) |
Balance at December 31, 2019 |
|
| 91,819,649 |
|
|
| 92 |
|
|
| 20,314,644 |
|
|
| 20 |
|
|
| 205,234 |
|
|
| 51,859 |
|
|
| (350 | ) |
|
| 256,855 |
|
Net income |
|
| — |
|
|
| — |
|
|
| — |
|
|
| — |
|
|
| — |
|
|
| 77,553 |
|
|
| — |
|
|
| 77,553 |
|
Stock–based compensation expense |
|
| — |
|
|
| — |
|
|
| — |
|
|
| — |
|
|
| 46,996 |
|
|
| — |
|
|
| — |
|
|
| 46,996 |
|
Issuance of common stock upon exercise of stock options |
|
| 352,212 |
|
|
| — |
|
|
| — |
|
|
| — |
|
|
| 1,136 |
|
|
| — |
|
|
| — |
|
|
| 1,136 |
|
Issuance of common stock upon vesting of restricted stock units |
|
| 1,347,464 |
|
|
| 1 |
|
|
| — |
|
|
| — |
|
|
| (1 | ) |
|
| — |
|
|
| — |
|
|
| — |
|
Payment of withholding taxes and option costs on net share settlement of restricted stock units and stock options |
|
| (447,160 | ) |
|
| — |
|
|
| — |
|
|
| — |
|
|
| (11,184 | ) |
|
| — |
|
|
| — |
|
|
| (11,184 | ) |
Conversion of common stock |
|
| 1,238,144 |
|
|
| 1 |
|
|
| (1,238,144 | ) |
|
| (1 | ) |
|
| — |
|
|
| — |
|
|
| — |
|
|
| — |
|
Foreign currency translation adjustment |
|
| — |
|
|
| — |
|
|
| — |
|
|
| — |
|
|
| — |
|
|
| — |
|
|
| 2,230 |
|
|
| 2,230 |
|
Balance at December 31, 2020 |
|
| 94,310,309 |
|
| $ | 94 |
|
|
| 19,076,500 |
|
| $ | 19 |
|
| $ | 242,181 |
|
| $ | 129,412 |
|
| $ | 1,880 |
|
| $ | 373,586 |
|
|
| Redeemable |
|
| Class A |
|
| Class B |
|
| Additional |
|
| Retained |
|
| Accumulated |
|
| Total |
| |||||||||||||||
|
| Interest |
|
| Shares |
|
| Amount |
|
| Shares |
|
| Amount |
|
| Capital |
|
| Earnings |
|
| Income (Loss) |
|
| Equity |
| |||||||||
Balance as of December 31, 2019 |
| $ | — |
|
|
| 91,819,649 |
|
| $ | 92 |
|
|
| 20,314,644 |
|
| $ | 20 |
|
| $ | 205,234 |
|
| $ | 51,859 |
|
| $ | (350 | ) |
| $ | 256,855 |
|
Net income |
|
| — |
|
|
| — |
|
|
| — |
|
|
| — |
|
|
| — |
|
|
| — |
|
|
| 77,553 |
|
|
| — |
|
|
| 77,553 |
|
Stock–based compensation expense |
|
| — |
|
|
| — |
|
|
| — |
|
|
| — |
|
|
| — |
|
|
| 46,996 |
|
|
| — |
|
|
| — |
|
|
| 46,996 |
|
Issuance of common stock upon exercise of stock options |
|
| — |
|
|
| 352,212 |
|
|
| — |
|
|
| — |
|
|
| — |
|
|
| 1,136 |
|
|
| — |
|
|
| — |
|
|
| 1,136 |
|
Issuance of common stock upon vesting of restricted stock units |
|
| — |
|
|
| 1,347,464 |
|
|
| 1 |
|
|
| — |
|
|
| — |
|
|
| (1 | ) |
|
| — |
|
|
| — |
|
|
| — |
|
Payment of withholding taxes on net share settlements of restricted stock units |
|
| — |
|
|
| (447,160 | ) |
|
| — |
|
|
| — |
|
|
| — |
|
|
| (11,184 | ) |
|
| — |
|
|
| — |
|
|
| (11,184 | ) |
Conversion of common stock |
|
| — |
|
|
| 1,238,144 |
|
|
| 1 |
|
|
| (1,238,144 | ) |
|
| (1 | ) |
|
| — |
|
|
| — |
|
|
| — |
|
|
| — |
|
Foreign currency translation adjustment |
|
| — |
|
|
| — |
|
|
| — |
|
|
| — |
|
|
| — |
|
|
| — |
|
|
| — |
|
|
| 2,230 |
|
|
| 2,230 |
|
Balance as of December 31, 2020 |
|
| — |
|
|
| 94,310,309 |
|
|
| 94 |
|
|
| 19,076,500 |
|
|
| 19 |
|
|
| 242,181 |
|
|
| 129,412 |
|
|
| 1,880 |
|
|
| 373,586 |
|
Net income |
|
| 1,129 |
|
|
| — |
|
|
| — |
|
|
| — |
|
|
| — |
|
|
| — |
|
|
| 109,244 |
|
|
| — |
|
|
| 109,244 |
|
Stock–based compensation expense |
|
| — |
|
|
| — |
|
|
| — |
|
|
| — |
|
|
| — |
|
|
| 56,772 |
|
|
| — |
|
|
| — |
|
|
| 56,772 |
|
Issuance of common stock upon exercise of stock options |
|
| — |
|
|
| 222,147 |
|
|
| — |
|
|
| — |
|
|
| — |
|
|
| 663 |
|
|
| — |
|
|
| — |
|
|
| 663 |
|
Issuance of common stock upon vesting of restricted stock units |
|
| — |
|
|
| 1,575,206 |
|
|
| 2 |
|
|
| — |
|
|
| — |
|
|
| (2 | ) |
|
| — |
|
|
| — |
|
|
| — |
|
Payment of withholding taxes on net share settlements of restricted stock units |
|
| — |
|
|
| (527,237 | ) |
|
| — |
|
|
| — |
|
|
| — |
|
|
| (15,388 | ) |
|
| — |
|
|
| — |
|
|
| (15,388 | ) |
Conversion of common stock |
|
| — |
|
|
| 3,077,327 |
|
|
| 3 |
|
|
| (3,077,327 | ) |
|
| (3 | ) |
|
| — |
|
|
| — |
|
|
| — |
|
|
| — |
|
Issuance of common stock upon for acquisition |
|
| — |
|
|
| 3,115,282 |
|
|
| 3 |
|
|
| — |
|
|
| — |
|
|
| 103,642 |
|
|
| — |
|
|
| — |
|
|
| 103,645 |
|
Acquisition of a 51% interest in CarOffer, LLC |
|
| 60,982 |
|
|
| — |
|
|
| — |
|
|
| — |
|
|
| — |
|
|
| — |
|
|
| — |
|
|
| — |
|
|
| — |
|
Accretion of redeemable noncontrolling interest to redemption value |
|
| 109,398 |
|
|
| — |
|
|
| — |
|
|
| — |
|
|
| — |
|
|
| — |
|
|
| (109,398 | ) |
|
| — |
|
|
| (109,398 | ) |
Tax distributions to redeemable noncontrolling interest holders |
|
| (8,701 | ) |
|
| — |
|
|
| — |
|
|
| — |
|
|
| — |
|
|
| — |
|
|
| — |
|
|
| — |
|
|
| — |
|
Foreign currency translation adjustment |
|
| — |
|
|
| — |
|
|
| — |
|
|
| — |
|
|
| — |
|
|
| — |
|
|
| — |
|
|
| (2,283 | ) |
|
| (2,283 | ) |
Balance as of December 31, 2021 |
|
| 162,808 |
|
|
| 101,773,034 |
|
|
| 102 |
|
|
| 15,999,173 |
|
|
| 16 |
|
|
| 387,868 |
|
|
| 129,258 |
|
|
| (403 | ) |
|
| 516,841 |
|
Net (loss) income |
|
| (5,433 | ) |
|
| — |
|
|
| — |
|
|
| — |
|
|
| — |
|
|
| — |
|
|
| 84,387 |
|
|
| — |
|
|
| 84,387 |
|
Stock–based compensation expense |
|
| — |
|
|
| — |
|
|
| — |
|
|
| — |
|
|
| — |
|
|
| 59,245 |
|
|
| — |
|
|
| — |
|
|
| 59,245 |
|
Issuance of common stock upon exercise of stock options |
|
| — |
|
|
| 131,061 |
|
|
| — |
|
|
| — |
|
|
| — |
|
|
| 721 |
|
|
| — |
|
|
| — |
|
|
| 721 |
|
Issuance of common stock upon vesting of restricted stock units |
|
| — |
|
|
| 1,649,294 |
|
|
| 1 |
|
|
| — |
|
|
| — |
|
|
| (1 | ) |
|
| — |
|
|
| — |
|
|
| — |
|
Payment of withholding taxes on net share settlements of restricted stock units |
|
| — |
|
|
| (566,267 | ) |
|
| — |
|
|
| — |
|
|
| — |
|
|
| (16,025 | ) |
|
| — |
|
|
| — |
|
|
| (16,025 | ) |
Repurchase of common stock |
|
| — |
|
|
| (1,350,473 | ) |
|
| (1 | ) |
|
| — |
|
|
| — |
|
|
| (18,716 | ) |
|
| — |
|
|
| — |
|
|
| (18,717 | ) |
Accretion of redeemable noncontrolling interest to redemption value |
|
| (109,398 | ) |
|
| — |
|
|
| — |
|
|
| — |
|
|
| — |
|
|
| — |
|
|
| 109,398 |
|
|
| — |
|
|
| 109,398 |
|
Tax distributions to redeemable noncontrolling interest holders |
|
| (11,228 | ) |
|
| — |
|
|
| — |
|
|
| — |
|
|
| — |
|
|
| — |
|
|
| — |
|
|
| — |
|
|
| — |
|
Foreign currency translation adjustment |
|
| — |
|
|
| — |
|
|
| — |
|
|
| — |
|
|
| — |
|
|
| — |
|
|
| — |
|
|
| (1,241 | ) |
|
| (1,241 | ) |
Balance as of December 31, 2022 |
| $ | 36,749 |
|
|
| 101,636,649 |
|
| $ | 102 |
|
|
| 15,999,173 |
|
| $ | 16 |
|
| $ | 413,092 |
|
| $ | 323,043 |
|
| $ | (1,644 | ) |
| $ | 734,609 |
|
The accompanying notes are an integral part of these consolidated financial statements.
70
CarGurus, Inc.
Consolidated Statements of Cash Flows
(in thousands)
|
| Year Ended December 31, |
| |||||||||
|
| 2022 |
|
| 2021 |
|
| 2020 |
| |||
Operating Activities |
|
|
|
|
|
|
|
|
| |||
Consolidated net income |
| $ | 78,954 |
|
| $ | 110,373 |
|
| $ | 77,553 |
|
Adjustments to reconcile consolidated net income to net cash provided |
|
|
|
|
|
|
|
|
| |||
Depreciation and amortization |
|
| 45,334 |
|
|
| 40,476 |
|
|
| 10,191 |
|
Currency loss (gain) on foreign denominated transactions |
|
| 155 |
|
|
| (70 | ) |
|
| 23 |
|
Deferred taxes |
|
| (22,114 | ) |
|
| 6,163 |
|
|
| 22,235 |
|
Provision for doubtful accounts |
|
| 1,769 |
|
|
| 999 |
|
|
| 1,930 |
|
Stock-based compensation expense |
|
| 54,777 |
|
|
| 53,525 |
|
|
| 45,090 |
|
Amortization of deferred financing costs |
|
| 136 |
|
|
| — |
|
|
| — |
|
Amortization of deferred contract costs |
|
| 11,067 |
|
|
| 12,653 |
|
|
| 11,605 |
|
Impairment of long-lived assets |
|
| 165 |
|
|
| 3,128 |
|
|
| 1,151 |
|
Changes in operating assets and liabilities: |
|
|
|
|
|
|
|
|
| |||
Accounts receivable |
|
| 152,954 |
|
|
| (174,771 | ) |
|
| 3,889 |
|
Inventory |
|
| 14,374 |
|
|
| (17,318 | ) |
|
| — |
|
Prepaid expenses, prepaid income taxes, and other assets |
|
| (6,573 | ) |
|
| (5,068 | ) |
|
| 3,484 |
|
Deferred contract costs |
|
| (13,697 | ) |
|
| (7,714 | ) |
|
| (11,378 | ) |
Accounts payable |
|
| (35,047 | ) |
|
| 35,397 |
|
|
| (15,077 | ) |
Accrued expenses, accrued income taxes, and other liabilities |
|
| (25,077 | ) |
|
| 35,817 |
|
|
| 7,450 |
|
Deferred revenue |
|
| (525 | ) |
|
| 3,661 |
|
|
| (861 | ) |
Lease obligations |
|
| (546 | ) |
|
| 1,041 |
|
|
| (542 | ) |
Net cash provided by operating activities |
|
| 256,106 |
|
|
| 98,292 |
|
|
| 156,743 |
|
Investing Activities |
|
|
|
|
|
|
|
|
| |||
Purchases of property and equipment |
|
| (5,924 | ) |
|
| (7,713 | ) |
|
| (2,952 | ) |
Capitalization of website development costs |
|
| (11,346 | ) |
|
| (6,163 | ) |
|
| (4,579 | ) |
Cash paid for acquisitions, net of cash acquired |
|
| — |
|
|
| (64,273 | ) |
|
| (21,056 | ) |
Investments in certificates of deposit |
|
| — |
|
|
| (120,000 | ) |
|
| (100,000 | ) |
Maturities of certificates of deposit |
|
| 90,000 |
|
|
| 130,000 |
|
|
| 111,692 |
|
Net cash provided by (used in) investing activities |
|
| 72,730 |
|
|
| (68,149 | ) |
|
| (16,895 | ) |
Financing Activities |
|
|
|
|
|
|
|
|
| |||
Proceeds from issuance of common stock upon exercise of stock options |
|
| 721 |
|
|
| 663 |
|
|
| 1,136 |
|
Payment of finance lease obligations |
|
| (68 | ) |
|
| (39 | ) |
|
| (37 | ) |
Payment of withholding taxes on net share settlements of restricted stock units |
|
| (16,022 | ) |
|
| (15,388 | ) |
|
| (11,184 | ) |
Repurchase of common stock |
|
| (14,428 | ) |
|
| — |
|
|
| — |
|
Repayment of line of credit |
|
| — |
|
|
| (14,250 | ) |
|
| — |
|
Payment of deferred financing costs |
|
| (2,578 | ) |
|
| — |
|
|
| — |
|
Payment of tax distributions to redeemable noncontrolling interest holders |
|
| (19,913 | ) |
|
| — |
|
|
| — |
|
Change in gross advance payments received from third-party payment processor |
|
| (40,332 | ) |
|
| 46,822 |
|
|
| — |
|
Net cash (used in) provided by financing activities |
|
| (92,620 | ) |
|
| 17,808 |
|
|
| (10,085 | ) |
Impact of foreign currency on cash, cash equivalents, and restricted cash |
|
| (364 | ) |
|
| (597 | ) |
|
| 440 |
|
Net increase in cash, cash equivalents, and restricted cash |
|
| 235,852 |
|
|
| 47,354 |
|
|
| 130,203 |
|
Cash, cash equivalents, and restricted cash at beginning of period |
|
| 248,280 |
|
|
| 200,926 |
|
|
| 70,723 |
|
Cash, cash equivalents, and restricted cash at end of period |
| $ | 484,132 |
|
| $ | 248,280 |
|
| $ | 200,926 |
|
Supplemental disclosure of cash flow information: |
|
|
|
|
|
|
|
|
| |||
Cash paid for income taxes |
| $ | 61,001 |
|
| $ | 27,520 |
|
| $ | 2,831 |
|
Cash paid for operating lease liabilities |
| $ | 17,548 |
|
| $ | 16,168 |
|
| $ | 14,941 |
|
Cash paid for interest |
| $ | 64 |
|
| $ | — |
|
| $ | — |
|
Supplemental noncash disclosure of cash flow information: |
|
|
|
|
|
|
|
|
| |||
Unpaid purchases of property and equipment, capitalized website |
| $ | 1,927 |
|
| $ | 478 |
|
| $ | 136 |
|
Unpaid repurchases of common stock |
| $ | 4,289 |
|
| $ | — |
|
| $ | — |
|
Capitalized stock-based compensation expense in website development and |
| $ | 4,468 |
|
| $ | 3,247 |
|
| $ | 1,906 |
|
Obtaining a right-of-use asset in exchange for a finance lease liability |
| $ | — |
|
| $ | 664 |
|
| $ | — |
|
Obtaining a right-of-use asset in exchange for an operating lease liability |
| $ | 9,845 |
|
| $ | 12,336 |
|
| $ | — |
|
Issuance of stock for acquisition |
| $ | — |
|
| $ | 103,645 |
|
| $ | — |
|
Accretion of redeemable noncontrolling interest to redemption value |
| $ | (109,398 | ) |
| $ | 109,398 |
|
| $ | — |
|
Accrued tax distributions to redeemable noncontrolling interest holders |
| $ | 16 |
|
| $ | 8,701 |
|
| $ | — |
|
|
| Year Ended December 31, |
| |||||||||
|
| 2020 |
|
| 2019 |
|
| 2018 |
| |||
Operating Activities |
|
|
|
|
|
|
|
|
|
|
|
|
Net income |
| $ | 77,553 |
|
| $ | 42,146 |
|
| $ | 65,170 |
|
Adjustments to reconcile net income to net cash provided by operating activities: |
|
|
|
|
|
|
|
|
|
|
|
|
Depreciation and amortization |
|
| 11,342 |
|
|
| 7,817 |
|
|
| 5,029 |
|
Currency gain on foreign denominated transactions |
|
| 23 |
|
|
| (690 | ) |
|
| (190 | ) |
Deferred taxes |
|
| 22,235 |
|
|
| (3,734 | ) |
|
| (39,040 | ) |
Provision for doubtful accounts |
|
| 1,930 |
|
|
| 1,091 |
|
|
| 1,680 |
|
Stock–based compensation expense |
|
| 45,090 |
|
|
| 34,301 |
|
|
| 20,794 |
|
Amortization of deferred contract costs |
|
| 11,605 |
|
|
| 8,416 |
|
|
| 3,689 |
|
Changes in operating assets and liabilities: |
|
|
|
|
|
|
|
|
|
|
|
|
Accounts receivable, net |
|
| 3,889 |
|
|
| (9,608 | ) |
|
| (1,911 | ) |
Prepaid expenses, prepaid income taxes, and other assets |
|
| 3,484 |
|
|
| (378 | ) |
|
| (11,753 | ) |
Deferred contracts costs |
|
| (11,378 | ) |
|
| (15,979 | ) |
|
| (12,987 | ) |
Accounts payable |
|
| (15,077 | ) |
|
| 4,268 |
|
|
| 9,345 |
|
Accrued expenses, accrued income taxes and other liabilities |
|
| 7,450 |
|
|
| 2,760 |
|
|
| 3,100 |
|
Deferred revenue |
|
| (861 | ) |
|
| 1,174 |
|
|
| 4,508 |
|
Deferred rent |
|
| — |
|
|
| — |
|
|
| 4,289 |
|
Lease obligations |
|
| (542 | ) |
|
| (1,468 | ) |
|
| — |
|
Net cash provided by operating activities |
|
| 156,743 |
|
|
| 70,116 |
|
|
| 51,723 |
|
Investing Activities |
|
|
|
|
|
|
|
|
|
|
|
|
Purchases of property and equipment |
|
| (2,952 | ) |
|
| (11,205 | ) |
|
| (5,956 | ) |
Capitalization of website development costs |
|
| (4,579 | ) |
|
| (3,021 | ) |
|
| (1,522 | ) |
Cash paid for acquisitions, net of cash acquired |
|
| (21,056 | ) |
|
| (19,139 | ) |
|
| — |
|
Investments in certificates of deposit |
|
| (100,000 | ) |
|
| (177,808 | ) |
|
| (212,800 | ) |
Maturities of certificates of deposit |
|
| 111,692 |
|
|
| 188,916 |
|
|
| 140,000 |
|
Net cash used in investing activities |
|
| (16,895 | ) |
|
| (22,257 | ) |
|
| (80,278 | ) |
Financing Activities |
|
|
|
|
|
|
|
|
|
|
|
|
Payment of initial public offering costs |
|
| — |
|
|
| — |
|
|
| (1,142 | ) |
Proceeds from exercise of stock options |
|
| 1,136 |
|
|
| 1,807 |
|
|
| 3,632 |
|
Financing cash flows from finance leases |
|
| (37 | ) |
|
| (30 | ) |
|
| — |
|
Payment of withholding taxes and option costs on net share settlement of restricted stock units and stock options |
|
| (11,184 | ) |
|
| (16,470 | ) |
|
| (25,885 | ) |
Net cash used in financing activities |
|
| (10,085 | ) |
|
| (14,693 | ) |
|
| (23,395 | ) |
Impact of foreign currency on cash, cash equivalents, and restricted cash |
|
| 440 |
|
|
| (1 | ) |
|
| (44 | ) |
Net increase (decrease) in cash, cash equivalents, and restricted cash |
|
| 130,203 |
|
|
| 33,165 |
|
|
| (51,994 | ) |
Cash, cash equivalents, and restricted cash at beginning of period |
|
| 70,723 |
|
|
| 37,558 |
|
|
| 89,552 |
|
Cash, cash equivalents, and restricted cash at end of period |
| $ | 200,926 |
|
| $ | 70,723 |
|
| $ | 37,558 |
|
Supplemental disclosure of cash flow information: |
|
|
|
|
|
|
|
|
|
|
|
|
Cash paid for income taxes |
| $ | 2,831 |
|
| $ | 300 |
|
| $ | 2,308 |
|
Unpaid purchases of property and equipment and internal-use software |
| $ | 136 |
|
| $ | 647 |
|
| $ | 5,287 |
|
Capitalized stock-based compensation expense in website development and internal-use software costs |
| $ | 1,906 |
|
| $ | 1,381 |
|
| $ | 490 |
|
Cash paid for operating lease liabilities |
| $ | 14,941 |
|
| $ | 10,906 |
|
|
| — |
|
The accompanying notes are an integral part of these consolidated financial statements.
71
CarGurus, Inc.
Notes to Consolidated Financial Statements
(dollars in thousands, except share and per share data, unless otherwise noted)
1. Organization and Business Description
CarGurus, Inc. (the “Company”"Company"), is a global,multinational, online automotive platform for buying and selling vehicles that is building upon its industry-leading listings marketplace connecting buyerswith both digital retail solutions and sellers of newthe CarOffer digital wholesale platform. The CarGurus platform gives consumers the confidence to buy and/or sell a vehicle either online or in-person, and used cars. Usingit gives dealerships the power to accurately price, instantly acquire, effectively market, and quickly sell vehicles, all with a nationwide reach. The Company uses proprietary technology, search algorithms and innovative data analytics to bring trust, transparency and competitive pricing to the Company believes it is building the world’s most trusted and transparent automotive marketplace and creating a differentiated automotive search experience for consumers. The Company’s trusted marketplace empowers consumers with unbiased third‑party validation on pricing and dealer reputation as well as other information that aids them in finding “Great Deals from Top-Rated Dealers.”shopping experience.
The Company is headquartered in Cambridge, Massachusetts and was incorporated in the State of Delaware on June 26, 2015. 2015.
The Company operates principally in the United States. In the United States, it also operates as independent brands the Autolist online marketplace, which it wholly owns, and the CarOffer, LLC (“CarOffer”) digital wholesale marketplace, in which it holds a 51% equity interest. In addition to the United States, itthe Company operates online marketplaces under the CarGurus brand in Canada and the United Kingdom. In the United Kingdom, it also operates as an independent brand the PistonHeads online marketplace, which it wholly owns. The Company also operated online marketplaces in Germany, Italy, and Spain until it ceased the operations of each of these marketplaces in the second quarter of 2020. In the United States and the United Kingdom, the Company also operates the Autolist and PistonHeads online marketplaces, respectively, as independent brands.
The Company has subsidiaries in the United States, Canada, Ireland, and the United Kingdom.Kingdom and, prior to the first quarter of 2022, had two reportable segments – United States and International. Effective as of the first quarter of 2022, the Company revised its segment reporting from two reportable segments to one reportable segment. Effective as of the fourth quarter of 2022, the Company revised its segment reporting from one reportable segment to two reportable segments – U.S. Marketplace and Digital Wholesale. See Note 1413 of the Company’sthese consolidated financial statements included elsewhere in this Annual Report on Form 10-K for more information on the Company’sfurther segment reporting and geographical information.
The Company is subject to a number of risks and uncertainties common to companies in its and similar industries and stages of development including, but not limited to, rapid technological changes, competition from substitute products and services from larger companies, management of international activities, protection of proprietary rights, patent litigation, and dependence on key individuals.
2. Summary of Significant Accounting Policies
Basis of Presentation
The consolidated financial statements have been prepared in conformity with accounting principles generally accepted in the United States of America (“GAAP”). Any reference in these notes to applicable guidance is meant to refer to GAAP as found in the Accounting Standards Codification (“ASC”) and Accounting Standards Update (“ASU”) of the Financial Accounting Standards Board (“FASB”).
InWhile the Company disclosed total revenue in the consolidated balance sheetincome statements in the Company's Annual Report on Form 10-K for the year end ended December 31, 2019,2020, filed with the Company has presented other current assets with prepaid expenseSEC on February 12, 2021, the accompanying consolidated income statements for the year ended December 31, 2020 present revenues disaggregated into marketplace, wholesale, and prepaid income taxesproduct revenues to conform to the prior and current year presentation, as it did not meeta result of the disclosure threshold.acquisition of a 51% interest in CarOffer.
InWhile the Company disclosed impairment of long-lived assets within depreciation and amortization in the consolidated statements of cash flows in the Company's Annual Report on Form 10-K for the year ended December 31, 2020 filed with the SEC on February 12, 2021, the accompanying consolidated statements of cash flows for the yearsyear ended December 31, 2019 and 2018, the Company has presented other non-current liabilities with accrued expenses, accrued income taxes and other current liabilities2020 present impairment of long-lived assets separately to conform to the prior and current year presentation, as it did not meetimpairments of long-lived assets were material for the disclosure threshold.year ended December 31, 2021.
72
Principles of Consolidation
The accompanying consolidated financial statements include the accounts of the Company and its subsidiaries. All intercompany balances and transactions have been eliminated in consolidation.
Subsequent Event Considerations
The Company considers events or transactions that occur after the balance sheet date but prior to the issuance of the financial statements to provide additional evidence for certain estimates or to identify matters that require additional disclosure. The Company has evaluated all subsequent events and determined that there are no material recognized or unrecognized subsequent events requiring disclosure, other than those disclosed in Note 16 of these consolidated financial statements.disclosure.
Use of Estimates
The preparation of the consolidated financial statements in conformity with GAAP requires management to make estimates and assumptions that affect the reported amounts of assets and liabilities, and the disclosure of contingent assets and liabilities at the date of the financial statements, and the reported amounts of revenue and expenses during the reporting period.
Although the Company regularly assesses these estimates, actual results could differ materially from these estimates. The Company bases its estimates on historical experience and various other assumptions that it believes to be reasonable under the circumstances. Actual results may differ from management’s estimates if these results differ from historical experience, or other assumptions do not turn out to be substantially accurate, even if such assumptions are reasonable when made. Changes in estimates are recordedrecognized in the period in which they become known.
SignificantCritical estimates relied upon in preparing thesethe consolidated financial statements include the determination of sales allowance and variable consideration in the Company’s revenue recognition, allowance for doubtful accounts, the expensing andimpairment of long-lived assets, the capitalization of product, technology, and development costs for website development, internal-use software and internal‑use software,hosting arrangements, the valuation of acquired assets and liabilities, the valuation and recoverability of goodwill and intangible assets and other long-lived assets,goodwill, the valuation of redeemable noncontrolling interest, the recoverability of the Company’s net deferred tax assets and related valuation allowance, the valuation of inventory, and stock-based compensation.the valuation of equity and liability-classified compensation awards. Accordingly, the Company considers these to be its critical accounting policies,estimates, and believes that of the Company’s significant accounting policies, these involve a greaterthe greatest degree of judgment and complexity.
Concentration of Credit Risk
The Company has no significant off‑balanceoff-balance sheet risk, such as foreign exchange contracts, option contracts, or other foreign hedging arrangements. Financial instruments that potentially expose the Company to concentrations of credit risk consist primarily of cash, cash equivalents, investments, and trade accounts receivable.
The Company maintains its cash, cash equivalents, and investments principally with accredited financial institutions of high credit standing. Although the Company deposits its cash, cash equivalents, and investments with multiple financial institutions, its deposits may often exceed governmental insured limits.
Credit risk with respect to accounts receivable is dispersed due to the large number of customers. The Company routinely assesses the creditworthiness of its customers.customers and does not require collateral. The Company generally has not experienced any material losses related to receivables from individual customers, or groups of customers. The majority of the Company's accounts receivable results from wholesale and product revenue transactions. The Company has had no material losses related to wholesale and product receivables as it does not require collateral.release title to the vehicle until successfully collecting funds from the buying dealer. Titling is handled by the Company's payment processor and is held in escrow until it collects funds from the buying dealer (i.e., title is legally transferred from the selling party to the buying party upon signing of bill of sale, but title is held in escrow by the payment processor until payment is received). Due to these factors, no additional credit risk beyond amounts provided for collection losses is believed by management to be probable in the Company’s accounts receivable.
73
As of December 31, 2022, one customer accounted for 13% of net accounts receivable. As of December 31, 2021, two customers accounted for 47% and 18% of net accounts receivable, respectively. The remainder of the accounts receivable was dispersed among more than 1,000 customers. The customers who account for greater than 10% of net accounts receivable are related to wholesale and product receivables. The collection risk associated with these customers is mitigated because, as discussed above, the Company does not release title on vehicles until funds are successfully collected. Furthermore, there is no significant credit risk with respect to accounts receivable because, other than the receivables associated with these customers, credit risk with respect to accounts receivable is dispersed due to the large number of customers.
For the years ended December 31, 2022, 2021, and 2020, 2019, and 2018, 0no individual customer accounted for more than 10% of total revenue.
As of December 31, 2020, 1 customer accounted for 10% of net accounts receivable. As of December 31, 2019 1 customer accounted for 18% of net accounts receivable.
Included in net accounts receivable at December 31, 2020 and 2019, is $7,426 and $8,880, respectively, of unbilled accounts receivable related primarily to advertising customers billed within a period subsequent to services rendered.
Cash, Cash Equivalents, and Investments
Cash and cash equivalents primarily consist of cash on deposit with banks, and amounts held in interest‑bearing money market accounts. Cash equivalents are carried at cost, which approximates their fair market value.
The Company considers all highly liquid investments with an original maturity of 90 days or less at the date of purchase to be cash equivalents. Investments not classified as cash equivalents with maturities less than one year from the balance sheet date are classified as short‑term investments, while investments with maturities in excess of one year from the balance sheet date are classified as long‑term investments. Management determines the appropriate classification of investments at the time of purchase, and re‑evaluates such determination at each balance sheet date. Investments are carried at cost, which approximates their fair market value.
The Company’s investment policy, which was approved by the Audit Committee of the Company’s board of directors (the “Board”), permits investments in fixed income securities, including U.S. government and agency securities, non‑U.S. government securities, money market instruments, commercial paper, certificates of deposit, corporate bonds, and asset‑backed securities.
As of December 31, 2020 and 2019,2022, the Company held no investments.
As of December 31, 2021, investments consisted of U.S. certificates of deposit (“CDs”) with remaining maturities of less than twelve months.months. The Company classifies CDs with readily determinable market values as held‑to‑maturity, because it is the Company’s intention to hold such investments until they mature. As such, as of December 31, 2021, investments were recordedrecognized at amortized cost at December 31, 2020 and 2019.cost. The Company adjusts the cost of investments for amortization of premiums and accretion of discounts to maturity, if any. For the years ended December 31, 2020, 20192021 and 2018,2020, the Company did 0tnot have any premiums or discounts. Realized gains and losses from sales of the Company’s investments are includedrecognized within other (expense) income, net in otherthe consolidated income net. Therestatements. For the years ended December 31, 2021 and 2020, there were 0no realized gains or losses on investments for the years ended December 31, 2020, 2019 or 2018.investments.
The Company reviews investments for other‑than‑temporary impairment whenever the fair value of an investment is less than the amortized cost and evidence indicates that an investment’s carrying amount is not recoverable within a reasonable period of time. Other‑than‑temporary impairments of investments are recognized in the consolidated income statements if the Company has experienced a credit loss or if it is more likely than not that the Company will be required to sell the investment before recovery of the amortized cost basis. Evidence considered in this assessment includes reasons for the impairment, compliance with the Company’s investment policy, the severity and duration of the impairment, and changes in value subsequent to the end of the period. As ofFor the years ended December 31, 20202021 and 2019,2020, the Company determined that 0no other‑than‑temporary impairments were required to be recognized in the consolidated income statements.
Restricted Cash
AtAs of December 31, 20202022 and 2019,2021, restricted cash was $10,627$14,615 and $10,803,$16,336, respectively, and primarily related to cash held at a financial institution in an interest-bearing cash account as collateral for the letters of credit related to the contractual provisions for the Company’s building leases.leases and pass-through payments from customers related to the Company’s wholesale business. As of December 31, 2022 and 2021, portions of restricted cash were classified as short-term assets and long-term assets, as disclosed in the consolidated balance sheets.
74
Accounts Receivable and Allowance for Doubtful Accounts
Accounts receivable are recorded based on the amount due from the customer and a third-party payment processor. Accounts receivable do not bear interest.
TThe Company is exposed to credit losses primarily through its trade accounts receivable, which includes receivables in transit from a third-party payment processor. The third-party payment processor collects customer payments on the Company's behalf and remits them to the Company. Customer payments received by the third-party payment processor, but not remitted to the Company as of period end are deemed to be receivables in transit. Additionally, the third-party payment processor provides payments in advance for certain selling dealers. If the third-party payment processor does not receive buying dealer payments associated with the transaction paid in advance, the Company would guarantee losses incurred by the third-party payment processor and the balance would be deducted from future remittances to the Company. To date, losses associated with these guarantees have not been material. Payments received in advance are presented as cash flows from financing activities in the consolidated statements of cash flows.he
The Company offsets gross trade accounts receivables in transit from the third-party payment processor with payments received in advance from the third-party payment processor as it has the right of offset. At any point in time, the Company could have amounts due from the third-party payment processor for funds the third-party payment processor has collected from buying dealers and has not yet remitted to the Company (i.e. receivables in transit), as well as amounts paid by the third-party payment processor to the Company in advance of collecting payments from buying dealers (i.e. payments received in advance). Therefore, as the Company has the right to offset, the Company can either have a net receivable balance due from the third-party payment processor which is recognized within accounts receivable, or the Company can have a net liability which is recognized within accrued expenses if the advance payments exceed the receivable position from the third-party payment processor as of the balance sheet date.
As of December 31, 2022, gross trade accounts receivable from receivables in transit from the third-party payment processor was $7,122, offset by payments received in advance of $6,490, which resulted in a net receivable of $632 recognized within accounts receivable, net in the consolidated balance sheets. As of December 31, 2021, gross trade accounts receivable from receivables in transit from the third-party payment processor was $18,747, offset by payments received in advance of $46,822, which resulted in a net liability of $28,075 recognized within accrued expenses, accrued income taxes and other current liabilities in the consolidated balance sheets.
The Company also is exposed to credit losses primarily through its trade accounts receivable. The Company offsets gross trade accounts receivable with an allowance for doubtful accounts. The allowance for doubtful accounts is the Company’s best estimate of the amount of probable credit losses in the Company’s existing accounts receivable and is based upon historical loss trends, the number of days that billings are past due, an evaluation of the potential risk of loss associated with specific accounts, current economic trends and conditions, and reasonable and supportable forecasts of economic conditions. If circumstances relating to specific customers change, or unanticipated changes occur in the general business environment, particularly as it affects auto dealers, the Company’s estimates of the recoverability of receivables could be further adjusted.
Provisions for allowances for doubtful accounts are recognized within general and administrative expense in the consolidated income statements. Amounts are charged against the allowance after all means of collection have been exhausted, the potential for recovery is considered remote and when it is determined that expected credit losses may occur. The Company does not have any off‑balance sheet credit exposure related to its customers. Provisions for allowances for doubtful accounts are recorded in general and administrative expense within the consolidated income statements. Unbilled accounts receivable are recorded forgenerally relate to services rendered in the current period, but generally not invoiced until the subsequent period.
The Company also considers current economic trends when evaluating the adequacy of the allowance for doubtful accounts. If circumstances relating to specific customers change, or unanticipated changes occur in the general business environment, particularly as it affects auto dealers, such as the impacts of the novel strain of coronavirus that surfaced in December 2019 and was subsequently declared a pandemic in 2020 by the World Health Organization after spreading globally (“COVID-19”), the Company’s estimates of the recoverability of receivables could be further adjusted.
In light of the COVID-19 pandemic, the Company assessed the implications on accounts receivable and increased its allowance for doubtful accounts to $616 asAs of December 31, 2020 as compared to $240 as of December 31, 2019. The increase in account delinquencies due to the COVID-19 pandemic resulted in $1,930 of bad debt expense2022 and $1,554 of write offs, net of recoveries for the year ended December 31, 2020.
Below is a summary of the2021, changes in the Company’s allowance for doubtful accounts for the years endedare as follows:
|
| Balance at |
|
| Provision |
|
| Write–offs, |
|
| Balance at |
| ||||
Year ended December 31, 2022 |
| $ | 420 |
|
| $ | 1,769 |
|
| $ | (380 | ) |
| $ | 1,809 |
|
Year ended December 31, 2021 |
|
| 616 |
|
|
| 999 |
|
|
| (1,195 | ) |
|
| 420 |
|
As of December 31, 2020, 2019,2022 and 2018:2021, $7,150 and $7,356, respectively was included in net accounts receivable, representing unbilled accounts receivable relating primarily to advertising customers invoiced in the period subsequent to services rendered.
75
Inventory
The Company’s inventory consists of inventory acquired through IMCO transactions, at other marketplaces, or in certain situations across all transactions, during arbitrations. The inventory is recognized in the consolidated balance sheets and is valued at the lower of cost or net realizable value. Cost is determined based on specific identification. In recording inventory at the lower of cost or net realizable value, the Company estimates potential future losses on inventory on hand based on historical losses and market trends. Estimated potential future losses on inventory may vary from actual results which could lead to material adjustments to the financial statements.
|
| Balance at Beginning of Period |
|
| Provision |
|
| Write–offs, net of recoveries |
|
| Balance at End of Period |
| ||||
Year ended December 31, 2020 |
| $ | 240 |
|
| $ | 1,930 |
|
| $ | (1,554 | ) |
| $ | 616 |
|
Year ended December 31, 2019 |
|
| 479 |
|
|
| 1,091 |
|
|
| (1,330 | ) |
|
| 240 |
|
Year ended December 31, 2018 |
|
| 494 |
|
|
| 1,680 |
|
|
| (1,695 | ) |
|
| 479 |
|
Property and Equipment
Property and equipment are stated at cost less accumulated depreciation and amortization using the straight‑line method over the estimated useful lives of the assets. Leasehold improvements and right-of-use assets are amortized over the shorter of the lease term, or the estimated useful life of the related asset. asset, if shorter. The estimated useful lives of the Company’s property and equipment are as follows:
Estimated Useful Life
| |||
|
| ||
Capitalized | equipment | 3 | |
Capitalized | internal-use software | 3 | |
| Capitalized website development |
| 3 |
|
| ||
|
| ||
Leasehold improvements | Lease term, or |
Expenditures for repairs and maintenance are charged to expense as incurred, whereas major betterments are capitalized as additions to property and equipment.