UNITED STATES

SECURITIES AND EXCHANGE COMMISSION

Washington, D.C. 20549

FORM 10-K

(Mark One)

ANNUAL REPORT PURSUANT TO SECTION 13 OR 15 (d) OF THE SECURITIES EXCHANGE ACT OF 1934

For the fiscal year ended December 26, 202030, 2023

OR

TRANSITION REPORT PURSUANT TO SECTION 13 OR 15 (d) OF THE SECURITIES EXCHANGE ACT OF 1934

For the transition period from __________ to __________

Commission file number: 1-14092

THE BOSTON BEER COMPANY, INC.

(Exact name of registrant as specified in its charter)

Massachusetts

04-3284048

(State or other jurisdiction of

incorporation or organization)

(I.R.S. Employer

Identification No.)

\

One Design Center Place, Suite 850, Boston, Massachusetts

(Address of principal executive offices)

02210

(Zip Code)

(617) (617) 368-5000

(Registrant’s telephone number, including area code)

Securities registered pursuant to Section 12(b) of the Act:

Title of each class


Trading

Symbol(s)

Trading

Symbol(s) 

Name of each exchange

on which registered

Class A Common Stock.Stock. $0.01 par value

SAM

New York Stock Exchange

Securities registered pursuant to Section 12(g) of the Act: None

Indicate by check mark if the registrant is a well-known seasoned issuer, as defined in Rule 405 of the Securities Act. Yes No

Indicate by check mark if the registrant is not required to file reports pursuant to Section 13 or Section 15(d) of the Exchange Act. Yes No    No  

Indicate by check mark whether the registrant (1) has filed all reports required to be filed by Section 13 or 15(d) of the Securities Exchange Act of 1934 during the preceding 12 months (or for such shorter period that the registrant was required to file such reports), and (2) has been subject to such filing requirements for the past 90 days. Yes No

Indicate by check mark whether the registrant has submitted electronically every Interactive Data File required to be submitted pursuant to Rule 405 of Regulation S-T (§232.405 of this chapter) during the preceding 12 months (or for such shorter period that the registrant was required to submit such files). Yes No

Indicate by check mark whether the registrant is a large accelerated filer, an accelerated filer, a non-accelerated filer, a smaller reporting company, or an emerging growth company. See the definitions of “large accelerated filer,” “accelerated filer,” “smaller reporting company,” and “emerging growth company” in Rule 12b-2 of the Exchange Act.

Large accelerated filer

Accelerated filer

Non-accelerated filer

Smaller reporting company

Emerging growth company

If an emerging growth company, indicate by check mark if the registrant has elected not to use the extended transition period for complying with any new or revised financial accounting standards provided pursuant to Section 13(a) of the Exchange Act.

Indicate by check mark whether the registrant has filed a report on and attestation to its management’s assessment of the effectiveness of its internal control over financial reporting under Section 404(b) of the Sarbanes-Oxley Act (15 U.S.C. 7262(b)) by the registered public accounting firm that prepared or issued its audit report.

If securities are registered pursuant to Section 12(b) of the Act, indicate by check mark whether the financial statements of the registrant included in the filing reflect the correction of an error to previously issued financial statements.

Indicate by check mark whether any of those error corrections are restatements that required a recovery analysis of incentive-based compensation received by any of the registrant’s executive officers during the relevant recovery period pursuant to §240.10D-1(b).

Indicate by check mark whether the registrant is a shell company (as defined in Rule 12b-2 of the Exchange Act). Yes No

The aggregate market value of the Class A Common Stock ($.010.01 par value) held by non-affiliates of the registrant totaled $5,952.53$2,937.59 million (based on the averageclosing price of the Company’s Class A Common Stock on the New York Stock Exchange on June 27, 2020)30, 2023). All of the registrant’s Class B Common Stock ($.010.01 par value) is held by an affiliate.

As of February 12, 2021,23, 2024 there were 10,088,3729,956,520 shares outstanding of the Company’s Class A Common Stock ($.010.01 par value) and 2,177,9832,068,000 shares outstanding of the Company’s Class B Common Stock ($.010.01 par value).

DOCUMENTS INCORPORATED BY REFERENCE

Certain parts of the registrant’s definitive Proxy Statement for its 20212024 Annual Meeting to be held on May 20, 20217, 2024 are incorporated by reference into Part III of this report.


THE BOSTON BEER COMPANY, INC. AND SUBSIDIARIES

FORM 10-K

FOR THE PERIOD ENDED DECEMBER 26, 202030, 2023

PART I.

Page

Item 1.

Business

3

Item 1A.

Risk Factors

1417

Item 1B.

Unresolved Staff Comments

2325

Item 1C.

Cybersecurity

25

Item 2.

Properties

2326

Item 3.

Legal Proceedings

2428

Item 4.

Mine Safety Disclosures

2428

PART II.

Item 5.

Market for Registrant’s Common Equity, Related Stockholder Matters and Issuer Purchases of Equity Securities

2529

Item 6.

Selected Consolidated Financial Data[Reserved]

2831

Item 7.

Management’s Discussion and Analysis of Financial Condition and Results of Operations

2932

Item 7A.

Quantitative and Qualitative Disclosures About Market Risk

3739

Item 8.

Financial Statements and Supplementary Data

3740

Item 9.

Changes in and Disagreements With Accountants on Accounting and Financial Disclosures

7071

Item 9A.

Controls and Procedures

7071

Item 9B.

Other Information

7173

           Item 9C.

Disclosure Regarding Foreign Jurisdictions that Prevent Inspections

73

PART III.

PART III.

Item 10.

Directors, Executive Officers and Corporate Governance

7274

Item 11.

Executive Compensation

7274

Item 12.

Security Ownership of Certain Beneficial Owners and Management and Related Stockholder Matters

7274

Item 13.

Certain Relationships and Related Transactions, and Director Independence

7274

Item 14.

Principal AccountingAccountant Fees and Services

7274

PART IV.

Item 15.

Exhibits and Financial Statement Schedules

7375

Item 16.

Form 10-K Summary

7577

Signatures

7678

2


PART I.

Item 1. BusinessBusiness

General

General

The Boston Beer Company, Inc. (“Boston Beer” or theand certain subsidiaries (the “Company”) is a high-end alcoholic beverage company and one of the largest craft brewersare engaged in the business of selling alcohol beverages throughout the United States. In fiscal 2020,States and in selected international markets, under the trademarks “The Boston Beer sold approximately 7.4 million barrels of its proprietary productsCompany®”, “Twisted Tea Brewing Company®”, “Hard Seltzer Beverage Company”, “Angry Orchard® Cider Company”, “Dogfish Head® Craft Brewery”, “Dogfish Head Distilling Co.”, “Angel City® Brewing Company”, “Coney Island® Brewing Company”, "Green Rebel Brewing Co.", "Truly Distilling Co.", “American Fermentation Company”, “General Admission Brewing Co.”, “TeaPot Worldwide”, and “Sun Cruiser Beverage Co.". The Company’s brands include Truly Hard Seltzer®, Twisted Tea®, Samuel Adams®, Angry Orchard® Hard Cider and Dogfish Head® Craft Brewery, as well as other local craft beer brands.

Boston Beer produces alcohol beverages, including flavored malt beverages, hard seltzer, malt beverages (“beers”),beer, and hard cider at Company-owned breweries and its cidery and under contract arrangements at other brewery locations. The four primary Company-owned breweries are focused on production and research and development, and includeincluding breweries located in Boston, Massachusetts (the “Boston Brewery”), Cincinnati, Ohio (the “Cincinnati Brewery”), Milton, Delaware (the “Milton Brewery”) and Breinigsville, Pennsylvania (the “Pennsylvania Brewery”). These breweries, with the exception of the Pennsylvania Brewery, have tap rooms for retail sales on site. The Company produces a small but growing amount of distilled spirits and spirits based ready to drink beverages (“spirits RTDs”) at the Milton Brewery.Brewery and other contract brewery locations.

The Company also owns fiveoperates three smaller local breweries that are mainly focused on brewing and packaging beers for retail sales on site at tap rooms and gift shops, restaurant activities, developing innovative and traditional beers and in some cases, supporting draft and package accounts in the respective local market areas. These local breweries are located in Boston, Massachusetts (the “Samuel Adams Boston Downtown Tap Room”), Rehoboth, Delaware (“Dogfish Head Brewings and Eats”), Los Angeles, California (the “Angel City Brewery”Brewery" and "Truly LA”), Brooklyn, New York (the “Coney Island Brewery”) and Miami, Florida (the “Miami Brewery”Cincinnati, Ohio ("Cincincatti Tap Room").

In addition, the Company owns an apple orchard and cidery located in Walden, New York (the “Orchard” and “Cidery”), a restaurant in Rehoboth, Delaware (“Chesapeake & Maine”) and a boutique inn in Lewes, Delaware (the “Dogfish Inn”).

The Company sells its beverages in various packages. Sleek cans, standard cans and bottles are sold primarily for off-premise retailers, which include grocery stores, club stores, convenience stores, liquor stores, and liquor stores.other traditional and e-commerce retail outlets. Kegs are sold primarily for on-premise retailers, which include bars, restaurants, stadiums and other venues.

The Company’s principal executive offices are located at One Design Center Place, Suite 850, Boston, Massachusetts 02210, and its telephone number is (617) 368-5000.

Industry Background

Most of the Company’s products are sold through off-premise retailers and the Company estimates the size of its markets using third-party metrics from measured off-premise channels, which is standard in the beer industry.

The Company was founded in 1984 as a craft brewery and continues to compete in the craft beer category primarily with its Samuel Adams and Dogfish Head brands. The Company has a strong history of innovation and has internally developed brands outside of the craft beer category that are among the leaders in their respective categories. These brands include Twisted Tea, a flavored malt beverage introduced in 2001, Angry Orchard, a hard cider introduced in 2009, and Truly Hard Seltzer, a hard seltzer introduced in 2016.

The Company’s flavored malt beverages, hard seltzers, beers, and hard ciders are primarily positioned in the market for High End beer occasions. The Company defines “High End” beers as including hard seltzer and flavored malt beverages, craft beers, domestic specialty beers, and most imported beer and hard cider that are called for by a High End beer drinker occasion. High End beers and beer occasions (the “High End category”) are determined by higher price, quality, image and taste, as compared with regular domestic beers.

This category has seen high single-digit compounded annual growth over the past ten years.  The Company believes that the High End category is positioned to increase market share, as drinkers continue to trade up in taste and quality. Boston Beer is one of the largest suppliers in the High End category in the United States.  The Company estimates that in 2020 the High End category percentage volume growth was approximately 25%, with the craft beer category volume growth approximately 13%, and total beer category volume growth approximately 10%.

 The Company believes that the High End category is now over 36% of the United States beer market and the Company has approximately a 9% market share of the High End category.

3


The domestic beer industry, excluding the High End category, has experienced a decline in shipment volume over the last twenty years. The Company believes that this decline is due to declining alcohol consumption per person in the population, drinkers trading up to drink high quality,high-quality, more flavorful beers, health and wellness trends and increased competition from wine and spirits companies. The Company estimates that the High End full year percentage volume changes in 2021, 2022 and 2023 were approximately 2%, (3%), and 1%, respectively. These trends are above the United States beer market volume changes in 2021, 2022 and 2023, of (5%), (5%), and (2%), respectively.

Before Prohibition, the United States beer industry consisted of hundreds of small breweries that brewed full-flavored beers. After the end of Prohibition, most domestic brewers shifted production to less flavorful, lighter beers, which use lower-cost ingredients, and can be mass-produced to take advantage of economies of scale in production. This shift towards mass-


producedmass-produced beers coincided with consolidation in the beer industry that by 2008 ultimately resulted in the two largest breweries, Anheuser-Busch InBev (“AB InBev”) and Molson Coors Beverage Company (“Molson Coors”), comprising over 90% of all United States domestic beer production, excluding imports. Duringproduction. At the last twentysame time, during recent years the number of breweries in the United States has increased significantly from approximately 1,500 in 2009 to over 8,00010,000 in 2020.2023. Most of these new breweries are craft (small and independent) brewers. The rise of craft breweries along with the growth of imported beers, flavored malt beverages, and hard seltzers has resulted in a significant decline in the volume of the two largest breweries who now comprise approximately 70%75% of all United States domestic beer production, excluding imports.

The Company and the alcohol industry, at large, is forecasting significant growth in a newly defined category named “Beyond Beer” that includes flavored malt beverages, hard seltzers, spirits RTDs, ciders, and other emerging beverages. The Company believes that the Beyond Beer category in dollars grew approximately 4% in 2022 and 6% in 2023 and is now approximately $9.6 billion at retail and 20% of the combined United States beer market and Beyond Beer category. The Company has approximately a 23% market share of the Beyond Beer category which is the second largest in the category.

Approximately 85% of the Company’s 2023 volume is in the Beyond Beer category. The Company believes that the Beyond Beer category is positioned to increase market share.

Description of the Company’s Business

The Company’s business goal is to become the leading supplier in the High End categoryand Beyond Beer categories by creating and offering high quality alcohol beverages. With the support of a large, well-trained sales organization and world-class brewers, the Company strives to achieve this goal by offering great hard seltzers, beers and hard ciders, andconsumer-responsive beverages, increasing brand availability and awareness through traditional media and digital advertising, point-of-sale, promotional programs, and drinker education.education and engagement.

The Company’s hard seltzers, beers and hard ciderbeverages are sold by the Company’s sales force to the same types of customers and drinkers in similar size quantities, at similar price points and through substantially the same channels of distribution. These beverages are manufactured using similar production processes, have comparable alcohol content and generally fall within the same regulatory environment.

The Company’s strategy is to create and offer a world-class variety of traditional and innovative alcohol beverages. The Company’s primary brands which include the Twisted Tea, Truly Hard Seltzer, Twisted Tea, Samuel Adams, Angry Orchard and Dogfish Head brands are all available nationally. The Twisted Tea brand family has grown each year since the product was first introduced in 2001 and has established a loyal drinker following and has become the largest selling flavored malt beverage brand. In 2016, the Company began national distribution of the Truly Hard Seltzer brand and it maintained its place as one of the leading brands in the hard seltzer category in 2020. The Twisted Tea brand family has grown each year since the product was first introduced in 2001 and has established a loyal drinker following.2023. The Samuel Adams brand began in 1984 and the brand is recognized as one of the largest and most respected craft beer brands with a particular focus on lagers and seasonal beers. The Angry Orchard brand was launched in 2011 and since 2013, Angry Orchard has been the largest selling hard cider in the United States. The Dogfish Head brand began in 1995 and is recognized as one of the most innovative and respected craft beer brandsand spirits brand with a particular focus on India Pale Ales (“IPAs”) and sour beers.spirits RTDs. In addition to its primary brands, the Company has threetwo local brewery brands, Angel City® and Coney Island®, that primarily focus on tap rooms and local and regional distribution, which include Angel City®, Coney Island® and Concrete Beach®.distribution.

The Company sellsentered the market for spirits RTDs through its beveragesDogfish Head brand in various packages. Sleek cans, standard cans and bottles are sold primarily for off-premise retailers, which include grocery stores, club stores, convenience stores and liquor stores. Kegs are sold primarily for on-premise retailers, which include bars, restaurants, stadiums and other venues.

2021 followed by its Truly Hard Seltzer

The Company’s Truly Hard SeltzerVodka Soda brand generally competes within the hard seltzer category that has similar characteristics to the beer industry for reporting and regulatory purposes.  This category is growing rapidly in its early stages of development over the last 5 years and is highly competitive and includes large international and domestic competitors as well as many smaller national, regional and local craft breweries and hard seltzer companies.2022. The Company believes thatis planning to launch additional RTD brands during the hard seltzer category comprises approximately 7%first quarter of United States beer consumption and that the volume comprising the hard seltzer category grew approximately 160% in 2020.

The Company offers seventeen styles of hard seltzer in the Truly brand family, most of which are available nationally in the United States. The majority of the promotional and distribution efforts for the Truly brand family are focused on sleek can variety packages2024 which include Truly Lemonade Seltzer Mix Pack, Truly Berry Mix Pack, Truly Tropical Mix Pack, Truly Citrus Mix PackTequila Soda brand and TrulySun Cruiser, a new spirit-based hard tea brand made with vodka.

4


In 2021, the Company entered separate licensing agreements with PepsiCo, Inc. (“Pepsi”) and Jim Beam Brands Co. (“Jim Beam”) to develop, market and sell alcohol beverages. During 2022 and 2023, the Company sold products under the brand names ‘Hard Mountain Dew’ under the Pepsi agreements and ‘Sauza Agave Cocktails’ and ‘Jim Beam Kentucky Coolers’ under the Jim Beam agreements. Also, the Company collected royalties under the Jim Beam agreement on Jim Beam shipments of ‘Truly Vodka’ and ‘Twisted Tea Seltzer Mix Pack.Whiskey’. While the Company believes these agreements represent strategic opportunities to increase volume in the longer term, these combined brands represented approximately 2% of net revenue in 2023.

Twisted Tea

The Company’s Twisted Tea products generally competescompete within the flavored malt beverage (“FMB”) category of the beer industry (and the Company’s Twisted Tea products are included in generic references to the Company’s “beers” in this report).industry. The Company believes that the FMB category comprises approximately 5%7% of United States beer consumption and that the volume comprising the FMB category grew approximately 13%9% in 2020.2022 and 16% in 2023. This category is highly competitive due to, among other factors, the presence of large brewers and spirits companies in the category as well as many smaller national and regional competitors and a fast pace of product innovation.


The Company offers over ten styles of flavored malt beverages in the Twisted Tea brand family, most of which are available nationally in both the United States and Canada. The majority of the promotional and distribution efforts for the Twisted Tea brand family are focused on Twisted Tea Original, and Twisted Tea Half and Half and variety packs in various standard can packages. During 2023, the Company increased its promotional efforts related to Twisted Tea Light and the style grew over 115% off a relatively small base.

Truly Hard Seltzer

The Company’s Truly Hard Seltzer brand generally competes within the hard seltzer category that has similar characteristics to the beer industry for reporting and regulatory purposes. This category grew rapidly in the early stages of its development and is highly competitive and includes large international and domestic competitors as well as many smaller national, regional and local craft breweries and hard seltzer companies. Beginning in the latter half of 2021 and continuing into 2023, the category saw sharp declines in volume. The Company believes that the hard seltzer category comprises approximately 6% of United States beer consumption and that the volume comprising the hard seltzer category grew 13% in 2021 and then declined 15% in 2022 and 21% in 2023. This relatively sudden and sharp decline has had a significant impact on the Company's business.

The Company offers overthirty styles of hard seltzer in the Truly Hard Seltzer brand family, most of which are available nationally in the United States. The majority of the promotional and distribution efforts for the Truly brand family in 2023 were focused on sleek can variety packages which include, Truly Berry Mix Pack, Truly Tropical Mix Pack, Truly Citrus Mix Pack, Truly Lemonade Seltzer Mix Pack, Truly Fruit Punch Mix Pack, and Truly Margarita Style Pack.

In early 2024, the Company is launching a new 8% ABV “Truly Unruly” variety pack, which will replace its Truly Margarita Style Pack, and a new Truly Party Pack, which will replace its Truly Tropical Pack.

Samuel Adams and Dogfish Head Beers

The Company’s Samuel Adams and Dogfish Head beers generally compete within the craft beer and domestic specialty beer category. The Company believes that the category comprises approximately 8%5% of United States beer consumption and that the volume comprising the category grewdeclined approximately 13%9% in 2020.2022 and 3% in 2023. This category is highly competitive and includes large international and domestic competitors, as well as many smaller national, regional and local craft breweries.

The Company offers over twenty styles of beer in the Samuel Adams brand family and the brand is recognized for helping launch the craft beer industry. Samuel Adams Boston Lager®is the Company’s flagship beer that was first introduced in 1984.

The Samuel Adams Seasonal program of beers was originally introduced in the late 1980’s and early 1990’s.includes various limited availability seasonal beers and variety packs.

5


The majority of the promotional and distribution efforts for the Samuel Adams brand family are focused on Samuel Adams Boston Lager and the Samuel Adams Seasonal program as well as Samuel Adams Just the Haze, a non-alcoholic hazy IPA that was released in early 2021 and Samuel Adams Gold Rush, a non-alcoholic golden lager that was released in early 2023. The two Samuel Adams non-alcoholic beers combined grew over 80% in 2023 and represent over 5% of the brands total volume. Most Samuel Adams beers are available nationally in various bottle, standard can, and keg packages.

The Samuel Adams brand also releases a variety of specialty package and draft beers brewed in limited quantities at its Samuel Adams Downtown Boston Tap Room, Samuel Adams Boston Brewery Tap Room, and Samuel Adams Cincinnati Brewery Tap Room.

The Company offers over twenty-five styles of beer in the Dogfish Head brand family. The Dogfish Head brand began in 19931995 and it is recognized as an early leader in bringing culinary innovations to the U.S. craft beer market. The majority of the promotional and distribution efforts for the Dogfish Head brand family are focused on continually-hopped Dogfish Head 60 Minute and 90 Minute IPAs, along with Dogfish Head SeaQuench, an innovative session sour, and Dogfish Head Slightly Mighty, a low calorie IPA.seasonal variety packs. These four styles are offered in various can, bottle and keg packages. The Company also offers over 15 styles of distilled spirits under the Dogfish Head brand in small quantities and to limited markets. The Dogfish Head brand also releases a variety of specialty package and draft beers brewed in limited quantities at its Dogfish Head Brewings and Eats brewery.and Milton Brewery tasting room locations. The Company does not own distribution rights to the Dogfish Head beer and distilled spirits brands outside of the United States and Canada.

Angry Orchard Hard Cider

The Company’s Angry Orchard ciders compete within the hard cider category that has similar characteristics to the beer industry. The Company believes that the hard cider category comprises less than 1%approximately 0.6% of United States beer consumption and that the volume comprising the category grew 4%declined 10% in 2020.2022 and 3% in 2023. This category is small and highly competitive and includes large international and domestic competitors, as well asthe competition consists mostly of many small regional and local hard cider companies.

The Company offers over ten styles of hard cider in the Angry Orchard brand family, most of which are available nationally in the United States.States in various bottle, can, and keg packages. The majority of the promotional and distribution efforts for the Angry Orchard brand family are focused on Angry Orchard Crisp Apple, Angry Orchard Rosé and Angry Orchard Crisp Unfiltered in various bottle, can and keg packages.Apple. The Angry Orchard brand also releases a variety of specialty package and draft ciders fermented in limited quantities at isits Company-owned Orchard and Cidery in Walden, New York.

Dogfish Head Spirit RTDs, Truly Vodka Soda and Truly Tequila Soda

The Company’s Dogfish Head Distilling Canned Cocktails brand and Truly Vodka and Tequilla Soda brands compete in the spirits RTD category. The Company believes that the spirits RTD category comprises over 11% of the United States Beyond Beer market and that the dollar value comprising the category increased 78% and 54% in 2022 and 2023, respectively. This category is small and highly competitive and includes large international and domestic competitors, as well as many small regional and local craft distilling companies.

The Dogfish Head brand began distilling spirits in 2002 and is considered one of the original craft distilleries. The Company offers over 15 styles of distilled spirits under the Dogfish Head brand in small quantities that are sold in limited markets. In 2021, the Company entered the market for spirits RTDs through its Dogfish Head brand.

The Company currently offers seven styles of spirits RTDs under the Dogfish Head brand that are available nationally in sleek can and sleek can variety packages.

The Company currently offers eleven styles of spirits RTDs under the Truly Vodka Soda brand that are available nationally in sleek can and sleek can variety packages. In the second half of 2023, the Company introduced its Truly Tequila Soda variety pack to limited test markets. The Company is planning to launch the Truly Tequila Soda variety pack nationally during the first quarter of 2024.

The Company continually evaluates the performance of its various hard seltzer, beer and hard cider productsbeverages and the rationalization of its product linelines as a whole. Periodically, the Company discontinues certain styles and packages. For example, during the first half of 2023, the Company discontinued Truly Iced Tea Variety Pack and is planning to discontinue Truly Margarita Style Variety Pack and Truly Tropical Variety Pack during the first half of 2024. Certain styles or brands put on hiatus or discontinued in previous years may be produced for the Company’s variety packs or reintroduced.

The Company’s Dogfish Head Brewery Transaction

On May 8, 2019, the Company entered into definitive agreements to acquire Dogfish Head Brewery (“Dogfish Head”) and various related operations (the “Transaction”), through the acquisition of all of the equity interests held by certain private entities in Off-Centered Way LLC, the parent holding company of the Dogfish Head operations. In accordance with these agreements, the Company made a payment of $158.4 million, which was placed in escrow pending the satisfaction of certain closing conditions. The Transaction closed on July 3, 2019, for total consideration of $336.0 million consisting of $173.0 million in cash and 429,291 shares of restricted Class A Common Stock that had an aggregate market value as of


6


July 3, 2019 of $163.0 million, after taking into account a post-closing cash related adjustment. As required under the definitive agreements, 127,146 of the 429,291 shares of restricted Class A Stock were placed in escrow and will be released no later than July 3, 2029.Product Innovations

These shares had a market value on July 3, 2019 of $48.3 million. The timing of the release of these escrowed shares is primarily related to the continued employment with the Company of Samuel A. Calagione III, one of the two Dogfish Head founders. As part of the transaction, distribution rights to the Dogfish Head brand outside of the United States and Canada were retained by the Dogfish Head founders. The fair value of the Transaction is estimated at approximately $317.7 million.

The results of operations from Dogfish Head have been included in the Company’s consolidated statements of operations since the July 3, 2019 Transaction closing date.

Product Innovations

The Company has a proven track record of innovation and building new brands and is committed to maintaining its position as a leading innovator. To that end, the Company continually tests new hard seltzers, beers, hard ciders, distilled spirits and other alcohol beverages and may sell them under various brand labels for evaluation of drinker interest. The Boston Brewery, the Milton Brewery and the Orchard, along with its other larger breweries and brewery tap rooms spend significant time ideating, testing and developing alcohol beverages for the Company’s potential future commercial development and evaluating ingredients and process improvements for existing beverages.

The Company’s most significant innovationinnovations in 2020 was2023 were the nationallaunches of new styles of its Truly Vodka Soda brand and its launch in limited markets of Truly Tequila Soda and Slingers, a new flavored malt beverage brand. In the first quarter of 2024, the Company is planning to launch Truly Lemonade Hard Seltzer Variety Pack, an innovativeTequila Soda nationally and expand Slingers to more markets. Also, during the first quarter of 2024, the Company is planning to launch two new brands in limited markets. These two new brands are Sun Cruiser, a new vodka based hard seltzer withtea and General Admission, a robust flavor, 100 caloriesnew non-alcoholic beer. During the rest of 2024, the Company has plans to add new beverage styles and 1 gramreformulate existing styles of sugar which was among the top introductions in the Hard Seltzer Category during 2020.  beverages.

In May 2021, the Company has planned for several new product introductions,announced that it was establishing a subsidiary to serve as a dedicated research and innovation hub in the federally regulated market of whichCanada focused on non-alcoholic cannabis beverages. This subsidiary enables the most significant include Truly Iced Tea Hard Seltzer, Twisted Tea ‘Slightly Sweet’, Samuel Adams ‘Wicked Hazy’, Samuel Adams ‘Wicked Easy’, Samuel Adams ‘JustCompany to develop and pilot unique cannabis beverages, while cannabis regulations continue to evolve in the Haze’, Angry Orchard Hard Fruit CiderUnited States and Dogfish Head Scratch-Made Canned Cocktails.  Samuel Adams’ Just the Haze is the Company’s first non-alcoholic beer.worldwide. The Company isbegan selling limited quantities of cannabis beverage products in Canada under the TeaPot brand during the second half of 2022. The Company currently in the early stagesdoes not have plans to produce or sell any cannabis products outside of these introductions.Canada.

Sales, Distribution, and Marketing

As dictated by the legal and regulatory environment, most all of the Company’s sales are made to a network of over 400300 wholesalers in the United States and to a network of foreign wholesalers, importers or other agencies (collectively referred to as “Distributors”). These Distributors, in turn, sell the products to retailers, such as grocery stores, club stores, convenience stores, liquor stores, bars, restaurants, stadiums and other traditional and e-commerce retail outlets, where the products are sold to drinkers, and in some limited circumstances to parties who act as sub-distributors. The Company sells its products predominantly in the United States, but also has markets in Canada, Europe, Israel, Australia, New Zealand, the Caribbean, the Pacific Rim, Mexico, and Central and South America.

With few exceptions, the Company’s products are not the primary brands in its Distributors’ portfolios. Thus, the Company, in addition to competing with other hard seltzers, beers and hard cidersbeverages for a share of the drinker’s business, competes with other brewersbeverage companies for a share of the Distributor’s attention, time and selling efforts. During 2020,2023, the Company’s largest individual Distributor accounted for approximately 2%3% of the Company’s gross sales. The top three individual Distributors collectively accounted for approximately 5%7% of the Company’s gross sales. In some states and countries, the Company’s contracts with its Distributors may be affected by laws that restrict the enforcement of some contract terms, especially those related to the Company’s right to terminate the relationship.

Most

Historically, most of the Company’s products arewere shipped within days of packaging, resulting in limited finished goods at the Company’s breweries and third-party breweries.production facilities. The Company receivesreceived most of its orders from Distributors in the first week of a month for products to be shipped the following month. Historically, Distributors would carry three to five weeks of packaged inventory and three to four weeks of draft inventory and the Company has beenwas able to meet Distributor orders with limited out of stocks.

Beginning in 2019, primarily as a result of higher than anticipated demand for the Truly Hard Seltzer and Twisted Tea brands and supply chain constraints, the Company began to have out of stocks and at times haswas not been able to fully meet Distributor demand, particularly at seasonal peaks during the peak summer months. In response to these out of stocks, the Company began working with certain Distributors on plans to increase Distributor inventories of packaged inventory of Truly Hard Seltzer and Twisted Tea brands to ensure that drinker demand cancould be met. Beginning in the second half of 2021, as the hard seltzer category slowed significantly more than industry expectations, both Company inventory and Distributors inventory in terms of days on hand increased above historical levels. In 2021, this resulted in write-offs of excess inventory at the Company’s breweries and warehouses and lower orders as distributors aggressively reduced their inventory levels.

During 2022, the Company produced and sourced materials for Truly Hard seltzer and some of its newer brands at the upper end of its projections to avoid out of stocks at retail. This led to improved customer service levels and significantly fewer out of stocks but resulted in additional write-offs of excess inventory at the Company’s breweries and warehouses. During 2023,

7


the Company significantly improved its supply chain functions which led to reduced inventories internally and at distributors, while improving customer service levels and significantly reducing write-offs of excess inventory. The Company continues to work on its supply chain transformation initiatives to better manage inventory and further reduce write-offs of excess inventory.

The Company believes distributor inventory


as of December 26, 2020 averaged approximately 5 weeks on hand and30, 2023 was at an appropriate level based on supply chain capacity constraintsfor each of its brands and inventory requirements to support the forecasted growth. The Company expects wholesaler inventory levels in terms ofaveraged approximately four weeks on hand compared to be between 3 and 7five weeks for most of 2021.on hand at December 31, 2022.

Boston Beer has a sales force of approximately 515over 475 people, which the Company believes is one of the largest in the domestic beer industry. The Company’s sales organization is designed to develop and strengthen relations at the Distributor, retailer and drinker levels by providing educational and promotional programs. The Company’s sales force has a high level of product knowledge and is trained in the details of the brewing and selling processes. Sales representatives typically carry samples of the Company’s hard seltzers, beers and hard ciders, certain ingredients,beverages and other promotional materials to educate wholesale and retail buyers about the quality and taste of the Company’s products. The Company has developed strong relationships with its Distributors and retailers, many of which have benefited from the Company’s premium pricing strategy and growth.

The Company also engages in media campaigns, including television, digital and social media, radio, billboards, and print. These media efforts are complemented by participation in sponsorships, which currently include the National Hockey League,United States Soccer Federation, the Boston Red Sox, and other professional sports teams, the Boston Marathon, local concert and festivals, and industry-related trade shows and promotional events at local establishments, to the extent permitted under local laws and regulations. The Company uses a wide array of point-of-sale items (banners, neon signs, umbrellas, glassware, display pieces, signs and menu stands) designed to stimulate impulse sales and continued awareness.

COVID-19

The Company began seeing the impact of the COVID-19 pandemic on its business in early March 2020.  The direct financial impact of the pandemic has primarily shown in significantly reduced keg demand from the on-premise channel and higher labor and safety-related costs at the Company’s breweries. In fiscal year 2020, shipments of kegs decreased to 3% of total shipment volume from 11% of shipments in 2019.  Also, in fiscal year 2020, the Company recorded COVID-19 related pre-tax reductions in net revenue and increases in other costs that total $16.0 million.  In addition to these direct financial impacts, COVID-19 related safety measures resulted in a reduction of brewery productivity. This has shifted more volume to third-party breweries, which increased production costs and negatively impacted gross margins.  Other impacts of COVID-19 on the Company’s business are discussed in “Packaging and Ingredients” below.

Packaging and Ingredients

Historically, the Company has been successful in obtaining sufficient quantities of the packaging materials and ingredients used in the production of its beverages. In the fourth quarter ofDuring 2020 and 2021, the Company experienced some can, cardboard wraps and glass shortagessupply chain constraints in packaging materials, primarily cans, that impacted the Company’s production schedules.schedules and increased can costs as a result of using a more expensive can supplier. The Company enters into limited-term supply agreements with certain vendors in order to receive preferential pricing. The Company maintains competitive sources for most all packaging materials and ingredients. In 2020,2023, certain flavorings, crowns and labels were each supplied by a single source; however, the Company believes that, given time to adjust, alternative suppliers are available. The most significant packaging and ingredients include:

Cans. Truly Hard Seltzer brand beverages are primarily packaged in sleek cans and Twisted Tea brand beverages are primarily packaged in standard cans. In 2020, over 74%2023, approximately 79% of the Company’s total volume was packaged in cans and the Company expects that percentage to increase further increase in 2021.2024. The demand for cans in the beverage industry has significantly increased during 2020 and 2021 and there has beenwas a shortage of capacity, as can manufacturers attempt to adjustadjusted their supply chains to keep up with the increased demand which has furtherhad accelerated duringbeginning in 2020 as the category grew household penetration and alcohol consumption shifted from on-premise to off-premise. In 2020,2021, as the Truly brand family and the Twisted brand families have grown significantly,grew, the Company has experienced supply shortages and in the fourth quarter of 2020, these supply shortages impacted the Company’s production schedules. The Company is working closely with its threeschedules and increased can suppliers to ensure there are no further supply disruptionscosts as a result of using a more expensive can supplier. During 2022 and 2023, the Company has an adequate supply. Thedid not have any significant disruptions in its can supply and the Company currently believes that it will have a sufficient supply of cans in 2021.2024.

Flavorings.

Flavorings and Fruit Juice. The Company’s hard seltzers, beers and hard cidersbeverages include many unique and proprietary flavors and combinations of flavors and some of these flavorings are single sourced. Truly Hard Seltzer and Twisted Tea brand beverages are particularly reliant on the use of flavorings and a variety of flavors as part of their appeal to drinkers. The Company is working closely with various flavoring and fruit juice suppliers to ensure it has an adequate supply and currently believes that it will have sufficient supply of flavorings and fruit juice in 2021.  2024.


Cardboard. 

Cardboard. The Company’s hard seltzers, beers and hard cidersbeverages are packaged primarily in cardboard wraps, carriers and cardboard shipping cases. During the fourth quarter of 2020, the Company hadexperienced a disruption to its supply of cardboard wraps which impacted its production schedules. The Company is working closely with its various cardboard suppliers to ensure that there are no further disruptions andSince 2020, the Company has an adequate supply. Thenot had any significant disruptions in its supply of cardboard and the Company currently believes that it will have a sufficient supply of cardboard wraps in 2021.2024.

Glass.Many Some of the Company’s beers and cidersbeverages are sold primarily in glass bottles. Due to the COVID -19COVID-19 pandemic during 2020 and 2021, the demand for glass bottles in the beverage industry has significantly increased and there has beenwas a shortage of capacity, as glass manufacturers attemptneeded to adjust their supply chains to keep up with the increased demand. DuringThe most recent disruption was during the fourth quarter of 2020, which impacted production schedules. Since 2020, the Company has not had a disruption toany

8


significant disruptions in its supply of glass bottles which impacted its production schedules. The Company is working closely with its two bottle suppliers to ensure there are no further supply disruptions and the Company has an adequate supply. The Company currently believes that it will have a sufficient supply of glass in 2021.2024.

Malt.

Malt. The two-row varieties of barley used in the Company’s malt are mainly grown in the United States and Canada. The 20202023 North American barley crop, which will support 20212024 malt needs, was generally consistent with historical long-term averages with regard to both quality and quantity. The Company purchased most of the malt used in the production of its beers from four suppliers during 2020. The Company currently has a multi-year contract with one of its suppliers and a one-year agreement with the other supplier.2023. The Company also believes that there are other malt suppliers available that are capable of supplying its needs.

Hops.

Hops. The Company uses Noble hop varieties from Europe for many of its Samuel Adams beers and also uses hops grown in the other areas of Europe, and in the United States, England and New Zealand. Noble hops are grown in several specific areas in Germany and the Czech Republic andthat are recognized for growing hops with superior taste and aroma properties. The Company uses hops in various formats including T-90 hop pellets, T-45 hop pellets and CO2 Extract. The Company stores its hops in multiple cold storage warehouses to minimize the impact of a catastrophe at a single site.

The Company enters into purchase commitments with nineseven primary hop dealers and attempts to maintain a one to two-year supply of essential hop varieties on-hand in order to limit the risk of an unexpected reduction in supply and procures hops needed for new beers, based on its best estimate of likely short-term demand. The Company classifies hops inventory in excess of two years of forecasted usage as other long term assets.

Variations to usage plans could result in hops shortages for specific beers or an excess of certain hops varieties.

Yeast.

Yeast. The Company uses multiple yeast strains for production of its beers, hard seltzers and hard ciders.beverages. While some strains are commercially available, other strains are proprietary. Since the proprietary strains cannot be replaced if destroyed, the Company protects these strains by storing multiple cultures of the same strain at different production locations and in several independent laboratories.

Apples.The Company uses special varieties and origins of apples in its hard ciders that it believes are important for their flavor profiles. In 2020,2023, these apples were sourced primarily from Europe and the United States and include bittersweet apples from France and culinary apples from Italy, Washington State and New York. Purchases and commitments are denominated in Euros for European apples and US Dollars for United StatesAmerican apples. There is limited availability of some of these apple varieties, and many outside factors, including weather conditions, growers rotating from apples to other crops, competitor demand, government regulation and legislation affecting agriculture could affect both price and supply.

Quality Assurance

As of December 26, 2020, the

The Company employed twentyemploys a quality assurance team and brewmasters to monitor the Company’s brewing operations and control the production of its hard seltzers, beers, and hard cidersbeverages both at Company-owned breweries and at the third-party breweriesproduction facilities at which the Company’s products are brewed, fermented or fermented.distilled. Extensive tests, tastings and evaluations are typically required to ensure that each batch of the Company’s hard seltzers, beers and hard cidersbeverages conforms to the Company’s standards. The Company has on-site quality control labs at each of the Company-owned breweries and supports the smaller tap rooms and local breweries with additional centralized lab services.

With the exception of certain specialty and distilled products, the Company includes a clearly legible “freshness” codedate on every bottle, can and keg of its hard seltzer, beers and hard ciders,beverages, in order to ensure that its drinkers enjoy only the freshest products. Boston Beer was the first American brewer to use this practice.


Production Strategy

The Company continues to pursue a production strategy that includes production at breweries owned by the Company and breweries and packaging facilities owned by others. During 2019 and 2020, the Company brewed, fermented and packaged approximately 74% and 65% of its volume at breweries owned by the Company, respectively. The Company made capital investments in 20202023 of approximately $140.0$63.9 million, most of which represented investments in the Company’sthese breweries. These investments were made to increase production, drive efficiencies and cost reductions and support product innovation and future growth.innovation. Based on its current estimates of future volumes and mix, the Company expects to invest between $300$90 million and $400$110 million in 20212024 to meet those estimates. Because actual capital investments are highly dependent on meeting demand, the actual amount spent may well be significantly different from the Company’s current expectations.

The Pennsylvania Brewery, the Cincinnati Brewery and the Milton Brewery produceproduced most of the Company’s shipment volume from breweries owned by the Company during 2020.2023. The Pennsylvania Brewery is the Company’s largest brewery.

9


Production and retail activities at the eightCompany's local breweries and tap rooms isare mainly for brewing and packaging beers for retail sales on site at tap rooms and gift shops, restaurant activities, developing innovative and traditional beers and in some cases supporting draft and package accounts in the respective local market areas.

The Cidery’s production is mainly for developing new types of innovative hard ciders and fermenting and packaging ciders for retail sales on site at the Cidery and supporting draft and package accounts in the local market area.

During the years ended December 30, 2023 and December 31, 2022, the Company brewed, fermented, and packaged approximately 71% and 65%, respectively, of its volume at Company-owned breweries. In the normal course of its business, the Company has historically entered into various production arrangements with other brewing companies. Pursuant to these arrangements, the Company generally supplies raw materials and packaging to those brewing companies and incurs conversion fees for labor at the time the liquid is produced and packaged. The Company has made up-front payments that were used for capital improvements at these third-party production facilities that it expenses over the period of the contracts.

The Company currently has a brewing and packaging services agreement with subsidiaries of City Brewing Company, LLC (“City Brewing”). During 20192023 and 2020,2022, City Brewing supplied approximately 23%22% and 33%26%, respectively, of the Company’s annual shipment volume, respectively. In accordance with the brewing and packaging services agreement, the Company has paid to City Brewing $71.5$113.4 million dollars for capital improvements at City Brewing facilities and other pre-payments. During 2022, the Company amended its agreement with City Brewing to ensure access to capacity at a new location and continued access at certain existing locations. The agreement includes a minimum capacity availability commitment by City Brewing and the Company is obligated to meet annual minimum volume commitments and is subject to contractual shortfall fees, if these annual minimum volume commitments are not met. The Company has the contractual right to extend its agreement with City Brewing beyond the December 31, 2024 termination date on an annual basis through December 31, 2035.

The Company currently has a production agreement with Rauch North America (“Rauch”). The agreement includes a minimum capacity availability commitment by Rauch and the Company is obligated to meet annual minimum volume commitments and is subject to contractual shortfall fees, if these annual minimum volume commitments are not met. Production under the Rauch agreement commenced in early 2022. The initial term of the agreement expires December 31, 2031 with provisions to extend.

At current production volume projections, the Company believes that it will continuefall short of its future annual volume commitments at certain third-party production facilities and will incur shortfall fees. The Company expenses the shortfall fees during the contractual period when such fees are incurred as a component of cost of goods sold. During 2023 and 2022, the Company recorded $9.5 million and $3.0 million, respectively, in shortfall fees. As of December 30, 2023, if volume for the remaining term of the production arrangements was zero, the contractual shortfall fees, with advance notice as specified in the related contractual agreements, would total approximately $106 million over the duration of the contracts which have expiration dates through December 31, 2031. At current volume projections and based on understandings reached with these third-party production facilities, the Company anticipates that it will recognize approximately $41 million of shortfall fees and expects to add production capacity at breweries and packaging facilities owned by others andrecord those expenses as follows:


Expected Shortfall Fees to be Incurred


(in millions)


2024


$

13


2025


13


2026


3


2027


3


2028


2


Thereafter


7


Total shortfall fees expected to be incurred


$

41


The Company currently expects that the percentage of total production at breweries and packaging facilities owned by others will increasebe approximately 24% in 2021.2024. The Company carefully selects breweries and packaging facilities owned by others with:with one or more of: (i) sleek can packaging and automated variety packaging capability and capacity; (ii) first-rate quality control capabilities throughout the process; and (iii) the capability of utilizing traditional brewing, fermenting and finishing methods. Under its brewing and packaging arrangements with third parties, the Company is charged a service fee based on units produced at each of the facilities and bears the costs of raw materials, risk, excise taxes and deposits for pallets and kegs and specialized equipment required to produce and package the Company’s beverages.facilities.

10


The Company’s international business is supplied by breweries owned by the Company, under third-party brewingproduction and packaging agreements, and production under license at international locations.

While the Company believes that it has alternatives available to it, in the event that production at any of its current locations is interrupted, severe interruptions at the Pennsylvania Brewery, Cincinnati Brewery, or City Brewing facilities would be most problematic, especially in seasonal peak periods. In addition, the Company may not be able to maintain its current economics, if interruptions were to occur, and could face significant delays in starting up replacement production locations. Potential interruptions at breweries include labor issues, governmental actions, quality issues, contractual disputes, machinery failures, operational shutdowns, or natural or other unavoidable catastrophes. Also, as the brewing industry has consolidated and the Company has grown, the capacity and willingness of breweries owned by others where the Company could produce some of its hard seltzers, beers and hard ciders, if necessary, has become a more significant concern. The Company would work with available contract brewers to attempt to minimize any potential disruptions.

Competition

Competition

The High End category withinBeer industry in the United States is highly competitive due to large domestic and international brewers and the increasing number of craft brewers and craft distilleries in this category who distribute similar products that have similar pricing and target drinkers.


The two largest brewers in the United States, AB InBev and Molson Coors, participate actively in the High End category,and Beyond Beer categories, through numerous launches of newflavored malt beverages, hard seltzers, beers, and spirit RTDs from existing beer brands or new brands, importing and distributing import brands, and with their own domestic specialty beers, either by developing new brands or by acquiring, in whole or part, existing craft breweries.brands. In addition, AB InBev’s High End DivisionInBev and Molson Coors’ Tenth and Blake were formed asCoors have business units headquartered in the United States that are focused exclusively on competing in the High End category.and Beyond Beer categories. Imported beers, such as Corona®Modelo Especial®, Heineken®Corona®, Modelo Especial®Heineken®, and Stella Artois®Artois®, continue to compete aggressively in the United States and have gained market share over the last ten years. Heineken and Constellation Brands (owner of the United States Distribution rights to CoronaModelo Especial and Modelo Especial)Corona) and Heineken may have substantially greater financial resources, marketing strength and distribution networks than the Company.

More recently, beginning in 2021, large non-alcoholic beverage companies including The Coca-Cola Company (“Coke"), Pepsi, Monster Beverage Corporation (“Monster”), and Arizona Beverage Company (“Arizona") have begun to enter these markets directly or through licensing agreements with alcoholic beverage companies to develop alcohol versions of existing traditional non-alcohol brands. Coke has entered into agreements with Molson Coors to develop, market and sell Topo Chico brand Hard Seltzer, Simply Spiked Lemonade, and Peace Hard Tea. Coke also announced agreements with Constellation Brands to develop, market and sell FRESCA™ Mixed and with Brown Forman to develop, market and sell Jack Daniel's® Tennessee Whiskey and Coca-Cola®™ Ready-to-Drink Cocktail. As previously discussed, the Company has entered into an agreement with Pepsi to develop, market and sell Hard Mountain Dew, to take advantage of this trend. Pepsi also entered an agreement in late 2022 with FIFCO USA, a New York based brewery, to develop, market and sell Lipton Hard Iced Tea which launched during the first half of 2023. In addition, Monster acquired CaNarchy Craft Brewery Collective in early 2022 and launched the Beast Unleashed, a new brand of flavored malt beverages in early 2023 which includes Nasty Beast Hard Tea. Arizona, after earlier development and launch in 2020 in Canadian markets, launched Arizona Hard Tea in certain markets in the United States during 2023.

The Company’s Twisted Tea beverages compete generally within the FMB category of the beer industry. FMBs, such as Twisted Tea, Mike’s Hard Lemonade, Smirnoff Ice, Cayman Jack, Beast Unleashed, Bud Light Lime, Redd’s Apple Ale, Seagrams Escapes are typically priced competitively with High End beers. As Twisted Tea has grown, more hard teas have been introduced by competitors. Some of these hard tea competitors currently include Arizona Hard Tea, Arnold Palmer Spiked, Nasty Beast Hard Tea, VooDoo Ranger Hard Charged Tea, Hoop Hard Tea, 2Hoots Hard Tea and Peace Hard Tea. As noted earlier, the FMB category is highly competitive due to, among other factors, the presence of large brewers and spirits companies in the category, the advertising of malt-based spirits brands in channels not available to the parent brands and a fast pace of product innovation.

The Company’s Truly Hard Seltzer beverages compete primarily within the hard seltzer category.category of the beer industry. This category has been growinggrew quickly sincefrom 2016 to 2021 and then declined in 2022 and 2023. The hard seltzer category, is highly competitive and includes large international and domestic competitors. Hard seltzers are typically priced competitively with High End beers and may compete for drinkers with beer, wine, spirits, or FMBs. Some of these competitors include Mark Anthony Brands under the brand name “White Claw” "White Claw Surf" and "White Claw Surge."; ABInBev under “Bud Light Seltzer”, “Natural Lightand “Michelob Ultra Organic Seltzer”, and “Bon & Viv’s”; Diageo under “Smirnoff Spiked Sparkling Seltzer”; and MolsonCoorsMolson Coors under “Vizzy Hard Sparkling Water” and “Coors Seltzer”"Topo Chico".

11


The Company’s Truly brand, including Truly Hard Seltzer, Truly Vodka Soda, and Truly Tequila Soda also compete against a sub-category of Spirits RTDs that the Company expects numerous additional entrantsand the alcohol industry at large categorize as Spirit Seltzer and Soda. The Spirit Seltzer and Soda sub-category generally consists of lower calorie and lower alcohol Spirits RTDs that are similar in flavor and taste to the hard seltzer category during 2021 from both largebeverages but at a higher price. The leading brand in the Spirit Seltzer and smaller international and domestic competitors, as the category continues to develop distribution and drinker awareness. Most significantly, ABInbev introduced and launched nationally “Michelob Ultra Organic Seltzer” in January 2021 and Mark Anthony Brands has announced that “Mikes Hard Lemonade Seltzer” and “White Claw Hard Seltzer Iced Tea” will be introduced and launched nationally in Spring 2021.

The Company’s Twisted Tea beverages compete primarily within the FMB category of the beer industry.  FMBs, such as Twisted Tea, Mike’s Hard Lemonade®, Smirnoff Ice®, Bud Light Lime® Ritas, Redd’s® Apple Ale, Seagrams Escapes® and Arnold Palmer Spiked, are flavored malt beverages that are typically priced competitively with High End beers.  As noted earlier, thisSoda category is highly competitive due to, amongowned by E&J Gallo Winery under the brand name "High Noon” and other factors, the presence of large brewers and spirits companiescompetitors in the category the advertising of malt-based spirits brands in channels not available to the parent brandsinclude ABInBev under “Nutrl Vodka Seltzer”, Mark Anthony under "White Claw Vodka Soda" and a fast pace of product innovation."Rey Azul Tequila and Soda" and Molson Coors under "Topo Chico Spirited Can Cocktails".

The Company’s Samuel Adams and Dogfish Head beveragesbeers compete primarily within the craft beer and domestic specialty beer category of the beer industry. The Company expects competition and innovation among domestic craft brewers to remain strong, as the number of craft brewers continues to grow. The Company estimates there are over 8,00010,000 breweries in operation, up from approximately 1,500 operating breweries in 2009. Most of these new breweries are craft (small and independent) brewers. Also, some existing craft breweries are building more capacity, adding additional local tap rooms, expanding geographically and adding more SKUs and styles.

There

In recent years, there have been numerous announcements of acquisitions of or investments in craft brewers by larger breweries and private equity and other investors. In 2019, a unit of global brewer Kirin Holdings Co. announced the acquisition of New Belgium Brewing, the fourth largest craft brewer, for a reported amount of $350 to $400 million. Also in 2019, global brewer Mahou San Miguel increased its ownership of Founders Brewing Co. from 30% to 90% for a reported valuation of approximately $300 million. The most significant acquisitions in the last few years include Heineken’s acquisition of Lagunitas Brewing Company for approximately $1 billion and AB InBev’s and Molson Coors purchase of multiple smaller craft breweries including Elysian Brewing Company, Golden Road Brewing, Four Peaks Brewing Company, Breckenridge Brewing, Devils Backbone, Karbach, Wicked Weed, Platform Beer and Craft Brew Alliance, and Molson Coors’ purchase of multiple craft breweries, including Hop Valley Brewing, Saint Archer Brewery and Revolver Brewing..

The Company’s Angry Orchard product line competes within the hard cider category. As noted earlier, this category is small and highly competitive and includes large international and domesticthe competitors as well as manyinclude mostly small regional and local hard cider companies. Hard ciders are typically priced competitively with High End Beers and may compete for drinkers with beer, wine, spirits, or FMBs. Some of these competitors include C&C Group PLC"Bold Rock", "Ace" and "2 Towns".

The Company’s Dogfish Head Canned Cocktails compete in the spirits RTDs category. This category is small and highly competitive and includes large international and domestic competitors, as well as many small regional and local distilling companies. Spirits RTDs are typically priced above High End Beers and may compete for drinkers with beer, wine, spirits, or FMBs. As discussed above, spirits RTDs consist of the sub-category of Spirit Seltzer and Soda. Dogfish Head Canned Cocktails generally competes in the other sub-category of spirits RTDs named Spirits-based Canned Cocktails. Beverages in the Spirits-based Canned Cocktails sub-category generally have more flavor and higher alcohol than spirits RTDs in the sub-category of Spirit Seltzer and Soda. Some of these Spirits-based Canned Cocktails competitors include; ABInBev under the brand names ‘Woodchuck’, ‘Magners’name "Cutwater" and ‘Hornsby’s’; HeinekenDiageo under the brand names ‘Strongbow’; and AB InBev under ‘Stella Cidre’name "Crown Royal". In recent years, regional and local cideries, including ‘Bold Rock’ and ‘Austin East Ciders’, have built businesses that have gained share locally at the expense of the national brands.

The Company’s products also compete with other alcoholic beverages for drinker attention and consumption and the pace of innovation in the categories in which the Company competes is increasing. In recent years, wine and spirits have been competing more directly with beers. The Company monitors such activity and attempts to develop strategies which benefit from the drinker’s interest in trading up, in order to position its hard seltzers, beers and hard cidersbeverages competitively with wine and spirits.


The Company competes with other beer and alcoholic beverage companies within a three-tier distribution system. The Company competes for a share of the Distributor’s attention, time and selling efforts. InAt retail, establishments, the Company competes for traditional retail shelf, cold box and tap space.space, as well as e-commerce placement. From a drinker perspective, competition exists for brand acceptance and loyalty. The principal factors of competition in the market for High End beer and Beyond Beer occasions include product quality and taste, brand advertising and imagery, trade and drinker promotions, pricing, packaging and the development of innovative new products.

The Company distributes its products through independent Distributors who also distribute competitors’ products. Certain brewers have contracts with their Distributors that impose requirements on the Distributors that are intended to maximize the Distributors’ attention, time and selling efforts on that brewer’s products. These contracts generally result in increased competition among brewers as the contracts may affect the manner in which a Distributor allocates selling effort and investment to the brands included in its portfolio. The Company closely monitors these and other trends in its Distributor network and works to develop programs and tactics intended to best position its products in the market.

The Company has certain competitive advantages over the localother brewers and regional craft brewers,competitors, including a long history of awards for product quality, greater available resources and the ability to distribute and promote its products on a more cost-effective basis. Additionally, the Company believes it has competitive advantages over imported beers, including lower transportation costs, higher product quality, a lack of import charges and superior product freshness.

12


Regulation and Taxation

The alcoholic beverage industry is regulated by federal, state and local governments. These regulations govern the production, sale and distribution of alcoholic beverages, including permitting, licensing, marketing and advertising. To operate its production facilities, the Company must obtain and maintain numerous permits, licenses and approvals from various governmental agencies, including but not limited to, the Alcohol and Tobacco Tax and Trade Bureau (the “TTB”), the Food and Drug Administration, state alcohol regulatory agencies and state and federal environmental agencies.

Governmental entities may levy various taxes, license fees and other similar charges and may require bonds to ensure compliance with applicable laws and regulations. Beginning in 2018, as a result of the “Tax Cuts and Jobs Act”, the Company’s federal excise tax rate on hard seltzer and beer isdecreased from $18 to $16 per barrel on all barrels below 6 million barrels produced annually. The top tier rate on hard cider (with alcohol by volume of 8.5% or less) is $0.226 per gallon, on hard cider (with non-qualifying fermentable fruits) is $1.07 per gallon, and on artificially carbonated wine (hard cider with high CO2 levels) is $3.30 per gallon. Prior to 2018, the federal excise tax on beer and hard seltzer was $18 per barrel, on hard cider (with alcohol by volume of 8.5% or less) was $0.226 per gallon, on hard cider (with non-qualifying fermentable fruits) was $1.07 per gallon, and on artificially carbonated wine (hard cider with high CO2 levels) was $3.30distilled spirits is $13.50 per proof gallon. These lower rates for hard seltzer, beer and hard cider were made permanent at the end of 2020. States levy excise taxes at varying rates based on the type of beverage and alcohol content. Failure by the Company to comply with applicable federal, state or local laws and regulations could result in higher taxes, penalties, fees and suspension or revocation of permits, licenses or approvals. While there can be no assurance that any such regulatory action would not have a material adverse effect upon the Company or its operating results, the Company is not aware of any infraction affecting any of its licenses or permits that would materially impact its ability to continue its current operations.

Trademarks

Trademarks

The Company has obtained trademark registrations with the United States Patent and Trademark Office for over 400 trademarks, including Samuel Adams®Adams®, Sam Adams®, Samuel Adams Boston Lager®, Samuel Adams Brewing the American Dream®Adams®, Twisted Tea®Tea®, Truly®Truly®, Truly Hard Seltzer®Seltzer®, Angry Orchard®Orchard®, Dogfish Head®Head®, Coney Island®Island®, and Angel City Brewery® and Concrete Beach®. It also has a number of common law trademarks. Several Company trademarks are also registered or have registrations pending in various foreign countries. The Company regards its trademarks as having substantial value and as being an important factor in the marketing of its products. The Company is not aware of any trademark infringements that could materially affect its current business or any prior claim to the trademarks that would prevent the Company from using such trademarks in its business. The Company’s policy is to pursue registration of its marks whenever appropriate and to oppose infringements of its marks through available enforcement options.

Environmental, Health, and Safety Regulations and Operating Considerations

The Company’s operations are subject to a variety of extensive and changing federal, state and local environmental and occupational health and safety laws, regulations and ordinances that govern activities or operations that may have adverse effects on human health or the environment. Environmental laws, regulations or ordinances may impose liability for the cost


of remediation of, and for certain damages resulting from, sites of past releases of hazardous materials. The Company believes that it currently conducts, and in the past has conducted, its activities and operations in substantial compliance with applicable environmental laws, and believes that any costs arising from existing environmental laws will not have a material adverse effect on the Company’s financial condition or results of operations.

As part of its efforts to be environmentally responsible, the Company has adopted a number of practices designed to improve recycling, waste reduction, and utilities consumption at its breweries.

The Company has adopted various policies and procedures intended to ensure that its facilities meet occupational health and safety requirements. The Company believes that it currently is in compliance with applicable requirements and will continue to endeavor to remain in compliance. There can be no assurances,In the future, however, that new and more restrictive requirements might notcould well be adopted, compliance with which might have a material, adverse financial effect on the Company and its operating results, orresults. There can be no assurances that such policies and procedures will be consistently followed and be sufficient to prevent serious accidents.

Among the Company’s key Environmental, Social, and Governance ("ESG") achievements in 2022 was the publication of its inaugural ESG Report entitled Setting the Course for the Future, which is available on the Company’s investor relations website at www.bostonbeer.com. While the Company is just starting its ESG journey, it has long believed in the importance of accurate and transparent reporting on the impact that the Company has on its people, the planet, and its communities. Going forward, the Company intends to share its progress regarding its ESG initiatives in its annual ESG Report, but the Company will continue to share select highlights in its 10-K and annual proxy statement.

Human Capital Resources

13


As of December 26, 2020,30, 2023, the Company had 2,423 employees,2,793 coworkers, of which 87169 were represented by unions or similar organizations. The Company’s Executive Leadership Team (“ELT”) is comprised of ourthe Company's CEO and seven of his six direct reports who collectively have management responsibility for ourthe Company's primary business areas, including but not limited to brewing, supply chain operations, sales, marketing, finance, legal, and people and culture. The Company’s Board of Directors and the ELT believe that succession planning, talent management, culture, and diversity, equity, and inclusion are critical to the Company’s continued success.

Succession Planning and Talent Management

The Company regularly reviews talent development and succession plans for each of its functional areas to identify and develop a pipeline of talent to maintain business operations. The Company understands the potential costs and risks of bringing in an outside executive officer in today’s environment, and that businesses are often – but not always – more successful in promoting internal candidates. Accordingly, the Board of Directors and the ELT make efforts to identify potential successors for those positions long in advance of any potential positional vacancies, perform skills gap analyses for those internal candidates, and provide training and exposure on those gap areas to those candidates in order to develop better potential successors. The Board of Directors is primarily responsible for succession planning for the CEO, but also participates in succession planning discussions for other executive officer positions. The Company believes that its culture, compensation structure, long-term equity program, and robust training and development program provide motivation for talented leaders to remain with the Company.

Culture

Culture

The ELT discusses culture with its employees and the Board of Directors on a regular basis. The Company is continuously focused on developing an inclusive and respectful work environment, where all employees at every level should feel empowered to honestly “discuss the undiscussables” with other employees at any level, all the way up to the Chairman and the CEO, without fear of retribution or retaliation. The Chairman teaches this philosophy during orientation to all new employees, and each company-wide meeting has time set aside to discuss the undiscussables. Additionally, each year the Board meets with a set of key senior managers, without the ELT present, so that the Board may seek direct feedback on the Company, its practices, culture, and employee benefits and programs.

The Company also fosters a culture of ongoing training and education. Some examples of trainings provided to employees include New EmployeeCo-Worker Orientation, Respectful and Effective Communications, Leading the Boston Beer Company Way, Selling Skills, Negotiations, and Building Brands. Over the past year, the Company has been particularly focused on delivering a Crucial Conversations class, designed to teach all employees refined skills for having “undiscussable” conversations. Employees also receive beer and cider education training during New EmployeeCo-Worker Orientation. Then, after having been with the Company for one year, employees are encouraged to participate in further beer and cider education courses where they can train to be certified as industry experts in those areas. The Company believes that it has the most beer industry experts, called “Certified Cicerones,” in the beer industry.

In October 2020, the Company rolled out a formal mentoring and leadership program to connect dozens of senior and junior employees across a range of backgrounds with the purpose of diversifying perspectives, building networks, developing capabilities, growing competencies, and cultivating leadership.

The Company also regularly conducts internal engagement surveys of its employee base to help ensure that it is maintaining its culture. In 2020,2023, over 72%83% of employees participated in the survey, which resulted in high scores in response to the


questions related to pride in working for the Company, believing inembodying the Company’s values, the Company’s concern for employee safety, confidence in the future of the Company,personal well-being, and pride in the Company’s handling of the COVID-19 pandemic.diversity, and creating a respectful work environment.

Diversity, Equity, and Inclusion

As anCore to the Company's "Our People" value is Diversity, Equity, and Inclusion (DE&I), which prioritizes building a diverse and fair-minded organization that recognizes and values differences. The Company committed to making Boston Beer a welcoming place to work for all employees, by fostering a culture where everyone feels heard, valued, and respected. These efforts reinforce a workplace that supports and uplifts coworkers to feel accepted, equal, opportunity employer,and involved, and to increase diverse representation across our organization. In 2023, the Company is committedset out to creatingaccomplish two objectives including hiring an inclusiveInclusion and diverse work environment that promotes equal opportunity, dignity,Belonging Program Manager dedicated to supporting the continued efforts in this space.

The following are a few accomplishments tied to these objectives:

14


Prioritized inclusion and respectbelonging to ensure coworkers feel heard, valued, and respected.
Rolled out visible pay ranges for all and increases diverse representationroles, including open job requisitions.

To support DE&I efforts, the Company previously established a “Value 4 Council” (named for the Company's 4th value, ‘our differences make us stronger’). This council, comprised of leaders across all departments, continues to engage in leadership roles. The Company is focused on expanding the diverse perspectives of its employee base, which is critical to continued success. Over the past two years,efforts supporting inclusion. To date, the Company has taken numerous steps in furtherancehad two cohorts participate on the council and complete 15 hours of this goal:allyship training.

Every employee of the Company is required to undergo extensive unconscious bias training.

Diversity was an area of discussion at our National Company Meetings.

The Company created an Employee Resource Group platform designed to provide an outlet for employees to come together around shared life experiences and provide a safe place to foster inclusivity and connection. As of 2020, the Company had six employee resource groups focused in the areas of diversity and inclusion, LGBTQIA+, working parents, veterans, drug and alcohol support, and sustainability.  

Diversity was the sole focus of our annual “Action Learning Project” in 2019, where a cross-functional group of high-potential employees is formed annually to tackle an issue of vital importance to the Company. The Action Learning Project Group met every week for over ten months, identifying potential solutions to improve diversity across the Company. The group presented its findings and proposed solutions to the Executive Leadership Team and a leadership group consisting of the Company’s key senior managers in late 2019.

In early 2020, the “Action Learning Project” project evolved into the creation of a Diversity & Inclusion Committee. The goal of the committee is to continue to advance the efforts of fostering open dialogue about diversity, equity, and inclusion, maintaining a culture that values everyone, regardless of their identity, and ensuring everyone at the Company is treated with dignity and respect. The Committee held monthly forum meetings over the course of 2020 open to all employees.

In early 2021, the Diversity & Inclusion Committee collaborated with the Company’s Talent Acquisition team to work on expanding the diversity of the employee candidate pipeline. Those efforts included auditing college and university partners, researching and reaching out to historically black colleges and Hispanic serving institutes, and focusing efforts on diverse recruiting and job board sites.

The Company sponsored a seminar series to bring guest speakers and experts across multiple facets of diversity and inclusion to speak to employees and business partners.

The Company established long-term relationships with the NAACP, Civic Alliance, and GLAAD to further our knowledge and support of issues facing black, brown, and LGTBQIA+ communities.

The Company participated in the #StopHateForProfit boycott that asked companies to halt spending advertising funds with certain social media platforms, with the purpose of encouraging those platforms to increase the monitoring and regulation of hate, racism, and disinformation by users.

In 2020, the Company appointed an employee to the newly-created full-time position of Diversity, Equity & Inclusion Leader to spearhead the Company’s diversity and inclusion efforts. The position also serves as a member of the Company’s newly-created Social Impact Team.

In 2020 the Company formed a multi-cultural task force, comprised of a cross-functional group of employees, to analyze and support the evolving makeup and needs of the Company’s consumer base.  Over the course of year, the Company leveraged its brands as external platforms to amplify these values and support diverse causes.

As of December 26, 2020, 2 ofTo promote an inclusive culture across the 9organization, the Company held six “Fearless Moments” discussion sessions. These sessions, featuring founders Jim Koch and Sam Calagione and facilitated by members of the BoardCompany's ELT and Value 4 Council, create a space for coworkers to reflect on the Company's values and their role in creating a community of Directorsbelonging.

To improve its ability to cultivate a more diverse workforce, the Company refreshed its employer brand, prominently updating its public-facing website, www.bostonbeer.com. In 2023, this led to a 9% increase in total job applicants. Within that overall growth, the Company saw an increase in diverse candidates in several demographics in 2023.

In 2022, the Company clearly established an ongoing commitment to pay transparency. Pay transparency is the commitment from Boston Beer to provide coworkers visibility into the BBC’s pay philosophy, how the Company administers pay, and finally the pay range for individual jobs. To deliver on pay ranges, over the course of 8 months the Company:

Created ~1,500 unique pay statements for each eligible coworker.
Hosted over 50 comp 101 education sessions to educate on the Company's pay practices with every department.
Held 100+ leadership review sessions to ensure the details were female and 1accurate.
Provided deep education to managers to help deliver the statements.

Following the successful roll-out of 9 self-identified as part of an underrepresented minority group; 3 of 11 Executive Officers were female and 1 of 11 self-identified as part of an underrepresented minority group. Acrosspay ranges for existing coworkers, in November 2023, the Company’s broader professional population, approximately 34.5% are female and 16.6% self-identified as part of an underrepresented minority group. In 2020, approximately 41.8% of new hires were female and 19.8% identified as an underrepresented minority group, both of which were improvements over 2019.Company began publicly disclosing salary ranges on job requisitions.

Corporate Social Responsibility

The Company’s core philanthropic initiative isSocial Impact Team works with external partners and internal stakeholders across the organization to bring Corporate Social Responsibility initiatives to life for our coworker communities and for its brands. In 2023, the Company invested nearly $3 million into cause-marketing, bringing the total dollars spent since 2016 to more than $23 million.

Boston Beer Benevolence Days are curated one day service projects during which coworkers work together to support non-profit partners in the communities they work and live in. In 2023, Boston Beer coworkers participated in 47 separate Benevolence Days totaling more than 1800 hours with 45 community partners. Some of the projects coworkers supported in 2023 included food & clothing pantry sorting/packing, home building, clearing invasive species from waterways, community beautification, and trail cleanup. In addition, the Social Impact Team hosted onsite Benevolence opportunities at our BeerFest meetings. In Boston, coworkers assembled hygiene kits for 2 New England veterans organizations and at the Delaware BeerFest gathering they penned Veterans Day cards for those staying at a local shelter.

The Samuel Adams Brewing the American Dream®.Dream® program celebrated a milestone 15th year in 2023, surpassing more than $100 million in loans to support small business owners. In partnership with ACCION, one ofAccion Opportunity Fund, the nation’s largest non-profit micro-lenders,micro-lender, as well as other local non-profit partners, the programinitiative supports small business owners in the food, beverage, and


brewing industries through access to business capital, coaching, and new market opportunities. The goal is to help strengthen small businesses, create local jobs, and build vibrant communities. SinceBoston Beer coworkers provide one-on-one coaching for the inception ofentrepreneurs in subjects ranging from procurement, sales and marketing. At the Samuel Adams Boston Taproom we launched a series of Brewing theThe American Dream collaboration beers to bring visibility to small, local breweries.

In 2023, Dogfish Head’s Beer & Benevolence program in 2008, the Company and ACCION have worked together to loaninvested more than $64 million to more than 3,200 small business owners who have subsequently repaid these loans at a rate of more than 95%. The loan repayments received are reinvested$625,000 into the coastal Delaware community through organizations working to build community, amplify the arts and make positive environmental impact. Some of the 2023 Beer & Benevolence highlights included: 1,800 runners participating in the 2023 Dogfish Dash, raising $70,000 for the Delaware Center for the Inland Bays; our seafood restaurant Chesapeake & Maine contributing 135.5 bushels of shellfish shucks to the Don't Chuck Your Shucks program. Boston Beer employees, together with local business partners and community organizations, have provided coaching and mentoringThese shucks contributed to more than 12,000 business owners across the country. These efforts have helped to create or maintain more than 9,000 local jobs.2,700 oyster shell bags that help restore

Other15


shorelines and protect marsh edges; and providing support to the Developing Artist Collaboration which provides artists with career development, peer connection and physical spaces.

The Company kicked off a three-year partnership with the newly formed National Black Brewers Association ("NB2A") in 2023, pledging financial support for the organization. The company has coworkers serving on the Advisory Board and the Business Council for the NB2A, whose mission is dedicated to addressing under-representation of Black people in the brewing industry.

Through these actions and others, the BBC Social Impact Team is focused on empowering coworkers, brands and partners to impact the Company's communities through inclusive engagement to deepen connections and make a difference.

Other

The Company submitted the Section 12(a) CEO Certification to the New York Stock Exchange in accordance with the requirements of Section 303A of the NYSE Listed Company Manual. This Annual Report on Form 10-K contains at Exhibits 31.1 and 31.2 the certifications of the Chief Executive Officer and Chief Financial Officer, respectively, in accordance with the requirements of Section 302 of the Sarbanes-Oxley Act of 2002. The Company makes available free of charge copies of its Annual Report on Form 10-K, as well as other reports required to be filed by Section 13(a) or 15(d) of the Securities Exchange Act of 1934, on the Company’s investor relations website at www.bostonbeer.com, or upon written request to Investor Relations, The Boston Beer Company, Inc., One Design Center Place, Suite 850, Boston, Massachusetts 02210.

16


Item 1A. Risk Factors

Item 1A.

Risk Factors

In addition to the other information in this Annual Report on Form 10-K, the risks described below should be carefully considered before deciding to invest in shares of the Company’s Class A Common Stock. These are risks and uncertainties that management believes are most likely to be material and therefore are most important for an investor to consider. The Company’s business operations and results may also be adversely affected by additional risks and uncertainties not presently known to it, or which it currently deems immaterial, or which are similar to those faced by other companies in its industry or business in general. If any of the following risks or uncertainties actually occurs, the Company’s business, financial condition, results of operations or cash flows would likely suffer. In that event, the market price of the Company’s Class A Common Stock could decline.

Risks Related to the COVID-19 Pandemic

The Global COVID-19 Pandemic Has Disrupted the Company’s Business and the Company’s Financial Condition and Operating Results Have Been and Are Expected To Continue to be Affected by the Outbreak and Its Effects.

The Company’s operations and business have been negatively affected and could continue to be materially and adversely affected by the COVID-19 pandemic and related weak, or weakening of, economic or other conditions, particularly in the United States where the Company derives most of its revenue and profit, but also in Europe, where some of the Company’s ingredient suppliers are located. National, state and local governments have responded to the COVID-19 pandemic in a variety of ways, including, without limitation, by declaring states of emergency, restricting people from gathering in groups or interacting within a certain physical distance (i.e., social distancing), and in certain cases, ordering businesses to close or limit operations or people to stay at home.  Although the Company has been permitted to continue to operate its breweries in all of the jurisdictions in which it operates, there is no assurance that the Company will be permitted to operate these facilities under every future government order or other restriction and in every location or that the third-party breweries on which the Company relies for production will similarly be permitted to continue to operate.  In particular, any limitations on, or closures of, the Company’s Pennsylvania, Cincinnati or Milton breweries or its third-party breweries, could have a material adverse impact on the Company’s ability to manufacture products and service customers and could have a material adverse impact on the Company’s business, financial condition and results of operations.

During the fifty-two weeks ended December 26, 2020, the principal impacts of the global COVID-19 pandemic were a significant reduction in keg demand from the on-premise channel and higher labor and safety related costs at Company-owned breweries.  The Company expects to continue to be impacted as the situation remains dynamic and subject to rapid and possibly material change.  Continued or additional disruptions to the Company’s business and potential associated impacts to the Company’s financial condition and results of operations include, but are not limited to:

reduced demand for the Company’s products, due to adverse and uncertain economic conditions, such as increased unemployment, a prolonged downturn in economic growth and other financial hardships, or a decline in consumer confidence, as a result of health concerns;


unpredictable drinker behaviors and reduced demand for the Company’s products, due to on-premise closures, government quarantines and other restrictions on social gatherings;

inability to manufacture and ship the Company’s products in quantities necessary to meet drinker demand and achieve planned shipment and depletion targets, due to disruptions at the Company-owned breweries and third-party breweries caused by:

o

the Company’s inability to maintain a sufficient workforce at Company-owned breweries, due to the health-related effects of COVID-19 and similar staffing issues at third-party breweries;

o

disruptions at the Company-owned breweries and third-party breweries caused by an inability to maintain a sufficient quantity of essential supplies, such as ingredients and packaging materials, and maintain logistics and other manufacturing and supply chain capabilities necessary for the manufacture and distribution of the Company’s products;

o

failure of third parties on which the Company relies, including the Company’s packaging and ingredients suppliers, third-party breweries, distributors, and logistics and transportation providers, to continue to meet on a timely basis their obligations to the Company, which may be caused by their own financial or operational difficulties;

potential incremental costs associated with mitigating the effects of the pandemic on the Company’s operations, including increased labor, freight and logistics costs and other expenses; or

significant changes in the conditions in markets in which the Company produces, sells or distributes Company products, including prolonged or additional quarantines, governmental and regulatory actions, closures or other restrictions that limit or close the Company’s operating and manufacturing facilities, restrict the ability of the Company’s employees to perform necessary business functions, restrict or prevent consumers access to the Company products, or otherwise prevent the Company’s third-parties from sufficiently staffing operations, including operations necessary for the production, distribution, sale and support of Company products.

These impacts could place limitations on the Company’s ability to operate effectively and could have a material and adverse effect on the Company’s operations, financial condition and operating results. The Company has implemented policies and procedures at its Company-owned breweries to address potential risks, including entrance screening and temperature checks, face mask requirements, reorganizing work to increase social distancing between and among shifts, and adding two hours of workspace cleaning per shift.  As the situation continues to evolve and more information and guidance becomes available, the Company may adjust its current policies and procedures, so as to address the rapidly changing variables related to the pandemic. Additional impacts may arise, of which the Company is not currently aware. The nature and extent of such impacts will depend on future developments, which are highly uncertain and cannot be predicted.

Risks Associated with Our Industry

The Company Faces Substantial Competition.faces substantial competition.

The market for High End beer occasionsand Beyond Beer categories within the United States isare highly competitive due to the introductionparticipation of large domestic and expansion of hard seltzer brands,international brewers in the categories and the increasing number of domesticregional and international beverage companies withlocal competitors, who distribute similar products that have similar pricing and target drinkers, gainsdrinkers.

The two largest brewers in market share achieved bythe United States, AB InBev and Molson Coors, participate actively in the High End and Beyond Beer categories, through numerous launches of new hard seltzers, flavored malt beverages and spirit RTDs from existing brands or new brands, importing and distributing import brands, and with their own domestic specialty beers, and imported beers, the acquisition of craft brewerseither by larger brewers. Some of the largest of these competitors include AB InBev, Molson Coors, Constellation, Heineken and Mark Anthony Brands as they introducedeveloping new hard seltzers and expand their efforts behindbrands or by acquiring, in whole or part, existing brands and acquire craft brewers.brands. Imported beers, such as Corona®Modelo Especial®, Heineken®Corona®, Modelo Especial®Heineken®, and Stella Artois®Artois®, also continue to compete aggressively in the United States beer market.and have gained market share over the last ten years. Constellation Brands (owner of the United States distribution rights to Modelo Especial and Corona) and Heineken may have substantially greater financial resources, marketing strength and distribution networks than the Company. The Company anticipates competition among domestic craft brewers will remain strong as some existing breweriesbeverage companies are building more capacity, expanding geographically and adding more SKUs and styles. The continuedpotential for growth in the sales of flavored malt beverages, hard seltzers, craft-brewed domestic beers, and imported beers and spirits RTDs is expected to increase the competition in the market for High End beer and Beyond Beer occasions within the United States and, as a result, pricesthe Company may well face competitive pricing pressures and the demand for and market share of the Company’s products may fluctuate and possibly decline.

The Company’s products compete generally with other alcoholic beverages. The Company competes with other beer and beverage companies not only for drinker acceptance and loyalty, but also for traditional retail shelf, cold box and tap space, in retail establishmentsas well as e-commerce placement and for marketing focus by the Company’s Distributors and their customers, all of which also distribute and sell other hard seltzers, beers and other alcoholic beverage products. Many of the Company’s competitors, including AB InBev, Molson Coors, Constellation, Heineken and Mark Anthony Brands, have substantially greater financial resources, marketing strength and distribution networks than the Company. Moreover, the introduction of new products by competitors


that compete directly with the Company’s products or that diminish the importance of the Company’s products to retailers or Distributors may have a material adverse effect on the Company’s business and financial results.

Further,

Beginning in 2021, large non-alcoholic beverage companies including Coca-Cola Company (“Coke"), Pepsi, Monster Beverage Corporation (“Monster”) and Arizona Beverage Company ("Arizona") have begun to enter these markets directly or through licensing agreements with alcoholic beverage companies to develop alcohol versions of existing traditional non-alcohol brands. Coke has entered into agreements with Molson Coors to develop, market and sell Topo Chico brand Hard Seltzer, Simply Spiked Lemonade and Peace Hard Tea. Coke also announced agreements with Constellation to develop, market and sell FRESCA™ Mixed, a line of spirits RTDs and with Brown Forman to develop, market and sell Jack Daniel’s® Tennessee Whiskey and Coca-Cola®™ Ready-to-Drink Cocktail. As previously discussed, the beer industryCompany has seen continued consolidation among brewers in orderentered into an agreement with Pepsi to develop, market and sell alcohol beverages which include Hard Mountain Dew, to take advantage of cost savings opportunities for supplies, distributionthis trend. In addition, Monster acquired CANarchy Craft Brewery Collective in early 2022 and operations. Illustrativelaunched the Beast Unleashed, a new brand of this consolidation is AB InBev’s $107 billion purchase of SAB Millerflavored malt beverages in early 2023 which includes Nasty Beast Hard Tea. Arizona, after earlier development and the related sale by SAB Miller to Molson Coors of its 58% share of the MillerCoors joint venture with Molson Coors, as well as Heineken’s acquisition of Lagunitas Brewing Company for approximately $1 billion. Also,launch in 2020 in Canadian markets, launched Arizona Hard Tea in certain markets in the last several years, both AB InBev and Molson Coors have introduced numerous new hard seltzers and purchased multiple regional craft breweries with the intention to expand the capacity and distribution of these breweries. United States during 2023.

17


Due to the increased leverage that these combined operations willlarger companies have in distribution and sales and marketing expenses, the costs to the Company of competing could increase. The potential also exists for these large competitors to increase their influence with their Distributors, making it difficult for smaller brewersbeverage companies to maintain their market presence or enter new markets. The continuingAlso, consolidation in the industry could also reduce the contract brewing capacity that is available to the Company. These potential increases in the number and availability of competing brands, the costs to compete, reductions in contract brewing capacity and decreases in distribution support and opportunities may have a material adverse effect on the Company’s business and financial results.

Changes in Public Attitudespublic attitudes and Drinker Tastes Could Harmdrinker tastes could harm the Company’s Business.business. Regulatory Changeschanges in Responseresponse to Public Attitudes Could Adversely Affectpublic attitudes could adversely affect the Company’s Business.business.

The alcoholic beverage industry has been the subject of considerable societal and political attention for several years, due to public concern over alcohol-related social problems, including driving under the influence, underage drinking and health consequences from the misuse of alcohol, including alcoholism. As an outgrowth of these concerns, the possibility exists that advertising by beer producers could be restricted, that additional cautionary labeling or packaging requirements might be imposed, that further restrictions on the sale of alcohol might be imposed or that there may be renewed efforts to impose increased excise or other taxes on beer sold in the United States.

The domestic beer industry, other than the market for High End beer occasions and Beyond Beer occasions, has experienced a decline in shipments over the last ten years. The Company believes that this decline is due to declining alcohol consumption per person in the population, drinkers trading up to drink high quality, more flavorful FMBs, hard seltzers, beers, and beers,spirts RTDs, health and wellness trends and increased competition from wine and spirits companies. If consumption of the Company’s products in general were to come into disfavor among domestic drinkers, or if the domestic beeralcohol beverage industry were subjected to significant additional societal pressure or governmental regulations, the Company’s business could be materially adversely affected.

Certain

Additionally, certain states are considering or have passed laws and regulations that allow the sale and distribution of marijuana. Currently it is not possible to predict the impact of this on sales of alcohol, but it is possible that legal marijuana usage could adversely impact the demand for the Company’s products.

The Company Is Dependentis dependent on Its Distributors.its distributors.

In the United States, where approximately 96%95% of its beer isbeverages are sold, the Company sells most of its alcohol beverages to independent beer Distributors for distribution to retailers and, ultimately, to drinkers. Although the Company currently has arrangements with over 400300 Distributors, sustained growth will require it to maintain such relationships and possibly enter into agreements with additional Distributors. Changes in control or ownership within the current distribution network could lead to less support of the Company’s products.

Contributing to distribution risk is the fact that the Company’s distribution agreements are generally terminable by the Distributor on relatively short notice. While these distribution agreements contain provisions giving the Company enforcement and termination rights, some state laws prohibit the Company from exercising these contractual rights. The Company’s ability to maintain its existing distribution arrangements may be adversely affected by the fact that many of its Distributors are reliant on one of the major beer producers for a large percentage of their revenue and, therefore, they may be influenced by such producers. If the Company’s existing distribution agreements are terminated, it may not be able to enter into new distribution agreements on substantially similar terms, which may result in an increase in the costs of distribution.

No assurance can be given that the Company will be able to maintain its current distribution network or secure additional Distributors on terms not less favorable to the Company than its current arrangements.


18


Risks Related to Ourthe Company's Business and Operations

There Is No Assurance of Continued Growthis no assurance that the Company will grow its business in the future or that the Company Can Adaptcan adapt to the Challengeschallenges of the Changing Competitive Environment.changing competitive environment.

From 2015 to 2017, the Company experienced a decline in the demand for its products, as craft beer growth rates slowed and the hard cider category declined. From 2018 to 2020,2021, the Company experienced increases in demand for its products, driven by growth in its Truly and Twisted Tea brands, and grew 13%, 22%, 37% and 37%22% in depletion volume for 2018, 2019, 2020 and 2020,2021, respectively. Beginning in the second half of 2021, the market for hard seltzer products experienced decelerating growth trends, which resulted in a depletion volume decline of 5% in 2022 and 6% in 2023 (5% decline on a 52-week comparable basis). The slowdown in growth trends greatly impacted the Company's volume of production and shipments, as well as its volume projections for the future. The volume reduction also resulted in increased supply chain related costs. These costs include the destruction of excess inventory, provisions for excess and obsolete inventories, property, plant and equipment impairments, write-offs of third-party production prepayments and provisions for costs associated with the termination of various third-party production contracts.

The Company is targeting shipmenta percentage change in shipments and depletion volume growth of between 35% and 45% in 2021.down single digits to up single digits. The Company’s ability to sustain double digit growth trendsmeet these targets may be affected by an increasing number of competing beverages. The development of new products by the Company to meet these challenges may lead to reduced sales of the Company’s existing brands and there is no guarantee that these new product initiatives will generate stable long term volume. Additionally, changes in the use of media and technology are changingimpacting the economics of how to market brands are marketed to drinkers and may be diminishing the traditional competitive advantage the Company may have had in buying national media relative to smaller brands. While the Company believes that a combination of innovation, new brand messaging and exploration of new media, and increased investment andin sales execution can lead to increased demand, there is no guarantee that the Company’s actions will be successful in maintaining the Company’s historical levels of profitability. Reduced sales, among other factors, could lead to lower brewery utilization, lower funds available to invest in brand support and reduced profitability, and these challenges may require a different mix and level of marketing investments to stabilize and grow volumes. A lower growth environment or periods of sales declines will present challenges for the Company to motivate and retain employees, and to maintain the current levels of distributor and retailer support of its brands, it’sand fund its current brand investment levels, and current returns to shareholders, and could potentially require a review of long term organization and brewery needs. Currently, the Company believes it can continuemeet its volume targets in 2024 and return to grow in 2021 andvolume growth in future years, but there is no guarantee itits efforts will be successful.successful or profitable.

The Company May Not Be AbleCompany’s inability to Increase Supplyreact to Meetchanges in demand could have a material adverse effect on the Increased Demand for Its Products.Company’s operations or financial results.

SinceDespite the depletion volume declines in 2023 of 6% (5% decline on a 52-week comparable basis), since 2017 demand for the Company’s products has grown significantly and the Company currently estimates depletion growth in 2021 to be between 35% and 45%. These estimated increases would result in 2021its 2023 depletion volume atwas over 2.5two times 2017 volumes. During 2021, the market for hard seltzer products experienced decelerating growth trends which resulted in the annual volume growth rate declining from an increase of 158% in 2020 to 13% in 2021 and then a decrease of 15% in 2022 and 21% in 2023.

The changes in growth trends in the Company’s business, particularly for the Truly Hard Seltzer Brand, as well as added product complexity, heighten the management challenges that the Company faces. In recent years, the Company has had periods of excess capacity that were nevertheless accompanied by product shortages and service issues. As demand for its products has grown,grew from 2017 through the first half of 2021, the Company has faced increasing challenges in meeting that demand. The challenges have beenwere both production constraints, primarily resulting from canning and variety pack capacity limitations, and can supply constraints. During this period, the Company experienced increased inventory obsolescence, operational, and freight costs, as it reacted. In response to these issues, the Company significantly increased its packaging capabilities and tank capacity and added personnel to address these challenges.

With a decline in volume over the second half of 2021 through 2023, the Company then incurred additional supply chain related costs associated with downsizing its production model to adjust to reduced demand. In recent periods, the Company has been able to better match its supply chain to meet demand, but a sudden increase could result in a recurrence of challenges in meeting demand and a sudden decrease could result in other incremental costs. There can be no assurance that the Company will effectively address changing consumer demand or manage increasing product complexity, without experiencing similar issues in the future. Planning failures, operating inefficiencies, insufficient employee training, control

19


deficiencies, or other similar issues could well have a material adverse effect on the Company’s business and financial results. Growth or decline in the Company’s revenues, changes in operating procedures, and increased complexity have required significant capital investment. The Company on an overall basis has also become moreyet to see any operating cost leverage from these investments and there is no guarantee that it will.

The Company remains reliant on third party-owned breweries, particularly City Brewing Company, LLC, to meet demand asand the percentage of its volume produced at Company owned breweries has decreased from over 90% in 2017 to approximately 65%71% in 2020, with a further decrease anticipated2023. The Company currently expects that the percentage of total production at Company owned breweries in 2021.2024 will be over 75%. The Company’sCompany expects its reliance on production at City Brewing Company, LLC to meet demand has growndecline from 23%approximately 22% of the Company’s total production volume in 20192023 to 33%approximately 20% of production in 2020. 2024.

The Company’s ability to grow and continue to meet potentially increasing consumer demand will be affected byby:

its ability to meet production goals and/or targets at the Company’s owned breweries and third party-owned breweries;
its ability to enter into new brewing contracts with third party-owned breweries on commercially acceptable terms;
disruption or other operating performance issues at the Company’s owned breweries or limits on the availability of suitable production capacity at third party-owned breweries;
its ability to obtain sufficient quantities of certain packaging materials and ingredients, such as cans, flavorings, cardboard wraps and glass bottles from suppliers; and
its ability to reduce risk of both over and under supply by improving and automating manual internal processes for demand and production planning.

If the Company were unable to increase supply to meet increased consumer demand for its products, the Company’s business and financial results could well be adversely affected. Alternatively, if there is a sudden decline in demand for the Company’s products, additional costs and inefficiencies could likely result from efforts to adjust the Company’s production model accordingly.

its ability to meet production goals and/or targets at the Company’s owned breweries and third party-owned breweries;

its ability to enter into new brewing contracts with third party-owned breweries on commercially acceptable terms;

disruption or other operating performance issues at the Company’s owned breweries or limits on the availability of suitable production capacity at third party-owned breweries; and

its ability to obtain sufficient quantities of certain packaging materials and ingredients, such as cans, flavorings, cardboard wraps and glass bottles, from suppliers.

The Company’s Advertisingadvertising and Promotional Investments May Affectpromotional investments may affect the Company’s Financial Resultsfinancial results but Not Be Effective.not be effective.

The Company has made and expects to continue to make, significant advertising and promotional expenditures to enhance its existing brands and promote new brands. These expenditures may adversely affect the Company’s results of operations in a particular quarter or even for the full year, and may not result in increased sales. Variations in the levels of advertising and promotional expenditures have in the past caused, and are expected in the future to continue to cause, variability in the Company’s quarterly results of


operations. While the Company attempts to invest only in effective advertising and promotional activities, it is difficult to correlate such investments with sales results, and there is no guarantee that the Company’s expenditures will be effective in building brand equity or growing long term sales.

The Company is Dependentdependent on Key Packaging Supplierskey packaging suppliers and an Increaseincrease in Packaging Costs Could Harmpackaging costs could harm the Company’s Financial Resultsfinancial results.

The demand for packaging materials in the beverage industry has significantly increased and during 2020 and 2021 there has beenwas a shortage of capacity, as manufacturers attempt to adjustadjusted their supply chains to keep up with the increased demand, which has further increased due tocaused by the COVID-19 pandemic. Truly Hard Seltzer brand beverages are primarily packaged in sleek cans and Twisted Tea brand beverages are primarily packaged in standard cans. In 2020 and 2021, as the Truly brand family and the Twisted brand families have growngrew significantly and overall demand for cans increased, the Company has experienced supply constraints for cans. In the fourth quarter of 2020, the Company experienced some can, cardboard wrap and glass shortages thatThese supply constraints impacted the Company’s production schedules.  The Company is working closely with its suppliersschedules and increased can cost by having to ensure there are no further supply disruptionsuse a more expensive supplier. These pressures were reduced during 2022 and 2023 and the Company has adequatecurrently believes it will have a sufficient supply of packaging materials.  In addition, the Company is working to increase packaging capacity to accommodate its expected needsmaterials for 2021 and currently expects to have sufficient supply and capacity to meet those needs.2024.

The Company maintains competitive sources for the supply of packaging materials, such as cans, glass, cardboard wraps and shipping cases. The Company enters into limited-term supply agreements with certain vendors in order to receive preferential pricing. In 2020,2023, certain flavorings, crowns, and labels were each supplied by single sources. Although the Company believes that alternative suppliers are available, the loss of any of the Company’s packaging materials suppliers could, in the short-term, adversely affect the Company’s results of operations, cash flows and financial position until alternative supply arrangements were secured. Additionally, there has been acquisition, change in control and consolidation activity in several of the packaging supplier networks which could potentially lead to further disruption in supply and changes in economics. If packaging costs continue to increase, there is no guarantee that such costs can be fully passed along through increased prices.

20


The Company has entered into long-term supply agreements for certain packaging materials that have shielded it from some cost increases. These contracts have varying lengths and terms and there is no guarantee that the economics of these contracts can be replicated when renewed. The Company’s inability to preserve the current economics on renewal could expose the Company to significant cost increases in future years. Some of these contracts require the Company to make commitments on minimum volume of purchases based on Company forecasts. If the Company's needs differdecline significantly from its forecasts, the Company would likely incur storage costs for excess production or contractual penalties that might be significant to Companyand could have a material adverse impact on the Company's financial results.

ImpactThe Company is dependent on key ingredient suppliers, including foreign sources; its dependence on foreign sources creates foreign currency exposure for the Company; the Company’s use of Reliancenatural ingredients creates weather and crop reliability and excess/shortage inventory exposure for the Company.

The Company purchases a substantial portion of the ingredients used in its beverages, including its flavorings, fruit juice, malt, hops, apples, and other ingredients, from a limited number of domestic and foreign suppliers. The Company has historically not experienced material difficulties in obtaining timely delivery from its ingredient suppliers and currently believes that it will have sufficient supply of ingredients in 2024. The Company believes that there are alternative sources available for some of the ingredients, but there can be no assurance that the Company would be able to acquire such ingredients from substitute sources on Company-Owned Production Facilities, Reduced Availability of Breweries Owned by Others, and Inability to Leverage Investmenta timely or cost-effective basis, if current suppliers could not adequately fulfill orders. The loss or significant reduction in the Company-Owned Breweries Could Havecapability of a Material Adverse Effectsupplier to support the Company’s requirements could, in the short-term, adversely affect the Company’s business and financial results, until alternative supply arrangements were secured.

The Company’s beverages include many unique and proprietary flavors and combinations of flavors and some of these flavorings are single sourced. Truly Hard Seltzer and Twisted Tea brand beverages are particularly reliant on the use of flavorings and variety of flavors as part of their appeal to drinkers.

The Company purchased most of the malt used in the production of its beer from four suppliers during 2023. Nevertheless, the Company believes that there are other malt vendors available that are capable of supplying part of its needs. The Company is exposed to the quality of the barley crop each year, and significant failure of a crop would adversely affect the Company’s costs.

The Company uses Noble hop varieties from Europe for many of its Samuel Adams beers and also uses hops grown in other areas of Europe, the United States, and New Zealand. Noble hops are grown in several specific areas in Germany and the Czech Republic that are recognized for growing hops with superior taste and aroma properties. The Company stores its hops in multiple cold storage warehouses to minimize the impact of a catastrophe at a single site. The performance and availability of the hops, as with any agricultural product, may be materially adversely affected by factors such as adverse weather or pests and there is no guarantee the contracts will be fulfilled completely. The Company has purchase commitments with seven primary hop dealers and attempts to maintain a one to two-year supply of essential hop varieties on-hand in order to limit the risk of an unexpected reduction in supply and procures hops needed for new beers, based on its best estimate of likely short-term demand. The failure of management’s assumptions regarding future sales growth, product mix and hops market conditions to prove accurate could result in future material losses.

The Company uses special varieties of apples in its ciders that it believes are important for the ciders’ flavor profile. These apples are sourced primarily from European and United States suppliers and include bittersweet apples from France and culinary apples from Italy and Washington state. There is limited availability of these apples and many outside factors, including weather conditions, farmers rotating from apples to other crops, government regulations and legislation affecting agriculture, could affect both price and supply.

The Company’s new product development can also be constrained by any limited availability of the desired ingredients. Growth rates higher than planned or the introduction of new products requiring special ingredients could create demand for ingredients greater than the Company can source.

The Company’s contracts for certain hops and apples are payable in Euros, Pounds Sterling and New Zealand dollars, and therefore, the Company is subject to the risk that the Euro, Pound or New Zealand dollar may fluctuate adversely against the U.S. dollar. The Company has, as a practice, not hedged this exposure, although this practice is regularly reviewed. The cost of hops has increased in recent years due to the rising market price of hops and exchange rate changes. The continuation of these trends will impact the Company’s product cost and potentially the Company’s ability to meet the demand for its beers. The Company buys some other ingredients and capital equipment from foreign suppliers for which the Company also carries

21


exposure to foreign exchange rate changes. Significant adverse fluctuations in foreign currency exchange rates may have a material adverse effect on the Company’s Operationsbusiness and financial results.

The Company’s reliance on breweries owned by others and an inability to leverage investment in the Company-owned breweries could have a material adverse effect on the Company’s operations or Financial Results.financial results.

During 2020,2023, the Company brewed, fermented and packagedproduced approximately 65%71% of its volume at breweries owned by the Company.  ThisCompany and, as noted above, anticipates producing 75% of its volume at breweries owned by the Company in 2024. While, on balance, the Company views greater reliance on its own breweries favorably, this reliance on its own breweries exposes the Company to capacity constraints and risk of disruption of supply, as these breweries are operating at or close to current capacity in peak months. Management believes that it has alternatives available to it, in the event that production at any of its brewing locations is temporarily interrupted, although as volumes at the Pennsylvania Brewery increase, severe interruptions there would be problematic, particularly during peak seasons. In addition, if interruptions were to occur, the Company might not be able to maintain its current economics and could face significant delays in starting replacement brewing locations. Potential interruptions at breweries include labor issues, governmental action, quality issues, contractual disputes, machinery failures, operational shutdowns, pandemic-related or other staffing shortages, or natural or unavoidable catastrophes.

The growth in the Company’s business and product complexity heighten the management challenges thatIf interruptions were to occur, the Company faces. In recent years, the Company has had product shortagescould face significant delays in starting replacement brewing locations and service issues.  The Company’s supply chain struggled under the increased volume and experienced increased operational and freight, costs as it reacted.  In response to these issues, the Company has significantly increased its packaging capabilities and tank capacity and added personnel to address these challenges.  There canoperating results could be no assurance that the Company will effectively manage such increasing complexity without experiencing future planning failures, operating inefficiencies, insufficient employee training, control deficiencies or other issues that could have a material adverse effect on the Company’s business and financial results. The growth of the Company, changes in operating procedures and increased complexity have required significant capital investment. In the future, the Company on an overall basis may not see operating cost leverage from these investments and there is no guarantee that it will.materially adversely affected.


The Company continues to avail itself of capacity at third-party breweries. During 2020,production facilities. Also as noted above, during 2023, approximately 33%22% of the Company’s annual shipment volume was brewed and/or packaged under service agreements with City Brewing Company, LLC. In selecting third party breweries for brewing services arrangements, the Company carefully weighs a brewery’s sleek can packaging and automated variety packaging capability and capacity, its quality control capabilities throughout the production process and its ability to utilize traditional brewing, fermenting and finishing methods. To the extent that the Company needs to avail itself of a third-party brewingproduction services arrangement, it exposes itself to higher than planned costs of operating under such contract arrangements than would apply at the Company-owned breweries, potential lower service levels and reliability than internal production, and potential unexpected declines in the brewing capacity available to it, any of which could have a material adverse effect on the Company’s business and financial results. The use of such third party facilities also creates higher logistical costs and uncertainty in the ability to deliver product to the Company’s customers efficiently and on time.

As the beer industry continues to consolidate and the Company has grown, the capacity and willingness of breweries owned by others where the Company could brew, ferment or package some of its products, if necessary, has become a more significant concern and, thus, there is no guarantee that the Company’s needs will be uniformly met. The Company continues to work at its Company-owned breweries and with its third-party brewersproduction partners to attempt to minimize any potential disruptions. Nevertheless, should an interruption occur, the Company could experience temporary shortfalls in production and/or increased production and/or distribution costs and be required to make significant capital investments to secure alternative capacity for certain brands and packages, the combination of which could have a material adverse effect on the Company’s business and financial results. A production interruption caused by an acquisition or change of control of City Brewing or a simultaneous interruption at several of the Company’s other production locations would likely cause significant disruption, increased costs and, potentially, lost sales.

The Company’s emphasis on owning production facilities requires it to continue to make a significant level of capital expenditure to maintain and improve these facilities and to incur significant fixed operating costs to support them. In an uncertain volume environment, the Company faces the risk of not being able to support the owned brewery operating costs, if volumes were to decline. At the same time, despite making these expenditures and incurring these costs, if demand were to further increase above current volume estimates, the Company could still face the risk of not being able to meet the increased demand.

The Company attempts to mitigate production and distribution risks through a combination of owned breweries and access to third-party contract facilities, but there is no guarantee that this strategy is optimal,will be successful, and it might result in short term costs and inefficiencies.inefficiencies which could adversely impact our business and financial results.

Turnover in Company Leadershipleadership or Other Key Positions May Leadother key positions may lead to Lossloss of Key Knowledgekey knowledge or Capabilitycapability and Adversely Impactadversely impact Company Performance.performance.

The Company has an experienced leadership team with an established track record of business success and innovation in the beverage and consumer goods industries.  Dave Burwick joined as President and Chief Executive Officer in 2018.  Prior to commencing that role, Mr. Burwick had served on Boston Beer’s Board of Directors since 2005.  His most recent role was Chief Executive Officer of Peet’s Coffee and prior to joining Peet’s, Mr. Burwick served as President of North America for Weight Watchers and in numerous leadership roles over 20 years at PepsiCo, including Chief Marketing Officer of Pepsi-Cola North America.  

The Company may wellhas and is likely to experience changes in key leadership or key positions in the future.regularly. The departure of key leadership personnel especially a Chief Executive Officer, can take from the Company significant knowledge and experience. This loss of knowledge and

22


experience can be mitigated through successful succession planning or external hiring and transition, but there can be no assurance that the Company will be successful in such efforts. Attracting, retaining, integrating and developing high performance individuals in key roles is a core component of the Company’s strategy for addressing its business opportunities. Attracting and retaining qualified senior leadership may be more challenging under adverse business conditions, such as the current declining growth environment that faced the Company in prior years.is facing. Failure to attract and retain the right talent, or to manage the transition of responsibilities resulting from such turnover smoothly, would affect the Company's ability to meet its challenges and may cause the Company to miss performance objectives or financial targets.

The Company has Significantly Increasedsignificantly increased its Product Offeringsproduct offerings and Distribution Footprint,distribution footprint, which Increases Complexityincreases complexity and Could Adversely Affectcould adversely affect the Company’s Performanceperformance and Financial Results.financial results.

The Company has significantly increased the number of commercially available flavored malt beverages, hard seltzers, beers, and hard ciders, and spirits RTDs that it produces. In the last five years, the Company has developed, introduced and reformulated many new hard seltzers, beers, and hard cidersexisting beverage styles under the Twisted Tea, Truly Hard Seltzer, Twisted Tea, Samuel Adams and Angry Orchard brands. InThe Dogfish Head brand, acquired in July 2019, the addition of the Dogfish Head brand


addedcurrently has over 25 styles of beer, 15 styles of distilled spirits, 7 spirits RTDs, two brewery tap rooms, a restaurant, and a boutique Inn.  inn. In January 2020, the Company opened the Samuel Adams Tap Room and small brewery in downtown Boston. The Company currently operates 108 retail locations, including eightseven brewery tap rooms, a cidery tasting room and a restaurant, where its beers, hard seltzers, hard ciders and distilled spiritsbeverages are sold and consumed on-premise. The Company’s most significant innovations in 2023 were the launches of new styles of its Truly Vodka Soda brand and its launch in limited markets of Truly Tequila Soda and Slingers, a new flavored malt beverage brand. In the first quarter of 2024, the Company is planning to launch Truly Tequila Soda nationally and expand Slingers to more markets. Also, during 2024, the Company has plans to add new beverage styles and reformulate existing styles of beverages. During the first quarter of 2024, the Company is launching two new brands in limited markets. These two new brands are Sun Cruiser, a new vodka based hard tea brand and General Admission, a new non-alcoholic beer brand.

These additional brands, styles, reformulations and locations, along with the increases in demand for certain existing brands, have added to the complexity of the Company’s product development process, as well as its brewing, fermenting, distilling, packaging, marketing and selling processes, and retail operations. There can be no assurance that the Company will effectively manage such increased complexity, without experiencing coordination issues, operating inefficiencies, supply shortages or control deficiencies. Such inefficiencies or deficiencies could have a material adverse effect on the Company’s business and financial results.

The Company’s Acquisition of Dogfish Head Involves a Number of Risks, the Occurrence of Which Could Adversely Affect Its Business, Financial Condition, and Operating Results.

On July 3, 2019, the Company completed its acquisition of Dogfish Head Brewery and various related operations, through the acquisition of all of the equity interests held by certain private entities in Off-Centered Way LLC, the parent holding company of the Dogfish Head Brewery operations. This transaction continues to involve certain risks, the occurrence of which could materially and adversely affect the Company’s business, liquidity, financial condition, and operating results, including:

potential loss of key Dogfish Head employees, suppliers, distributors and drinkers or other adverse effects on existing business relationships with suppliers, distributors and drinkers;

potential inability to fully integrate Dogfish Head’s Distributors into the Company’s existing wholesaler network

adverse impact on overall profitability, if the Company’s expanded operations do not achieve the growth prospects, net revenues, earnings, cost or revenue synergies, or other financial results projected in the Company’s valuation models, or delays in the realization thereof;

inaccurate assessment of undisclosed, contingent or other liabilities of the acquired operations, unanticipated costs associated with the transaction; and

the potential future write-off of significant amounts of goodwill, intangible assets and/or other tangible assets if the Dogfish Head business does not perform in the future as expected, or other potential financial accounting or reporting impacts

The Company cannot assure that it will realize the expected benefits of the Dogfish Head transaction. The Company’s failure to adequately manage the risks associated with the transaction could have a material adverse effect on its business, liquidity, financial condition or results of operations.

Changes in Drinker Attitudesdrinker attitudes on Brand Equitybrand equity and Reliancereliance on the Company’s Foundersfounders in the Samuel Adams and Dogfish Head Brand Communications May Adversely Affect Demandbrand communications may adversely affect demand for the Company’s Productionproduction and Resultsresults of Operations.operations.

The success of ourthe Company's brands depends upon the positive image that drinkers have of those brands and maintaining a good reputation is critical to selling our branded products. Our reputation could be impacted negatively by public perception, adverse publicity, negative comments in social media, or our responses to negative publicity or comments.comments, either by members of the Company or those who may be affiliated with it. There is also no guarantee that the brand equities that the Company has built in its brands will continue to appeal to drinkers. Changes in drinker attitudes or demands, or competitor activity and promotion, could adversely affect the strength of the Company’s brands and the revenue that is generated from that strength. It is possible that the Company could react to such changes and reposition its brands, but there is no certainty that the Company would be able to maintain volumes, pricing power and profitability. It is also possible that marketing messages or other actions taken by the Company could damage its brand equities, as opposed to building them. If such damage were to occur, it would likely have a negative effect on the financial condition of the Company.

In addition to these inherent brand risks, C. James Koch, the founder and Chairman of the Company, as well as the founders of Dogfish Head brand, Samuel Calagione, Founder and Brewer, Dogfish Head Brewery and Mariah Calagione, Founder and Communitarian, Dogfish Head Brewery, are an integral part of the Company’s history, brand equity and current and potential future brand messaging and the Company relies on the positive public perception of these founders. The role of these founders as founders, brewers and leaders of the Company is emphasized as part of the Company’s brand communication and has appeal to some drinkers. If these founders were not available to the Company to continue their active roles, their absence could


negatively affect the strength of the Company’s messaging and, accordingly, the Company’s growth prospects. The Company and its brands may also be impacted if drinkers’ perceptions of these founders, including their social or political views, were to change negatively. If any negative changes were to occur, the Company might need to adapt its strategy for communicating its key messages regarding its history, equity, and current and potential future brand messaging. Any such change in the Company’s messaging strategy might have a detrimental impact on the future growth of the Company.

The Company is Dependent on Key Ingredient Suppliers, Including Foreign Sources; Its Dependence on Foreign Sources Creates Foreign Currency Exposure for the Company; 23


The Company’s Use of Natural Ingredients Creates Weather and Crop Reliability and Excess/Shortage Inventory Exposure for the Company.

The Company purchases a substantial portion of the ingredients used in its hard seltzers, beers and hard ciders, including its flavorings, malt, hops, apples and other ingredients, from a limited number of foreign and domestic suppliers. The Company has historically not experienced material difficulties in obtaining timely delivery from its ingredient suppliers and currently believesoperations are subject to certain operating hazards that it will have sufficient supply of ingredients in 2021.  The Company believes that there are alternative sources available for some of the ingredients, but there can be no assurance that the Company would be able to acquire such ingredients from substitute sources on a timely or cost-effective basis, in the event that current suppliers could not adequately fulfill orders. The loss or significant reduction in the capability of a supplier to support the Company’s requirements could, in the short-term, adversely affect the Company’s business and financial results, until alternative supply arrangements were secured.

The Companies hard seltzers, beers and hard ciders include many unique and proprietary flavors and combinations of flavors and some of these flavorings are single sourced.  Truly Hard Seltzer and Twisted Tea brand beverages are particularly reliant on the use of flavorings and variety of flavors as part of their appeal to drinkers.  

The Company purchased most of the malt used in the production of its beer from four suppliers during 2020. Nevertheless, the Company believes that there are other malt vendors available that are capable of supplying part of its needs. The Company is exposed to the quality of the barley crop each year, and significant failure of a crop would adversely affect the Company’s costs.

The Company uses Noble hop varieties from Europe for many of its Samuel Adams beers and also uses hops grown in the other areas of Europe, and in the United States, England and New Zealand. Noble hops are grown in several specific areas in Germany and the Czech Republic and are recognized for growing hops with superior taste and aroma properties. The Company stores its hops in multiple cold storage warehouses to minimize the impact of a catastrophe at a single site. The performance and availability of the hops, as with any agricultural product, may be materially adversely affected by factors such as adverse weather or pests and there is no guarantee the contracts will be fulfilled completely. The Company enters into purchase commitments with nine primary hop dealers and attempts to maintain a one to two-year supply of essential hop varieties on-hand in order to limit the risk of an unexpected reduction in supply and procures hops needed for new beers, based on its best estimate of likely short-term demand.  Variations in management’s assumptions regarding future sales growth, product mix and hops market conditions could result in future material losses.

The Company uses special varieties of apples in its cidersunexpected costs or product recalls that it believes are important for the ciders’ flavor profile. These apples are sourced primarily from European and United States suppliers and include bittersweet apples from France and culinary apples from Italy and Washington state. There is limited availability of these apples and many outside factors, including weather conditions, farmers rotating from apples to other crops, government regulations and legislation affecting agriculture, could affect both price and supply.

The Company’s new product development can also be constrained by any limited availability of certain ingredients. Growth rates higher than planned or the introduction of new products requiring special ingredients could create demand for ingredients greater than the Company can source.

The Company’s contracts for certain hops and apples are payable in Euros, Pounds Sterling and New Zealand dollars, and therefore, the Company is subject to the risk that the Euro, Pound or New Zealand dollar may fluctuate adversely against the U.S. dollar. The Company has, as a practice, not hedged this exposure, although this practice is regularly reviewed. Significant adverse fluctuations in foreign currency exchange rates may have a material adverse effect onharm the Company’s business and financial results. The cost of hops has increased in recent years due to the rising market price of hops and exchange rate changes. The continuation of these trends will impact the Company’s product cost and potentially the Company’s ability to meet the demand for its beers. The Company buys some other ingredients and capital equipment from foreign suppliers for which the Company also carries exposure to foreign exchange rate changes.


The Company’s Operations are Subject to Certain Operating Hazards Which Could Result in Unexpected Costs or Product Recalls That Could Harm the Company’s Business.business.

The Company’s operations are subject to certain hazards and liability risks faced by all brewers,beverage companies, such as potential contamination of ingredients or products by bacteria or other external agents that may be wrongfully or accidentally introduced into products or packaging, or defective packaging and handling. Such occurrences may create bad tasting hard seltzer, beer or hard ciders,beverages, or pose health risk to the consumer or risk to the integrity and safety of the packaging. These could result in unexpected costs to the Company and, in the case of a costly product recall, potentially serious damage to the Company’s reputation for product quality, as well as product liability claims.

The Company Relies Upon Complex Information Systemsrelies upon complex information systems and Vulnerabilitiesvulnerabilities or Disruptionsdisruptions of These Systems Could Expose Usthese systems could expose us to Liabilityliability and Harm Our Businessharm our business and Operations.operations.

The Company depends on information technology to be able to operate efficiently and interface with customers and suppliers, as well as maintain financial and accounting reporting accuracy to ensure compliance with all applicable laws. If the Company does not allocate and effectively manage the resources necessary to build and sustain the proper technology infrastructure, the Company could be subject to transaction errors, processing inefficiencies, the loss of customers, business disruptions, or the loss of or damage to intellectual property through security breach.breaches. The Company recognizes that many groups on a world-wide basis have experienced increases in security breaches, cyber-attacks, and other hacking activities such as denial of service, malware and ransomware. The Company has dedicated internal and external resources to review and address such threats. However, as with all large information technology systems, the Company’s systems could be penetrated by outside parties intent on extracting confidential or proprietary information, corrupting information, disrupting business processes, or engaging in the unauthorized use of strategic information. Such unauthorized access could disrupt business operations and could result in the loss of assets or revenues, remediation costs or damage to the Company’s reputation, as well as litigation against the Company by third parties adversely affected by the unauthorized access. Such events could have a material adverse effect on the Company’s business and financial results. The Company also relies on third parties for supply of software, software and data hosting and telecommunications and networking, and is reliant on those third parties for the quality and integrity of these complex services. Failure by a third partythird-party supplier could have material adverse effects on the Company’s ability to operate.

An Increaseincrease in Energy Costs Could Harmenergy costs could harm the Company’s Financial Results.financial results.

In the last five years, the Company has experienced significant variation in direct and indirect energy costs, and energy costs could change unpredictably. Increased energy costs would result in higher transportation, freight and other operating costs, including increases in the cost of ingredients and supplies. The Company’s future operating expenses and margins could be dependent on its ability to manage the impact of such cost increases. If energy costs increase, there is no guarantee that such costs can be fully passed along through increased prices.

The Class B Shareholder Has Significant Controlshareholder has significant control over the CompanyCompany.

The Company’s Class A Common Stock is not entitled to any voting rights except for the right as a class to (1) approve certain mergers, charter amendments and by-law amendments and (2) elect a minority of the directors of the Company. Although not as a matter of right, the Class A stockholders have also been afforded the opportunity to vote on an advisory basis on executive compensation. Consequently, the election of a majority of the Company’s directors and all other matters requiring stockholder approval are currently decided by C. James Koch, who is the founder and Chairman of the Company, as the holder of 100% of the voting rights to the outstanding shares of the Company’s Class B Common Stock. As a result, Mr. Koch is able to exercise substantial influence over all matters requiring stockholder approval, including the composition of the board of directors, approval of equity-based and other executive compensation and other significant corporate and governance matters, such as approval of the Company’s independent registered public accounting firm. This could have the effect of delaying or preventing a change in control of the Company and makes most material transactions difficult or impossible to accomplish without the support of Mr. Koch. While Mr. Koch is currently the 100% holder of the Company’s Class B Common Stock, there is nothing that prevents Mr. Koch or his heirs from transferring some or all shares of the Class B Common Stock to others.

The Company’s acquisition of Dogfish Head included intangible assets that are marked to fair value on an annual basis, which have resulted and could in the future further result in impairment charges that have an adverse impact on the Company’s operating results.


24


On July 3, 2019, the Company completed its acquisition of Dogfish Head Brewery and various related operations, through the acquisition of all of the equity interests held by certain private entities in Off-Centered Way LLC, the parent holding company of the Dogfish Head Brewery operations. During 2022 and 2023, the Company recorded $27.1 million and $15.8 million, respectively, in non-cash impairment charges for the Dogfish Head brand, as a result of the Company’s annual impairment analysis. The impairment determination was primarily based on the latest forecasts of brand performance which have been below the Company’s projections made on the acquisition date. As of December 30, 2023, the Dogfish Head brand intangible asset was valued at $55.6 million on the Company’s statement of financial position. The Company cannot assure that there will not be further non-cash impairment charges recognized on the Company’s Dogfish Head brand intangible assets that would have a material adverse effect on the Company’s results of operations.

Risks Related to Law and Regulations

Changes in Tax, Environmentaltax, environmental and Other Regulations, Government Shutdownsother regulations, government shutdowns or Failurefailure to Complycomply with Existing Licensing, Tradeexisting licensing, trade or Other Regulations Could Haveother regulations could have a Material Adverse Effectmaterial adverse effect on the Company’s Financial Condition.financial condition.

The Company’s business is highly regulated by federal, state and local laws and regulations regarding such matters as licensing requirements, trade and pricing practices, labeling, advertising, promotion and marketing practices, relationships with Distributors, environmental impact of operations and other matters. These laws and regulations are subject to frequent reevaluation, varying interpretations and political debate, and inquiries from governmental regulators charged with their enforcement. In addition, any delays in federal or state government required approvals caused by federal or state government shutdowns, similar to the January 2019 federal government shutdown, could prevent new brands or innovations from getting to market on time or at all. Failure to comply with existing laws and regulations to which the Company’s operations are subject or any revisions to such laws and regulations or the failure to pay taxes or other fees imposed on the Company’s operations and results could result in the loss, revocation or suspension of the Company’s licenses, permits or approvals, and could have a material adverse effect on the Company’s business, financial condition and results of operations. Changes in federal and other tax rates could have a significant effect on the Company’s financial results.

There Is No Guaranteeis no guarantee that the Company Will Not Face Litigationwill not face litigation that Could Harmcould harm the Company’s Business.business.

While the Company has from time to time in the past been involved in material litigation, it is not currently a party to any pending or threatened litigation, the outcome of which would be expected to have a material adverse effect on itsthe Company’s financial condition or the results of its operations. In general, while the Company believes it conducts its business appropriately in accordance with laws, regulations and industry guidelines, claims, whether or not meritorious, could be asserted against the Company that might adversely impact the Company’s results. See Item 3 - Legal Proceedings below below..

Risks Related to General Economic Conditions

The Company’s Operating Resultsoperating results and Cash Flow May Be Adversely Affectedcash flow may be adversely affected by Unfavorable Economic, Financialunfavorable economic, financial and Societal Market Conditions.societal market conditions.

Volatility, uncertainty, and uncertaintyinflation in the financial markets and economic conditions generally may directly or indirectly affect the Company’s performance and operating results in a variety of ways, including: (a) prices for energy, labor, packaging, ingredients, and agricultural products may rise faster than current estimates, including increases resulting from currency fluctuations; (b) the Company’s key suppliers may not be able to fund their capital requirements, resulting in disruption in the supplies of the Company’s raw and packaging materials; (c) the credit risks of the Company’s Distributors may increase; (d) the impact of currency fluctuations on amounts owed to the Company by distributors that pay in foreign currencies; (e) the Company’s credit facility, or portion thereof, may become unavailable at a time when needed by the Company to meet critical needs; (f) overall beer consumption may decline; or (g) drinkers of the Company’s products may change their purchase preferences and frequency, which might result in sales declines.

Item 1B. Unresolved Staff Comments

Item 1B.

Unresolved Staff Comments

The Company has not received any written comments from the staff of the Securities and Exchange Commission (the “SEC”) regarding the Company’s periodic or current reports that (1) the Company believes are material, (2) were issued not less than 180 days before the end of the Company’s 20202023 fiscal year, and (3) remain unresolved.

Item 1C. Cybersecurity

25


The Company faces motivated and persistent cybersecurity threats from a variety of adversaries on a daily basis. As a manufacturing company dispersed across multiple states supported by a global supply chain, the Company recognizes the critical importance of maintaining the safety and security of its networks and systems, as well as ensuring the confidentiality, integrity, and availability of its data. The Company employs a holistic process for overseeing and managing cybersecurity and information security risks which is supported by both management and its Board of Directors.

As described in more detail below, the Company has established policies, standards, processes and practices for assessing, identifying, and managing material risks from cybersecurity threats. The Company has devoted significant financial and personnel resources to implement and maintain security measures to meet regulatory requirements and customer expectations and intends to continue to make significant investments to maintain the security of its data and cybersecurity infrastructure.

The Company's cybersecurity program is led by its Chief Information Security Officer (CISO), who reports to its Chief Information Officer (CIO). The CISO is responsible for management of cybersecurity risk and the protection and defense of the Company's networks and systems. The CISO manages a team of cybersecurity professionals with broad experience and expertise, including in incident response, forensics, threat intelligence, vulnerability management, and mitigation. The Company's cybersecurity team has processes in place to assess, identify, manage, and address material cybersecurity threats and incidents. These include, among other things: annual and ongoing security awareness training for employees, mechanisms to detect and monitor unusual network and endpoint activity, integrated threat intelligence, and containment and incident response tools. The cybersecurity team also leverages multiple third-party security programs for full-time monitoring of security stacks and on-demand support to act as force multipliers in the event of severe or critical security events.

The Company's Board of Directors has ultimate oversight of cybersecurity risk and aids in making decisions with respect to company priorities, resource allocations, and oversight structures. The Board of Directors is assisted by the Audit Committee, which regularly reviews the cybersecurity program with management and reports to the Board of Directors. Cybersecurity reviews by the Audit Committee or the Board of Directors generally occur at least once annually, or more frequently as determined to be necessary or advisable.

The Company's approach to cybersecurity risk management includes the following key elements:

Multi-Layered Defense and Continuous Monitoring. The Company works to protect its computing environments and products from cybersecurity threats through multi-layered defenses and apply lessons learned from its defense and monitoring efforts to proactively prevent future attacks. The Company utilizes best-in-class SIEM technologies, data analytics and threat intelligence to detect anomalies and search for cyber threats. The Company's internal cybersecurity team and third-party security services provide comprehensive cyber threat detection and response capabilities and maintain a full-time monitoring system which complements the technology, processes and threat detection techniques we use to monitor, manage and mitigate cybersecurity threats. From time to time, the Company engages third-party consultants or other advisors to assist in assessing, identifying and/or managing cybersecurity threats and also periodically uses its Internal Audit function to conduct additional reviews and assessments.
Third-Party Risk Assessments. The Company conducts information security assessments before sharing or allowing the hosting of sensitive data in computing environments managed by third parties, and its standard terms and conditions contain contractual provisions requiring certain security protections.
Training and Awareness. The Company conducts monthly attack simulations across the Company and provide awareness training to our coworkers to help identify, avoid and mitigate cybersecurity threats. Employees with network access participate annually in required training, including spear phishing, malware, access control, and other awareness training. The Company also periodically hosts tabletop exercises with management and other employees to practice rapid cyber incident response;
Supplier Engagement. The Company requires its suppliers to comply with its standard information security terms and conditions as a condition of doing business, and requires them to complete information security questionnaires to review and assess any potential cyber-related risks depending on the nature of the services being provided. The Company also monitors supplier network access to its networks and systems.

While the Company has experienced minor cybersecurity incidents in the past, to date none have materially affected the Company or its financial position, results of operations and/or cash flows. The Company continues to invest in the cybersecurity and resiliency of its networks and to enhance its internal controls and processes, which are designed to help protect its systems, infrastructure, and the information they contain.

Item 2. Properties

26


Item 2.

Properties

The Company maintains its principal corporate offices in approximately 54,200 square feet of leased space located in Boston, Massachusetts, the term of which is set to expire in 2031.

The Company owns approximately 76 acres of land in Breinigsville, Pennsylvania, consisting of the two parcels on which the Company’s Pennsylvania Brewery is located. The buildings on this property consist of approximately 1 million square feet of brewery and warehouse space.

The Company owns approximately 57 acres of land in Milton, Delaware, consisting of the two parcels on which the Company’s Milton Brewery is located. The buildings on this property consist of approximately 240,000 square feet of brewery and warehouse space.


The Company owns approximately 10 acres of land in Cincinnati, Ohio, on which the Company’s Cincinnati Brewery is located, and leases, with an option to purchase, approximately 1 acre of land from the City of Cincinnati which abuts its property. The buildings on this property consist of approximately 128,500 square feet of brewery and warehouse space.

The Company owns approximately 62 acres of land in Walden, New York, consisting of an apple orchard and certain buildings, including a small cidery, gift shop, and tour center. The small cidery, gift shop, and tour center on this property consist of approximately 15,000 square feet of space.

The Company owns approximately 1 acre of land in Lewes, Delaware, on which the Company’s Dogfish Head Inn is located. The buildings on this property consists of approximately 8,400 square feet of space.

The Company leases approximately 43,000 square feet of space in Boston, Massachusetts, on which it maintains a Samuel Adams brand tap room and tour center. The current term of the lease for this facility will expire in 2034, although it has an option to extend the term for an additional fifteen years in five-year increments.

The Company leases approximately 6,666 square feet of space in Boston, Massachusetts, on which it maintains a research and development site. The current term of the lease for this facility will expire in 2026, although it has an option to extend the term for an additional three years in one-year increments.

The Company leases approximately 48,650 square feet of space in Los Angeles, California, on which it maintains an Angel City and Truly brand tap room, small brewery, and tour center. The current term of the lease for this facility will expire in 2021.2026.

The Company leases approximately 11,365 square feet of space in Miami, Florida, on which it maintains a tap room, small brewery and tour center. The current term of the lease for this facility will expire in 2023.

The Company leases approximately 9,000 square feet of space in Boston, Massachusetts, on which it maintains a Samuel Adams brand tap room and small brewery. The current term of the lease for this facility will expire in 2028, although it has two options to extend the term for an additional 5 years.

The Company leases approximately 8,900 square feet of space in Cincinnati, Ohio, on which it maintains a Samuel Adams brand tap room and small brewery. The current term of the lease for this facility will expire in 2028.

The Company leases approximately 7,100 square feet of space within the retail section of MCU Park in Brooklyn, New York on which it maintainspreviously maintained a Coney Island brand tap room and small brewery. The current term of the lease for this facility will expire in 2025.

The Company leases approximately 4,490 square feet of space in Rehoboth, DE, on which it maintains Dogfish Head Brewings and Eats, a tap room, small brewery, and the Chesapeake & Maine restaurant. The current term of the lease for this facility will expire in 2029.

The Company, under a development agreement, has access to approximately 900 square feet of space in Windsor, Ontario, on which it maintains a cannabis research and development facility. The current term of the agreement for this facility will expire in 2026.

The Company also leases small offices in Burlington, Vermont, Cincinnati, Vermont andOhio, Montreal, Quebec, and Toronto, Ontario as well as various warehousing facilities across the United States and Canada.

The Company believes that its facilities are adequate for its current needs and that suitable additional space will be available on commercially acceptable terms as required.

27


Item 3.

The Company is currently not a party to any pendinglegal proceedings and claims, including class action claims, where significant damages are asserted against it. Given the inherent uncertainty of litigation, it is possible that the Company could incur liabilities as a consequence of these claims, which may or threatened litigation, the outcome of which would be expected tomay not have a material adverse effect on itsthe Company’s financial condition or the results of its operations. The Company accrues loss contingencies if, in the opinion of management and its legal counsel, the risk of loss is probable and able to be estimated. Material pending legal proceedings are discussed below.

Securities Litigation. On September 14, 2021, a purported class action lawsuit was filed by an individual shareholder in the United States District Court for the Southern District of New York against the Company and three of its officers. The complaint alleged claims under Sections 10(b) and 20(a) of the Securities Exchange Act of 1934 between April 22, 2021 and September 8, 2021. The plaintiff claimed that defendants made materially false and/or misleading statements or failed to disclose material adverse facts about the Company’s business, operations, and prospects. On October 8, 2021, a nearly identical complaint was filed against the Company by an individual shareholder in the United States District Court for the Southern District of New York. The Court consolidated the two actions and on December 14, 2021 appointed a lead plaintiff, who filed an amended complaint on January 13, 2022. The Company’s Motion to Dismiss the Amended Complaint was granted by the Court on December 5, 2022. The plaintiff filed a notice of appeal on January 5, 2023. After briefing and oral argument on the appeal, the United States Court of Appeals for the Second Circuit affirmed the dismissal on November 22, 2023. The Mandate of the United States Court of Appeals was issued and transmitted to the District Court on December 15, 2023.

Supplier Dispute. On December 31, 2022, Ardagh Metal Packaging USA Corp. (“Ardagh”) filed an action against the Company alleging, among other things, that the Company had failed to purchase contractual minimum volumes of certain aluminum beverage can containers in 2021 and 2022. The Company denies that it breached the terms of the parties’ contract and intends to defend against the Ardagh claims vigorously. On February 23, 2023 and April 4, 2023, Ardagh and the Company engaged in mediation sessions with a neutral, third-party mediator, but were not able to resolve the matter and the litigation will proceed. On May 5, 2023, the Company filed an Answer in response to the Complaint, and Counterclaims against Ardagh. On June 26, 2023, Ardagh filed a Motion to Dismiss Certain Counterclaims and a Motion to Strike Certain Affirmative Defenses, to which the Company filed Oppositions on July 24, 2023. On November 9, 2023, Ardagh filed a Notice of Plaintiff’s Motion for Judgment on the Pleadings on Count II of the Complaint, to which the Company filed an Opposition on November 22, 2023. The parties are currently engaged in the fact discovery phase of the matter and the range of potential outcomes cannot be estimated at this time.

Item 4. Mine Safety Disclosures

Item 4.

Mine Safety Disclosures

Not Applicable


28


PART II.

Item 5. Market for Registrant’s Common Equity, Related Stockholder Matters and Issuer Purchases of Equity Securities

Item 5.

Market for Registrant’s Common Equity, Related Stockholder Matters and Issuer Purchases of Equity Securities

The graph set forth below shows the value of an investment of $100 on January 1, 20162019 in each of the Company’s stock (“The Boston Beer Company, Inc.”), the Standard & Poor’s 500 Index (“S&P 500 Index”) and the Standard & Poor’s 500 Beverage Index, which consists of producers of alcoholic and non-alcoholic beverages (“S&P 500 Beverages Index”) for the five years ending December 26, 2020.30, 2023.

Total Return Toto Shareholders

(Includes reinvestment of dividends)


ANNUAL RETURN PERCENTAGE

Years Ending


ANNUAL RETURN PERCENTAGE
Years Ending


Company Name / Index


12/31/16


12/30/17


12/29/18


12/28/19


12/26/2020


12/28/2019


12/26/2020


12/25/2021


12/31/2022


12/30/2023


The Boston Beer Company, Inc.


(17.31

)


12.51


24.97


58.59


167.97


58.59


167.97


(48.29

)


(37.22

)


4.88


S&P 500 Index


11.07


21.83


(5.20

)


32.97


16.40


32.97


16.40


29.44


(17.40

)


26.29


S&P 500 Beverages Index


1.77


18.84


(3.29

)


23.99


6.56


23.99


6.56


14.51


8.93


(1.98

)


INDEXED RETURNS

Years Ending


INDEXED RETURNS
Years Ending


Company Name / Index


Base Period

12/26/15


12/31/16


12/30/17


12/29/18


12/28/19


12/26/2020


Base Period 12/30/2018


12/28/2019


12/26/2020


12/25/2021


12/31/2022


12/30/2023


The Boston Beer Company, Inc.


100


82.69


93.04


116.27


184.40


494.12


100


158.59


424.98


219.78


137.98


144.71


S&P 500 Index


100


111.07


135.32


128.28


170.57


198.54


100


132.97


154.78


200.35


165.49


209.00


S&P 500 Beverages Index


100


101.77


120.94


116.97


145.03


154.54


100


123.99


132.12


151.29


164.81


161.54


img2070507_0.jpg 

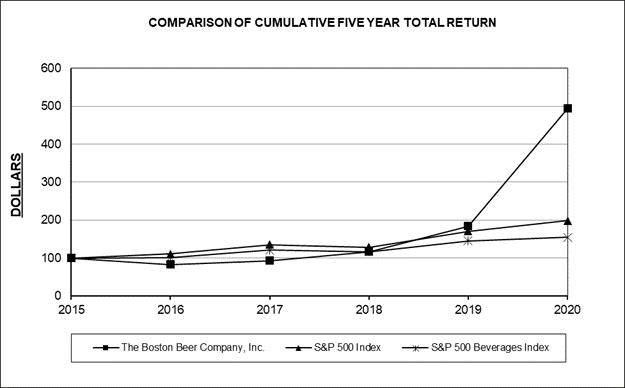
The Company’s Class A Common Stock is listed for trading on the New York Stock Exchange under the symbol SAM.


There were 7,8596,875 holders of record of the Company’s Class A Common Stock as of February 12, 2021.23, 2024. Excluded from the number of stockholders of record are stockholders who hold shares in “nominee” or “street” name. The closing price per share of the Company’s Class A Common Stock as of February 12, 2021,23, 2024, as reported under the New York Stock Exchange-Composite Transaction Reporting System, was $1,167.13.$354.43.

29


Class A Common Stock

At December 26, 2020,30, 2023, the Company had 22,700,000 authorized shares of Class A Common Stock with a par value of $.01,$0.01, of which 10,070,64910,057,950 were issued and outstanding, which includes 65,96824,647 shares that have trading restrictions. The Class A Common Stock has no voting rights, except (1) as required by law, (2) for the election of Class A Directors, and (3) that the approval of the holders of the Class A Common Stock is required for (a) future authorizations or issuances of additional securities which have rights senior to Class A Common Stock, (b) alterations of rights or terms of the Class A or Class B Common Stock as set forth in the Articles of Organization of the Company, (c) certain other amendments of the Articles of Organization of the Company, (d) certain mergers or consolidations with, or acquisitions of, other entities, and (e) sales or dispositions of any significant portion of the Company’s assets.

Class B Common Stock

At December 26, 2020,30, 2023, the Company had 4,200,000 authorized shares of Class B Common Stock with a par value of $.01,$0.01, of which 2,177,9832,068,000 shares were issued and outstanding. The Class B Common Stock has full voting rights, including the right to (1) elect a majority of the members of the Company’s Board of Directors and (2) approve all (a) amendments to the Company’s Articles of Organization, (b) mergers or consolidations with, or acquisitions of, other entities, (c) sales or dispositions of any significant portion of the Company’s assets and, (d) equity-based and other executive compensation, and other significant corporate matters, such as approval of the Company’s independent registered public accounting firm. The Company’s Class B Common Stock is not listed for trading. Each share of Class B Common Stock is freely convertible into one share of Class A Common Stock, upon request of any Class B holder.

As of February 12, 2021,23, 2024, C. James Koch, the Company’s Chairman, was the direct holder of record of all of the Company’s issued and outstanding Class B Common Stock.

The holders of the Class A and Class B Common Stock are entitled to dividends, on a share-for-share basis, only if and when declared by the Board of Directors of the Company out of funds legally available for payment thereof. Since its inception, the Company has not paid dividends and does not currently anticipate paying dividends on its Class A or Class B Common Stock in the foreseeable future.

Repurchases of the Registrants Class A Common Stock

In 1998, the Company began a share repurchase program. Under this program, the Company's Board of Directors has authorized the repurchase of the Company's Class A Stock. On May 18, 2023, the Board of Directors authorized management to implement aan increase in the aggregate expenditure limit for the Company’s stock repurchase program withby $269.0 million, increasing the limit from $931.0 million to $1.2 billion. The Board of Directors did not specify a limit of $931.0 million.date upon which the total authorization would expire and, in the future, can further increase the authorized amount. As of December 26, 2020,30, 2023, the Company hashad repurchased a cumulative total of approximately 13.814.1 million shares of its Class A Common Stock for an aggregate purchase price of approximately $840.7 million.$933.5 million and had approximately $266.5 million remaining on the $1.2 billion stock repurchase expenditure limit set by the Board of Directors.


During the twelve months ended December 26, 2020,fiscal year 2023, the Company repurchased 480and subsequently retired 276,045 shares of its Class A Common Stock as illustrated infor an aggregate purchase price of $92.9 million. Additionally, the table below:Company repurchased 1,891 shares of its Class A Common

30


Period


Total Number

of Shares

Purchased


Average

Price Paid

per Share


Total Number

of Shares

Purchased as

Part of Publicly

Announced

Plans or

Programs


Dollar Value

of Shares that

May Yet be

Purchased

Under the

Plans or

Programs

(in thousands)


December 29, 2020 to February 1, 2020


167


$

132.37


$

90,335


February 2, 2020 to February 29, 2020


-


-


90,335


March 1, 2020 to March 28, 2020


58


105.56


90,335


March 29, 2020 to May 2, 2020


59


145.01


90,335


May 3, 2020 to May 30, 2020


-


-


90,335


May 31, 2020 to June 27, 2020


31


187.54


90,335


June 28, 2020 to August 1, 2020


-


-


90,335


August 2, 2020 to August 29, 2020


131


160.57


90,335


August 30, 2020 to September 26, 2020


26


187.54


90,335


September 27, 2020 to October 31, 2020


90,335


November 1, 2020 to November 28, 2020


90,335


November 29, 2020 to December 26, 2020


8


187.54


90,335


Total


480


145.85


$

90,335


All shares that were purchased during the period representStock for repurchases of unvested investment shares issued under the Investment Share Program of the Company’s Employee Equity Incentive Plan.Plan, as illustrated in the table below:

Period


Total Number
of Shares
Purchased


Average
Price Paid
per Share


Total Number
of Shares
Purchased as
Part of Publicly
Announced
Plans or
Programs


Dollar Value
of Shares that
May Yet be
Purchased
Under the
Plans or
Programs
(in thousands)


January 1, 2023 - February 4, 2023


21,058


$

351.21


20,770


$

83,007


February 5, 2023 - March 4, 2023


19,379


340.70


19,266


76,434


March 5, 2023 - April 1, 2023


25,125


319.49


24,993


68,438


April 2, 2023 - May 6, 2023


30,447


316.72


30,132


58,841


May 7, 2023 - June 3, 2023


23,741


321.01


23,607


320,245


June 4, 2023 - July 1, 2023


23,354


325.69


23,302


312,647


July 2, 2023 - August 5, 2023


26,755


313.85


26,752


304,250


August 6, 2023 - September 2, 2023


11,150


360.77


11,017


300,254


September 3, 2023 - September 30, 2023


10,360


370.78


10,118


296,457


October 1, 2023 - November 4, 2023


32,349


351.09


32,067


285,152


November 5, 2023 - December 2, 2023


33,334


342.29


33,275


273,755


December 3, 2023 - December 30, 2023


20,884


350.76


20,746


266,457


Total


277,936


$

335.51


276,045


$

266,457


Item 6. [Reserved]


31


Item 7. Management’s Discussion and Analysis of Financial Condition and Results of Operations

The Company has elected to omit discussion of the earliest of the three years covered by the consolidated financial statements presented. Refer to Item 7. "Management's Discussion and Analysis of Financial Condition and Results of Operations" located in the Company's Form 10-K for the fiscal year ended December 31, 2022, filed on February 22, 2023, for reference to discussion of the fiscal year ended December 25, 2021, the earliest of the three fiscal years presented.

Item 6.

Selected Consolidated Financial Data


Year Ended


Dec. 26

2020


Dec. 28

2019


Dec. 29

2018


Dec. 30

2017

(53 weeks)


Dec. 31

2016


(in thousands, except per share and net revenue per barrel data)


Income Statement Data:


Revenue


$

1,851,813


$

1,329,108


$

1,057,495


$

921,736


$

968,994


Less excise taxes


115,381


79,284


61,846


58,744


62,548


Net revenue


1,736,432


1,249,824


995,649


862,992


906,446


Cost of goods sold


921,980


635,658


483,406


413,091


446,776


Gross profit


814,452


614,166


512,243


449,901


459,670


Operating expenses:


Advertising, promotional and selling expenses


447,568


355,613


304,853


258,649


244,213


General and administrative expenses


118,211


112,730


90,857


73,126


78,033


Impairment (gain on sale) of assets, net


4,466


911


652


2,451


(235

)

Total operating expenses


570,245


469,254


396,362


334,226


322,011


Operating income


244,207


144,912


115,881


115,675


137,659


Other income (expense), net


23


(542

)


405


467


(538

)

Income before provision for income taxes


244,230


144,370


116,286


116,142


137,121


Provision for income taxes


52,270


34,329


23,623


17,093


49,772


Net income


$

191,960


$

110,041


$

92,663


$

99,049


$

87,349


Net income per share - basic


$

15.73


$

9.26


$

7.90


$

8.18


$

6.93


Net income per share - diluted


$

15.53


$

9.16


$

7.82


$

8.09


$

6.79


Weighted average shares outstanding - basic


12,130


11,781


11,622


12,035


12,533


Weighted average shares outstanding - diluted


12,283


11,908


11,734


12,180


12,796


Balance Sheet Data:


Working capital


$

153,750


$

37,999


$

111,057


$

66,590


$

99,719


Total assets


$

1,378,825


$

1,054,057


$

639,851


$

569,624


$

623,297


Total long-term obligations


$

129,879


$

83,832


$

59,020


$

44,343


$

75,196


Total stockholders’ equity


$

956,967


$

735,636


$

460,317


$

423,523


$

446,582


Statistical Data:


Barrels sold


7,368


5,307


4,286


3,768


4,019


Net revenue per barrel


$

235.67


$

235.51


$

232.30


$

229.05


$

225.55


Item 7.

Management’s Discussion and Analysis of Financial Condition and Results of Operations

Forward-Looking Statements

In this Form 10-K and in other documents incorporated herein, as well as in oral statements made by the Company, statements that are prefaced with the words “may,” “will,” “expect,” “anticipate,” “continue,” “estimate,” “project,” “intend,” “designed,” and similar expressions, are intended to identify forward-looking statements regarding events, conditions, and financial trends that may affect the Company’s future plans of operations, business strategy, results of operations, and financial position. These statements are based on the Company’s current expectations and estimates as to prospective events and circumstances about which the Company can give no firm assurance. Further, any forward-looking statement speaks only as of the date on which such statement is made, and the Company undertakes no obligation to update any forward-looking statement to reflect future events or circumstances. Forward-looking statements should not be relied upon as a prediction of actual future financial condition or results. These forward-looking statements, like any forward-looking statements, involve risks and uncertainties that could cause actual results to differ materially from those projected or anticipated. Such risks and uncertainties include the factors set forth above and the other information set forth in this Form 10-K.

Introduction and COVID-19 Pandemic

Introduction

The Boston Beer Company is engaged in the business of producing and selling alcohol beverages primarily in the domestic market and, to a lesser extent, in selected international markets. The Company’s revenues are primarily derived by selling its hard seltzers, beers and hard cidersbeverages to Distributors, who in turn sell the products to retailers and drinkers.

The

Most of the Company’s beverages which include flavored malt beverages, hard seltzers, beers, and hard ciders, are primarily positioned in the market for High End beer occasions. High End beers and beer occasions (the “High End category”) are determined by higher price, quality, image and taste, as compared with regular domestic beers. Boston Beer is one of the largest suppliers in the High End category in the United States. The High End category has seen high single-digit compounded annual growth over the past ten years. The Company believes that the High End category is positioned to increase market share in the total beer category, as drinkers continue to trade up in taste and quality. Boston Beer is one of the largest suppliers in the High End category in the United States. In measured off-premise channels, theThe Company estimates that in 2020 the High End category percentage volume growth was approximately 25% with the craft beer category volume growth approximately 13% and total beer category volume growth approximately 10%. The Company believes that the High End categoryfull year percentage volume is over 35% ofchanges in 2021, 2022 and 2023 were approximately 2%, (3%) and 1% respectively. These trends are above the estimated United States beer market. Depletionsmarket volume changes in 2021, 2022 and 2023, of (5%), (5%) and (2%) respectively.

The market for hard seltzer products has experienced declining annual volume growth rate trends from estimated growth of 158% in 2020 and 13% in 2021 to an estimated decline of 15% in 2022 and 21% in 2023. The decline in volume trends has negatively impacted the Company's volume of depletions, or Distributor sales to retailers, and shipments, as well as its projections for the future. The decline in volume trends resulted in several supply chain related costs recorded during the second half of 2021 and 2022. These costs included provisions for excess and obsolete inventories, property, plant, and equipment impairments, write-offs of third-party production prepayments, and provisions for costs associated with the termination of various third-party production contracts.

Depletions of the Company’s hard seltzers, beers and hard cidersbeverages for the 52 week fiscal period ended December 26, 2020, increased30, 2023, decreased approximately 37%6% from the 53 week fiscal period in the prior year.

Depletions of the Company’s beverages for the 53 week fiscal period ended December 31, 2022, decreased approximately 5% from the comparable 52 week fiscal period in the prior year, of which 35% is from Boston Beer legacy brands and 2% is from the addition of Dogfish Head brands beginning July 3, 2019.

The Company began seeing the impact of the COVID-19 pandemic on its business in early March 2020.  The direct financial impact of the pandemic has primarily shown in significantly reduced keg demand from the on-premise channel and higher labor and safety-related costs at the Company’s breweries. In the 52-week period ended December 26, 2020, the Company recorded COVID-19 related pre-tax reductions in net revenue and increases in other costs that total $16.0 million, of which $1.8 million was recorded in the fourth quarter.  The total amount consists of a $3.3 million reduction in net revenue for estimated keg returns from distributors and retailers and $12.7 million of other COVID-19 related direct costs, of which $8.2 million are recorded in cost of goods sold and $4.5 million are recorded in operating expenses.  In addition to these direct financial impacts, COVID-19 related safety measures resulted in a reduction of brewery productivity. This has shifted more volume to third-party breweries, which increased production costs and negatively impacted gross margins.  The Company will continue to assess and manage this situation and will provide a further update in each quarterly earnings release, to the extent that the effects of the COVID-19 pandemic are then known more clearly.

Outlook

Year-to-date depletions reported to the Company for the 6 weeks ended February 6, 2021 are estimated by the Company to have increased approximately 53% from the comparable weeks in 2020.

The Company is targeting Non-GAAP earnings per diluted share for 2021 of between $20.00 and $24.00, excluding the impact of ASU 2016-09, year.

Stock Compensation (Topic 718), Improvements to Employee Share-Based Payment Accounting, but actual results could vary significantly from this target. The Company is forecasting 2021 depletions and shipments percentage increases of between 35% and 45%. The Company is targeting national price increases of between 1% and 2%. Full-year 2021 gross margins are currently expected to be between 45% and 47%, a decrease from the previously communicated estimate of between 46% and 48%. The Company intends to increase advertising, promotional and selling expenses by between $120 million and $140 million for the full year 2021, a decrease from the previously communicated estimate of between $130 million and $150 million, which does not include any increases in freight costs for the shipment of products to its Distributors. The Company intends to increase its investment in its brands in 2021 commensurate with the


32


opportunities for growth that it sees, but there is no guarantee that such increased investments will result in increased volumes. The Company estimates a full-year 2021 Non-GAAP effective tax rate of approximately 26.5%, excluding the impact of ASU 2016-09. This effective tax rate estimate also, excludes the potential impact of changes to current federal income tax laws and regulations that could occur later in 2021. Non-GAAP earnings per diluted share and Non-GAAP effective tax rate are not defined terms under U.S. generally accepted accounting principles (“GAAP”). These Non-GAAP measures should not be considered in isolation or as a substitute for diluted earnings per share and effective tax rate data prepared in accordance with GAAP, and may not be comparable to calculations of similarly titled measures by other companies. Management believes these Non-GAAP measures provide meaningful and useful information to investors and analysts regarding our outlook and facilitate period to period comparisons of our forecasted financial performance. Non-GAAP earnings per diluted share and Non-GAAP effective tax rate exclude the potential impact of ASU 2016-09, which could be significant and will depend largely upon unpredictable future events outside the Company’s control, including the timing and value realized upon exercise of stock options versus the fair value of those options when granted. Therefore, because of the uncertainty and variability of the impact of ASU 2016-09, the Company is unable to provide, without unreasonable effort, a reconciliation of these Non-GAAP measures on a forward-looking basis.

The Company is continuing to evaluate 2021 capital expenditures. Its current estimates are between $300 million and $400 million, consisting mostly of continued investments in capacity and efficiency improvements at the Company’s breweries. The actual total amount spent on 2021 capital expenditures may well be different from these estimates. Based on information currently available, the Company believes that its capacity requirements for 2021 can be covered by its Company-owned breweries and contracted capacity at third-party brewers.

Results of Operations

Year Ended December 26, 202030, 2023 (52 weeks) Compared to Year Ended December 28, 201931, 2022 (53 weeks)


Year Ended

(in thousands, except per barrel)


Year Ended
(in thousands, except per barrel)


Dec. 26

2020


Dec. 28

2019


Amount

change


% change


Per barrel

change


Dec. 30
2023


Dec. 31
2022


Amount
change


% change


Per barrel
change


Barrels sold


7,368


5,307


2,061


38.8

%


7,678


8,183


(505

)


(6.2

)%


Per barrel


% of net

revenue


Per barrel


% of net

revenue


Per barrel


% of net
revenue


Per barrel


% of net
revenue


Net revenue


$

1,736,432


$

235.67


100.0

%


$

1,249,824


$

235.51


100.0

%


$

486,608


38.9

%


$

0.16


$

2,008,625


$

261.61


100.0

%


$

2,090,334


$

255.44


100.0

%


$

(81,709

)


(3.9

)%


$

6.17


Cost of goods


921,980


125.13


53.1

%


635,658


119.78


50.9

%


286,322


45.0

%


5.35


1,156,256


150.59


57.6

%


1,228,348


150.10


58.8

%


(72,092

)


(5.9

)%


0.49


Gross profit


814,452


110.54


46.9

%


614,166


115.73


49.1

%


200,286


32.6

%


(5.19

)


852,369


111.01


42.4

%


861,986


105.33


41.2

%


(9,617

)


(1.1

)%


5.68


Advertising, promotional and selling

expenses


447,568


60.74


25.8

%


355,613


67.01


28.5

%


91,955


25.9

%


(6.27

)

Advertising, promotional, and selling
expenses


555,998


72.41


27.7

%


578,400


70.68


27.7

%


(22,402

)


(3.9

)%


1.73


General and administrative

expenses


118,211


16.04


6.8

%


112,730


21.24


9.0

%


5,481


4.9

%


(5.20

)


174,548


22.73


8.7

%


157,534


19.25


7.5

%


17,014


10.8

%


3.48


Impairment of assets, net


4,466


0.61


0.3

%


911


0.17


0.1

%


3,555


390.2

%


0.44


Impairment of intangible assets


16,426


2.14


0.8

%


27,100


3.31


1.3

%


(10,674

)


(39.4

)%


(1.17

)

Impairment of brewery assets


5,396


0.70


0.3

%


2,782


0.34


0.1

%


2,614


94.0

%


0.36


Contract termination costs and other


0.00


0.0

%


5,379


0.66


0.3

%


(5,379

)


(100.0

)%


(0.66

)

Total operating expenses


570,245


77.39


32.8

%


469,254


88.42


37.5

%


100,991


21.5

%


(11.03

)


752,368


97.99


37.5

%


771,195


94.24


36.9

%


(18,827

)


(2.4

)%


3.75


Operating income


244,207


33.14


14.1

%


144,912


27.31


11.6

%


99,295


68.5

%


5.83


100,001


13.02


5.0

%


90,791


11.09


4.3

%


9,210


10.1

%


1.93


Other income (expense), net


23


0.00


0.0

%


(542

)


(0.10

)


0.0

%


565


(104.2

)%


0.10


Income before provision for income taxes


244,230


33.15


14.1

%


144,370


27.20


11.6

%


99,860


69.2

%


5.95


Provision for income taxes


52,270


7.09


3.0

%


34,329


6.47


2.7

%


17,941


52.3

%


0.62


Other income, net


9,587


1.25


0.5

%


645


0.08


0.0

%


8,942


1386.4

%


1.17


Income before income tax provision


109,588


14.27


5.5

%


91,436


11.17


4.4

%


18,152


19.9

%


3.10


Income tax provision


33,338


4.34


1.7

%


24,173


2.95


1.2

%


9,165


37.9

%


1.39


Net income


$

191,960


$

26.05


11.1

%


$

110,041


$

20.74


8.8

%


$

81,919


74.4

%


$

5.31


$

76,250


$

9.93


3.8

%


$

67,263


$

8.22


3.2

%


$

8,987


13.4

%


$

1.71


Net revenue. Net revenue increaseddecreased by $486.6$81.7 million, or 38.9%3.9%, to $1,736.4$2,008.6 million for the year ended December 26, 2020,30, 2023, as compared to $1,249.8$2,090.3 million for the year ended December 28, 2019, due31, 2022, primarily to increased shipments.as a result of lower shipment volume of $129.3 million and $12.6 million of product mix impacts, partially offset by price increases of $60.2 million.

Volume. Total shipment volume of 7,368,0007,678,000 barrels for the year ended December 26, 2020 increased30, 2023 decreased by 38.8%6.2% over 20192022 levels of 5,307,0008,183,000 barrels, due primarily to increasesreflecting decreases in shipments ofthe Company’s Truly Hard Seltzer, and Twisted Tea and the addition of theAngry Orchard, Samuel Adams, Dogfish Head and Hard Mountain Dew brands, partially offset by decreasesincreases in its Samuel Adamas and Angry Orchard brands.Twisted Tea brand. On a 52-week comparable basis, shipment volume decreased 5.2%.


Depletions or sales by Distributors to retailers, of the Company’s products for the year ended December 28, 2019 increased30, 2023 decreased by approximately 37%6% compared to the prior year, primarily due to increasesreflecting decreases in depletions ofthe Company’s Truly Hard Seltzer, Angry Orchard, Samuel Adams and Twisted Tea brands and the addition of the Dogfish Head brands, partially offset by decreasesincreases in its Samuel AdamsTwisted Tea and Angry OrchardHard Mountain Dew brands. On a 52-week comparable basis, depletions decreased 5%.

The Company believes distributor inventory as of December 30, 2023 averaged approximately four weeks on hand and was at an appropriate level for each of its brands.

Net Revenue per barrel. The net revenue per barrel increased by 0.1%2.4% to $235.67$261.61 per barrel for the year ended December 26, 2020,30, 2023, as compared to $235.51$255.44 per barrel for the year ended December 28, 2019,31, 2022, primarily due to price increases, partially offset by unfavorable package mix.product mix impacts.

Cost of goods sold. Cost of goods sold was $125.13$150.59 per barrel for the fifty-two weeks ended December 30, 2023, as compared to $150.10 per barrel for the fifty-three weeks ended December 31, 2022. The 2023 increase in cost of goods sold of $0.49, or 0.3% per barrel was primarily due to inflationary cost impacts of $30.0 million, or $3.91 per barrel, increased third-party production shortfall fees of $6.5 million, or $0.85 per barrel, the brewery cost absorption impact due to lower volume of $6.2 million, or $0.80 per barrel, and a contract settlement cost of $4.5 million, or $0.59 per barrel partially offset by contract renegotiations and recipe optimization of $26.6 million, or $3.46 per barrel, and decreases in inventory obsolescence of $14.8 million, or $1.93 per barrel.

Inflationary impacts of $30.0 million consist primarily of increased material costs of $16.0 million, costs of third-party production of $7.6 million, and internal brewery costs of $6.4 million.

33


Supply chain constraints in package materials, primarily cans, have impacted production schedules and increased can costs, as a result of using a more expensive supplier. During fiscal 2023 and 2022, the additional can costs related to use of this more expensive supplier were zero and $3.6 million, respectively. These supply chain constraints in package materials did not otherwise have a material impact on the Company’s results of operations or capital resources.

Gross profit. Gross profit was $111.01 per barrel for the year ended December 26, 2020,30, 2023, as compared to $119.78$105.33 per barrel for the year ended December 28, 2019. The 2020 increase in cost of goods sold of $5.35 or 4.5% per barrel31, 2022. Gross margin was primarily the result of higher processing costs due to increased production at third party breweries and higher processing costs and finished goods keg inventory write-offs at Company-owned breweries, partially offset by cost saving initiatives at Company-owned breweries.

Gross profit. Gross profit was $110.54 per barrel42.4% for the year ended December 26, 2020,30, 2023, as compared to $115.73 per barrel41.2% for the year ended December 28, 2019. Gross margin31, 2022. The increase was 46.9% for the year ended December 26, 2020, as comparedprimarily due price increases, contract renegotiations and recipe optimization and lower inventory obsolescence partially offset by inflationary costs, increased third-party production shortfall fees and brewery cost absorption impact due to 49.1% for the year ended December 28, 2019.lower volume.

The Company includes freight charges related to the movement of finished goods from manufacturing locations to Distributor locations in its advertising, promotional and selling expense line item. As such, the Company’s gross margins may not be comparable to other entities that classify costs related to distribution differently.

Advertising, promotional, and selling. selling expenses. Advertising, promotional and selling expenses, increased $92.0decreased $22.4 million, or 25.9%3.9%, to $447.6$556.0 million for the year ended December 26, 2020,30, 2023, as compared to $355.6$578.4 million for the year ended December 28, 2019.31, 2022. The increasedecrease was primarily the resultdue to decreased freight to distributors of increased$50.9 million from lower rates and volumes, partially offset by an increase in brand investments of $28.5 million, mainly driven by higher investments in local marketing and media of $15.9 million and production, higherincreased salaries and benefits costs the addition of Dogfish Head brand related expenses beginning July 3, 2019, and increased freight to distributors due to higher volumes.$14.0 million.

Advertising, promotional and selling expenses were 25.8%27.7% of net revenue, or $60.74$72.41 per barrel, for the year ended December 26, 2020,30, 2023, as compared to 28.5%27.7% of net revenue, or $67.01$70.68 per barrel, for the year ended December 28, 2019.31, 2022. The Company will invest in advertising and promotional campaigns that it believes are effective, but there is no guarantee that such investment will generate sales growth.

The Company conducts certain advertising and promotional activities in its Distributors’ markets, and the Distributors make contributions to the Company for such efforts. These amounts are included in the Company’s statement of operations as reductions to advertising, promotional and selling expenses. Historically, contributions from Distributors for advertising and promotional activities have amounted to betweenapproximately 2% and 3% of net sales. The Company may adjust its promotional efforts in the Distributors’ markets, if changes occur in these promotional contribution arrangements, depending on the industry and market conditions.

General and administrative. administrative expenses. General and administrative expenses increased by $5.5$17.0 million, or 4.9%10.8%, to $118.2$174.5 million for the year ended December 26, 2020,30, 2023, as compared to $112.7$157.5 million for the comparable period in 2019.2022. The increase was primarily due to increases inincreased consulting costs of $7.5 million and increased salaries and benefits costs and the addition of Dogfish Head general and administrative expenses beginning July 3, 2019, partially offset by$4.9 million, mainly due to higher incentive compensation.

Impairment of intangible assets. Impairment of intangible assets reflects a $16.4 million non-cash impairment charge recorded primarily for the Dogfish Head transaction-related feesbrand, taken as a result of $7.8the Company’s annual impairment analysis as of September 1, 2023. The impairment determination was primarily based on the latest forecasts of brand performance which have been below the Company’s previous projections. In fiscal 2022, the Company recorded an impairment charge of $27.1 million incurredfor the Dogfish Head brand. See further discussion in Note H to the comparable 52-week period in 2019.Consolidated Financial Statements within Part II, Item 8 of this Form 10-K.

Impairment of brewery assets. ForImpairment of brewery assets of $5.4 million increased by $2.6 million from the prior fiscal year, ended December 26, 2020, the Company incurred impairment charges of $4.5 million, based upon its review of the carrying values of its property, plant and equipment. These impairment charges were primarily due to the write-downhigher write-offs of brewery equipment at Company-owned breweries.

Stock-based compensation expense. For the year ended December 26, 2020, an aggregate of $15.3

Contract termination costs and other. Contract termination costs decreased by $5.4 million in stock-based compensation expense is included in advertising, promotional and selling expenses and general and administrative expenses. Stock compensation increased by $3.0 million in 2020 compared to 2019, primarily due to achievement of performance-based awards.costs incurred during fiscal year 2022 resulting from negotiations with a supplier that terminated a production agreement.


Provision for income taxes. 

Income tax provision.The Company’s effective tax rate decreasedfor fiscal 2023 was a tax provision of 30.2% compared to 21.4% for the year ended December 26, 2020 from approximately 23.8% for the year ended December 28, 2019. This decrease was26.4% in fiscal 2022, primarily due to a higher tax benefit from stock option activity recordedan increase in accordance with ASU 2016-09.non-deductible officer compensation.

Liquidity and Capital Resources

The Company’s primary sources of liquidity are its existing cash balances, cash flows from operating activities and amounts available under its revolving credit facility. The Company’s material cash requirements include working capital needs, satisfaction of contractual commitments, and investment in the Company’s business through capital expenditures.

34


Cash and cash equivalents and restricted cash increased to $163.3$298.5 million as of December 26, 202030, 2023 from $36.7$180.6 million as of December 28, 2019,31, 2022, primarily reflecting cash provided by operating activities and proceeds from the exercise of stock options and sale of investment shares, partially offset by repurchases of Class A common stock and purchases of property, plant, and equipment.

Cash provided by or used in operating activities consists of net income, adjusted for certain non-cash items, such as depreciation and amortization, impairment of intangible assets, stock-based compensation expense, and related excess tax benefit, other non-cash items included in operating results, and changes in operating assets and liabilities, such as accounts receivable, inventory, prepaid expenses and other current assets, accounts payable, and accrued expenses.

Cash provided by operating activities increasedfor the year ended December 30, 2023 was $265.2 million and consisted of net income of $76.3 million, non-cash items of $124.0 million, and an inflow of $64.9 million from $178.2a net decrease in operating assets and liabilities. The inventory decrease of $31.5 million is due to improvements in 2019supply chain process resulting in lower inventory levels and lower volumes. The third-party production prepayments decrease of $27.8 million is due to $253.3expensing of these prepayments over the respective contract terms. The accrued expenses and other current liabilities increase of $13.9 million in 2020 principally as a result ofis primarily due to increases in accrued incentive compensation compared to the prior year. The accounts receivable increase of $10.3 million is primarily due timing of shipments in the month of December compared to the prior year.

Cash provided by operating activities for the year ended December 31, 2022 was $199.9 million and consisted of net income of $67.3 million, non-cash items of $142.4 million and outflows of $9.7 million from net increases in operating income, partially offset by higher investmentsassets and liabilities. The change is primarily due to a net decrease in working capital, particularly higher inventoryoperating assets and third party brewery prepayments due under production agreementsliabilities in fiscal 2023 compared to support increased demand.a net increase in fiscal 2022.

Cash

The Company used $62.4 million in investing activities decreased from $258.8during the year ended December 30, 2023, as compared to $88.5 million in 2019 to $139.1 million in 2020, primarily as a result ofduring the investment in Dogfish Head in fiscal 2019.year ended December 31, 2022. Investing activities in 2020during both periods primarily consisted of capital investments made mostly in the Company’s breweries to increase capacity, drive efficiencies and cost reductions and support product innovation.innovation and potential future growth.

Cash provided byused in financing activities was $12.3$84.8 million during 2020,the year ended December 30, 2023, as compared to $8.9$2.8 million provided by financing activities during 2019.the year ended December 31, 2022. The $3.4 million increase in cash provided by financing activities in 2020 from 2019change is primarily due to higher proceeds from exercise$92.9 million in repurchases of Class A common stock options and sale of investment shares.in fiscal 2023.

In 1998, the Board of Directors authorized management to implement a stock repurchase program.

During thefiscal year ended December 26, 2020,2023, the Company did not repurchase anyrepurchased and subsequently retired 276,045 shares of its Class A Common Stock, under the stock repurchase program.respectively, for an aggregate purchase price of $92.9 million. As of December 26, 2020,30, 2023, the Company had repurchased a cumulative total of approximately 13.814.1 million shares of its Class A Common Stock for an aggregate purchase price of $840.7 million. From December 27, 2020 through February 12, 2021, the Company did not repurchase any shares of its Class A Common Stock. The Company has approximately $90.3$933.5 million and had approximately $266.5 million remaining on the $931.0 million$1.2 billion stock repurchase expenditure limit set by the Board of Directors.

The Company expects that its cash balance as of December 26, 202030, 2023 of $163.3$298.5 million along withand future operating cash flow and the Company’s unused line offlows, along with its $150.0 million credit of $150.0 million,facility agreement, will be sufficient to fund future cash requirements. The Company’s $150.0 millionRefer to Note K of the Notes to the Consolidated Financial Statements within Part II, Item 8 of this Form 10-K for further details of the terms of the credit facility has a term not scheduled to expire until March 31, 2023.agreement. As of the date of this filing, the Company was not in violation of any of its covenants to the lender under the credit facility and there were no amounts outstanding under the credit facility.

Critical Accounting Policies

The discussion and analysis of the Company’s financial condition and results of operations is based upon its consolidated financial statements, which have been prepared in accordance with U.S. generally accepted accounting principles. The preparation of these financial statements requires the Company to make significant estimates and judgments that affect the reported amounts of assets, liabilities, revenues and expenses, and related disclosure of contingent assets and liabilities. These items are monitored and analyzed by management for changes in facts and circumstances, and material changes in these estimates could occur in the future. The more judgmental estimates are summarized below. Changes in estimates are recorded in the period in which they become known. The Company bases its estimates on historical experience and various other assumptions that the Company believes to be reasonable under the circumstances. Actual results may differ from the Company’s estimates if past experience or other assumptions do not turn out to be substantially accurate.estimates.

Provision for Excess or Expired Inventory

35


The provisions for excess or expired inventory are based on management’s estimates of forecasted usage of inventories on hand and under contract.hand. Forecasting usage involves significant judgments regarding future demand for the Company’s various existing products and products under development as well as the potency and shelf-life of various ingredients.raw material ingredients and finished goods. A


significant change in the timing or level of demand for certain products as compared to forecasted amounts may result in recording additional provisions for excess or expired inventory in the future. Provisions for excess inventory are included in cost of goods sold and have historically been adequate to provide for losses on its inventory. Provision for excess or expired inventory included in cost of goods sold was $11.3$19.3 million, $8.1$35.9 million, and $4.2$62.6 million in fiscal years 2020, 20192023, 2022, and 2018,2021 respectively.

Valuation of Property, Plant, and Equipment

The carrying value of property, plant, and equipment, net of accumulated depreciation, at December 26, 202030, 2023 was $623.1$642.5 million. For purposes of determining whether there are any impairment losses on brewery assets, as further discussed below, management has historically examined the carrying value of the Company’s identifiable long-lived assets, including their useful lives, semi-annually, or more frequently when indicators of impairment are present. Evaluations of whether indicators of impairment exist involve judgments regarding the current and future business environment and the length of time the Company intends to use the asset. If an impairment loss is identified based on the fair value of the asset, as compared to the carrying value of the asset, such loss would be charged to expense in the period the impairment is identified. Furthermore, if the review of the carrying values of the long-lived assets indicates impairment of such assets, the Company may determine that shorter estimated useful lives are more appropriate. In that event, the Company will be required to record additional depreciation in future periods, which will reduce earnings. Estimating the amount of impairment, if any, requires significant judgments including identification of potential impairments, market comparison to similar assets, estimated cash flows to be generated by the asset, discount rates, and the remaining useful life of the asset.asset, and the usefulness of the asset in consideration of future business plans. Impairment of brewery assets classified as property, plant, and equipment included in operating expenses was $4.4$5.0 million, $0.9$2.6 million and $0.7$18.5 million in fiscal years 2020, 20192023, 2022, and 2018,2021, respectively.

Factors generally considered important which could trigger an impairment review on the carrying value of long-lived assets include the following: (1) significant underperformance relative to historical or projected future operating results; (2) significant changes in the manner of use of acquired assets or the strategy for the Company’s overall business; (3) underutilization of assets; and (4) discontinuance of products by the Company or its customers. The Company believes that the carrying value of its long-lived assets was realizable as of December 26, 2020 and December 28, 2019.

Valuation of Goodwill and Indefinite Lived Intangible Assets

The Company has recorded intangible assets with indefinite lives and goodwill for which impairment testing is required at least annually or more frequently if events or circumstances indicate that these assets might be impaired. The Company performs its annual impairment tests and re-evaluates the useful lives of other intangible assets with indefinite lives at the annual impairment test measurement date in the third quarter of each fiscal year or when circumstances arise that indicate a possible impairment or change in useful life might exist.

The Company’s annual goodwill impairment evaluation analysis conducted at the end of fiscal August indicated that the fair value of the Company’s goodwill was substantially greater than the carrying value and accordingly there was no impairment to record during 2020.fiscal 2023. The guidance for goodwill impairment testing allows an entity to assess qualitative factors to determine whether the existence of events or circumstances leads to a determination that it is more likely than not that the estimated fair value of a reporting unit, of which the Company has one, is less than its carrying amount or to proceed directly to performing a quantitative impairment test. Under the quantitative assessment, the estimated fair value of the Company’s reporting unit is compared to its carrying value, including goodwill. The estimate of fair value of the Company’s reporting unit is generally calculated based on an income approach using the discounted cash flow method supplemented by the market approach which considers the Company’s market capitalization and enterprise value. If the estimated fair value of the Company’s reporting unit is less than the carrying value of its reporting unit, a goodwill impairment will be recognized. In estimating the fair value of the Company’s reporting unit, management must make assumptions and projections regarding such items as future cash flows, future revenues, future earnings, cost of capital, and other factors. The assumptions used in the estimate of fair value are based on historical trends and the projections and assumptions that are used in current strategicthe latest operating plans. These assumptions reflect management’s estimates of future economic and competitive conditions and are, therefore, subject to change as a result of changing market conditions. If these estimates or their related assumptions change in the future, the Company may be required to recognize an impairment loss for the Company’s goodwill which could have a material adverse impact on the Company’s financial statements.

The Company’s annual intangible asset impairment evaluation analysis indicated that the fair value of the intangible assets were greater than the carrying value and there was no impairment to record during 2020.  

The Company’s intangible assets consist primarily of a trademark and customer relationships obtained through the Company’s Dogfish Head acquisition. Customer relationships are amortized over their estimated useful lives. The Dogfish Head trademark which was determined


to have an indefinite useful life is not amortized. The guidance for indefinite lived

36


intangible asset impairment testing allows an entity to assess qualitative factors to determine whether the existence of events or circumstances indicates that it is more likely than not that the indefinite lived intangible asset is impaired or to proceed directly to performing the quantitative impairment test. Under the quantitative assessment, the trademark is evaluated for impairment by comparing the carrying value of the trademark to its estimated fair value. The estimated fair value of the trademark is calculated based on an income approach using the relief from royalty method. If the estimated fair value is less than the carrying value of the trademark, then an impairment charge is recognized to reduce the carrying value of the trademark to its estimated fair value.

The fair value of the Dogfish Head trademark calculated in the third quarter of 2020 equaled 117.7% of its carrying value. The carrying value of the Dogfish Head trademark was $98.5 million as of December 26, 2020.  

Significant judgementjudgment is required to estimate the fair value the Dogfish Head trademark. Accordingly, the Company obtains the assistance of third-party valuation specialists as part of the impairment evaluation. In estimating the fair value of the trademark, management must make assumptions and projections regarding future cash flows based upon future revenues, the market-based royalty rate, the discount rate, and the tax rateafter-tax royalty savings expected from ownership of the trademark. The assumptions and other factors.projections used in the estimate of fair value are consistent with recent trends and represent the projections used in the Company’s current strategic operating plans which include reductions in revenues from the Dogfish Head beer products which were partially offset with revenue growth from the new Dogfish Head canned cocktails products that were launched in 2021. These assumptions reflect management’s estimates of future economic and competitive conditions and consider many factors including macroeconomic conditions, industry growth rates, and competitive activities and are, therefore, subject to change as well as the impact the COVID-19 pandemic has had on the Company.  The assumptions and projections used in the estimatea result of fair value are consistent with historical trends and those used in current strategic operating plans and the Company believes they are reasonable and comparable to those that would be used by other marketplace participants. The COVID-19 pandemic has resulted in the temporary closures of certain on-premise channels of distribution and a corresponding decline in net revenue from those on-premise channels.  There is a significant amount of uncertainty relating to how the pandemic will evolve and how governments and consumers will react. The Company’s third quarter 2020 impairment evaluation assumes the pandemic’s impact on revenues will begin to abate during the first half of fiscal 2021 and significantly improve by the second half of the fiscal year.changing market conditions. If these estimates or their related assumptions change in the future, the Companywe may be required to recognize an additional impairment losscharge for the Dogfish Head trademark whichasset. The recognition of any resulting impairment charge could have a material adverse impact on the Company’sCompany's financial statements.

The Company performed a sensitivity analysis on ourits significant assumptions used in the Dogfish Head trademark fair value calculation each of which we determined to be reasonable, and determined the following:following:

A decrease in the revenue growth rates of 26.8% would decrease the fair value calculation from 117.7% of carrying value to 100% of carrying value.  

A decrease in the discount rate of 1.5% would increase the fair value to 141.2% of carrying value and an increase of the discount rate of 1.5% would decrease the fair value to 100.5% of carrying value.

Business Combinations

On July 3, 2019, the Company completed its acquisition of Dogfish Head Brewery and various related operations (the “Transaction”), through the acquisition of all of the equity interests held by certain private entities in Off-Centered Way LLC, the parent holding company of the Dogfish Head Brewery operations. Dogfish Head results of operations have been included in the Company’s financial results beginning afterannual forecasted revenue growth rate of 1.0% would result in a 5.2% decrease to the closing date of July 3, 2019. Under the acquisition method of accounting, the Company allocated thecurrent fair value of purchase consideration transferred$55.6 million.

An increase in the discount rate of 1.5% would result in a 11.7% decrease to the tangible and intangible assets acquired and liabilities assumed based on their estimated fair values on the date of the acquisition. The fair values assigned, defined as the price that would be received to sell an asset or paid to transfer a liability in an orderly transaction between willing market participants, are based on estimates and assumptions determined by management. The excess purchase consideration over the aggregatecurrent fair value of tangible and intangible assets, net of liabilities assumed, is recorded as goodwill. When determining the fair value of assets acquired and liabilities assumed, the Company makes significant estimates and assumptions, especially with respect to intangible assets. The Company’s estimates of fair value are based upon assumptions believed to be reasonable, but which are inherently uncertain and unpredictable and, as a result, actual results may differ from estimates. The fair value of the assets acquired and liabilities assumed is typically determined by using either estimates of replacement costs or discounted cash flow valuation methods. When determining the fair value of tangible assets acquired, the Company must estimate the cost to replace the asset with a new asset taking into consideration such factors as age, condition and the economic useful life of the asset. When determining the fair value of intangible assets acquired, the Company must estimate the applicable discount rate, the royalty rate, and the timing and amount of future expected cash flows. During the measurement period, not to exceed one year from the date of acquisition, the Company may record adjustments to the assets acquired and liabilities assumed, with a corresponding offset to goodwill if new information is obtained related to facts and circumstances that existed as of the acquisition date. After the measurement period, any subsequent adjustments are reflected in the consolidated statements of operations. Acquisition costs, such as legal and consulting fees, are expensed as incurred.$55.6 million.


Revenue Recognition and Classification of Customer Programs and Incentives

The Company recognizes revenue when obligations under the terms of a contract with its customer are satisfied; generally, this occurs with the transfer of control of its products. Revenue is measured as the amount of consideration expected to be received in exchange for transferring products. If the conditions for revenue recognition are not met, the Company defers the revenue until all conditions are met. As of December 26, 202030, 2023 and December 28, 2019,31, 2022, the Company hashad deferred $13.5revenue of $8.9 million and $7.0$6.8 million, respectively, in revenue related to product shipped prior to these dates for which the criteria to recognize revenue was not met as of these dates. These amounts are included in accrued expenses and other current liabilities in the accompanying consolidated balance sheets.

The Company is committed to maintaining the freshness of the productits products in the market. In certain circumstances and with the Company’s approval, the Company accepts and destroys or offers credits for stale beer that is returned or destroyed by Distributors. The Company generally credits approximately fifty percent of the distributor’s cost of the beer that has passed its freshness expiration date for freshness when it is returned to the Company or destroyed. The Company reduces revenue and establishes an accrual based upon both historical returns, which is applied to an estimated lag time for receipt of product, and knowledge of specific return transactions. Estimating this reserve involves significant judgments and estimates, including comparability of historical return trends to future trends, lag time from date of sale to date of return, and product mix of returns. Stale beer expense is reflected in the accompanying financial statements as a reduction of revenue. Historically, the cost of actual stale beer returns has been in line with established reserves,reserves; however, the cost could differ materially from the estimated reservereserves which would impact revenue. As of December 26, 202030, 2023, and December 28, 2019,31, 2022, the stale beer reserve was $3.1$8.2 million and $1.8$5.6 million, respectively. These amounts are included in accrued expenses and other current liabilities in the accompanying consolidated balance sheets.

Customer programs and incentives are a common practice in the alcohol beverage industry. Amounts paid in connection with customer programs and incentives are recorded as reductions to net revenue or as advertising, promotional and selling expenses, based on the nature of the expenditure. Customer incentives and other payments made to Distributors are primarily based upon the performance of certain marketing and advertising activities. Depending on applicable state laws and regulations, these activities promoting the Company’s products may include, but are not limited to, point-of-sale and merchandise placement, samples, product displays, promotional programs at retail locations and meals, travel and entertainment. Amounts paid to customers in connection with these programs that were recorded as reductions to net revenue or as advertising, promotional and selling expenses totaled $85.0$106.4 million, $75.2$95.9 million and $55.5$126.1 million in fiscal year 2020, 2019years

37


2023, 2022, and 2018,2021, respectively. Estimates are based on historical and projected experience for each type of program or customer and have historically been in line with actual costs incurred.

Customer promotional discount programs are entered into with Distributors for certain periods of time. Amounts paid to Distributors in connection with these programs in fiscal years 2020, 20192023, 2022, and 20182021 were $59.3$62.6 million, $43.9$54.8 million and $34.5$72.7 million, respectively. The reimbursements for discounts to Distributors are recorded as reductions to net revenue. The agreed-upon discount rates are applied to certain Distributors’ sales to retailers, based on volume metrics, in order to determine the total discounted amount. The computation of the discount allowance requires that management make certain estimates and assumptions that affect the timing and amounts of revenue and liabilities recorded. Actual promotional discounts owed and paid have historically been in line with allowances recorded by the Company,Company; however, the amounts could differ from the estimated allowance.allowances.

Customer incentives and other payments are made primarily to Distributors based upon the performance of certain marketing and advertising activities. Depending on applicable state laws and regulations, these activities promoting the Company’s products may include, but are not limited to point-of-sale and merchandise placement, samples, product displays, promotional programs at retail locations and meals, travel and entertainment. Amounts paid to customers in connection with these programs in fiscal years 2020, 20192023, 2022, and 20182021 were $25.7$43.8 million, $31.2$41.1 million and $21.0$53.4 million, respectively. In fiscal 2020, 2019years 2023, 2022, and 2018,2021, the Company recorded certain of these costs in the total amount of $23.1$31.4 million, $21.6$29.9 million and $13.9$42.0 million, respectively as reductions to net revenue. Costs recognized in net revenues include, but are not limited to, promotional discounts, sales incentives and certain other promotional activities. Costs recognized in advertising, promotional and selling expenses include point of sale materials, samples and media advertising expenditures in local markets. These costs are recorded as incurred, generally when invoices are received; however certain estimates are required at the period end. Estimates are based on historical and projected experience for each type of program or customer and have historically been in line with actual costs incurred.

In connection with its preparation of financial statements and other financial reporting, management is required to make certain estimates and assumptions regarding the amount, timing and classification of expenditures resulting from these activities. Actual expenditures incurred could differ from management’s estimates and assumptions.


Stock-Based Compensation

The Company accounts for share-based awards in accordance with ASC Topic 718, Compensation – Stock Compensation (“(“ASC 718”), which generally requires recognition of share-based compensation costs in financial statements based on fair value. Compensation cost is recognized over the period during which an employee is required to provide services in exchange for the award (the requisite service period). The amount of compensation cost recognized in the consolidated statements of comprehensive income is based on the awards ultimately expected to vest, and therefore, reduced for estimated forfeitures. Stock-based compensation was $15.3$17.0 million, $12.3$14.0 million and $10.0$18.6 million in fiscal years 2020, 20192023, 2022, and 2018,2021, respectively.

As permitted by ASC 718, the Company elected to use a lattice model, such as the trinomial option-pricing model, to estimate the fair values of stock options. All option-pricing models require the input of subjective assumptions. These assumptions include the estimated volatility of the Company’s common stock price over the expected term, the expected dividend rate, the estimated post-vesting forfeiture rate, the risk-free interest rate and expected exercise behavior. See Note N of the Notes to Consolidated Financial Statements for further discussion of the application of the option-pricing models.

In addition, an estimated pre-vesting forfeiture rate is applied in the recognition of the compensation charge. Periodically, the Company grants performance-based stock options, related to which itoptions. The Company only recognizes compensation expense with respect to these options if it is probable that the performance targets will be met. Consequently, at the end of each reporting period, the Company estimates whether it is probable that performance targets will be met. Changes in the subjective assumptions and estimates can materially affect the amount of stock-based compensation expense recognized in the consolidated statements of comprehensive income.

Business Environment

38


The alcoholic beverage industry is highly regulated at the federal, state and local levels. The TTB and the Justice Department’s Bureau of Alcohol, Tobacco, Firearms and Explosives enforce laws under the Federal Alcohol Administration Act. The TTB is responsible for administering and enforcing excise tax laws that directly affect the Company’s results of operations. State and regulatory authorities have the ability to suspend or revoke the Company’s licenses and permits or impose substantial fines for violations. The Company has established strict policies, procedures and guidelines in efforts to ensure compliance with all applicable state and federal laws. However, the loss or revocation of any existing license or permit could have a material adverse effect on the Company’s business, results of operations, cash flows and financial position.

The High End category and the Beyond Beer category within the United States isare highly competitive due to large domestic and international brewers and the increasing number of craft brewers in this category who distribute similar products that have similar pricing and target drinkers. The Company believes that its pricing is appropriate given the quality and reputation of its brands, while realizing that economic pricing pressures may affect future pricing levels. Large domestic and international brewers are able to compete more aggressively than the Company, as they have substantially greater resources, marketing strength and distribution networks than the Company. The Company anticipates competition among domestic craft brewers will remain strong, as the number of craft brewers continues to grow. The Company also increasingly competes with wine and spirits companies, some of which have significantly greater resources than the Company. This competitive environment may affect the Company’s overall performance within the High End category. As the market matures and the High End category continues to consolidate, the Company believes that companies that are well-positioned in terms of brand equity, marketing and distribution will have greater success than those who do not. With its over 400300 Distributors nationwide and the Company’s sales force of approximately 515over 475 people, as well as a commitment to maintaining its innovation capability, brand equity and quality, the Company believes it is well positioned to compete in the High End Beer category.

The Potential Impact of Known Facts, Commitments, Events

Item 7A. Quantitative and UncertaintiesQualitative Disclosures About Market Risk

Contractual Obligations

See Note L of the Notes to Consolidated Financial Statements.

Recent Accounting Pronouncements

See Note B of the Notes to Consolidated Financial Statements.

Off-Balance Sheet Arrangements

The Company has not entered into any material off-balance sheet arrangements as of December 26, 2020.


Item 7A.

Quantitative and Qualitative Disclosures About Market Risk

In the ordinary course of business, the Company is exposed to the impact of fluctuations in foreign exchange rates. The Company does not enter into derivatives or other market risk sensitive instruments for the purpose of speculation or for trading purposes. Market risk sensitive instruments include derivative financial instruments, other financial instruments and derivative commodity instruments, such as futures, forwards, swaps and options, that are exposed to rate or price changes.

The Company enters into hops purchase contracts, as described in Note L ofM to the Notes to Consolidated Financial Statements within Part II, Item 8 of this Form 10-K, and makes purchases of other ingredients, equipment, and machinery and payments for commissions and marketing services to an international sales agent denominated in foreign currencies. The cost of these commitments changes as foreign exchange rates fluctuate. Currently, it is not the Company’s policy to hedge against foreign currency fluctuations.

The interest rate for borrowings under the Company’s credit facility is based on either (i) the Alternative Prime Rate (3.25% at December 26, 2020) or (ii) the applicable LIBORsecured overnight financing rate (0.15% at December 26, 2020)("SOFR") plus 0.45%1.1%, and therefore, subjects the Company to fluctuations in such rates. At December 30, 2023, the applicable SOFR was 5.4%. As of December 26, 2020,30, 2023, the Company had no amounts outstanding under its current line of credit.

Sensitivity Analysis

The Company applies a sensitivity analysis to reflect the impact of a 10% hypothetical adverse change in the foreign currency exchange rates. A potential adverse fluctuation in foreign currency exchange rates could negatively impact future cash flows by approximately $2.5$1.8 million as of December 26, 2020.30, 2023.

There are many economic factors that can affect volatility in foreign exchange rates. As such factors cannot be predicted, the actual impact on earnings due to an adverse change in the respective rates could vary substantially from the amounts calculated above.

39


Item 8. Financial Statements and Supplementary Data

40


Item 8.

Financial Statements and Supplementary Data


REPORT OF INDEPENDENT REGISTERED PUBLIC ACCOUNTING FIRM

To the shareholdersShareholders and the Board of Directors of

The Boston Beer Company, Inc.

Boston, Massachusetts

Opinion on the Financial Statements

We have audited the accompanying consolidated balance sheets of The Boston Beer Company, Inc. and subsidiaries (the "Company") as of December 26, 202030, 2023 and December 28, 2019,31, 2022, the related consolidated statements of comprehensive income, stockholders’ equity, and cash flows, for each of the three years in the period ended December 26, 2020,30, 2023, and the related notes. In our opinion, the financial statements present fairly, in all material respects, the financial position of The Boston Beer Company, Inc. and subsidiaries as of December 26, 202030, 2023 and December 28, 2019,31, 2022, and the results of its operations and its cash flows for each of the three years in the period ended December 26, 2020,30, 2023, in conformity with accounting principles generally accepted in the United States of America.

We have also audited, in accordance with the standards of the Public Company Accounting Oversight Board (United States) (PCAOB), the Company's internal control over financial reporting as of December 26, 2020,30, 2023, based on criteria established in Internal Control — Integrated Framework (2013) issued by the Committee of Sponsoring Organizations of the Treadway Commission and our report dated February 17, 2021,27, 2024, expressed an unqualified opinion on the Company's internal control over financial reporting.

Basis for Opinion

These financial statements are the responsibility of the Company's management. Our responsibility is to express an opinion on the Company's financial statements based on our audits. We are a public accounting firm registered with the PCAOB and are required to be independent with respect to the Company in accordance with the U.S. federal securities laws and the applicable rules and regulations of the Securities and Exchange Commission and the PCAOB.

We conducted our audits in accordance with the standards of the PCAOB. Those standards require that we plan and perform the audit to obtain reasonable assurance about whether the financial statements are free of material misstatement, whether due to error or fraud. Our audits included performing procedures to assess the risks of material misstatement of the financial statements, whether due to error or fraud, and performing procedures that respond to those risks. Such procedures included examining, on a test basis, evidence regarding the amounts and disclosures in the financial statements. Our audits also included evaluating the accounting principles used and significant estimates made by management, as well as evaluating the overall presentation of the financial statements. We believe that our audits provide a reasonable basis for our opinion.

Critical Audit Matter

The critical audit matter communicated below is a matter arising from the current-period audit of the financial statements that was communicated or required to be communicated to the audit committee and that (1) relates to accounts or disclosures that are material to the financial statements and (2) involved our especially challenging, subjective, or complex judgments. The communication of critical audit matters does not alter in any way our opinion on the financial statements, taken as a whole, and we are not, by communicating the critical audit mattermatters below, providing a separate opinion on the critical audit mattermatters or on the accounts or disclosures to which it relates.

Dogfish Head brand NameTrademark Intangible — Refer to NoteNotes B, H, and N to the financial statements

Critical Audit Matter Description

The Company has an indefinite lived intangible asset consisting of the Dogfish Head Brand NameTrademark (the “brand intangible asset”“trademark”). As of December 26, 2020, the carrying valueThe Company's evaluation of the brand intangible asset was $98.5 million.trademark for impairment involves the comparison of the fair value to its' carrying value. Management estimates the fair value of the brand intangible assettrademark annually on its elected assessment date which is the last daySeptember 1st of the Company’s Augusteach fiscal month,year, or more often if impairment indicators are present, using the relief-from-royalty method, which is a specific discounted cash flow method.  The results of the impairment test indicated the estimated fair value of the brand intangible asset was in excess of the carrying value, and accordingly, no impairment existed. The determination of fair value requires management to make significant estimates and assumptions related to forecasts of futureforecasted revenues, including growth rates, for a 10-year time period,the royalty rates, discount ratesrate, and the overall methodologiesdiscount rate used to estimate the net presentfair value of the brand intangibletrademark asset. Changes in these assumptions could have a significant impact on the fair value of the trademark and the amount of any impairment charge. As of December 30, 2023, the carrying value of the trademark was $55.6 million. During the year ended December 30, 2023, the Company recognized an impairment charge of $15.8 million related to the trademark, since its fair value was lower than its carrying value.


41


We identified the valuation of the brand intangible assettrademark as a critical audit matter because of the significant judgments and assumptions management makes in estimating the fair value of the brand intangible asset.trademark. This required a high degree of auditor judgment and an increased extent of effort including the need to involve our fair value specialists, when performing audit procedures to evaluate the reasonableness of management’s forecasted revenues, the selection of the royalty rate and the selection of the discount rate, including the need to involve our fair value specialists.

How the Critical Audit Matter Was Addressed in the Audit

Our audit procedures related to the forecasted revenues, the selected royalty rate, and the selected discount rate utilized in estimating the fair value of the trademark included the following, among others:

We tested the effectiveness of controls over management’s trademark impairment evaluation, including those over the determination of the fair value of the trademark, such as controls related to management’s forecasts of future revenue, and the selection of the royalty rate and the discount rate.

We evaluated management’s ability to accurately forecast revenues by comparing actual revenues to management’s historical forecasts.

We evaluated the reasonableness of management’s forecasts by comparing forecasted revenues to:

The Company’s business strategies and growth plans including consideration of the effects of new products;
Historical results and trends; and
Industry reports.

With the assistance of our fair value specialists, we evaluated the reasonableness of the valuation methodology and management’s assumptions including the royalty rate and the discount rate by:

Testing the source information underlying the determination of the royalty rate, the discount rate, and the overall valuation methodologies utilized.

Howmathematical accuracy of the Critical Audit Matter Was Addressed incalculations.

Developing a range of independent estimates for the Audit

Our audit procedures relateddiscount rate and comparing those to the forecasts of future revenue and selection of the royalty rate, discount rate as well as the methodologies utilized in the valuation models in estimating the fair value of the brand name intangible asset included the following, among others:selected by management.

We tested the effectiveness of controls over management’s intangible asset impairment evaluation, including those over the determination of the fair value of the brand intangible asset, such as controls related to management’s forecasts of future revenue and the selection of the royalty rate and discount rate.

We evaluated management’s ability to accurately forecast future revenues by comparing actual revenues to management’s historical forecasts.

We evaluated the reasonableness of management’s forecasts of future revenues by:

Comparing the projections of future revenues to historical results and internal communications to management and the Board of Directors.

Assessing the reasonableness of the projected revenue mix based on historical revenue mix and the Company’s ongoing investments in the brand.

Calculating independent revenue projections based on objectively verifiable information and comparing to management’s revenue projections.

With the assistance of our fair value specialists, we evaluated the reasonableness of the management’s forecast of future revenues and the selection of the royalty rate, discount rate, and valuation methodologies by:

Testing the source information underlying a) the determination of revenue growth projections, specifically the long-term growth rate b) the royalty rate and discount rate and c) testing the mathematical accuracy of the calculation.

Developing a range of independent estimates for the discount rate and comparing those to the discount rate selected by management.

/s/ Deloitte & Touche LLP

Boston, Massachusetts

February 17, 202127, 2024

We have served as the Company’s auditor since 2015.


42


THE BOSTON BEER COMPANY, INC. AND SUBSIDIARIES

CONSOLIDATED STATEMENTS OF COMPREHENSIVE INCOME

(in thousands, except per share data)


Year Ended


Year Ended


December 30,
2023


December 31,
2022


December 25,
2021


December 26,

2020


December 28,

2019


December 29,

2018


Revenue


$

1,851,813


$

1,329,108


$

1,057,495


$

2,133,292


$

2,222,667


$

2,196,650


Less excise taxes


115,381


79,284


61,846


124,667


132,333


139,028


Net revenue


1,736,432


1,249,824


995,649


2,008,625


2,090,334


2,057,622


Cost of goods sold


921,980


635,658


483,406


1,156,256


1,228,348


1,259,830


Gross profit


814,452


614,166


512,243


852,369


861,986


797,792


Operating expenses:


Advertising, promotional and selling expenses


447,568


355,613


304,853


Advertising, promotional, and selling expenses


555,998


578,400


606,994


General and administrative expenses


118,211


112,730


90,857


174,548


157,534


133,624


Impairment of assets


4,466


911


652


Impairment of intangible assets


16,426


27,100


Impairment of brewery assets


5,396


2,782


18,499


Contract termination costs and other


5,379


30,678


Total operating expenses


570,245


469,254


396,362


752,368


771,195


789,795


Operating income


244,207


144,912


115,881


100,001


90,791


7,997


Other income (expense), net:


Interest (expense) income, net


(199

)


647


1,292


Other income (expense), net


222


(1,189

)


(887

)

Other income (expense):


Interest income (expense), net


10,995


2,561


(110

)

Other expense, net


(1,408

)


(1,916

)


(978

)

Total other income (expense), net


23


(542

)


405


9,587


645


(1,088

)

Income before provision for income tax


244,230


144,370


116,286


Provision for income taxes


52,270


34,329


23,623


Income before income tax provision


109,588


91,436


6,909


Income tax provision (benefit)


33,338


24,173


(7,644

)

Net income


$

191,960


$

110,041


$

92,663


$

76,250


$

67,263


$

14,553


Net income per common share - basic


$

15.73


$

9.26


$

7.90


$

6.23


$

5.46


$

1.19


Net income per common share - diluted


$

15.53


$

9.16


$

7.82


$

6.21


$

5.44


$

1.17


Weighted-average number of common shares - Class A basic


9,734


8,908


8,620


Weighted-average number of common shares - Class B basic


2,396


2,873


3,002


Weighted-average number of common shares - basic


12,243


12,317


12,280


Weighted-average number of common shares - diluted


12,283


11,908


11,734


12,258


12,345


12,436


Net income


$

191,960


$

110,041


$

92,663


$

76,250


$

67,263


$

14,553


Other comprehensive income (loss) , net of tax:


Currency translation adjustment


25


47


25


Other comprehensive income (loss):


Foreign currency translation adjustment


166


(269

)


(32

)

Defined benefit plans liability adjustment


1,392


(519

)


277


(13

)


253


90


Impact of ASU 2018-02


(211

)

Total other comprehensive income (loss), net of tax:


1,417


(472

)


91


Total other comprehensive income (loss), net of tax


153


(16

)


58


Comprehensive income


$

193,377


$

109,569


$

92,754


$

76,403


$

67,247


$

14,611


The accompanying notes are an integral part of these consolidated financial statements.


43


THE BOSTON BEER COMPANY, INC. AND SUBSIDIARIES

CONSOLIDATED BALANCE SHEETS

(in thousands, except share data)


December 30,
2023


December 31,
2022


Assets


Current Assets:


Cash and cash equivalents


$

298,491


$

180,560


Accounts receivable


66,997


56,672


Inventories


115,773


148,450


Prepaid expenses and other current assets


20,538


27,461


Income tax receivable


1,711


10,126


Total current assets


503,510


423,269


Property, plant, and equipment, net


642,509


667,909


Operating right-of-use assets


35,559


43,768


Goodwill


112,529


112,529


Intangible assets


59,644


76,324


Third-party production prepayments


33,581


61,339


Other assets


42,661


35,635


Total assets


$

1,429,993


$

1,420,773


Liabilities and Stockholders' Equity


Current Liabilities:


Accounts payable


$

87,245


$

84,248


Accrued expenses and other current liabilities


126,930


111,153


Current operating lease liabilities


9,113


8,866


Total current liabilities


223,288


204,267


Deferred income taxes, net


85,721


96,592


Non-current operating lease liabilities


36,161


45,274


Other liabilities


6,894


6,091


Total liabilities


352,064


352,224


Commitments and Contingencies (See Note M)


Stockholders' Equity:


Class A Common Stock, $0.01 par value; 22,700,000 shares authorized; 10,033,303
   and
10,238,009 issued and outstanding as of December 30, 2023 and
   December 31, 2022, respectively


100


102


Class B Common Stock, $0.01 par value; 4,200,000 shares authorized; 2,068,000
   issued and outstanding at December 30, 2023 and December 31, 2022


21


21


Additional paid-in capital


656,297


629,515


Accumulated other comprehensive loss


(57

)


(210

)

Retained earnings


421,568


439,121


Total stockholders' equity


1,077,929


1,068,549


Total liabilities and stockholders' equity


$

1,429,993


$

1,420,773


The accompanying notes are an integral part of these consolidated financial statements


December 26,

2020


December 28,

2019


Assets


Current Assets:


Cash and cash equivalents


$

163,282


$

36,670


Accounts receivable


78,358


54,404


Inventories


130,910


106,038


Prepaid expenses and other current assets


30,230


12,077


Income tax receivable


10,393


9,459


Total current assets


413,173


218,648


Property, plant and equipment, net


623,083


541,068


Operating right-of-use assets


58,483


53,758


Goodwill


112,529


112,529


Intangible assets


103,930


104,272


Other assets


67,627


23,782


Total assets


$

1,378,825


$

1,054,057


Liabilities and Stockholders’ Equity


Current Liabilities:


Accounts payable


$

121,647


$

76,374


Accrued expenses and other current liabilities


129,544


99,107


Current operating lease liabilities


8,232


5,168


Total current liabilities


259,423


180,649


Deferred income taxes


92,665


75,010


Non-current operating lease liabilities


59,171


53,940


Other liabilities


10,599


8,822


Total liabilities


421,858


318,421


Commitments and Contingencies (See Note L)


Stockholders’ Equity:


Class A Common Stock, $.01 par value; 22,700,000 shares authorized;

10,004,681 and 9,370,526 shares issued and outstanding as of December 26,

   2020 and December 28, 2019, respectively


100


94


Class B Common Stock, $.01 par value; 4,200,000 shares authorized;

   2,177,983 and 2,672,983 shares issued and outstanding as of December 26,

   2020 and December 28, 2019, respectively


22


27


Additional paid-in capital


599,737


571,784


Accumulated other comprehensive loss, net of tax


(252

)


(1,669

)

Retained earnings


357,360


165,400


Total stockholders’ equity


956,967


735,636


Total liabilities and stockholders’ equity


$

1,378,825


$

1,054,057


44


THE BOSTON BEER COMPANY, INC. AND SUBSIDIARIES

CONSOLIDATED STATEMENTS OF STOCKHOLDERS’ EQUITY

For the Years Ended December 30, 2023, December 31, 2022, and December 25, 2021

(in thousands)


Class A


Accumulated


Class A


Common


Class B


Class B


Additional


Other


Total


Common


Stock,


Common


Common


Paid-in


Comprehensive


Retained


Stockholders’


Shares


Par


Shares


Stock, Par


Capital


Loss


Earnings


Equity


Balance at December 26, 2020


10,005


$

100


2,178


$

22


$

599,737


$

(252

)


$

357,360


$

956,967


Net income


14,553


14,553


Stock options exercised and restricted
   shares activities


69


1


(6,730

)


(6,729

)

Stock-based compensation expense


18,615


18,615


Conversion from Class B to Class A


110


1


(110

)


(1

)


Defined benefit plans liability adjustment, net of tax of ($20)


90


90


Impact of ASU 2019-12


$

(55

)


(55

)

Foreign currency translation adjustment


$

(32

)


(32

)

Balance at December 25, 2021


10,184


$

102


2,068


$

21


$

611,622


$

(194

)


$

371,858


$

983,409


Net income


67,263


67,263


Stock options exercised and restricted
   shares activities


54


3,905


3,905


Stock-based compensation expense


13,988


13,988


Defined benefit plans liability adjustment, net of tax of ($95)


253


253


Foreign currency translation adjustment


(269

)


(269

)

Balance at December 31, 2022


10,238


$

102


2,068


$

21


$

629,515


$

(210

)


$

439,121


$

1,068,549


Net income


76,250


76,250


Repurchase and retirement of Class A Common Stock


(276

)


(2

)


(93,803

)


(93,805

)

Stock options exercised and restricted
   shares activities


71


9,811


9,811


Stock-based compensation expense


16,971


16,971


Defined benefit plans liability adjustment, net of tax of $1


(13

)


(13

)

Foreign currency translation adjustment


166


166


Balance at December 30, 2023


10,033


$

100


2,068


$

21


$

656,297


$

(57

)


$

421,568


$

1,077,929


The accompanying notes are an integral part of these consolidated financial statements.


45


THE BOSTON BEER COMPANY, INC. AND SUBSIDIARIES

CONSOLIDATED STATEMENTS OF STOCKHOLDERS’ EQUITYCASH FLOWS

For the Years Ended December 26, 2020, December 28, 2019, and December 29, 2018

(in thousands)


Class A

Common

Shares


Class A

Common

Stock,

Par


Class B

Common

Shares


Class B

Common

Stock,

Par


Additional

Paid-in

Capital


Accumulated

Other

Comprehensive

Loss, net of tax


Retained

Earnings


Total

Stockholders’

Equity


Balance at December 30, 2017


8,603


$

86


3,018


$

30


$

372,590


$

(1,288

)


$

52,105


$

423,523


Net income


92,663


92,663


Stock options exercised and

   restricted shares activities


227


2


23,086


23,088


Stock-based compensation expense


10,035


10,035


Repurchase of Class A Common

   Stock


(350

)


(3

)


(88,309

)


(88,312

)

Conversion from Class B to Class A


100


1


(100

)


(1

)


Defined benefit plans liability

   adjustment, net of tax of $93


277


277


Currency translation adjustment


25


25


One time effect of adoption of ASU

   2014-09, Revenue from Contracts

   with Customers, net of tax of

   $329


(982

)


(982

)

One time effect of adoption of ASU

   2018-02, Reclassification of

   Certain Tax Effects from

   Accumulated Other

   Comprehensive Income


(211

)


211


Balance at December 29, 2018


8,580


$

86


2,918


$

29


$

405,711


$

(1,197

)


$

55,688


$

460,317


Net income


110,041


110,041


Stock options exercised and

   restricted shares activities


116


1


8,998


8,999


Stock-based compensation expense


12,337


12,337


Shares issued in connection with

   Dogfish Head merger


430


5


144,738


144,743


Conversion from Class B to Class A


245


2


(245

)


(2

)


Defined benefit plans liability

   adjustment, net of tax of $176


(519

)


(519

)

Adoption of ASU 2014-09,

   Revenue from Contracts

   with Customers, tax adjustment


(329

)


(329

)

Currency translation adjustment


47


47


Balance at December 28, 2019


9,371


$

94


2,673


$

27


$

571,784


$

(1,669

)


$

165,400


$

735,636


Net Income


$

191,960


$

191,960


Stock options exercised and

   restricted shares activities


139


1


12,671


12,672


Stock-based compensation expense


15,282


15,282


Conversion from Class B to Class A


495


5


(495

)


(5

)


-


Defined benefit plans liability

   adjustment, net of tax of $467


1,392


1,392


Currency translation adjustment


25


25


Balance at December 26, 2020


10,005


$

100


2,178


$

22


$

599,737


$

(252

)


$

357,360


$

956,967


Year Ended


December 30,
2023


December 31,
2022


December 25,
2021


Cash flows provided by operating activities:


Net income


$

76,250


$

67,263


$

14,553


Adjustments to reconcile net income to net cash provided by operating activities:


Depreciation and amortization


88,141


81,356


72,096


Impairment of intangible asset


16,426


27,100


Impairment of brewery assets


5,396


2,782


18,499


Change in right-of-use assets


7,678


7,972


8,018


Stock-based compensation expense


16,971


13,988


18,615


Deferred income taxes


(10,871

)


9,097


(5,225

)

Other non-cash expense (income)


224


89


(399

)

Changes in operating assets and liabilities:


Accounts receivable


(10,340

)


(2,042

)


23,071


Inventories


31,500


131


(21,224

)

Prepaid expenses, income tax receivable, and other current assets


13,979


38,652


(49,073

)

Third-party production prepayments


27,758


26,955


(16,635

)

Other assets


(5,849

)


(14,031

)


(5,699

)

Accounts payable


2,763


(2,219

)


(27,361

)

Accrued expenses, other current liabilities, and other liabilities


13,884


(50,632

)


35,290


Operating lease liabilities


(8,759

)


(6,516

)


(8,229

)

Net cash provided by operating activities


265,151


199,945


56,297


Cash flows used in investing activities:


Purchases of property, plant, and equipment


(64,087

)


(90,582

)


(147,919

)

Proceeds from sale of property, plant, and equipment


1,709


2,076


1,157


Other investing activities


145


Net cash used in investing activities


(62,378

)


(88,506

)


(146,617

)

Cash flows (used in) provided by financing activities:


Repurchases and retirement of Class A common stock


(92,877

)


Proceeds from exercise of stock options and sale of investment shares


11,723


7,946


10,465


Net cash paid on finance leases and notes payable


(1,575

)


(1,672

)


(1,570

)

Payment of tax withholding on stock-based payment awards and investment shares


(2,113

)


(3,474

)


(15,536

)

Line of credit borrowings


30,000


Line of credit repayments


(30,000

)


Net cash (used in) provided by financing activities


(84,842

)


2,800


(6,641

)

Change in cash and cash equivalents and restricted cash


117,931


114,239


(96,961

)

Cash and cash equivalents and restricted cash at beginning of period


180,560


66,321


163,282


Cash and cash equivalents and restricted cash at end of period


$

298,491


$

180,560


$

66,321


Supplemental disclosure of cash flow information:


Income tax (payments) refunds, net


$

(35,728

)


$

28,144


$

(41,221

)

Cash paid for amounts included in measurement of lease liabilities


Operating cash outflows from operating leases


$

10,483


$

8,510


$

10,495


Operating cash outflows from finance leases


$

138


$

71


$

121


Financing cash outflows from finance leases


$

1,575


$

1,598


$

1,499


Right-of-use-assets obtained in exchange for operating lease obligations


$

(107

)


$

(827

)


$

2,309


Right-of-use-assets obtained in exchange for finance lease obligations


$

2,825


$

-


$

472


Increase (decrease) in accounts payable and accrued expenses for purchases of property, plant, and equipment


$

1,107


$

1,045


$

(15,824

)

Non-cash financing activity – accrued excise taxes on share repurchases


$

929


$

-


$

-


Supplemental disclosure of cash, cash equivalents and restricted cash


As of


December 30,
2023


December 31,
2022


December 25,
2021


Cash and cash equivalents


$

298,491


$

180,560


$

26,853


Restricted cash


39,468


Total cash, cash equivalents and restricted cash shown in the statements of cash flows


$

298,491


$

180,560


$

66,321


The accompanying notes are an integral part of these consolidated financial statements.


46


THE BOSTON BEER COMPANY, INC. AND SUBSIDIARIES

CONSOLIDATED STATEMENTS OF CASH FLOWS

(in thousands)


Year Ended


December 26,

2020


December 28,

2019


December 29,

2018


Cash flows provided by operating activities:


Net income


$

191,960


$

110,041


$

92,663


Adjustments to reconcile net income to net cash provided by operating activities:


Depreciation and amortization


65,657


56,271


51,968


Impairment of assets


4,466


911


652


(Gain) loss on disposal of property, plant and equipment


(639

)


871


64


Change in ROU assets


7,355


4,207


Bad debt expense


488


45


2


Stock-based compensation expense


15,282


12,337


10,035


Deferred income taxes


17,655


7,404


14,350


Changes in operating assets and liabilities:


Accounts receivable


(24,014

)


(12,260

)


(1,636

)

Inventories


(24,463

)


(24,932

)


(21,312

)

Prepaid expenses, income tax receivable and other current assets


(19,411

)


(1,530

)


(552

)

Other assets


(44,322

)


(12,332

)


Accounts payable


40,771


21,417


6,352


Accrued expenses and other current liabilities


24,469


18,618


10,130


Change in operating lease liability


(3,786

)


(3,277

)


Other liabilities


1,939


451


731


Net cash provided by operating activities


253,407


178,242


163,447


Cash flows used in investing activities:


Purchases of property, plant and equipment


(139,996

)


(93,233

)


(55,460

)

Proceeds from sale of property, plant and equipment


487


165


27


Cash paid for acquisition of intangible assets


(50

)

Investment in Dogfish Head, net of cash acquired


(165,517

)


Other investing activities


392


(244

)


139


Net cash used in investing activities


(139,117

)


(258,829

)


(55,344

)

Cash flows provided by (used in) financing activities:


Repurchase of Class A Common Stock


(88,312

)

Proceeds from exercise of stock options and sale of investment shares


15,274


9,236


23,049


Net cash paid on note payable and finance leases


(1,260

)


(378

)


(78

)

Cash borrowed on line of credit


100,000


97,000


Cash paid on line of credit


(100,000

)


(97,000

)


Payment of tax withholdings on stock-based payment awards and investment shares


(1,692

)


0


Net cash provided by (used in) financing activities


12,322


8,858


(65,341

)

Change in cash and cash equivalents


126,612


(71,729

)


42,762


Cash and cash equivalents at beginning of year


36,670


108,399


65,637


Cash and cash equivalents at end of period


$

163,282


$

36,670


$

108,399


Supplemental disclosure of cash flow information:


Non cash consideration issued in Dogfish Head Transaction


$


$

144,743


$


Income taxes paid


$

36,032


$

30,760


$

11,353


Income taxes refunded


$

60


$

18


$

5,000


Cash paid for amounts included in measurement of lease liabilities


Operating cash flows from operating leases


$

6,194


$

4,696


$


Operating cash flows from finance leases


$

143


$

56


$


Financing cash flows from finance leases


$

1,192


$

313


$


Right-of-use assets obtained in exchange for operating lease obligations


$

12,081


$

57,966


$


Right-of-use assets obtained in exchange for finance lease obligations


$

2,689


$

2,837


$


Interest paid on revolving credit facility


$

246


$

451


$


Change in purchase of property, plant and equipment in accounts payable and accrued expenses


$

9,387


$

6,632


$

2,609


The accompanying notes are an integral part of these consolidated financial statements.


THE BOSTON BEER COMPANY, INC. AND SUBSIDIARIES

NOTES TO CONSOLIDATED FINANCIAL STATEMENTS

December 26, 202030, 2023

A. Organization and Basis of Presentation

A.

Organization and Basis of Presentation

The Boston Beer Company, Inc. and certain subsidiaries (the “Company”) are engaged in the business of selling alcohol beverages throughout the United States and in selected international markets, under the trade namestrademarks “The Boston Beer Company®Company®”, “Twisted Tea Brewing Company®Company®”, “Hard Seltzer Beverage Company”, “Angry Orchard®Orchard® Cider Company”, “Dogfish Head®Head® Craft Brewery”, “Dogfish Head Distilling Co.”, “Angel City®City® Brewing Company”, “Concrete Beach Brewery®”, “Coney Island®Island® Brewing Company” and, "Green Rebel Brewing Co.", "Truly Distilling Co.", “American Fermentation Company”, “General Admission Brewing Co.”, “TeaPot Worldwide”, and “Sun Cruiser Beverage Co.".

B. Summary of Significant Accounting Policies

B.

Summary of Significant Accounting Policies

Fiscal Year

The Company’s fiscal year is a fifty-two or fifty-three-week period ending on the last Saturday in December. The 2020, 20192023 and 20182021 fiscal years all consisted of fifty-two weeks, while the 2022 fiscal year was fifty-three weeks.

Principles of Consolidation

The accompanying consolidated financial statements include the accounts of the Company and its subsidiaries, all of which are wholly-owned. All intercompany transactions and balances have been eliminated in consolidation.

Use of Estimates

The preparation of thecondensed consolidated financial statements in conformity with U.S.United States generally accepted accounting principles (“GAAP”) requires management to make estimates and assumptions that affect the reported amounts of assets and liabilities during the reporting periods, the reported amounts of revenue and expenses during the reporting periods and the disclosure of contingent assets and liabilities at the date of the financial statementsstatements. On an ongoing basis, the Company bases estimates and assumptions on historical experience, currently available information, and various other factors that management believes to be reasonable under the reported amounts of revenue and expenses during the reporting period.circumstances. Actual results couldmay differ materially from those estimates.

COVID-19

these estimates and assumptions. The Company began seeing the impact of the COVID-19 pandemic on its business in early March 2020.  The direct financial impact of the pandemic has primarily shown in significantly reduced keg demand from the on-premise channel and higher labor and safety-related costs at the Company’s breweries. In fiscal year 2020, shipments of kegs decreased to 3% of total shipment volume from 11% of shipments in 2019.  Also, in fiscal year 2020,accounting policies which the Company recorded COVID-19 related pre-tax reductions in netbelieves involve the most significant application of judgment or involve complex estimations are inventories and associated reserves, revenue reserves, assumptions surrounding the recoverability of long-lived assets, and increases in other costs that total $16.0 million.  In addition to these direct financial impacts, COVID-19 related safety measures resulted in a reduction of brewery productivity. This has shifted more volume to third-party breweries, which increased production costs and negatively impacted gross margins.  The Company will continue to assess and manage this situation and will provide a further update in each quarterly earnings release, to the extent that the effects of the COVID-19 pandemic are then known more clearly.income taxes.

Cash and Cash Equivalents

Cash and cash equivalents at December 26, 202030, 2023 and December 28, 201931, 2022 included cash on-hand and money market instruments that are highly liquid investments. Cash and cash equivalents are carried at cost, which approximates fair value.value.

Accounts Receivable and Allowance for Doubtful AccountsCredit Losses

The Company’s accounts receivable primarily consist of trade receivables. The Company records an allowance for doubtful accountscredit losses that is based on historical trends, customer knowledge, any known disputes, and the aging of the accounts receivable balances combined with management’s estimate of future potential recoverability. Receivables are written off against the allowance after all attempts to collect a receivable have failed. The Company believes its allowanceallowances for doubtful accountscredit losses as of December 26, 202030, 2023 and December 28, 201931, 2022 are adequate, but actual write-offslosses could exceed the recorded allowance.


Concentrations of Credit Risk

Financial instruments that potentially subject the Company to concentrations of credit risk consist principally of cash equivalents, restricted cash, and trade receivables. The Company places its cash equivalents with high credit quality financial institutions. As of December 26, 2020,30, 2023, the Company’s cash and cash equivalents were primarily invested in investment-grade, highly liquid U.S. government agency corporatea “Triple A” rated money market accounts.fund.

The Company sells primarily to a network of independent wholesalers in the United States and to a network of foreign wholesalers, importers or other agencies (collectively referred to as “Distributors”). In 2020, 20192023, 2022, and 2018,2021, sales to foreign

47


Distributors were approximately 4% of total sales. Receivables arising from thesethe Company's sales are not collateralized; however, credit risk is minimized as a result of the large and diverse nature of the Company’s customer base. There were 0no individual customer accounts receivable balances outstanding at December 26, 202030, 2023 or December 28, 201931, 2022 that were in excess of 10% of the gross accounts receivable balance on those dates. NaNNo individual customers represented more than 10% of the Company’s revenues in fiscal years 2020, 2019,2023, 2022, or 2018.2021.

Financial Instruments and Fair Value of Financial Instruments

The Company’s primary financial instruments at December 26, 202030, 2023 and December 28, 201931, 2022 consisted of cash equivalents, restricted cash, accounts receivable, and accounts payable. The Company determines the fair value of its financial assets and liabilities in accordance with Financial Accounting Standards Board (“FASB”) Accounting Standards Codification (“ASC”) Topic 820, Fair Value Measurements and Disclosures (“ASC 820”). The Company believes that the carrying amount of its cash equivalents, restricted cash, accounts receivable, and accounts payable approximates fair value due to the short-term nature of these assets and liabilities. The Company is not exposed to significant interest, currency or credit risks arising from these financial assets and liabilities.

Inventories and Provision for Excess or Expired Inventory

Inventories consist of raw materials and packaging materials, work in process and finished goods. Raw materials, which principally consist of flavorings, hops, malt, apple juice,fruit juices, other brewing materials and packaging, are stated at the lower of cost (first-in, first-out basis) or net realizable value. The Company’s goal is to maintain on-hand a supply of approximately two years for essential hop varieties, in order to limit the risk of an unexpected reduction in supply. Inventories are generally classified as current assets. The Company classifies hops inventory in excess of two years of forecasted usage in other long-term assets. The cost elements of work in process and finished goods inventory consist of raw materials, direct labor and manufacturing overhead. Packaging design costs are expensed as incurred. The Company enters into multi-year purchase commitments in order to secure adequate supply of ingredients and packaging, to brew and package its products. Inventory on hand and under purchase commitments totaled approximately $285.0 million at December 26, 2020.

The provisions for excess or expired inventory are based on management’s estimates of forecasted usage of inventories on hand and under contract.hand. Forecasting usage involves significant judgments regarding future demand for the Company’s various existing products and products under development as well as the potency and shelf-life of various ingredients.raw material ingredients and finished goods. A significant change in the timing or level of demand for certain products as compared to forecasted amounts may result in recording additional provisions for excess or expired inventory in the future. Provisions for excess inventory are included in cost of goods sold and have historically been adequate to cover incurred inventory losses. Provision for excess or expired inventory included in cost of goods sold was $11.3$19.3 million, $8.1$35.9 million, and $4.2$62.6 million in fiscal years 2020, 2019,2023, 2022, and 20182021 respectively.


48


Property, Plant and Equipment

Property, plant, and equipment are stated at cost or fair value as of the date of acquisition. Expenditures for repairs and maintenance are expensed as incurred. Major renewals and betterments that extend the life of the property are capitalized. Depreciation is computed using the straight-line method based upon the estimated useful lives of the underlying assets as follows:

��

Kegs

5 years

Computer software and equipment

2 to 5 years

Office equipment and furniture

3 to 7 years

Machinery and plant equipment

3 to 20 years or the term of the production agreement, whichever is shorter

Leasehold improvements

Lesser of the remaining term of the lease or estimated useful life of the asset

Building and building improvements

12 to 20 years, or the remaining useful life of the building, whichever is shorter

The carrying value of property, plant and equipment, net of accumulated depreciation, at December 26, 2020 was $623.1 million. For purposes of determining whether there are any impairment losses on brewery assets, as further discussed below, management has historically examined the carrying value of the Company’s identifiable long-lived assets, including their useful lives, semi-annually, or more frequently when indicators of impairment are present. Evaluations of whether indicators of impairment exist involve judgments regarding the current and future business environment and the length of time the Company intends to use the asset. If an impairment loss is identified based on the fair value of the asset, as compared to the carrying value of the asset, such loss would be charged to expense in the period the impairment is identified. Furthermore, if the review of the carrying values of the long-lived assets indicates impairment of such assets, the Company may determine that shorter estimated useful lives are more appropriate. In that event, the Company will be required to record additional depreciation in future periods, which will reduce earnings. Estimating the amount of impairment, if any, requires significant judgments including identification of potential impairments, market comparison to similar assets, estimated cash flows to be generated by the asset, discount rates, and the remaining useful life of the asset.asset, and the usefulness of the asset in consideration of future business plans. Impairment of brewery assets classified as property, plant, and equipment included in operating expenses was $4.4$5.0 million, $0.9$2.6 million and $0.7$18.5 million in fiscal years 2020, 20192023, 2022, and 2018,2021, respectively.

Factors generally considered important which could trigger an impairment review on the carrying value of long-lived assets include the following: (1) significant underperformance relative to historical or projected future operating results; (2) significant changes in the manner of use of acquired assets or the strategy for the Company’s overall business; (3) underutilization of assets; and (4) discontinuance of products by the Company or its customers. The Company believes that the carrying value of its long-lived assets as of December 26, 2020 and December 28, 2019 was realizable.

Segment Reporting

The Company consists of one operating segment that produces and sells alcohol beverages under the Company’s Truly Hard Seltzer, Twisted Tea, Samuel Adams, , Angry Orchard, Dogfish Head, Angel City, Coney Island, and Concrete Beach,various brands. All brands are predominantly beverages that are manufactured using similar production processes, have comparable alcohol content, generally fall under the same regulatory environment, and are sold to the same types of customers in similar size quantities at similar price points, with similar profit margins, and through the same channels of distribution.

Goodwill and Intangible Assets

The Company does not amortize goodwill and tradenamehas recorded intangible assets but evaluateswith indefinite lives and goodwill for which impairment testing is required at least annually or more frequently if events or circumstances indicate that these assets might be impaired. The Company performs its annual impairment tests and re-evaluates the recoverabilityuseful lives of other intangible assets with indefinite lives at the annual impairment test measurement date in the third quarter of each fiscal year or when circumstances arise that indicate a possible impairment or change in useful life might exist.

The Company’s annual goodwill impairment evaluation analysis conducted at the end of fiscal August indicated that the fair value of the Company’s goodwill was substantially greater than the carrying value and accordingly there was no impairment to record during fiscal 2023. The guidance for goodwill impairment testing allows an entity to assess qualitative factors to determine whether the existence of events or circumstances leads to a determination that it is more likely than not that the estimated fair value of a reporting unit, of which the Company has one, is less than its carrying amount or to proceed directly to performing a quantitative impairment test. Under the quantitative assessment, the estimated fair value of the Company’s

49


reporting unit is compared to its carrying value, including goodwill. The estimate of fair value of the Company’s reporting unit is generally calculated based on an income approach using the discounted cash flow method supplemented by the market approach which considers the Company’s market capitalization and enterprise value. If the estimated fair value of the Company’s reporting unit is less than the carrying value of its reporting unit, a goodwill impairment will be recognized. In estimating the fair value of the Company’s reporting unit, management must make assumptions and projections regarding such items as future cash flows, future revenues, future earnings, cost of capital, and other factors. The assumptions used in the estimate of fair value are based on historical trends and the projections and assumptions that are used in the latest operating plans. These assumptions reflect management’s estimates of future economic and competitive conditions and are, therefore, subject to change as a result of changing market conditions. If these estimates or their related assumptions change in the future, the Company may be required to recognize an impairment loss for the Company’s goodwill which could have a material adverse impact on the Company’s financial statements.

The Company’s intangible assets consist primarily of a trademark and customer relationships obtained through the Company’s Dogfish Head acquisition. Customer relationships are amortized over their estimated useful lives. The Dogfish Head trademark which was determined to have an indefinite useful life is not amortized. The guidance for indefinite lived intangible asset impairment testing allows an entity to assess qualitative factors to determine whether the existence of events or circumstances indicates that it is more likely than not that the indefinite lived intangible asset is impaired or to proceed directly to performing the quantitative impairment test. Under the quantitative assessment, the trademark is evaluated for impairment by comparing the carrying value andof the trademark to its estimated fair value. The estimated fair value of the trademark is calculated based on an income approach using the relief from royalty method. If the estimated fair value is less than the carrying value of the trademark, then an impairment charge is recognized to reduce the carrying value of the trademark to its estimated fair value.

Significant judgment is required to estimate the fair value annually at the endDogfish Head trademark. Accordingly, the Company obtains the assistance of third-party valuation specialists as part of the fiscal monthimpairment evaluation. In estimating the fair value of August, or more frequently when indicatorsthe trademark, management must make assumptions and projections regarding future cash flows based upon future revenues, the market-based royalty rate, the discount rate, the tax rate and other factors. These assumptions reflect management’s estimates of impairmentfuture economic and competitive conditions and consider many factors including macroeconomic conditions, industry growth rates, and competitive activities. The assumptions and projections used in the estimate of fair value are present. Theconsistent with those used in current operating plans and the Company has concluded that its goodwill and intangible assets were not impaired as of December 26, 2020 and December 28, 2019. Customer relationship intangible assetsbelieves they are amortized over the useful life of fifteen years. As of December 26, 2020, and December 28, 2019, goodwill amounted to $112.5 million. As of December 26, 2020, and December 28, 2019, intangible assets amounted to $103.9 million and $104.3 million, respectively.reasonable.


Refundable Deposits on Kegs and Pallets

The Company distributes its packaged flavored malt beverages, hard seltzer, beerseltzers, beers, and hard ciderciders primarily in cans and glass bottles and its draft beer in kegs and such cans, bottles, and kegs are shipped on pallets to Distributors. Most kegs and pallets are owned by the Company. Kegs are reflected in the Company’s balance sheets at cost and are depreciated over the estimated useful life of the keg, while pallets are expensed upon purchase. Upon shipment of beer to Distributors, the Company collects a refundable deposit on the kegs and certain pallets, which is included in current liabilities in the Company’s balance sheets. Upon return of the kegs and pallets to the Company, the deposit is refunded to the Distributor.

The Company has experienced some loss of kegs and pallets and anticipates that some loss will occur in future periods due to the significant volume of kegs and pallets handled by each Distributor and retailer, the homogeneous nature of kegs and pallets owned by most brewers, and the relatively small deposit collected for each keg when compared with its market value. The Company believes that this is an industry-wide issue and that the Company’s loss experience is not atypical. The Company believes that the loss of kegs and pallets, after considering the forfeiture of related deposits, has not been material to the financial statements. The Company uses internal records, records maintained by Distributors, records maintained by other third-party vendors and historical information to estimate the physical count of kegs and pallets held by Distributors. These estimates affect the amount recorded as property, plant and equipment and current liabilities as of the date of the financial statements. The actual liability for refundable deposits could differ from these estimates. For the year ended December 26, 2020,30, 2023, the Company decreased its liability for refundable deposits by $0.7 million. For the year ended December 31, 2022, the Company decreased its liability for refundable deposits, gross property, plant, and equipment and related accumulated depreciation by $0.4$0.4 million, $0.8$1.0 million and $0.8 million, respectively. For the year ended December 28, 2019, the Company decreased its liability for refundable deposits, gross property, plant and equipment and related accumulated depreciation by $0.8 million, $1.3 million and $1.3$1.0 million, respectively. As of December 26, 2020,30, 2023, and December 28, 2019,31 2022, the Company’s balance sheet includes $15.5$13.3 million and $19.5$13.0 million, respectively, in refundable deposits on kegs and pallets and $0.3$0.7 million and $0.5$1.0 million, respectively, in kegs, net of accumulated depreciation.

Income Taxes

Income tax expense was $52.3 million, $34.3 million, and $23.6 million in fiscal years 2020, 2019, and 2018, respectively.

The Company provides for deferred taxes using an asset and liability approach that requires the recognition of deferred tax assets and liabilities for the expected future tax consequences of events that have been recognized in the Company’s

50


consolidated financial statements or tax returns. This results in differences between the book and tax basis of the Company’s assets, liabilities and carry-forwards, such as tax credits. In estimating future tax consequences, all expected future events, other than enactment of changes in the tax laws or rates, are generally considered. Valuation allowances are provided when recovery of deferred tax assets does not meet the more likely than not standards as defined in ASC Topic 740, Income Taxes.

The calculation of the Company’s uncertain tax liabilitiespositions involves dealing with uncertainties in the application of complex tax regulations in several different state tax jurisdictions. The Company is periodically reviewed by tax authorities regarding the amount of taxes due. These reviews include inquiries regarding the timing and amount of deductions and the allocation of income among various tax jurisdictions. The Company records estimated reserves for exposures associated with positions that it takes on its income tax returns that do not meet the more likely than not standards as defined in ASC Topic 740, Income Taxes. Historically,

The Organization for Economic Co-operation and Development/G20 Inclusive Framework on Base Erosion and Profit Shifting has introduced rules to establish a global minimum tax rate of 15%, commonly referred to as the valuation allowancesPillar Two rules. Numerous foreign countries have enacted legislation to implement the Pillar Two rules, effective beginning in 2024, or are expected to enact similar legislation. The Company is currently evaluating the potential impacts that Pillar Two may have on future periods and reserves for uncertain tax positions have been adequatewill continue to covermonitor the related tax exposures.implementation of the Pillar Two rules in the jurisdictions in which it operates.

Revenue Recognition and Classification of Customer Programs and Incentives

During fiscal years 2020, 20192023, 2022, and 20182021 approximately 95%94%, 95%, and 95%, respectively, of the Company’s revenue was from shipments of its products to domestic Distributors and 4%4% from shipments to international Distributors, primarily located in Canada. Less than 1%Approximately 2%, 1%, and 1% of the Company’s revenue iswas from retail beer, cider, food and merchandise sales at the Company’s retail locations.locations during fiscal years 2023, 2022, and 2021, respectively.

The Company recognizes revenue when obligations under the terms of a contract with its customer are satisfied; generally, this occurs with the transfer of control of its products. Revenue is measured as the amount of consideration expected to be received in exchange for transferring products. If the conditions for revenue recognition are not met, the Company defers the revenue until all conditions are met. As of December 26, 2020,30, 2023 and December 28, 2019,31, 2022, the Company had deferred revenue of $13.5$8.9 million and $7.0$6.8 million, respectively, related to product shipped prior to these dates for which the criteria to recognize revenue was not met as of these dates. These amounts are included in accrued expenses and other current liabilities in the accompanying consolidated balance sheets.

The Company is committed to maintaining the freshness of its products in the market. In certain circumstances and with the Company’s approval, the Company accepts and destroys or offers credits for stale beer that is returned or destroyed by Distributors. The Company generally credits approximately fifty percent of the distributor’s cost of beer that has passed its freshness expiration date when it is


returned to the Company or destroyed. The Company reduces revenue and establishes an accrual based upon both historical returns, which is applied to an estimated lag time for receipt of product, and knowledge of specific return transactions. Estimating this reserve involves significant judgments and estimates, including comparability of historical return trends to future trends, lag time from date of sale to date of return, and product mix of returns. Stale beer expense is reflected in the accompanying financial statements as a reduction of revenue. Historically, the cost of actual stale beer returns has been in line with established reserves; however, the cost could differ materially from the reserves which would impact revenue. As of December 26, 2020,30, 2023, and December 28, 2019,31, 2022, the stale beer reserve was $3.1$8.2 million and $1.85.6 million, respectively. These amounts are included in accrued expenses and other current liabilities in the accompanying consolidated balance sheets. Provision for stale beer recorded as reductions to revenue totaled $8.4$18.8 million, $4.4$19.6 million, and $2.7$9.5 million in fiscal years 2020, 2019,2023, 2022, and 20182021 respectively.

Customer programs and incentives are a common practice in the alcohol beverage industry. Amounts paid in connection with customer programs and incentives are recorded as reductions to net revenue or as advertising, promotional and selling expenses, based on the nature of the expenditure. Customer incentives and other payments made to Distributors are primarily based upon the performance of certain marketing and advertising activities. Depending on applicable state laws and regulations, these activities promoting the Company’s products may include, but are not limited to, point-of-sale and merchandise placement, samples, product displays, promotional programs at retail locations and meals, travel and entertainment. Amounts paid to customers in connection with these programs that were recorded as reductions to net revenue or as advertising, promotional and selling expenses totaled $85.0$106.4 million, $75.2$95.9 million and $55.5$126.1 million in fiscal years 2020, 20192023, 2022, and 2018,2021, respectively. Estimates are based on historical and projected experience for each type of program or customer and have historically been in line with actual costs incurred.

51


Customer promotional discount programs are entered into with Distributors for certain periods of time. Amounts paid to Distributors in connection with these programs in fiscal years 2020, 20192023, 2022, and 20182021 were $59.3$62.6 million, $43.9$54.8 million and $34.5$72.7 million, respectively. The reimbursements for discounts to Distributors are recorded as reductions to net revenue. The agreed-upon discount rates are applied to certain Distributors’ sales to retailers, based on volume metrics, in order to determine the total discounted amount. The computation of the discount allowance requires that management make certain estimates and assumptions that affect the timing and amounts of revenue and liabilities recorded. Actual promotional discounts owed and paid have historically been in line with allowances recorded by the Company; however, the amounts could differ from the estimated allowances.

Customer incentives and other payments are made primarily to Distributors based upon the performance of certain marketing and advertising activities. Depending on applicable state laws and regulations, these activities promoting the Company’s products may include, but are not limited to point-of-sale and merchandise placement, samples, product displays, promotional programs at retail locations and meals, travel and entertainment. Amounts paid to customers in connection with these programs in fiscal years 2020, 20192023, 2022, and 20182021 were $25.7$43.8 million, $31.3$41.1 million and $21.0$53.4 million, respectively. In fiscal years 2020, 20192023, 2022, and 2018,2021, the Company recorded certain of these costs in the total amount of $23.1$31.4 million, $21.6$29.9 million and $13.9$42.0 million, respectively, as reductions to net revenue. Costs recognized in net revenues include, but are not limited to, promotional discounts, sales incentives and certain other promotional activities. Costs recognized in advertising, promotional and selling expenses include point of sale materials, samples and media advertising expenditures in local markets. These costs are recorded as incurred, generally when invoices are received; however certain estimates are required at the period end. Estimates are based on historical and projected experience for each type of program or customer and have historically been in line with actual costs incurred.

In connection with its preparation of financial statements and other financial reporting, management is required to make certain estimates and assumptions regarding the amount, timing and classification of expenditures resulting from these activities. Actual expenditures incurred could differ from management’s estimates and assumptions.

Excise Taxes

The Company is responsible for compliance with the Alcohol and Tobacco Tax and Trade Bureau of the U.S. Treasury Department (the “TTB”)TTB regulations, including making timely and accurate excise tax payments. The Company is subject to periodic compliance audits by the TTB. Individual states also impose excise taxes on alcohol beverages in varying amounts. The Company calculates its excise tax expense based upon units shipped and on its understanding of the applicable excise tax laws.

The Company benefited from a reduction in federal excise taxes of $11.9 million and $8.9 million in fiscal years 2020 and 2019, respectively, as a result of the Tax Cuts and Jobs Act of 2017.


Cost of Goods Sold

The following expenses are included in cost of goods sold:sold in the accompanying consolidated statements of comprehensive income: raw material costs, packaging material costs, costs and income related to deposit activity, purchasing and receiving costs, manufacturing labor and overhead, brewing and processing costs, inspection costs relating to quality control, inbound freight charges, depreciation expense related to manufacturing equipment and warehousing costs, which include rent, labor and overhead costs.

Shipping Costs

Costs incurred for the shipping of products to customers are included in advertising, promotional and selling expenses in the accompanying consolidated statements of comprehensive income. The Company incurred shipping costs of $97.6$114.7 million, $69.1$165.5 million, and $61.8$166.6 million in fiscal years 2020, 20192023, 2022, and 2018,2021, respectively.

Advertising, Promotional, and Selling Expenses

Advertising and Sales Promotions

The following expenses are included in advertising, promotional and selling expenses in the accompanying consolidated statements of comprehensive income: media advertising and production costs, sales and brand related expenses, sales and brand salary and benefit expenses, stock compensation, meals, travel and entertainment expenses, promotional activity expenses, shipping costs related to shipments of finished goods from manufacturing locations to distributor locations and point-of-sale items. Total advertising and sales promotional expenditures of $211.2$233.5 million, $177.2$226.7 million, and $145.1$291.3 million were included in advertising, promotional and selling expenses in the accompanying consolidated statements of comprehensive income for fiscal years 2020, 20192023, 2022, and 2018,2021, respectively.

52


The Company conducts certain advertising and promotional activities in its Distributors’ markets and the Distributors make contributions to the Company for such efforts. Reimbursements from Distributors for advertising and promotional activities are recorded as reductions to advertising, promotional and selling expenses.

General and Administrative Expenses

The following expenses are included in general and administrative expenses in the accompanying consolidated statements of comprehensive income: general and administrative salary and benefit expenses, stock compensation, insurance costs, consulting and professional service fees, rent and utility expenses, meals, travel and entertainment expenses for general and administrative employees, and other general and administrative overhead costs.

Stock-Based Compensation

The Company accounts for share-based awards in accordance with ASC Topic 718, Compensation – Stock Compensation (“ASC 718”), which generally requires recognition of share-based compensation costs in financial statements based on fair value. Compensation cost is recognized over the period during which an employee is required to provide services in exchange for the award (the requisite service period). The amount of compensation cost recognized in the consolidated statements of comprehensive income is based on the awards ultimately expected to vest, and therefore, reduced for estimated forfeitures. Stock-based compensation was $15.3$17.0 million, $12.3$14.0 million and $10.0$18.6 million in fiscal years 2020, 20192023, 2022, and 2018,2021, respectively.

As permitted by ASC 718, the Company elected to use a lattice model, such as the trinomial option-pricing model, to estimate the fair values of stock options. All option-pricing models require the input of subjective assumptions. These assumptions include the estimated volatility of the Company’s common stock price over the expected term, the expected dividend rate, the estimated post-vesting forfeiture rate, the risk-free interest rate and expected exercise behavior. See Note NO for further discussion of the application of the option-pricing models.

In addition, an estimated pre-vesting forfeiture rate is applied in the recognition of the compensation charge. Periodically, the Company grants performance-based stock options. The Company only recognizes compensation expense with respect to these options if it is probable that the performance targets will be met. Consequently, at the end of each reporting period, the Company estimates whether it is probable that performance targets will be met. Changes in the subjective assumptions and estimates can materially affect the amount of stock-based compensation expense recognized in the consolidated statements of comprehensive income.


Net Income Per Share

Basic net income per share is calculated by dividing net income by the weighted-average common shares outstanding. Diluted net income per share is calculated by dividing net income by the weighted-average common shares and potentially dilutive securities outstanding during the period using the treasury stock method or the two-class method, whichever is more dilutive.dilutive.

C. Recent Accounting Pronouncements Recently Adopted

New accounting pronouncements are issued periodically by the FASB and are adopted by the Company as of the specified effective dates. Unless otherwise disclosed below, the Company believes that recently issued and adopted pronouncements will not have a material impact on the Company’s financial position, results of operations and cash flows or do not apply to the Company’s operations.

In June 2016,November 2023, the FASB issued ASU 2016-13, 2023-07—Financial Instruments – Credit LossesSegment Reporting (Topic 326)280): Measurement of Credit Losses on Financial InstrumentsImprovements to Reportable Segment Disclosures. The guidance requires companiesThis ASU was issued to measure credit losses utilizing a methodologyimprove reportable segment disclosure requirements, primarily through enhanced disclosures about significant segment expenses. This ASU applies to all public entities that reflects expected credit losses and requires the consideration of a broader range of reasonable and supportableare required to report segment information to inform credit loss estimates.in accordance with Topic 280, Segment Reporting. ASU 2016-132023-07 is effective for fiscal years beginning after December 15, 2019, including2023, and interim periods within those fiscal years. The Company adopted the standard in the first quarter of fiscal 2020 and there was no material impact.

In January 2017, the FASB issued ASU No. 2017-04, Intangibles—Goodwill and Other (Topic 350): Simplifying the Test for Goodwill Impairment. Prior to ASU No. 2017-04, the goodwill impairment test is a two-step assessment, if indicators of impairment exist. The first step requires an entity to compare each reporting unit’s carrying value and its fair value. If the reporting unit’s carrying value exceeds the fair value, then the entity must perform the second step, which is to compare the implied fair value of goodwill to its carrying value, and record an impairment charge for any excess of carrying value of goodwill over its implied fair value. An entity also has the option to perform a qualitative assessment for a reporting unit to determine if the quantitative impairment test is necessary. ASU 2017-04 simplifies the goodwill impairment test by eliminating the second step of the test. As such, an entity will perform its goodwill impairment test by comparing the fair value of a reporting unit with its carrying amount. An entity should recognize a goodwill impairment charge for the amount by which the reporting unit’s carrying amount exceeds its fair value. If fair value exceeds the carrying amount, 0 impairment should be recorded. ASU 2017-04 is effective prospectively for the year beginning December 29, 2019. The Company adopted the standard in the third quarter of 2020 during the annual goodwill impairment assessment and there was no material impact.

Accounting Pronouncements Not Yet Effective

In December 2019, the FASB issued ASU 2019-12, Income Taxes (Topic 740): Simplifying the Accounting for Income Taxes. The standard includes multiple key provisions, including removal of certain exceptions to ASC 740, Income Taxes, and simplification in several other areas such as accounting for a franchise tax (or similar tax) that is partially based on income. ASU 2019-12 is effective for fiscal years beginning after December 15, 2020, including interim periods within those2024. Early adoption is permitted and the standard should be applied retrospectively. ASU 2023-07 will be effective for the Company's fiscal years.year ending December 28, 2024. The Company is currently assessing the impact of adopting this standard but does not expectanticipate the adoption of this guidance toASU will have a material impact on its consolidated financial statements.

In December 2023, the FASB issued ASU 2023-09—Income Taxes (Topic 740): Improvements to Income Tax Disclosures. This ASU was issued to address investor requests for more transparency about income tax information through improvements

C.

53


Dogfish Head Brewery Transaction

On May 8, 2019, the Company entered into definitive agreements to acquire Dogfish Head Brewery (“Dogfish Head”) and various related operations (the “Transaction”), through the acquisition of all of the equity interests held by certain private entities in Off-Centered Way LLC, the parent holding company of the Dogfish Head operations. In accordance with these agreements, the Company made a payment of $158.4 million, which was placed in escrow pending the satisfaction of certain closing conditions. The Transaction closed on July 3, 2019, for total consideration of $336.0 million consisting of $173.0 million in cash and 429,291 shares of restricted Class A Common Stock that had an aggregate market value as of July 3, 2019 of $163.0 million, after taking into account a post-closing cash related adjustment. As required under the definitive agreements, 127,146 of the 429,291 shares of restricted Class A Stock have been placed in escrow and will be released no later than July 3, 2029. These shares had a market value on July 3, 2019 of $48.3 million. The timing of the release of these escrowed shares isincome tax disclosure primarily related to the continued employment withrate reconciliation and income taxes paid information, and to improve the effectiveness of income tax disclosures. This ASU is effective for public entities for annual periods beginning after December 15, 2024. Early adoption is permitted. ASU 2023-09 will be effective for the Company in the first quarter of Samuel A. Calagione III, oneits fiscal year ending December 27, 2025. The Company is currently evaluating the impact the adoption of the two Dogfish Head founders.this ASU will have on its consolidated financial statements.


The Company’s allocation of consideration exchanged to the net tangible and intangible assets acquired and liabilities assumed in the Transaction is based on estimated fair values as of July 3, 2019, and was finalized on July 3, 2020. The following table summarizes the acquisition date fair value of the tangible assets, intangible assets, liabilities assumed, and related goodwill acquired from Dogfish Head, as well as the allocation of purchase price paid:D. Inventories


Total

(In Thousands)


Cash and cash equivalents


$

7,476


Accounts receivable


8,081


Inventories


9,286


Prepaid expenses and other current assets


847


Property, plant and equipment


106,964


Goodwill


108,846


Brand


98,500


Other intangible assets


3,800


Other assets


378


Total assets acquired


344,178


Accounts payable


3,861


Accrued expenses and other current liabilities


4,085


Deferred income taxes


18,437


Other liabilities


59


Total liabilities assumed


26,442


Net assets acquired


$

317,736


Cash consideration


$

172,993


Nominal value of equity issued


162,999


Fair Value reduction due to liquidity


(18,256

)

Estimated total purchase price


$

317,736


The Company accounted for the acquisition in accordance with the accounting standards codification guidance for business combinations, whereby the total purchase price was allocated to the acquired net tangible and intangible assets of Dogfish Head based on their fair values as of the Transaction closing date.

The fair value of the Dogfish Head brand trade name is estimated at approximately $98.5 million and the fair value of customer relationships is estimated at $3.8 million. The Company estimated the Dogfish Head brand trade name will have an indefinite life and customer relationships will have an estimated useful life of 15 years. The customer relationship intangible asset will be amortized on a straight-line basis over the 15 year estimated useful life. The fair value of the deferred income tax liability assumed is $18.4 million, representing the expected future tax consequences of temporary differences between the fair values of the assets acquired and liabilities assumed and their tax basis. The Company used a preliminary consolidated tax rate to determine the net deferred tax liabilities. The Company will record measurement period adjustments as the Company applies the appropriate tax rate for each legal entity within Dogfish Head. The expectation is that the Dogfish Head deferred income taxes will be subject to the Company’s consolidated rate. The excess of the purchase price paid over the estimated fair values of the assets and liabilities assumed has been recorded as goodwill in the amount of $108.8 million. Goodwill associated with the acquisition is primarily attributable to the future growth opportunities associated with the Transaction, expected synergies and value of the workforce. The Company believes the majority of the goodwill is deductible for tax purposes.

The fair value of the brand trade name was determined utilizing the relief from royalty method which is a form of the income approach. Under this method, a royalty rate based on observed market royalties is applied to projected revenue supporting the trade name and discounted to present value using an appropriate discount rate. The fair value of the property, plant and equipment was determined utilizing the cost and market valuation approaches.

The results of operations from Dogfish Head have been included in the Company’s consolidated statements of comprehensive income since the July 3, 2019 Transaction closing date.

Consistent with prior periods and considering post-merger reporting structures, the Company will continue to report as one operating segment. The combined Company’s brands are predominantly beverages that are manufactured using similar


production processes, have comparable alcohol content, generally fall under the same regulatory environment, and are sold to the same types of customers in similar size quantities at similar price points and through the same channels of distribution.

The following unaudited pro forma information has been prepared, as if the Transaction and the related debt financing had occurred as of December 31, 2017, the first day of the Company’s 2018 fiscal year. The pro forma amounts reflect the combined historical operational results for Boston Beer and Dogfish Head, after giving effect to adjustments related to the impact of purchase accounting, transaction costs and financing. The unaudited pro forma financial information is not indicative of the operational results that would have been obtained had the Transaction occurred as of that date, nor is it necessarily indicative of the Company’s future operational results. The following adjustments have been made:

(i)

Depreciation and amortization expenses were updated to reflect the fair value adjustments to Dogfish Head property, plant and equipment and intangible assets beginning December 31, 2017.

(ii)

Transaction costs incurred in the fifty-two weeks ended December 28, 2019 have been re-assigned to the first period of the comparative fiscal year.

(iii)

Interest expense has been included at a rate of approximately 3% which is consistent with the borrowing rate on the Company’s current line of credit.

(iv)

The tax effects of the pro forma adjustments at an estimated statutory rate of 25.6%.

(v)

Earnings per share amounts are calculated using the Company’s historical weighted average shares outstanding plus the 429,291 shares issued in the merger.


Fifty-two weeks ended


December 28,

2019


Net revenue


$

1,304,239


Net income


$

116,868


Basic earnings per share


$

9.83


Diluted earnings per share


$

9.73


D.

Inventories

Inventories consisted of the following:following as of:


December 30,
2023


December 31,
2022


(in thousands)


Current inventory:


Raw materials


$

55,116


$

81,225


Work in process


18,750


20,374


Finished goods


41,907


46,851


Total current inventory


115,773


148,450


Long term inventory


14,369


13,192


Total inventory


$

130,142


$

161,642


As of December 30, 2023 and December 31, 2022, the Company has recorded inventory obsolescence reserves of $7.6 million and $22.0 million, respectively. The reduction in inventory obsolescence reserves was primarily driven by the destruction of previously reserved inventory and improved supply chain processes that resulted in less obsolescence in fiscal 2023.


December 26,

2020


December 28,

2019


(in thousands)


Current inventory:


Raw materials


$

69,272


$

61,522


Work in process


16,846


12,631


Finished goods


44,792


31,885


Total current inventory


130,910


106,038


Long term inventory


9,639


10,048


Total inventory


$

140,549


$

116,086


E. Prepaid Expenses and Other Current Assets


E.

Prepaid Expenses and Other Current Assets

Prepaid expenses and other current assets consisted of the following:following as of:


December 30,
2023


December 31,
2022


(in thousands)


Prepaid taxes


$

5,536


$

6,753


Prepaid software and consulting fees


3,627


4,549


Prepaid insurance


3,394


3,497


Prepaid advertising, promotional and selling costs


3,324


8,878


Other


4,657


3,784


Total prepaid expenses and other current assets


$

20,538


$

27,461


December 26,

2020


December 28,

2019


(in thousands)


Prepaid brewing services fee - short term (see Note L)


$

14,816


$

4,936


Prepaid advertising, promotional and selling


4,876


1,649


Down payments to vendors


4,693


24


Other


5,845


5,468


$

30,230


$

12,077


F. Property, Plant, and Equipment

F.

Property, Plant and Equipment

Property, plant, and equipment consisted of the following:following as of:


December 26,

2020


December 28,

2019


December 30,
2023


December 31,
2022


(in thousands)


(in thousands)


Machinery and plant equipment


$

641,790


$

571,506


$

777,185


$

760,895


Building and building improvements


247,384


237,561


Leasehold improvements


74,603


75,260


Kegs


61,582


66,011


58,492


58,492


Office equipment and furniture


40,723


36,935


Land


25,753


25,759


25,752


25,777


Building and building improvements


174,328


130,311


Office equipment and furniture


31,115


29,202


Leasehold improvements


43,157


48,528


Assets under construction


84,564


59,027


66,700


41,323


1,062,289


930,344


Property, plant, and equipment, gross


1,290,839


1,236,243


Less accumulated depreciation


(439,206

)


(389,276

)


(648,330

)


(568,334

)


$

623,083


$

541,068


Property, plant, and equipment, net


$

642,509


$

667,909


The Company recorded depreciation expense related to these assets of $65.4$87.9 million, $56.1$81.1 million, and $51.8$71.8 million, in fiscal years 2020, 2019,2023, 2022, and 2018,2021, respectively.

Impairment of Assets

54


The Company evaluates its assets for impairment when events indicate that an asset or asset group may have suffered impairment. During fiscal years 2020, 20192023, 2022, and 2018,2021, the Company recorded impairment charges on brewery assets classified as property, plant, and equipment of $4.4$5.0 million, $0.9$2.6 million, and $0.7$18.5 million, respectively. The increase in impairment charges during fiscal year 2021 relates to write-downs of equipment related to the slowdown of the hard seltzer category.

G. Leases

G.

Leases

The Company has various lease agreements in place for facilities and equipment. Terms of these leases include, in some instances, scheduled rent increases, renewals, purchase options, and maintenance costs, and vary by lease. These lease obligations expire at various dates through 2034. As the rate implicit in each lease is not readily determinable, the Company uses its incremental borrowing rate based on information available at lease commencement to determine the present value of the lease payments. Leases with an initial term of 12 months or less (“short-term leases”) are not recorded on the balance sheet and are recognized on a straight-line basis over the lease term. As of December 26, 2020, total ROUTotal right-of-use ("ROU") assets and lease liabilities were as follows:follows at:


Classification


Leases


December 30,
2023


December 31,
2022


(in thousands)


Right-of-use assets


Operating lease assets


Operating right-of-use assets


$

35,559


$

43,768


Finance lease assets


Property, plant, and equipment, net


2,680


1,424


Lease Liabilities


Current


Operating lease liabilities


Current operating lease liabilities


9,113


8,866


Finance lease liabilities


Accrued expenses and other current liabilities


1,257


935


Non-current


Operating lease liabilities


Non-current operating lease liabilities


36,161


45,274


Finance lease liabilities


Other liabilities


1,451


524


Classification


December 26,

2020


December 28,

2019


Right-of-use assets


(in thousands)


Operating lease assets


Operating right-of-use assets


$

58,483


$

53,758


Finance lease assets


Property, plant and equipment, net


4,035


2,531


Lease Liabilities


Current


Operating lease liabilities


Current operating lease liabilities


8,232


5,168


Finance lease liabilities


Accrued expenses and other current liabilities


1,453


546


Non-current


Operating lease liabilities


Non-current operating lease liabilities


59,171


53,940


Finance lease liabilities


Other liabilities


2,631


2,042


The gross value and accumulated depreciation of ROU assets related to finance leases as of December 26, 2020 were as follows:

follows at:


Finance

Leases


December 26,

2020


December 28,

2019


(in thousands)


Gross value


$

5,526


$

2,837


Accumulated amortization


(1,491

)


(306

)

Carrying value


$

4,035


$

2,531


Finance Leases


December 30,
2023


December 31,
2022


(in thousands)


Gross value


$

6,134


$

5,998


Accumulated amortization


(3,454

)


(4,574

)

Carrying value


$

2,680


$

1,424


Components of lease cost for the fiscal year-ended are as follows:follows at:


Fiscal years ended


December 30,
2023


December 31,
2022


December 25,
2021


(in thousands)


Operating lease cost:


Amortization of right-of-use assets


$

8,339


$

9,978


$

10,283


Variable lease costs not included in liability


606


702


1,132


Total operating lease cost


$

8,945


$

10,680


$

11,415


Finance lease cost:


Amortization of right-of-use assets


$

1,568


$

1,590


$

1,493


Interest on lease liabilities


138


71


121


Total finance lease cost


$

1,706


$

1,661


$

1,614


Lease Cost


December 26,

2020


December 28,

2019


(in thousands)


Operating lease cost


$

9,764


$

5,625


Variable lease costs not included in liability


1,643


1,064


Finance lease cost:


Amortization of right-of-use asset


$

1,185


$

306


Interest on lease liabilities


143


56


Total finance lease cost


$

1,328


$

362


55


Additionally, during 2023 and 2022, the Company recorded impairment charges on right-of use assets of$0.4 million and $0.2 million, respectively, included within impairment of brewery assets within the Company's consolidated statements of comprehensive income.


Maturities of lease liabilities as of December 26, 202030, 2023 are as follows:


Operating


Finance


Weighted- Average
Remaining Term
in Years


Leases


Leases


Operating
Leases


Finance
Leases


(in thousands)


2024


$

10,529


$

1,367


2025


7,102


1,109


2026


6,671


391


2027


6,122


8


2028


6,039


Thereafter


14,746


Total lease payments


51,209


2,875


Less imputed interest (based on 3.5% weighted-average
   discount rate)


(5,935

)


(167

)


Present value of lease liabilities


$

45,274


$

2,708


6.8


2.2


Operating


Finance


Weighted-Average Remaining

Term in Years


Leases


Leases


Operating

Leases


Finance

Leases


(in thousands)


2021


$

10,454


$

1,572


2022


9,908


1,572


2023


9,737


863


2024


9,714


265


2025


6,389


8


Thereafter


32,891


15


Total lease payments


79,093


4,295


Less imputed interest (based on 3.5% weighted-

   average discount rate)


(11,690

)


(211

)


Present value of lease liability


$

67,403


$

4,084


8.8


2.9


H. Goodwill and Intangible Assets

H.

Goodwill and Intangible Assets

The Company has recorded intangible assets with indefinite lives and goodwill for which impairment testing is required at least annually or more frequently if events or circumstances indicate that these assets might be impaired. The Company performs its annual impairment tests and re-evaluates the useful lives of other intangible assets with indefinite lives at the annual impairment test measurement date in the third quarter of each fiscal year or when circumstances arise that indicate a possible impairment or change in the carrying value of goodwill and intangible assets during the fifty-two weeks ended December 26, 2020 and December 28, 2019 were as follows:useful life might exist.


Fifty-two weeks ended


December 26,


December 28,


2020


2019


(in thousands)


Goodwill as of beginning of period


$

112,529


$

3,683


Acquired goodwill


108,846


Impairment of goodwill


Goodwill as of end of period


$

112,529


$

112,529


The $108.8 million of goodwill acquired during the fifty-two weeks ended December 28, 2019 is related to the Dogfish Head Transaction disclosed in Note C. Goodwill.No impairment of existing goodwill was recorded in any period.

Intangible assets.The Company’s intangible assetsCompany's annual impairment testing occurs as of December 26, 2020 and December 28, 2019 were as follows:


As of December 26, 2020


As of December 28, 2019


Estimated Useful

Life (Years)


Gross Carrying

Value


Accumulated

Amortization


Net Book

Value


Gross Carrying

Value


Accumulated

Amortization


Net Book

Value


(in thousands)


(in thousands)


Customer Relationships


15


$

3,800


$

(380

)


$

3,420


$

3,800


$

(127

)


$

3,673


Trade Names


Indefinite


100,510


100,510


100,599


100,599


Total intangible assets


$

104,310


$

(380

)


$

103,930


$

104,399


$

(127

)


$

104,272


September 1 each year. During the fifty-two weeks ended December 28, 2019,fiscal 2023, the Company acquired intangible assets as partevaluated the continuing negative trends of the Dogfish Head Transaction disclosedbrand, including slower growth rates resulting from increased competition and updated its long-term financial forecasts for the Dogfish Head brand. These updated forecasts for the brand included reductions in Note C, that consistsrevenues from the continuing negative trends in the brands’ beer products and the overall slowing craft beer industry sector which were partially offset by increases in revenues from the brands’ emerging canned cocktail products. As a result of $98.5performing this assessment, the Dogfish Head trademark asset with a carrying value of $71.4 million forwas written down to its estimated fair value of $55.6 million, resulting in an impairment of $15.8 million which was recorded during the third quarter of 2023. Additionally during the third quarter of 2023, an impairment of $0.6 million was recorded on other intangible assets. During fiscal 2022, an impairment of $27.1 million was recorded to reduce the carrying value of the Dogfish Head brand name and $3.8trademark asset from $98.5 million for the value of customer relationships. to $71.4 million.

The customer relationshipCompany’s intangible asset will be amortized on a straight-line basis over the 15-year useful life. assets were as follows:


As of December 30, 2023


As of December 31, 2022


Estimated
Useful


Gross
Carrying


Accumulated


Net Book


Gross
Carrying


Accumulated


Net Book


Life (Years)


Value


Amortization


Value


Value


Amortization


Value


(in thousands)


Customer relationships


15


$

3,800


$

(1,140

)


$

2,660


$

3,800


$

(886

)


$

2,914


Trademarks


Indefinite


56,984


56,984


73,410


73,410


Total intangible assets


$

60,784


$

(1,140

)


$

59,644


$

77,210


$

(886

)


$

76,324


Amortization expense in the fifty-two weeks ended December 26, 2020 was approximately $253,000. $253,000 in fiscal 2023, 2022, and 2021. The Company expects to record amortization expense as follows over the five subsequent years:


56


Fiscal Year


Amount (in thousands)


2024


$

253


2025


253


2026


253


2027


253


2028


253


Thereafter


1,395


Total amortization to be recorded


$

2,660


Fiscal Year


Amount


(in thousands)


2021


$

253


2022


253


2023


253


2024


253


2025


253


I. Third-Party Production Prepayments

For fiscal years 2023, 2022, and 2021 the Company brewed and packaged approximately 71%, 65%, and 56%, respectively, of its volume at Company-owned breweries. The Company brewed and packaged approximately 22%, 26% and 32% of its volume across various City Brewing Company, LLC locations for fiscal 2023, 2022, and 2021, respectively. In the normal course of its business, the Company has historically entered into various production arrangements with other brewing companies. Pursuant to these arrangements, the Company generally supplies raw materials and packaging to those brewing companies and incurs conversion fees for labor at the time the liquid is produced and packaged. The Company has made up-front payments that were used for capital improvements at these third-party production facilities that it expenses over the period of the contracts. Under these production arrangements, there are minimum production quantities and the Company is obligated to pay shortfall fees for production quantity below those thresholds.

During fiscal 2021, the Company amended its master transaction agreement with City Brewing Company, LLC ("City Brewing") to ensure access to capacity at a new location and continued access at certain existing locations. The amendment became effective during the second quarter of fiscal year 2021, upon the closing of the purchase of the new location by City Brewing.

Total third-party production prepayments were $33.6 million and $61.3 million as of December 30, 2023 and December 31, 2022, respectively. The Company will expense the total prepaid amount of $33.6 million as of December 30, 2023, all of which relates to the master transaction agreement described above and other agreements with City Brewing, as a component of cost of goods sold over the contractual period ending December 31, 2025.

At current production volume projections, the Company believes that it will fall short of its future annual volume commitments at certain third-party production facilities, including those that are part of the master transaction agreement described above, and will incur shortfall fees. The Company expenses the shortfall fees during the contractual period when such fees are incurred as a component of cost of goods sold. During 2023 and 2022, the Company recorded $9.5 million and $3.0 million, respectively, in shortfall fees. As of December 30, 2023, if volume for the remaining term of the production arrangements was zero, the contractual shortfall fees, with advance notice as specified in the related contractual agreements, would total approximately $106 million over the duration of the contracts which have expiration dates through December 31, 2031. At current volume projections and based on understandings reached with these third-party production facilities, the Company anticipates that it will recognize approximately $41 million of shortfall fees and expects to record those expenses as follows:


Expected Shortfall Fees to be Incurred


(in millions)


2024


$

13


2025


13


2026


3


2027


3


2028


2


Thereafter


7


Total shortfall fees expected to be incurred


$

41


On October 23, 2023, the Company amended its master transaction agreement with City Brewing to include a provision that required the Company, upon 30 days notice, to loan City Brewing $20 million for the purpose of buying packaging equipment at its Irwindale location. Notice was given by City Brewing on December 1, 2023. The Company and City Brewing entered into a Loan and Security agreement on January 2, 2024 at which time payment of $20 million was made by the Company to City Brewing. Repayment of the loan plus an agreed investment return combined total $22.4 million, subject to applicable maximum interest laws, and shall be credited to the Company through reductions of shortfall fees, subject to annual repayment limits and through other payments or credits should owed shortfall fees be lower than these annual

57


repayment limits. The annual repayment limits are $3.0 million in 2024, $7.5 million in 2025 and $10.0 million in 2026 and thereafter.

J. Accrued Expenses and Other Current Liabilities

I.

Accrued Expenses and Other Current Liabilities

Accrued expenses and other current liabilities consisted of the following:following as of:


December 30,
2023


December 31,
2022


(in thousands)


Employee wages, benefits, and reimbursements


$

49,446


$

31,449


Advertising, promotional, and selling expenses


18,950


18,915


Accrued deposits


13,425


13,090


Accrued inventory and production related costs


9,775


17,986


Deferred revenue


8,895


6,840


Accrued returns


8,240


5,580


Accrued taxes


6,757


7,229


Other


11,442


10,064


Total accrued expenses and other current liabilities


$

126,930


$

111,153


December 26,

2020


December 28,

2019


(in thousands)


Employee wages, benefits and reimbursements


$

50,938


$

35,394


Advertising, promotional and selling expenses


15,752


17,009


Accrued deposits


15,616


20,483


Deferred revenue


13,522


6,984


Accrued taxes


10,133


3,316


Accrued capital expenditures


7,523


2,621


Other accrued liabilities


16,060


13,300


$

129,544


$

99,107


K. Revolving Line of Credit

J.

Revolving Line of Credit

The

During 2022, the Company has aamended its $150.0 million credit facility in place that provides for a $150.0 million revolving line of creditagreement, which now has a term not scheduled to expire until March 31, 2023. TheDecember 16, 2027. Under the terms of the amended agreement, the Company may elect an interest rate for borrowings under the credit facility based on either (i) the Alternative Prime Rate (3.25% at December 26, 2020) or (ii) the applicable LIBORsecured overnight financing rate (0.15% at("SOFR") plus 1.1%. At December 26, 2020) plus 0.45%30, 2023, the applicable SOFR was 5.4%. The Company incurs an annual commitment fee of 0.15%0.2% on the unused portion of the facility and is obligated to meet certain financial covenants, which are measured using earnings before interest, tax, depreciation, and amortization (“EBITDA”) based ratios. The Company’s EBITDA to interest expense ratio was 795.001,680.1 as of December 26, 2020,30, 2023, compared to a minimum allowable ratio of 2.002.0 and the Company’s total funded debt to EBITDA ratio was 0.0 as of December 26, 2020,30, 2023, compared to a maximum allowable ratio of 2.50.2.5. There were no borrowings, repayments, or interest payments during 2023 or 2021. During the fifty-two weeksyear ended December 26, 2020,31, 2022, the companyCompany borrowed and repaid $100.0$30.0 million on the credit facility and paid a total of $0.2 millionapproximately $18,000 in related interest. There were 0no borrowings outstanding under the credit facility as of December 26, 2020 and December 28, 2019.30, 2023.

There are also certain restrictive covenants set forth in the credit agreement. Pursuant to the negative covenants, the Company has agreed that it will not: enter into any indebtedness or guarantees other than those specified by the lender, enter into any sale and leaseback transactions, merge, consolidate, or dispose of significant assets without the lender’s prior written consent, make or maintain any investments other than those permitted in the credit agreement, or enter into any transactions with affiliates outside of the ordinary course of business. In addition, the credit agreement requires the Company to obtain prior written consent from the lender on distributions on account of, or in repurchase, retirement or purchase of its capital stock or other equity interests with the exception of the following: (a) distributions of capital stock from subsidiaries to The Boston Beer Company, Inc. and Boston Beer Corporation (a subsidiary of The Boston Beer Company, Inc.), (b) repurchase from former employees of non-vested investment shares of Class A Common Stock, issued under the Employee Equity Incentive Plan, and (c) redemption of shares of Class A Common Stock as approved by the Board of Directors and payment of cash dividends to its holders of common stock. Borrowings under the credit facility may be used for working capital, capital expenditures and general corporate purposes of the Company and its subsidiaries. In the event of a default that has not been cured, the credit facility would terminate and any unpaid principal and accrued interest would become due and payable.


58


L. Income Taxes

K.

Income Taxes

Significant components of the income tax provision (benefit) for income taxes arefiscal 2023, 2022, and 2021 were as follows:


2023


2022


2021


(in thousands)


Current:


Federal


$

36,556


$

10,453


$

(4,473

)

State


7,650


4,683


2,078


Total current


44,206


15,136


(2,395

)

Deferred:


Federal


(10,816

)


8,196


(2,762

)

State


(52

)


841


(2,487

)

Total deferred


(10,868

)


9,037


(5,249

)

Total income tax provision (benefit)


$

33,338


$

24,173


$

(7,644

)


2020


2019


2018


(in thousands)


Current:


Federal


$

25,115


$

18,510


$

4,471


State


9,455


8,084


4,894


Total current


34,570


26,594


9,365


Deferred:


Federal


16,363


8,081


12,860


State


1,337


(346

)


1,398


Total deferred


17,700


7,735


14,258


Total provision for income taxes


$

52,270


$

34,329


$

23,623


The Company’s reconciliations to statutory rates arefor fiscal 2023, 2022, and 2021 were as follows:


2023


2022


2021


Statutory rate


21.0

%


21.0

%


21.0

%

State income taxes, net of federal benefit


4.8


4.1


11.0


Non-deductible compensation under Internal Revenue Code Section 162(m)


3.4


0.2


5.7


Non-deductible meals & entertainment


1.2


0.6


5.6


Change in valuation allowance


1.0


1.2


21.9


Deduction relating to excess stock-based compensation


0.1


(0.9

)


(153.8

)

Change in unrecognized tax benefits (including interest and penalty)


0.1


(8.7

)

Federal and state provision to return


0.0


(0.2

)


(7.1

)

Other


(1.2

)


0.4


(6.3

)


30.4

%


26.4

%


(110.7

)%


2020


2019


2018


Statutory rate


21.0

%


21.0

%


21.0

%

State income taxes, net of federal benefit


4.4


4.6


4.6


Deduction relating to excess stock based compensation


(4.3

)


(3.2

)


(3.6

)

Non-deductable meals & entertainment


0.2


0.7


1.1


Accounting method changes


(3.9

)

Change in valuation allowance


0.1


0.4


0.7


Other


0.3


0.4


21.4

%


23.8

%


20.3

%

Due to a change of tax accounting methods for depreciation of certain property, plant and equipment for the fiscal year-ended December 30, 2017, the Company experienced a one-time income tax benefit of $4.5 million for the tax year ended December 29, 2018.

Significant components of the Company’s deferred tax assets and liabilities arewere as follows at:


December 26,

2020


December 28,

2019


December 30,
2023


December 31,
2022


(in thousands)


(in thousands)


Deferred tax assets:


Lease Liabilities


$

17,951


$

15,567


Inventory


2,525


5,868


Lease liabilities


$

12,034


$

13,994


Stock-based compensation expense


5,568


5,818


8,062


7,441


Accrued expenses


3,171


3,232


7,100


4,609


Inventory reserves


4,689


8,595


Loss carryforwards


1,864


968


Tax credit carryforwards


689


813


Accrued commitments for inventory at vendor locations


108


1,799


Other


2,212


1,914


983


1,833


Total deferred tax assets


31,427


32,399


35,529


40,052


Valuation allowance


(2,022

)


(1,866

)


(5,808

)


(4,600

)

Total deferred tax assets net of valuation allowance


29,405


30,533


Total deferred tax assets, net of valuation allowance


29,721


35,452


Deferred tax liabilities:


Property, plant and equipment


(88,947

)


(78,232

)

Right-of-use Assets


(15,695

)


(14,203

)

Amortization


(12,900

)


(10,899

)

Property, plant, and equipment


(90,372

)


(103,561

)

Right-of-use assets


(9,590

)


(11,375

)

Intangible assets amortization


(8,244

)


(10,373

)

Prepaid expenses


(4,528

)


(2,209

)


(7,236

)


(6,735

)

Total deferred tax liabilities


(122,070

)


(105,543

)


(115,442

)


(132,044

)

Net deferred tax liabilities


$

(92,665

)


$

(75,010

)


$

(85,721

)


$

(96,592

)

The Company’s practicepolicy is to classify interest and penalties related to income tax matters in income tax expense. Interest and penalties included in the provision for income taxes amounted to $0.0$0.1 million $0.0 million,in fiscal year 2023, and $0.1 million for$0 in each of the fiscal years


2020, 2019, 2022, and 2018, respectively.2021. Accrued interest and penalties amounted to $0.2  million and $0.1$0.2 million at December 26, 202030, 2023 and December 28, 2019, respectively.31, 2022.

59


A reconciliation of the beginning and ending amount of unrecognized tax benefits isfor fiscal 2023 and 2022 was as follows:


2020


2019


(in thousands)


Balance at beginning of year


$

811


$

836


Increases related to current year tax positions


101


Increases (decreases) related to prior year tax positions


13


(63

)

Decreases related to lapse of statute of limitations


(12

)


(63

)

Balance at end of year


$

812


$

811


2023


2022


(in thousands)


Balance at beginning of period


$

243


$

232


Increases related to current period tax positions


69


41


Increases (decreases) related to prior period tax positions


4


(30

)

Decreases related to lapse of statute of limitations


(13

)


Balance at end of period


$

303


$

243


Included in the balance of unrecognized tax benefits at December 26, 202030, 2023 and December 28, 201931, 2022 are potential net benefits of $0.8$0.3 million and $0.8$0.2 million, respectively, that would favorably impact the effective tax rate if recognized. Unrecognized tax benefits are included in accrued expenses in the accompanying consolidated balance sheets and adjusted in the period in which new information about a tax position becomes available or the final outcome differs from the amount recorded.

In September 2017, the Internal Revenue Service (“IRS”) commenced an examination of the Company’s 2015 consolidated corporate income tax return. The examination was completed in July 2018 resulting in a no change report.

As of December 26, 2020,30, 2023, the Company’s 2017, 2018,2020, 2021, and 20192022 federal income tax returns remain subject to examination by the IRS. The Company’s state income tax returns remain subject to examination for three or four years depending on the state’s statute of limitations. The Company is being audited by one state as of December 26, 2020. In addition, the Company is generally obligated to report changes in taxable income arising from federal income tax audits.

It The Company is reasonably possible that the Company’s unrecognized tax benefits may increase or decrease in 2020 if there are changes as a result of potentialnot currently under any income tax audits; however, the Company cannot estimate the rangeaudits as of such possible changes. The Company does not expect that any potential changes would have a material impact on the Company’s financial position, results of operations or cash flows.December 30, 2023.

As of December 26, 2020,30, 2023, the Company’s deferred tax assets includedinclude a capital loss carryforward totaling $1.1 million. If unused, the capital loss carryforward will expirevaluation allowance of $5.8 million, compared to $4.6 million at December 31, 2022. The valuation allowance as of December 30, 2023 and December 31, 2022 was primarily related to stock-based compensation expected by management to be non-deductible under Internal Revenue Code, Section 162(m), as well as jurisdictional losses not expected to be utilized before expiring. The net increase in fiscal year 2021.total valuation allowance was $1.2 million from December 31, 2022 to December 30, 2023, compared to a net increase of $1.3 million from December 25, 2021 to December 31, 2022.

M. Commitments and Contingencies

L.

Commitments and Contingencies

Contractual Obligations

As of December 26, 2020,30, 2023, projected cash outflows under non-cancelablenon-cancellable contractual obligations for the remaining years under the contracts are as follows:


Payments Due by Period


Total


2021


2022


2023


2024


2025


Thereafter


Payments Due by Fiscal Year


(in thousands)


Total


2024


2025


2026


Thereafter


Ingredients (excluding hops and malt)


$

91,414


$

91,414


$


$


$


$


$


(in thousands)


Ingredients and packaging (excluding hops and malt)


$

82,988


$

82,988


$


$


$


Brand support


87,459


61,154


8,646


8,397


4,703


4,559


64,768


50,749


10,249


3,770


Hops and malt


40,766


38,299


2,054


413


Equipment and machinery


79,379


79,379


36,751


36,751


Hops and malt


51,988


41,103


4,667


2,317


2,175


1,726


Other


11,659


9,854


1,633


172


21,721


19,194


2,024


503


Total contractual obligations


$

321,899


$

282,904


$

14,946


$

10,886


$

6,878


$

6,285


$


$

246,994


$

227,981


$

14,327


$

4,686


$


The Company’s accounting policy for inventory and non-cancellable purchase commitments is to recognize a loss by establishing a reserve to the extent inventory levels and commitments exceed forecasted needs. The computation of the excess inventory requires management to make certain assumptions regarding future sales growth, product mix, cancellation costs and supply, among others. Actual results may differ materially from management’s estimates. The Company continues to manage inventory


levels and purchase commitments in an effort to maximize utilization. However, changes in management’s assumptions regarding future sales growth, product mix, and hops market conditions could result in future material losses.

The Company utilizes several varieties of hops in the production of its products. To ensure adequate supplies of these varieties, the Company enters into advance multi-year purchase commitments based on forecasted future hop requirements, among other factors. These purchase commitments extend through crop year 20252026 and specify both the quantities and prices, denominated in U.S. Dollar, Euros, New Zealand Dollars and British Pounds, to which the Company is committed. Hops purchase commitments outstanding at December 26, 202030, 2023 totaled $29.5$10.5 million, based on the exchange rates on that date.

60


The Company does not use forward currency exchange contracts and intends to purchase future hops using the exchange rate at the time of purchase. These contracts were deemed necessary in order to bring hop inventory levels and purchase commitments into balance with the Company’s current brewing volume and hop usage forecasts. In addition, these contracts enable the Company to secure its position for future supply with hop vendors in the face of some competitive buying activity.

Currently, the Company has entered into contracts for barley and wheat used in the Company’s malt with 4four major suppliers. The contracts include crop year 2020 and 2021 and cover the Company’s barley, wheat, and malt requirements for 2021.2024 and extend through crop year 2024. These purchase commitments outstanding at December 26, 202030, 2023 totaled $22.5$30.2 million.

For the fiscal year ended December 26, 2020, the

The Company brewed approximately 65%anticipates paying shortfall fees at certain of its volume at Company-owned breweries. In the normal course of its business, the Company has historically entered into variousthird-party production arrangements with other brewing companies. Pursuant to these arrangements, the Company supplies raw materials to those brewing companies, and incurs conversion feeslocations in future periods. See Note I for labor at the time the liquid is produced and packaged.

The Company currently has a brewing services agreement with subsidiaries of City Brewing Company, LLC (“City Brewing”).  During 2019 and 2020, City Brewing supplied approximately 23% and 33%further discussion of the Company’s annual shipment volume, respectively. In accordance with the brewing services agreement, the Company has paid to City $71.6 million dollars for capital improvements at City Brewing facilities and other pre-payments. The Company has the contractual right to extend its agreement with City Brewing beyond the December 31, 2024 termination date on an annual basis through December 31, 2035. At December 26, 2020, the Company had prepaidCompany's third-party brewing service fees of $14.8 million in prepaid expenses and other current assets and $56.8 million in other assets, long term. The Company plans to expense the total amount of $71.6 million over the brewing service agreement periods ending in 2026 based on committed capacity.

In accordance with the City Brewing contract and other production arrangements, the Company is obligated to meet annual minimum volume commitments and is subject to contractual shortfall fees if these annual minimum volume commitments are not met. At December 26, 2020, if volume for the remaining term of the production arrangements were zero, the contractual shortfall fees would total $70.7 million through December 31, 2026. Based on current production volume projections, the Company believes that it will meet all annual volume commitments under these production arrangements and will not incur anythe anticipated shortfall fees. If future volume projections are reduced below the minimum annual volume commitments and the Company estimates thatThe anticipated shortfall fees will be incurred, the Company will expense the estimated shortfall feesare not included in the period when incurring the shortfall fees becomes probable.contractual obligations above.

The Company’s arrangements with other brewing companies require it to periodically purchase equipment in support of brewery operations. As of December 26, 2020, there were no significant equipment purchase requirements outstanding under existing contracts. Changes to the Company’s brewing strategy or existing production arrangements, new production relationships or the introduction of new products in the future may require the Company to purchase equipment to support the contract breweries’ operations.

The Company continues to review the impact the COVID-19 pandemic will have on its future commitments and contingencies but does not believe that the future commitments will be materially impacted.Litigation

Litigation

The Company is currently not a party to any pendinglegal proceedings and claims, including class action claims, where significant damages are asserted against it. Given the inherent uncertainty of litigation, it is possible that the Company could incur liabilities as a consequence of these claims, which may or threatened litigation, the outcome of which would be expected tomay not have a material adverse effect on itsthe Company’s financial condition or the results of its operations. The Company accrues loss contingencies if, in the opinion of management and its legal counsel, the risk of loss is probable and able to be estimated. Material pending legal proceedings are discussed below.

Securities Litigation. On September 14, 2021, a purported class action lawsuit was filed by an individual shareholder in the United States District Court for the Southern District of New York against the Company and three of its officers. The complaint alleged claims under Sections 10(b) and 20(a) of the Securities Exchange Act of 1934 between April 22, 2021 and September 8, 2021. The plaintiff claimed that defendants made materially false and/or misleading statements or failed to disclose material adverse facts about the Company’s business, operations, and prospects. On October 8, 2021, a nearly identical complaint was filed against the Company by an individual shareholder in the United States District Court for the Southern District of New York. The Court consolidated the two actions and on December 14, 2021 appointed a lead plaintiff, who filed an amended complaint on January 13, 2022. The Company’s Motion to Dismiss the Amended Complaint was granted by the Court on December 5, 2022. The plaintiff filed a notice of appeal on January 5, 2023. After briefing and oral argument on the appeal, the United States Court of Appeals for the Second Circuit affirmed the dismissal on November 22, 2023. The Mandate of the United States Court of Appeals was issued and transmitted to the District Court on December 15, 2023.

Supplier Dispute. On December 31, 2022, Ardagh Metal Packaging USA Corp. (“Ardagh”) filed an action against the Company alleging, among other things, that the Company had failed to purchase contractual minimum volumes of certain aluminum beverage can containers in 2021 and 2022. The Company denies that it breached the terms of the parties’ contract and intends to defend against the Ardagh claims vigorously. On February 23, 2023 and April 4, 2023, Ardagh and the Company engaged in mediation sessions with a neutral, third-party mediator, but were not able to resolve the matter and the litigation will proceed. On May 5, 2023, the Company filed an Answer in response to the Complaint, and Counterclaims against Ardagh. On June 26, 2023, Ardagh filed a Motion to Dismiss Certain Counterclaims and a Motion to Strike Certain Affirmative Defenses, to which the Company filed Oppositions on July 24, 2023. On November 9, 2023, Ardagh filed a Notice of Plaintiff’s Motion for Judgment on the Pleadings on Count II of the Complaint, to which the Company filed an Opposition on November 22, 2023. The parties are currently engaged in the fact discovery phase of the matter and the range of potential outcomes cannot be estimated at this time.

N. Fair Value Measurements

M.

Fair Value Measures

The Company defines fair value as the price that would be received to sell an asset or be paid to transfer a liability in an orderly transaction between market participants at the measurement date. The Company applies the following fair value


hierarchy, which prioritizes the inputs used to measure fair value into three levels and bases the categorization within the hierarchy upon the lowest level of input that is available and significant to the fair value measurement. The hierarchy gives

61


the highest priority to unadjusted quoted prices in active markets for identical assets or liabilities (Level 1 measurements) and the lowest priority to unobservable inputs (Level 3 measurements).

Level 1 — Level 1 inputs are quoted prices (unadjusted) in active markets for identical assets or liabilities that the reporting entity has the ability to access at the measurement date.
Level 2 — Level 2 inputs are inputs other than quoted prices included within Level 1 that are observable for the asset or liability, either directly or indirectly. If the asset or liability has a specified (contractual) term, a Level 2 input must be observable for substantially the full term of the asset or liability.
Level 3 — Level 3 inputs are unobservable inputs for the asset or liability in which there is little, if any, market activity for the asset or liability at the measurement date.

Level 1 — Level 1 inputs are quoted prices (unadjusted) in active markets for identical assets or liabilities that the reporting entity has the ability to access at the measurement date.

Level 2 — Level 2 inputs are inputs other than quoted prices included within Level 1 that are observable for the asset or liability, either directly or indirectly. If the asset or liability has a specified (contractual) term, a Level 2 input must be observable for substantially the full term of the asset or liability.

Level 3 — Level 3 inputs are unobservable inputs for the asset or liability in which there is little, if any, market activity for the asset or liability at the measurement date.

The Company’s investments in money market funds are measured at fair value on a recurring basis (at least annually) and are classified within Level 1 of the fair value hierarchy because they are valued using quoted market prices. The money market funds are invested substantially in United States Treasury and government securities. The Company does not adjust the quoted market price for such financial instruments. Cash, receivablesaccounts receivable, accounts payable, and payablesaccrued expenses are carried at their cost, which approximates fair value, because of their short-term nature.

At December 26, 202030, 2023 and December 28, 2019,31, 2022, the Company had money market funds withinvested in a “Triple A” rated money market fund. The Company considers the “Triple A” rated money market fund to be a large, highly-rated investment-grade institution. As of December 26, 2020,30, 2023 and December 28, 2019,31, 2022, the Company’s cash and cash equivalents balance was $163.3$298.5 million and $36.7$180.6 million, respectively, including money market funds amounting to $157.6$291.5 million and $29.5$174.2 million, respectively.

Non-Recurring Fair Value Measurement

The fair value of the Company's Dogfish Head trademark intangible assets is classified within Level 3 of the fair value hierarchy because there are no observable inputs of market activity. When performing a quantitative assessment for impairment of the trademark asset, the Company measures the amount of impairment by calculating the amount by which the carrying value of the trademark asset exceeds its estimated fair value. The estimated fair value is determined based on an income approach using the relief from royalty method, which assumes that, in lieu of ownership, a third party would be willing to pay a royalty in order to exploit the related benefits of the trademark asset. The cash flow projections the Company uses to estimate the fair value of its Dogfish Head trademark intangible asset involves several assumptions, including (i) projected revenue growth, (ii) an estimated royalty rate, (iii) after-tax royalty savings expected from ownership of the trademark and (iv) a discount rate used to derive the estimated fair value of the trademark asset.

O. Common Stock and Share-Based Compensation

N.

Common Stock and Share-Based Compensation

Class A Common Stock

The Class A Common Stock has no voting rights, except (1) as required by law, (2) for the election of Class A Directors, and (3) that the approval of the holders of the Class A Common Stock is required for (a) certain future authorizations or issuances of additional securities which have rights senior to Class A Common Stock, (b) certain alterations of rights or terms of the Class A or Class B Common Stock as set forth in the Articles of Organization of the Company, (c) other amendments of the Articles of Organization of the Company, (d) certain mergers or consolidations with, or acquisitions of, other entities, and (e) sales or dispositions of any significant portion of the Company’s assets.

Class B Common Stock

The Class B Common Stock has full voting rights, including the right to (1) elect a majority of the members of the Company’s Board of Directors and (2) approve all (a) amendments to the Company’s Articles of Organization, (b) mergers or consolidations with, or acquisitions of, other entities, (c) sales or dispositions of any significant portion of the Company’s assets, and (d) equity-based and other executive compensation and other significant corporate matters. The Company’s Class B Common Stock is not listed for trading. Each share of Class B Common Stock is freely convertible into one share of Class A Common Stock, upon request of any Class B holder, and participates equally in earnings.

All distributions with respect to the Company’s capital stock are restricted by the Company’s credit agreement, with the exception of distributions of capital stock from subsidiaries to The Boston Beer Company, Inc. and

Boston Beer Corporation, repurchase from former employees of non-vested investment shares of Class A Common Stock issued under the Company’s equity incentive plan, redemption of certain shares of Class A Common Stock as approved by the Board of Directors and payment of cash dividends to its holders of common stock.

62


Employee Stock Compensation Plan

The Company’s Employee Equity Incentive Plan (the “Equity Plan”) currently provides for the grant of discretionary options, restricted stock awards and restricted stock units to employees, and provides for shares to be sold to employees of the Company at a discounted purchase price under its investment share program. The Equity Plan is administered by the Board of


Directors of the Company, based on recommendations received from the Compensation Committee of the Board of Directors. The Compensation Committee consists of three independent directors. In determining the quantities and types of awards for grant, the Compensation Committee periodically reviews the objectives of the Company’s compensation system and takes into account the position and responsibilities of the employee being considered, the nature and value to the Company of his or her service and accomplishments, his or her present and potential contributions to the success of the Company, the value of the type of awards to the employee and such other factors as the Compensation Committee deems relevant.

Stock options and related vesting requirements and terms are granted at the Board of Directors’ discretion, but generally vest ratably over three to five-year periods and, with respect to certain options granted to members of senior management, based on the Company’s performance. Generally, the maximum contractual term of stock options is ten years, although the Board of Directors may grant options that exceed the ten-year term. During fiscal years 2020, 2019,2023, 2022, and 2018,2021, the Company granted options to purchase 21,99258,054 shares, 26,50717,114 shares, 27,490and 18,998 shares, respectively, of its Class A Common Stock to employees at market pricevalue on the grant dates. Of31,117 of the shares granted in 2020, all shares related to2023 stock option grants were performance-based stock options.while 26,937 were service-based.

During fiscal years 2020, 2019,2023, 2022, and 2018,2021, the Company granted 33,40353,884 shares, 22,50932,744 shares, and 83,56112,867 shares, respectively, of restricted stock units or awards to certain senior managers and key employees. OfAll of the total 20202023 restricted stock unit grants 30,707 are service-based and vest ratably over service periods of onethree to five years and 2,696 are performance-based..

The Equity Plan also has an investment share program which permits employees who have been with the Company for at least one year to purchase shares of Class A Common Stock at a discount from current market value of 0%0% to 40%40%, based on the employee’s tenure with the Company. Investment shares vest ratably over service periods of five years. years. Participants may pay for these shares either up front or through payroll deductions over an eleven-month period during the year of purchase. During fiscal years 2020, 2019,2023, 2022, and 2018,2021, employees elected to purchase an aggregate of 9,12710,594 investment shares, 7,90110,845 investment shares, and 9,2144,954 investment shares, respectively.

The Company has reserved 6.7 million shares of Class A Common Stock for issuance pursuant to the Equity Plan, of which 1.00.9 million shares were available for grant as of December 26, 2020.30, 2023. Shares reserved for issuance under cancelled employee stock options and forfeited restricted stock are returned to the reserve under the Equity Plan for future grants or purchases. The Company also purchases unvested investment shares from employees who have left the Company at the lesser of (i) the price paid for the shares when the employee acquired the shares or (ii) the fair market value of the shares as of the date next preceding the date on which the shares are called for redemption by the Company. These shares are also returned to the reserve under the Equity Plan for future grants or purchases.

Non-Employee Director OptionsPlan

The Company has a stock option and restricted stock unit plan for non-employee directors of the Company (the “Non-Employee Director Plan”), pursuant to which each non-employee director of the Company is granted an optiona combination of options to purchase shares of the Company’s Class A Common Stock and restricted stock units upon election or re-election to the Board of Directors. Stock options issued to non-employee directors vest upon grant and have a maximum contractual term of ten years.years. Restricted stock units granted to non-employee directors vest over a 1-year service period, During fiscal years 2020, 2019,2023, 2022, and 20182021 the Company granted options to purchase an aggregate of 4,4102,941 shares, 4,7793,810 shares, and 5,0801,422 shares of the Company’s Class A Common Stock to non-employee directors, respectively. During fiscal year 2023 1,442 restricted stock units were granted to non-employee directors. No restricted stock units were granted to non-employee directors during fiscal years 2022 or 2021.

The Company has reserved 0.6 million shares of Class A Common Stock for issuance pursuant to the Non-Employee Director Plan, of which 0.1 million shares were available for grant as of December 26, 2020.30, 2023. Shares under any cancelled non-employee directors’ restricted stock units or stock options or options that expire unexercised are returned to the reserve under the Non-Employee Director Plan for future grants.


63


Option Activity

Information related to stock options under the Equity Plan and the Non-Employee Director Plan is summarized as follows:


Shares


Weighted-

Average

Exercise

Price


Weighted-Average

Remaining

Contractual Term

in Years


Aggregate

Intrinsic

Value

(in thousands)


Outstanding at December 28, 2019


315,678


$

186.53


Granted


26,402


393.54


Forfeited


(2,595

)


242


Exercised


(97,638

)


136.87


Outstanding at December 26, 2020


241,847


$

228.58


5.93


$

190,176


Exercisable at December 26, 2020


53,638


$

211.32


5.16


$

43,104


Vested and expected to vest at

   December 26, 2020


217,604


$

227.97


5.91


$

171,246


Shares


Weighted-
Average
Exercise Price


Weighted-
Average
Remaining
Contractual
Term in Years


Aggregate
Intrinsic
Value
(in thousands)


Vested and expected to vest at December 31, 2022


204,245


$

334.26


Granted


60,995


326.17


Exercised


(50,211

)


200.62


Cancelled/Forfeited


(5,756

)


396.86


Expired


(1,463

)


464.33


Outstanding at December 30, 2023


207,810


$

361.53


6.14


$

11,419


Exercisable at December 30, 2023


110,193


$

288.62


4.23


$

9,830


Vested and expected to vest at December 30, 2023


175,897


$

350.85


5.75


$

11,101


Of the total options outstanding at December 26, 2020, 14,96230, 2023, 43,520 shares were performance-based options for which the performance criteria had yet to be achieved and 24,699 shares were performance-based options for which the performance criteria had been met but yet to be approved for vesting by the Board of Directors.achieved.

Stock Compensation to Chief Executive Officer

On April 30, 2018, the Company granted its incoming Chief Executive Officer a performance-based stock option to purchase 9,959 shares of the Company’s Class A Common stock with a weighted average fair value of $100.50 per share, which vests through 2022. The Chief Executive Officer was also granted 64,325 restricted stock awards with a weighted-average fair value of $229.30 per share with service-based vesting through 2023.

Stock-Based Compensation

The following table provides information regarding stock-based compensation expense included in operating expenses in the accompanying consolidated statements of comprehensive income:


2020


2019


2018


(in thousands)


Amounts included in advertising, promotional and

   selling expenses


$

4,467


$

3,996


$

3,243


Amounts included in general and administrative

   expenses


10,815


8,341


6,792


Total stock-based compensation expense


$

15,282


$

12,337


$

10,035


Amounts related to performance-based stock awards

   included in total stock-based compensation expense


$

2,771


$

1,944


$

1,750


As permitted by ASC 718, the Company uses a lattice model, such as the trinomial option-pricing model, to estimate the fair values of stock options. The Company believes that the Black-Scholes option-pricing model is less effective than the trinomial option-pricing model in valuing long-term options, as it assumes that volatility and interest rates are constant over the life of the option. In addition, the Company believes that the trinomial option-pricing model more accurately reflects the fair value of its stock awards, as it takes into account historical employee exercise patterns based on changes in the Company’s stock price and other relevant variables. The weighted-average fair value of stock options granted in fiscal years 2020, 2019, and 2018 was $153.31, $131.91, and $92.89 per share, respectively, as calculated using a trinomial option-pricing model.


Weighted average assumptions used to estimate fair values of stock options on the date of grants arefir fiscal 2023, 2022, and 2021 was as follows:


2020


2019


2018


2023


2022


2021


Expected volatility


32.6

%


32.1

%


34.0

%


39.7

%


38.0

%


36.1

%

Risk-free interest rate


1.09

%


2.63

%


2.68

%


3.96

%


2.11

%


1.45

%

Expected dividends


0

%


0

%


0

%


0

%


0

%


0

%

Exercise factor


2.1 times


2.33 times


2.52 times


2.3 times


3.0 times


2.6 times


Discount for post-vesting restrictions


0.0

%


0.0

%


0.0

%


0.0

%


0.0

%


0.0

%

Expected volatility is based on the Company’s historical realized volatility. The risk-free interest rate represents the implied yields available from the U.S. Treasury zero-coupon yield curve over the contractual term of the option when using the trinomial option-pricing model. Expected dividend yield is 0%0% because the Company has not paid dividends in the past and currently has no known intention to do so in the future. Exercise factor and discount for post-vesting restrictions are based on the Company’s historical experience.

Fair

No options vested during fiscal year 2023. The total fair value of options vested during fiscal years 2022 and 2021 was $6.6 million and $6.3 million, respectively. The aggregate intrinsic value of stock options exercised during fiscal years 2023, 2022, and 2021 was $6.6 million, $6.9 million, and $28.9 million, respectively.

Non-Vested Shares Activity

The following table summarizes vesting activities of shares issued under the investment share program and restricted stock awards:


Number of Shares


Weighted Average Fair Value


Non-vested at December 31, 2022


91,211


$

423.60


Granted


65,920


306.04


Vested


(27,640

)


341.57


Forfeited


(14,694

)


358.43


Non-vested at December 30, 2023


114,797


$

373.56


The fair value of restricted stock awards is based on the Company’s traded stock price on the date of the grants. Fair value of investment shares is calculated using the trinomial option-pricing model.

27,640 shares vested in 2023 with a weighted average fair value of $341.57, 32,476 shares vested in 2022 with a weighted average fair value of $292.27, and 42,038 shares vested in 2021 with a weighted average fair value of $227.40.

64


Stock-Based Compensation

The following table provides information regarding stock-based compensation expense included in operating expenses in the accompanying consolidated statements of comprehensive income:


2023


2022


2021


(in thousands)


Amounts included in general and administrative
   expenses


$

10,370


$

8,804


$

13,003


Amounts included in advertising, promotional, and
   selling expenses


6,601


5,184


5,612


Total stock-based compensation expense


$

16,971


$

13,988


$

18,615


Amounts related to performance-based stock awards
   included in total stock-based compensation expense


$

2,518


$

1,198


$

3,384


The Company uses the straight-line attribution method in recognizing stock-based compensation expense for awards that vest based on service conditions. For awards that vest subject to performance conditions, compensation expense is recognized ratably for each tranche of the award over the performance period if it is probable that performance conditions will be met.

The Company recognizes compensation expense, less estimated forfeitures of 13.0%. Theforfeitures. For Equity Plan awards during fiscal year 2023, the estimated forfeiture rate iswas 20.0% for stock options and 12% for restricted stock units and investment shares. The estimated forfeiture rate was 19.0%, and 13.0% for all types of awards during fiscal years 2022, and 2021, respectively. The estimated forfeiture rates used are based upon historical experience with the various award types and the Company periodicallyannually reviews this ratethese rates to ensure proper projection of future forfeitures.

The total fair value of options vested during fiscal years 2020, 2019, and 2018 was $4.8 million, $2.5 million, and $3.2 million, respectively. The aggregate intrinsic value of stock options exercised during fiscal years 2020, 2019, and 2018 was $45.9 million, $20.9 million, and $19.2 million, respectively.

Based on equity awards outstanding as of December 26, 2020,30, 2023, there is $28.6$33.1 million of unrecognized compensation costs, net of estimated forfeitures, related to unvested share-based compensation arrangements that are expected to vest. Such costs are expected to be recognized over a weighted-average period of 2.01.8 years.

Non-Vested Shares Activity

The following table summarizes vesting activities of shares issued under the investment share program and restricted stock awards:


Number of

Shares


Weighted

Average Fair

Value


Non-vested at December 28, 2019


122,142


$

213.52


Granted


42,530


350.96


Vested


(45,860

)


214.23


Forfeited


(4,496

)


236.63


Non-vested at December 26, 2020


114,316


$

263.47


45,860 shares vested in 2020 with a weighted average fair value of $214.23, 33,205 shares vested in 2019 with a weighted average fair value of $188.63, and 20,678 shares vested in 2018 with a weighted average fair value of $156.50.


Stock Repurchase Program

In 1998, the Company began a share repurchase program. Under this program, the Company's Board of Directors has authorized the repurchase of the Company's Class A Stock. On May 18, 2023, the Board of Directors authorized management to implement aan increase in the aggregate expenditure limit for the Company’s stock repurchase program.program by $269.0 million, increasing the limit from $931.0 million to $1.2 billion. The Board of Directors did not specify a date upon which the total authorization would expire and, in the future, can further increase the authorized amount. Share repurchases under this program for the periods included herein were effected through open market transactions

During fiscal year 2023, the Company repurchased and subsequently retired 276,045 shares of its Class A Common Stock for an aggregate purchase price of $92.9 million. As of December 26, 2020,30, 2023, the Company hashad repurchased a cumulative total of approximately 13.814.1 million shares of its Class A Common Stock for an aggregate purchase price of approximately $840.7$933.5 million as follows:


Number of

Shares


Aggregate

Purchase Price


(in thousands)


Repurchased at December 30, 2017


13,447,346


$

752,352


2018 repurchases


349,691


88,312


Repurchased at December 29, 2018


13,797,037


840,664


2019 repurchases


Repurchased at December 28, 2019


13,797,037


840,664


2020 repurchases


Repurchased at December 26, 2020


13,797,037


$

840,664


O.

Employee Retirement Plans and Post-Retirement Medical Benefits

The Company has 1 retirement plan covering substantially all non-union employees; 2 other retirement plans, one of which covers substantially all union employees, and had approximately $266.5 million remaining on the other of which covers employees of a specific union which was terminated in 2020; and post-retirement medical benefits covering substantially all union employees.

Non-Union Plans

The Boston Beer Company 401(k) Plan (the “Boston Beer 401(k) Plan”), which was established$1.2 billion stock repurchase expenditure limit set by the Company in 1993, is a Company-sponsored defined contribution plan that covers a majorityBoard of theDirectors.

P. Employee Retirement Plans and Post-Retirement Medical Benefits

The Company’s workforce comprises mostly of non-union employees who are employed by Boston Beer Corporation, American Craft Brewery LLC, A & S Brewing Collaborative LLC, or Angry Orchard Cider Company, LLC. AllAs of December 30, 2023, the Company had three unions at its Cincinnati Brewery: Local 1, Local 20, and Teamsters Local Union. No. 1199 (“Local Union 1199”). The Company has different retirement and post-retirement plans available to each group of employees. The Boston Beer Company 401(k) Plan (the “Boston Beer 401(k) Plan”) covers most non-union employees and all members of these entitiesLocal 1 and Local Union 1199. The Samuel Adams Cincinnati Brewery 401(k) Plan for Represented Employees (the “SACB 401(k) Plan”) covers members of Local 20. The Company additionally provides a supplement to eligible retirees from Local 1, Local 20, and Local Union 1199 to assist with the cost of Medicare gap coverage after their retirement on account of age or permanent disability (collectively, the “Retiree Medical Plan”). The Company previously offered a pension plan (the “Local 1199 Pension Plan”) to members of Local Union 1199 until the plan was terminated effective January 1, 2020.

Boston Beer 401(k) Plan

65


The Boston Beer 401(k) Plan, which was established by the Company in 1993, is a Company-sponsored defined contribution. Most non-union employees and all members of the Local 1 and Local 1199 unions are eligible to participate in the Plan immediately upon employment.employment. Participants may make voluntary contributions up to 60%60% of their annual compensation, subject to IRS limitations. The Company matches each participant’s contribution. A maximum of 5%5% of compensation is taken into account in determining the amount of the match. In January 2020, the Company amended the Boston Beer 401(k) Plan to update the Company match as follows: 100%100% of the first 3%3% of the eligible compensation participants contribute. Thereafter, the Company matches 50%50% of the next 2% of the eligible contribution, up to a maximumcompensation participants contribute. Beginning April 1, 2023, for Local 1 union members specifically, the Company match is 100% of 5%.the first 5% of the eligible contribution. The Company’s contributions to the Boston Beer 401(k) Plan amounted to $6.4$8.8 million, $4.0$7.6 million, and $3.5$7.4 million in fiscal years 2020, 2019,2023, 2022, and 2018,2021, respectively. The basic annual administrative fee for the Boston Beer

SACB 401(k) Plan is paid

The “SACB 401(k) Plan”, which was established by the Plan’s investment fund revenue. In addition, per the Service Provider Payment Agreement, a credit up to a maximum of two basis points multiplied by the total amount of assets under the Plan per year is available for paying eligible Plan expenses. Participant forfeitures are also available for paying eligible Plan expenses. The Company is responsible for the payment of any additional fees related to the management of the Boston Beer 401(k) Plan. Such fees are not material to the Company.

As part of the Dogfish Head Transaction, the Company acquired The Dogfish Head 401(k) Plan (the “Dogfish Head 401(k) Plan”), which is a Company-sponsored defined contribution plan that is available to all Dogfish Head employees. Participants may make voluntary contributions up to 60% of their annual compensation, subject to IRS limitations. The Company matches each participant’s contribution. A maximum of 5% of compensation is taken into account in determining the amount of the match. The Company matches 100% of the first 3% of the eligible compensation participants contribute. Thereafter, the Company matches 50% of the eligible contribution. The Company’s contributions to the Dogfish Head 401(k) Plan amounted to $0.3 million in fiscal year 2019. In January 2020, the Dogfish Head 401(k) Plan merged with the Boston Beer 401(k) Plan.

Union Plans

The Samuel Adams Cincinnati Brewery 401(k) Plan for Represented Employees (the “SACB 401(k) Plan”)1997, is a Company-sponsored defined contribution plan. It was established in 1997 and is available to all union employeesmembers of Local 20 upon commencement of employment or, if later, attaining age 21. Participants may make voluntary contributions up to 60%60% of their annual compensation to the SACB 401(k) Plan, subject to IRS limitations. Company contributions for fiscal years 20202023, 2022, and 20192021 were insignificant. The basic annual administrative fee for the SACB 401(k) Plan is paid by the Plan’s investment fund


revenue. In addition, per the Service Provider Payment Agreement, a credit up to a maximum of two basis points multiplied by the total amount of assets under the Plan per year, excluding participant loans, is available for paying eligible Plan expenses. The Company is responsible for the payment of any additional fees related to the management of the SACB 401(k) Plan. Such fees are not material to the Company.

The Samuel Adams Brewery Company, Ltd. Local Union No. 1199 Pension Plan (the “Local 1199 Pension Plan”) was a Company-sponsored defined benefit pension plan. It was established in 1991 and was open to all union employees who are covered by the Company’s collective bargaining agreement with Teamsters Local Union. No. 1199 (“Local Union 1199”), or persons on leave from the Company who are employed by Local Union 1199, and in either case who have completed 12 consecutive months of employment with at least 750 hours worked. The defined benefit is determined based on years of service since July 1991. On April 21, 2019, the Company reached an agreement with the Local Union 1199 to terminate the Local Union No. 1199 Pension Plan effective January 1, 2020 through either lump sum payments or the purchase of third-party annuities.  On May 28, 2020, the Company received a positive determination letter for the termination on the plan from the IRS. During 2020, the Company completed the termination of the plan and recorded an expense of $2.0 million as a result of the termination. The Company made contributions of $2.9 million, $0.3 million and $0.3 million in fiscal years 2020, 2019 and 2018, respectively. As of December 26, 2020, there was 0 unfunded projected pension benefit.  As of December 28, 2019, the unfunded projected pension benefits were $2.7 million .

The Company provides a supplement to eligible retirees from Local 1, Local 20, and Local Union 1199 to assist them with the cost of Medicare gap coverage after their retirement on account of age or permanent disability. Retiree Medical Plan

To qualify for this benefit, (collectively, the “Retiree Medical Plan”), an eligible employee must have worked for at least 20 years for the Company or its predecessor at the Company’s Cincinnati Brewery as a part of one of its three unions, must have been enrolled in the Company’s group medical insurance plan for at least 5 years before retirement, and, in the case of retirees from Local 20, for at least 7 of the last 10 years of their employment, and must be eligible for Medicare benefits under the Social Security Act. The accumulated post-retirement benefit obligation was determined using a discount rate of 2.50%5.03% at December 26, 202030, 2023 and 3.32%5.22% at December 28, 201931, 2022 and a 2.50%2.50% health care cost increase based on the Cincinnati Consumer Price Index for the years 2020, 2019,2023 and 2018.2022. The effect of a 1% point increase and the effect of a 1% point decrease in the assumed health care cost trend rates on the aggregate of the service and interest cost components of net periodic post-retirement health care benefit costs and on the accumulated post-retirement benefit obligation for health care benefits would not be significant.

In addition, the comprehensive medical plan offered to currently employed members of Local 20 remains available to them should they retire after reaching age 57, and before reaching age 65, with at least 20 years of service with the Company or its predecessor at the Company’s Cincinnati Brewery. These eligible retirees may choose to continue to be covered under the Company’s comprehensive group medical plan until they reach the age when they are eligible for Medicare health benefits under the Social Security Act or coverage under a comparable State health benefit plan. Eligible retirees pay 100%100% of the cost of the coverage.

The funded status of the Local 1199 Pension Plan and the Retiree Medical Plan areis as follows:follows at:


Retiree Medical Plan


December 30,
2023


December 31,
2022


Benefit obligation at end of period


$

828


$

757


Unfunded Status


$

828


$

757


Local 1199 Pension Plan


Retiree Medical Plan


December 26,

2020


December 28,

2019


December 26,

2020


December 28,

2019


(in thousands)


Fair value of plan assets at end of fiscal

   year


$


$

3,946


$


$


Benefit obligation at end of fiscal year


6,680


1,077


888


Unfunded Status


$


$

(2,734

)


$

(1,077

)


$

(888

)

66


The Local 1199 Plan’s weighted-average asset allocations at the measurement dates by asset category are as follows:

Q. Net Income per Share

Asset Category


December 26,

2020


December 28,

2019


Cash equivalents


0

%


100

%

Equity securities


0

%


0

%

Debt securities


0

%


0

%

Total


0

%


100

%


P.

Net Income per Share

Net Income per Common Share - Basic

The following table sets forth the computation of basic net income per share using the two-class method:


December 30,


December 31,


December 25,


2023


2022


2021


(in thousands, except per share data)


Net Income


$

76,250


$

67,263


$

14,553


Allocation of net income for basic:


Class A Common Stock


$

63,216


$

55,812


$

11,995


Class B Common Stock


12,880


11,293


2,506


Unvested participating shares


154


158


52


$

76,250


$

67,263


$

14,553


Weighted average number of shares for basic:


Class A Common Stock


10,150


10,221


10,121


Class B Common Stock*


2,068


2,068


2,115


Unvested participating shares


25


28


44


12,243


12,317


12,280


Net income per share for basic:


Class A Common Stock


$

6.23


$

5.46


$

1.19


Class B Common Stock


$

6.23


$

5.46


$

1.19


December 26,


December 28,


December 29,


2020


2019


2018


(in thousands, except per share data)


Net Income


$

191,960


$

110,041


$

92,663


Allocation of net income for basic:


Class A Common Stock


$

153,106


$

82,474


$

68,080


Class B Common Stock


37,690


26,600


23,710


Unvested participating shares


1,164


967


873


$

191,960


$

110,041


$

92,663


Weighted average number of shares for basic:


Class A Common Stock


9,734


8,908


8,620


Class B Common Stock*


2,396


2,873


3,002


Unvested participating shares


74


105


111


12,204


11,886


11,733


Net income per share for basic:


Class A Common Stock


$

15.73


$

9.26


$

7.90


Class B Common Stock


$

15.73


$

9.26


$

7.90


*Changes in Class B Common Stock resulted from the conversion to Class A Common stock during fiscal 2022 as disclosed in the Company's consolidated statements of stockholders' equity.

*

Change in Class B Common Stock resulted from the conversion of 100,000 shares to Class A Common Stock on November 1, 2018, 100,000 shares to Class A Common stock on August 8, 2019 and 145,000 shares to Class A Common stock on December 13, 2019, 150,000 shares to Class A Common Stock on March 11, 2020, 215,000 shares to Class A Common Stock on May 6, 2020 and 130,000 shares to Class A Common Stock on November 3, 2020 with the ending number of shares reflecting the weighted average for the period.

Net Income per Common Share - Diluted

The Company calculates diluted net income per share for common stock using the more dilutive of (1) the treasury stock method, or (2) the two-class method, which assumes the participating securities are not exercised or converted.

The following tables set forth the computation of diluted net income per share, assuming the conversion of all Class B Common Stock into Class A Common Stock and using the two-class method for unvested participating shares:Stock:


Fiscal year ended December 30, 2023


Earnings to
Common
Shareholders


Common
Shares


EPS


(in thousands, except per share data)


As reported - basic


$

63,216


10,150


$

6.23


Add: effect of dilutive potential common shares


Share-based awards


40


Class B Common Stock


12,880


2,068


Net effect of unvested participating shares


Net income per common share - diluted


$

76,096


$

12,258


$

6.21


Fiscal year ended December 31, 2022


Earnings to
Common
Shareholders


Common
Shares


EPS


(in thousands, except per share data)


As reported - basic


$

55,812


10,221


$

5.46


Add: effect of dilutive potential common shares


Share-based awards


56


Class B Common Stock


11,293


2,068


Net effect of unvested participating shares


1


Net income per common share - diluted


$

67,106


12,345


$

5.44


Fifty-two weeks ended December 26, 2020


Earnings to

Common

Shareholders


Common

Shares


EPS


(in thousands, except per share data)


As reported - basic


$

153,106


9,734


$

15.73


Add: effect of dilutive potential common shares


Share-based awards


153


Class B Common Stock


37,690


2,396


Net effect of unvested participating shares


14


Net income per common share - diluted


$

190,810


$

12,283


15.53


67


Fifty-two weeks ended December 28, 2019


Fiscal year ended December 25, 2021


Earnings to

Common

Shareholders


Common

Shares


EPS


Earnings to
Common
Shareholders


Common
Shares


EPS


(in thousands, except per share data)


(in thousands, except per share data)


As reported - basic


$

82,474


8,908


$

9.26


$

11,995


10,121


$

1.19


Add: effect of dilutive potential common shares


Share-based awards


127


138


Class B Common Stock


26,600


2,873


2,506


2,115


Net effect of unvested participating shares


10


52


62


Net income per common share - diluted


$

109,084


11,908


9.16


$

14,553


12,436


$

1.17


Fifty-two weeks ended December 29, 2018


Earnings to

Common

Shareholders


Common

Shares


EPS


(in thousands, except per share data)


As reported - basic


$

68,080


8,620


$

7.90


Add: effect of dilutive potential common shares


Share-based awards


112


Class B Common Stock


23,710


3,002


Net effect of unvested participating shares


8


Net income per common share - diluted


$

91,798


11,734


$

7.82


Basic net income per common share for each share of Class A Common Stock and Class B Common Stock is $15.73, $9.26,$6.23, $5.46, and $7.90$1.19 for the fiscal years 2020, 2019,2023, 2022, and 2018,2021, respectively, as each share of Class A and Class B participates equally in earnings. Shares of Class B are convertible at any time into shares of Class A on a 1-for-oneone-for-one basis at the option of the stockholder.

There were 0 stock options with anti-dilutive effects that were excluded in computing diluted income during fiscal 2020.

Weighted average stock options to purchase 23,000,approximately 52,000, 17,000, and 100,00017,000 shares of Class A Common Stock were outstanding during fiscal 2019,years 2023, 2022, and 2018,2021, respectively, but not included in computing diluted income per share because their effects were anti-dilutive. Additionally, performance-based stock options to purchase 10,000,approximately 54,000, 1,000, and 10,000 shares of Class A Common Stock1,000 performance awards were outstanding during fiscal 2019,years 2023, 2022, and 2018,2021, respectively, but not included in computing dilutive income per share because the performance criteria of these stock options were not met as of December 28, 2019, and December 29, 2018, respectively.at the respective fiscal year ends.

R. Accumulated Other Comprehensive Loss

Q.

Accumulated Other Comprehensive Loss

Accumulated other comprehensive loss represents cumulative currency translation adjustments and amounts of unrecognized actuarial gains or losses related to the Company sponsored defined benefit pension plan and post-retirement medical plan, net of tax effect, and cumulative currency translation adjustments.effect. Changes in accumulated other comprehensive loss represent currency translation adjustments due to exchange rate fluctuations in the period and actuarial losses or gains, net of tax effect, recognized as components of net periodic benefit costs and currency translation adjustments due to tax rate changes in


costs. the period. The following table detailscomponents of the changes in accumulated other comprehensive loss for 2020, 2019,was as follows as of::


December 30,


December 31,


2023


2022


(in thousands)


Cumulative currency translation adjustments


$

(141

)


$

(307

)

Deferred benefit costs, net of tax


84


97


Total accumulated other comprehensive loss


$

(57

)


$

(210

)

S. Valuation and 2018 (in thousands):Qualifying Accounts


Accumulated

Other

Comprehensive

(Loss) Income


Balance at December 30, 2017


$

(1,288

)

Deferred pension and other post-retirement benefit costs,

   net of taxes of $64


191


Amortization of Deferred benefit costs, net of taxes of $29


86


One time effect of adoption of ASU 2018-02,

   Reclassification of Certain Tax Effects from

   Accumulated Other Comprehensive Income


(211

)

Currency translation adjustment


25


Balance at December 29, 2018


$

(1,197

)

Deferred pension and other post-retirement benefit costs,

   net of taxes of $150


(442

)

Amortization of Deferred benefit costs, net of taxes of $26


(77

)

Currency translation adjustment


47


Balance at December 28, 2019


$

(1,669

)

Deferred pension and other post-retirement benefit costs,

   net of tax benefit of $502


1,611


Amortization of Deferred benefit costs, net of taxes of $35


(219

)

Currency translation adjustment


25


Balance at December 26, 2020


$

(252

)


R.

Valuation and Qualifying Accounts

The Company maintains reserves against accounts receivable for doubtful accounts and inventory for obsolete and slow-moving inventory. The Company also maintains reserves against accounts receivable for distributor promotional allowances. In addition, the Company maintains a reserve for estimated returns of stale beer, which is included in accrued expenses.

Allowance for Credit Losses


Balance at
Beginning of
Period


Net Provision
(Recovery)


Amounts
Charged Against
Reserves


Balance at
End of Period


(In thousands)


2023


$

418


$

15


$

(6

)


$

427


2022


$

353


$

326


$

(261

)


$

418


2021


$

535


$

182


$

(364

)


$

353


Discount Accrual


Balance at
Beginning of
Period


Net Provision
(Recovery)


Amounts
Charged Against
Reserves


Balance at
End of Period


(In thousands)


2023


$

8,179


$

62,620


$

(62,846

)


$

7,953


2022


$

11,221


$

54,825


$

(57,867

)


$

8,179


2021


$

9,357


$

72,680


$

(70,816

)


$

11,221


68


Inventory Obsolescence Reserve


Balance at
Beginning of
Period


Net Provision
(Recovery)


Amounts
Charged Against
Reserves


Balance at
End of Period


(In thousands)


2023


$

21,976


$

19,328


$

(33,664

)


$

7,640


2022


$

43,055


$

35,867


$

(56,946

)


$

21,976


2021


$

6,331


$

62,616


$

(25,892

)


$

43,055


Stale Beer Reserve


Balance at
Beginning of
Period


Net Provision
(Recovery)


Amounts
Charged Against
Reserves


Balance at
End of Period


(In thousands)


2023


$

5,580


$

18,772


$

(16,112

)


$

8,240


2022


$

6,045


$

19,589


$

(20,054

)


$

5,580


2021


$

3,092


$

9,537


$

(6,584

)


$

6,045


T. Licensing Agreements

Pepsi Licensing Agreement

On August 9, 2021, the Company signed a series of agreements with PepsiCo, Inc. (“Pepsi”) to develop, market, and sell alcohol beverages. Under the agreements, the Company is responsible for developing, manufacturing, and marketing a flavored malt beverage product under the HARD MTN DEW® brand. As part of the agreements, Pepsi provides certain proprietary ingredients and also licenses the Company the use of its HARD MTN DEW® trademark in connection with manufacturing, promoting, marketing, and distributing the developed product, primarily through the Pepsi distribution network.

During fiscal 2022 and 2023, distribution was primarily managed through the Pepsi Network per terms of the original agreements. Pursuant to these terms, the Company made payments to Pepsi for proprietary ingredients, freight costs to ship the product to Pepsi, and certain marketing services. The costs of the proprietary ingredients above fair market value are recorded within net revenue at the time revenue is recognized for the flavored malt beverages sold to Pepsi and were $2.0 million and $2.5 million during fiscal 2023 and 2022, respectively. Freight costs and marketing costs are recorded in advertising, promotional, and selling expenses. The excess costs over fair market value of proprietary ingredients on hand at the end of the period are classified within prepaid expenses and other current assets. The excess over fair market value for inventory on hand was $0.1 million and $0.4 million as of December 30, 2023 and December 31, 2022, respectively. During fiscal 2023 and 2022, total net revenue recognized under these agreements amounted to approximately 2% of the Company's total net revenues.

On February 24, 2024, the Company and Pepsi amended the terms of these agreements, most notably to change distribution from the Pepsi Distribution network to the Company’s distribution network. The transition of distributor networks is expected to begin in May of 2024 and extend into 2025. Under the agreements, the Company is responsible for developing, manufacturing, and marketing a flavored malt beverage product under Pepsi’s MTN DEW® brand. Pepsi provides certain proprietary ingredients and also licenses the Company the use of its HARD MTN DEW® trademark in connection with manufacturing, promoting, marketing, and distributing the developed product.

Allowance for Doubtful Accounts


Balance at

Beginning of

Period


Net Provision

(Recovery)


Amounts

Charged Against

Reserves


Balance at

End of Period


(In thousands)


2020


$

47


$

488


$


$

535


2019


$

2


$

45


$


$

47


2018


$


$

2


$


$

2


U. Related Party Transactions

Discount Accrual


Balance at

Beginning of

Period


Net Provision

(Recovery) *


Amounts

Charged Against

Reserves


Balance at

End of Period


(In thousands)


2020


$

6,272


$

59,279


$

(56,194

)


$

9,357


2019


$

4,636


$

43,920


$

(42,284

)


$

6,272


2018


$

3,072


$

36,213


$

(34,649

)


$

4,636


Inventory Obsolescence Reserve


Balance at

Beginning of

Period


Net Provision

(Recovery)


Amounts

Charged Against

Reserves


Balance at

End of Period


(In thousands)


2020


$

6,375


$

11,248


$

(11,292

)


$

6,331


2019


$

2,580


$

8,092


$

(4,297

)


$

6,375


2018


$

1,826


$

4,175


$

(3,421

)


$

2,580


Stale Beer Reserve


Balance at

Beginning of

Period


Net Provision

(Recovery)


Amounts

Charged Against

Reserves


Balance at

End of Period


(In thousands)


2020


$

1,828


$

8,411


$

(7,147

)


$

3,092


2019


$

2,146


$

4,406


$

(4,724

)


$

1,828


2018


$

3,023


$

2,691


$

(3,568

)


$

2,146


*

2018 net provision of the discount accrual includes $1.7 million related to the cumulative effect adjustment to retained earnings and the current year adjustment to deferred revenue related to the adoption of ASU 2014-09.

S.

Related Party Transactions

The Company has entered into a lease with the Dogfish Head founders and other owners of buildings used in certain of the Company’s restaurant operations. The lease is for ten years with renewal options. The total payments due under the initial ten year term is $3.6$3.6 million. Total related party expense recognized was approximately $366,000, $366,000 and $348,000for fiscal 2020 was approximately $348,000. During 2020, the Company entered into an agreement to sell a boat2023, 2022, and a car2021, respectively. Other related party expenses and transactions totaled less than $0.1 million for fiscal 2023, 2022, and 2021.

V. Subsequent Events

See Note I to the Dogfish Head founders at market valueConsolidated Financial Statements of approximately $26,000. In addition,this Form 10-K for fiscal 2020,discussion of the Company incurred expenses$20 million loan to City Brewing on January 2, 2024. See Note T to the Consolidated Financial Statements of less than $50,000this Form 10-K for discussion of the February 24, 2024 amendment to various other suppliers affiliatedthe Company's agreements with the Dogfish Head founders.

T.

Subsequent Events

Pepsi. The Company evaluated subsequent events occurring after the balance sheet date, December 26, 2020,30, 2023, through the issuance of these financial statements and concluded that there were no other

69


events of which management was aware that occurred after the balance sheet date that would require any adjustment to or disclosure in the accompanying consolidated financial statements.

70


Item 9. Changes in and Disagreements with Accountants on Accounting and Financial Disclosures

None.

Item 9A. Controls and Procedures

U.

Quarterly Results (Unaudited)

The Company’s fiscal quarters are consistently determined year to year and generally consist of 13 weeks, except in those fiscal years in which there are fifty-three weeks where the last fiscal quarters then consist of 14 weeks. In management’s opinion, the following unaudited information includes all adjustments, consisting of normal recurring adjustments, necessary for a fair presentation of the information for the quarters presented. The operating results for any quarter are not necessarily indicative of results for any future quarters.


For Quarters Ended


December 26,

2020


September 26,

2020


June 27,

2020


March 28,

2020


December 28,

2019 (1)


September 28,

2019 (1)


June 29,

2019 (1)


March 30,

2019


(13 weeks)


(13 weeks)


(13 weeks)


(13 weeks)


(13 weeks)


(13 weeks)


(13 weeks)


(13 weeks)


(In thousands, except per share data)


Net revenue


$

460,937


$

492,792


$

452,138


$

330,565


$

301,300


$

378,466


$

318,407


$

251,651


Gross profit


216,270


240,585


209,624


147,973


142,789


187,835


159,002


124,540


Operating income


42,125


101,781


78,769


21,532


17,702


59,836


37,932


29,443


Net income


$

32,817


$

80,768


$

60,141


$

18,234


$

13,762


$

44,729


$

27,856


$

23,694


Net income per share – basic


$

2.68


$

6.61


$

4.93


$

1.50


$

1.13


$

3.70


$

2.39


$

2.04


Net income per share – diluted


$

2.64


$

6.51


$

4.88


$

1.49


$

1.12


$

3.65


$

2.36


$

2.02


(1)

During the second, third and fourth quarter of 2019, the Company recorded $1.9 million, $5.9 million and $2.1 million in non-reoccurring transaction fees related to the Dogfish Head Transaction, respectively.


Item 9.

Changes in and Disagreements with Accountants on Accounting and Financial Disclosures

None.

Item 9A.

Controls and Procedures

(a) Evaluation of disclosure controls and procedures

The Company’s management, including the Chief Executive Officer and the Chief Financial Officer, carried out an evaluation of the effectiveness of the Company’s disclosure controls and procedures (as such term is defined in Rules 13a-15(e) and 15d-15(e) under the Securities Exchange Act of 1934, as amended) as of the end of the period covered by this report. Based on this evaluation, the Company’s Chief Executive Officer and Chief Financial Officer concluded that the Company’s disclosure controls and procedures were effective in alerting them in a timely manner to material information required to be disclosed in the Company’s reports filed with or submitted to the SEC.

(b) Management’s Report on Internal Control Over Financial Reporting

The management of the Company is responsible for establishing and maintaining adequate internal control over financial reporting, as such term is defined in Exchange Act Rules 13a-15(f). The Company’s internal control system was designed to provide reasonable assurance to the Company’s management and Board of Directors regarding the preparation and fair presentation of published financial statements.

The Company’s management assessed the effectiveness of the Company’s internal control over financial reporting as of December 26, 2020.30, 2023. In making this assessment, the Company used the criteria set forth by the Committee of Sponsoring Organizations of the Treadway Commission (COSO) in Internal Control—Integrated Framework (2013 framework). Based on its assessment, the Company believes that, as of December 26, 2020,30, 2023, the Company’s internal control over financial reporting is effective based on those criteria.

The effectiveness of the Company’s internal control over financial reporting as of December 26, 202030, 2023 has been audited by Deloitte & Touche LLP, an independent registered public accounting firm, as stated in their report.

Because of its inherent limitations, internal control over financial reporting may not prevent or detect misstatements. Also, projections of any evaluation of effectiveness to future periods are subject to the risk that controls may become inadequate because of changes in conditions, or that the degree of compliance with the policies or procedures may deteriorate.

(c) Changes in internal control over financial reporting

No changes in the Company’s internal control over financial reporting occurred during the quarter ended December 26, 202030, 2023 that have materially affected, or are reasonably likely to materially affect, the Company’s internal control over financial reporting.

71


REPORT OF INDEPENDENT REGISTERED PUBLIC ACCOUNTING FIRM

To the shareholdersShareholders and Board of Directors of The Boston Beer Company, Inc. Boston, Massachusetts

Opinion on Internal Control over Financial Reporting

We have audited the internal control over financial reporting of The Boston Beer Company, Inc. and subsidiaries (the “Company”) as of December 26, 2020,30, 2023, based on criteria established in Internal Control — Integrated Framework (2013) issued by the Committee of Sponsoring Organizations of the Treadway Commission (COSO). In our opinion, the Company maintained, in all material respects, effective internal control over financial reporting as of December 26, 2020,30, 2023, based on criteria established in Internal Control — Integrated Framework (2013) issued by COSO.

We have also audited, in accordance with the standards of the Public Company Accounting Oversight Board (United States) (PCAOB), the consolidated financial statements as of and for the year ended December 26, 2020,30, 2023, of the Company and our report dated February 17, 202127, 2024, expressed an unqualified opinion on those financial statements.


Basis for Opinion

The Company’s management is responsible for maintaining effective internal control over financial reporting and for its assessment of the effectiveness of internal control over financial reporting, included in the accompanying Management’s Report on Internal Control Over Financial Reporting. Our responsibility is to express an opinion on the Company’s internal control over financial reporting based on our audit. We are a public accounting firm registered with the PCAOB and are required to be independent with respect to the Company in accordance with the U.S. federal securities laws and the applicable rules and regulations of the Securities and Exchange Commission and the PCAOB.

We conducted our audit in accordance with the standards of the PCAOB. Those standards require that we plan and perform the audit to obtain reasonable assurance about whether effective internal control over financial reporting was maintained in all material respects. Our audit included obtaining an understanding of internal control over financial reporting, assessing the risk that a material weakness exists, testing and evaluating the design and operating effectiveness of internal control based on the assessed risk, and performing such other procedures as we considered necessary in the circumstances. We believe that our audit provides a reasonable basis for our opinion.

Definition and Limitations of Internal Control over Financial Reporting

A company’s internal control over financial reporting is a process designed to provide reasonable assurance regarding the reliability of financial reporting and the preparation of financial statements for external purposes in accordance with generally accepted accounting principles. A company’s internal control over financial reporting includes those policies and procedures that (1) pertain to the maintenance of records that, in reasonable detail, accurately and fairly reflect the transactions and dispositions of the assets of the company; (2) provide reasonable assurance that transactions are recorded as necessary to permit preparation of financial statements in accordance with generally accepted accounting principles, and that receipts and expenditures of the company are being made only in accordance with authorizations of management and directors of the company; and (3) provide reasonable assurance regarding prevention or timely detection of unauthorized acquisition, use, or disposition of the company’s assets that could have a material effect on the financial statements.

Because of its inherent limitations, internal control over financial reporting may not prevent or detect misstatements. Also, projections of any evaluation of effectiveness to future periods are subject to the risk that controls may become inadequate because of changes in conditions, or that the degree of compliance with the policies or procedures may deteriorate.

/s/ Deloitte & Touche LLP

Boston, Massachusetts

February 17, 202127, 2024

72


Item 9B. Other Information

Insider Trading Agreements

The table below sets forth information regarding trading plans adopted during the quarter ended December 30, 2023 by an executive officer that is intended to satisfy the affirmative defense conditions of Securities Exchange Act Rule 10b5-1(c):

Name and Title

Date of Adoption of Plan

Duration of Plan

Aggregate Number of Shares to Be Purchased or Sold Pursuant to Plan

Description of the Material Terms of the Rule 10b5-1 Trading Arrangement

Dave Burwick,
President, Chief Executive Officer

November 6, 2023

March 6, 2024 - June 4, 2024

Up to 1,116

Vested stock option sales

Item 9C. Disclosure Regarding Foreign Jurisdictions that Prevent Inspections

Not Applicable

73


Item 9B.

Other Information

None.


PART III.

Item 10. Directors, Executive Officers and Corporate Governance

Item 10.

Directors, Executive Officers and Corporate Governance

In December 2002, the Board of Directors of the Company adopted a (i) Code of Business Conduct and Ethics that applies to its Chief Executive Officer and its Chief Financial Officer, and (ii) Corporate Governance Guidelines. The Code of Business Conduct and Ethics was amended effective August 1, 2007 to provide for a third-party whistleblower hotline. These, as well as the charters of each of the Board Committees, are posted on the Company’s investor relations website, www.bostonbeer.com, and are available in print to any shareholder who requests them. Such requests should be directed to the Investor Relations Department, The Boston Beer Company, Inc., One Design Center Place, Suite 850, Boston, MA 02210. The Company intends to disclose any amendment to, or waiver from, a provision of its code of ethics that applies to the Company’s Chief Executive Officer or Chief Financial Officer and that relates to any element of the Code of Ethics definition enumerated in Item 406 of Regulation S-K by posting such information on the Company’s website.

The information required by Item 10 is hereby incorporated by reference from the registrant’s definitive Proxy Statement for the 20212024 Annual Meeting to be held on May 20, 2021.7, 2024.

Item 11. Executive Compensation

Item 11.

Executive Compensation

The Information required by Item 11 is hereby incorporated by reference from the registrant’s definitive Proxy Statement for the 20212024 Annual Meeting to be held onMay 20, 2021.7, 2024.

Item 12.

Security Ownership of Certain Beneficial Owners and Management and Related Stockholder Matters

Item 12. Security Ownership of Certain Beneficial Owners and Management and Related Stockholder Matters

Security Ownership

The information required by Item 12 with respect to security ownership of certain beneficial owners and management is hereby incorporated by reference from the registrant’s definitive Proxy Statement for the 20212024 Annual Meeting to be held on May 20, 2021.7, 2024.

Related Stockholder Matters

EQUITY COMPENSATION PLAN INFORMATION

Plan Category


Number of

Securities to

be Issued Upon

Exercise of

Outstanding

Options,

Warrants and

Rights


Weighted-

Average

Exercise Price of

Outstanding

Options,

Warrants and

Rights


Number of

Securities

Remaining

Available

for Future

Issuance

Under Equity

Compensation

Plans


Equity Compensation Plans Approved by

   Security Holders


241,847


$

228.58


1,108,791


Equity Compensation Plans Not Approved by

   Security Holders


N/A


N/A


N/A


Total


241,847


$

228.58


1,108,791


As of December 30, 2023:

Plan Category


Number of
Securities to
be Issued Upon
Exercise of
Outstanding
Options,
Warrants and
Rights


Weighted-
Average
Exercise Price of
Outstanding
Options,
Warrants and
Rights


Number of
Securities
Remaining
Available
for Future
Issuance
Under Equity
Compensation
Plans


Equity Compensation Plans Approved by
   Security Holders


207,810


$

361.53


918,623


Equity Compensation Plans Not Approved by
   Security Holders


N/A


N/A


N/A


Total


207,810


$

361.53


918,623


Item 13.

The information required by Item 13 is hereby incorporated by reference from the registrant’s definitive Proxy Statement for the 20212024 Annual Meeting to be held on May 19, 2021.7, 2024.

Item 14. Principal Accountant Fees and Services

Item 14.

Principal Accounting Fees and Services

The information required by Item 14 is hereby incorporated by reference from the registrant’s definitive Proxy Statement for the 20212024 Annual Meeting to be held on May 19, 2021.7, 2024.


74


PART IV.

Item 15.

Exhibits, Financial Statement Schedules

Item 15. Exhibits and Financial Statement Schedules

(a)1. Financial Statements.

The following financial statements are filed as a part of this report:

Page

Report of Independent Registered Public Accounting Firm(PCAOB ID No. 34)

3841

Consolidated Financial Statements:

Consolidated Balance Sheets as of December 26, 202030, 2023 and December 28, 201931, 2022

4144

Consolidated Statements of Comprehensive Income for the years ended December 26, 2020,30, 2023, December 28, 2019,31, 2022, and December 29, 201825, 2021

4043

Consolidated Statements of Stockholders’ Equity for the years ended December 26, 2020,30, 2023, December 28, 2019,31, 2022, and December 29, 201825, 2021

4245

Consolidated Statements of Cash Flows for the years ended December 26, 2020,30, 2023, December 28, 2019,31, 2022, and December 29, 201825, 2021

4346

Notes to the Consolidated Financial Statements

4447

(a)2. Financial Statement Schedules.

All schedules for which provision is made in the applicable accounting regulation of the Securities and Exchange Commission have been omitted because they are inapplicable or the required information is shown in the consolidated financial statements, or notes thereto, included herein.

(b) Exhibits

The following is a list of exhibits filed as part of this Form 10-K:

Exhibit No.

Title

      2.1

Agreement and Plan of Merger, dated May 8, 2019, with Dogfish Head Holding Company, Canoe Acquisition Corp., and solely with respect to the indemnification obligations set forth in the Merger Agreement, Samuel A. Calagione III and Mariah D. Calagione (incorporated by reference to Exhibit 2.1 to the Company’s Form 8-K filed on May 9, 2019).

      2.2

Membership Unit Purchase Agreement, dated May 8, 2019, by and among The Boston Beer Company, Inc., Dogfish East of the Mississippi LP, and solely with respect to indemnification obligations set forth therein, Samuel A. Calagione III and Mariah D. Calagione (incorporated by reference to Exhibit 2.2 to the Company’s Form 8-K filed on May 9, 2019).

      2.3

Membership Unit Purchase Agreement, dated as of May 8, 2019, by and among The Boston Beer Company, Inc. and DFH Investors LLC (incorporated by reference to Exhibit 2.3 to the Company’s Form 8-K filed on May 9, 2019).

      3.1

Amended and Restated By-Laws of the Company, dated June 2, 1998 (incorporated by reference to Exhibit 3.5 to the Company’s Form 10-Q filed on August 10, 1998).

      3.2

Restated Articles of Organization of the Company, dated November 17, 1995, as amended August 4, 1998 (incorporated by reference to Exhibit 3.6 to the Company’s Form 10-Q filed on August 10, 1998).

      4.1

Form of Class A Common Stock Certificate (incorporated by reference to Exhibit 4.1 to the Company’s Registration Statement No. 33-96164). (P)

      4.2

Description of the Registrant’s Securities Registered Pursuant to Section 12 of the Securities Exchange Act of 1934 (incorporated by reference to Exhibit 4.1 to the Company’s Form 10-K filed on February 19, 2020)

    10.1

Stockholder Rights Agreement, dated as of December 1995, among The Boston Beer Company, Inc. and the initial Stockholders (incorporated by reference to the Company’s Form 10-K, filed on April 1, 1996). (P)


Exhibit No.

Title

    10.2

Second Amended and Restated Credit Agreement between The Boston Beer Company, Inc. and Boston Beer Corporation, as Borrowers, and Bank of America, N.A. (successor-in-merger to Fleet National Bank), effective as of July 1, 2002 (incorporated by reference to the Company’s 10-Q, filed on August 13, 2002).

75


    10.3

Letter Agreement dated August 4, 2004 amending the Second Amended and Restated Credit Agreement between Bank of America, N.A. (successor-in-merger to Fleet National Bank) and The Boston Beer Company, Inc. and Boston Beer Corporation (incorporated by reference to the Company’s 10-Q, filed on November 4, 2004).  +10.2

    10.4

Amendment dated February 27, 2007 to the Second Amended and Restated Credit Agreement between Bank of America, N.A., successor-in-merger to Fleet National Bank, and The Boston Beer Company, Inc. and Boston Beer Corporation (incorporated by reference to the Company’s Annual Report on Form 10-K filed on March 15, 2007).

    10.5

Amendment to Credit Agreement by and among the Company and Boston Beer Corporation, as borrowers, and Bank of America, N.A., as the lender, effective as of March 10, 2008 (incorporated by reference to the Company’s Quarterly Report on Form 10-Q filed on May 6, 2008).

  +10.6

Production Agreement between Samuel Adams Brewery Company, Ltd. and Brown-Forman Distillery Company, a division of Brown-Forman Corporation, effective as of April 11, 2005 (incorporated by reference to the Company’s 10-Q filed on May 5, 2005).

  +10.7  +10.3

Brewing Services Agreement between CBC Latrobe Acquisition, LLC and Boston Beer Corporation dated March 28, 2007 (incorporated by reference to the Company’s Quarterly Report on Form 10-Q filed on May 10, 2007).

  +10.8  +10.4

Office Lease Agreement between Boston Design Center LLC and Boston Beer Corporation dated March 24, 2006 (“Office Lease Agreement”), as amended on September 29, 2006, October 31, 2007, March 25, 2008, August 27, 2012, February 22, 2013, and June 3, 2015 (incorporated by reference to the Company’s Quarterly Report on Form 10-Q filed on May 11, 2006 and Annual Report on Form 10-K filed on February 18, 2016).

*+10.9 +10.5

Seventh Amendment to Lease Agreement dated June 1, 2019. Certain information in this exhibit is confidential and has been excluded pursuant to applicable rules because it (i) is not material and (ii) would likely cause competitive harm if publicly disclosed.

**10.10

The 1996 Stock Option Plan for Non-Employee Directors, originally adopted in 1996 and amended and restated on October 19, 2004, as amended on October 30, 2009, effective as of January  1, 2010disclosed (incorporated by reference to the Company’s Post-Effective Amendment to its Registration StatementCompany's Annual Report on Form S-810-K filed on November 28, 2009); amended and restatedFebruary 17, 2021).

**10.6

The Boston Beer Company, Inc. Equity Plan for Non-Employee Directors, adopted on December 12, 2012, effective as of January 1, 2012; amended and restated on MarchFebruary 9, 2016, effective as of March  9, 20162023 (incorporated by reference to Exhibit 10.1 to the Company’s Quarterly Report on Form 10-Q filed on July 21, 2016).

    10.11

Amendment dated January 24, 2014 to the Second Amended and Restated Credit Agreement between Bank of America, N.A., successor-in-merger to Fleet National Bank, and The Boston Beer Company, Inc. and Boston Beer Corporation (incorporated by reference to the Company’s Current Report on Form 8-K filed on January 28, 2014).February 10, 2023.

**10.1210.7

The Boston Beer Company, Inc. Employee Equity Incentive Plan, as amended on February 23, 1996, December 20, 1997, December 19, 2005, December 19, 2006, December 21, 2007, October 30, 2009, October 8, 2013, October 8, 2014, and December 9, 2015, December 20, 2017, and December 20, 2018 (incorporated by reference to the Company’s Current Report on Form 8-K filed on December 21, 2018).

**10.13

Martin F. Roper Proprietary Information and Restrictive Covenant Agreement dated February  2, 2017 (incorporated by reference to the Company’s Current Report on Form 8-K filed on February 6, 2017).10.8

**10.14

Offer Letter to David A. Burwick, future Chief Executive Officer and President, dated January 23, 2018 (incorporated by reference to the Company’s Current Report on Form 8-K filed on February 16, 2018).

    10.15

Amendment to Credit Agreement by and among the Company and Boston Beer Corporation, as borrowers, and Bank of America, N.A., as the lender, effective as of March 27, 2018 (incorporated by reference to the Company’s Current Report on Form 8-K filed on March 30, 2018).


Exhibit No.

Title

**10.1610.9

Employment Agreement of Samuel A. Calagione III, dated July 3, 2019 (incorporated by reference to Exhibit 10.3 to the Company’s 10-Q filed on July 25, 2019)

**10.1710.10

Offer Letter to Frank H. Smalla, Senior Vice President, Finance dated December 15, 2015 (incorporated by reference to the Company’s Annual Report on Form 10-K filed on February 18, 2016).

    10.18    10.11

Registration Rights Agreement with the Former Dogfish Head Stockholders, dated July 3, 2019 (incorporated by reference to Exhibit 10.1 to the Company’s 10-Q filed on July 25, 2019).

**10.1910.12

Indemnification Agreement with the Dogfish Head Founders, dated July 3, 2019 (incorporated by reference to Exhibit 10.2 to the Company’s 10-Q filed on July 25, 2019).

**10.2010.13

Third Amended and Restated Credit Agreement by and among The Boston Beer Company, Inc., Boston Beer Corporation, American Craft Brewery LLC, and Bank of America, N.A., dated December 16, 2022 (incorporated by reference to the Company’s Current Report on Form 8-K filed on December 22, 2022).

10.14

Offer Letter to Quincy B. Troupe, Senior Vice President, Supply ChainLesya Lysyj, Chief Marketing Officer, dated December 18, 2015March 21, 2019 (incorporated by reference to Exhibit 10.5 to the Company’s Annual Report on Form 10-KCompany's 10-Q filed on February 18, 2016)July 25, 2019).

**10.2110.15

Offer Letter to Carolyn O’Boyle,Matthew D. Murphy, Chief PeopleAccounting Officer & Interim Financial Officer, dated February 7, 2020May 12, 2023 (incorporated by reference to Exhibit 10.1 to a Current Report on Form 8-K filed by the Company’s 10-Q filedCompany on July 23, 2020).May 16, 2023)

10.16

Offer Letter to Philip A. Hodges, Chief Supply Chain Officer, dated May 15, 2023 (incorporated by reference to Exhibit 10.1 to a Current Report on Form 8-K filed by the Company on May 22, 2023).

10.17

Offer Letter to Diego Reynoso, Chief Financial Officer, dated July 21, 2023 (incorporated by reference to exhibit 10.1 to a Current Report on Form 8-K filed by the Company on July 24, 2023)

  *21.1

List of subsidiaries of The Boston Beer Company, Inc. effective as of December 26, 2020. 30, 2023.

  *23.1

Consent of Deloitte & Touche LLP, an Independent Registered Public Accounting Firm.

  *31.1

Certification of the President and Chief Executive Officer pursuant to Rule 13a-14(a) under the Securities Exchange Act of 1934, as adopted pursuant to Section 302 of the Sarbanes-Oxley Act of 2002.

76


  *31.2

Certification of the Chief Financial Officer pursuant to Rule 13a-14(a) under the Securities Exchange Act of 1934, as adopted pursuant to Section 302 of the Sarbanes-Oxley Act of 2002.

  *32.1

Certification of the President and Chief Executive Officer pursuant to 18 U.S.C. Section 1350, as adopted pursuant to Section 906 of the Sarbanes-Oxley Act of 2002.

  *32.2

Certification of the Chief Financial Officer pursuant to 18 U.S.C. Section 1350, as adopted pursuant to Section 906 of the Sarbanes-Oxley Act of 2002.

    97.1

The Boston Beer Company, Inc. Clawback Policy amended effective as of October 2, 2023.

*101.INS

XBRL Instance Document

*101.INS

XBRL Instance Document

*101.SCH

*101.SCH

Inline XBRL Taxonomy Extension Schema Document

*101.CAL

Inline XBRL Taxonomy Calculation Linkbase Document

*101.LAB

Inline XBRL Label Linkbase Document

*101.PRE

Inline XBRL Taxonomy Presentation Linkbase Document

*101DEF

Inline XBRL Definition Linkbase Document

  104

Cover Page Interactive Data File (formatted as inline XBRL and included in Exhibit 101).

* Filed with this report.

+ Portions of this Exhibit were omitted pursuant to an application for an order declaring confidential treatment filed with and approved by the Securities and Exchange Commission.

** Indicates management contract or compensatory plan or arrangement.

Item 16. Form 10-K Summary

Not Applicable

77


SIGNATURES

*

Filed with this report.

+

Portions of this Exhibit were omitted pursuant to an application for an order declaring confidential treatment filed with and approved by the Securities and Exchange Commission.

**

Indicates management contract or compensatory plan or arrangement.

Item 16.

Form 10-K Summary

Not applicable.


SIGNATURES

Pursuant to the requirements of Section 13 or 15(d) of the Securities and Exchange Act of 1934, the registrant has duly caused this report to be signed on its behalf by the undersigned, thereunto duly authorized, on this 17th27th day of February 2021.2024.

THE BOSTON BEER COMPANY, INC.

/s/ David A. Burwick

David A. Burwick

President and Chief Executive Officer (principal executive officer)

Pursuant to the requirements of the Securities and Exchange Act of 1934, the following persons on behalf of the registrant and in the capacities and on the dates indicated have signed this report below.

Signature

Title

Date

/s/ David A. Burwick

David A. Burwick

President, Chief Executive Officer (principal executive officer) and Director

February 27, 2024

/s/ Frank H. SmallaDiego Reynoso

Frank H. SmallaDiego Reynoso

Chief Financial Officer (principal financial officer)

February 27, 2024

/s/ Matthew D. Murphy

Matthew D. Murphy

VP Finance and Chief Accounting Officer (principal accounting officer)

February 27, 2024

/s/ Samuel A. Calagione III

Samuel A. Calagione III

Brewer and Director

February 27, 2024

/s/ Cynthia A. Fisher

Cynthia A. Fisher

Director

February 27, 2024

/s/ Meghan V. Joyce

Meghan V. Joyce

Director

February 27, 2024

/s/ C. James Koch

C. James Koch

Chairman and Director

February 27, 2024

/s/ Michael M. Lynton

Michael M. Lynton

Director

/s/ Julio N. Nemeth

Julio N. Nemeth

Director

February 27, 2024

/s/ Michael Spillane

Michael Spillane

Director

February 27, 2024

/s/ Cynthia L. Swanson

Cynthia L. Swanson

Director

February 27, 2024

/s/ Jean-Michel Valette

Jean-Michel Valette

Director

February 27, 2024

78

76