

UNITED STATES
SECURITIES AND EXCHANGE COMMISSION
Washington, D.C. 20549
FORM 10-K
☒ | ANNUAL REPORT PURSUANT TO SECTION 13 OR 15(d) OF THE SECURITIES EXCHANGE ACT OF 1934 |
For the fiscal year ended December 31 2020, 2023
Or
☐ | TRANSITION REPORT PURSUANT TO SECTION 13 OR 15(d) OF THE SECURITIES EXCHANGE ACT OF 1934 |
For the transition period from to
Commission file number: 000-50796
SP PLUS CORPORATION
(Exact Name of Registrant as Specified in Its Charter)
Delaware | 16-1171179 | |||
(State or Other Jurisdiction of | (I.R.S. Employer Identification No.) | |||
Incorporation or Organization) | ||||
200 E. Randolph Street, Suite 7700 | ||||
Chicago, Illinois60601-7702 | ||||
(Address of Principal Executive Offices, Including Zip Code) | ||||
| ||||
(Registrant's Telephone Number, Including Area Code) | ||||
Securities registered pursuant to Section 12(b) of the Act: | ||||
Title of each class | Trading Symbol(s) | Name of each exchange on which registered | ||
Common Stock, $0.001 par value per share | SP | The Nasdaq Stock Market LLC | ||
Securities registered pursuant to Section 12(g) of the Act: NONE | ||||
Indicate by check mark if the registrant is a well-known seasoned issuer, as defined in Rule 405 of the Securities Act. Yes☒ | No ☐ |
Indicate by check mark if the registrant is not required to file reports pursuant to Section 13 or Section 15(d) of the Act. Yes ☐ | No☒ |
Indicate by check mark whether the registrant: (1) has filed all reports required to be filed by Section 13 or 15(d) of the Securities Exchange Act of 1934 during the preceding 12 months (or for such shorter periods that the registrant was required to file such reports), and (2) has been subject to such filing requirements for the past 90 days. Yes☒ No o☐
Indicate by check mark whether the registrant has submitted electronically every Interactive Data File required to be submitted pursuant to Rule 405 of Regulation S-T (§ 232.405 of this chapter) during the preceding 12 months (or for such shorter period that the registrant was required to submit such files). Yes☒ No ☐
Indicate by check mark whether the registrant is a large accelerated filer, an accelerated filer, a non-accelerated filer, smaller reporting company, or an emerging growth company.
See the definitions of "large accelerated filer," "accelerated filer," "smaller reporting company," and "emerging growth company" in Rule 12b-2 of the Exchange Act. (Check one):
Large Accelerated Filer | ☒ | Accelerated Filer | ☐ |
Non-accelerated Filer | ☐ | Smaller Reporting Company | ☐ |
Emerging Growth Company | ☐ |
If an emerging growth company, indicate by check mark if the registrant has elected not to use the extended transition period for complying with any new or revised financial accounting standards provided pursuant to Section 13(a) of the Exchange Act. O☐
Indicate by check mark whether the registrant has filed a report on and attestation to its management’s assessment of the effectiveness of its internal control over financial reporting under Section 404(b) of the Sarbanes-Oxley Act (15 U.S.C. 7262(b)) by the registered public accounting firm that prepared or issued its audit report. ☒
If securities are registered pursuant to Section 12(b) of the Act, indicate by check mark whether the financial statements of the registrant included in the filing reflect the correction of an error to previously issued financial statements. ☐
Indicate by check mark whether any of those error corrections are restatements that required a recovery analysis of incentive-based compensation received by any of the registrant’s executive officers during the relevant recovery period pursuant to § 240.10D-1(b). ☐
Indicate by check mark whether the registrant is a shell company (as defined in Rule 12b-2 of the Act). Yes ☐ No ☒
As of June 30, 2020,2023, the last business day of the registrant's most recently completed second fiscal quarter, the aggregate market value of the voting and non-voting common stock held by nonaffiliates of the registrant was approximately $476.8$761.9 million. Solely for purposes of this disclosure, shares of common stock held by executive officers and directors of the registrant as of such date have been excluded because such persons may be deemed to be affiliates. This determination of executive officers and directors as affiliates is not necessarily a conclusive determination for any other purposes.
Class | Outstanding at February |
Common Stock, $0.001 par value per share |
|
DOCUMENTS INCORPORATED BY REFERENCE
None
Audit Firm Id:42Auditor Name:Ernst & Young LLPAuditor Location:Chicago, Illinois, United States
Portions of the registrant's definitive proxy statement to be delivered to stockholders in connection with the Annual Meeting of Stockholders to be held on May 12, 2021 are incorporated by reference into Part III of this Form 10-K. The 2020 Proxy Statement will be filed with the U.S. Securities and Exchange Commission within 120 days after the end of the fiscal year to which this report relates.
SP PLUS CORPORATION
TABLE OF CONTENTS
1
1
Forward-Looking Statements
The Business section and other parts of this Annual Report on Form 10-K ("Form 10-K") contain forward-looking statements, within the meaning of the Private Securities Litigation Reform Act of 1995, that involve risks and uncertainties. Many of the forward-looking statements are located in "Management's Discussion and Analysis of Financial Condition and Results of Operations." Forward-looking statements provide current expectations of future events based on certain assumptions and include any statement that does not directly relate to any historical or current fact. Forward-looking statements can also be identified by words such as "future," "anticipates," "believes," "estimates," "expects," "intends," "plans," "predicts," "will," "would," "could," "can," "may," and similar terms. Forward-looking statements are not guarantees of future performance and the Company'sSP Plus Corporation’s actual results may differ significantly from the results discussed in the forward-looking statements. Factors that might cause such differences include, but are not limited to, those discussed in Part I, Item 1A. of this Form 10-K under the heading "Risk Factors," which are incorporated herein by reference. Each ofThe term the terms the "Company" and "SP Plus" as used herein refers collectively to SP Plus Corporation and its wholly owned subsidiaries, unless otherwise stated. The Company assumes no obligation to revise or update any forward-looking statements for any reason, except as required by law.
2
2
PART I
Item 1. Business
|
|
Our Company
SP Plus Corporation, a Delaware corporation, which operates through its subsidiaries (collectively referred to as “SP+”, "we", "us", or "our") facilitates, develops and integrates technology with operations management and support to deliver mobility solutions that enable the efficient and time-sensitive movement of people, vehicles and personal belongings withtravel belongings. We are committed to providing solutions that make every moment matter for a world on the goalgo while meeting the objectives of enhancing the consumer experience while improving bottom line results for our clients. We provide professional parking management, ground transportation, remote baggage check-indiverse client base in North America and handling, facility maintenance, security, event logistics, and other technology-driven mobility solutions toEurope, which includes aviation, commercial, hospitality healthcare and government clients across North America.institutional clients. We typically enter into contractual agreements with property owners or managers as opposed to owning facilities.
Acquisitions, InvestmentOn October 4, 2023, we entered into an Agreement and Plan of Merger (the "Merger Agreement") by and among us, Metropolis Technologies, Inc. ("Metropolis") and Schwinger Merger Sub Inc., a direct, wholly owned subsidiary of Metropolis (“Merger Sub”), in Joint Venturean all-cash transaction with a total enterprise value of approximately $1.5 billion. Pursuant to the Merger Agreement, subject to terms and Saleconditions therein, Merger Sub will acquire all of Business
On November 30, 2018, we acquired the outstanding shares of ZWB Holdings,our common stock for $54.00 per share, without interest, and merge with SP+, with the SP+ surviving as a wholly owned subsidiary of Metropolis. The Company’s stockholders approved the transaction on February 9, 2024. The transaction is expected to close in 2024, subject to other customary closing conditions, including the receipt of regulatory approvals. Upon completion of the transaction, the Company’s shares will no longer trade on the Nasdaq Global Select Market.
Acquisitions
On July 25, 2023, we acquired certain assets of Roker Inc. and Rynn's Luggage Corporation, and their subsidiaries and affiliates (collectively, "Bags"("Roker"), for an all-cash purchase price of $277.9 million, net of $5.9 million of cash acquired. Bags is a leadingUnited States based provider of baggage services, remote airline check-in,fully-integrated parking solutions that simplify permit, violation and other related services, primarily to airline, airportenforcement management for organizations and hospitality clients. Bags provides these services by combining exceptional customer service with innovative technologies. Bags clients include major airlines, airports, sea ports, cruise lines, and leading hotels and resorts.
Our Operations
Our experiencemunicipalities, for approximately $3.1 million. Roker's operations are included in the industriesCommercial segment.
On November 10, 2022, we serve has allowed usacquired certain assets of DiVRT, Inc. ("DIVRT"), a developer of innovative software and technology solutions that enables frictionless parking capabilities, for approximately $17.6 million. In addition, we may be required to pay the former owner of DIVRT a maximum amount of $7.0 million in contingent consideration if certain targets related to the number of our locations using the DIVRT technology are met by October 31, 2025. Based on a probability weighting of potential payouts, we accrued $4.0 million in projected contingent consideration as of the acquisition date. During the year ended December 31, 2023, we determined that the first two targets were met as of October 31, 2023, which was the second milestone measurement date. As a result, we paid the former owner $2.8 million during the first quarter of 2024. We will continue to evaluate the potential payouts in the future and adjust the contingent consideration for any changes in the estimated fair value each reporting period. DIVRT's operations are included in the Commercial segment.
On October 11, 2022, we acquired K M P Associates Limited ("KMP"), a United Kingdom based software and technology provider serving aviation and commercial parking clients, primarily through its AeroParker technology, throughout the United States and Europe for approximately $13.8 million, less cash acquired of $0.9 million, and assumed KMP's debt of $0.3 million. Immediately following the acquisition, we repaid all of the debt assumed. KMP's operations are included in the Aviation segment.
Our Operations
We develop and standardize a rigorous system of processesintegrate technology with operations management and controlssupport to deliver mobility solutions that enable us to deliver consistent, transparent, value-addedthe efficient and high-quality services that facilitate thetime-sensitive movement of people, vehicles and personal travel belongings. We serve a variety of industries and have industry vertical specific specializationspecialization. Our Commercial segment serves clients in commercial real estate, residential communities, hotels and resorts, airports, airlines, cruise lines, healthcare facilities, municipalities and government facilities, retail operations, large event venues, colleges and universities. Our Aviation segment primarily serves clients in the aviation industry (i.e. airports, airlines, cruise lines, certain hospitality clients and certain commercial clients within Europe that utilize our AeroParker technology).
We typically enter into contractual relationships with property owners or managers as opposed to owning facilities. We primarily operate under two primary types of arrangements: management type contracts and lease type contracts. See Part I. Industry Operating Arrangements for further discussion.
|
|
|
|
Our revenue is derived from a broad and diverse group of clients, industry vertical markets and geographies. Our clients include some of North America's largest private and public owners, municipalities and governments, managers and developers of major office buildings, residential properties, commercial properties, shopping centers and other retail properties, healthcare facilities and medical centers, sports and special event complexes, hotels and resorts, airlines and cruise lines. In addition, through our acquisition of KMP, we now service multiple airports and other clients in Europe. No single client accounted for more than 6%7% of our revenue, net of reimbursed management type contract revenue, or more than 6% of our gross profit forduring the year ended December 31, 2020.2023. Additionally, we have built a diverse geographic footprint that spans operations in 45 states, the District of Columbia and Puerto Rico, and 4 Canadian provinces.provinces and multiple countries within Europe. Our strategy is focused on building scale and leadership positions in large, strategic markets in order to leverage the advantages of scale across a larger number of clients in a single market.
ServicesThe acquisitions discussed above enhance our position as a global provider of frictionless Platform-as-a-Service ("PaaS") and Software-as-a-Service ("SaaS") solutions that are not dependent on our legacy parking management and transportation related operations. Our acquisitions of KMP, DIRVT and Roker have been accounted for as business combinations, and the assets acquired and liabilities assumed were recorded at their fair values as of the acquisition dates. The results of each acquisition’s operations are reflected in our Consolidated Financial Statements from the date of acquisition.
Services
As a professional service and technology solutions provider, we provide comprehensive, turn-key service and technology-enabled offering packages to our clients. Under a typical management type contract structure, we are responsible for providing and supervising all personnel necessary to facilitate daily operations, which may include cashiers, porters, baggage handlers, valet attendants, managers, bookkeepers, cashiers and a variety of ground transportation services, maintenance, marketing, customer service, and accounting and revenue control functions.
BeyondIn addition to the conventional management services described above, we also offer an expanded range of ground transportation services, baggage delivery and handling services, technology enabled solutions and other ancillary services. For example, we provide:services as described below for each of our Segments:
Commercial
|
|
|
|
|
|
3 |
|
|
|
|
|
|
|
|
|
|
|
|
|
3
Aviation
| • baggage services, including delivery of delayed luggage and baggage handling services; • remote airline check-in services; • wheelchair assist services at airports and to airline passengers; • baggage repair and replacement services; • shuttle bus vehicles and the drivers to operate them, such as on-airport car rental operations and private off-airport parking locations; • ground transportation services, such as taxi and livery dispatch services, as well as concierge-type ground transportation information and support services for passengers with transportation network companies; • valet services, including vehicle staging and valet tracking systems with SMS capabilities; • innovative and environmentally compliant facility maintenance services, including power sweeping and washing, painting and general repairs, as well as cleaning and seasonal services; • comprehensive security services including the training and hiring of security officers and patrol, as well as customized services and technology that are efficient and appropriate for the property involved; • online and mobile application consumer platforms through our AeroParker technology and parking.com; • multi-platform marketing services including SP+, AeroParker and KMP Digitata branded websites which offer clients a unique platform for marketing airport facilities, mobile applications, search marketing, email marketing and social media campaigns; and • revenue management services.
|
|
|
|
|
|
Industry Overview
Overview
The parking management, ground transportation servicesservice and baggage servicesservice providers, as well as technology solution providers that serve those industries, are large and fragmented. A substantial number of companies in these industries offer parking management services, ground transportation services, technology servicessolutions and baggage services as non-core operations, and companies in these industries are large national competitors or small and private companies that operate in limited markets and geographies. Additionally, technological advancements are having an impact on both consumer behavior and information technology in these industries. From time to time, smaller operators and technology solution providers find they lack the financial resources, economies of scale and/or management techniques required to compete for the business of increasingly sophisticated clients and the increasing demands of clients. We expect this trend to continue and will provide larger professional service companiesand/or technology solutions providers with greater opportunities to expand their businesses and potentially acquire smaller operators.operators and/or technology solutions providers. We also expect that new small operators and technology companiessolutions providers will continue to enter the market as they have in the past.
Beginning in March 2020, the COVID-19 pandemic (“COVID-19”)Industry Operating Arrangements
Professional service businesses and the resulting stay at home orders issued by local governments began impacting certain industries and businesses internationally andtechnology solution providers within the United States and North America,industry, including our business and those businesses that serve the hospitality and travel industries. See Item 1A. Risk Factors for risks related to COVID-19, as well as other risks related to our business and the industry.
Industry Operating Arrangements
Professional service businessesCompany, operate primarily under two general types of arrangements, which include:
Management Type Contracts
Under management type contracts, the professional serviceservices operator generallytypically receives a fixed and/or variable monthly fee for providing services and may receive an incentive fee based on the achievement of certain performance objectives. Professional service operators also generally charge fees for various ancillary services such as accounting support services, equipment leasing and consulting. Primary responsibilities under a management type contract include hiring, training and staffing personnel, and providing revenue collection, accounting, record-keeping, insurance and marketing services. The client is usually responsible for operating expenses associated with the client's operations, such as taxes, license and permit fees, insurance costs, payroll and accounts receivable processing and wages of personnel assigned to the operation, although some management type contracts, typically referred to as "reverse" management type contracts, require the professional serviceservices operator to pay certain of these cost categories but provide for payment to the operator of a larger management fee. Under a management type contract, the client usually is responsible for non-routine maintenance and repairs and capital improvements of the operation facility or location,
4
such as structural and significant mechanical repairs. Management type contracts are typically for a term of one to three years (although the contracts may be terminated early and may contain renewal clauses).
Lease Type Contracts
Under lease type contracts, the professional services operator generally pays to the client or property owner a fixed base rent or fee, percentage rent that is tied to the financial performance of the operation, or a combination of both. The professional services operator collects all revenue and is responsible for most operating expenses, but typically is not responsible for major maintenance, capital expenditures or real estate taxes. In contrast to management type contracts, lease type contracts typically have longer terms, ofgenerally three to ten years, and often contain a renewal term and provide for a fixed payment to the client regardless of the facility's operating earnings. In addition, many of these lease type contracts may be canceled by the client for various reasons, including development of the real estate for other uses, and may be canceled by the client on as little as 30 days' notice without cause. Lease type contracts generally require larger capital investment by the professional services operator than doas compared to management type contracts and therefore tend to have longer contract periods.
General Business Trends
We believe that oursophisticated clients recognize the potential for technology-driven mobility solutions, parking services, parking management, ground transportation services, baggage handling services and technology-driven mobility solutions and other ancillary services to be a profit generator and/or a service differentiator to their respective customers. By outsourcing these services, our clients are able to capture additional profit and enhance theimprove customer experienceexperiences by leveraging the unique technology, operational skills and controls that an experienced services and technology companysolutions provider can offer. Our ability to consistently deliver a uniformly high level of servicesservice to our clients, including the use of various technologicaltechnology solutions and enhancements, allows us to maximize the profit and enhance theand/or customer experience for our clients thereby improvingand improves our ability to win contracts and retain existing clients.
Our Competitive Strengths
We believe we have the following key competitive strengths:
• A Leading Market Position with a Unique Value Proposition. We are one of the industry leading providers of technology-driven mobility solutions, parking management, ground transportation services, baggage services and other ancillary services for aviation, commercial, hospitality, institutional, municipal and government, airport, airline and cruise line clients across North America and Europe. Our competitive and key advantages are our Sphere technology, which is a suite of industry-leading technology solutions that drives end-to-end mobility and delivers a frictionless consumer experience across all markets we serve and our AeroParker technology, which is a Software-as-a Solution ("SaaS") ecommerce platform that increases non-aeronautical revenues for multiple major US and European airports through pre-booked parking, revenue management and sales of other products such as access to airport lounges. Our services include on-site parking management, valet parking, ground transportation services, facility maintenance, event logistics, baggage related services, remote airline check-in services, security services, municipal meter revenue collection and enforcement services, and consulting services. We market and offer many of our services under our SP+, Sphere,Bags,AeroParker, MetroParker and KMP Digitata brands, which reflect our ability to provide customized solutions and meet the varied demands of our diverse client base. We can augment our parking services and technology solutions by providing our clients with related services through our SP+ Parking, SP+ Facility Maintenance, SP+ GAMEDAY, SP+ Transportation, SP+ Event Logistics,Sphere, AeroParker, MetroParker, KMP Digitata and Bags brands, thus enabling our clients to efficiently address variousneeds through a single vendor relationship. We believe our ability to offer a comprehensive range of services and technology solutions, as well as leverage our Sphere,AeroParker, MetroParker and KMP Digitata platforms and the Bags service offerings on an international basis is a significant competitive advantage and allows our clients to attract, service and retain customers, gain access to the breadth and depth of our service and process expertise, leverage our significant technology capabilities and enhance their financial operations and customer experience. • Our Scale and Diversification. Expanding our client base, industry vertical markets and geographic locations has enabled us to significantly enhanceour operating efficiency over the past several years by standardizing processes and managing overhead. The ability to use our scale and purchasing power with vendors drives cost savings and benefits for our client base. o Client Base. Our clients include some of North America's largest private and public owners, municipalities, managers and developers ofmajor office buildings, residential properties, commercial properties, shopping centers and other retail properties, sports and special event complexes, hotels and resorts, healthcare facilities and medical centers, airports, airlines and cruise lines. In addition, through our acquisition of KMP, we now service many airports and other clients within Europe. o Industry Vertical Markets. We believe our industry vertical market diversification, such as commercial real estate, residentialcommunities, hotels and resorts, airports, airlines, cruise lines, healthcare facilities and medical centers, seaports, municipalities and government facilities, commercial real estate, residential communities, retail operations, large event venues, and colleges and universities, allows us to minimize our exposure to industry-specific seasonality and volatility. We believe that the breadth of the end-markets we serve and the depths and diversity of services and technology solutions we offer to those end-markets provide us with a broader base of clients that we can target. o Geographic Locations. We have a diverse geographic footprint that includes operations or our technology-driven mobility solutions in 45 states, the District of Columbia, Puerto Rico, 4 Canadian provinces and several countries within in Europe. • Stable Client Relationships. We have a track record of providing our clients with consistent, value-added and high-quality services, which can enhance their customers'experience. We continue to see a trend in outsourcing to professional service providers; we believe this trend has meaningful benefits to companies like ours, which have a national footprint and scale, extensive industry experience, broad process capabilities and a demonstrated ability to create value for our clients. We expect that our acquisition of KMP will further enhance our company footprint outside of North America. • Established Platform for Future Growth. We have invested in and developed an international infrastructure utilizing our Sphere and AeroParker technology solutions and platforms that arecomplemented by significant management expertise, which enable us to scale our business for future growth effectively and efficiently. We have the ability to transition into local service operations very quickly, from the simplest to the most complex operation, and have experience working with incumbent professional service operators and technology solution providers to implement smooth and efficient takeovers and integrate professional service operations and technology solutions seamlessly into our existing operations. • Predictable Business Model. We believe that our business model provides us with a measure of insulation from broader economic cycles, because asignificant portion of our locations operate on management type contracts that, for the most part, are not dependent upon the financial performance of the client's operation. • Highly Capital Efficient Business with Attractive Cash Flow Characteristics. Our business generates attractive operating cash flow due to negative workingcapital dynamics. In addition, we generally have low capital expenditure requirements, which allows us to grow our business through additional technology investments. 5 |
|
4
| • Focus on Operational Excellence and Human Capital Management. Our culture and training programs place a continuing focus on excellence in theexecution of all aspects of day-to-day operations. This focus is reflected in our ability to deliver to our clients professional, high-quality services through well-trained, service-oriented personnel, which we believe differentiates us from our competitors. To support our focus on operational excellence, we manage our human capital through a comprehensive, structured program that evaluates the competencies and performance of all of our key operations and administrative support personnel on an annual basis. We have also dedicated significant resources to human capital management, providing comprehensive training for our employees, delivered through the use of our web-based SP+ University learning management system, in addition to facilitated classes. These investments in our people promote customer service and client retention in addition to providing our employees with continued training and career development opportunities. • Focus on Operational Compliance and Safety Initiatives. Our culture and training programs continue to focus on various compliance and safetyinitiatives and disciplines throughout the organization, as we implement an integrated approach for continuous improvement in our risk and safety programs. We have also dedicated significant resources to our risk and safety programs by providing comprehensive training for our employees, delivered primarily through the use of our web-based SP+ University learning management system, on-site training and our SP+irit in Safety newsletters.
|
|
|
|
|
|
|
|
|
|
|
|
|
|
|
|
|
|
|
|
|
Our Growth Strategy
Building on these competitive strengths, we believe we are well positioned to execute on the following growth strategies:
| • Grow our Business through Technology investments. We believe a significant opportunity exists to expand our business through the use of technology driven mobility solutions. We provide a suite of industry-leading technology solutions through our Sphere and AeroParker technology and will continue to invest further in these products and offerings, as we believe Sphere and AeroParker are key differentiators for us. • Grow Our Business in Existing Geographic Markets. A component of our strategy is to capitalize on economies of scale and operating efficiencies byexpanding our business in our existing geographic markets, especially in our core markets. As a given geographic market achieves a certain operational size, we will typically establish a local office in order to promote increased operating efficiency by enabling local managers to use a common staff for recruiting, training and human resources support. The concentration of our operating locations allows for increased operating efficiency and superior levels of customer service and retention through the accessibility of local managers and support resources. • Increase Penetration in Our Current Industry Vertical Markets. We believe that a significant opportunity exists for us to further expand our presenceinto certain industry vertical markets, such as airports and aviation, colleges and universities, healthcare, municipalities, hospitality and events. In order to effectively target these markets, we have implemented a go-to-market strategy of aligning our business by operating segment, industry vertical markets and branding our domain expertise through our SP+, Sphere, SP+ GAMEDAY, AeroParker, MetroParker, KMP Digitata and Bags designations to highlight the specialized expertise, competencies, services and technology offerings that we provide to meet the needs of each particular industry and customer. Our recognized SP+ brand, which emphasizes our specialized market expertise and distinguishes our ancillary service lines from traditional parking under our operating divisions, SP+ Commercial and SP+ Aviation,with operations supporting airport, airline, cruise line ports, event, venue, healthcare, hospitality, university, residential and retail clients. • Expand and Cross-Sell Additional Services to Drive Incremental Revenue. We believe we have significant opportunities to further strengthen ourrelationships with existing clients, and to attract new clients, by continuing to cross-sell value-added services that complement our core service operations.Bagsis a leading provider of baggage, remote airline check-in, and other relatedservices, primarily to airlines, airports, sea ports, cruise lines, hotels and resorts. Bags combines exceptional customer service with innovative technologies to provide value-add client and customer services. In addition, our AeroParker technologyis a SaaS ecommerce platform that increases non-aeronautical revenues for major U.S. and European airports through pre-booked parking, revenue management and other sales products such as access to airport lounges. We believe there are opportunities to further cross-sell the aforementioned services that Bags and the AeroParker technology provides to our existing clients within the aviation, hospitality and commercial markets and to cross-sell parking services and ground transportation services and other ancillary services to our existing Bags and AeroParker clients. Our emphasis on these innovative services will continue to drive value with our clients and allow us to expand our footprint into multiple markets and geographies. • Expand Our Geographic Platform. We believe that opportunities exist to further develop new geographic markets through new contracts,acquisitions, alliances, joint ventures or partnerships. Clients that outsource the management of their operations and professional services often have a presence in a variety of urban markets and seek to outsource the management of their operations to a national or international provider. We continue to focus on leveraging relationships with existing clients that have locations in multiple markets as one potential entry point into developing new core markets. • Focus on Operational Efficiencies to Further Improve Profitability. We have invested substantial resources in information technology and regularlyseek to consolidate various corporate functions where possible in order to improve our processes and service offerings. In addition, we will continue to evaluate and improve our human capital management to ensure a consistent and high-level of service for our clients. The initiatives undertaken to date in these areas have improved our cost structure and enhanced our financial strength, which we believe will continue to yield future benefits. SphereRemote™ allows us to provide remote management services, whereby personnel are able to monitor revenue and otheraspects of an operation and provide 24-hour-a-day customer assistance (including remedying equipment malfunctions at a facility) by using off-site personnel and equipment. We have begun expanding the facilities where our remote management technology is installed. Additionally, Sphere iQ™ reduces the dependency on local resources by providing remote support for daily revenue reporting and monthly billing maintenance, reducing the cost of local bookkeeping and allowing for increased focus on maximizing revenue. We expect these businesses to grow as clients focus on improving the profitability of their operations by decreasing labor costs at their locations through remote services. • Pursue Opportunistic, Strategic Acquisitions. The outsourced professional services industry and technology solution providers serving the industry remain fragmented and presents a significantopportunity for us. Given the scale in our existing operating platform, we have a demonstrated ability to successfully identify, acquire and integrate strategic acquisitions. We will continue to selectively pursue acquisitions and joint venture investment opportunities that we believe will help us acquire scale or further enhance our service capabilities and technology solution offerings.
|
|
|
|
|
|
5
|
|
|
|
|
|
|
|
|
|
Business Development
We place a specific focus on marketing and relationship efforts that pertain to those clients or prospective clients having a large regional, national or nationalinternational presence. Accordingly, we assign dedicated executives to these existing clients or prospective clients to manage the overall relationship, as well as to reinforce existing account relationships and to develop new relationships, andas well as to take any other action that may further our business development interests.
Competition
We face competition from large national competitors and numerous smaller locally owned independent professional serviceoperators and technology solution providers, and operators, offering an array of services and professional servicetechnology solutions, which may include developers, hotels and resorts, airports, airlines, cruise lines, national services companies and other institutions that may elect to internally manage
6
their own professional service offerings. Additionally, technological factors that improve ride-sharing capabilities increase the use of parking aggregators and the use of third-party technology-driven mobility solutions can impact our parking and parking management business. Some of our present and potential competitors have or may be able to obtain greater financial and marketing resources than we have, which may negatively impact our ability to retain existing contracts and gain new contracts. We also face significant competition in our efforts to provide ancillary services such as shuttle bus services and on-street parking enforcement because of the number of large companies that specialize in these services.
We compete for management type contract type clients based on a variety of factors, including fees charged for services and technology solutions, providing a comprehensive suite of technology driventechnology-driven mobility solutions, ability to generate revenues and control expenses for clients, accurate and timely reporting of operational results, providing high quality customer service and customer experience, and the ability to anticipate and respond to industry and technology related changes. Factors that affect our ability to compete for lease type contract type locations include the ability to make financial commitments, long-term financial stability and the ability to generate revenues and control expenses. Factors affecting our ability to compete for employees include wages, benefits and working conditions.
Support Operations
We maintain regional and city offices throughout the United States, Canada, Puerto Rico, the United Kingdom and Puerto Rico.India. These offices serve as the centralized locations through which we provide the employees to staff our professional services, as well as the on-site and support management staff to oversee those operations. Our administrative staff is primarily based in those same offices and facilitate the efficient, accurate and timely production and delivery of client deliverables, such as monthly reporting invoicing, etc.and invoicing. Having these all-inclusive operations and administrative teams located in regional and city offices throughout the United States, Canada and Puerto Rico allows us to add new professional services for new and existing clients in a seamless and cost-efficient manner.
Our overall basic corporate functions in the areas of finance, human resources, risk management, legal, purchasing, and procurement, general administration, strategy, and product and technology development are primarily based in our Chicago corporate office, as well as the Nashville support office. We also perform product and Orlando support offices.technology development at our subsidiary in India.
Employees
As of December 31, 2020,2023, we employed approximately 12,20019,900 individuals, including 8,60013,100 full-time and 3,6006,800 part-time employees. Approximately 28%31% of our employees are covered by collective bargaining agreements and represented by labor unions, which include various local operational employees. Various union locals represent local operational employees in the following cities: Akron (OH), Arlington, Baltimore, Birmingham, Boston, Buffalo, Burbank, Chicago, Cincinnati,
6
Cleveland, Dallas, Denver, Detroit, Kansas City, Las Vegas, Los Angeles, Manchester (NH), Meadowlands, Miami, New York City, Newark, Oakland, Ontario (Canada), Orlando, Oxon Hill, Philadelphia, Pittsburgh, Portland, Richmond, San Diego, San Francisco, San Jose, San Juan (Puerto Rico), Santa Monica, Seattle, Washington, D.C. and Windsor Locks.
We are frequently engaged in collective bargaining negotiations with various union locals. No single collective bargaining agreement covers a material number of our employees. We believe that our employee relations are generally healthy, as evidenced by higher than average rate of tenure and rate of internal promotions.
Central to our ability to execute on our business strategy is the commitment of our employees to delivering excellence in execution of all aspects of our day-to-day operations. We strive to create an inclusive environment which promotes diversity across our organization and a safe and engaging work environment where our employees have the opportunity to succeed and grow. Through our comprehensive development programs and talent management systems, our employees refine their skills and are able to access continued training and career development opportunities. In addition to base salary, our compensation and benefits programs are structured to retain and motivate our employees.
The health and safety of our employees is of paramount importance. Because the safety is the responsibility of everyone, each employee is expected to take all safety and health polices seriously and help enforce these policies within the workplace. In 2020, we quickly activated comprehensive health and safety protocols to ensure appropriate safety precautions to address COVID-19.
Insurance
We purchase comprehensive liability insurance covering certain claims that occur in the operations that we lease or manage, including coverage for general/garage liability, garage keepers legal liability and auto liability. In addition, we purchase workers' compensation insurance for all eligible employees and umbrella/excess liability coverage. Under our various liability and workers' compensation insurance policies, we are obligated to pay directly or reimburse the insurance carrier for the deductible / retention amount for each loss covered by our general/garage liability, automobile liability, workers' compensation and garage keepers legal liability policy. As a result, we are effectively self-insured for all claims up to the deductible / retention amount for each loss. We also purchase property insurance that provides coverage for loss or damage to our property and in some cases our clients' property, as well as business interruption coverage for lost operating income and certain associated expenses. Because of the size of the operations covered and our claims experience, we purchase insurance policies at prices that we believe represent a discount to the prices that would typically be charged to our clients on a stand-alone basis. The clients for whom we provide professional services pursuant to management type contracts have the option of purchasing their own liability insurance policies (provided that we are named as an additional insured party), but historically most of our clients have chosen to obtain insurance coverage by being named as additional insureds under our master liability insurance policies. Pursuant to our management type contracts, we charge those clients insurance-related costs.
We provide group health insurance with respect to eligible full-time employees (whether they work at leased facilities, managed facilities or in our support offices). We self-insure the cost of the medical claims for these participants up to a stop-loss limit. Pursuant to our management type contracts, we charge those clients insurance-related costs.
Regulation
Our business is subject to numerous federal, foreign, state and local laws and regulations, and inregulations. In some cases, foreign, municipal and state authorities directly regulate or impose extensive governmental restrictions concerning automobile capacity, pricing, structural integrity and certain prohibited practices. Additionally, many cities impose a tax or surcharge on parking services, which generally range from 10% to 50% of revenues collected. We collect and remit sales/parking taxes and file our own tax returns, for andas well as tax returns on behalf of our clients and ourselves.clients. We are affected by laws and regulations that may impose a direct assessment on us for failure to remit sales/parking taxes, or to filefiling our own tax returns for ourselves andor filing tax returns on behalf of our clients.
Under various federal, foreign, state and local environmental laws, ordinances and regulations, a current or previous owner or operator of real property may be liable for the costs of removal or remediation of hazardous or toxic substances on, under or in such property. Such laws typically impose liability without regard to whether the owner or operator knew of, or was responsible for, the presence of such hazardous or toxic substances. In connection with the operation of parking facilities, we may be potentially liable for any such costs.
Several foreign, state and local laws have been passed in recent years that encourage car-pooling and the use of mass transit or impose certain restrictions on automobile usage. These types of laws have adversely affected our revenues and could continue to do so in the future. For example, New York City and Boston imposed restrictions in the wake of terrorist attacks, which included street closures, traffic flow restrictions and a requirement for passenger cars entering certain
7
bridges and tunnels to have more than one occupant during the morning rush hour. It is possible that cities could enact new or additional measures such as higher tolls, increased taxes and vehicle occupancy requirements in certain circumstances, which could adversely impact us. We are also affected by zoning and use restrictions and other laws and regulations that are common to any business that deals with real estate.
In addition, we are subject to laws generally applicable to businesses, including, but not limited to federal, foreign, state and local regulations relating to wage and hour matters, including minimum wage per hour laws and regulations imposed, employee classification, mandatory healthcare benefits, unlawful workplace discrimination, human rights laws and whistle blowing. Several cities in which we have operations either have adopted or are considering the adoption of so-called "living wage" ordinances, which could adversely impact our profitability by requiring companies that contract with local governmental authorities and other employers to increase wages to levels substantially above the federal minimum wage. In addition, we are subject to the provisions of the Occupational Safety and Health Act of 1970, as amended ("OSHA"), and related regulations. Any actual or alleged failure to comply with any regulation applicable to our business or any whistle-blowing claim, even if without merit, could result in costly litigation, regulatory action or otherwise harm our business, financial condition and results of operations.
In connection with ground transportation services and certain airline and cruise line transportation, baggage services and remote airline check-in services provided to our clients, the U.S. Department of Transportation, including the Transportation Security Administration (the "TSA"), the Federal Aviation Administration (the "FAA") and Department of Homeland Security, and various federal and state agencies, exercise broad powers over these certain transportation services, including shuttle bus operations, baggage delivery services, and remote airline check-in, licensing and authorizations, safety, training and insurance requirements. Our employees must also comply with the various safety and fitness regulations promulgated by the U.S. Department of Transportation and other federal agencies, including those related to minimum training hours and requirements, drug and alcohol testing and service hours. We may become subject to new and more restrictive federal and state regulations. Compliance with such regulations may increase our operating costs.
Regulations by the FAA may affect our business. The FAA generally prohibits parking within 300 feet of airport terminals during times of heightened alert. The 300 feet rule and new regulations may prevent us from using a number of existing spaces during heightened security alerts at airports. Reductions in the number of parking spaces may reduce our gross profitoperating income and cash flow.
7
Various other governmental regulations affect our operation of propertyproperties or facilities, both directly and indirectly, including the Americans with Disabilities Act (the "ADA"). Under the ADA, all public accommodations, including parking facilities, are required to meet certain federal requirements related to access and use by disabled persons. For example, the ADA requires parking facilities to include handicapped spaces, headroom for wheelchair vans, attendants' booths that accommodate wheelchairs and elevators that are operable by disabled persons. When negotiating contracts with clients, we generally require that the property owner contractually assume responsibility for any ADA liability in connection with the property or facility. There can be no assurance, however, that the property owner has assumed such liability for any given property or that we would not be held liable despite assumption of responsibility for such liability by the property owner. We believe that the parking facilities we operate are in substantial compliance with ADA requirements.
We are also subject to consumer credit laws and credit card industry rules and regulations relating to the processing of credit card transactions, including the Fair and Accurate Credit Transactions Act and the Payment Card Data Security Standard. These laws and industry standards impose substantial financial penalties for non-compliance.
Intellectual Property
SP Plus®, SP+® and the SP+ logo, SP+ GAMEDAY®, Sphere TM, Sphere Technology by SP+TM (and its related marks), Parking.com Innovation In Operation®TM and the Parking.com logoTM, AeroParker®, MetroParkerTM, KMP DigitataTM, Standard Parking® and the Standard Parking logo, CPC®, Central Parking System®, Central Parking Corporation®, USA Parking®, Focus Point Parking®, Allright Parking®the Bags logo, and Bags®Making Every Moment Matter for a World on the GoTM, are some of the important trademarks and service marks registered with the United States Patent and Trademark Office. In addition,utilized in our business. Where appropriate, we have registeredalso sought protection for the names and as applicable, the logos of all of our material subsidiaries and divisions as service marks with the United States Patent and Trademark Office or the equivalent state or foreign registry. We invented the Multi-Level Vehicle Parking Facility Musical Theme Floor Reminder System. We have also registered the copyright in our proprietary software, such as Client View©, Hand HeldProgram©, License Plate Inventory Programs© and ParkStat© with the United States Copyright Office. We also own the URLURLs parking.com, spplus.com, and maketraveleasier.com. We deem our registered service marks to be important, but not critical, to our business and marketing efforts.
Corporate Information
Our Annual Report on Form 10-K, quarterly reports on Form 10-Q, current reports on Form 8-K and amendments to those reports filed or furnished pursuant to Section 13(a) or 15(d) of the Securities Exchange Act of 1934 (the “Exchange Act”) are available free of charge at www.spplus.com as soon as reasonably practicable after we file such material with, or furnish it to, the Securities and Exchange Commission ("SEC"). We provide references to our website for convenience, but our website is not incorporated into this or any of our other filings with the SEC.
Item 1A. Risk Factors
|
|
The following discussion of risk factors contains forward-looking statements. These risk factors may be important to understanding any statement in this Form 10-K or elsewhere. The following information should be read in conjunction with Part II, Item 7. "Management's Discussion and Analysis of Financial Condition and Results of Operations" and the Consolidated Financial Statements and related notes in Part IV, Item 15. "Exhibits and Financial Statement Schedules" of this Form 10-K.
TheOur business, financial condition and operating results of the Company can be affected by a number of factors, whether currently known or unknown, including but not limited to those described below. Any one or more of such factors could directly or indirectly cause the Company'sour actual results of operations and financial condition to vary materially from past or anticipated future results of operations and financial condition. Any of these factors, in whole or in part, could materially and adversely affect the Company'sour business, financial condition, results of operations and stock price.
Because of the following factors, as well as other factors affecting the Company'sour financial condition and operating results, past financial performance should not be considered to be a reliable indicator of future performance, and investors should not use historical trends to anticipate results or trends in future periods.
Risks related to our business and industry
The global COVID-19 pandemic has had,We may fail to consummate the Merger, and is expecteduncertainties related to continue tothe consummation of the Merger may have a negative effect on the global economy, the United States economy and the global financial markets, and has disrupted, and is expected to continue to disrupt, our operations and our clients’ operations, all of which have had and will have anmaterial adverse effect on our business, financial condition and results of operations.
The ongoing COVID-19 global and national health emergency has caused significant disruptions inMerger is subject to the international and United States economies and financial markets. On March 11, 2020,satisfaction of a number of conditions beyond our control. Failure to satisfy the World Health Organization declaredconditions to the COVID-19 outbreak a pandemic. The spread of COVID-19 has caused illness, quarantines, cancellation of events and travel, business and school shutdowns, reduction in business activity and financial transactions, supply chain interruptions and overall economic and financial market instability.
We are taking precautions to protectMerger could prevent or delay the safety and well-being of our employees, clients and customers. However, no assurance can be given that the steps being taken will be deemed to be adequate or appropriate, nor can we predict the level of disruption which will occur to our ability to continue to provide services to our clients.
The spread of COVID-19 and the recent developments surrounding the global pandemic are having material negative impacts on all aspects of our business, as manycompletion of the clients we serve have suspendedMerger. If the Merger does not receive, or closed operations. We have been,timely receive, the required regulatory approvals and will continue toclearances, including anti-trust clearance under the Hart-Scott-Rodino Act, the completion of the Merger may be negatively impacted by related developments, including heightened governmental regulations and travel advisories, recommendations bydelayed or prevented. If the U.S. Department of State and the Centers for Disease Control and Prevention, and travel bans and restrictions, each of which has impacted, and is expected to continue to significantly impact, the demand for the services we provide, including professional parking management, ground transportation, remote baggage check-in and handling, facility maintenance, security, event logistics, and other technology-driven mobility solutions.
The extent to which the pandemic impacts our business, operations, and financial results, including the duration and magnitude of such effects, will depend on numerous evolving factors thatMerger does not close, we may not be able to accurately predict or assess, including, but not limited to:experience other consequences that
8 |
|
|
|
|
|
|
|
8
|
|
|
|
|
|
|
|
The COVID-19 pandemic has already subjectedcould adversely affect our business, operations and financial condition, operating results and stock price. Our stockholders could be exposed to a number ofadditional risks, including, but not limited to those discussed below.the following:
|
|
|
|
|
|
As a result,
In addition, the efforts and costs to reduce our costs may not be sufficient to offset any reduction in our revenues and, atsatisfy the same time, may negatively impact our ability to attract and retain employees and senior management, retain or expand our client and customer base, continue to provide services sufficient to meet customer demand, including, in particular, following the endclosing conditions of the pandemic,Merger may place a significant burden on management and compete with others in our industries, and our reputation, revenues and market share may suffer as a result.
In addition, if our furloughed personnel do not return to work with us when the COVID-19 pandemic subsides, we may experience operational challenges, which could limit our ability to grow and expand our business and could reduce our profits. Further, reputational damage from,internal resources, and the financial impact of, reduced work hours could lead employees to depart the companyMerger and make it harder for us to recruit and hire new employees in the future.
Our ability to grow our company may also be harmed by COVID-19. If COVID-19related transactions whether or general economic weakness causes further deterioration for the travel, leisure and hospitality industry or the other industries to which we provide services, we may not be able to expand the geographies in which we provide our services or acquire businesses that may enable us to fuel our growth or otherwise execute our strategic growth plan. In addition, once the pandemic subsides, certain acquisition or other opportunities to grow our business may no longer be available, because such opportunities may have been pursued by our competitors or such opportunities may be too costly or time-consuming for us to pursue at that time. See “Risks relating to our acquisition strategy may adversely impact our results of operations.” See also “We are subject to intense competition that could constrain our ability to gain business and adversely impact our profitability.”
COVID-19 has caused, and, in the future, may continue to cause, us to incur additional expenses in light of the public health implications posed by COVID-19, including additional or accelerated investments in technology solutions which may be mandated by local, state, federal or other governmental authorities or by recommendations from the Centers for Disease Control and Prevention. The cost of investing in, implementing and maintaining such technology may be high, and such technology, whether purchased or developed internally, may not meet our needs or the needs of our clients and customers, in a timely, cost-effective manner or at all. During the course of implementing new technology into our operations, we may experience system interruptions and failures, whichconsummated, may result in additional costs to us. In addition, we may not recognize,a diversion of management's attention from day-to-day operations. Any significant diversion of management's attention away from ongoing business and difficulties encountered in the Merger process could have a timely manner or at all, the benefits that we may expect as a result of our implementing this or any other new technology into our operations.
The full impact of COVID-19material adverse effect on our business, results of operations and the industries in which we operate, as well as the effect on local, regional and global economic conditions, is highly uncertain, and its continuation, a future resurgence of COVID-19, or the existence of any future pandemic could precipitate or magnify the other risks described below in this Item 1A. “Risk Factors.”financial condition.
We are subject to intense competition that could constrain our ability to gain business and adversely impact our profitability.
Competition is intense in the parking facility management, valet, ground transportation service, event management, technology-driven mobility solutions and baggage delivery businesses including other ancillary services that we offer. Providers of similar services have traditionally competed on the basis of cost and quality of service. As we have worked to establish ourselves as a leader in the industries in which we operate, we compete predominately on the basis of high levels of service and strong relationships. We may not be able to, or may choose not to compete with certain competitors on the basis of price. As a result, a greater proportion of our clients may switch to other service providers or elect to self-manage the services we provide.
The low cost of entry into these businesses has led to strongly competitive, fragmented markets consisting of various sized entities, ranging from small local or single lot operators to large regional and national businesses and multi-facility operators, as well as governmental entities and companies that can perform for themselves one or more of the services we provide. Regional and local-owned and operated companies may have additional insights into local or smaller markets and significantly lower labor and overhead costs, providing them with a competitive advantage in those regards. Competitors may also be able to adapt more quickly to changes in customer requirements, devote greater resources to the promotion and sale of their services or develop technology that is as or more successful than our technology.
We provide nearly all of our services under contracts, many of which are obtained through competitive bidding, and many of our contracts require that our clients pay certain costs at specified rates. Our management type contracts are typically for a term of one to three years, although the contracts may be terminated by the client, without cause, on 30-days' notice or less, giving clients regular opportunities to attempt to negotiate a reduction in fees or other allocated costs. Any loss of a significant number of clients could, in the aggregate, materially adversely affect our operating results. We may experience higher operating costs related to changes in laws and regulations regarding employee benefits, employee minimum wage, and other entitlements promulgated by federal, state and local governments or as a result of increased local wages necessary to attract employees due to changes in the unemployment rate. If actual costs exceed the rates specified in the contacts or we are unable to renegotiate our specified rates in our contracts, our profitability may be negatively affected. Furthermore, these strong competitive pressures could impede our success in bidding for profitable business and our ability to maintain or increase prices even as costs rise, thereby reducing margins.
Changing consumer preferences and legislation affecting our industry or related industries may lead to a decline in parking demand, which could have a material adverse impact on our business, financial condition and results of operations.
9
Ride sharing services, such as Uber and Lyft, and car sharing services, like Zipcar, along with the potential for driverless cars, may lead to a decline in parking demand in cities and urban areas. While we devote considerable effort and resources to analyzing and responding to consumer preferencepreferences and changes in the markets in which we operate, consumer preferences cannot be predicted with certainty and can change rapidly. Changes in consumer behaviors, including the use of mobile phone applications and on-line parking reservation services that help drivers reserve parking with garage, lots and individual owner spaces, cannot be predicted with certainty and could change current customers' parking preferences, which may have an impact on the price customers are willing to pay for our services. In addition, demand for ride share services, such as Uber and Lyft, and car sharing services, like Zipcar, along with the potential for driverless cars, may lead to a decline in parking demand in cities and urban areas. Additionally, urban congestion and congestion pricing due to the aforementioned ride sharing services, or state and local laws that have been or may be passed encouraging carpooling and use of mass transit systems or the aforementioned ride sharing services, may negatively impact parking demand and pricing that a customer would be willing to pay for our services. If we are unable to anticipate and respond to trends in the consumer marketplace and the industry, including, but not limited to, market displacement by livery service companies, car sharing companies and changing technologies, itwe could haveexperience a material and adverse impact on our business, financial condition and results of operations. In addition, several state and local laws have been passed in recent years that encourage the use of carpooling and mass transit. In the future, local, state and federal environmental regulatory authorities may pursue or continue to pursue, measures related to climate change and greenhouse gas emissions which may have the effect of decreasing the number of cars being driven. Such laws or regulations could adversely impact the demand for our services and ultimately our business.
Our business success depends on our ability to preserve client relationships.
We primarily provide services pursuant to agreements that are cancelable by either party upon 30-days’ notice. As we generally incur initial costs on new contracts, our business associated with long-term client relationships is generally more profitable than short-term client relationships. Managing our existing client relationships, including those client relationships acquired as part of a business acquisition, is an important factor in contributing to our business success. If we lose a significant number of existing clients, or fail to win new clients, our profitability could be negatively impacted, even if we gain equivalent revenues from new clients or through client relationships acquired by acquisition.obtained through acquisitions.
We may have difficulty obtaining, maintaining or renewing coverage for certain insurable risks or coverage for certain insurable risks at a reasonable cost to us or at all.
We use a combination of insured and self-insured programs to cover workers' compensation, general/garage liability, automobile liability, property damage, healthcare and other insurable risks, and we provide liability and workers' compensation insurance coverage, consistent with our obligations to our clients under our various contracts. We are responsible for claims in excess of our insurance policies' limits, and, while we endeavor to purchase insurance coverage that is appropriate to our assessment of risk, we are unable to predict with certainty the frequency, nature or magnitude of claims or direct or consequential damages. If our insurance proves to be inadequate or unavailable, our business may be negatively affected.
9
Recent consolidation within the insurance industry could impact our ability to obtain or renew policies at competitive rates. Should we be unable to obtain or renew our excess, umbrella or other commercial insurance policies at competitive rates, it could have a material adverse impact on our business, as would the occurrence of catastrophic uninsured claims or the inability or refusal of our insurance carriers to pay otherwise insured claims.
We are subject to volatility associated with our high deductible and high retention insurance programs, including the possibility that changes in estimates of ultimate insurance losses could result in material charges against our operating results.
We are obligated to reimburse our insurance carriers for, or pay directly, each loss incurred up to the amount of a specified deductible or self-insured retention amount. We also purchase property insurance that provides coverage for loss or damage to our property and, in some cases, our clients' property, as well as business interruption coverage for lost operating income and certain associated expenses. The deductible or retention applicable to any given loss under the property insurance policies varies based upon the insured values and the peril that causes the loss. Our financial statements reflect our funding of all such obligations based upon guidance and evaluation received from third-party insurance professionals. However, our actual obligations at any particular time may exceed the amount presently funded or accrued, in which case we would need to set aside additional funds to reserve for any such excess.
The determination of required insurance reserves is dependent upon significant actuarial judgments. We use the results of actuarial studies to estimate insurance rates and reserves for future periods and adjust reserves as appropriate for the current year and prior years. Changes in insurance reserves as a result of periodic evaluations of the liabilities can cause swings in operating results that may not be indicative of the performance of our ongoing business. Actual experience related to our insurance reserves can cause us to change our estimates for reserves, and any such changes may materially impact our results of operations, causing volatility in our operating results. Additionally, our obligations could increase if we receive a greater number of insurance claims, or if the severity of, or the administrative costs associated with, those claims generallymaterially increases.
Further, to the extent that we self-insure our losses, deterioration in our loss control and/or our continuing claim management efforts could increase the overall costs of claims within our retained limits. A material change in our insurance costs due to changes in the frequency of claims, the severity of claims, the costs of excess/umbrella premiums, regulatory changes or consolidation within the insurance industry could have a material adverse effect on our financial position, results of operations or cash flows.
Because of the size of the operations covered and our claims experience, we purchase insurance policies at prices that we believe represent a discount to the prices that would typically be charged to clients on a stand-alone basis. The clients for whom we provide professional services pursuant to management type contracts have the option of purchasing their own liability insurance policies (provided that we are named as an additional insured party). Historically, most of our clients have chosen to obtain insurance coverage by being named as additional insureds under our master liability insurance policies. Pursuant to our management type contracts, we charge those clients an allocated portion of our insurance-related costs. Our inability to purchase such policies at competitive rates or charge clients for such insurance-related costs, could have a material adverse effect on our financial position, results of operations or cash flows.
We do not maintain insurance coverage for all possible risks.
We maintain a comprehensive portfolio of insurance policies to help protect us against loss or damage incurred from a wide variety of insurable risks. Each year, we review with our third partythird-party insurance advisers whether the insurance policies and associated coverages that we maintain are sufficient to adequately protect us from the various types of risk to which we are exposed in the ordinary course of business. That analysis takes into account various pertinent factors such as the likelihood that we would incur a material loss from any given risk, as well as the cost of obtaining insurance coverage against any such risk. We are responsible for claims in excess of our insurance policies' limits, and, while we endeavor to purchase insurance coverage that is appropriate to our assessment of risk, we are unable to predict with certainty the frequency, nature or magnitude of claims or direct or consequential damages, including, in particular, due to unforeseen events, such as COVID-19natural disasters, severe weather conditions, pandemic outbreaks and terrorist attacks.acts of terrorism and other geopolitical events. In addition, we may sustain material losses resulting from an event or occurrence where our insurance coverage is believed to be sufficient, but such coverage is either inadequate or we cannot access the coverage. Furthermore, our business interruption insurance, however, may not
10
provide sufficient coverage, if any, for losses we incur in connection with these events, in addition to other specified exclusions. These scenarios may result in a material adverse impact on our results of operations.
Our risk management and safety programs may not have the intended effect of allowing us to reduce our insurance costs.
We attempt to mitigate our business and operating risks through the implementation of Company-wide safety and loss control programs designed to decrease the incidence of accidents or events that might increase our exposure or liability. However, our insurance coverage may not be adequate, despite our implementation of Company-wide safety and loss control efforts, or may be inaccessible in certain instances, either of which would result in additional costs to us and may adversely impact our results of operations.
Risks relating to our acquisition strategy may adversely impact our results of operations.
In the past, a significant portion of our growth has been generated by acquisitions. In light of recent events related to the COVID-19 pandemic, we expect that there will be a slowdown in the pace or size of our acquisitions, which, in addition to the other factors discussed above, could lead to a slower growth rate. Any acquisition we make may not provide us with any of the benefits that we anticipated or anticipate when entering into such transaction, particularly acquisitions in adjacent professional services. The process of integrating an acquired business may create unforeseen difficulties and expenses. The areas in which we may face risks in connection with any potential acquisition of a business include, but are not limited to:
|
|
|
|
|
|
|
|
|
|
|
|
|
|
|
|
|
|
|
|
| • additional indebtedness incurred |
|
|
|
|
Our management type contracts and lease type contracts expose us to certain risks.
The loss or renewal on less favorable terms of a substantial number of management type contracts or lease type contracts could have a material adverse effect on our business, financial condition and results of operations. A material reduction in the operating income associated with the integrated services we provide under management type contracts and lease type contracts could have a material adverse effect on our business, financial condition and results of operations. Our management type contracts are typically for a term of one to three years, although the contracts may be terminated, without cause, on 30-days' notice or less, giving clients regular opportunities to attempt to negotiate a reduction in fees or other allocated costs. Any loss of a significant number of clients could in the aggregate materially adversely affect our operating results.
We are particularly exposed to increases in costs for locations that we operate under lease type contracts because we are generally responsible for all the operating expenses of our leased locations. Typically, during the first and fourth quarters of each year, seasonality generally impacts our performance with regard to moderating revenues, with the reduced levels of travel most clearly reflected in the parking activity associated with our airport and hotel businesses as well as increases in certain costs of parking services, such as snow removal, all of which negatively affects gross profit.The impact of COVID-19 on the seasonality of our business specifically, and the performance of our operations generally, will depend on, among other factors, the scale and duration of the pandemic and its impact on regulations, consumer behavior and consumer spending.
Deterioration in economic conditions in general could reduce the demand for our services and, as a result reduce our earnings andof an acquisition may adversely affectimpact our financial condition.
Adverse changes in global, nationalposition, results of operations and local economic conditions could havecash flows;
In addition, our business operations tend to be concentrated in large urban areas. Many of our customers are workers who commute by car to their places of employment in these urban centers or who use services in the travel, leisure and hospitality industry. Our business could be materially adversely affected to the extent that weak economic conditions or demographic factors could result in the elimination of jobs and high unemployment in the large urban areas where our business operations are concentrated, as has occurred in the wake of COVID-19. In addition, increased unemployment levels, increased office vacancies in urban areas, movement toward home office or “work from home” alternatives or lower consumer spending could reduce consumer demand for our services.
We are increasingly dependent on information technology, and potential disruption, cyber-attacks, cyber-terrorism and security breaches to our technology, or our third-party providers and clients, or the compromise of our data, present risks that could materially harm our business.
We are increasingly dependent on automated information technology systems to manage and support a variety of business processes and activities. In addition, a portion of our business operations is conducted electronically, increasing the risk of attack or interception that could in the future cause loss or misuse of data, system failures, disruption of operations, unauthorized malware, computer or system viruses, or the compromise of data, such as theft of intellectual property or
10
inappropriate disclosure of confidential, proprietary or personal information.
11
Furthermore, while we continue to devote resources to monitoring and updating our systems and implementing information security measures to protect our systems, the controls and procedures that we have in place may not be sufficient to protect us from security breaches. Improper activities by third parties, exploitation of encryption technology, new data-hacking tools and discoveries and other events or developments maycan result in a future compromise or breach of our networks, payment card terminals or other payment systems. In particular, the techniques used by criminals to obtain unauthorized access to sensitive data change frequently and often are not recognized until they have been deployed against a target. Accordingly, we may be unable to anticipate these techniques or implement adequate preventative measures.
Additionally, our systems could beare subject to damage or interruption from system conversions, power outages, computer or telecommunications failures, computer viruses and malicious attack, security breaches and catastrophic events. If our systems are damaged or fail to function properly, we may incur substantial repair and/or replacement costs, experience data loss or theft and impediments to our ability to manage customer transactions, which could materially adversely affect our operationsbusiness and our results of operations. The occurrence of acts of cyber terrorism, such as website defacement, denial of automated payment services, sabotage of our proprietary on-demand technology or the use of electronic social media to disseminate unfounded or otherwise harmful allegations to our reputation, could have a material adverse effect on our business. Any disruptions to our information technology systems, breaches or compromise of data and/or misappropriation of information could result in lost sales, negative publicity, litigation, violation of privacy laws, or business interruptions or damage to our reputation that, in turn, could materially negatively impact our financial condition and results of operations. While we maintain insurance coverage that may, subject to policy terms and conditions, cover certain aspects of cyber risks, suchOur insurance coverage may be insufficient to cover all losses potentially incurred and would not remedy any damage to our reputation.
We do not have control over security measures taken by third-party vendors hired by our clients to prevent unauthorized access to electronic and other confidential information. There can be no assurance third-party vendors will not suffer an attack in the future in which unauthorized parties gain access to personal financial information of individuals associated with our company,Company, our clients or our client's customers, and any such incident may not be discovered and remedied in a timely manner, or at all.
Our risk management and safety programs may not have the intended effect of allowing us to reduce our insurance costs.
We attempt to mitigate our business and operating risks through the implementation of Company-wide safety and loss control programs designed to decrease the incidence of accidents or events that might increase our exposure or liability. However, our insurance coverage may not be adequate, despite our implementation of Company-wide safety and loss control efforts, or may be inaccessible in certain instances, either of which would result in additional costs to us and may adversely impact our results of operations.
Our contracts expose us to certain risks.
The loss or renewal on less favorable terms of a substantial number of contracts could have a material adverse effect on our business, financial condition and results of operations. A material reduction in the operating income associated with the integrated services we provide under our contracts could have a material adverse effect on our business, financial condition and results of operations. Our management type contracts are typically for a term of one to three years, although the contracts may be terminated, without cause, on 30-days' notice or less, giving clients regular opportunities to attempt to negotiate a reduction in fees or other allocated costs. Any loss of a significant number of clients could in the aggregate materially adversely affect our operating results.
We are particularly exposed to increases in costs for locations that we operate under lease type contracts because we are generally responsible for all the operating expenses of our leased locations. Typically, during the first and fourth quarters of each year, seasonality generally impacts our performance with regard to moderating revenues, with the reduced levels of travel most clearly reflected in the parking activity associated with our aviation and hotel businesses, as well as increases in certain costs of parking services, such as snow removal, all of which can negatively affect operating income.
Deterioration in economic conditions in general could reduce the demand for our services and, as a result, reduce our earnings and adversely affect our financial condition.
Adverse changes in global, national and local economic conditions could have a negative impact on our business. Adverse economic conditions, including inflation and rising interest rates, may result in our client's customers reducing their discretionary spending, which includes travel and leisure spending. Because a portion of our revenue is tied to the volume of airline passengers, hotel guests, retail shoppers and sporting event attendees, our business could be adversely impacted by the curtailment of business travel, personal travel or discretionary spending caused by unfavorable changes in economic conditions and/or consumer confidence. Adverse changes in local, regional, national and international economic conditions could depress prices for our services or cause clients to cancel agreements for the services we provide to our clients and their customers.
In addition, the majority of our business tends to be concentrated in large urban areas. Many of our customers are workers who commute by car to their places of employment in these urban areas or who use services in the travel, leisure and hospitality industry. Our business could be materially adversely affected to the extent that weak economic conditions or demographic factors could result in the elimination of jobs and high unemployment in the large urban areas where our business is concentrated. In addition, increased unemployment levels, increased office vacancies in urban areas, movement toward home office or “work from home” alternatives or lower consumer spending could reduce demand for our services.
Global or large-scale pandemics could have a negative effect on the global economy and the financial markets, which has had and could in the future have an adverse effect on our business, financial condition and results of operations.
If a pandemic or similar occurrence, or general economic weakness causes deterioration for the travel, leisure and hospitality industry or the other industries to which we provide services, we may not be able to expand the geographies in which we provide our services or acquire businesses that may enable us to expand or otherwise execute our strategic growth plan.Such events have caused, and could in the future cause us to incur additional expenses in light of the public health implications, including additional or accelerated investments in technology solutions which may be mandated by local, state, federal, foreign or other governmental authorities or by recommendations from the Centers for Disease Control and Prevention.
Labor disputes could lead to loss of revenues or expense variations.
When one or more of our major collective bargaining agreements becomes subject to renegotiation or we face union organizing drives, we may disagree with the union on important issues that, in turn, could lead to a strike, work slowdown or other job actions. We may not be able to renew existing labor union contracts on acceptable terms, particularly during times of economic distress, and, in such cases, we may not be able to staff sufficient employees for our short-term needs. A strike, work slowdown or other job action could in some cases disrupt our ability to provide services, resulting in reduced revenues. If declines in client service occur or if our clients are targeted for sympathy strikes by other unionized workers, contract cancellations could result. Negotiating a first timefirst-time agreement or renegotiating an existing collective bargaining agreement could result in a substantial increase in labor and benefits expenses that we may be unable to pass through to clients. In addition, potential legislation could make it significantly easier for union organizing drives to be successful and could give third-party arbitrators the ability to impose terms of collective bargaining agreements upon us and a labor union if we are unable to agree with such union on the terms of a collective
11
bargaining agreement. At December 31, 2020,2023, approximately 28%31% of our employees were represented by labor unions and approximately 51%13% of our collective bargaining contracts are up for renewal in 2021,2024, representing approximately 54%22% of our employees. In addition, at any given time, we may face a number of union organizing drives. When one or more of our major collective bargaining agreements becomes subject to renegotiation or when we face union organizing drives, we and the union may disagree on important issues that could lead employees to strike, work slowdown, or other job actions. In a market where we are unionized but our competitors are not unionized, we may lose clients as a result. A strike, work slowdown, or other job actions could disrupt our ability to provide services to our clients, resulting in reduced revenues or contract cancellations. Moreover, negotiating first-time collective bargaining agreements or renewing existing agreements, could result in substantial increases in labor and benefit costs that we may not be able to pass through to clients.
In addition, we make contributions to multi-employer benefit plans on behalf of certain employees covered by collective bargaining agreements, and we could be responsible for paying unfunded liabilities incurred by such benefit plans, which amount could be material. If we become responsible for any such liability or liabilities, we could experience a material adverse impact on our results of operations and financial condition.
Catastrophic events could disrupt our business and services.
Catastrophic events, including natural disasters, severe weather conditions, pandemic outbreaks and acts of terrorism or other geopolitical events, have in the past, and may again in the future, cause economic dislocations throughout the country,geographies we operate in, lead to reduced levels of travel and result in an increase in certain costs of providing parking and remote bag check-in and handling services, any of which could negatively affect the use of our services and our gross profit.operating income. In addition, terrorist attacks have resulted in, and may continue to result in, increased government regulation of airlines and airport facilities, including the imposition of minimum distances between parking facilities and terminals, resulting in the elimination of parking facilities we manage. We derive a significant percentage of our gross profitoperating income from parking facilities and parking related services in and around airports. The Federal Aviation AdministrationFAA generally prohibits parking within 300 feet of airport terminals during periods of heightened security. Although the prohibition is not currently in effect, it may be reinstated in the future. The existing regulations governing parking within 300 feet of airport terminals during a period of heightened security or future regulations may prevent us from using certain parking spaces. Reductions in the number of parking spaces and air travelers may reduce our revenue and cash flow from both our leased facilities and those facilities and contracts we operate under management type contracts.
Because our business is affected by weather-related trends, typically in the first and fourth quarters of each year, our results may fluctuate from period to period, which could make it difficult to evaluate our business.
Weather conditions, including fluctuations in temperatures, snow or severe weather storms, heavy flooding, hurricanes or natural disasters, can negatively impact portions of our business. We periodically have from time to time experienced fluctuations in our quarterly results arising from a number of factors, including the following:
| • reduced levels of travel during and as a result of severe weather conditions, which is reflected in lower revenue from our services; and • increased cost of services, such as snow removal and longer delivery times for our baggage delivery services.
|
|
|
|
These factors have typically had negative impacts to our gross profitoperating income and could cause gross profitoperating income reductions in the future. Fluctuations in our results could make it difficult to evaluate our business or cause instability in the market price of our common stock.
There are risks associated with operations outside the United States
We have operations outside the United States. As such, we are subject to risks inherent in conducting our business outside the United States. The economic environment in which we operate may become volatile and we could be impacted by changes in foreign exchange rates, tax or other regulatory changes in the countries in which we have operations. In addition, we may have difficulties managing our international operations across different geographic areas and cultures, including assuring compliance with the U.S. Foreign Corrupt Practices Act and other U.S. and foreign anti-corruption laws. Any of these issues could have a material adverse impact on our business, financial condition and results of operations.
State and municipal government clients may sell or enter into long-term lease type contracts of parking-related assets with our competitors or property owners and developers may redevelop existing locations for alternative uses.
In order to raise additional revenue, a number of state and municipal governments have either sold or entered into long-term lease type contracts of public assets or may be contemplating such transactions. The assets that are the subject of such transactions have included government-owned parking garages located in downtown commercial districts and parking operations at airports. The sale or long-term leasing of such government-owned parking assets to our competitors or clients of our competitors could have a material adverse effect on our business, financial condition and results of operations.
12
Additionally, property owners and developers may elect to redevelop existing locations for alternative uses other than parking or significantly reduce the number of existing spaces used for parking at those facilities in which we either lease through a lease type contract or operate through a management type contract.facilities. Reductions in the number of parking spaces or potential loss of contracts due to redevelopment by property owners may reduce our gross profitoperating income and cash flow for both our lease type contracts and those facilities or contracts we operate under management type contracts.
We have investments in joint ventures and may be subject to certain financial and operating risks with our joint venture investments.
We have acquired or invested in a number of joint ventures, and may acquire or enter into joint ventures with additional companies. These transactions create risks such as:
| • additional operating losses and expenses in the businesses acquired or joint ventures in which we have made investments; • potential unknown liabilities associated with a company we may acquire or in which we invest; • requirements or obligations to commit and provide additional capital, equity or credit support as required by the joint venture agreements; • inability of the joint venture partner to (1) perform its obligations as a result of financial or other difficulties or (2) provide additional capital, equity or credit support under the joint venture agreements; and • disruption of our ongoing business, including loss of our focus on the business.
|
|
|
|
|
|
|
|
|
|
|
|
As a result of future acquisitions or joint ventures in which we may invest, we may need to issue additional equity securities, spend our cash, or incur debt and contingent liabilities, any of which could reduce our profitability and harm our business. In addition, valuations supporting our acquisitions or investments in joint ventures could change rapidly given the global economic environment and climate.environment. We could determine that such valuations have experienced impairments, resulting in other-than-temporary declines in fair value that could adversely impact our financial results.
13
Risks related to legal and regulatory matters
Adverse litigation judgments or settlements resulting from legal proceedings in which we may be involved could adversely affect our operations and financial condition.
12
In the normal course of business, we are from time to time involved in various legal proceedings.proceedings, including class action litigation. The outcome of these and any other legal proceedings cannot be predicted. It is possible that an unfavorable outcome of some or all of the matterslegal proceedings could cause us to incur substantial liabilities that may have a material adverse effect uponon our financial condition and results of operations. Any significant adverse litigation, judgments or settlements could have a negative effect on our business, financial condition and results of operations. Because our business employs a significant number of employees, we incur risks that these individuals will make claims against us for violating various employment-related federal, foreign, state and local laws. Some or all of these claims may lead to litigation, including class action litigation, and there may be negative publicity with respect to any alleged claims. Additionally, we are subject to legal and regulatory risks in the states and foreign countries where we have employees, including, for example, if there are new or unanticipated judicial interpretations of existing laws and those interpretations are applied to employers on a retroactive basis.
We operate in a highly regulated environment, and our compliance with laws and regulations, including any changes thereto, or our non-compliance with such laws and regulations, may impose significant costs on us.
Under various federal, state and local environmental laws, ordinances and regulations, current or previous owners or operators of real property may be liable for the costs of removal or remediation of hazardous or toxic substances on, under or in their properties. This appliescould apply to properties we either own or operate. These laws typically impose liability without regard to whether the owner or operator knew of, or was responsible for, the presence of such hazardous or toxic substances. We may be potentially liable for such costs as a result of our operation of parking facilities. Additionally, we hold a partial ownership interest in four parking facilities, and companies that we previously acquired in previous years may have owned a large number of properties that we did not acquire. We may be held liable for certain costs as a result of such previous and current ownership. In addition, from time to time we are subject to legal claims and regulatory actions involving environmental issues at certain locations or otherwise in connection with our operations. The cost of defending against claims of liability, or remediation of a contaminated property, could have a material adverse effect on our business, financial condition and results of operations.
In connection with ground transportation services and certain transportation and baggage services provided to our clients, including shuttle bus operations, baggage handling and delivery services and remote airline check-in services, the U.S. Department of Transportation, including the Transportation Security Administration (TSA)TSA and Department of Homeland Security, and various federal and state agencies exercise broad powers over these transportation and baggage related services, including, licensing and authorizations, safety, training and insurance requirements. Our employees must also comply with the various safety and fitness regulations promulgated by the U.S. Department of Transportation and other federal agencies, including those related to minimum training hours and requirements, drug and alcohol testing and service hours. We may become subject to new and more restrictive federal and state regulations, including in the wake of the COVID-19 pandemic.regulations. Compliance with such regulations could hamper our ability to provide qualified drivers and increase our operating costs. Our compliance with any new rules and regulations, directives, anticipated rules or other forms of regulatory oversight may have a material adverse effect on us.our business, financial condition or results of operations.
We are also subject to consumer credit laws and credit card industry rules and regulations relating to the processing of credit card transactions, including the Fair and Accurate Credit Transactions Act and the Payment Card Data Security Standard. These laws and these industry standards impose substantial financial penalties for non-compliance.
In addition, we are subject to laws generally applicable to businesses, including, but not limited, to federal, foreign, state and local regulations relating to data privacy, wage and hour matters, employee classification, mandatory healthcare benefits, unlawful workplace discrimination and whistle blowing. Any actual or alleged failure to comply with any regulation applicable to our business or any whistle-blowing claim, even if without merit, could result in costly litigation, regulatory action or otherwise harm our business, financial condition and results of operations.
We collect and remit sales/parking taxes and file our own tax returns for and tax returns on behalf of ourselves and our clients. We are affected, and may in the future be affected, by laws and regulations that may impose a direct assessment on us for failure to remit sales/parking taxes and filing ofour tax returns for ourselves and tax returns on behalf of our clients.
We cannot predict changes in laws and regulations made by federal, foreign, state or local government.governments. Any such changes may pose additional regulatory burden and costs on our business or otherwise adversely affect our results of operations.
FederalRising healthcare reform legislationcosts may adversely affect our business and results of operations.
We provide healthcare and other benefits to employees. In certain circumstances, we charge our clients insurance-related costs. Costs for health care have generally increased more rapidly than the general inflation in the U.S. economy. If this trend in health care continues and we are unable to raise the rates we charge our clients to cover expenses incurred due to the Patient Protection and Affordable Care Act or other healthcare initiatives, our operating profitincome could be negatively impacted.
Changes in tax laws or rulings could materially affect our financial position, results of operations, and cash flows.
We are subject to income and non-incomeother tax laws in the United States (federal, state and local) and other foreign jurisdictions, which include Canada, Puerto Rico, the United Kingdom and Puerto Rico.India. Changes in tax laws, regulations, tax rulings, administrative practices or changes in interpretations of existing laws, could materially affect our business. Due to economic and political conditions, tax rates in various jurisdictions may be subject to significant change, with or without notice, and theour effective tax rate could be affected by changes in the mix of earnings in countries with differing statutory tax rates or changes in tax laws or their interpretation, including in the United States (federal, state and local), Canada and Puerto Rico.the other foreign jurisdictions in which we operate. Our income tax expense, deferred tax assets and liabilities and our effective tax rates could be affected by numerous factors, including the relative amount of our foreign earnings, including earnings being lower than anticipated in jurisdictions where we have lower statutory rates and higher than anticipated in jurisdictions where we have higher statutory rates, the applicability of special tax regimes, losses incurred in jurisdictions for which we are not able to realize the related tax benefit, entry into new businesses or geographies, changes to our existing business and operations, acquisitions and investments and how they are financed and changes in the relevant tax, accounting and other laws regulation,tax law regulations, administrative practices, principles and interpretations. Additionally, adverse changes in the underlying profitability and financial outlook of our operations or changes in tax law, as discussed above, could lead to changes in our valuation allowances against deferred tax assets on our consolidated balance sheets, which could materially affect our results of operations.
We are also subject to tax audits and examinations by governmental authorities in the United States (federal, state and local), Canada and Puerto Rico.other foreign jurisdictions in which we operate. We regularly assess the likelihood of an adverse outcome resulting from these examinations to determine the adequacy of our provision for taxes, but our assessments as to the outcome of such tax audits and examinations involve a number of assumptions and may ultimately prove to be incorrect. Negative unexpected results from one or more such tax audits or examinations or our failure to sustain our reporting positions on examination could have an adverse effect on our results of operations and our effective tax rate.
13
14
Risks related to our liquidity and capital resources
The phase-out of the London Interbank Offered Rate (“LIBOR”) could affect interest rates under our existing credit facility agreement, hedging activity, as well as our ability to seek future debt financing.
LIBOR is the basicInterest rate of interest used in lending between banks on the London interbank market and is widely used as a reference for setting the interest rates on loans globally. We generally use LIBOR as a reference rate to calculate interest rates under the Senior Credit Facility and to establish the floor and ceiling ranges for the interest rate collar contracts that we entered into to manage interest rate risk associated with the Senior Credit Facility.
In 2017, the United Kingdom’s Financial Conduct Authority, which regulates LIBOR, announced that it intends to phase out LIBOR by the end of 2021. Regulators in various jurisdictions have been working to replace LIBOR and other interbank offered rates with reference interest rates that are more firmly based on actual transactions. The U.S. Federal Reserve, in conjunction with the Alternative Reference Rates Committee, a steering committee comprised of large U.S. financial institutions, has identified the Secured Overnight Financing Rate (“SOFR”) that is calculated using short-term repurchase agreements backed by Treasury securities, as its preferred alternative to LIBOR. The Financial Accounting Standards Board ("FASB") added the Overnight Index Swap Rate based on the SOFR to the list of U.S. benchmark interest rates eligible to be hedged under US GAAP and has issued a proposal for consideration that would help facilitate the market transition from existing reference interest rates to alternatives.
It is expected that a transition away from the widespread use of LIBOR to alternative rates will occur over the course of the next few years. If a published LIBOR is unavailable after 2021, the interest rates under our Senior Credit Facility will be determined using various alternative methods, any of which may not be as favorable to us as those in effect prior to any LIBOR phase-out. In addition, the transition process to an alternative method may involve, among other things, increased volatility or illiquidity in markets for instruments that currently rely on LIBOR and may also result in reductions in the value of certain instruments or the effectiveness of related transactions such as our interest rate collars and any other hedges, increased borrowing costs, uncertainty under applicable documentation, or difficult and costly consent processes. Any such effects of the transition away from LIBOR, as well as other unforeseen effects, may result in expenses, difficulties, complications or delays in connection with future financing efforts, whichchanges could have a material adverse impacteffect on our results of operations.
We are exposed to interest rate risks primarily as a result of our borrowings and investing activities, which include long-term borrowings used to maintain liquidity and fund our business and capital requirements. The nature and amount of our debt may vary from time to time as a result of business requirements, market conditions, and other factors.
On April 21, 2022, we entered into a fifth amendment (the “Fifth Amendment”) to our Amended Credit Agreement (as defined in Note 11. Borrowing Arrangements), pursuant to which the Lenders have made available to us a senior secured credit facility (the “Senior Credit Facility”). The Senior Credit Facility bears interest at a forward-looking SOFR term interest rate administered by Chicago Mercantile Exchange (“Term SOFR”). Our interest expense could increase due to changes in the Term SOFR rate and our available cash flow for general corporate requirements may be adversely affected. In addition, there remains uncertainty as to the longer-term impact of the adoption of Term SOFR and other alternative reference rates, which could affect our overall financial condition andor results of operations.
Impairment charges could have a material adverse effect on our financial condition and results of operations.
Goodwill represents the excess of the purchase price of acquired businesses over the fair values of the assets acquired and liabilities assumed. October 1st is our annual impairment assessment date for goodwill. However, we could be required to evaluate the recoverability of goodwill prior to the annual assessment if we experience a significant under-performance relative to expected historical or projected future operating results, significant changes in the use of acquired assets or our business strategy, andor significant negative industry or economic trends. The goodwill impairment test is performed at the reporting unit level. If the fair value of one of our reporting units is less than its carrying value, we would record impairment for the excess of the carrying amount over the implied fair value. The valuation of our reporting units requires significant judgment in evaluation of recent indicators of market activity and estimated future cash flows, discount rates, and other factors. Future events may indicate differences from management’sour judgments and estimates which could, in turn, result in impairment charges. Future events that may result in impairment charges include extended unfavorable economic impacts of COVID-19,volatility, increases in interest rates, which would impact discount rates, or other factors which could decrease revenues and profitability of our reporting units and changes in the cost structure of existing facilities. During the year ended December 31, 2020, we recognized a goodwill impairment charge of $59.5 million. See Note 1. Significant Accounting Policies and Practices and Note 11. Goodwill to our Consolidated Financial Statements for further discussion.
We evaluate our long-lived assets, including lease ROUright-of-use (“ROU”) and intangible assets, for impairment whenever events or changes in circumstances indicate that the carrying amount of such assets may not be recoverable. These events and circumstances include, but are not limited to, a current expectation that a long-lived asset will be disposed of significantly before the end of its previously estimated useful life, a significant adverse change in the extent or manner in which we use a long-lived asset or asset group, a change in itsa long-lived asset’s physical condition or a projection or forecast that demonstrates continuing losses associated with the use of the long-lived asset or asset group. When this occurs, a recoverability test is performed that compares the projected undiscounted cash flows from the use and eventual disposition of an asset or asset group to its carrying amount. If we conclude that the projected undiscounted cash flows are less than the carrying amount, impairment would be recorded for the excess of the carrying amount over the estimated fair value. During the year ended December 31, 2020, we concluded that certain ROU and intangible assets were impaired and recorded impairment charges amounting to $98.6 million and $75.8 million, respectively. See Notes 1. Significant Accounting Policies and Practices, Note 2. Leases and Note 10. 3. Other Intangible Assets, netLeases to our Consolidated Financial Statements for further discussion.
Assumptions and estimates used to determine cash flows in the evaluation of impairment and the fair values used to determine the impairment are subject to a degree of judgment and complexity. Any future changes to the assumptions and estimates resulting from changes in actual results or market conditions from those anticipated may affect the carrying value of long-lived assets or asset groups and could result in additional impairment charges. Future events that may result in impairment charges include extended unfavorable economic impacts of COVID-19,volatility or other factors which could decrease revenues and profitability of existing locations and changes in the cost structure of existing facilities.
We have incurred indebtedness, and we may incur indebtedness in the future, thatwhich could adversely affect our financial condition.
Our Amended Credit Agreement (as defined in Item 9B. Other Information), which was amended on February 16, 2021, provides for a Senior Credit Facility that includes a $325.0$400.0 million revolving credit facility and a $225.0$200.0 million term loan that is scheduled to mature in November 2023.April 2027. The Senior Credit Facility is secured by a lien on all of our assets. In connection with our Amended Credit Agreement, the negative and financial covenants in the Credit Agreement were amended and some additional covenants were added, as described in Item 9B. Note 11. Other InformationBorrowing Arrangements. Failure to comply with covenants or to meet payment obligations under our Senior Credit Facility could result in an event of default which, if not cured or waived, could result in the acceleration of outstanding debt obligations.
We may incur additional indebtedness in the future, which could cause the related risks to intensify. We may need to refinance all or a portion of our indebtedness on or before their respective maturities. We may not be able to refinance any of our indebtedness, including indebtedness under our Senior Credit Facility, on commercially reasonable terms or at all. If we are unable to refinance our debt, we may default under the terms of our indebtedness, which could lead to an acceleration of debt repayment.the repayment of outstanding debt. We do not expect that we could repay all of our outstanding indebtedness if the repayment of such indebtedness was accelerated. If adequate capital is not available to us and our internal sources of liquidity prove to be insufficient, or if future financings require more restrictive covenants, such combination of events could adversely affect our ability to (i) acquire new businesses or enter new markets, (ii) service or refinance our existing debt, (iii) make necessary capital investments and (iv) make other expenditures necessary for the ongoing conduct of our business.
In addition, the terms of future debt agreements and amendments to our existing debt agreements could include more restrictive covenants, which may further restrict our business operations or cause future financing to be unavailable due to our covenant restrictions then in effect.
Our ability to maintain and expand our business will be dependent upon the availability of adequate capital.
15
The ability to maintain and expand our business will depend, in part, on the availability of adequate capital, which in turn will depend, in large part, on cash flow generated by our business and the availability of equity and debt capital. In addition, the Senior Credit Facility contains provisions that restrict our ability to incur additional indebtedness and/or make substantial investments or acquisitions. As a result, we may not have the ability to obtain adequate capital to maintain and expand our business.
The financial difficulties or bankruptcy of one or more of our major clients could adversely affect our results.
Future revenue and our ability to collect accounts receivable depend in part on the financial strength of our clients. We estimate an allowance for doubtful accounts, and this allowancewhich adversely impacts profitability. In the event that any of our clients experience financial difficulty, become unable to obtain financing or seek bankruptcy protection, our profitability wouldcould be further impacted by our failureinability to collect accounts receivable in excess of the estimated allowance. Additionally, our future revenue wouldcould be reduced by the loss of theseany such clients or by the cancellation of lease type contracts or management type contracts by clients in bankruptcy.
The sureties for our performance bond program may elect not to provide us with new or renewal performance bonds for any reason.
As is customary in the industry, a surety provider can refuse to provide a bond principal with new or renewal surety bonds. If any existing or future surety provider refuses to provide us with surety bonds, either generally or because we are unwilling or unable to post collateral at levels sufficient to satisfy the surety's requirements, we may not be able to find alternate providers on acceptable terms, or at all. Our inability to provide surety bonds could also result in the loss of
14
existing contracts. Failure to find a provider of surety bonds, and our resulting inability to bid for new contracts or renew existing contracts, could have a material adverse effect on our business and financial condition.
General risk factors
Our business success depends on retaining senior management and attracting and retaining qualified personnel.
Our future performance depends on the continuing services and contributions of our senior management to execute on our acquisition and growth strategies and to identify and pursue new opportunities. Our future success also depends, in large part, on our continued ability to attract and retain qualified personnel. Any unplanned turnover in senior management or the inability to attract and retain qualified personnel could have a negative effect on our results of operations.
Additionally, we must attract, train and retain a large and growing number of qualified employees while controlling labor costs. Our ability to control labor costs is subject to numerous internal and external factors, including changes in immigration policy, regulatory changes, prevailing wage rates, and competition we face from other companies to attract and retain qualified employees. We may not be able to attract and retain qualified employees in the future, which could have a material adverse effect on our business, financial condition and results of operations.
Climate change may have a long-term impact on our business.
There are inherent climate-related risks wherever our business is conducted. Changes in market dynamics, stakeholder expectations, local, national and international climate change policies, and the frequency and intensity of extreme weather events on critical infrastructure in the United States and abroad, all have the potential to disrupt our business. Such events could result in a significant increase in our costs and expenses and harm our future revenue, cash flows and financial performance. Global climate change is resulting, and may continue to result, in certain natural disasters and adverse weather, such as droughts, wildfires, storms, sea-levels rising and flooding, occurring more frequently or with greater intensity, which could cause business disruptions and impact employees’ abilities to commute to work or to work from home effectively. Government failure to address climate change could result in greater exposure to economic and other risks from climate change and impact our ability to achieve climate goals.
Actions of activist investors could disrupt our business.
Public companies have been the target of activist investors, including, in particular, during times of economic and market turmoil. In the event that a third-party, such as an activist investor, proposes to change our governance policies, boardBoard of directors,Directors (the "Board") or other aspects of our operations,business, our review and consideration of such proposals may create a significant distraction for our management and employees. This could negatively impact our ability to execute our long-term growth plan and may require our management to expend significant time and resources responding to such proposals. Such proposals may also create uncertainties with respect to our financial position and operations and may adversely affect our ability to attract and retain key employees.
Item 1B.Unresolved Unresolved Staff Comments
Not applicable.
Item 1C. Cybersecurity We maintain an information security and cybersecurity program as part of our overall risk management program. Our information security and cybersecurity program is managed by a dedicated Chief Information Security Officer (“CISO”), who reports to our Chief Financial Officer ("CFO"). Our CISO has extensive expertise and eighteen years of experience in information security. In addition, the CISO’s team is responsible for leading the enterprise-wide information security and cybersecurity strategy, policy, standards, architecture and processes. Our information security and cybersecurity program identifies and prioritizes risks to appropriately analyze and manage our potential cyber-related threats.The CISO provides periodic, or as needed, reports regarding risks from cybersecurity threats to the Audit Committee (the “AC”) of the Board, as well as the Security Executive Committee, which includes our Chairman and Chief Executive Officer ("CEO"), CFO and other executive leadership. These reports include updates on our cybersecurity risks, the status of projects to strengthen our information security systems, assessments of the information security program and the emerging threat landscape. The CISO is responsible for leading the day-to-day assessment, identification and management of cybersecurity risks, while the Board, as a whole and through the AC, has responsibility for the oversight of risk management, including cybersecurity risk. The Board, in its risk oversight role, is responsible for determining that the risk management framework and supporting processes as implemented by management are adequate and functioning as designed. The Board is actively involved in the oversight of key risks inherent in our business and routinely reviews our strategic plan and the related key risks, including the output of our enterprise risk management process, which includes risks related to cybersecurity. In addition to the CISO’s and Security Executive Committee's review, cybersecurity risks are regularly assessed by two other internal information security sub-committees, as well as a third-party security consultant. The results of those reviews are reported to our Security Executive Committee, the AC and the Board.The third-party security consultant discussed above has extensive industry expertise in security and risk management.In addition, as part of our cybersecurity program, we evaluate all of our third-party vendors for any material cybersecurity risks and only contract with third-party vendors that have the controls that we believe are appropriate to have in place to protect against cybersecurity risks and threats. As of the date of this report, we are not aware of any material risks from cybersecurity threats that have materially affected or are reasonably likely to materially affect us, including our business strategy, results of operations or financial condition. See Part I, Item 1A. Risk Factors of this Form 10-K under the heading “Risk Factors” for further discussion. Item 2. Properties
|
|
Our principal support office is located at 200 East Randolph Street, Suite 7700, Chicago, Illinois 60601.
Principal Properties as of December 31, 20202023
Location | Character of Office | Approximate Square Feet | Lease Expiration Date | Segment | ||||||
Chicago, Illinois |
|
|
|
| ||||||
|
|
|
|
| ||||||
|
|
|
|
| ||||||
(1) |
|
| Chicago Support Office |
| 35,000 | September 2025 | Other | |||||
Nashville, Tennessee | Nashville Support Office | 25,000 | June 2025 | Other |
In addition to the above properties, we have other offices, warehouses and parking facilities in various locations in the United States, Canada, Puerto Rico, the United Kingdom and Puerto Rico.India.
We believe that these properties are well maintained, in good operating condition and suitable for the purposes for which they are used.
15 Item 3. Legal Proceedings General
|
|
General
We are subject to claims and litigation in the normal course of our business, including those related to labor and employment, contracts, personal injury and other related matters, some of which allege substantial monetary damages and claims. Some of these actions may be brought as class actions on behalf of a class or purported class of employees. While the outcomes of claims and legal proceedings brought against us are subject to significant uncertainty, our management believeswe believe the final outcome will not have a material adverse effect on our financial position, results of operations or cash flows.
We accrue a charge when our management determineswe determine that it is probable that an asset has been impaired or a liability has been incurred and the amount of loss can be reasonably estimated. When a loss is probable, we record an accrual based on the reasonably estimable loss or range of loss. When no point of loss is more likely than another, we record the lowest amount in the estimated range of loss and, if material, disclose the estimated range. We do not record liabilities for reasonably possible loss contingencies, but do disclose a range of reasonably possible losses if they are material and we are able to estimate such a range. If we cannot
16
provide a range of reasonably possible losses, we explain the factors that prevent us from determining such a range. In addition, we accrue for the authoritative judgments or assertions made against us by government agencies at the time of their rendering regardless of our intent to appeal. We regularly evaluate current information available to us to determine whether an accrual should be established or adjusted. Estimating the probability that a loss will occur and estimating the amount of a loss or a range of loss involves significant estimation and judgment.
Item 4. Mine Safety Disclosures
|
|
Not applicable.
16
17
PART II
Item 5. Market for Registrant's Common Equity, Related Stockholder Matters and Issuer Purchases of Equity Securities
|
|
Our common stock is listed on the Nasdaq Stock Market LLC under the symbol "SP".
Holders
As of February 11, 2021,13, 2024, we estimate that there were approximately 9,0009,700 registered holders of our common stock.
Issuer Purchases of Equity Securities
There were no repurchasesOn February 14, 2023, our Board approved a new stock repurchase plan authorizing us to repurchase, on the open market, shares of equity securities during the three months endedour outstanding common stock in an amount not to exceed $60.0 million in aggregate.
As of December 31, 2020.2023, $60.2 million remained available for repurchase under our May 2022 and February 2023 stock repurchase programs. Repurchases of our common stock may be made in open market transactions effected through a broker-dealer at prevailing market prices, in block trades, or by other means in accordance with the Rules 10b-18, to the extent relied upon, and 10b5-1 under the Exchange Act at the time and prices considered to be appropriate at our discretion. The stock repurchase program does not obligate us to repurchase any particular amount of common stock and has no fixed termination date, and may be suspended at any time at our discretion.
As a condition of the Merger Agreement, beginning on October 4, 2023, we were restricted from repurchasing our common stock.
Securities Authorized for Issuance Under Equity Compensation Plans
We have an amended and restated long-term incentive plan (the "Plan") that was adopted in conjunction with our initial public offering in 2004. On March 7, 2018, the26, 2021, our Board approved an amendment and restatement of the Plan that increased the number of shares of common stock available under the Plan from 2,975,0003,775,000 to 3,775,000. Company4,775,000. Our stockholders approved the Plan amendment and restatement on May 8, 2018.12, 2021. Under the Plan, we have granted stock options, stock grants and issued restricted stock units (RSUs)(“RSU’s”) and performance stock units (PSUs)(“PSU’s”) awards to certain employees. Forfeited and expired options under the Plan generally become available for reissuance. Additional information regarding the Plan appears in Note 1. Significant AccountingPolicies and Practices and Note 7.6. Stock-Based Compensation to our Consolidated Financial Statements.
The status of the Plan onas of December 31, 2020 is2023 was as follows:
|
|
|
|
|
|
| Number of |
| ||||
|
|
|
|
|
|
| Securities |
| ||||
|
|
|
|
|
|
| Remaining |
| ||||
|
|
|
|
|
|
| Available |
| ||||
| Number of |
|
| Weighted- |
|
| for Future |
| ||||
| Securities to be |
|
| Average |
|
| Issuance |
| ||||
| Issued Upon |
|
| Exercise |
|
| Under Equity |
| ||||
| Exercise of |
|
| Price of |
|
| Compensation |
| ||||
| Outstanding |
|
| Outstanding |
|
| Plans |
| ||||
| Options, |
|
| Options, |
|
| (Excluding |
| ||||
| Warrants |
|
| Warrants |
|
| Securities |
| ||||
Plan Category |
| Rights (Column A) |
|
| Rights (Column B) |
|
| Column A) |
| |||
Equity compensation plans approved by securities holders (a) |
|
| 610,955 |
|
|
| — |
|
|
| 832,273 |
|
Equity compensation plans not approved by securities holders |
|
| — |
|
|
| — |
|
|
| — |
|
Total |
|
| 610,955 |
|
|
| — |
|
|
| 832,273 |
|
|
|
|
|
|
|
|
|
|
| Number of |
| |
|
|
|
|
|
|
|
|
|
| Securities |
| |
|
|
|
|
|
|
|
|
|
| Remaining |
| |
|
|
|
|
|
|
|
|
|
| Available |
| |
|
| Number of |
|
| Weighted- |
|
| for Future |
| |||
|
| Securities to be |
|
| Average |
|
| Issuance |
| |||
|
| Issued Upon |
|
| Exercise |
|
| Under Equity |
| |||
|
| Exercise of |
|
| Price of |
|
| Compensation |
| |||
|
| Outstanding |
|
| Outstanding |
|
| Plans |
| |||
|
| Options, |
|
| Options, |
|
| (Excluding |
| |||
|
| Warrants and |
|
| Warrants and |
|
| Securities Reflected in |
| |||
Plan Category |
| Rights (Column A) |
|
| Rights (Column B) |
|
| Column A) |
| |||
Equity compensation plans approved by securities holders (a) |
| $ | 251,494 |
|
| $ | — |
|
| $ | 647,903 |
|
Equity compensation plans not approved by securities holders |
|
| — |
|
|
| — |
|
|
| — |
|
Total |
| $ | 251,494 |
|
| $ | — |
|
| $ | 647,903 |
|
17 |
|
18
Stock Performance Graph

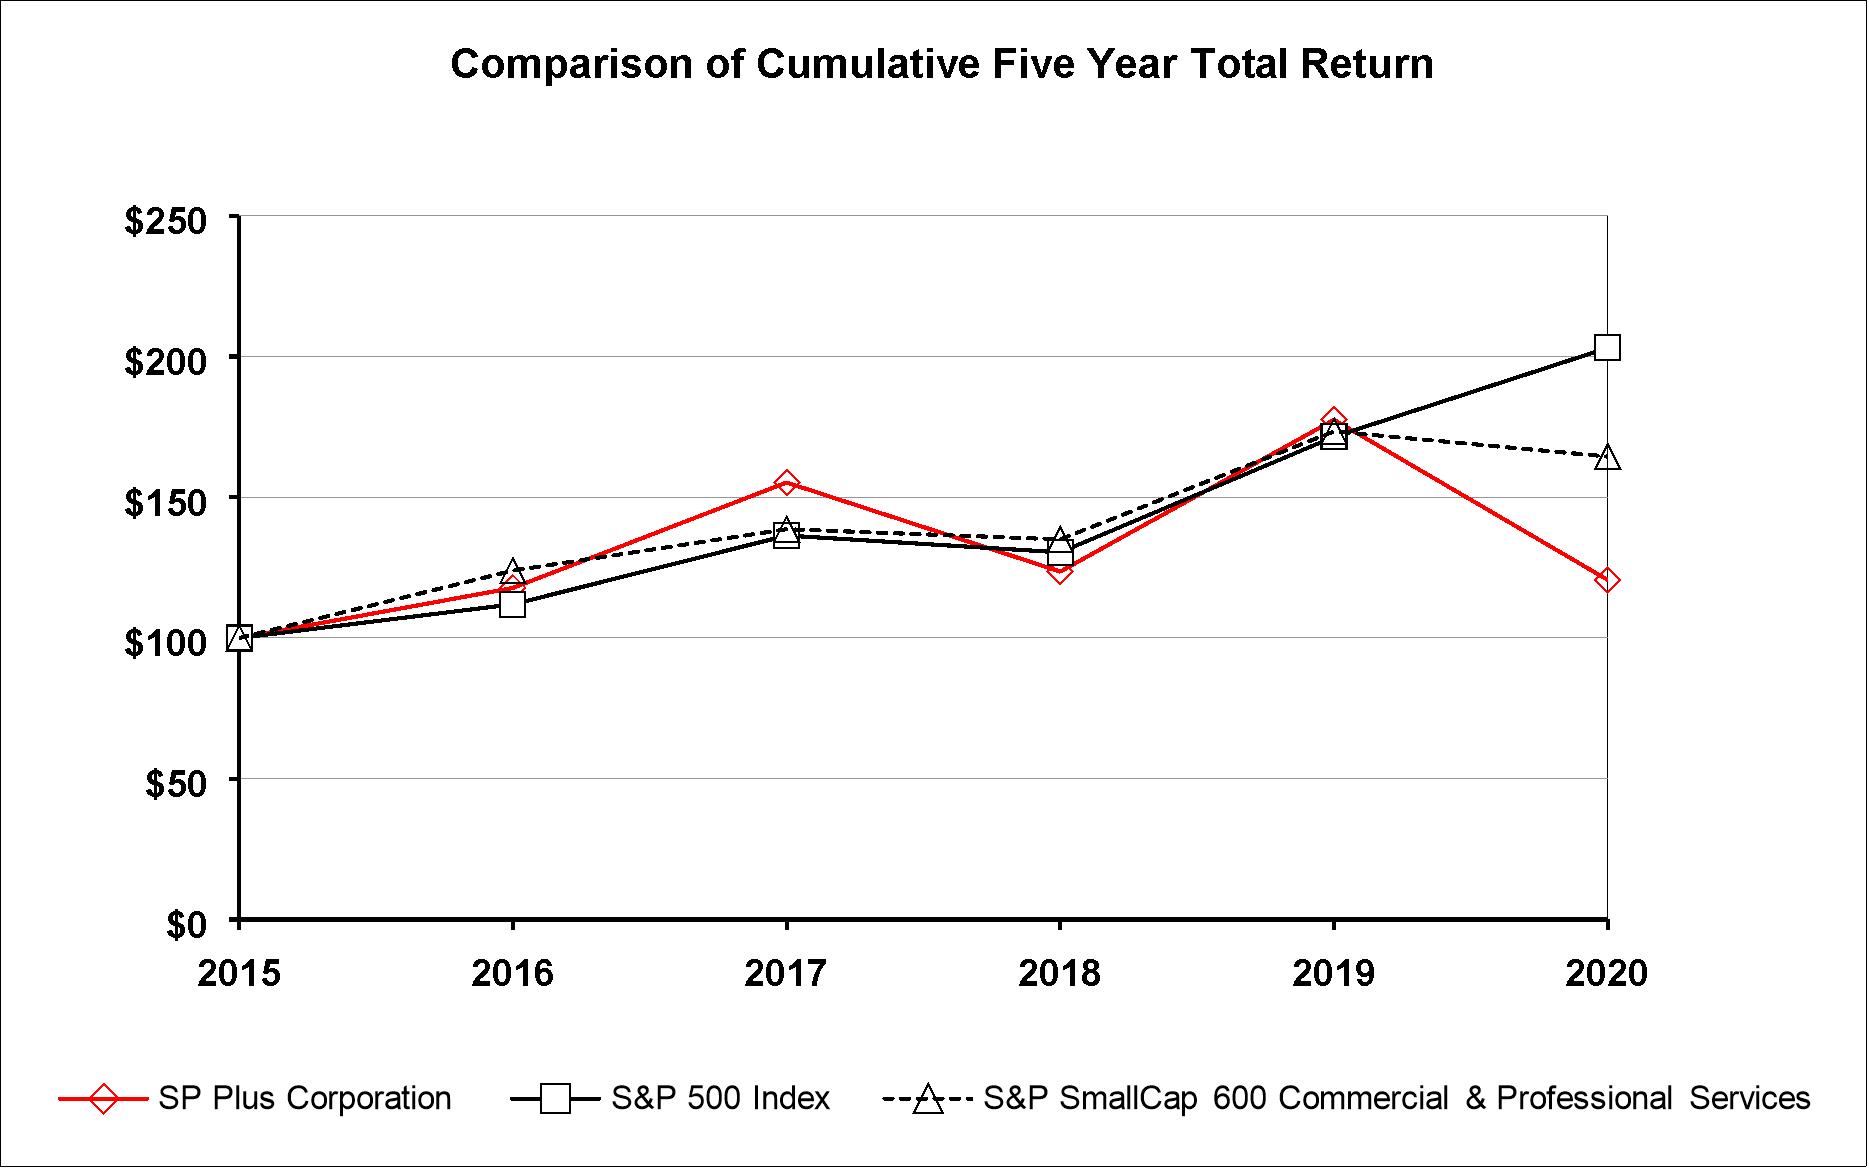
| Years Ended December 31, |
| ||||||||||||||||||||||
Company / Index |
| 2018 |
|
| 2019 |
|
| 2020 |
|
| 2021 |
|
| 2022 |
|
| 2023 |
| ||||||
SP Plus Corporation |
| $ | 100.00 |
|
| $ | 143.64 |
|
| $ | 97.60 |
|
| $ | 95.53 |
|
| $ | 117.54 |
|
| $ | 173.49 |
|
S&P 500 Index |
| $ | 100.00 |
|
| $ | 131.49 |
|
| $ | 155.68 |
|
| $ | 200.37 |
|
| $ | 164.08 |
|
| $ | 207.21 |
|
S&P SmallCap 600 Commercial & Professional Services |
| $ | 100.00 |
|
| $ | 128.41 |
|
| $ | 121.80 |
|
| $ | 144.16 |
|
| $ | 124.98 |
|
| $ | 142.05 |
|
|
| Years Ended December 31, |
| |||||||||||||||||||||
Company / Index |
| 2015 |
|
| 2016 |
|
| 2017 |
|
| 2018 |
|
| 2019 |
|
| 2020 |
| ||||||
SP Plus Corporation |
| $ | 100.00 |
|
| $ | 117.78 |
|
| $ | 155.23 |
|
| $ | 123.60 |
|
| $ | 177.53 |
|
| $ | 120.63 |
|
S&P 500 Index |
| $ | 100.00 |
|
| $ | 111.96 |
|
| $ | 136.40 |
|
| $ | 130.42 |
|
| $ | 171.49 |
|
| $ | 203.04 |
|
S&P SmallCap 600 Commercial & Professional Services |
| $ | 100.00 |
|
| $ | 123.95 |
|
| $ | 138.65 |
|
| $ | 135.03 |
|
| $ | 173.39 |
|
| $ | 164.46 |
|
The performance graph above shows the cumulative total stockholder return of our common stock for the period starting on December 31, 20152018 to December 31, 2020.2023. This performance is compared with the cumulative total returns over the same period of the Standard & Poor's (“S&P”) 500 Index and the Standard & Poor'sS&P SmallCap 600 Commercial and Professional Services Index, which includes our direct competitor, ABM Industries Incorporated. The graph assumes that on December 31, 2015,2018, $100 was invested in each of the other two indices, and assumes reinvestment of dividends. The stock performance shown in the graph represents past performance and should not be considered an indication of future performance.
Item 6. [Reserved]
18 |
|
N/A
19
Item 7. Management's Discussion and Analysis of Financial Condition and Results of Operations
|
|
This Item 7. "Management's Discussion and Analysis of Financial Condition and Results of Operations" and other parts of this Form 10-K contain forward-looking statements, within the meaning of the Private Securities Litigation Reform Act of 1995, that involve risks and uncertainties. Forward-looking statements provide current expectations of future events based on certain assumptions and include any statement that does not directly relate to any historical or current fact, including statements regarding the anticipated further impact of the COVID-19 pandemic on our operations and financial condition.fact. Forward-looking statements can also be identified by words such as "future," "anticipates," "believes," "estimates," "expects," "intends," "plans," "predicts," "will," "would," "could," "can," "may," and similar terms. Forward-looking statements are not guarantees of future performance, and the Company'sSP Plus Corporation’s (“we”, "us" or "our") actual results may differ significantly from the results discussed in the forward-looking statements. Factors that might cause such differences include, but are not limited to, those discussed in Part I, Item 1A. "Risk Factors" of this Form 10-K, which are incorporated herein by reference. The following discussion should be read in conjunction with the Consolidated Financial Statements and notes thereto included in Part IV, Item 15. "Exhibits and Financial Statement Schedules" of this Form 10-K. Each of the terms the "We" and "Our" as used herein refers collectively to SP Plus Corporation and its wholly-owned subsidiaries, unless otherwise stated. The Company assumesWe assume no obligation to revise or update any forward-looking statements for any reason, except as required by law.
Explanatory Note
On November 30, 2018, we completed the acquisition of Bags. Our consolidatedA discussion regarding our financial condition and results of operations for the year-ended December 31, 2022 compared to the year-ended December 31, 2021 can be found in Part II Item 7. Management's Discussion and Analysis of Financial Condition and Results of Operations in our Annual Report on Form 10-K for the fiscal year ended December 31, 2018 includes2022 as filed with the resultsSecurities and Exchange Commission on February 24, 2023.
Recent Developments
On October 4, 2023, we entered into the Merger Agreement by and among us, Metropolis and the Merger Sub. See Note 1. Significant Accounting Policies and Practices within the Notes to the Consolidated Financial Statements for further discussion.
General Overview
As of operations for the period of November 30, 2018 through December 31, 2018. See Note 3. Acquisition, which is included2023, in Part IV, Item 15. "Exhibitsour Commercial segment, we operated approximately 88% of our locations under management type contracts and Financial Statement Schedules" for further discussion of the acquisition of Bags.12% under lease type contracts, while in our Aviation segment, we served 159 airports across North America and Europe.
General Overview
In evaluating our financial condition and operating performance, our primary area of focus is on our gross profit and total general and administrative expenses.operating income. Revenue from lease type contracts includes all gross customer collections derived from our lease type contractsleased locations (net of local parking taxes), whereas revenue from management type contracts only includes our contractually agreed upon management fees and amounts attributable to ancillary services. Gross customer collections at facilities under management type contracts, therefore, are not included in our revenue. Accordingly, while a change in the proportion of our operating agreements that are structured as lease type contracts may cause significant fluctuations in reported revenue and cost of services, those changesour operating income under lease type contracts will not artificially affect our gross profit. For example, as of December 31, 2020, 85% of our commercial business wasbe comparable to the operating income under management type contracts. Only 54% of total revenue (excluding reimbursed management type contract revenue) for the year ended December 31, 2020, however, was from management type contracts. Under those contracts, the revenue collected from customers belongs to our clients.
We believe that sophisticated clients (which also include property owners) recognize the potential for technology-driven mobility solutions, parking services, parking management, ground transportation services, baggage handling services technology-driven mobility solutions and other ancillary services to be a profit generator and/or a service differentiator to their customers. By outsourcing these services, theyour clients are able to capture additional profit and improve customer experiences by leveraging the unique technology, operational skills and controls that an experienced services companyand technology solutions provider can offer. Our ability to consistently deliver a uniformly high level of services to our clients, including the use of various technologicaltechnology solutions and enhancements, allows us to maximize the profit and/or customer experience tofor our clients and improves our ability to win contracts and retain existing clients. Our focus on customer service and satisfaction is a key driver of our high retention rate, which was approximately 87%94% and 93% for the years ended December 31, 20202023 and 2019,2022, respectively, for theour Commercial segment.segment facilities.
Commercial Segment Facilities
In order to mitigate some of the effects from the COVID-19 pandemic (“COVID-19”), we converted many of our lease locations to management locations during the year ended December 31, 2020. In addition, we were able to exit many less profitable contracts, which were for both lease and management locations. The following table reflects our Commercial facilities (by contractual type) operated aton the enddates indicated:
| December 31, |
| |||||
|
| 2023 |
| 2022 |
| ||
Managed facilities |
|
| 2,979 |
|
| 2,709 |
|
Leased facilities |
|
| 405 |
|
| 421 |
|
Total Commercial segment facilities |
|
| 3,384 |
|
| 3,130 |
|
The increase as of December 31, 2023 included 22 unique facilities added as a result of the yearsacquisition of Roker.
Aviation Segment - Airports Served
The following table reflects the number of airports where at least one of our services is provided as of the dates indicated:
| December 31, |
| |||||
|
| 2023 |
| 2022 |
| ||
North America |
|
| 101 |
|
| 100 |
|
Europe |
|
| 58 |
|
| 58 |
|
Total Airports |
|
| 159 |
|
| 158 |
|
19
|
| December 31, |
| |||||||||
|
| 2020 |
|
| 2019 |
|
| 2018 |
| |||
Lease-type facilities |
|
| 445 |
|
|
| 609 |
|
|
| 628 |
|
Management-type facilities |
|
| 2,539 |
|
|
| 2,560 |
|
|
| 2,514 |
|
Total Commercial segment facilities |
|
| 2,984 |
|
|
| 3,169 |
|
|
| 3,142 |
|
Revenue
We recognize services revenue from our contracts and certain fees for using our technology-driven mobility solutions as the related services are provided. Substantially all of our revenue comes from the following two sources:
Lease type contracts. Consists of all revenue received at lease type locations, including gross receipts (net of local taxes), consulting and real estate development fees, gains on sales of contracts and payments for exercising termination rights. Revenue from lease type contracts includes a reduction for service concessions.
Management type contracts. Consists of management fees, including fixed, variable and/or performance-based fees, and in some cases e-commerce technology fees, customer convenience fees and monthly subscription fees related to the use of our technology solutions and amounts attributable to ancillary services such as accounting, equipment leasing, baggage services, payments received for exercising termination rights, consulting, developmental fees, gains on sales of contracts, insurance and other value-added services. We believe we generally can purchase required insurance at lower rates than our clients can obtain on their own because we effectively self-insure for all liability, worker’s compensation and health care claims by maintaining a large per-claim deductible. As a result, we have generatedgenerate operating income on the insurance provided under our management type contracts by focusing on our risk management efforts and controlling losses. Management type contract revenues do not include gross customer collections, at those facilities, as those revenues belong to the client rather than to us. Management type contracts generally provide us with a management fee regardless of the operating performance of the underlying facility. In addition, management type contract.contract revenue includes revenue related to our other aviation services. Other aviation services include our baggage delivery, curbside concierge, remote airline check-in and other miscellaneous services provided to our airport and airline clients.
Lease type contracts. Consists of all revenue received at lease type locations, including gross receipts (net of local taxes), e-commerce technology fees and customer convenience fees. As discussed in Note 4. Revenue within the Notes to the Consolidated Financial Statements, revenue from lease type contracts includes a reduction for certain expenses (primarily rent expense) related to service concession arrangements.
Reimbursed Management Type Contract Revenue. Consists of the direct reimbursement from the client for operating expenses incurred under a management type contract, which are reflected in our revenue.contract.
20
Cost of Services (Exclusive of Depreciation and Amortization)
Our cost of services consists of the following:
Management type contracts. Expenses under a management type contract are generally the responsibility of the client. As a result, these costs are not included in our cost of services. However, "reverse" management type contracts, which typically provide for larger management fees, do require us to pay for certain costs, which are included in cost of services. In addition, certain costs related to providing our other aviation and ancillary services are included in cost of services.
Lease type contracts. Consists of contractual rents or fees paid to the client and all operating expenses incurred in connection with operating the leased facility. Contractual rents or fees paid to the client are generally based on either a fixed contractual amount, a percentage of gross revenue or a combination thereof. Generally, under a lease type arrangement we are not responsible for major capital expenditures or real estate taxes.
Management type contracts. Cost of services under a management type contract is generally the responsibility of the client. As a result, these costs are not included in our results of operations. However, our reverse management type contracts, which typically provide for larger management fees, do require us to pay for certain costs and those costs are included in our results of operations.
Reimbursed Management Type Contract Expense. ConsistsConsists of directly reimbursed costs incurred on behalf of a client under a management type contract, which are reflected in our cost of services.contract.
Gross Profit
Gross profit equals our revenue less the cost of generating such revenue. This is the key metric we userevenue (“cost of services”), lease impairment and depreciation and amortization expenses related to examine our performance because it captures the underlying economic benefit to uscost of both lease and management type contracts.services activities.
General and Administrative Expenses
General and administrative expenses include salaries, wages, incentive compensation, stock-based compensation, payroll taxes, insurance, travel and office related expenses for our headquarters, field offices and supervisory employees,employees. Additionally, acquisition-related expenses are included in general and board of directors.administrative expenses.
Depreciation and Amortization
Depreciation is determined using a straight-line method over the estimated useful lives of the various asset classes, or in the case of leasehold improvements, over the initial term of the operating lease or its useful life, whichever is shorter. Intangible assets determined to have finite lives, usually acquired through the acquisition of businesses, are amortized over their remaining estimated useful lives.
GoodwillOperating Income
Operating income represents revenue less cost of services, general and administrative expense and depreciation and amortization. This is the key metric our Chief Operating Decision Maker (“CODM”) uses for making decisions, assessing performance and allocating resources to our Operating Segments, Commercial and Aviation.
Segments
An operating segment is defined as a component of an enterprise that engages in business activities from which it may earn revenue and incur expenses, and about which separate financial information is regularly evaluated by the CODM. The CODM is our CEO. The CODM uses this separate discrete financial information by segment to allocate resources and assess performance, primarily based on operating income.
Our operating segments are Commercial and Aviation, which are described below.
The Other segment includes costs related to our operational support teams and common and shared infrastructure, including finance, accounting, information technology, human resources, procurement, legal and corporate development.
20
Analysis of Results of Operations
New business relates to contracts that started during the current period. Contract terminations relate to contracts that have expired or terminated early during the current period but where we were operating the business in the prior year.
Acquisition-related, restructuring and other costs include expenses related to the proposed merger with Metropolis, compensation expenses related to organizational changes, acquisition-related expenses, including integration expenses related to our recent acquisitions, and severance and other costs primarily related to workforce reductions.
2023 Compared to 2022
Consolidated results during the years ended December 31, 2023 and 2022, respectively, included the following notable items:
| December 31, |
|
| Variance |
| |||||||||||
(millions) |
| 2023 |
|
| 2022 |
|
| Amount |
|
| % |
| ||||
Services revenue |
| $ | 1,782.3 |
|
| $ | 1,553.5 |
|
| $ | 228.8 |
|
|
| 14.7 | % |
Cost of services (exclusive of depreciation and amortization)(1) |
|
| 1,528.3 |
|
|
| 1,331.8 |
|
|
| 196.5 |
|
|
| 14.8 | % |
General and administrative expenses |
|
| 140.4 |
|
|
| 109.1 |
|
|
| 31.3 |
|
|
| 28.7 | % |
Depreciation and amortization |
|
| 36.1 |
|
|
| 29.7 |
|
|
| 6.4 |
|
|
| 21.5 | % |
Operating income |
|
| 77.5 |
|
|
| 82.9 |
|
|
| (5.4 | ) |
|
| (6.5 | )% |
Interest expense |
|
| 29.1 |
|
|
| 17.7 |
|
|
| 11.4 |
|
|
| 64.4 | % |
Income tax expense |
|
| 14.0 |
|
|
| 17.5 |
|
|
| (3.5 | ) |
|
| (20.0 | )% |
Net income attributable to SP Plus Corporation |
|
| 31.1 |
|
|
| 45.2 |
|
|
| (14.1 | ) |
|
| (31.2 | )% |
Services revenue increased by $228.8 million, or 14.7%, attributable to the following:
Cost of services (exclusive of depreciation and amortization) increased by $196.5 million, or 14.8%, attributable to the following:
General and administrative expenses increased $31.3 million, or 28.7%, primarily due to higher compensation and non-cash stock-based compensation expenses and higher acquisition-related, restructuring and other costs of $18.3 million during the year ended December 31, 2023 as compared to $3.7 million during the year ended December 31, 2022, as well as our continued investment in business development, technology deployment and growth initiatives.
Depreciation and amortization expenses increased $6.4 million, or 21.5%, primarily due to the amortization of other intangible assets related to the recent acquisitions and our continued investment in technology and growth initiatives.
Our effective tax rate was 28.7% and 26.7% during the years ended December 31, 2023 and 2022, respectively. The increase in the effective tax rate is primarily due to certain non-deductible expenses as a result of the proposed merger with Metropolis.
The following tables summarize our revenues (excluding reimbursed management type contract revenue), gross profit, general and administrative expenses, depreciation and amortization, and operating income (expense) by segment during the years ended December 31, 2023 and 2022.
21
Commercial
| Commercial |
|
| Variance |
| |||||||||||
(millions) |
| 2023 |
|
| 2022 |
|
| Amount |
|
| % |
| ||||
Services revenue |
|
|
|
|
|
|
|
|
|
|
|
| ||||
Management type contracts |
| $ | 307.7 |
|
| $ | 276.8 |
|
| $ | 30.9 |
|
|
| 11.2 | % |
Lease type contracts |
|
| 277.8 |
|
|
| 261.7 |
|
|
| 16.1 |
|
|
| 6.2 | % |
Total services revenue |
|
| 585.5 |
|
|
| 538.5 |
|
|
| 47.0 |
|
|
| 8.7 | % |
Gross profit |
|
|
|
|
|
|
|
|
|
|
|
| ||||
Management type contracts |
|
| 138.9 |
|
|
| 123.4 |
|
|
| 15.5 |
|
|
| 12.6 | % |
Lease type contracts |
|
| 47.8 |
|
|
| 44.7 |
|
|
| 3.1 |
|
|
| 6.9 | % |
Lease impairment |
|
| — |
|
|
| (3.7 | ) |
|
| 3.7 |
|
|
| 100.0 | % |
Depreciation and amortization |
|
| (8.3 | ) |
|
| (7.9 | ) |
|
| (0.4 | ) |
|
| (5.1 | )% |
Total gross profit |
|
| 178.4 |
|
|
| 156.5 |
|
|
| 21.9 |
|
|
| 14.0 | % |
General and administrative expenses |
|
| 36.6 |
|
|
| 29.3 |
|
|
| 7.3 |
|
|
| 24.9 | % |
Depreciation and amortization(1) |
|
| 6.8 |
|
|
| 5.2 |
|
|
| 1.6 |
|
|
| 30.8 | % |
Operating income |
| $ | 135.0 |
|
| $ | 122.0 |
|
| $ | 13.0 |
|
|
| 10.7 | % |
Gross Profit
General and administrative expenses increased $7.3 million, or 24.9%, to $36.6 million during the year ended December 31, 2023, compared to $29.3 million during the year ended December 31, 2022. The increase was primarily related to higher compensation and non-cash stock-based compensation expenses, as well as higher restructuring and other costs of $3.7 million during the year ended December 31, 2023 as compared to $0.8 million during the year ended December 31, 2022 and our continued investments in growth initiatives.
Operating Income increased $13.0 million, or 10.7%, to $135.0 million during the year ended December 31, 2023, compared to $122.0 million during the year ended December 31, 2022, primarily due to the factors noted above, partially offset by increased amortization expenses related to the other intangible assets acquired as a result of the acquisitions of DIVRT and Roker.
22
Aviation
| Aviation |
|
| Variance |
| |||||||||||
(millions) |
| 2023 |
|
| 2022 |
|
| Amount |
|
| % |
| ||||
Services revenue |
|
|
|
|
|
|
|
|
|
|
|
| ||||
Management type contracts |
| $ | 282.3 |
|
| $ | 241.9 |
|
| $ | 40.4 |
|
|
| 16.7 | % |
Lease type contracts |
|
| 15.4 |
|
|
| 14.0 |
|
|
| 1.4 |
|
|
| 10.0 | % |
Total services revenue |
|
| 297.7 |
|
|
| 255.9 |
|
|
| 41.8 |
|
|
| 16.3 | % |
Gross profit |
|
|
|
|
|
|
|
|
|
|
|
| ||||
Management type contracts |
|
| 62.5 |
|
|
| 52.1 |
|
|
| 10.4 |
|
|
| 20.0 | % |
Lease type contracts |
|
| 4.8 |
|
|
| 5.2 |
|
|
| (0.4 | ) |
|
| (7.7 | )% |
Depreciation and amortization |
|
| (6.1 | ) |
|
| (5.8 | ) |
|
| (0.3 | ) |
|
| (5.2 | )% |
Total gross profit |
|
| 61.2 |
|
|
| 51.5 |
|
|
| 9.7 |
|
|
| 18.8 | % |
General and administrative expenses |
|
| 17.2 |
|
|
| 12.6 |
|
|
| 4.6 |
|
|
| 36.5 | % |
Depreciation and amortization(1) |
|
| 6.1 |
|
|
| 5.4 |
|
|
| 0.7 |
|
|
| 13.0 | % |
Operating income |
| $ | 37.9 |
|
| $ | 33.5 |
|
| $ | 4.4 |
|
|
| 13.1 | % |
Gross Profit
General and administrative expenses increased$4.6 million, or 36.5%, to $17.2 million during the year ended December 31, 2023, compared to $12.6 million during the year ended December 31, 2022 primarily due to our continued investments in growth initiatives, as well as higher restructuring and other costs of $2.0 million during the year ended December 31, 2023 as compared to a benefit of $0.4 million during the year ended December 31, 2022.
Operating Income increased $4.4 million, or 13.1%, to $37.9 million during the year ended December 31, 2023, compared to $33.5 million during the year ended December 31, 2022, primarily related to the factors noted above, partially offset by increased amortization expenses related to the other intangible assets acquired as a result of the acquisition of KMP.
Other
Operating expenses within the Other segment increased $22.8 million, or 31.4%, to $95.4 million during the year ended December 31, 2023, compared to $72.6 million during the year ended December 31, 2022, primarily due to higher acquisition-related, restructuring and other costs of $12.6 million during the year ended December 31, 2023 as compared to $3.3 million during the year ended December 31, 2022, as well as higher compensation and non-cash stock-based compensation expenses and our continued investments in business development, technology deployment and growth initiatives.
Analysis of Financial Condition
Liquidity and Capital Resources
General
We continually project anticipated cash requirements for our operating, investing and financing needs, as well as cash flows generated from operating activities available to meet these needs. Our operating needs can include, among other items, commitments for cost of services, operating leases, payroll, insurance claims, interest and legal settlements. Our investing and financing spending can include payments for acquired businesses or assets, joint ventures, capital expenditures, distributions to noncontrolling interests, stock repurchases and payments on our outstanding indebtedness.
As of December 31, 2023, we had $19.1 million of cash and cash equivalents and $227.5 million of borrowing availability under our Senior Credit Facility (as defined in Note 11. Borrowing Arrangements within the Notes to the Consolidated Financial Statements). We believe we will be able to generate sufficient liquidity to satisfy our obligations and remain in compliance with our existing debt covenants for the next twelve months.
Outstanding Indebtedness
As of December 31, 2023, we had total indebtedness of approximately $352.1 million, an increase of $7.9 million from $344.2 million as of December 31, 2022. The $352.1 million included:
23
As of December 31, 2023, we were in compliance with our debt covenants under the Amended Credit Agreement (as defined in Note 11. Borrowing Arrangements within the Notes to the Consolidated Financial Statements).
As of December 31, 2023, we had $36.9 million of letters of credit outstanding under the Senior Credit Facility and borrowings against the Senior Credit Facility aggregated to $329.5 million.
The weighted average interest rate on our Senior Credit Facility was 6.5% and 5.6% during the years ended December 31, 2023 and 2022, respectively. That rate included the letters of credit for both years and the interest rate collars during the year ended December 31, 2022. The weighted average interest rate on all outstanding borrowings, not including letters of credit, was 7.0% and 6.0% during the years ended December 31, 2023 and 2022, respectively.
During the year ended December 31, 2022, we incurred approximately $2.5 million for fees and other customary closing costs in connection with the Amended Credit Agreement.
Stock Repurchases
In February 2023, our Board authorized us to repurchase, on the open market, shares of our outstanding common stock in an amount not to exceed $60.0 million in aggregate.
In May 2022, our Board authorized us to repurchase, on the open market, shares of our outstanding common stock in an amount not to exceed $60.0 million in aggregate. During the year ended December 31, 2023, we repurchased 285,700 shares of common stock at an average price of $36.53 under this program. As of December 31, 2023, $0.2 million remained available for repurchase under this program.
As of December 31, 2023, $60.2 million remained available for repurchase under the May 2022 and February 2023 stock repurchase programs. Under the programs, repurchases of our common stock may be made in open market transactions effected through a broker-dealer at prevailing market prices, in block trades or by other means in accordance with Rules 10b-18, to the extent relied upon, and 10b5-1 under the Exchange Act at times and prices considered to be appropriate at our discretion. The stock repurchase programs do not obligate us to repurchase any particular amount of common stock, have no fixed termination date, and may be suspended at any time at our discretion.
As a condition of the Merger Agreement, beginning on October 4, 2023, we are restricted from repurchasing our common stock.
Stock repurchase activity under the May 2022 stock repurchase program during the years ended December 31, 2023 and 2022 was as follows:
(millions, except for share and per share data) |
| December 31, 2023 |
|
| December 31, 2022 |
| ||
Total number of shares repurchased |
|
| 285,700 |
|
|
| 1,474,300 |
|
Average price paid per share |
| $ | 36.53 |
|
| $ | 33.47 |
|
Total value of common stock repurchased |
| $ | 10.4 |
|
| $ | 49.4 |
|
The remaining authorized repurchase amount under the May 2022 and February 2023 repurchase programs as of December 31, 2023 was as follows:
(millions) |
| December 31, 2023 |
| |
Total authorized repurchase amount |
| $ | 120.0 |
|
Total value of shares repurchased |
|
| 59.8 |
|
Total remaining authorized repurchase amount |
| $ | 60.2 |
|
Letters of Credit
We provided letters of credit totaling $30.9 million and $30.8 million to our casualty insurance carriers to collateralize our casualty insurance program as of December 31, 2023 and 2022, respectively.
We provided $6.5 million and $7.7 million in letters of credit to collateralize other obligations as of December 31, 2023 and 2022, respectively.
Interest Rate Collars
In May 2019, we entered into three-year interest rate collar contracts with an aggregate notional amount of $222.3 million. The interest rate collar contracts matured in April 2022. The interest rate collars were used to manage interest rate risk associated with variable interest rate borrowings under the Credit Agreement (as defined in Note 11. Borrowing Arrangements within the Notes to the Consolidated Financial Statements). The interest rate collars established a range where we paid the counterparties if the one-month London Interbank Offered Rate ("LIBOR") fell below the established floor rate, and the counterparties paid us if the one-month LIBOR exceeded the established ceiling rate of 2.5%. The interest rate collars settled monthly through the maturity date. No payments or receipts were exchanged on the interest rate collar contracts unless interest rates rose above or fell below the pre-determined ceiling or floor rates. The notional amount amortized consistently with the term loan portion of the Senior Credit Facility under the Credit Agreement prior to the third amendment to the Credit Agreement (the “Third Amendment”). The fair value of the interest rate collars was a Level 2 fair value measurement, as the fair value was determined based on quoted prices of similar instruments in active markets.
On May 6, 2020, concurrent with entering into the Third Amendment, we de-designated the interest rate collars. Prior to de-designation, the effective portion of the change in the fair value of the interest rate collars was reported in Accumulated other comprehensive loss. Upon de-designation, the balance in Accumulated other comprehensive loss was being reclassified to Other expense within the Consolidated Statements of Income on a straight-line basis through April 2022, which was over the remaining life for which the interest rate collars had previously been designated as cash flow hedges. Changes in the fair value of the interest rate collars after de-designation were included in Other expense within the Consolidated Statements of Income. During the years ended December 31, 2022 and 2021, $0.8 million and $2.5 million, respectively, was paid in interest related to the interest rate collars.
We do not enter into derivative instruments for any speculative purposes.
Daily Cash Collections
As a result of day-to-day activity at our parking locations, we collect significant amounts of cash. Lease type contract revenue is generally deposited into our local bank accounts, with a portion remitted to our clients in the form of rental payments based on the terms of the leases. Under management type contracts, clients may require us to deposit the daily receipts into one of our local bank accounts, with the cash in excess of our operating expenses and management fees remitted to the clients at negotiated intervals. Other clients may require us to deposit the daily receipts into client designated bank accounts and the clients then reimburse us for operating expenses and pay our management fee subsequent to month-end. In addition, our clients may require segregated bank accounts for receipts and
24
disbursements. Our working capital and liquidity may be adversely affected if a significant number of our clients require us to deposit all parking revenues into their respective accounts.
Our liquidity also fluctuates on an intra-month and intra-year basis depending on the contract mix and timing of significant cash payments. Additionally, our ability to utilize cash deposited into our local accounts is dependent upon the availability and movement of that cash into our corporate accounts. For all these reasons, from time to time, we carry a significant cash balance, while also utilizing our Senior Credit Facility.
Cash and Cash Equivalents
We had cash and cash equivalents of $19.1 million and $12.4 million as of December 31, 2023 and 2022, respectively. The cash balances reflect our ability to utilize funds deposited into our bank accounts. Availability, timing of deposits and the subsequent movement of cash into our corporate bank accounts may result in significant changes to our cash balances.
Summary of Cash Flows
Our primary sources of liquidity are cash flows from operating activities and availability under our Senior Credit Facility. Our cash flows during the years ended December 31, 2023, 2022 and 2021 were as follows:
|
| Years ended December 31, |
| |||||||||
(millions) |
| 2023 |
|
| 2022 |
|
| 2021 |
| |||
Net cash provided by operating activities |
| $ | 55.8 |
|
| $ | 93.3 |
|
| $ | 53.4 |
|
Net cash used in investing activities |
|
| (26.6 | ) |
|
| (54.0 | ) |
|
| (9.1 | ) |
Net cash used in financing activities |
|
| (22.3 | ) |
|
| (42.4 | ) |
|
| (42.4 | ) |
Effect of exchange rate changes on cash and cash equivalents |
|
| (0.2 | ) |
|
| (0.2 | ) |
|
| (0.1 | ) |
Net increase (decrease) in cash and cash equivalents |
|
| 6.7 |
|
|
| (3.3 | ) |
|
| 1.8 |
|
Operating Activities
Net cash provided by operating activities decreased $37.5 million to $55.8 million during the year ended December 31, 2023 from $93.3 million during the year ended December 31, 2022. The decrease resulted from the payment of $21.7 million of acquisition-related, restructuring and other costs, primarily related to the proposed merger with Metropolis, and per the terms of the Merger Agreement, certain incentive compensation earned in 2023, which usually would be paid in 2024, during the year ended December 31, 2023. In addition, the decrease related to the receipt of the $20.5 million U.S. Federal income tax refund during the year ended December 31, 2022, as well as higher interest payments during the year ended December 31, 2023 of $27.7 million as compared to $16.9 million during the year ended December 31, 2022, partially offset by growth in the business and improved working capital.
Net cash provided by operating activities increased $39.9 million to $93.3 million during the year ended December 31, 2022 from $53.4 million during the year ended December 31, 2021. The increase primarily resulted from higher operating income, net of non-cash related items, due to improving business conditions, as well as the receipt of the $20.5 million U.S. Federal income tax refund related to our ability to carry back our 2020 U.S. Federal NOL and lower interest payments, partially offset by the payment of performance-based compensation and higher income tax installment payments during the year ended December 31, 2022.
Investing Activities
Net cash used in investing activities was $26.6 million during the year ended December 31, 2023, a decrease of $27.4 million from $54.0 million during the year ended December 31, 2022. The decrease was primarily due to the acquisitions of businesses and other intangible assets, net of cash acquired, of $3.1 million during the year ended December 31, 2023 as compared to $32.3 million during the year ended December 31, 2022, as well as the noncontrolling interest buyout of $2.4 million during the year ended December 31, 2023.
Net cash used in investing activities was $54.0 million during the year ended December 31, 2022, an increase of $44.9 million from $9.1 million during the year ended December 31, 2021. The increase was primarily due to the acquisitions of businesses and other intangible assets, net of cash acquired, of $32.3 million during the year ended December 31, 2022. Cash used to purchase property and equipment, primarily related to our investments in internal-use software, was $21.9 million during the year ended December 31, 2022 as compared to $9.6 million during the year ended December 31, 2021, reflecting our continued investment in technology initiatives during the year ended December 31, 2022.
Financing Activities
Net cash used in financing activities was $22.3 million during the year ended December 31, 2023, a decrease of $20.1 million from $42.4 million during the year ended December 31, 2022. The decrease was primarily related to the $11.1 million purchase of common stock during the year ended December 31, 2023 as compared to $48.7 million during the year ended December 31, 2022, partially offset by borrowings under our Senior Credit Facility during the year ended December 31, 2022 that were used, in addition to cash on hand, to fund the acquisitions noted above and $5.8 million related to payments of withholding taxes on share-based compensation during the year ended December 31, 2023.
Net cash used in financing activities was $42.4 million during the years ended December 31, 2022 and 2021. During the year ended December 31, 2022 we repurchased $48.7 million of common stock under our May 2022 stock repurchase program, partially offset by an increase in borrowings under our Senior Credit Facility that were used, in addition to cash on hand, to fund the acquisitions noted above. During the year ended December 31, 2021, we paid down debt by $40.1 million.
Summary Disclosures about Contractual Obligations and Commercial Commitments
The following table summarizes certain contractual obligations as of December 31, 2023 and the effect such obligations are expected to have on our liquidity and cash flow in future periods. We do not have significant short-term purchase obligations.
25
| Payments Due by Period |
| ||||||||||||||||||
|
|
|
|
|
|
|
|
|
|
|
|
| 2029 and |
| ||||||
(millions) |
| Total |
|
| 2024 |
|
| 2025 - 2026 |
|
| 2027 - 2028 |
|
| thereafter |
| |||||
Contractual obligations |
|
|
|
|
|
|
|
|
|
|
|
|
|
|
| |||||
Operating leases(1) |
| $ | 246.9 |
|
| $ | 66.1 |
|
| $ | 95.3 |
|
| $ | 49.5 |
|
| $ | 36.0 |
|
Finance leases |
|
| 27.2 |
|
|
| 8.7 |
|
|
| 11.7 |
|
|
| 4.8 |
|
|
| 2.0 |
|
Service concession arrangements(2) |
|
| 38.3 |
|
|
| 19.3 |
|
|
| 13.3 |
|
|
| 4.8 |
|
|
| 0.9 |
|
Noncontrolling interests buyout |
|
| 2.1 |
|
|
| 0.4 |
|
|
| 0.8 |
|
|
| 0.5 |
|
|
| 0.4 |
|
Total contractual obligations |
| $ | 314.5 |
|
| $ | 94.5 |
|
| $ | 121.1 |
|
| $ | 59.6 |
|
| $ | 39.3 |
|
Critical Accounting Policies and Estimates
The preparation of financial statements in conformity with accounting principles generally accepted in the United States ("US GAAP") requires us to make estimates and judgments that affect the reported amounts of assets and liabilities, revenues and expenses and related disclosures of contingent assets and liabilities within the Consolidated Financial Statements and accompanying notes. The SEC has defined critical accounting policies and estimates as the ones that are most important to the portrayal of the financial condition and results of operations, and which require the most difficult and subjective judgments, often as a result of the need to make estimates of matters that are inherently uncertain. Based on this definition, we have identified the critical accounting policies and judgments addressed below. We base these estimates and judgments on historical experience and on various other assumptions that are believed to be reasonable under the circumstances, the results of which form the basis for making judgments about carrying values of assets and liabilities that are not readily apparent from other sources. Certain accounting estimates are particularly sensitive because of their complexity and the possibility that future events affecting them may differ materially from our current judgments and estimates.
This listing of critical accounting policies is not intended to be a comprehensive list of all of our accounting policies. We also have other key accounting policies, which involve the use of estimates, judgments, and assumptions that are significant to understanding our results, which are included in Note 1. SignificantAccounting Policies and Practices within the Notes to the Consolidated Financial Statements included in Part IV, Item 15. "Exhibits and Financial StatementSchedules."
Goodwill and Other Intangible Assets
Goodwill represents the excess of the purchase price paid over the fair value of net assets acquired. In accordance with the Financial Accounting Standards Board's ("FASB") authoritative accounting guidance on goodwill, we evaluate goodwill for impairment on an annual basis, or more often if events or circumstances change that could cause goodwill to become impaired. We have elected to assess the impairment of goodwill annually on October 1 or at an interim date if there is an event or change in circumstances indicating the carrying value may not be recoverable. The goodwill impairment test is performed at the reporting unit level; our reporting units represent our operating segments, consisting of Commercial and Aviation. Factors that could trigger an impairment review include among others, significant under-performance relative to expected historical or projected future operating results, significant changes in the use of acquired assets or our business strategy, and significant negative industry or economic trends.
We may perform a qualitative, rather than quantitative, assessment to determine whether it is more likely than not that the fair value of a reporting unit is less than its carrying amount. If we determine it is more likely than not that the fair value is less than the carrying amount. As of January 1, 2020,amount, we adopted Accounting Standards Update ("ASU") 2017-04, which eliminated the two step approach from the current goodwill impairment test and allows impairmentwould need to be calculated based on theperform a quantitative assessment. The determination of fair value of a reporting unit utilizes cash flow projections that assume certain future revenue and cost levels, comparable marketplace data, comparable company market valuations, assumed discount rates based upon current market conditions and other valuation factors, all of which involve the use of significant judgment and estimates. We also assess critical areas that may impact our business including economic conditions, market related exposures, competition, changes in service offerings and changes in key personnel.
Beginning in March 2020, COVID-19 and the resulting stay at home orders issued by local governments were impacting certain of our businesses. These factors have significantly impacted the hospitality and travel industries, as well as overall consumer discretionary spending.
Due to the impacts of COVID-19, revenues for certain markets in which we operate have dropped significantly as compared to the expectations as of the October 1, 2019 annual impairment test. We do not know how long the impacts of COVID-19 will or may impact our results. In addition, certain Aviation contracts were terminated during August 2020. The termination of these contracts and the ongoing impacts of COVID-19 on our expected future operating cash flows triggered us to complete a quantitative goodwill impairment analysis for our Aviation reporting unit as of August 31, 2020. Based on the quantitative analysis, we determined that estimated carrying values exceeded implied fair value for the Aviation reporting unit and goodwill was impaired, and therefore an impairment charge was recognized during the year ended December 31, 2020. As of October 1, 2020 (our annual goodwill impairment test date), we performed a qualitative assessment of goodwill, since projections used in the August 31, 2020 impairment test have not materially changed and we concluded no further impairment testing was required. See Note 11. Goodwill in the notes to the Consolidated Financial Statements for further discussion.
Other Intangibles Assets, net
Other intangible assets represent assets with finite lives that are amortized over their estimated useful lives and reviewed for impairment when circumstances change that would indicate the carrying value may not be recoverable. Intangible assets are amortized on a straight-line basis over their estimated useful lives. We evaluate the remaining useful life of the other intangible assets on a periodic basis to determine whether events or circumstances warrant a revision to their remaining useful lives. In addition, other intangible assets are reviewed for impairment when circumstances change that would indicate the carrying value may not be recoverable. Assumptions and estimates about future values and remaining useful lives of our intangible assets are complex and subjective. Theysubjective, and can be affected by a variety of factors, including external factors such as industry and economic trends, and internal factors, such as changes in our business strategy and internal forecasts. Although management believeswe believe the historical assumptions and estimates are reasonable and appropriate, different assumptions and estimates could materially impact our reported financial results.
As a result of the termination of certain contracts within the Aviation reporting unit and the ongoing impact of COVID-19 on our expected future operating cash flows, we determined certain impairment testing triggers had occurred related to our intangible assets during the year ended December 31, 2020. Accordingly, we analyzed undiscounted cash flows for certain intangible assets and determined that estimated net carrying values exceeded undiscounted future cash flows, resulting in certain intangible assets being impaired, resulting in impairment charges being recognized during the year ended December 31, 2020. See Note 10. Other Intangible Assets, net in the notes to the Consolidated Financial Statements for further discussion.
21
For both goodwill and intangible assets, future events may indicate differences from our judgments and estimates which could, in turn, result in impairment charges. Future events that may result in impairment charges include extended unfavorable economic impacts of COVID-19, increases in interest rates, which would impact discount rates, or other factors which could decrease revenues and profitability of existing locations and changes in the cost structure of existing facilities.Long-Lived Assets
Long-Lived Assets
We evaluate long-lived assets, primarily including right-of-use (“ROU”)ROU assets, leasehold improvements, equipment and constructionconstruction/development in progress, for impairment whenever events or circumstances indicate that the carrying value of an asset or asset group may not be recoverable. We group assets at the lowest level for which cash flows are separately identified in order to measure an impairment. Events or circumstances that would result in an impairment review include a significant change in the use of an asset, the planned sale or disposal of an asset, or a projection or forecast that demonstrates continuing losses associated with the use of a long-lived asset or asset group. Recoverability of assets to be held and used is measured by a comparison of the carrying amount of the asset or asset group to future undiscounted cash flows expected to be generated by the asset or asset group. If itthe asset or asset group is determined to be impaired, the impairment recognized is measured by the amount by which the carrying value of the asset or asset group exceeds its fair value.
As a result of the impact of COVID-19 on our expected future operating cash flows, we determined certain impairment triggers had occurred for certain ROU assets associated with certain asset groups, resulting in impairment charges being recognized during the year ended December 31, 2020. See Note 2. Leases in the notes to the Consolidated Financial Statements for further discussion.
Assumptions and estimates used to determine cash flows in the evaluation of impairment and the fair values used to determine the impairment are subject to a degree of judgment and complexity. Any future changes to the assumptions and estimates resulting from changes in actual results or market conditions from those anticipated may affect the carrying value of long-lived assets and could result in additional impairment charges. Future events that may result in impairment charges include extended unfavorable economic impacts of COVID-19,volatility, or other factors, whichthat could decrease revenues and profitability of existing locations and changes in the cost structure of existing facilities.
Segments
An operating segment is definedfacilities, such as a component of an enterprise that engages in business activities from which it may earn revenueincreasing labor and incur expenses, and about which separate financial information is regularly evaluated by our chief operating decision maker (“CODM”), in deciding how to allocate resources. Our CODM is our chief executive officer.
The operating segments are reported to our CODM as Commercial and Aviation.
|
|
|
|
|
|
In July 2020, we changed our internal reporting segment information reported to the CODM. Certain hospitality locations previously reported under Aviation are now included in Commercial. All prior year amounts have been reclassified to conform to the Company’s current reporting structure.
Analysis of Results of Operations
2020 Compared to 2019
Existing business represents business that has been operating for at least one year and operating for the entire period in the comparative period being presented. Other business comprises of expired business, conversions and new/acquired business. As a result of COVID-19, we have executed on a strategy to successfully convert certain lease type contracts to management type contracts which should provide a higher gross profit over the contract term. In addition, for those locations that have remained leases, we have worked with landlords to either receive rent concessions or change lease terms to be more favorable to us. Expired business relates to contracts that have expired but where we were operating the business in the comparative period presented. Existing business in the Other segment represents amounts not specifically attributable to Commercial or Aviation and certain unallocated items.
Consolidated results for the for the years ended December 31, 2020 and 2019, respectively, included the following notable items:
|
| December 31, |
|
| Variance |
| ||||||||||
(millions) |
| 2020 |
|
| 2019 |
|
| Amount |
|
| % |
| ||||
Service revenue (1) |
| $ | 549.0 |
|
| $ | 934.9 |
|
| $ | (385.9 | ) |
|
| (41.3 | )% |
Cost of services (2) |
|
| 421.5 |
|
|
| 706.8 |
|
|
| (285.3 | ) |
|
| (40.4 | )% |
Lease impairment |
|
| 97.1 |
|
|
| — |
|
|
| 97.1 |
|
|
| 100.0 | % |
Gross profit |
|
| 30.4 |
|
|
| 228.1 |
|
|
| (197.7 | ) |
|
| (86.7 | )% |
General and administrative expenses |
|
| 85.4 |
|
|
| 109.0 |
|
|
| (23.6 | ) |
|
| (21.7 | )% |
Depreciation and amortization |
|
| 29.3 |
|
|
| 29.4 |
|
|
| (0.1 | ) |
|
| (0.3 | )% |
Impairment of goodwill and intangible assets |
|
| 135.3 |
|
|
| — |
|
|
| 135.3 |
|
|
| 100.0 | % |
Operating (loss) income |
|
| (219.6 | ) |
|
| 89.7 |
|
|
| (309.3 | ) |
|
| (344.8 | )% |
Income tax (benefit) expense |
|
| (67.5 | ) |
|
| 19.4 |
|
|
| (86.9 | ) |
|
| (447.9 | )% |
22
|
|
|
|
Services revenue decreased by $385.9 million, or 41.3%, attributable to the following:
|
|
|
|
Gross profit decreased by $197.7 million, or 86.7%, attributable to the following:
|
|
|
|
|
|
General and administrative expenses decreased $23.6 million, or 21.7%, for the year ended December 31, 2020, as compared to the year ended December 31, 2019, primarily related to lower stock based compensation expense related to performance share units during the year ended December 31, 2020, as well as lower performance based compensation and cost initiatives, partially offset by an increase in acquisition, restructuring and integration costs. Impairment charges of $1.6 million during the year ended December 31, 2020 related to certain abandoned operating leases. No similar impairment charges were recognized during the year ended December 31, 2019.
We recognized $135.3 million of impairment charges related to certain finite lived intangible assets and goodwill for the year ended December 31, 2020 in the Aviation segment. Due to the impact of COVID-19 on our operations and the termination of certain Aviation contracts, our projected future revenue, profitability and operating cash flows within the Aviation segment are expected to be lower than our prior projections. As a result, the implied fair value of certain asset groups related to finite lived intangible assets within the Aviation segment were lower than their carrying value, resulting in $75.8 million of impairment charges being recorded during the year ended December 31, 2020. In addition, based on the quantitative goodwill impairment analysis performed by us as of August 31, 2020, the estimated carrying values for the Aviation reporting unit exceeded their implied fair value, resulting in $59.5 million of goodwill impairment charges being recorded during the year ended December 31, 2020. No similar impairment charges were recognized during the year ended December 31, 2019.
Our effective tax rate was 28.1% for the year ended December 31, 2020 compared to 27.3% for the year ended December 31, 2019. The effective tax rate for the year ended December 31, 2020 reflects the benefit related to the ability to carryback our current year federal Net Operating Loss (“NOL”) to tax years that had a higher tax rate.
The following charts summarize our revenues (excluding reimbursed management type contract revenue) and gross profit by segment for years ended December 31, 2020 and 2019.
Commercial segment: Services Revenue
23
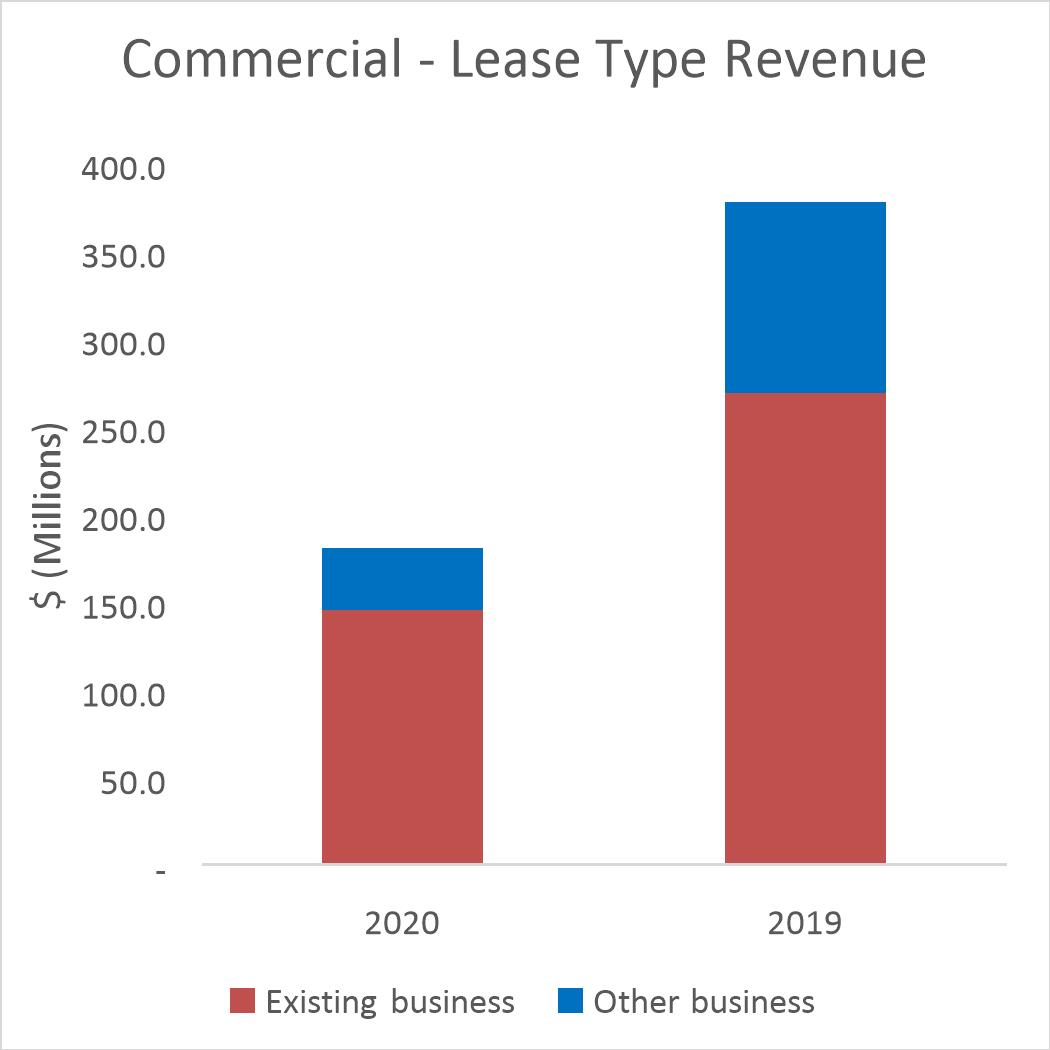
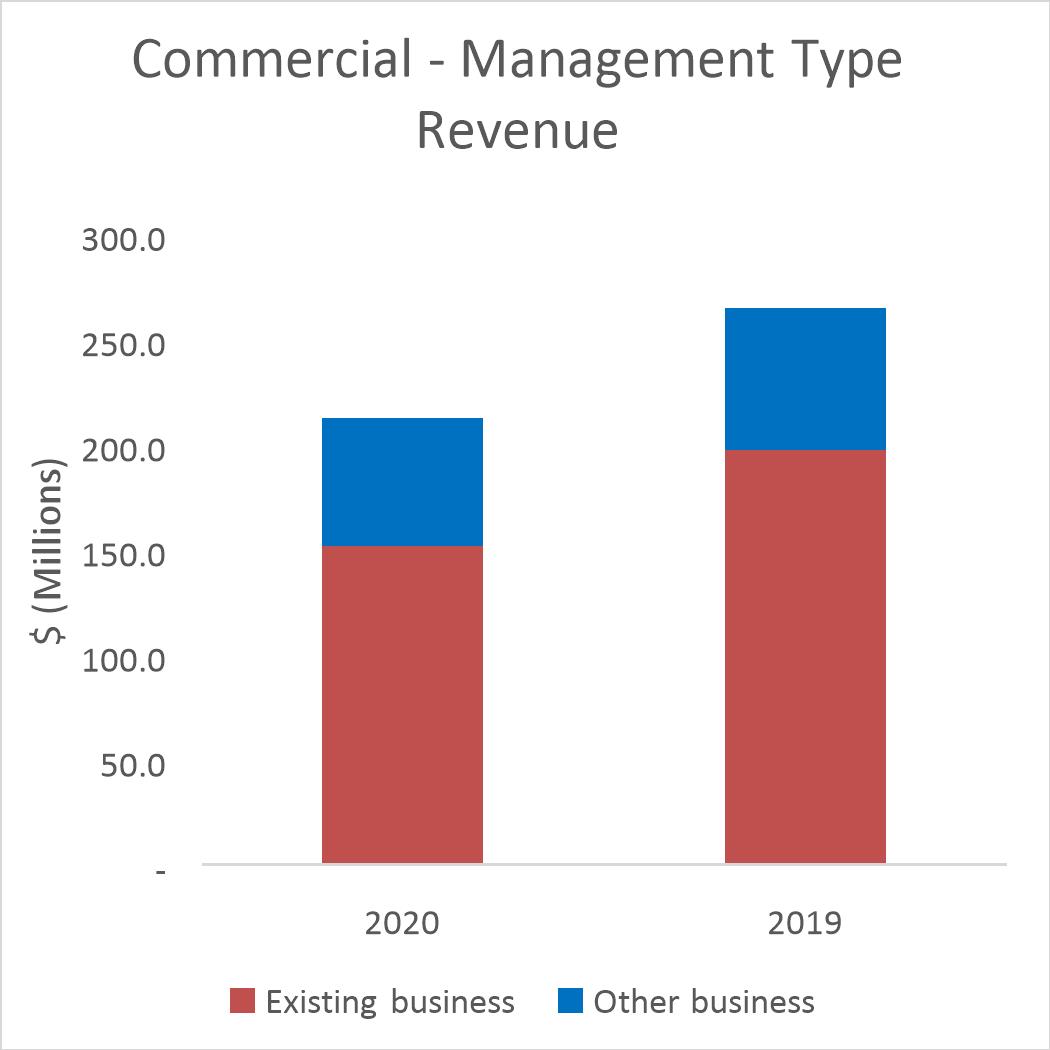
Lease type contracts. Lease type contract revenue decreased $197.1 million, or 52.2%, to $180.2 million for the year ended December 31, 2020, compared to $377.3 million for the year ended December 31, 2019. Existing business revenue decreased $123.3 million, or 46.0%, primarily due to a decrease in transient revenue as a result of COVID-19. Revenue from other business decreased by $73.8 million, or 67.7%, primarily due to decreases of $40.3 million from expired business, $32.8 million from locations that converted to management type contracts during the periods presented and $0.7 million from new/acquired business.
Management type contracts. Management type contract revenue decreased $52.5 million, or 19.8%, to $212.1 million for the year ended December 31, 2020, compared to $264.6 million for the year ended December 31, 2019. Existing business revenue decreased by $45.6 million, or 23.1%, primarily due to a decrease in activity for volume based management type contracts as a result of COVID-19. Management type revenue from other business decreased by $6.9 million, or 10.2%, primarily due to a decrease of $33.9 million from expired business, partially offset by an increase of $26.2 million from new/acquired business and $0.8 million in locations that converted from lease type contracts during the period presented.
Commercial segment: Gross Profit
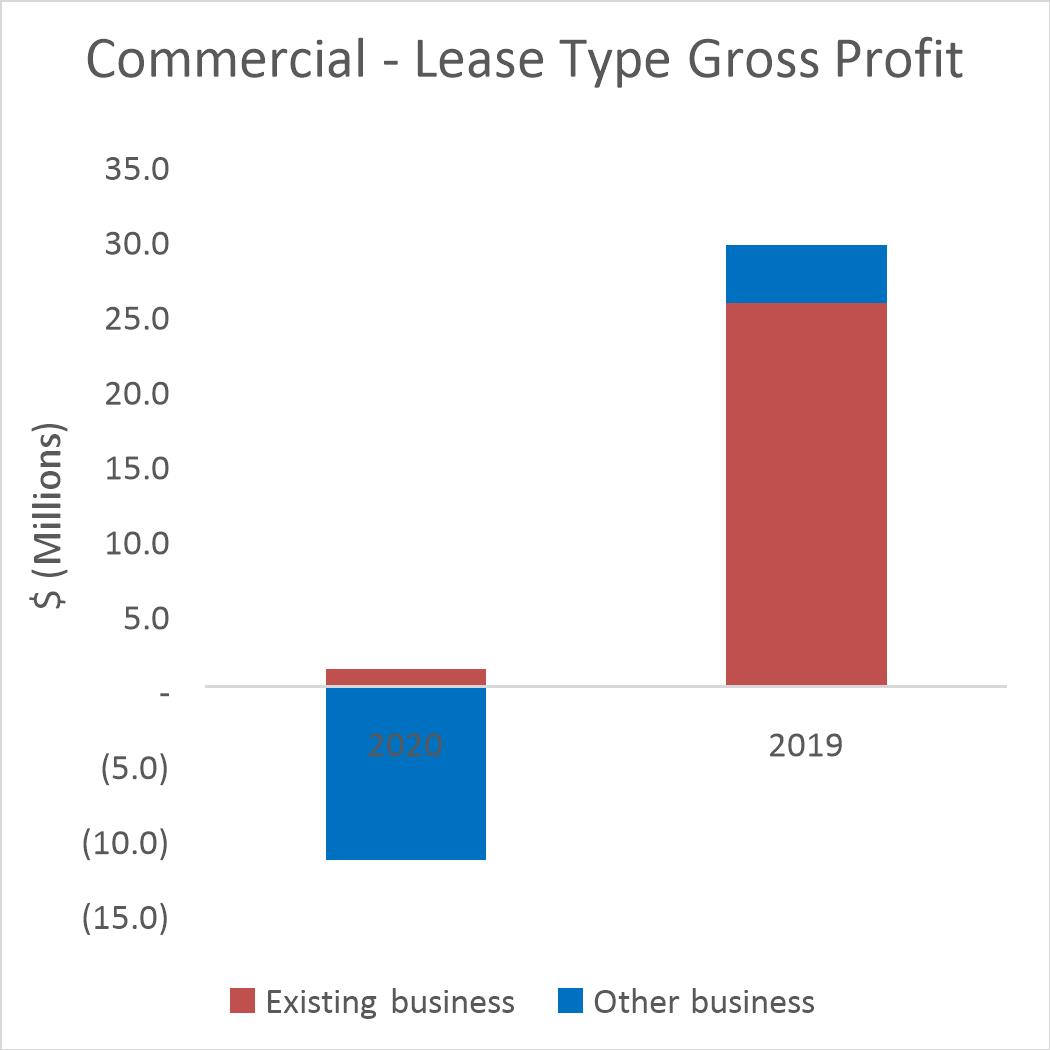
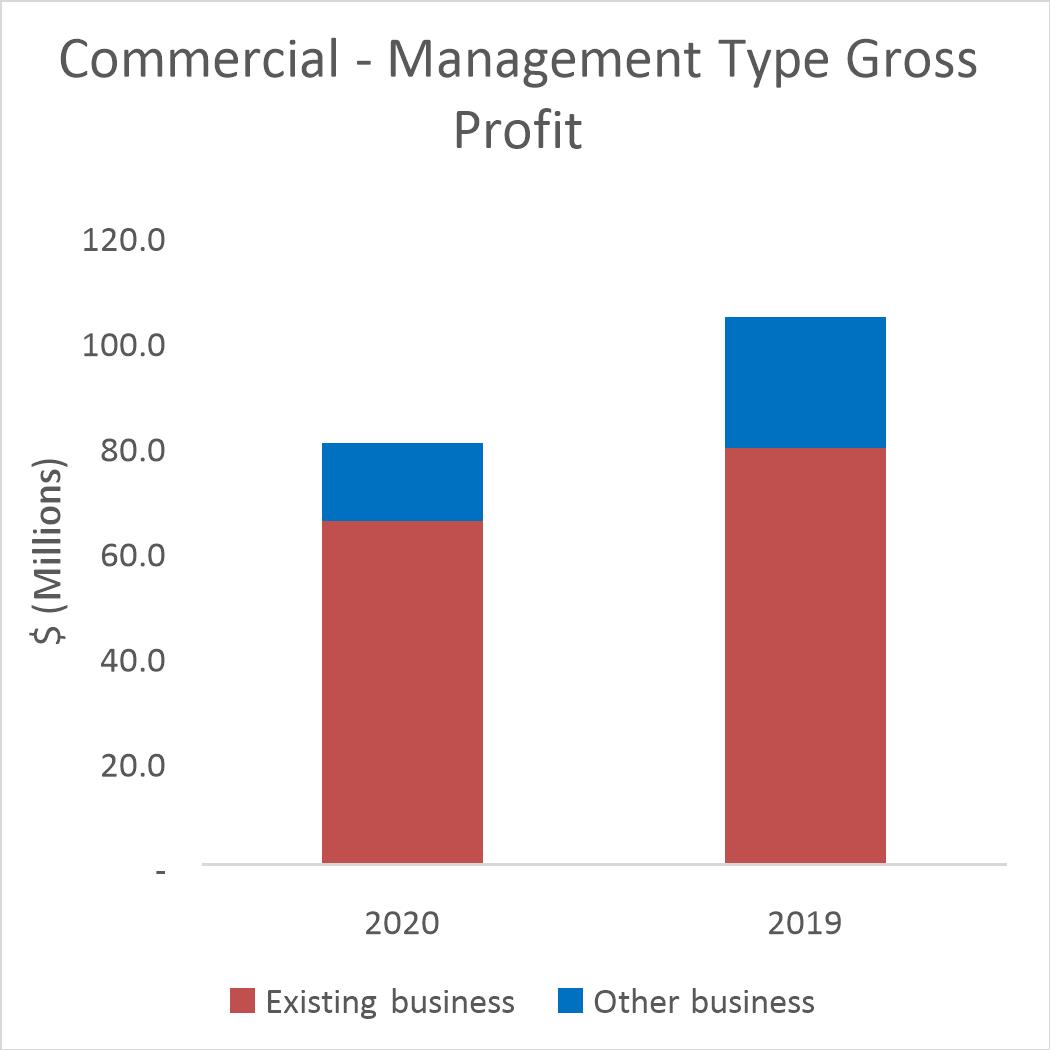
Lease type contracts. Gross profit decreased $39.9 million, or 135.3%, to a loss of $10.4 million for the year ended December 31, 2020, compared to gross profit of $29.5 million for the year ended December 31, 2019. Gross profit percentage decreased to negative 5.8% for the year ended December 31, 2020, compared to 7.8% for the year ended December 31, 2019. Gross profit decreased as a result of declines in existing business, expired business, locations that converted to management type contracts in the periods presented and new/acquired business. Gross profit for existing business decreased $24.4 million, or 95.3%, primarily due to decreases in transient revenue as a result of COVID-19, partially offset by the recognition of certain rent concessions of $30.1 million, as well as decreases in variable rent, compensation, benefits and overall lower net operating costs.
24
Table of ContentsInsurance Reserves
Management type contracts. Gross profit decreased $24.0 million, or 23.1%, to $80.1 million for the year ended December 31, 2020, compared to $104.1 million for the year ended December 31, 2019. Gross profit percentage decreased to 37.8% for the year ended December 31, 2020, compared to 39.3% for the year ended December 31, 2019. Gross profit decreased as a result of declines in expired business and existing business, partially offset by increases in new/acquired business and locations that converted from lease type contracts during the periods presented. Gross profit for existing business decreased $13.8 million, or 17.4%, primarily due to a decrease in activity for volume based management type contracts as a result of COVID-19, partially offset by a decrease in compensation, benefits and overall lower net operating costs.
Aviation segment: Services Revenue
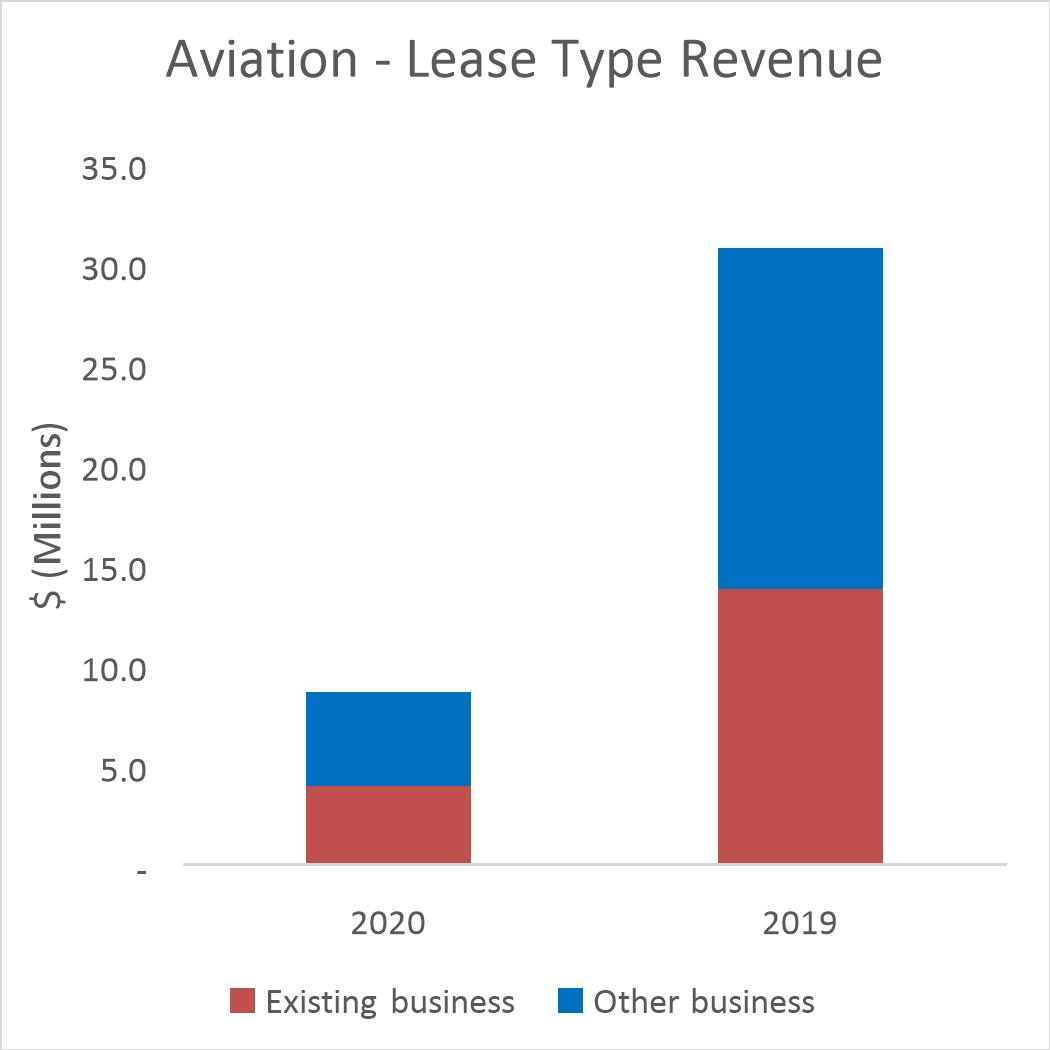
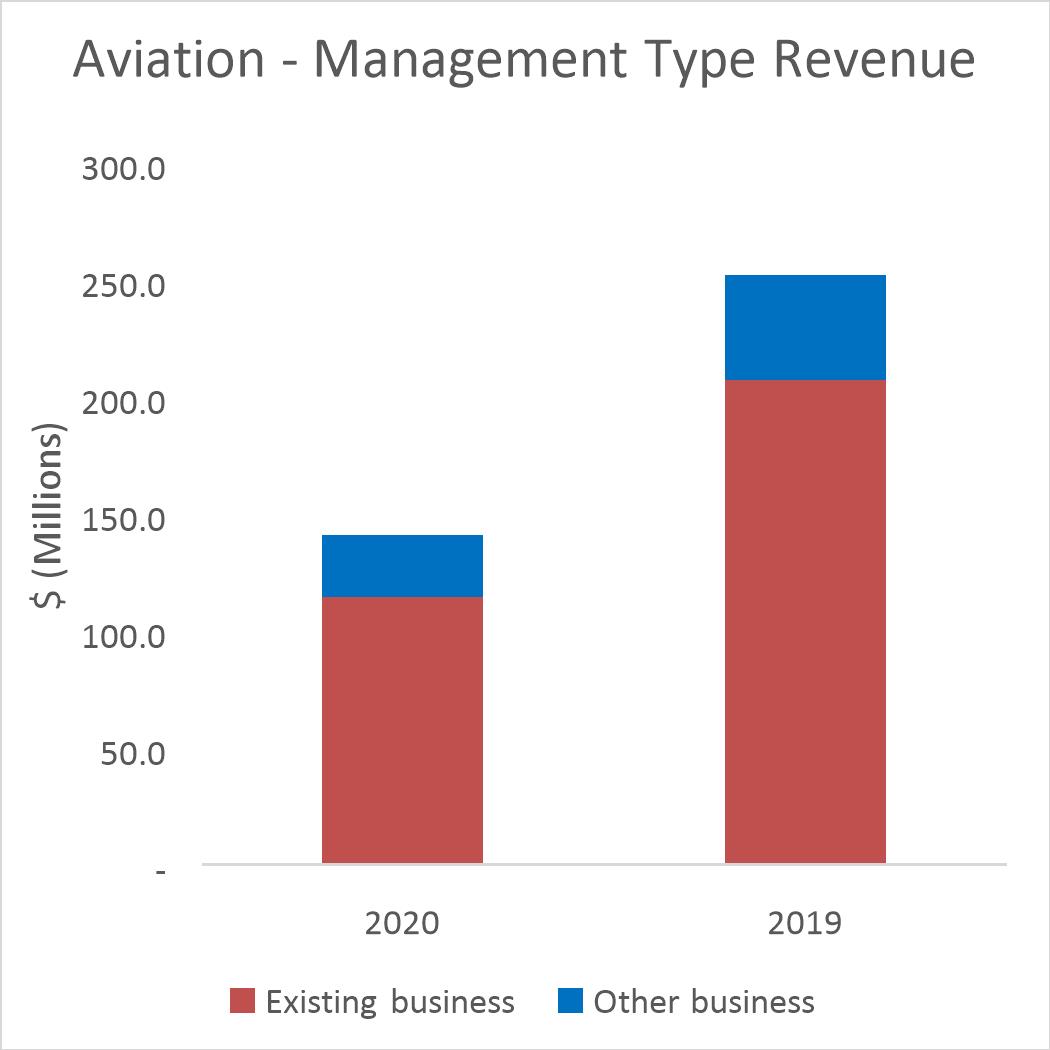
Lease type contracts. Lease type contract revenue decreased $22.1 million, or 72.0%, to $8.6 million for the year ended December 31, 2020, compared to $30.7 million for the year ended December 31, 2019. Existing business revenue decreased $9.8 million, or 71.5%, primarily due to a decrease in transient revenue as a result of COVID-19. Revenue from other business decreased by $12.3 million, or 72.4%, primarily due to decreases of $10.2 million from locations that converted to management type contracts during the periods presented, $1.2 million from new/acquired business and $0.9 million from expired business.
Management type contracts. Management type contract revenue decreased $111.3 million, or 44.2%, to $140.5 million for the year ended December 31, 2020, compared to $251.8 million for the year ended December 31, 2019. Existing business decreased by $92.7 million, or 44.8%, primarily due to a decrease in activity for volume based management type contracts as a result of COVID-19, partially offset by $5.6 million of termination fees received related to certain terminated contracts. Revenue from other business decreased by $18.6 million, or 41.5%, primarily due to a decrease of $14.4 million from expired business and $4.8 million from new/acquired business, partially offset by an increase of $0.6 million from locations that converted from lease type contracts during the periods presented.
Aviation segment: Gross Profit
25
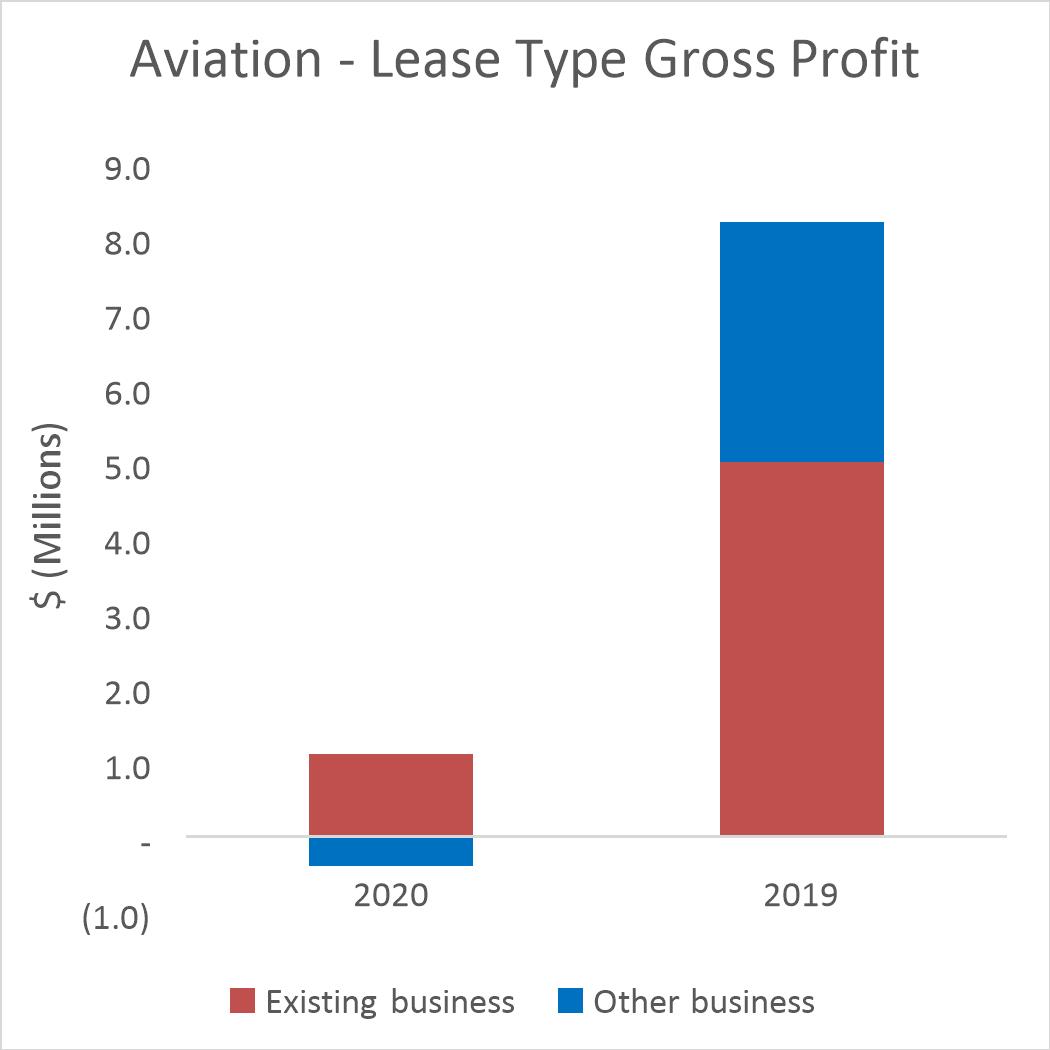
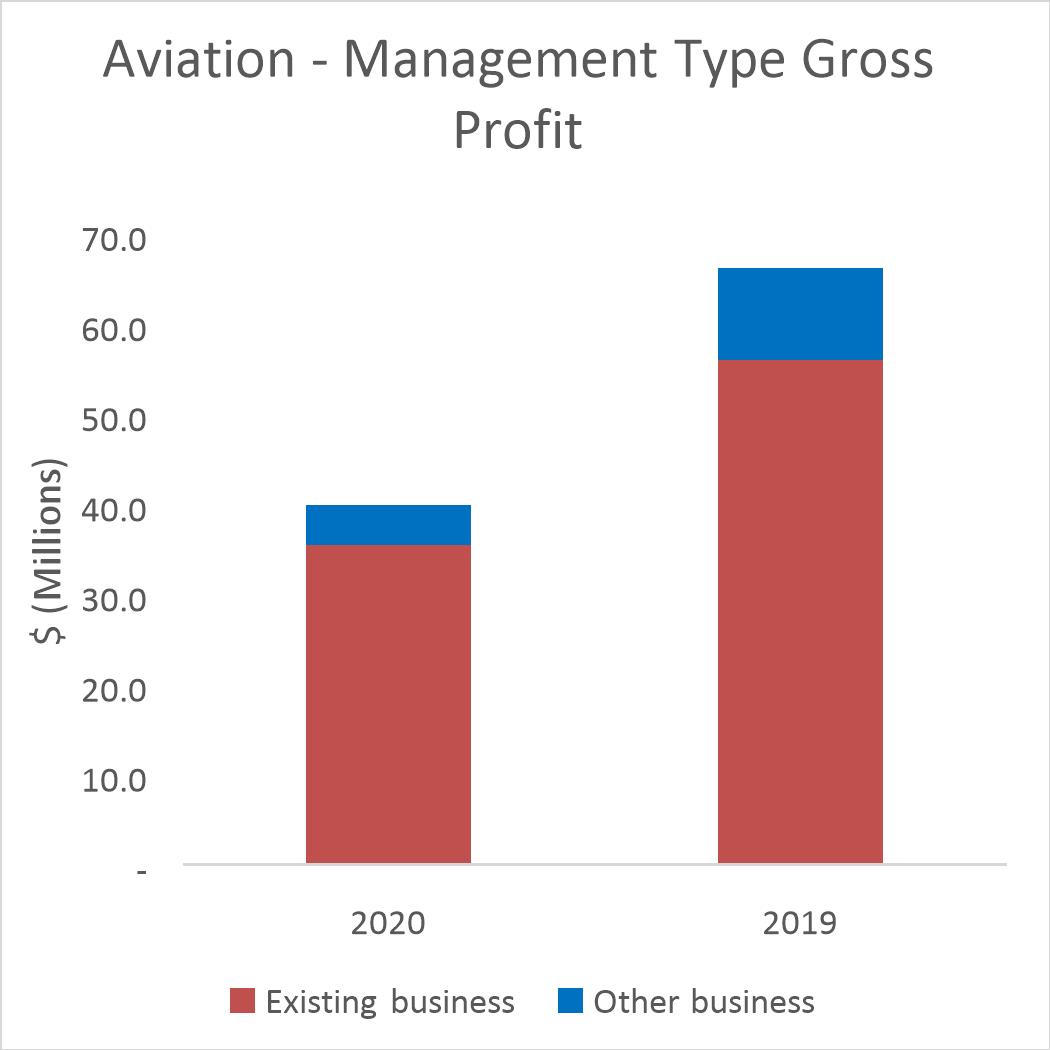
Lease type contracts. Gross profit decreased $7.5 million, or 91.5%, to $0.7 million for the year ended December 31, 2020, compared to $8.2 million for the year ended December 31, 2019. Gross profit percentage decreased to 8.1% for the year ended December 31, 2020, compared to 26.7% for the year ended December 31, 2019. Gross profit decreased as a result of declines in existing business, locations that converted to management type contracts in the periods presented and new/acquired business, partially offset by increases in expired business. Gross profit for existing business decreased $3.9 million, or 78.0%, primarily due to declines in transient revenue as a result of COVID-19, partially offset by the recognition of certain concessions of $27.1 million, as well as a decrease in variable rent and overall net operating costs.
Management type contracts. Gross profit for management type contracts decreased $26.3 million, or 39.7%, to $39.9 million for the year ended December 31, 2020, compared to $66.2 million for the year ended December 31, 2019. Gross profit percentage increased to 28.4% for the year ended December 31, 2020, compared to 26.3% for the year ended December 31, 2019. Gross profit decreased as a result of declines in existing business, expired business and new/acquired business, partially offset by an increase in locations that converted from lease type contracts in the periods presented. Gross profit for existing business decreased $20.6 million, or 36.8%, primarily due to decreases in activity for volume based management type contracts as a result of COVID-19, partially offset by decreases in overall net operating costs and $5.6 million of termination fees received related to certain terminated contacts.
“Other” segment
"Other" consists of ancillary revenue and costs that are not specifically identifiable to Commercial or Aviation and certain unallocated items, such as and including prior year insurance reserve adjustments/costs and other corporate items. Total service revenue in “Other” decreased $2.9 million, or 27.6%, to $7.6 million for the year ended December 31, 2020, compared to $10.5 million for the year ended December 31, 2019. Gross profit for “Other” decreased $2.9 million, or 14.4%, to $17.2 million for the year ended December 31, 2020, compared to $20.1 million for the year ended December 31, 2019.
2019 Compared to 2018
Consolidated results for the for the years ended December 31, 2020 and 2019, respectively, include the following notable items:
|
| December 31, |
|
| Variance |
| ||||||||||
(millions) |
| 2019 |
|
| 2018 |
|
| Amount |
|
| % |
| ||||
Service revenue (1) |
| $ | 934.9 |
|
| $ | 775.4 |
|
| $ | 159.5 |
|
|
| 20.6 | % |
Cost of services (2) |
|
| 706.8 |
|
|
| 591.4 |
|
|
| 115.4 |
|
|
| 19.5 | % |
Gross profit |
|
| 228.1 |
|
|
| 184.0 |
|
|
| 44.1 |
|
|
| 24.0 | % |
General and administrative expenses |
|
| 109.0 |
|
|
| 91.0 |
|
|
| 18.0 |
|
|
| 19.8 | % |
Depreciation and amortization |
|
| 29.4 |
|
|
| 17.9 |
|
|
| 11.5 |
|
|
| 64.2 | % |
Operating income |
|
| 89.7 |
|
|
| 75.1 |
|
|
| 14.6 |
|
|
| 19.4 | % |
Income tax expense |
|
| 19.4 |
|
|
| 19.6 |
|
|
| (0.2 | ) |
|
| (1.0 | )% |
|
|
|
|
Services revenue increased by $159.5 million, or 20.6%, attributable to the following:
|
|
|
|
26
|
Gross profit increased by $44.1 million, or 24.0%, attributable to the following:
|
|
|
|
General and administrative expenses increased $18.0 million, or 19.8%, for the year ended December 31, 2019, as compared to the year ended December 31, 2019, primarily related to the acquisition of Bags, a one-time $1.7 million cost recovery (reduction of expense) from a vendor partner recognized in 2018 and higher compensation and benefit costs, including costs associated with our performance-based compensation program, partially offset by a reduction in acquisition, restructuring and integration related costs.
Our effective tax rate was 27.3% for the year ended December 31, 2019 compared to 25.8% for the year ended December 31, 2018. The increase in the effective tax rate for the year ended December 31, 2019 reflects the benefit recorded in 2018 related to the U.S. Tax Cuts and Jobs Act of 2017 (the ”2017 Tax Act”).
The following charts summarize our revenues (excluding reimbursed management type contract revenue) and gross profit by segment for years ended December 31, 2019 and 2018.
Commercial segment: Services Revenue
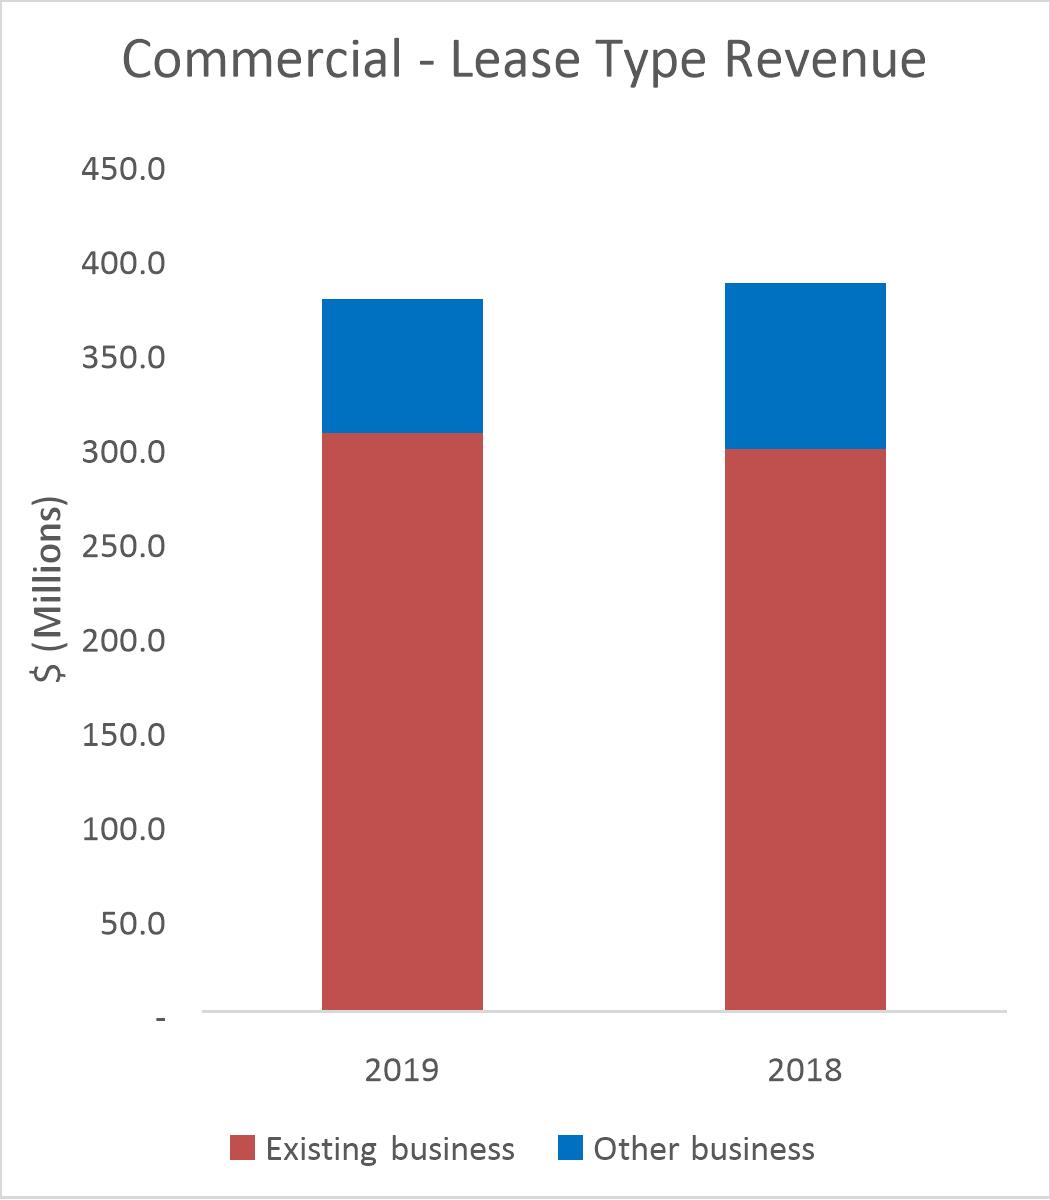
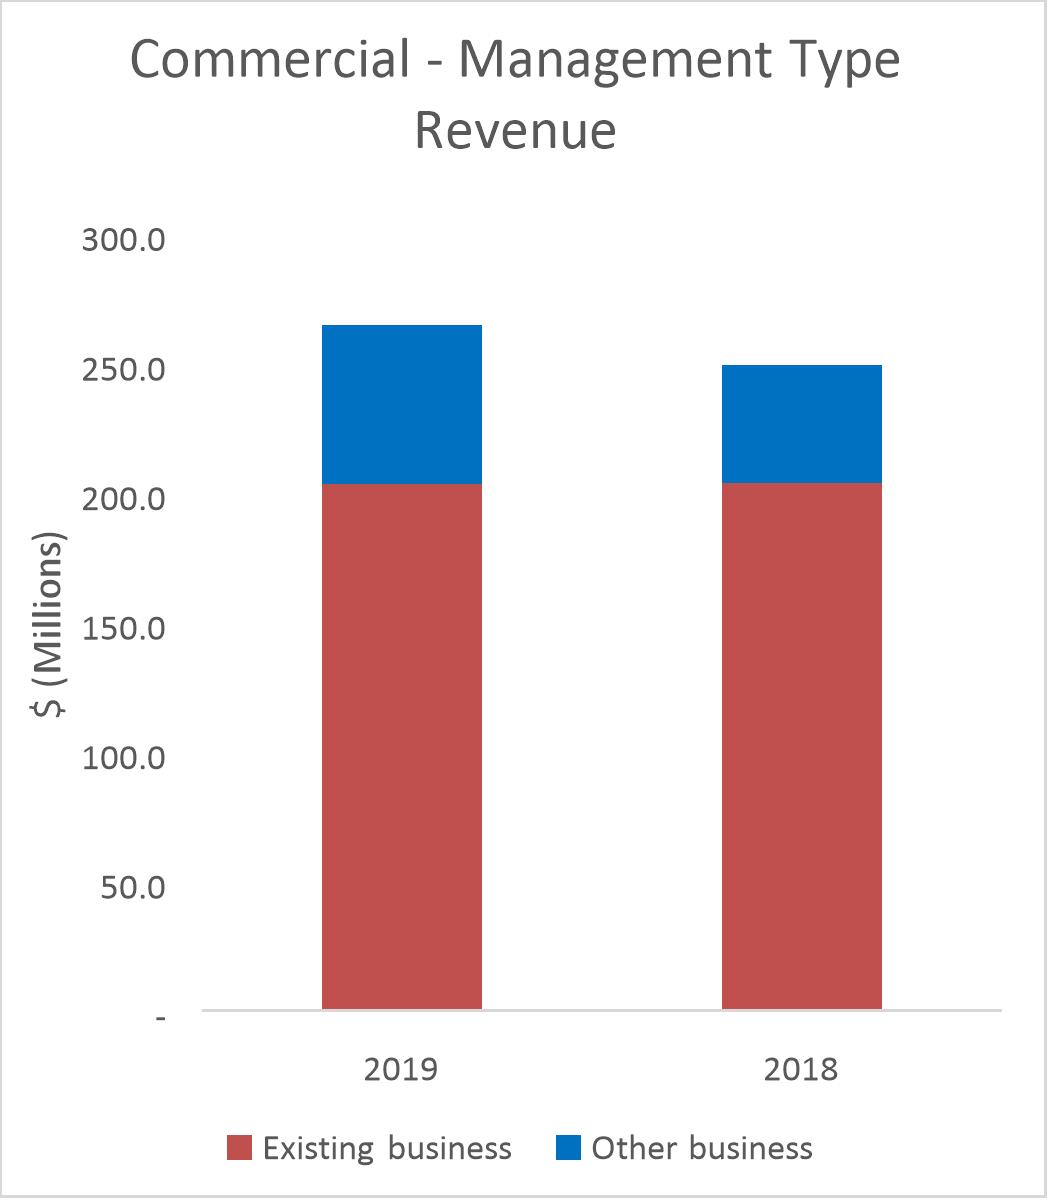
Lease type contracts. Lease type contract revenue decreased $8.9 million, or 2.3%, to $377.3 million for the year ended December 31, 2019, compared to $386.2 million for the year ended December 31, 2018. Revenue from other business decreased by $17.4 million, or 19.7%, primarily due to a decrease of $26.5 million from expired business, partially offset by increases of $8.9 million from new/acquired business and $0.2 million from locations that converted from management type contracts during the periods presented. Existing business revenue increased $8.5 million, or 2.9%, primarily due to an increase in transient revenue.
27
Management type contracts. Management type contract revenue increased $15.2 million, or 6.1%, to $264.6 million for the year ended December 31, 2019, compared to $249.4 million for the year ended December 31, 2018. Management type revenue from other business increased by $15.9 million, or 34.9%, primarily due to increases of $35.8 million from new/acquired business, mainly due to the acquisition of Bags, and $0.2 million in locations that converted from lease type contracts during the periods presented, partially offset by a decrease of $20.1 million from expired business. Existing business revenue decreased by $0.7 million, or 3.0%, primarily due to a decrease in volume based management type contracts.
Commercial segment: Gross Profit
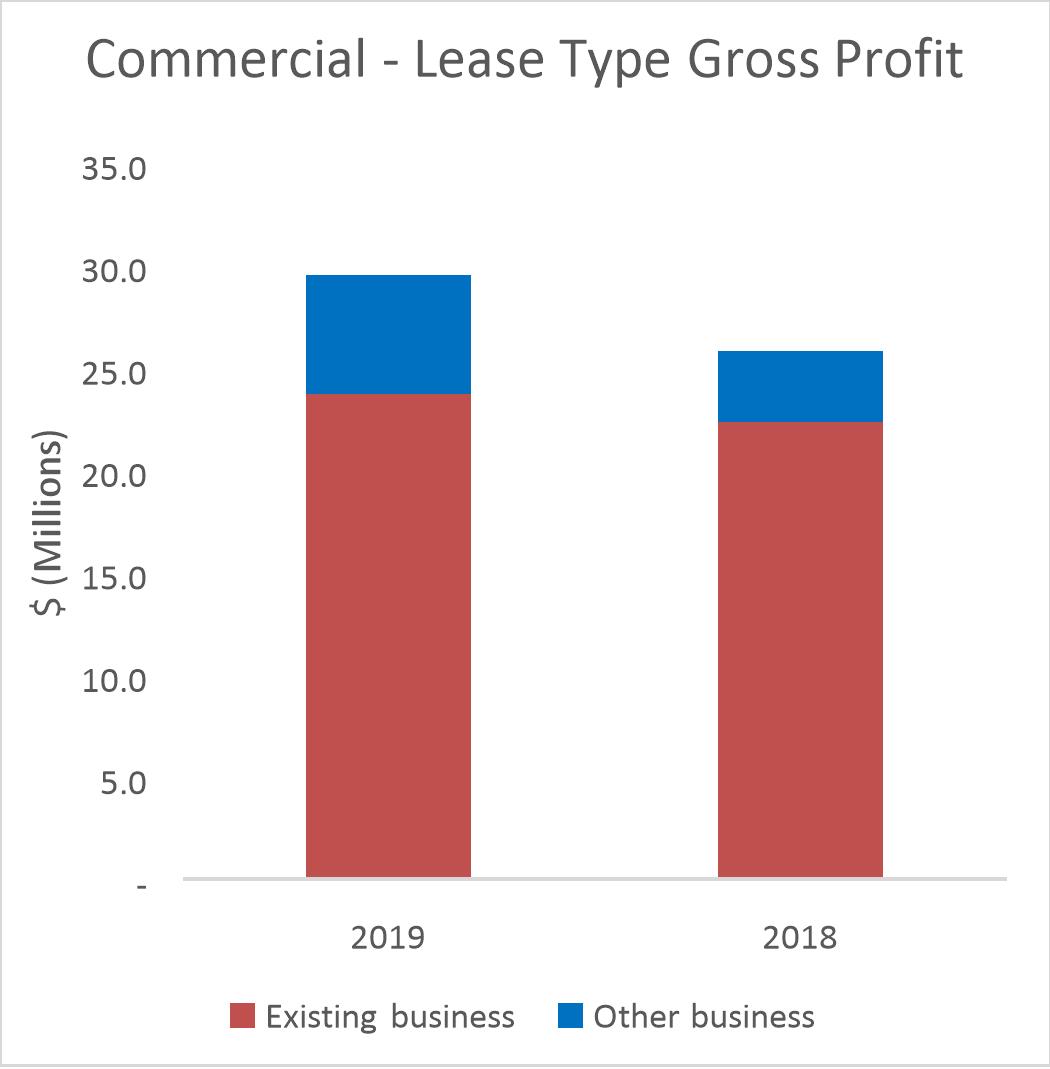
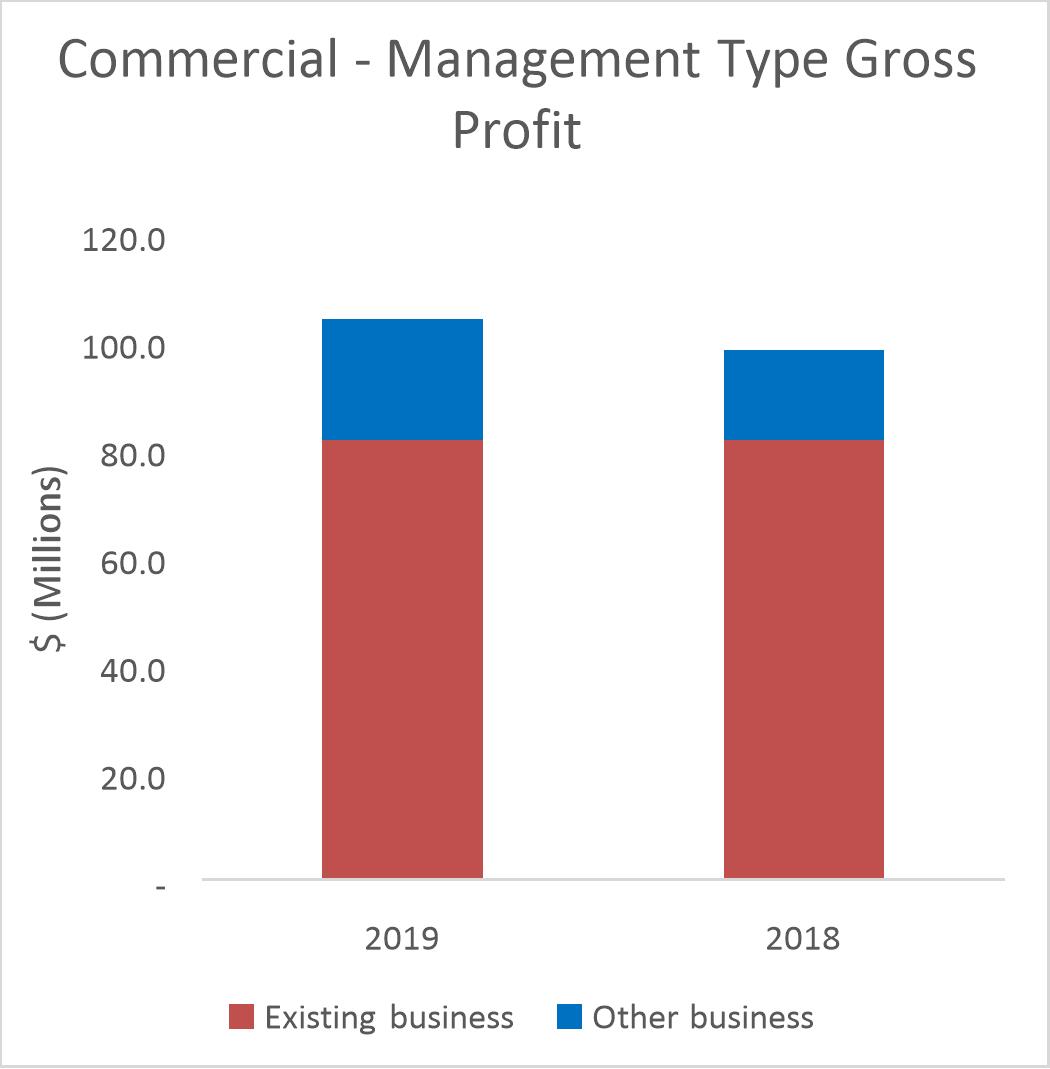
Lease type contracts. Gross profit increased $3.7 million, or 14.3%, to $29.5 million for the year ended December 31, 2019, compared to $25.8 million for the year ended December 31, 2018. Gross profit percentage increased to 7.8% for the year ended December 31, 2019, compared to 6.7% for the year ended December 31, 2018. Gross profit increased as a result of increases in existing business, expired business, new/acquired business and locations that converted from management type contracts in the periods presented. Gross profit for existing business increased $1.4 million, or 6.3%, primarily due to increases in transient revenue, partially offset by an increase in compensation and benefits costs, as well as rent expense.
Management type contracts. Gross profit increased $5.8 million, or 5.9%, to $104.1 million for the year ended December 31, 2019, compared to $98.3 million for the year ended December 31, 2018. Gross profit percentage decreased to 39.3% for the year ended December 31, 2019, compared to 39.4% for the year ended December 31, 2018. Gross profit increased as a result of increases in new/acquired business and existing business, partially offset by a decrease in expired business. Gross profit for existing business increased $0.1 million, or 0.1%.
Aviation segment: Services Revenue
28
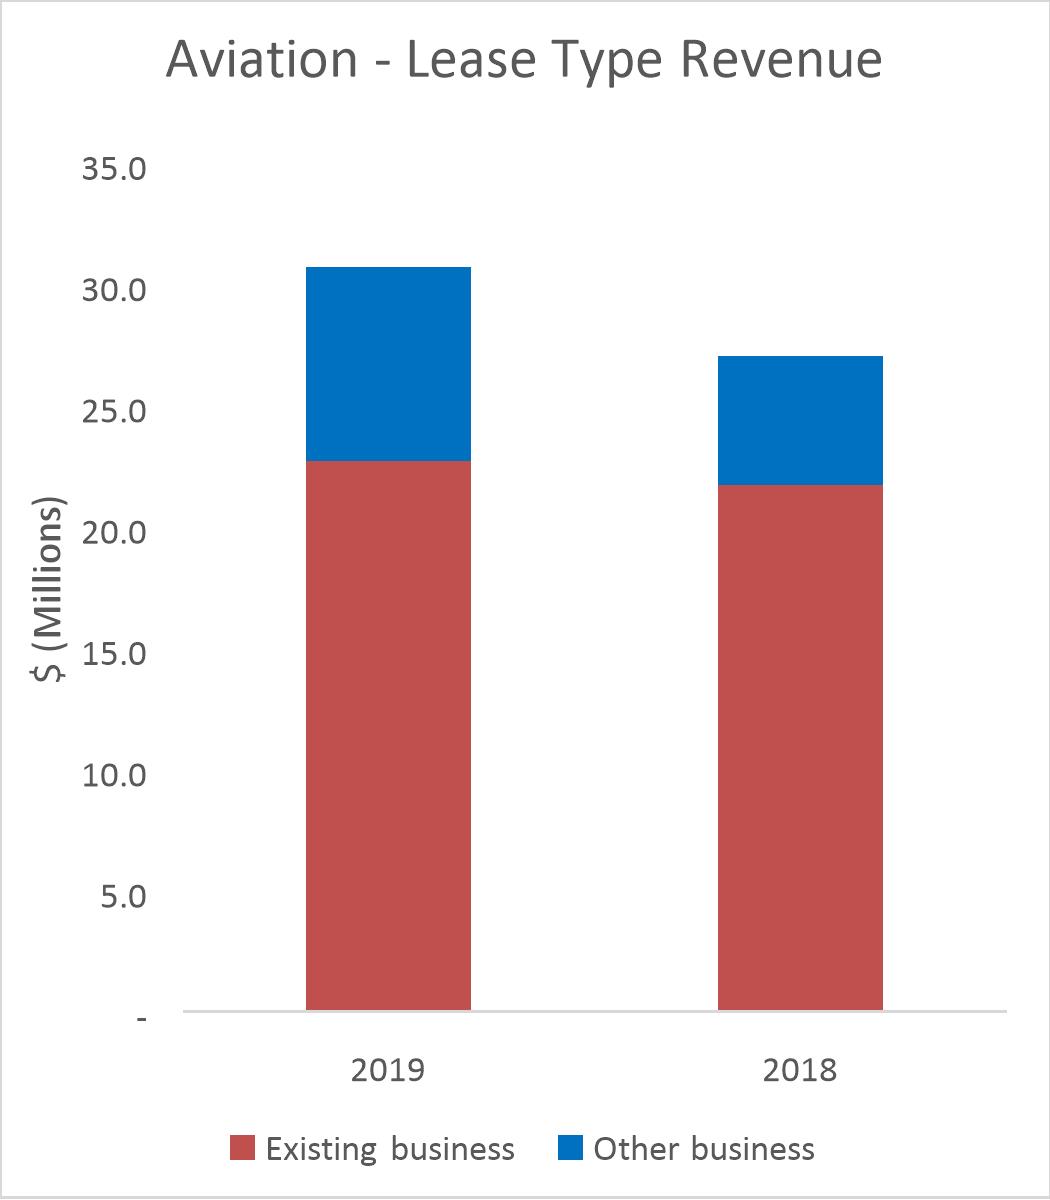
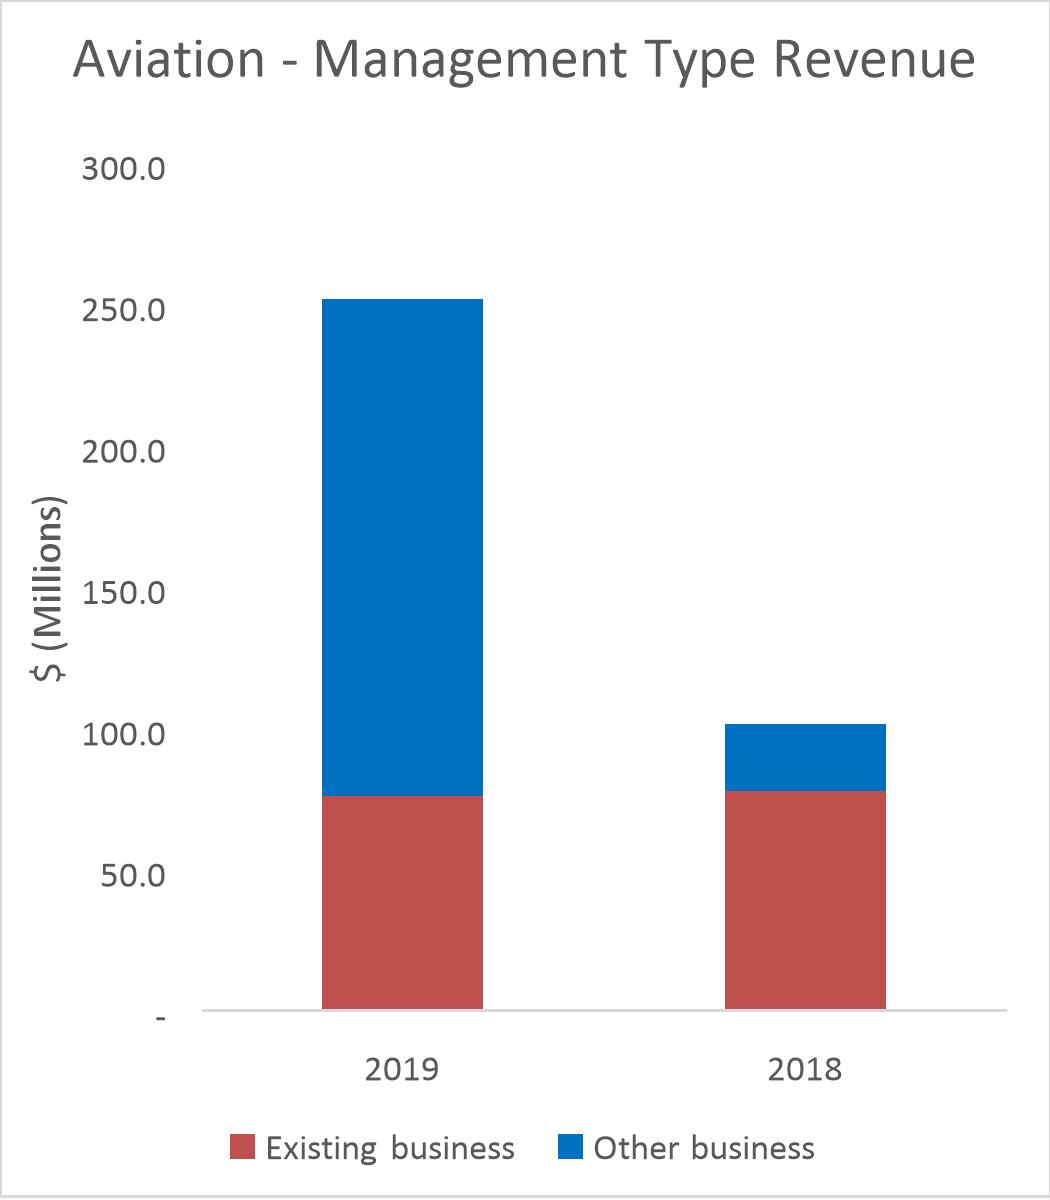
Lease type contracts. Lease type contract revenue increased $3.7 million, or 13.7%, to $30.7 million for the year ended December 31, 2019, compared to $27.0 million for the year ended December 31, 2018. Revenue from other business increased by $2.7 million, or 50.9%, primarily due to an increase of $3.1 million new/acquired business, partially offset by a decrease of $0.4 million from expired business. Existing business revenue increased $1.0 million, or 4.6%, primarily due to an increase in transient revenue.
Management type contracts. Management type contract revenue increased $150.6 million, or 148.8%, to $251.8 million for the year ended December 31, 2019, compared to $101.2 million for the year ended December 31, 2018. Revenue from other business decreased by $152.5 million, or 648.9%, primarily due to increases of $150.1 million from new/acquired business and $2.4 million from expired business. Existing business decreased $1.9 million, or 2.4%, primarily due to changes in contract terms for certain management type contracts, whereby the contract terms converted from “reverse” management type contracts to management type contracts, which typically have lower management fees from the facility owner but do not require us to pay certain operating costs associated with the facilities operation, partially offset by increased management fees.
Aviation segment: Gross Profit
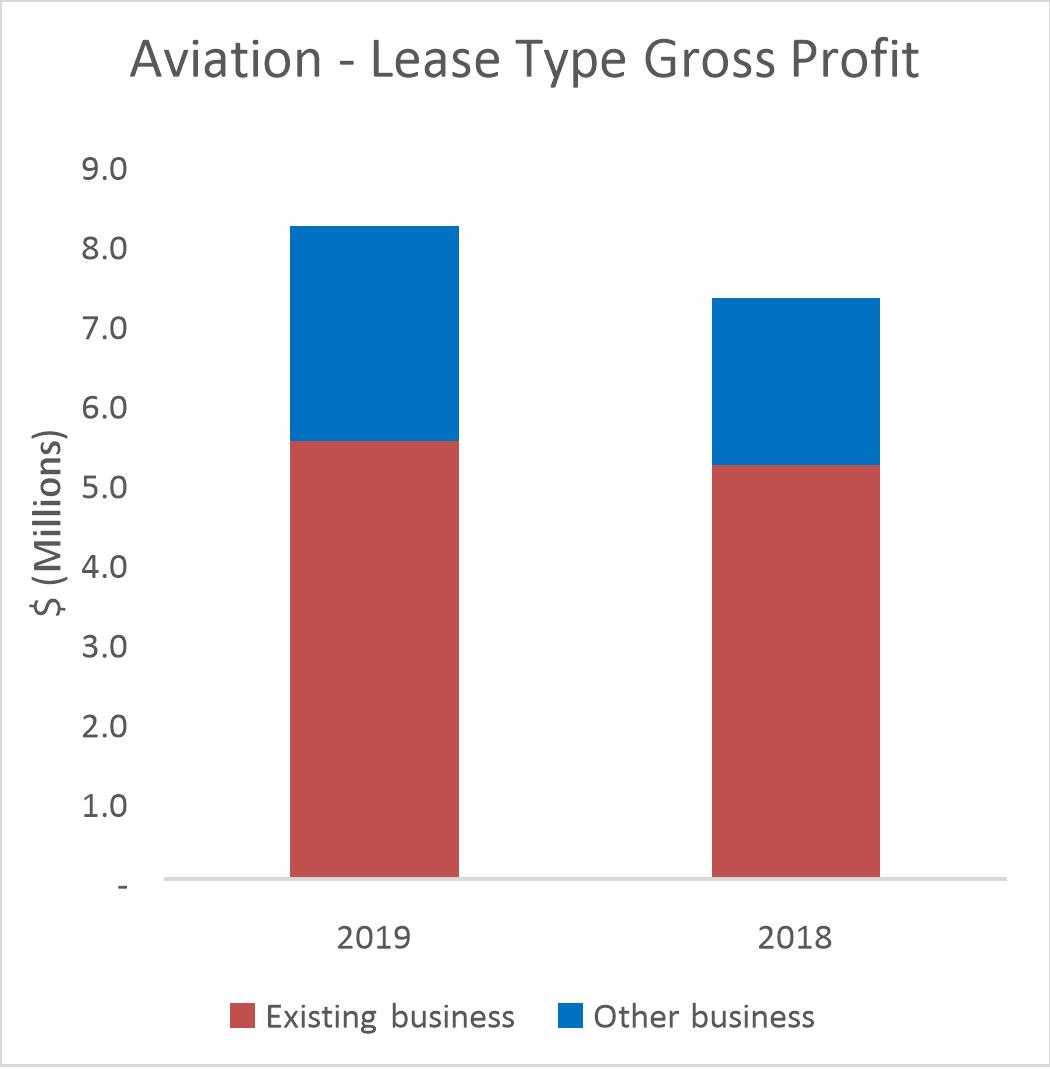
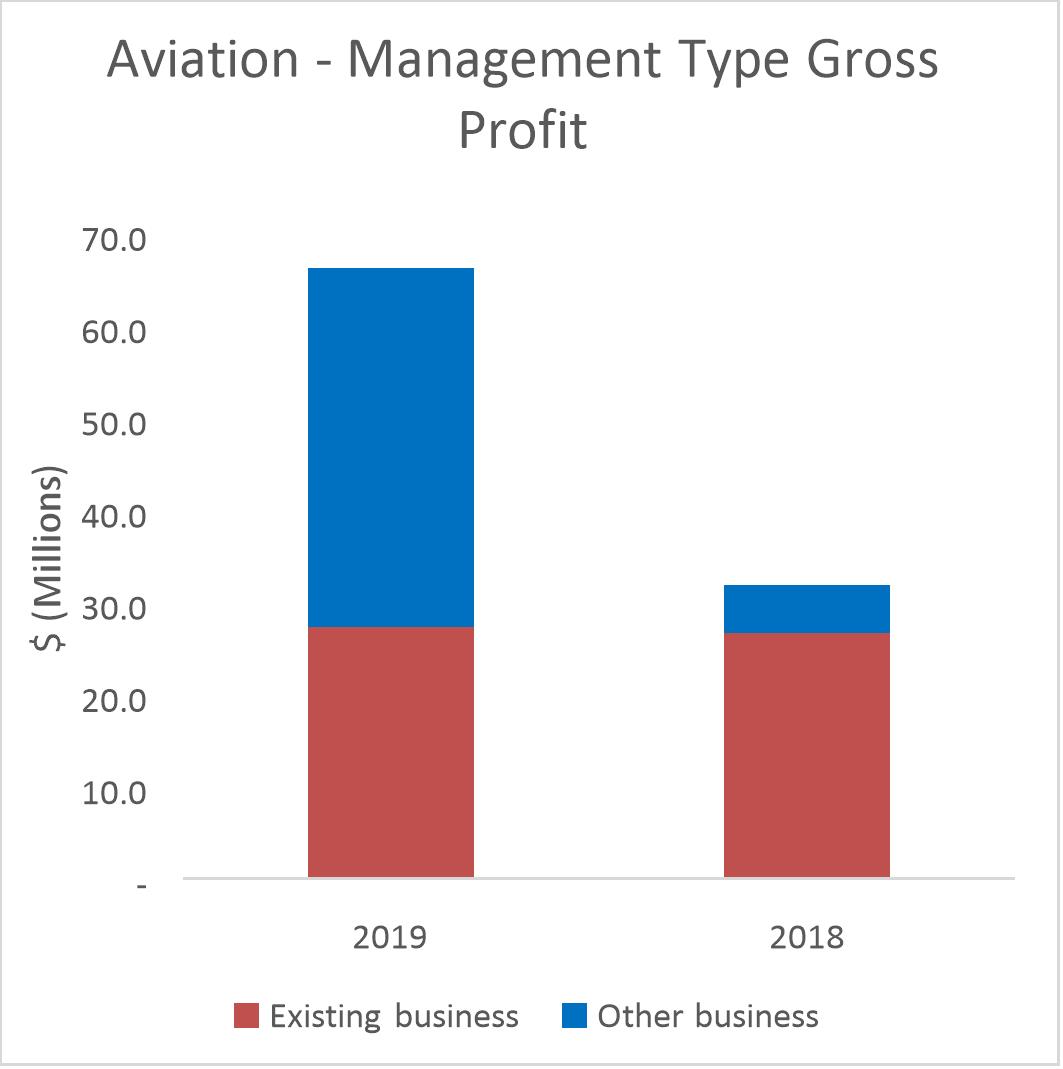
Lease type contracts. Gross profit increased $0.9 million, or 12.3%, to $8.2 million for the year ended December 31, 2019, compared to $7.3 million for the year ended December 31, 2018. Gross profit percentage decreased to 26.7% for the year ended December 31, 2019, compared to 27.0% for the year ended
29
December 31, 2018. Gross profit increased as a result of increases from new/acquired business and existing business, partially offset by a decrease in expired business. Gross profit for existing business increased $0.3 million, or 5.8%, primarily due to increases in transient revenue, partially offset by an increase in compensation and benefits costs, as well as, rent expense.
Management type contracts. Gross profit increased $34.3 million, or 107.5%, to $66.2 million for the year ended December 31, 2019, compared to $31.9 million for the year ended December 31, 2018. Gross profit percentage decreased to 26.3% for the year ended December 31, 2019, compared to 31.5% for the year ended December 31, 2018. Gross profit increased as a result of increases in new/acquired business, primarily due to the acquisition of Bags, expired business and existing business. Gross profit for existing business increased $0.7 million, or 2.6%, primarily due to decreases in net operating costs and increased management fees.
“Other” segment
"Other" consists of ancillary revenue and costs that are not specifically identifiable to Commercial or Aviation and certain unallocated items, such as and including prior year insurance reserve adjustments/costs and other corporate items. Total service revenue in “Other” decreased $1.1 million, or 9.5%, to $10.5 million for the year ended December 31, 2019, compared to $11.6 million for the year ended December 31, 2018. Gross profit for “Other” decreased $0.6 million, or 2.9%, to $20.1 million for the year ended December 31, 2019, compared to $20.7 million for the year ended December 31, 2018.
Analysis of Financial Condition
Liquidity and Capital Resources
General
We continually project anticipated cash requirements for our operating, investing and financing needs, as well as cash flows generated from operating activities available to meet these needs. Our operating needs can include, among other items, commitments for cost of services, operating leases, payroll, insurance claims, interest and legal settlements. Our investing and financing spending can include payments for acquired businesses, joint ventures, capital expenditures, cost of contracts, distributions to noncontrolling interests, share repurchases and payments on our outstanding indebtedness.
As of December 31, 2020, we had $13.9 million of cash and cash equivalents and $190.3 million of borrowing availability under our Senior Credit Facility. COVID-19 and the resulting global disruptions have negatively affected the global economy, as well as our business and the businesses of our customers and clients. The full impact of COVID-19 on our business and the businesses of our customers and clients is unknown and highly unpredictable and could continue beyond the containment of the COVID-19 outbreak. We are taking further actions to improve our liquidity, including, without limitation, reducing operating expenses and capital expenditures and suspending repurchases of our common stock. Based on these actions and our expectations regarding the impact of COVID-19, we believe we will be able to generate sufficient liquidity to satisfy our obligations and remain in compliance with our existing debt covenants for the next twelve months.
Outstanding Indebtedness
As of December 31, 2020, we had total indebtedness of approximately $362.1 million, a decrease of $6.9 million from $369.0 million as of December 31, 2019. The $362.1 million included:
|
|
|
|
Senior Credit Facility
On November 30, 2018, we entered into a credit agreement (the “Credit Agreement”) with Bank of America, N.A., as Administrative Agent, and various other institutions (the “Lenders”), pursuant to which the Lenders made available to us, a senior secured credit facility (the “Senior Credit Facility”). The Senior Credit Facility was further amended during 2020 and 2021. See Item 9B. Other Information for further information.
Under the terms of the Amended Credit Agreement (as defined in Item 9B. Other Information), term loans under the Senior Credit Facility are subject to scheduled quarterly payments of principal in installments equal to 1.25% of the initial aggregate principal amount of such term loan through the first quarter of 2021 and will increase to 1.875% thereafter.
We were in compliance with our debt covenants as of December 31, 2020.
As of December 31, 2020, we had $190.3 million of borrowing availability under the Credit Agreement, of which we could have borrowed $21.6 million on December 31, 2020 and remained in compliance with the above described covenants as of such date. Our borrowing availability under the Amended Credit Agreement is limited only as of our fiscal quarter-end by the covenant restrictions described above. At December 31, 2020, we had $49.0 million letters of credit outstanding under the Senior Credit Facility and borrowings against the Senior Credit Facility aggregated to $333.2 million (excluding debt discount of $0.9 million and deferred financing costs of $1.7 million).
Stock Repurchases
On March 10, 2020, we suspended stock repurchases in order to help improve liquidity in response to the impacts of COVID-19.
In May 2016, our Board of Directors (the “Board”) authorized us to repurchase, on the open market, shares of our outstanding common stock in an amount not to exceed $30.0 million. Under this program, the entire authorized amount was applied to repurchase 988,767 shares of common stock at an average price of $30.30 resulting in completion of the program in August 2019.
In July 2019, the Board authorized us to repurchase, on the open market, shares of our outstanding common stock in an amount not to exceed $50.0 million in aggregate. Under this program,
30
we repurchased 393,375 shares of common stock at an average price of $38.78 during the year ended December 31, 2020. During the year ended December 31, 2019, we repurchased 652,000 shares of common stock at an average price of $38.88 under this program.
In March 2020, the Board authorized a new program to repurchase, on the open market, shares of our outstanding stock in an amount not to exceed $50.0 million in aggregate. We have yet to repurchase shares under this program.
As of December 31, 2020, $59.4 million remained available for repurchase under the July 2019 and March 2020 stock repurchase programs. Purchases of our common stock may be made in open market transactions effected through a broker-dealer at prevailing market prices, in block trades, or by other means in accordance with Rules 10b-18 and 10b5-1 under the Securities Exchange Act of 1934 at time and prices considered to be appropriate at our discretion. As noted above, we have currently suspended stock repurchases. The share repurchase program does not obligate us to repurchase any particular amount of common stock, has no fixed termination date and the program may be suspended at any time at our discretion.
Share repurchase activity under the stock repurchase programs for the year ended December 31, 2020 and 2019 was as follows:
(millions, except for share and per share data) |
| December 31, 2020 |
|
| December 31, 2019 |
| ||
Total number of shares repurchased |
|
| 393,975 |
|
|
| 1,335,584 |
|
Average price paid per share |
| $ | 38.78 |
|
| $ | 35.83 |
|
Total value of stock repurchased |
| $ | 15.3 |
|
| $ | 47.9 |
|
The remaining authorized amounts in the aggregate under the July 2019 and March 2020 repurchase programs as of December 31, 2020 was as follows:
(millions) |
| December 31, 2020 |
| |
Total authorized repurchase amount |
| $ | 100.00 |
|
Total value of shares repurchased |
|
| 40.6 |
|
Total remaining authorized repurchase amount |
| $ | 59.4 |
|
Letters of Credit
We provided letters of credit totaling $14.4 million and $17.2 million to our casualty insurance carriers to collateralize our casualty insurance program as of December 31, 2020 and 2019, respectively.
We provided $34.6 million and $33.0 million in letters of credit to collateralize other obligations as of December 31, 2020 and 2019, respectively.
Interest Rate Collars
In May 2019, we entered into three-year interest rate collar contracts with an aggregate $222.3 million notional amount. The interest rate collars are used to manage interest rate risk associated with variable interest rate borrowings under the Credit Agreement. The interest rate collars establish a range where we will pay the counterparties if the one-month U.S. dollar LIBOR rate falls below the established floor rate, and the counterparties will pay us if the one-month U.S. dollar LIBOR rate exceeds the established ceiling rate of 2.5%. The interest rate collars settle monthly through the termination date of April 2022. No payments or receipts are exchanged on the interest rate collar contracts unless interest rates rise above or fall below the pre-determined ceiling or floor rates. The notional amount amortized consistently with the term loan portion of the Senior Credit Facility under the Credit Agreement prior to the Third Amendment. The interest rate collars were classified as cash flow hedges through May 5, 2020. On May 6, 2020, concurrent with entering into the Third Amendment, we de-designated the three-year interest rate collars. Prior to de-designation, the effective portion of the change in the fair value of the collars was reported in Accumulated other comprehensive loss. Upon de-designation, the balance in Accumulated other comprehensive loss is being reclassified to Other income (expense) in the Consolidated Statements of (Loss) Income on a straight-line basis through April 2022, which is over the remaining life for which the interest rate collars had previously been designated as cash flow hedges. Changes in the fair value of the collars after de-designation are included within Other income (expense) in the Consolidated Statements of (Loss) Income. For the year ended December 31, 2020, $1.6 million of interest was paid related to the interest rate collars.
We do not enter into derivative instruments for any speculative purposes.
Daily Cash Collections
As a result of day-to-day activity at our parking locations, we collect significant amounts of cash. Lease type contract revenue is generally deposited into our local bank accounts, with a portion remitted to our clients in the form of rental payments according to the terms of the leases. Under management type contracts, clients may require us to deposit the daily receipts into one of our local bank accounts, with the cash in excess of our operating expenses and management fees remitted to the clients at negotiated intervals. Other clients may require us to deposit the daily receipts into client designated bank accounts and the clients then reimburse us for operating expenses and pay our management fee subsequent to month-end, or may require segregated bank accounts for the receipts and disbursements at locations. Our working capital and liquidity may be adversely affected if a significant number of our clients require us to deposit all parking revenues into their respective accounts.
Our liquidity also fluctuates on an intra-month and intra-year basis depending on the contract mix and timing of significant cash payments. Additionally, our ability to utilize cash deposited into our local accounts is dependent upon the availability and movement of that cash into our corporate accounts. For all these reasons, from time to time, we carry a significant cash balance, while also utilizing our Senior Credit Facility.
Cash and Cash Equivalents
We had cash and cash equivalents of $13.9 million and $24.1 million at December 31, 2020 and 2019, respectively. The cash balances reflect our ability to utilize funds deposited into our bank accounts. Availability, timing of deposits and the subsequent movement of cash into our corporate bank accounts may result in significant changes to our cash balances.
31
Summary of Cash Flows
Our primary sources of liquidity are cash flows from operating activities and availability under our Senior Credit Facility. Our cash flows for the years ended December 31, 2020, 2019 and 2018 were as follows:
|
| Years ended December 31, |
| |||||||||
(millions) |
| 2020 |
|
| 2019 |
|
| 2018 |
| |||
Net cash provided by operating activities |
| $ | 40.2 |
|
| $ | 76.0 |
|
| $ | 70.9 |
|
Net cash used in by investing activities |
| $ | (11.5 | ) |
| $ | (12.5 | ) |
| $ | (268.4 | ) |
Net cash (used in) provided by financing activities |
| $ | (39.0 | ) |
| $ | (79.4 | ) |
| $ | 215.2 |
|
Operating Activities
Net cash provided by operating activities decreased $35.8 million to $40.2 million during the year ended December 31, 2020 from $76.0 million during the year ended December 31, 2019. The decrease in net cash provided by operating activities primarily resulted from the impacts of COVID-19, partially offset by lower cash taxes and favorable working capital management.
Net cash provided by operating activities increased $5.1 million to $76.0 million during the year ended December 31, 2019 from $70.9 million during the year ended December 31, 2018. The increase in net cash provided by operating activities primarily resulted from increased revenue, partially offset by higher cash interest.
Investing Activities
Net cash used in investing activities was $11.5 million during the year ended December 31, 2020, a decrease of $1.0 million from $12.5 million during the year ended December 31, 2019. Cash used to purchase leasehold improvements, equipment and cost of contracts was $11.0 million during the year ended December 31, 2020 as compared to $12.8 million during the year ended December 31, 2019. During the year ended December 31, 2020, we sold investments and equipment for $1.2 million and bought out a minority partner for $1.7 million as part of our decision to convert our agreement with the Bradley International Airport to a standard management type agreement.
Net cash used in investing activities was $12.5 million during the year ended December 31, 2019, a decrease of $255.9 million from $268.4 million during the year ended December 31, 2018. Cash used in investing activities during the year ended December 31, 2018 included $277.9 million used for the acquisition of Bags and $19.3 million in proceeds received from the sale of an equity method investee’s sale of assets. Cash used to purchase leasehold improvements, equipment and cost of contracts was $12.8 million during the year ended December 31, 2019 as compared to $10.0 million during the year ended December 31, 2018.
Financing Activities
Net cash used in financing activities was $39.0 million during the year ended December 31, 2020, a decrease of $40.4 million from $79.4 million during the year ended December 31, 2019. The decrease was primarily due to lower repurchases of common stock and lower net payments on the Senior Credit Facility.
Net cash used in financing activities was $79.4 million during the year ended December 31, 2019, as compared to net cash provided by financing activities of $215.2 million during the year ended December 31, 2018. Net cash provided by financing activities during the year ended December 31, 2019 included net proceeds from the Senior Credit Facility of $222.2 million, which was primarily used for the acquisition of Bags. Cash used in financing activities for the year ended December 31, 2019 included $47.6 million for the repurchase of our common stock and net payments on the Senior Credit Facility of $26.3.
Summary Disclosures about Contractual Obligations and Commercial Commitments
The following table summarizes certain of our contractual obligations at December 31, 2020 and the effect such obligations are expected to have on our liquidity and cash flow in future periods. The nature of our business is to manage parking facilities and as a result, we do not have significant short-term purchase obligations.
|
| Payments Due by Period |
| |||||||||||||||||
|
|
|
|
|
|
|
|
|
|
|
|
|
|
|
|
|
| 2026 and |
| |
(millions) |
| Total |
|
| 2021 |
|
| 2022 - 2023 |
|
| 2024 - 2025 |
|
| thereafter |
| |||||
Contractual obligations |
|
|
|
|
|
|
|
|
|
|
|
|
|
|
|
|
|
|
|
|
Operating leases (1) |
| $ | 374.4 |
|
| $ | 94.7 |
|
| $ | 139.1 |
|
| $ | 71.3 |
|
| $ | 69.3 |
|
Finance leases |
|
| 31.7 |
|
|
| 8.8 |
|
|
| 12.8 |
|
|
| 5.1 |
|
|
| 5.0 |
|
Service concession arrangements (2) |
|
| 118.0 |
|
|
| 51.3 |
|
|
| 48.4 |
|
|
| 15.1 |
|
|
| 3.2 |
|
Total contractual obligations |
| $ | 524.1 |
|
| $ | 154.8 |
|
| $ | 200.3 |
|
| $ | 91.5 |
|
| $ | 77.5 |
|
|
|
|
|
32
Critical Accounting Policies and Estimates
The preparation of financial statements in conformity with accounting principles generally accepted in the United States requires management to make estimates and judgments that affect the reported amounts of assets and liabilities, revenues and expenses and related disclosures of contingent assets and liabilities in the Consolidated Financial Statements and accompanying notes. The SEC has defined a company's critical accounting policies and estimates as the ones that are most important to the portrayal of the company's financial condition and results of operations, and which require the company to make its most difficult and subjective judgments, often as a result of the need to make estimates of matters that are inherently uncertain. Based on this definition, we have identified the critical accounting policies and judgments addressed below. We base these estimates and judgments on historic experience and on various other assumptions that are believed to be reasonable under the circumstances, the results of which form the basis for making judgments about carrying values of assets and liabilities that are not readily apparent from other sources. Certain accounting estimates are particularly sensitive because of their complexity and the possibility that future events affecting them may differ materially from our current judgments and estimates.
This listing of critical accounting policies is not intended to be a comprehensive list of all of our accounting policies. We also have other key accounting policies, which involve the use of estimates, judgments, and assumptions that are significant to understanding our results, which are included in Note 1. Significant Accounting Policies and Practices of the notes to the Consolidated Financial Statements included in Part IV, Item 15. "Exhibits and Financial StatementSchedules."
Goodwill and Other Intangible Assets
Goodwill represents the excess of purchase price paid over the fair value of net assets acquired. In accordance with the Financial Accounting Standards Board's ("FASB") authoritative accounting guidance on goodwill, we evaluate goodwill for impairment on an annual basis, or more often if events or circumstances change that could cause goodwill to become impaired. We have elected to assess the impairment of goodwill annually on October 1 or at an interim date if there is an event or change in circumstances indicating the carrying value may not be recoverable. The goodwill impairment test is performed at the reporting unit level; the Company's reporting units represent its operating segments, consisting of Commercial and Aviation. Factors that could trigger an impairment review include significant under-performance relative to expected historical or projected future operating results, significant changes in the use of acquired assets or its business strategy, and significant negative industry or economic trends.
We may perform a qualitative, rather than quantitative, assessment to determine whether it is more likely than not that the fair value of a reporting unit is less than its carrying amount. As of January 1, 2020, we adopted Accounting Standards Update (“ASU”) 2017-04, which eliminated the two step approach from the current goodwill impairment test and allows impairment to be calculated based on the quantitative assessment. The determination of fair value of a reporting unit utilizes cash flow projections that assume certain future revenue and cost levels, comparable marketplace data, assumed discount rates based upon current market conditions and other valuation factors, all of which involve the use of significant judgement and estimates. We also assess critical areas that may impact our business including economic conditions, market related exposures, competition, changes in service offerings and changes in key personnel.
Other intangible assets with finite lives are amortized over their estimated useful lives. We evaluate the remaining useful life of other intangible assets on a periodic basis to determine whether events or circumstances warrant a revision to their remaining useful lives. In addition, other intangible assets are reviewed for impairment when circumstances change that would indicate the carrying value may not be recoverable. Assumptions and estimates about future values and remaining useful lives of intangibles are complex and subjective. They can be affected by a variety of factors, including external factors such as industry and economic trends, and internal factors, such as changes in our business strategy and internal forecasts. Although management believes the historical assumptions and estimates are reasonable and appropriate, different assumptions and estimates could materially impact our reported financial results.
Long-Lived Assets
We evaluate long-lived assets, including ROU assets, leasehold improvements, equipment and construction in progress, for impairment whenever events or circumstances indicate that the carrying value of an asset or asset group may not be recoverable. We group assets at the lowest level for which cash flows are separately identified in order to measure an impairment. Events or circumstances that would result in an impairment review include a significant change in the use of an asset, the planned sale or disposal of an asset, or a projection or forecast that demonstrates continuing losses associated with the use of a long-lived asset group. Recoverability of assets to be held and used is measured by a comparison of the carrying amount of the asset to future undiscounted cash flows expected to be generated by the asset group. If it is determined to be impaired, the impairment recognized is measured by the amount by which the carrying value of the asset exceeds its fair value.
Assumptions and estimates used to determine cash flows in the evaluation of impairment and the fair values used to determine the impairment are subject to a degree of judgment and complexity. Any changes to the assumptions and estimates resulting from changes in actual results or market conditions from those anticipated may affect the carrying value of long-lived assets and could result in an impairment charge.
Insurance Reserves
We purchase comprehensive casualty insurance covering certain claims that arise in connection with our operations. In addition, we purchase umbrella/excess liability coverage. Under the various liability and workers' compensation insurance policies, we are obligated to pay directly or reimburse the insurance carrier for the deductible / retention amount of each loss covered by our general / garage, liability, automobile, workers' compensation and garage keepers legal liability policies. As a result, we are in effect,effectively self-insured for all claims within the deductible / retention amount of each loss. Any loss over the deductible / retention is the responsibility of the third-party insurer. We apply the provisions as defined in the guidance related to accounting for contingencies, in determining the timing and amount of expense recognition associated with claims against us. The expense recognition is based upon our determination of an unfavorable outcome of a claim being deemed as probable and capable of being reasonably estimated, as defined in the guidance related to accounting for contingencies.estimated. This determination requires the use of judgment in both the estimation of probability and the amount to be recognized as an expense. We utilize historical claims experience and exposures specific to each type of insurance, along with actuarial methods performed quarterly by a third party actuarial adviser in determining the required level of insurance reserves. As of December 31, 2020,2023, the insurance reserve for general, garage, automobile
26
and workers’ compensation liabilities was $50.3 million, of which $24.9 million and $25.4 million was recorded in Accrued and other current liabilities and Other noncurrent liabilities, inrespectively, within the Consolidated Balance Sheets for short term and long term balances, respectively.Sheets. Future information regarding historical loss experience may require changes to the level of insurance reserves and could result in increased expense recognition in the future.
33
Allowance for Doubtful Accounts
We report accountsAccounts receivable, net of anthe allowance for doubtful accounts, to representrepresents our estimate of the amount that ultimately will be realized in cash. In determiningWe review the adequacy of the allowance for doubtful accounts weon an ongoing basis, primarily use theusing a review of specific accounts, but also useas well as historical collection trends and aging of receivables, and makerecord adjustments into the allowance as necessary. Changes in economic conditions or other circumstances could have an impact on the collection of existing receivable balances or future allowance considerations.
Income Taxes
Income tax expense involves management judgment as to the ultimate resolution of any tax issues. Historically, our assessments of the ultimate resolution of tax issues have been reasonably accurate. The current open issues are not dissimilar from historical items.
Deferred income taxes are computed using the asset and liability method, such that deferred tax assets and liabilities are recognized for the expected future tax consequences ofdeductible temporary differences between US GAAP amounts and the tax basis of existing assets and liabilities based on currently enacted tax laws and tax rates in effect for the periods in which these temporary differences are expected to reverse or be settled. Income tax expense (benefit) is the tax payable (receivable) for the period plus the change during the period in deferred income taxes. We have certain state net operating lossNOL carry forwards which expire in 2040.2043. We consider a number of factors in our assessment of the recoverability of our net operating lossNOL carryforwards including their expiration dates and the limitations imposed due to the change in ownership, as well as future projections of income. Future changes in our operating performance, along with these considerations, may significantly impact the amount of net operating lossesNOLs ultimately recovered, and our assessment of their recoverability.
We recognize deferred tax liabilities related to taxes on certain foreign earnings that are not considered to be permanently invested. In addition, we have recognized deferred tax liabilities on nondeductible intangible assets.
When evaluating our tax positions, we account for uncertainty in income taxes inwithin our Consolidated Financial Statements. The evaluation of a tax position is a two-step process, the first step being recognition. The first step is to determine whether it is more-likely-than-not that a tax position will be sustained upon tax examination, including resolution of any related appeals or litigation processes, based on only the technical merits of the position and the weight of available evidence. If a tax position does not meet the more-likely-than-not threshold, which is more than 50% likely of being realized, the benefit of that position is not recognized in our financial statements. The second step is measurement of the tax benefit. The tax position is measured as the largest amount of benefit that is more-likely-than-not of being realized, which is more than 50% likely of being realized upon ultimate resolution with a taxing authority.
Legal and Other Contingencies
We are subject to claims and litigation in the normal course of our business. Thebusiness, including those related to labor and employment, contracts, personal injury and other related matters, some of which allege substantial monetary damages and claims. Some of these actions may be brought as class actions on behalf of a class or purported class of employees. While the outcomes of claims and legal proceedings brought against us and other loss contingencies are subject to uncertainty. uncertainty, we believe the final outcome will not have a material adverse effect on our financial position, results of operations or cash flows.
We accrue a charge when we determine that it is probable that an asset has been impaired or a liability has been incurred and the amount of loss can be reasonably estimated. When a loss is probable, we record an accrual based on the reasonably estimable loss or range of loss. When no point of loss is more likely than another, we record the lowest amount in the estimated range of loss, and if material, disclose the estimated range. We do not record liabilities for reasonably possible loss contingencies, but do disclose a range of reasonably possible losses if they are material and we are able to estimate such a range. If we cannot provide a range of reasonably possible losses, we explain the factors that prevent us from determining such a range. In addition, we accrue for the authoritative judgments or assertions made against us by government agencies at the time of their rendering regardless of our intent to appeal. We regularly evaluate current information available to us to determine whether an accrual should be established or adjusted. Estimating the probability that a loss will occur and estimating the amount of a loss or a range of loss involves significant estimation and judgment.
Item 7A. Quantitative and Qualitative Disclosures About Market Risk
|
|
Interest Rates
Our primary market risk exposure consists of risk related to changes in interest rates. We use the variable rate Senior Credit Facility to finance our operations. ThisThe Senior Credit Facility exposes us to variability in interest payments due to changes in interest rates. If interest rates increase, interest expense increases and conversely, if interest rates decrease, interest expense also decreases. We believe that it is prudent to limit our exposure to an increase in interest rates. See Note 13. 11. Borrowing Arrangements within the Notes to ourthe Consolidated Financial Statements for further discussion.
If we were to borrow the entire $190.3 million available under the revolving credit facility, aA one percent increase in the average market rate would result in an increase in our annual interest expense of $1.9 million. This amount is determined by considering$3.3 million related to borrowings outstanding on our Senior Credit Facility.
Foreign Currency Risk
We are exposed to the impact of the hypothetical interest rates on our borrowing cost, but does not consider the effects of the reduced level of overall economic activity that could existforeign currency fluctuations in such an environment. Duecertain countries in which we operate. The exposure to the uncertainty of the specific changes and their possible effects, the foregoing sensitivity analysis assumes no changesforeign currency movements is limited in our financial structure.
Interest Rate Collars
See Item 7 of Part II of this Annual Report on Form 10-K concerning LiquidityCanada and Capital Resources for further discussion regarding our interest rate collars.
Foreign Currency Risk
Substantially all of our operationsIndia subsidiaries because the operating revenues and expenses are conductedsubstantially in the local currency in which they operate. Even though our United States and, as such, are not subjectKingdom subsidiary transacts business in many countries, their exposure to material foreign currency exchange risk. All foreign investments are denominated in U.S. dollars, with the exception of Canada.fluctuations is considered not significant. We had approximately $0.5$1.6 million of Canadian dollarforeign denominated cash instruments at December 31, 2020, and no debt instruments denominated in Canadian dollar atforeign currencies as of December 31, 2020.2023. We do not hold any hedging instruments related to foreign currency transactions.
We monitor foreign currency positions and may enter into certain hedging instruments in the future shouldif we determine thatthe exposure to foreign exchange risk has increased.
|
|
TheItem 8. Financial Statements and Supplementary Data
1. All Financial Statements
Index to Consolidated Financial Statements and related notes and schedules required by this item are incorporated into this Form 10-K and set forth in Part IV, Item 15. "Exhibits and Financial Statement Schedules" herein.
34
27
None.
|
|
Evaluation of Disclosure Controls and Procedures
Prior to the filing of our Annual Report on Form 10-K for the fiscal year ended December 31, 2020 and under the supervision and with the participation of our management, including our Chief Executive Officer and Chief Financial Officer, we carried out an evaluation of the effectiveness of the design and operation of our disclosure controls and procedures (the "Evaluation") as of the last day of the period covered by this Form 10-K.
Disclosure controls and procedures are defined by Rules 13a-15(e) and 15d-15(e) of the Exchange Act as controls and other procedures that are designed to ensure that information required to be disclosed in the reports that we file or submit under the Exchange Act is recorded, processed, summarized and reported within the time periods specified by the SEC's rules and forms. Disclosure controls and procedures include, without limitation, controls and procedures designed to ensure that information required to be disclosed in the reports that we file or submit under the Exchange Act is accumulated and communicated to our management, including our Chief Executive Officer and Chief Financial Officer, to allow timely decisions regarding required disclosures.
Based upon the Evaluation, our Chief Executive Officer and Chief Financial Officer concluded that, as of December 31, 2020, our disclosure controls and procedures were effective to promote reasonable assurance that information required to be disclosed by us in the reports that we file or submit under the Exchange Act is recorded, processed, summarized and reported accurately and within the time frames specified in the SEC's rules and forms and accumulated and communicated to our management, including our Chief Executive Officer and Chief Financial Officer, as appropriate to allow timely decisions regarding required disclosure.
Inherent Limitations of the Effectiveness of Internal Control
Our internal control over financial reporting is designed to provide reasonable assurance regarding the reliability of financial reporting and the preparation of financial statements for external purposes in accordance with U.S. generally accepted accounting principles ("GAAP"). Our internal control over financial reporting includes those policies and procedures that:
|
|
|
|
|
|
Management, including our Chief Executive Officer and Chief Financial Officer, does not expect that our internal controls will prevent or detect all errors and all fraud. A control system, no matter how well designed and operated, can provide only reasonable, not absolute, assurance that the objectives of the control system are met. Further, the design of a control system must reflect the fact that there are resource constraints, and the benefits of controls must be considered relative to their costs. Because of the inherent limitations in all control systems, no evaluation of internal controls can provide absolute assurance that all control issues and instances of fraud, if any, have been detected. Also, any evaluation of the effectiveness of controls in future periods are subject to the risk that those internal controls may become inadequate because of changes in business conditions, or that the degree of compliance with the policies or procedures may deteriorate.
Management's Annual Report on Internal Control over Financial Reporting
Our management is responsible for establishing and maintaining adequate internal control over financial reporting. Our internal control system was designed to provide reasonable assurance to our management and Board of Directors regarding the preparation and fair presentation of our published financial statements.
Prior to the filing of our Annual Report on Form 10-K for the fiscal year ended December 31, 2020, our management assessed the effectiveness of our internal control over financial reporting as of the last day of the period covered by the report. In making this assessment, our management used the criteria set forth by the Committee of Sponsoring Organizations of the Treadway Commission ("COSO") in Internal Control—Integrated Framework (2017 Framework). Based on our Evaluation under the COSO Framework, our management concluded that our internal control over financial reporting was effective as of December 31, 2020.
Ernst & Young LLP has audited the Consolidated Financial Statements included in this Annual Report on Form 10-K and, as part of its audit, has issued an attestation report, included herein, on the effectiveness of our internal control over financial reporting.
Changes in Internal Control over Financial Reporting
There have been no significant changes in our internal control over financial reporting that occurred during the quarter ended December 31, 2020, that were identified in connection with management’s evaluation required by paragraph (d) of Rules 13a-15 and 15d-15 under the Exchange Act, that have materially affected or are reasonably likely to materially affect our internal control over financial reporting.
|
|
Senior Credit Facility
On February 16, 2021 (the “Fourth Amendment Effective Date”), we entered into a fourth amendment (the “Fourth Amendment”) to our credit agreement (as amended prior to the Fourth Amendment Effective Date (as defined below), the “Credit Agreement”) with Bank of America, N.A. (“Bank of America”), as Administrative Agent, swing-line lender and a letter of credit issuer; Wells Fargo Bank, N.A., as syndication agent; BMO Harris Bank N.A., JPMorgan Chase Bank, N.A., KeyBank National Association and U.S. Bank National Association, as co-documentation agents; Merrill Lynch, Pierce, Fenner & Smith Incorporated and Wells Fargo Securities, LLC, as joint lead arrangers and joint bookrunners; and the lenders party thereto (the “Lenders”), pursuant to which the Lenders have made available to us a senior secured credit facility (the “Senior Credit Facility”). Prior to the Fourth Amendment Effective Date and pursuant to the third amendment (the “Third Amendment”) to our credit agreement, which was entered into on May 6, 2020, the Senior Credit Facility permitted aggregate borrowings of $595.0 million consisting of (i) a revolving credit facility of up to $370.0 million at any time outstanding, which includes a letter of credit facility that is limited to
35
$100.0 million at any time outstanding, and (ii) a term loan facility of $225.0 million (the entire principal amount of which we drew on November 30, 2018). Pursuant to the Credit Agreement as amended by the Fourth Amendment (the “Amended Credit Agreement”), the aggregate commitments under the revolving credit facility decreased by $45.0 million to $325.0 million.
Borrowings under the Senior Credit Facility bear interest, at our option, at a rate per annum based on our consolidated total debt to EBITDA ratio for the 12-month period ending as of the last day of the immediately preceding fiscal quarter, determined in accordance with (i) the applicable pricing levels set forth in the Credit Agreement (the “Applicable Margin”) for London Interbank Offered Rate (“LIBOR”) loans, subject to a “floor” on LIBOR of 1.00%, or a comparable or successor rate to LIBOR approved by Bank of America, plus the applicable LIBOR rate, or (ii) the Applicable Margin for base rate loans plus the highest of (x) the federal funds rate plus 0.5%, (y) the Bank of America prime rate and (z) a daily rate equal to the applicable LIBOR rate plus 1.0%, except that the Third Amendment provided that, for the period from May 6, 2020 until the date on which we deliver a compliance certificate for the fiscal quarter ending June 30, 2021, (i) the interest rate applicable to both the term loan and revolving credit facilities was fixed at LIBOR plus 2.75% per annum and (ii) the per annum rate applicable to unused revolving credit facility commitments was fixed at 0.375% (the “Fixed Margin Rates”). Pursuant to the Fourth Amendment, the application of the Fixed Margin Rates was extended until the date on which we deliver a compliance certificate for the fiscal quarter ending June 30, 2022.
Also pursuant to the Fourth Amendment, (a) we are subject to a liquidity test that requires us to have liquidity of at least $40.0 million at each of March 31, 2021 and June 30, 2021, (b) we are subject to a requirement that, at any time cash on hand exceeds $40.0 million for a period of three consecutive business days, we must repay revolving loans in an amount equal to such excess. Certain other negative and financial covenants were amended, which included restrictions on certain Investments, Permitted Acquisitions, Restricted Payments and Prepayments of Subordinated Debt (each as defined in the Amended Credit Agreement and described in the Fourth Amendment), through the delivery of the compliance certificate for the fiscal quarters ending March 31, 2022 or June 30, 2022, as applicable.
Prior to the Fourth Amendment Effective Date, we were required to maintain a maximum consolidated total debt to EBITDA ratio of between 5.50:1.0 and 3.50:1.0 (with such ratio being waived for the fiscal quarter ended June 30, 2020 and with certain step-ups and step-downs described in, and as calculated in accordance with, the Credit Agreement that were amended under the Fourth Amendment). In addition, we were required to maintain a minimum consolidated fixed charge coverage ratio of not less than 3.50:1.0 (with certain step-ups and step-downs described in the Credit Agreement that were amended under the Fourth Amendment). Under the terms of the Fourth Amendment, the maximum consolidated debt to EBITDA ratio will be waived for the quarters ending March 31, 2021 and June 30, 2021. As of December 31, 2020, the maximum total debt to EBITDA ratio required us to maintain a maximum ratio (as calculated in accordance with the Amended Credit Agreement) of not greater than 4.75:1.0. Starting with the quarter ending September 30, 2021, we will be required to maintain a maximum consolidated total debt to EBITDA ratio (as calculated in accordance with the Fourth Amendment) of not greater than 5.25:1.0 (with certain step-downs described in the Amended Credit Agreement). As of December 31, 2020, we were required to maintain a minimum consolidated fixed coverage ratio of not less than 2.50:1.0 (as calculated in accordance with the Amended Credit Agreement). Beginning with the quarter ending March 31, 2021, we will be required to maintain a minimum consolidated fixed coverage ratio of not less than 1.60:1:0 (with certain step-ups and step-downs described in the Amended Credit Agreement). On March 31, 2021 and June 30, 2021 only, we must maintain $40.0 million of Minimum Liquidity (as described in the Amended Credit Agreement).
We incurred approximately $1.2 million for fees and other customary closing costs in connection with the Amended Credit Agreement.
The forgoing description of the Fourth Amendment is not complete and is qualified in its entirety by reference to the full text of the Fourth Amendment, a copy of which is filed as Exhibit 10.1.4 hereto.
36
PART III
|
|
Information required by this item with respect to our directors and compliance by our directors, executive officers and certain beneficial owners of our common stock with Section 16(a) of the Exchange Act is incorporated by reference to all information under the captions entitled "Board Matters—Nominees for Director," "Board Matters—Nomination Process," "Our Corporate Governance Practices—Codes of Conduct and Ethics," "Board Committees and Meetings," "Executive Officers" and "Delinquent Section 16(a) Reports" (if any) included in our 2021 Proxy Statement.
We have adopted a code of ethics as part of our compliance program. The code of ethics applies to our Chief Executive Officer (Principal Executive Officer), Chief Financial Officer (Principal Financial Officer) and Corporate Controller (Principal Accounting Officer). In addition, we have adopted a code of business conduct that applies to all of our officers and employees. Any amendments to, or waivers from, our code of ethics will be posted on our website www.spplus.com. A copy of these codes of conduct and ethics will be provided to you without charge upon request to investor_relations@spplus.com.
|
|
Information required by this item is incorporated by reference to all information under the caption entitled "Board Committees and Meetings-Committees of the Board-Compensation Committee-Compensation Committee Interlocks and Insider Participation," "Compensation Discussion and Analysis," "Compensation Committee Report," "Executive Compensation," and "Non-Employee Director Compensation" included in our 2021 Proxy Statement.
|
|
Information required by this item is incorporated by reference to all information under the caption entitled "Equity Compensation Plan Information" and "Security Ownership" included in our 2021 Proxy Statement.
Item 13.Certain Relationships and Related Transactions and Director Independence
Information required by this item is incorporated by reference to all information under the caption "Board Matters—Nomination Process—Board Designees," "Our Corporate Governance Practices—Director Independence," "Our Corporate Governance Practices—Related-Party Transaction Policy," and "Transactions with Related Persons and Control Persons" included in our 2021 Proxy Statement.
|
|
Information required by this item is incorporated by reference to all information under the caption "Audit Committee Disclosure—Principal Accounting Fees and Services," and "Audit Committee Disclosure—Procedures for Audit Committee Pre-Approval of Audit and Permissible Non-Audit Services of Independent Registered Public Accounting Firm" included in our 2021 Proxy Statement.
37
PART IV
|
|
(a) Documents filed as part of this report
1. All Financial Statements
Index to Consolidated Financial Statements
Report of Independent Registered Public Accounting Firm (PCAOB ID: 42) |
| |
Report of Independent Registered Public Accounting Firm on Internal Control over Financial Reporting |
| |
Audited Consolidated Financial Statements | ||
Consolidated Balance Sheets as of December 31, |
| |
For the years ended December 31, | ||
| ||
| ||
| ||
| ||
|
2. Financial Statement Schedule
Schedules are omitted since the required information is not present or is not present in amounts sufficient to require submission of the schedule, or because the information required is included in the Consolidated Financial Statements or notes thereto.
28
3. Exhibits
|
|
|
| Incorporated by Reference | ||||
Exhibit Number |
| Description |
| Form |
| Exhibit |
| Filing Date/Period End Date |
|
|
|
|
|
|
|
|
|
2.1 |
|
| 8-K |
| 2.1 |
| October 17, 2018 | |
|
|
|
|
|
|
|
|
|
3.1 |
| Second Amended and Restated Certificate of Incorporation of the Company filed on June 2, 2004. |
| 10-K |
| 3.1 |
| December 31, 2008 |
|
|
|
|
|
|
|
|
|
3.1.1 |
|
| 10-K |
| 3.1.1 |
| December 31, 2008 | |
|
|
|
|
|
|
|
|
|
3.1.2 |
|
| 10-Q |
| 3.1.3 |
| June 30, 2010 | |
|
|
|
|
|
|
|
|
|
3.1.3 |
|
| 10-Q |
| 3.1.4 |
| June 30, 2010 | |
|
|
|
|
|
|
|
|
|
3.1.4 |
|
| 8-K |
| 3.1 |
| December 2, 2013 | |
|
|
|
|
|
|
|
|
|
3.2 |
| Fourth Amended and Restated Bylaws of the Company dated January 1, 2010. |
| 10-Q |
| 3.1 |
| September 30, 2016 |
|
|
|
|
|
|
|
|
|
3.2.1 |
| Amendment to Fourth Amended and Restated Bylaws of the Company dated February 19, 2016. |
| 10-Q |
| 3.1.1 |
| September 30, 2016 |
|
|
|
|
|
|
|
|
|
3.2.2 |
| Amendment to Fourth Amended and Restated Bylaws of the Company dated August 5, 2016. |
| 10-Q |
| 3.1.2 |
| September 30, 2016 |
|
|
|
|
|
|
|
|
|
4.1 |
|
| 10-K |
| 4.1 |
| December 31, 2015 | |
|
|
|
|
|
|
|
|
|
4.2* |
|
|
|
|
|
|
| |
|
|
|
|
|
|
|
|
|
10.1 |
|
| 8-K |
| 10.1 |
| November 30, 2018 | |
|
|
|
|
|
|
|
|
|
10.1.1 |
|
| 10-K |
| 10.1.1 |
| February 27, 2019 | |
|
|
|
|
|
|
|
|
|
10.1.2 |
|
| 10-Q |
| 10.1 |
| October 31, 2019 | |
38
|
|
|
|
|
|
|
|
|
10.1.3 |
|
| 10-Q |
| 10.1 |
| May 11, 2020 | |
|
|
|
|
|
|
|
|
|
10.1.4* |
|
| 10-K |
| 10.1.4 |
| February 22, 2021 | |
|
|
|
|
|
|
|
|
|
10.3+ |
|
| 10-K |
| 10.22.2 |
| December 31, 2012 | |
|
|
|
|
|
|
|
|
|
10.3.1+ |
|
| 8-K |
| 10.3 |
| March 7, 2005 | |
|
|
|
|
|
|
|
|
|
10.3.2 + |
|
| 10-K |
| 10.10.2 |
| December 31, 2012 | |
|
|
|
|
|
|
|
|
|
10.3.3+ |
|
| 10-Q |
| 10.8 |
| June 30, 2012 | |
|
|
|
|
|
|
|
|
|
10.4+ |
|
| 10-Q |
| 10.1 |
| August 1, 2019 | |
|
|
|
|
|
|
|
|
|
10.5*+ |
| Executive Employment Agreement by and between Baggage Airline Guest Services, Inc., and Robert Miles |
| 10-K |
| 10.5 |
| February 22, 2021 |
|
|
|
|
|
|
|
|
|
10.6+ |
|
| 10-Q |
| 10.9 |
| September 30, 2012 | |
|
|
|
|
|
|
|
|
|
10.6.1+ |
|
| 10-K |
| 10.7.1 |
| December 31, 2017 | |
|
|
|
|
|
|
|
|
|
10.6.2+ |
| Second Amendment to Employment Agreement dated February 15, 2017 between the Company and Rob Toy. |
| 10-K |
| 10.12.1 |
| December 31, 2016 |
|
|
|
|
|
|
|
|
|
10.7+ |
|
| 8-K/A |
| 10.1 |
| September 27, 2019 | |
|
|
|
|
|
|
|
|
|
10.8+ |
|
| 10-K |
| 10.8 |
| February 27, 2019 | |
|
|
|
|
|
|
|
|
|
10.9+ |
| Form of Performance Share Agreement between the Company and Recipient. |
| 10-K |
| 4.1 |
| December 31, 2015 |
|
|
|
|
|
|
|
|
|
10.10+ |
| Form of the Company's Restricted Stock Unit Agreement dated as of July 1, 2008. |
| 8-K |
| 10.1 |
| July 2, 2008 |
|
|
|
|
|
|
|
|
|
10.10.1+ |
| First Amendment to Form of the Company's Restricted Stock Unit Agreement. |
| 8-K |
| 10.1 |
| August 6, 2009 |
|
|
|
|
|
|
|
|
|
10.10.2+ |
| Second Amendment to Form of the Company's Restricted Stock Unit Agreement dated May 27, 2011. |
| 8-K |
| 10.1 |
| June 2, 2011 |
|
|
|
|
|
|
|
|
|
10.10.3 |
| Third Amendment to Form of the Company's Restricted Stock Unit Agreement dated March 2, 2017. |
| 10-Q |
| 10.1 |
| May 6, 2019 |
|
|
|
|
|
|
|
|
|
10.11 |
|
| 10-K |
| 10.23 |
| December 31, 2013 | |
|
|
|
|
|
|
|
|
|
10.12 |
|
| 10-K |
| 10.24 |
| December 31, 2013 | |
|
|
|
|
|
|
|
|
|
10.13 |
|
| 10-K |
| 10.30 |
| December 31, 2005 | |
|
|
|
|
|
|
|
|
|
10.14 |
|
| 10-K |
| 10.27 |
| December 31, 2008 | |
|
|
|
|
|
|
|
|
|
10.15 |
|
| 10-K |
| 10.28 |
| December 31, 2008 | |
|
|
|
|
|
|
|
|
|
10.16 |
|
| 10-K |
| 10.29 |
| December 31, 2008 | |
|
|
|
|
|
|
|
|
|
39
| ||||||||
|
| |||||||
| ||||||||
| ||||||||
| ||||||||
|
| |||||||
|
| |||||||
|
| |||||||
|
| |||||||
|
| |||||||
|
| |||||||
|
| |||||||
|
|
|
|
|
|
|
|
None.
40
SIGNATURES
Pursuant to the requirements of Section 13 or 15(d) of the Securities Exchange Act of 1934, the registrant has duly caused this report to be signed on its behalf by the undersigned, thereunto duly authorized.
| |||
|
|
| |
| |||
| |||
| |||
| |||
Pursuant to the requirements of the Securities Exchange Act of 1934, this report has been signed below by the following persons on behalf of the Registrant and in the capacities and on the dates indicated.
|
|
| ||
|
|
| ||
| ||||
|
|
| ||
| ||||
|
|
| ||
| ||||
|
|
| ||
| ||||
|
|
| ||
| ||||
|
|
| ||
| ||||
|
|
| ||
| ||||
41
Report of Independent Registered Public Accounting Firm
To the Stockholders and the Board of Directors of SP Plus Corporation
Opinion on the Financial Statements
We have audited the accompanying consolidated balance sheets of SP Plus Corporation (the Company) as of December 31, 20202023 and 2019,2022, the related consolidated statements of (loss) income, comprehensive (loss) income, stockholders’ equity and cash flows for each of the three years in the period ended December 31, 2020,2023, and the related notes (collectively referred to as the “consolidated financial statements”). In our opinion, the consolidated financial statements present fairly, in all material respects, the financial position of the Company at December 31, 20202023 and 2019,2022, and the results of its operations and its cash flows for each of the three years in the period ended December 31, 2020,2023, in conformity with U.S. generally accepted accounting principles.
We also have audited, in accordance with the standards of the Public Company Accounting Oversight Board (United States) (PCAOB), the Company's internal control over financial reporting as of December 31, 2020,2023, based on criteria established in Internal Control-Integrated Framework issued by the Committee of Sponsoring Organizations of the Treadway Commission (2013 framework) and our report dated February 22, 202127, 2024 expressed an unqualified opinion thereon.
Basis for Opinion
These financial statements are the responsibility of the Company's management. Our responsibility is to express an opinion on the Company’s financial statements based on our audits. We are a public accounting firm registered with the PCAOB and are required to be independent with respect to the Company in accordance with the U.S. federal securities laws and the applicable rules and regulations of the Securities and Exchange Commission and the PCAOB.
We conducted our audits in accordance with the standards of the PCAOB. Those standards require that we plan and perform the audit to obtain reasonable assurance about whether the financial statements are free of material misstatement, whether due to error or fraud. Our audits included performing procedures to assess the risks of material misstatement of the financial statements, whether due to error or fraud, and performing procedures that respond to those risks. Such procedures included examining, on a test basis, evidence regarding the amounts and disclosures in the financial statements. Our audits also included evaluating the accounting principles used and significant estimates made by management, as well as evaluating the overall presentation of the financial statements. We believe that our audits provide a reasonable basis for our opinion.
Critical Audit MattersMatter
The critical audit mattersmatter communicated below are mattersis a matter arising from the current period audit of the financial statements that werewas communicated or required to be communicated to the audit committee and that: (1) relaterelates to accounts or disclosures that are material to the financial statements and (2) involved our especially challenging, subjective or complex judgments. The communication of the critical audit mattersmatter does not alter in any way our opinion on the consolidated financial statements, taken as a whole, and we are not, by communicating the critical audit mattersmatter below, providing a separate opinionsopinion on the critical audit mattersmatter or on the accounts or disclosures to which they relate.it relates.
| ||
|
| |
|
| |
| ||
|
|
42
|
| |
Valuation of insurance reserves for claims incurred but not reported | ||
Description of the Matter | As discussed in Note 1 to the consolidated financial statements, the Company purchases comprehensive liability insurance covering certain claims that occur in its operations, including coverage for general, garage and automobile liabilities. In addition, the Company purchases workers' compensation insurance coverage for all eligible employees and umbrella/excess liability insurance coverage. Under these various insurance policies, the Company is effectively self-insured for all claims up to the Auditing management's actuarial analysis. | |
How We Addressed the Matter in Our Audit | We obtained an understanding, evaluated the design, and tested the operating effectiveness of controls over the Company’s IBNR process, including controls over management’s review of the To test the insurance reserves, we performed audit procedures over the completeness and accuracy of the underlying claims data provided to management’s third-party actuarial advisers, which is the basis used to estimate total ultimate dollar value of claims and the expected amount of IBNR claims. Furthermore, we involved our actuarial specialist to assist in our evaluation of the methodologies and assumptions applied by management’s third-party actuarial advisers in | |
/s/ ERNST & YOUNG LLP
We have served as the Company’s auditor since 1989.
Chicago, Illinois
February 22, 202127, 2024
29
43
Report of Independent Registered Public Accounting Firm
To the Stockholders and the Board of Directors of SP Plus Corporation
Opinion on Internal Control Over Financial Reporting
We have audited SP Plus Corporation’s internal control over financial reporting as of December 31, 2020,2023, based on criteria established in Internal Control—Integrated Framework issued by the Committee of Sponsoring Organizations of the Treadway Commission (2013 framework) (the COSO criteria). In our opinion, SP Plus Corporation (the Company) maintained, in all material respects, effective internal control over financial reporting as of December 31, 2020,2023, based on the COSO criteria.
We also have audited, in accordance with the standards of the Public Company Accounting Oversight Board (United States) (PCAOB), the consolidated balance sheets of the Company as of December 31, 20202023 and 2019,2022, the related consolidated statements of (loss) income, comprehensive (loss) income, stockholders’ equity and cash flows for each of the three years in the period ended December 31, 2020,2023, and the related notes and our report dated February 22, 202127, 2024 expressed an unqualified opinion thereon.
Basis for Opinion
The Company’s management is responsible for maintaining effective internal control over financial reporting and for its assessment of the effectiveness of internal control over financial reporting included in the accompanying Management's Annual Report on Internal Control over Financial Reporting. Our responsibility is to express an opinion on the Company’s internal control over financial reporting based on our audit. We are a public accounting firm registered with the PCAOB and are required to be independent with respect to the Company in accordance with the U.S. federal securities laws and the applicable rules and regulations of the Securities and Exchange Commission and the PCAOB.
We conducted our audit in accordance with the standards of the PCAOB. Those standards require that we plan and perform the audit to obtain reasonable assurance about whether effective internal control over financial reporting was maintained in all material respects.
Our audit included obtaining an understanding of internal control over financial reporting, assessing the risk that a material weakness exists, testing and evaluating the design and operating effectiveness of internal control based on the assessed risk, and performing such other procedures as we considered necessary in the circumstances. We believe that our audit provides a reasonable basis for our opinion.
Definition and Limitations of Internal Control Over Financial Reporting
A company’s internal control over financial reporting is a process designed to provide reasonable assurance regarding the reliability of financial reporting and the preparation of financial statements for external purposes in accordance with generally accepted accounting principles. A company’s internal control over financial reporting includes those policies and procedures that (1) pertain to the maintenance of records that, in reasonable detail, accurately and fairly reflect the transactions and dispositions of the assets of the company; (2) provide reasonable assurance that transactions are recorded as necessary to permit preparation of financial statements in accordance with generally accepted accounting principles, and that receipts and expenditures of the company are being made only in accordance with authorizations of management and directors of the company; and (3) provide reasonable assurance regarding prevention or timely detection of unauthorized acquisition, use, or disposition of the company’s assets that could have a material effect on the financial statements.
Because of its inherent limitations, internal control over financial reporting may not prevent or detect misstatements. Also, projections of any evaluation of effectiveness to future periods are subject to the risk that controls may become inadequate because of changes in conditions, or that the degree of compliance with the policies or procedures may deteriorate.
/s/ ERNST & YOUNG LLP
Chicago, Illinois
February 22, 202127, 2024
30
44
SP Plus Corporation
Consolidated Balance Sheets
|
| December 31, |
|
| December 31, |
| ||||||||||
(millions, except for share and per share data) |
| 2020 |
|
| 2019 |
|
| 2023 |
|
| 2022 |
| ||||
Assets |
|
|
|
|
|
|
|
|
|
|
|
|
|
| ||
Cash and cash equivalents |
| $ | 13.9 |
|
| $ | 24.1 |
|
| $ | 19.1 |
|
| $ | 12.4 |
|
Notes and accounts receivable, net |
|
| 111.2 |
|
|
| 162.3 |
| ||||||||
Accounts receivable, net |
|
| 180.5 |
|
|
| 167.7 |
| ||||||||
Prepaid expenses and other current assets |
|
| 26.8 |
|
|
| 24.7 |
|
|
| 12.6 |
|
|
| 16.7 |
|
Total current assets |
|
| 151.9 |
|
|
| 211.1 |
|
|
| 212.2 |
|
|
| 196.8 |
|
Leasehold improvements, equipment and construction in progress, net |
|
| 53.3 |
|
|
| 47.9 |
| ||||||||
Property and equipment, net |
|
| 68.3 |
|
|
| 60.2 |
| ||||||||
Right-of-use assets |
|
| 235.1 |
|
|
| 431.7 |
|
|
| 179.4 |
|
|
| 166.9 |
|
Goodwill |
|
| 526.6 |
|
|
| 586.0 |
|
|
| 544.6 |
|
|
| 543.2 |
|
Other intangible assets, net |
|
| 63.1 |
|
|
| 152.2 |
|
|
| 59.7 |
|
|
| 68.9 |
|
Equity investments in unconsolidated entities |
|
| 10.1 |
|
|
| 10.2 |
| ||||||||
Deferred taxes |
|
| 63.8 |
|
|
| 10.6 |
| ||||||||
Other noncurrent assets, net |
| 33.8 |
|
| 29.9 |
| ||||||||||
Deferred income taxes |
|
| 42.8 |
|
|
| 44.4 |
| ||||||||
Other noncurrent assets |
|
| 44.9 |
|
|
| 41.0 |
| ||||||||
Total noncurrent assets |
|
| 985.8 |
|
|
| 1,268.5 |
|
|
| 939.7 |
|
|
| 924.6 |
|
Total assets |
| $ | 1,137.7 |
|
| $ | 1,479.6 |
|
| $ | 1,151.9 |
|
| $ | 1,121.4 |
|
Liabilities and stockholders' equity |
|
|
|
|
|
|
|
|
|
|
|
|
|
| ||
Liabilities |
|
|
|
|
|
| ||||||||||
Accounts payable |
| $ | 97.8 |
|
| $ | 115.3 |
|
| $ | 136.6 |
|
| $ | 133.4 |
|
Accrued and other current liabilities |
|
| 112.7 |
|
|
| 121.4 |
|
|
| 128.1 |
|
|
| 137.6 |
|
Short-term lease liabilities |
|
| 82.1 |
|
|
| 115.2 |
|
|
| 56.2 |
|
|
| 60.2 |
|
Current portion of long-term obligations under Senior Credit Facility and other long-term borrowings |
|
| 25.0 |
|
|
| 17.9 |
| ||||||||
Current portion of long-term borrowings |
|
| 16.5 |
|
|
| 12.4 |
| ||||||||
Total current liabilities |
|
| 317.6 |
|
|
| 369.8 |
|
|
| 337.4 |
|
|
| 343.6 |
|
Long-term borrowings, excluding current portion |
| 337.1 |
|
|
| 351.1 |
|
|
| 335.6 |
|
|
| 331.8 |
| |
Long-term lease liabilities |
|
| 243.4 |
|
|
| 327.7 |
|
|
| 158.0 |
|
|
| 158.5 |
|
Other noncurrent liabilities |
|
| 58.2 |
|
|
| 57.1 |
|
|
| 70.2 |
|
|
| 61.8 |
|
Total noncurrent liabilities |
|
| 638.7 |
|
|
| 735.9 |
|
|
| 563.8 |
|
|
| 552.1 |
|
Total liabilities |
| $ | 956.3 |
|
| $ | 1,105.7 |
|
| $ | 901.2 |
|
| $ | 895.7 |
|
Stockholders' equity |
|
|
|
|
|
|
|
|
|
|
|
|
|
| ||
Preferred Stock, par value $0.01 per share; 5,000,000 shares authorized as of December 31, 2020 and 2019, respectively; 0 shares issued or outstanding |
| $ | 0 |
|
| $ | 0 |
| ||||||||
Common stock, par value $0.001 per share; 50,000,000 shares authorized as of December 31, 2020 and 2019; 25,123,128 and 23,088,386 shares issued and outstanding as of December 31, 2020, respectively, and 24,591,127 and 22,950,360 issued and outstanding as of December 31, 2019, respectively |
|
| 0 |
|
|
| 0 |
| ||||||||
Treasury stock at cost, 2,034,742 and 1,640,767 shares at December 31, 2020 and 2019, respectively |
|
| (70.6 | ) |
|
| (55.3 | ) | ||||||||
Preferred Stock, par value $0.01 per share; 5,000,000 shares authorized as of December 31, 2023 and 2022, respectively; no shares issued or outstanding |
| $ | — |
|
| $ | — |
| ||||||||
Common stock, par value $0.001 per share; 50,000,000 shares authorized as of December 31, 2023 and 2022; 23,593,626 and 19,798,884 shares issued and outstanding as of December 31, 2023, respectively, and 23,276,329 and 19,767,287 shares issued and outstanding as of December 31, 2022, respectively |
|
| — |
|
|
| — |
| ||||||||
Treasury stock at cost; 3,794,742 and 3,509,042 shares as of December 31, 2023 and December 31, 2022, respectively |
|
| (130.5 | ) |
|
| (120.0 | ) | ||||||||
Additional paid-in capital |
|
| 261.4 |
|
|
| 262.6 |
|
|
| 277.9 |
|
|
| 274.2 |
|
Accumulated other comprehensive loss |
|
| (4.4 | ) |
|
| (2.7 | ) |
|
| (1.3 | ) |
|
| (1.8 | ) |
(Accumulated deficit) retained earnings |
|
| (3.3 | ) |
|
| 169.5 |
| ||||||||
Retained earnings |
|
| 104.7 |
|
|
| 73.6 |
| ||||||||
Total SP Plus Corporation stockholders' equity |
|
| 183.1 |
|
|
| 374.1 |
|
|
| 250.8 |
|
|
| 226.0 |
|
Noncontrolling interest |
|
| (1.7 | ) |
|
| (0.2 | ) | ||||||||
Noncontrolling interests |
|
| (0.1 | ) |
|
| (0.3 | ) | ||||||||
Total stockholders' equity |
|
| 181.4 |
|
|
| 373.9 |
|
|
| 250.7 |
|
|
| 225.7 |
|
Total liabilities and stockholders' equity |
| $ | 1,137.7 |
|
| $ | 1,479.6 |
|
| $ | 1,151.9 |
|
| $ | 1,121.4 |
|
See Notes to Consolidated Financial Statements.
31
45
SP Plus Corporation
Consolidated Statements of (Loss) Income
|
| Years Ended December 31, |
|
| Years Ended December 31, |
| ||||||||||||||||||
(millions, except for share and per share data) |
| 2020 |
|
| 2019 |
|
| 2018 |
|
| 2023 |
|
| 2022 |
|
| 2021 |
| ||||||
Services revenue |
|
|
|
|
|
|
|
|
|
|
|
|
|
|
|
|
|
|
|
|
| |||
Management type contracts |
|
| 590.0 |
|
|
| 518.7 |
|
|
| 385.9 |
| ||||||||||||
Lease type contracts |
| $ | 189.4 |
|
| $ | 408.9 |
|
| $ | 413.9 |
|
|
| 293.2 |
|
|
| 275.7 |
|
|
| 215.6 |
|
Management type contracts |
|
| 359.6 |
|
|
| 526.0 |
|
|
| 361.5 |
| ||||||||||||
|
|
| 549.0 |
|
|
| 934.9 |
|
|
| 775.4 |
|
|
| 883.2 |
|
|
| 794.4 |
|
|
| 601.5 |
|
Reimbursed management type contract revenue |
|
| 537.9 |
|
|
| 728.8 |
|
|
| 693.0 |
|
|
| 899.1 |
|
|
| 759.1 |
|
|
| 575.7 |
|
Total services revenue |
|
| 1,086.9 |
|
|
| 1,663.7 |
|
|
| 1,468.4 |
|
|
| 1,782.3 |
|
|
| 1,553.5 |
|
|
| 1,177.2 |
|
Cost of services |
|
|
|
|
|
|
|
|
|
|
|
| ||||||||||||
Cost of services (exclusive of depreciation and amortization) |
|
|
|
|
|
|
|
|
| |||||||||||||||
Management type contracts |
|
| 388.6 |
|
|
| 343.2 |
|
|
| 247.5 |
| ||||||||||||
Lease type contracts |
|
| 195.0 |
|
|
| 366.9 |
|
|
| 377.6 |
|
|
| 240.6 |
|
|
| 225.8 |
|
|
| 170.6 |
|
Management type contracts |
|
| 226.5 |
|
|
| 339.9 |
|
|
| 213.8 |
| ||||||||||||
Lease impairment |
|
| — |
|
|
| 3.7 |
|
|
| 3.6 |
| ||||||||||||
|
|
| 421.5 |
|
|
| 706.8 |
|
|
| 591.4 |
|
|
| 629.2 |
|
|
| 572.7 |
|
|
| 421.7 |
|
Reimbursed management type contract expense |
|
| 537.9 |
|
|
| 728.8 |
|
|
| 693.0 |
|
|
| 899.1 |
|
|
| 759.1 |
|
|
| 575.7 |
|
Lease impairment |
|
| 97.1 |
|
|
| 0 |
|
|
| 0 |
| ||||||||||||
Total cost of services |
|
| 1,056.5 |
|
|
| 1,435.6 |
|
|
| 1,284.4 |
| ||||||||||||
Gross profit |
|
|
|
|
|
|
|
|
|
|
|
| ||||||||||||
Lease type contracts |
|
| (5.6 | ) |
|
| 42.0 |
|
|
| 36.3 |
| ||||||||||||
Management type contracts |
|
| 133.1 |
|
|
| 186.1 |
|
|
| 147.7 |
| ||||||||||||
Lease impairment |
|
| (97.1 | ) |
|
| 0 |
|
|
| 0 |
| ||||||||||||
Total gross profit |
|
| 30.4 |
|
|
| 228.1 |
|
|
| 184.0 |
| ||||||||||||
Total cost of services (exclusive of depreciation and amortization) |
|
| 1,528.3 |
|
|
| 1,331.8 |
|
|
| 997.4 |
| ||||||||||||
General and administrative expenses |
|
| 85.4 |
|
|
| 109.0 |
|
|
| 91.0 |
|
|
| 140.4 |
|
|
| 109.1 |
|
|
| 88.2 |
|
Depreciation and amortization |
|
| 29.3 |
|
|
| 29.4 |
|
|
| 17.9 |
|
|
| 36.1 |
|
|
| 29.7 |
|
|
| 25.1 |
|
Impairment of goodwill and intangible assets |
|
| 135.3 |
|
|
| 0 |
|
|
| 0 |
| ||||||||||||
Operating (loss) income |
|
| (219.6 | ) |
|
| 89.7 |
|
|
| 75.1 |
| ||||||||||||
Operating income |
|
| 77.5 |
|
|
| 82.9 |
|
|
| 66.5 |
| ||||||||||||
Other expense (income) |
|
|
|
|
|
|
|
|
|
|
|
|
|
|
|
|
|
|
|
|
| |||
Interest expense |
|
| 21.5 |
|
|
| 18.9 |
|
|
| 9.6 |
|
|
| 29.1 |
|
|
| 17.7 |
|
|
| 21.2 |
|
Interest income |
|
| (0.5 | ) |
|
| (0.3 | ) |
|
| (0.4 | ) |
|
| (0.3 | ) |
|
| (0.4 | ) |
|
| (0.4 | ) |
Other expenses |
|
| 0.1 |
|
|
| 0 |
|
|
| 0 |
| ||||||||||||
Gain on sale of other investments |
|
| (0.3 | ) |
|
| 0 |
|
|
| 0 |
| ||||||||||||
Equity in earnings from investment in unconsolidated entity |
|
| 0 |
|
|
| 0 |
|
|
| (10.1 | ) | ||||||||||||
Total other expenses (income) |
|
| 20.8 |
|
|
| 18.6 |
|
|
| (0.9 | ) | ||||||||||||
(Loss) earnings before income taxes |
|
| (240.4 | ) |
|
| 71.1 |
|
|
| 76.0 |
| ||||||||||||
Income tax (benefit) expense |
|
| (67.5 | ) |
|
| 19.4 |
|
|
| 19.6 |
| ||||||||||||
Net (loss) income |
|
| (172.9 | ) |
|
| 51.7 |
|
|
| 56.4 |
| ||||||||||||
Less: Net (loss) income attributable to noncontrolling interest |
|
| (0.1 | ) |
|
| 2.9 |
|
|
| 3.2 |
| ||||||||||||
Net (loss) income attributable to SP Plus Corporation |
| $ | (172.8 | ) |
| $ | 48.8 |
|
| $ | 53.2 |
| ||||||||||||
Other income |
|
| — |
|
|
| — |
|
|
| (0.1 | ) | ||||||||||||
Total other expenses |
|
| 28.8 |
|
|
| 17.3 |
|
|
| 20.7 |
| ||||||||||||
Earnings before income taxes |
|
| 48.7 |
|
|
| 65.6 |
|
|
| 45.8 |
| ||||||||||||
Income tax expense |
|
| 14.0 |
|
|
| 17.5 |
|
|
| 10.5 |
| ||||||||||||
Net income |
|
| 34.7 |
|
|
| 48.1 |
|
|
| 35.3 |
| ||||||||||||
Less: Net income attributable to noncontrolling interests |
|
| 3.6 |
|
|
| 2.9 |
|
|
| 3.6 |
| ||||||||||||
Net income attributable to SP Plus Corporation |
| $ | 31.1 |
|
| $ | 45.2 |
|
| $ | 31.7 |
| ||||||||||||
Common stock data |
|
|
|
|
|
|
|
|
|
|
|
|
|
|
|
|
|
|
|
|
| |||
Net (loss) income per common share |
|
|
|
|
|
|
|
|
|
|
|
| ||||||||||||
Net income per common share |
|
|
|
|
|
|
|
|
| |||||||||||||||
Basic |
| $ | (8.21 | ) |
| $ | 2.21 |
|
| $ | 2.38 |
|
| $ | 1.58 |
|
| $ | 2.17 |
|
| $ | 1.50 |
|
Diluted |
| $ | (8.21 | ) |
| $ | 2.20 |
|
| $ | 2.35 |
|
| $ | 1.57 |
|
| $ | 2.15 |
|
| $ | 1.48 |
|
Weighted average shares outstanding |
|
|
|
|
|
|
|
|
|
|
|
|
|
|
|
|
|
|
|
|
| |||
Basic |
|
| 21,056,061 |
|
|
| 22,080,025 |
|
|
| 22,394,542 |
|
|
| 19,670,918 |
|
|
| 20,809,363 |
|
|
| 21,166,323 |
|
Diluted |
|
| 21,056,061 |
|
|
| 22,208,032 |
|
|
| 22,607,223 |
|
|
| 19,781,388 |
|
|
| 21,007,068 |
|
|
| 21,379,983 |
|
See Notes to Consolidated Financial Statements.
32
46
SP Plus Corporation
Consolidated Statements of Comprehensive (Loss) Income
|
| Years Ended December 31, |
| |||||||||
(millions) |
| 2020 |
|
| 2019 |
|
| 2018 |
| |||
Net (loss) income |
| $ | (172.9 | ) |
| $ | 51.7 |
|
| $ | 56.4 |
|
Change in fair value of interest rate collars |
|
| (1.8 | ) |
|
| (0.4 | ) |
|
| — |
|
Foreign currency translation gain (loss) |
|
| 0.1 |
|
|
| 0.1 |
|
|
| (0.6 | ) |
Comprehensive (loss) income |
|
| (174.6 | ) |
|
| 51.4 |
|
|
| 55.8 |
|
Less: Comprehensive (loss) income attributable to noncontrolling interest |
|
| (0.1 | ) |
|
| 2.9 |
|
|
| 3.2 |
|
Comprehensive (loss) income attributable to SP Plus Corporation |
| $ | (174.5 | ) |
| $ | 48.5 |
|
| $ | 52.6 |
|
| Years Ended December 31, |
| ||||||||||
(millions) |
| 2023 |
|
| 2022 |
|
| 2021 |
| |||
Net income |
| $ | 34.7 |
|
| $ | 48.1 |
|
| $ | 35.3 |
|
Reclassification of de-designated interest rate collars |
|
| — |
|
|
| 0.5 |
|
|
| 1.7 |
|
Foreign currency translation gain (loss) |
|
| 0.5 |
|
|
| 0.5 |
|
|
| (0.1 | ) |
Comprehensive income |
|
| 35.2 |
|
|
| 49.1 |
|
|
| 36.9 |
|
Less: Comprehensive income attributable to noncontrolling interests |
|
| 3.6 |
|
|
| 2.9 |
|
|
| 3.6 |
|
Comprehensive income attributable to SP Plus Corporation |
| $ | 31.6 |
|
| $ | 46.2 |
|
| $ | 33.3 |
|
See Notes to Consolidated Financial Statements
33
47
SP Plus Corporation
Consolidated Statements of Stockholders' Equity
|
| Common Stock |
|
|
|
|
|
|
|
|
|
|
|
|
|
|
|
|
|
|
|
|
|
|
|
|
|
| Common Stock |
|
|
|
|
|
|
|
|
|
|
|
|
|
|
|
|
|
|
| ||||||||||||||||
|
|
|
|
|
|
|
|
|
|
|
|
|
| Accumulated |
|
| Retained |
|
|
|
|
|
|
|
|
|
|
|
|
|
| Number |
|
|
|
|
|
|
| Accumulated |
|
| Retained |
|
|
|
|
|
|
|
|
|
| |||||||||||
|
| Number |
|
|
|
|
|
| Additional |
|
| Other |
|
| Earnings |
|
|
|
|
|
|
|
|
|
|
|
|
|
| of |
|
|
|
|
| Additional |
|
| Other |
|
| Earnings |
|
|
|
|
|
|
|
|
|
| ||||||||||||
|
| of |
|
| Par |
|
| Paid-In |
|
| Comprehensive |
|
| (Accumulated |
|
| Treasury |
|
| Noncontrolling |
|
|
|
|
|
| Shares |
|
| Par |
|
| Paid-In |
|
| Comprehensive |
|
| (Accumulated |
|
| Treasury |
|
| Noncontrolling |
|
|
|
| |||||||||||||||
(millions, except share data) |
| Shares |
|
| Value |
|
| Capital |
|
| Loss |
|
| Deficit) |
|
| Stock |
|
| Interest |
|
| Total |
|
| Issued |
|
| Value |
|
| Capital |
|
| Loss |
|
| Deficit) |
|
| Stock |
|
| Interests |
|
| Total |
| ||||||||||||||||
Balance at December 31, 2017 |
|
| 22,542,672 |
|
| $ | — |
|
| $ | 254.6 |
|
| $ | (1.2 | ) |
| $ | 67.0 |
|
| $ | (7.5 | ) |
| $ | 0.2 |
|
| $ | 313.1 |
| ||||||||||||||||||||||||||||||||
Adoption of ASU No. 2018-02 |
|
| — |
|
|
| — |
|
|
| — |
|
|
| (0.6 | ) |
|
| 0.6 |
|
|
| — |
|
|
| — |
|
|
| 0 |
| ||||||||||||||||||||||||||||||||
Balance at January 1, 2018 |
|
| 22,542,672 |
|
| $ | — |
|
| $ | 254.6 |
|
| $ | (1.8 | ) |
| $ | 67.6 |
|
| $ | (7.5 | ) |
| $ | 0.2 |
|
| $ | 313.1 |
| ||||||||||||||||||||||||||||||||
Balance at January 1, 2021 |
|
| 23,088,386 |
|
| $ | — |
|
| $ | 261.4 |
|
| $ | (4.4 | ) |
| $ | (3.3 | ) |
| $ | (70.6 | ) |
| $ | (1.7 | ) |
| $ | 181.4 |
| ||||||||||||||||||||||||||||||||
Net income |
|
| — |
|
|
| — |
|
|
| — |
|
|
| — |
|
|
| 31.7 |
|
|
| — |
|
|
| 3.6 |
|
|
| 35.3 |
| ||||||||||||||||||||||||||||||||
Foreign currency translation |
|
| — |
|
|
| — |
|
|
| — |
|
|
| (0.1 | ) |
|
| — |
|
|
| — |
|
|
| — |
|
|
| (0.1 | ) | ||||||||||||||||||||||||||||||||
Reclassification of de-designated interest rate collars |
|
| — |
|
|
| — |
|
|
| — |
|
|
| 1.7 |
|
|
| — |
|
|
| — |
|
|
| — |
|
|
| 1.7 |
| ||||||||||||||||||||||||||||||||
Issuance of stock grants |
|
| 13,420 |
|
|
| — |
|
|
| 0.5 |
|
|
| — |
|
|
| — |
|
|
| — |
|
|
| — |
|
|
| 0.5 |
| ||||||||||||||||||||||||||||||||
Issuance of restricted stock units |
|
| 41,517 |
|
|
| — |
|
|
| — |
|
|
| — |
|
|
| — |
|
|
| — |
|
|
| — |
|
|
| — |
| ||||||||||||||||||||||||||||||||
Issuance of performance stock units |
|
| 81,136 |
|
|
| — |
|
|
| — |
|
|
| — |
|
|
| — |
|
|
| — |
|
|
| — |
|
|
| — |
| ||||||||||||||||||||||||||||||||
Non-cash stock-based compensation |
|
| — |
|
|
| — |
|
|
| 5.6 |
|
|
| — |
|
|
| — |
|
|
| — |
|
|
| — |
|
|
| 5.6 |
| ||||||||||||||||||||||||||||||||
Distributions to noncontrolling interests |
|
| — |
|
|
| — |
|
|
| — |
|
|
| — |
|
|
| — |
|
|
| — |
|
|
| (2.3 | ) |
|
| (2.3 | ) | ||||||||||||||||||||||||||||||||
Balance at December 31, 2021 |
|
| 23,224,459 |
|
| $ | — |
|
| $ | 267.5 |
|
| $ | (2.8 | ) |
| $ | 28.4 |
|
| $ | (70.6 | ) |
| $ | (0.4 | ) |
| $ | 222.1 |
| ||||||||||||||||||||||||||||||||
Net income |
|
| — |
|
|
| — |
|
|
| — |
|
|
| — |
|
|
| 45.2 |
|
|
| — |
|
|
| 2.9 |
|
|
| 48.1 |
| ||||||||||||||||||||||||||||||||
Foreign currency translation |
|
| — |
|
|
| — |
|
|
| — |
|
|
| 0.5 |
|
|
| — |
|
|
| — |
|
|
| — |
|
|
| 0.5 |
| ||||||||||||||||||||||||||||||||
Reclassification of de-designated interest rate collars |
|
| — |
|
|
| — |
|
|
| — |
|
|
| 0.5 |
|
|
| — |
|
|
| — |
|
|
| — |
|
|
| 0.5 |
| ||||||||||||||||||||||||||||||||
Issuance of stock grants |
|
| 14,635 |
|
|
| — |
|
|
| 0.4 |
|
|
| — |
|
|
| — |
|
|
| — |
|
|
| — |
|
|
| 0.4 |
| ||||||||||||||||||||||||||||||||
Issuance of restricted stock units |
|
| 37,235 |
|
|
| — |
|
|
| — |
|
|
| — |
|
|
| — |
|
|
| — |
|
|
| — |
|
|
| — |
| ||||||||||||||||||||||||||||||||
Non-cash stock-based compensation |
|
| — |
|
|
| — |
|
|
| 8.6 |
|
|
| — |
|
|
| — |
|
|
| — |
|
|
| — |
|
|
| 8.6 |
| ||||||||||||||||||||||||||||||||
Repurchases of common stock |
|
| — |
|
|
| — |
|
|
| — |
|
|
| — |
|
|
| — |
|
|
| (49.4 | ) |
|
| — |
|
|
| (49.4 | ) | ||||||||||||||||||||||||||||||||
Noncontrolling interests buyout |
|
| — |
|
|
| — |
|
|
| (2.3 | ) |
|
| — |
|
|
| — |
|
|
| — |
|
|
| — |
|
|
| (2.3 | ) | ||||||||||||||||||||||||||||||||
Distributions to noncontrolling interests |
|
| — |
|
|
| — |
|
|
| — |
|
|
| — |
|
|
| — |
|
|
| — |
|
|
| (2.8 | ) |
|
| (2.8 | ) | ||||||||||||||||||||||||||||||||
Balance at December 31, 2022 |
|
| 23,276,329 |
|
| $ | — |
|
| $ | 274.2 |
|
| $ | (1.8 | ) |
| $ | 73.6 |
|
| $ | (120.0 | ) |
| $ | (0.3 | ) |
| $ | 225.7 |
| ||||||||||||||||||||||||||||||||
Net income |
|
| — |
|
|
| — |
|
|
| — |
|
|
| — |
|
|
| 53.2 |
|
|
| — |
|
|
| 3.2 |
|
|
| 56.4 |
|
|
| — |
|
|
| — |
|
|
| — |
|
|
| — |
|
|
| 31.1 |
|
|
| — |
|
|
| 3.6 |
|
|
| 34.7 |
|
Foreign currency translation |
|
| — |
|
|
| — |
|
|
| — |
|
|
| (0.6 | ) |
|
| — |
|
|
| — |
|
|
| — |
|
|
| (0.6 | ) |
|
| — |
|
|
| — |
|
|
| — |
|
|
| 0.5 |
|
|
| — |
|
|
| — |
|
|
| — |
|
|
| 0.5 |
|
Issuance of stock grants |
|
| 20,757 |
|
|
| — |
|
|
| 0.7 |
|
|
| — |
|
|
| — |
|
|
| — |
|
|
| — |
|
|
| 0.7 |
|
|
| 18,660 |
|
|
| — |
|
|
| 0.6 |
|
|
| — |
|
|
| — |
|
|
| — |
|
|
| — |
|
|
| 0.6 |
|
Issuance of restricted stock units |
|
| 161,495 |
|
|
| — |
|
|
| — |
|
|
| — |
|
|
| — |
|
|
| — |
|
|
| — |
|
|
| 0 |
|
|
| 242,909 |
|
|
| — |
|
|
| — |
|
|
| — |
|
|
| — |
|
|
| — |
|
|
| — |
|
|
| — |
|
Issuance of performance stock units |
|
| 59,052 |
|
|
| — |
|
|
| — |
|
|
| — |
|
|
| — |
|
|
| — |
|
|
| — |
|
|
| 0 |
|
|
| 55,728 |
|
|
| — |
|
|
| — |
|
|
| — |
|
|
| — |
|
|
| — |
|
|
| — |
|
|
| — |
|
Non-cash stock-based compensation |
|
| — |
|
|
| — |
|
|
| 2.4 |
|
|
| — |
|
|
| — |
|
|
| — |
|
|
| — |
|
|
| 2.4 |
| ||||||||||||||||||||||||||||||||
Distributions to noncontrolling interest |
|
| — |
|
|
| — |
|
|
| — |
|
|
| — |
|
|
| — |
|
|
| — |
|
|
| (3.3 | ) |
|
| (3.3 | ) | ||||||||||||||||||||||||||||||||
Balance at December 31, 2018 |
|
| 22,783,976 |
|
| $ | — |
|
| $ | 257.7 |
|
| $ | (2.4 | ) |
| $ | 120.7 |
|
| $ | (7.5 | ) |
| $ | 0.1 |
|
| $ | 368.6 |
| ||||||||||||||||||||||||||||||||
Net income |
|
| — |
|
|
| — |
|
|
| — |
|
|
| — |
|
|
| 48.8 |
|
|
| — |
|
|
| 2.9 |
|
|
| 51.7 |
| ||||||||||||||||||||||||||||||||
Foreign currency translation |
|
| — |
|
|
| — |
|
|
| — |
|
|
| 0.1 |
|
|
| — |
|
|
| — |
|
|
| — |
|
|
| 0.1 |
| ||||||||||||||||||||||||||||||||
Change in fair value of interest rate collars |
|
| — |
|
|
| — |
|
|
| — |
|
|
| (0.4 | ) |
|
| — |
|
|
| — |
|
|
| — |
|
|
| (0.4 | ) | ||||||||||||||||||||||||||||||||
Issuance of stock grants |
|
| 14,076 |
|
|
| — |
|
|
| 0.8 |
|
|
| — |
|
|
| — |
|
|
| — |
|
|
| — |
|
|
| 0.8 |
| ||||||||||||||||||||||||||||||||
Issuance of restricted stock units |
|
| 90,214 |
|
|
| — |
|
|
| — |
|
|
| — |
|
|
| — |
|
|
| — |
|
|
| — |
|
|
| 0 |
| ||||||||||||||||||||||||||||||||
Issuance of performance stock units |
|
| 62,094 |
|
|
| — |
|
|
| — |
|
|
| — |
|
|
| — |
|
|
| — |
|
|
| — |
|
|
| 0 |
| ||||||||||||||||||||||||||||||||
Payments of withholding taxes on share-based compensation |
|
| — |
|
|
| — |
|
|
| (5.8 | ) |
|
| — |
|
|
| — |
|
|
| — |
|
|
| — |
|
|
| (5.8 | ) | ||||||||||||||||||||||||||||||||
Non-cash stock-based compensation |
|
| — |
|
|
| — |
|
|
| 4.1 |
|
|
| — |
|
|
| — |
|
|
| — |
|
|
| — |
|
|
| 4.1 |
|
|
| — |
|
|
| — |
|
|
| 9.8 |
|
|
| — |
|
|
| — |
|
|
| — |
|
|
| — |
|
|
| 9.8 |
|
Repurchases of common stock |
|
| — |
|
|
| — |
|
|
| — |
|
|
| — |
|
|
| — |
|
|
| (47.9 | ) |
|
| — |
|
|
| (47.8 | ) |
|
| — |
|
|
| — |
|
|
| — |
|
|
| — |
|
|
| — |
|
|
| (10.5 | ) |
|
| — |
|
|
| (10.5 | ) |
Distributions to noncontrolling interest |
|
| — |
|
|
| — |
|
|
| — |
|
|
| — |
|
|
| — |
|
|
| — |
|
|
| (3.2 | ) |
|
| (3.2 | ) | ||||||||||||||||||||||||||||||||
Balance at December 31, 2019 |
|
| 22,950,360 |
|
| $ | — |
|
| $ | 262.6 |
|
| $ | (2.7 | ) |
| $ | 169.5 |
|
| $ | (55.3 | ) |
| $ | (0.2 | ) |
| $ | 373.9 |
| ||||||||||||||||||||||||||||||||
Net loss |
|
| — |
|
|
| — |
|
|
| — |
|
|
| — |
|
|
| (172.8 | ) |
|
| — |
|
|
| (0.1 | ) |
|
| (172.9 | ) | ||||||||||||||||||||||||||||||||
Foreign currency translation |
|
| — |
|
|
| — |
|
|
| — |
|
|
| 0.1 |
|
|
| — |
|
|
| — |
|
|
| — |
|
|
| 0.1 |
| ||||||||||||||||||||||||||||||||
Change in fair value of interest rate collars |
|
| — |
|
|
| — |
|
|
| — |
|
|
| (1.8 | ) |
|
| — |
|
|
| — |
|
|
| — |
|
|
| (1.8 | ) | ||||||||||||||||||||||||||||||||
Issuance of stock grants |
|
| 25,066 |
|
|
| — |
|
|
| 0.5 |
|
|
| — |
|
|
| — |
|
|
| — |
|
|
| — |
|
|
| 0.5 |
| ||||||||||||||||||||||||||||||||
Issuance of restricted stock units |
|
| 66,259 |
|
|
| — |
|
|
| — |
|
|
| — |
|
|
| — |
|
|
| — |
|
|
| — |
|
|
| 0 |
| ||||||||||||||||||||||||||||||||
Issuance of performance stock units |
|
| 46,701 |
|
|
| — |
|
|
| — |
|
|
| — |
|
|
| — |
|
|
| — |
|
|
| — |
|
|
| 0 |
| ||||||||||||||||||||||||||||||||
Noncontrolling interest buyout |
|
| — |
|
|
| — |
|
|
| (1.7 | ) |
|
| — |
|
|
| — |
|
|
| — |
|
|
| — |
|
|
| (1.7 | ) | ||||||||||||||||||||||||||||||||
Repurchases of common stock |
|
| — |
|
|
| — |
|
|
| — |
|
|
| — |
|
|
| — |
|
|
| (15.3 | ) |
|
| — |
|
|
| (15.3 | ) | ||||||||||||||||||||||||||||||||
Distributions to noncontrolling interest |
|
| — |
|
|
| — |
|
|
| — |
|
|
| — |
|
|
| — |
|
|
| — |
|
|
| (1.4 | ) |
|
| (1.4 | ) | ||||||||||||||||||||||||||||||||
Balance at December 31, 2020 |
|
| 23,088,386 |
|
| $ | — |
|
| $ | 261.4 |
|
| $ | (4.4 | ) |
| $ | (3.3 | ) |
| $ | (70.6 | ) |
| $ | (1.7 | ) |
| $ | 181.4 |
| ||||||||||||||||||||||||||||||||
Noncontrolling interests buyout |
|
| — |
|
|
| — |
|
|
| (0.9 | ) |
|
| — |
|
|
| — |
|
|
| — |
|
|
| — |
|
|
| (0.9 | ) | ||||||||||||||||||||||||||||||||
Distributions to noncontrolling interests |
|
| — |
|
|
| — |
|
|
| — |
|
|
| — |
|
|
| — |
|
|
| — |
|
|
| (3.4 | ) |
|
| (3.4 | ) | ||||||||||||||||||||||||||||||||
Balance at December 31, 2023 |
|
| 23,593,626 |
|
| $ | — |
|
| $ | 277.9 |
|
| $ | (1.3 | ) |
| $ | 104.7 |
|
| $ | (130.5 | ) |
| $ | (0.1 | ) |
| $ | 250.7 |
| ||||||||||||||||||||||||||||||||
Note: Amounts may not foot due to rounding.
See Notes to Consolidated Financial Statements.
34
48
SP Plus Corporation
Consolidated Statements of Cash Flows
|
| Year Ended December 31, |
|
| Year Ended December 31, |
| ||||||||||||||||||
(millions) |
| 2020 |
|
| 2019 |
|
| 2018 |
|
| 2023 |
|
| 2022 |
|
| 2021 |
| ||||||
Operating activities |
|
|
|
|
|
|
|
|
|
|
|
|
|
|
|
|
|
|
|
|
| |||
Net (loss) income |
| $ | (172.9 | ) |
| $ | 51.7 |
|
| $ | 56.4 |
| ||||||||||||
Adjustments to reconcile net (loss) income to net cash provided by operating activities: |
|
|
|
|
|
|
|
|
|
|
|
| ||||||||||||
Impairments |
|
| 234.0 |
|
|
| 0 |
|
|
| 0 |
| ||||||||||||
Net income |
| $ | 34.7 |
|
| $ | 48.1 |
|
| $ | 35.3 |
| ||||||||||||
Adjustments to reconcile net income to net cash provided by operating activities: |
|
|
|
|
|
|
|
|
| |||||||||||||||
Impairment |
|
| — |
|
|
| 3.7 |
|
|
| 3.6 |
| ||||||||||||
Depreciation and amortization |
|
| 29.3 |
|
|
| 29.3 |
|
|
| 18.8 |
|
|
| 36.1 |
|
|
| 29.7 |
|
|
| 25.1 |
|
Non-cash stock-based compensation |
|
| 0.5 |
|
|
| 4.9 |
|
|
| 3.1 |
|
|
| 10.4 |
|
|
| 9.0 |
|
|
| 6.1 |
|
Provisions for credit losses on accounts receivable |
|
| 6.4 |
|
|
| 1.1 |
|
|
| 1.5 |
|
|
| 1.7 |
|
|
| 0.5 |
|
|
| 0.8 |
|
Deferred income taxes |
|
| (52.5 | ) |
|
| 4.2 |
|
|
| 1.3 |
|
|
| 1.4 |
|
|
| 7.6 |
|
|
| 12.6 |
|
Gain on sale of equity method investment |
|
| 0 |
|
|
| 0 |
|
|
| (10.1 | ) | ||||||||||||
Other |
|
| 2.0 |
|
|
| 0.5 |
|
|
| (0.3 | ) |
|
| (3.2 | ) |
|
| 1.3 |
|
|
| 0.2 |
|
Changes in operating assets and liabilities |
|
|
|
|
|
|
|
|
|
|
|
|
|
|
|
|
|
|
|
|
| |||
Notes and accounts receivable |
|
| 44.6 |
|
|
| (12.7 | ) |
|
| (16.7 | ) | ||||||||||||
Prepaid and other current assets |
|
| (2.1 | ) |
|
| (6.9 | ) |
|
| 0.1 |
| ||||||||||||
Accounts receivable |
|
| (14.6 | ) |
|
| (27.9 | ) |
|
| (29.2 | ) | ||||||||||||
Prepaid expenses and other current assets |
|
| 4.1 |
|
|
| 15.7 |
|
|
| (5.4 | ) | ||||||||||||
Accounts payable |
|
| (17.5 | ) |
|
| 5.2 |
|
|
| 0.8 |
|
|
| 3.0 |
|
|
| 14.7 |
|
|
| 20.7 |
|
Accrued liabilities and other |
|
| (31.6 | ) |
|
| (1.3 | ) |
|
| 16.0 |
|
|
| (17.8 | ) |
|
| (9.1 | ) |
|
| (16.4 | ) |
Net cash provided by operating activities |
|
| 40.2 |
|
|
| 76.0 |
|
|
| 70.9 |
|
|
| 55.8 |
|
|
| 93.3 |
|
|
| 53.4 |
|
Investing activities |
|
|
|
|
|
|
|
|
|
|
|
|
|
|
|
|
|
|
|
|
| |||
Purchase of leasehold improvements and equipment |
|
| (8.4 | ) |
|
| (10.2 | ) |
|
| (8.9 | ) | ||||||||||||
Cost of contracts purchased |
|
| (2.6 | ) |
|
| (2.6 | ) |
|
| (1.1 | ) | ||||||||||||
Proceeds from sale of other investments and equipment |
|
| 1.2 |
|
|
| 0.3 |
|
|
| 0.2 |
| ||||||||||||
Proceeds from sale of equity method investment |
|
| 0 |
|
|
| 0 |
|
|
| 19.3 |
| ||||||||||||
Noncontrolling interest buyout |
|
| (1.7 | ) |
|
| 0 |
|
|
| 0 |
| ||||||||||||
Acquisition of business, net of cash acquired |
|
| 0 |
|
|
| 0 |
|
|
| (277.9 | ) | ||||||||||||
Purchases of property and equipment |
|
| (21.4 | ) |
|
| (21.9 | ) |
|
| (9.6 | ) | ||||||||||||
Acquisitions of businesses, net of cash acquired |
|
| (3.1 | ) |
|
| (30.5 | ) |
|
| — |
| ||||||||||||
Acquisition of other intangible assets |
|
| — |
|
|
| (1.8 | ) |
|
| — |
| ||||||||||||
Proceeds from sale of property and equipment |
|
| 0.3 |
|
|
| 0.2 |
|
|
| 0.5 |
| ||||||||||||
Noncontrolling interests buyout |
|
| (2.4 | ) |
|
| — |
|
|
| — |
| ||||||||||||
Net cash used in investing activities |
|
| (11.5 | ) |
|
| (12.5 | ) |
|
| (268.4 | ) |
|
| (26.6 | ) |
|
| (54.0 | ) |
|
| (9.1 | ) |
Financing activities |
|
|
|
|
|
|
|
|
|
|
|
|
|
|
|
|
|
|
|
|
| |||
Proceeds from credit facility revolver |
|
| 484.1 |
|
|
| 455.6 |
|
|
| 333.5 |
|
|
| 452.5 |
|
|
| 570.0 |
|
|
| 371.6 |
|
Payments on credit facility revolver |
|
| (488.4 | ) |
|
| (470.6 | ) |
|
| (186.3 | ) |
|
| (441.7 | ) |
|
| (559.0 | ) |
|
| (387.2 | ) |
Proceeds from credit facility term loan |
|
| 0 |
|
|
| 0 |
|
|
| 225.0 |
|
|
| — |
|
|
| 17.2 |
|
|
| — |
|
Payments on credit facility term loan |
|
| (11.3 | ) |
|
| (11.3 | ) |
|
| (150.0 | ) |
|
| (5.0 | ) |
|
| (6.7 | ) |
|
| (15.5 | ) |
Payments of debt issuance costs |
|
| (1.7 | ) |
|
| 0 |
|
|
| (3.2 | ) |
|
| — |
|
|
| (2.5 | ) |
|
| (1.3 | ) |
Payments on other long-term borrowings |
|
| (5.0 | ) |
|
| (2.3 | ) |
|
| (0.5 | ) |
|
| (7.8 | ) |
|
| (9.9 | ) |
|
| (7.7 | ) |
Distributions to noncontrolling interest |
|
| (1.4 | ) |
|
| (3.2 | ) |
|
| (3.3 | ) | ||||||||||||
Payments of withholding taxes on share-based compensation |
|
| (5.8 | ) |
|
| — |
|
|
| — |
| ||||||||||||
Distributions to noncontrolling interests |
|
| (3.4 | ) |
|
| (2.8 | ) |
|
| (2.3 | ) | ||||||||||||
Repurchases of common stock |
|
| (15.3 | ) |
|
| (47.6 | ) |
|
| 0 |
|
|
| (11.1 | ) |
|
| (48.7 | ) |
|
| — |
|
Net cash (used in) provided by financing activities |
|
| (39.0 | ) |
|
| (79.4 | ) |
|
| 215.2 |
| ||||||||||||
Net cash used in financing activities |
|
| (22.3 | ) |
|
| (42.4 | ) |
|
| (42.4 | ) | ||||||||||||
Effect of exchange rate changes on cash and cash equivalents |
|
| 0.1 |
|
|
| 0.1 |
|
|
| (0.6 | ) |
|
| (0.2 | ) |
|
| (0.2 | ) |
|
| (0.1 | ) |
(Decrease) increase in cash and cash equivalents |
|
| (10.2 | ) |
|
| (15.8 | ) |
|
| 17.1 |
| ||||||||||||
Increase (decrease) in cash and cash equivalents |
|
| 6.7 |
|
|
| (3.3 | ) |
|
| 1.8 |
| ||||||||||||
Cash and cash equivalents at beginning of year |
|
| 24.1 |
|
|
| 39.9 |
|
|
| 22.8 |
|
|
| 12.4 |
|
|
| 15.7 |
|
|
| 13.9 |
|
Cash and cash equivalents at end of year |
| $ | 13.9 |
|
| $ | 24.1 |
|
| $ | 39.9 |
|
| $ | 19.1 |
|
| $ | 12.4 |
|
| $ | 15.7 |
|
Supplemental Disclosures |
|
|
|
|
|
|
|
|
|
|
|
| ||||||||||||
Cash paid during the period for |
|
|
|
|
|
|
|
|
|
|
|
| ||||||||||||
Supplemental disclosures |
|
|
|
|
|
|
|
|
| |||||||||||||||
Cash paid (received) during the period for: |
|
|
|
|
|
|
|
|
| |||||||||||||||
Interest |
| $ | 18.8 |
|
| $ | 17.9 |
|
| $ | 8.5 |
|
| $ | 27.7 |
|
| $ | 16.9 |
|
| $ | 19.4 |
|
Income taxes |
| $ | 2.4 |
|
| $ | 15.3 |
|
| $ | 15.3 |
| ||||||||||||
Income taxes, net |
| $ | 10.0 |
|
| $ | (7.1 | ) |
| $ | 0.5 |
| ||||||||||||
See Notes to Consolidated Financial Statements
35
49
SP Plus Corporation
Notes to Consolidated Financial Statements
(millions, except share and per share data)
1. Significant Accounting Policies and Practices
|
|
The Company
SP Plus Corporation (the "Company") facilitatesdevelops and integrates technology with operations management and support to deliver mobility solutions that enable the efficient and time-sensitive movement of people, vehicles and personal belongings with the goal of enhancing the consumer experience while improving bottom line results for the Company’s clients.travel belongings. The Company provides professional parking management, ground transportation, remote baggage check-inis committed to providing solutions that make every moment matter for a world on the go while meeting the objectives of the Company's diverse client base in North America and handling, facility maintenance, security, event logistics, and other technology-driven mobility solutions toEurope, which includes aviation, commercial, hospitality healthcare and government clients across North America.institutional clients. The Company typically enters into contractual arrangements with property owners or managers as opposed to owning facilities.
On October 4, 2023, the Company entered into an Agreement and Plan of Merger (the "Merger Agreement") by and among the Company, Metropolis Technologies, Inc. ("Metropolis") and Schwinger Merger Sub Inc., a direct, wholly owned subsidiary of Metropolis (“Merger Sub”), in an all-cash transaction with a total enterprise value of approximately $1.5 billion. Pursuant to the Merger Agreement, subject to terms and conditions therein, Merger Sub will acquire all of the outstanding shares of the Company’s common stock for $54.00 per share, without interest, and merge with the Company, with the Company surviving as a wholly owned subsidiary of Metropolis. The Company’s stockholders approved the transaction on February 9, 2023. The transaction is expected to close in 2024, subject to other customary closing conditions, including the receipt of regulatory approvals. Upon completion of the transaction, the Company’s shares will no longer trade on the Nasdaq Global Select Market. As of December 31, 2023, the Company had incurred $9.7 million in expenses related to the proposed merger with Metropolis.
Principles of Consolidation
The Consolidated Financial Statements include the accounts of the Company, its wholly owned subsidiaries, and Variable Interest Entities ("VIEs") in which the Company is the primary beneficiary. The Company is the primary beneficiary of a VIE when the Company has the power to direct activities that most significantly affect the economic performance of the VIE. If the Company is not the primary beneficiary in a VIE and has significant influence, the Company accounts for the investment in the VIE as an equity method investment in accordance with applicable accounting principles generally accepted in the United States (“U.S. GAAP”). As of December 31, 2023 and 2022, assets related to consolidated VIEs were $51.4 million and $57.1 million, respectively, which were primarily related to right-of-use (“ROU”) assets and property and equipment, net. As of December 31, 2023 and 2022, liabilities related to consolidated VIEs were $43.5 million and $50.9 million, respectively, which were primarily related to operating and finance lease liabilities. All significant intercompany profits, transactions and balances have been eliminated in consolidation.
Use of Estimates
The preparation of financial statements in conformityaccordance with accounting principles generally accepted in the United States ("U.S. GAAP")GAAP requires management to make estimates and assumptions that affect the amounts reported in the financial statements and accompanying notes. Actual results could differ from those estimates. Management evaluates its estimates and assumptions on an ongoing basis using historical experience and other factors, including the current environment.
Foreign Currency Translation
The functional currency ofCompany has foreign operations in Canada, Puerto Rico, the Company's Canadian operations is the Canadian dollar. Accordingly, assetsUnited Kingdom and India. Assets and liabilities of the Company's Canadianforeign operations are translated from the Canadian dollar into U.S. dollars at the ratesrate in effect on the respective balance sheet date, while income and expenses are translated at the weighted-average exchangeaverage rates forduring the year. Adjustmentsrespective periods. Translation adjustments resulting from the translations of Canadian dollar financial statementsfluctuations in exchange rates are accumulated and classifiedrecorded as a separate component of stockholders' equity.Accumulated other comprehensive loss in Stockholders’ equity within the Consolidated Balance Sheets, while transaction gains and losses are recorded within the Consolidated Statements of Income. Deferred taxes are not recorded on cumulative foreign currency translation adjustments when the Company expects the foreign earnings to be permanently reinvested.
Cash and Cash Equivalents
Cash equivalents represent funds temporarily invested in money market instruments with maturities of three months or less. Cash equivalents are stated at cost, which approximates fair value. Cash and cash equivalents that are restricted as to withdrawal or use under the terms of certain contractual agreements were $0.3$0.2 million and $0.5$0.6 million as of December 31, 20202023 and 2019,2022, respectively, and arewere included withinin Cash and cash equivalents within the Consolidated Balance Sheets.
Allowance for Doubtful Accounts
Accounts receivable, net of the allowance for doubtful accounts, represents the Company's estimate of the amount that ultimately will be realized in cash. ManagementThe Company reviews the adequacy of its allowance for doubtful accounts on an ongoing basis, primarily using a review of specific accounts, as well as historical collection trends and aging of receivables, and makesrecords adjustments to the allowance as necessary. Changes in economic conditions or other circumstances could have an impact on the collection of existing accounts receivable balances or future allowance considerations. As of December 31, 2020 and 2019, the Company's allowance for doubtful accounts was $5.1 million and $1.9 million, respectively.
Transactions affecting the allowance for doubtful accounts receivable forduring the years ended December 31, 20202023, 2022 and 20192021 were as follows:
(millions) |
| December 31, 2023 |
|
| December 31, 2022 |
|
| December 31, 2021 |
| |||
Beginning Balance |
| $ | 4.0 |
|
| $ | 3.5 |
|
| $ | 5.1 |
|
Provision for credit losses |
|
| 1.7 |
|
|
| 0.5 |
|
|
| 0.8 |
|
Write offs and other |
|
| (3.1 | ) |
|
| - |
|
|
| (2.4 | ) |
Ending Balance |
| $ | 2.6 |
|
| $ | 4.0 |
|
| $ | 3.5 |
|
(millions) |
| December 31, 2020 |
|
| December 31, 2019 |
| ||
Beginning Balance |
| $ | 1.9 |
|
| $ | 1.0 |
|
Provision for credit losses |
|
| 6.4 |
|
|
| 1.1 |
|
Write offs and other |
|
| (3.2 | ) |
|
| (0.2 | ) |
Ending Balance |
| $ | 5.1 |
|
| $ | 1.9 |
|
Property and Equipment, net
Leasehold Improvements, EquipmentProperty and Construction in Progress, net
Leasehold improvements, equipment includes the Company's equipment, internal-use software, vehicles, leasehold improvements and other fixed assetsconstruction/development in process. Property and equipment are stated at cost, less accumulated depreciation and amortization. amortization, whenever applicable.
Certain costs incurred in the planning and evaluation stage of internal-use software projects are recorded to expense as incurred. Costs associated with directly obtaining, developing or upgrading internal-use software are capitalized and included as Software in Property and equipment, net, within the Consolidated Balance
36
Sheets. When the internal-use software is ready for its intended use, it is amortized on a straight-line basis over the estimated useful life of the internal-use software, which is typically 3 years.
Equipment isand vehicles are depreciated on thea straight-line basis over the estimated useful lives ranging from 1 to 10 years.years. Expenditures for major renewals and improvements that extend the useful life of property and equipment, other than internal-use software, are capitalized. Leasehold improvements are amortized on thea straight-line basis over the terms of the respective leases or the serviceuseful lives of the improvements, whichever is shorter (weighted average remaining life of approximately 4.3 years).shorter.
Goodwill
Certain costs associated with directly obtaining, developing or upgrading internal-use software are capitalized and amortized over the estimated useful life of software.
Cost of Contracts
Cost of contracts represents the cost of obtaining contractual rights associated with a managed type or lease-type contract. Cost of parking contracts are amortized over the estimated life of the contracts, including anticipated renewals and terminations. Estimated lives are based on the contract life or anticipated life of the contract. Effective January 1, 2019, cost of contracts associated with leases within the scope of ASU No. 2016-02 Leases (Topic 842) are included in the right-of-use (“ROU”) assets balance.
50
Goodwill
Goodwill represents the excess of the purchase price paid over the fair value of net assets acquired. In accordance with the Financial Accounting Standards Board's ("FASB") authoritative accounting guidance on goodwill, the Company evaluates goodwill for impairment on an annual basis, or more often if events or circumstances change that could cause goodwill to become impaired. The Company has elected to assess the impairment of goodwill annually on October 1 or at an interim date if there is an event or change in circumstances indicating the carrying value may not be recoverable. The goodwill impairment test is performed at the reporting unit level; the Company's reporting units represent its operating segments, consisting of Commercial and Aviation. Factors that could trigger an impairment review include significant under-performance relative to expected historical or projected future operating results, significant changes in the use of acquired assets or itsthe Company’s business strategy, and significant negative industry or economic trends.
The Company may perform a qualitative, rather than quantitative, assessment to determine whether it is more likely than not that the fair value of a reporting unit is less than its carrying amount. As of January 1, 2020,If the Company adopted Accounting Standards Update (“ASU”) 2017-04, which eliminateddetermines it is more likely than not that the two step approach fromfair value is less than the current goodwill impairment test and allows impairmentcarrying amount, the Company would need to be calculated based on theperform a quantitative assessment. The determination of fair value of a reporting unit utilizes cash flow projections that assume certain future revenue and cost levels, comparable marketplace data, comparable company market valuations, assumed discount rates based upon current market conditions and other valuation factors, all of which involve the use of significant judgementjudgment and estimates. The Company also assesses critical areas that may impact its business including economic conditions, market related exposures, competition, changes in service offerings and changes in key personnel.
Beginning in March 2020, The Company completed a qualitative test of goodwill as of October 1, 2023, and concluded that it is more likely than not that the COVID-19 pandemic (“COVID-19”) and the resulting stay at home orders issued by local governments were beginning to impact certainestimated fair values of each of the Company’s businesses. These factors have significantly impactedreporting units exceeded the hospitality and travel industries, as well as overall consumer discretionary spending.
Duecarrying amount of net assets assigned to the impacts of COVID-19, revenues for certain markets in which the Company operates have dropped significantly as compared to the expectations as of the October 1, 2019 annual impairment test. The Company does not know how long the COVID-19 pandemic and its effects will continue to impact the results of the Company. In addition, certain Aviation contracts were terminated in August 2020. The termination of these contracts and the ongoing impacts of COVID-19 on the Company’s expected future operating cash flows triggered the Company to complete a quantitative goodwill impairment analysis for the Aviationeach reporting unit as of August 31, 2020. Based on the quantitative analysis, the Company determined that estimated carrying value exceeded implied fair value for the Aviation reporting unit and goodwill was impaired. See Note 11. unit.
Goodwill for further discussion.
Other Intangible Assets, net
Other intangible assets represent assets with finite lives that are amortized on a straight-line basis over their estimated useful lives. The Company evaluates the remaining useful life of other intangible assets on a periodic basis to determine whether events or circumstances warrant a revision to their remaining useful lives. In addition, other intangible assets are reviewed for impairment when circumstances change that would indicate the carrying value may not be recoverable. Assumptions and estimates about future values and remaining useful lives of intangible assets are complex and subjective. Theysubjective, and can be affected by a variety of factors, including external factors such as industry and economic trends, and internal factors, such as changes in the Company’s business strategy and internal forecasts. Although managementthe Company believes the historical assumptions and estimates are reasonable and appropriate, differencedifferent assumptions and estimates could materially impact reported financial results.
As a result of the impact of COVID-19 on the Company’s expected future operating cash flows, the Company determined certain impairment triggers had occurred related to a proprietary know how intangible assets within the Aviation segment as of June 30, 2020. Accordingly, the Company analyzed undiscounted cash flows for the proprietary know how intangible asset as of June 30, 2020. Based on the undiscounted cash flow analysis, the Company determined that the estimated net carrying value for the proprietary know how intangible asset exceeded its undiscounted future cash flows and therefore, as of June 30, 2020, the asset was impaired.
Additionally, as a result of the termination of certain contracts within the Aviation reporting unit during August 2020 and the ongoing impact of COVID-19 on the Company’s expected future operating cash flows, the Company determined certain impairment testing triggers had occurred related to the Company’s customer relationships and trade names and trademarks intangible assets. Accordingly, the Company analyzed undiscounted cash flows for certain intangible assets as of August 31, 2020. Based on the undiscounted cash flow analysis, the Company determined that estimated net carrying values exceeded undiscounted future cash flows for certain intangible assets and therefore, as of August 31, 2020, certain intangible assets were impaired.
The impairments recognized were measured by the amount by which the carrying value of the intangible assets exceed their fair value. See Note 10. Other Intangible Assets, net for further discussion.
For both goodwill and intangible assets, future events may indicate differences from management’s judgementsthe Company's judgments and estimates which could, in turn, result in impairment charges. Future events that may result in impairment charges include extended unfavorable economic impacts of COVID-19,volatility, increases in interest rates, which would impact discount rates, or other factors which could decreasesdecrease revenues and profitability of existing locations and changes in the cost structure of existing facilities.facilities, such as increasing labor and benefit costs.
Long-Lived Assets
The Company evaluates long-lived assets, including ROU assets, leasehold improvements, equipment and constructionconstruction/development in progress, for impairment whenever events or circumstances indicate that the carrying value of an asset or asset group may not be recoverable. The Company groups assets at the lowest level for which cash flows are separately identified in order to measure an impairment. Events or circumstances that would result in an impairment review include a significant change in the use of an asset, the planned sale or disposal of an asset, or a projection or forecast that demonstrates continuing losses associated with the use of a long-lived asset or asset group. Recoverability of assets to be held and used is measured by a comparison of the carrying amount of the asset or asset group to future undiscounted cash flows expected to be generated by the asset or asset group. If itthe asset or asset group is determined to be impaired, the impairment recognized is measured by the amount by which the carrying value of the asset or asset group exceeds its fair value.
As a result of the impact of COVID-19 on the Company's expected future operating cash flows, the Company’s managementThe Company determined impairment testing triggers had occurred for ROU assets associated with certain asset groups. Accordingly,groups during the years ended December 31, 2022 and 2021. See Note 3. Leases for further discussion.
The Company analyzed undiscounted cash flowsdetermined no impairment testing triggers had occurred for these ROUlong-lived assets during the year ended December 31, 2020. Based on the undiscounted cash flow analysis, the Company determined that estimated net carrying values exceeded undiscounted cash flows for ROU assets associated with certain asset groups and therefore for the year ended December 31, 2020, certain ROU assets were impaired. The impairment recognized is measured by the amount by which the carrying value of the ROU asset exceeded its fair value. See Note 2. Leases2023. for further discussion.
51
Assumptions and estimates used to determine cash flows in the evaluation of impairment and the fair values used to determine the impairment are subject to a degree of judgment and complexity. Any future changes to the assumptions and estimates resulting from changes in actual results or market conditions from those anticipated may affect the carrying value of long-lived assets and could result in additional impairment charges. Future events that may result in impairment charges include extended unfavorable economic impacts of COVID-19,volatility or other factors whichthat could decrease revenues and profitability of existing locations and changes in the cost structure of existing facilities.facilities, such as increasing labor and benefit costs.
Accrued and Other Current Liabilities
Components of Accrued and other current liabilities
Components as of accrued and other current liabilities for the years ended December 31, 20202023 and 20192022 were as follows:
(millions) |
| December 31, 2023 |
|
| December 31, 2022 |
| ||
Accrued rent |
| $ | 20.1 |
|
| $ | 21.4 |
|
Compensation and payroll withholdings |
|
| 26.2 |
|
|
| 29.2 |
|
Property, payroll and other taxes |
|
| 5.1 |
|
|
| 7.8 |
|
Accrued insurance |
|
| 24.9 |
|
|
| 24.0 |
|
Contract liabilities |
|
| 17.5 |
|
|
| 17.4 |
|
Contingent consideration |
|
| 2.8 |
|
|
| 1.8 |
|
Accrued expenses |
|
| 31.5 |
|
|
| 36.0 |
|
Accrued and other current liabilities |
| $ | 128.1 |
|
| $ | 137.6 |
|
(millions) |
| December 31, 2020 |
|
| December 31, 2019 |
| ||
Accrued rent |
| $ | 17.3 |
|
| $ | 18.1 |
|
Compensation and payroll withholdings |
|
| 32.0 |
|
|
| 28.7 |
|
Property, payroll and other taxes |
|
| 4.8 |
|
|
| 6.8 |
|
Accrued insurance |
|
| 20.1 |
|
|
| 19.2 |
|
Accrued expenses |
|
| 38.5 |
|
|
| 48.6 |
|
Accrued and other current liabilities |
| $ | 112.7 |
|
| $ | 121.4 |
|
Financial Instruments
The carrying values of cash and cash equivalents, accounts receivable and accounts payable approximate their fair value due to the short-term nature of these financial instruments. Book overdrafts of $23.2$31.0 million and $29.3$30.9 million arewere included withinin Accounts payable within the Consolidated Balance Sheets as of
37
December 31, 2020,2023 and 2019,2022, respectively. Long-term debt has a carrying value that approximates fair value because the instruments bear interest at variable market rates.
Insurance Reserves
The Company purchases comprehensive casualty insurance covering certain claims that arise in connection with itsthe Company’s operations. In addition, the Company purchases umbrella/excess liability coverage. Under the various liability and workers' compensation insurance policies, the Company is obligated to pay directly or reimburse the insurance carrier for the deductible / retention amount of each loss covered by itsthe Company’s general / garage, liability, automobile, workers' compensation and garage keepers legal liability policies. As a result, the Company is, in effect,effectively self-insured for all claims within the deductible / retention amount of each loss. Any loss over the deductible / retention is the responsibility of the third-party insurer. The Company applies the provisions as defined in the guidance related to accounting for contingencies, in determining the timing and amount of expense recognition associated with claims against the Company. The expense recognition is based upon the Company's determination of an unfavorable outcome of a claim being deemed as probable and capable of being reasonably estimated, as defined in the guidance related to accounting for contingencies.estimated. This determination requires the use of judgment in both the estimation of probability and the amount to be recognized as an expense. The Company utilizes historical claims experience and exposures specific to each type of insurance, along with actuarial methods performed quarterly by a third party actuarial adviser in determining the required level of insurance reserves. As of December 31, 2020,2023 and 2022, the insurance reserve for general, garage, automobile and workers’ compensation liabilities iswas $50.3 million and $48.4 million, respectively, of which $24.9 million and $24.0 million was recorded in Accrued and other current liabilities and Other noncurrent liabilities inwithin the Consolidated Balance Sheets for short termas of December 31, 2023 and long term balances,2022, respectively, and $25.4 million and $24.4 million was recorded in Other noncurrent liabilities within the Consolidated Balance Sheets as of December 31, 2023 and 2022, respectively. Future information regarding historical loss experience may require changes to the level of insurance reserves and could result in increased expense recognition in the future.
Legal and Other Commitments and Contingencies
The Company is subject to litigation in the normal course of its business. The Company applies the provisions as defined in the guidance related to accounting for contingencies in determining the recognition and measurement of expense recognition associated with legal claims against the Company. Management uses guidance from internal and external legal counsel on the potential outcome of litigation in determining the need to record liabilities for potential losses and the disclosure for pending legal claims. See Note 19. 16. Legal Proceedingsand Other Commitments and Contingencies for further discussion.
Services Revenue
The Company's revenues are primarily derived from management type and lease type contracts; whereby the Company provides parking services, parking management, ground transportation services, baggage handling services and other ancillary services to commercial, hospitality, institutional, municipal and aviation clients. Ancillary services include fees associated with using the Company's technology-driven mobility solutions, as well as on-site parking management, facility maintenance, ground transportation services, event logistics, remote airline check-in, security services, municipal meter revenue collection and enforcement services, and scheduling and supervising all service personnel, as well as providing customer service, marketing, and accounting and revenue control functions necessary to complete such services. Ancillary services also include payments received for exercising termination rights, consulting development fees, gains on sales of contracts, insurance (general, workers' compensation and health care) and other value-added services. In accordance with the guidance related to revenue recognition, entities are required to recognize revenue when control of the promised goods or services is transferred to customers at an amount that reflects the consideration to which the entity expects to be entitled to in exchange for those goods or services. The Company recognizes gross receipts (net of taxes collected from customers) as revenue from leasedlease type contracts, and management fees for services, as the related services are provided.performed. Ancillary services are earned fromprimarily included in management contract propertiestype contracts and are recognized as revenue as those services are provided.
Reimbursed Management Type Contract Revenue and Expense
The Company recognizes both revenues and expenses, in equal amounts, that are directly reimbursed by the Company’s clients for operating expenses incurred under a management type contract. The Company has determined it is the principal in these transactions as the nature of ourthe Company's performance obligations is for the Company to provide the services on behalf of the customer. As the principal to these related transactions, the Company has control of the promised services before they are transferredprovided to the customer.
Cost of Services
The Company recognizes costs for lease type contracts, non-reimbursed costs from management type contracts and reimbursed management type contract expenses as cost of services. Cost of services consists primarily of rent, and payroll related costs.costs and other miscellaneous expenses.
52
Stock-Based Compensation
Stock-based payments to employees, including grants of employee stock options, restricted stock units and performance-based share units, are measured at the grant date, based on the estimated fair value of the award, and the related expense is recognized over the requisite employee service period or performance period (generally the vesting period) for awards expected to vest. The Company also grants stock to its Board of Directors (the “Board”) on an annual basis, which is recorded as expense at the grant date, based on the fair value of the award. The Company accounts for forfeitures of stock-based awards as they occur. See Note 6. Stock-Based Compensation for further discussion.
Equity Investment in Unconsolidated Entities
The Company has ownership interests in 2926 active partnerships, joint ventures or similar arrangements that operate parking facilities, of which 2420 are consolidated under the VIE or voting interest models and 56 are unconsolidated where the Company’s ownership interests range from 30-5030-50 percent and for which there are no indicators of control. The Company accounts for such investments under the equity method of accounting, and itsthe Company’s underlying share of each investee’s equity isof $12.2 million and $11.9 million as of December 31, 2023 and 2022, respectively, was included in Equity investments in unconsolidated entitiesOther noncurrent assets within the Consolidated Balance Sheets. As the operations of these entities are consistent with the Company’s underlying core business operations, the equity in earnings of these investments arewere included in Services revenue - lease type contracts within the Consolidated Statements of (Loss) Income. The equity earnings in these related investments were $1.3$2.6 million, $3.2$4.6 million and $2.7$1.4 million forduring the yearyears ended December 31, 2020, 20192023, 2022 and 2018,2021, respectively.
In 2014, the Company entered into an agreement to establish a joint venture with Parkmobile USA, Inc. and contributed all of the assets and liabilities of its proprietary Click and Park parking prepayment business in exchange for a 30% interest in the newly formed legal entity called Parkmobile, LLC (“Parkmobile”). On January 3, 2018, the Company sold its entire 30% interest in Parkmobile to Parkmobile USA, Inc. for a gross sale price of $19.0 million and recognized a pre-tax gain of $10.1 million, net of closing costs. The pre-tax gain was included in Equity in (earnings) losses from investment in unconsolidated entity within the Consolidated Statements of (Loss) Income for the year ended December 31, 2018. The Company historically accounted for its investment in the Parkmobile joint venture using the equity method of accounting, and its underlying share of equity in Parkmobile was included in Equity investments in unconsolidated entities within the Consolidated BalanceSheets. The equity (earnings) losses in the Parkmobile joint venture were historically included in Equity in (earnings) losses from investment in unconsolidated entity within the Consolidated Statements of (Loss) Income.
Noncontrolling Interests
Noncontrolling interests represent the noncontrolling holders' percentage share of income or losses(losses) from the subsidiaries in which the Company holds a majority,controlling, but less than 100 percent, ownership interest and theinterest. The results of whichthese subsidiaries are consolidated and included within in ourthe Company’s Consolidated Financial Statements.
Income Taxes
Income tax expense involves management judgmentDuring the year ended December 31, 2023, the Company recognized a $1.0 million liability, which was recorded in Other noncurrent liabilities within the Consolidated Balance Sheets as of December 31, 2023, related to its estimate of additional consideration (“contingent consideration”) due to a former minority partner that held a noncontrolling interest in a joint venture with the Company. The Company purchased the minority partner’s interest in the joint venture in 2020. The contingent consideration is contingent on the performance of certain parking-related operations of the Bradley International Airport. The contingent consideration is not capped and, if any amount is due, would be payable to the ultimate resolutionformer minority partner in April 2025. The $1.0 million was determined based on a probability weighting of anypotential payouts and recorded in Additional paid-in capital within the Consolidated Balance Sheets. In addition, the Company recorded a
38
deferred tax issues. Historically,asset of $0.3 million related to the Company’s assessmentscontingent consideration during the year ended December 31, 2023, which was also recorded in Additional paid-in capital within the Consolidated Balance Sheets. The Company will continue to evaluate the criteria for making these payments in the future and adjust the liability when deemed necessary.
Additionally, during the year ended December 31, 2023, the Company paid a former minority partner $2.4 million per the terms of an agreement between the Company and the former minority partner. As of December 31, 2022, the Company entered into an agreement with the former partner to purchase the former minority partner’s entire noncontrolling interest in a joint venture with the Company. Per the terms of the ultimate resolutionagreement, the Company is required to make additional payments to the former minority partner over a ten-year period, starting in 2023, amounting to a total of tax issues have been reasonably accurate.$4.5 million to be paid to the former minority partner. The $2.4 million that was paid during the year ended December 31, 2023 was included in Accrued and other current open issues are not dissimilar from historical items.liabilities within the Consolidated Balance Sheets as of December 31, 2022. As of December 31, 2023 and 2022, the liability for the payment to the former minority partner was $1.7 million and $4.0 million, respectively, of which $0.4 million and $2.4 million was recorded in Accrued and other current liabilities within the Consolidated Balance Sheets as of December 31, 2023 and 2022, respectively, and $1.3 million and $1.6 million was recorded in Other noncurrent liabilities within the Consolidated Balance Sheets as of December 31, 2023 and 2022, respectively.
Income Taxes
Deferred income taxes are computed using the asset and liability method, such that deferred tax assets and liabilities are recognized for the expected future tax consequences ofdeductible temporary differences between US GAAP amounts and the tax basis of existing assets and liabilities based on currently enacted tax laws and tax rates in effect for the periods in which these temporary differences are expected to reverse or be settled. Income tax expense (benefit) is the tax payable (receivable) for the period plus the change during the period in deferred income taxes. The Company has certain state net operating loss (“NOL”) carry forwards which expire in 2036.2043. The Company considers a number of factors in its assessment of the recoverability of its net operating lossNOL carryforwards including their expiration dates and the limitations imposed due to the change in ownership as well as future projections of income. Future changes in the Company's operating performance, along with these considerations, may significantly impact the amount of net operating lossesNOLs ultimately recovered, and the Company’s assessment of their recoverability.
The Company recognizes deferred tax liabilities related to taxes on certain foreign earnings that were not considered to be permanently reinvested. In addition, the Company has recognized deferred tax liabilities on nondeductible intangible assets.
When evaluating the Company’s tax positions, the Company accounts for uncertainty in income taxes in its Consolidated Financial Statements. The evaluation of a tax position by the Company is a two-step process, the first step being recognition. The first step is to determine whether it is more-likely-than-not that a tax position will be sustained upon tax examination, including resolution of any related appeals or litigation processes, based on only the technical merits of the position and the weight of available evidence. If a tax position does not meet the more-likely-than-not threshold, which is more than 50% likely of being realized, the benefit of that position is not recognized in the Company’s financial statements. The second step is measurement of the tax benefit. The tax position is measured as the largest amount of benefit that is more-likely-than-not of being realized, which is more than 50% likely of being realized upon ultimate resolution with a taxing authority.
On December 22, 2017, the U.S. Tax Cuts and Jobs Act of 2017 (the “2017 Tax Act”) was signed into law. The 2017 Tax Act included significant changes to the corporate income tax system in the United States, including a federal corporate rate reduction from 35% to 21% and the transition of United States international taxation from a worldwide tax system to a territorial tax system, and a one-time transition tax on the mandatory deemed repatriation of foreign earnings. On December 22, 2017, the SEC staff issued Staff Accounting Bulletin No. 118, See Note 13. Income Tax Accounting Implications of the Tax Cuts and Jobs Act of 2017Taxes (SAB 118), as issued to address the application of US GAAP in situations when a registrant does not have the necessary information available, prepared, or analyzed (including computations) in reasonable detail to complete accounting for certain income tax effects of the 2017 Tax Act. The Company completed its analysis of the income tax effects of the 2017 Tax Act in the fourth quarter of 2018 in accordance with SAB 118.further discussion.
53
Recently Issued Accounting Pronouncements
Recently Adopted Accounting Pronouncements
|
|
| |||
|
|
| |||
|
|
| |||
|
|
| |||
|
|
| |||
|
|
| |||
|
|
| |||
|
|
| |||
|
|
| |||
|
|
| |||
|
|
| |||
|
|
|
Accounting Pronouncements to be Adopted
EffectsSegment Reporting (Topic 280): Improvements to Reportable Segment Disclosures
In November 2023, the FASB issued Accounting Standards Update ("ASU") 2023-07, Improvements to Reportable Segment Disclosures. Public companies are required to disclose significant segment expenses and other segment items on an interim and annual basis and provide all disclosures about a reportable segment’s profit or loss and assets in interim periods. Entities are also permitted to disclose more than one measure of Reference Rate Reforma segment’s profit or loss if such measures are used by the chief operating decision maker ("CODM") to allocate resources and assess performance, as long as at least one of those measures is determined in a way that is most consistent with the measurement principles used to measure the corresponding amounts in the Consolidated Financial Statements. These amendments aim to improve reportable segment disclosure requirements primarily through enhanced disclosures about significant segment expenses. In addition, the amendments enhance interim disclosure requirements, clarify circumstances in which an entity can disclose multiple segment measures of profit or loss, provide new segment disclosure requirements for entities with a single reportable segment, and contain other disclosure requirements. The guidance is applied retrospectively to all periods presented in the Consolidated Financial Statements, unless doing so is impracticable, and early adoption is permitted. The ASU is effective for fiscal years beginning after 15 December 2023. The Company is currently assessing the impact of adopting the standard on Financial Reportingthe Company’s financial statement disclosures.
Income Taxes (Topic 740): Improvements to Income Tax Disclosures
In March 2020,December 2023, the FASB issued ASU 2020-04, Reference Rate Reform (Topic 848): Facilitation2023-09, Improvements to Income Tax Disclosures. These amendments require disaggregated information about a reporting entity’s effective tax rate reconciliation as well as additional information on income taxes paid. Companies are required to disclose in their rate reconciliation table additional categories of information about federal, state and foreign income taxes and provide more details about the Effectsreconciling items in some categories if items meet a certain quantitative threshold. The guidance will require all entities to disclose income taxes paid, net of Reference Rate Reformrefunds, disaggregated by federal (national), state and foreign taxes for annual periods and to disaggregate the information by jurisdiction based on Financial Reporting. This ASU provides optional expedient and exceptions for applying U.S. GAAPa certain quantitative threshold. The standard is intended to contracts, hedging relationships, and other transactions affectedbenefit investors by reference rate reform if certain criteria are met. In response to the concerns about structural risks of interbank offered rates (IBORs) and, particularly, risks associatedproviding more detailed income tax disclosures that would be useful in making capital allocation decisions. The guidance will be applied on a prospective basis with the phase out ofoption to apply the London Interbank Offered Rate (LIBOR), regulators in several jurisdictions around the world have undertaken reference rate reform initiatives to identify alternative reference rates that are more observable or transaction based and less susceptible to manipulation.standard retrospectively. The ASU provides companies with optional guidance to ease the potential accounting burden associated with transitioning away from reference rates that are expected to be discontinued. The ASU can be adopted no later thanis effective for fiscal years beginning after December 1, 202215, 2024, with early adoption permitted. The Company is currently assessing the impact of adopting the standard on the Company's financial position, results of operations, cash flows andCompany’s financial statement disclosures.
2. Acquisitions
Investments - equity securities; Investments-Equity Method2023 Acquisition
On July 25, 2023, the Company acquired certain assets of Roker Inc. ("Roker"), a United States based provider of fully-integrated parking solutions that simplify permit, violation and Joint Ventures; Derivativesenforcement management for organizations and Hedging
In January 2020, the FASB issued ASU 2020-01, Investments-Equity Securities (Topic 321), Investments-Equity Method and Joint Ventures (Topic 323), and Derivatives and Hedging (Topic 815). The amendments in this ASU clarify the interaction between the accountingmunicipalities, for investments in equity securities, investment in equity method and certain derivatives instruments. The ASU is expected to reduce diversity in practice and increase comparability of the accounting for these interactions. This ASU is effective for fiscal years beginning after December 15, 2021.approximately $3.1 million. The Company utilized borrowings under its Senior Credit Facility and cash on hand to fund the acquisition. Roker's operations are included in the Commercial segment.
The acquisition enhances the Company's position as a global provider of frictionless technology solutions that is currently assessing the impact of adopting the standardnot dependent on the Company's financial position,legacy parking management related operations. Roker has been accounted for as a business combination, and the assets acquired and liabilities assumed were recorded at their fair values as of the acquisition date. Goodwill was measured as the excess of the consideration over the assets acquired, including other intangible assets, less liabilities assumed. Tax deductible goodwill related to the acquisition was $1.0 million. The results of Roker's operations cash flows and financial statement disclosures.
In October 2020, the FASB issued ASU 2020-10, Codification Improvements. This ASU addresses, a variety of topicswere reflected in the Accounting Standards CodificationConsolidated Financial Statements from the date of the acquisition.
39
During the year ended December 31, 2023, Roker contributed $0.2 million of services revenue and $0.4 million of losses before income taxes, primarily due to the amortization related to the acquired other intangible assets.
During the year ended December 31, 2023, the Company incurred acquisition-related costs of $0.2 million related to Roker.
The fair values of the assets acquired and liabilities assumed were as follows:
(millions) |
|
| |
Other intangible assets | $ | 2.3 |
|
Goodwill |
| 1.0 |
|
Accounts payable |
| (0.2 | ) |
Net cash paid | $ | 3.1 |
|
As discussed above, during the year ended December 31, 2023, the Company recorded additions to other intangible assets of $2.3 million. The other intangible assets acquired were recorded at their fair value on the acquisition date as follows:
(millions) |
| Estimated Life |
| Fair Value |
| |
Proprietary know how |
| 8.0 Years |
| $ | 2.1 |
|
Customer relationships |
| 5.4 Years |
|
| 0.2 |
|
Fair value of identified intangible assets |
|
|
| $ | 2.3 |
|
The fair values of other intangible assets acquired were determined to be Level 3 under the fair value hierarchy. The fair value for all identifiable intangible assets was based on assumptions that market participants would use in order to improve consistencypricing an asset, based on the most advantageous market for the asset.
The fair value of the Proprietary know how were determined using the multi-period excess earnings method under the income approach utilizing projected financial information for the technology that was acquired. The fair value of the customer relationships was determined using the distributor method under the income approach.
2022 Acquisitions
On October 11, 2022, the Company acquired K M P Associates Limited ("KMP"), a United Kingdom based software and clarifytechnology provider serving aviation and commercial parking clients, primarily through its Aeroparker technology, throughout the guidance. The FASB provided transition guidanceUnited States and Europe for approximately $13.8 million, less cash acquired of $0.9 million, and assumed KMP's debt of $0.3 million. Immediately following the acquisition, the Company repaid all of the amendments. The ASU is effectivedebt assumed. KMP's operations are included in the Aviation segment.
On November 10, 2022, the Company acquired certain assets of DIVRT, Inc. ("DIVRT"), a developer of innovative software and technology solutions that enables frictionless parking capabilities, for fiscal years beginning afterapproximately $17.6 million. In addition, the Company may be required to pay the former owner of DIVRT a maximum amount of $7.0 million in contingent consideration if certain targets related to the number of the Company's locations using the DIVRT technology are met by October 31, 2025. Based on a probability weighting of potential payouts, the Company accrued $4.0 million in projected contingent consideration as of the acquisition date, which was determined to be Level 3 under the fair value hierarchy. During the year ended December 15, 2020.31, 2023, the Company determined that the first two targets were met as of October 31, 2023, which was the second milestone date. As a result, the Company paid the former owner $2.8 million during the first quarter of 2024. Based on the achievement of the first two targets and the Company’s forecast for future payments, the Company evaluated the estimated contingent consideration and determined no additional accruals were needed. The Company is currently assessingwill continue to evaluate the impactpotential payouts in the future and adjust the contingent consideration for any changes in the estimated fair value each reporting period. DIVRT's operations are included in the Commercial segment. See Note 10. Fair Value Measurement for further discussion.
During the year ended December 31, 2023, KMP and DIVRT contributed $6.3 million of adoptingservices revenue and losses before income taxes of $4.0 million, primarily due to the standardamortization related to the acquired other intangible assets.
During the year ended December 31, 2022, the Company incurred acquisition-related costs of $2.6 million related to KMP and DIVRT.
The Company finalized its purchase price allocations for KMP and DIVRT during the year ended December 31, 2023. There were no measurement period adjustments recorded during the year ended December 31, 2023. The fair value of the assets acquired and liabilities assumed were as follows:
(millions) |
|
| |
Cash and cash equivalents | $ | 0.9 |
|
Accounts receivable |
| 0.7 |
|
Prepaid expenses and other current assets |
| 0.1 |
|
Other intangible assets |
| 21.7 |
|
Goodwill |
| 16.3 |
|
ROU asset |
| 0.1 |
|
Accounts payable |
| (0.1 | ) |
Accrued and other current liabilities |
| (1.5 | ) |
Deferred income taxes |
| (2.5 | ) |
Other long-term borrowings |
| (0.3 | ) |
Net assets acquired and liabilities assumed |
| 35.4 |
|
Less: cash and cash equivalents acquired |
| 0.9 |
|
Less: contingent consideration payable |
| 4.0 |
|
Net cash paid | $ | 30.5 |
|
In addition to the acquisitions discussed above, on April 18, 2022, the Company acquired certain other intangible assets for a purchase price of $1.8 million.
40
As discussed above, during the year ended December 31, 2022, the Company recorded additions to other intangible assets of $23.5 million. The other intangible assets acquired were recorded at their fair value on the Company’sacquisition dates as follows:
(millions) |
| Estimated Life |
| Fair Value |
| |
Proprietary know how |
| 7.4 Years |
| $ | 17.3 |
|
Customer relationships |
| 5.8 Years |
|
| 3.2 |
|
Trade names |
| 13.2 Years |
|
| 1.8 |
|
Covenant not to compete |
| 4.2 Years |
| 1.2 |
| |
Estimated fair value of identified intangible assets |
|
|
| $ | 23.5 |
|
The fair values of the other intangible assets acquired were determined to be Level 3 under the fair value hierarchy. The fair value for all identifiable intangible assets was based on assumptions that market participants would use in pricing an asset, based on the most advantageous market for the asset.
The fair values of the Proprietary know how were determined using the multi-period excess earnings method under the income approach utilizing projected financial position, resultsinformation for each technology that was acquired. The fair value of operations, cash flowsthe customer relationships was determined using the distributor method under the income approach. The fair values of the trade names were determined using the relief from royalty savings method under the income approach. The Company considered the return on assets and financial statement disclosures.market comparable methods when estimating an appropriate royalty rate for the trade names.
3. Leases
2. Leases
The Company leases parking facilities, office space, warehouses, vehicles and equipment and determines if an arrangement is a lease at inception. The Company subleases certain real estate to third parties. The Company's sublease portfolio consists of operating leases for space within leased parking facilities.
The Company accounts for leases in accordance with Topic 842. Operating lease ROU assets and lease liabilities are recognized at commencement date based on the present value of lease payments over the lease term. ROU assets represent the Company's "right-of-use" over an underlying asset for the lease term, and
54
lease liabilities represent the Company’s obligation to make lease payments arising from the lease. The ROU asset includesassets include cumulative prepaid or accrued rent, as well as lease incentives, initial direct costs and acquired lease contracts. The short term lease exception has been applied to leases with an initial term of 12 months or less and these leases are not recorded onwithin the balance sheet.Consolidated Balance Sheets.
As most of the Company's leases do not provide an implicit rate, the Company uses its incremental borrowing rate based on the information available at commencement date in determining the present value of lease payments. The Company uses the implicit rate when readily determinable. Lease expense is recognized on a straight-line basis over the lease term.
For leases that include one or more options to renew, the exercise of such renewal options is at the Company's sole discretion or mutual agreement.agreement with the landlord. The Company’s lease term may include renewal options that are at the Company’s sole discretion and are reasonably certain to be exercised. Equipment and vehicle leases also include options to purchase the leased property. The depreciable life of assets and leasehold improvements are limited by the expected lease term, unless there is a transfer of title or purchase option reasonably certain of exercise.
Variable lease components comprising of payments that are a percentage of parking services revenue based on contractual levels and rental payments adjusted periodically for inflation are not included in the lease liability. The Company's lease agreements do not contain any material residual value guarantees or material restrictive covenants.
Consistent with other long-lived assets or asset groups that are heldAs discussed in Note 1. Significant Accounting Policies and used,Practices, the Company tests ROU assets when impairment indicators are present as detailed in Note 1. Significant Accounting Policies and Practicespresent..
As discussed in Note 1. Significant Accounting Policies and Practices, due toDuring the impact of COVID-19 on the Company's expected future operating cash flows,year ended December 31, 2022, the Company determined certain impairment testing triggers had occurred for an ROU asset associated with a certain asset group within its asset groups. Accordingly,the Commercial segment. Therefore, the Company performed an undiscounted cash flow analyses on certain operating leaseanalysis for the ROU assets during the year endedasset as of December 31, 2020.2022. Based on the undiscounted cash flow analyses as of March 31, 2020, June 30, 2020, September 30, 2020, and December 31, 2020,analysis, the Company determined that certainthe ROU asset groups had a net carrying valuesvalue that exceeded theirits estimated undiscounted future cash flows and the fair value for these asset groups was determined.the ROU asset. The fair value of the ROU assetsasset measured on a non-recurring basis, which iswas classified as Level 3 in the fair value hierarchy, was determined based on estimates of future discounted cash flows. The estimated fair values werevalue was compared to the net carrying values,value, and as a result, the ROU assetsasset held and used with a carrying amount of $278.9$8.4 million werewas determined to have a fair value of $180.2$4.7 million, resulting in an impairment chargescharge of $98.7$3.7 million. The impairment charge of $3.7 million in the Commercial segment for the year ended December 31, 2020, of which $97.1 million is included within Lease impairment in the Consolidated Statements of (Loss) Income and $1.6 million is included within General and administrative expenses in the Consolidated Statements of (Loss) Income. NaN lease impairment charges were recognized during the year ended December 31, 2019.2022 was included in Lease impairment within the Consolidated Statements of Income. Additionally, during the year ended December 31, 2021, the Company recorded impairment charges of $3.6 million, of which $3.5 million and $0.1 million were recorded in the Commercial and Aviation segments, respectively. The impairment charge of $3.6 during the year ended December 31, 2021 was included in Lease Impairment within the Consolidated Statements of Income.
In April 2020, the FASB staff provided accounting elections for entities that receive or provide lease-related concessions to mitigate the economic effects of the COVID-19 pandemic ("COVID-19") on lessees. The Company elected not to evaluate whether certain concessions provided by lessors in response to the COVID-19, pandemic, that are within the scope of additional interpretation provided by the FASB in April 2020, were lease modifications and has also elected not to apply modification guidance under Topic 842.guidance. These concessions will bewere recognized as a reduction of rent expense in the month they occuroccurred and will bewere recorded withinin Cost of parking services - lease type contracts within the Consolidated Statements of (Loss) Income. During the year ended December 31, 2020, as
As a result of the ongoing COVID-19, pandemic, the Company was able to negotiate lease concessions with certain landlords. These rent concessions have beenwere recorded in accordance with the guidance noted above. As a result,Accordingly, the Company recorded $26.0$4.1 million, related to rent concessions$6.2 million and $16.6 million as a reduction to costCost of services - lease type contracts within the Consolidated Statements of Income during the yearyears ended December 31, 2020.2023, 2022 and 2021, respectively.
41
Costs associated with the right to use the infrastructure on service concession arrangements are recorded as a reduction of revenue in accordance with the scope of ASU No. 2017-10, Service Concession Arrangements (Topic 853): Determining the Customer of the Operation Services. See Note 5. 4. Revenue for further discussion on service concession arrangements.
During the year ended December 31, 2020, as a result of the ongoing COVID -19 pandemic, the Company was able to negotiate cost reductions with certain entities related to service concession arrangements. As a result, the Company recorded $31.3 million related to such cost reductions during the year ended December 31, 2020.
The components of ROU assets and lease liabilities and the classification onwithin the Consolidated Balance SheetSheets as of December 31, 20202023 and 20192022 were as follows:
(millions) |
| Classification |
| 2023 |
|
| 2022 |
| ||
Assets |
|
|
|
|
|
|
|
| ||
Operating |
| Right-of-use assets |
| $ | 179.4 |
|
| $ | 166.9 |
|
Finance |
| Property and equipment, net |
|
| 24.6 |
|
|
| 24.4 |
|
Total leased assets |
|
|
| $ | 204.0 |
|
| $ | 191.3 |
|
Liabilities |
|
|
|
|
|
|
|
| ||
Current |
|
|
|
|
|
|
|
| ||
Operating |
| Short-term lease liabilities |
| $ | 56.2 |
|
| $ | 60.2 |
|
Finance |
| Current portion of long-term borrowings |
|
| 7.5 |
|
|
| 7.2 |
|
Noncurrent |
|
|
|
|
|
|
|
| ||
Operating |
| Long-term lease liabilities |
|
| 158.0 |
|
|
| 158.5 |
|
Finance |
| Long-term borrowings, excluding current portion |
|
| 16.6 |
|
|
| 16.0 |
|
Total lease liabilities |
|
|
| $ | 238.3 |
|
| $ | 241.9 |
|
(millions) |
| Classification |
| 2020 |
|
| 2019 |
| ||
Assets |
|
|
|
|
|
|
|
|
|
|
Operating |
| Right-of-use assets |
| $ | 235.1 |
|
| $ | 431.7 |
|
Finance |
| Leasehold improvements, equipment and construction in progress, net |
|
| 28.8 |
|
|
| 18.6 |
|
Total leased assets |
|
|
| $ | 263.9 |
|
| $ | 450.3 |
|
Liabilities |
|
|
|
|
|
|
|
|
|
|
Current |
|
|
|
|
|
|
|
|
|
|
Operating |
| Short-term lease liabilities |
| $ | 82.1 |
|
| $ | 115.2 |
|
Finance |
| Current portion of long-term obligations under Senior Credit Facility and other long-term borrowings |
|
| 7.8 |
|
|
| 3.1 |
|
Noncurrent |
|
|
|
|
|
|
|
|
|
|
Operating |
| Long-term lease liabilities |
|
| 243.4 |
|
|
| 327.7 |
|
Finance |
| Long-term borrowings, excluding current portion |
|
| 20.5 |
|
|
| 15.6 |
|
Total lease liabilities |
|
|
| $ | 353.8 |
|
| $ | 461.6 |
|
55
The components of lease cost and classification onwithin the Consolidated StatementStatements of Income forduring the yearyears ended December 31, 20202023, 2022 and 20192021 were as follows:
(millions) |
| Classification |
| 2023 |
|
| 2022 |
|
| 2021 |
| |||
Operating lease (a)(b) |
| Cost of services - lease type contracts |
| $ | 60.6 |
|
| $ | 61.6 |
|
| $ | 57.5 |
|
Short-term lease (a) |
| Cost of services - lease type contracts |
|
| 19.9 |
|
|
| 19.4 |
|
|
| 15.9 |
|
Variable lease |
| Cost of services - lease type contracts |
|
| 84.7 |
|
|
| 72.1 |
|
|
| 36.7 |
|
Operating lease cost |
|
|
|
| 165.2 |
|
|
| 153.1 |
|
|
| 110.1 |
|
Finance lease cost |
|
|
|
|
|
|
|
|
|
|
| |||
Amortization of leased assets |
| Depreciation and amortization |
|
| 6.7 |
|
|
| 5.9 |
|
|
| 5.7 |
|
Interest on lease liabilities |
| Interest expense |
|
| 1.3 |
|
|
| 1.0 |
|
|
| 1.0 |
|
Lease Impairment |
| Lease impairment |
|
| — |
|
|
| 3.7 |
|
|
| 3.6 |
|
Net lease cost |
|
|
| $ | 173.2 |
|
| $ | 163.7 |
|
| $ | 120.4 |
|
(millions) |
| Classification |
| 2020 |
|
| 2019 |
| ||
Operating lease (a)(b) |
| Cost of services - lease type contracts |
| $ | 81.1 |
|
| $ | 150.9 |
|
Short-term lease (a) |
| Cost of services - lease type contracts |
|
| 22.6 |
|
|
| 33.1 |
|
Variable lease |
| Cost of services - lease type contracts |
|
| 20.1 |
|
|
| 58.1 |
|
Operating lease cost |
|
|
|
| 123.8 |
|
|
| 242.1 |
|
Finance lease cost |
|
|
|
|
|
|
|
|
|
|
Amortization of leased assets |
| Depreciation and amortization |
|
| 4.2 |
|
|
| 2.3 |
|
Interest on lease liabilities |
| Interest expense |
|
| 1.1 |
|
|
| 0.9 |
|
Lease Impairment |
| Lease impairment |
|
| 97.1 |
|
|
| — |
|
Lease Impairment |
| General and administrative expenses |
|
| 1.6 |
|
|
| — |
|
Net lease cost |
|
|
| $ | 227.8 |
|
| $ | 245.3 |
|
| (b) Included rent concessions of $4.1 million, $6.2 million and $16.6 million during the years ended December 31, 2023, 2022 and 2021, respectively.
|
|
|
|
Sublease income during the years ended December 31, 20202023, 2022 and 20192021 was $1.6$2.1 million, $1.4 million and $2.0$1.4 million, respectively.
The Company has entered into new operating lease arrangements as of December 31, 20202023 that commence in future periods. The total amount of ROU assets and lease liabilities related to these arrangements are immaterial.
Maturities, lease term and discount rate information of lease liabilities as of December 31, 20202023 were as follows:
|
| Operating |
|
| Finance |
|
|
|
|
|
| Operating |
|
| Finance |
|
|
|
| |||||
(millions) |
| Leases |
|
| Leases |
|
| Total |
|
| Leases |
|
| Leases |
|
| Total |
| ||||||
2021 |
| $ | 94.7 |
|
| $ | 8.8 |
|
| $ | 103.5 |
| ||||||||||||
2022 |
|
| 80.0 |
|
|
| 7.5 |
|
|
| 87.5 |
| ||||||||||||
2023 |
|
| 59.1 |
|
|
| 5.3 |
|
|
| 64.4 |
| ||||||||||||
2024 |
|
| 41.8 |
|
|
| 3.4 |
|
|
| 45.2 |
|
| $ | 66.1 |
|
| $ | 8.7 |
|
| $ | 74.8 |
|
2025 |
|
| 29.5 |
|
|
| 1.7 |
|
|
| 31.2 |
|
|
| 53.7 |
|
|
| 6.5 |
|
|
| 60.2 |
|
After 2025 |
|
| 69.3 |
|
|
| 5.0 |
|
|
| 74.3 |
| ||||||||||||
2026 |
|
| 41.6 |
|
|
| 5.2 |
|
|
| 46.8 |
| ||||||||||||
2027 |
|
| 27.8 |
|
|
| 3.1 |
|
|
| 30.9 |
| ||||||||||||
2028 |
|
| 21.7 |
|
|
| 1.7 |
|
|
| 23.4 |
| ||||||||||||
After 2028 |
|
| 36.0 |
|
|
| 2.0 |
|
|
| 38.0 |
| ||||||||||||
Total lease payments |
|
| 374.4 |
|
|
| 31.7 |
|
|
| 406.1 |
|
|
| 246.9 |
|
|
| 27.2 |
|
|
| 274.1 |
|
Less: Imputed interest |
|
| 48.9 |
|
|
| 3.4 |
|
|
| 52.3 |
|
|
| 32.7 |
|
|
| 3.1 |
|
|
| 35.8 |
|
Present value of lease liabilities |
| $ | 325.5 |
|
| $ | 28.3 |
|
| $ | 353.8 |
|
| $ | 214.2 |
|
| $ | 24.1 |
|
| $ | 238.3 |
|
Weighted-average remaining lease term (years) |
|
| 5.6 |
|
|
| 5.1 |
|
|
|
|
|
|
| 5.1 |
|
|
| 4.0 |
|
|
|
| |
Weighted-average discount rate |
|
| 5.0 | % |
|
| 4.2 | % |
|
|
|
|
|
| 5.6 | % |
|
| 5.9 | % |
|
|
| |
Future sublease income for the periods shown above was excluded as the amounts are not material.
Supplemental cash flow information related to leases forduring the years ended December 31, 20202023, 2022 and 20192021 were as follows:
(millions) |
| 2023 |
|
| 2022 |
|
| 2021 |
| |||
Cash paid for amounts included in the measurement of lease liabilities |
|
|
|
|
|
|
|
|
| |||
Operating cash outflows related to operating leases |
| $ | 88.7 |
|
| $ | 91.5 |
|
| $ | 96.4 |
|
Operating cash outflows related to interest on finance leases |
|
| 1.3 |
|
|
| 1.0 |
|
|
| 1.0 |
|
Financing cash outflows related to finance leases |
|
| 7.8 |
|
|
| 9.6 |
|
|
| 7.7 |
|
Leased assets obtained in exchange for new operating lease liabilities |
|
| 69.4 |
|
|
| 22.2 |
|
|
| 40.7 |
|
Leased assets obtained in exchange for new finance lease liabilities |
|
| 9.0 |
|
|
| 10.1 |
|
|
| 0.4 |
|
(millions) |
| 2020 |
|
| 2019 |
| ||
Cash paid for amounts included in the measurement of lease liabilities |
|
|
|
|
|
|
|
|
Operating cash outflows related to operating leases |
| $ | 120.3 |
|
| $ | 179.0 |
|
Operating cash outflows related to interest on finance leases |
|
| 1.1 |
|
|
| 0.9 |
|
Financing cash outflows related to finance leases |
|
| 5.2 |
|
|
| 2.3 |
|
Leased assets obtained in exchange for new operating liabilities |
|
| 38.2 |
|
|
| 68.6 |
|
Leased assets obtained in exchange for new finance lease liabilities |
|
| 16.5 |
|
|
| 6.8 |
|
4. Revenue
3. Acquisition
On November 30, 2018 (the “acquisition date”), the Company acquired the outstanding shares of ZWB Holdings, Inc. and Rynn's Luggage Corporation, and their subsidiaries and affiliates (collectively, "Bags"). Bags is a leading provider of baggage delivery, remote airline check in, and other related services, primarily to airline, airport and hospitality clients. Subject to the terms and conditions of the Stock Purchase Agreement, the Company paid $283.6 million as consideration for the acquisition of Bags. The consideration was comprised of $275.0 million of cash paid by SP Plus, $8.1 million related to the net working capital and cash acquired and $0.5 million for certain individual taxes to be paid by the seller (the “Cash Consideration”). As described in Note 20. Segment Information, the Company integrated the Bags' operations into the Aviation segment, effective November 30, 2018.
The acquisition of Bags has been accounted for as a business combination, and assets acquired and liabilities assumed were recorded at their estimated fair values. Goodwill as of the acquisition date was measured as the excess of consideration transferred, which is also generally measured at fair value or the net acquisition date fair values of the assets acquired and the liabilities assumed. The results of operations are reflected in the consolidated financial statements of the Company from the acquisition date.
The Company incurred certain acquisition and integration costs associated with the acquisition of Bags that were expensed as incurred and are reflected in the Consolidated Statements of (Loss) Income. See Note 4. Acquisition, Restructuring and Integration Costs for further discussion.
The fair values of assets acquired and liabilities assumed were as follows:
56
|
|
|
|
|
| Measurement |
|
|
|
|
| |
|
|
|
|
|
| Period |
|
|
|
|
| |
(millions) |
| Initial |
|
| Adjustments |
|
| Final |
| |||
Cash and cash equivalents |
| $ | 5.9 |
|
|
|
|
|
| $ | 5.9 |
|
Notes and accounts receivable |
|
| 13.2 |
|
|
|
|
|
|
| 13.2 |
|
Prepaid expenses and other current assets |
|
| 2.0 |
|
|
|
|
|
|
| 2.0 |
|
Other noncurrent assets |
|
| 0.2 |
|
|
|
|
|
|
| 0.2 |
|
Leasehold improvements, equipment and construction in progress |
|
| 1.5 |
|
|
|
|
|
|
| 1.5 |
|
Other intangible assets, net |
|
| 118.0 |
|
|
|
|
|
|
| 118.0 |
|
Goodwill |
|
| 154.1 |
|
|
| 0.3 |
|
|
| 154.4 |
|
Accounts payable |
|
| (6.5 | ) |
|
|
|
|
|
| (6.5 | ) |
Accrued and other current liabilities |
|
| (4.1 | ) |
|
| (0.3 | ) |
|
| (4.4 | ) |
Other long-term liabilities |
|
| (0.7 | ) |
|
|
|
|
|
| (0.7 | ) |
Net assets acquired and liabilities assumed |
| $ | 283.6 |
|
| $ | 0 |
|
| $ | 283.6 |
|
Goodwill of $154.4 million represents the future economic benefits arising from other assets acquired in a business combination that are not individually identified and separately recognized. The goodwill recognized was primarily attributable to expanded revenue synergies and opportunities in the aviation and hospitality businesses, as well as other benefits that the Company believes will result from combining its operations with the operations of Bags. The goodwill acquired is deductible for tax purposes.
Acquired other Intangibles assets were as follows:
(millions) |
| Estimated Life |
| Fair Value |
| |
Trade name |
| 5.0 Years |
| $ | 5.6 |
|
Customer relationships |
| 12.4 - 15.8 Years |
|
| 100.4 |
|
Existing technology |
| 5.0 - 6.0 Years |
|
| 10.4 |
|
Non-compete agreement |
| 5.0 Years |
|
| 1.6 |
|
Estimated fair value of identified intangibles |
|
|
| $ | 118.0 |
|
The fair value for all identifiable intangible assets is based on assumptions that market participants would use in pricing an asset, based on the most advantageous market for the asset (i.e., its highest and best use). The fair value of trade names was determined with the relief from royalty savings method. The Company considered the return on assets and market comparable methods when estimating an appropriate royalty rate for the trade names. The fair value of acquired customer relationships was determined with the excess earnings method. This approach calculates the excess of the future cash inflows (i.e., revenue from customers generated from the relationships) over the related cash outflows (i.e., customer servicing expenses) generated over the useful life of the relationship. The fair value of developed or existing technology was determined utilizing the relief from royalty savings method with additional consideration given to asset deterioration rates.
Unaudited Pro forma financial information
The following unaudited pro forma results of operations for the year ended December 31, 2018, assumes the acquisition of Bags was completed on January 1, 2018, and as such Bags pre-acquisition results have been added to the Company’s historical results. The historical consolidated financial information of the Company and Bags have been adjusted to give effect to pro forma events that are (1) directly attributable to the transaction, (2) factually supportable and (3) expected to have a continuing impact on the combined results. The pro forma results contained in the table below include adjustments for (i) amortization of acquired intangibles, (ii) reduced general and administrative expenses related to non-routine transaction expenses, (iii) increased interest expense related to the financing of the acquisition of Bags, and (iv) estimated income tax effect.
The unaudited pro forma condensed combined financial information is presented solely for informational purposes and is not necessarily indicative of the combined results of operations or financial position that might have been achieved for the periods or dates indicated, nor is it necessarily indicative of the future results of the combined company. The unaudited pro forma condensed combined financial statements do not give effect to the potential impact of any anticipated benefits from revenue synergies, cost savings or operating synergies that may result from the acquisition of Bags or to any disynergies and integration related costs. Also, the unaudited pro forma condensed combined financial information does not reflect possible adjustments related to potential restructuring or integration activities that have yet to be determined or transaction or other costs following the combination that are not expected to have a continuing impact on the business of the combined company. Further, one-time transaction-related expenses anticipated to be incurred prior to, or concurrent with, the closing of the transaction were not included in the unaudited pro forma condensed combined statement of income as such transaction costs were determined not to be significant. Additionally, the unaudited pro forma financial information does not reflect the costs that the company has incurred or may incur to integrate Bags.
(millions) |
| 2018 |
| |
Total services revenue |
| $ | 1,617.7 |
|
Net income attributable to SP Plus Corporation |
|
| 55.1 |
|
Services revenue and net income related to Bags that are included in the Consolidated Statements of (Loss) Income were $14.2 million and $1.3 million or the year ended December 31, 2018, respectively, which were included in Services revenue - Management type contracts and Net income attributable to SP Plus Corporation, respectively.
4. Acquisition, Restructuring and Integration Costs
Acquisition, Restructuring and Integration Costs
The Company incurred certain acquisition, restructuring and integration costs that were expensed as incurred, which include:
|
|
57
|
|
|
|
Included in General and administrative expenses are severance related costs of $4.0 million during the year ended December 31, 2020, reflecting the actions the Company has taken to lessen the impacts of COVID-19 on the business. The acquisition, restructuring, and integration related costs for the years ended December 31, 2020, 2019 and 2018 were as follows:
|
| Year Ended December 31, |
| |||||||||
(millions) |
| 2020 |
|
| 2019 |
|
| 2018 |
| |||
Cost of services - lease type contracts |
| $ | 0.4 |
|
| $ | — |
|
| $ | — |
|
Cost of services - management type contracts |
|
| 0.7 |
|
|
| — |
|
|
| — |
|
General and administrative expenses |
|
| 6.5 |
|
|
| 1.3 |
|
|
| 8.1 |
|
The accrual for acquisition, restructuring and integration costs of $1.2 million and $0.1 million is included in Accrued and other current liabilities within the Consolidated Balance Sheet as of December 31, 2020 and 2019, respectively.
5. Revenue
The Company accounts for revenue in accordance with Topics 606 and 853. Topic 606 requires entities to recognizerecognizes revenue when control of the promised goods or services is transferred to customers at an amount that reflects the consideration to which the entityCompany expects to be entitled to in exchange for those goods or services.
42
Contracts with customers and clients
The Company accounts for a contract when it has the approval and commitment from both parties, the rights of the parties are identified, payment terms are identified, the contract has commercial substance and collectability of consideration is probable. Once a contract is identified, the Company evaluates whether the combined or single contract should be accounted for as more than one performance obligation. Substantially all of the Company's revenues come from the following two types of arrangements: Management type and Lease type and contracts.
Management type contracts.contracts
Management type contract revenue consists of management fees, including both fixed and performance-based fees, and in some cases e-commerce technology fees, customer convenience fees and monthly subscription fees related to the use of the Company's technology solutions. In exchange for this consideration, the Company may have a bundle of integrated services that comprise one performance obligation and include services such as managing the facility, as well as ancillary services such as accounting, equipment leasing, consulting, insurance and other value-added services. Management type contract revenues do not include gross customer collections at the managed facilities, as these revenues belong to the property owners rather than to the Company. Management type contracts generally provide the Company with management fees regardless of the operating performance of the underlying facilities. Revenue is recognized over time as the Company provides services over the term of the contract.
Lease type contracts
Lease type contract revenue includes gross receipts (net of local taxes), e-commerce technology fees and customer convenience fees. Performance obligations related to lease type contracts include parking for transient and monthly parkers. Revenue is recognized over time as the Company provides services. Under lease type arrangements, the Company pays the property owner a fixed base rent, percentage rent that is tied to the facility’s financial performance, or a combination of both. The Company operates the parking facility and is responsible for most operating expenses, but typically is not responsible for major maintenance, capital expenditures or real estate taxes. Performance obligations related to lease type contracts include parking for transient and monthly parkers. Revenue is recognized over time as the Company provides services. As noted in Note 1. Significant Accounting Policies and Practices and in accordance with Topic 853, certain expenses, primarily rental expense for the contractual arrangements that meet the definition of service concession arrangements, are recorded as a reduction of revenue for the year ended December 31, 2020, 2019, and 2018, respectively.
Management type contracts
Management type contract revenue consists of management fees, including both fixed and performance-based fees. In exchange for this consideration, the Company has a bundle of performance obligations that include services such as managing the facilities as well ancillary services such as accounting, equipment leasing, consulting, insurance and other value-added services. The Company believes that it can generally purchase required insurance for the facility and facility operations at lower rates than clients can obtain on their own because the Company is effectively self-insured for all liability, workers' compensation and health care claims by maintaining a large per-claim deductible. As a result, the Company generates operating income on the insurance provided under its management type contracts by focusing on risk management efforts and controlling losses. Management type contract revenues do not include gross customer collections at the managed facilities as these revenues belong to the property owners rather than to the Company. Management type contracts generally provide the Company with management fees regardless of the operating performance of the underlying facilities. Revenue is recognized over time as the Company provides services.
Service concession arrangements
Service concession agreements include both lease type and management type contracts. Revenue generated from service concession arrangements, is accounted for under the guidance of Topics 606 and 853. Certain expenses (primarily rental expense), as well as depreciation and amortization, related to service concession arrangements and depreciation and amortization, have beenfor lease type contracts, are recorded as a reduction of Service revenue - lease type contracts.
The Company recorded $11.1 million, $12.0 million and $24.4 million of cost concessions related to service concession arrangements (recognized as an increase to revenue) during the years ended December 31, 2023, 2022 and 2021, respectively.
Contract modifications and taxes
Contracts are often modified to account for changes in contract specifications and requirements. The Company considers contract modifications to exist when the modification eitherparties to the contract have approved changes to or have new enforceable rights and obligations, which may include changes to the contract consideration due to the Company or creates new performance obligations or changesobligations. The Company assesses whether a contract modification results in either a new separate contract, the existing scopetermination of the contract and related performance obligations. Most contract modifications are for services that are not distinct from the existing contract due toand the fact thatcreation of a new contract, or modifies the Company is providing a bundle of performance obligations that are highly inter-related in the context of the contract, and are therefore accounted for as if they were part of that existing contract. Typically, modifications are accounted for prospectively as part of the existing contract.prospectively.
Taxes assessed by a governmental authority that are both imposed on and concurrent with a specific revenue-producing transaction, which are collected by the Company from a customer, are excluded from revenue.
Reimbursed management type contract revenue and expense
TheFor certain management type contracts, the Company recognizes both revenues and expenses, in equal amounts, that are directly reimbursed from the property owner or client for operating expenses incurred under a management type contract.by the Company on behalf of the clients. The Company has determined it is the principal in these transactions, as the nature of its performance obligations is for the Company to provide the services on behalf of the client. As the principal to these related transactions, the Company has control of the promised services before they are transferred to the client.
58
Disaggregation of revenue
The Company disaggregates its revenue from contracts with customers by type of arrangement for each of the reportable segments. The Company has concluded that such disaggregation of revenue best depicts the overall economic nature, timing and uncertainty of the Company's revenue and cash flows affected by the economic factors of the respective contractual arrangement. See Note 20. 17. Segment Information for further information on disaggregation of the Company's revenue by segment.
Performance obligations
A performance obligation is a promise in a contract to transfer a distinct good or service to the customer or client, and is the unit of account under Topic 606. The contract transaction price is allocated to each distinct performance obligation and recognized as revenue when, or as, the performance obligation is satisfied. The majority of the Company’s contracts have a single performance obligation that is not separately identifiable from other promises in the contract and therefore not distinct, comprising the promise to provide aan integrated bundle of monthly performance obligationsservices or parking services for transient or monthly parkers.
The contract price is generally deemed to be the transaction price. Some management type contracts include performance incentives that are based on variable performance measures. These incentives are constrained at contract inception and recognized once the customer has confirmed that the Company has met the contractually agreed upon performance measures as defined in the contract.
The Company’s performance obligations are primarily satisfied over time as the Company provides the related services. Typically, revenueFor management type contracts, the Company is recognized over timegenerally entitled to receive base management fees and, in some cases, an incentive management fee, which is generally based on a straight-line basis asmeasure of the Company satisfies the related performance obligation.parking facility’s revenue or profitability. There are certain management type contracts where revenue is recognized based on costs incurred to date plus a reasonable margin. The Company has concluded this is a faithful depiction of how control is transferred to the customer. Performance obligations satisfied atThe Company recognizes the base management fees on a point in time formonthly basis over the year ended December 31, 2020, 2019term of the contract. For contracts that include incentive management fees, the Company recognizes incentive management fees on a monthly basis over the term of the contract based on each parking facility’s financial results, as long as the Company does not expect a significant reversal due to projected future performance. For lease type contracts, the Company typically recognizes revenue on a daily basis, as the customers utilize the Company's services and 2018, respectively, were not significant.products and the Company has performed its performance obligations.
The time between completion of the performance obligation and collection of cash is typically not more than 30 - 60 days. In certain contractual arrangements, such as monthly parker contracts, cashthe payment is typically collected in advance of the Company commencing its performance obligations under the contractual arrangement.
43
As of December 31, 2020,2023, the Company had $118.0$199.3 million related to performance obligations that were unsatisfied or partially unsatisfied for which the Company expects to recognize revenue. This amount excludes variable consideration primarily related to contracts where the Company and customer share the gross revenues or operating profit for the location and contracts where transaction prices include performance incentives that are constrained at contract inception. These performance incentives are based on measures that are ascertained exclusively by future performance and therefore cannot be estimated at contract inception by the Company. The Company applies the practical expedient that permits exclusion of information about the remaining performance obligations that have original expected durations of one year or less.
The Company expects to recognize the remaining performance obligations as revenue in future periods as follows:
|
| Remaining Performance |
|
| Remaining Performance |
| ||
(millions) |
| Obligations |
|
| Obligations |
| ||
2021 |
| $ | 51.3 |
| ||||
2022 |
|
| 28.9 |
| ||||
2023 |
|
| 19.5 |
| ||||
2024 |
|
| 10.7 |
|
| $ | 75.4 |
|
2025 |
|
| 4.4 |
|
|
| 47.4 |
|
2026 and thereafter |
|
| 3.2 |
| ||||
2026 |
|
| 34.0 |
| ||||
2027 |
|
| 21.0 |
| ||||
2028 |
|
| 8.6 |
| ||||
2029 and thereafter |
|
| 12.9 |
| ||||
Total |
| $ | 118.0 |
|
| $ | 199.3 |
|
Contract balances
The timing of revenue recognition, billings and cash collections results in accounts receivable, contract assets and contract liabilities. Accounts receivable represent amounts where the Company has an unconditional right to the consideration and therefore only the passage of time is required for the Company to receive consideration due from the customer.customer or client. Both lease typemanagement and managementlease type contracts have customers and clients where amounts are billed as work progresses or in advance in accordance with agreed-upon contractual terms. Billing may occur subsequent to or prior to revenue recognition, resulting in contract assets and liabilities. The Company, on occasion, receives advances or deposits from customers and clients on both lease and management type contracts, before revenue is recognized, resulting in the recognition of contract liabilities.
Contract assets and liabilities are reported on a contract-by-contract basis and are included in Notes and accountsAccounts receivable, net and Accrued and other current liabilities, respectively, onwithin the Consolidated Balance Sheets. See Note 1. Significant Accounting Policies and Practices for additional detaildiscussion on the write-off of accounts receivable. There were 0no impairment charges recorded on contract assets and liabilities forduring the years ended December 31, 2020, 20192023, 2022 and 2018. 2021.
The following table provides information about accounts receivable, contract assets and contract liabilities with customers and clients as of December 31, 20202023 and 2019:2022:
(millions) |
| 2020 |
|
| 2019 |
|
| 2023 |
|
| 2022 |
| ||||
Accounts receivable |
| $ | 102.7 |
|
| $ | 151.3 |
|
| $ | 181.9 |
|
| $ | 169.9 |
|
Contract asset |
|
| 8.6 |
|
|
| 11.0 |
|
|
| 1.2 |
|
|
| 1.8 |
|
Contract liability |
|
| (12.5 | ) |
|
| (19.4 | ) |
|
| (17.5 | ) |
|
| (17.4 | ) |
59
Changes in contract assets, which include the recognition of additional consideration due from the customerclient, are offset by reclassifications of contract asset balances to accounts receivable when the Company obtains an unconditional right to consideration, thereby establishing an accounts receivable. The following table provides information about changes to contract asset balancesassets during the years ended December 31, 20202023 and 2019:2022:
(millions) |
| 2020 |
|
| 2019 |
|
| 2023 |
|
| 2022 |
| ||||
Balance, beginning of period |
| $ | 11.0 |
|
| $ | 11.4 |
| ||||||||
Balance, beginning of year |
| $ | 1.8 |
|
| $ | 2.3 |
| ||||||||
Additional contract assets |
|
| 8.6 |
|
|
| 11.0 |
|
|
| 1.2 |
|
|
| 1.8 |
|
Reclassification to accounts receivable |
|
| (11.0 | ) |
|
| (11.4 | ) |
|
| (1.8 | ) |
|
| (2.3 | ) |
Balance, end of period |
| $ | 8.6 |
|
| $ | 11.0 |
| ||||||||
Balance, end of year |
| $ | 1.2 |
|
| $ | 1.8 |
| ||||||||
Changes in contract liabilities primarily include additional contract liabilities and reductions of contract liabilities when revenue is recognized. The following table provides information about changes to contract liabilities balances during the years ended December 31, 20202023 and 2019:2022:
(millions) |
| 2020 |
|
| 2019 |
|
| 2023 |
|
| 2022 |
| ||||
Balance, beginning of period |
| $ | (19.4 | ) |
| $ | (19.1 | ) | ||||||||
Balance, beginning of year |
| $ | (17.4 | ) |
| $ | (15.7 | ) | ||||||||
Acquisitions |
|
| — |
|
|
| (1.1 | ) | ||||||||
Additional contract liabilities |
|
| (12.5 | ) |
|
| (19.4 | ) |
|
| (17.5 | ) |
|
| (16.4 | ) |
Recognition of revenue from contract liabilities |
|
| 19.4 |
|
|
| 19.1 |
|
|
| 17.4 |
|
|
| 15.8 |
|
Balance, end of period |
| $ | (12.5 | ) |
| $ | (19.4 | ) | ||||||||
Balance, end of year |
| $ | (17.5 | ) |
| $ | (17.4 | ) | ||||||||
Cost of contracts, net
Cost of contracts, net, represents the cost of obtaining contractual rights associated with providing services for lease or management type contracts. Incremental costs incurred to obtain service contractsCosts are amortized on a straight linestraight-line basis over the estimated life of the contracts, including anticipated renewals and terminations. The amortization period is consistent with the timing of when the Company satisfies the related performance obligations. Estimated lives are based on the contract life.
See Note 9. Cost of Contracts,contracts, net, for amortization expense related to cost as of contracts. Amortization expenseDecember 31, 2023 and 2022 was as follows:
| December 31, |
| ||||||
(millions) |
| 2023 |
|
| 2022 |
| ||
Cost of contracts |
| $ | 20.9 |
|
| $ | 23.3 |
|
Accumulated amortization |
|
| (18.7 | ) |
|
| (20.4 | ) |
Cost of contracts, net |
| $ | 2.2 |
|
| $ | 2.9 |
|
44
Cost of contracts expense related to service concession arrangements within the scope of Topic 853 and certain management type contracts are recorded as a reduction of revenue and were not significant for the years ended December 31, 2020, 2019 and 2018, respectively.
As of December 31, 2020 and 2019, costrevenue. Cost of contracts net of accumulated amortization included on the Consolidated Balance Sheets within Other noncurrent assets was $4.8 million and $4.3 million, respectively. NaN impairment charges were recordedexpense during the years ended December 31, 2020, 20192023, 2022 and 2018, respectively.2021, which was included as a reduction to Services revenue – management type contracts within the Consolidated Statements of Income, was as follows:
6.
| Year Ended December 31, |
| ||||||||||
(millions) |
| 2023 |
|
| 2022 |
|
| 2021 |
| |||
Cost of contracts expense |
| $ | 0.9 |
|
| $ | 1.0 |
|
| $ | 1.0 |
|
Weighted average life (years) |
|
| 7.4 |
|
|
| 7.1 |
|
|
| 7.0 |
|
5. Net (Loss) Income per Common Share
Basic net (loss) income per common share is computed by dividing net (loss) income by the weighted daily average number of shares of common stock outstanding during the period. Diluted net (loss) income per common share is based upon the weighted daily average number of shares of common stock outstanding forduring the period plus all potentially dilutive potential common shares,stock-based awards, including restricted stock and performance share units, using the treasury-stock method. Unvested performance share units are excluded from the computation of weighted average diluted common shares outstanding if the performance targets upon which the issuance of the shares is contingent have not been achieved and the respective performance period has not been completed as of the end of the period. In periods where the Company has a net loss, restricted stock units are excluded from the calculation of net (loss) earnings per common share, as their inclusion would be anti-dilutive.
Basic and diluted net (loss) income per common share and a reconciliation of the weighted average basic common shares outstanding to the weighted average diluted common shares outstanding during the years ending December 31, 2023, 2022 and 2021 was as follows:
|
| Year Ended December 31, |
|
| Year Ended December 31, |
| ||||||||||||||||||
(millions, except share and per share data) |
| 2020 |
|
| 2019 |
|
| 2018 |
|
| 2023 |
|
| 2022 |
|
| 2021 |
| ||||||
Net (loss) income attributable to SP Plus Corporation |
| $ | (172.8 | ) |
| $ | 48.8 |
|
| $ | 53.2 |
| ||||||||||||
Net income attributable to SP Plus Corporation |
| $ | 31.1 |
|
| $ | 45.2 |
|
| $ | 31.7 |
| ||||||||||||
Basic weighted average common shares outstanding |
|
| 21,056,061 |
|
|
| 22,080,025 |
|
|
| 22,394,542 |
|
|
| 19,670,918 |
|
|
| 20,809,363 |
|
|
| 21,166,323 |
|
Dilutive impact of share-based awards |
|
| — |
|
|
| 128,007 |
|
|
| 212,681 |
|
|
| 110,470 |
|
|
| 197,705 |
|
|
| 213,660 |
|
Diluted weighted average common shares outstanding |
|
| 21,056,061 |
|
|
| 22,208,032 |
|
|
| 22,607,223 |
|
|
| 19,781,388 |
|
|
| 21,007,068 |
|
|
| 21,379,983 |
|
Net (loss) income per common share |
|
|
|
|
|
|
|
|
|
|
|
| ||||||||||||
Net income per common share |
|
|
|
|
|
|
| |||||||||||||||||
Basic |
| $ | (8.21 | ) |
| $ | 2.21 |
|
| $ | 2.38 |
|
| $ | 1.58 |
|
| $ | 2.17 |
|
| $ | 1.50 |
|
Diluted |
| $ | (8.21 | ) |
| $ | 2.20 |
|
| $ | 2.35 |
|
| $ | 1.57 |
|
| $ | 2.15 |
|
| $ | 1.48 |
|
Due to the net loss during the year ended December 31, 2020, common stock equivalents arising from 51,276 restricted stock units were excluded from the computation.
There were 0no additional securities that could dilute basic earnings per common share in the future that were not included in the computation of diluted earningsnet income per common share, other than those disclosed.
7.6. Stock-Based Compensation
The Company measures stock-based compensation expense at the grant date, based on the estimated fair value of the award based on assumptions, primarily the stock price, as of the grant date. The expense is recognized on a straight-line basis over the requisite employee service period or performance period (generally the vesting period) for awards expected to vest. For those awardsstock grants in which there is no requisite service period, the Company immediately recognizes the compensation expense. If thean award is later modified, the Company may measure the award based on the estimated fair value at the modification date and recognize expense over the remaining requisite employee service period or performance period. The Company accounts for forfeitures of stock-based awards as they occur.
The Company has an amended and restated long-term incentive plan (the "Plan") under which the Company may grant future awards. OnIn March 7, 2018,2021, the Company’s Board of Directors (the “Board”) approved an amendment to the Plan that increased the number of shares of common stock available under the Plan from 2,975,0003,775,000 to 3,775,000. Company4,775,000. The Company's stockholders approved the Plan amendment onin May 8, 2018.2021. Forfeited and expired optionsawards under the Plan generally become generally available for reissuance. AtAs of December 31, 2020, 647,9032023, 832,273 shares remained available for grant under the Plan.
60
Stock Grants
Stock-based compensation expense related to vested stock grants arewere included in General and administrative expenses within the Consolidated Statements of (Loss) Income. The Company’s authorized vested stock grants to certain directorsthe Board and related expense for the years ended December 31, 2020, 20192023, 2022 and 2018,2021, was as follows:
|
| Year Ended December 31, |
|
| Year Ended December 31, |
| ||||||||||||||||||
(millions, except stock grants) |
| 2020 |
|
| 2019 |
|
| 2018 |
|
| 2023 |
|
| 2022 |
|
| 2021 |
| ||||||
Vested stock grants |
|
| 25,066 |
|
|
| 14,076 |
|
|
| 12,736 |
|
|
| 18,660 |
|
|
| 14,635 |
|
|
| 13,420 |
|
Stock-based compensation expense |
| $ | 0.5 |
|
| $ | 0.5 |
|
| $ | 0.5 |
|
| $ | 0.6 |
|
| $ | 0.4 |
|
| $ | 0.5 |
|
Restricted Stock Units ("RSU's")
NaN restricted stock units were granted during the year ended December 31, 2020.
During the year ended December 31, 2019,2023, the Company granted of 37,235126,931 restricted stock units to certain executives that vest over three years from the grant date..
During the year ended December 31, 2018,2022, the Company granted of 48,6631,057 and 8,426187,574 restricted stock units to certain executives and employees at a weighted average grant-date fair value of $31.82that vest over one and three years, respectively.
During the year ended December 31, 2021, the Company granted 160,843 and five years from the grant date, respectively.
Nonvested152,659 restricted stock units to certain executives and employees at a weighted average grant-date fair value of $34.45 that vested over two and three years, respectively.
On October 23, 2023, the Board approved a change in the vesting date for the RSU’s granted in 2021 that were originally expected to vest as of December 31, 2020,2023, to December 1, 2023. The change in the vesting date was considered a Type 1 modification, as the acceleration of the vesting date did not change the expectation that the awards would ultimately vest, and accordingly, the remaining compensation expense related to the awards was recognized and did not result in any additional compensation expense.
45
Nonvested RSU's as of December 31, 2023, and changes during the year ended December 31, 20202023 were as follows:
| Shares |
|
| Weighted |
| |||
Nonvested as of December 31, 2022 |
|
| 338,448 |
|
| $ | 33.28 |
|
Granted |
|
| 126,931 |
|
|
| 34.57 |
|
Vested |
|
| (167,620 | ) |
|
| 35.00 |
|
Forfeited |
|
| (6,972 | ) |
|
| 33.83 |
|
Nonvested as of December 31, 2023 |
|
| 290,787 |
|
| $ | 32.89 |
|
During the years ended December 31, 2022 and 2021, 188,887 and 5,615 RSU's, respectively, vested at a weighted average grant-date fair value of $33.88 and $26.71, respectively.
|
| Shares |
|
| Weighted Average Grant-Date Fair Value |
| ||
Nonvested as of December 31, 2019 |
|
| 153,442 |
|
| $ | 27.46 |
|
Granted |
|
| — |
|
|
| — |
|
Vested |
|
| (102,166 | ) |
|
| 24.56 |
|
Forfeited |
|
| — |
|
|
| — |
|
Nonvested as of December 31, 2020 |
|
| 51,276 |
|
| $ | 33.24 |
|
The Company's stock-based compensation expense related to the restricted stock units forRSU's during the years ended December 31, 2020, 20192023, 2022 and 2018,2021, which iswas included in General and administrative expenses within the Consolidated Statements of (Loss) Income, was as follows:
| Year Ended December 31, |
| ||||||||||
(millions) |
| 2023 |
|
| 2022 |
|
| 2021 |
| |||
Stock-based compensation expense |
| $ | 5.1 |
|
| $ | 5.7 |
|
| $ | 4.6 |
|
|
| Year Ended December 31, |
| |||||||||
(millions) |
| 2020 |
|
| 2019 |
|
| 2018 |
| |||
Stock-based compensation expense |
| $ | 1.1 |
|
| $ | 1.1 |
|
| $ | 0.9 |
|
Unrecognized stock-based compensation expense related to restricted stock unitsRSU's and the respective weighted average periods in which the expense will be recognized as of December 31, 20202023 was as follows:
|
| Year Ended December 31, |
|
| Year Ended December 31, |
| ||
(millions) |
| 2020 |
|
| 2023 |
| ||
Unrecognized stock-based compensation |
| $ | 0.6 |
|
| $ | 5.4 |
|
Weighted average (years) |
| 1.2 years |
|
|
| 1.7 |
| |
Performance Share Units (“PSU’s”)
In September 2014, the Board authorized a performance-based incentive program under the Plan (“Performance-based Incentive Program”), whereby the Company may issue PSU’s to certain individuals that represent shares potentially issuable in the future. The objective of the Performance-Based Incentive Program is to link compensation to business performance, encourage the ownership of the Company’s common stock, retain key employees and reward management’sexecutives' performance. The Performance-Based Incentive Program provides participants with the opportunity to earn vested common stock if certain performance targets for pre-tax cash flow are achieved over the cumulative three-year period starting in the year of grant and the participants satisfy service-based vesting requirements. The stock-based compensation expense associated with nonvested PSU’s is recognized on a straight-line basis over the shorter of the vesting period or minimum service period and dependent upon the probable outcome of the number of shares that will ultimately be issued based on the achievement of pre-tax cash flowthe performance target defined in the award over the cumulative three-year period.
The Company granted awards during the years ended December 31, 2020, 20192023, 2022 and 20182021 of 96,056, 125,232126,921, 132,304 and 100,715,50,868, respectively, under the Performance-Based Incentive Program.Program at a weighted average grant-date fair value of $34.57, $30.80 and $34.97, respectively. The performance target for the PSU awards is based on the achievement of free cash flow before cash taxesa certain level of operating income, excluding depreciation and interest payments over the cumulative three-year period starting in the year of grant,amortization, subject to certain discretionary adjustments by the Board.Board, over three-year performance periods. The ultimate number of shares issued could change depending on the Company’sCompany's results over the performance period. The maximum amount of shares that could be issued for the PSU awards granted in 2020 (“2020 PSU’s)2023 ("2023 PSU's") and 2019 (“2019 PSU’s)2022 ("2022 PSU's") are 253,842 and 258,114, are 181,504respectively. The Company is currently recognizing expense for the 2023 PSU's and 227,478,2022 PSU's based on an expected payout of 129,459 shares and 196,167 shares, respectively.
Due to the impact of COVID-19 on the Company’s operations, during the year ended December 31, 2020, the Compensation Committee ofOn October 23, 2023, the Board modifiedapproved a change in the performance targetvesting date for the awardsPSU’s granted in 20182021 (“20182021 PSU’s”), as well as evaluated qualitative performance factors for the Company during 2020, which resulted in achievement of 95% of the target for the 2018 PSU’s. The 2018 PSU’s vested that were originally expected to vest as of December 31, 2020.2023, to December 1, 2023. In addition, the Board approved the maximum payout for the awards. The Company concluded this determination washad been recognizing expense based on the maximum payout before the modification. The changes to the 2021 PSU’s noted above were considered a Type III1 modification, and compensation expense was recorded based onas the fair value of the awards atbefore and after the date of modification. Hadmodification were the Compensation Committee not made this determination,same, and accordingly, the Company would have recorded noremaining compensation expense related to the 2018 PSU’s. The performance targets for the 2019 and 2020 PSU’s have not been amended. As such, during the year ended December 31, 2020, $1.4 million of compensation expense related to the
61
20192021 PSU’s was reversed, since the Company no longer expected the required performance targets to be achieved. In addition, the Company hasrecognized and did not recordedresult in any additional compensation expense related to the 2020 PSU’s.expense.
Nonvested PSU’s as of December 31, 2020,2023, and changes during the year ended December 31, 2020 was2023 were as follows:
|
| Shares |
|
| Weighted |
| ||
Nonvested as of December 31, 2022 |
|
| 177,605 |
|
| $ | 31.94 |
|
Granted |
|
| 126,921 |
|
|
| 34.57 |
|
2021 PSU's(1) |
|
| 47,730 |
|
|
| 34.97 |
|
Vested |
|
| (95,460 | ) |
|
| 34.97 |
|
Forfeited |
|
| (5,334 | ) |
|
| 33.48 |
|
Nonvested as of December 31, 2023 |
|
| 251,462 |
|
| $ | 32.66 |
|
During the years ended December 31, 2022 and 2021, 80,979 and 112,328 PSU’s, respectively, expired at a weighted average grant-date fair value of $37.89 and $33.28, respectively, due to the performance targets not being met.
|
| Shares |
|
| Weighted Average Grant-Date Fair Value |
| ||
Nonvested as of December 31, 2019 |
|
| 212,096 |
|
| $ | 35.01 |
|
Granted |
|
| 96,056 |
|
|
| 37.89 |
|
Vested |
|
| (81,115 | ) |
|
| 30.01 |
|
Forfeited |
|
| (23,173 | ) |
|
| 36.27 |
|
Expired |
|
| (3,646 | ) |
|
| 37.59 |
|
Nonvested as of December 31, 2020 |
|
| 200,218 |
|
| $ | 35.27 |
|
46
The Company's stock-based compensation expense (net reduction of expense) related to PSU’s during the years ended December 31, 2020, 20192023, 2022 and 2018,2021, which iswas included in General and administrative expenses within the Consolidated Statements of (Loss) Income, was as follows:
| Year Ended December 31, |
| ||||||||||
(millions) |
| 2023 |
|
| 2022 |
|
| 2021 |
| |||
Stock-based compensation expense |
| $ | 4.7 |
|
| $ | 2.9 |
|
| $ | 1.0 |
|
|
| Year Ended December 31, |
| |||||||||
(millions) |
| 2020 |
|
| 2019 |
|
| 2018 |
| |||
Stock-based compensation expense |
| $ | (1.0 | ) |
| $ | 3.3 |
|
| $ | 1.4 |
|
Unrecognized stock-based compensation expense related to PSU’s based on current projections and the respective weighted average periods in which the expense will be recognized as of December 31, 2023 was as follows:
| Year Ended December 31, |
| ||
(millions) |
| 2023 |
| |
Unrecognized stock-based compensation |
| $ | 5.1 |
|
Weighted average (years) |
|
| 1.6 |
|
Since theThe Company no longer expects the required performance targets to be achievedcould recognize additional future stock-based compensation of $4.2 million and $1.9 million for the 20192023 PSU's and 2020 PSU’s, no future compensation expense is expected to be recognized; however, future compensation expense for2022 PSU's, respectively, if the 2019 and 2020 PSU’s could reach a maximum of $14.1 million if certain performance targets are achieved.
8. Leasehold Improvements,7. Property and Equipment, net
Property and Construction in Progress, net
Leasehold improvements, equipment, and construction in progress andthe related accumulated depreciation and amortization for the years endedas of December 31, 20202023 and 2019,2022, were as follows:
|
|
|
| December 31 |
|
| December 31 |
| ||||||||||||
(millions) |
| Estimated Useful Life |
| 2020 |
|
| 2019 |
|
| Estimated Useful Life |
| 2023 |
|
| 2022 |
| ||||
Equipment |
| 1 - 10 Years |
| $ | 50.1 |
|
| $ | 45.2 |
|
| 1 - 10 Years |
| $ | 58.9 |
|
| $ | 54.5 |
|
Software |
| 2 - 5 Years |
|
| 42.3 |
|
|
| 39.7 |
|
| 3 Years |
|
| 74.2 |
|
|
| 61.0 |
|
Vehicles |
| 1 - 10 Years |
|
| 37.3 |
|
|
| 30.0 |
|
| 1 - 10 Years |
|
| 40.4 |
|
|
| 39.0 |
|
Other |
| 3 Years |
|
| 0.8 |
|
|
| 0.6 |
|
| 3 Years |
|
| 1.5 |
|
|
| 1.3 |
|
|
| Shorter of lease term or economic life up to |
|
|
|
|
|
|
|
|
| Shorter of lease term or economic life up to |
|
|
|
|
|
| ||
Leasehold improvements |
| 10 years |
|
| 18.0 |
|
|
| 18.8 |
|
| 10 years |
|
| 16.8 |
|
|
| 16.7 |
|
Construction in progress |
|
|
|
| 6.8 |
|
|
| 6.3 |
|
|
|
|
| 9.1 |
|
|
| 6.9 |
|
|
|
|
|
| 155.3 |
|
|
| 140.6 |
| ||||||||||
Property and equipment, gross |
|
|
|
| 200.9 |
|
|
| 179.4 |
| ||||||||||
Accumulated depreciation and amortization |
|
|
|
| (102.0 | ) |
|
| (92.7 | ) |
|
|
|
| (132.6 | ) |
|
| (119.2 | ) |
Leasehold improvements, equipment and construction in |
|
|
|
|
|
|
|
|
|
| ||||||||||
progress, net |
|
|
| $ | 53.3 |
|
| $ | 47.9 |
| ||||||||||
Property and equipment, net |
|
|
| $ | 68.3 |
|
| $ | 60.2 |
| ||||||||||
Asset additions are recorded at cost, which includes interest on significant projects. Depreciation is recorded on a straight-line basis over theirthe estimated useful liveslives. For leasehold improvements, depreciation is recorded over the estimated useful life or the terms of the respective leases, whichever is shorter. Leasehold improvements,Property and equipment and construction in progress areis reviewed for impairment when conditions indicate an impairment.impairment may be present. If the assets are determined to be impaired, they are either written down to their estimated fair value or the useful life is adjusted to the remaining period of the estimated remaining useful life.
The Company's depreciation and amortization expense related to leasehold improvementsproperty and equipment forduring the years ended December 31, 2020, 20192023, 2022 and 2018,2021, which was included in Depreciation and amortization expense within the Consolidated Statements of (Loss) Income, was as follows:
| Year Ended December 31, |
| ||||||||||
(millions) |
| 2023 |
|
| 2022 |
|
| 2021 |
| |||
Depreciation expense and amortization |
| $ | 24.1 |
|
| $ | 19.8 |
|
| $ | 16.4 |
|
|
| Year Ended December 31, |
| |||||||||
(millions) |
| 2020 |
|
| 2019 |
|
| 2018 |
| |||
Depreciation expense and amortization |
| $ | 15.3 |
|
| $ | 12.8 |
|
| $ | 9.6 |
|
9. Cost of Contracts, net
Cost of contracts, net, as of December 31, 2020 and 2019 was as follows:
|
| December 31, |
| |||||
(millions) |
| 2020 |
|
| 2019 |
| ||
Cost of contracts |
| $ | 26.0 |
|
| $ | 26.0 |
|
Accumulated amortization |
|
| (21.2 | ) |
|
| (21.7 | ) |
Cost of contracts, net |
| $ | 4.8 |
|
| $ | 4.3 |
|
The table below shows the Company's amortization expense related to costs of contracts for the years ended December 31, 2020, 2019 and 2018, which was primarily included in Depreciation and amortization within the Consolidated Statements of (Loss) Income.
62
|
| Year Ended December 31, |
| |||||||||
(millions) |
| 2020 |
|
| 2019 |
|
| 2018 |
| |||
Amortization expense |
| $ | 1.6 |
|
| $ | 1.9 |
|
| $ | 3.0 |
|
Weighted average life (years) |
|
| 7.8 |
|
|
| 10.0 |
|
|
| 9.4 |
|
10.8. Other Intangible Assets, net
The components of other intangible assets, net, foras of December 31, 2023 and 2022, were as follows:
|
|
|
| December 31, |
| |||||||||||||||||||||||
|
|
|
| 2023 |
|
| 2022 |
| ||||||||||||||||||||
| Weighted |
|
|
|
|
|
|
|
|
|
|
|
|
|
|
|
|
|
|
| ||||||||
|
| Average |
|
| Intangible |
|
|
|
|
| Intangible |
|
| Intangible |
|
|
|
|
| Intangible |
| |||||||
| Life |
|
| Assets, |
|
| Accumulated |
|
| Assets, |
|
| Assets, |
|
| Accumulated |
|
| Assets, |
| ||||||||
(millions) |
| (Years) |
|
| Gross |
|
| Amortization |
|
| Net |
|
| Gross |
|
| Amortization |
|
| Net |
| |||||||
Management contract rights |
|
| 5.6 |
|
| $ | 81.0 |
|
| $ | (58.0 | ) |
| $ | 23.0 |
|
| $ | 81.0 |
|
| $ | (52.9 | ) |
| $ | 28.1 |
|
Proprietary know how |
|
| 6.1 |
|
|
| 24.1 |
|
|
| (6.2 | ) |
|
| 17.9 |
|
|
| 21.7 |
|
|
| (2.7 | ) |
|
| 19.0 |
|
Customer relationships |
|
| 7.8 |
|
|
| 25.1 |
|
|
| (8.9 | ) |
|
| 16.2 |
|
|
| 24.8 |
|
|
| (6.6 | ) |
|
| 18.2 |
|
Trade names and trademarks |
|
| 12.5 |
|
|
| 3.0 |
|
|
| (1.2 | ) |
|
| 1.8 |
|
|
| 2.8 |
|
|
| (0.7 | ) |
|
| 2.1 |
|
Covenant not to compete |
|
| 3.7 |
|
|
| 2.9 |
|
|
| (2.1 | ) |
|
| 0.8 |
|
|
| 2.9 |
|
|
| (1.4 | ) |
|
| 1.5 |
|
Other intangible assets, net |
|
| 6.5 |
|
| $ | 136.1 |
|
| $ | (76.4 | ) |
| $ | 59.7 |
|
| $ | 133.2 |
|
| $ | (64.3 | ) |
| $ | 68.9 |
|
Amortization expense related to other intangible assets during the years ended December 31, 20202023, 2022 and 2019 were as follows:
|
|
|
|
|
| December 31, |
| |||||||||||||||||||||
|
|
|
|
|
| 2020 |
|
| 2019 |
| ||||||||||||||||||
|
| Weighted |
|
| Acquired |
|
|
|
|
|
| Acquired |
|
| Acquired |
|
|
|
|
|
| Acquired |
| |||||
|
| Average |
|
| Intangible |
|
|
|
|
|
| Intangible |
|
| Intangible |
|
|
|
|
|
| Intangible |
| |||||
|
| Life |
|
| Assets, |
|
| Accumulated |
|
| Assets, |
|
| Assets, |
|
| Accumulated |
|
| Assets, |
| |||||||
(millions) |
| (Years) |
|
| Gross |
|
| Amortization |
|
| Net |
|
| Gross |
|
| Amortization |
|
| Net |
| |||||||
Covenant not to compete |
|
| 2.1 |
|
| $ | 2.9 |
|
| $ | (1.3 | ) |
| $ | 1.6 |
|
| $ | 2.9 |
|
| $ | (0.3 | ) |
| $ | 2.6 |
|
Trade names and trademarks |
|
| 2.9 |
|
|
| 0.9 |
|
|
| (0.2 | ) |
|
| 0.7 |
|
|
| 5.6 |
|
|
| (1.2 | ) |
|
| 4.4 |
|
Proprietary know how |
|
| 3.7 |
|
|
| 3.8 |
|
|
| (0.4 | ) |
| $ | 3.4 |
|
|
| 10.4 |
|
|
| (2.0 | ) |
|
| 8.4 |
|
Management contract rights |
|
| 8.1 |
|
|
| 81.0 |
|
|
| (42.6 | ) |
|
| 38.4 |
|
|
| 81.0 |
|
|
| (37.4 | ) |
|
| 43.6 |
|
Customer relationships |
|
| 12.9 |
|
|
| 21.5 |
|
|
| (2.5 | ) |
| $ | 19.0 |
|
|
| 100.4 |
|
|
| (7.2 | ) |
|
| 93.2 |
|
Acquired intangible assets, net |
|
| 9.1 |
|
| $ | 110.1 |
|
| $ | (47.0 | ) |
| $ | 63.1 |
|
| $ | 200.3 |
|
| $ | (48.1 | ) |
| $ | 152.2 |
|
The table below shows the amortization expense related to intangible assets for the years ended December 31, 2020, 2019 and 2018,2021, which was included in Depreciation and amortization within the Consolidated Statements of (Loss) Income.Income, was as follows:
| Year Ended December 31, |
| ||||||||||
(millions) |
| 2023 |
|
| 2022 |
|
| 2021 |
| |||
Amortization expense |
| $ | 12.0 |
|
| $ | 9.9 |
|
| $ | 8.7 |
|
|
| Year Ended December 31, |
| |||||||||
(millions) |
| 2020 |
|
| 2019 |
|
| 2018 |
| |||
Amortization expense |
| $ | 13.2 |
|
| $ | 15.1 |
|
| $ | 6.1 |
|
47
The expected future amortization of other intangible assets as of December 31, 20202023 was as follows:
(millions) |
| Intangible asset |
| |
2024 |
| $ | 11.6 |
|
2025 |
|
| 10.5 |
|
2026 |
|
| 10.0 |
|
2027 |
|
| 6.9 |
|
2028 |
|
| 6.6 |
|
2029 and thereafter |
|
| 14.1 |
|
Total |
| $ | 59.7 |
|
(millions) |
| Intangible asset amortization |
| |
2021 |
| $ | 8.7 |
|
2022 |
|
| 8.1 |
|
2023 |
|
| 8.0 |
|
2024 |
|
| 7.3 |
|
2025 |
|
| 6.6 |
|
2026 and thereafter |
|
| 24.4 |
|
Total |
| $ | 63.1 |
|
9. Goodwill
As discussed in Note 1. Significant Accounting Policies and Practices, the Company determined impairment testing triggers had occurred for certain intangible assets. The fair value of these intangible assets were classified as Level 3 in the fair value hierarchy.
Due to the impact of COVID-19 on the Company's expected future operating cash flows, the Company analyzed undiscounted cash flows as of June 30, 2020 and determined the carrying value for a proprietary know how asset was higher than its projected undiscounted cash flows. As a result, the Company recorded $3.7 million of impairment charges within the Aviation segment during the year ended December 31, 2020 which was recognized in Impairment of goodwill and intangible assets in the Consolidated Statements of (Loss) Income.
Additionally, due to the termination of certain contracts within the Aviation segment during August 2020 and the impact of COVID-19 on the Company's expected future operating cash flows, the Company analyzed undiscounted cash flows as of August 31, 2020 and determined the carrying values for the customer relationships and trade names and trademarks were higher than their projected undiscounted cash flows. As a result, the Company recorded $72.1 million of impairment charges within the Aviation segment during the year ended December 31, 2020 which was recognized in Impairment of goodwill and intangible assets in the Consolidated Statements of (Loss) Income. See Note 12. Fair Value Measurement for further discussion.
NaN impairment charges were recorded during the years ended December 31, 2019 and 2018.
63
11. Goodwill
The changes in the carrying amounts of goodwill forduring the years ended December 31, 20202023 and 20192022 were as follows:
(millions) |
| Commercial |
|
| Aviation |
|
| Total |
| |||
Net book values as of January 1, 2019 |
|
|
|
|
|
|
|
|
|
|
|
|
Goodwill |
| $ | 376.8 |
|
| $ | 208.7 |
|
| $ | 585.5 |
|
Accumulated impairment losses |
|
| — |
|
|
| — |
|
|
| — |
|
Total |
| $ | 376.8 |
|
| $ | 208.7 |
|
| $ | 585.5 |
|
Purchase price adjustments |
|
| 0 |
|
|
| 0.3 |
|
|
| 0.3 |
|
Foreign currency translation |
|
| 0.2 |
|
|
| 0 |
|
|
| 0.2 |
|
Net book value as of December 31, 2019 |
|
|
|
|
|
|
|
|
|
|
|
|
Goodwill |
| $ | 377.0 |
|
| $ | 209.0 |
|
| $ | 586.0 |
|
Accumulated impairment losses |
|
| — |
|
|
| — |
|
|
| — |
|
Total |
| $ | 377.0 |
|
| $ | 209.0 |
|
| $ | 586.0 |
|
Impairment |
|
| — |
|
|
| (59.5 | ) |
|
| (59.5 | ) |
Foreign Currency translation |
|
| 0.1 |
|
|
| 0 |
|
|
| 0.1 |
|
Net book value as of December 31, 2020 |
|
|
|
|
|
|
|
|
|
|
|
|
Goodwill |
| $ | 377.1 |
|
| $ | 209.0 |
|
| $ | 586.1 |
|
Accumulated impairment losses |
|
| — |
|
|
| (59.5 | ) |
|
| (59.5 | ) |
Total |
| $ | 377.1 |
|
| $ | 149.5 |
|
| $ | 526.6 |
|
In July 2020, the Company changed its internal reporting structure. All prior periods presented have been reclassified to reflect the new internal reporting structure. See Note 20. Segment Information
(millions) |
| Commercial |
|
| Aviation |
|
| Total |
| |||
Net book values as of January 1, 2022 |
|
|
|
|
|
|
|
|
| |||
Goodwill |
| $ | 377.1 |
|
| $ | 209.0 |
|
| $ | 586.1 |
|
Accumulated impairment losses |
|
| — |
|
|
| (59.5 | ) |
|
| (59.5 | ) |
Total |
| $ | 377.1 |
|
| $ | 149.5 |
|
| $ | 526.6 |
|
Acquisitions |
|
| 10.1 |
|
|
| 6.2 |
|
|
| 16.3 |
|
Foreign currency translation |
|
| (0.2 | ) |
|
| 0.5 |
|
|
| 0.3 |
|
Net book value as of December 31, 2022 |
|
|
|
|
|
|
|
|
| |||
Goodwill |
| $ | 387.0 |
|
| $ | 215.7 |
|
| $ | 602.7 |
|
Accumulated impairment losses |
|
| — |
|
|
| (59.5 | ) |
|
| (59.5 | ) |
Total |
| $ | 387.0 |
|
| $ | 156.2 |
|
| $ | 543.2 |
|
Acquisitions |
|
| 1.0 |
|
|
| — |
|
|
| 1.0 |
|
Foreign currency translation |
|
| 0.1 |
|
|
| 0.3 |
|
|
| 0.4 |
|
Net book value as of December 31, 2023 |
|
|
|
|
|
|
|
|
| |||
Goodwill |
| $ | 388.1 |
|
| $ | 216.0 |
|
| $ | 604.1 |
|
Accumulated impairment losses |
|
| — |
|
|
| (59.5 | ) |
|
| (59.5 | ) |
Total |
| $ | 388.1 |
|
| $ | 156.5 |
|
| $ | 544.6 |
|
for further discussion.
As discussed in Note 1. Significant Accounting Policies and Practices, due to the impacts of COVID-19, revenues for certain markets in which the Company operates have dropped significantly as compared to the expectations as of the October 1, 2019 annual impairment test. The Company does not know how long COVID-19 and its effects will continue to impact results of the Company. In addition, certain Aviation contracts were terminated in August 2020. The termination of these contracts and the ongoing impacts of COVID-19 on the Company’s expected future operating cash flows triggered the Company to complete a quantitative goodwill impairment analysis as of August 31, 2020 for the Aviation reporting unit. Accordingly, the Company determined the carrying value for the Aviation reporting unit was higher than its implied fair value. The implied fair value was determined based on cash flow projections that assume certain future revenue and cost levels, comparable marketplace data, assumed discount rates based upon current market conditions and other valuation factors. As a result, the Company recorded $59.5 million of impairment charges during the year ended December 31, 2020, which was recognized in Impairment of goodwill and intangible assets in the Consolidated Statements of (Loss) Income. The fair value of goodwill was classified as Level 3 in the fair value hierarchy. See Note 12 10. Fair Value Measurement for further discussion.
As of December 31, 2020 the Company performed a qualitative, rather than a quantitative, assessment to determine whether it is more likely than not that the fair value of a reporting unit was less than its carrying amount. Generally, the more-likely-than-not-threshold is a greater than 50% likelihood that the fair value of a reporting unit is greater than the carrying value. In performing the qualitative analysis, the Company considered various factors, including the Company’s stock price as of December 31, 2020 and the reporting units’ actual results compared to projections used in the August 31, 2020 goodwill impairment analysis. Based on this qualitative analysis, the Company concluded there was no further impairment testing required. If the impacts from COVID-19 exceed the Company’s current expectations, additional impairment charges could be recorded in future periods.
12. Fair Value Measurement
Fair Value Measurements-Recurring Basis
In determining fair value, the Company uses various valuation approaches within the fair value measurement framework. Fair value measurements are determined based on the assumptions that market participants would use in pricing an asset or liability. Applicable accounting literature establishes a hierarchy for inputs used in measuring fair value that maximizes the use of observable inputs and minimizes the use of unobservable inputs by requiring that the most observable inputs be used when available. The fair value hierarchy is based on observable or unobservable inputs to valuation techniques that are used to measure fair value. Observable inputs reflect assumptions market participants would use in pricing an asset or liability based on market data obtained from independent sources while unobservable inputs reflect a reporting entity'sthe Company's pricing based upon its own market assumptions. Applicable accounting literature defines levels within the hierarchy based on the reliability of inputs as follows:
| • Level 1: Inputs are quoted prices in active markets for identical assets or liabilities. • Level 2: Inputs are quoted prices for similar assets or liabilities in an active market, quoted prices for identical or similar assets or liabilities in markets that are not active, and inputs other than quoted prices that are observable and market-corroborated inputs, which are derived principally from or corroborated by observable market data. • Level 3: Inputs that are derived from valuation techniques in which one or more significant inputs or value drivers are unobservable.
|
|
|
|
|
|
Cash and cash equivalents are financial assets measured at fair value on a recurring basis. See Note 1. Significant Accounting Policies and Practices for further discussion. Interest rate collars
Contingent consideration liabilities are financial liabilities measured at fair value on a recurring basis.basis using Level 3 inputs under the fair value hierarchy. The Company is subject to contingent consideration arrangements in connection with the acquisition of certain assets of DIRVT, as well as the purchase of a former minority partner’s share in a joint venture with the Company. Liabilities for contingent consideration are measured at fair value each reporting period, with the acquisition-date fair value for DIVRT included as part of the consideration payable for the acquired assets and subsequent changes in fair value recorded in operating expenses within the Consolidated Statements of Income. Subsequent changes in the fair value of the contingent consideration related to the purchase of a former minority partner’s share in a joint venture are recorded in Additional paid-in capital within the Consolidated Balance Sheets. See Note 13. 1. Borrowing ArrangementsSignificant Accounting Policies and Practices and Note 2. Acquisitions for further discussion.
Changes to the contingent consideration during the years ended December 31, 2023 and 2022 were as follows:
(millions) |
| 2023 |
|
| 2022 |
| ||
Balance, beginning of year |
| $ | 4.1 |
|
| $ | — |
|
Acquisitions |
|
| — |
|
|
| 4.0 |
|
Additions |
|
| 1.0 |
|
|
| — |
|
Changes in fair value |
|
| 0.4 |
|
|
| 0.1 |
|
Balance, end of year |
| $ | 5.5 |
|
| $ | 4.1 |
|
Nonrecurring Fair Value Measurements
64
Certain assets are measured at fair value on a nonrecurring basis, generally as a result of acquisitions or the remeasurement of assets resulting in impairment charges. The purchase price of business acquisitions is primarily allocated to the tangible and identifiable intangible assets acquired and liabilities assumed based
48
on their estimated fair values on the acquisition dates, with the excess, if applicable, recorded as goodwill. The Company utilizes Level 3 inputs in the determination of the initial fair value using certain assumptions. See Note 3. Acquisition for further discussion.
Non-financial assets, such as goodwill, other intangible assets, and leasehold improvements,property and equipment and construction in progress are subsequently measured at fair value when there is an indicator of impairment and recorded at fair value when impairment is recognized. The Company assesses the impairment of intangible assets annually or whenever events or changes in circumstances indicate that the carrying amount of an intangible asset may not be recoverable. The fair value of the Company’s goodwill andor other intangible assets are not estimated if there is no change in events or circumstances that indicate the carrying amount of the goodwill and intangible assets may not be recoverable. During the years ended December 31, 2022 and 2021, the Company measured certain assets at fair value, which resulted in impairment charges. The fair value of these assets were determined using a discounted cash flow (“DCF”) model, which estimated the present value of net cash flows that the asset or asset group was expected to generate. The key inputs to the DCF model included the Company’s future projections of cash operating income, capital expenditures and current discount rates.
During the year ended December 31, 2023, the Company did not recognize impairment charges.
For those assets and asset groups for which impairment was recorded, the fair value as of the measurement date, net book value as of December 31, 20202022 and related impairment charges during2021, and the year ended December 31, 2020 were as follows:
|
|
| As of Measurement Date |
|
| As of December 31, 2020 |
| ||||||
(millions) | Measurement Date |
| Impairment Charge |
|
| Fair Value Measurement (Level 3) |
|
| Net Book Value of Assets Assessed for Impairment |
| |||
ROU assets | March 31, 2020 |
| $ | 77.5 |
|
| $ | 147.4 |
|
|
|
|
|
ROU assets | June 30, 2020 |
|
| 16.7 |
|
|
| 26.2 |
|
|
|
|
|
ROU assets | September 30, 2020 |
|
| 1.6 |
|
|
| 1.6 |
|
|
|
|
|
ROU assets | December 31, 2020 |
|
| 2.9 |
|
|
| 5.0 |
|
|
|
|
|
Total of ROU assets impaired |
|
|
| 98.7 |
|
|
| 180.2 |
|
|
| 121.4 |
|
Goodwill - Aviation reporting unit | August 31, 2020 |
|
| 59.5 |
|
|
| 149.5 |
|
|
| 149.5 |
|
Proprietary know how | June 30, 2020 |
|
| 3.7 |
|
|
| 3.9 |
|
|
|
|
|
Customer relationships | August 31, 2020 |
|
| 69.2 |
|
|
| 4.6 |
|
|
|
|
|
Trade names and trademarks | August 31, 2020 |
|
| 2.9 |
|
|
| 0.5 |
|
|
|
|
|
Total Other intangible assets, net |
|
|
| 75.8 |
|
|
| 9.0 |
|
|
| 8.3 |
|
There were 0related impairment charges during the years ended December 31, 20192022 and 2018.2021, were as follows:
Year ended December 31, 2022 |
|
| As of |
| |||||||||
|
|
| As of Measurement Date |
|
|
|
| ||||||
(millions) | Measurement Date |
| Impairment Charge |
|
| Fair Value Measurement (Level 3) |
|
| Net Book Value of Assets Assessed for Impairment |
| |||
ROU assets | December 31, 2022 |
| $ | 3.7 |
|
| $ | 4.7 |
|
|
|
| |
Total of ROU assets impaired |
|
| $ | 3.7 |
|
| $ | 4.7 |
|
| $ | 4.7 |
|
|
|
|
|
|
|
|
|
|
|
| |||
Year ended December 31, 2021 |
|
| As of |
| |||||||||
|
|
| As of Measurement Date |
|
|
|
| ||||||
(millions) | Measurement Date |
| Impairment Charge |
|
| Fair Value Measurement (Level 3) |
|
| Net Book Value of Assets Assessed for Impairment |
| |||
ROU assets | March 31, 2021 |
| $ | 0.1 |
|
| $ | — |
|
|
|
| |
ROU assets | September 30, 2021 |
|
| 3.5 |
|
|
| 2.0 |
|
|
|
| |
Total of ROU assets impaired |
|
| $ | 3.6 |
|
| $ | 2.0 |
|
| $ | 1.9 |
|
Financial Instruments Not Measured at Fair Value
The fair value of the Senior Credit Facility and other obligations approximates the carrying amount due to variable interest rates and would be classified as Level 2.2 in the fair value hierarchy. See Note 13. 11. Borrowing Arrangements for further information.
13.11. Borrowing Arrangements
Long-term borrowings, as of December 31, 20202023 and 2019,2022, in order of preference, were as follows:
|
|
| Amount Outstanding |
| ||||||
|
|
| December 31, |
| ||||||
(millions) |
| Maturity Date |
| 2023 |
|
| 2022 |
| ||
Senior Credit Facility, net of original discount on borrowings (1) |
| April 21, 2027 |
| $ | 328.6 |
|
| $ | 322.3 |
|
Other borrowings (2) |
| Various |
|
| 25.2 |
|
|
| 24.3 |
|
Deferred financing costs |
|
|
|
| (1.7 | ) |
|
| (2.4 | ) |
Total obligations |
|
|
|
| 352.1 |
|
|
| 344.2 |
|
Less: Current portion of long-term borrowings |
|
|
|
| 16.5 |
|
|
| 12.4 |
|
Long-term borrowings, excluding current portion |
|
|
| $ | 335.6 |
|
| $ | 331.8 |
|
|
|
|
| Amount Outstanding |
| |||||
|
|
|
| December 31, |
| |||||
(millions) |
| Maturity Date |
| 2020 |
|
| 2019 |
| ||
Senior Credit Facility, net of original discount on borrowings (1) |
| November 30, 2023 |
| $ | 332.3 |
|
| $ | 347.5 |
|
Other borrowings |
| Various |
|
| 31.5 |
|
|
| 23.1 |
|
Deferred financing costs |
|
|
|
| (1.7 | ) |
|
| (1.6 | ) |
Total obligations under Senior Credit Facility and other borrowings |
|
|
|
| 362.1 |
|
|
| 369.0 |
|
Less: Current portion of obligations under Senior Credit Facility and other borrowings |
|
|
|
| 25.0 |
|
|
| 17.9 |
|
Total long-term obligations under Senior Credit Facility and other borrowings |
|
|
| $ | 337.1 |
|
| $ | 351.1 |
|
|
|
At December 31, 2020, the2023 and 2022, respectively.
The future maturities of debt, including capitalizedfinance leases, as of December 31, 2023, were as follows:
(millions) |
|
|
| |
2024 |
| $ | 17.4 |
|
2025 |
|
| 15.7 |
|
2026 |
|
| 14.7 |
|
2027 |
|
| 303.6 |
|
2028 |
|
| 1.6 |
|
Thereafter |
|
| 1.8 |
|
Total |
| $ | 354.8 |
|
(millions) |
|
|
|
|
2021 |
| $ | 26.3 |
|
2022 |
|
| 23.6 |
|
2023 |
|
| 305.7 |
|
2024 |
|
| 3.1 |
|
2025 |
|
| 1.4 |
|
Thereafter |
|
| 4.6 |
|
Total |
| $ | 364.7 |
|
Senior Credit Facility
On February 16, 2021April 21, 2022 (the “Fourth“Fifth Amendment Effective Date”), the Company entered into a fourthfifth amendment (the “Fourth“Fifth Amendment”) to the Company’s credit agreement (as amended prior to the FourthFifth Amendment Effective Date, (as defined below), the “Credit Agreement”; the Credit Agreement, as amended by the Fifth Amendment, the “Amended Credit Agreement”) with Bank of America, N.A. (“Bank of America”), as Administrative Agent, swing-line lender and a letter of credit issuer; Wells Fargo Bank, N.A.,certain subsidiaries of the Company, as syndication agent; BMO Harris Bank N.A.,
65
JPMorgan Chase Bank, N.A., KeyBank National Association and U.S. Bank National Association, as co-documentation agents; Merrill Lynch, Pierce, Fenner & Smith Incorporated and Wells Fargo Securities, LLC, as joint lead arrangers and joint bookrunners;guarantors; and the lenders party thereto (the “Lenders”), pursuant to which the Lenders have made available to the Company a senior secured credit facility (the “Senior Credit Facility”). Prior to the Fourth Amendment Effective Date and pursuant to the third amendment (the “Third Amendment”) to our credit agreement, which was entered into on May 6, 2020, theThe Senior Credit Facility permittedpermits aggregate borrowings of $595.0600.0 million consisting of (i) a revolving credit facility of up to $370.0400.0 million at any time outstanding, which includes a letter of credit facility that is limited to $100.0$100.0 million at any time outstanding, and (ii) a term loan facility of $225.0 million (the entire principal amount$200.0 million. The maturity date of which the Company drew on November 30, 2018). Pursuant to the Credit Agreement as amended by the Fourth Amendment (the “Amended Credit Agreement”), the aggregate commitments under the revolving credit facility decreased by $45.0 million to $325.0 million.
Borrowings under the Senior Credit Facility bear interest, at the Company’s option, at a rate per annum based on the Company’s consolidated total debt to EBITDA ratio for the 12-month period ending asis April 21, 2027.
49
Also pursuant to the Fourth Amendment, (a) the Company is subject to a liquidity test that requires the Company to have liquidity of at least $40.0 million at each of March 31, 2021 and June 30, 2021, (b) the Company is subject to a requirement that, at any time cash on hand exceeds $40.0 million for a period of three consecutive business days, the Company must repay revolving loans in an amount equal to such excess. Certain other negative and financial covenants were amended, which included restrictions on certain Investments, Permitted Acquisitions, Restricted Payments and Prepayments of Subordinated Debt (each as defined in the Amended Credit Agreement and described in the Fourth Amendment), through the delivery of the compliance certificate for the fiscal quarters ending March 31, 2022 or June 30, 2022, as applicable.
Prior to the Fourth Amendment Effective Date, the Company was required to maintain a maximum consolidated total debt to EBITDA ratio of between 5.50:1.0 and 3.50:1.0 (with such ratio being waived for the fiscal quarter ended June 30, 2020 and with certain step-ups and step-downs described in, and as calculated in accordance with, the Credit Agreement that were amended under the Fourth Amendment). In addition, the Company was required to maintain a minimum consolidated fixed charge coverage ratio of not less than 3.50:1.0 (with certain step-ups and step-downs described in the Credit Agreement that were amended under the Fourth Amendment). Under the terms of the Fourth Amendment, the maximum consolidated debt to EBITDA ratio will be waived for the quarters ending March 31, 2021 and June 30, 2021. As of December 31, 2020, the maximum total debt to EBITDA ratio (as calculated in accordance with the Amended Credit Agreement) required the Company to maintain a maximum ratio of not greater than 4.75:1.0. Starting with the quarter ending September 30, 2021, the Company will be required to maintain a maximum consolidated total debt to EBITDA ratio (as calculated in accordance with the Fourth Amendment) of not greater than 5.25:1.0 (with certain step-downs described in the Amended Credit Agreement). As of December 31, 2020, the Company was required to maintain a minimum consolidated fixed coverage ratio of not less than 2.50:1.0 (as calculated in accordance with the Amended Credit Agreement). Beginning with the quarter ending March 31, 2021, the Company will be required to maintain a minimum consolidated fixed coverage ratio of not less than 1.60:1:0 (with certain step-ups and step-downs described in the Amended Credit Agreement). On March 31, 2021 and June 30, 2021 only, the Company must maintain $40.0 million of Minimum Liquidity (as described in the Amended Credit Agreement).
The Company incurred approximately $1.2 million for fees and other customary closing costs in connection with the Amended Credit Agreement.
Under the terms of the Amended Credit Agreement, term loans under the Senior Credit Facility are subject to scheduled quarterly payments of principal in installments equal to 1.25% of initial aggregate principal amount of such term loan through the first quarter of 2021 and will increase to 1.875% thereafter.
Events of default under the Credit Agreement include failure to pay principal or interest when due, failure to comply with the financial and operational covenants, the occurrence of any cross default event, non-compliance with other loan documents, the occurrence of a change of control event, and bankruptcy and other insolvency events. If an event of default occurs and is continuing, the Administrative Agent can, with the consent of the required Lenders, among others (i) terminate the commitments under the Credit Agreement, (ii) accelerate and require the Company to repay all the outstanding amounts owed under the Credit Agreement, and (iii) require the Company to cash collateralize any outstanding letters of credit.
Each wholly owned domestic subsidiary of the Company (subject to certain exceptions set forth in the Credit Agreement) has guaranteed all existing and future indebtedness and liabilities of the other guarantors and the Company arising under the Credit Agreement. The Company’s obligations under the Credit Agreement and such domestic subsidiaries’ guaranty obligations are secured by substantially all of their respective assets. The Senior Credit Facility matures on November 30, 2023. The proceeds from the Senior Credit Facility may be used to finance working capital, capital expenditures and acquisitions, as well as for other general corporate purposes. The Amended Credit Agreement did not change the guarantors, collateral, maturity date or permitted uses of proceeds, except as otherwise described above. million for fees and other customary closing costs in connection with the Amended Credit Agreement.
The Company incurred approximately $1.7 million for fees and other customer closing costs in connection with the Third Amendment, which the Company entered into on May 6, 2020.
As of December 31, 2020,2023, the Company was in compliance with its debt covenants under the Amended Credit Agreement.
AtAs of December 31, 2020,2023, the Company had $49.0$36.9 million of letters of credit outstanding under the Senior Credit Facility and borrowings against the Senior Credit Facility aggregated to $333.2$329.5 million.
The weighted average interest rate on the Company's Senior Credit Facility was 6.5% and Former Restated Credit Facility was 3.6% and 3.4% for5.6% during the years ended December 31, 20202023 and 2019,2022, respectively. TheThat rate included all outstanding LIBOR contracts andthe letters of credit.credit for both years and interest rate collars during the year ended December 31, 2022. The weighted average interest rate on all outstanding borrowings, not including letters of credit, was 3.8%7.0% and 3.6% at6.0% during the years ended December 31, 20202023 and 2019,2022, respectively.
InDuring the years ended December 31, 2022 and 2021, the Company incurred approximately $2.5 million and $1.3 million for fees and other customary closing costs in connection with the Fifth Amendment and effective upon the execution and delivery offourth amendment to the Credit Agreement, on November 30, 2018, the Company recognized losses on extinguishment of debt relating to debt discount and debt issuance costs on the former credit facility. These losses were not significant.
66
Table of Contentsrespectively.
Interest Rate Collars
The Company seeks to minimize risks from interest rate fluctuations in the ordinary course of business through the use of interest rate collar contracts. Interest rate collars, which are considered derivative instruments, are used to manage interest rate risk associated with the Company’s floating rate debt. The Company accounts for its derivative instruments at fair value. Derivatives held by the Company are usually designated as hedges of specific exposures at inception, with an expectation that changes in the fair value will essentially offset the change in the underlying exposure. Discontinuance of hedge accounting is required whenever it is subsequently determined that an underlying transaction is not going to occur, with any gains or losses recognized in the Consolidated Statements of (Loss) Income on a straight-line basis over the life of the original designation period, with any subsequent changes in fair value recognized in earnings. In May 2019, the Company entered into three-year interest rate collar contracts with an aggregate notional amount of $222.3 million and maturity dates of$222.3 million. The interest rate collar contracts matured in April 2022. The interest rate collars were used to manage interest rate risk associated with variable interest rate borrowings under the Credit Agreement. The interest rate collars establishestablished a range where the Company will paypaid the counterparties if the one-month LIBOR rate fallsLondon Interbank Offered Rate ("LIBOR") fell below the established floor rate, and the counterparties will paypaid the Company if the one-month LIBOR rate exceedsexceeded the established ceiling rate of 2.5%2.5%. The interest rate collars settlesettled monthly through the termination date of April 2022.maturity date. No payments or receipts arewere exchanged on the interest rate collar contracts unless interest rates riserose above or fallfell below the pre-determined ceiling or floor rates. The notional amount amortized consistently with the term loan portion of the Senior Credit Facility under the Credit Agreement prior to the Third Amendment.third amendment to the Credit Agreement (the “Third Amendment”). The fair value of the interest rate collars iswas a Level 2 fair value measurement, as the fair value was determined based on quoted prices of similar itemsinstruments in active markets. For the year ended December 31, 2020, a liability for Interest rate collars of $3.1 million was included in Other noncurrent liabilities in the Consolidated Balance Sheets and for the year ended December 31, 2019, a liability for Interest rate collars of $0.6 million was included in Accrued and other current liabilities in the Consolidated Balance Sheets. The interest rate collars were classified as cash flow hedges through May 5, 2020.
On May 6, 2020, concurrent with entering into the Third Amendment, the Company de-designated the three-year interest rate collars. Prior to de-designation, the effective portion of the change in the fair value of the interest rate collars was reported in Accumulated other comprehensive loss. Upon de-designation, the balance in Accumulated other comprehensive loss iswas being reclassified to Other income (expense) inexpense within the Consolidated Statements of (Loss) Income on a straight-line basis through April 2022, which iswas over the remaining life for which the interest rate collars had previously been designated as cash flow hedges. Changes in the fair value of the interest rate collars after de-designation arewere included withinin Other income (expense) inexpense within the Consolidated Statements of (Loss) Income. ForDuring the yearyears ended December 31, 2020, $1.62022 and 2021, $0.8 million of interestand $2.5 million was paid for thein interest rate collars.
See Note 18. Comprehensive (Loss) Income for the amount of (loss) gain recognized in Other Comprehensive (loss) income onrelated to the interest rate collars, andrespectively.
See Note 15. Comprehensive Income for the lossamount reclassified from Accumulated other comprehensive loss to Other expense within the Consolidated Statements of (Loss) Income for the years ended December 31, 2020 and 2019.Income.
Summarized information about the Company’s interest rate collars was as follows:
Interest Rate Collars |
| |||||||||||||
December 31, 2020 |
| |||||||||||||
|
|
|
| Interest Rate Parameters |
| |||||||||
(millions) |
| Maturity Date |
| Notional Amount |
|
| LIBOR Ceiling |
|
| LIBOR Floor |
| |||
Collar 1 |
| April 2022 |
| $ | 74.1 |
|
|
| 2.5 | % |
|
| 1.2 | % |
Collar 2 |
| April 2022 |
|
| 74.1 |
|
|
| 2.5 | % |
|
| 1.3 | % |
Collar 3 |
| April 2022 |
|
| 74.1 |
|
|
| 2.5 | % |
|
| 1.4 | % |
Total |
|
|
| $ | 222.3 |
|
|
|
|
|
|
|
|
|
Subordinated Convertible Debentures
The Company acquired Subordinated Convertible Debentures ("Convertible Debentures") as a result of the October 2, 2012 acquisition of Central Parking Corporation. As of October 2, 2012, the convertible debentures were no longer redeemable for shares. The Convertible Debentures mature April 1, 2028 at $25 per share. The subordinated debenture holders have the right to redeem the Convertible Debentures for $19.18$19.18 per share before their stated maturity (April 1, 2028) or upon acceleration or earlier repayment of the Convertible Debentures. There were 0no redemptions of Convertible Debentures during the years ended December 31, 20202023 and 2019,2022, respectively. The approximate redemption value of the Convertible Debentures outstanding at eachas of December 31, 20202023 and December 31, 20192022 was $1.1$1.1 million.
14.12. Stock Repurchase Program
In May 2016, the Board authorized the Company to repurchase, on the open market, shares of the Company's outstanding common stock in an amount not to exceed $30.0 million. Under this program, the entire authorized amount was applied to repurchase 988,767 shares of common stock at an average price of $30.30 resulting in completion of the program in August 2019.
In July 2019, the Board authorized the Company to repurchase, on the open market, shares of the Company's outstanding common stock in an amount not to exceed $50.0 million in aggregate. Under this program, the Company repurchased 393,975 shares of common stock through December 31, 2020, at an average price of $38.78.
In March 2020,February 2023, the Board authorized the Company to repurchase, on the open market, shares of the Company’s outstanding common stock in an amount not to exceed $50.0$60.0 million in aggregate. No shares have been repurchased under this program.
In May 2022, the Board authorized the Company to repurchase, on the open market, shares of the Company’s outstanding common stock in an amount not to exceed $60.0 million in aggregate. During the year ended December 31, 2020, 02023, the Company repurchased 285,700 shares had been repurchasedof common stock at an average price of $36.53 under this program.
67
As of December 31, 2020, $50.02023, $0.2 million and $9.4remained available for repurchase under this program.
As of December 31, 2023, $60.2 million remained available for repurchase under the March 2020May 2022 and July 2019February 2023 stock repurchase programs, respectively.programs. Under the programs, repurchases of the Company's common stock may be made in open market transactions effected through a broker-dealer at prevailing market prices, in block trades or by other means in accordance with Rules 10b-18, to the extent relied upon, and 10b5-1 under the Exchange Act at times and prices considered to be appropriate at the Company's discretion. The stock repurchase programs do not obligate the Company to repurchase any particular amount of common stock, havehas no fixed termination date, and may be suspended at any time at the Company's discretion. On March 10, 2020 and continuing through December 31, 2020, in order to improve
As a condition of the Company's liquidity during the COVID-19 pandemic,Merger Agreement, beginning on October 4, 2023, the Company suspended repurchases under the stock repurchase programs.is restricted from repurchasing its common stock.
ShareStock repurchase activity under the May 2022 stock repurchase programsprogram for the years ended December 31, 20202023 and 20192022 was as follows:
(millions, except for share and per share data) |
| December 31, 2023 |
|
| December 31, 2022 |
| ||
Total number of shares repurchased |
|
| 285,700 |
|
|
| 1,474,300 |
|
Average price paid per share |
| $ | 36.53 |
|
| $ | 33.47 |
|
Total value of common stock repurchased |
| $ | 10.4 |
|
| $ | 49.4 |
|
The Company recorded $0.1 million in Additional paid-in capital within the Consolidated Balance Sheets during the year ended December 31, 2023, related to the excise tax on net repurchases of common stock that was a provision of the Inflation Reduction Act of 2022.
(millions, except for share and per share data) |
| December 31, 2020 |
|
| December 31, 2019 |
| ||
Total number of shares repurchased |
|
| 393,975 |
|
|
| 1,335,584 |
|
Average price paid per share |
| $ | 38.78 |
|
| $ | 35.83 |
|
Total value of stock repurchased |
| $ | 15.3 |
|
| $ | 47.9 |
|
The remaining authorized repurchase amounts in the aggregateamount under the July 2019May 2022 and March 2020February 2023 stock repurchase programs as of December 31, 20202023 was as follows:
(millions) |
| December 31, 2023 |
| |
Total authorized repurchase amount |
| $ | 120.0 |
|
Total value of shares repurchased |
|
| 59.8 |
|
Total remaining authorized repurchase amount |
| $ | 60.2 |
|
(millions) |
| December 31, 2020 |
| |
Total authorized repurchase amount |
| $ | 100.00 |
|
Total value of shares repurchased |
|
| 40.6 |
|
Total remaining authorized repurchase amount |
| $ | 59.4 |
|
50
15.
13. Income Taxes
(Loss) earningsEarnings before income taxes during the years ended December 31, 2020, 20192023, 2022 and 20182021, was as follows:
| Year Ended December 31, |
| ||||||||||
(millions) |
| 2023 |
|
| 2022 |
|
| 2021 |
| |||
United States |
| $ | 47.8 |
|
| $ | 65.1 |
|
| $ | 44.8 |
|
Foreign |
|
| 0.9 |
|
|
| 0.5 |
|
|
| 1.0 |
|
Total |
| $ | 48.7 |
|
| $ | 65.6 |
|
| $ | 45.8 |
|
|
| Year Ended December 31, |
| |||||||||
(millions) |
| 2020 |
|
| 2019 |
|
| 2018 |
| |||
United States |
| $ | (240.1 | ) |
| $ | 69.7 |
|
| $ | 74.9 |
|
Foreign |
|
| (0.3 | ) |
|
| 1.4 |
|
|
| 1.1 |
|
Total |
| $ | (240.4 | ) |
| $ | 71.1 |
|
| $ | 76.0 |
|
The components of income tax expense (benefit) expense during the years ended December 31, 2020, 20192023, 2022 and 20182021 were as follows:
|
| Year Ended December 31, |
|
| Year Ended December 31, |
| ||||||||||||||||||
(millions) |
| 2020 |
|
| 2019 |
|
| 2018 |
|
| 2023 |
|
| 2022 |
|
| 2021 |
| ||||||
Current provision |
|
|
|
|
|
|
|
|
|
|
|
| ||||||||||||
U.S. federal |
| $ | (15.3 | ) |
| $ | 9.6 |
|
| $ | 9.9 |
| ||||||||||||
Current |
|
|
|
|
|
|
|
|
| |||||||||||||||
U.S. Federal |
| $ | 8.2 |
|
| $ | 6.9 |
|
| $ | (3.2 | ) | ||||||||||||
Foreign |
|
| 0.2 |
|
|
| 0.9 |
|
|
| 1.0 |
|
|
| 0.8 |
|
|
| 0.3 |
|
|
| 0.2 |
|
State |
|
| 0.1 |
|
|
| 4.7 |
|
|
| 7.4 |
|
|
| 3.6 |
|
|
| 2.7 |
|
|
| 1.0 |
|
Total current |
|
| (15.0 | ) |
|
| 15.2 |
|
|
| 18.3 |
|
|
| 12.6 |
|
|
| 9.9 |
|
|
| (2.0 | ) |
Deferred provision |
|
|
|
|
|
|
|
|
|
|
|
| ||||||||||||
U.S. federal |
|
| (40.7 | ) |
|
| 2.9 |
|
|
| 1.3 |
| ||||||||||||
Deferred |
|
|
|
|
|
|
|
|
| |||||||||||||||
U.S. Federal |
|
| 1.3 |
|
|
| 5.1 |
|
|
| 9.7 |
| ||||||||||||
Foreign |
|
| — |
|
|
| (0.1 | ) |
|
| (0.3 | ) |
|
| (0.5 | ) |
|
| — |
|
|
| 0.1 |
|
State |
|
| (11.8 | ) |
|
| 1.4 |
|
|
| 0.3 |
|
|
| 0.6 |
|
|
| 2.5 |
|
|
| 2.7 |
|
Total deferred |
|
| (52.5 | ) |
|
| 4.2 |
|
|
| 1.3 |
|
|
| 1.4 |
|
|
| 7.6 |
|
|
| 12.5 |
|
Income tax (benefit) expense |
| $ | (67.5 | ) |
| $ | 19.4 |
|
| $ | 19.6 |
| ||||||||||||
Income tax expense |
| $ | 14.0 |
|
| $ | 17.5 |
|
| $ | 10.5 |
| ||||||||||||
Deferred income taxes reflect the net effects of temporary differences between the carrying amounts of assets and liabilities for U.S. GAAP purposes and the amount used for income tax purposes.
68
Componentsomponents of the Company's deferred tax assets and liabilities as of December 31, 20202023 and 20192022 were as follows:
|
| December 31, |
| |||||
(millions) |
| 2020 |
|
| 2019 |
| ||
Deferred tax assets |
|
|
|
|
|
|
|
|
Net operating loss carry forwards and tax credits |
| $ | 23.5 |
|
| $ | 20.8 |
|
Lease liability |
|
| 87.9 |
|
|
| 119.5 |
|
Accrued expenses |
|
| 15.2 |
|
|
| 15.0 |
|
Accrued compensation |
|
| 8.4 |
|
|
| 9.2 |
|
Depreciation |
|
| 17.2 |
|
|
| — |
|
Other |
|
| 3.4 |
|
|
| 1.4 |
|
Total gross deferred tax assets |
|
| 155.6 |
|
|
| 165.9 |
|
Valuation allowances |
|
| (10.7 | ) |
|
| (8.3 | ) |
Total deferred tax assets |
|
| 144.9 |
|
|
| 157.6 |
|
Deferred tax liabilities |
|
|
|
|
|
|
|
|
Prepaid expenses |
|
| (0.2 | ) |
|
| (0.1 | ) |
Right of use asset |
|
| (62.8 | ) |
|
| (114.9 | ) |
Undistributed foreign earnings |
|
| (0.2 | ) |
|
| 0 |
|
Depreciation and amortization |
|
| — |
|
|
| (0.7 | ) |
Goodwill amortization |
|
| (13.0 | ) |
|
| (26.2 | ) |
Equity investments in unconsolidated entities |
|
| (4.9 | ) |
|
| (5.1 | ) |
Total deferred tax liabilities |
|
| (81.1 | ) |
|
| (147.0 | ) |
Net deferred tax asset |
| $ | 63.8 |
|
| $ | 10.6 |
|
| December 31, |
| ||||||
(millions) |
| 2023 |
|
| 2022 |
| ||
Deferred income tax assets |
|
|
|
|
|
| ||
NOL carry forwards and tax credits |
| $ | 17.7 |
|
| $ | 20.2 |
|
Lease liabilities |
|
| 57.8 |
|
|
| 59.0 |
|
Accrued expenses |
|
| 16.7 |
|
|
| 15.7 |
|
Accrued compensation |
|
| 10.3 |
|
|
| 10.2 |
|
Depreciation |
|
| 27.6 |
|
|
| 27.6 |
|
Other |
|
| 4.8 |
|
|
| 0.2 |
|
Total deferred income tax assets |
|
| 134.9 |
|
|
| 132.9 |
|
Valuation allowances |
|
| (6.8 | ) |
|
| (9.0 | ) |
Net deferred income tax assets |
|
| 128.1 |
|
|
| 123.9 |
|
Deferred income tax liabilities |
|
|
|
|
|
| ||
ROU assets |
|
| (47.3 | ) |
|
| (43.9 | ) |
Depreciation and amortization |
|
| (12.9 | ) |
|
| (13.5 | ) |
Goodwill |
|
| (22.3 | ) |
|
| (19.3 | ) |
Equity investments in unconsolidated entities |
|
| (4.7 | ) |
|
| (5.1 | ) |
Other |
|
| (0.4 | ) |
|
| (0.3 | ) |
Total deferred income tax liabilities |
|
| (87.6 | ) |
|
| (82.1 | ) |
Total net deferred income tax asset |
| $ | 40.5 |
|
| $ | 41.8 |
|
|
|
|
|
|
|
| ||
Amounts per Consolidated Balance Sheets |
|
|
|
|
|
| ||
Deferred income tax assets |
|
| 42.8 |
|
|
| 44.4 |
|
Deferred income tax liabilities (included in Other noncurrent liabilities) |
|
| (2.3 | ) |
|
| (2.6 | ) |
Total net deferred income tax asset |
| $ | 40.5 |
|
| $ | 41.8 |
|
Changes affecting the valuation allowances on deferred tax assets during the years ended December 2020, 2019,31, 2023, 2022 and 20182021, were as follows:
|
| December 31, |
|
| December 31, |
| ||||||||||||||||||
(millions) |
| 2020 |
|
| 2019 |
|
| 2018 |
|
| 2023 |
|
| 2022 |
|
| 2021 |
| ||||||
Beginning Balance |
| $ | 8.3 |
|
| $ | 8.1 |
|
| $ | 7.1 |
|
| $ | 9.0 |
|
| $ | 10.9 |
|
| $ | 10.7 |
|
Current year expense |
|
| 2.4 |
|
|
| 0.2 |
|
|
| 1.0 |
| ||||||||||||
Current year (benefit) expense |
|
| (2.2 | ) |
|
| (1.9 | ) |
|
| 0.2 |
| ||||||||||||
Ending Balance |
| $ | 10.7 |
|
| $ | 8.3 |
|
| $ | 8.1 |
|
| $ | 6.8 |
|
| $ | 9.0 |
|
| $ | 10.9 |
|
The accounting guidance for accounting for income taxes requires that the Company to assess the realizability of deferred tax assets at each reporting period. These assessments generally consider several factors including the reversal of existing temporary differences, projected future taxable income and potential tax planning strategies. The Company has valuation allowances of $10.7$6.8 million and $8.3$9.0 million as of December 31, 20202023 and 2019,2022, respectively, primarily related to ourthe Company’s state Net Operating Loss carryforwards ("NOLs"),NOLs, foreign tax credits and state tax credits that the Company believes are not likely to be realized based on its estimates of future foreign and state taxable income, limitations on the uses of its state NOLs and the carryforward life over which the state tax benefit is realized.
The Company recognized excess tax benefits of $0.1 million and $0.5 million during the years ended December 31, 2020 and 2019, respectively, and as a result of the required adoption of ASU 2016-09 – Improvements to Employee Share-based Payment Accounting, the Company's effective tax rate may have increased volatility.
The Company has $20.5$17.7 million of tax effected state NOLs, foreign tax credits and state tax credits as of December 31, 2020,2023, which will expire in the years 20212024 through 2040.2043. As noted above, the utilization of NOLs of the Company are limited.
51
A reconciliation of differences between the U.S. Federal statutory income tax rate and the Company's reported income tax provision to the amount computed by multiplying earnings before income taxes by statutory United States federaleffective income tax rate during the years ended December 31, 2020, 20192023, 2022 and 20182021, was as follows:
|
| Year Ended December 31, |
| |||||||||
(millions) |
| 2020 |
|
| 2019 |
|
| 2018 |
| |||
Tax at statutory rate |
| $ | (50.5 | ) |
| $ | 14.9 |
|
| $ | 16.0 |
|
Permanent differences |
|
| 0.7 |
|
|
| 0.8 |
|
|
| 0.2 |
|
State taxes, net of federal benefit |
|
| (13.9 | ) |
|
| 4.5 |
|
|
| 6.3 |
|
Effect of foreign tax rates |
|
| 0.4 |
|
|
| 0.6 |
|
|
| 0.6 |
|
Federal net operating loss carryback rate differential |
|
| (6.1 | ) |
|
| 0 |
|
|
| 0 |
|
Effect of 2017 Tax Act |
|
| 0 |
|
|
| 0 |
|
|
| (1.5 | ) |
Noncontrolling interest |
|
| 0 |
|
|
| (0.6 | ) |
|
| (0.7 | ) |
Current year adjustment to deferred taxes |
|
| 0 |
|
|
| 0.8 |
|
|
| 0.4 |
|
Recognition of tax credits |
|
| (0.5 | ) |
|
| (1.8 | ) |
|
| (2.7 | ) |
|
|
| (69.9 | ) |
|
| 19.2 |
|
|
| 18.6 |
|
Change in valuation allowance |
|
| 2.4 |
|
|
| 0.2 |
|
|
| 1.0 |
|
Income tax (benefit) expense |
| $ | (67.5 | ) |
| $ | 19.4 |
|
| $ | 19.6 |
|
Effective tax rate |
|
| 28.1 | % |
|
| 27.3 | % |
|
| 25.8 | % |
| Year Ended December 31, |
| ||||||||||
(percentages) |
| 2023 |
|
| 2022 |
|
| 2021 |
| |||
Tax at statutory rate |
|
| 21.0 | % |
|
| 21.0 | % |
|
| 21.0 | % |
Permanent differences |
|
| 4.8 | % |
|
| 1.3 | % |
|
| 1.4 | % |
State and local income taxes, net of federal benefit |
|
| 11.6 | % |
|
| 10.0 | % |
|
| 6.8 | % |
Foreign taxes |
|
| 0.7 | % |
|
| 0.4 | % |
|
| 0.5 | % |
Federal NOL carryback rate differential |
|
| — |
|
|
| — |
|
|
| (4.4 | )% |
Noncontrolling interest |
|
| (1.6 | )% |
|
| (0.9 | )% |
|
| (1.7 | )% |
Recognition of tax credits |
|
| (3.3 | )% |
|
| (2.2 | )% |
|
| (1.0 | )% |
|
| 33.2 | % |
|
| 29.6 | % |
|
| 22.6 | % | |
Change in valuation allowance |
|
| (4.5 | )% |
|
| (2.9 | )% |
|
| 0.3 | % |
Effective tax rate |
|
| 28.7 | % |
|
| 26.7 | % |
|
| 22.9 | % |
69
Due to the Coronavirus Aid, Relief, and Economic Security Act in 2020, the Company will bewas able to carry back its current year2020 U.S. Federal taxable loss to the 2015 and 2016 tax years, which had a higher corporate tax rate. As a result, based on the Company’s initial estimates as of December 31, 2020, the Company recorded an income tax refund receivable of $15.4$15.4 as of December 31, 2020, which is included in Prepaid and other current assets within2020. During the Consolidated Balance Sheets.
Taxes paid were $2.4 million, $15.3 million and $15.3 million in the yearsyear ended December 31, 2020, 2019 and 2018, respectively.
The2021, the Company finalized its accounting for2020 U.S. Federal income tax return, which resulted in a $5.1 million increase of the income tax effectsrefund receivable, of which $2.0 million related to the 2017 Tax Actadditional benefit recognized due to the ability to carryback the Company’s 2020 U.S. Federal taxable loss to tax years 2015 and 2016. The $20.5 million income tax refund was received during the year ended December 31, 20182022.
Taxes paid were $10.2 million, $13.8 million and recorded a tax benefit of $1.5 million for the transition tax on the mandatory deemed repatriation of foreign earnings.
The 2017 Tax Act also included a provision designed to tax Global Intangible Low Taxed Income (“GILTI”). The Company has elected the period cost method to account for any tax liability subject to GILTI. The GILTI amount recognized$0.8 during the years ended December 31, 20202023, 2022 and 2019 was not significant.2021, respectively. Taxes refunded were $0.2 million, $20.9 million and $0.3 million during the years ended December 31, 2023, 2022 and 2021, respectively.
As of December 31, 20202023 and 2022, the Company had not identified any uncertain tax positions that would have a material impact on the Company's financial position.
The Company would recognize potential interest and penalties related to uncertain tax positions, if any, in income tax expense. The tax years that remain subject to examination for the Company's major tax jurisdictions as of December 31, 20202023 and 2022 were as follows:
| United States - federal income tax | |
| United States - state and local income tax | |
| Foreign - Canada and Puerto Rico |
16.14. Benefit Plans
Deferred Compensation Arrangements
The Company offersoffered deferred compensation arrangements for certain key executives. Certain employees are offered supplemental pension arrangements, subject to their continued employment by the Company, in which the employees will receive a defined monthly benefit upon attaining age 65. At65. As of December 31, 20202023 and 2019,2022, the Company had $3.4$2.7 million and $3.6$2.8 million, respectively, recorded asin Other noncurrent liabilities within the Consolidated Balance Sheets, representing the present value of the future benefit payments. Expenses related to these plans amounted to $0.2was $0.2 million for bothduring the years ended December 31, 20202023, 2022 and 2019, and $0.4 for2021.
In addition, the year ended December 31, 2018.
The Company also has agreements with certain former key executives that provide for aggregate annual payments over periods ranging from 10 years to life, beginning when the executive retires or upon death or disability. Under certain conditions, the amount of the deferred benefits can be reduced. Compensation cost was $0.3 million for both$0.2 during the years ended December 31, 20202023, 2022 and 2019, and $0.2 million for the year ended December 31, 2020, 2018. 2021.As of December 31, 20202023 and 2019,2022, the Company had $2.2$1.3 million and $2.3$1.4 million, respectively, recorded asin Other noncurrent liabilities within the Consolidated Balance Sheets, associated with these agreements.
Life insurance contracts with a face value of approximately $4.8 million and $5.4$4.1 million as of December 31, 20202023 and 20192022, respectively, have been purchased to fund, as necessary, the benefits under the Company's deferred compensation agreements. The cash surrender value of the life insurance contracts was approximately $3.4$3.4 million and $3.8$3.3 million as of December 31, 20202023 and 2019,2022, respectively, and classified asin Other noncurrent assets, net, within the Consolidated Balance Sheets. The plan is a non-qualified plan and not subject to ERISA funding requirements.
Defined Contribution Plans
The Company sponsors savings and retirement plans whereby the participants may elect to contribute a portion of their compensation to the plans. The plan is a qualified defined contribution plan 401(k). The Company historically had contributedcontributes an amount in cash or other property as a Company match equal to 50%50% of the first 6%6% of contributions as they occur. As a result of COVID-19, during the second quarter of 2020 and through September 30, 2021, the Company suspended the Company match under the plan. The Company plans to reinstitutereinstituted the Company match onceduring the impactsfourth quarter of COVID-19 have subsided.2021. Expenses related to the Company's 401(k) match amounted to $0.9were $2.6 million, $2.0$2.0 million, and $2.1$0.6 million during the years ended December 31, 2020, 20192023, 2022 and 2018,2021, respectively.
TheAdditionally, the Company also offers a non-qualified deferred compensation plan to those employees whose participation in the 401(k) plan is limited by statute or regulation. This plan allows certain employees to defer a portion of their compensation, limited to a maximum of $0.1$0.1 million per year, to be paid to the participants upon separation of employment or distribution date selected by the employee. To support the non-qualified deferred compensation plan, the Company has elected to purchase Company Owned Life Insurance ("COLI") policies on certain plan participants. The cash surrender value of the COLI policies is designed to provide a source for funding the non-qualified deferred compensation liability.liabilities. As of December 31, 20202023 and 2019,2022, the cash surrender value of the COLI policies was $20.3$22.5 million and $17.3$19.2 million, respectively, and classified asin Other noncurrent assets, net, within the Consolidated Balance Sheets. The liabilityliabilities for the non-qualified deferred compensation plan iswere $24.9 million and $19.4 million as of December 31, 2023 and 2022, respectively, and included in Other noncurrent liabilities within the Consolidated Balance Sheets and was $20.3 million and $20.4 million as of December 31, 2020 and 2019, respectively. As a result of COVID-19, during the second quarter of 2020, the Company suspended participation in the non-qualified deferred compensation plan. The Company reinstituted the participation for employees in the non-qualified deferred compensation plan as of January 1, 2021.Sheets.
Multi-Employer Defined Benefit and Contribution Plans
The Company contributes to a number of multiemployer defined benefit plans under the terms of collective-bargaining agreements that cover its union-represented employees. The risks of participating in these multiemployer plans are different from single-employer plans in the following aspects:
52 |
|
|
|
|
|
70
The Company's contributions represented more than 5% of total contributions to the Teamsters Local Union No. 727 and Local 272 Labor Management Benefit Funds forduring the plan years ending February 28, 2020October 31, 2023 and November 30, 2020,August 15, 2023, respectively. The Company does not representcontribute more than five percent5% to any other fund. The Company's participation in these plans for the annual periods ended December 31, 2020, 20192023, 2022 and 2018,2021, is discussedpresented in the table below. The "EIN/Pension Plan Number" column provides the Employee Identification Number ("EIN") and the three-digit plan number, if applicable. The zone status iswas based on information that the Company received from the plan and iswas certified by the plan's actuary. Among other factors, plans in the red zone are generally less than 65 percent funded, plans in the yellow zone are less than 80 percent funded, and plans in the green zone are at least 80 percent funded. The "FIP/RP Status Pending/Implementation" column indicates plans for which a Financial Improvement Plan ("FIP") or a Rehabilitation Plan ("RP") is either pending or has been implemented. Finally, the "Expiration Date of Collective Bargaining Agreement" column lists the expiration dates of the agreements to which the plans are subject.
|
|
|
|
|
|
|
|
|
|
|
|
|
|
|
|
|
|
|
|
|
|
|
|
|
| Zone |
|
|
|
|
|
|
|
|
|
|
|
|
|
|
|
|
|
|
|
|
|
|
|
| Zone |
|
| |||
|
|
|
|
|
|
|
|
|
|
|
|
|
|
|
|
|
|
|
|
|
|
|
|
|
| Status |
|
|
|
|
|
|
|
|
|
|
|
|
|
|
|
|
|
|
|
| Status |
|
| |||||||
|
|
|
| Pension Protection |
|
|
|
|
|
|
|
|
|
|
|
|
|
|
|
|
| as of the |
| Expiration |
|
|
| Pension Protection |
|
|
|
|
|
|
|
|
|
|
|
| as of the |
| Expiration | |||||||||||||
|
| EIN/ |
| Zone Status |
|
|
| Contributions (millions) |
|
|
|
| Most |
| Date of |
| EIN/ |
| Zone Status |
|
|
| Contributions (millions) |
|
|
|
| Most |
| Date of | ||||||||||||||||||||||||||
|
| Pension |
|
|
|
|
|
|
| FIP/FR |
|
|
|
|
|
|
|
|
|
|
|
|
|
|
| Recent |
| Collective |
| Pension |
|
|
|
|
|
|
| FIP/FR |
|
|
|
|
|
|
|
|
|
|
|
| Recent |
| Collective | |||
|
| Plan |
|
|
|
|
|
|
| Pending |
|
|
|
|
|
|
|
|
|
|
|
|
| Surcharge |
| Annual |
| Bargaining |
| Plan |
|
|
|
|
|
|
| Pending |
|
|
|
|
|
|
|
|
|
| Surcharge |
| Annual |
| Bargaining | |||
Pension |
| Number |
| 2020 |
| 2019 |
| 2018 |
| Implementation |
| 2020 |
|
| 2019 |
|
| 2018 |
|
| Imposed |
| Report |
| Agreement |
| Number |
| 2023 |
| 2022 |
| 2021 |
| Implementation |
| 2023 |
|
| 2022 |
|
| 2021 |
|
| Imposed |
| Report |
| Agreement | ||||||
Teamsters Local Union 727 |
| 36-61023973 |
| Green |
| Green |
| Green |
| N/A |
| $ | 0.3 |
|
| $ | 3.1 |
|
| $ | 3.2 |
|
| No |
| 2020 |
| 10/31/2021 |
| 36-61023973 |
| Green |
| Green |
| Green |
| N/A |
| $ | 3.7 |
|
| $ | 3.5 |
|
| $ | 2.9 |
|
| No |
| 2023 |
| 10/31/2026 |
Local 272 Labor Management |
| 13-5673836 |
| Green |
| Green |
| Green |
| N/A |
| $ | 1.1 |
|
| $ | 1.3 |
|
| $ | 1.5 |
|
| No |
| 2020 |
| 3/5/2021 |
| 13-5673836 |
| Green |
| Green |
| Green |
| N/A |
| $ | 0.9 |
|
| $ | 0.9 |
|
| $ | 0.9 |
|
| No |
| 2023 |
| 8/15/2026 |
Net expenses for contributions not reimbursed by clients and related to multiemployer defined benefit and defined contribution benefit plans were $1.2$1.0 million, $2.0$0.9 million and $2.1$0.8 million forduring the years ended December 31, 2020, 20192023, 2022 and 2018,2021, respectively.
The Company currently does not have any intentions to cease participating in these multiemployer pension plans.
17. Bradley Agreement
In February 2000, the Company, through a partnership agreement with a minority partner (the “Partnership”), entered into a 25-year agreement (the "Bradley Agreement") with the State of Connecticut (the “State”) that was due to expire on April 6, 2025, under which the Company would operate garage and surface parking spaces at Bradley International Airport (“Bradley”) located in the Hartford, Connecticut metropolitan area.
Under the terms of the Bradley Agreement, the parking garage was financed through the issuance of State of Connecticut special facility revenue bonds and provided that the Company deposited, with the trustee for the bondholders, all gross revenues collected from operations of the garage and surface parking. From those gross revenues, the trustee paid debt service on the special facility revenue bonds outstanding, operating and capital maintenance expenses of the garage and surface parking facilities, and specific annual guaranteed minimum payments to the State. All of the cash flows from the parking facilities were pledged to the security of the special facility revenue bonds and were collected and deposited with the bond trustee. Each month the bond trustee made certain required monthly distributions, which were characterized as “Guaranteed Payments.” To the extent the monthly gross receipts generated by the parking facilities were not sufficient for the bond trustee to make the required Guaranteed Payments, the Company was obligated to deliver the deficiency amount to the bond trustee, with such deficiency payments representing interest bearing advances to the bond trustee.
On June 30, 2020, the Company and the State agreed to terminate the Bradley Agreement, with an effective date of May 31, 2020 (the “Termination Agreement”). The Company then entered into a management type contract with the Connecticut Airport Authority, effective June 1, 2020 (“Bradley Management Agreement”), under which the Company will provide the same parking services for Bradley.
Under the terms of the Bradley Management Agreement, the Company is no longer required to make deficiency payments. In addition, other than the contingent consideration discussed below, the Company has no other ongoing obligations under the Bradley Agreement.
The total deficiency repayments (net of payments made), interest and premium received and recognized under the Bradley Agreement for the years ended December 31, 2020, 2019 and 2018 were as follows:
15. Comprehensive Income
|
| Year Ended December 31 |
| |||||||||
(millions) |
| 2020 |
|
| 2019 |
|
| 2018 |
| |||
Deficiency repayments |
| $ | 0.1 |
|
| $ | 3.8 |
|
| $ | 3.9 |
|
Interest |
|
| 0.1 |
|
|
| 1.0 |
|
|
| 0.9 |
|
Premium |
|
| — |
|
|
| 0.4 |
|
|
| 0.3 |
|
Deficiency payments made under the Bradley Agreement were recorded as an increase in Cost of services - management type contracts and deficiency repayments, interest and premium received under the Bradley Agreement were recorded as reductions to Cost of services - management type contracts. The reimbursement of principal, interest and premium was recognized when received.
71
On June 30, 2020, concurrent with the termination of the Bradley Agreement and effective as of May 31, 2020, the Company entered into an agreement to purchase the minority partners’ share in the Partnership previously established to execute the Bradley Agreement for a total cash consideration of $1.7 million. The consideration was paid in cash during the year ended December 31, 2020. Under the terms of the Termination Agreement, the Company may be required to pay additional consideration (“contingent consideration”) to the minority partner, that is contingent on the performance of the operations of Bradley. The contingent consideration is not capped and if any, would be payable to the minority partner in April 2025. Based on a probability weighting of potential payouts, the criteria to accrue for such potential payments had not been met and the contingent consideration was estimated to have no fair value as of December 31, 2020. The Company will continue to evaluate the criteria for making these payments in the future and accrue for such potential payments if deemed necessary.
18. Comprehensive (Loss) Income
The components of accumulated other comprehensive (loss) income and the income tax benefit allocated to each component forduring the years ended December 31, 2020, 2019,2023, 2022 and 20182021, were as follows:
| 2023 |
|
| 2022 |
|
| 2021 |
| ||||||||||||||||||||||
(millions) |
| Before Tax Amount |
| Income Tax |
| Net of Tax Amount |
|
| Before Tax Amount |
| Income Tax |
| Net of Tax Amount |
|
| Before Tax Amount |
| Income Tax |
| Net of Tax Amount |
| |||||||||
Translation adjustments |
| $ | 0.5 |
| $ | — |
| $ | 0.5 |
|
| $ | 0.5 |
| $ | — |
| $ | 0.5 |
|
| $ | (0.1 | ) | $ | — |
| $ | (0.1 | ) |
De-designation of interest rate collars |
|
| — |
|
| — |
|
| — |
|
|
| 0.7 |
|
| 0.2 |
|
| 0.5 |
|
|
| 2.3 |
|
| 0.6 |
|
| 1.7 |
|
Other Comprehensive income |
| $ | 0.5 |
| $ | — |
| $ | 0.5 |
|
| $ | 1.2 |
| $ | 0.2 |
| $ | 1.0 |
|
| $ | 2.2 |
| $ | 0.6 |
| $ | 1.6 |
|
|
| 2020 |
|
| 2019 |
|
| 2018 |
| |||||||||||||||||||||
(millions) |
| Before Tax Amount |
| Income Tax |
| Net of Tax Amount |
|
| Before Tax Amount |
| Income Tax |
| Net of Tax Amount |
|
| Before Tax Amount |
| Income Tax |
| Net of Tax Amount |
| |||||||||
Translation adjustments |
| $ | 0.1 |
| $ | — |
| $ | 0.1 |
|
| $ | 0.1 |
| $ | — |
| $ | 0.1 |
|
| $ | (0.6 | ) | $ | — |
| $ | (0.6 | ) |
Change in fair value of interest rate collars |
|
| (2.5 | ) |
| (0.7 | ) |
| (1.8 | ) |
|
| (0.6 | ) |
| (0.2 | ) |
| (0.4 | ) |
|
| — |
|
| — |
|
| — |
|
Other Comprehensive (loss) income |
| $ | (2.4 | ) | $ | (0.7 | ) | $ | (1.7 | ) |
| $ | (0.5 | ) | $ | (0.2 | ) | $ | (0.3 | ) |
| $ | (0.6 | ) | $ | — |
| $ | (0.6 | ) |
The changes to accumulated other comprehensive loss by component forduring the years ended December 31, 2020, 2019,2023, 2022 and 2018,2021, were as follows:
|
|
|
|
|
|
| Total |
| ||||
| Foreign |
|
|
|
|
| Accumulated |
| ||||
| Currency |
|
|
|
|
| Other |
| ||||
| Translation |
|
| Interest Rate |
|
| Comprehensive |
| ||||
(millions) |
| Adjustments |
|
| Collars |
|
| Loss |
| |||
Balance as of January 1, 2021 |
| $ | (2.2 | ) |
| $ | (2.2 | ) |
| $ | (4.4 | ) |
Other comprehensive loss before reclassification |
|
| (0.1 | ) |
|
| — |
|
|
| (0.1 | ) |
Amounts reclassified from accumulated other comprehensive loss |
|
| — |
|
|
| 1.7 |
|
|
| 1.7 |
|
Balance as of December 31, 2021 |
|
| (2.3 | ) |
|
| (0.5 | ) |
|
| (2.8 | ) |
Other comprehensive income before reclassification |
|
| 0.5 |
|
|
| — |
|
|
| 0.5 |
|
Amounts reclassified from accumulated other comprehensive loss |
|
| — |
|
|
| 0.5 |
|
|
| 0.5 |
|
Balance as of December 31, 2022 |
|
| (1.8 | ) |
|
| — |
|
|
| (1.8 | ) |
Other comprehensive income before reclassification |
|
| 0.5 |
|
|
| — |
|
|
| 0.5 |
|
Balance as of December 31, 2023 |
| $ | (1.3 | ) |
| $ | — |
|
| $ | (1.3 | ) |
|
|
|
|
|
|
|
|
|
| Total |
| |
|
| Foreign |
|
| Change in Fair |
|
| Accumulated |
| |||
|
| Currency |
|
| Value |
|
| Other |
| |||
|
| Translation |
|
| of Interest Rate |
|
| Comprehensive |
| |||
(millions) |
| Adjustments |
|
| Collars |
|
| Loss |
| |||
Balance as of January 1, 2018 |
| $ | (1.2 | ) |
| $ | — |
|
| $ | (1.2 | ) |
Other comprehensive loss before reclassification |
|
| (0.6 | ) |
|
| — |
|
|
| (0.6 | ) |
Cumulative effect of change in accounting principle (1) |
|
| (0.6 | ) |
|
| — |
|
|
| (0.6 | ) |
Balance as of December 31, 2018 |
|
| (2.4 | ) |
|
| — |
|
|
| (2.4 | ) |
Other comprehensive (loss) income before reclassification |
|
| 0.1 |
|
|
| (0.4 | ) |
|
| (0.3 | ) |
Balance as of December 31, 2019 |
|
| (2.3 | ) |
|
| (0.4 | ) |
|
| (2.7 | ) |
Other comprehensive (loss) income before reclassification |
|
| 0.1 |
|
|
| (2.9 | ) |
|
| (2.8 | ) |
Amounts reclassified from accumulated other comprehensive loss |
|
| — |
|
|
| 1.1 |
|
|
| 1.1 |
|
Balance as of December 31, 2020 |
| $ | (2.2 | ) |
| $ | (2.2 | ) |
| $ | (4.4 | ) |
(1) Refer to Note 1, Significant Accounting Policies and Practices for additional information on the Company's adoption of ASU 2018-02.
Reclassifications from accumulated other comprehensive loss forduring the years ended December 31, 2020, 2019,2023, 2022 and 20182021, were as follows:
(millions) |
| 2023 |
|
| 2022 |
|
| 2021 |
| Classification in the Consolidated Statements of Income | |||
Interest Rate Collars: |
|
|
|
|
|
|
|
|
|
| |||
Net realized loss |
| $ | — |
|
| $ | 0.7 |
|
| $ | 2.3 |
| Other expenses |
Reclassifications before tax |
|
| — |
|
|
| 0.7 |
|
|
| 2.3 |
|
|
Income tax benefit |
|
| — |
|
|
| 0.2 |
|
|
| 0.6 |
|
|
Reclassifications, net of tax |
| $ | — |
|
| $ | 0.5 |
|
| $ | 1.7 |
|
|
(millions) |
| 2020 |
|
| 2019 |
|
| 2018 |
| Classification in the Consolidated Statements of (Loss) Income | |||
Interest Rate Collars: |
|
|
|
|
|
|
|
|
|
|
|
|
|
Net realized loss |
| $ | 1.5 |
|
| $ | — |
|
| $ | — |
| Other expenses |
Reclassifications before tax |
|
| 1.5 |
|
|
| — |
|
|
| — |
|
|
Income tax benefit |
|
| 0.4 |
|
|
| — |
|
|
| — |
|
|
Reclassifications, net of tax |
| $ | 1.1 |
|
| $ | — |
|
| $ | — |
|
|
53
19.
16. Legal Proceedingsand Other Commitments and Contingencies
The Company is subject to claims and litigation in the normal course of its business. Thebusiness, including those related to labor and employment, contracts, personal injury and other related matters, some of which allege substantial monetary damages and claims. Some of these actions may be brought as class actions on behalf of a class or purported class of employees. While the outcomes of claims and legal proceedings and claims brought against the Company and other loss contingencies are subject to significant uncertainty. uncertainty, the Company believes the final outcome will not have a material adverse effect on its financial position, results of operations or cash flows.
The Company accrues a charge against income when its managementit determines that it is probable that an asset has been impaired or a liability has been incurred and the amount of loss can be reasonably estimated. In addition,When a loss is probable, the Company accrues forrecords an accrual based on the authoritative judgmentsreasonably estimable loss or assertions made againstrange of loss. When no point of loss is more likely than another, the Company by government agencies atrecords the timelowest amount in the estimated range of their rendering regardlessloss, and if material, discloses the estimated range. The Company does not record liabilities for reasonably possible loss contingencies, but does disclose a range of its intent to appeal. In addition,reasonably possible losses if they are material and the Company is from time-to-time partyable to litigation, administrative proceedings and union grievances that arise in the normal course of business, and occasionally pays amounts to resolve claims or alleged violations of regulatory requirements. There are no "normal course" matters that separately or in the aggregate, would, in the opinion of management, haveestimate such a material adverse effect on the Company’s results of operations, financial condition or cash flows.
In determining the appropriate accounting for loss contingencies,range. If the Company considerscannot provide a range of reasonably possible losses, it explains the likelihood of loss or the incurrence offactors that prevent it from determining such a liability, as well as the Company’s ability to reasonably estimate the amount of potential loss.range. The Company regularly evaluates current information available to determine whether an accrual should be established or adjusted. Estimating the probability that a loss will occur and estimating the amount of a potential loss or a range of potential loss involves significant estimation and judgment. During the year ended December 31, 2020, the Company recorded $6.0 million in reserves related to legal matters.
72
20.17. Segment Information
Segment information is presented in accordance with a “management approach,” which designates the internal reporting used by the Company's Chief Operating Decision Maker (“CODM”) for making decisions and assessing performance as the source of the Company’s reportable segments. The Company’s segments are organized in a manner consistent with which discrete financial information is available and evaluated regularly by the CODM in deciding how to allocate resources and assess performance.
An operating segment is defined as a component of an enterprise that engages in business activities from which it may earn revenue and incur expenses, and about which separate financial information is regularly evaluated by the CODM. The CODM is the Company’s chief executive officer.
Each of the operating segments are directly responsible for revenue and expenses related to their operations, including direct segment general and administrative costs. Finance, information technology, human resources and legal are shared functions that are not allocated back to the 2 operating segments.expenses. The CODM assesses the performance of each operating segment using information about its revenue and gross profitoperating income (loss) as its primary measure of performance, but does not evaluate segments using discrete asset information. Therefore, assets are not presented at the segment level. There arewere no material inter-segment transactions during the years ended December 31, 2023, 2022 and 2021, and the Company does not allocate other income,expense (income), interest expense depreciation and amortization(income) or income taxestax expense (benefit) to the operating segments. The accounting policies for segment reporting are the same as for the Company as a whole.
In July 2020,The Company’s operating segments are Commercial and Aviation:
The Other segment information reportedincludes costs related to the CODM. Certain hospitality locations previouslyCompany's operational support teams and costs related to common and shared infrastructure, including finance, accounting, information technology, human resources, purchasing, legal and corporate development.
Revenue, operating income (loss), general and administrative expenses and depreciation and amortization by operating segment during the years ended December 31, 2023, 2022 and 2021 were as follows:
| Year Ended December 31, | |||||||||||||||||
(millions) |
| 2023 |
|
|
|
| 2022 |
|
|
|
| 2021 |
|
|
| |||
Services revenue |
|
|
|
|
|
|
|
|
|
|
|
|
|
|
| |||
Commercial |
|
|
|
|
|
|
|
|
|
|
|
|
|
|
| |||
Management type contracts |
| $ | 307.7 |
|
|
|
| $ | 276.8 |
|
|
|
| $ | 232.5 |
|
|
|
Lease type contracts |
|
| 277.8 |
|
|
|
|
| 261.7 |
|
|
|
|
| 206.5 |
|
|
|
Total Commercial |
|
| 585.5 |
|
|
|
|
| 538.5 |
|
|
|
|
| 439.0 |
|
|
|
Aviation |
|
|
|
|
|
|
|
|
|
|
|
|
|
|
| |||
Management type contracts |
|
| 282.3 |
|
|
|
|
| 241.9 |
|
|
|
|
| 153.4 |
|
|
|
Lease type contracts |
|
| 15.4 |
|
|
|
|
| 14.0 |
|
|
|
|
| 9.1 |
|
|
|
Total Aviation |
|
| 297.7 |
|
|
|
|
| 255.9 |
|
|
|
|
| 162.5 |
|
|
|
Reimbursed management type contract revenue |
|
| 899.1 |
|
|
|
|
| 759.1 |
|
|
|
|
| 575.7 |
|
|
|
Total services revenue |
| $ | 1,782.3 |
|
|
|
| $ | 1,553.5 |
|
|
|
| $ | 1,177.2 |
|
|
|
Operating income (loss) |
|
|
|
|
|
|
|
|
|
|
|
|
|
|
| |||
Commercial |
| $ | 135.0 |
|
|
|
| $ | 122.0 |
|
|
|
| $ | 101.3 |
|
|
|
Aviation |
|
| 37.9 |
|
|
|
|
| 33.5 |
|
|
|
|
| 21.8 |
|
|
|
Other |
|
| (95.4 | ) |
|
|
|
| (72.6 | ) |
|
|
|
| (56.6 | ) |
|
|
Total operating income |
| $ | 77.5 |
|
|
|
| $ | 82.9 |
|
|
|
| $ | 66.5 |
|
|
|
General and administrative expenses |
|
|
|
|
|
|
|
|
|
|
|
|
|
|
| |||
Commercial |
| $ | 36.6 |
|
|
|
| $ | 29.3 |
|
|
|
| $ | 23.0 |
|
|
|
Aviation |
|
| 17.2 |
|
|
|
|
| 12.6 |
|
|
|
|
| 11.8 |
|
|
|
Other |
|
| 86.6 |
|
|
|
|
| 67.2 |
|
|
|
|
| 53.4 |
|
|
|
Total general and administrative expenses |
| $ | 140.4 |
|
|
|
| $ | 109.1 |
|
|
|
| $ | 88.2 |
|
|
|
Depreciation and amortization |
|
|
|
|
|
|
|
|
|
|
|
|
|
|
| |||
Commercial(1) |
| $ | 15.1 |
|
|
|
| $ | 13.1 |
|
|
|
| $ | 13.5 |
|
|
|
Aviation(2) |
|
| 12.2 |
|
|
|
|
| 11.2 |
|
|
|
|
| 8.4 |
|
|
|
Other |
|
| 8.8 |
|
|
|
|
| 5.4 |
|
|
|
|
| 3.2 |
|
|
|
Total depreciation and amortization |
| $ | 36.1 |
|
|
|
| $ | 29.7 |
|
|
|
| $ | 25.1 |
|
|
|
54
Item 9. Changes in and Disagreements with Accountants on Accounting and Financial Disclosure
None.
Item 9A. Controls and Procedures
Evaluation of Disclosure Controls and Procedures
Prior to the filing of SP Plus Corporation's (“SP+, “we” ,”our”, “us”) our Annual Report on Form 10-K for the fiscal year ended December 31, 2023 and under the supervision and with the participation of our management, including our Chief Executive Officer ("CEO"), Chief Financial Officer ("CFO") and Corporate Controller, we carried out an evaluation of the effectiveness of the design and operation of our disclosure controls and procedures (the "Evaluation") as of the last day of the period covered by this Form 10-K.
Disclosure controls and procedures are defined by Rules 13a-15(e) and 15d-15(e) of the Exchange Act as controls and other procedures that are designed to ensure that information required to be disclosed in the reports that we file or submit under the Exchange Act is recorded, processed, summarized and reported within the time periods specified by the Security Exchange Commission's ("SEC") rules and forms. Disclosure controls and procedures include, without limitation, controls and procedures designed to ensure that information required to be disclosed in the reports that we file or submit under Aviationthe Exchange Act is accumulated and communicated to our management, including our CEO, CFO and Corporate Controller, to allow timely decisions regarding required disclosures.
Based upon the Evaluation, our CEO, CFO and Corporate Controller concluded that, as of December 31, 2023, our disclosure controls and procedures were effective to promote reasonable assurance that information required to be disclosed by us in the reports that we file or submit under the Exchange Act is recorded, processed, summarized and reported accurately and within the time frames specified in the SEC's rules and forms and accumulated and communicated to our management, including our CEO, CFO and Corporate Controller, as appropriate to allow timely decisions regarding required disclosure.
Inherent Limitations of the Effectiveness of Internal Control
Our internal control over financial reporting is designed to provide reasonable assurance regarding the reliability of financial reporting and the preparation of financial statements for external purposes in accordance with applicable accounting principles generally accepted in the United States (“US GAAP"). Our internal control over financial reporting includes those policies and procedures that:
Management, including our CEO, CFO and Corporate Controller, does not expect that our internal controls will prevent or detect all errors and all fraud. A control system, no matter how well designed and operated, can provide only reasonable, not absolute, assurance that the objectives of the control system are met. Further, the design of a control system must reflect the fact that there are resource constraints, and the benefits of controls must be considered relative to their costs. Because of the inherent limitations in all control systems, no evaluation of internal controls can provide absolute assurance that all control issues and instances of fraud, if any, have been detected. Also, any evaluation of the effectiveness of controls in future periods are subject to the risk that those internal controls may become inadequate because of changes in business conditions, or that the degree of compliance with the policies or procedures may deteriorate.
Management's Annual Report on Internal Control over Financial Reporting
Our management is responsible for establishing and maintaining adequate internal control over financial reporting. Our internal control system was designed to provide reasonable assurance to our management and Board of Directors (the "Board") regarding the preparation and fair presentation of our published financial statements.
Prior to the filing of our Annual Report on Form 10-K for the fiscal year ended December 31, 2023, our management assessed the effectiveness of our internal control over financial reporting as of the last day of the period covered by the report. In making this assessment, our management used the criteria set forth by the Committee of Sponsoring Organizations of the Treadway Commission ("COSO") in Internal Control—Integrated Framework (2017 Framework). Based on our Evaluation under the COSO Framework, our management concluded that our internal control over financial reporting was effective as of December 31, 2023.
Ernst & Young LLP has audited the Consolidated Financial Statements included in Commercial. All prior year amountsthis Annual Report on Form 10-K and, as part of its audit, has issued an attestation report, included herein, on the effectiveness of our internal control over financial reporting.
Changes in Internal Control over Financial Reporting
There have been reclassifiedno significant changes in our internal control over financial reporting that occurred during the quarter ended December 31, 2023, that were identified in connection with management’s evaluation required by paragraph (d) of Rules 13a-15 and 15d-15 under the Exchange Act, that have materially affected or are reasonably likely to conformmaterially affect our internal control over financial reporting.
Item 9B. Other Information
None.
Item 9C. Disclosure Regarding Foreign Jurisdictions that Prevent Inspections
None.
55
PART III
Item 10. Directors, Executive Officers and Corporate Governance
Directors of the Board
The Board is set forth below.
G Marc Baumann
Age: 68
Mr. Baumann has served as our Chairman of the Board since May 2021, our President since March 2014 and as CEO and a director since January 1, 2015. Mr. Baumann served as our Chief Operating Officer ("COO") from March 2014 through December 2014, CFO and Treasurer from October 2000 to March 2014, President of Urban Operations from October 2012 to March 2014, and Executive Vice President from October 2000 to October 2012. Mr. Baumann holds a B.S. degree from Northwestern University and an M.B.A. degree from the Kellogg School of Management at Northwestern University.
Qualifications: In addition to the Company’squalifications described above, the Board believes Mr. Baumann’s extensive industry knowledge in transportation and mobility and his deep knowledge of SP+ allow him to contribute unique strategic insights to the Board.
Alice M. Peterson
Age: 71
Board Committees:
Ms. Peterson has served as a director since March 2018. She has been the President of Kentucky Heritage Hemp Company LLC since 2021. From 2020 to 2021, Ms. Peterson was the principal of The Loretto Group, a consultancy focused on sustainably profitable business growth. From 2019 to 2020, Ms. Peterson served as the Executive Vice President of Operations for Fluresh LLC, a grower and seller of cannabis products. Prior to that, Ms. Peterson was the President of The Loretto Group from 2016 through 2018. From 2012 through 2015, she served as COO of PPL Group and Big Shoulders Capital, both private equity firms with common ownership. From 2009 to 2010, Ms. Peterson served as the Chief Ethics Officer of SAI Global, a provider of compliance and ethics services, and was a special advisor to SAI Global until 2012.
Ms. Peterson served as a director of RIM Finance, LLC, a wholly owned subsidiary of Research in Motion, Ltd., the maker of the Blackberry™ handheld device, from 2000 to 2013. Ms. Peterson served as a director of Patina Solutions, which provides professionals with a flexible basis to help companies achieve their business objectives, from 2012 to 2013. Ms. Peterson served as a director of the general partner of Williams Partners L.P. and its predecessor (a diversified master limited partnership focused on natural gas transportation; gathering, treating and processing; storage; natural gas liquid fractionation; and oil transportation) from 2005 to 2018 and served as the chair of its audit committee and was a member of the conflicts committee. Ms. Peterson previously served as a director of Navistar Financial Corporation, a wholly owned subsidiary of Navistar International (a manufacturer of commercial and military trucks, diesel engines and parts), Hanesbrands Inc. (an apparel company), TBC Corporation (a marketer of private branded replacement tires), and Fleming Companies (a supplier of consumer package goods). Ms. Peterson holds a B.A. degree from the University of Louisville and an M.B.A. in Finance from Vanderbilt University.
Qualifications: In addition to the qualifications described above, the Board believes Ms. Peterson’s financial and accounting, corporate governance, securities and capital markets, executive leadership, strategy development and risk management, and operating experience are particularly important attributes for a director of SP+.
Gregory A. Reid
Age: 71
Board Committees:
Mr. Reid has served as a director since May 2017. He has served as President of BoomDeYada, LLC, a brand development consultancy group, since October 2011. Prior to founding BoomDeYada, Mr. Reid held various marketing and sales positions at YRC Worldwide, Inc., a transportation and global logistics company, including as Senior Vice President of sales and marketing from 1997 to 2001, Senior Vice President and Chief Marketing Officer from 2001 to 2006, and Executive Vice President and Chief Marketing Officer from 2007 to 2011. From 1994 to 1997, Mr. Reid served as a Vice President and General Manager for the Integrated Logistics Division of Ryder System Inc. Mr. Reid holds a Bachelor of Business Administration degree in Marketing from the University of Cincinnati.
Qualifications: In addition to the qualifications described above, the Board believes Mr. Reid’s strategic planning experience, marketing experience and leadership in the transportation and logistics industry are particularly important attributes for a director of SP+.
Wyman T. Roberts
Age: 64
Board Committees:
Mr. Roberts has served as a director since April 2015. He retired in 2022 as President and CEO of Brinker International, Inc., a position he held since January 2013, and as President of Chili’s Grill & Bar, a position he held since September 2018. Mr. Roberts served as a director of Brinker International, Inc., from February 2013 to May 2022. From November 2009 to June 2016, Mr. Roberts served as President of Chili’s Grill & Bar. He served in various other executive roles at Brinker
56
International from August 2005 to October 2009, including serving as President of Maggiano’s Little Italy and Chief Marketing Officer. Mr. Roberts served as Executive Vice President and Chief Marketing Officer for NBC’s Universal Parks & Resorts from December 2000 until August 2005. Mr. Roberts has a Bachelor’s degree in Finance and an M.B.A. from Brigham Young University.
Qualifications: In addition to the qualifications described above, the Board believes Mr. Roberts’ understanding of technology-based marketing and experience managing a large workforce are particularly important attributes for a director of SP+.
Diana L. Sands
Age: 58
Board Committees:
Ms. Sandshas served as a director since May 2021. She has been a member of the Board of Directors for AngloGold Ashanti since June 2023 and for Vmo Aircraft Leasing since September 2022. She was also on the Board of Directors for PDC Energy, Inc. from February 2021 to August 2023 when it was acquired by Chevron Corporation. Prior to that, from 2016 to 2020, Ms. Sands was an executive officer and Senior Vice President of the Office of Internal Governance and Administration at The Boeing Company and the Senior Vice President of the Office of Internal Governance from 2014 to 2016, where she oversaw a diverse team including internal audit, ethics & investigations, compliance risk management, security and internal services. Since joining Boeing in 2001, Ms. Sands held senior finance roles, including Corporate Controller from 2012 to 2014 and Vice President of Investor Relations from 2008 to 2012. She also led financial planning and analysis and worked in corporate treasury. Prior to that, Ms. Sands held various roles at General Motors Corporation. Ms. Sands has a Master's in Business Administration from Northwestern's Kellogg School of Management, and a Bachelor's in Business Administration from University of Michigan's Ross Business School.
Qualifications: In addition to the qualifications described above, the Board believes Ms. Sands’ understanding of technology, corporate strategy, ethics, compliance and governance, along with her deep financial expertise are particularly important attributes for a director of SP+.
Douglas R. Waggoner
Age: 65
Board Committees:
Mr. Waggonerhas served as our Lead Independent Director since May 2021 and as a director since April 2015. He has served as CEO of Echo Global Logistics, Inc. ("Echo"), a provider of a wide range of transportation and logistics services, since December 2006. He was on the Board of Directors for Echo from February 2008 to 2021, and was Chairman of the Board of Directors of Echo from June 2015 to 2021. Prior to joining Echo, Mr. Waggoner founded SelecTrans, LLC, a transportation management system software provider based in Chicago, Illinois. From April 2004 to December 2005, Mr. Waggoner served as CEO of USF Bestway, and from January 2002 to April 2004 he served as Senior Vice President of strategic marketing for USF Corporation. Mr. Waggoner holds a Bachelor’s degree in Economics from San Diego State University.
Qualifications: In addition to the qualifications described above, the Board believes Mr. Waggoner’s technology experience and leadership in the transportation and logistics industry are particularly important attributes for a director of SP+.
Executive Officers (other than the CEO)
The table below sets forth certain information regarding our executive officers, except for Mr. Baumann, whose biographical information is included in the Directors of the Board within Item 10. Directors, Executive Officers and Corporate Governance.
Name | Age | Position |
Kristopher H. Roy | 49 | CFO & Treasurer |
Christopher Sherman | 48 | President, Commercial Division |
Ritu Vig | 46 | President, Aviation Division |
Kristopher H. Roy has served as CFO & Treasurer since September 2019. Mr. Roy served as Senior Vice President and Corporate Controller from 2015 through August 2019. He joined SP+ in 2013 as Vice President and Assistant Controller. Prior to joining SP+, Mr. Roy served as Global Director of Accounting, Consolidation and Financial Systems at CNH Industrial N.V. and its predecessor from March 2013 to December 2013. He was a Senior Manager with Ernst & Young, LLP from 2009 until 2013. Mr. Roy is a Certified Public Accountant and earned his Bachelor of Arts degree from Michigan State University.
Christopher Sherman has served as President, Commercial Division since January 2023. Prior to that, Mr. Sherman was our Chief Strategy Officer, Commercial Division from March 2022 through December 2022 and a Senior Vice President from October 2012 through February 2022. Mr. Sherman served in the following positions at our predecessor company Central Parking Corporation: Vice President from January 2011 through September 2012; General Manager from October 2002 through December 2010 and Operations Manager from September 2001 through September 2002. Mr. Sherman earned his Bachelor of Science degree in Business from the University of Baltimore.
Ritu Vig has served as President, Aviation Division since January 2023. Prior to that, Ms. Vig was our Chief Legal Officer and Corporate Secretary from September 2019 through December 2022. Ms. Vig joined SP+ in November 2018, when she became Senior Vice President, Deputy General Counsel, a position she held until September 2019. Prior to joining SP+, Ms. Vig was Vice President, Associate General Counsel of RR Donnelley & Sons Company from September 2016 through November 2018. Ms. Vig earned her Juris Doctor degree and Bachelor of Science degree in Finance from the University of Illinois and holds a Master of Business Administration from the University of Chicago Booth School of Business.
57
Delinquent Section 16(a) Reports
Section 16(a) of the Exchange Act requires our directors, executive officers and persons who beneficially own more than 10% of our equity securities to file with the SEC initial reports of beneficial ownership of the common stock and reports of changes in their beneficial ownership and to furnish us with copies of those reports. As a matter of practice, our administrative staff assists our executive officers and directors in preparing initial reports of ownership and reports of changes in ownership and filing such reports with the SEC. To our knowledge, based solely upon a review of copies of reports furnished to us or written representations from certain reporting persons, we believe that during 2023, all Section 16(a) filing requirements applicable to our executive officers, directors and 10% stockholders were met in a timely manner, except for a Form 4 covering two late transactions filed by each of G Marc Baumann, Kristopher H. Roy, Christopher Sherman and Ritu Vig.
Codes of Conduct and Ethics
We have adopted a code of ethics as part of our compliance program. The code of ethics applies to our CEO (Principal Executive Officer), CFO (Principal Financial Officer) and Corporate Controller (Principal Accounting Officer) and all other persons performing similar functions on behalf of SP+. In addition, we have adopted a code of business conduct that applies to all of our officers and employees. Any amendments to, or waivers from, our code of ethics will be posted on our website www.spplus.com. These codes are available on the Investor Relations portion of our website and copies will be provided to you without charge upon request to investor_relations@spplus.com.
Audit Committee
We have established an Audit Committee, which currently has three members: Diana L. Sands, who serves as Chair, Alice M. Peterson and Gregory A. Reid. The Board has determined that all members of the Audit Committee meet Nasdaq Stock Market LLC (“Nasdaq”)’s financial literacy and independence requirements, and that Ms. Peterson and Ms. Sandseach qualify as an “audit committee financial expert” for purposes of the rules and regulations of the SEC. We limit the number of public-company audit committees on which any Audit Committee member may serve to three. The Board will continue to monitor and assess the audit committee memberships of our Audit Committee members on a regular basis.
The Audit Committee’s primary duties and responsibilities are to:
A complete description of the Audit Committee’s function may be found in its charter, which may be accessed through the Corporate Governance section of our website, accessible through our Investor Relations page at www.spplus.com.
Item 11. Executive Compensation
On October 4, 2023, we entered into the Merger Agreement by and among us, Metropolis and the Merger Sub. See Note 1. Significant Accounting Policies and Practices within the Notes to the Consolidated Financial Statements for further discussion. The following discussion references the Merger Agreement.
Compensation Discussion and Analysis (the "CD&A")
This CD&A describes the material components of the executive compensation program applicable to our named executive officers ("NEOs"). While the discussion in the CD&A focuses on our NEOs, many of our executive compensation programs apply broadly across our executive ranks.
Our NEOs during the year ended December 31, 2023 were as follows:
58
2023 Compensation Overview
Our NEOs showed exceptional leadership and focus as they executed our strategy to drive long-term growth. The following elements of compensation were earned by, or awarded to, our NEOs in 2023:
Each of our NEOs is considered to be a "disqualified individual" within the meaning of Section 280G of the Internal Revenue Code of 1986, as amended (the "Code"). To the extent that the closing of the proposed merger with Metropolis is anticipated to occur in 2024, SP+ was permitted under the Merger Agreement to take, and took the following tax-planning actions in 2023, to mitigate any adverse tax consequences under Sections 280G or 4999 of the Code that could arise in connection with the closing of the proposed merger with Metropolis:
Compensation Philosophy and Competitive Positioning
Our compensation program is designed to reward employees for producing sustainable growth for our stockholders and to attract, motivate and retain top talent in the industry. Like most companies, we use a combination of fixed and variable, “at-risk” compensation programs to help align the interests of our executives with our stockholders. This “pay-for-performance” philosophy forms the foundation of our Compensation Committee’s decisions regarding compensation. Underlying these decisions is the Compensation Committee’s beliefs that the labor market for the type of talent we require is limited, and that our executives are among the most capable and highest performing in the industry.
Our Compensation Committee believes that the compensation of our NEOs must be closely aligned with our performance, on both a short- and long-term basis, at responsible levels that are consistent with our cost-conscious culture. At the same time, the Compensation Committee recognizes that our compensation programs must be designed to attract and retain key executives, many of whom are responsible for developing, nurturing and maintaining the client relationships that are important to producing superior results for our stockholders.
In May 2023, after a robust assessment process, the Compensation Committee selected a new independent consultant: Meridian Compensation Partners, LLC ("Meridian"). In order to provide a market perspective on executive and board pay levels, design practices and goal setting, Meridian completed an analysis and recommendation to establish a compensation peer group for SP+. The peer group consists of 18 peer companies as set forth below:
Companies in Peer Group (established by Meridian) | ||
BrightView Holdings, Inc. | Forward Air Corporation | Stericycle, Inc. |
Casella Waste Systems, Inc. | Healthcare Services Group, Inc. | The Brink's Company |
Civeo Corporations | Itron, Inc. | UniFirst Corporation |
Convenant Logistics Group, Inc. | McGrath RentCorp | Universal Logistics Holdings, Inc. |
Deluxe Corporation | Montrose Environmental Group, Inc. | Verra Mobility Corporation |
Enviri Corporation | Sabre Corporation | Werner Enterprises, Inc. |
Given SP+'s diverse businesses, the peer group was selected based on a best available set of peers considering industry, business mix, size and scope. Subsequently, Meridian conducted market-based assessments as to the competitiveness of our executives’ total pay opportunities. This competitive analysis for our NEOs found the following:
59
Given the information obtained from the current and previous compensation studies, the Compensation Committee has informally adopted a guideline that targets total cash compensation and equity in the 50th percentile range for our NEOs. This range is merely a guideline, as the Compensation Committee does not believe in fixing compensation levels based only on market comparisons. Rather, the Compensation Committee believes that other factors should be considered and weighted appropriately, including, but not limited to:
Reasonableness of Compensation
We manage our pay structure and make compensation decisions using a combination of policies, practices and inherent logic. We have a “pay-for-performance” culture as exemplified by our management of salaries, bonus compensation and equity compensation. Base salaries may be adjusted to provide market-based increases, and our executives’ true upside potential has been provided through bonuses and stock-based award opportunities available under our annual cash and long-term incentive plans. After considering all components of the compensation paid to the NEOs, the Compensation Committee has determined that the compensation arrangements are reasonable and appropriate given our overall performance, market for talent, executive retention and business strategy.
Compensation Objectives and Program Components
Our overall compensation philosophy is governed by three fundamental objectives:
Our NEO compensation consists primarily of the following elements: base salary; an annual incentive bonus under our Management Incentive Compensation Program; compensation under our LTIP, which includes grants of PSUs and RSUs; perquisites and personal benefits; and retirement benefits and deferred compensation opportunities.
The Compensation Committee reviews the executive compensation program and NEO compensation on an annual basis. The use and relative contribution of each compensation element is based on a discretionary determination by the Compensation Committee of the importance of each compensation element in supporting our financial and strategic objectives, after taking into consideration the recommendations of our CEO.
The primary elements of our 2023 executive compensation program were:
Compensation Element | Compensation Objective | Performance Metric | Characteristics | Time Horizon | ||||
Base Salary | • Attract and retain qualified executives |
|
• None | • Market-competitive, fixed level of compensation |
|
Management Incentive Compensation Program | • Attract and retain qualified executives | • PBC Adjusted EBITDA |
| • At target, annual incentive provides market-competitive total cash opportunity | • Annual | |||
LTIP | • Attract and retain qualified executives | • For PSUs, PBC Adjusted EBITDA | • PSU and RSU awards paid in shares of | • Three years cliff vesting | ||||
Other Stock-Based Grants | • Attract and retain qualified executives | • None | • Typically RSUs are granted with cliff vesting | • Three years cliff vesting |
Base Salary
Base salary is a critical element of NEO compensation because it is the source of an officer’s consistent income stream and is the most visible barometer of evaluation vis-à-vis the employment market. In establishing and reviewing base salaries, the Compensation Committee considers various factors that include the executive’s qualifications and experience, scope of responsibilities, internal pay equity, past performance and achievements, future expectations that include the executive’s ability to impact short-term and long-term results, as well as the salary practices at other comparable companies. We strive to provide our NEOs with a competitive base salary that is in line with their roles and responsibilities when compared to companies of comparable size.
Management Incentive Compensation Program
Our NEOs participate in our Management Incentive Compensation Program, which provides for an annual cash incentive bonus. Our Compensation Committee oversees this program. By creating target awards and setting performance objectives at the beginning of each fiscal year, our NEOs have the proper incentives to attain key performance metrics. The target bonus opportunities are fixed and subject to change only via approval of the Compensation Committee.
In order to calculate the payout under the Management Incentive Compensation Program, the target bonus amount is multiplied by our PBC Adjusted EBITDA achievement percentage. The total of that is then multiplied by the business unit attainment percentage for those NEOs whose payout under this program is based
60
Revenueson both a PBC Adjusted EBITDA target and gross profita business unit performance metric. Additionally, in 2023, the Compensation Committee approved 10% of the bonus to be based on achievement of a SP+ enabled technology transaction goal. Payouts could range from 0% to 200% of target.
The target bonuses, metrics, weightings, level of achievement and awards are reported in the tables set forth under “2023 Annual Incentive Compensation Program Payouts and Performance Analysis,” below.
LTIP
Because one of our basic compensation objectives is to align our executives’ interests with the long-term interests of our stockholders, we make annual equity grants to our executives in the form of PSUs and RSUs, as further described below. Additionally, in order to align our executives' interests with the long-term interests of our stockholders, we implemented the executive stock ownership requirements, are described under the caption “Executive Stock Ownership Requirements” below.
Performance Share Program. The objective of granting PSUs under our LTIP to participating executives (the "Performance Share Program") is to link compensation to business performance, encourage ownership of our common stock, retain executive talent, and incentivize and reward executive performance. The Performance Share Program provides participating executives with the opportunity to earn shares of our common stock if performance targets for PBC Adjusted EBITDA (for the 2022-2024 and 2023-2025 cycles) are achieved over the cumulative three-year period and recipients satisfy service-based vesting requirements. The Compensation Committee may choose to discontinue the plan or change the performance measures for future performance periods.
For purposes of the Performance Share Program, adjusted EBITDA for each respective performance period will be adjusted for any one-time expenses, benefits, cash payments or receipts made for acquisitions, restructuring and other related costs, joint ventures or other transactions; one-time expenses and benefits related to the sale or disposition of assets; legal costs for one-time, non-recurring items that are considered non-core to the business; cash taxes paid; and significant refinancing costs and expenses (“PBC Adjusted EBITDA”).
The number of PSUs set aside at the onset of the performance period is determined by operatingdividing the proportional annual award values established for our NEOs by the closing share price of our common stock on the day approved by the Compensation Committee. The PSUs issued under the Performance Share Program do not vest until the end of the performance period upon attainment of the performance goals. However, once the PSUs vest, they are no longer subject to forfeiture unless the executive is in violation of the non-compete provisions of the executive’s PSU agreement.
The target Performance Share Program metrics and awards are reported in the tables set forth under “2023 Long-Term Incentive Plan Payouts and Performance Analysis,” below.
RSUs. The objective of granting RSUs is to link compensation to the performance of our common stock, encourage ownership of our common stock and retain executive talent. RSUs typically vest three years from the date of issuance and represent the right to receive shares of our common stock upon vesting. The number of RSUs awarded to an NEO is calculated based on the closing share price of our common stock on the grant date. As a result, the final value of the RSU award depends upon the performance of the stock price at the end of the vesting period.
Other Stock-Based Grants.Periodically, stock awards may be made in the form of RSUs to senior executives, depending on individual performance and the environment for senior executive leadership talent. The RSUs typically vest three years from the date of issuance and represent the right to receive shares of our common stock upon vesting. The number of shares subject to each RSU award is calculated based on the closing share price of our common stock on the grant date. The Compensation Committee believes that these RSUs help to retain executives because they have value upon vesting regardless of our stock price. The Compensation Committee did not grant any such supplemental stock awards to NEOs in 2023.
Perquisites and Personal Benefits
We provide our NEOs with certain limited perquisites and personal benefits. We believe that perquisites are often a way to provide the NEOs with additional annual compensation that supplements their base salaries and bonus opportunities and are intended to ensure productivity. When determining each NEO’s base salary, we take the value of each NEOs’ perquisites and personal benefits into consideration.
The perquisites and personal benefits paid to each NEO in 2023 are reported in column (i) of the Summary Compensation Table, below, and further described in the footnotes thereto.
Retirement Benefits and Deferred Compensation Opportunities
Deferred compensation is a tax-advantaged means of providing certain NEOs with additional compensation that supplements their base salaries and bonus opportunities, including our 401(k) plan.
Employment Agreements
Historically, we have maintained employment agreements with all of our NEOs. It is customary in our industry for senior executives to have employment agreements because it encourages employment continuity and is a practical means to ensure that client relationships are protected through the legal enforcement of protective covenants, including the covenant not to compete and the covenant not to solicit customers and employees.
The Company entered into new employment arrangements with Mr. Sherman and Ms.Vig, effective January 1, 2023, in connection with planned succession changes. As part of these changes, effective January 1, 2023, Mr. Sherman transitioned to the role of President of the Commercial Division and Ms. Vig transitioned to the role of President of the Aviation Division. On October 4, 2023, we entered into an Amended and Restated CEO Agreement with Mr. Baumann to include clarifying language regarding the definition of good reason and the pre change in control protection period, as well as other compliance-related updates.
The employment agreements of all our NEOs have provisions that are triggered if they are terminated for various reasons. Please see the “Payments and Potential Payments Upon Termination or Change-in-Control” section below for a description of the potential payments that may be made to the NEOs in connection with their termination of employment or a change-in-control, and “Executive Compensation-Employment Agreements” for a more detailed description of the employment agreements of our NEOs.
Change in Control Severance Plan
We have a Change in Control Severance Plan (the “Change in Control Severance Plan”) for the benefit of certain executive officers. The Change in Control Severance Plan has provisions that are triggered if these officers are terminated for various reasons. Please see the “Payments and Potential Payments Upon Termination or Change-in-Control” section below for a description of the potential payments that may be made to our NEOs in connection with their termination of employment under the Change in Control Severance Plan, and “Executive Compensation-Change in Control Severance Plan” for a more detailed description of the Change in Control Severance Plan.
61
2023 Compensation Decisions
All our NEOs have entered into employment agreements with us, and their compensation is governed largely by their respective employment agreements. The compensation program for our NEOs is focused on incentive-based compensation, consistent with our philosophy of creating long-term value for our stakeholders. As a result, the majority of our NEO’s compensation is considered “at-risk”.
The mix of fixed and variable compensation at target and realized pay for Mr. Baumann earned in 2023 is reflected below. Taking into consideration his actual salary, earned annual incentive bonus payout, actual stock awards for the 2021-2023 PSUs at 200% and the 2021-2023 RSUs, Mr. Baumann earned $5,997,363 in 2023, which was approximately 157.8% of his 2023 annual total target compensation of $3,800,000.
|
| 2023 |
| |||||
|
| Target Annual Compensation |
|
| Actual Annual Compensation |
| ||
RSUs |
| $ | 1,650,000 |
|
| $ | 2,419,183 |
|
PSUs |
|
| 550,000 |
|
|
| 1,612,789 |
|
Annual Incentive |
|
| 800,000 |
|
|
| 1,165,360 |
|
Salary |
|
| 800,000 |
|
|
| 800,031 |
|
Taking into consideration the actual salary, earned annual incentive bonus payout, and earned stock awards that vested in 2023, our other NEOs as a group earned, on average, 139.5% of their total annual target compensation in 2023.
2023 Base Salary
In 2023, three of our NEOs received a base salary increase - two of which were tied to promotional increases. The table below reflects the base salary for each of our NEOs in 2023.
|
| 2023 |
|
| 2022 |
|
|
|
| |||
Name |
| Salary |
|
| Salary |
|
| % Increase (Decrease) |
| |||
G Marc Baumann |
| $ | 800,000 |
|
| $ | 800,000 |
|
|
| 0.0 | % |
Kristopher H. Roy |
|
| 525,000 |
|
|
| 475,000 |
|
|
| 10.5 | % |
Christopher Sherman |
|
| 500,000 |
|
|
| 412,000 |
|
|
| 21.4 | % |
Ritu Vig |
|
| 450,000 |
|
|
| 400,000 |
|
|
| 12.5 | % |
2023 Management Incentive Compensation Program Payouts and Performance Analysis
Our annual bonus program in 2023 for our NEOs was designed to reward year-over-year growth in PBC Adjusted EBITDA and business unit performance, as well as increase the number of SP+ technology enabled transactions. In order to receive the maximum payout under this program, SP+ needed to achieve PBC Adjusted EBITDA of approximately $156.6 million and 19.2 million SP+ technology enabled transactions. In 2023, as outlined in the Merger Agreement, each outstanding performance-based cash incentive award for the performance period which was scheduled to end on December 31, 2023 that was held by a disqualified individual (within the meaning Section 280G of the Code) was paid in December 2023, determined based on the attainment of the applicable performance metrics at the actual level of performance through September 30, 2023. The PBC Adjusted EBITDA of $104.8 million resulted in a payout of 142.9% for the financial metric (90% weighting) and 170.6% for the technology transaction metric (10% weighting) under the Management Incentive Compensation Program, as shown in the table below.
|
| 2023 |
| |||||||||||||||||||||
Name |
| Base Salary |
|
| Target Bonus |
|
| Threshold Bonus |
|
| Maximum Bonus |
|
| Actual Bonus |
|
| Actual Bonus as % of Target |
| ||||||
G Marc Baumann |
| $ | 800,000 |
|
| $ | 800,000 |
|
| $ | 200,000 |
|
| $ | 1,600,000 |
|
| $ | 1,165,360 |
|
|
| 146 | % |
Kristopher H. Roy(1) |
|
| 525,000 |
|
|
| 300,000 |
|
|
| 75,000 |
|
|
| 600,000 |
|
|
| 437,010 |
|
|
| 146 | % |
Christopher Sherman(2) |
|
| 500,000 |
|
|
| 250,000 |
|
|
| 62,500 |
|
|
| 500,000 |
|
|
| 396,328 |
|
|
| 159 | % |
Ritu Vig |
|
| 450,000 |
|
|
| 225,000 |
|
|
| 56,250 |
|
|
| 450,000 |
|
|
| 368,270 |
|
|
| 164 | % |
The Compensation Committee believes that the PBC Adjusted EBITDA measure and SP+ enabled technology transactions for our CEO and the other NEOs that participate in the program are the appropriate measures of performance at this time. These measures may be modified as circumstances warrant, including possible adjustments due to acquisitions and other atypical events.
2023 LTIP Payouts and Performance Analysis
RSUs scheduled to vest December 31, 2023
In December 2023, per the terms of the Merger Agreement, each outstanding RSU which was scheduled to vest on December 31, 2023 that was held by a disqualified individual (within the meaning of Section 280G of the Code) vested in full on December 1, 2023 and settled in December 2023.
|
| 2023 |
| |||||
Name |
| Shares Awarded on Settlement (#)(1) |
|
| Actual Value Realized on Settlement ($)(2) |
| ||
G Marc Baumann |
|
| 47,130 |
|
| $ | 2,419,183 |
|
Kristopher H. Roy |
|
| 10,712 |
|
|
| 549,847 |
|
Christopher Sherman |
|
| 2,679 |
|
|
| 137,513 |
|
Ritu Vig |
|
| 8,034 |
|
|
| 412,385 |
|
62
2021-2023 PSU Cycle
Payouts under the Performance Share Program vest at the end of three-year performance periods. Payouts for the 2021-2023 PSU cycle were based upon our PBC Adjusted EBITDA during the cycle.
|
| 2023 |
| |||||||||||||||||
Name |
| Target Value ($) |
|
| Target Shares (#)(1) |
|
| Shares Awarded (#) |
|
| Actual Value ($)(2) |
|
| Realized Value as % of Target Value |
| |||||
G Marc Baumann |
| $ | 550,000 |
|
|
| 15,710 |
|
|
| 31,420 |
|
|
| 1,612,789 |
|
|
| 293 | % |
Kristopher H. Roy |
|
| 125,000 |
|
|
| 3,570 |
|
|
| 7,140 |
|
|
| 366,496 |
|
|
| 293 | % |
Christopher Sherman |
|
| 31,250 |
|
|
| 892 |
|
|
| 1,784 |
|
|
| 91,573 |
|
|
| 293 | % |
Ritu Vig |
|
| 93,750 |
|
|
| 2,678 |
|
|
| 5,356 |
|
|
| 274,923 |
|
|
| 293 | % |
2023-2025 PSU Cycle
In March 2023, the Compensation Committee established the payout formula for the 2023-2025 PSU cycle under the Performance Share Program equal to one percent for every $1 million of cumulative three-year PBC Adjusted EBITDA over $380.8 million up to a $571.3 million cap with $476.1 million as the target.
Performance Level |
| Cumulative Three-Year PBC Adjusted EBITDA (millions) |
|
| Performance Payout* (%) |
| ||
Maximum |
| $ | 571.3 |
|
|
| 200 | % |
Target |
|
| 476.1 |
|
|
| 100 | % |
Threshold |
|
| 380.8 |
|
|
| 0 | % |
* If our cumulative three-year PBC Adjusted EBITDA falls between performance levels, the performance payout percentage is determined by linear interpolation between such performance levels.
In March 2023, the Compensation Committee also established that for the 2023-2025 performance cycle under the LTIP, the award for each NEO would consist of 50% PSUs and 50% RSUs. The number of RSUs set aside at the onset of the period is determined by dividing 50% of the annual reward value established for each of our NEOs by the stock price on the grant date ($34.57 on March 1, 2023). The table below shows PSU awards granted to each of our NEOs for the 2023-2025 performance cycle.
Name |
| 2023 - 2025 Threshold ($) |
|
| 2023 - 2025 Threshold (#) |
|
| 2023 - 2025 Target ($) |
|
| 2023 - 2025 Target (#) |
|
| 2023 - 2025 Maximum ($) |
|
| 2023 - 2025 Maximum (#) |
| ||||||
G Marc Baumann |
| $ | 12,000 |
|
|
| 347 |
|
| $ | 1,200,000 |
|
|
| 34,712 |
|
| $ | 2,400,000 |
|
|
| 69,424 |
|
Kristopher H. Roy |
|
| 3,000 |
|
|
| 87 |
|
|
| 300,000 |
|
|
| 8,678 |
|
|
| 600,000 |
|
|
| 17,356 |
|
Christopher Sherman |
|
| 2,500 |
|
|
| 72 |
|
|
| 250,000 |
|
|
| 7,232 |
|
|
| 500,000 |
|
|
| 14,464 |
|
Ritu Vig |
|
| 2,250 |
|
|
| 65 |
|
|
| 225,000 |
|
|
| 6,509 |
|
|
| 450,000 |
|
|
| 13,018 |
|
Impact of the Merger Agreement on Outstanding Awards
Outstanding RSUs
Each RSU that is outstanding immediately prior to the effective time of the proposed merger with Metropolis (the "Effective Time") will automatically vest (if unvested) and be canceled and converted into the right to receive an amount in cash, without interest, equal to (i) the total number of shares of our common stock underlying such RSU multiplied by (ii) $54.00 (the "proposed Merger Consideration"); provided that, RSUs granted after October 4, 2023 will vest on a pro-rata basis immediately prior to the Effective Time based on the number of days that have elapsed since the beginning of the vesting period, e.g. if the Effective Time occurs on June 30, 2024, then one-sixth (1/6th) of the RSUs underlying an applicable award will vest, with any portion of the RSUs underlying such award that does not vest being forfeited for no consideration at the Effective Time.
Outstanding PSUs
Each PSU that is outstanding immediately prior to the Effective Time will automatically be canceled and converted into the right to receive an amount in cash, without interest, equal to the product of (i) the number of shares of our common stock underlying such PSU attributable to the percentage of the PSUs that vest as of immediately prior to the Effective Time (with vesting determined in accordance with the following sentence) multiplied by (ii) the proposed Merger Consideration, and any PSUs that do not so vest will be canceled and terminated for no consideration. Each PSU (x) in respect of which the performance period has not expired as of the Effective Time shall vest determined based on the attainment of the applicable performance metrics at the actual level of performance through September 30, 2023 (determined by pro-rating the performance metrics to reflect the shortened performance period), and (y) in respect of which the performance period has expired as of the Effective Time, shall vest based on actual level of performance through the end of the performance period, in each case, as determined in good faith consistent with past practices by the Board; provided that in the event the Effective Time occurs on or after December 31, 2024, each outstanding award of PSUs will vest immediately prior to the Effective Time, regardless of whether the performance period has expired as of the Effective Time, determined based on the attainment of the applicable performance metrics at the actual level of performance through September 30, 2023 (determined by pro-rating the performance metrics to reflect the shortened performance period).
Outstanding Performance-Based Cash Incentive Awards
Each outstanding performance-based cash incentive award under our Management Incentive Compensation Program for the performance period scheduled to end on December 31, 2024 will vest on a pro-rata basis immediately prior to the Effective Time based on the number of days that have elapsed since the beginning
63
of the vesting period, e.g. if the Effective Time occurs on June 30, 2024, then one-half (1/2) of such awards shall vest, with any portion of such awards that does not vest being forfeited for no consideration at the Effective Time.
Say-on-Pay Advisory Vote
The Dodd-Frank Wall Street Reform and Consumer Protection Act requires public companies to provide their stockholders with an advisory vote to approve executive compensation at least once every three years. At our annual meeting of stockholders in 2017, our stockholders approved a proposal to hold a stockholder advisory vote on executive compensation every year.
This proposal, commonly known as a “Say-on-Pay” proposal, gives stockholders the opportunity to endorse or not endorse our executive pay program and policies.
Prior Say-on-Pay Advisory Vote
Our Board values our stockholders’ feedback and pays careful attention to communications from our stockholders regarding our executive compensation practices. Our executive compensation program is designed to pay for performance and to align the long-term interests of our NEOs and other members of our management team with the long-term interests of our stockholders. We believe these design and alignment principles help to ensure an appropriate balance between risk and reward; while our incentive compensation arrangements do not encourage employees to take unnecessary or excessive risks, our employees are rewarded for executing on our financial and strategic objectives. Further, the Compensation Committee and the Board believe that the compensation policies and procedures are effective in furthering our achievement of short-term, medium-term and long-term business goals, and that the compensation of our NEOs, which is structured to motivate superior individual performance, has supported and contributed to our success.
Say-on-Golden Parachute Advisory Vote
In addition to considering the prior Say-on-Pay advisory vote, we held a special meeting of stockholders on February 9, 2024, regarding the proposed merger with Metropolis. At the meeting, the vote on a proposal to approve, on a non-binding, advisory basis, the compensation that will or may become payable by us to our NEOs in connection with the proposed merger with Metropolis and contemplated by the Merger Agreement did not receive a majority of votes. However, as the vote was non-binding, the results of such vote will not impact any of our contractual commitments or plans or ability to move forward with those commitments.
Role of the Compensation Committee
Our Compensation Committee has administered our executive compensation program since the committee was established in conjunction with our initial public offering. Broadly stated, the Compensation Committee’s overall role is to oversee all of our compensation plans and policies, administer our equity plans and policies, approve equity grants to our executive officers and review and approve all compensation decisions relating to the NEOs. Our Compensation Committee engaged Meridian in 2023 as a consultant to assist in addressing and discharging its duties and obligations. As required by the SEC, the Compensation Committee has determined Meridian has no conflicts of interest with SP+ and is independent.
Role of Management
Our CEO and Chief Human Resources Officer regularly and routinely work with our Compensation Committee throughout the year, with input from our outside legal counsel, as well as from the Compensation Committee’s compensation consultant. Our CEO plays an integral role in making specific recommendations to the Compensation Committee regarding the compensation for all of the NEOs other than the CEO himself. The Board decides the compensation of our CEO following recommendations made by the Compensation Committee.
Executive Stock Ownership Requirements
In order to align the interests of our senior executives with those of our stockholders, we implemented stock ownership requirements for our senior executives in January 2007. In March 2021, the Board adopted new, more expansive executive stock ownership requirements for the same purpose, and also to help attract, motivate, and retain a talented and creative executive team while further promoting our commitment to sound corporate governance. Under the stock ownership requirements, our CEO is required to own and continuously hold a number of shares of our common stock and RSUs with a total value at least equal to three times his base salary. Additionally, each member of our executive team is required to own and continuously hold a number of shares of our common stock and RSUs with a total value at least equal to two times his or her base salary and each member of our senior management team is required to own and continuously hold a number of shares of our common stock and RSUs with a total value at least equal to one times his or her base salary. Our NEOs meet the applicable requirements.
Hedging and Pledging Policy
Our insider trading policy prohibits directors, officers, employees, consultants and certain of their family members ("Covered Persons") from entering into any hedging or monetization transactions relating to our securities or otherwise trading in any instrument relating to the future price of our securities, such as a put or call option, futures contract, short sale, collar or other derivative security. The policy also prohibits Covered Persons from pledging SP+ common stock as collateral for any loans.
Tax and Accounting Considerations
We measure stock-based compensation expense at the grant date, based on the fair value of the award, and the expense is recognized over the requisite employee service period (generally, the vesting period) for awards expected to vest. We account for forfeitures of stock-based awards when they occur. Accounting rules also require us to record cash compensation as an expense at the time the obligation is accrued.
Section 162(m) of the Internal Revenue Code limits the deductibility of compensation paid to certain executive officers to $1 million per year. The Compensation Committee has and will continue to take into consideration Section 162(m) in establishing compensation for our executives but considers other factors and business needs as well. Interpretations of and changes in applicable tax laws and regulations, as well as other factors beyond our control, can affect deductibility of compensation. For these and other reasons, the Compensation Committee has determined that it will not necessarily seek to limit executive compensation to the amount that is deductible under Section 162(m) of the Code.
Relationship between Compensation Plans and Risk
The Compensation Committee has concluded that it is not reasonably likely that the risks arising from our compensation policies and practices would have a material adverse effect on SP+. In reaching this conclusion, the Compensation Committee considered the following factors:
64
Clawback Policy
We believe that it is in the best interest of SP+ and our stockholders to maintain a culture that emphasizes integrity and accountability, including as to financial reporting matters. Accordingly, in October 2023, the Board adopted the Dodd-Frank Clawback policy to comply with the final rules issued by the SEC and the final listing standard to be adopted by NASDAQ pursuant to Section 954 of the Dodd-Frank Wall Street Reform and Consumer Protection Act and to supplement their existing clawback policy which was enacted in 2019. These policies provide for the recoupment of certain executive officer compensation in the event of an accounting restatement resulting from material noncompliance with financial reporting requirements under the federal securities laws. These policies are administered by the Compensation Committee, and they apply to Incentive Compensation paid, granted or otherwise awarded to our current and former executive officers. “Incentive Compensation” includes annual bonuses and other short- and long-term cash incentive awards, stock options, restricted stock awards and other equity or equity-based awards, but does not include restricted stock or similar awards subject to only time-based vesting.
Tax Reimbursement Agreements
In connection with the Merger Agreement, on October, 4, 2023, we entered into tax reimbursement agreements with Mr. Baumann and Mr. Roy, and on November 22 and November 24, 2023, we entered into tax reimbursement agreements with Mr. Sherman and Ms. Vig, respectively, which provide each of them, to the extent they are subjected to the excise tax under Section 4999 of the Code, with a payment such that each of them will retain an amount equal to the amount he or she would have received had the excise tax not applied to certain payments and benefits received in connection with the proposed merger with Metropolis.
COMPENSATION COMMITTEE REPORT
The Compensation Committee of the Board has reviewed and discussed with management the foregoing “Compensation Discussion and Analysis,” and, based on such review and discussion, the Compensation Committee recommended to the Board that the “Compensation Discussion and Analysis” be included in this Form 10-K for filing with the SEC.
By the Compensation Committee
Wyman T. Roberts (Chair)
Gregory A. Reid
Diana L. Sands
Douglas R. Waggoner
Executive Compensation
Summary Compensation Table
The following table sets forth the compensation earned, awarded or paid for services rendered to us in all capacities for the fiscal years ending December 31, 2023, 2022 and 2021 by our Principal Executive Officer (“PEO”), our Principal Financial Officer (“PFO”) and our other two NEOs.
Name and Principal Position |
| Year |
|
| Salary |
|
| Bonus |
|
| Stock |
| Non-Equity |
|
| All Other |
|
| Total |
| ||||||
G Marc Baumann |
|
| 2023 |
|
|
| 800,031 |
|
|
| — |
|
| 2,400,022 |
|
| 1,165,360 |
|
|
| 38,255 |
|
|
| 4,403,668 |
|
Chief Executive Officer; |
|
| 2022 |
|
|
| 800,031 |
|
|
| — |
|
| 2,400,028 |
|
| 1,008,000 |
|
|
| 26,356 |
|
|
| 4,234,415 |
|
President (PEO) |
|
| 2021 |
|
|
| 800,031 |
|
|
| — |
|
| 2,944,473 |
|
| 1,200,000 |
|
|
| 2,500 |
|
|
| 4,947,004 |
|
|
|
|
|
|
|
|
|
|
|
|
|
|
|
|
|
|
|
|
|
| ||||||
Kristopher H. Roy |
| 2023 |
|
|
| 522,937 |
|
|
| — |
|
| 600,031 |
|
| 437,010 |
|
|
| 24,855 |
|
|
| 1,584,833 |
| |
Chief Financial Officer (PFO) |
| 2022 |
|
|
| 472,935 |
|
|
| — |
|
| 600,015 |
|
| 346,500 |
|
|
| 12,385 |
|
|
| 1,431,835 |
| |
|
| 2021 |
|
|
| 425,017 |
|
|
| — |
|
| 633,783 |
|
| 300,000 |
|
|
| 1,431 |
|
| 1,360,231 |
| ||
|
|
|
|
|
|
|
|
|
|
|
|
|
|
|
|
|
|
|
|
| ||||||
Christopher Sherman |
|
| 2023 |
|
|
| 496,352 |
|
|
| — |
|
| 500,020 |
|
| 396,328 |
|
|
| 24,066 |
|
|
| 1,416,766 |
|
President, Commercial Division(4) |
|
| 2022 |
|
|
| 412,001 |
|
|
| — |
|
| 200,015 |
|
| 238,140 |
|
|
| 9,945 |
|
|
| 860,101 |
|
|
|
| 2021 |
|
|
| 412,001 |
|
|
| — |
|
| 193,433 |
|
| 165,000 |
|
|
| 3,227 |
|
|
| 773,661 |
|
|
|
|
|
|
|
|
|
|
|
|
|
|
|
|
|
|
|
|
|
| ||||||
Ritu Vig |
| 2023 |
|
|
| 447,934 |
|
|
| — |
|
| 450,032 |
|
| 368,270 |
|
|
| 24,720 |
|
|
| 1,290,956 |
| |
President, Aviation Division(5) |
| 2022 |
|
|
| 397,932 |
|
|
| — |
|
| 425,009 |
|
| 283,500 |
|
|
| 9,180 |
|
|
| 1,115,621 |
| |
| 2021 |
|
|
| 350,013 |
|
|
| — |
|
| 508,797 |
|
| 300,000 |
|
|
| 2,500 |
|
|
| 1,161,310 |
| ||
|
|
|
|
|
|
|
|
|
|
|
|
|
|
|
|
|
|
|
|
| ||||||
(1) The amounts shown in column (e) for 2023 represent the aggregate grant date fair value of the 2023-2025 PSU awards and RSU awards, which were granted under the LTIP. The fair value of the PSU awards and the regular RSU awards granted to all NEOs is based on the closing price of our common stock on the grant date, March 2, 2023 ($34.57), and, with respect to the PSUs, is calculated at the target share payout for the cumulative three years of the performance period. For a discussion of the assumptions used in determining the grant date fair value, please refer to Note 6. Stock-Based Compensation within our Notes to the Consolidated Financial Statements. The maximum value of the PSUs assuming the highest level of performance conditions will be achieved would be $2,400,000 for Mr. Baumann, $600,000 for Mr. Roy, $500,000 for Mr. Sherman and $450,000 for Ms. Vig. For information about the threshold and maximum payout amounts under the PSU awards, see the “Grants of Plan-Based Awards for 2023” table below.
The amounts shown in column (e) were computed in accordance with Financial Accounting Standards Board (“FASB”) Accounting Standards Codification (“ASC”) Topic 718, not the actual amounts paid to or realized by the NEOs during our 2023, 2022 and 2021 fiscal years. An explanation of the methodology for payouts under our PSU and RSU awards is discussed in the footnotes to the “Grants of Plan-Based Awards for 2023” and “Outstanding Equity Awards at Fiscal Year-End 2023” tables below.
(2) The amounts for 2023 shown in column (g) reflect cash bonuses paid pursuant to our Management Incentive Compensation Program for 2023 performance.
(3) The values of All Other Compensation reported in column (i) include our 401(k) contributions, life insurance and financial planning services for each of our NEOs. In 2023,the value of Mr. Baumann's group term life insurance was $11,430. Furthermore, the value of Financial Planning for each NEO was $13,500.
(4) For the calendar years 2022 and 2021, Mr. Sherman was not an NEO; in 2022, he served as Chief Strategy Officer, Commercial Division, and prior to 2022, as Senior Vice President, Operations.
(5) For the calendar years 2022 and 2021, Ms. Vig was not an NEO; prior to 2023, she served as Chief Legal Officer.
65
Grants of Plan-Based Awards for 2023
The following table sets forth summary information regarding RSUs and PSUs granted to our NEOs pursuant to our LTIP and bonus amounts achievable pursuant to our Management Incentive Compensation Program during 2023.
|
|
|
| Estimated Future Payouts |
|
| Estimated Future Payouts |
|
| All Other Stock Awards: Number of Shares of Stock or Units(3) |
| Grant Date |
| ||||||||||||||||||||
Name |
| Grant |
| Threshold |
|
| Target |
|
| Maximum |
|
| Threshold |
|
| Target |
|
| Maximum |
|
| Units |
| Value |
| ||||||||
G Marc Baumann |
| 1/1/2023 | (1) |
| 200,000 |
|
|
| 800,000 |
|
|
| 1,600,000 |
|
|
|
|
|
|
|
|
|
|
|
|
|
|
| |||||
|
| 3/1/2023 | (2) |
|
|
|
|
|
|
|
|
|
|
|
|
|
|
|
|
|
|
| 34,713 |
|
| 1,200,028 |
| ||||||
| 3/1/2023 | (3) |
|
|
|
|
|
|
|
|
|
| 347 |
|
|
| 34,712 |
|
|
| 69,424 |
|
|
|
|
| 1,199,994 |
| |||||
Kristopher H. Roy |
| 1/1/2023 | (1) |
| 75,000 |
|
|
| 300,000 |
|
|
| 600,000 |
|
|
|
|
|
|
|
|
|
|
|
|
|
|
| |||||
|
| 3/1/2023 | (2) |
|
|
|
|
|
|
|
|
|
|
|
|
|
|
|
|
|
|
| 8,679 |
|
| 300,033 |
| ||||||
| 3/1/2023 | (3) |
|
|
|
|
|
|
|
|
|
| 87 |
|
|
| 8,678 |
|
|
| 17,356 |
|
|
|
|
| 299,998 |
| |||||
Christopher Sherman |
| 1/1/2023 | (1) |
| 62,500 |
|
|
| 250,000 |
|
|
| 500,000 |
|
|
|
|
|
|
|
|
|
|
|
|
|
|
| |||||
|
| 3/1/2023 | (2) |
|
|
|
|
|
|
|
|
|
|
|
|
|
|
|
|
|
|
| 7,232 |
|
| 250,010 |
| ||||||
|
| 3/1/2023 | (3) |
|
|
|
|
|
|
|
|
|
| 72 |
|
|
| 7,232 |
|
|
| 14,464 |
|
|
|
|
| 250,010 |
| ||||
Ritu Vig |
| 1/1/2023 | (1) |
| 56,250 |
|
|
| 225,000 |
|
|
| 450,000 |
|
|
|
|
|
|
|
|
|
|
|
|
|
|
| |||||
|
| 3/1/2023 | (2) |
|
|
|
|
|
|
|
|
|
|
|
|
|
|
|
|
|
|
| 6,509 |
|
| 225,016 |
| ||||||
| 3/1/2023 | (3) |
|
|
|
|
|
|
|
|
|
| 65 |
|
|
| 6,509 |
|
|
| 13,018 |
|
|
|
|
| 225,016 |
| |||||
Outstanding Equity Awards at Fiscal Year-End 2023
The following table shows stock awards subject to certain restrictions and other contingencies outstanding on December 31, 2023, the last day of our fiscal year, for our NEOs. No NEO held stock options or stock appreciation rights as of December 31, 2023.
|
|
|
| Stock Awards | ||||||||||||||||||||||
Name |
| Vesting Period/ |
| Number of |
| Market Value of Shares or Units of Stock |
| Equity |
| Equity | ||||||||||||||||
|
|
|
|
|
|
|
|
|
|
|
|
|
|
|
|
|
|
|
|
|
|
| ||||
G Marc Baumann |
| 1/1/22-12/31/24 (4) |
|
|
|
|
|
|
|
|
|
|
|
|
| 38,961 |
|
|
|
|
| 1,996,751 |
|
| ||
|
| 1/1/22-12/31/24 (5) |
|
|
| 38,962 |
|
|
|
|
| 1,996,803 |
|
|
|
|
|
|
|
|
|
|
|
| ||
|
| 1/1/23-12/31/25 (6) |
|
|
|
|
|
|
|
|
|
|
|
|
| 34,712 |
|
|
|
|
| 1,778,990 |
|
| ||
|
| 1/1/23-12/31/25 (7) |
|
|
| 34,713 |
|
|
|
|
| 1,779,041 |
|
|
|
|
|
|
|
|
|
|
|
| ||
Kristopher H. Roy |
| 1/1/22-12/31/24 (4) |
|
|
|
|
|
|
|
|
|
|
|
|
| 9,740 |
|
|
|
|
| 499,175 |
|
| ||
|
| 1/1/22-12/31/24 (5) |
|
|
| 9,741 |
|
|
|
|
| 499,226 |
|
|
|
|
|
|
|
|
|
|
|
| ||
|
| 1/1/23-12/31/25 (6) |
|
|
|
|
|
|
|
|
|
|
|
|
| 8,678 |
|
|
|
|
| 444,748 |
|
| ||
|
| 1/1/23-12/31/25 (7) |
|
|
| 8,679 |
|
|
|
|
| 444,799 |
|
|
|
|
|
|
|
|
|
|
|
| ||
Christopher Sherman |
| 1/1/22-12/31/24 (4) |
|
|
|
|
|
|
|
|
|
|
|
|
| 3,247 |
|
|
|
|
| 166,409 |
|
| ||
|
| 1/1/22-12/31/24 (5) |
|
|
| 3,247 |
|
|
|
|
| 166,409 |
|
|
|
|
|
|
|
|
|
|
|
| ||
|
| 1/1/23-12/31/25 (6) |
|
|
|
|
|
|
|
|
|
|
|
|
| 7,232 |
|
|
|
|
| 370,640 |
|
| ||
|
| 1/1/23-12/31/25 (7) |
|
|
| 7,232 |
|
|
|
|
| 370,640 |
|
|
|
|
|
|
|
|
|
|
|
| ||
Ritu Vig |
| 1/1/22-12/31/24 (4) |
|
|
|
|
|
|
|
|
|
|
|
|
| 6,899 |
|
|
|
|
| 353,574 |
|
| ||
|
| 1/1/22-12/31/24 (5) |
|
|
| 6,900 |
|
|
|
|
| 353,625 |
|
|
|
|
|
|
|
|
|
|
|
| ||
|
| 1/1/23-12/31/25 (6) |
|
|
|
|
|
|
|
|
|
|
|
|
| 6,509 |
|
|
|
|
| 333,586 |
|
| ||
|
| 1/1/23-12/31/25 (7) |
|
|
| 6,509 |
|
|
|
|
| 333,586 |
|
|
|
|
|
|
|
|
|
|
|
| ||
66
Stock Vested During 2023
The following table provides information on the RSUs and PSUs held by our NEOs that vested during 2023. SP+ has no outstanding option awards.
|
| Stock Awards | ||||||||||
Name |
| Number of |
| Value | ||||||||
G Marc Baumann(3) |
|
|
| 78,550 |
|
|
|
|
| 4,003,694 |
|
|
Kristopher H. Roy(4) |
|
|
| 17,852 |
|
|
|
|
| 909,916 |
|
|
Christopher Sherman(5) |
|
|
| 12,889 |
|
|
|
|
| 521,294 |
|
|
Ritu Vig(6) |
|
|
| 13,390 |
|
|
|
|
| 682,488 |
|
|
Nonqualified Defined Contribution and Other Nonqualified Deferred Compensation Plans
We offer a non-qualified deferred compensation plan to those employees whose participation in the 401(k) plan is limited by statute or regulation (the "Deferred Compensation Plan"). Our NEOs each participated in the Deferred Compensation Plan during 2023 which provided each with the opportunity to defer an amount that, when combined with his or her 401(k) plan deferral, will equal the maximum allowable deferral pursuant to the IRS section 415 limits, to be paid upon separation of employment or distribution date selected by the participant. The aggregate earnings credited to participants' accounts in the Deferred Compensation Plan correspond to the actual returns of their chosen investments funds. The following table sets forth the nonqualified deferred compensation for our NEOs for the year ending December 31, 2023.
Name |
| Executive |
| Registrant |
| Aggregate |
| Aggregate |
| Aggregate | ||||||||||||||||||||
(a) |
| (b) |
|
| (c) |
|
|
|
| (d) |
|
|
|
| (e) |
|
|
|
| (f) |
|
| ||||||||
G Marc Baumann |
|
|
| 16,001 |
|
|
|
|
| 9,225 |
|
|
|
|
| 34,983 |
|
|
|
|
| — |
|
|
|
|
| 353,829 |
|
|
Kristopher H. Roy |
|
|
| 20,917 |
|
|
|
|
| 9,225 |
|
|
|
|
| 74,224 |
|
|
|
|
| — |
|
|
|
|
| 491,115 |
|
|
Christopher Sherman |
|
|
| 201,232 |
|
|
|
|
| 8,481 |
|
|
|
|
| 113,975 |
|
|
|
|
| — |
|
|
|
|
| 962,689 |
|
|
Ritu Vig |
|
|
| 20,157 |
|
|
|
|
| 9,225 |
|
|
|
|
| 17,014 |
|
|
|
|
| — |
|
|
|
|
| 97,921 |
|
|
(1) The amounts included in column (b) are included as Salary in column (c) of the Summary Compensation Table.
(2) The amounts included in column (c) are included as All Other Compensation in column (i) of the Summary Compensation Table.
(3) Because the earnings reflected in column (d) do not constitute above-market interest or preferential earnings, none of the amounts reported in column (d) are reported in the Summary Compensation Table.
(4) Amounts reported in column (f) for each NEO include amounts reported in the Summary Compensation Table in previous years when earned if that executive’s compensation was required to be disclosed in a previous year.
CEO Pay Ratio
As required by the Dodd-Frank Act and Item 402(u) of Regulation S-K, we are providing the following information about the relationship of the annual total compensation of our median employee to the annual total compensation of our CEO.
As is permitted under the SEC rules, to determine our median employee, we chose “gross wages” as our consistently applied compensation measure. Using a determination date of December 31, 2023, our employee population was comprised of 19,335 people. Under the de minimis rule, we may exclude non-U.S. employees who account for 5% or less of our total employees. In determining the identity of our median employee, we excluded 280 non-US employees from the following countries: Canada (167); the United Kingdom (46); and India (67). From the remaining 19,055 US employees, we identified our median employee. We determined that our median employee’s total compensation was $25,155 calculated in accordance with the SEC rules applicable to the Summary Compensation Table, while our CEO’s total compensation included in the Summary Compensation Table was $4,403,668. Accordingly, our estimated CEO pay ratio is 175 to 1.
This ratio is a reasonable estimate calculated using a methodology consistent with the SEC rules. As the SEC rules allow companies to adopt a wide range of methodologies, to apply country exclusions and to make reasonable estimates and assumptions that reflect their compensation practices to identify the median employee and calculate the CEO pay ratio, the ratio may not be comparable to the CEO pay ratios presented by other companies.
Employment Agreements
Mr. Baumann
We entered into an amended and restated CEO Employment Agreement with Mr. Baumann effective as of October 4, 2023 (the "CEO Employment Agreement"). The Amended and Restated CEO Employment Agreement provides Mr. Baumann with the following compensation and benefits:
The Amended and Restated CEO Employment Agreement provides continuation of certain salary and benefits upon termination of employment depending upon the reason for termination as described below under “Payments and Potential Payments upon Termination or Change of Control-Mr. Baumann.” The Amended
67
and Restated CEO Employment Agreement also provides that Mr. Baumann may not disclose or use any of our confidential information during the term of the employment agreement. During his employment with SP+ and for a period of 24 months following his termination for any reason, he is precluded from engaging or assisting in any business that is in competition with SP+ and from soliciting our clients, customers, business referral sources, employees or representatives.
Under the Amended and Restated CEO Employment Agreement, Mr. Baumann is entitled to receive enhanced severance benefits upon a termination of employment that occurs in connection with a change in control. In the event that Mr. Baumann’s employment with SP+ is terminated without cause or he terminates his employment for good reason (as each term is defined in the Amended and Restated CEO Employment Agreement) during the period beginning three months prior to the announcement of a change in control of SP+ and ending two years following said change in control, subject to his compliance in all material respects with the restrictive covenants set forth in the CEO Employment Agreement and his execution and non-revocation of a separation agreement and release, Mr. Baumann will receive the following payments and benefits:
Messrs. Roy and Sherman and Ms. Vig
On November 15, 2022, we announced several leadership changes, all of which took effect on January 1, 2023. As part of these changes, Mr. Sherman transitioned to President, Commercial Division and Ms. Vig transitioned to President, Aviation Division.
We also have employment agreements with each of Messrs. Roy and Sherman and Ms. Vig.
Each executive’s compensation is governed largely by his or her respective employment agreement, subject to annual review. The employment agreements of Messrs. Roy and Sherman and Ms. Vig automatically renew for one-year periods unless either party provides advanced notice of an intention not to renew the employment agreement. As of February 27, 2024, the employment agreements will automatically renew for Messrs. Roy and Sherman and Ms. Vig on the following dates unless either party provides a termination notice: Mr. Roy - August 31, 2024 and Mr. Sherman and Ms. Vig - January 1, 2025.
Each of the employment agreements provides the NEO with the following compensation and benefits:
The annual salary for each as of December 31, 2023 was as follows: Mr. Roy-$525,000, Mr. Sherman-$500,000 and Ms. Vig-$450,000.
The employment agreements provide that each of these NEOs is entitled to continuation of certain salary and benefits upon termination of employment depending upon the reason for termination as described below under “Payments and Potential Payments upon Termination or Change of Control-Potential Payments to Other Executive Officers.” The employment agreements for each of these NEOs also provide that they may not disclose or use any confidential information of SP+ during or after the term of the employment agreement. During their employment with us and for a period of 12 months following their termination of employment for any reason, each of these employees is precluded from engaging or assisting in any business that is in competition with SP+ and from soliciting any of our clients, customers, business referral sources, officers, employees or representatives.
Change in Control Severance Plan
Under the Change in Control Severance Plan, Messrs. Roy and Sherman and Ms. Vig are designated as “Tier 1 Employees” and entitled to enhanced severance benefits upon a termination of employment that occurs in connection with a change in control. In the event a Tier 1 Employee’s employment with SP+ is terminated without cause or a Tier 1 Employee terminates his or her employment for good reason (as each term is defined in the Change in Control Severance Plan) in the three months prior to or two years following a change in control of SP+, such Tier 1 Employee will receive the following benefits:
Payments and Potential Payments upon Termination or Change of Control
Potential Payments to Mr. Baumann
Our employment agreement with Mr. Baumann is terminable by us for cause. If his employment is terminated by reason of his death, we are obligated to pay his estate an amount equal to the base salary earned through the end of the calendar month in which death occurs, plus any earned and unpaid annual bonus, a pro-rata portion of the target bonus for the year in which the death occurs, vacation pay and other benefits earned through the date of death including any vested benefits to which he may be entitled and the value of any in-flight equity awards that will vest on the date of termination or later.
If Mr. Baumann’s employment is terminated by reason of disability, we are obligated to pay him or his legal representative an amount equal to his annual base salary in effect on the date of termination for, eighteen (18) months reduced by amounts received under any disability benefit program, plus any earned and unpaid annual bonus, pro-rata portion of the target bonus for the year the date of termination occurs, vacation pay and other benefits earned through the date of termination, including any vested benefits to which he may be entitled and the value of any in-flight equity awards that will vest on the date of the termination or later.
68
Upon Mr. Baumann’s termination of employment for cause or by reason of his voluntary resignation not for good reason, we must pay him the annual base salary through the date of termination, the annual bonus for any calendar year ended prior to termination, and any vested benefits to which he may be entitled.
If Mr. Baumann voluntarily resigns for “good reason” (as defined in the Amended and Restated CEO Employment Agreement) or upon our termination of his employment for any reason other than cause, we must continue to pay his most recent base salary and target annual bonus, for a period of 24 months following termination, pay any earned but unpaid annual bonus, and provide him and/or his family with certain other benefits including health insurance (medical and dental) for eighteen months and any vested benefits to which he may be entitled as well as the value on any in-flight equity awards that will vest on the date of termination or later.
Mr. Baumann is subject to non-competition and non-solicitation agreements for 24 months following termination of his employment.
Post-Employment Payments. The following table describes certain potential payments and benefits payable to Mr. Baumann, our Chairman and CEO, if his employment terminated and a change of control occurred on December 31, 2023, the last day of the fiscal year.
Compensation Component |
| CEO Voluntary |
| CEO |
| Company |
| Company |
| Change in | ||||||||||||||||||||
Compensation |
|
|
|
|
|
|
|
|
|
|
|
|
|
|
|
|
|
|
|
|
|
|
|
|
| |||||
Base salary |
|
|
| — |
|
|
|
|
| 1,600,000 |
| (2) |
|
|
| 1,600,000 |
| (1) |
|
|
| — |
|
|
|
|
| 2,400,000 |
| (3) |
Target cash incentive |
|
|
| — |
|
|
|
|
| 1,600,000 |
| (2) |
|
|
| 1,600,000 |
| (2) |
|
|
| — |
|
|
|
|
| 2,400,000 |
| (3) |
RSUs |
|
|
| 1,924,215 |
| (4) |
|
|
| 1,924,215 |
| (4) |
|
|
| 1,924,215 |
| (4) |
|
|
| — |
|
|
|
|
| 3,775,844 |
| (4) |
PSUs |
|
|
| 1,924,165 |
| (5) |
|
|
| 1,924,165 |
| (5) |
|
|
| 1,924,165 |
| (5) |
|
|
| — |
|
|
|
|
| 3,775,741 |
| (5) |
Benefits and Perquisites |
|
|
|
|
|
|
|
|
|
|
|
|
|
|
|
|
|
|
|
|
|
|
|
|
| |||||
Health Benefits |
|
|
| — |
|
|
|
|
| 42,545 |
| (6) |
|
|
| 42,545 |
| (6) |
|
|
| — |
|
|
|
|
| 42,545 |
| (3) |
Insurance Funding |
|
|
| 9,888 |
|
|
|
|
| 9,888 |
| (7) |
|
|
| 9,888 |
| (7) |
|
|
| 9,888 |
|
|
|
|
| 9,888 |
| (3) |
Total |
|
|
| 3,858,268 |
|
|
|
|
| 7,100,813 |
|
|
|
|
| 7,100,813 |
|
|
|
|
| 9,888 |
|
|
|
|
| 12,404,018 |
|
|
(5) For a retirement after age 65, the PSUs vest pro-rata (i.e. open cycles) provided that the vesting provisions including any performance requirements are met. For purposes of this schedule, the value of the PSUs was calculated by multiplying the closing price per share of common stock on December 29, 2023 by the pro-rated actual value. In the event of a change of control prior to the end of the performance cycle, the performance period ends as of the date of the change of control and the performance goal is measured through this date with appropriate adjustments to reflect the shortened performance period and all target shares are awarded.
(6) Estimated cost of health insurance coverage continuation for 18 months computed at current premium.
(7) Estimated cost of required life insurance policy payments computed based on 2023 premiums.
Potential Payments to Other Named Executive Officers
Each of our employment agreements with Messrs. Roy and Sherman and Ms. Vig is terminable by us for cause. If their employment is terminated by reason of their death, we are obligated to pay their respective estates an amount equal to the base salary earned through the end of the calendar month in which death occurs, plus any earned and unpaid annual bonus, vacation pay and other benefits earned through the date of death. If the employment of Messrs. Roy or Sherman or Ms. Vig is terminated by us because of the NEO's disability, we are obligated to pay the NEO or their legal representative an amount equal to their annual base salary for the duration of the employment period in effect on the date of termination, reduced by amounts received under any disability benefit program, plus any earned and unpaid annual bonus, vacation pay and other benefits earned through the date of termination. Upon termination of the employment for Messrs. Roy or Sherman or Ms. Vig for cause or by reason of their voluntary resignation without good reason, we must pay them the sum of 1/24 of their annual salary, payable over a 12-month period.
If Messrs. Roy or Sherman or Ms. Vig voluntarily resigns for “good reason” (as defined in the respective employment agreement) or upon our termination of their employment for any reason other than cause, we must (i) pay the executive, for a period of 12 months following termination, payments at the rate of the executive’s most recent annual base salary and annual target bonus, and (ii) provide the executive and/or his or her family with certain other benefits. Messrs. Roy and Sherman and Ms. Vig are subject to non-competition and non-solicitation agreements for 12 months following termination of their employment.
Post-Employment Payments. The following table describes certain potential payments and benefits payable to Mr. Roy, our CFO, if his employment terminated and a change of control occurred on December 31, 2023, the last day of the fiscal year.
Compensation Component |
| NEO Voluntary |
| NEO |
| Company |
| Company |
| Change in | ||||||||||||||||||||
Compensation |
|
|
|
|
|
|
|
|
|
|
|
|
|
|
|
|
|
|
|
|
|
|
|
|
| |||||
Base salary |
|
|
| 21,875 |
| (1) |
|
|
| 525,000 |
| (2) |
|
|
| 525,000 |
| (1) |
|
|
| 21,875 |
| (1) |
|
|
| 1,050,000 |
| (3) |
Target cash incentive |
|
|
| — |
|
|
|
|
| 300,000 |
| (2) |
|
|
| 300,000 |
| (2) |
|
|
| — |
|
|
|
|
| 600,000 |
| (3) |
RSUs |
|
|
| — |
|
|
|
|
| — |
|
|
|
|
| — |
|
|
|
|
| — |
|
|
|
|
| 943,923 |
| (4) |
PSUs |
|
|
| — |
|
|
|
|
| — |
|
|
|
|
| — |
|
|
|
|
| — |
|
|
|
|
| 944,025 |
| (5) |
Benefits and Perquisites |
|
|
|
|
|
|
|
|
|
|
|
|
|
|
|
|
|
|
|
|
|
|
|
|
| |||||
Health Benefits |
|
|
| — |
|
|
|
|
| 28,364 |
| (6) |
|
|
| 28,364 |
| (6) |
|
|
| — |
|
|
|
|
| 28,364 |
| (3) |
Total |
|
|
| 21,875 |
|
|
|
|
| 853,364 |
|
|
|
|
| 853,364 |
|
|
|
|
| 21,875 |
|
|
|
|
| 3,566,312 |
|
|
(1) Payment as consideration for compliance with Protection of Proprietary Interests provisions per the terms of his employment agreement.
(2) Payable as salary continuation over 12 months, subject to compliance with covenants not to solicit or compete for 12 months.
(3) In the event NEO is terminated following a change of control, it would follow the termination without cause provisions outlined in the Change in Control Severance plan.
(4) In the event of a change of control, the RSU vesting accelerates. For purposes of this schedule, the value of the RSUs was calculated by multiplying the closing price per share of common stock on December 29, 2023 ($51.25).
(5) With the exception of the shares vested on 12/31/23, the RSUs are forfeited for all reasons referenced in the table, except in the event of a change of control.
(6) For a retirement after age 65, the PSUs vest pro-rata (i.e. open cycles) provided that the vesting provisions including any performance requirements are met. For purposes of this schedule, the value of the PSUs was calculated by multiplying the closing price per share of common stock on December 29, 2023 ($51.25) by the pro-rated actual value. In the event of a change of control prior to the end of the performance cycle, the performance period ends as of the date of the change of control and the performance goal is measured through this date with appropriate adjustments to reflect the shortened performance period and all target shares are awarded.
69
(7) Estimated cost of health insurance coverage continuation for 12 months computed at current premium.
Post-Employment Payments. The following table describes certain potential payments and benefits payable to Mr. Sherman, our President, Commercial Division, if his employment terminated and a change of control occurred on December 31, 2023, the last day of the fiscal year.
Compensation Component |
| NEO Voluntary |
| NEO |
| Company |
| Company |
| Change in | ||||||||||||||||||||
Compensation |
|
|
|
|
|
|
|
|
|
|
|
|
|
|
|
|
|
|
|
|
|
|
|
|
| |||||
Base salary |
|
|
| 20,833 |
| (1) |
|
|
| 500,000 |
| (2) |
|
|
| 500,000 |
| (1) |
|
|
| 28,833 |
| (1) |
|
|
| 1,000,000 |
| (3) |
Target cash incentive |
|
|
| — |
|
|
|
|
| 250,000 |
| (2) |
|
|
| 250,000 |
| (2) |
|
|
| — |
|
|
|
|
| 500,000 |
| (3) |
RSUs |
|
|
| — |
|
|
|
|
| — |
|
|
|
|
| — |
|
|
|
|
| — |
|
|
|
|
| 537,049 |
| (4) |
PSUs |
|
|
| — |
|
|
|
|
| — |
|
|
|
|
| — |
|
|
|
|
| — |
|
|
|
|
| 537,049 |
| (5) |
Benefits and Perquisites |
|
|
|
|
|
|
|
|
|
|
|
|
|
|
|
|
|
|
|
|
|
|
|
|
| |||||
Health Benefits |
|
|
| — |
|
|
|
|
| 27,371 |
| (6) |
|
|
| 27,371 |
| (6) |
|
|
| — |
|
|
|
|
| 27,371 |
| (3) |
Total |
|
|
| 20,833 |
|
|
|
|
| 777,371 |
|
|
|
|
| 777,371 |
|
|
|
|
| 28,833 |
|
|
|
|
| 2,601,469 |
|
|
(1) Payment as consideration for compliance with Protection of Proprietary Interests provisions per the terms of his employment agreement.
(2) Payable as salary continuation over 12 months, subject to compliance with covenants not to solicit or compete for 12 months.
(3) In the event NEO is terminated following a change of control, it would follow the termination without cause provisions outlined in the Change in Control Severance plan.
(4) In the event of a change of control, the RSU vesting accelerates. For purposes of this schedule, the value of the RSUs was calculated by multiplying the closing price per share of common stock on December 29, 2023 ($51.25).
(5) With the exception of the shares that vested on 12/31/23, the RSUs are forfeited for all reasons referenced in the table, except in the event of a change of control.
(6) For a retirement after age 65, the PSUs vest pro-rata (i.e. open cycles) provided that the vesting provisions including any performance requirements are met. For purposes of this schedule, the value of the PSUs was calculated by multiplying the closing price per share of common stock on December 29, 2023 ($51.25) by the pro-rated actual value. In the event of a change of control prior to the end of the performance cycle, the performance period ends as of the date of the change of control and the performance goal is measured through this date with appropriate adjustments to reflect the shortened performance period and all target shares are awarded.
(7) Estimated cost of health insurance coverage continuation for 12 months computed at current premium.
Post-Employment Payments. The following table describes certain potential payments and benefits payable to Ms. Vig, President, Aviation Division, if her employment terminated and a change of control occurred on December 31, 2023, the last day of the fiscal year.
Compensation Component |
| NEO Voluntary |
| NEO |
| Company |
| Company |
| Change in | ||||||||||||||||||||
Compensation |
|
|
|
|
|
|
|
|
|
|
|
|
|
|
|
|
|
|
|
|
|
|
|
|
| |||||
Base salary |
|
|
| 18,750 |
| (1) |
|
|
| 450,000 |
| (2) |
|
|
| 450,000 |
| (1) |
|
|
| 18,750 |
| (1) |
|
|
| 900,000 |
| (3) |
Target cash incentive |
|
|
| — |
|
|
|
|
| 225,000 |
| (2) |
|
|
| 225,000 |
| (2) |
|
|
| — |
|
|
|
|
| 450,000 |
| (3) |
RSUs |
|
|
| — |
|
|
|
|
| — |
|
|
|
|
| — |
|
|
|
|
| — |
|
|
|
|
| 687,211 |
| (4) |
PSUs |
|
|
| — |
|
|
|
|
| — |
|
|
|
|
| — |
|
|
|
|
| — |
|
|
|
|
| 687,160 |
| (5) |
Benefits and Perquisites |
|
|
|
|
|
|
|
|
|
|
|
|
|
|
|
|
|
|
|
|
|
|
|
|
| |||||
Health Benefits |
|
|
| — |
|
|
|
|
| — |
|
|
|
|
| — |
|
|
|
|
| — |
|
|
|
|
| — |
|
|
Total |
|
|
| 18,750 |
|
|
|
|
| 675,000 |
|
|
|
|
| 675,000 |
|
|
|
|
| 18,750 |
|
|
|
|
| 2,724,371 |
|
|
(1) Payment as consideration for compliance with Protection of Proprietary Interests provisions per the terms of her employment agreement.
(2) Payable as salary continuation over 12 months, subject to compliance with covenants not to solicit or compete for 12 months.
(3) In the event NEO is terminated following a change of control, it would follow the termination without cause provisions outlined in her employment agreement.
(4) For a voluntary resignation after age 65, the RSUs are pro-rated. In the event of a change of control, the RSU vesting accelerates. For purposes of this schedule, the value of the RSUs was calculated by multiplying the closing price per share of common stock on December 29, 2023 ($51.25).
(5) For a retirement after age 65, the PSUs vest pro-rata (i.e. open cycles) provided that the vesting provisions including any performance requirements are met. For purposes of this schedule, the value of the PSUs was calculated by multiplying the closing price per share of common stock on December 29, 2023 by the pro-rated actual value. In the event of a change of control prior to the end of the performance cycle, the performance period ends as of the date of the change of control and the performance goal is measured through this date with appropriate adjustments to reflect the shortened performance period and all target shares are awarded.
(6) Estimated cost of health insurance coverage continuation for 12 months computed at current premium.
Non-Employee Director Compensation Table
The following table sets forth the compensation earned for services rendered to us for the fiscal year ending December 31, 2023 by our non-executive directors.
Non-Employee Director Compensation Table
Name(1) |
| Fees Earned |
|
| Stock |
|
|
| Option |
| All Other |
| Total | |||||||||||||||||
Alice M. Peterson |
|
|
| 95,320 |
|
|
|
|
| 130,023 |
|
|
|
|
| — |
|
|
|
|
| — |
|
|
|
|
| 225,343 |
|
|
Gregory A. Reid |
|
|
| 84,218 |
|
|
|
|
| 130,023 |
|
|
|
|
| — |
|
|
|
|
| — |
|
|
|
|
| 214,241 |
|
|
Wyman T. Roberts |
|
|
| 90,818 |
|
|
|
|
| 130,023 |
|
|
|
|
| — |
|
|
|
|
| — |
|
|
|
|
| 220,841 |
|
|
Diana L. Sands |
|
|
| 93,815 |
|
|
|
|
| 130,023 |
|
|
|
|
| — |
|
|
|
|
| — |
|
|
|
|
| 223,838 |
|
|
Douglas R. Waggoner |
|
|
| 117,820 |
|
|
|
|
| 130,023 |
|
|
|
|
| — |
|
|
|
|
| — |
|
|
|
|
| 247,843 |
|
|
(1) G Marc Baumann, our CEO, is also director but does not receive any compensation for his service as a director.
(2) Represents the aggregate grant date fair value based on the closing price per share of our common stock on the grant date ($34.84 on May 10, 2023). For a discussion of the assumptions used in determining the grant date fair value, please refer to Note 6. Stock-Based Compensation within the Notes to the Consolidated Financial Statements.
Non-Employee Director Fees Earned or Paid in Cash
2023 directors’ fees paid in cash as stated below are paid only to directors who are not employees of SP+.
70
Fee Category | Annual Rate ($) | |||
Annual Cash Retainer (exclusive of Chair) |
| 70,500 |
| (1) |
Lead Independent Director |
| 35,000 |
|
|
Audit Committee Membership (exclusive of Chair) |
| 10,000 |
|
|
Audit Committee Chair |
| 25,000 |
| (2) |
Compensation Committee Membership (exclusive of Chair) |
| 7,500 |
|
|
Compensation Committee Chair |
| 20,000 |
| (3) |
Nominating and Corporate Governance Committee |
| 5,000 |
|
|
Nominating and Corporate Governance Committee Chair |
| 15,000 |
|
|
(1) The Annual Cash Retainer (exclusive of Chair)'s annual rate was $60,000 for the period January 1, 2023 to May 10, 2023.
(2) The Audit Committee Chair's annual rate was $30,000 for the period January 1, 2023 to May 10, 2023.
(3) The Compensation Committee Chair's annual rate was $17,500 for the period January 1, 2023 to May 10, 2023.
Non-Employee Director Stock Grants
Messrs. Reid, Roberts and Waggoner and Mses. Peterson and Sands each received a fully vested stock grant of 3,732 shares of common stock on May 10, 2023 for their service as directors.
Non-Employee Director Stock Ownership Requirements
In March 2019, the Board adopted stock ownership requirements for our non-employee directors. Our non-employee directors are required to hold common stock equal to three times their annual cash retainer, which was $70,500 in 2023. All non-employee directors have achieved compliance with these stock ownership requirements.
Item 12. Security Ownership of Certain Beneficial Owners and Management and Related Stockholder Matters
Security Ownership
The following table sets forth information regarding the beneficial ownership of our common stock as of February 20, 2024 by:
Beneficial ownership is determined in accordance with SEC rules. In computing the number of shares beneficially owned by a person and the percentage ownership of that person, shares of common stock subject to options held by that person that are currently exercisable or exercisable within 60 days of the Record Date, are deemed issued and outstanding. These shares, however, are not deemed outstanding for purposes of computing percentage ownership of any other stockholder.
Except as indicated in the footnotes to this table and subject to applicable community property laws, each stockholder named in the table has sole voting and investment power with respect to the shares shown as beneficially owned by them. This table also includes shares owned by a spouse as community property.
Percentage beneficially owned is based on 19,798,884 shares of our common stock outstanding as of February 20, 2024, and is calculated in accordance with SEC rules.
Name and Address of Beneficial Owner(1) | Current Shares Beneficially Owned(2) |
| Percent of Shares Beneficially Owned (%) | |
5% or Greater Beneficial Owners |
|
|
| |
Alpine Associates Management Inc.(3) |
| 999,100 |
| 5.05% |
BlackRock, Inc.(4) |
| 1,498,011 |
| 7.57% |
River Road Asset Management, LLC(5) |
| 1,428,239 |
| 7.21% |
The Vanguard Group(6) |
| 1,076,247 |
| 5.44% |
Named Executive Officers & Directors |
|
|
| |
G Marc Baumann(7) |
| 133,131 |
| * |
Alice M. Peterson |
| 18,826 |
| * |
Gregory A. Reid |
| 21,829 |
| * |
Wyman T. Roberts |
| 29,448 |
| * |
Kristopher H. Roy(8) |
| 22,345 |
| * |
Diana L. Sands |
| 9,343 |
| * |
Christopher Sherman(9) |
| 17,082 |
| * |
Douglas R. Waggoner |
| 29,448 |
| * |
Ritu Vig(10) |
| 14,073 |
| * |
All directors and executive officers as a group (9 persons)(11) |
| 295,525 |
| * |
*Less than 1.0% of the outstanding shares of common stock
71
Director Independence
The rules of the Nasdaq require listed companies to have a board of directors with at least a majority of independent directors. These rules have both objective tests and a subjective test for determining who is an “independent director.” On an annual basis, each member of the Board is required to complete a questionnaire designed to provide information to assist the Board in determining whether the director is independent under Nasdaq listing standards and our Governance Guidelines, and whether members of our Audit Committee and Compensation Committee satisfy additional SEC and Nasdaq independence requirements. The Board has adopted guidelines setting forth certain categories of transactions, relationships and arrangements that it has deemed immaterial for purposes of making its determination regarding a director’s independence, and does not consider any such transactions, relationships, and arrangements in making its subjective determination.
The Board has determined that each of the following directors is independent under the applicable Nasdaq listing rules and our Governance Guidelines: Alice M. Peterson, Gregory A. Reid, Diana L. Sands, Wyman T. Roberts and Douglas R. Waggoner. Mr. Baumann is not considered independent because he is our CEO.
The Board limits membership on the Audit Committee, Compensation Committee, Executive Committee and the Nominating and Corporate Governance Committee to independent directors, and all directors serving on such committees have been determined to be independent. Our Governance Guidelines require any director who has previously been determined to be independent to inform the Chair, Lead Independent Director and our Corporate Secretary of any change in his or her principal occupation or status as a member of the Board of any other public company, or any change in circumstance that may cause his or her status as an independent director to change.
Related-Party Transaction Policy
As part of its oversight responsibilities, the charter of our Audit Committee requires the Audit Committee to review all related-party transactions for potential conflicts of interest. In addition, the Board has adopted our Related Party Transaction Policy that requires the Audit Committee to review all transactions between SP+ and our executive officers, directors, principal stockholders and other related persons for potential conflicts involving amounts in excess of $5,000. This policy is available on the Investor Relations portion of our website.
Transactions with Related Persons and Control Persons
The Board recognizes related person transactions present a heightened risk of conflicts of interest and/or improper valuation (or the perception thereof) and has determined that the Audit Committee is best suited to review and approve related person transactions. Our Audit Committee’s charter requires it to review, on an ongoing basis, related party transactions required to be disclosed in our public filings for potential conflict of interest situations and requires all such transactions to be approved by the Audit Committee or another independent body of the Board.
Item 14. Principal Accountant Fees and Services
Principal Accountant Fees and Services
The Audit Committee, with the approval of our stockholders, engaged Ernst & Young LLP to perform an annual audit of our financial statements for the fiscal year ended December 31, 2023. The following table presents fees for professional services rendered by Ernst & Young LLP for the audit of our annual consolidated financial statements for the years ended December 31, 2020, 20192023 and 2018 wereDecember 31, 2022, the review of our interim consolidated financial statements for each quarter in fiscal years 2023 and 2022 and for tax and all other services rendered by Ernst & Young LLP during those periods.
Type of Fee | 2023 |
| 2022 |
| ||
Audit Fees(1) | $ | 2,287,500 |
| $ | 2,250,500 |
|
Audit-Related Fees(2) |
| 92,500 |
|
| 89,000 |
|
Tax Fees(3) |
| — |
|
| — |
|
All Other Fees(4) |
| 2,000 |
|
| 1,050 |
|
Total | $ | 2,382,000 |
| $ | 2,340,550 |
|
Procedures for Audit Committee Pre-Approval of Audit and Permissible Non-Audit Services of Independent Registered Public Accounting Firm
Pursuant to our pre-approval policy and procedures, the Audit Committee was responsible for reviewing and approving, in advance, all audit services and permissible non-audit services or relationships between SP+ and Ernst & Young LLP. The Audit Committee is responsible for appointing, setting compensation for and overseeing the work of our independent registered public accounting firm, and has established a policy concerning the pre-approval of services performed by our independent registered public accounting firm. Each proposed engagement not specifically identified by the SEC as follows:impairing independence is evaluated for independence implications prior to entering into a contract with the independent registered public accounting firm for such services. The Audit Committee has approved in advance certain permitted services whose scope is consistent with maintaining the independence of our registered public accounting firm.
72
|
| Year Ended December 31, |
| |||||||||||||||||||||
(millions) |
| 2020 |
|
| Gross Margin Percentage |
|
| 2019 |
|
| Gross Margin Percentage |
|
| 2018 (1) |
|
| Gross Margin Percentage |
| ||||||
Services revenue |
|
|
|
|
|
|
|
|
|
|
|
|
|
|
|
|
|
|
|
|
|
|
|
|
Commercial |
|
|
|
|
|
|
|
|
|
|
|
|
|
|
|
|
|
|
|
|
|
|
|
|
Lease type contracts |
| $ | 180.2 |
|
|
|
|
|
| $ | 377.3 |
|
|
|
|
|
| $ | 386.2 |
|
|
|
|
|
Management type contracts |
|
| 212.1 |
|
|
|
|
|
|
| 264.6 |
|
|
|
|
|
|
| 249.4 |
|
|
|
|
|
Total Commercial |
|
| 392.3 |
|
|
|
|
|
|
| 641.9 |
|
|
|
|
|
|
| 635.6 |
|
|
|
|
|
Aviation |
|
|
|
|
|
|
|
|
|
|
|
|
|
|
|
|
|
|
|
|
|
|
|
|
Lease type contracts |
|
| 8.6 |
|
|
|
|
|
|
| 30.7 |
|
|
|
|
|
|
| 27.0 |
|
|
|
|
|
Management type contracts |
|
| 140.5 |
|
|
|
|
|
|
| 251.8 |
|
|
|
|
|
|
| 101.2 |
|
|
|
|
|
Total Aviation |
|
| 149.1 |
|
|
|
|
|
|
| 282.5 |
|
|
|
|
|
|
| 128.2 |
|
|
|
|
|
Other |
|
|
|
|
|
|
|
|
|
|
|
|
|
|
|
|
|
|
|
|
|
|
|
|
Lease type contracts |
|
| 0.6 |
|
|
|
|
|
|
| 0.9 |
|
|
|
|
|
|
| 0.7 |
|
|
|
|
|
Management type contracts |
|
| 7.0 |
|
|
|
|
|
|
| 9.6 |
|
|
|
|
|
|
| 10.9 |
|
|
|
|
|
Total Other |
|
| 7.6 |
|
|
|
|
|
|
| 10.5 |
|
|
|
|
|
|
| 11.6 |
|
|
|
|
|
Reimbursed management type contract revenue |
|
| 537.9 |
|
|
|
|
|
|
| 728.8 |
|
|
|
|
|
|
| 693.0 |
|
|
|
|
|
Total services revenue |
| $ | 1,086.9 |
|
|
|
|
|
| $ | 1,663.7 |
|
|
|
|
|
| $ | 1,468.4 |
|
|
|
|
|
Gross profit |
|
|
|
|
|
|
|
|
|
|
|
|
|
|
|
|
|
|
|
|
|
|
|
|
Commercial |
|
|
|
|
|
|
|
|
|
|
|
|
|
|
|
|
|
|
|
|
|
|
|
|
Lease type contracts |
|
| (10.4 | ) |
|
| (5.8 | )% |
|
| 29.5 |
|
|
| 7.8 | % |
|
| 25.8 |
|
|
| 6.7 | % |
Management type contracts |
|
| 80.1 |
|
|
| 37.8 | % |
|
| 104.1 |
|
|
| 39.3 | % |
|
| 98.3 |
|
|
| 39.4 | % |
Lease impairment |
|
| (97.1 | ) |
| N/M |
|
|
| — |
|
| N/M |
|
|
| — |
|
| N/M |
| |||
Total Commercial |
|
| (27.4 | ) |
|
|
|
|
|
| 133.6 |
|
|
|
|
|
|
| 124.1 |
|
|
|
|
|
Aviation |
|
|
|
|
|
|
|
|
|
|
|
|
|
|
|
|
|
|
|
|
|
|
|
|
Lease type contracts |
|
| 0.7 |
|
|
| 8.1 | % |
|
| 8.2 |
|
|
| 26.7 | % |
|
| 7.3 |
|
|
| 27.0 | % |
Management type contracts |
|
| 39.9 |
|
|
| 28.4 | % |
|
| 66.2 |
|
|
| 26.3 | % |
|
| 31.9 |
|
|
| 31.5 | % |
Total Aviation |
|
| 40.6 |
|
|
|
|
|
|
| 74.4 |
|
|
|
|
|
|
| 39.2 |
|
|
|
|
|
Other |
|
|
|
|
|
|
|
|
|
|
|
|
|
|
|
|
|
|
|
|
|
|
|
|
Lease type contracts |
|
| 4.1 |
|
| N/M |
|
|
| 4.3 |
|
| N/M |
|
|
| 3.2 |
|
| N/M |
| |||
Management type contracts |
|
| 13.1 |
|
| N/M |
|
|
| 15.8 |
|
| N/M |
|
|
| 17.5 |
|
| N/M |
| |||
Total Other |
|
| 17.2 |
|
|
|
|
|
|
| 20.1 |
|
|
|
|
|
|
| 20.7 |
|
|
|
|
|
Total gross profit |
| $ | 30.4 |
|
|
|
|
|
| $ | 228.1 |
|
|
|
|
|
| $ | 184.0 |
|
|
|
|
|
PART IV
Item 15. Exhibits and Financial Statement Schedules
(a) Documents filed as part of this report
1. All Financial Statements
Index to Consolidated Financial Statements
Report of Independent Registered Public Accounting Firm (PCAOB ID: 42) |
| 29 |
Report of Independent Registered Public Accounting Firm on Internal Control over Financial Reporting | 30 | |
Audited Consolidated Financial Statements | ||
| 31 | |
For the | ||
Consolidated Statements of | 32 | |
33 | ||
34 | ||
35 | ||
36 |
2. Financial Statement Schedule
Schedules are omitted since the required information is not present or is not present in amounts sufficient to require submission of the schedule, or because the information required is included in the Consolidated Financial Statements or notes thereto.
3. Exhibits
|
|
|
| Incorporated by Reference | ||||
Exhibit Number |
| Description |
| Form |
| Exhibit |
| Filing Date/Period End Date |
|
|
|
|
|
|
|
|
|
2.1 |
|
| 8-K |
| 2.1 |
| October 17, 2018 | |
|
|
|
|
|
|
|
|
|
2.2 |
|
| 8-K |
| 2.2 |
| October 5, 2023 | |
|
|
|
|
|
|
|
|
|
3.1 |
| Second Amended and Restated Certificate of Incorporation of the Company filed on June 2, 2004. |
| 10-K |
| 3.1 |
| December 31, 2008 |
|
|
|
|
|
|
|
|
|
3.1.1 |
|
| 10-K |
| 3.1.1 |
| December 31, 2008 | |
|
|
|
|
|
|
|
|
|
3.1.2 |
|
| 10-Q |
| 3.1.3 |
| June 30, 2010 | |
|
|
|
|
|
|
|
|
|
3.1.3 |
|
| 10-Q |
| 3.1.4 |
| June 30, 2010 | |
|
|
|
|
|
|
|
|
|
3.1.4 |
|
| 8-K |
| 3.1 |
| May 16, 2023 | |
|
|
|
|
|
|
|
|
|
3.1.5 |
|
| 8-K |
| 3.1 |
| December 2, 2013 | |
|
|
|
|
|
|
|
|
|
3.2 |
| Fourth Amended and Restated Bylaws of the Company dated January 1, 2010. |
| 10-Q |
| 3.1 |
| September 30, 2016 |
|
|
|
|
|
|
|
|
|
3.2.1 |
| Amendment to Fourth Amended and Restated Bylaws of the Company dated February 19, 2016. |
| 10-Q |
| 3.1.1 |
| September 30, 2016 |
|
|
|
|
|
|
|
|
|
3.2.2 |
| Amendment to Fourth Amended and Restated Bylaws of the Company dated August 5, 2016. |
| 10-Q |
| 3.1.2 |
| September 30, 2016 |
|
|
|
|
|
|
|
|
|
3.2.3 |
| Amendment to Fourth Amended and Restated Bylaws of the Company dated May 11, 2023. |
| 8-K |
| 3.2 |
| May 16, 2023 |
|
|
|
|
|
|
|
|
|
4.1 |
|
| 10-K |
| 4.1 |
| December 31, 2015 | |
|
|
|
|
|
|
|
|
|
4.2 |
|
| 10-K |
| 4.2 |
| February 22, 2021 | |
|
|
|
|
|
|
|
|
|
10.1 |
|
| 8-K |
| 10.1 |
| November 30, 2018 | |
|
|
|
|
|
|
|
|
|
10.1.1 |
|
| 10-K |
| 10.1.1 |
| February 27, 2019 | |
|
|
|
|
|
|
|
|
|
73
10.1.2 |
|
| 10-Q |
| 10.1 |
| October 31, 2019 | |
|
|
|
|
|
|
|
|
|
10.1.3 |
|
| 10-Q |
| 10.1 |
| May 11, 2020 | |
|
|
|
|
|
|
|
|
|
10.1.4 |
|
| 10-K |
| 10.1.4 |
| February 22, 2021 | |
|
|
|
|
|
|
|
|
|
10.1.5 |
|
| 8-K |
| 10.1 |
| April 26, 2022 | |
|
|
|
|
|
|
|
|
|
10.2+ |
|
| 10-K |
| 10.22.2 |
| December 31, 2012 | |
|
|
|
|
|
|
|
|
|
10.2.1+ |
|
| 8-K |
| 10.3 |
| March 7, 2005 | |
|
|
|
|
|
|
|
|
|
10.2.2+ |
|
|
|
|
|
|
| |
|
|
|
|
|
|
|
|
|
10.2.3+ |
|
| 10-Q |
| 10.8 |
| June 30, 2012 | |
|
|
|
|
|
|
|
|
|
10.2.4 |
|
| 8-K |
| 10.2 |
| December 30, 2022 | |
|
|
|
|
|
|
|
|
|
10.3+ |
|
| 10-Q |
| 10.1 |
| August 1, 2019 | |
|
|
|
|
|
|
|
|
|
10.3.1+ |
|
| 8-K |
| 10.4 |
| December 30, 2022 | |
|
|
|
|
|
|
|
|
|
10.3.2+ |
|
| 8-K |
| 10.1 |
| October 5, 2023 | |
|
|
|
|
|
|
|
|
|
10.4+ |
| Executive Employment Agreement by and between Baggage Airline Guest Services, Inc., and Robert Miles |
| 10-K |
| 10.5 |
| February 22, 2021 |
|
|
|
|
|
|
|
|
|
10.5+ |
|
| 10-Q |
| 10.9 |
| September 30, 2012 | |
|
|
|
|
|
|
|
|
|
10.5.1+ |
|
| 10-K |
| 10.7.1 |
| December 31, 2017 | |
|
|
|
|
|
|
|
|
|
10.5.2+ |
| Second Amendment to Employment Agreement dated February 15, 2017 between the Company and Rob Toy. |
| 10-K |
| 10.12.1 |
| December 31, 2016 |
|
|
|
|
|
|
|
|
|
10.5.3+ |
|
| 8-K |
| 10.1 |
| December 30, 2022 | |
|
|
|
|
|
|
|
|
|
10.6+ |
| Consulting Agreement between SP Plus Corporation and John Ricchiuto, dated as of December 29, 2022. |
| 8-K |
| 10.3 |
| December 30, 2022 |
|
|
|
|
|
|
|
|
|
10.7+ |
|
| 8-K/A |
| 10.1 |
| September 27, 2019 | |
|
|
|
|
|
|
|
|
|
10.8+ |
|
| 8-K |
| 10.5 |
| December 30, 2022 | |
|
|
|
|
|
|
|
|
|
10.8.1+ |
|
| 8-K |
| 10.2 |
| October 5, 2023 | |
|
|
|
|
|
|
|
|
|
10.9+ |
|
| 10-K |
| 10.8 |
| February 27, 2019 | |
|
|
|
|
|
|
|
|
|
10.10+ |
| Form of Performance Share Agreement between the Company and Recipient. |
| 10-K |
| 4.1 |
| December 31, 2015 |
74
|
|
|
|
|
|
|
|
|
10.11+ |
| Form of the Company's Restricted Stock Unit Agreement dated as of July 1, 2008. |
| 8-K |
| 10.1 |
| July 2, 2008 |
|
|
|
|
|
|
|
|
|
10.11.1+ |
| First Amendment to Form of the Company's Restricted Stock Unit Agreement. |
| 8-K |
| 10.1 |
| August 6, 2009 |
|
|
|
|
|
|
|
|
|
10.11.2+ |
| Second Amendment to Form of the Company's Restricted Stock Unit Agreement dated May 27, 2011. |
| 8-K |
| 10.1 |
| June 2, 2011 |
|
|
|
|
|
|
|
|
|
10.11.3 |
| Third Amendment to Form of the Company's Restricted Stock Unit Agreement dated March 2, 2017. |
| 10-Q |
| 10.1 |
| May 6, 2019 |
|
|
|
|
|
|
|
|
|
10.12 |
|
| 10-K |
| 10.23 |
| December 31, 2013 | |
|
|
|
|
|
|
|
|
|
10.13 |
|
| 10-K |
| 10.24 |
| December 31, 2013 | |
|
|
|
|
|
|
|
|
|
10.14 |
|
| 10-Q |
| 10.1 |
| November 2, 2023 | |
|
|
|
|
|
|
|
|
|
10.15 |
|
| 10-Q |
| 10.2 |
| November 2, 2023 | |
|
|
|
|
|
|
|
|
|
10.16 |
|
| 10-K |
| 10.30 |
| December 31, 2005 | |
|
|
|
|
|
|
|
|
|
10.17 |
|
| 10-K |
| 10.27 |
| December 31, 2008 | |
|
|
|
|
|
|
|
|
|
10.18 |
|
| 10-K |
| 10.28 |
| December 31, 2008 | |
|
|
|
|
|
|
|
|
|
10.19 |
|
| 10-K |
| 10.29 |
| December 31, 2008 | |
|
|
|
|
|
|
|
|
|
10.20 |
| SP Plus Corporation Long-Term Incentive Plan, as Amended and Restated, adopted as of March 4, 2021 |
| S-8 |
| 10.1 |
| May 14, 2021 |
|
|
|
| 8-K |
| 10.3 |
| October 5, 2023 |
10.21 |
|
|
|
|
|
|
| |
|
|
|
|
|
|
|
|
|
21* |
|
|
|
|
|
|
| |
|
|
|
|
|
|
|
|
|
23* |
| Consent of Independent Registered Public Accounting Firm dated as of February 27, 2024. |
|
|
|
|
|
|
|
|
|
|
|
|
|
|
|
31.1* |
|
|
|
|
|
|
| |
|
|
|
|
|
|
|
|
|
31.2* |
|
|
|
|
|
|
| |
|
|
|
|
|
|
|
|
|
31.3* |
|
|
|
|
|
|
| |
|
|
|
|
|
|
|
|
|
32** |
|
|
|
|
|
|
| |
|
|
|
|
|
|
|
|
|
97.1*+ |
|
|
|
|
|
|
| |
|
|
|
|
|
|
|
|
|
101.INS * |
| Inline XBRL Instance Document - the instance document does not appear in the Interactive Data File because its XBRL tags are embedded within the Inline XBRL document. |
|
|
|
|
|
|
|
|
|
|
|
|
|
|
|
101.SCH * |
| Inline XBRL Taxonomy Extension Schema With Embedded Linkbase Documents. |
|
|
|
|
|
|
|
|
|
|
|
|
|
|
|
101.CAL * |
| Inline XBRL Taxonomy Extension Calculation Linkbase. |
|
|
|
|
|
|
|
|
|
|
|
|
|
|
|
104 |
| Cover Page Interactive Data File (embedded within Inline XBRL document). |
|
|
|
|
|
|
|
|
|
|
|
|
|
|
|
* Filed herewith.
** Furnished herewith.
+ Management contract or compensation plan, contract or agreement.
Item 16. Form 10-K Summary
None.
75
N/M - Not MeaningfulSIGNATURES
73Pursuant to the requirements of Section 13 or 15(d) of the Securities Exchange Act of 1934, the registrant has duly caused this report to be signed on its behalf by the undersigned, thereunto duly authorized.
SP PLUS CORPORATION | |||
Date: February 27, 2024 | By: | /s/ KRISTOPHER H. ROY | |
Kristopher H. Roy | |||
Chief Financial Officer | |||
(Principal Financial Officer) | |||
Pursuant to the requirements of the Securities Exchange Act of 1934, this report has been signed below by the following persons on behalf of the Registrant and in the capacities and on the dates indicated.
Signature | Title | Date | ||
/s/ G MARC BAUMANN | Chairman and Chief Executive Officer (Principal Executive Officer) | February 27, 2024 | ||
G Marc Baumann | ||||
/s/ ALICE M. PETERSON | Director | February 27, 2024 | ||
Alice M. Peterson | ||||
/s/ GREGORY A. REID | Director | February 27, 2024 | ||
Gregory A. Reid | ||||
/s/ WYMAN T. ROBERTS | Director | February 27, 2024 | ||
Wyman T. Roberts | ||||
/s/ DIANA L. SANDS | Director | February 27, 2024 | ||
Diana L. Sands | ||||
/s/ DOUGLAS R. WAGGONER | Lead Independent Director | February 27, 2024 | ||
Douglas R. Waggoner | ||||
/s/ KRISTOPHER H. ROY | Chief Financial Officer (Principal Financial Officer) | February 27, 2024 | ||
Kristopher H. Roy | ||||
/s/ GARY T. ROBERTS | Senior Vice President, Corporate Controller and Assistant Treasurer (Principal Accounting Officer and Duly Authorized Officer) | February 27, 2024 | ||
Gary T. Roberts | ||||
76