

UNITED STATES
SECURITIES AND EXCHANGE COMMISSION
Washington, D.C. 20549
FORM 10-K
FORM 10-K
(Mark One)
☒ | ANNUAL REPORT PURSUANT TO SECTION 13 OR 15(d) OF THE SECURITIES EXCHANGE ACT OF 1934 |
For the fiscal year ended December 31, 20202023
or
☐ | TRANSITION REPORT PURSUANT TO SECTION 13 OR 15(d) OF THE SECURITIES EXCHANGE ACT OF 1934 |
For the transition period from to
Commission File Number 001-37839
TPI Composites, Inc.
(Exact name of Registrant as specified in its charter)
Delaware | 20-1590775 | |
(State or other jurisdiction of incorporation or organization) | (I.R.S. Employer Identification Number) |
8501 N. Scottsdale Rd.9200 E. Pima Center Parkway, Suite 250
Gainey Center II, Suite 100Scottsdale, AZ 85258
Scottsdale, AZ 85253(480) 305-8910
(480) 305-8910
(Address, including zip code, and telephone number,
including area code, of Registrant’s principal executive offices)
Securities registered pursuant to Section 12(b) of the Act:
Title of each class | Trading symbol(s) | Name of each exchange on which registered |
Common Stock, par value $0.01 | TPIC | NASDAQ Global Market |
Securities registered pursuant to Section 12(g) of the Act: None
Indicate by check mark if the Registrant is a well-known seasoned issuer, as defined in Rule 405 of the Securities Act. Yes ☐ No☒ No ☐
Indicate by check mark if the Registrant is not required to file reports pursuant to Section 13 or 15(d) of the Act. Yes ☐ ☐No No ☒
Indicate by check mark whether the Registrant (1) has filed all reports required to be filed by Section 13 or 15(d) of the Securities Exchange Act of 1934 during the preceding 12 months (or for such shorter period that the Registrant was required to file such reports), and (2) has been subject to such filing requirements for the past 90 days. Yes☒ No ☐☐
Indicate by check mark whether the Registrant has submitted electronically every Interactive Data File required to be submitted pursuant to Rule 405 of Regulation S-T (§232.405 of this chapter) during the preceding 12 months (or for such shorter period that the Registrant was required to submit such files). Yes☒ No ☐
Indicate by check mark whether the Registrant is a large accelerated filer, an accelerated filer, a non-accelerated filer, a smaller reporting company, or an emerging growth company. See the definitions of “large accelerated filer,” “accelerated filer,” “smaller reporting company,” and “emerging growth company” in Rule 12b-2 of the Exchange Act.
Large accelerated filer |
|
|
| ||||
|
| ☐ |
| Accelerated filer |
| ☒ | |
Non-accelerated filer | ☐ |
| ☐ | ||||
Emerging growth company | ☐ | ||||||
If an emerging growth company, indicate by check mark if the Registrant has elected not to use the extended transition period for complying with any new or revised financial accounting standards provided pursuant to Section 13(a) of the Exchange Act. | ☐ | ||||||
Indicate by check mark whether the registrant has filed a report on and attestation to its management’s assessment of the effectiveness of its internal control over financial reporting under Section 404(b) of the Sarbanes-Oxley Act (15 U.S.C. 7262(b)) by the registered public accounting firm that prepared or issued its audit report. |
| ||||||
If securities are registered pursuant to Section 12(b) of the Act, indicate by check mark whether the financial statements of the registrant included in the filing reflect the correction
of an error to previously issued financial statements. ☐
Indicate by check mark whether any of those error corrections are restatements that required a recovery analysis of incentive-based compensation received by any of the registrant’s
executive officers during the relevant recovery period pursuant to §240.10D-1(b). ☐
Indicate by check mark whether the Registrant is a shell company (as defined in Rule 12b-2 of the Exchange Act). Yes ☐ No ☒
The aggregate market value of the shares of common stock held by non-affiliates of the Registrant, based on the closing price of the shares of common stock on June 30, 20202023 as reported by the NASDAQ Global Market on such date was approximately $708$435 million. Shares of the Registrant’s common stock held by each executive officer, director and holder of 5% or more of the outstanding common stock have been excluded in that such persons may be deemed to be affiliates. This calculation does not reflect a determination that certain persons are affiliates of the Registrant for any other purpose.
As of January 29, 2021,31, 2024, the Registrant had 36,563,79847,240,579 shares of common stock outstanding.
Documents Incorporated by Reference
Portions of the Registrant’s Definitive Proxy Statement relating to the Annual Meeting of Stockholders, scheduled to be held on May 18, 2021,29, 2024, are incorporated by reference into Part III of this Report.
Table of Contents
Page | |||||
PART I | |||||
Item 1. | 3 | ||||
Item 1A. |
| ||||
Item 1B. |
| ||||
Item | 29 | ||||
Item 2. | 31 | ||||
Item 3. | 31 | ||||
Item 4. | 31 | ||||
| |||||
PART II | |||||
| |||||
| 32 | ||||
Item 6. | 33 | ||||
Item 7. | Management’s Discussion and Analysis of Financial Condition and Results of Operations | 34 | |||
Item 7A. |
| ||||
Item 8. |
| ||||
Item 9. | Changes in and Disagreements with Accountants on Accounting and Financial Disclosure |
| |||
Item 9A. |
| ||||
Item 9B. | 55 | ||||
| |||||
PART III | |||||
| |||||
| 56 | ||||
Item 11. | 56 | ||||
Item 12. | Security Ownership of Certain Beneficial Owners and Management and Related Stockholder Matters | 56 | |||
Item 13. | Certain Relationships and Related Transactions, and Director Independence | 56 | |||
Item 14. | 56 | ||||
| |||||
PART IV | |||||
| |||||
| 57 | ||||
Item 16. | 57 | ||||
i
i
SPECIAL NOTE REGARDING FORWARD-LOOKING STATEMENTS
This Annual Report on Form 10-K contains forward-looking statements within the meaning of Section 27A of the federal securities law.Securities Act of 1933, as amended, and Section 21E of the Securities Exchange Act of 1934, as amended (the Exchange Act). All statements other than statements of historical facts contained in this Annual Report on Form 10-K, including statements regarding our future results of operations and financial position, business strategy and plans and objectives of management for future operations, are forward-looking statements. In many cases, you can identify forward-looking statements by terms such as “may,” “should,” “expects,” “plans,” “anticipates,” “could,” “intends,” “target,“targets,” “projects,” “contemplates,” “believes,” “estimates,” “predicts,” “potential” or “continue” or the negative of these terms or other similar words. Forward-looking statements contained in this Annual Report on Form 10-K include, but are not limited to, statements about:
| • competition from other wind blade and wind blade turbine manufacturers; • the discovery of defects in our products and our ability to estimate the future cost of warranty campaigns; • the sufficiency of our cash and cash equivalents to meet our liquidity needs; • the increasing cost and availability of additional capital, should such capital be needed; • our projected sales and costs, including materials costs and capital expenditures, during the current fiscal year; • our projected business model during the current fiscal year, including with respect to the number of wind blade manufacturing lines we anticipate; • our ability to service our current debt and comply with any covenants related to such debt; • the current status of the wind energy market and our addressable market; • our ability to absorb or mitigate the impact of price increases in resin, carbon reinforcements (or fiber), other raw materials and related logistics costs that we use to produce our products; • our ability to absorb or mitigate the impact of wage inflation in the countries in which we operate; • our ability to procure adequate supplies of raw materials and components to fulfill our wind blade volume commitments to our customers; • the potential impact of the increasing prevalence of auction-based tenders in the wind energy market and increased competition from solar energy on our gross margins and overall financial performance; • our future financial performance, including our net sales, cost of goods sold, gross profit or gross margin, operating expenses, ability to generate positive cash flow and ability to achieve or maintain profitability; • changes in domestic or international government or regulatory policy, including without limitation, changes in trade policy and energy policy; • changes in global economic trends and uncertainty, geopolitical risks, and demand or supply disruptions from global events; • changes in macroeconomic and market conditions, including the potential impact of any pandemic, risk of recession, rising interest rates and inflation, supply chain constraints, commodity prices and exchange rates, and the impact of such changes on our business and results of operations; • our ability to attract and retain customers for our products, and to optimize product pricing; • our ability to effectively manage our growth strategy and future expenses, including our startup and transition costs; • our ability to successfully expand in our existing wind energy markets and into new international wind energy markets, including our ability to expand our field service inspection and repair services business; 1 • our ability to keep up with market changes and innovations; • our ability to successfully open new manufacturing facilities and expand existing facilities on time and on budget; • the impact of the pace of new product and wind blade model introductions on our business and our results of operations; • our ability to identify and execute a strategic alternative to enable the growth of our automotive business; • our ability to maintain, protect and enhance our intellectual property; • our ability to comply with existing, modified or new laws and regulations applying to our business, including the imposition of new taxes, duties or similar assessments on our products; • the attraction and retention of qualified associates and key personnel; • our ability to maintain good working relationships with our associates, and avoid labor disruptions, strikes and other disputes with labor unions that represent certain of our associates; and • the potential impact of one or more of our customers becoming bankrupt or insolvent, or experiencing other financial problems.
|
|
|
|
|
|
|
|
|
|
|
|
|
|
|
|
|
|
|
|
|
|
|
|
|
|
|
|
|
|
|
|
|
|
|
|
|
|
|
|
1
|
|
These forward-looking statements are only predictions. These statements relate to future events or our future financial performance and involve known and unknown risks, uncertainties and other important factors that may cause our actual results, levels of activity, performance or achievements to materially differ from any future results, levels of activity, performance or achievements expressed or implied by these forward-looking statements. We have described under the heading “Risk Factors” included in Part 1, Item 1A of this Annual Report on Form 10-K the principal risks and uncertainties that we believe could cause actual results to differ from these forward-looking statements. Because forward-looking statements are inherently subject to risks and uncertainties, some of which cannot be predicted or quantified, you should not rely on these forward-looking statements as guarantees of future events.
The forward-looking statements in this Annual Report on Form 10-K represent our views as of the date of this Annual Report on Form 10-K. We anticipate that subsequent events and developments will cause our views to change. However, while we may elect to update these forward-looking statements at some point in the future, we undertake no obligation to update any forward-looking statement to reflect events or developments after the date on which the statement is made or to reflect the occurrence of unanticipated events except to the extent required by applicable law. You should, therefore, not rely on these forward-looking statements as representing our views as of any date after the date of this Annual Report on Form 10-K. Our forward-looking statements do not reflect the potential impact of any future acquisitions, mergers, dispositions, joint ventures, or investments we may make.
2
PART I
Item 1. Business
Description of Business
TPI Composites, Inc. is the holding company that conducts substantially all of its business operations through its direct and indirect subsidiaries (collectively, the Company, TPI or we). The Company was founded in 1968 and has been producing composite wind blades since 2001. The Company’s knowledgeCompany is incorporated in the State of Delaware.
Discontinued Operations
In December 2022, we committed to a restructuring plan to rebalance our organization and experienceoptimize our global manufacturing footprint. Changing economic and geopolitical factors, including increased logistics costs and tariffs imposed on components of composite materialswind turbines from China, including wind blades, had an adverse impact on demand and profitability for our wind blades manufactured in our Chinese facilities. In connection with our restructuring plan, we ceased production at our Yangzhou, China manufacturing originates with its predecessor company, Tillotson Pearson Inc.,facility as of December 31, 2022 and are in the final stages of shutting down our business operations in China. Our business operations in China comprised the entirety of our Asia reporting segment. This shut down has had a leading manufacturermeaningful effect on our global manufacturing footprint and consolidated financial results. Accordingly, the historical results of high-performance sailour Asia reporting segment have been presented as discontinued operations in our Consolidated Statements of Operations and powerboats along withConsolidated Balance Sheets. Our China operations represented a wide rangegeographic operating segment that included (1) the manufacturing of composite structures usedwind blades at our facilities in other industrial applications. FollowingDafeng, China and Yangzhou, China, (2) the separation from the boat building business in 2004, the Company reorganized in Delaware as LCSI Holding, Inc.manufacturing of precision molding and then changed its corporate name to TPI Composites, Inc. in 2008.assembly systems at our Taicang Port, China facility and (3) wind blade inspection and repair services. The following discussion reflects continuing operations only, unless otherwise indicated.
Overview
We are the only independent manufacturer of composite wind blades for the wind energy market with a global manufacturing footprint. We enable many of the industry’s leading wind turbine original equipment manufacturers (OEM) to outsource the manufacturing of somea portion of their wind blades through our global footprint of advanced manufacturing facilities strategically located to serve large and growing wind markets in a cost-effective manner. Given the importance of wind energy capture, turbine reliability and cost to power producers, the size, quality and performance of wind blades is highly strategic to our OEM customers. As a result, we have become a key supplier to our OEM customers in the manufacture of wind blades and related precision molding and assembly systems. We have entered into long-term supply agreements pursuant to which we dedicate capacity at our facilities to our customers in exchange for their commitment to purchase minimum annual volumes ofand manufacture wind blade sets (which consist(each set consisting of three wind blades). for our customers. This collaborative dedicated supplier model provides us with contracted volumes that generate significant revenue visibility, drive capital efficiency and allow us to produce wind blades at a lower total deliveredcompetitive cost, while ensuring critical dedicated capacity for our customers.
We also provide field service inspection and repair services to our OEM customers and wind farm owners and operators. Our field service inspection and repairs services include diagnostic, repair and maintenance service offerings for wind blades that have been installed on wind turbines located at wind farms. Our field service inspection and repair services can be performed up-tower, where a blade technician performs these services in the air or from the wind turbine tower on a wind turbine blade, or down tower, where a blade is first removed from a wind turbine and these services are performed on the ground at the wind farm site or in a repair facility.
We also leverage our advanced composite technology and history of innovation to supply high strength, lightweight and durable composite products to the transportationautomotive market. In November 2017, we signed a five- year supply agreementComposites offer multiple advantages to metallics in the automotive market, including strength, weight and ratio of strength to weight. We have numerous contracts with Proterra Inc. (Proterra) to supply Proterra Catalyst® composite bus bodies. In February 2018, we entered into an agreement with Navistar, Inc. (Navistar) toOEMs in various stages of maturity from design and develop an all composite Class 8 tractor cab. This collaborative development project was entered into in connection with Navistar’s award under the Department of Energy’s (DOE) Super Truck II investment program, which is designed to promote fuel efficiency in commercial vehicles. In 2019, we also agreed to develop prototype composite body delivery vehicles for Workhorse Group. In 2019, we made a capital investment of approximately $11.5 million to develop a highly automated manufacturing line for the electric vehicle market within our Warren, Rhode Island facility, and wefull scale production. We are currently in the process of commissioning this line.exploring strategic alternatives to ensure the automotive business is sufficiently funded to execute on its growth strategies as we intend to prioritize capital for growth opportunities in the wind blade business in the near term. We expect to complete this investment will enable us to further develop our technology, create defensible product and process intellectual property (IP) and demonstrate our capability to manufacture composite components cost effectively at automotive volume rates. We also expect this automated manufacturing line will also help our current and potential customers to de-risk the decision-making process to commit to TPI for high-volume manufacturing programs in the future.no later than June 30, 2024.
3
Our wind blade and precision molding and assembly systems manufacturing businesses accounted for approximately 96%, 96%92%, and 95%94% of our total net sales for each of the years ended December 31, 2020, 20192023, 2022 and 2018,2021, respectively. As of February 24, 2021, our long-term wind and transportation supply agreements provide for minimum aggregate volume commitments from our customers of approximately $2.8 billion and encourage our
3
customers to purchase additional volume up to, in the aggregate, a total contract value of approximately $4.6 billion through the end of 2024.
Financial Information about Segments and Geographic Areas
We divide our business operations into fivefour geographic operating segments - (1) the United States (U.S.), (2) Asia,Mexico, (3) Mexico, (4) Europe, the Middle East and Africa (EMEA) and (5)(4) India as follows:
| • Our U.S. segment includes (1) the manufacturing of wind blades at our Newton, Iowa facility in which production has been shut down since the end of the fourth quarter of 2021, and is expected to resume within the next 12 to 18 months, (2) the manufacturing of precision molding and assembly systems used for our automotive business at our Warren, Rhode Island facility, (3) the manufacturing of composite solutions for the automotive industry, which we also conduct at our Warren, Rhode Island facility, (4) wind blade inspection and repair services, (5) our advanced engineering center in Kolding, Denmark, which provides technical and engineering resources to our manufacturing facilities, (6) our engineering center in Berlin, Germany and (7) our corporate headquarters. • Our Mexico segment includes (1) the manufacturing of wind blades at our three facilities in Juárez, Mexico and two facilities in Matamoros, Mexico, (2) the manufacturing of precision molding and assembly systems and composite solutions for the automotive industry at our fourth Juárez, Mexico facility and (3) wind blade inspection and repair services. • Our EMEA segment includes (1) the manufacturing of wind blades at our two facilities in Izmir, Türkiye, and wind blade inspection and repair services in Türkiye, (2) our wind blade inspection and repair service facility in Madrid, Spain, (3) wind blade inspection and repair services in the United Kingdom, and (4) wind blade inspection and repair services in France. • Our India segment manufactures wind blades at our manufacturing facility in Chennai, India.
|
|
|
|
|
|
|
|
|
|
For additional information regarding our discontinued operations, and operating segments and geographic areas, see Note 192 - Discontinued Operations, and Note 22 – Segment Reporting, respectively, of the Notes to Consolidated Financial Statements included in Part II, Item 8 of this Annual Report on Form 10-K.
Business Strategy
Our long-term success will be driven by our business strategy. The key elements of our business strategy are as follows:
| • Capitalize on the long-term, global trends of decarbonization of the electric sector. We believe we are well-positioned to participate and benefit from the long term, global trend of decarbonization of the electric sector. Although regulatory uncertainty, as well as permitting, siting and transmission challenges in the U.S. and Europe has tempered demand for wind energy in the near term, we expect global demand for renewable energy, and wind energy in particular, will continue to grow in the long term due to a multitude of factors, including: increased cost competitiveness of wind energy compared to fossil fuel generated electricity; increased demand from corporations and utility providers for renewable energy; the need for energy independence and security and recent international policy initiatives designed to promote the • Grow our existing relationships and develop new relationships with leading industry OEMs. We plan to continue growing and expanding our relationships with existing customers who, according to data from BloombergNEF (Bloomberg), represented approximately 34% of the global onshore wind energy market, approximately 77% of that market excluding China, and 87% of the U.S. onshore wind turbine market over the three years ended December 31, 2022, based on megawatts (MWs) of energy capacity installed, as well as developing new relationships with other leading industry OEMs. We expect to be presented with opportunities to expand our existing relationships and develop new relationships with industry OEMs as they seek to capitalize on the benefits of outsourced wind blade manufacturing while 4 maintaining high quality customization and dedicated capacity. In December 2022, we extended our supply agreements with GE Vernova at two of our Juarez, Mexico manufacturing facilities through 2025. In December 2023, we added our third blade manufacturing facility in Juarez, Mexico to our agreement with GE Vernova for four new lines through 2025. In December 2023, we also extended our supply agreements with Vestas in Mexico and India through 2024, added two manufacturing lines with Nordex in Türkiye through 2025, and extended our other supply agreements with Nordex in Türkiye through 2024. • Leverage our footprint in large and growing wind markets, capitalize on the continuing outsourcing trend and evaluate strategic acquisitions. As many wind turbine OEMs continue to shift towards increased outsourcing of wind blade manufacturing, |
Similarly, we believe we are well-positioned with our global footprint. We utilize our strengths in composites technology and manufacturing, combined with our collaborative dedicated supplier model to capitalizeprovide our customers with an efficient solution for their expansion in large and growing onshore wind markets. In addition, our demonstrated ability to enter into new markets and the strength of our manufacturing capabilities afford us the optionality to build new factories or grow through strategic acquisitions.
4
| our customers’ most advanced wind blades.
|
|
|
|
|
|
|
|
5
|
|
Wind Blade Manufacturing Operations and Process
We have developed significant expertise in advanced composite technology and we use high performance composite materials, precision molding and assembly systems including modular tooling, and advanced process technology, as well as sophisticated measurement, inspection, testing and quality assurance tools, allowing us to produce over 65,00092,000 wind blades since 2001 from our continuing and discontinued operations with a strong, long-term field performance record in a market where reliability is critical to our customers’ success. We manufacture or have manufactured wind blades ranging from 30 meters to approximatelyover 80 meters in length across our global facilities and have the capability to manufacture wind blades of greater lengths as required by existing or new customers. In
5
combination with our advanced technologies, we seek to create manufacturing processes that are replicable and scalable in our manufacturing facilities located worldwide, regardless of cultural or language barriers. Using continuous improvement principles, we can customize each manufacturing step, from raw materials to finished products. This also allows us to systematically design for the entire manufacturing process so that we can achieve better quality control and increase production efficiencies. We believe that our focus on simplifying and, where feasible, automating production processes is critical to manufacturing high-precision, lightweight and durable products at a reasonablecompetitive cost tofor our customers. We produce high unit volumes of near-aerospace grade products at industrial costs.
Raw Materials
The key raw materials for the wind blades we manufacture include highly advanced fiberglass fabrics, select carbon reinforcements, foam, balsa wood, resin, adhesives for assembly of molded components, gel coat or paint for preparation of cosmetic surfaces and attachment hardware including steel components. Most of these materials are available in multiple geographic regions and in reasonably close proximity to our manufacturing facilities. Our agreements for the supply of raw materials are designed to guaranteesecure volumes that we believe will be required to fulfill our customers’ wind blade commitments.commitments for fixed prices with limited contractual price adjustment provisions. A portion of our raw materials are subject to price volatility, such as the resins and carbon reinforcements used in our manufacturing processes.
Although the majority of materials incorporated into our products are available from a number of sources, certain materials are available only from a relatively limited number of suppliers. We seek multiple suppliers for our raw materials and continually evaluate potential new supplier relationships. However, one of our customers sources all of the critical raw materials that we use to produce such customers' wind blades. Since we do not source procurement of these raw materials for this customer, we have fewer controls and remedies to mitigate raw material and supply chain risks and disruptions relating to such raw materials for such customer.
Precision Molding and Assembly Systems
Over the last decade, we have produced hundreds of precision molding and assembly systems, ranging from 30 meters to approximatelyover 80 meters in length, to support our global operations. We began these operations in our tooling technology center in Warren, Rhode Island. We also manufacture our precision molding and assembly systems production capabilities at a facility in Taicang Port, China, which serves customers around the globe. While capable of cost-effectively delivering precision molding and assembly systems across all of our facilities, our Rhode Island tooling technology center primarily serves the North American market. In 2020, we transitioned most of our North American precision molding and assembly system production capabilities from Warren, Rhode Island to a new facility in Juárez, Mexico, which can serve customers globally. Our precision molding and assembly systems have been used to build tens of thousands of wind blades worldwide.
Our tooling solutions include precision wind blade patterns, precision molding and assembly systems, including modular tooling techniques. We believe that our technological and production expertise are key factors in
6
our continued competitiveness, as we address continually increasing physical dimensions, demanding technical specifications, and strict quality control requirements for wind blades.
Wind Blade Production Process
Production of wind blades requires adherence to the unique specifications of each of our customers, who design their wind turbines and wind blades to optimize performance, reliability and total delivered cost. With our culture of innovation and a collaborative “design for manufacturability” approach, we have the capability and expertise to manufacture wind blades of different designs, utilizing fiberglass, carbon fiber, or other advanced composite materials to meet unique customer specifications. We also have the flexibility to quickly transition our manufacturing facilities to produce different wind blade models and sizes using our precision molding and assembly systems, including modular tooling techniques.
We have developed a highly dependable method for making high-quality wind blades. In conjunction with our continuous improvement principles, we design our proprietary manufacturing processes to be replicable, scalable and transferable to each of our advanced manufacturing facilities worldwide. As a result, we can repeatedly move a product from its design phase to volumeserial production while maintaining quality, even in developing regions of the world. Similarly, we have developed the manual portions of our manufacturing processes based on proven technologies and production methods that can be learned and implemented rapidly by line personnel. We focus on safety, consistency and quality control across our facilities, using hands-on training methods and employing repeatable manufacturing processes.
6
We use an advanced form of vacuum-assisted resin transfer tooling process to pull liquid resin into a dry lay-up, resulting in light, strong, and reliable composite structures. In our manufacturing process, fiber reinforcements and core materials are laid up in a mold while dry, followed by a vacuum bag that is placed over the layup and sealed to the mold. The wind blade component is then placed under vacuum. The resin is introduced into the wind blade component via resin inlet ports and then distributed through the reinforcement and core materials via a flow medium and a series of channels, saturating the wind blade component. The vacuum removes air and gases during processing, thereby eliminating voids. Pressure differentials drive resin uniformly throughout the wind blade component, providing a consistent laminate. By using a variety of reinforcement and core materials, the structural characteristics of the wind blade can be highly engineered to suit the custom specifications of our customers. Although only occasionally required by our customers, we are also capable of employing additional composite fabrication processes, such as pre-impregnated laminates, in addition to our vacuum infusion process.
Wind Blade Long-Term Supply Agreements
Our current wind blade customers, which include Vestas, GE Wind,Vernova, Nordex, Siemens Gamesa Renewable Energy S.A. (Siemens Gamesa) and ENERCON GmbH (ENERCON), are some of the world’s largest wind turbine manufacturers. According to data from Bloomberg, our customers represented approximately 52%34% of the global onshore wind energy market, approximately 88%77% of that market excluding China, and 99%87% of the U.S. onshore wind turbine market over the three years ended December 31, 2019,2022, based on MWs of energy capacity installed. In our collaborative dedicated supplier model, our customers are incentivized to maximize the volume of wind blades purchased through lowerdue to pricing at higher purchase volumes. As of February 24, 2021, our existing wind blade supply agreements provide for minimum aggregate volume commitments from our customers of approximately $2.8 billion and encourage our customers to purchase additional volume up to, in the aggregate, a total contract value of approximately $4.6 billion through the end of 2024, which we believe provides us with significant future revenue visibility and helps to insulate us from potential short-term fluctuations or legislative changes in any one market. Our supply agreements generally contain liquidated damages provisions in the event of late delivery, however, we generally do not bear the responsibility for transporting the wind blades we manufacture to our customers.
Our long-termSome of our supply agreements with our customers generallyprovide us with downside protection through minimum annual volume commitments, as well as encourage our customers to maximize the volume of wind blades they purchase from us, since purchasing less than a specified amount typically triggers higher pricing, as well as provide downside protection for us through minimum annual volume commitments.pricing. Some of our long-term supply agreements also provide for annual sales price reductions reflecting assumptions regarding increasesimprovements in our manufacturing efficiency and increases in productivity. We work to continue to drive down or minimize the impact of increases in the cost of materials and production through innovation and global sourcing, a portion of the benefit of which we share with our
7
customers contractually, further strengthening our deep customer relationships. Similarly, we typically share any raw material price increases with our customers. However, one of our customers sources all of the critical raw materials that we use to produce such customers' wind blades and this customer assumes 100% of any such raw material price increases or decreases. Wind blade pricing is based on annual commitments of volume as established in the customer’s contract, with orders less than committed volume resulting in additional costs per wind blade to customers.the customer. Orders in excess of annual commitments may but generally do not result in discounts to customers from the contracted price for the committed volume. Customers may utilize early payment discounts, which are reported as a reduction of revenue at the time the discount is taken.
Vestas
Vestas
In 2014,December 2023, we entered into a newextended our supply agreementagreements with Vestas to supply wind blades from a manufacturing facility in Dafeng, China. Based on the success of this manufacturing arrangement, we expanded our relationship with Vestas through additional supply agreements to manufacture wind blades at our manufacturing facilities in Turkey,India and in Matamoros, Mexico and Yangzhou, China. Additionally, in 2018, we entered into athrough 2024. The term of the Matamoros supply agreement will continue until the one-year anniversary of the date upon which we commence production of a new Vestas wind blade model on up to four manufacturing lines at our Matamoros manufacturing facility. We expect to commence production of this new wind blade model in July 2024. We have the right to terminate the Matamoros supply agreement as of December 31, 2024 if Vestas’ projected annual demand for this new wind blade model is less than or equal to 50% of our dedicated manufacturing capacity allocated to this new wind blade model.
GE Vernova
We have two supply agreements with VestasGE Vernova to supplymanufacture wind blades from a newthree manufacturing facility that was builtfacilities in Chennai, India andJuárez, Mexico. In October 2022, we commenced operations at this facility in the first quarter of 2020. In August 2020, we reachedsigned an agreement with VestasGE Vernova that enabled us to extendsecure a ten-year lease extension of our supplyIowa manufacturing facility. Under the agreement, atwe and GE Vernova plan to develop competitive blade manufacturing options. In December 2022, we extended our Turkey facility by one year through 2022. Each of the supply agreements with VestasGE Vernova for ten of our existing lines in two of our Juarez, Mexico manufacturing facilities through December 2025,
7
and in December 2023, we added a third manufacturing facility in Juarez, Mexico for four new manufacturing lines, also through December 2025.
Nordex
Generally, our supply agreements with Nordex provide for a minimum number of wind blade sets to be purchased by VestasNordex each year during the term, the schedule for which is established at the outset of the agreement. In return,and we commit to dedicate a specific number of manufacturing lines to VestasNordex for each of the years under the supply agreements. Additionally, we create some of the model-specific tooling for Vestas. If either party commits a material breach of theWe supply agreement, the non-breaching party may terminate the supply agreement if the breach is not remedied or if the parties have not mutually agreed to plan for cure within 30 days after notice of breach has been given.
GE Wind
We have entered into multiple supply agreements with GE Wind to manufacture wind blades to Nordex from twoour manufacturing facilities in Juárez,Türkiye, and India, and from a manufacturing facility in Matamoros, Mexico and our Newton, Iowa manufacturing facility. Each of the supply agreements with GE Wind provide forthat we took over from Nordex in July 2021, pursuant to a minimum number of wind blade sets to be purchased by GE Wind each year during the term, the schedule for which is established at the outset of the agreement. In return, we commit to dedicate a specific number of manufacturing lines to GE Wind for each of the years under the supply agreements. In August 2018, GE Wind agreed to extend our existingthree-year supply agreement for oneexpiring on June 30, 2024. We are in the process of our Mexicotransitioning the operation of this Matamoros manufacturing facilities byfacility back to Nordex. In December 2023, we extended two years to 2022 and increased the number of wind blade manufacturing lines in that facility from three to five. In addition, GE Wind agreed to transition to a larger blade model in our Newton, Iowa plant in early 2019 and to eliminate its option to terminate its supply agreement at this location prior to its December 2020 expiration. In July 2020, GE Wind agreed to extend our existing supply agreement in one of our Mexico plants by two years to 2022 and our existing supply agreement in our Newton Iowa plant by one year to 2021 with an option to extend through 2022 and added one additional wind blade manufacturing line in Mexico to provide blades for GE Wind’s turbine technologies in North America in 2021. Unless otherwise terminated or renewed, our supply agreements with GE Wind are in effect untilNordex at our Türkiye manufacturing facilities for eight lines through the end of 2021 for our Iowa facility2024 and untiladded two new lines through the end of 2022 for our two Mexico facilities. In addition, either party may terminate these supply agreements upon a material breach by the other party which goes uncured for 30 days after written notice has been provided.
Other Long-Term Supply Agreements
We have entered into other long-term supply agreements in China, Mexico, Turkey and India with Nordex, Siemens Gamesa and ENERCON. With respect to these supply agreements, we agree to dedicate capacity for a set number of wind blades for each calendar year during the term of the agreement in exchange for commitments to purchase minimum annual volumes of wind blade sets. Unless otherwise terminated, these supply agreements generally remain in effect for a period of five years and either party may terminate their respective supply agreements upon a material breach by the other party which goes uncured. Some of these supply agreements contain provisions that allow for our customers to purchase less volume in later years of these supply agreements, reduce the number of dedicated manufacturing lines or to terminate the supply agreement upon notice for reasons such as our failure to deliver the contracted wind blade volumes or our failure to meet certain mutually agreed upon cost reduction targets. See “Risk Factors—Risks Related to Our Wind Blade Business— Some of our long-term supply agreements with our customers are subject to early termination and volume reductions at the discretion of our customers, and any early termination of or reduced volumes of wind blades purchased under these agreements
8
would materially harm our business, financial condition and results of operations” included in Part I, Item 1A of this Annual Report on Form 10-K.2025.
Research and Development
We have a long history of developing composite products as well as the development of new and advanced materials, tooling, manufacturing processes and inspection methods. Our knowledge and experience of composite materials and manufacturing originates with our predecessor company, Tillotson Pearson Inc., a leading manufacturer of high-performance recreational sail and powerboats along with a wide range of composite structures used in other industrial applications. Leveraging our knowledge and experience, we realized the opportunity to specialize in wind energy and other industrial end-markets where there was a demand for high precision composite manufacturing capabilities.
We conduct research and development in close collaboration with our customers on theand suppliers in areas of design developmentfor manufacturing and deployment of innovative manufacturing processes, including automation, advanced materials, and sophisticatedemerging product quality inspection tools. We have partnered with the U.S. DOE, governmentDepartment of Energy, national laboratories, universities, suppliers, and our customers to innovate through cost sharingcost-sharing and funded development of advanced manufacturing, sustainability (including material recycling) and other innovative programs. During the year ended December 31, 2023, we collaborated on a variety of proposals with universities, government laboratories and private industry resulting in the award of several new projects that include inspection technologies, additive manufacturing of modular wind blades, as well as manufacturing automation applying recycled materials to ensure movement toward a more sustainable, carbon neutral future. We continue to collaborate in national consortia including the Institute for Advanced Composite Manufacturing Innovation Initiative programs. In 2021, we will be collaboratingas a premium member with responsibility to direct research activity by our industrial, government laboratory and university members. We maintain a position on the Industrial Advisory Board for WindSTAR, a National Science Foundation Industry/University Collaborative Research Consortium, and study a broad range of Maine pursuant to a grant from the U.S. DOE’s Officewind energy related technologies with our customers and wind energy owner operators. One such set of Energy Efficiencyactivities is an internal and Renewable Energy to develop a rapid, low-cost additive manufacturing solution (3D printing) for fabricating large, segmented wind blade molds. In February 2018, we entered into an agreement with Navistar to design and develop an all composite Class 8 tractor cab. Thisexternal collaborative development project was entered intoprogram to create a comprehensive multi-layered Artificial Intelligence powered vision system that supports production metrics such as cycle-time and labor headcount and will also drive quality by reducing infusion defects and ensuring uniform resin process across the entire surface of the wind turbine blade.
We continue to expand our intellectual property portfolio through funding internal research and development. Our manufacturing technology team is leveraging our in-house knowledge and expertise in connection with Navistar’s recent award under the DOE’s Super Truck II investment program,modeling, data analysis, machine learning, artificial intelligence, and optical vision systems to implement an engineering configuration that allows for an effective roll-out of a closed-loop blade manufacturing system which is designedwill positively impact quality, labor productivity and cycle-time. We are expanding and diversifying our Model-Based Manufacturing tools and techniques to promote fuel efficiency in commercial vehicles. We believe incorporating composite materials into a Class 8 tractor cab offers multiple potential performancecover broad technical areas including design, manufacturability, finishing processes and efficiency advantages compared to traditional metals in terms of weight savings, reduced part counts, and non-corrosion. In the first quarter of 2019, we executed a joint development agreement with GE Wind to cooperatively develop advanced blade technology for future wind turbines.factory level repairs.
We employ a highly experienced workforce of engineers in various facets of our business, from research and development projects, to the ongoing, real-time development and implementation of incremental manufacturing and material improvements. We have an advanced engineering center based in Berlin, Germany which focuses on blade design, tooling, materials and process technology development. In addition, we have an advanced engineering center based in Kolding, Denmark which provides technical and engineering resources to our manufacturing facilities and our customers. Our research and development effort places a priority on improving quality through process and procedure improvement, in addition to reducing cost through specification changes and sourcing of more cost-effective suppliers. Other areas of emphasis include composite design, in-house fabrication of precision molding and assembly systems, prototyping, testing, optimization and volume production capabilities. We also encourage our employeesassociates to invent and develop new technologies to maintain our competitiveness in the marketplace. In addition to our internal research and development activities, from time to time, we also conduct research and development activities pursuant to funded development arrangements with our customers and other third parties and we intend to
8
continue to seek opportunities for product development programs that could create recurring revenue and increase our overall profitability over the long term.
In July 2019, we acquired certain intellectual property and hired a team of engineering resources from the EUROS group, based in Berlin, Germany. This team of technical experts focuses on blade design, tooling, materials and process technology development, strengthened our technical capabilities in support of our global operations and growth. In addition, we established an advanced engineering center in Kolding, Denmark which provides technical and engineering resources to our manufacturing facilities and our customers.
9
Competition
The wind blade market is highly concentrated, competitive and subject to evolving customer needs and expectations. In 2017, GE Wind, our largest customer at the time, completed its acquisition ofOur competitors include LM Wind Power (LM), our largest competitor. We also compete primarily with(a subsidiary of GE Vernova) and other independent wind blade manufacturers such as Sinoma Science & Technology Co. Ltd., Shanghai Aeolon Wind Energy Technology Development (Group) Co., Ltd., Aeris Industria E Comercio De Equipamentos Para Geracao De Energia S.A. and ZhongFu Lianzhong Composites Group Co., Ltd., as well as regional wind blade suppliers in geographic areas where our current or prospective manufacturing facilities are or will be located.
We also compete with and in a number of cases supplement, vertically integrated wind turbine OEMs that manufacture their own wind blades. We believe that a number of other established companies are manufacturing wind blades that will compete directly with our offerings, and some of our competitors noted above, may have significant financial and institutional resources.
The principal competitive factors in the wind blade market include reliability, total delivered cost, manufacturing capability, product quality, engineering capability and timely completionon-time delivery of wind blades. We believe we compete favorably with our competitors on the basiswith respect to each of the foregoingthese factors. Our ability to remain competitivecompete will depend to a great extent upon our ongoing performance in the areas of manufacturing capability, timely completiontotal delivered costs, on-time delivery and product quality.
Transportation Products
We seek to create additional recurring revenue opportunities through the supply of other composite structures outsideCompetitive advantages in the wind energy market. blade service market include total delivered cost, speed of response, local footprint, repair quality, competitive labor pricing and capacity to work across regions as demand adapts to business seasonality. Our ability to improve our product and service offerings, including strengthening our response time, adding and managing labor resources, sourcing materials globally at competitive rates while further expanding into new countries, and offering additional value-added engineering support and technical solutions.
The automotive supply industry is highly competitive, and our composite solutions compete against alternative materials and a broad range of competitive suppliers. Our ability to compete will depend on our ability to provide superior performance attributes with our composites solutions, time to market, and continuing to provide a lower upfront investment for our customers.
Automotive Products
We believe transportationautomotive products, including buses, trucks, electric vehicles and high-performance automotive products and components, are ideally suited for our advanced composite technology because of the benefits derived from weight reduction, corrosion resistance, strength, durability and durability.lower upfront capital costs. These benefits should allow us to develop structural composite solutions to assist our customers in developing electric vehicles, including light, medium and heavy-duty trucks, buses and automobiles with clean propulsion systems or in meeting new and developing fuel economy standards.
In addition, by producing a range of composite structures, we are able to leverage the materials and manufacturing process technology and expertise developed through one project to maximize production quality, improve performance and minimize costs across our other manufacturing efforts, including our wind blade business. Our projects for customers in the transportationautomotive market have historically generated project-related revenues for a specific duration. We intend to seek collaborations with additional customers in these markets that will provide recurring revenue and business opportunities for us, in addition to the opportunities provided by our existing customers and relationships, and contribute to our overall profitability over the long term.
Our facilities in Warren, Rhode Island and Juárez, Mexico manufacture products for customers in the transportationautomotive market using, ain some cases, similar proprietary and replicable manufacturing processes that we use to produce wind blades. Our projects for customers in the transportationautomotive market include, or have included, the supply of all-composite bodies for electric buses and last-mile delivery as well as automated people mover systems for airports. We ceased manufacturing composite bus bodies from our Newton, Iowa facility in the first quarter of 2020. In 2019, we made a capital investment of approximately $11.5 million to develop a highly automated manufacturing line for the electric vehicle market within our Warren, Rhode Island facility, and we are currently in the process of commissioning this line. We expect this investment will enable us to further develop our technology, create defensible product and process IP and demonstrate our capability to manufacture composite components cost effectively at automotive volume rates.
Our current principal competitors in the transportationautomotive market include suppliers of conventional steel and aluminum products and non-structural automotive fiberglass and other advanced composites-based manufacturers for transportationautomotive applications.
109
Intellectual Property
We have a variety of intellectual property (IP) rights, including trademarks, copyrights and patents issued, filed and applied-for in a number of jurisdictions, including the United States,U.S., Germany, the European Union, Türkiye, India and China, trademarks and copyrights, but we believe that our continued success and competitive position depend, in large part, on our proprietary materials, tooling, process and inspection technologies and our ability to innovate.innovate and not on our IP alone. Accordingly, we take measures to protect the confidentiality and control the disclosure of our proprietary technology. We rely primarily on a combination of patents, know-how and trade secrets to establish and protect our proprietary rights and preserve our competitive position. We also seek to protect our proprietary technology, in part, by confidentiality agreements with our customers, employees,associates, consultants and other contractors. Trade secrets, however, are difficult to protect. These agreements may be breached, and we may not have adequate remedies for any breach. In addition, our trade secrets may otherwise become known or be independently discovered by competitors. To the extent that our customers, employees,associates, consultants or contractors use intellectual propertyIP owned by others in their work for us, disputes may arise as to the rights in related or resulting know-how and inventions.
Backlog
As of December 31, 20202023 and 2019,2022, our backlog for wind blades and related wind products totaled $1,197.7$767.3 million and $1,038.9$919.9 million, respectively. Our backlog includes purchase orders issued in connection with our long-term supply agreements. We generally record a purchase order into backlog when the following requirements have been met: a signed long-term supply agreement or other contractual agreement has been executed with our customer, a purchase order has been issued by our customer and we expect to ship wind blades to or produce the related wind products for such customer in satisfaction of any purchase order within 12 months. Backlog as of any particular date should not be relied upon as indicative of our revenue for any future period.
Regulation
Wind Energy
Our operations are subject to various foreign, federal, state and local regulations related to environmental protection, health and safety, labor relationships, general business practices and other matters. These regulations are administered by various foreign, federal, state and local environmental agencies and authorities, including the Environmental Protection Agency (EPA), the Occupational Safety and Health Administration of the U.S. Department of Labor and comparable agencies in China, Mexico, Turkey,Türkiye, India and individual U.S. states. In addition, our manufacturing operations in China, Mexico, TurkeyTürkiye and India are subject to those countries’ wage and price controls, currency exchange control regulations, investment and tax laws, laws restricting our ability to repatriate profits, trade restrictions and laws that may restrict foreign investment in certain industries. Some of these laws have only been recently adopted or are subject to further rulemaking or interpretation, and their impact on our operations, including the cost of complying with these laws, is uncertain. We believe that our operations currently comply, in all material respects, with applicable laws and regulations. Further, as a U.S. corporation, we are subject to The Foreign Corrupt Practices Act of 1977 (FCPA), which generally prohibits U.S. companies and their intermediaries from making improper payments to foreign officials for the purpose of obtaining or keeping business. As a U.S. corporation with global operations, we are also subject to foreign antibribery laws and regulations in the countries where we conduct business, including the U.K. Bribery Act and the India Prevention of Corruption Act.
In addition, our business has been and will continue to be affected by subsidizationAugust 2022, the U.S. Congress passed the Inflation Reduction Act of 2022 (IRA) which effectively extended the wind turbine industry with its influence declining over time as wind energy reaches grid parity with traditional sources of energy. In the United States, the federal government has encouraged capital investment in renewable energy primarily through tax incentives. Production tax credits for new renewable energy projects were first established in 1992. The Production Tax Credit for Renewable Energy (PTC) provided the owner, which provides owners of a wind turbine placed in operation before January 1, 2015turbines with a 10-year credit against its U.S. federal income tax obligations based on the amount of electricity generated by the wind turbine.
The PTCturbine, until the later of 2032 or when greenhouse gas emissions have been reduced by 75% compared to 2022. In addition, a new advanced manufacturing production tax credit (AMPC) was extended in 2015created that can be claimed for the domestic production and sale of clean energy components, such as wind power projects through December 31, 2019, and wasturbine blades. We expect to be phased down overutilize the termAMPC when we restart our Newton, Iowa manufacturing plant. Although the passing of the PTC extension. Specifically,IRA is expected to provide long-term incentive certainty in the PTC was kept atU.S. market, the same rate in effect atU.S. wind industry is waiting on more specific and definitive guidance from the endInternal Revenue Services and U.S. Treasury Department, among others, to define and clarify the implementation of 2014 for wind power projects that either commenced construction or met certain safe harbor requirements by the end of 2016, and thereafter was to be reduced by 20% per year in 2017, 2018 and 2019, respectively. In December 2019, Congress extended the PTC through the end of 2020 and increased the rate from 40% to 60% for projects that eitherthis complex legislation.
11
commenced construction or met certain safe harbor requirements by the end of 2020 and are commissioned by the end of 2024. In December 2020, Congress extended the PTC through the end of 2021, continuing the rate of 60% for projects that either commenced construction or met certain safe harbor requirements by the end of 2021 and are commissioned by the end of 2025. In January 2021, the Biden administration announced several executive orders to promote renewable energy.10
At the state level, as of December 31, 2020,2023, 30 states, the District of Columbia and Puerto Rico have implemented renewable portfolio standard (RPS) programs that generally require that, by a specified date, a certain percentage of a utility’s electricity supplied to consumers within such state is to be from renewable sources (ranging from 10% to 100% and from between the present and 2050).
In addition, there are also increasing regulatory efforts globally to promote renewable power. In December 2020, the European Union (EU) agreed to reduce EU greenhouse gas emissions by at least 55% by 2030, compared to 1990 levels. In May 2022, the EU announced the REPowerEU plan which seeks to rapidly reduce the EU's dependence on fossil fuels by 2027. Furthermore, the EU introduced the Green Deal Industrial Plan that is expected to further accelerate the expansion of renewable energy and green technologies including easing state aid rules to enable higher subsidies. A key component of the Green Deal Industrial Plan is the Net-Zero Industry Act to simplify regulations, speed up permits and promote cross-border projects to accelerate climate neutrality. In November 2023, EU’s Renewable Energy Directive III entered into effect, which aims to raise the share of renewable power in the EU’s overall energy consumption to 42.5% by 2030, with an additional 2.5% indicative top up that would allow the overall share to reach 45%. Similarly, in December 2020, China announced its goal to reach carbon neutrality by 2060, and in September 2019,November 2021, India targeted to increase its renewable energy capacity to 450500 gigawatts by 2030 and to 40% non-fossil fuel energyreach carbon neutrality by 2030. 2070. Additionally, TurkeyTürkiye enacted Law No. 5346 in 2005, which was recently amended and extended in January 2021, to promote renewable-based electricity generation within their domestic electricity market through feed-in- tariffs and purchase obligations for distribution companies requiring purchases from certified renewable energy producers.
Human Capital
As of December 31, 2020,2023, we employed over 14,900more than 12,300 full-time employees,associates, approximately 1,300500 of whom were located in the United States, 2,000 in China, 6,000U.S., 6,600 in Mexico, 4,1003,600 in TurkeyTürkiye, and 1,5001,600 in India. Certain of our employeesassociates in TurkeyTürkiye and at our manufacturing facilityfacilities in Matamoros, Mexico are represented by a labor union.unions. We believe that our relations with our employeesassociates are generally good.
Our human capital strategy focuses on creating an exceptional employeeassociate experience and ensuring that we foster a learning culture where our employeesassociates want to grow with us. Our primary focus areas of our human capital strategy are as follows:
Culture
Culture
We believe our unique culture is a key strategic advantage for us. Our associates are highly engaged, have a strong sense of inclusion and belonging, and are committed to the company,Company, their teams, and the jobs they perform based on our most recent employeeassociate engagement surveys. This strong employeeOur associate engagement is due in part to a strong sense of purpose given our role in the broader renewable energy supply chain. We believe strong employeeassociate engagement and feelings of inclusion and belonging translates into a strong quality focus and orientation. It is through the efforts of our nearly 15,000 employees at year-end 2020 that we have been able to continue to achieve high levels of performance. When we select new persons to join our team, we ensure that the individuals have high levels of commitment and adaptability in addition to the skills needed for the role. Our employeesassociates embrace our core values of safety, operational excellence, commitment, integrity and leadership. Our team members bring our values to life by applying their diverse backgrounds and skillsets to the jobs they are performing, demonstrating high discretionary effort, and embracing our values in their day-to-day lives.
Safety
Safety
Safety is our most important and first core value. We strongly believe that all accidents are preventable and that every associate should return at the end of their shift to their families in the same healthy condition in which they showed up for work. To help drive these beliefs it is our goal to continuously improve our zero-harm culture and implement a global behavior-based safety (BBS) program resulting in zero unsafe behaviors. Our 13All of our manufacturing facilities have safety management systems in place that cover their associates and activities. We ensure the safety of our associates to support our zero-harm culture in a variety of ways, starting with safety education. Safety education is
11
the foundation for our other safety measures. Associates receive regular training on environmental, health and safety (EHS) related topics. This training includes but is not limited to:
|
|
12
|
|
|
|
|
|
|
|
|
|
|
|
|
|
Inclusion, Diversity, Equity and InclusionAwareness
We value diversity in all forms, especially diversity of thought, and aspire to create an environment that recognizes and celebrates the benefits that come with a diverse workforce. We know that diversity of our employeeassociate population makes us better and we strive to continue to improve and act with intention in these areas. Most importantly we strive to create a culture of inclusion where everyone has a true sense of belonging and feels they can be themselves in the workplace.
As a global business, we have an incredible opportunity to benefit from the diversity we have in our company.Company. We can and will do more to maximize the positive impact that inclusion, diversity, equity, inclusion,awareness and a feeling of belonging can bring. We believe that this and the rest of our vision statement for inclusion, diversity, equity, and inclusionawareness is a solid representation of what we believe in, are committed to, and how we will hold associates and leaders accountable. We recognize that onehave made progress towards increasing our representation of women at all levels of our greatest areas oforganization, but we recognize we have an opportunity is to further increase the representation of women andas well as increase overall racial and ethnic diversity at all levels ofin leadership as we add more talent to our leadership levels.
Talent
We market open jobs across multiple platforms such as our website, LinkedIn, internal postings and local job boards to ensure that our candidate pool is as diverse as possible. We promote having diversity on the interviewing and selection panel to ensure different points of view are considered as part of the final selection process. We enjoy high levels of retention across all of our geographies. OurOn a global basis, our overall turnover rate has continued to decline over the past three years ondeclined in 2023 after a global basis.slight increase in 2022. We facilitate an annual talent review process in all regions and functional teams to promote the internal development and promotion of internal talent. We have enjoyed high participation in employeeassociate surveys, high engagement levels against industry normative data, and also facilitated a COVID and diversity equity andan inclusion survey in 2020.2022 and 2023.
Environmental, Health and Safety
We are subject to various environmental, health and safety laws, regulations and permit requirements in the jurisdictions in which we operate governing, among other things, health, safety, pollution and protection of the environment and natural resources, the handling and use of hazardous substances, the generation, storage, treatment and disposal of wastes, and the cleanup of any contaminated sites. We are not aware of any pending environmental compliance or remediation matters that are reasonably likely to have a material adverse effect on our business, financial position or results of operations. However, failure by us to comply with applicable environmental and other requirements could result in fines, penalties, enforcement actions, third party claims, remediation actions, and could negatively impact our reputation with customers. We have adopted environmental, health and safety policies outlining our commitment to environmental responsibility and accountability.accountability and our desire to eliminate unsafe behaviors in the workplace. These policies apply to the companyCompany as a whole, and our vendors and suppliers and are available on our website. We have a company-wide focus on safety and have implemented a number of measures to promote workplace safety. Customers are increasingly focused on safety records in their sourcing decisions due to increased regulations to report all incidents that occur at their sites and the costs associated with such incidents.
12
Available Information
Our website address is www.tpicomposites.com. All of our filings with the Securities and Exchange Commission (SEC), including this Annual Report on Form 10-K, quarterly reports on Form 10-Q, current reports on Form 8-K, statements of changes in beneficial ownership and amendments to those reports, along with any exhibits to such reports, are available free of charge on our website as soon as reasonably practicable after they are electronically filed with, or furnished to, the SEC. The information contained on our website is neither a part of, nor incorporated by reference into, this Annual
13
Report on Form 10-K. The SEC also maintains an Internet website that contains reports, proxy and information statements, and other information regarding issuers, like us, that file electronically with the SEC. The address of that website is www.sec.gov.
Our investor relations website address is https://ir.tpicomposites.com/websites/tpicomposites/English/0/investor-relations.html and includes key information about our corporate governance initiatives, including our Nominating and Corporate Governance Committee charter, charters of the Audit and Compensation committees and our Code of Business Conduct & Ethics.
13
Information about our Executive Officers
The following table sets forth certain information regarding our Executive Officers as of February 24, 2021:22, 2024:
Name, Age |
| Position | Year Appointed as Executive | Business Experience since January 1, 2018 | ||
William |
| President, Chief Executive Officer and Director | 2013 | TPI Composites, Inc.: Chief Executive Officer since May 2020, President from May 2019 to May 2020, Chief Financial Officer from August 2013 to May 2019. | ||
|
|
| ||||
|
| Chief Operating Officer, Wind | 2023 | TPI Composites, Inc.: Chief Operating Officer since November 2023. | ||
|
| Chief Financial Officer | 2022 | TPI Composites, Inc.: Chief Financial Officer since May 2022. | ||
|
| Chief Commercial Officer, Wind | 2022 | TPI Composites, Inc.: Chief Commercial Officer since January 2022, Senior Vice | ||
|
| President, Automotive | 2021 | TPI Composites, Inc.: President, Automotive since June 2021. | ||
Steven Fishbach, 54 | General Counsel and Secretary | 2015 | TPI Composites, Inc.: General Counsel since January 2015. |
William E. Siwek. Mr. Siwek joined us in August 2013 as our Chief Financial Officer. In May 2019, Mr. Siwek was named our President and ceased serving as our Chief Financial Officer. In May 2020, Mr. Siwek assumed the role of Chief Executive Officer and was elected to the Board of Directors. Prior to joining us, Mr. Siwek previously served as the Chief Financial Officer for T.W. Lewis Company, an Arizona-based real estate investment company, from September 2012 to September 2013. From May 2010 until September 2012, he was an independent consultant assisting companies in the real estate, construction, insurance and renewable energy industries. Prior to that, Mr. Siwek was Executive Vice President and Chief Financial Officer of Talisker Mountain, Inc., from January 2009 to April 2010. Prior to that, he was President and Chief Financial Officer of the Lyle Anderson Company from December 2002 to December 2008. Prior to that, Mr. Siwek spent 18 years, from September 1984 to May 2002, with Arthur Andersen where he became a Partner in both Audit and Business Consulting Divisions. Mr. Siwek also serves on the Board of Directors of the American Clean Power Association, a renewable energy industry trade group, which commenced operations in January 2021. Mr. Siwek holds B.S. degrees in Accounting and Economics from University of Redlands and is a Certified Public Accountant.
Bryan R. Schumaker.14
Mr. Schumaker joined us in May 2019 as our Chief Financial Officer. Prior to joining us, Mr. Schumaker served as the Chief Accounting Officer of First Solar, Inc. from July 2015 to May 2019 and the Chief Financial Officer of 8point3 Energy Partners, a publicly-traded limited partnership formed by First Solar and Sunpower Corporation to own, operate and acquire solar energy generation projects from July 2016 to July 2018. Mr. Schumaker also served as Assistant Corporate Controller of First Solar from April 2008 to December 2011 and Vice President, Corporate Controller from December 2011 to July 2015. Prior to working at First Solar, Mr. Schumaker worked for Swift Transportation from January 2003 to April 2008 in multiple roles, including Vice President, Corporate Controller. Prior to that, Mr. Schumaker worked for KPMG, LLP as a Supervising Senior for the Assurance Practice and for a BDO Alliance Firm as a Senior Audit Associate. Mr. Schumaker holds a B.B.A. degree in Accounting from the University of New Mexico. Mr. Schumaker also serves on the Board of Directors of the Arizona Manufacturing Extension Partnership.
Ramesh Gopalakrishnan. Mr. Gopalakrishnan joined us in September 2016 as Vice President, Technology, Transfer and Launch, and was promoted to Senior Vice President, Technology and Industrialization in August 2017 and Senior Vice President, Global Quality, Technology and Latin American Operations in February 2019. In May 2019, Mr. Gopalakrishnan was named our Chief Operating Officer – Wind. Prior to joining us, Mr. Gopalakrishnan served as Executive Vice President, Manufacturing for Senvion GmbH from May 2015 to August 2016 and Senior Vice President, Global Blades from February 2013 to April 2015. Prior to joining Senvion GmbH, Mr. Gopalakrishnan served as the Chief Executive Officer of Suzlon Energy Composites from February 2011 to January 2014, where he oversaw blade and mold factories in the United States, China and India and engineering centers in Europe. Prior to joining Suzlon Energy Composites, Mr. Gopalakrishnan served in various operations, supply chain and engineering roles at Halliburton Company and General Electric Company. Mr. Gopalakrishnan
14
holds a B.S. in Mechanical Engineering from the Indian Institute of Technology and a M.S. and Ph.D in Mechanical Engineering from the State University of New York at Stony Brook.
James M. Hilderhoff. Mr. Hilderhoff joined us in August 2020 as our Chief Commercial Officer. Prior to joining us, Mr. Hilderhoff served as the Chief Commercial Officer – North America for Wabtec Corporation, a publicly-traded leading global provider of equipment, systems, digital solutions, and value-added services for the freight and transit rail sectors, from February 2019 to July 2020. Prior to Wabtec Corporation's merger with General Electric Company's transportation business in February 2019, Mr. Hilderhoff served in sales, service, operations and marketing roles in various businesses of General Electric Company for over thirty years, including GE's transportation and power businesses. Mr. Hilderhoff served as General Manager, Global Sales and Marketing of GE's transportation business from January 2016 to February 2019, and also served as General Manager, Americas Services Operation for GE's transportation business from 2010 to December 2015. Mr. Hilderhoff holds an M.B.A. in Business Administration from the University of Pennsylvania, Wharton School of Business and a B.S. degree in Engineering Science from Pennsylvania State University.
Thomas J. Castle. Mr. Castle joined us in November 2015 as our Senior Vice President—North American Wind Operations and Global Operational Excellence. In February 2019, Mr. Castle was named our Senior Vice President—U.S. and Transportation Operations. In May 2019, Mr. Castle was named our Senior Vice President – Operations, Strategic Markets. Prior to joining us, Mr. Castle was with Honeywell Aerospace from 2007 to 2015. Mr. Castle served as the Vice President of Integrated Supply Chain, Americas Electronics Operations Center from 2014 to 2015. From 2012 to 2014, he was the Global Vice President of the Honeywell Operating System for Aerospace. Prior to that, Mr. Castle held various positions at the Americas Services Organization from 2007 to 2012. From 1996 to 2007, Mr. Castle was with GE Aviation in roles of increasing responsibility, most recently as the Managing Director of a manufacturing facility in Thailand from 2005 to 2007. Mr. Castle holds a B.S. degree in Aeronautics from St. Louis University.
Steven G. Fishbach. Mr. Fishbach has served as our General Counsel since January 2015. Prior to joining us, Mr. Fishbach served as Deputy General Counsel of Global Cash Access Holdings, Inc. from 2011 to 2015 and Associate General Counsel from 2009 to 2011. Prior to that, Mr. Fishbach served in various senior roles in the legal department of Fidelity National Information Services, Inc./eFunds Corporation from 2005 to 2008. Mr. Fishbach also practiced corporate and securities law at Squire Sanders (now Squire Patton Boggs) from 2000 to 2005. Mr. Fishbach holds a B.A. degree in American Studies from Georgetown University and a J.D. degree from William & Mary Law School.
15
Item 1A. Risk Factors
You should carefully consider the following risk factors. If any of the events contemplated by the following discussion of risks should occur, our business, results of operations, financial condition, growth prospects and cash flows could suffer significantly. Additional risks that we currently do not know about or that we currently believe to be immaterial may also impair our business. Certain statements below are forward-looking statements. See “Special Note Regarding Forward-Looking Statements” in this Annual Report on Form 10-K.
Risks Related to Our Wind Blade Business
A significant portion of our business is derived from a small number of customers, and two wind blade customers in particular, therefore any loss of or reduction in purchase orders, failure of these customers to fulfill their obligations or our failure to secure long-term supply agreement renewals from these customers could materially harm our business.
Substantially all of our revenues are derived from fourthree wind blade customers. Two customers, Vestas, GE Vernova and GE Wind,Nordex accounted for 49.7%35.8%, 24.6% and 23.4%30.3%, respectively, of our total net sales for the year ended December 31, 2020,2023, and 46.1%36.2%, 20.8% and 25.7%32.6%, respectively, of our total net sales for the year ended December 31, 2019,2022, and 32.0%30.9%, 29.0% and 31.7%25.4%, respectively, of our total net sales for the year ended December 31, 2018. In addition, two customers, Nordex and Siemens Gamesa accounted for 15.3% and 4.7%, respectively, of our net sales for the year ended December 31, 2020, 16.1% and 5.1%, respectively, of our net sales for the year ended December 31, 2019, and 19.0% and 11.2%, respectively, of our net sales for the year ended December 31, 2018.2021. Accordingly, we are substantially dependent on continued business from our current wind blade customers, and Vestas and GE Wind in particular.customers. If one or more of our wind blade customers were to reduce or delay wind blade orders, file for bankruptcy or become insolvent, fail to pay amounts due or satisfactorily perform their respective contractual obligations with us or otherwise terminate or fail to renew their long-term supply agreements with us, our business, financial condition and results of operations could be materially harmed.
Defects in materials and workmanship or wind blade failures could harm our reputation, expose us to product warranty or other liability claims, decrease demand for wind blades we manufacture, or materially harm existing or prospective customer relationships, and our reserves for warranty expenses might not be sufficient to cover all future costs.
Defects in the wind blades we manufacture are unpredictable and an inherent risk in manufacturing technically advanced products that involve a significant amount of manual labor and processes. Defects may arise from multiple causes, including design, engineering, materials, manufacturing and componentscomponent failures as well as deficiencies in our manufacturing processes. Under our supply agreements, we warranty the materials and workmanship of the wind blades while our customers are responsible for the fitness of use and design of the wind blades. We have experienced wind blade failures and defects at some of our facilities during the startup manufacturing phase of new products, and we may experience failures or defects in the future. Wind blades that we have manufactured have also failed in the field. Any wind blade failures or other product defects in the future could materially harm our existing and prospective customer relationships. Specifically, negative publicity about the quality of the wind blades we manufacture or defects in the wind blades supplied to our customers could result in a reduction in wind blade orders, increased warranty claims, product liability claims and other damages or termination of our long-term supply agreements or business relationships with current or new customers. Any of the foregoing could materially harm our business, operating results and financial condition.
We provide warranties for all of the wind blades and precision molding and assembly systems we produce, including parts and labor, for periods that typically range from two to five years depending on the product sold. Our estimate of warranty expense requires us to make assumptions about matters that are highly uncertain, including future rates of product failure, repair costs, shipping and handling and de-installation and re-installation costs at customers’ sites. Our assumptions could be materially different from the actual performance of our products and these remediation expenses in the future. The expenses associated with wind blade repair and remediation activities can be substantial and may include changes to our manufacturing processes. If our estimates prove materially incorrect, we could incur warranty expenses that exceed our reserves and we could be required to make material unplanned cash expenditures, which could materially harm our business, operating results and financial condition.
16
We operate in an industry characterized by changing customer demands and associated transition costs, which could materially harm our business.15
The wind energy industry is competitive and is characterized by evolving customer demands. As a result, we must adapt quickly to customer requests for changes to wind blade specifications, which increases our costs and can provide periods of reduced revenue and margins. For instance, during 2020 and into 2021, we have undertaken and will undertake model transitions at several of our facilities for various customer demands. In 2020, we had several manufacturing lines in transition which adversely impacted our revenue and profitability. We currently expect to have manufacturing lines in transition during 2021 which could adversely affect our revenue and profitability in 2021. We typically share transition costs with the customer in connection with these changing customer demands, but any sharing is usually the subject of negotiation and the amount is not always contractually defined. If we do not receive transition payments from our customers sufficient to cover our transition costs or lost margins, our business, financial condition, and results of operations could be materially harmed.
We have experienced, and could in the future experience, quality or operational issues in connection with plant construction, expansion or expansion,assumption which could result in losses and cause delays in our ability to complete our projects and may therefore materially harm our business, financial condition and results of operations.
We dedicate most of the capacity of our current wind blade manufacturing facilities to existing customers and, as a result, we may need to build additional manufacturing capacity or facilities to serve the needs of new customers or expanded needs of existing customers. Since the third quarter of 2016, we have commencedWe currently conduct operations at four newfive manufacturing facilities in Mexico, one in Turkey, one in Yangzhou, ChinaTürkiye, and one in Chennai, India. The construction of new plants and the expansion or assumption of existing plants involves significant time, cost and other risks. We generally expect our plants to generate losses in their first 12 to 18 months of operations related to production startup costs. Additionally, numerous factors can contribute, and have in the past contributed, to delays or difficulties in the startup of, or the adoption of our manufacturing lines to produce larger wind blade models, which we refer to as model transitions, in our manufacturing facilities. These factors include permitting, construction or renovation delays, defects or issues with product tooling, the engineering and fabrication of specialized equipment, the modification of our general production know-how and customer-specific manufacturing processes to address the specific wind blades to be tested and built, changing and evolving customer specifications and expectations and the hiring and training of plant personnel. Any delays or difficulties in plant startup, expansion or expansionassumption may result in cost overruns, production delays, contractual penalties, loss of revenues, reduced margins and impairment of customer relationships, which could materially harm our business, financial condition and results of operations. For example, in 2019,In 2022 and 2023, we experienced construction and startupsignificant production delays with respect to our newat the Matamoros, Mexico manufacturing facility that we took over from Nordex in Yangzhou, China. These delays resulted in us paying liquidated damagesJuly 2021 due to the poor condition of $7.8 million to one ofthe facility and related equipment, which adversely impacted our customers in 2019profitability and 2020. financial condition.
Some of our long-term supply agreements with our customers are subject to early termination and volume reductions at the discretion of our customers, and any early termination of or reduced volumes of wind blades purchased under these agreements could materially harm our business, financial condition and results of operations.
Our current long-term supply agreements expire between the endDecember of 20212024 and the endDecember of 2024.2025. Some of our long-term supply agreements contain provisions that allow for the early termination of these agreements upon the customer providing us with advance written notice and paying an early termination fee. Our wind blade supply agreements generally establish annual purchase requirements on which we rely for our future production and financial forecasts. However, the timing and volume of purchases, within certain parameters, may be subject to change by our customers. The amount of the annual purchase requirements typically declinedeclines in the later years of our long-term supply agreements. Our customers may not continue to maintain long-term supply agreements with us in the future. For example, Vestas has notified us that it does not intend to renew our Dafeng,terminated its Yangzhou, China supply agreement which expires at the end of 2021. 2022, even though it was set to expire at the end of 2023, and paid to us an early termination fee.If one or more of our customers terminate or reduce the number of manufacturing lines and volumes of wind blades purchased, or fail to renew their long-term supply agreements with us, it would materially harm our business, financial condition and results of operations.
17
Many of our long-term supply agreements contain liquidated damages provisions, which may require us to make unanticipated payments to our customers.
Many of our long-term supply agreements contain liquidated damages provisions in the event that we fail to perform our obligations thereunder in a timely manner or in accordance with the agreed terms, conditions and standards. Our liquidated damages provisions generally require us to make a payment to the customer if we fail to deliver a product or service on time. We generally try to limit our exposure under any individual long-term supply agreement to a maximum penalty. Nevertheless, if we incur liquidated damages, they may materially harm our business, operating results and financial condition.
Our wind turbine OEM customers are facing increasing competition and pricing pressure due to the increasing prevalence of auction-based tenders in wind energy markets, and correspondingly our margins and results of operations may be adversely affected.
Many governments are shifting from feed-in tariffs, which typically provide producers of wind energy with favorable prices for wind generated electricity, to unsubsidized, auction-based tenders as a means of promoting the development and growth of renewable energy sources such as wind energy. As a result of this shift, our wind turbine OEM customers are experiencing intense pricing pressure with respect to the sale of their turbines. As a result of this pricing pressure, we will be required to further reduce the costs we incur to manufacture wind blades to remain competitive. We typically share the benefit of cost reductions related to manufacturing wind blades with our customers pursuant to the terms of our long-term supply agreements. If these pricing pressures continue, we may choose to reduce our margins or pass on a greater percentage of the savings to our OEM customers obtained from manufacturing cost reductions than required under our supply agreements to remain competitive, each of which may materially harm our business, financial condition and results of operations.
Although a majority of our manufacturing facilities are located outside the United States,U.S., our business is still heavily dependent upon the demand for wind energy in the United StatesU.S. and any downturn in demand for wind energy in the United StatesU.S. could materially harm our business.
We have developed a global footprint to serve the growing wind energy market worldwide and have wind blade manufacturing facilities in the United States, China,U.S., Mexico, TurkeyTürkiye and India. Although a majority of our manufacturing facilities are located outside of the United States,U.S., historically more than half of the wind blades that we produced were deployed in wind farms located within the United States.U.S. Our Iowa manufacturing facility, where production has been shut down since the end of the fourth quarter of 2021, and our Mexico manufacturing facilities manufacture wind blades that are generally deployed within the United States.U.S. In addition, many of our wind blades are exported from our China, TurkeyTürkiye and India manufacturing facilities to the United States. In addition, tariffs imposed on components of wind turbines from China, including wind blades, has had a negative impact on demand for our wind blades manufactured in our Chinese manufacturing facilities.U.S. Consequently, demand for wind energy and our wind blade sales could be adversely affected by a variety of reasons and factors, and any downturn in demand for wind energy in the United StatesU.S. could materially harm our business.
We could experience shortagesexpect that demand for wind turbine blades in 2024 will be slightly down compared to 2023 due to our customers and wind farm developers continuing to defer investments into the future until inflationary pressure and global economies stabilize, and there is clearer regulatory guidance with respect to the IRA and actions proposed by the EU under the REPowerEU plan and the Green Deal Industrial Plan.
16
We have experienced volatility in the price and availability of raw materials orand components that are critical to our manufacturing needs, as well as ongoing inflationary pressures impacting many of our labor and other costs, and we may continue to, or in the future, experience price increases, supply constraints, and inflationary pressures, which may hinder our ability to perform under our supply agreements.agreements and adversely impact our profitability and financial condition.
We rely upon third parties for raw materials, such as fiberglass, carbon fiber, resins, foam core and balsa wood, and various components for the wind bladesproducts we manufacture. Some of these raw materials and components may only be purchased from a limited number of suppliers. For example, balsa wood is only grownCurrent geopolitical climate, such as the attacks on shipping vessels in the Red Sea, and producedthe economic environment generally, including with respect to inflation, continue to evolve and affect supply chain performance and underlying assumptions in various ways – specifically with volatility in commodity, energy, and logistics costs. However, the overall pricing for the raw materials that we source decreased in 2023 compared to 2022 due to decreases in pricing and logistics costs. We expect to see a limited numberfurther decrease in material pricing in 2024. If the prices for these raw materials and logistics costs revert back to the levels we experienced in 2021 and 2022, such elevated price levels could have a material impact on our results of geographies and is only available from a limited number of suppliers. operations.
Additionally, our ability to purchase the appropriate quantities of raw materials is constrained by our customers’ transitioning wind blade designs and specifications. As a result, we maintain, relatively lowclosely monitor and manage inventory and acquire raw materials and components as needed.needed and with consideration to lead time factors. Due to significantfluctuating international demand for these raw materials from many industries, and extended logistics lead times, we may be unable to acquire sufficient quantities or secure a stable supply for our manufacturing needs. For example, in 2019, we experienced shortages in the supplyOne of balsa wood and other core materials. If shortages or delays occur, we may be unable to provide our products to our customers on time, or at all. In some instances, our customers directly controlsources all of the purchase of certain keycritical raw materials that we use to produce such customers' wind blades. Since we do not source procurement of these raw materials for this customer, we have fewer controls and componentsremedies to mitigate raw material and if they are unablesupply chain risks and disruptions relating to procure and provide us with such raw materials and components, it could cause delays and disruptions with respect to our business and operations. for such customer.
In 2020,2023, we procured approximately 25%11% of our raw materials from China so any ocean logistic delays arising from attacks on shipping vessels in the Red Sea or otherwise, weather events, strikes, other force majeure events or geopolitical developments impacting China could disrupt our supply chain. In addition, a disruption in any aspect of our global supply chain caused by transportation delays, customs
18
delays, cost issues or other factors could result in a shortage of raw materials or components critical to our manufacturing needs. For example, in 2020 and 2021, we have experienced several delays in receipt of certain raw materials used to make our products primarily due to COVID-19 outbreaks amongst port workers at certain ports in the United States. Any supply shortages, delays in the shipment of materials or components from third party suppliers, or changes in the terms on which they are available could disrupt or materially harm our business, operating results and financial condition.
Ongoing inflationary pressures have caused and may continue to cause many of our material, labor, and other costs to increase, which can have adverse impacts on our results of operations. The government of Mexico increased minimum wages approximately 20% effective January 1, 2023, and an additional 20% effective January 1, 2024. The government of Türkiye increased minimum wages approximately 55%, 34% and 49%, respectively, effective January 1, 2023, July 1, 2023, and January 1, 2024. In May 2023 we agreed to an amendment to our collective bargaining agreement with our associates in Türkiye which resulted in significantly increased wages for these associates. While our customer contracts allow us to pass a portion of these increases to our customers, we will not be able to recover 100% of the wage inflation. If our manufacturing facilities in these countries continue to experience wage inflation at these levels and the increased costs in local currency are not offset with favorable foreign currency fluctuations, such elevated wages could have a material impact on our results of operations and financial condition.
Demand for the wind blades we manufacture may fluctuate for a variety of reasons, including the growth of the wind industry, and decreases in demand could materially harm our business and may not be sufficient to support our growth strategy.
Our revenues, business prospects and growth strategy heavily depend on the continued growth of the wind industry and our customers’ continuing demand for wind blades. Customer demand could decrease from anticipated levels due to numerous factors outside of our control that may affect the development of the wind energy market generally, portions of the market or individual wind project developments, including:
|
|
|
|
17 |
|
|
|
|
|
|
|
|
|
|
|
|
|
|
|
|
|
|
|
|
|
In 2023, we experienced a decline in demand for our wind turbine blades due primarily to regulatory uncertainty as our customers and wind farm developers continued to defer investments into the future until inflationary pressure and global economies stabilize, and there is clearer regulatory guidance with respect to the IRA and actions proposed by the EU under the REPowerEU plan, which adversely impacted our operating results. We expect that demand for wind turbine blades in 2024 will remain slightly down. In addition to factors affecting the wind energy market generally, our customers’ demand may also fluctuate based on other factors beyond our control. Any decline in customer demand below anticipated levels could materially harm our revenues and operating results and could delay or impede our growth strategy.
We have experienced in the past, and our future wind blade production could be affected by, operating problems at our facilities, which may materially harm our operating results and financial condition.
Our wind blade manufacturing processes and production capacity have in the past been, and could in the future be, disrupted by a variety of issues, including:
| • production outages to conduct maintenance activities that cannot be performed safely during operations; • prolonged power failures or reductions; • breakdowns, failures or substandard performance of machinery and equipment; • our inability to comply with material environmental requirements or permits; • inadequate transportation infrastructure, including problems with railroad tracks, bridges, tunnels or roads; • supply shortages of key raw materials and components; • damage or production delays caused by earthquakes, fires, floods, tornadoes, hurricanes, extreme weather conditions such as windstorms, hailstorms, drought, temperature extremes, typhoons or other natural disasters or terrorism or health epidemics; and • labor unrest or shortages in skilled labor.
|
|
|
|
|
|
|
|
19
|
|
|
|
|
|
|
|
The cost of repeated or prolonged interruptions, reductions in production capacity, or the repair or replacement of complex and sophisticated tooling and equipment may be considerable and could result in damages under
18
or the termination of our long-term supply agreements or penalties for regulatory non-compliance, any of which could materially harm our business, operating results and financial condition.
We operate a substantial portion of our business in international markets and we may be unable to effectively manage a variety of currency, legal, regulatory, economic, social and political risks associated with our global operations and those in developing markets.
We currently operate manufacturing facilities in the United States, China,U.S., Mexico, Turkey,Türkiye, and India. Since the third quarter of 2016, we have commenced operations at fourfive new manufacturing facilities in Mexico, one in Turkey, one in Yangzhou, ChinaTürkiye, and one in Chennai, India. For the years ended December 31, 2020, 20192023, 2022 and 2018,2021, approximately 89%96%, 88%94% and 84%87%, respectively, of our net sales were derived from our continuing international operations and we expect that a substantial portion of our projected revenue growth will be derived from those operations. Our overall success depends, in part, upon our ability to succeed in differing legal, regulatory, economic, social and political conditions. The global nature of our operations is subject to a variety of risks, including:
|
|
|
|
|
|
|
|
|
|
|
|
|
|
|
|
|
|
|
|
|
|
|
|
|
|
20
As we continue to operate our business globally, our success will depend, in part, on our ability to anticipate and effectively manage these and other related risks. We may be unsuccessful in developing and implementing policies and strategies that will be effective in managing these risks in each country where we do business or conduct operations. Our failure to manage these risks successfully could materially harm our business, operating results and financial condition.
We may not achieve the long-term growth we anticipate if wind turbine OEMs do not continue to shift from in-house production of wind blades to outsourced wind blade suppliers and if we do not expand our customer relationships and add new customers.19
Many wind turbine OEMs rely on in-house production of wind blades for some or all of their wind turbines. Our growth strategy depends in large part on the continued expansion of our relationships with our current wind blade customers, and the addition of new key customers. All of our customers possess the financial, engineering and technical capabilities to produce their own wind blades and many source wind blades from multiple suppliers. Our existing customers may not expand their wind energy operations or, if they do, they may not choose us to supply them with new or additional quantities of wind blades. Our collaborative dedicated supplier model for the manufacture of wind blades is a significant departure from traditional vertically integrated methods. As is typical for rapidly evolving industries, customer demand for new business models is highly uncertain. Although we have entered into long-term supply agreements with customers that also produce wind blades for their wind turbines in-house, we may not be able to maintain these customer relationships or enter into similar arrangements with new customers that produce wind blades in-house in the future. In addition, although GE Wind historically outsourced all of their wind blade production requirements prior to its acquisition of LM, we expect that GE Wind will continue to utilize LM for a substantial percentage of its wind blade production in the future. Our business and growth strategies depend in large part on the continuation of the trend toward outsourcing manufacturing. If that trend does not continue or we are unsuccessful in persuading wind turbine OEMs to shift from in-house production to the outsourcing of their wind blade manufacturing, we may not achieve the long-term growth we anticipate and our market share could be limited.
A drop in the price of energy sources other than wind energy, or our inability to deliver wind blades that compete with the price of other energy sources, may materially harm our business, financial condition and results of operations.
We believe that the decision to purchase wind energy is, to a significant degree, driven by the relative cost of electricity generated by wind turbines compared to the applicable price of electricity from traditional (i.e., thermal) and other renewable energy sources. Decreases in the prices of electricity from traditional or renewable energy sources other than wind energy, such as solar, wouldcould harm the market for wind energy. In particular, a drop in natural gas prices could lessen the appeal of wind-generated electricity. Technological advancements or the construction of a significant number of power generation plants, including nuclear, coal, natural gas or power plants utilizing other renewable energy technologies, government support for other forms of renewable energy or construction of additional electric transmission and distribution lines could reduce the price of electricity produced by competing methods, thereby making the purchase of wind energy less attractive. The ability of energy conservation technologies, public initiatives and government incentives to reduce electricity consumption or support other forms of renewable energy could also lead to a reduction in the price of electricity, which would undermine the attractiveness of wind energy and thus wind turbines, and, ultimately wind blades. If prices for electricity generated by wind turbines are not competitive, our business, financial condition and results of operations may be materially harmed.
We encounter intense competition for limited customers from other wind blade manufacturers, as well as in-house production by wind turbine OEMs, which may make it difficult to enter into long-term supply agreements, keep existing customers and potentially get new customers.
We face significant competition from other wind blade manufacturers, and this competition may intensify in the future. The wind turbine market is characterized by a relatively small number of large OEMs. The competitive environment in the wind energy industry mayrecently has become more challenging in the years ahead, particularly in the event ofprimarily due to ongoing regulatory uncertainty and supply chain constraints and significant raw material price increases. This challenging environment may lead to further consolidation in the industry, which could lead to us having even fewer customers. In addition, a significant percentage of wind turbine OEMs, including all of our current customers, produce some of their own
21
wind blades in-house. As a result, we compete for business from a limited number of customers that outsource the production of wind blades. We also compete with a number of wind blade manufacturers in China, who are growing in terms of their technical capability and aspire to expand outside of China. Some of our competitors have more experience in the wind energy industry, as well as greater financial, technical or human resources than we do, which may limit our ability to compete effectively with them and maintain or improve our market share. Additionally, our long-term supply agreements dedicate capacity at our facilities to our customers, which may also limit our ability to compete if our facilities cannot accommodate additional capacity. If we are unable to compete effectively for the limited number of customers that outsource production of wind blades, our ability to enter into long-term supply agreements with potential new and existing customers may be materially harmed.
We rely on our research and development efforts to remain competitive, and we may fail to develop on a timely basis new wind blade manufacturing technologies that are commercially attractive or permit us to keep up with customer demands.
The market for wind blades is subject to evolving customer needs and expectations. Our research and development is invested in developing faster and more efficient manufacturing processes in order to build the new wind blades designed by our customers that more effectively capture wind energy and are adaptable to new growth segments of the wind energy market. Research and development activities are inherently uncertain and the results of our in-house research and development may not be successful. In addition, our competition may adopt more advanced technologies or develop wind blades that are more effective or commercially attractive. We believe that our future success will depend in large part upon our ability to be at the forefront of technological innovation in the wind energy industry and to rapidly and cost-effectively adapt our wind blade manufacturing processes to keep pace with changing technologies, new wind blade design and changing customer needs. If we are unable to do so, our business, operating results, financial condition and reputation could be materially harmed.
Various legislation, infrastructure, regulations including permitting and siting and incentives that are expected to support the growth of wind energy in the United StatesU.S. and around the world may not be extended or may be discontinued, phased out or changed, or may not be successfully implemented, which could materially harm wind energy programs and materially decrease demand for the wind blades we manufacture.
The U.S. wind energy industry has been dependent in part upon governmental support through certain incentives including federal tax incentives and state RPS programs and may not be economically viable if a large number of these incentives are not continued. Government-sponsored tax incentive programs including the PTC, and the Investment Tax Credit (ITC), are expected to continue to support have supported the U.S. growth of wind energy. TheIn August 2022, the PTC and ITC were recentlywas extended for an additional year throughuntil the endlater of 2021.2032 or when greenhouse gas emissions have been reduced by 75% compared to 2022. In addition, therea new advanced manufacturing production tax credit (AMPC) was created that can be claimed for the domestic production and sale of clean energy components, such as wind turbine blades. There are also increasing regulatory efforts globally to promote renewable power.energy. In December 2020, the EU agreed to reduce EU greenhouse gas emissions by at least 55% by 2030, compared to 1990 levels. In May 2022, the EU announced the REPowerEU plan which seeks to rapidly reduce the EU's dependence on fossil fuels by 2027. Furthermore, the EU introduced the Green Deal Industrial Plan that is expected to further accelerate the expansion of renewable energy and green technologies including easing state aid rules to enable higher subsidies. A key component of the Green
20
Deal Industrial Plan is the Net-Zero Industry Act to simplify regulations, speed up permitting and promote cross-border projects to accelerate climate neutrality in Europe. In November 2023, EU’s Renewable Energy Directive III, which aims to raise the share of renewable power in the EU’s overall energy consumption to 42.5% by 2030, with an additional 2.5% indicative top up that would allow the overall share to reach 45%, entered into effect. We expect that the new government policy will accelerate long-term growth in the wind industry. Despite these favorable long-term policy trends, we don’t expect an increase in demand until 2025, while the wind industry awaits clarity on the implementation guidance related to key components of the IRA and clarity around more robust policies in Europe. In addition, permitting, transmission, transmission queues, the ability of the broader wind industry supply chain to ramp volume, elevated interest rates and inflation, and the cost and availability of capital are further factors limiting the timing of the wind market recovery.
Because of the long lead times necessary to develop wind energy projects, including obtaining necessary permits or access to transmission infrastructure, any uncertainty or delay in reinstituting the PTC and ITC or adopting, extending or renewing the PTC, ITC or other incentives promoting wind energy beyond their current or future expiration dates could negatively impact potential wind energy installations and result in industry volatility. There can be no assurance that the PTC, the ITC, tender offers, auctions or other governmental programs or subsidies for renewable energy will remain in effect in their present form or at all, or that the required transmission infrastructure expansion occurs, and the elimination, reduction, or modification of these programs or subsidies could materially harm wind energy programs in the United StatesU.S. and international markets and materially decrease demand for the wind blades we manufacture and, in turn, materially harm our business, operating results and financial condition.
Our long-term growth Although regulatory uncertainty, as well as permitting, siting and success is dependent upon retaining our senior managementtransmission challenges in the U.S. and attractingEurope has tempered demand for wind energy in the near term, we expect global demand for renewable energy, and retaining qualified personnel.
Our growth and success depends to a significant extent on our ability to attract and retain highly qualified research and development, management, manufacturing and other key personnel including engineerswind energy in our various locations. In addition, we rely heavily on our management team, including William E. Siwek, our President and Chief Executive Officer; Ramesh Gopalakrishnan, our Chief Operating Officer - Wind; Bryan Schumaker, our Chief Financial Officer; and other senior management. Although we have executed an employment agreement with each of these executives, these executives and other senior management can resign with little or no notice to us. The inability to recruit and retain key personnel or the unexpected loss of key personnel may materially harm our business, operating results and financial condition. Hiring those persons may be especially difficult because of the
22
specialized nature of our business and our international operations. If we cannot attract and retain qualified personnel, or if we lose the services of Messrs. Siwek, Gopalakrishnan, or Schumaker, other key members of senior management or other key personnel, and we do not have adequate succession plans in place, our ability to successfully execute our business plan, market and develop our products and serve our customers could be materially and adversely affected. In addition, because of our reliance on our management team, our future success depends, in part, on its ability to identify and develop talent to succeed its senior management. The retention of key personnel and appropriate senior management succession planningparticular, will continue to be criticalgrow in the long term due to a multitude of factors, including: increased cost competitiveness of wind energy compared to fossil fuel generated electricity; increased demand from corporations and utility providers for renewable energy; and recent international policy initiatives designed to promote the successful implementationgrowth of our future strategies.renewable energy.
Risks Related to our TransportationOur Automotive Business
Our efforts to expand our transportationautomotive business or consummate a strategic transaction to further expand and enter into other strategic marketsfund our automotive business may not be successful.
While our primary focus has been to manufacture composite wind blades, our strategy is to expand our transportation business and to enter into other strategic markets. In 2018, we expanded our relationship with Proterra and began supplying bus bodies from a new manufacturing facility in Newton, Iowa in addition to our manufacturing facility in Warren, Rhode Island.also serve the automotive market. We have experienced startup challenges and incurred significant losses to date in connection with the supply of bus bodies to Proterra from our Newton, Iowa manufacturing facility. As result, we closed our Newton, Iowa bus body manufacturing facility in the first quarter of 2020, and consolidated our bus body manufacturing operation into our Warren, Rhode Island manufacturing facility and a manufacturing facility in Juárez, Mexico.automotive business. The expansion of our transportationautomotive business and our entry into other strategic markets will require improved execution in terms of our start up activity and ongoing manufacturing performance as well as significant levels of investment. As a result, we are in the process of exploring strategic alternatives to ensure our automotive business is sufficiently funded to execute on its growth strategies. We expect to complete this process no later than June 30, 2024. There can be no assurance that our transportation business or other strategic markets will develop as anticipated or that we will have success in any such markets, and if we do not, we may be unableable to recovergrow or adequately fund our investment,automotive business which could adversely impact our business, financial condition and results of operations.
We may incur material losses and costs as a result of product liability and warranty claims, litigation and other disputes and claims.
We are exposed to warranty and product liability claims if our transportationautomotive products fail to perform as expected. We may in the future be required to participate in a recall of these products or the vehicles incorporating our products. If public safety concerns are raised, we may have to participate in a recall even if our products are ultimately found not to be defective. Vehicle manufacturers have experienced increasing recall campaigns in recent years. Our customers may look to us for contribution when faced with recalls and product liability claims. If our customers demand higher warranty-related cost recoveries, or if our transportationautomotive products fail to perform as expected, our business, financial condition and results of operations could materially suffer.
21
Risks Related to Our Business as a Whole
Our business, operations and financial condition during the year ended December 31, 2020 were adversely affected by the COVID-19 pandemic and we cannot estimate the duration of the COVID-19 pandemic and our business may be adversely affected in the future if the COVID-19 pandemic persists.
The COVID-19 pandemic adversely affected our business and operations during the year ended December 31, 2020. During the first quarter of 2020, our China manufacturing facilities were adversely impacted by the COVID-19 pandemic in the form of reduced production levels and COVID-19 related costs associated with the health and safety of our associates and non-productive labor. During the second quarter of 2020, all of our manufacturing facilities with the exception of our China manufacturing facilities and our Rhode Island manufacturing facility were required to temporarily suspend production or operate at reduced production levels due primarily to certain applicable government-mandated stay at home orders in response to the COVID-19 pandemic, demands from certain of our labor unions to suspend or reduce production and general safety concerns of our associates. By the end of the second quarter of 2020, most of our manufacturing facilities had returned to operating at or near normal production levels. We may be required to reinstate temporary production suspensions or volume reductions at our other manufacturing facilities to the extent there is a resurgence of COVID-19 cases in the regions where we operate or there is an outbreak of positive COVID-19 cases in any of our manufacturing facilities. In addition, although we currently have not experienced any significant disruptions in our global supply chain due to the COVID-19 pandemic, our global supply chain may in the future be adversely affected if the COVID-19 pandemic persists.
23
Our financial position, revenue, operating results, profitability and cash flows are difficult to predict and may vary from quarter to quarter, which could cause our share price to decline significantly.
Our quarterly revenue, operating results, profitability and cash flows have varied in the past and are likely to vary significantly from quarter to quarter in the future. For example, our quarterly results have ranged from operating income of $29.0 million for the three months ended September 30, 2020 to an operating loss of $15.4 million for the three months ended March 31, 2020. The factors that are likely to cause these variations include:
| • warranty expense; • associate wage levels and wage inflation in Türkiye, Mexico and other countries in which we operate, and continuing general inflationary pressures in these markets; • operating and startup costs of new manufacturing facilities; • wind blade model transitions; • differing quantities of wind blade production; • unanticipated contract or project delays or terminations; • changes in the costs of raw materials or disruptions in raw material supply; • scrap of defective products; • payment of liquidated damages to our customers for late deliveries of our products; • availability of qualified personnel; • costs incurred in the expansion of our existing manufacturing capacity; • volume reduction requests from our customers pursuant to our customer agreements; • damage or production delays caused by earthquakes, fires, floods, tornadoes, hurricanes, extreme weather conditions such as windstorms, hailstorms, drought, temperature extremes, typhoons or other natural disasters or terrorism or health epidemics such as the COVID-19 pandemic; • changes in our effective tax rate; • general economic conditions; and • the complexity of the financial assumptions we must use for forecasting our revenue, profitability and operating results under the revenue recognition standard and the impact that unanticipated blade transitions have on those estimates.
|
|
|
|
|
|
|
|
|
|
|
|
|
|
|
|
|
|
|
|
|
|
|
|
|
|
|
|
|
|
|
|
As a result, our revenue, operating results, profitability and cash flows for a particular period are difficult to predict and may decline in comparison to corresponding prior periods regardless of the strength of our business. It is also possible that in some future periods our revenue, operating results and profitability may not meet the expectations of securities analysts or investors. If this occurs, the trading price of our common stock could fall substantially, either suddenly or over time, and our business, operating results and financial condition would be materially harmed.
Our Credit Agreement with Oaktree contains, and any future loan agreements we may enter into may contain, operating and financial covenants that restrict our business and financing activities.
As of December 31, 2023, we had outstanding $395.0 million of senior, secured indebtedness under the Credit Agreement and Guaranty, dated as of December 14, 2023, between the Company and Oaktree Fund Administration, LLC (the Credit Agreement) and total outstanding indebtedness of $606.1 million. Our obligations under the Credit Agreement are secured by substantially all of our assets. In addition, from time to time, we enter into various loan, working capital and accounts receivable financing facilities to finance the construction and ongoing operations of our advanced manufacturing facilities and other capital expenditures. The Credit Agreement contains various financial covenants and other restrictions regarding, among other things, maintaining minimum cash balances,
22
making capital expenditures and other restricted payments, incurring additional indebtedness, creating liens, and paying dividends. The operating and financial restrictions and covenants contained in the Credit Agreement, as well as our other existing and any future financing agreements that we may enter into, may restrict our ability to finance our operations, engage in business activities, expand or fully pursue our business strategies or respond to changing business and economic conditions. Our ability to comply with these covenants may be affected by events beyond our control. A breach of any of these covenants could result in a default under the Credit Agreement or one or more of our other loan facilities, which could cause all of the outstanding indebtedness under such agreements to become immediately due and payable by us and/or enable the applicable lender to terminate all commitments to extend further credit. If we are forced to refinance these borrowings on less favorable terms or if cannot refinance these borrowings, our results of operations and financial condition could be adversely affected. In addition, if we were unable to repay the outstanding indebtedness upon a default, our lenders could proceed against the assets pledged as collateral to secure that indebtedness. Any acceleration of the amounts due under the Credit Agreement, or the exercise by the applicable lenders or agent of their rights under the related security documents, would likely have a material adverse effect on our business.
Our indebtedness may adversely affect our business, results of operations and financial condition.
Our indebtedness could adversely affect our business, results of operations and financial condition by, among other things:
In addition, we may not be able to generate sufficient cash flow from our operations to repay our outstanding indebtedness when it becomes due and to meet our other cash needs or to comply with the financial covenants set forth therein. If we are not able to pay our debts as they become due, we could be in default of the Credit Agreement or other indebtedness. We might also be required to pursue one or more alternative strategies to repay indebtedness, such as selling assets, refinancing or restructuring our indebtedness or obtaining additional debt financing or selling equity securities on terms that may be onerous or highly dilutive. We may not be able to refinance our debt or sell additional debt or equity securities or our assets on favorable terms, if at all, and if we must sell assets, it may negatively affect our ability to generate revenues.
The fluctuation of foreign currency exchange rates could materially harm our financial results.
Since we conduct a significant portion of our operations internationally, our business is subject to foreign currency risks, including currency exchange rate fluctuations. The exchange rates are affected by, among other things, changes in political and economic conditions. For example, an increase in our TurkeyTürkiye sales and operations will result in a larger portion of our net sales and expenditures being denominated in the Euro and Turkish Lira. Significant fluctuations in the exchange rate between the Turkish Lira and the U.S. dollar, the Turkish Lira and the Euro or the Euro and the U.S. dollar may adversely affect our revenue, expenses, as well as the value of our assets and liabilities. To the extent our future revenues and expenses are generated outside of the United StatesU.S. in currencies other than the U.S. dollar, including the Euro, the Turkish Lira, the Chinese Renminbi, Mexican Peso or India Rupee, among others, we will be
23
subject to increased risks relating to foreign currency exchange rate fluctuations which could materially harm our business, financial condition and operating results.
24
Our manufacturing operations and future growth are dependent upon the availability of capital, which may be insufficient to support our capital expenditures.
Our current wind blade manufacturing activities and future growth will require substantial capital investment. For the years ended December 31, 20202023 and 2019,2022, our capital expenditures, including those related to discontinued operations, were $65.8$36.1 million and $80.2$18.8 million, respectively, including assets acquired under finance leases in 20202023 and 20192022 of $0.2$0.8 million and $5.8$0.2 million, respectively. We have recently entered into lease agreements with third partiesplan to lease new manufacturing facilities in China, India and Mexico. Major projects expected to be undertaken include purchasing equipment for our new manufacturing facility in Chennai, India and themake continued investmentinvestments in our Turkey,U.S., Türkiye, Mexico, China and IowaIndia facilities. Our ability to grow our business is predicated upon us making significant additional capital investments to expand our existing manufacturing facilities and build and operate new manufacturing facilities in existing and new markets. We generally estimate that the startup of amarkets or access capital to acquire new multi-line manufacturing facility requires cash for net operating expenses and working capital of between $20 million to $25 million and additional capital expenditures primarily for machinery and equipment of between $40 million to $50 million. In addition, we estimate our annual maintenance capital expenditures to be between $1 million to $3 million per facility.businesses. We may not have the capital to undertake these capital investments. In addition, our capital expenditures may be significantly higher if our estimates of future capital investments are incorrect and may increase substantially if we are required to undertake actions to comply with new regulatory requirements or compete with new technologies. The cost of some projects may also be affected by foreign exchange rates if any raw materials or other goods must be paid for in foreign currency. We cannot assure you that we will be able to raise funds on favorable terms, if at all, or that future financings would not be dilutive to holders of our capital stock. We also cannot assure you that completed capital expenditures will yield the anticipated results. IfThe Credit Agreement contains covenants that limit the amount of capital expenditures that we can make, and if we raise additional funds by obtaining loans from third parties, the terms of those financing arrangements may include negative covenants, or other restrictions on our business that could impair our operational flexibility and would require us to fund additional interest expense. If we are unable to obtain sufficient capital at a reasonable cost or at all, we may not be able to expand production sufficientlyour business to take advantage of changes in the marketplace or may be required to delay, reduce or eliminate some or all of our current operations, which could materially harm our business, operating results and financial condition.
As a U.S. corporation with international operations, we are subject toOur business and reputation could be adversely impacted by any violations of the U.S. Foreign Corrupt PracticesFCPA, the U.K. Bribery Act, of 1977, which could impact our ability to compete in certain jurisdictions.and other foreign anti-corruption laws.
As a U.S. corporation, we are subject to the FCPA, which generally prohibits U.S. companies and their intermediaries from making improper payments to foreign officials for the purpose of obtaining or keeping business. Other countries in which we operate also have anti-corruption laws, some of which prohibit improper payments to government and non-government persons and entities, and others extend their application to activities outside their country of origin. We have manufacturing facilities in China, Mexico, TurkeyTürkiye and India, countries with a fairly high risk of corruption. Those facilities are subject to routine government oversight. In addition, a number of our raw materials and components suppliers are state-owned, particularly in China. Moreover, due to our need to import raw materials across international borders, we also routinely have interactions, directly or indirectly, with customs officials. In many foreign countries, under local custom, businesses engage in practices that may be prohibited by the FCPA or other similar laws and regulations. Additionally, we continue to hire employeesassociates around the world as we continue to expand.support our international operations. Although we have implemented certain policies, procedures and controls designed to ensure compliance with the FCPA and similar laws, there can be no guarantee that all of our employeesassociates and agents, as well as those companies to which we outsource certain of our business operations, have not taken and will not take actions that violate our policies and the FCPA or other anti-corruption laws, which could subject us to fines, penalties, disgorgement, and loss of business, harm our reputation and impact our ability to compete in certain jurisdictions. In addition, these laws are complex and far-reaching in nature, and, as a result, we may be required in the future to alter one or more of our practices to be in compliance with these laws or any changes in these laws or the interpretation thereof. Moreover, our competitors may not be subject to the FCPA or comparable legislation,similar laws, which could provide them with a competitive advantage in some jurisdictions.
Effective internal controls are necessary for us to provide reliable financial reports and effectively address fraud risks.
We maintain a system of internal controls to provide reasonable assurance regarding the reliability of financial reporting and the preparation of financial statements for external purposes in accordance with U.S. generally accepted accounting principles (GAAP). The process of designing and implementing effective internal controls is a
24
continuous effort that requires us to anticipate and react to changes in our business and the economic and regulatory
25
environments and to expend significant resources to establish and maintain a system of internal controls that will be adequate to satisfy the reporting obligations of a public company. The effectiveness of our internal controls depends in part on the cooperation of senior managers worldwide.
Any system of controls, however well designed and operated, can provide only reasonable, and not absolute, assurance that the objectives of the system are met. Any failure to maintain that system, or consequent inability to produce accurate financial statements on a timely basis, could increase our operating costs and harm our business, and lead to our becoming subject to litigation, sanctions or investigations by The NASDAQ Global Market (NASDAQ), the SEC or other regulatory governmental agencies and bodies. Furthermore, investors’ perceptions that our internal controls are inadequate or that we are unable to produce accurate financial statements on a timely basis may harm our stock price.
Our indebtedness may adversely affect our business, results of operations and financial condition.
Our indebtedness could adversely affect our business, results of operations and financial condition by, among other things:
|
|
|
|
|
|
|
|
|
|
|
|
|
|
In addition, we may not be able to generate sufficient cash flow from our operations to repay our outstanding indebtedness when it becomes due and to meet our other cash needs or to comply with the financial covenants set forth therein. If we are not able to pay our debts as they become due, we could be in default under our senior secured credit facility or other indebtedness. We might also be required to pursue one or more alternative strategies to repay indebtedness, such as selling assets, refinancing or restructuring our indebtedness or selling additional debt or equity securities. We may not be able to refinance our debt or sell additional debt or equity securities or our assets on favorable terms, if at all, and if we must sell assets, it may negatively affect our ability to generate revenues.
Much of our intellectual property consists of trade secrets and know-how that is very difficult to protect. If we experience loss of protection for our trade secrets or know-how, our business would be substantially harmed.
We have a variety of intellectual propertyIP rights, including patents, trademarks and copyrights, but much of our most important intellectual propertyIP rights consist of trade secrets and know-how and effective intellectual propertyIP protection may be unavailable, limited or outside the scope of the intellectual propertyIP rights we pursue in the United StatesU.S. and in foreign countries such as China where we operate. Although we strive to protect our intellectual propertyIP rights, there is always a risk that our trade secrets or know-how will be compromised or that a competitor could lawfully reverse-engineer our technology or independently develop similar or more efficient technology. We have confidentiality agreements with each of our customers, suppliers, key employeesassociates and
26
independent contractors in place to protect our intellectual propertyIP rights, but it is possible that a customer, supplier, employeeassociate or contractor might breach the agreement, intentionally or unintentionally. For example, we believe a key former employee may have shared some of our intellectual property with a competitor in China and this former employee or the competitor may use this intellectual property to compete with us in the future. It is also possible that our confidentiality agreements with customers, suppliers, employeesassociates and contractors will not be effective in preserving the confidential nature of our intellectual propertyIP rights. The patents we own could be challenged, invalidated, narrowed or circumvented by others and may not be of sufficient scope or strength to provide us with any meaningful protection or commercial advantage. Once our patents expire, or if they are invalidated, narrowed or circumvented, our competitors may be able to utilize the inventions protected by our patents. Additionally, the existence of our intellectual propertyIP rights does not guarantee that we will be successful in any attempt to enforce these rights against third parties in the event of infringement, misappropriation or other misuse, which may materially and adversely affect our business. Because our ability to effectively compete in our industry depends upon our ability to protect our proprietary technology, we might lose business to competitors and our business, revenue, operating results and prospects could be materially harmed if we suffer loss of trade secret and know-how protection or breach of our confidentiality agreements.
We may be subject to significant liabilities and costs relating to environmental and health and safety requirements.
We are subject to various environmental, health and safety laws, regulations and permit requirements in the jurisdictions in which we operate governing, among other things, health, safety, pollution and protection of the environment and natural resources, the handling and use of hazardous substances, the generation, storage, treatment and disposal of wastes, and the cleanup of any contaminated sites. In June 2018, Iowa’s Occupational Safety and Health Administration, a division of the Iowa Department of Labor, issued a citation and notification of penalty to us alleging that certain of our workplace practices and conditions at our Newton, Iowa wind blade manufacturing facility had violated the Iowa Occupational Safety and Health Act. Specifically, the citation cited us for multiple alleged violations and proposed that we pay an aggregate penalty of $0.2 million. In March 2019, we entered into a settlement agreement with the Iowa Department of Labor pursuant to which we agreed to make a settlement payment of $0.1 million and to implement certain safety enhancements at our Newton, Iowa manufacturing facility to fully resolve this matter.
We have incurred, and expect to continue to incur, capital and operating expenditures to comply with such laws, regulations and permit requirements. While we believe that we currently are in material compliance with all such laws, regulations and permit requirements, any noncompliance may subject us to a range of enforcement measures, including the imposition of monetary fines and penalties, other civil or criminal sanctions, remedial obligations, and the issuance of compliance requirements restricting our operations.
There can be no assurance that we will not in the future become subject to compliance requirements, obligations to undertake cleanup or related activities, or claims or proceedings relating to environmental, health or safety matters, hazardous substances or wastes, contaminated sites, or other environmental or natural resource damages, that could impose significant liabilities and costs on us and materially harm our business, operating results or financial condition.
27
Claims that we infringe, misappropriate or otherwise misuse the intellectual property rights of others could subject us to significant liability and disrupt our business.
Our competitors and third-party suppliers of components and raw materials used in our products protect their intellectual property rights by means such as trade secrets and patents. In the future we may be sued for violations of other parties’ intellectual property rights, and the risk of this type of lawsuit will likely increase as our size, geographic presence and market share expand and as the number of competitors in our market increases. Any such claims or litigation, whether meritorious or not, could disrupt our business and materially harm our operating results and financial condition. In addition, intellectual property disputes have in the past arisen between our customers which negatively affected such customers’ demand for wind blades manufactured by us. If such intellectual property disputes involving, or between, one or more of our customers should arise in the future, our business could be materially harmed.
25
Work disruptions resulting from our collective bargaining agreements could result in increased operating costs and materially harm our business, operating results and financial condition.
Certain of our employeesassociates in TurkeyTürkiye and Matamoros, Mexico, which in the aggregate represented approximately 38%37% of our workforce as of December 31, 2020,2023, are covered by collective bargaining agreements.
We have separate collective bargaining agreements for each of our Matamoros, Mexico manufacturing facilities. Our collective bargaining agreement at one of our Matamoros, Mexico manufacturing facilities is in effect through March 2025. Our collective bargaining agreement for our Turkey facilities areother facility in Matamoros, Mexico that we took over from Nordex in July 2021, pursuant to a 3-year supply agreement, is in effect through April 2025.
In July 2022, we experienced a brief labor disruption in our Türkiye manufacturing facilities as we worked with the endunion to address the inflationary pressures on wages. Our Türkiye manufacturing facilities have experienced significant wage inflation over the course of 2020the past year. For example, the government of Türkiye increased minimum wages approximately 55%, 34% and we are in the process of negotiating an amendment for calendar year 2021. In March 2018, we entered into a49%, respectively, effective January 1, 2023; July 1, 2023; and January 1, 2024. Our collective bargaining agreement with a labor union for certain of our employeesTürkiye facilities is in our Matamoros, Mexico facility. In January 2019, thousands of workers employed in dozens of manufacturing facilities in Matamoros, Mexico, went on strike. In general, these workers, who were represented by several different labor unions, demanded an increase in their wage rate and an annual bonus. In February 2019, our manufacturing production employees in Matamoros, Mexico, who are represented by a labor union, went on strike also demanding an increase in their hourly wage rate and the payment of an annual bonus. During this strike, our Matamoros manufacturing facility stopped production for several weeks until we reached a revised agreement with our labor union. We recently amended our Matamoros collective bargaining agreement to adjust the salaries and bonuses payable to our associates for calendar year 2021 that are covered by this agreement.effect through December 2024.
Additionally, our other employeesassociates working at other manufacturing facilities may vote to be represented by a labor union in the future. There can be no assurance that we will not experience labor disruptions such as work stoppages or other slowdowns by workers at any of our facilities. Should significant industrial action, threats of strikes or related disturbances occur, or other challenges with negotiating and extending our collective bargaining agreements with our unionized associates, we could experience further disruptions of operations and increased labor costs in Turkey,Türkiye, Mexico or other locations, which could materially harm our business, operating results or financial condition. Any such work stoppage or slow-down at any of our facilities could also result in additional expenses and possible loss of revenue for us.
Our information technology infrastructure could experience serious failures or disruptions,cyber security attacks, the failure of which could materially harm our business, operating results and financial condition.
Information technology is part of our business strategy and operations. It enables us to streamline operation processes, facilitate the collection and reporting of business data, and provide for internal and external communications. There are risks that information technology system failures, network disruptions, breaches of data security and phishing and ransomware attacks could disrupt our operations. Any significant disruption or breach may materially harm our business, operating results orand financial condition.
We are faced with increasingly complex tax issues in many jurisdictions, and we could be obligated to pay additional taxes in various jurisdictions.
We may be subject to taxation in many jurisdictions in the United States and around the world with increasingly complex tax laws, the application of which can be uncertain. The amount of taxes we pay in these jurisdictions could increase substantially as a result of changes in the applicable tax laws, including increased tax rates or revised interpretations of existing tax laws and precedents, which could harm our liquidity and operating results. In addition, the taxing authorities in these jurisdictions could review our tax returns, or authorities in jurisdictions in which we do not file tax returns could assert that we are subject to tax in those jurisdictions, and in
28
either case could impose additional tax, interest and penalties. Further, the authorities could claim that various withholding requirements apply to us or our subsidiaries or assert that benefits of tax treaties are not available to us or our subsidiaries, or that our transfer pricing arrangements with our foreign subsidiaries are improper, any of which could have a material adverse impact on us and the results of our operations.
Risks Related to Ownership of Our Common Stock
The price of our common stock may fluctuate substantially and your investment may decline in value.
The market price of our common stock is likely to be highly volatile and may fluctuate substantially due to many factors, including:
| • actual or anticipated fluctuations in our results of operations; • our ability to provide products due to shipments subject to delayed delivery and deferred revenue arrangements; • loss of or changes in our relationship with one or more of our customers; • failure to meet our earnings estimates; • conditions and trends in the energy and manufacturing markets in which we operate and changes in estimates of the size and growth rate of these markets; • announcements by us or our competitors of significant contracts, developments, acquisitions, strategic partnerships or divestitures; • availability of equipment, labor and other items required for the manufacture of wind blades; 26 • changes in governmental policies; • our ability to successfully grow our automotive business; • additions or departures of members of our senior management or other key personnel; • changes in market valuation or earnings of our competitors; • sales of our common stock, including sales of our common stock by our directors and officers or by our other principal stockholders; • the trading volume of our common stock; and • general market, industry and economic conditions.
|
|
|
|
|
|
|
|
|
|
|
|
|
|
|
|
|
|
|
|
|
|
|
|
|
|
|
|
These broad market and industry factors may materially harm the market price of our common stock, regardless of our operating performance. In the past, securities class-action litigation has often been instituted against a company following periods of volatility in the market price of that company’s securities. Securities class-action litigation, if instituted against us, could result in substantial costs or damages and a diversion of management’s attention and resources, which could materially harm our business and operating results.
A significant portion of our total outstanding shares may be sold into the public market in future sales, which could cause the market price of our common stock to drop significantly, even if our business is doing well.
Sales of a substantial number of shares of our common stock in the public market can occur at any time. These sales, or the market perception that the holders of a large number of shares intend to sell shares, could reduce the market price of our common stock. As of December 31, 2020,2023, we had 36,563,79846,471,131 shares of common stock outstanding. In addition, Oaktree owns approximately 9.9% of our outstanding common stock. All of the shares held by Oaktree can now be sold, subject to any applicable volume limitations under federal securities laws. We may issue debt or equity securities under our automatic shelf registration statement, which we filed in September 2020, or in other registered or unregistered convertible debt or equity offerings.
In the future, we may also issue our securities in connection with investments or acquisitions. The amount of shares of our common stock issued in connection with an investment or acquisition could constitute a material
29
portion of our then-outstanding shares of our common stock. Any issuance of additional securities in connection with investments or acquisitions may result in additional dilution to you and may cause the market price of our common stock to drop significantly.
The exercise of options and warrants and other issuances of shares of common stock or securities convertible into common stock under our equity compensation plans will dilute your interest.
Under our existing equity compensation plans, as of December 31, 2020,2023, we had outstanding options to purchase 1,499,5861,212,503 shares of our common stock, 668,4541,516,377 restricted stock units and 650,523308,741 performance stock units to our employeesassociates and non-employee directors. From time to time, we expect to grant additional options and other stock awards. The exercise of options and warrants at prices below the market price of our common stock could adversely affect the price of shares of our common stock. Additionally, any issuance of our common stock that is not made solely to then-existing stockholders proportionate to their interests, such as in the case of a stock dividend or stock split, will result in dilution to each stockholder by reducing their percentage ownership of the total outstanding shares. If we issue options or warrants to purchase our common stock in the future and those options or warrants are exercised or we issue stock, stockholders may experience further dilution.
We have indebtedness in the form of convertible senior notes, which could adversely affect our financial health and our ability to respond to changes in our business.
In March 2023, we issued and sold an aggregate of $132.5 million principal amount of convertible senior unsecured notes due in 2028 (the Notes) in a private placement offering. Our ability to repay our indebtedness, including the Notes, is significantly dependent on our generation of cash flow. Our indebtedness could have significant negative consequences for our security holders and our business, results of operations and financial condition by, among other things:
27
Our business may not generate sufficient funds, and we may otherwise be unable to maintain sufficient cash reserves, to pay amounts due under our indebtedness, including the notes, and our cash needs may increase in the future.
Conversions or exchanges of our convertible senior notes may dilute the ownership interest of our stockholders or may otherwise affect the market price of our Common Stock.
The conversion of some or all the Notes will dilute the ownership interests of our stockholders to the extent we deliver shares of common stock upon conversion of any of the Notes. The notes may from time to time be convertible at the option of their holders prior to their scheduled terms under certain circumstances. On conversion of the Notes, we have the option to pay or deliver, as the case may be, cash, shares of our common stock, or a combination of cash and shares of our common stock. If we elect to settle our conversion obligation in shares of our common stock or a combination of cash and shares of our common stock, any sales in the public market of our common stock issuable on such conversion could adversely affect prevailing market prices of our common stock. In addition, the existence of the Notes may encourage short selling by market participants because the conversion of the Notes could be used to satisfy short positions, or anticipated conversion of the Notes into shares of our common stock, any of which could depress the market price of our common stock.
The Capped Call Transactions may affect the value of the Notes and our common stock.
In connection with the Notes’ issuance, we entered into capped call transactions with certain financial institutions (option counterparties). The capped call transactions are generally expected to reduce the potential dilution of our common stock upon any conversion of the Notes and/or offset any cash payments we are required to make in excess of the principal amount of converted Notes, with such reduction and/or offset subject to a cap. From time to time, the option counterparties or their respective affiliates may modify their hedge positions by entering into or unwinding derivative transactions with respect to our common stock and/or purchasing or selling our common stock or other securities of ours in secondary market transactions before the maturity of the Notes. This activity could cause a decrease in the market price of our common stock.
We are subject to counterparty risk with respect to the capped call transactions.
The counterparties to the capped call transactions entered into in connection with the offering of the Notes are financial institutions, and we are subject to the risk that one or more of the counterparties may default or otherwise fail to perform, or may exercise certain rights to terminate, their obligations under the capped call transactions. Our exposure to the credit risk of the counterparties will not be secured by any collateral. Global economic conditions have in the past resulted in the actual or perceived failure or financial difficulties of many financial institutions. If a counterparty to one or more capped call transactions becomes subject to bankruptcy or other insolvency proceedings, we will become an unsecured creditor in those proceedings with a claim equal to our exposure at the time under such transactions. Our exposure will depend on many factors but, generally, our exposure will increase if the market price or the volatility of our common stock increases. In addition, upon a default or other failure to perform, or a termination of obligations, by a counterparty, the counterparty may fail to deliver the shares of our common stock or cash required to be delivered to us under the capped call transactions and we may suffer adverse
28
tax consequences or experience more dilution than we currently anticipate with respect to our common stock. We can provide no assurances as to the financial stability or viability of the counterparties.
Provisions of Delaware law or our charter documents could delay or prevent an acquisition of our company,Company, even if the acquisition would be beneficial to our stockholders and could make it more difficult for you to change management.
Provisions of Delaware law and our amended and restated certificate of incorporation and amended and restated by-laws may discourage, delay or prevent a merger, acquisition or other change in control that stockholders may consider favorable, including transactions in which stockholders might otherwise receive a premium for their shares. These provisions may also prevent or delay attempts by stockholders to replace or remove our current management or members of our board of directors. These provisions include: a classified board of directors; limitations on the removal of directors; advance notice requirements for stockholder proposals and nominations; the inability of stockholders to act by written consent or to call special meetings; the ability of our board of directors to make, alter or repeal our amended and restated by-laws; and the authority of our board of directors to issue preferred stock with such terms as our board of directors may determine.
The affirmative vote of the holders of at least 75% of our shares of capital stock entitled to vote, and not less than 75% of the outstanding shares of each class entitled to vote thereon as a class, is necessary to amend or repeal the above provisions that are contained in our amended and restated certificate of incorporation. In addition, absent approval of our board of directors, our amended and restated by-laws may only be amended or repealed by the affirmative vote of the holders of at least 75% of our shares of capital stock entitled to vote.
In addition, we are subject to the provisions of Section 203 of the Delaware General Corporation Law, which limits business combination transactions with stockholders of 15% or more of our outstanding voting stock that our board of directors has not approved. These provisions and other similar provisions make it more difficult for stockholders or potential acquirers to acquire us without negotiation. These provisions may apply even if some stockholders may consider the transaction beneficial to them.
As a result, these provisions could limit the price that investors are willing to pay in the future for shares of our common stock. These provisions might also discourage a potential acquisition proposal or tender offer, even if the acquisition proposal or tender offer is at a premium over the then current market price for our common stock.
30
Item 1B. Unresolved Staff Comments
None.
Item 1C. Cybersecurity
Risk Management and Strategy
We have instituted policies and processes dedicated to assessing, identifying, and managing risks from cybersecurity threats. Cybersecurity risks are managed as part of our enterprise risk management program. We are committed to safeguarding our critical information assets and data and have implemented a defense-in-depth strategy that is informed by industry standard cybersecurity frameworks. We benchmark against these frameworks and our internal risk assessment process to inform how we identify, protect, detect, respond to, and recover from risks, threats, vulnerabilities, and cybersecurity incidents across our information assets.
We incorporate reputable third-party vendors and solutions into our cyber risk management strategies to fortify our cyber defense mechanisms. We collaborate with internal stakeholders across the Company to integrate cybersecurity principles into our operations, including deployment of multiple layers of cybersecurity defenses, restricted access based on business need, and integrity of our business information. We also train our employees during onboarding and annually thereafter on matters including cybersecurity awareness, confidential information protection, and phishing attacks.
29
We actively enhance our cybersecurity program through testing by third-party assessors and measure the results against industry standards. We also have standing engagements with incident response experts and external counsel to provide timely support to our incident response capabilities, and we regularly engage with external experts to analyze the threat landscape.
Our cybersecurity risk management is integrated into our business continuity program and enterprise risk management framework, which promotes proactive planning and preparedness to address potential threats. Members of our global information security team collaborate with subject matter experts within our organization to assess and refine our cybersecurity posture and incident response and preparedness, including evaluating and updating contingency plans, participating in tabletop exercises, threat hunting, red team engagements, and simulating real-world scenarios related to cyber incidents.
Although risks from cybersecurity threats have to date not materially affected us, and we do not believe they are reasonably likely to materially affect our Company, business strategy, results of operations or financial condition, we could, from time to time, experience threats and security incidents relating to our and our third party vendors’ information systems. For more information, please see the section entitled “Risk Factors” included in Part I, Item 1A of this Annual Report on Form 10-K.
Governance
Our board of directors is responsible for monitoring and assessing strategic risk exposure, and administers its cybersecurity risk oversight function through the Audit Committee. The Audit Committee receives quarterly updates on our enterprise risk management program, including information on cybersecurity risks and initiatives undertaken to identify, assess and mitigate such risks.
Our chief information security officer is the senior director responsible for the cybersecurity organization, which has primary oversight of material risks from cybersecurity threats. Our chief information security officer reports to our chief information officer. Our chief information officer is responsible for the overall Information Technology (IT) organization.
Our chief information officer and chief information security officer assess our cybersecurity readiness through internal assessment tools, as well as third-party assessments, audits, penetration tests, and evaluation against industry standards. We have governance and compliance structures that are designed to elevate issues relating to cybersecurity to our chief information officer and chief information security officer, as appropriate.
Our chief information officer meets with the Audit Committee each quarter to review our information technology systems and discuss key cybersecurity risks. In addition, at least annually, the chief financial officer reviews with the board of directors our global enterprise risk management program, which includes cybersecurity risks.
30
Item 2. Properties
Our headquarters is located in Scottsdale, Arizona, and we own or lease various other facilities in the United States, China,U.S., Mexico, Turkey,Türkiye, India, Denmark, Germany and Germany.Spain. We believe that our properties are generally in good condition, are well maintained and are generally suitable and adequate to carry out our business at expected capacity for the foreseeable future. The table below lists various information regarding our facilities as of February 24, 2021:22, 2024:
|
| Operating |
| Year |
| Leased or |
| Approximate |
|
|
| |
Location |
| Segment |
| Commenced |
| Owned |
| Square Footage |
|
| Description of Use | |
Newton, IA, United States |
| U.S. |
| 2008 |
| Leased |
|
| 337,922 |
|
| Wind Blade Manufacturing Facility |
Newton, IA, United States |
| U.S. |
| 2018 |
| Leased |
|
| 114,078 |
|
| Transportation Manufacturing Facility |
Dafeng, China |
| Asia |
| 2013 |
| Leased |
|
| 381,102 |
|
| Wind Blade Manufacturing Facility |
Dafeng, China |
| Asia |
| 2015 |
| Leased |
|
| 446,034 |
|
| Wind Blade Manufacturing Facility |
Taicang Port, China |
| Asia |
| 2007 |
| Owned |
|
| 208,445 |
|
| Precision Molding Facility |
Yangzhou, China |
| Asia |
| 2018 |
| Leased |
|
| 934,133 |
|
| Wind Blade Manufacturing Facility |
Juárez, Mexico |
| Mexico |
| 2013 |
| Leased |
|
| 345,984 |
|
| Wind Blade Manufacturing Facility |
Juárez, Mexico |
| Mexico |
| 2016 |
| Leased |
|
| 453,096 |
|
| Wind Blade Manufacturing Facility |
Juárez, Mexico |
| Mexico |
| 2017 |
| Leased |
|
| 339,386 |
|
| Wind Blade Manufacturing Facility |
Juárez, Mexico |
| Mexico |
| 2018 |
| Leased |
|
| 300,277 |
|
| Precision Molding Manufacturing Facility |
Matamoros, Mexico |
| Mexico |
| 2017 |
| Leased |
|
| 527,442 |
|
| Wind Blade Manufacturing Facility |
Izmir, Turkey |
| EMEA |
| 2012 |
| Leased |
|
| 343,000 |
|
| Wind Blade Manufacturing Facility |
Izmir, Turkey |
| EMEA |
| 2015 |
| Leased |
|
| 817,078 |
|
| Wind Blade Manufacturing Facility |
Warren, RI, United States |
| U.S. |
| 2004 |
| Leased |
|
| 108,750 |
|
| Precision Molding Development and Manufacturing and Research and Development Facility, Transportation Manufacturing Facility |
Santa Teresa, NM, United States |
| Mexico |
| 2014 |
| Leased |
|
| 503,710 |
|
| Wind Blade Storage Facility |
Scottsdale, AZ, United States |
| U.S. |
| 2015 |
| Leased |
|
| 22,508 |
|
| Corporate Headquarters |
Kolding, Denmark |
| U.S. |
| 2018 |
| Leased |
|
| 2,583 |
|
| Advanced Engineering Center |
Chennai, India |
| India |
| 2019 |
| Leased |
|
| 776,280 |
|
| Wind Blade Manufacturing Facility |
Berlin, Germany |
| U.S. |
| 2019 |
| Leased |
|
| 4,684 |
|
| Engineering Center |
|
| Operating |
| Year |
| Leased or |
| Approximate |
|
|
| |
Location |
| Segment |
| Commenced |
| Owned |
| Square |
|
| Description of Use | |
Newton, IA, U.S. |
| U.S. |
| 2008 |
| Leased |
|
| 337,922 |
|
| Wind Blade Manufacturing Facility |
Juárez, Mexico |
| Mexico |
| 2013 |
| Leased |
|
| 345,984 |
|
| Wind Blade Manufacturing Facility |
Juárez, Mexico |
| Mexico |
| 2016 |
| Leased |
|
| 453,096 |
|
| Wind Blade Manufacturing Facility |
Juárez, Mexico |
| Mexico |
| 2016 |
| Leased |
|
| 339,386 |
|
| Wind Blade Manufacturing Facility |
Matamoros, Mexico |
| Mexico |
| 2017 |
| Leased |
|
| 527,442 |
|
| Wind Blade Manufacturing Facility |
Juárez, Mexico |
| Mexico |
| 2018 |
| Leased |
|
| 300,277 |
|
| Precision Molding Manufacturing and |
Matamoros, Mexico |
| Mexico |
| 2021 |
| Leased |
|
| 557,491 |
|
| Wind Blade Manufacturing Facility |
Izmir, Türkiye |
| EMEA |
| 2012 |
| Leased |
|
| 343,000 |
|
| Wind Blade Manufacturing Facility |
Izmir, Türkiye |
| EMEA |
| 2015 |
| Leased |
|
| 817,078 |
|
| Wind Blade Manufacturing Facility |
Warren, RI, U.S. |
| U.S. |
| 2004 |
| Leased |
|
| 108,750 |
|
| Precision Molding Manufacturing, |
Santa Teresa, NM, U.S. |
| Mexico |
| 2014 |
| Leased |
|
| 503,710 |
|
| Wind Blade Storage Facility |
Kolding, Denmark |
| U.S. |
| 2018 |
| Leased |
|
| 2,583 |
|
| Advanced Engineering Center |
Chennai, India |
| India |
| 2019 |
| Leased |
|
| 776,280 |
|
| Wind Blade Manufacturing Facility |
Madrid, Spain |
| EMEA |
| 2021 |
| Leased |
|
| 26,124 |
|
| Wind Blade Services Facility |
Scottsdale, AZ, U.S. |
| U.S. |
| 2023 |
| Leased |
|
| 12,993 |
|
| Corporate Headquarters |
Berlin, Germany |
| U.S. |
| 2023 |
| Leased |
|
| 4,239 |
|
| Engineering Center |
Des Moines, IA, U.S. |
| U.S. |
| 2023 |
| Leased |
|
| 26,640 |
|
| Wind Blade Services Facility |
Item 3. Legal Proceedings
For a discussion of our legal proceedings, refer to Note 1417 – Commitments and Contingencies – (b) Legal Proceedings of the Notes to Consolidated Financial Statements in Part II, Item 8 of this Annual Report on Form 10-K.
Item 4. Mine Safety Disclosures
Not applicable.
31
PART II
Item 5. Market for Registrant’s Common Equity, Related Stockholder Matters and Issuer Purchases of Equity Securities
Market Information
On July 22, 2016, our common stock began trading on NASDAQ under the symbol “TPIC.” Prior to that time, there was no public market for our stock.
Performance Graph
The following graph and table illustrate the total stockholder return from July 22, 2016 through December 31, 2020,2023, on our common stock, the Russell 2000 Index, the S&P Small Cap 600 Energy (Sector) Index and the NASDAQ Clean Edge Green Energy Index, assuming an investment of $100.00 on July 22, 2016 including the reinvestment of dividends.

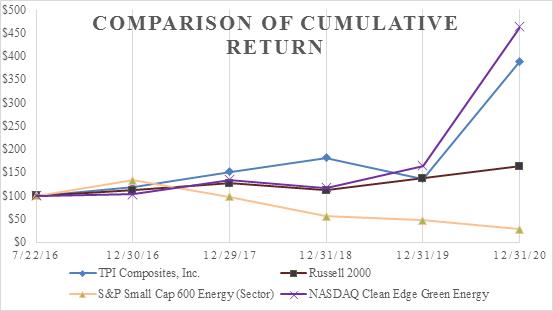
|
| Base Period |
|
|
|
|
|
|
|
|
|
|
|
|
|
|
|
|
|
|
|
|
|
|
|
|
| |||||||||
|
| 7/22/16 |
|
| 12/30/16 |
|
| 12/29/17 |
|
| 12/31/18 |
|
| 12/31/19 |
|
| 12/31/20 |
|
| 12/31/21 |
|
| 12/30/22 |
|
| 12/29/23 |
| |||||||||
TPI Composites, Inc. |
| $ | 100.00 |
|
| $ | 118.29 |
|
| $ | 150.88 |
|
| $ | 181.27 |
|
| $ | 136.50 |
|
| $ | 389.23 |
|
| $ | 110.32 |
|
| $ | 74.78 |
|
| $ | 30.53 |
|
Russell 2000 |
|
| 100.00 |
|
|
| 111.89 |
|
|
| 126.60 |
|
|
| 111.19 |
|
|
| 137.56 |
|
|
| 162.82 |
|
|
| 185.12 |
|
|
| 145.21 |
|
|
| 167.13 |
|
S&P Small Cap 600 Energy (Sector) |
|
| 100.00 |
|
|
| 133.11 |
|
|
| 97.60 |
|
|
| 55.64 |
|
|
| 47.19 |
|
|
| 28.17 |
|
|
| 44.86 |
|
|
| 65.17 |
|
|
| 66.48 |
|
NASDAQ Clean Edge Green Energy |
|
| 100.00 |
|
|
| 102.59 |
|
|
| 134.16 |
|
|
| 116.50 |
|
|
| 163.93 |
|
|
| 462.91 |
|
|
| 448.76 |
|
|
| 311.51 |
|
|
| 278.55 |
|
Holders
|
| Base Period |
|
|
|
|
|
|
|
|
|
|
|
|
|
|
|
|
|
|
|
|
| |
|
| 7/22/16 |
|
| 12/30/16 |
|
| 12/29/17 |
|
| 12/31/18 |
|
| 12/31/19 |
|
| 12/31/20 |
| ||||||
TPI Composites, Inc. |
| $ | 100.00 |
|
| $ | 118.29 |
|
| $ | 150.88 |
|
| $ | 181.27 |
|
| $ | 136.50 |
|
| $ | 389.23 |
|
Russell 2000 |
| $ | 100.00 |
|
| $ | 111.89 |
|
| $ | 126.60 |
|
| $ | 111.19 |
|
| $ | 137.56 |
|
| $ | 162.82 |
|
S&P Small Cap 600 Energy (Sector) |
| $ | 100.00 |
|
| $ | 133.11 |
|
| $ | 97.60 |
|
| $ | 55.64 |
|
| $ | 47.19 |
|
| $ | 28.17 |
|
NASDAQ Clean Edge Green Energy |
| $ | 100.00 |
|
| $ | 102.59 |
|
| $ | 134.16 |
|
| $ | 116.50 |
|
| $ | 163.93 |
|
| $ | 462.91 |
|
Holders
As of January 29, 2021,31, 2024, there was one stockholderwere five stockholders of record of our common stock, although there is a much larger number of beneficial owners.
32
Dividends
We have never declared or paid any cash dividends on shares of our capital stock. We currently intend to retain earnings, if any, to finance the development and growth of our business and do not anticipate paying cash dividends on the common stock in the future. Any payment of any future dividends to holders of our common stock, will be at the discretion of the board of directors and subject to compliance with certain covenants in our loan agreements, after taking into account various factors, including our financial condition, operating results, capital requirements, restrictions contained in any future financing instruments, growth plans and other factors the board of directors deems relevant. See “Management’s Discussion and Analysis of Financial Condition and Results of Operations – Liquidity and Capital Resources” included in Part II, Item 7 of this Annual Report on Form 10-K.
Certain of our subsidiaries are limited in their ability to declare dividends without first meeting statutory restrictions of China, including retained earnings as determined under Chinese-statutory accounting requirements. Until 50% ($26.6 million) of registered capital is contributed to a surplus reserve, our China operations can only pay dividends equal to 90% of after-tax profits (10% must be contributed to the surplus reserve). Once the surplus reserve fund requirement is met, our China operations can pay dividends equal to 100% of after-tax profit assuming other conditions are met. As of December 31, 2020, the amount of the surplus reserve fund was $7.0 million. See “Management’s Discussion and Analysis of Financial Condition and Results of Operations— Liquidity and Capital Resources” included in Part II, Item 7 of this Annual Report on Form 10-K.
Securities Authorized for Issuance under Equity Compensation Plans
The information required in response to Item 201(d) of Regulation S-K is set forth in Part III, Item 12 of this Annual Report on Form 10-K which is incorporated herein by reference.
Recent Sales of Unregistered Securities
None. There were no unregistered sales of equity securities during the year ended December 31, 2023 and from the period from December 31, 2023 to the filing date of this Annual Report on Form 10-K which have not previously been disclosed in a Quarterly Report on Form 10-Q or in a Current Report on Form 8-K.
Use of Proceeds from Registered Securities
NoneNone.
Purchases of Equity Securities by the Issuer
The following table summarizes the total number of shares of our common stock that we repurchased duringDuring the three months ended December 31, 2020 from certain employees who surrendered2023 we did not repurchase any shares of our common stock to pay the taxes in connection with the vesting of restricted stock units.stock.
Period |
| Total Number of Shares Purchased |
|
| Average Price Paid per Share |
|
| Total Number of Shares Purchased as Part of Publicly Announced Program |
|
| Maximum Number of Shares That May Yet Be Purchased Under the Program |
| ||||
October (October 1 - October 31) |
|
| — |
|
| $ | — |
|
|
| — |
|
|
| — |
|
November (November 1 - November 30) |
|
| — |
|
|
| — |
|
|
| — |
|
|
| — |
|
December (December 1 - December 31) |
|
| 31,880 |
|
|
| 52.78 |
|
|
| — |
|
|
| — |
|
Total |
|
| 31,880 |
|
| $ | 52.78 |
|
|
| — |
|
|
| — |
|
Item 6. Selected Financial Data[Reserved]
Not applicable.33
33
Item 7. Management’s Discussion and Analysis of Financial Condition and Results of Operations
You should read the following discussion and analysis of our financial condition and results of operations together with our consolidated financial statements and the related notes included in Part II, Item 8 of this Annual Report on Form 10-K and other financial information appearing elsewhere in this Annual Report on Form 10-K. Some of the information contained in this discussion and analysis or set forth elsewhere in this Annual Report on Form 10-K, including information with respect to plans and strategy for our business and related financing, includes forward-looking statements that involve risks and uncertainties. Our actual results could differ materially from those described in or implied by these forward-looking statements as a result of various factors, including those discussed below and elsewhere in this Annual Report on Form 10-K, particularly those under “Risk Factors” included in Part I, Item 1A of this Annual Report on Form 10-K.
OVERVIEW
Our Company
We are the only independent manufacturer of composite wind blades for the wind energy market with a global manufacturing footprint. We deliver high-quality, cost-effective composite solutions through long term relationships with leading original equipment manufacturers in the wind and transportationautomotive markets. We also provide field service inspection and repair services to our OEM customers and wind farm owners and operators, and we supply high strength, lightweight and durable composite products to the transportationautomotive market. We are headquartered in Scottsdale, Arizona and operate factories throughoutin the U.S., China, Mexico, Turkey,Türkiye, and India. We operate additional engineering development centers in Denmark and Germany.Germany and a services facility in Spain. For a further overview of our Company, refer to the discussion in “Business—Overview” included in Part I, Item 1 of this Annual Report on Form 10-K.
In December 2022, the Company committed to a restructuring plan to rebalance our organization and optimize our global manufacturing footprint. Changing economic and geopolitical factors, including increased logistics costs and tariffs imposed on components of wind turbines from China, including wind blades, has had an adverse impact on demand and profitability for our wind blades manufactured in our Chinese facilities. In connection with our restructuring plan, we ceased production at our Yangzhou, China manufacturing facility as of December 31, 2022 and are in the final stages of shutting down our business operations in China. Our business operations in China comprised the entirety of our Asia reporting segment. This shut down had a meaningful effect on our global manufacturing footprint and consolidated financial results. Accordingly, the historical results of our Asia reporting segment have been presented as discontinued operations in our Consolidated Statements of Operations and Consolidated Balance Sheets. Our China operations represented a geographic operating segment that included (1) the manufacturing of wind blades at our facilities in Dafeng, China and Yangzhou, China, (2) the manufacturing of precision molding and assembly systems at our Taicang Port, China facility and (3) wind blade inspection and repair services. The following discussion reflects continuing operations only, unless otherwise indicated. For further information regarding our discontinued operations, refer to Note 2 – Discontinued Operations of the Notes to Consolidated Financial Statements in Part II, Item 8 of this Annual Report on Form 10-K.
Our business operations are defined geographically into five geographicfour operating segments - (1) the United States (U.S.)U.S., (2) Asia,Mexico, (3) Mexico, (4) Europe, the Middle East and Africa (EMEA) and (5)(4) India. For further information regarding our operating segments, refer to Note 1922 – Segment Reporting of the Notes to Consolidated Financial Statements in Part II, Item 8 of this Annual Report on Form 10-K.
Key Trends AffectingKEY TRENDS AND RECENT DEVELOPMENTS AFFECTING OUR BUSINESS
Geopolitical events around the world have accelerated regional needs for energy independence and security. Climate change also continues to drive the need for renewable energy solutions and net-zero carbon emissions. Over the course of the past few years, we have seen numerous government policy initiatives aimed at expanding the use of renewable energy, including the passing of the Inflation Reduction Act of 2022 (IRA) in the U.S. and several policy initiatives in the European Union (EU) that are expected to simplify regulations, speed up permitting and promote cross-border projects to accelerate climate neutrality. We expect these recent trends in governmental policy will enable long-term revenue growth in the wind industry. As the majority of our Businesswind blades are installed in the
34
U.S. and Europe, these policy trends are expected to have a material impact on our business and the pace of long-term growth.
Despite these favorable long-term policy trends, we expect reduced demand in the near term while the wind industry awaits clarity on the implementation guidance related to key components of the IRA and clarity around more robust policies in the EU. In addition, permitting, transmission, transmission queues, the ability of the broader wind industry supply chain to ramp volume, elevated interest rates and inflation, and the cost and availability of capital are further factors limiting the timing of the wind market recovery. Specific to our customers and our manufacturing lines, we ended 2023 with 37 dedicated manufacturing lines and expect to end 2024 with 36 dedicated manufacturing lines. We expect to have six manufacturing lines in startup and four manufacturing lines in transition during 2024 as our customers prepare for anticipated stronger demand beginning in 2025. Four of the manufacturing lines in startup will be in Juarez, Mexico at a previously idle manufacturing facility and two of the manufacturing lines in startup will be in Türkiye where two longer blade lines will replace three blade lines due to space considerations. The four manufacturing lines in transition will all occur in one of our Matamoros, Mexico manufacturing facilities. For the other Matamoros, Mexico facility, which is a four-line manufacturing facility we took over from Nordex in July 2021, we plan to exit this location at the end of the three-year contract on June 30, 2024. The impact of all these changes, along with near term demand reductions from one of our customers as they consider existing inventory levels and contemplate changes in geographic demand, is expected to result in 2024 sales down slightly from 2023. We expect the first half of 2024 will be down more than the second half of 2024 as the manufacturing lines in startup or transition will be ramping throughout the year.
While the accelerated pace of new product introductions within the industry over the last five years and along with the push for larger wind turbines getting to market quicker has significantly reduced the levelized cost of wind energy, it is also a contributing factor to quality issues that have surfaced in the wind industry. In early 2023, we started to see increased inspection and repair costs due to enhanced customer inspection criteria requirements. With the quality issues in the wind industry that have been in the public eye over the course of this last year, most of our customers, and some of their customers, are requiring additional quality control checks and measures that are adding cost and time to the production process. In 2023, the Company was impacted by the following costs related to quality issues:
Our results of operations have been adversely impacted by the performance of our Matamoros, Mexico manufacturing facility that we took over from Nordex in July 2021. For example, during 2023, production had to be temporarily paused due to extreme heat and humidity issues at this facility. Net sales for the year ended December 31, 2023 were negatively impacted by approximately $17.3 million due to these lost production days. We experienced a loss from operations of $45.6 million and $40.8 million at this facility, for the years ended December 31, 2023 and 2022, respectively.
During 2023, the overall pricing for raw materials that we source modestly decreased compared to 2022. We expect raw materials pricing to continue its downward trend in 2024. With our contract structure and shared cost approach with our customers, we expect to have a net benefit from this reduction in material pricing in 2024 as compared to 2023.
Ongoing inflationary pressures have caused and may continue to cause many of our production expenses to increase, which adversely impacts our results of operations. The government of Mexico increased minimum wages approximately 20% effective January 1, 2023, and an additional 20% effective January 1, 2024. The government of Türkiye increased minimum wages approximately 55% and 34%, respectively, effective January 1, 2023 and July 1, 2023. In May 2023 we agreed to an amendment to our collective bargaining agreement with our associates in Türkiye which resulted in significantly increased wages for these associates. During 2023, these total wage increases in Türkiye have increased our labor costs at these facilities by approximately 64%, net of favorable foreign currency
35
fluctuations, compared to the same period in 2022. The government of Türkiye further increased minimum wages 49% effective January 1, 2024. While our customer contracts allow us to pass a portion of these increases to our customers, we will not be able to recover 100% of the increased labor costs caused by this wage inflation. If our manufacturing facilities in these countries continue to experience wage inflation at these levels and the increased costs in local currency are not offset with favorable foreign currency fluctuations, such elevated wages will have a material impact on our results of operations.
We have identifiedmade significant investments to expand the following material trends affectingautomotive business during the last several years. While we believe there is increasing demand for composite products for electric vehicles and we have made much progress with the automotive business, we intend to prioritize capital for growth in the wind blade business in the near term. As a result, we are in the process of exploring strategic alternatives to ensure our business:automotive business is sufficiently funded to execute on its growth strategies. We expect to complete this process no later than June 30, 2024.
We were notified on August 7, 2023 that Proterra Inc. (Proterra), one of our customers in our automotive business line, filed for bankruptcy protection under Chapter 11 of the U.S. bankruptcy code, and that Proterra had rejected its bus body supply agreement with us as part of its bankruptcy reorganization. Net sales from this bus body supply agreement were less than 2% of our consolidated net sales prior to the bankruptcy filing. As a result of the bankruptcy filing by Proterra, we recorded a charge for credit losses on contract assets of $12.8 million, a charge for credit losses on accounts receivable of $8.1 million, a charge for inventory of $1.7 million, an impairment charge of $0.7 million related to fixed assets, and severance charges totaling $0.4 million. |
|
|
|
|
|
|
34
|
|
|
|
|
|
|
|
35
|
|
|
|
COMPONENTS OF RESULTS OF OPERATIONS
Net Sales
We recognize revenue from the majority of our manufacturing services over time as our customers control the product as it is produced, and we may not use or sell the product to fulfill other customers’ contracts. Net sales include amounts billed to our customers for our products, including wind blades, precision molding and assembly systems and other products and services, as well as the progress towards the completion of the performance obligation for products in progress, which is determined on a ratio of direct costs incurred to date in fulfillment of the contract to the total estimated direct costs required to complete the performance obligation.
Cost of Goods Sold
Cost of goods sold includes the costs we incur at our production facilities to make products saleable on both products invoiced during the period as well as products in progress towards the completionsatisfaction of eachthe related performance obligation.obligations for which we have an enforceable right to payment upon termination and we may not use or sell the product to fulfill other customers’ contracts. All costs incurred at our production facilities, as well as the allocated portion to our production facilities of costs incurred at our corporate headquarters and our research facilities, are directly or indirectly related to the manufacturing of products or services and are presented in cost of goods sold. Cost of goods sold includes such items as raw materials, direct and indirect labor and facilities costs, including purchasing and receiving costs, plant management, inspection costs, production process improvement activities, product engineering and internal transfer costs. In addition, all depreciation associated with assets used in the production of our products is also included in cost of goods sold. Direct labor costs consist of salaries, benefits and other personnel related costs for employeesassociates engaged in the manufacturing of our products and services. All direct labor costs, excluding non-productive labor costs, are included in the measure of progress towards completion of the relevant performance obligation when determining revenue to be recognized during the period.
36
Startup and transition costs are primarily unallocated fixed overhead costs and underutilized direct labor costs incurred during the period production facilities are transitioning wind blade models and ramping up manufacturing. All direct labor costs are included in the measure of progress towards completion of the relevant performance obligation when determining revenue to be recognized during the period. The cost of sales for the initial wind bladesproducts from a new model manufacturing line is generally higher than when the line is operating at optimal production volume levels due to inefficiencies during ramp-up related to labor hours per blade, cycle times per blade and raw material usage. Additionally, these costs as a percentage of net sales are generally higher during the period in which a facility is ramping up to full production capacity due to underutilization of the facility. Manufacturing overhead at each of our facilities includes virtually all indirect costs (including
36
(including share-based compensation costs) incurred at the plants, including engineering, finance, information technology, human resources and plant management.
General and Administrative Expenses
General and administrative expenses primarily relate to the unallocated portion of costs incurred at our corporate headquarters and our research facilities and include salaries, benefits and other personnel related costs for employeesassociates engaged in research and development, engineering, finance, internal audit, information technology, human resources, business development, global operational excellence, global supply chain, in-house legal and executive management. Other costs include outside legal and accounting fees, risk management (insurance), share-based compensation and certain other administrative and global resources costs.
The unallocated research and development expenses incurred at our Warren, Rhode Island location as well as at our Kolding, Denmark advanced engineering center and our Berlin, Germany engineering center are also included in general and administrative expenses. For the years ended December 31, 2020, 20192023, 2022 and 2018, total2021, research and development expenses totaled $1.4 million, $1.1 million and $1.0 million, $1.0 million and $0.8 million, respectively.
Loss on Sale of Assets and Asset Impairments
Loss on sale of assets represents the losses on the sale of certain receivables, on a non-recourse basis under supply chain financing arrangements with our customers, to financial institutions and losses on the sale of other assets at our corporate and manufacturing facilities. Asset impairments represent the losses on the impairment of our assets at our corporate and manufacturing facilities.
Gain on extinguishment of Series A Preferred Stock
Gain on extinguishment of Series A Preferred Stock, par value $0.01 per share (the Series A Preferred Stock), represents the gain recognized as a result of the cashless exchange of all of the outstanding Series A Preferred Stock for the new senior secured term loan (the Term Loan) under the Credit Agreement that we entered into in December 2023. See Note 12, Debt and Note 15, Mezzanine Equity for further discussion of the gain recognized.
Restructuring Charges
Restructuring charges primarily consist of employeeassociate severance, one-time termination benefits and ongoing benefits related to the reduction of our workforce and other costs associated with exit activities, which may include costs related to leased facilities to be abandoned and facility and employeeassociate relocation costs.
Other Income (Expense)
Other income (expense) consists of interest expense on our debt borrowings and the amortization of deferred financing costs on such borrowings, foreign currency income and losses, interest income, losses on extinguishment of debt and miscellaneous income and expense.
Income Taxes
Income taxes consists of federal, state, provincial, local and foreign taxes based on income in jurisdictions in which we operate, including in the U.S., China, Mexico, TurkeyTürkiye, India and India.various countries within Europe. The income tax rate, tax provisions, deferred tax assets and liabilities vary according to the jurisdiction in which the income or loss arises. Tax laws are complex and subject to different interpretations by management and the respective governmental taxing authorities and require us to exercise judgment in determining our income tax provision, our deferred tax assets and liabilities and the valuation allowance recorded against our net deferred tax assets.
37
KEY METRICS USED BY MANAGEMENT TO MEASURE PERFORMANCE
In addition to measures of financial performance presented in our consolidated financial statements in accordance with GAAP, we use certain other financial measures and operating metrics to analyze our performance. These “non-GAAP” financial measures consist of EBITDA, adjusted EBITDA, free cash flow and net cash (debt), which help us evaluate growth trends, establish budgets, assess operational efficiencies, oversee our overall liquidity, and evaluate our overall financial performance. The key operating metrics consist of wind blade sets produced, estimated megawatts of energy capacity to be generated by wind blade sets produced, utilization, dedicated manufacturing lines, and manufacturing lines installed, which help us evaluate our operational performance. We believe that these measures are useful to investors in evaluating our performance.
Key Financial Measures
The following discussion reflects continuing operations only, unless otherwise indicated. Certain prior period amounts have been reclassified to conform to the current period's presentation.
The key financial measures as of and for the years ended December 31 are as follow: follows:
|
| 2023 |
|
| 2022 |
|
| 2021 |
| |||
|
| (in thousands) |
| |||||||||
Net sales |
| $ | 1,455,183 |
|
| $ | 1,522,741 |
|
| $ | 1,472,386 |
|
Net loss from continuing operations |
|
| (196,453 | ) |
|
| (55,550 | ) |
|
| (155,894 | ) |
EBITDA(1) |
|
| (127,910 | ) |
|
| 17,864 |
|
|
| (74,818 | ) |
Adjusted EBITDA(1) |
|
| (85,920 | ) |
|
| 37,857 |
|
|
| (20,055 | ) |
Capital expenditures(2) |
|
| 36,137 |
|
|
| 18,832 |
|
|
| 37,119 |
|
Free cash flow(1)(2) |
|
| (117,109 | ) |
|
| (81,104 | ) |
|
| (62,644 | ) |
Total debt, net of debt issuance costs |
|
| 485,193 |
|
|
| 61,173 |
|
|
| 74,646 |
|
Net cash (debt)(1) |
|
| (323,218 | ) |
|
| 82,042 |
|
|
| 167,519 |
|
|
| 2020 |
|
| 2019 |
|
| 2018 |
| |||
|
| (in thousands) |
| |||||||||
Net sales |
| $ | 1,670,137 |
|
| $ | 1,436,500 |
|
| $ | 1,029,624 |
|
Net income (loss) |
|
| (19,027 | ) |
|
| (15,708 | ) |
|
| 5,279 |
|
EBITDA(1) |
|
| 52,323 |
|
|
| 54,009 |
|
|
| 42,308 |
|
Adjusted EBITDA(1) |
|
| 94,498 |
|
|
| 85,841 |
|
|
| 68,173 |
|
Capital expenditures |
|
| 65,666 |
|
|
| 74,408 |
|
|
| 52,688 |
|
Net cash provided by (used in) operating activities |
|
| 37,570 |
|
|
| 57,084 |
|
|
| (3,258 | ) |
Free cash flow(1) |
|
| (28,096 | ) |
|
| (17,324 | ) |
|
| (55,946 | ) |
Total debt, net of debt issuance costs and discount |
|
| 216,867 |
|
|
| 141,389 |
|
|
| 137,623 |
|
Net debt(1) |
|
| (88,061 | ) |
|
| (71,779 | ) |
|
| (53,155 | ) |
|
|
EBITDA and adjusted EBITDA
We define EBITDA, a non-GAAP financial measure, as net income or loss from continuing operations plus interest expense, (including losses on extinguishment of debt and net of interest income), income taxes and depreciation and amortization. We define adjusted EBITDA as EBITDA plus any share-based compensation expense, plus or minus any foreign currency losses or income, plus or minus any losses or gains from the sale of assets and asset impairments, plus any restructuring charges. Adjusted EBITDA is the primary metric used by our management and our board of directors to establish budgets and operational goals for managing our business and evaluating our performance. In addition, our credit agreement (the Credit Agreement) that we entered into in April 2018 contains minimum EBITDA (as defined in the Credit Agreement) covenants with which we must comply. We monitor adjusted EBITDA as a supplement to our GAAP measures, and believe it is useful to present to investors, because we believe that it facilitates evaluation of our period-to-period operating performance by eliminating items that are not operational in nature, allowing comparison of our recurring core business operating results over multiple periods unaffected by differences in capital structure, capital investment cycles and fixed asset base. In addition, we believe adjusted EBITDA and similar measures are widely used by investors, securities analysts, ratings agencies, and other parties in evaluating companies in our industry as a measure of financial performance and debt-service capabilities.
Our use of adjusted EBITDA has limitations as an analytical tool and you should not consider it in isolation or as a substitute for analysis of our results as reported under GAAP. Some of these limitations are:
| • adjusted EBITDA does not reflect the net income or loss from discontinued operations; 38 • adjusted EBITDA does not reflect changes in, or cash requirements for, our working capital needs; • adjusted EBITDA does not reflect our cash expenditures for capital equipment or other contractual commitments; • adjusted EBITDA does not reflect the interest expense or the cash requirements necessary to service interest or principal payments on our indebtedness; • adjusted EBITDA does not reflect the dividends to our now extinguished Series A Preferred Stockholders or accretion of the Series A Preferred Stock; • adjusted EBITDA does not reflect the gain on extinguishment of our Series A Preferred Stock; • adjusted EBITDA does not reflect losses on extinguishment of debt relating to prepayment penalties, termination fees and the write off of any remaining debt discount and debt issuance costs upon the repayment or refinancing of our debt; • adjusted EBITDA does not reflect tax payments that may represent a reduction in cash available to us; • although depreciation and amortization are non-cash charges, the assets being depreciated and amortized may have to be replaced in the future, and adjusted EBITDA does not reflect capital expenditure requirements relating to the future need to augment or replace those assets; • adjusted EBITDA does not reflect share-based compensation expense on equity-based incentive awards to our officers, associates, directors and consultants; • adjusted EBITDA does not reflect the foreign currency income or losses in our operations; • adjusted EBITDA does not reflect the gains or losses on the sale of assets and asset impairments; • adjusted EBITDA does not reflect restructuring charges; and • other companies, including companies in our industry, may calculate EBITDA and adjusted EBITDA differently, which reduces their usefulness as comparative measures.
|
|
|
|
38
|
|
|
|
|
|
|
|
|
|
|
|
|
|
|
|
|
|
In evaluating EBITDA and adjusted EBITDA, you should be aware that in the future, we will incur expenses similar to the adjustments noted herein. Our presentations of EBITDA and adjusted EBITDA should not be construed as suggesting that our future results will be unaffected by these expenses or any unusual or non-recurring items. When evaluating our performance, you should consider EBITDA and adjusted EBITDA alongside other financial performance measures, including our net income (loss) and other GAAP measures.
Free cash flow
We define free cash flow as net cash provided by (used in) operating activities less capital expenditures. We believe free cash flow is a useful measure for investors because it portrays our ability to generate cash from our business for purposes such as repaying maturing debt and accrued interest paid in kind on debt and funding business acquisitions.
Net cash (debt)
We define net cash (debt) as total unrestricted cash and cash equivalents less the total principal amount of debt outstanding. The total principal amount of debt outstanding is comprised of the long-term debt and current maturities of long-term debt as presented in our consolidated balance sheets adding back any debt issuance costs. We believe that the presentation of net cash (debt) provides useful information to investors because our management reviews net cash (debt) as part of our oversight of overall liquidity, financial flexibility and leverage. Net cash (debt) is important when we consider opening new manufacturing facilities and expanding existing manufacturing facilities, as well as for capital expenditure requirements.
The following table reconcilestables reconcile our non-GAAP key financial measures to the most directly comparable GAAP measures:
39
EBITDA and adjusted EBITDA for the years ended December 31 are reconciled as follows:
|
| 2020 |
|
| 2019 |
|
| 2018 |
| |||||||||||||||
|
| (in thousands) |
|
| 2023 |
|
| 2022 |
|
| 2021 |
| ||||||||||||
Net income (loss) |
| $ | (19,027 | ) |
| $ | (15,708 | ) |
| $ | 5,279 |
| ||||||||||||
|
| (in thousands) |
| |||||||||||||||||||||
Net loss attributable to common stockholders |
| $ | (177,612 | ) |
| $ | (124,208 | ) |
| $ | (165,588 | ) | ||||||||||||
Net loss from discontinued operations |
|
| 5,326 |
|
|
| 9,755 |
|
|
| 3,654 |
| ||||||||||||
Net loss from continuing operations attributable |
|
| (172,286 | ) |
|
| (114,453 | ) |
|
| (161,934 | ) | ||||||||||||
Preferred stock dividends and accretion |
|
| 58,453 |
|
|
| 58,903 |
|
|
| 6,040 |
| ||||||||||||
Gain on extinguishment of |
|
| (82,620 | ) |
|
| — |
|
|
| — |
| ||||||||||||
Net loss from continuing operations |
|
| (196,453 | ) |
|
| (55,550 | ) |
|
| (155,894 | ) | ||||||||||||
Adjustments: |
|
|
|
|
|
|
|
|
|
|
|
|
|
|
|
|
|
|
|
|
| |||
Depreciation and amortization |
|
| 49,667 |
|
|
| 38,580 |
|
|
| 26,429 |
|
|
| 38,869 |
|
|
| 38,772 |
|
|
| 37,606 |
|
Interest expense (net of interest income) |
|
| 10,399 |
|
|
| 8,022 |
|
|
| 10,236 |
| ||||||||||||
Loss on extinguishment of debt |
|
| — |
|
|
| — |
|
|
| 3,397 |
| ||||||||||||
Income tax provision (benefit) |
|
| 11,284 |
|
|
| 23,115 |
|
|
| (3,033 | ) | ||||||||||||
Interest expense, net |
|
| 12,112 |
|
|
| 5,029 |
|
|
| 13,644 |
| ||||||||||||
Income tax provision |
|
| 17,562 |
|
|
| 29,613 |
|
|
| 29,826 |
| ||||||||||||
EBITDA |
|
| 52,323 |
|
|
| 54,009 |
|
|
| 42,308 |
|
|
| (127,910 | ) |
|
| 17,864 |
|
|
| (74,818 | ) |
Share-based compensation expense |
|
| 10,352 |
|
|
| 5,681 |
|
|
| 7,795 |
|
|
| 9,916 |
|
|
| 14,459 |
|
|
| 7,814 |
|
Foreign currency loss, net |
|
| 19,986 |
|
|
| 4,107 |
|
|
| 13,489 |
| ||||||||||||
Foreign currency loss (income), net |
|
| 5,162 |
|
|
| (4,571 | ) |
|
| 21,970 |
| ||||||||||||
Loss on sale of assets and asset impairments |
|
| 7,748 |
|
|
| 18,117 |
|
|
| 4,581 |
|
|
| 21,862 |
|
|
| 9,842 |
|
|
| 12,436 |
|
Restructuring charges, net |
|
| 4,089 |
|
|
| 3,927 |
|
|
| — |
|
|
| 5,050 |
|
|
| 263 |
|
|
| 12,543 |
|
Adjusted EBITDA |
| $ | 94,498 |
|
| $ | 85,841 |
|
| $ | 68,173 |
|
| $ | (85,920 | ) |
| $ | 37,857 |
|
| $ | (20,055 | ) |
Free cash flow, which includes discontinued operations, for the years ended December 31 is reconciled as follows:
|
| 2020 |
|
| 2019 |
|
| 2018 |
| |||||||||||||||
|
| (in thousands) |
|
| 2023 |
|
| 2022 |
|
| 2021 |
| ||||||||||||
Net cash provided by (used in) operating activities |
| $ | 37,570 |
|
| $ | 57,084 |
|
| $ | (3,258 | ) | ||||||||||||
|
| (in thousands) |
| |||||||||||||||||||||
Net cash used in operating activities |
| $ | (80,972 | ) |
| $ | (62,272 | ) |
| $ | (25,525 | ) | ||||||||||||
Less capital expenditures |
|
| (65,666 | ) |
|
| (74,408 | ) |
|
| (52,688 | ) |
|
| (36,137 | ) |
|
| (18,832 | ) |
|
| (37,119 | ) |
Free cash flow |
| $ | (28,096 | ) |
| $ | (17,324 | ) |
| $ | (55,946 | ) |
| $ | (117,109 | ) |
| $ | (81,104 | ) |
| $ | (62,644 | ) |
Net debtcash (debt) as of December 31 is reconciled as follows:
|
| 2020 |
|
| 2019 |
|
| 2018 |
| |||
|
| (in thousands) |
| |||||||||
Cash and cash equivalents |
| $ | 129,857 |
|
| $ | 70,282 |
|
| $ | 85,346 |
|
Less total debt, net of debt issuance costs |
|
| (216,867 | ) |
|
| (141,389 | ) |
|
| (137,623 | ) |
Less debt issuance costs |
|
| (1,051 | ) |
|
| (672 | ) |
|
| (878 | ) |
Net debt |
| $ | (88,061 | ) |
| $ | (71,779 | ) |
| $ | (53,155 | ) |
|
| 2023 |
|
| 2022 |
|
| 2021 |
| |||
|
| (in thousands) |
| |||||||||
Cash and cash equivalents |
| $ | 161,059 |
|
| $ | 133,546 |
|
| $ | 216,236 |
|
Cash and cash equivalents of |
|
| 916 |
|
|
| 9,669 |
|
|
| 25,929 |
|
Total debt, net of debt issuance costs |
|
| (485,193 | ) |
|
| (61,173 | ) |
|
| (74,646 | ) |
Net cash (debt) |
| $ | (323,218 | ) |
| $ | 82,042 |
|
| $ | 167,519 |
|
Key Operating Metrics (1)(1)
The key operating metrics as of and for the year ended December 31 are as follows:
|
| 2023 |
|
| 2022 |
|
| 2021 |
| |||
Sets |
|
| 2,584 |
|
|
| 2,441 |
|
|
| 2,674 |
|
Estimated megawatts |
|
| 11,382 |
|
|
| 10,736 |
|
|
| 10,607 |
|
Utilization |
|
| 82 | % |
|
| 80 | % |
|
| 77 | % |
Dedicated manufacturing lines |
|
| 37 |
|
|
| 36 |
|
|
| 46 |
|
Manufacturing lines installed |
|
| 37 |
|
|
| 36 |
|
|
| 46 |
|
|
| 2020 |
|
| 2019 |
|
| 2018 |
| |||
Sets |
|
| 3,544 |
|
|
| 3,189 |
|
|
| 2,423 |
|
Estimated megawatts |
|
| 12,080 |
|
|
| 9,598 |
|
|
| 6,560 |
|
Utilization |
|
| 81 | % |
|
| 79 | % |
|
| 71 | % |
Dedicated manufacturing lines |
|
| 53 |
|
|
| 52 |
|
|
| 55 |
|
Manufacturing lines installed |
|
| 55 |
|
|
| 48 |
|
|
| 43 |
|
40
|
|
Sets represents the number of wind blade sets, consisting of three wind blades each, which we produced worldwide during the period. We monitor sets and believe that presenting sets to investors is helpful because we believe that it is the most direct measurement of our manufacturing output during the period. Sets primarily impact net sales.
Estimated megawatts are the energy capacity to be generated by wind blade sets produced during the period. Our estimate is based solely on name-plate capacity of the wind turbine on which the wind blades we manufacture
40
are expected to be installed. We monitor estimated megawatts and believe that presenting estimated megawatts to investors is helpful because we believe that it is a commonly followed measurement of energy capacity across our industry and provides an indication of our share of the overall wind blade market.
Utilization represents the percentage of the number of wind blades invoicedproduced during the period compared to the total potential wind blade capacity of the manufacturing lines installed during the period. We monitor utilization because we believe it helps investors to better understand how close we are to operating at maximum production capacity.
Dedicated manufacturing lines are the number of wind blade manufacturing lines that we have dedicated to our customers pursuant to our long-term supply agreements at the end of the period. We monitor dedicated manufacturing lines and believe that presenting this metric to investors is helpful because we believe that the number of dedicated manufacturing lines is the best indicator of demand for the wind blades we manufacture for customers under our long-term supply agreements in any given period. Lines become dedicated upon the execution of a long-term supply agreement; this means that lines are typically dedicated before they are installed.
Manufacturing lines installed represents the number of wind blade manufacturing lines installed and either in operation, startup or transition during the period. We believe that total manufacturing lines installed provides an understanding of the number of manufacturing lines installed and either in operation, startup or transition. From time to time, we have manufacturing lines installed that are not dedicated to our customers pursuant to a long-term supply agreement.
41
RESULTS OF OPERATIONS
Year Ended December 31, 20202023 Compared to Year Ended December 31, 20192022
The following table summarizes certain of our operating results as a percentage of net sales for the years ended December 31 that have been derived from our consolidated statements of operations:
|
| 2020 |
|
|
| 2019 |
|
| ||
Net sales |
|
| 100.0 |
| % |
|
| 100.0 |
| % |
Cost of sales |
|
| 93.5 |
|
|
|
| 89.8 |
|
|
Startup and transition costs |
|
| 2.7 |
|
|
|
| 4.8 |
|
|
Total cost of goods sold |
|
| 96.2 |
|
|
|
| 94.6 |
|
|
Gross profit |
|
| 3.8 |
|
|
|
| 5.4 |
|
|
General and administrative expenses |
|
| 2.0 |
|
|
|
| 2.8 |
|
|
Loss on sale of assets and asset impairments |
|
| 0.5 |
|
|
|
| 1.3 |
|
|
Restructuring charges, net |
|
| 0.2 |
|
|
|
| 0.2 |
|
|
Income from operations |
|
| 1.1 |
|
|
|
| 1.1 |
|
|
Total other expense |
|
| (1.6 | ) |
|
|
| (0.6 | ) |
|
Income (loss) before income taxes |
|
| (0.5 | ) |
|
|
| 0.5 |
|
|
Income tax provision |
|
| (0.6 | ) |
|
|
| (1.6 | ) |
|
Net loss |
|
| (1.1 | ) | % |
|
| (1.1 | ) | % |
41
|
| 2023 |
|
| 2022 |
| ||
Net sales |
|
| 100.0 | % |
|
| 100.0 | % |
Cost of sales |
|
| 104.5 |
|
|
| 97.4 |
|
Startup and transition costs |
|
| 1.5 |
|
|
| 1.7 |
|
Total cost of goods sold |
|
| 106.0 |
|
|
| 99.1 |
|
Gross profit (loss) |
|
| (6.0 | ) |
|
| 0.9 |
|
General and administrative expenses |
|
| 3.4 |
|
|
| 2.1 |
|
Loss on sale of assets and asset impairments |
|
| 1.5 |
|
|
| 0.6 |
|
Restructuring charges, net |
|
| 0.3 |
|
|
| — |
|
Loss from continuing operations |
|
| (11.2 | ) |
|
| (1.8 | ) |
Total other income (expense) |
|
| (1.1 | ) |
|
| 0.1 |
|
Loss before income taxes |
|
| (12.3 | ) |
|
| (1.7 | ) |
Income tax provision |
|
| (1.2 | ) |
|
| (1.9 | ) |
Net loss from continuing operations |
|
| (13.5 | ) |
|
| (3.6 | ) |
Preferred stock dividends and accretion |
|
| (4.0 | ) |
|
| (3.9 | ) |
Gain on extinguishment of Series A Preferred Stock |
|
| 5.7 |
|
|
| — |
|
Net loss attributable to common stockholders |
|
| (11.8 | ) |
|
| (7.5 | ) |
Net loss from discontinued operations |
|
| (0.4 | ) |
|
| (0.6 | ) |
Net loss attributable to common stockholders |
|
| (12.2 | )% |
|
| (8.1 | )% |
Net sales
Consolidated discussion
The following table summarizes our net sales by product/service for the years ended December 31:
|
|
|
|
|
|
|
|
|
| Change |
| |||||
|
| 2020 |
|
| 2019 |
|
| $ |
|
| % |
| ||||
|
| (in thousands) |
|
|
|
|
| |||||||||
Wind blade sales |
| $ | 1,580,055 |
|
| $ | 1,328,717 |
|
| $ | 251,338 |
|
|
| 18.9 | % |
Precision molding and assembly systems sales |
|
| 28,073 |
|
|
| 48,680 |
|
|
| (20,607 | ) |
|
| -42.3 | % |
Transportation sales |
|
| 36,196 |
|
|
| 28,870 |
|
|
| 7,326 |
|
|
| 25.4 | % |
Other sales |
|
| 25,813 |
|
|
| 30,233 |
|
|
| (4,420 | ) |
|
| -14.6 | % |
Total net sales |
| $ | 1,670,137 |
|
| $ | 1,436,500 |
|
| $ | 233,637 |
|
|
| 16.3 | % |
|
|
|
|
|
|
|
| Change |
| |||||||
|
| 2023 |
|
| 2022 |
|
| $ |
|
| % |
| ||||
|
| (in thousands) |
|
|
|
| ||||||||||
Wind blade, tooling |
| $ | 1,394,316 |
|
| $ | 1,423,824 |
|
| $ | (29,508 | ) |
|
| (2.1 | )% |
Automotive sales |
|
| 22,775 |
|
|
| 44,002 |
|
|
| (21,227 | ) |
|
| (48.2 | ) |
Field service, inspection |
|
| 38,092 |
|
|
| 54,915 |
|
|
| (16,823 | ) |
|
| (30.6 | ) |
Total net sales |
| $ | 1,455,183 |
|
| $ | 1,522,741 |
|
| $ | (67,558 | ) |
|
| (4.4 | )% |
The increasedecrease in net sales of wind blades, tooling and other wind related sales (collectively, Wind) for the year ended December 31, 2023, as compared to the same period in 2022, was due primarily to a reduction in wind blade inventory included in contract assets driven by a 11%working capital initiatives and the wind down of lines in transition at the end of the year. The inventory reduction significantly impacted net sales of Wind for the year ended December 31, 2023 as lower blade inventory costs directly correlate to lower revenue under the cost-to-cost revenue recognition method for our blade contracts. These decreases were offset by an increase in the number of wind blades produced, duringincreased average sales prices, favorable foreign currency fluctuations, and an increase in tooling sales. The decrease in automotive sales for the year ended December 31, 20202023, as compared to the same period in 20192022, was primarily due to a decrease in the number of composite bus bodies produced as a result of increased production at our China, Mexico, IndiaProterra's bankruptcy during the third quarter of 2023 and Iowa facilities. The increase was alsoa decrease in sales of other automotive products due to a higher averageour customers’ supply chain constraints and delays in transitions of new product launches. The decrease in field service, inspection and repair services (collectively, Field Services) sales price due to the mix of wind blade models produced duringfor the year ended December 31, 2020 compared to the same period in 2019. Net sales from the manufacturing of precision molding and assembly systems decreased, primarily in Asia, during the year ended December 31, 20202023, as compared to the same
42
period in 2019,2022, was primarily due to our customers deferring a number of blade model transitionsreduction in technicians deployed to revenue generating projects due to the COVID-19 pandemic. Additionally, there was an increase in transportationtime spent on non-revenue generating inspection and other sales during the year ended December 31, 2020 as compared to the same period in 2019.repair activities. The fluctuating U.S. dollar against the Euro in our Turkey operations and the Chinese Renminbi in our ChinaTürkiye operations had a favorable impact of 0.1%1.0% on consolidated net sales for the year ended December 31, 20202023, as compared to 2019. Although our net sales increased for the year ended December 31, 2020 compared to the same period in 2019, we estimate that our net sales were adversely impacted by approximately $148.0 million, based upon 352 wind blade sets, which we had forecasted to produce at our Mexico, China, Iowa, Turkey and India manufacturing facilities in the periods under non-cancellable purchase orders associated with our long-term contracts but were unable to do so as a result of the COVID-19 pandemic. The COVID-19 pandemic required these manufacturing facilities to either temporarily suspend production or operate at reduced production levels primarily during the first and second quarters of 2020 as a result of certain applicable government-mandated stay at home orders 2022.in response to the COVID-19 pandemic, demands from certain of our labor unions to suspend or reduce production and general safety concerns of our associates.
Segment discussion
The following table summarizes our net sales by our fivefour geographic operating segments for the years ended December 31:
|
|
|
|
| Change |
| ||||||||||
|
| 2020 |
|
| 2019 |
|
| $ |
|
| % |
| ||||
|
| (in thousands) |
|
|
|
|
| |||||||||
U.S. |
| $ | 181,941 |
|
| $ | 169,317 |
|
| $ | 12,624 |
|
|
| 7.5 | % |
Asia |
|
| 527,083 |
|
|
| 393,809 |
|
|
| 133,274 |
|
|
| 33.8 | % |
Mexico |
|
| 495,839 |
|
|
| 435,606 |
|
|
| 60,233 |
|
|
| 13.8 | % |
EMEA |
|
| 373,545 |
|
|
| 437,081 |
|
|
| (63,536 | ) |
|
| -14.5 | % |
India |
|
| 91,729 |
|
|
| 687 |
|
|
| 91,042 |
|
| NM |
| |
Total net sales |
| $ | 1,670,137 |
|
| $ | 1,436,500 |
|
| $ | 233,637 |
|
|
| 16.3 | % |
NM – not meaningful.
42
|
|
|
|
|
|
|
| Change |
| |||||||
|
| 2023 |
|
| 2022 |
|
| $ |
|
| % |
| ||||
|
| (in thousands) |
|
|
|
| ||||||||||
U.S. |
| $ | 51,100 |
|
| $ | 89,170 |
|
| $ | (38,070 | ) |
|
| (42.7 | )% |
Mexico |
|
| 589,539 |
|
|
| 646,615 |
|
|
| (57,076 | ) |
|
| (8.8 | ) |
EMEA |
|
| 573,483 |
|
|
| 568,992 |
|
|
| 4,491 |
|
|
| 0.8 |
|
India |
|
| 241,061 |
|
|
| 217,964 |
|
|
| 23,097 |
|
|
| 10.6 |
|
Total net sales |
| $ | 1,455,183 |
|
| $ | 1,522,741 |
|
| $ | (67,558 | ) |
|
| (4.4 | )% |
U.S. Segment
The following table summarizes our net sales by product/service for the U.S. segment for the years ended December 31:
|
|
|
|
|
|
|
|
|
|
|
| |||||
|
|
|
|
| Change |
| ||||||||||
|
| 2020 |
|
| 2019 |
|
| $ |
|
| % |
| ||||
|
| (in thousands) |
|
|
|
|
| |||||||||
Wind blade sales |
| $ | 135,415 |
|
| $ | 120,125 |
|
| $ | 15,290 |
|
|
| 12.7 | % |
Precision molding and assembly systems sales |
|
| — |
|
|
| 3,774 |
|
|
| (3,774 | ) |
| NM |
| |
Transportation sales |
|
| 33,849 |
|
|
| 28,523 |
|
|
| 5,326 |
|
|
| 18.7 | % |
Other sales |
|
| 12,677 |
|
|
| 16,895 |
|
|
| (4,218 | ) |
|
| -25.0 | % |
Total net sales |
| $ | 181,941 |
|
| $ | 169,317 |
|
| $ | 12,624 |
|
|
| 7.5 | % |
|
|
|
|
|
|
|
| Change |
| |||||||
|
| 2023 |
|
| 2022 |
|
| $ |
|
| % |
| ||||
|
| (in thousands) |
|
|
|
| ||||||||||
Wind blade, tooling |
| $ | — |
|
| $ | 1,000 |
|
| $ | (1,000 | ) |
| NM |
| |
Automotive sales |
|
| 22,775 |
|
|
| 44,002 |
|
|
| (21,227 | ) |
|
| (48.2 | ) |
Field service, inspection |
|
| 28,325 |
|
|
| 44,168 |
|
|
| (15,843 | ) |
|
| (35.9 | ) |
Total net sales |
| $ | 51,100 |
|
| $ | 89,170 |
|
| $ | (38,070 | ) |
|
| (42.7 | )% |
NM - not meaningful.
The increasedecrease in the U.S. segment’s netautomotive sales of wind blades was primarily due to a 14% increase in the number of wind blades produced infor the year ended December 31, 20202023, as compared to the same period in 2019, as well2022, was primarily due to a decrease in the number of composite bus bodies produced as a higher averageresult of Proterra’s bankruptcy during the third quarter of 2023, and a decrease in sales price due to the mix of wind blade models producedother automotive products. The decrease in the comparable periods. Although our U.S. netsegment’s Field Services sales increased for the year ended December 31, 2020 compared to the same period in 2019, our U.S. net sales were adversely impacted due to reduced production levels at our U.S. manufacturing facilities due to the COVID-19 pandemic primarily during the second quarter of 2020.
Asia Segment
The following table summarizes our net sales by product/service for the Asia segment for the years ended December 31:
|
|
|
|
|
|
|
|
|
|
|
| |||||
|
|
|
|
| Change |
| ||||||||||
|
| 2020 |
|
| 2019 |
|
| $ |
|
| % |
| ||||
|
| (in thousands) |
|
|
|
|
| |||||||||
Wind blade sales |
| $ | 511,090 |
|
| $ | 366,206 |
|
| $ | 144,884 |
|
|
| 39.6 | % |
Precision molding and assembly systems sales |
|
| 13,134 |
|
|
| 25,203 |
|
|
| (12,069 | ) |
|
| -47.9 | % |
Other sales |
|
| 2,859 |
|
|
| 2,400 |
|
|
| 459 |
|
|
| 19.1 | % |
Total net sales |
| $ | 527,083 |
|
| $ | 393,809 |
|
| $ | 133,274 |
|
|
| 33.8 | % |
The increase in the Asia segment’s net sales of wind blades2023, was primarily due to a 22% net increasereduction in the number of wind blades produced in the year ended December 31, 2020 as comparedtechnicians deployed to the same period in 2019 andrevenue generating projects due to an increase in the average sales price of wind blades due to a change in the mix of wind blades produced in the two comparative periods. Although our Asia net sales increased for the year ended December 31, 2020 compared to the same period in 2019, our Asia net sales were adversely impacted due to reduced production levels at our Asia manufacturing facilities due to the COVID-19 pandemic primarily during the first quarter of 2020. Net sales from the manufacturing of precision moldingtime spent on non-revenue generating inspection and assembly systems during the 2020 period decreased by $12.1 million as compared to the 2019 period primarily due to our customers deferring a number of blade model transitions due to the COVID-19 pandemic.repair activities.
43
Mexico Segment
The following table summarizes our net sales by product/service for the Mexico segment for the years ended December 31:
|
|
|
|
|
|
|
|
|
|
|
| |||||
|
|
|
|
| Change |
| ||||||||||
|
| 2020 |
|
| 2019 |
|
| $ |
|
| % |
| ||||
|
| (in thousands) |
|
|
|
|
| |||||||||
Wind blade sales |
| $ | 472,994 |
|
| $ | 410,337 |
|
| $ | 62,657 |
|
|
| 15.3 | % |
Precision molding and assembly systems sales |
|
| 14,939 |
|
|
| 19,703 |
|
|
| (4,764 | ) |
|
| -24.2 | % |
Transportation sales |
|
| 2,347 |
|
|
| 347 |
|
|
| 2,000 |
|
| NM |
| |
Other sales |
|
| 5,559 |
|
|
| 5,219 |
|
|
| 340 |
|
|
| 6.5 | % |
Total net sales |
| $ | 495,839 |
|
| $ | 435,606 |
|
| $ | 60,233 |
|
|
| 13.8 | % |
|
|
|
|
|
|
|
| Change |
| |||||||
|
| 2023 |
|
| 2022 |
|
| $ |
|
| % |
| ||||
|
| (in thousands) |
|
|
|
| ||||||||||
Wind blade, tooling |
| $ | 587,628 |
|
| $ | 642,377 |
|
| $ | (54,749 | ) |
|
| (8.5 | )% |
Field service, inspection |
|
| 1,911 |
|
|
| 4,238 |
|
|
| (2,327 | ) |
|
| (54.9 | ) |
Total net sales |
| $ | 589,539 |
|
| $ | 646,615 |
|
| $ | (57,076 | ) |
|
| (8.8 | )% |
The increasedecrease in the Mexico segment’s net sales of wind blades reflects a 18% net increase in overall wind blade volume and an increase in the average sales price of wind blades due to a change in the mix of wind blades produced in the two comparative periods. In addition, our 2019 net sales were impacted by the employees strike at our Matamoros production facility. Although our Mexico net sales increasedWind for the year ended December 31, 20202023, as compared to the same period in 2019, our Mexico net2022, was due primarily to a reduction in wind blade inventory included in contract assets driven by working capital initiatives and the wind down of lines in transition at the end of the year and lower average sales were adversely impacted due to reduced production levels at our Mexico manufacturing facilitiesprices due to the COVID-19 pandemicimpact of raw material and logistic cost reductions on our blade prices. This decrease was partially offset by an increase in the number of wind blades produced due to an increase in lines in production and an increase in tooling sales in preparation for manufacturing line startups and transitions. The decrease in the Mexico segment’s Field Services sales for the year ended December 31, 2023, as compared to the same period in 2022, was primarily during the second quarter of 2020.due to a reduction in technicians deployed to revenue generating projects due to an increase in time spent on non-revenue generating inspection and repair activities.
EMEA Segment
The following table summarizes our net sales by product/service for the EMEA segment for the years ended December 31:
|
|
|
|
|
|
|
|
|
|
|
| |||||
|
|
|
|
| Change |
| ||||||||||
|
| 2020 |
|
| 2019 |
|
| $ |
|
| % |
| ||||
|
| (in thousands) |
|
|
|
|
| |||||||||
Wind blade sales |
| $ | 368,907 |
|
| $ | 431,362 |
|
| $ | (62,455 | ) |
|
| -14.5 | % |
Other sales |
|
| 4,638 |
|
|
| 5,719 |
|
|
| (1,081 | ) |
|
| -18.9 | % |
Total net sales |
| $ | 373,545 |
|
| $ | 437,081 |
|
| $ | (63,536 | ) |
|
| -14.5 | % |
|
|
|
|
|
|
|
| Change |
| |||||||
|
| 2023 |
|
| 2022 |
|
| $ |
|
| % |
| ||||
|
| (in thousands) |
|
|
|
| ||||||||||
Wind blade, tooling |
| $ | 565,627 |
|
| $ | 562,485 |
|
| $ | 3,142 |
|
|
| 0.6 | % |
Field service, inspection |
|
| 7,856 |
|
|
| 6,507 |
|
|
| 1,349 |
|
|
| 20.7 |
|
Total net sales |
| $ | 573,483 |
|
| $ | 568,992 |
|
| $ | 4,491 |
|
|
| 0.8 | % |
The decreaseincrease in the EMEA segment’s net sales of wind blades was driven by a 22% decrease in wind blade production at our two Turkey plants due to transitions and reduced production levels at these manufacturing facilities dueWind for the year ended December 31, 2023, as compared to the COVID-19 pandemicsame period in 2022, was primarily during the second quarter of 2020. The decrease was partially offset bydue to an increase in the average sales price of wind blades delivered in the comparative periods and an increase in the year over year number of wind blades stillproduced in 2023 as compared to 2022 due to a brief labor disruption in Türkiye in the production processthird quarter of 2022 as we worked with the union to resolve inflationary pressures on wages, favorable foreign currency fluctuations, and higher average sales prices due to the impact of inflation on wind blade prices. These increases were partially offset by a reduction in wind blade inventory included in contract assets driven by working capital initiatives and the wind down of lines in transition at the end of the period.year. The increase in the EMEA segment’s Field Services sales for the year ended December 31, 2023, as compared to the same period in 2022, was primarily due to an increase in demand for such services in this region and the commencement of our service center in Spain during 2022. The fluctuating U.S. dollar relative to the Euro had a favorable impact of 0.3%2.7% on the EMEA segment’s net sales duringfor the year ended December 31, 20202023, as compared to the 2019 period.same period in 2022.
44
India Segment
The following table summarizes our net sales by product/service for the India segment for the years ended December 31:
|
|
|
|
| Change | |||||||||
|
| 2020 |
|
| 2019 |
|
| $ |
|
| % | |||
|
| (in thousands) |
|
|
| |||||||||
Wind blade sales |
| $ | 91,649 |
|
| $ | 687 |
|
| $ | 90,962 |
|
| NM |
Other sales |
|
| 80 |
|
|
| — |
|
|
| 80 |
|
| NM |
Total net sales |
| $ | 91,729 |
|
| $ | 687 |
|
| $ | 91,042 |
|
| NM |
|
|
|
|
|
|
|
| Change |
| |||||||
|
| 2023 |
|
| 2022 |
|
| $ |
|
| % |
| ||||
|
| (in thousands) |
|
|
|
| ||||||||||
Wind blade, tooling |
| $ | 241,061 |
|
| $ | 217,962 |
|
| $ | 23,099 |
|
|
| 10.6 | % |
Field service, inspection |
|
| — |
|
|
| 2 |
|
|
| (2 | ) |
| NM |
| |
Total net sales |
| $ | 241,061 |
|
| $ | 217,964 |
|
| $ | 23,097 |
|
|
| 10.6 | % |
The increase in the India segment’s net sales of Wind for the year ended December 31, 2023, as compared to the same period in 2022, was primarily due to an increase in the number of wind blades was drivenproduced due to the transition of two of our manufacturing lines from one type of wind blade to a new type of wind blade during the prior comparative period, partially offset by lower average sales prices due to the startupimpact of production in 2020. Noraw material production took place in 2019.and logistic cost reductions on our blade prices.
Total cost of goods sold
The following table summarizes our total cost of goods sold for the years ended December 31:
|
|
|
|
|
|
|
|
|
|
|
| |||||||||||||||||||||
|
|
|
|
| Change |
|
|
|
|
|
|
| Change |
| ||||||||||||||||||
|
| 2020 |
|
| 2019 |
|
| $ |
|
| % |
|
| 2023 |
|
| 2022 |
|
| $ |
|
| % |
| ||||||||
|
| (in thousands) |
|
|
|
|
|
| (in thousands) |
|
|
| ||||||||||||||||||||
Cost of sales |
| $ | 1,561,432 |
|
| $ | 1,290,619 |
|
| $ | 270,813 |
|
|
| 21.0 | % |
| $ | 1,520,974 |
|
| $ | 1,482,428 |
|
| $ | 38,546 |
|
|
| 2.6 | % |
Startup and transition costs |
|
| 44,606 |
|
|
| 68,033 |
|
|
| (23,427 | ) |
|
| -34.4 | % | ||||||||||||||||
Startup costs |
|
| 4,399 |
|
|
| — |
|
|
| 4,399 |
|
| NM |
| |||||||||||||||||
Transition costs |
|
| 17,358 |
|
|
| 25,668 |
|
|
| (8,310 | ) |
|
| (32.4 | ) | ||||||||||||||||
Total cost of goods sold |
| $ | 1,606,038 |
|
| $ | 1,358,652 |
|
| $ | 247,386 |
|
|
| 18.2 | % |
| $ | 1,542,731 |
|
| $ | 1,508,096 |
|
| $ | 34,635 |
|
|
| 2.3 |
|
% of net sales |
|
| 96.2 | % |
|
| 94.6 | % |
|
|
|
|
|
| 1.6 | % |
|
| 106.0 | % |
|
| 99.1 | % |
|
|
|
| 6.9 | % | ||
Total cost of goods sold for the year ended December 31, 2020 was $1,606.0 million and included $25.9 million related to lines in startup and $18.7 million related to lines in transition during the period. This compares to total cost of goods sold for the year ended December 31, 2019 of $1,358.7 million and included $48.5 million related to lines in startup and $19.5 million related to lines in transition during the period. Cost of goods sold as a percentage of net sales increased by approximately two percentage points during6.9% for the year ended December 31, 20202023, as compared to the same period in 2019,2022, primarily driven by an increase of $50.6 million of total warranty costs due to changes in previous estimates primarily by theassociated with a single campaign with a current customer, an increase in warrantyoperating costs primarily relatingdue to a remediation campaign for a specific wind blade model for oneadditional quality control measures implemented in certain of our customers,manufacturing facilities, increased labor costs in Türkiye and COVID-19 related costs associated with the healthMexico as a result of wage increases, continued cost challenges at facilities in Matamoros, Mexico, and safety of our associates and non-productive labor,unfavorable foreign currency fluctuations. These unfavorable items were partially offset by a decrease inreduced startup and transition costs the impact ofand cost savings in raw material costs and foreign currency fluctuations.initiatives. The fluctuating U.S. dollar against the Euro, Turkish Lira, Chinese Renminbi and Mexican Peso had a combined favorable impact of 1.5%0.3% on consolidated cost of goods sold for the year ended December 31, 20202023, as compared to 2019.the same period in 2022.
General and administrative expenses
The following table summarizes our general and administrative expenses for the years ended December 31:
|
|
|
|
|
|
|
| Change |
| |||||||
|
| 2023 |
|
| 2022 |
|
| $ |
|
| % |
| ||||
|
| (in thousands) |
|
|
|
| ||||||||||
General and |
| $ | 49,133 |
|
| $ | 32,349 |
|
| $ | 16,784 |
|
|
| 51.9 | % |
% of net sales |
|
| 3.4 | % |
|
| 2.1 | % |
|
|
|
|
| 1.3 | % | |
|
|
|
|
|
|
|
|
|
|
|
| |||||
|
|
|
|
| Change |
| ||||||||||
|
| 2020 |
|
| 2019 |
|
| $ |
|
| % |
| ||||
|
| (in thousands) |
|
|
|
|
| |||||||||
General and administrative expenses |
| $ | 33,496 |
|
| $ | 39,916 |
|
| $ | (6,420 | ) |
|
| -16.1 | % |
% of net sales |
|
| 2.0 | % |
|
| 2.8 | % |
|
|
|
|
|
| -0.8 | % |
45
The decrease in generalGeneral and administrative expenses as a percentage of net sales increased by 1.3% for the year ended December 31, 20202023, as compared to the same period in 20192022, and was primarily driven by $20.9 million of credit losses on contract assets and accounts receivable from the Proterra bankruptcy impacting our automotive business, partially offset by lower travelstock-based compensation expense and training costs due to the COVID-19 pandemic.employee incentive costs.
45
Loss on sale of assets and asset impairments
The following table summarizes our loss on sale of assets and asset impairments for the years ended December 31:
|
|
|
|
|
|
|
|
|
|
|
| |||||||||||||||||||||
|
|
|
|
| Change |
|
|
|
|
|
|
| Change |
| ||||||||||||||||||
|
| 2020 |
|
| 2019 |
|
| $ |
|
| % |
|
| 2023 |
|
| 2022 |
|
| $ |
|
| % |
| ||||||||
|
| (in thousands) |
|
|
|
|
|
| (in thousands) |
|
|
| ||||||||||||||||||||
Loss on sale of assets and asset impairments |
| $ | 7,748 |
|
| $ | 18,117 |
|
| $ | (10,369 | ) |
|
| -57.2 | % | ||||||||||||||||
Loss on sale of receivables |
| $ | 19,546 |
|
| $ | 9,754 |
|
| $ | 9,792 |
|
|
| 100.4 | % | ||||||||||||||||
Loss on sale of other assets |
|
| 211 |
|
|
| 167 |
|
|
| 44 |
|
|
| 26.3 |
| ||||||||||||||||
Asset impairment charges |
|
| 2,105 |
|
|
| (79 | ) |
|
| 2,184 |
|
| NM |
| |||||||||||||||||
Total loss on sale of assets |
| $ | 21,862 |
|
| $ | 9,842 |
|
| $ | 12,020 |
|
|
| 122.1 |
| ||||||||||||||||
% of net sales |
|
| 0.5 | % |
|
| 1.3 | % |
|
|
|
|
|
| -0.8 | % |
|
| 1.5 | % |
|
| 0.6 | % |
|
|
|
| 0.9 | % | ||
The decreaseincrease in the loss on sale of assets and asset impairments for the year ended December 31, 20202023, as compared to the same period in 20192022, was primarily due to: (i) a decrease of $4.4 millionto an increase in asset impairment charges primarily related to the shutdown of our second Newton, Iowa facility in 2019, (ii) a decrease of $4.1 million in losses on the sale of assets at our corporate and manufacturing facilities, and (iii) lower losses on the salevolume of receivables under supply chainsold through our accounts receivable financing arrangements with certain of our customers, and an increase in the current year period due to decreasing interestagreed-upon discount rates, as compared towell as an increase in asset impairments in our automotive business from the equivalent prior year period.Proterra bankruptcy during the third quarter of 2023.
Restructuring charges, net
RestructuringThe following table summarizes our restructuring charges, net, for the years ended December 31:
|
|
|
|
|
|
|
| Change |
| |||||||
|
| 2023 |
|
| 2022 |
|
| $ |
|
| % |
| ||||
|
| (in thousands) |
|
|
|
| ||||||||||
Severance |
| $ | 5,075 |
|
| $ | (210 | ) |
| $ | 5,285 |
|
| NM |
| |
Other restructuring costs |
|
| (25 | ) |
|
| 473 |
|
|
| (498 | ) |
|
| (105.3 | ) |
Total restructuring charges, net |
| $ | 5,050 |
|
| $ | 263 |
|
| $ | 4,787 |
|
| NM |
| |
% of net sales |
|
| 0.3 | % |
|
| 0.0 | % |
|
|
|
|
| 0.3 | % | |
The increase in restructuring charges, net for the year ended December 31, 2020 totaled $4.1 million. These charges2023, as compared to the same period in 2022 was primarily relateddue to downsizing at our Dafeng, China manufacturing facility, comprised of $3.8 million ofan increase in severance benefits to terminated employees, and $0.2 million of other charges, primarily related to exit costs at our second Newton, Iowa facility. The $3.8 million of severance benefits relating to our Dafeng, China facility were paid to terminated employees in January 2021. Restructuring charges, net, for the year ended December 31, 2019 totaled $3.9 million. These charges primarily related to the closing of our Taicang City, China manufacturing facility, comprised of $3.3 million of severance benefits to terminated employeesTürkiye and $0.6 million of other charges, primarily related to exit costs.Rhode Island facilities.
46
Income (loss) from continuing operations
Segment discussion
The following table summarizes our income (loss) from operations by our fivefour geographic operating segments for the years ended December 31:
|
|
|
|
|
|
|
|
|
|
|
| |||||
|
|
|
|
| Change |
| ||||||||||
|
| 2020 |
|
| 2019 |
|
| $ |
|
| % |
| ||||
|
| (in thousands) |
|
|
|
|
| |||||||||
U.S. |
| $ | (40,991 | ) |
| $ | (78,278 | ) |
| $ | 37,287 |
|
|
| 47.6 | % |
Asia |
|
| 62,869 |
|
|
| 24,132 |
|
|
| 38,737 |
|
|
| 160.5 | % |
Mexico |
|
| (9,611 | ) |
|
| 3,533 |
|
|
| (13,144 | ) |
| NM |
| |
EMEA |
|
| 23,331 |
|
|
| 70,449 |
|
|
| (47,118 | ) |
|
| -66.9 | % |
India |
|
| (16,832 | ) |
|
| (3,948 | ) |
|
| (12,884 | ) |
| NM |
| |
Total income from operations |
| $ | 18,766 |
|
| $ | 15,888 |
|
| $ | 2,878 |
|
|
| 18.1 | % |
% of net sales |
|
| 1.1 | % |
|
| 1.1 | % |
|
|
|
|
|
| 0.0 | % |
|
|
|
|
|
|
|
| Change |
| |||||||
|
| 2023 |
|
| 2022 |
|
| $ |
|
| % |
| ||||
|
| (in thousands) |
|
|
|
| ||||||||||
U.S. |
| $ | (47,909 | ) |
| $ | (46,387 | ) |
| $ | (1,522 | ) |
|
| (3.3 | )% |
Mexico |
|
| (174,009 | ) |
|
| (76,096 | ) |
|
| (97,913 | ) |
|
| (128.7 | ) |
EMEA |
|
| 33,571 |
|
|
| 77,195 |
|
|
| (43,624 | ) |
|
| (56.5 | ) |
India |
|
| 24,754 |
|
|
| 17,479 |
|
|
| 7,275 |
|
|
| 41.6 |
|
Total loss from |
| $ | (163,593 | ) |
| $ | (27,809 | ) |
| $ | (135,784 | ) |
|
| (488.3 | ) |
% of net sales |
|
| -11.2 | % |
|
| -1.8 | % |
|
|
|
|
| (9.4 | )% | |
U.S. Segment
The decreaseincrease in the loss from operations in the U.S. segment for the year ended December 31, 20202023, as compared to the same period in 20192022 was primarily due to: (i) the decreasedto credit losses and asset impairment charges in our automotive business as a result of Proterra’s bankruptcy, increased labor costs, related to the shutdown of our Newton, Iowa transportation facility, (ii) theand a decrease in transitionthe volume of field service sales, partially offset by a decrease in non-restructuring related operating costs at our Newton, Iowa blademanufacturing facility (iii) the increase in wind blade volume, (iv) the increase in the average sales price of wind blades and (v) a decrease inlower general and administrative expenses, partially offset by increased direct material costs at our Newton, Iowa blade facility. Although our U.S. loss from operations decreased for the year ended December 31, 2020 compared to the same period in 2019, our income from operations for the year ended December 31, 2020 was adversely impacted due to reduced production levels at our U.S. blade manufacturing facility due to the COVID-19 pandemic during the
46
second quarter of 2020 and COVID-19 related costs associated with the health and safety of our associates and non-productive labor.expenses.
Asia
Mexico Segment
The increase in the income from operations in the Asia segment for the year ended December 31, 2020 as compared to the same period in 2019 was primarily due to the net increase in overall wind blade volume and increase in the average sales price of wind blades, a decrease in the startup and transition costs and lower direct labor costs. The fluctuating U.S. dollar against the Chinese Renminbi had an unfavorable impact of 0.3% on cost of goods sold for the year ended December 31, 2020 as compared to the 2019 period. Although our Asia income from operations increased for the year ended December 31, 2020 as compared to the same period in 2019, our income from operations was adversely impacted due to reduced production levels at our Asia manufacturing facilities due to the COVID-19 pandemic during the first quarter of 2020 and COVID-19 related costs associated with the health and safety of our associates and non-productive labor.
Mexico Segment
The decrease in incomeloss from operations in the Mexico segment for the year ended December 31, 20202023, as compared to the same period in 20192022, was primarily due to increased warranty costs the reduced production levelsand additional quality control measures implemented in certain manufacturing facilities, increased labor costs, continued cost challenges at our facilities in Matamoros, Mexico, manufacturing facilities due to the COVID-19 pandemic during the second quarter of 2020 and COVID-19 related costs associated with the health and safety of our associates and non-productive labor.unfavorable foreign currency fluctuations. These increased costsunfavorable items were partially offset by the overall increase in wind blade volume, an increase in the average sales price of wind blades, decreasedreduced startup and transition costs favorable foreign currency fluctuations as well asand additional fees received from savings in raw material costs.our customer related to the temporary production pause at one of our Matamoros, Mexico facilities. The fluctuating U.S. dollar relative to the Mexican Peso had a favorablean unfavorable impact of 1.9%2.2% on the Mexico segment’s cost of goods sold for the year ended December 31, 20202023, as compared to 2019.the same period in 2022.
EMEA Segment
The decrease in income from operations in the EMEA segment for the year ended December 31, 20202023, as compared to the same period in 20192022 was primarily drivendue to inflation impacting operating costs that we were not able to pass on to our customers, increased labor costs as a result of wage increases in Türkiye, and an adverse cumulative catch-up adjustment as a result of changes in certain of our estimated costs to complete our performance obligations. This decrease was partially offset by increased warranty costs, decreasedan increase in the volume of wind blades produced in 2023 as compared to 2022 due to a brief labor disruption in Türkiye in the third quarter of 2022 as we worked with the union to resolve inflationary pressures on wages, an increase in wind blade production at our two Turkey manufacturing facilities due to the COVID-19 pandemic during the second quarter of 2020prices, cost savings initiatives, and COVID-19 related costs associated with the health and safety of our associates and non-productive labor, the increased transition costs at one of our Turkey manufacturing facilities, partially offset by favorable foreign currency fluctuations. The fluctuating U.S. dollar relative to the Turkish Lira and Euro had a favorable impact of 3.2%5.2% on the EMEA segment's cost of goods sold, for the year ended December 31, 20202023, as compared to 2019.the same period in 2022.
India Segment
47
The increase in the lossincome from operations in the India segment for the year ended December 31, 20202023, as compared to the same period in 20192022, was primarily due to an increase in the increased startup costs related to our India manufacturingvolume of wind blades produced and operational efficiencies as the facility during 2020.was ramping up production in early 2022.
Other income (expense)
The following table summarizes our total other income (expense) for the years ended December 31:
|
|
|
|
|
|
|
|
|
|
|
| |||||
|
|
|
|
| Change |
| ||||||||||
|
| 2020 |
|
| 2019 |
|
| $ |
|
| % |
| ||||
|
| (in thousands) |
|
|
|
|
| |||||||||
Interest income |
| $ | 102 |
|
| $ | 157 |
|
| $ | (55 | ) |
|
| -35.0 | % |
Interest expense |
|
| (10,501 | ) |
|
| (8,179 | ) |
|
| (2,322 | ) |
|
| -28.4 | % |
Foreign currency loss, net |
|
| (19,986 | ) |
|
| (4,107 | ) |
|
| (15,879 | ) |
| NM |
| |
Miscellaneous income |
|
| 3,876 |
|
|
| 3,648 |
|
|
| 228 |
|
|
| 6.3 | % |
Total other expense |
| $ | (26,509 | ) |
| $ | (8,481 | ) |
| $ | (18,028 | ) |
| NM |
| |
47
|
|
|
|
|
|
|
| Change |
| |||||||
|
| 2023 |
|
| 2022 |
|
| $ |
|
| % |
| ||||
|
| (in thousands) |
|
|
|
| ||||||||||
Interest expense, net |
| $ | (12,112 | ) |
| $ | (5,029 | ) |
| $ | (7,083 | ) |
|
| (140.8 | )% |
Foreign currency |
|
| (5,162 | ) |
|
| 4,571 |
|
|
| (9,733 | ) |
|
| (212.9 | ) |
Miscellaneous income |
|
| 1,976 |
|
|
| 2,330 |
|
|
| (354 | ) |
|
| (15.2 | ) |
Total other income (expense) |
| $ | (15,298 | ) |
| $ | 1,872 |
|
| $ | (17,170 | ) |
| NM |
| |
The increasechange in the total other expenseincome (expense) for the year ended December 31, 20202023, as compared to the same period in 20192022, was primarily due to increases inunfavorable foreign currency loss,fluctuations and an increase in interest expense, net primarily due to net Euro liability exposure against the Turkish Lira in the current year period as compared to the same period in 2019. issuance of $132.5 million of convertible senior unsecured notes.
Income taxes
Income tax provision
The following table summarizes our income tax provisiontaxes for the years ended December 31:
|
|
|
|
|
|
|
|
|
|
|
| |||||
|
|
|
|
| Change |
| ||||||||||
|
| 2020 |
|
| 2019 |
|
| $ |
|
| % |
| ||||
|
| (in thousands) |
|
|
|
|
| |||||||||
Income tax provision |
| $ | 11,284 |
|
| $ | 23,115 |
|
| $ | (11,831 | ) |
|
| -51.2 | % |
Effective tax rate |
|
| -145.7 | % |
|
| 312.1 | % |
|
|
|
|
|
|
|
|
The decrease in the
|
|
|
|
|
|
|
| Change |
| |||||||
|
| 2023 |
|
| 2022 |
|
| $ |
|
| % |
| ||||
|
| (in thousands) |
|
|
|
| ||||||||||
Income tax provision |
| $ | (17,562 | ) |
| $ | (29,613 | ) |
| $ | 12,051 |
|
|
| 40.7 | % |
Effective tax rate |
|
| 9.8 | % |
|
| 114.2 | % |
|
|
|
|
|
| ||
Our income tax provision for the year ended December 31, 20202023, as compared to the same period in 2019 was primarily2022 decreased due to the mix of earnings of our operations in foreign jurisdictions and changes in our uncertain tax benefits from the effect of tax law changes and the release of valuation allowances in certain jurisdictions, partially offset by lower pretax income related to the earnings mix by jurisdiction and unrecognized tax benefits in the year ended December 31, 2020 as compared to the same period in 2019.positions.
Net loss from continuing operations
The following table summarizes our net loss from continuing operations for the years ended December 31:
|
|
|
|
|
|
|
|
|
|
|
| |||||
|
|
|
|
| Change |
| ||||||||||
|
| 2020 |
|
| 2019 |
|
| $ |
|
| % |
| ||||
|
| (in thousands) |
|
|
|
|
| |||||||||
Net loss |
| $ | 19,027 |
|
| $ | 15,708 |
|
| $ | 3,319 |
|
|
| 21.1 | % |
|
|
|
|
|
|
|
| Change | ||||||
|
| 2023 |
|
| 2022 |
|
| $ |
|
| % | |||
|
| (in thousands) |
|
|
| |||||||||
Net loss from |
| $ | (196,453 | ) |
| $ | (55,550 | ) |
| $ | (140,903 | ) |
| NM |
The increase in the net loss for the year ended December 31, 20202023 as compared to the same period in 20192022 was primarily due to the reasons set forth above. In addition, we estimate that
Net loss from discontinued operations
The following table summarizes our net loss duringfrom discontinued operations for the yearyears ended December 31, 2020 was adversely impacted by approximately $26.5 million, net of taxes, based upon the forecasted gross margin on the wind blade sets we had forecasted to produce at our Mexico, China, Iowa, Turkey and India manufacturing facilities31:
|
|
|
|
|
|
|
| Change |
| |||||||
|
| 2023 |
|
| 2022 |
|
| $ |
|
| % |
| ||||
|
| (in thousands) |
|
|
|
| ||||||||||
Net loss from |
| $ | (5,326 | ) |
| $ | (9,755 | ) |
| $ | 4,429 |
|
|
| 45.4 | % |
48
The change in the period under non-cancellable purchase orders associated with our long-term contracts but were unable to do so as a result of the COVID-19 pandemic. The COVID-19 pandemic required these manufacturing facilities to either temporarily suspend production or operate at reduced production levels due primarily to certain applicable government-mandated stay at home orders in response to the COVID-19 pandemic, demands from certain of our labor unions to suspend or reduce production and general safety concerns of our associates. In addition, during the period we incurred $15.5 million, net of taxes, of COVID-19 related costs associated with the health and safety of our associates and non-productive labor. The diluted net loss per share was $0.54from discontinued operations for the year ended December 31, 2020,2023 as compared to the same period in 2022, was primarily due to the closure of production at our Yangzhou, China facility at the end of 2022. In September 2023, we completed the sale of our Taicang, China facility, received proceeds of $12.8 million, and recorded a diluted net loss per sharegain on the sale of $0.45 for the year ended December 31, 2019. $0.4 million.
Year Ended December 31, 20192022 Compared to Year Ended December 31, 20182021
For a comparison of our results of operations for the years ended December 31, 20192022 and 2018,2021, see “Management’s Discussion and Analysis of Financial Condition and Results of Operations—Results of Operations” included in Part II, Item 7 of our Annual Report on Form 10-K for the year ended December 31, 2019,2022, filed with the SEC on March 2, 2020February 22, 2023 and incorporated herein by reference.
LIQUIDITY AND CAPITAL RESOURCES
As a result of the uncertainty relating to: (i) the rapidly evolving nature, magnitude and duration of the COVID-19 pandemic, (ii) the variety of measures implemented by governments around the world to address its effects and (iii) the impact on our manufacturing operations, we have and will continue to manage our liquidity to ensure our long-term viability until the COVID-19 pandemic abates. During the year ended December 31, 2020, we had net borrowings of $58.7 million under our Credit Agreement. In addition, during the year ended December 31, 2020,November 2021, we entered into or amended four unsecureda Series A Preferred Stock Purchase Agreement with Oaktree Power Opportunities Fund V (Delaware) Holdings, L.P., OPPS TPIC Holdings, LLC, and Oaktree Phoenix Investment Fund L.P. (collectively, the Purchasers), pursuant to which we issued and sold to the Purchasers 350,000 shares of Series A Preferred Stock, par value $0.01 per share, for an aggregate purchase price of $350.0 million. We used $181.2 million of the net proceeds from the issuance and sale of the Series A Preferred Stock to repay all outstanding indebtedness under our previous senior secured credit agreementsfacility and terminated such credit facility. The remainder of the net proceeds were used for general corporate purposes. In connection with four Turkish financial institutionsthe transaction, we also issued warrants to purchase 4,666,667 shares of common stock at an exercise price of $0.01 per share to the Series A Preferred Stockholders. In August 2022, the Series A Preferred Stockholders exercised the outstanding, fully vested warrants at a price of $0.01 per share to purchase an aggregate of 4,666,667 shares of common stock on a cashless basis, resulting in the net borrowingsissuance to the Purchasers of $25.1an aggregate of 4,664,155 shares of common stock. On December 14, 2023, we entered into the Credit Agreement and a Common Stock Purchase Agreement with the Purchasers, pursuant to which all of the outstanding shares of Series A Preferred Stock, along with $86.0 million of and current availabilityunpaid dividends on the Series A Preferred Stock, were exchanged for the $393.0 million Term Loan and the issuance of $52.9 million. 3,899,903 shares of common stock. See Note 12, Debt and Note 15, Mezzanine Equity, to Consolidated Financial Statements in Part II, Item 8 of this Annual Report on Form 10-K, for further discussion on the Series A Preferred Stock Purchase Agreement.
48
Our primary needs for liquidity have been, and in the future will continue to be, capital expenditures, purchases of raw materials, new facility startup costs, the impact of transitions, working capital, debt service costs, warranty costs and warranty costs.restructuring costs associated with the optimization of our global footprint. Our capital expenditures have been primarily related to machinery and equipment for new facilities or facility expansions. Historically, we have funded our working capital needs through cash flows from operations, the proceeds received from our credit facilities and from proceeds received from the issuance of stock. We had net borrowingsproceeds under our financing arrangements of $75.7$124.6 million for the year ended December 31, 20202023 as compared to net repayments under our financing arrangements of $2.1 million and $8.9$13.7 million for the yearsyear ended December 31, 20192022. As of December 31, 2023 and 2018,2022, we had $485.2 million and $61.2 million in outstanding indebtedness, net of debt issuance costs and discounts, respectively. As of December 31, 2020 and 2019, we had $217.9 million and $142.1 million in outstanding indebtedness, excluding debt issuance costs, respectively. As of December 31, 2020,2023, we had an aggregate of $120.5$68.8 million of remaining capacity of cash and $94.2non-cash financing, including $63.5 million of remaining availability for cash borrowing under our various credit facilities. Working capital requirements have increased as a result of our overall growth and the need to fund higher accounts receivable and inventory levels as our business volumes have increased. Based upon current and anticipated levels of operations, we believe that cash on hand, available credit facilities and cash flow from operations will be adequate to fund our working capital and capital expenditure requirements and to make required payments of principal and interest on our indebtedness over the next twelve months.
We anticipate that any new facilities and future facility expansions will be funded through cash flows from operations, the incurrence of other indebtedness and other potential sources of liquidity. The Term Loan contains certain covenants and rights including, but not limited to, amount of indebtedness, capital expenditure limitations, a U.S. cash on hand balance requirement of $40.0 million through September 30, 2024 and $50.0 million thereafter.
At December 31, 20202023 and 2019,2022, we had unrestricted cash and cash equivalents and short-term investments totaling $129.9$161.1 million and $70.3$133.6 million, respectively. The December 31, 20202023 balance includes $61.0included $45.0 million of cash located outside of the United States, including $47.4U.S., $40.6 million in China, $6.0 million in Turkey, $5.0Türkiye, $1.9 million in India, $2.1$1.2 million in Mexico and $0.5$1.3 million in other countries. The December 31, 2022 balance included $9.2 million of cash located outside of the U.S., $2.4 million in Türkiye, $4.7
49
million in India, $1.4 million in Mexico and $0.7 million in other countries. In February 2020,addition to these amounts, at December 31, 2023 and 2022, we entered into an Incremental Facility Agreement with the current lendershad unrestricted cash and cash equivalents related to our Credit Agreementdiscontinued operations of $0.9 million and $9.7 million, respectively, all located outside of the U.S.
We are not presently involved in any off-balance sheet arrangements, including transactions with unconsolidated special-purpose or other entities that would materially affect our financial position, results of operations, liquidity or capital resources, other than our accounts receivable assignment agreements described below. Furthermore, we do not have any relationships with special-purpose or other entities that provide off-balance sheet financing; liquidity, market risk or credit risk support; or engage in leasing or other services that may expose us to liability or risks of loss that are not reflected in the consolidated financial statements and related notes.
Our segments enter into accounts receivable assignment agreements with various financial institutions. Under these agreements, the financial institution buys, on a non-recourse basis, the accounts receivable amounts related to our segment’s customers at an additional lender, pursuant to whichagreed-upon discount rate.
The following table summarizes certain key details of each of the aggregate principal amountaccounts receivable assignment agreements in place as of our revolving credit facilityDecember 31, 2023:
Year Of Initial Agreement | Segment(s) Related To | Current Annual Interest Rate | ||
2014 | Mexico | LIBOR plus 0.75% | ||
2019 | Asia and Mexico | LIBOR plus 1.00% | ||
2019 | Asia | Fixed rate of 3.85% | ||
2020 | EMEA | EURIBOR plus 1.95% | ||
2020 | India | LIBOR plus 1.00% | ||
2020 | U.S. | SOFR plus 0.29% | ||
2021 | Mexico | SOFR plus 0.29% | ||
2022 | EMEA | EURIBOR plus 1.97% |
As the receivables are purchased by the financial institutions under the Credit Agreement was increasedagreements noted above, the receivables are removed from $150.0 million to $205.0 million.
Our ability to repatriate funds from China toour consolidated balance sheet. During the United States is subject to a number of restrictions imposed by the Chinese government. We repatriate funds through several technology license and corporate/administrative service agreements. We are compensated quarterly based on agreed upon royalty rates for such intellectual property licenses and quarterly fees for those services. Certain of our subsidiaries are limited in their ability to declare dividends without first meeting statutory restrictions of China, including retained earnings as determined under Chinese-statutory accounting requirements. Until 50% ($26.6 million) of registered capital is contributed to a surplus reserve, our China operations can only pay dividends equal to 90% of after-tax profits (10% must be contributed to the surplus reserve). Once the surplus reserve fund requirement is met, our China operations can pay dividends equal to 100% of after-tax profit assuming other conditions are met. Atyears ended December 31, 2020,2023 and 2022, $1,026.1 million and $913.5 million, respectively, of receivables were sold under the amount of the surplus reserve fund was $7.0 million.accounts receivable assignment agreements described above.
Cash Flow Discussion
The following table summarizes our key cash flow activity for continuing and discontinued operations for the years ended December 31:
|
| 2020 |
|
| 2019 |
|
| $ Change |
| |||
|
| (in thousands) |
| |||||||||
Net cash provided by operating activities |
| $ | 37,570 |
|
| $ | 57,084 |
|
| $ | (19,514 | ) |
Net cash used in investing activities |
|
| (65,666 | ) |
|
| (75,510 | ) |
|
| 9,844 |
|
Net cash provided by financing activities |
|
| 88,612 |
|
|
| 970 |
|
|
| 87,642 |
|
Impact of foreign exchange rates on cash, cash equivalents and restricted cash |
|
| (2,069 | ) |
|
| (171 | ) |
|
| (1,898 | ) |
Net change in cash, cash equivalents and restricted cash |
| $ | 58,447 |
|
| $ | (17,627 | ) |
| $ | 76,074 |
|
49
|
| 2023 |
|
| 2022 |
|
| $ Change |
| |||
|
| (in thousands) |
| |||||||||
Net cash used in operating activities |
| $ | (80,972 | ) |
| $ | (62,272 | ) |
| $ | (18,700 | ) |
Net cash used in investing activities |
|
| (23,301 | ) |
|
| (18,832 | ) |
|
| (4,469 | ) |
Net cash provided by (used in) financing activities |
|
| 121,994 |
|
|
| (14,597 | ) |
|
| 136,591 |
|
Impact of foreign exchange rates on cash, cash |
|
| 2,023 |
|
|
| (3,448 | ) |
|
| 5,471 |
|
Net change in cash, cash equivalents |
| $ | 19,744 |
|
| $ | (99,149 | ) |
| $ | 118,893 |
|
Operating Cash Flows
Net cash provided byused in operating activities decreasedincreased by $19.5$18.7 million for the year ended December 31, 20202023 as compared to the same period in 20192022 primarily as the result of decreased operating resultsan increase in net losses, partially offset by a reduction in wind blade inventory included in contract assets driven by working capital initiatives and certain changesthe wind down of production for wind blade lines in our working capital.transition.
50
Investing Cash Flows
Net cash used in investing activities decreasedincreased by $9.8$4.5 million for the year ended December 31, 20202023 as compared to the same period in 20192022 primarily as the result of a decreasean increase in capital expenditures.expenditures, partially offset by proceeds from the sale of our Taicang, China facility.
We anticipate fiscal year 20212024 capital expenditures of between $55$25 million to $65 million and we estimate that the cost that we will incur after December 31, 2020 to complete our current projects in process will be approximately $13.8$30 million. We have used, and will continue to use, cash flows from operations, the proceeds received from our credit facilities and the proceeds received from the issuance of stock for major projects currently being undertaken, which include our manufacturing facility in Chennai, India and the continued investment in our existing Turkey, Mexico, China and U.S.manufacturing facilities.
Financing Cash Flows
Net cash provided by financing activities increased by $87.6$136.6 million for the year ended December 31, 20202023 as compared to the same period in 20192022 primarily as the result of increased borrowings on our revolving loans and other growth-related debt, as well as increased proceeds from the exercise$132.5 million convertible notes and proceeds from the loan to finance our purchase of stock options.the wind turbines in Türkiye.
For a discussion and comparison of our cash flows for the years ended December 31, 2022 and 2021, see “Management’s Discussion and Analysis of Financial Condition and Results of Operations—Results of Operations” included in Part II, Item 7 of our Annual Report on Form 10-K for the year ended December 31, 2022, filed with the SEC on February 22, 2023 incorporated herein by reference.
Our Indebtedness
For a discussion of our indebtedness, refer to Note 11 - Long-Term 12, Debt Net of Debt Issuance Costs and Current Maturities, of the Notes to Consolidated Financial Statements in Part II, Item 8 of this Annual Report on Form 10-K.
Other Contingencies
For a discussion of our legal proceedings, refer to Note 14 – 17, Commitments and Contingencies – (b) Legal Proceedings, of the Notes to Consolidated Financial Statements in Part II, Item 8 of this Annual Report on Form 10-K.
The wind blades and other composite structures that we produce are subject to warranties against defects in workmanship and materials, generally for a period of two to five years. We are not responsible for the fitness for use of the wind blade or the overall wind turbine system. If a wind blade is found to be defective during the warranty period as a result of a defect in workmanship or materials, among other potential remedies, we may need to repair or replace the wind blade (which could include significant transportation and installation costs) at our sole expense. At December 31, 20202023 and 2019,2022, we had accrued warranty reserves totaling $50.9$37.5 million and $47.6$22.3 million, respectively.
As of December 31, 2020,2023, we had no material operating expenditures for environmental matters, including government imposed remedial or corrective actions, during the year ended December 31, 2020.
Off-Balance Sheet Transactions
We are not presently involved in any off-balance sheet arrangements, including transactions with unconsolidated special-purpose or other entities that would materially affect our financial position, results of operations, liquidity or capital resources, other than our accounts receivable assignment agreements described below. Furthermore, we do not have any relationships with special-purpose or other entities that provide off-balance sheet financing; liquidity, market risk or credit risk support; or engage in leasing or other services that may expose us to liability or risks of loss that are not reflected in the consolidated financial statements and related notes.
50
Our segments enter into accounts receivable assignment agreements with various financial institutions. Under these agreements, the financial institution buys, on a non-recourse basis, the accounts receivable amounts related to our segment’s customers at an agreed-upon discount rate.2023.
The following table summarizes certain key details of each of the accounts receivable assignment agreements in place as of December 31, 2020:
|
|
| ||
|
|
| ||
|
|
| ||
|
|
| ||
|
|
| ||
|
|
| ||
|
|
| ||
|
|
| ||
|
|
| ||
|
|
|
As the receivables are purchased by the financial institutions under the agreements noted above, the receivables are removed from our consolidated balance sheet. During the years ended December 31, 2020 and 2019, $1,251.5 million and $776.2 million, respectively, of receivables were sold under the accounts receivable assignment agreements described above.
Contractual Obligations
The following table summarizes certain of our contractual obligations as of December 31, 2020:
|
| Payments Due by Period |
| |||||||||||||||||
|
| Less than 1 year |
|
| 1-3 years |
|
| 3-5 years |
|
| More than 5 years |
|
| Total |
| |||||
|
| (in thousands) |
| |||||||||||||||||
Long-term debt obligations(1) |
| $ | 32,551 |
|
| $ | 185,150 |
|
| $ | 217 |
|
| $ | — |
|
| $ | 217,918 |
|
Operating lease obligations(2) |
|
| 34,798 |
|
|
| 62,644 |
|
|
| 54,004 |
|
|
| 98,764 |
|
|
| 250,210 |
|
Purchase obligations |
|
| 2,568 |
|
|
| 2,465 |
|
|
| 714 |
|
|
| — |
|
|
| 5,747 |
|
Estimated interest payments(3) |
|
| 7,529 |
|
|
| 8,904 |
|
|
| 6 |
|
|
| — |
|
|
| 16,439 |
|
Total contractual obligations |
| $ | 77,446 |
|
| $ | 259,163 |
|
| $ | 54,941 |
|
| $ | 98,764 |
|
| $ | 490,314 |
|
|
|
|
|
|
|
CRITICAL ACCOUNTING POLICIES AND ESTIMATES
Our discussion and analysis of our financial condition and results of operations are based upon our consolidated financial statements, which have been prepared in accordance with GAAP. The preparation of these consolidated financial statements requires us to make estimates and judgments that affect the reported amount of our assets, liabilities, revenue and expenses and related disclosure of contingent assets and liabilities. We evaluate our estimates on an ongoing basis, including those related to revenue recognition, income taxes and warranty expense. We base our estimates on our historical experience and on various other assumptions that we believe to be reasonable under the circumstances, the results of which form the basis for making the judgments we make about the carrying values of our assets and liabilities that are not readily apparent from other sources. Because these estimates can vary depending on the situation, actual results may differ from the estimates.
51
We believe the following critical accounting policies affect our more significant judgments used in the preparation of our consolidated financial statements.
Revenue Recognition. The majority of our revenue is generated from long-term contractssupply agreements associated with manufacturing of wind blades and related services. We account for a long-term contractsupply agreement when it has the approval from both parties, the rights of the parties are identified, payment terms are established, the contract has commercial substance and the collectability of consideration is probable. Our manufacturing services are customer specific and involve production of items that cannot be sold to other customers due to the customers’ protected intellectual property.IP.
Revenue is primarily recognized over time as we have an enforceable right to payment upon termination and we may not use or sell the product to fulfill other customers’ contracts.supply agreements. Because control transfers over time, revenue is recognized based on the extent of progress towards the completion of the performance obligation under the cost-to-cost input measure of progress as this method provides the best representation of the production progress towards satisfaction of the performance obligation. Under the cost-to-cost method, progress and the related revenue recognition is determined by a ratio of direct costs incurred to date in fulfillment of the performance obligation to the total estimated direct costs required to complete the performance obligation.
Determining the revenue to be recognized for services performed under our manufacturing contractssupply agreements involves judgments and estimates relating to the total consideration to be received and the expected direct costs to complete the performance obligation. Our estimates of variable consideration and determination of whether to include estimated amounts in the transaction price are based largely on an assessment of our anticipated performance and all information available to us at the time of the estimate and may materially change as additional information becomes known.
Under the cost-to-cost method, contract assets established primarily relate to our rights to consideration for work completed but not billed at the reporting date on manufacturing services contracts.our supply agreements. The contract assets are transferred to accounts receivable when the rights become unconditional, which generally occurs when customers are invoiced upon the determination that a product conforms to the contract specifications.
See Note 1 – Summary of Operations and Summary of Significant Accounting Policies – (c) Revenue Recognition of the Notes to Consolidated Financial Statements in Part II, Item 8 of this Annual Report on Form 10-K, for further discussion of our accounting policies related to revenue recognition, including accounting policies surrounding our non-manufacturing related services.
Income Taxes. In connection with preparing our consolidated financial statements, we are required to estimate our income taxes in each of the jurisdictions in which we operate. This process involves our assessment of any net operating loss carryforwards, as well as estimating our actual current tax liability together with assessing temporary differences resulting from differing treatment of items, such as reserves and accrued liabilities, for tax and accounting purposes. We also have to assess whether any portion of our earnings generated in one taxing jurisdiction might be claimed as earned by income tax authorities in a differing tax jurisdiction. Significant judgment is required in determining our annual tax rate, the allocation of earnings to various jurisdictions and the evaluation of our tax positions.
In the normal course of business, we establish valuation allowances for our deferred tax assets when the realization of the assets is not more likely than not. We intend to maintain such valuation allowances on our deferred tax assets until there is sufficient evidence to support the reversal of all or some portion of the allowances. Historically, we determined thatWe maintain a valuation allowance for all of our U.S. deferred tax assets was appropriate, however duringin the third quarter of 2018, we reversed a portion of the U.S. valuation allowance, based on the available evidence at that time. In 2019 a full valuation allowance was recorded, Switzerland, Spain and for our discontinued operations in Taicang and India. Given our anticipated future earnings in India from becoming fully operational in 2020, we reversed the valuation allowance in that jurisdiction in 2020.China. The effect of a change in judgment concerning the realizability of deferred tax assets is included in our income tax provision.
52
As of December 31, 2020,2023, we have U.S. federal net operating losses (NOLs) of approximately $103.0$392.7 million, state NOLs of approximately $253.2$317.0 million, foreign NOLs of approximately $41.0$4.7 million and foreign tax credits of approximately $1.9 million available to offset future taxable income in the U.S., China and India.
In December 2017, the Tax Cuts and Jobs Act (Tax Reform) was signed into law, which significantly revised U.S. tax law by, among other things, lowering the statutory federal corporate income tax rate from 35% to 21% for tax years beginning after December 31, 2017, eliminating certain deductions, imposing a mandatory one-time transition tax, introducing new tax regimes, and changing how foreign earnings are subject to U.S. tax. Tax Reform also includes many new provisions, such as changes to bonus depreciation, changes to deductions for executive compensation, interest expense limitations, NOL deduction limitations, tax on global intangible low tax income (GILTI) earned by foreign corporate subsidiaries, the base erosion anti abuse tax (BEAT), and a deduction for foreign derived intangible income (FDII).
As of December 31, 2018, we completed the accounting for the enactment-date income tax effects of Tax Reform, which resulted in an immaterial impact to our financial statements. Upon further analyses of certain aspects of Tax Reform, and refinement of calculations during 2018, we increased our provisional amount of previously untaxed foreign earnings by $13.8 million, to $88.1 million. This resulted in no change to our U.S. federal income tax expense due to the impact of foreign tax credits. In addition, the provisional net tax expense, which was estimated at approximately $0.1 million, primarily attributable to the reduction in the federal tax rate, was unchanged and we made a policy election to account for any impacts of GILTI tax in the period in which it is incurred.
Spain. Income tax expense or benefit, deferred tax assets and liabilities, and liabilities for unrecognized tax benefits reflect our best estimate of current and future taxes to be paid. We are subject to income taxes in both the U.S. and numerous foreign jurisdictions in which we operate, principally, China, Mexico, India and Turkey.Türkiye, and our discontinued operations in China. Significant judgements and estimates are required in determining our consolidated income tax expense. The statutory federal corporate income tax rate in the U. S. is 21% and the tax rates in China, Mexico, India and TurkeyTürkiye are 25%, 30%, 17% and 22%, respectively. Our second Turkey facilityOne of our two Türkiye facilities is located in a tax-free zone and is not subject to income taxes on earnings recognized from its manufacturing activities.
Warranty Expense. The wind blades we manufacture are subject to warranties against defects in workmanship and materials, generally for a period of two to five years. We are not responsible for the fitness for use of the wind blade in the overall wind turbine system. If a wind blade is found to be defective during the warranty period as a result of a defect in workmanship or materials, among other potential remedies, we may need to repair or replace the wind blade at our sole expense. We provide warranties for all of our products with terms and conditions that vary depending on the product sold. We record warranty expense based upon our estimate of future repairs using a probability-based methodology that considers previous warranty claims, identified quality issues and industry practices. Once the warranty period has expired, any remaining unused warranty accrual for the specific products is reversed against the current year warranty expense amount.amount, provided that the warranty accrual for other products whose warranty period has not yet expired is sufficient to cover the estimated cost of future repairs for those other products.
Our estimate of warranty expense requires us to make assumptions about matters that are highly uncertain, including future rates of product failure, repair costs, availability of materials, shipping and handling, and de-installation and re-installation costs at customers’ sites, among others. When a potential or actual warranty claim arises, we may accrue additional warranty reserves for the estimated cost of remediation or proposed settlement. In 2020,2023, we accrued additional warranty expenses of approximately $12.9$42.7 million beyond the normal warranty expense describedescribed above related to a remediation campaign for a specific wind blade model for one of our customers. We have not experienced any materialIn 2022, we accrued additional warranty expenses of approximately $7.2 million beyond the provisionnormal warranty expense described above in the years ended December 31, 2019 and 2018. However, changesrelated to a remediation campaign for a specific wind blade model for one of our customers. Changes in warranty reserves could have a material effect on our consolidated financial statements. For example, as of December 31, 2020,2023, a hypothetical change of 10% in the estimated warranty accrual rate of 1% across all productsour warranty reserve would have resulted in a change theto our warranty accrual byreserve of approximately $42.5$5.1 million.
53
Recent Accounting Pronouncements
For a discussion of recent accounting pronouncements, see Note 1 – Summary of Operations and Summary of Significant Accounting Policies of the Notes to Consolidated Financial Statements in Part II, Item 8 of this Annual Report on Form 10-K.
Item 7A. Quantitative and Qualitative Disclosures About Market Risk
We are exposed to market risk in the ordinary course of our business. These market risks are principally limited to changes in foreign currency exchange rates and commodity prices.
Foreign Currency Risk. We conduct international manufacturing operations related to our continuing operations in China, Mexico, TurkeyTürkiye and India. Our results of operations are subject to both currency transaction risk and currency translation risk. We incur currency transaction risk whenever we enter into either a purchase or sale transaction using a currency other than the local currency of the transacting entity. With respect to currency translation risk, our financial condition and results of operations are measured and recorded in the relevant domesticfunctional currency and then translated into U.S. dollars for inclusion in our consolidated financial statements. In recent years, exchange rates between these foreign currencies and the U.S. dollar have fluctuated significantly and may do so in the future. A hypothetical change of 10% in the exchange rates for the countries above would have resulted in a change to incomeloss from our continuing operations of approximately $46.2$13.6 million and $10.9$5.4 million for the years ended December 31, 20202023 and 2019,2022, respectively.
53
Commodity Price Risk. We are subject to commodity price risk under agreements for the supply of our raw materials. We have not hedged our commodity price exposure. We generally lock in pricing for our key raw materials for 12 months which protects us from price increases within that period. As many of our raw material supply agreements have meet or release clauses, if raw materials prices go down, we are able to benefit from the reductions in price. We believe that this adequately protects us from increases in raw material prices in the near term and also enables us to take full advantage of decreases.
Resin and resin systems are the primary commodities for which we do not have fixed pricing. Approximately 40%59% of the resin and resin systems, and approximately 91% of the carbon fiber, we use areis purchased under contracts either controlled or borne by onetwo of our customers and therefore they receive/bear 100% of any increase or decrease in resin and carbon fiber costs further limiting our exposure to price fluctuations. Prior to taking into account any contractual obligations of our customers to share with us the cost savings or increases resulting from a change in the price of resin and resin systems, we believe that a 10% change in the price of resin and resin systems for the customers in which we are exposed to fluctuating prices would have had an impact to incomeloss from our continuing operations of approximately $10.1$5.7 million and $9.3$7.2 million for the years ended December 31, 20202023 and 2019,2022, respectively. Under our customer supply agreements, our customers typically receive approximately 70% of the cost savings or increases resulting from a change in the price of resin and resin systems.
In late 2019, worldwide demand for balsa wood increased as a result of shortages of other types of core materials. In addition, our supply chain for balsa wood, which is primarily sourced from Ecuador, has been further stressed due to the COVID-19 pandemic. As a result of this increased demand and supply chain disruption, we did have fixed pricing for a portion of our contracts and purchase orders for balsa wood for most of 2020. We believe that a 10% change in the price of balsa wood would have had an impact to income from operations of approximately $8.0 million for the year ended December 31, 2020.
Interest Rate RiskRisk.. As of December 31, 2020, our Credit Agreement includes interest on the unhedged principal amount of $96.2 million which is tied to LIBOR, and our EMEA segment has one general credit agreement2023, all outstanding which is tied to the Euro Interbank Offered Rate (EURIBOR). For a discussion of the interest rate swap arrangement we entered into related to our Credit Agreement, See Note 13 – Financial Instruments of the Notes to Consolidated Financial Statements in Part II, Item 8 of this Annual Report on Form 10-K. The EMEA credit agreement had unsecured financing of $11.2 million and financing of capital expenditures of $4.3 million outstanding as of December 31, 2020. Our Credit Agreement and the one EMEA general credit agreement are the only variable rate debt agreements that we had outstanding as of December 31, 2020 as all remaining working capital loans, secured and unsecured financing and finance lease obligations are fixed rate instruments and are not subject to fluctuations in interest rates. Due to the relatively low LIBOR and EURIBOR rates in effect as of
54
December 31, 2020, a 10% change in the LIBOR or EURIBOR rate would not have had a material impact on our future earnings, fair values or cash flows.
Item 8. Financial Statements and Supplementary Data
The financial statements required to be filed pursuant to this Item 8 are appended to this Report. An index of those financial statements is found in Part IV, Item 15.15 of this Annual Report on Form 10-K.
Item 9. Changes in and Disagreements with Accountants on Accounting and Financial Disclosure
None
Item 9A. Controls and Procedures
Evaluation of Disclosure Controls and Procedures
We maintain disclosure controls and procedures that are designed to provide reasonable assurance that information required to be disclosed in our reports under the Exchange Act is recorded, processed, summarized, and reported within the time period specified in the SEC’s rules and forms and that such information is accumulated and communicated to our management, including our Chief Executive Officer and Chief Financial Officer, as appropriate, to allow timely decisions regarding required disclosure.
As required by Rule 13a-15(b) promulgated under the Exchange Act, our management, with the participation of our Chief Executive Officer and Chief Financial Officer, evaluated the design and operating effectiveness as of December 31, 20202023 of our disclosure controls and procedures, as defined in Rule 13a-15(e) promulgated under the Exchange Act. Based on this evaluation, our Chief Executive Officer and Chief Financial Officer concluded that our disclosure controls and procedures were effective as of December 31, 2020.2023.
Management’s Report on Internal Control Over Financial Reporting
As required by Rules 13a-15(f) promulgated under the Exchange Act, our management is responsible for establishing and maintaining adequate internal control over financial reporting to provide reasonable assurance regarding the reliability of our financial reporting and the preparation of financial statements for external purposes in accordance with U.S. generally accepted accounting principles. Management assessed the effectiveness of our internal control over financial reporting as of December 31, 2020.2023. Management based its assessment on criteria established in Internal Control-Integrated Framework (2013) issued by the Committee of Sponsoring Organizations of the Treadway Commission (COSO). Management's assessment included evaluation of elements such as the design and operating effectiveness of key financial reporting controls, process documentation, accounting policies
54
and our overall control environment. Based on this assessment, management has concluded that our internal control over financial reporting was effective as of December 31, 20202023 to provide reasonable assurance regarding the reliability of financial reporting and the preparation of financial statements for external reporting purposes in accordance with U.S. generally accepted accounting principles. We reviewed the results of management's assessment with the Audit Committee of our Board of Directors.
Our internal control over financial reporting as of December 31, 20202023 has been audited by KPMG LLP, an independent registered public accounting firm, as stated in their report which is included herein.
Changes in Internal Control Over Financial Reporting
There have been no changes in our internal control over financial reporting during the three months ended December 31, 2020,2023, that have materially affected, or are reasonably likely to materially affect, our internal control over financial reporting.
Item 9B. Other Information
Not applicable.
55
PART III
Item 10. Directors, Executive Officers and Corporate Governance
The information required by this Item is incorporated by reference to “Business – Information about our Executive Officers” included in Part 1, Item 1 of this Annual Report on Form 10-K and the information that will be contained in our proxy statement related to the 20212024 Annual Meeting of Stockholders, which we intend to file with the SEC within 120 days of the fiscal year ended December 31, 2020.2023.
Item 11. Executive Compensation
The information required by this Item is incorporated by reference to the information that will be contained in our proxy statement related to the 20212024 Annual Meeting of Stockholders, which we intend to file with the SEC within 120 days of the fiscal year ended December 31, 2020.2023.
Item 12. Security Ownership of Certain Beneficial Owners and Management and Related Stockholder Matters
The information required by this Item is incorporated by reference to the information that will be contained in our proxy statement related to the 20212024 Annual Meeting of Stockholders, which we intend to file with the SEC within 120 days of the fiscal year ended December 31, 2020.2023.
The information required by this Item is incorporated by reference to the information that will be contained in our proxy statement related to the 20212024 Annual Meeting of Stockholders, which we intend to file with the SEC within 120 days of the fiscal year ended December 31, 2020.2023.
Item 14. Principal Accounting Fees and Services
Our independent registered public accounting firm is KPMG LLP, Phoenix, AZ, Auditor Firm ID: 185.
The information required by this Item is incorporated by reference to the information that will be contained in our proxy statement related to the 20212024 Annual Meeting of Stockholders, which we intend to file with the SEC within 120 days of the fiscal year ended December 31, 2020.2023.
56
PART IV
Item 15. Exhibits and Financial Statement Schedules
| (a) Financial Statements and Schedules
|
|
The financial statements listed in the accompanying Index to Consolidated Financial Statements are filed as part of this Annual Report on Form 10-K. All financial statement schedules have been omitted as the required information is not applicable or is not material to require presentation of the schedule, or because the information required is included in the Consolidated Financial Statements and notes thereto of this Annual Report on Form 10-K.
| (b) Exhibits
|
|
See Exhibit Index.
Item 16. Form 10-K Summary
Not applicable.
57
57
INDEX TO CONSOLIDATED FINANCIAL STATEMENTS
Page | |||
F-2 | |||
Consolidated Balance Sheets as of December 31, | F-5 | ||
F-6 | |||
F-7 | |||
F-8 | |||
F-9 | |||
F-11 |
F-1
Report of Independent Registered Public Accounting Firm
To the Stockholders and Board of Directors
TPI Composites, Inc.:
Opinions on the Consolidated Financial Statements and Internal Control Over Financial Reporting
We have audited the accompanying consolidated balance sheets of TPI Composites, Inc. and subsidiaries (the Company) as of December 31, 20202023 and 2019,2022, the related consolidated statements of operations, comprehensive income (loss),loss, changes in mezzanine equity and stockholders’ (deficit) equity, and cash flows for each of the years in the three-year period ended December 31, 2020,2023, and the related notes (collectively, the consolidated financial statements). We also have audited the Company’s internal control over financial reporting as of December 31, 2020,2023, based on criteria established in Internal Control – Integrated Framework (2013)issued by the Committee of Sponsoring Organizations of the Treadway Commission.
In our opinion, the consolidated financial statements referred to above present fairly, in all material respects, the financial position of the Company as of December 31, 20202023 and 2019,2022, and the results of its operations and its cash flows for each of the years in the three-year period ended December 31, 2020,2023, in conformity with U.S. generally accepted accounting principles. Also in our opinion, the Company maintained, in all material respects, effective internal control over financial reporting as of December 31, 20202023 based on criteria established in Internal Control – Integrated Framework (2013) issued by the Committee of Sponsoring Organizations of the Treadway Commission.
Adoption of New Accounting Pronouncement
As discussed in Note 1 to the consolidated financial statements, effective January 1, 2019, the Company changed its method of accounting for leases due to the adoption of Financial Accounting Standards Board Accounting Standard Codification Topic 842, Leases.
Basis for Opinions
The Company’s management is responsible for these consolidated financial statements, for maintaining effective internal control over financial reporting, and for its assessment of the effectiveness of internal control over financial reporting, included in the accompanying Item 9A, Management’sManagement's Report on Internal Control Over Financial Reporting.Reporting. Our responsibility is to express an opinion on the Company’s consolidated financial statements and an opinion on the Company’s internal control over financial reporting based on our audits. We are a public accounting firm registered with the Public Company Accounting Oversight Board (United States) (PCAOB) and are required to be independent with respect to the Company in accordance with the U.S. federal securities laws and the applicable rules and regulations of the Securities and Exchange Commission and the PCAOB.
We conducted our audits in accordance with the standards of the PCAOB. Those standards require that we plan and perform the audits to obtain reasonable assurance about whether the consolidated financial statements are free of material misstatement, whether due to error or fraud, and whether effective internal control over financial reporting was maintained in all material respects.
Our audits of the consolidated financial statements included performing procedures to assess the risks of material misstatement of the consolidated financial statements, whether due to error or fraud, and performing procedures that respond to those risks. Such procedures included examining, on a test basis, evidence regarding the amounts and disclosures in the consolidated financial statements. Our audits also included evaluating the accounting principles used and significant estimates made by management, as well as evaluating the overall presentation of the consolidated financial statements. Our audit of internal control over financial reporting included obtaining an understanding of internal control over financial reporting, assessing the risk that a material weakness exists, and testing and evaluating the design and operating effectiveness of internal control based on the assessed risk. Our audits also included
F-2
performing such other procedures as we considered necessary in the circumstances. We believe that our audits provide a reasonable basis for our opinions.
Definition and Limitations of Internal Control Over Financial Reporting
A company’s internal control over financial reporting is a process designed to provide reasonable assurance regarding the reliability of financial reporting and the preparation of financial statements for external purposes in accordance with generally accepted accounting principles. A company’s internal control over financial reporting includes those policies and procedures that (1) pertain to the maintenance of records that, in reasonable detail, accurately and fairly reflect the transactions and dispositions of the assets of the company; (2) provide reasonable assurance that transactions are recorded as necessary to permit preparation of financial statements in accordance with generally accepted accounting principles, and that receipts and expenditures of the company are being made only in accordance with authorizations of management and directors of the company; and (3) provide reasonable assurance regarding prevention or timely detection of unauthorized acquisition, use, or disposition of the company’s assets that could have a material effect on the financial statements.
Because of its inherent limitations, internal control over financial reporting may not prevent or detect misstatements. Also, projections of any evaluation of effectiveness to future periods are subject to the risk that controls may become inadequate because of changes in conditions, or that the degree of compliance with the policies or procedures may deteriorate.
Critical Audit Matter
The critical audit matter communicated below is a matter arising from the current period audit of the consolidated financial statements that was communicated or required to be communicated to the audit committee and that: (1) relates to accounts or disclosures that are material to the consolidated financial statements and (2) involved our especially challenging, subjective, or complex judgments. The communication of a critical audit matter does not alter in any way our opinion on the consolidated financial statements, taken as a whole, and we are not, by communicating the critical audit matter below, providing a separate opinion on the critical audit matter or on the accounts or disclosures to which it relates.
Variable consideration and direct costs to complete performance obligations for wind blade sales
As discussed in Notes 1 and 23 to the consolidated financial statements, the Company generates the majority of its revenue from long-term contracts associated with manufacturing custom wind blades. Revenue from manufacturing wind blades is primarily recognized over time based on progress towards the completion of the performance obligation in the contract. Progress is determined by the ratio of direct costs incurred to date in fulfillment of the performance obligation to the total estimated direct costs required to complete the performance obligation. The Company recognizes variable consideration for wind blade sales that includes estimates of future contract volumes. Wind blade sales under long-term contracts from continuing operations was $1,580,055$1,394,316 thousand compared to total net sales of $1,670,137$1,455,183 thousand in fiscal 2020.2023.
We identified the evaluation of estimates of future contract volumes and direct costs to complete performance obligations for wind blade sales as a critical audit matter. Evaluating these estimates required a high degree of auditor judgment as changes to the inputs can have a significant effect on the Company’s revenue. Each wind blade contract contains variable consideration that includes estimates of future contract volumes. Each wind blade contract also requires a measure of progress that includes estimates of direct costs to complete the performance obligations.
F-3
The following are the primary procedures we performed to address this critical audit matter. We evaluated the design and tested the operating effectiveness of certain internal controls related to the Company’s process to recognize revenue from wind blade sales. This included controls
F-3
related to estimates of future contract volumes and direct costs to complete the performance obligation. We read a selection of long-term customer contracts, and observed that terms, conditions, and key elements of the contracts were included in the Company’s estimate of future contract volumes. We evaluated the Company’s ability to estimate future contract volumes and direct costs to complete the performance obligations by comparing these estimates to historical results. We evaluated estimated future contract volumes by assessing (1) manufacturing plant capacity, (2) historical production volume, and (3) customer purchase commitments. We evaluated estimated direct costs to complete the performance obligations by examining the estimated amounts agreed upon with the customer and comparing them to historical costs. We compared the estimated future direct cost per blade to historical direct costs per blade and assessed the potential impact of future manufacturing efficiencies. Further, we evaluated historical direct labor cost by wind blade type and manufacturing plant, and analyzed jurisdiction-specific inflation rates based on publicly available data. We assessed current period revenue based upon the estimated consideration, the ratio of direct costs incurred to date in fulfillment of the performance obligations to the total estimated direct costs required to complete the performance obligations, and revenue recognized in previous periods for the performance obligations. obligations
/s/ KPMG LLP
We have served as the Company’s auditor since 2008.
Phoenix, Arizona
February 25, 202122, 2024
F-4
TPI COMPOSITES, INC. AND SUBSIDIARIES
CONSOLIDATED BALANCE SHEETS
|
| December 31, |
| |||||
|
| 2020 |
|
| 2019 |
| ||
|
| (In thousands, except par value data) |
| |||||
Assets |
|
|
|
|
|
|
|
|
Current assets: |
|
|
|
|
|
|
|
|
Cash and cash equivalents |
| $ | 129,857 |
|
| $ | 70,282 |
|
Restricted cash |
|
| 339 |
|
|
| 992 |
|
Accounts receivable |
|
| 132,768 |
|
|
| 184,012 |
|
Contract assets |
|
| 216,928 |
|
|
| 166,515 |
|
Prepaid expenses |
|
| 29,507 |
|
|
| 10,047 |
|
Other current assets |
|
| 27,921 |
|
|
| 29,843 |
|
Inventories |
|
| 10,839 |
|
|
| 6,731 |
|
Total current assets |
|
| 548,159 |
|
|
| 468,422 |
|
Property, plant and equipment, net |
|
| 209,001 |
|
|
| 205,007 |
|
Operating lease right of use assets |
|
| 158,827 |
|
|
| 122,351 |
|
Goodwill |
|
| 2,807 |
|
|
| 2,807 |
|
Intangible assets and deferred costs, net |
|
| 4,146 |
|
|
| 4,170 |
|
Other noncurrent assets |
|
| 33,317 |
|
|
| 23,920 |
|
Total assets |
| $ | 956,257 |
|
| $ | 826,677 |
|
|
|
|
|
|
|
|
|
|
Liabilities and Stockholders’ Equity |
|
|
|
|
|
|
|
|
Current liabilities: |
|
|
|
|
|
|
|
|
Accounts payable and accrued expenses |
| $ | 295,992 |
|
| $ | 293,104 |
|
Accrued warranty |
|
| 50,852 |
|
|
| 47,639 |
|
Current maturities of long-term debt |
|
| 32,551 |
|
|
| 13,501 |
|
Current operating lease liabilities |
|
| 26,099 |
|
|
| 16,629 |
|
Contract liabilities |
|
| 614 |
|
|
| 3,008 |
|
Total current liabilities |
|
| 406,108 |
|
|
| 373,881 |
|
Long-term debt, net of debt issuance costs and current maturities |
|
| 184,316 |
|
|
| 127,888 |
|
Noncurrent operating lease liabilities |
|
| 155,925 |
|
|
| 113,883 |
|
Other noncurrent liabilities |
|
| 8,873 |
|
|
| 5,975 |
|
Total liabilities |
|
| 755,222 |
|
|
| 621,627 |
|
Commitments and contingencies (Note 14) |
|
|
|
|
|
|
|
|
Stockholders’ equity: |
|
|
|
|
|
|
|
|
Common shares, $0.01 par value, 100,000 shares authorized and 36,771 shares issued and 36,564 shares outstanding at December 31, 2020; 100,000 shares authorized and 35,326 shares issued and 35,181 shares outstanding at December 31, 2019 |
|
| 368 |
|
|
| 353 |
|
Paid-in capital |
|
| 349,472 |
|
|
| 322,906 |
|
Accumulated other comprehensive loss |
|
| (32,990 | ) |
|
| (23,612 | ) |
Accumulated deficit |
|
| (109,716 | ) |
|
| (90,689 | ) |
Treasury stock, at cost, 207 shares at December 31, 2020; 145 shares at December 31, 2019 |
|
| (6,099 | ) |
|
| (3,908 | ) |
Total stockholders’ equity |
|
| 201,035 |
|
|
| 205,050 |
|
Total liabilities and stockholders’ equity |
| $ | 956,257 |
|
| $ | 826,677 |
|
F-4
See accompanying notes to consolidated financial statements.
F-5
TPI COMPOSITES, INC. AND SUBSIDIARIES
CONSOLIDATED STATEMENTS OF OPERATIONS
|
| Year Ended December 31, |
| |||||||||
|
| 2020 |
|
| 2019 |
|
| 2018 |
| |||
|
| (In thousands, except per share data) |
| |||||||||
Net sales |
| $ | 1,670,137 |
|
| $ | 1,436,500 |
|
| $ | 1,029,624 |
|
Cost of sales |
|
| 1,561,432 |
|
|
| 1,290,619 |
|
|
| 882,075 |
|
Startup and transition costs |
|
| 44,606 |
|
|
| 68,033 |
|
|
| 74,708 |
|
Total cost of goods sold |
|
| 1,606,038 |
|
|
| 1,358,652 |
|
|
| 956,783 |
|
Gross profit |
|
| 64,099 |
|
|
| 77,848 |
|
|
| 72,841 |
|
General and administrative expenses |
|
| 33,496 |
|
|
| 39,916 |
|
|
| 43,542 |
|
Loss on sale of assets and asset impairments |
|
| 7,748 |
|
|
| 18,117 |
|
|
| 4,581 |
|
Restructuring charges, net |
|
| 4,089 |
|
|
| 3,927 |
|
|
| — |
|
Income from operations |
|
| 18,766 |
|
|
| 15,888 |
|
|
| 24,718 |
|
Other income (expense): |
|
|
|
|
|
|
|
|
|
|
|
|
Interest income |
|
| 102 |
|
|
| 157 |
|
|
| 181 |
|
Interest expense |
|
| (10,501 | ) |
|
| (8,179 | ) |
|
| (10,417 | ) |
Loss on extinguishment of debt |
|
| — |
|
|
| — |
|
|
| (3,397 | ) |
Foreign currency loss, net |
|
| (19,986 | ) |
|
| (4,107 | ) |
|
| (13,489 | ) |
Miscellaneous income |
|
| 3,876 |
|
|
| 3,648 |
|
|
| 4,650 |
|
Total other expense |
|
| (26,509 | ) |
|
| (8,481 | ) |
|
| (22,472 | ) |
Income (loss) before income taxes |
|
| (7,743 | ) |
|
| 7,407 |
|
|
| 2,246 |
|
Income tax benefit (provision) |
|
| (11,284 | ) |
|
| (23,115 | ) |
|
| 3,033 |
|
Net income (loss) |
| $ | (19,027 | ) |
| $ | (15,708 | ) |
| $ | 5,279 |
|
|
|
|
|
|
|
|
|
|
|
|
|
|
Weighted-average common shares outstanding: |
|
|
|
|
|
|
|
|
|
|
|
|
Basic |
|
| 35,532 |
|
|
| 35,062 |
|
|
| 34,311 |
|
Diluted |
|
| 35,532 |
|
|
| 35,062 |
|
|
| 36,002 |
|
|
|
|
|
|
|
|
|
|
|
|
|
|
Net income (loss) per common share: |
|
|
|
|
|
|
|
|
|
|
|
|
Basic |
| $ | (0.54 | ) |
| $ | (0.45 | ) |
| $ | 0.15 |
|
Diluted |
| $ | (0.54 | ) |
| $ | (0.45 | ) |
| $ | 0.15 |
|
See accompanying notes to consolidated financial statements.
F-6
TPI COMPOSITES, INC. AND SUBSIDIARIES
CONSOLIDATED STATEMENTS OF COMPREHENSIVE INCOME (LOSS)
|
| Year Ended December 31, |
| |||||||||
|
| 2020 |
|
| 2019 |
|
| 2018 |
| |||
|
| (In thousands) |
| |||||||||
Net income (loss) |
| $ | (19,027 | ) |
| $ | (15,708 | ) |
| $ | 5,279 |
|
Other comprehensive income (loss): |
|
|
|
|
|
|
|
|
|
|
|
|
Foreign currency translation adjustments |
|
| (8,099 | ) |
|
| (7,026 | ) |
|
| (14,428 | ) |
Unrealized gain (loss) on hedging derivatives, net of taxes of $(200), $(585) and $158 for the years ended December 31, 2020, 2019 and 2018 |
|
| (1,279 | ) |
|
| (2,194 | ) |
|
| 594 |
|
Comprehensive loss |
| $ | (28,405 | ) |
| $ | (24,928 | ) |
| $ | (8,555 | ) |
See accompanying notes to consolidated financial statements.
TPI COMPOSITES, INC. AND SUBSIDIARIES
CONSOLIDATED STATEMENTS OF CHANGES IN STOCKHOLDERS’ EQUITY
|
| Common |
|
| Paid-in |
|
| Accumulated other comprehensive |
|
| Accumulated |
|
| Treasury stock, |
|
| Total stockholders' |
| ||||||||||
|
| Shares |
|
| Amount |
|
| capital |
|
| loss |
|
| deficit |
|
| at cost |
|
| equity |
| |||||||
|
| (In thousands) |
| |||||||||||||||||||||||||
Balance at December 31, 2017 |
|
| 34,049 |
|
| $ | 340 |
|
| $ | 301,543 |
|
| $ | (558 | ) |
| $ | (80,260 | ) |
| $ | (511 | ) |
| $ | 220,554 |
|
Net income |
|
| — |
|
|
| — |
|
|
| — |
|
|
| — |
|
|
| 5,279 |
|
|
| — |
|
|
| 5,279 |
|
Other comprehensive loss |
|
| — |
|
|
| — |
|
|
| — |
|
|
| (13,834 | ) |
|
| — |
|
|
| — |
|
|
| (13,834 | ) |
Common stock repurchased |
|
| — |
|
|
| — |
|
|
| — |
|
|
| — |
|
|
| — |
|
|
| (2,859 | ) |
|
| (2,859 | ) |
Issuances under share-based compensation plan |
|
| 696 |
|
|
| 7 |
|
|
| 2,695 |
|
|
| — |
|
|
| — |
|
|
| 1,582 |
|
|
| 4,284 |
|
Share-based compensation expense |
|
| — |
|
|
| — |
|
|
| 7,533 |
|
|
| — |
|
|
| — |
|
|
| — |
|
|
| 7,533 |
|
Balance at December 31, 2018 |
|
| 34,745 |
|
|
| 347 |
|
|
| 311,771 |
|
|
| (14,392 | ) |
|
| (74,981 | ) |
|
| (1,788 | ) |
|
| 220,957 |
|
Net loss |
|
| — |
|
|
| — |
|
|
| — |
|
|
| — |
|
|
| (15,708 | ) |
|
| — |
|
|
| (15,708 | ) |
Other comprehensive loss |
|
| — |
|
|
| — |
|
|
| — |
|
|
| (9,220 | ) |
|
| — |
|
|
| — |
|
|
| (9,220 | ) |
Common stock repurchased |
|
| — |
|
|
| — |
|
|
| — |
|
|
| — |
|
|
| — |
|
|
| (2,120 | ) |
|
| (2,120 | ) |
Issuances under share-based compensation plan |
|
| 581 |
|
|
| 6 |
|
|
| 5,291 |
|
|
| — |
|
|
| — |
|
|
|
|
|
|
| 5,297 |
|
Share-based compensation expense |
|
| — |
|
|
| — |
|
|
| 5,844 |
|
|
| — |
|
|
| — |
|
|
| — |
|
|
| 5,844 |
|
Balance at December 31, 2019 |
|
| 35,326 |
|
|
| 353 |
|
|
| 322,906 |
|
|
| (23,612 | ) |
|
| (90,689 | ) |
|
| (3,908 | ) |
|
| 205,050 |
|
Net loss |
|
| — |
|
|
| — |
|
|
| — |
|
|
| — |
|
|
| (19,027 | ) |
|
| — |
|
|
| (19,027 | ) |
Other comprehensive loss |
|
| — |
|
|
| — |
|
|
| — |
|
|
| (9,378 | ) |
|
| — |
|
|
| — |
|
|
| (9,378 | ) |
Common stock repurchased |
|
| — |
|
|
| — |
|
|
| — |
|
|
| — |
|
|
| — |
|
|
| (2,191 | ) |
|
| (2,191 | ) |
Issuances under share-based compensation plan |
|
| 1,445 |
|
|
| 15 |
|
|
| 16,569 |
|
|
| — |
|
|
| — |
|
|
| — |
|
|
| 16,584 |
|
Share-based compensation expense |
|
| — |
|
|
| — |
|
|
| 9,997 |
|
|
| — |
|
|
| — |
|
|
| — |
|
|
| 9,997 |
|
Balance at December 31, 2020 |
|
| 36,771 |
|
| $ | 368 |
|
| $ | 349,472 |
|
| $ | (32,990 | ) |
| $ | (109,716 | ) |
| $ | (6,099 | ) |
| $ | 201,035 |
|
See accompanying notes to consolidated financial statements.
TPI COMPOSITES, INC. AND SUBSIDIARIES
CONSOLIDATED STATEMENTS OF CASH FLOWS
|
| Year Ended December 31, |
| |||||||||
|
| 2020 |
|
| 2019 |
|
| 2018 |
| |||
|
| (In thousands) |
| |||||||||
Cash flows from operating activities: |
|
|
|
|
|
|
|
|
|
|
|
|
Net income (loss) |
| $ | (19,027 | ) |
| $ | (15,708 | ) |
| $ | 5,279 |
|
Adjustments to reconcile net income (loss) to net cash provided by (used in) operating activities: |
|
|
|
|
|
|
|
|
|
|
|
|
Depreciation and amortization |
|
| 49,667 |
|
|
| 38,580 |
|
|
| 26,429 |
|
Loss on sale of assets and asset impairments |
|
| 7,748 |
|
|
| 18,117 |
|
|
| 4,581 |
|
Restructuring charges, net |
|
| 4,089 |
|
|
| 3,927 |
|
|
| — |
|
Share-based compensation expense |
|
| 10,352 |
|
|
| 5,681 |
|
|
| 7,795 |
|
Amortization of debt issuance costs |
|
| 351 |
|
|
| 206 |
|
|
| 336 |
|
Loss on extinguishment of debt |
|
| — |
|
|
| — |
|
|
| 3,397 |
|
Deferred income taxes |
|
| (7,982 | ) |
|
| 4,951 |
|
|
| (14,912 | ) |
Changes in assets and liabilities: |
|
|
|
|
|
|
|
|
|
|
|
|
Accounts receivable |
|
| 42,986 |
|
|
| (19,366 | ) |
|
| (59,200 | ) |
Contract assets and liabilities |
|
| (56,150 | ) |
|
| (57,583 | ) |
|
| (7,898 | ) |
Operating lease right of use assets and operating lease liabilities |
|
| 15,036 |
|
|
| 6,953 |
|
|
| — |
|
Inventories |
|
| (4,276 | ) |
|
| (1,145 | ) |
|
| (1,685 | ) |
Prepaid expenses |
|
| (19,916 | ) |
|
| (1,052 | ) |
|
| 1,318 |
|
Other current assets |
|
| 1,491 |
|
|
| (13,692 | ) |
|
| (132 | ) |
Other noncurrent assets |
|
| 734 |
|
|
| (7,177 | ) |
|
| (5,167 | ) |
Accounts payable and accrued expenses |
|
| 6,209 |
|
|
| 80,720 |
|
|
| 32,263 |
|
Accrued warranty |
|
| 3,213 |
|
|
| 10,874 |
|
|
| 6,346 |
|
Other noncurrent liabilities |
|
| 3,045 |
|
|
| 2,798 |
|
|
| (2,008 | ) |
Net cash provided by (used in) operating activities |
|
| 37,570 |
|
|
| 57,084 |
|
|
| (3,258 | ) |
Cash flows from investing activities: |
|
|
|
|
|
|
|
|
|
|
|
|
Purchases of property, plant and equipment |
|
| (65,666 | ) |
|
| (74,408 | ) |
|
| (52,688 | ) |
Acquisition of a business |
|
| — |
|
|
| (1,102 | ) |
|
| — |
|
Net cash used in investing activities |
|
| (65,666 | ) |
|
| (75,510 | ) |
|
| (52,688 | ) |
Cash flows from financing activities: |
|
|
|
|
|
|
|
|
|
|
|
|
Proceeds from revolving and term loans |
|
| 80,000 |
|
|
| 22,000 |
|
|
| 89,435 |
|
Repayments of revolving and term loans |
|
| (21,260 | ) |
|
| — |
|
|
| (74,972 | ) |
Net proceeds from (repayments of) accounts receivable financing |
|
| (3,805 | ) |
|
| (10,719 | ) |
|
| 424 |
|
Proceeds from working capital loans |
|
| — |
|
|
| 3,535 |
|
|
| — |
|
Repayments of working capital loans |
|
| — |
|
|
| (3,535 | ) |
|
| — |
|
Principal repayments of finance leases |
|
| (6,116 | ) |
|
| (9,128 | ) |
|
| — |
|
Net proceeds from (repayments of) other debt |
|
| 26,875 |
|
|
| (4,286 | ) |
|
| (23,763 | ) |
Debt issuance costs |
|
| (730 | ) |
|
| — |
|
|
| (281 | ) |
Proceeds from exercise of stock options |
|
| 15,839 |
|
|
| 5,223 |
|
|
| 4,284 |
|
Repurchase of common stock including shares withheld in lieu of income taxes |
|
| (2,191 | ) |
|
| (2,120 | ) |
|
| (2,859 | ) |
Net cash provided by (used in) financing activities |
|
| 88,612 |
|
|
| 970 |
|
|
| (7,732 | ) |
Impact of foreign exchange rates on cash, cash equivalents and restricted cash |
|
| (2,069 | ) |
|
| (171 | ) |
|
| 617 |
|
Net change in cash, cash equivalents and restricted cash |
|
| 58,447 |
|
|
| (17,627 | ) |
|
| (63,061 | ) |
Cash, cash equivalents and restricted cash, beginning of year |
|
| 71,749 |
|
|
| 89,376 |
|
|
| 152,437 |
|
Cash, cash equivalents and restricted cash, end of year |
| $ | 130,196 |
|
| $ | 71,749 |
|
| $ | 89,376 |
|
See accompanying notes to consolidated financial statements.
TPI COMPOSITES, INC. AND SUBSIDIARIES
CONSOLIDATED STATEMENTS OF CASH FLOWS – CONTINUEDBALANCE SHEETS
|
| Year Ended December 31, |
| |||||||||
|
| 2020 |
|
| 2019 |
|
| 2018 |
| |||
|
| (in thousands) |
| |||||||||
Supplemental cash flow information: |
|
|
|
|
|
|
|
|
|
|
|
|
Cash paid for interest |
| $ | 9,853 |
|
| $ | 8,190 |
|
| $ | 9,904 |
|
Cash paid for income taxes, net of refunds |
|
| 20,965 |
|
|
| 18,640 |
|
|
| 7,246 |
|
Noncash investing and financing activities: |
|
|
|
|
|
|
|
|
|
|
|
|
Right of use assets obtained in exchange for new operating lease liabilities |
|
| 61,455 |
|
|
| 15,855 |
|
|
| — |
|
Property, plant, and equipment obtained in exchange for new finance lease liabilities |
|
| 163 |
|
|
| 5,811 |
|
|
| 21,968 |
|
Accrued capital expenditures in accounts payable |
|
| 7,556 |
|
|
| 14,644 |
|
|
| 5,139 |
|
|
| December 31, |
| |||||
|
| 2023 |
|
| 2022 |
| ||
|
| (In thousands, except par value data) |
| |||||
Assets |
|
|
|
|
|
| ||
Current assets: |
|
|
|
|
|
| ||
Cash and cash equivalents |
| $ | 161,059 |
|
| $ | 133,546 |
|
Restricted cash |
|
| 10,838 |
|
|
| 9,854 |
|
Accounts receivable |
|
| 138,029 |
|
|
| 184,809 |
|
Contract assets |
|
| 112,237 |
|
|
| 215,939 |
|
Prepaid expenses |
|
| 17,621 |
|
|
| 29,119 |
|
Other current assets |
|
| 34,564 |
|
|
| 26,052 |
|
Inventories |
|
| 9,420 |
|
|
| 10,661 |
|
Assets held for sale |
|
| 17,787 |
|
|
| — |
|
Current assets of discontinued operations |
|
| 1,520 |
|
|
| 35,182 |
|
Total current assets |
|
| 503,075 |
|
|
| 645,162 |
|
Property, plant and equipment, net |
|
| 128,808 |
|
|
| 136,841 |
|
Operating lease right of use assets |
|
| 136,124 |
|
|
| 152,312 |
|
Goodwill |
|
| 2,807 |
|
|
| 2,807 |
|
Intangible assets and deferred costs, net |
|
| 2,442 |
|
|
| 3,262 |
|
Other noncurrent assets |
|
| 30,824 |
|
|
| 21,792 |
|
Total assets |
| $ | 804,080 |
|
| $ | 962,176 |
|
|
|
|
|
|
| |||
Liabilities, Mezzanine Equity and Stockholders’ Equity |
|
|
|
|
|
| ||
Current liabilities: |
|
|
|
|
|
| ||
Accounts payable and accrued expenses |
| $ | 227,723 |
|
| $ | 280,499 |
|
Accrued warranty |
|
| 37,483 |
|
|
| 22,347 |
|
Current maturities of long-term debt |
|
| 70,465 |
|
|
| 59,975 |
|
Current operating lease liabilities |
|
| 22,017 |
|
|
| 22,220 |
|
Contract liabilities |
|
| 24,021 |
|
|
| 17,100 |
|
Liabilities held for sale |
|
| 1,897 |
|
|
| — |
|
Current liabilities of discontinued operations |
|
| 2,815 |
|
|
| 54,440 |
|
Total current liabilities |
|
| 386,421 |
|
|
| 456,581 |
|
Long-term debt, net of current maturities |
|
| 414,728 |
|
|
| 1,198 |
|
Noncurrent operating lease liabilities |
|
| 117,133 |
|
|
| 133,363 |
|
Other noncurrent liabilities |
|
| 8,102 |
|
|
| 10,670 |
|
Total liabilities |
|
| 926,384 |
|
|
| 601,812 |
|
Commitments and contingencies (Note 17) |
|
|
|
|
|
| ||
Mezzanine equity: |
|
|
|
|
|
| ||
Series A Preferred Stock, $0.01 par value, 400 shares authorized, 0 |
|
| — |
|
|
| 309,877 |
|
Stockholders’ equity: |
|
|
|
|
|
| ||
Common shares, $0.01 par value, 100,000 shares authorized, 46,990 |
|
| 470 |
|
|
| 424 |
|
Paid-in capital |
|
| 431,335 |
|
|
| 407,570 |
|
Accumulated other comprehensive loss |
|
| (7,627 | ) |
|
| (15,387 | ) |
Accumulated deficit |
|
| (536,348 | ) |
|
| (334,569 | ) |
Treasury stock, at cost, 519 shares at December 31, 2023 and 325 shares |
|
| (10,134 | ) |
|
| (7,551 | ) |
Total stockholders’ (deficit) equity |
|
| (122,304 | ) |
|
| 50,487 |
|
Total liabilities, mezzanine equity and stockholders’ equity |
| $ | 804,080 |
|
| $ | 962,176 |
|
Reconciliation of Cash, Cash Equivalents and Restricted Cash: |
| December 31, |
| |||||||||||||
|
| 2020 |
|
| 2019 |
|
| 2018 |
|
| 2017 |
| ||||
Consolidated Balance Sheets |
| (in thousands) |
| |||||||||||||
Cash and cash equivalents |
| $ | 129,857 |
|
| $ | 70,282 |
|
| $ | 85,346 |
|
| $ | 148,113 |
|
Restricted cash |
|
| 339 |
|
|
| 992 |
|
|
| 3,555 |
|
|
| 3,849 |
|
Restricted cash included within other noncurrent assets |
|
| — |
|
|
| 475 |
|
|
| 475 |
|
|
| 475 |
|
Consolidated Statements Of Cash Flows |
|
|
|
|
|
|
|
|
|
|
|
|
|
|
|
|
Total cash, cash equivalents and restricted cash shown in the consolidated statements of cash flows |
| $ | 130,196 |
|
| $ | 71,749 |
|
| $ | 89,376 |
|
| $ | 152,437 |
|
See accompanying notes to consolidated financial statements.
F-5
TPI COMPOSITES, INC. AND SUBSIDIARIES
CONSOLIDATED STATEMENTS OF OPERATIONS
|
| Year Ended December 31, |
| |||||||||
|
| 2023 |
|
| 2022 |
|
| 2021 |
| |||
|
| (In thousands, except per share data) |
| |||||||||
Net sales |
| $ | 1,455,183 |
|
| $ | 1,522,741 |
|
| $ | 1,472,386 |
|
Cost of sales |
|
| 1,520,974 |
|
|
| 1,482,428 |
|
|
| 1,459,155 |
|
Startup and transition costs |
|
| 21,757 |
|
|
| 25,668 |
|
|
| 50,832 |
|
Total cost of goods sold |
|
| 1,542,731 |
|
|
| 1,508,096 |
|
|
| 1,509,987 |
|
Gross profit (loss) |
|
| (87,548 | ) |
|
| 14,645 |
|
|
| (37,601 | ) |
General and administrative expenses |
|
| 49,133 |
|
|
| 32,349 |
|
|
| 29,246 |
|
Loss on sale of assets and asset impairments |
|
| 21,862 |
|
|
| 9,842 |
|
|
| 12,436 |
|
Restructuring charges, net |
|
| 5,050 |
|
|
| 263 |
|
|
| 12,543 |
|
Loss from continuing operations |
|
| (163,593 | ) |
|
| (27,809 | ) |
|
| (91,826 | ) |
Other income (expense): |
|
|
|
|
|
|
|
|
| |||
Interest expense, net |
|
| (12,112 | ) |
|
| (5,029 | ) |
|
| (13,644 | ) |
Foreign currency income (loss) |
|
| (5,162 | ) |
|
| 4,571 |
|
|
| (21,970 | ) |
Miscellaneous income |
|
| 1,976 |
|
|
| 2,330 |
|
|
| 1,372 |
|
Total other income (expense) |
|
| (15,298 | ) |
|
| 1,872 |
|
|
| (34,242 | ) |
Loss from continuing operations before income taxes |
|
| (178,891 | ) |
|
| (25,937 | ) |
|
| (126,068 | ) |
Income tax provision |
|
| (17,562 | ) |
|
| (29,613 | ) |
|
| (29,826 | ) |
Net loss from continuing operations |
|
| (196,453 | ) |
|
| (55,550 | ) |
|
| (155,894 | ) |
Preferred stock dividends and accretion |
|
| (58,453 | ) |
|
| (58,903 | ) |
|
| (6,040 | ) |
Gain on extinguishment of Series A Preferred Stock |
|
| 82,620 |
|
|
| — |
|
|
| — |
|
Net loss from continuing operations attributable |
|
| (172,286 | ) |
|
| (114,453 | ) |
|
| (161,934 | ) |
Net loss from discontinued operations |
|
| (5,326 | ) |
|
| (9,755 | ) |
|
| (3,654 | ) |
Net loss attributable to common stockholders |
| $ | (177,612 | ) |
| $ | (124,208 | ) |
| $ | (165,588 | ) |
|
|
|
|
|
|
|
|
|
| |||
Weighted-average common shares outstanding: |
|
|
|
|
|
|
|
|
| |||
Basic |
|
| 42,671 |
|
|
| 41,959 |
|
|
| 37,415 |
|
Diluted |
|
| 42,671 |
|
|
| 41,959 |
|
|
| 37,415 |
|
|
|
|
|
|
|
|
|
|
| |||
Net loss from continuing operations per common share: |
|
|
|
|
|
|
|
|
| |||
Basic |
| $ | (4.04 | ) |
| $ | (2.73 | ) |
| $ | (4.33 | ) |
Diluted |
| $ | (4.04 | ) |
| $ | (2.73 | ) |
| $ | (4.33 | ) |
|
|
|
|
|
|
|
|
|
| |||
Net loss from discontinued operations per common share: |
|
|
|
|
|
|
|
|
| |||
Basic |
| $ | (0.12 | ) |
| $ | (0.23 | ) |
| $ | (0.10 | ) |
Diluted |
| $ | (0.12 | ) |
| $ | (0.23 | ) |
| $ | (0.10 | ) |
|
|
|
|
|
|
|
|
|
| |||
Net loss per common share: |
|
|
|
|
|
|
|
|
| |||
Basic |
| $ | (4.16 | ) |
| $ | (2.96 | ) |
| $ | (4.43 | ) |
Diluted |
| $ | (4.16 | ) |
| $ | (2.96 | ) |
| $ | (4.43 | ) |
See accompanying notes to consolidated financial statements.
F-6
TPI COMPOSITES, INC. AND SUBSIDIARIES
CONSOLIDATED STATEMENTS OF COMPREHENSIVE LOSS
|
| Year Ended December 31, |
| |||||||||
|
| 2023 |
|
| 2022 |
|
| 2021 |
| |||
|
| (In thousands) |
| |||||||||
Net loss from continuing operations attributable |
| $ | (172,286 | ) |
| $ | (114,453 | ) |
| $ | (161,934 | ) |
Net loss from discontinued operations |
|
| (5,326 | ) |
|
| (9,755 | ) |
|
| (3,654 | ) |
Net loss attributable to common stockholders |
|
| (177,612 | ) |
|
| (124,208 | ) |
|
| (165,588 | ) |
Other comprehensive loss: |
|
|
|
|
|
|
|
|
| |||
Foreign currency translation adjustments |
|
| 2,317 |
|
|
| 37,685 |
|
|
| (18,419 | ) |
Reclassification of foreign currency translation |
|
| 901 |
|
|
| — |
|
|
| — |
|
Unrealized gain (loss) on hedging derivatives, net of taxes |
|
| 2,304 |
|
|
| 934 |
|
|
| (2,597 | ) |
Reclassification of loss on hedging derivatives, |
|
| 2,238 |
|
|
| — |
|
|
| — |
|
Comprehensive loss |
| $ | (169,852 | ) |
| $ | (85,589 | ) |
| $ | (186,604 | ) |
See accompanying notes to consolidated financial statements.
F-7
TPI COMPOSITES, INC. AND SUBSIDIARIES
|
| Series A Preferred Stock |
|
|
| Common |
|
| Paid-in |
|
| Accumulated other comprehensive |
|
| Accumulated |
|
| Treasury stock, |
|
| Total stockholders' |
| |||||||||||||||
|
| Shares |
|
| Amount |
|
|
| Shares |
|
| Amount |
|
| capital |
|
| loss |
|
| deficit |
|
| at cost |
|
| (deficit) equity |
| |||||||||
|
|
|
|
|
|
|
|
| (In thousands) |
| |||||||||||||||||||||||||||
Balance at December 31, 2020 |
|
| — |
|
|
| — |
|
|
|
| 36,771 |
|
| $ | 368 |
|
| $ | 349,472 |
|
| $ | (32,990 | ) |
| $ | (109,716 | ) |
| $ | (6,099 | ) |
| $ | 201,035 |
|
Net loss |
|
| — |
|
|
| — |
|
|
|
| — |
|
|
| — |
|
|
| — |
|
|
| — |
|
|
| (159,548 | ) |
|
| — |
|
|
| (159,548 | ) |
Preferred stock dividends |
|
| — |
|
|
| 4,114 |
|
|
|
| — |
|
|
| — |
|
|
| (4,114 | ) |
|
| — |
|
|
| — |
|
|
| — |
|
|
| (4,114 | ) |
Other comprehensive loss |
|
| — |
|
|
| — |
|
|
|
| — |
|
|
| — |
|
|
| — |
|
|
| (21,016 | ) |
|
| — |
|
|
| — |
|
|
| (21,016 | ) |
Common stock |
|
| — |
|
|
| — |
|
|
|
| — |
|
|
| — |
|
|
| — |
|
|
| — |
|
|
| — |
|
|
| (493 | ) |
|
| (493 | ) |
Issuances under |
|
| — |
|
|
| — |
|
|
|
| 647 |
|
|
| 6 |
|
|
| 5,239 |
|
|
| — |
|
|
| — |
|
|
| — |
|
|
| 5,245 |
|
Share-based compensation |
|
| — |
|
|
| — |
|
|
|
| — |
|
|
| — |
|
|
| 8,414 |
|
|
| — |
|
|
| — |
|
|
| — |
|
|
| 8,414 |
|
Issuance of Series A |
|
| 350 |
|
|
| 244,934 |
|
|
|
| — |
|
|
| — |
|
|
| — |
|
|
| — |
|
|
| — |
|
|
| — |
|
|
| — |
|
Issuance of warrants to |
|
| — |
|
|
| — |
|
|
|
| — |
|
|
| — |
|
|
| 94,355 |
|
|
| — |
|
|
| — |
|
|
| — |
|
|
| 94,355 |
|
Accretion of Series A |
|
| — |
|
|
| 1,926 |
|
|
|
| — |
|
|
| — |
|
|
| (1,926 | ) |
|
| — |
|
|
| — |
|
|
| — |
|
|
| (1,926 | ) |
Balance at December 31, 2021 |
|
| 350 |
|
|
| 250,974 |
|
|
|
| 37,418 |
|
|
| 374 |
|
|
| 451,440 |
|
|
| (54,006 | ) |
|
| (269,264 | ) |
|
| (6,592 | ) |
|
| 121,952 |
|
Net loss |
|
| — |
|
|
| — |
|
|
|
| — |
|
|
| — |
|
|
| — |
|
|
| — |
|
|
| (65,305 | ) |
|
| — |
|
|
| (65,305 | ) |
Preferred stock dividends |
|
| — |
|
|
| 40,589 |
|
|
|
| — |
|
|
| — |
|
|
| (40,589 | ) |
|
| — |
|
|
| — |
|
|
| — |
|
|
| (40,589 | ) |
Other comprehensive |
|
| — |
|
|
| — |
|
|
|
| — |
|
|
| — |
|
|
| — |
|
|
| 38,619 |
|
|
| — |
|
|
| — |
|
|
| 38,619 |
|
Common stock |
|
| — |
|
|
| — |
|
|
|
| — |
|
|
| — |
|
|
| — |
|
|
| — |
|
|
| — |
|
|
| (959 | ) |
|
| (959 | ) |
Issuances under |
|
| — |
|
|
| — |
|
|
|
| 287 |
|
|
| 3 |
|
|
|
|
|
| — |
|
|
| — |
|
|
| — |
|
|
| 3 |
| |
Share-based compensation |
|
| — |
|
|
| — |
|
|
|
| — |
|
|
| — |
|
|
| 15,080 |
|
|
| — |
|
|
| — |
|
|
| — |
|
|
| 15,080 |
|
Issuance of common stock |
|
| — |
|
|
| — |
|
|
|
| 4,664 |
|
|
| 47 |
|
|
| (47 | ) |
|
| — |
|
|
| — |
|
|
| — |
|
|
| — |
|
Accretion of Series A |
|
| — |
|
|
| 18,314 |
|
|
|
| — |
|
|
| — |
|
|
| (18,314 | ) |
|
| — |
|
|
| — |
|
|
| — |
|
|
| (18,314 | ) |
Balance at December 31, 2022 |
|
| 350 |
|
|
| 309,877 |
|
|
|
| 42,369 |
|
|
| 424 |
|
|
| 407,570 |
|
|
| (15,387 | ) |
|
| (334,569 | ) |
|
| (7,551 | ) |
|
| 50,487 |
|
Net loss |
|
| — |
|
|
| — |
|
|
|
| — |
|
|
| — |
|
|
| — |
|
|
| — |
|
|
| (201,779 | ) |
|
| — |
|
|
| (201,779 | ) |
Preferred stock dividends |
|
| — |
|
|
| 41,507 |
|
|
|
| — |
|
|
| — |
|
|
| (41,507 | ) |
|
| — |
|
|
| — |
|
|
| — |
|
|
| (41,507 | ) |
Other comprehensive |
|
| — |
|
|
| — |
|
|
|
| — |
|
|
| — |
|
|
| — |
|
|
| 7,760 |
|
|
| — |
|
|
| — |
|
|
| 7,760 |
|
Common stock |
|
| — |
|
|
| — |
|
|
|
| — |
|
|
| — |
|
|
| — |
|
|
| — |
|
|
| — |
|
|
| (2,583 | ) |
|
| (2,583 | ) |
Issuances under |
|
| — |
|
|
| — |
|
|
|
| 721 |
|
|
| 7 |
|
|
|
|
|
| — |
|
|
| — |
|
|
| — |
|
|
| 7 |
| |
Share-based compensation |
|
| — |
|
|
| — |
|
|
|
| — |
|
|
| — |
|
|
| 9,881 |
|
|
| — |
|
|
| — |
|
|
| — |
|
|
| 9,881 |
|
Issuance of common |
|
| — |
|
|
| — |
|
|
|
| — |
|
|
| — |
|
|
| — |
|
|
| — |
|
|
| — |
|
|
| — |
|
|
| — |
|
Accretion of Series A |
|
| — |
|
|
| 16,946 |
|
|
|
| — |
|
|
| — |
|
|
| (16,946 | ) |
|
| — |
|
|
| — |
|
|
| — |
|
|
| (16,946 | ) |
Capped call transactions |
|
| — |
|
|
| — |
|
|
|
| — |
|
|
| — |
|
|
| (18,590 | ) |
|
| — |
|
|
| — |
|
|
| — |
|
|
| (18,590 | ) |
Extinguishment of |
|
| (350 | ) |
|
| (368,330 | ) |
|
|
| 3,900 |
|
|
| 39 |
|
|
| 90,927 |
|
|
| — |
|
|
| — |
|
|
| — |
|
|
| 90,966 |
|
Balance at December 31, 2023 |
|
| — |
|
|
| — |
|
|
|
| 46,990 |
|
|
| 470 |
|
|
| 431,335 |
|
|
| (7,627 | ) |
|
| (536,348 | ) |
|
| (10,134 | ) |
|
| (122,304 | ) |
See accompanying notes to consolidated financial statements.
F-8
TPI COMPOSITES, INC. AND SUBSIDIARIES
CONSOLIDATED STATEMENTS OF CASH FLOWS
|
| Year Ended December 31, |
| |||||||||
|
| 2023 |
|
| 2022 |
|
| 2021 |
| |||
|
| (In thousands) |
| |||||||||
Cash flows from operating activities: |
|
|
|
|
|
|
|
|
| |||
Net loss |
| $ | (201,779 | ) |
| $ | (65,305 | ) |
| $ | (159,548 | ) |
Adjustments to reconcile net loss to net cash |
|
|
|
|
|
|
|
|
| |||
Depreciation and amortization |
|
| 38,869 |
|
|
| 45,480 |
|
|
| 52,593 |
|
Provision for credit losses |
|
| 23,323 |
|
|
| — |
|
|
| — |
|
Loss on sale of assets and asset impairments |
|
| 23,332 |
|
|
| 27,372 |
|
|
| 13,110 |
|
Share-based compensation expense |
|
| 9,881 |
|
|
| 15,080 |
|
|
| 8,407 |
|
Amortization of debt issuance costs and debt discount |
|
| 2,151 |
|
|
| — |
|
|
| 1,051 |
|
Paid in kind interest |
|
| 2,041 |
|
|
| — |
|
|
| — |
|
Deferred income taxes |
|
| (11,806 | ) |
|
| 11,484 |
|
|
| 2,126 |
|
Changes in assets and liabilities: |
|
|
|
|
|
|
|
|
| |||
Accounts receivable |
|
| 17,540 |
|
|
| (42,030 | ) |
|
| (34,715 | ) |
Contract assets and liabilities |
|
| 98,255 |
|
|
| (10,331 | ) |
|
| 23,983 |
|
Operating lease right of use assets and operating lease liabilities |
|
| (9,769 | ) |
|
| (4,727 | ) |
|
| 8,771 |
|
Inventories |
|
| 1,871 |
|
|
| (639 | ) |
|
| (1,018 | ) |
Prepaid expenses |
|
| 13,003 |
|
|
| (9,254 | ) |
|
| 9,683 |
|
Other current assets |
|
| (8,283 | ) |
|
| (3,125 | ) |
|
| 4,699 |
|
Other noncurrent assets |
|
| 980 |
|
|
| 4,873 |
|
|
| 11,612 |
|
Accounts payable and accrued expenses |
|
| (97,700 | ) |
|
| (11,418 | ) |
|
| 45,755 |
|
Accrued warranty |
|
| 15,136 |
|
|
| (19,673 | ) |
|
| (8,832 | ) |
Other noncurrent liabilities |
|
| 1,983 |
|
|
| (59 | ) |
|
| (3,202 | ) |
Net cash used in operating activities |
|
| (80,972 | ) |
|
| (62,272 | ) |
|
| (25,525 | ) |
Cash flows from investing activities: |
|
|
|
|
|
|
|
|
| |||
Purchases of property, plant and equipment |
|
| (36,137 | ) |
|
| (18,832 | ) |
|
| (37,119 | ) |
Proceeds from sale of business |
|
| 12,836 |
|
|
| — |
|
|
| — |
|
Net cash used in investing activities |
|
| (23,301 | ) |
|
| (18,832 | ) |
|
| (37,119 | ) |
Cash flows from financing activities: |
|
|
|
|
|
|
|
|
| |||
Proceeds from issuance of convertible notes |
|
| 132,500 |
|
|
| — |
|
|
| — |
|
Purchase of capped calls |
|
| (18,590 | ) |
|
| — |
|
|
| — |
|
Payments of debt issuance costs |
|
| (5,962 | ) |
|
| — |
|
|
| — |
|
Proceeds from revolving and term loans |
|
| — |
|
|
| — |
|
|
| 18,109 |
|
Repayments of revolving and term loans |
|
| — |
|
|
| (8,109 | ) |
|
| (181,154 | ) |
Proceeds from working capital loans |
|
| 46,329 |
|
|
| 43,992 |
|
|
| 10,269 |
|
Repayments of working capital loans |
|
| (47,673 | ) |
|
| (39,015 | ) |
|
| — |
|
Principal repayments of finance leases |
|
| (1,300 | ) |
|
| (5,100 | ) |
|
| (5,750 | ) |
Net proceeds from (repayments of) other debt |
|
| 19,273 |
|
|
| (5,456 | ) |
|
| 13,438 |
|
Proceeds from exercise of stock options and common stock warrants |
|
| — |
|
|
| 50 |
|
|
| 5,211 |
|
Repurchase of common stock including shares withheld in lieu of income |
|
| (2,583 | ) |
|
| (959 | ) |
|
| (493 | ) |
Proceeds from the issuance of Series A Preferred Stock |
|
| — |
|
|
| — |
|
|
| 350,000 |
|
Equity issuance costs |
|
| — |
|
|
| — |
|
|
| (10,711 | ) |
Net cash provided by (used in) financing activities |
|
| 121,994 |
|
|
| (14,597 | ) |
|
| 198,919 |
|
Impact of foreign exchange rates on cash, cash equivalents and restricted cash |
|
| 2,023 |
|
|
| (3,448 | ) |
|
| (14,253 | ) |
Net change in cash, cash equivalents and restricted cash |
|
| 19,744 |
|
|
| (99,149 | ) |
|
| (122,022 | ) |
Cash, cash equivalents and restricted cash, beginning of year |
|
| 153,069 |
|
|
| 252,218 |
|
|
| 130,196 |
|
Cash, cash equivalents and restricted cash, end of year |
| $ | 172,813 |
|
| $ | 153,069 |
|
| $ | 252,218 |
|
See accompanying notes to consolidated financial statements.
F-9
TPI COMPOSITES, INC. AND SUBSIDIARIES
CONSOLIDATED STATEMENTS OF CASH FLOWS – CONTINUED
|
| Year Ended December 31, |
| |||||||||
|
| 2023 |
|
| 2022 |
|
| 2021 |
| |||
|
| (in thousands) |
| |||||||||
Supplemental cash flow information: |
|
|
|
|
|
|
|
|
| |||
Cash paid for interest |
| $ | 9,650 |
|
| $ | 5,727 |
|
| $ | 13,360 |
|
Cash paid for income taxes, net of refunds |
|
| 23,115 |
|
|
| 30,818 |
|
|
| 25,268 |
|
Noncash investing and financing activities: |
|
|
|
|
|
|
|
|
| |||
Right of use assets obtained in exchange for new operating |
|
| 8,077 |
|
|
| 27,435 |
|
|
| 13,232 |
|
Property, plant, and equipment obtained in exchange for new |
|
| 796 |
|
|
| 215 |
|
|
| 1,817 |
|
Accrued capital expenditures in accounts payable |
|
| 5,861 |
|
|
| 2,429 |
|
|
| 2,504 |
|
Paid in kind preferred stock dividends and accretion |
|
| 58,453 |
|
|
| 58,903 |
|
|
| 6,040 |
|
Issuance of Common Stock to extinguish |
|
| 8,346 |
|
|
| — |
|
|
| — |
|
Issuance of debt, net of debt discount, |
|
| 274,712 |
|
|
| — |
|
|
| — |
|
Accrued transaction costs in accounts |
|
| 1,499 |
|
|
| — |
|
|
| — |
|
Reconciliation of Cash, Cash Equivalents and Restricted Cash: |
| December 31, |
| |||||||||||||
|
| 2023 |
|
| 2022 |
|
| 2021 |
|
| 2020 |
| ||||
|
| (in thousands) |
| |||||||||||||
Cash and cash equivalents |
| $ | 161,059 |
|
| $ | 133,546 |
|
| $ | 216,236 |
|
| $ | 82,463 |
|
Restricted cash |
|
| 10,838 |
|
|
| 9,854 |
|
|
| 10,053 |
|
|
| 29 |
|
Cash and cash equivalents of discontinued operations |
|
| 916 |
|
|
| 9,669 |
|
|
| 25,929 |
|
|
| 47,394 |
|
Restricted cash of discontinued operations |
|
| — |
|
|
| — |
|
|
| — |
|
|
| 310 |
|
Total cash, cash equivalents and restricted |
| $ | 172,813 |
|
| $ | 153,069 |
|
| $ | 252,218 |
|
| $ | 130,196 |
|
See accompanying notes to consolidated financial statements.
F-10
TPI COMPOSITES, INC. AND SUBSIDIARIES
Notes to Consolidated Financial Statements
Note 1. Summary of Operations and Summary of Significant Accounting Policies
(a) Description of Business
TPI Composites, Inc. is the holding company that conducts substantially all of its business operations through its direct and indirect subsidiaries (collectively, the Company or we). The Company was founded in 1968 and has been producing composite wind blades since 2001. The Company’s knowledge and experience of composite materials and manufacturing originates with its predecessor company, Tillotson Pearson Inc., a leading manufacturer of high-performance sail and powerboats along with a wide range of composite structures usedCompany is incorporated in other industrial applications. Following the separation from the boat building business in 2004, the Company reorganized in Delaware, as LCSI Holding, Inc. and then changed its corporate name to TPI Composites, Inc. in 2008. Today, the Company is headquartered in Scottsdale, Arizona and has expanded itsa global footprint to includethat includes domestic facilities in Newton, Iowa; Des Moines, Iowa; Warren, Rhode Island and Santa Teresa, New Mexico and international facilities in Dafeng, China; Taicang Port, China; Yangzhou, China, Juárez, Mexico; Matamoros, Mexico; Izmir, Turkey;Türkiye; Chennai, India,India; Kolding, DenmarkDenmark; Berlin, Germany and Berlin, Germany.Madrid, Spain.
In December 2022, we committed to a restructuring plan to rebalance our organization and optimize our global manufacturing footprint. Changing economic and geopolitical factors, including increased logistics costs and tariffs imposed on components of wind turbines from China, including wind blades, had an adverse impact on demand for our wind blades manufactured in our Chinese facilities.In connection with our restructuring plan, we ceased production at our Yangzhou, China manufacturing facility as of December 31, 2022 and are in the final stages of shutting down our business operations in China. Our business operations in China comprised the entirety of our Asia reporting segment. This shut down has had a meaningful effect on our global manufacturing footprint and consolidated financial results. Accordingly, the historical results of our Asia reporting segment have been presented as discontinued operations in our Consolidated Statements of Operations and Consolidated Balance Sheets. Our China operations represented a geographic operating segment that included (1) the manufacturing of wind blades at our facilities in Dafeng, China and Yangzhou, China, (2) the manufacturing of precision molding and assembly systems at our Taicang Port, China facility and (3) wind blade inspection and repair services. The following discussion reflects continuing operations only, unless otherwise indicated. For further information regarding our discontinued operations, refer to Note 2 – Discontinued Operations.
(b) Basis of Presentation
The accompanying consolidated financial statements include the accounts of TPI Composites, Inc. and all majority owned subsidiaries. All significant intercompany transactions and balances have been eliminated. Certain prior period amounts in the consolidated financial statements and accompanying notes have been reclassified to conform to the current period’s presentation.
(c) Revenue Recognition
The majority of our revenue is generated from long-term contractssupply agreements associated with manufacturing of wind blades and related services. We account for a long-term contractsupply agreement when it has the approval from both parties, the rights of the parties are identified, payment terms are established, the contract has commercial substance and the collectability of consideration is probable.
To determine the proper revenue recognition method for each long-term contract,supply agreement, we evaluate whether the original contract should be accounted for as one or more performance obligations. This evaluation requires judgment and the decisions reached could change the amount of revenue and gross profit recorded in a given period. As most of our contracts contain multiple performance obligations, we allocate the total transaction price to each performance obligation based on the estimated relative standalone selling prices of the promised goods or services underlying each performance obligation. Our manufacturing services are customer specific and involve production of items that cannot be sold to other customers due to the customers’ protected intellectual property;IP; therefore, we allocate the total transaction price under our contracts with multiple performance obligations using the contractually stated prices, as these prices represent the relative standalone selling price based on an expected cost pluscost-plus margin model.
Revenue is primarily recognized over time as we have an enforceable right to payment upon termination and we may not use or sell the product to fulfill other customers’ contracts. In addition, the customer does not have return or refund rights for items produced that conform to the specifications included in the contract. Because control transfers over time, revenue is recognized based on the extent of progress towards the completion of the
F-11
TPI COMPOSITES, INC. AND SUBSIDIARIES
Notes to Consolidated Financial Statements
performance obligation. We use the cost-to-cost input measure of progress for our contracts as this method provides the best representation of the production progress towards satisfaction of the performance obligation as the materials are distinct to the product being manufactured because of customer specifications provided for in the contract, the costs incurred are proportional to the progress towards completion of the product, and the products do not involve significant pre-fabricated component parts. Under the cost-to-cost method, progress and the related revenue recognition is determined by a ratio of direct costs incurred to date in fulfillment of the performance obligation to the total estimated direct costs required to complete the performance obligation.
F-11
TPI COMPOSITES, INC. AND SUBSIDIARIES
Notes to Consolidated Financial Statements
Determining the revenue to be recognized for services performed under our manufacturing contractssupply agreements involves judgments and estimates relating to the total consideration to be received and the expected direct costs to complete the performance obligation. As such, revenue recognized reflects our estimates of future contract volumes and the direct costs to complete the performance obligation. The judgments and estimates relating to the total consideration to be received include the amount of variable consideration as our contracts typically provide the customer with a range of production output options from guaranteed minimum volume obligations to the production capacity of the facility, and customers will provide periodic non-cancellable commitments for the number of wind blades to be produced over the term of the agreement. The total consideration also includes payments expected to be received associated with wind blade model transitions.transitions, and payments expected to be received or paid in the form of liquidated damages, for missed production deadlines which are paid over a negotiated timeline. We use historical experience, customer commitments and forecasted future production based on the capacity of the plant to estimate the total revenue to be received to complete the performance obligation. In addition, the amount of consideration per unit produced may vary based on the costs of production of the wind blades as we may be able to change the price per unit based on changes in the cost of production. Further, some of our contracts provide opportunities for us to share in labor and material cost savings as well as absorb some additional costs as an incentive for more efficient production, both of which impact the margin realized on the contract and ultimately the total amount of revenue to be recognized. Additionally, certain of our customer contracts provide for us to make concessions, such as in the form of liquidated damages, for missed production deadlines which are paid over a negotiated timeline.
We estimate variable consideration at the most likely amount to which we expect to be entitled. We include estimated amounts in the transaction price to the extent it is probable that a significant reversal of cumulative revenue recognized will not occur when the uncertainty associated with the variable consideration is resolved. Our estimates of variable consideration and determination of whether to include estimated amounts in the transaction price are based largely on an assessment of our anticipated performance and all information available to us at the time of the estimate and may materially change as additional information becomes known.
Our contracts may be modified to account for changes in specifications of products and changing requirements. If the contract modifications are for goods or services that are not distinct from the existing contract, they are accounted for as if they were part of the original contract. The effect of a contract modification on the transaction price and the measure of progress for the performance obligation to which it relates is recognized as an adjustment to revenue on a cumulative catch-up basis. If contract modifications are for goods and services that are distinct from the existing contract and increases the amount of consideration reflecting the standalone sale price of the additional goods or services, then the contract modification is accounted for as a separate contract and is evaluated for one or more performance obligations.
Each reporting period, we evaluate the progress towards satisfaction of each performance obligation based on any contract modifications that have occurred, costcosts incurred to date, and an estimate of the expected future consideration and costs to be incurred to complete the performance obligation. Based on this analysis, any changes in estimates of total consideration to be received and direct costs to complete the performance obligation are recognized on a cumulative catch-up basis, which recognizes in the current period the cumulative effect of the changes on current and prior periods based on the percentage of completion of the performance obligation.
Wind blade pricing is based on annual commitments of volume as established in our customer contractssupply agreements and orders less than committed volume may result in a higher price per wind blade to our customers. Orders in excess of annual commitments may result in discounts to our customers from the contracted price for the committed volume. Our customers typically provide periodic purchase orders with the price per wind blade given the current cost of the bill of materials, labor requirements and volume desired. We record an allowance for expected utilization of early payment discounts which are reported as a reduction of the total consideration to be received.
Precision molding and assembly systems included in a customer’s contract are based upon the specific engineering requirements and design determined by the customer and are specific to the wind blade design and
F-12
TPI COMPOSITES, INC. AND SUBSIDIARIES
Notes to Consolidated Financial Statements
function desired. From the customer’s engineering specifications, a job cost estimate is developed along with a production plan, and the desired margin is applied based on the location the work is to be performed and complexity of the customer’s design. Precision molding and assembly systems are generally built to produce wind blades which may be manufactured by us in production runs specified in the customer contract.
F-12
TPI COMPOSITES, INC. AND SUBSIDIARIES
Notes to Consolidated Financial Statements
Contract assets primarily relate to our rights to consideration for work completed but not billed at the reporting date on manufacturing services contracts. supply agreements. The contract assets are transferred to accounts receivable when the rights become unconditional, which generally occurs when customers are invoiced upon the determination that a product conforms to the contract specifications and invoices are due based on each customer’s negotiated payment terms, which, when factoring in our accounts receivable assignment agreements, range from 5 to 2595 days. We apply the practical expedient that allows us to exclude payment terms under one year from the transfer of a promised good or service from consideration of a significant financing component in its contracts. With regards to the production of precision molding and assembly systems, our contracts generally call for progress payments to be made in advance of production. Generally, payment is made at certain percentage of completion milestones with the final payment due upon delivery to the manufacturing facility. These progress payments are recorded within contract liabilities as current liabilities in the consolidated balance sheets and are reduced as we record revenue over time. We evaluate indications that a customer may not be able to meet the obligations under our long-term supply agreements to determine if an account receivable or contract asset may be impaired.
Our customers may request, in situations where they do not have space available to receive products or do not want to take possession of products immediately for other reasons, that their finished products be stored by us in one of our facilities. Most of our contracts provide for a limited number of wind blades to be stored during the period of the contract with any additional wind blades stored subject to additional storage fees, which are included in wind blade sales.
Revenue related to field service inspection and repair services, non-recurring engineering and freight services provided under our customer contractssupply agreements is recognized at a point in time following the transfer of control of the promised services to the customer. Customers usually pay the carrier directly for the cost of shipping associated with items produced. When we pay the shipping costs,cost, we apply the practical expedient that allows us to account for shipping and handling as a fulfillment costs and include the revenue in the associated performance obligation and the costs are included in cost of goods sold.
Taxes assessed by a governmental authority that are both imposed on and concurrent with specific revenue-producing transactions, that are collected by us from a customer, are excluded from revenue.
(d) Cost of Goods Sold
Cost of goods sold includes the costs we incur at our production facilities to make products saleable on both products invoiced during the period as well as products in progress towards the satisfaction of the related performance obligations for which we have an enforceable right to payment upon termination and we may not use or sell the product to fulfill other customers’ contracts. All costs incurred at our production facilities, as well as the allocated portion to our production facilities of costs incurred at our corporate headquarters and our research facilities, are directly or indirectly related to the manufacturing of products or services and are presented in cost of goods sold. Cost of goods sold includes such items as raw materials, direct and indirect labor and facilities costs, including purchasing and receiving costs, plant management, inspection costs, production process improvement activities, product engineering and internal transfer costs, as well as the allocated portion of costs incurred at our corporate headquarters and our research facilities.costs. In addition, all depreciation associated with assets used in the production of our products is also included in cost of goods sold. Direct labor costs consist of salaries, benefits and other personnel related costs for employeesassociates engaged in the manufacturing of our products and services.
Startup and transition costs are primarily unallocated fixed overhead costs and underutilized direct labor costs incurred during the period production facilities are transitioning wind blade models and ramping up manufacturing. All direct labor costs, excluding non-productive labor costs, are included in the measure of progress towards completion of the relevant performance obligation when determining revenue to be recognized during the period. The cost of sales for the initial wind bladesproducts from a new model manufacturing line is generally higher than when the line is operating at optimal production volume levels due to inefficiencies during ramp-up related to labor hours per blade, cycle times per blade and raw material usage. Additionally, these costs as a percentage of net sales are generally higher during the period in which a facility is ramping up to full production capacity due to
F-13
TPI COMPOSITES, INC. AND SUBSIDIARIES
Notes to Consolidated Financial Statements
underutilization of the facility. Manufacturing overhead at each of our facilities includes virtually all indirect costs (including share-based compensation costs) incurred at the plants, including engineering, finance, information technology, human resources and plant management.
F-13
TPI COMPOSITES, INC. AND SUBSIDIARIES
Notes to Consolidated Financial Statements
(e) General and Administrative Expenses
General and administrative expenses primarily relate to the unallocated portion of costs incurred at our corporate headquarters and our research facilities and include salaries, benefits and other personnel related costs for employeesassociates engaged in research and development, engineering, finance, internal audit, information technology, human resources, business development, global operational excellence, global supply chain, in-house legal and executive management. Other costs include outside legal and accounting fees, risk management (insurance), share-based compensation and certain other administrative and global resources costs.
The unallocated research and development expenses incurred at our Warren, Rhode Island location as well as at our Kolding, Denmark advanced engineering center and our Berlin, Germany engineering center are also included in general and administrative expenses. For the years ended December 31, 2020, 20192023, 2022 and 2018,2021, total research and development expenses totaled $1.0$1.4 million, $1.0$1.1 million and $0.8$1.0 million, respectively.
(f) Loss on Sale of Assets and Asset Impairments
For the years ended December 31, 2020, 20192023, 2022 and 2018,2021, the losses on the sale of certain receivables, on a non-recourse basis under supply chain financing arrangements with our customers, to financial institutions, as well as the losses on the sale of other assets at our corporate and manufacturing facilities and asset impairment charges totaled $7.7$21.9 million, $18.1$9.8 million and $4.6$12.4 million, respectively.
(g) Restructuring Charges, Net
(g)Restructuring charges primarily consist of associate severance, one-time termination benefits and ongoing benefits related to the reduction of our workforce and other costs associated with exit activities, which may include costs related to leased facilities to be abandoned and facility and associate relocation costs. The determination of when we accrue for involuntary termination benefits under restructuring plans depends on whether the termination benefits are provided under an ongoing benefit arrangement or under a one-time benefit arrangement. Ongoing benefit arrangements are recognized over the service period or when termination becomes reasonably probable, and one-time benefit arrangements are recognized in the period the arrangement is approved and formally communicated to associates. If applicable, we record such costs into operating expense over the terminated associate’s future service period beyond any minimum retention period. Restructuring charges that have been incurred but not yet paid are recorded in accrued expenses in the accompanying consolidated balance sheets.
For the years ended December 31, 2023, 2022 and 2021, restructuring charges, net totaled $5.1 million, $0.3 million and $12.5 million, respectively. These charges primarily related to severance benefits to terminated associates as a result of the reorganization of our operations in Türkiye, temporary shutdown of our Newton, Iowa manufacturing facility and the stop of production in one of our Juarez, Mexico facilities.
(h) Cash and Cash Equivalents and Restricted Cash
Cash and cash equivalents include highly liquid investments that are readily convertible to known amounts of cash with original maturities of three months or less. The carrying value of cash and cash equivalents approximates fair value.
As of December 31, 20202023 and 2019,2022, our China locationsdiscontinued operations collectively had unrestricted cash totaling $47.4$0.9 million and $9.7$9.7 million, respectively, in bank accounts in China.respectively. The Chinese government imposes certain restrictions on transferring cash out of China. The local governments in Turkey and Mexicoother countries in which we operate impose no such restrictions on transferring cash out of the respective country.
F-14
TPI COMPOSITES, INC. AND SUBSIDIARIES
Notes to Consolidated Financial Statements
As of December 31, 20202023 and 2019,2022, we had provided$10.8 million and $9.9 million, respectively of cash held as collateral for cash depositsvarious instruments, primarily for letters of guarantee used for customs clearance related to our China locations totaling $0.3 millionIndia, corporate, and $1.0 million, respectively.Mexico locations. These amounts are reported as restricted cash in our consolidated balance sheets.
As of December 31, 2019, we maintained a long-term deposit in interest bearing accounts, related to fully cash-collateralized letters of credit in connection an equipment lessor in Iowa, totaling $0.5 million. This balance was refunded to us in 2020. See Note 8, Other Noncurrent Assets.(i) Accounts Receivable
(h) Accounts Receivable
Trade accounts receivable are recorded at the invoiced amount and generally do not bear interest. We follow the allowance method of recognizing uncollectible accounts receivable, which recognizes bad debt expense based on a review of the individual accounts outstanding and prior history of uncollectible accounts receivable. Credit is extended based on evaluation of each of our customer’s financial condition and is generally unsecured. Accounts receivable are generally due within 30 days and are stated net of an allowance for doubtful accounts in the consolidated balance sheets. Accounts are considered past due if outstanding longer than contractual payment terms. We record an allowance based on consideration of a number of factors, including the length of time trade accounts are past due, previous loss history, the creditworthiness of individual customers, economic conditions affecting specific customer industries, and economic conditions in general. We charge-off accounts receivable after all reasonable collection efforts have been exhausted. We credit payments subsequently received on such receivables to bad debt expense in the period payment is received. We record delinquent finance charges on outstanding accounts receivables only if they are collected. We wrote off 0$10.5 million of receivables during 20202023 primarily due to a write off of $8.1 million in accounts receivables due to Proterra's bankruptcy filing. We wrote off no receivables during 2022, or 2019, and $0.2 million during 2018, and2021. We do not have any off-balance-sheet credit exposure related to our customers. See Note 4, 5, Accounts Receivable.
(j) Inventories
F-14
TPI COMPOSITES, INC. AND SUBSIDIARIES
Notes to Consolidated Financial Statements
(i) Inventories
Inventories represent materials purchased that are not restricted to fulfillment of a specific contract and are measured at the lower of cost or net realizable value. Net realizable value is defined as the estimated selling prices in the ordinary course of business, less reasonably predictable costs of completion, disposal, and transportation. Cost is determined using the first-in, first-out method for such raw materials. Write-downs to reduce the carrying cost of obsolete, slow-moving, and unusable inventory to net realizable value are recognized in cost of goods sold. The effect of these write-downs establishes a new cost basis in the related inventory, which is not subsequently written up.
(j)(k) Property, Plant and Equipment
Property, plant and equipment are stated at cost. Depreciation and amortization of property, plant, and equipment is calculated on the straight-line method over the estimated useful lives of the assets. See Note 6, 7, Property, Plant and Equipment, Net.
Estimated
| |||
Machinery and equipment |
| ||
Buildings | 20 years | ||
Leasehold improvements | 5 to 10 years, or the term
| ||
Office equipment and software | 3 to 5 years | ||
Furniture | 3 to 5 years | ||
Vehicles | 5 years |
(k)(l) Recoverability of Long-Lived Assets
We review property, plant and equipment and other long-lived assets in order to assess recoverability based on expected future undiscounted cash flows whenever events or circumstances indicate that the carrying value may not be recoverable. If the sum of the expected future net cash flows is less than the carrying value, an impairment loss is recognized. The impairment loss is measured as the amount by which the carrying value exceeds the fair value of the asset.
F-15
TPI COMPOSITES, INC. AND SUBSIDIARIES
(l)Notes to Consolidated Financial Statements
(m) Assets Held for Sale
We classify long-lived assets or disposal groups to be sold as held for sale in the period in which all of the following criteria are met: (1) management, having the authority to approve the action, commits to a plan to sell the asset or disposal group; (2) the asset or disposal group is available for immediate sale in its present condition subject only to terms that are usual and customary for sales of such assets or disposal groups; (3) an active program to locate a buyer and other actions required to complete the plan to sell the asset or disposal group have been initiated; (4) the sale of the asset or disposal group is probable, and transfer of the asset or disposal group is expected to qualify for recognition as a completed sale within one year, except if events or circumstances beyond our control extend the period of time required to sell the asset or disposal group beyond one year; (5) the asset or disposal group is being actively marketed for sale at a price that is reasonable in relation to its current fair value; and (6) actions required to complete the plan indicate that it is unlikely that significant changes to the plan will be made or that the plan will be withdrawn.
We initially measure a long-lived asset or disposal group that is classified as held for sale at the lower of its carrying value or fair value less any costs to sell. Any loss resulting from this measurement is recognized in the period in which the held-for-sale criteria are met. Conversely, gains are not recognized on the sale of a long-lived asset or disposal group until the date of sale. We assess the fair value of a long-lived asset or disposal group less any costs to sell each reporting period it remains classified as held for sale and report any subsequent changes as an adjustment to the carrying value of the asset or disposal group, as long as the new carrying value does not exceed the carrying value of the asset at the time it was initially classified as held for sale.
Upon determining that a long-lived asset or disposal group meets the criteria to be classified as held for sale, we cease depreciation and report long-lived assets and/or the assets and liabilities of the disposal group, if material, in the line items assets held for sale and liabilities held for sale, respectively, in our consolidated balance sheets.
As of December 31, 2023, we met the criteria to classify $17.8 million of assets and $1.9 million of liabilities as held for sale associated with our automotive business. The assets held for sale relate to $14.2 million of property, plant and equipment, net, $2.4 million of accounts receivables, and $1.2 million of other current assets. The liabilities held for sale relate to $1.9 million of other current liabilities. These amounts have been reclassified to assets held for sale and liabilities held for sale, respectively, in the accompanying consolidated balance sheets.
We are in the process of exploring strategic alternatives to ensure our automotive business is sufficiently funded to execute on its growth strategies as we intend to prioritize capital for growth in the wind blade business in the near term. We expect to complete this process no later than June 30, 2024, which could result in a material impairment of the business's assets. Accordingly, the Company determined a triggering event had occurred and performed an analysis to evaluate if any impairment exists in the assets held for sale associated with our automotive business. The Company concluded that there were no indicators of impairment and that the carrying values of the long-lived assets equates to their fair values as of December 31, 2023.
(n) Discontinued Operations
In determining whether a group of assets disposed (or to be disposed) of should be presented as a discontinued operation, the Company makes a determination of whether the criteria for held-for-sale classification is met and whether the disposition represents a strategic shift that has (or will have) a major effect on the entity’s operations and financial results. If these determinations can be made affirmatively, the results of operations of the group of assets being disposed of (as well as any gain or loss on the disposal transaction) are aggregated for separate presentation apart from continuing operating results of the Company in the consolidated financial statements. As of December 31, 2023, and 2022 we met the criteria to classify the disposal of our business operations in China as discontinued operations. See Note 2, Discontinued Operations.
(o) Goodwill, Intangible Assets and Deferred Costs, Net
Goodwill represents the excess of the acquisition cost of Composite Solutions, Inc. from True North Partners, LLC in 2004 over the fair value of identifiable assets acquired and liabilities assumed. Goodwill, which is entirely in the U.S. segment, is evaluated for impairment annually on October 31 and whenever events or circumstances make it likely that impairment may have occurred. In determining whether impairment has occurred, one compareswe compare the fair value of the related reporting unit (calculated using the discounted cash flow method) to its carrying value. If the carrying value exceeds the fair value, impairment is recognized for the difference. We may first assess qualitative factors to determine whether it is necessary to perform the quantitative goodwill impairment test. We performed our annual goodwill impairment test during 20202023 and determined that it is more-likely-than-not that its fair value exceeds its carrying amount.
Our patents, licenses, trademarks and development tools were acquired in business acquisitions and provide contractual or legal rights, or other future benefits that could be separately identified. Our valuation of identified
F-16
TPI COMPOSITES, INC. AND SUBSIDIARIES
Notes to Consolidated Financial Statements
intangible assets was based upon discounted cash flow estimates that require significant management judgment with respect to revenue and expense growth rates, changes in working capital, and the selection and use of the appropriate discount rate. The intangible assets are amortized over their estimated useful life. Intangible assets with indefinite lives are evaluated at least annually for impairment or whenever events or circumstances make it likely that impairment may have occurred.
F-15
TPI COMPOSITES, INC. AND SUBSIDIARIES
Notes to Consolidated Financial Statements
In addition, we recognize an asset for deferred costs incurred to fulfill a contract when such costs meet certain criteria. These deferred costs are amortized over their estimated useful life. See Note 2,3, Revenue from Contracts with CustomersNet Sales for a further discussion of those deferred costs. See Note 7,8, Intangible Assets and Deferred Costs, Net.
(m)(p) Mezzanine Equity
We issued Series A Preferred Stock that we determined is a financial instrument with both equity and debt characteristics and is classified as mezzanine equity in our consolidated financial statements. The instrument was initially recognized at fair value net of issuance costs. We reassess whether the instrument is currently redeemable or probable to become redeemable in the future as of each reporting date, in which, if the instrument meets either criterion, we will accrete the carrying value to the estimated maximum redemption value based on the effective interest method over the remaining period to the expected redemption date. To assess classification, we review all features of the instrument, including all mandatory and optional redemption features that may be substantive. All financial instruments that are classified as mezzanine equity are evaluated for embedded derivative features by evaluating each feature against the nature of the host instrument (e.g. more equity-like or debt-like). Features identified as freestanding instruments or bifurcated embedded derivatives that are material are recognized separately as a derivative asset or liability in the consolidated financial statements. We evaluated our Series A Preferred Stock and determined that its nature is that of a debt host and embedded derivatives exist that require bifurcation on our balance sheet. Mezzanine equity is presented net of related issuance costs and discounts resulting from bifurcated instruments and embedded features issued in conjunction with the host. On December 14, 2023, we entered into a new Credit Agreement and Guaranty (the "Credit Agreement") with Oaktree Fund Administration, LLC, as administrative agent and an affiliate of the holders of our Series A Preferred Stock, which, among other things, included a new senior secured term loan (the "Term Loan") in exchange, together with the issuance of an aggregate of 3,899,903 shares of Common Stock, on a cashless basis, for all Series A Preferred stock and $86.0 million of accrued and unpaid dividends. See Note 12, Debt, and Note 15, Mezzanine Equity.
(q) Warranty Expense
We provide a limited warranty for our mold, and wind blade, and automotive products, including materials and workmanship, with terms and conditions that vary depending on the product sold, generally for periods that range from two to five years. We also provide a limited warranty for our transportation products, including materials and workmanship, with terms and conditions that vary depending on the product sold, generally for a period of approximately two years.years. Warranty expense is recorded based upon estimates of future repairs using a probability-based methodology that considers previous warranty claims, identified quality issues and industry practices. Once the warranty period has expired, any remaining unused warranty accrual for the specific products is generally reversed against the current year warranty expense amount.amount, provided that the warranty accrual for other products whose warranty period has not yet expired is sufficient to cover the estimated cost of future repairs for those other products. See Note 9, 10, Accrued Warranty.
(n)(r) Treasury Stock
Common stock purchased for treasury is recorded at historical cost. Transactions in treasury shares relate to shares withheld in lieu of income taxes associated with share-based compensation plans and are recorded at weighted-average cost.
(o)(s) Foreign Currency Translation and Income and Losses
Foreign currency-denominated assets and liabilities are translated into U.S. dollars at exchange rates existing at the respective balance sheet dates. Results of operations of our foreign subsidiaries are translated at the average exchange rates during the respective periods. Translation adjustments are reported in accumulated other comprehensive loss in our consolidated balance sheets. Currency translation adjustments for the years ended December 31, 2020, 20192023, 2022 and 20182021 amounted to other comprehensive lossesincome (losses) of $8.1$(2.3) million, $7.0$(37.7) million and $14.4$18.4 million, respectively.
F-17
TPI COMPOSITES, INC. AND SUBSIDIARIES
Notes to Consolidated Financial Statements
Our reporting currency is the U.S. dollar. However, we have non-U.S. operating subsidiaries in our U.S., Mexico, Turkey, ChinaEMEA, and India segments, and our China discontinued operations.
| • The U.S. parent companies of our Mexico operations and China discontinued operations, which are wholly-owned subsidiaries of TPI Composites, Inc., maintain their books and records in their functional currency, the U.S. dollar. • Our Mexico operations maintain their books and records through multiple legal entities that are denominated in the local Mexican currency, the Peso, which are remeasured to their U.S. dollar functional currency. • Our Türkiye operations maintain their books and records in their functional currency, the Euro. • Our China discontinued operations maintain their books and records in their functional currency, the local Chinese currency, the Renminbi. • Our Chennai, India operations maintain their books and records in their functional currency, the U.S. dollar. • Our Kolding, Denmark operation, which is an indirect, wholly-owned subsidiary of TPI Composites, Inc., maintains its books and records in their functional currency, the local Danish currency, the Krone. • Our Berlin, Germany operation, which is an indirect, wholly-owned subsidiary of TPI Composites, Inc., maintains its books and records in their functional currency, the Euro. • Our Madrid, Spain operation, which is an indirect, wholly-owned subsidiary of TPI Composites, Inc., maintains its books and records in their functional currency, the Euro.
|
|
|
|
|
|
|
|
|
|
|
|
|
|
Foreign currency transaction gains and losses are reported in foreign currency income (loss),loss, net in our consolidated statements of operations.
F-16
TPI COMPOSITES, INC. AND SUBSIDIARIES
Notes to Consolidated Financial Statements
(p)(t) Share-Based Compensation
We maintain 1 activeOur incentive compensation plan: the Amended and Restated 2015 Stock Option and Incentive Plan (the 2015 Plan). The 2015 Planplan provides for the issuance of incentive stock options, non-qualified stock options, stock appreciation rights, restricted stock units (RSUs), restricted stock awards, unrestricted stock awards, cash-based awards, performance-based restricted stock units (PSUs), and dividend equivalent rights to certain of our employees,associates, non-employee directors and consultants. The term of stock options issued under the 2015 Plan may not exceed ten years from the date of grant. Under the 2015 Plan, incentiveIncentive stock options and non-qualified stock options are granted at an exercise price that is not to be less than 100%100% of the fair market value of our common stock on the date of grant, as determined by the Compensation Committee of our board of directors. Stock options become vested and exercisable at such times and under such conditions as determined by the Compensation Committee on the date of grant.
We use the Black Scholes valuation model, unless the awardsFor performance stock units that are subject to market conditions, in which case we utilize a binomial-lattice model (i.e., Monte Carlo simulation model),model to determine the fair value of stock options and certain PSUs granted.value. The Monte Carlo simulation model utilizes multiple input variables to determine the share-based compensation expense. For grants with market conditions made induring the year ended December 31, 2020,2023, we utilized a weighted-averagean expected volatility assumption of 47.3%77.64%, a 0%0% dividend yield and a weighted-average risk-free interest rate of 0.5%4.0%. The volatility was based on the most recent comparable period for the Company and the peer group. The stock price projection for the Company and the components of theour peer group assumes a 0% dividend yield. This is mathematically equivalent to reinvesting dividends in the issuing entity over the performance period.and us. The risk-free interest rate is equal to the yield, as of the measurement date, of the zero-coupon U.S. Treasury bill that is commensurate with the remaining performance measurement period. We currently do not pay a dividend.
The determination of the grant date fair value using an option-pricing model and simulation model requires judgment as well as assumptions regarding a number of other complex and subjective variables. These variables include our closing market price at the grant date as well as the following assumptions:
Expected Volatility. As our common stock had not been publicly traded prior to July 2016, theThe expected volatility assumption reflects an average of our historical volatility and the volatilities of publicly traded peer group companies with a period equal to the expected life of the options.
Expected Life (years). We use the simplified method to estimate the expected term of stock options. The simplified method for estimating expected term is to use the mid-point between the vesting term and the contractual term of the option. We elected to use the simplified method because we did not have historical exercise data to estimate the expected term due to the limited time period our common stock hadhas been publicly traded.
F-18
TPI COMPOSITES, INC. AND SUBSIDIARIES
Notes to Consolidated Financial Statements
Risk-Free Interest Rate. The risk-free interest rate assumption is based upon the U.S. constant maturity treasury rates as the risk-free rate interpolated between the years commensurate with the expected life of the options.
Dividend Yield. The dividend yield assumption is 0zero since we do not expect to declare or pay dividends in the foreseeable future.
Forfeitures. Share-based compensation expense is reversed when the service-based award is forfeited.
Expected Vesting Period. We amortize the share-based compensation expense over the requisite service period.
Share-based compensation expense related to RSUs and PSUs are expensed over the vesting period using the straight-line method for our employeesassociates and our board of directors. The RSUs and PSUs do not have voting rights. We calculate the fair value of our share-based awards on the date of grant for our employeesassociates and directors.
(u) Leases
(q) Leases
On January 1, 2019, we adopted the Financial Accounting Standards Board (FASB) Accounting Standard Codification (ASC) Topic 842, Leases. We determine if an arrangement is a lease at inception. Operating leases are included in operating lease right of use (ROU) assets, current operating lease liabilities, and noncurrent operating
F-17
TPI COMPOSITES, INC. AND SUBSIDIARIES
Notes to Consolidated Financial Statements
lease liabilities in the consolidated balance sheets. Finance leases are included in property, plant and equipment, current maturities of long-term debt, and long-term debt, net of debt issuance costs and current maturities in the consolidated balance sheets.
Operating lease ROU assets and operating lease liabilities are recognized based on the present value of future minimum lease payments over the lease term at commencement date. Variable payments are not included in ROU assets or lease liabilities and can vary from period to period based on asset usage or our proportionate share of common costs. The implicit rate within our leases is generally not determinable and, therefore, the incremental borrowing rate at lease commencement is utilized to determine the present value of lease payments. We estimate our incremental borrowing rate based on third-party lender quotes to obtain secured debt in a like currency for a similar asset over a timeframe similar to the term of the lease. The ROU asset also includes any lease prepayments made and any initial direct costs incurred and excludes lease incentives. Our lease terms may include options to extend or terminate the lease when it is reasonably certain that we will exercise that option. Lease expense for minimum lease payments is recognized on a straight-line basis over the lease term. We have elected not to recognize ROU assets or lease liabilities for leases with a term of 12 months or less.
We have lease agreements with lease and non-lease components. We have elected to apply the practical expedient to account for these components as a single lease component for all classes of underlying assets. See Note 13, Leases.
(r)(v) Income Taxes
Income taxes are accounted for under the asset and liability method in accordance with FASB ASCAccounting Standards Codification ("ASC") Topic 740, Income Taxes. Deferred tax assets and liabilities are measured using enacted tax rates expected to apply to taxable income in the years in which those differences are projected to be recovered or settled. Realization of deferred tax assets is dependent on our ability to generate sufficient taxable income of an appropriate character in future periods. A valuation allowance is established if it is determined to be more-likely-than-not that a deferred tax asset will not be realized. See Note 18, Income Taxes.
(s)(w) Use of Estimates
The preparation of consolidated financial statements in conformity with U.S. generally accepted accounting principles (GAAP) requires management to make estimates and assumptions that affect the reported amounts of assets and liabilities and disclosure of contingent assets and liabilities at the date of the consolidated financial statements and the reported amounts of revenues and expenses during the reporting period. Actual results could differ from those estimates. Significant items subject to such estimates and assumptions include the useful lives of property, plant and equipment, realizability of intangible assets, deferred costs and deferred tax assets, standalone selling prices and future contract volumes and the direct costs to complete the performance obligation for revenue
F-19
TPI COMPOSITES, INC. AND SUBSIDIARIES
Notes to Consolidated Financial Statements
recognition, fair value of stock options, performance-based restricted stock units and warrants, features related to our Series A Preferred Stock, our new Term Loan, warranty reserves and other contingencies.
(t)(x) Fair Value of Financial Instruments
FASB ASC Topic 820, Fair Value Measurements, defines fair value as the price that would be received to sell an asset or paid to transfer a liability in an orderly transaction between market participants at the measurement date. Topic 820 also specifies a fair value hierarchy that requires an entity to maximize the use of observable inputs and minimize the use of unobservable inputs when measuring fair value. The standard describes three levels of inputs that may be used to measure fair value is follows:
Level 1: Quoted prices in active markets for identical assets or liabilities;
Level 2: Observable inputs other than Level 1 prices, such as quoted prices for similar assets or liabilities; quoted prices in markets that are not active; or other inputs that are observable or can be corroborated by observable market data for substantially the full term of the assets or liabilities; and
Level 3: Valuation is generated from model-based techniques that use significant assumptions not observable in the market. These unobservable assumptions reflect our own estimate of assumptions that market participants would use in pricing the asset or liability.
F-18
TPI COMPOSITES, INC. AND SUBSIDIARIES
Notes to Consolidated Financial Statements
The carrying amounts of our cash and cash equivalents, trade accounts receivable, income taxes receivable, accounts payable and accrued expenses and income taxes payable approximate fair value because of the short-term nature of these financial instruments. The carrying amount of our short-term unsecured loans approximates fair value due to their short-term nature and the loans carry a current market rate of interest, a Level 2 input. The Term Loan issued on December 14, 2023 was recorded at fair value resulting in an original issuance discount on the Term Loan (see Note 12, Debt). The fair value of the Term Loan was estimated using the discounted cash flow method under the income approach, where the contractual cash flows were discounted to present value using a synthetic credit risk adjusted discount rate based on market rates for similar publicly traded debt, all of which represent Level 2 inputs. The carrying value of the Term Loan approximates fair value as of December 31, 2023, due to the short period between issuance date and year end. The carrying value of our other long-term debt approximates fair value based on its variable rate index or based upon market interest rates available to us for debt of similar risk and maturities, both of which areis a Level 2 inputs.input. Since our derivative assets and liabilities are not traded on an exchange, we value them using standard industry valuation models. As applicable, these models project future cash flows and discount the amounts to a present value using market-based observable inputs, including interest rate curves, credit risk, foreign exchange rates, and forward and spot prices for currencies. These inputs are observable in active markets over the contract term of the derivative instruments we hold, including the Event of Default Derivative associated with our Term Loan, and accordingly, we classify the valuation techniques as Level 2. See Note 12, Debt.
(y) Earnings Per Share
(u)We calculate basic earnings per share for both continuing and discontinued operations, by dividing net income from continuing operations, and net income from discontinued operations, respectively, after deducting dividends on and accretion of preferred stock, by the average number of common shares outstanding during the period, which includes unissued common shares associated with vested equity awards for which little or no consideration is required prior to issuance, net of any treasury shares. We calculate diluted earnings per share for both continuing and discontinued operations in a similar manner after consideration of the potential dilutive effect of common stock equivalents on the average number of common shares outstanding during the period. Common stock equivalents include warrants, stock options, restricted stock awards and units, and performance share awards and units. Common stock equivalents are calculated based upon the treasury stock method using an average market price of common shares during the period. Dilution is not considered when a net loss from continuing operations is reported. Common stock equivalents that have an antidilutive effect are excluded from the computation of diluted earnings per share. See Note 19, Net Income (Loss) Per Share.
ASC Topic 260, Effect on the Calculation of Earnings per Share for the Redemption or Induced Conversion of Preferred Stock, provides guidance on the accounting for extinguishments (redemptions) of equity-classified preferred stock. It requires the gain or loss on extinguishment of equity-classified preferred stock to be included in the net income per common stockholder used to calculate earnings per share (similar to the treatment of dividends paid on preferred stock). The difference between (1) the fair value of the consideration transferred to the holders of
F-20
TPI COMPOSITES, INC. AND SUBSIDIARIES
Notes to Consolidated Financial Statements
the preferred stock and (2) the carrying amount of the preferred stock (net of issuance costs) is subtracted from (or added to) net income to arrive at income available to common stockholders in the calculation of earnings per share. Accordingly, any excess fair value of the consideration transferred over the carrying amount of the preferred stock is charged against retained earnings, or additional paid-in capital if there are insufficient retained earnings. We applied this guidance to the accounting treatment of the Series A Preferred Stock Exchange described in Note 12, Debt.
(z) Debt Discounts
Debt discounts on our long-term debt are recorded as a direct deduction from the carrying amount of such debt on the consolidated balance sheets. All debt discounts are amortized using the effective interest method over the term of the debt. Debt discount amortization expense is recorded as part of interest expense in the consolidated statements of operations.
(aa) Recently Issued Accounting Pronouncements
Accounting Pronouncements Adopted in 2020Supplier Finance Programs
Financial Instruments
In June 2016,September 2022, the FASB issued Accounting Standards Update (ASU) No. 2016-13, Financial Instruments – Credit Losses (Topic 326): MeasurementASU 2022-04, Liabilities - Supplier Finance Programs (Subtopic 405-50), which requires the disclosure of Credit Losses on Financial Instruments.the key terms of outstanding supplier finance programs and a roll forward of the related obligations. The new standard is intended to providedoes not affect the recognition, measurement or financial statement users with more decision-useful information about the expected credit losses on financial instruments and other commitments to extend credit held at each reporting date.
This standard was effective for all public business entities for annual and interim periods beginning after December 15, 2019, with early adoption permitted.presentation of supplier finance program obligations. We adopted this standard on January 1, 2020 and it2023, except for the roll forward requirement, which becomes effective January 1, 2024. The new standard did not have a material effectimpact on our consolidated financial statements.
Fair Value Measurement
In August 2018, the FASB issued ASU 2018-13, Fair Value Measurement (Topic 820): Disclosure Framework—Changes to the Disclosure Requirements for Fair Value Measurement, which modifies the disclosure requirements in Topic 820.
This standard was effective for all public business entities for annual and interim periods beginning after December 15, 2019, with early adoption permitted. We adopted this standard on January 1, 2020 and it did not have a material effect on our consolidated financial statements.
Income Taxes
In December 2019, the FASB issued ASU 2019-12, Income Taxes (Topic 740): Simplifying the Accounting for Income Taxes, which primarily removes specific exemptions to the general principles in Topic 740 in GAAP and improves the financial statement preparers’ application of income tax-related guidance and simplifies GAAP.
We adopted this standard on January 1, 2020 and it did not have a material effect on our consolidated financial statements.
Recent Accounting Pronouncements
Reference Rate Reform
In March 2020, the FASB issued ASU 2020-04, Reference Rate Reform (Topic 848): Facilitation of the Effects of Reference Rate Reform on Financial Reporting. These amendments provide optional guidance for a limited time to ease the potential burden in accounting for reference rate reform. This new guidance provides optional expedients and exceptions for applying GAAP to contracts, hedging relationships and other transactions affected by reference rate reform if certain criteria are met. These amendments apply only to contracts and hedging relationships that reference the London Interbank Offered Rate (LIBOR) or another reference rate expected to be discontinued due to reference rate reform. These amendments are effective immediately and may be applied prospectively to contract modifications made and hedging relationships entered into or evaluated on or before December 31, 2022.
F-19
TPI COMPOSITES, INC. AND SUBSIDIARIES
Notes to Consolidated Financial Statements
In January 2021, the FASB issued ASU 2021-01, Reference Rate Reform (Topic 848): Scope. This ASU clarifies that certain optional expedients and exceptions in Topic 848 for contract modifications and hedge accounting apply to derivatives that are affected by the discounting transition. The ASU also amends the expedients and exceptions in Topic 848 to capture the incremental consequences of the scope clarification and to tailor the existing guidance to derivative instruments affected by the discounting transition.
An entity may elect to apply ASU 2021-01 on contract modifications that change the interest rate used for margining, discounting, or contract price alignment retrospectively as of any date from the beginning of the interim period that includes March 12, 2020, or prospectively to new modifications from any date within the interim period that includes or is subsequent to January 7, 2021, up to the date that financial statements are available to be issued.
An entity may elect to apply ASU 2021-01 to eligible hedging relationships existing as of the beginning of the interim period that includes March 12, 2020, and to new eligible hedging relationships entered into after the beginning of the interim period that includes March 12, 2020.
We are currently evaluating our contracts and the optional expedients provided by these new standards.
There have been no other recent accounting pronouncements or changes in accounting pronouncements during the current year that are of significance, or potential significance, to us.
Note 2. Discontinued Operations
In December 2022, we committed to a restructuring plan to rebalance our organization and optimize our global manufacturing footprint. Changing economic and geopolitical factors, including increased logistics costs and tariffs imposed on components of wind turbines from China, including wind blades, had an adverse impact on demand and profitability for our wind blades manufactured in our Chinese facilities. In connection with our restructuring plan, we ceased production at our Yangzhou, China manufacturing facility as of December 31, 2022 and are in the final stages of shutting down our business operations in China. Our business operations in China comprised the entirety of our Asia reporting segment. This shut down has had a meaningful effect on our global manufacturing footprint and consolidated financial results. Accordingly, the historical results of our Asia reporting segment have been presented as discontinued operations in our Consolidated Statements of Operations and Consolidated Balance Sheets. During the year ended December 31, 2023, we completed the sale of our Taicang, China operations and received net proceeds of $12.8 million, resulting in a net gain on the sale of $0.4 million.
The following table presents the carrying amounts of major classes of assets and liabilities that were included in discontinued operations:
F-21
TPI COMPOSITES, INC. AND SUBSIDIARIES
Notes to Consolidated Financial Statements
|
| December 31, |
| |||||
|
| 2023 |
|
| 2022 |
| ||
|
| (In thousands) |
| |||||
Cash and cash equivalents |
| $ | 916 |
|
| $ | 9,669 |
|
Accounts receivable |
|
| 198 |
|
|
| 2,716 |
|
Prepaid expenses |
|
| 388 |
|
|
| 1,877 |
|
Inventories |
|
| 17 |
|
|
| 1,501 |
|
Property, plant and equipment, net |
|
| — |
|
|
| 17,678 |
|
Other classes of assets that are not major |
|
| 1 |
|
|
| 1,741 |
|
Total assets of discontinued operations |
| $ | 1,520 |
|
| $ | 35,182 |
|
|
|
|
|
|
|
| ||
Accounts payable and accrued expenses |
| $ | 1,632 |
|
| $ | 26,942 |
|
Accrued restructuring |
|
| 1,183 |
|
|
| 17,764 |
|
Operating lease liabilities |
|
| — |
|
|
| 9,524 |
|
Other classes of liabilities that are not major |
|
| — |
|
|
| 210 |
|
Total liabilities of discontinued operations |
| $ | 2,815 |
|
| $ | 54,440 |
|
The following table presents the components of net loss from discontinued operations:
|
| Year Ended December 31, |
| |||||||||
|
| 2023 |
|
| 2022 |
|
| 2021 |
| |||
|
| (In thousands) |
| |||||||||
Net sales |
| $ | 2,948 |
|
| $ | 235,588 |
|
| $ | 260,197 |
|
Cost of sales |
|
| 8,906 |
|
|
| 200,701 |
|
|
| 254,176 |
|
Startup and transition costs |
|
| — |
|
|
| 7,994 |
|
|
| — |
|
Total cost of goods sold |
|
| 8,906 |
|
|
| 208,695 |
|
|
| 254,176 |
|
Gross profit |
|
| (5,958 | ) |
|
| 26,893 |
|
|
| 6,021 |
|
Loss on sale of assets and asset impairments |
|
| 1,470 |
|
|
| 17,530 |
|
|
| 674 |
|
Restructuring charges, net |
|
| (756 | ) |
|
| 20,175 |
|
|
| 11,219 |
|
Loss from discontinued operations |
|
| (6,672 | ) |
|
| (10,812 | ) |
|
| (5,872 | ) |
Other income (expense): |
|
|
|
|
|
|
|
|
| |||
Interest income, net |
|
| 49 |
|
|
| 147 |
|
|
| 22 |
|
Foreign currency income (loss) |
|
| (519 | ) |
|
| 5,627 |
|
|
| (1,701 | ) |
Miscellaneous income |
|
| 1,612 |
|
|
| 1,477 |
|
|
| 831 |
|
Total other income (expense) |
|
| 1,142 |
|
|
| 7,251 |
|
|
| (848 | ) |
Loss before income taxes |
|
| (5,530 | ) |
|
| (3,561 | ) |
|
| (6,720 | ) |
Income tax benefit (provision) |
|
| 204 |
|
|
| (6,194 | ) |
|
| 3,066 |
|
Net loss from discontinued operations |
| $ | (5,326 | ) |
| $ | (9,755 | ) |
| $ | (3,654 | ) |
The following table presents summarized cash flows from discontinued operations:
|
| Year Ended December 31, |
| |||||||||
|
| 2023 |
|
| 2022 |
|
| 2021 |
| |||
|
| (in thousands) |
| |||||||||
Net cash used in operating activities |
| $ | (8,579 | ) |
| $ | (12,676 | ) |
| $ | (19,469 | ) |
Net cash used in investing activities |
|
| (185 | ) |
|
| (2,101 | ) |
|
| (2,583 | ) |
Additional non-cash items related to operating |
|
|
|
|
|
|
|
|
| |||
Depreciation and amortization |
|
| — |
|
|
| 6,708 |
|
|
| 14,987 |
|
Share-based compensation expense |
|
| (34 | ) |
|
| 621 |
|
|
| 593 |
|
F-22
TPI COMPOSITES, INC. AND SUBSIDIARIES
Notes to Consolidated Financial Statements
The following is a summary of our restructuring liability activity related to discontinued operations for the periods presented:
|
| Severance |
|
| Other |
|
| Total |
| |||
|
| (in thousands) |
| |||||||||
Balance at December 31, 2020 |
| $ | 3,200 |
|
| $ | — |
|
| $ | 3,200 |
|
Restructuring charges, net |
|
| 10,485 |
|
|
| 734 |
|
|
| 11,219 |
|
Payments |
|
| (5,540 | ) |
|
| (734 | ) |
|
| (6,274 | ) |
Balance at December 31, 2021 |
|
| 8,145 |
|
|
| — |
|
|
| 8,145 |
|
Restructuring charges, net |
|
| 17,548 |
|
|
| 2,627 |
|
|
| 20,175 |
|
Payments |
|
| (9,936 | ) |
|
| (620 | ) |
|
| (10,556 | ) |
Balance at December 31, 2022 |
|
| 15,757 |
|
|
| 2,007 |
|
|
| 17,764 |
|
Restructuring charges, net |
|
| (1,981 | ) |
|
| 1,225 |
|
|
| (756 | ) |
Payments |
|
| (13,459 | ) |
|
| (2,366 | ) |
|
| (15,825 | ) |
Balance at December 31, 2023 |
| $ | 317 |
|
| $ | 866 |
|
| $ | 1,183 |
|
Note 2 – Revenue from Contracts with Customers3. Net Sales
The following tables represents the disaggregation of our net sales revenue by product for each of our reportable segments:
|
| Year Ended December 31, 2023 |
| |||||||||||||||||
|
| U.S. |
|
| Mexico |
|
| EMEA |
|
| India |
|
| Total |
| |||||
|
| (in thousands) |
| |||||||||||||||||
Wind blade, tooling and other |
| $ | — |
|
| $ | 587,628 |
|
| $ | 565,627 |
|
| $ | 241,061 |
|
| $ | 1,394,316 |
|
Automotive sales |
|
| 22,775 |
|
|
| — |
|
|
| — |
|
|
| — |
|
|
| 22,775 |
|
Field service, inspection and |
|
| 28,325 |
|
|
| 1,911 |
|
|
| 7,856 |
|
|
| — |
|
|
| 38,092 |
|
Total net sales |
| $ | 51,100 |
|
| $ | 589,539 |
|
| $ | 573,483 |
|
| $ | 241,061 |
|
| $ | 1,455,183 |
|
|
| Year Ended December 31, 2022 |
| |||||||||||||||||
|
| U.S. |
|
| Mexico |
|
| EMEA |
|
| India |
|
| Total |
| |||||
|
| (in thousands) |
| |||||||||||||||||
Wind blade, tooling and other |
| $ | 1,000 |
|
| $ | 642,377 |
|
| $ | 562,485 |
|
| $ | 217,962 |
|
| $ | 1,423,824 |
|
Automotive sales |
|
| 44,002 |
|
|
| — |
|
|
| — |
|
|
| — |
|
|
| 44,002 |
|
Field service, inspection and |
|
| 44,168 |
|
|
| 4,238 |
|
|
| 6,507 |
|
|
| 2 |
|
|
| 54,915 |
|
Total net sales |
| $ | 89,170 |
|
| $ | 646,615 |
|
| $ | 568,992 |
|
| $ | 217,964 |
|
| $ | 1,522,741 |
|
|
| Year Ended December 31, 2021 |
| |||||||||||||||||
|
| U.S. |
|
| Mexico |
|
| EMEA |
|
| India |
|
| Total |
| |||||
|
| (in thousands) |
| |||||||||||||||||
Wind blade, tooling and other |
| $ | 130,502 |
|
| $ | 594,763 |
|
| $ | 476,888 |
|
| $ | 200,196 |
|
| $ | 1,402,349 |
|
Automotive sales |
|
| 37,312 |
|
|
| — |
|
|
| — |
|
|
| — |
|
|
| 37,312 |
|
Field service, inspection and |
|
| 24,525 |
|
|
| 2,835 |
|
|
| 5,332 |
|
|
| 33 |
|
|
| 32,725 |
|
Total net sales |
| $ | 192,339 |
|
| $ | 597,598 |
|
| $ | 482,220 |
|
| $ | 200,229 |
|
| $ | 1,472,386 |
|
|
| Year Ended December 31, 2020 |
|
| |||||||||||||||||||||
|
| U.S. |
|
| Asia |
|
| Mexico |
|
| EMEA |
|
| India |
|
| Total |
|
| ||||||
|
| (in thousands) |
|
| |||||||||||||||||||||
Wind blade sales |
| $ | 135,415 |
|
| $ | 511,090 |
|
| $ | 472,994 |
|
| $ | 368,907 |
|
| $ | 91,649 |
|
| $ | 1,580,055 |
|
|
Precision molding and assembly systems sales |
|
| — |
|
|
| 13,134 |
|
|
| 14,939 |
|
|
| — |
|
|
| — |
|
|
| 28,073 |
|
|
Transportation sales |
|
| 33,849 |
|
|
| — |
|
|
| 2,347 |
|
|
| — |
|
|
| — |
|
|
| 36,196 |
|
|
Other sales |
|
| 12,677 |
|
|
| 2,859 |
|
|
| 5,559 |
|
|
| 4,638 |
|
|
| 80 |
|
|
| 25,813 |
|
|
Total net sales |
| $ | 181,941 |
|
| $ | 527,083 |
|
| $ | 495,839 |
|
| $ | 373,545 |
|
| $ | 91,729 |
|
| $ | 1,670,137 |
|
|
F-23
|
| Year Ended December 31, 2019 |
| |||||||||||||||||||||
|
| U.S. |
|
| Asia |
|
| Mexico |
|
| EMEA |
|
| India |
|
| Total |
| ||||||
|
| (in thousands) |
| |||||||||||||||||||||
Wind blade sales |
| $ | 120,125 |
|
| $ | 366,206 |
|
| $ | 410,337 |
|
| $ | 431,362 |
|
| $ | 687 |
|
| $ | 1,328,717 |
|
Precision molding and assembly systems sales |
|
| 3,774 |
|
|
| 25,203 |
|
|
| 19,703 |
|
|
| — |
|
|
| — |
|
|
| 48,680 |
|
Transportation sales |
|
| 28,523 |
|
|
| — |
|
|
| 347 |
|
|
| — |
|
|
| — |
|
|
| 28,870 |
|
Other sales |
|
| 16,895 |
|
|
| 2,400 |
|
|
| 5,219 |
|
|
| 5,719 |
|
|
| — |
|
|
| 30,233 |
|
Total net sales |
| $ | 169,317 |
|
| $ | 393,809 |
|
| $ | 435,606 |
|
| $ | 437,081 |
|
| $ | 687 |
|
| $ | 1,436,500 |
|
|
| Year Ended December 31, 2018 |
| |||||||||||||||||||||
|
| U.S. |
|
| Asia |
|
| Mexico |
|
| EMEA |
|
| India |
|
| Total |
| ||||||
|
| (in thousands) |
| |||||||||||||||||||||
Wind blade sales |
| $ | 126,335 |
|
| $ | 264,417 |
|
| $ | 256,101 |
|
| $ | 286,414 |
|
| $ | — |
|
| $ | 933,267 |
|
Precision molding and assembly systems sales |
|
| 5,034 |
|
|
| 36,616 |
|
|
| 7,203 |
|
|
| — |
|
|
| — |
|
|
| 48,853 |
|
Transportation sales |
|
| 29,254 |
|
|
| — |
|
|
| — |
|
|
| — |
|
|
| — |
|
|
| 29,254 |
|
Other sales |
|
| 3,093 |
|
|
| 5,222 |
|
|
| 5,452 |
|
|
| 4,483 |
|
|
| — |
|
|
| 18,250 |
|
Total net sales |
| $ | 163,716 |
|
| $ | 306,255 |
|
| $ | 268,756 |
|
| $ | 290,897 |
|
| $ | — |
|
| $ | 1,029,624 |
|
F-20
TPI COMPOSITES, INC. AND SUBSIDIARIES
Notes to Consolidated Financial Statements
In addition, most of our net sales are made directly to our customers, primarily large multi-national wind turbine manufacturers, under our long-term contracts which are typically five years in length.supply agreements.
For a further information regarding of our reportable segments, refer to Note 19, 22, Segment Reporting.
Contract Assets and Liabilities
Contract assets consist of the amount of revenue recognized over time for performance obligations in production where control has transferred to the customer, but the contract does not yet allow for the customer to be billed. Typically, customers are billed when the product finishes production and meets the technical specifications contained in the contract. The time it takes to produce a single wind blade is typically between 5 to 7 days. The time it takes to produce a mold is typically between 3 to 6 months. The majority of the contract asset balance relates to materials procured based on customer specifications. The contract assets are recorded as current assets in the consolidated balance sheets. Contract liabilities consist of advance payments in excess of revenue earned. These amounts primarily represent progress payments received as precision molding and assembly systems are being manufactured. The contract liabilities are recorded as current liabilities in the consolidated balance sheets and are reduced as we record revenue over time.
These contract assets and liabilities are reported on the consolidated balance sheets net on a contract-by-contract basis at the end of each reporting period, as demonstrated in the table below.
Contract assets and contract liabilities as of December 31 consisted of the following:
|
| 2020 |
|
| 2019 |
|
| $ Change |
|
| 2023 |
|
| 2022 |
|
| $ Change |
| ||||||
|
| (in thousands) |
|
| (in thousands) |
| ||||||||||||||||||
Gross contract assets |
| $ | 223,428 |
|
| $ | 170,973 |
|
| $ | 52,455 |
|
| $ | 121,483 |
|
| $ | 231,487 |
|
| $ | (110,004 | ) |
Less: reclassification from contract liabilities |
|
| (6,500 | ) |
|
| (4,458 | ) |
|
| (2,042 | ) |
|
| (9,246 | ) |
|
| (15,548 | ) |
|
| 6,302 |
|
Contract assets |
| $ | 216,928 |
|
| $ | 166,515 |
|
| $ | 50,413 |
|
| $ | 112,237 |
|
| $ | 215,939 |
|
| $ | (103,702 | ) |
|
| 2023 |
|
| 2022 |
|
| $ Change |
| |||
|
| (in thousands) |
| |||||||||
Gross contract liabilities |
| $ | 33,267 |
|
| $ | 32,648 |
|
| $ | 619 |
|
Less: reclassification to contract assets |
|
| (9,246 | ) |
|
| (15,548 | ) |
|
| 6,302 |
|
Contract liabilities |
| $ | 24,021 |
|
| $ | 17,100 |
|
| $ | 6,921 |
|
|
| 2020 |
|
| 2019 |
|
| $ Change |
| |||
|
| (in thousands) |
| |||||||||
Gross contract liabilities |
| $ | 7,114 |
|
| $ | 7,466 |
|
| $ | (352 | ) |
Less: reclassification to contract assets |
|
| (6,500 | ) |
|
| (4,458 | ) |
|
| (2,042 | ) |
Contract liabilities |
| $ | 614 |
|
| $ | 3,008 |
|
| $ | (2,394 | ) |
ContractsContract assets increaseddecreased by $50.4$103.7 million from December 31, 20192022 to December 31, 20202023 primarily due to customer specific material purchases and incrementala reduction in our unbilled production during the year ended December 31, 2020. Contracts2023, a decrease in customer specific blade material purchases driven by working capital improvement initiatives and a $12.8 million impairment of contract assets associated with our bus body supply agreement with Proterra, Inc. (Proterra), one of our customers in our automotive business line that filed for bankruptcy. Contract liabilities, decreasednet of the amounts reclassed to contract assets, increased by $2.4$6.9 million from December 31, 20192022 to December 31, 20202023 due to the amounts billed to customers exceeding the revenue earned related to precision molding and assembly systems and wind blades being produced exceeding the amounts billed to customers related to wind blades produced during the year ended December 31, 2020.2023.
For the years ended December 31, 2020, 20192023, 2022 and 2018,2021, we recognized revenue of $3.0$17.1 million, $7.1$1.3 million and $2.8$0.6 million, respectively, related to precision molding and assembly systems and wind blades,customer advances, which was included in the corresponding contract liability balance at the beginning of the period.
Performance Obligations
Remaining performance obligations represent the transaction price for which work has not been performed and excludes any unexercised contract options. As discussed in Note 1, Summary of Operations and Summary of Significant Accounting Policies – (c)(d) Revenue Recognition, the transaction price includes estimated variable
F-24
TPI COMPOSITES, INC. AND SUBSIDIARIES
Notes to Consolidated Financial Statements
consideration as determined based on the estimated production output within the range of the contractual guaranteed minimum volume obligations and production capacity.
F-21
TPI COMPOSITES, INC. AND SUBSIDIARIES
Notes to Consolidated Financial Statements
As of December 31, 2020,2023, the aggregate amount of the transaction price allocated to the remaining performance obligations to be satisfied in future periods was approximately $3.6$1.4 billion. We estimate that we will recognize the remaining performance obligations as revenue as follows:
|
| $ |
|
| % of Total |
| ||
|
| (in thousands) |
| |||||
Year Ending December 31, |
|
|
|
|
|
| ||
2024 |
| $ | 1,098,908 |
|
|
| 77.1 | % |
2025 |
|
| 326,893 |
|
|
| 22.9 |
|
Total remaining performance obligations |
| $ | 1,425,801 |
|
|
| 100.0 | % |
|
| $ |
|
| % of Total |
| ||
|
| (in thousands) |
|
|
|
|
| |
Year Ending December 31, |
|
|
|
|
|
|
|
|
2021 |
| $ | 1,689,153 |
|
|
| 47.1 | % |
2022 |
|
| 1,203,476 |
|
|
| 33.5 | % |
2023 |
|
| 622,170 |
|
|
| 17.3 | % |
2024 |
|
| 75,841 |
|
|
| 2.1 | % |
Total remaining performance obligations |
| $ | 3,590,640 |
|
|
| 100.0 | % |
The transaction price allocated to the remaining performance obligations excludes approximately $71.9 million of variable consideration over the contractual guaranteed minimum volume obligations under current contracts with customers which has been constrained primarily due to uncertainty associated with production volume during the remaining term of the agreements. We estimate the constraint will be resolved in subsequent periods when our customers provide additional information relevant to forecasted future production.
For the year ended December 31, 2020,2023, net revenue recognized from our performance obligations satisfied in previous periods increaseddecreased by $23.7$30.7 million. The current year increasedecrease primarily relates to changes in certain of our estimated total contract values and related direct costs to complete the performance obligations.
Pre-Production Investments
We recognize an asset for deferred costs incurred to fulfill a contract when those costs meet all of the following criteria: (a) the costs relate directly to a contract or to an anticipated contract that we can specifically identify; (b) the costs generate or enhance our resources that will be used in satisfying performance obligations in the future; and, (c) the costs are expected to be recovered. We capitalize the costs related to training our workforce to execute the manufacturing services and other facility set-up costs related to preparing for production of a specific contract. We factor these costs into our estimated cost analysis for the overall contract. Costs capitalized are amortized over the number of units produced during the contract term. As of December 31, 2020,2023, the cost and accumulated amortization of such assets totaled $6.6$9.0 million and $3.7$7.3 million, respectively. As of December 31, 2019,2022, the cost and accumulated amortization of such assets totaled $5.6$8.5 million and $2.7$6.0 million, respectively. These amounts are included in intangible assets and deferred costs, net in the consolidated balance sheet. See Note 7, 8, Intangible Assets and Deferred Costs, Net.
In applying the practical expedient as permitted under FASB ASU 2014-09, Revenue from Contracts with Customers (Topic 606), we recognize the incremental costs of obtaining contracts as an expense when incurred if the amortization period of the asset that we otherwise would have recognized is one year or less. These costs are included in cost of goods sold.
Note 3.4. Significant Risks and Uncertainties
Our revenues and receivables are earned from a small number of customers. As such, our production levels are dependent on these customers’ orders. See Note 18, 21, Concentration of Customers.
The COVID-19 pandemic adversely affected our business and operations duringThere have been numerous government initiatives over the year ended December 31, 2020. Duringpast few years aimed at expanding the first quarteruse of 2020, our China manufacturing facilities were adversely impacted byrenewable energy, including the COVID-19 pandemicInflation Reduction Act (IRA) in the formU.S, and several policy initiatives in the European Union (EU) that are expected to accelerate the expansion of renewable energy and green technologies, simplify regulations, speed up permitting and promote cross-border projects to accelerate climate neutrality. Despite these favorable long-term policy trends, we expect reduced production levels and COVID-19demand in the near term while the wind industry awaits clarity on the implementation guidance related costs associated with the health and safety of our associates and non-productive labor. During the second quarter of 2020, all of our manufacturing facilities with the exception of our China manufacturing facilities and our Rhode Island manufacturing facility were
F-22
TPI COMPOSITES, INC. AND SUBSIDIARIES
Notes to Consolidated Financial Statements
required to temporarily suspend production or operate at reduced production levels due primarily to certain applicable government-mandated stay at home orders in response to the COVID-19 pandemic, demands from certain of our labor unions to suspend or reduce production and general safety concerns of our associates. By the endkey components of the second quarter of 2020, most of our manufacturing facilities had returned to operating at or near normal production levels. Although all of our manufacturing facilities currently are operating at or near normal production levels, we may be required to reinstate temporary production suspensions or volume reductions at our manufacturing facilities or at our other locations to the extent there is a resurgence of COVID-19 casesIRA, clarity around more robust policies in the regions where we operate or there is an outbreak of positive COVID-19 cases in any of our facilities. EU, and industry headwinds caused by rising interest rates and inflation.
We maintain our U.S. cash in bank deposit and money market accounts that, at times, exceed U.S. federally insured limits. U.S. bank accounts are guaranteed by the Federal Deposit Insurance Corporation (FDIC) in an amount up to $250,000$250,000 during 20202023 and 2019. U.S2022. U.S. money market accounts are not guaranteed by the FDIC. As of
F-25
TPI COMPOSITES, INC. AND SUBSIDIARIES
Notes to Consolidated Financial Statements
December 31, 20202023 and 2019,2022, we had $68.9$116.0 million and $45.8$124.4 million, respectively, of cash in bank deposit and money market accounts in high quality U.S. banks, which was in excess of FDIC limits. We have not experienced losses in any such accounts. As of December 31, 2023 and 2022, we had $10.8 million and $9.9 million, respectively of cash held as collateral for various instruments, primarily for letters of guarantee related to our India, corporate, and Mexico locations. These amounts are reported as restricted cash in our consolidated balance sheets.
We also maintain cash in bank deposit accounts outside the U.S. with no insurance.that are not subject to FDIC limits. As of December 31, 2020,2023, this included $47.4$40.6 million in China, $6.0 million in Turkey, $5.0Türkiye, $1.9 million in India, $2.1$1.2 million in Mexico and $0.5$1.3 million in other countries. As of December 31, 2019,2022, this included $9.7$2.4 million in China, $9.9 million in Turkey, $2.4Türkiye, $4.7 million in India, $2.1$1.4 million in Mexico and $0.4$0.7 million in other countries. We have not experienced losses in these accounts. In addition, as ofat December 31, 20202023 and 2019,2022, we have short-term deposits in interest bearing accountshad unrestricted cash and cash equivalents related to our discontinued operations of $0.3$0.9 million and $1.0$9.7 million, respectively, in China, which are reported as restricted cash in our consolidated balance sheets. As of December 31, 2019, we had long-term deposits in interest bearing accounts of $0.5 million in Iowa. This deposit was repaid to us in 2020. See Note 8, Other Noncurrent Assetsrespectively..
Certain of our debt agreements are either tied to LIBOR or the Euro Interbank Offered Rate (EURIBOR) and certain of them have associated interest rate hedges. Due to the relatively low LIBOR and EURIBOR rates in effect as of December 31, 2020, a 10% change in the LIBOR or EURIBOR rate would not have had a material impact on our future earnings, fair values or cash flows.
Note 4.5. Accounts Receivable
Accounts receivable as of December 31 consisted of the following:
|
| 2023 |
|
| 2022 |
| ||
|
| (in thousands) |
| |||||
Trade accounts receivable |
| $ | 129,312 |
|
| $ | 181,322 |
|
Other accounts receivable |
|
| 8,717 |
|
|
| 3,487 |
|
Total accounts receivable |
| $ | 138,029 |
|
| $ | 184,809 |
|
|
| 2020 |
|
| 2019 |
| ||
|
| (in thousands) |
| |||||
Trade accounts receivable |
| $ | 127,765 |
|
| $ | 180,051 |
|
Other accounts receivable |
|
| 5,003 |
|
|
| 3,961 |
|
Total accounts receivable |
| $ | 132,768 |
|
| $ | 184,012 |
|
Note 5.6. Other Current Assets
Other current assets as of December 31 consisted of the following:
|
| 2023 |
|
| 2022 |
| ||
|
| (in thousands) |
| |||||
Refundable value-added tax |
| $ | 33,691 |
|
| $ | 25,331 |
|
Deposits |
|
| 597 |
|
|
| 586 |
|
Other current assets |
|
| 276 |
|
|
| 135 |
|
Total current assets |
| $ | 34,564 |
|
| $ | 26,052 |
|
|
| 2020 |
|
| 2019 |
| ||
|
| (in thousands) |
| |||||
Refundable value-added tax |
| $ | 18,961 |
|
| $ | 22,687 |
|
Deposits |
|
| 2,791 |
|
|
| 6,143 |
|
Other current assets |
|
| 6,169 |
|
|
| 1,013 |
|
Total current assets |
| $ | 27,921 |
|
| $ | 29,843 |
|
F-23
TPI COMPOSITES, INC. AND SUBSIDIARIES
Notes to Consolidated Financial Statements
Note 6.7. Property, Plant and Equipment, Net
Property, plant and equipment, net as of December 31 consisted of the following:
|
| 2020 |
|
| 2019 |
|
| 2023 |
|
| 2022 |
| ||||
|
| (in thousands) |
|
| (in thousands) |
| ||||||||||
Machinery and equipment |
| $ | 204,917 |
|
| $ | 159,176 |
|
| $ | 190,866 |
|
| $ | 199,406 |
|
Buildings |
|
| 15,544 |
|
|
| 14,495 |
| ||||||||
Leasehold improvements |
|
| 61,947 |
|
|
| 56,414 |
|
|
| 60,635 |
|
|
| 63,423 |
|
Office equipment and software |
|
| 35,194 |
|
|
| 32,284 |
|
|
| 41,801 |
|
|
| 41,114 |
|
Furniture |
|
| 25,097 |
|
|
| 22,429 |
|
|
| 22,163 |
|
|
| 22,249 |
|
Vehicles |
|
| 635 |
|
|
| 562 |
|
|
| 1,925 |
|
|
| 872 |
|
Construction in progress |
|
| 8,725 |
|
|
| 20,677 |
|
|
| 24,676 |
|
|
| 5,575 |
|
Idle assets |
|
| 2,116 |
|
|
| — |
| ||||||||
Total property, plant and equipment, gross |
|
| 352,059 |
|
|
| 306,037 |
|
|
| 344,182 |
|
|
| 332,639 |
|
Accumulated depreciation |
|
| (143,058 | ) |
|
| (101,030 | ) |
|
| (215,374 | ) |
|
| (195,798 | ) |
Total property, plant and equipment, net |
| $ | 209,001 |
|
| $ | 205,007 |
|
| $ | 128,808 |
|
| $ | 136,841 |
|
As of December 31, 2020, the projects in construction in progress included the continued investment in of our manufacturing facility in Chennai, India and in our other existing manufacturing facilities.
Total depreciation for the years ended December 31, 2020, 20192023, 2022 and 20182021 was $48.6$37.0 million, $36.7$37.5 million and $25.5$34.5 million, respectively.
F-26
TPI COMPOSITES, INC. AND SUBSIDIARIES
As of December 31, 2020, the cost and accumulated depreciation of property, plant and equipment that we are leasing under finance lease arrangements is $28.5 million and $12.5 million, respectively. As of December 31, 2019, the cost and accumulated depreciation of property, plant and equipment that we are leasing under finance lease arrangements is $45.0 million and $17.0 million, respectively. See Note 12, Leases for more information relatedNotes to finance leases.Consolidated Financial Statements
Note 7.8. Intangible Assets and Deferred Costs, Net
Carrying values and estimated useful lives of intangible assets and deferred costs as of December 31, 2020,2023, consisted of the following:
|
| Estimated Useful Life |
| Cost |
|
| Accumulated Amortization |
|
| Net |
|
| Estimated |
| Cost |
|
| Accumulated |
|
| Net |
| ||||||
|
|
|
| (in thousands) |
|
| (in thousands) |
| ||||||||||||||||||||
Pre-production investments (1) |
| Various |
| $ | 6,581 |
|
| $ | (3,723 | ) |
| $ | 2,858 |
|
| Various |
| $ | 8,968 |
|
| $ | (7,267 | ) |
| $ | 1,701 |
|
Patents |
| 10 years |
|
| 123 |
|
|
| (6 | ) |
|
| 117 |
|
| 10 years |
|
| 110 |
|
|
| (50 | ) |
|
| 60 |
|
Acquired development tools |
| 10 years |
|
| 1,075 |
|
|
| (54 | ) |
|
| 1,021 |
|
| 10 years |
|
| 966 |
|
|
| (435 | ) |
|
| 531 |
|
Trademarks |
| Indefinite |
|
| 150 |
|
|
| — |
|
|
| 150 |
|
| Indefinite |
|
| 150 |
|
|
| — |
|
|
| 150 |
|
Total intangible assets and deferred costs, net |
|
|
| $ | 7,929 |
|
| $ | (3,783 | ) |
| $ | 4,146 |
|
| $ | 10,194 |
|
| $ | (7,752 | ) |
| $ | 2,442 |
| ||
Carrying values and estimated useful lives of intangible assets and deferred costs as of December 31, 2019,2022, consisted of the following:
|
| Estimated |
| Cost |
|
| Accumulated |
|
| Net |
| |||
|
|
|
| (in thousands) |
| |||||||||
Pre-production investments (1) |
| Various |
| $ | 8,480 |
|
| $ | (6,045 | ) |
| $ | 2,435 |
|
Patents |
| 10 years |
|
| 107 |
|
|
| (37 | ) |
|
| 70 |
|
Acquired development tools |
| 10 years |
|
| 934 |
|
|
| (327 | ) |
|
| 607 |
|
Trademarks |
| Indefinite |
|
| 150 |
|
|
| — |
|
|
| 150 |
|
Total intangible assets and deferred costs, net |
|
|
| $ | 9,671 |
|
| $ | (6,409 | ) |
| $ | 3,262 |
|
|
| Estimated Useful Life |
| Cost |
|
| Accumulated Amortization |
|
| Net |
| |||
|
|
|
| (in thousands) |
| |||||||||
Pre-production investments (1) |
| Various |
| $ | 5,639 |
|
| $ | (2,656 | ) |
| $ | 2,983 |
|
Patents |
| 10 years |
|
| 112 |
|
|
| (6 | ) |
|
| 106 |
|
Acquired development tools |
| 10 years |
|
| 980 |
|
|
| (49 | ) |
|
| 931 |
|
Trademarks |
| Indefinite |
|
| 150 |
|
|
| — |
|
|
| 150 |
|
Total intangible assets and deferred costs, net |
|
|
| $ | 6,881 |
|
| $ | (2,711 | ) |
| $ | 4,170 |
|
|
|
F-24
TPI COMPOSITES, INC. AND SUBSIDIARIES
Notes to Consolidated Financial Statements
During the years ended December 31, 2020, 20192023, 2022 and 2018,2021, we recorded amortization expense for the intangible assets and deferred costs of $1.1$1.9 million, $1.9$1.3 million and $0.9$3.1 million, respectively.
Note 8.9. Other Noncurrent Assets
Other noncurrent assets as of December 31 consisted of the following:
|
| 2023 |
|
| 2022 |
| ||
|
| (in thousands) |
| |||||
Deferred tax assets |
| $ | 18,357 |
|
| $ | 9,555 |
|
Deposits |
|
| 10,488 |
|
|
| 9,362 |
|
Other |
|
| 1,979 |
|
|
| 2,875 |
|
Total other noncurrent assets |
| $ | 30,824 |
|
| $ | 21,792 |
|
|
| 2020 |
|
| 2019 |
| ||
|
| (in thousands) |
| |||||
Deferred tax assets |
| $ | 18,793 |
|
| $ | 11,209 |
|
Deposits |
|
| 10,004 |
|
|
| 8,437 |
|
Land use right (50 year estimated useful life) |
|
| 1,584 |
|
|
| 1,521 |
|
Restricted cash |
|
| — |
|
|
| 475 |
|
Other |
|
| 2,936 |
|
|
| 2,278 |
|
Total other noncurrent assets |
| $ | 33,317 |
|
| $ | 23,920 |
|
Note 9.10. Accrued Warranty
Warranty accrual as of December 31 consisted of the following:
|
| 2023 |
|
| 2022 |
|
| 2021 |
| |||
|
| (in thousands) |
| |||||||||
Warranty accrual at beginning of year |
| $ | 22,347 |
|
| $ | 42,020 |
|
| $ | 50,852 |
|
Accrual during the year |
|
| 12,131 |
|
|
| 13,598 |
|
|
| 20,650 |
|
Cost of warranty services provided during the year |
|
| (48,402 | ) |
|
| (36,227 | ) |
|
| (23,174 | ) |
Changes in estimate for pre-existing warranties, |
|
| 51,407 |
|
|
| 2,956 |
|
|
| (6,308 | ) |
Warranty accrual at end of year |
| $ | 37,483 |
|
| $ | 22,347 |
|
| $ | 42,020 |
|
|
| 2020 |
|
| 2019 |
|
| 2018 |
| |||
|
| (in thousands) |
| |||||||||
Warranty accrual at beginning of year |
| $ | 47,639 |
|
| $ | 36,765 |
|
| $ | 30,419 |
|
Accrual during the year |
|
| 20,029 |
|
|
| 23,710 |
|
|
| 16,153 |
|
Cost of warranty services provided during the year |
|
| (29,890 | ) |
|
| (6,220 | ) |
|
| (4,457 | ) |
Changes in estimate for pre-existing warranties, including expirations during the period |
|
| 13,074 |
|
|
| (6,616 | ) |
|
| (5,350 | ) |
Warranty accrual at end of year |
| $ | 50,852 |
|
| $ | 47,639 |
|
| $ | 36,765 |
|
F-27
TPI COMPOSITES, INC. AND SUBSIDIARIES
Notes to Consolidated Financial Statements
Note 10.11. Share-Based Compensation
The share-based compensation expense recognized in the consolidated statements of operations for the years ended December 31 was as follows:
|
| 2023 |
|
| 2022 |
|
| 2021 |
| |||
|
| (in thousands) |
| |||||||||
Cost of goods sold |
| $ | 2,671 |
|
| $ | 2,701 |
|
| $ | 1,943 |
|
General and administrative expenses |
|
| 7,245 |
|
|
| 11,758 |
|
|
| 5,871 |
|
Total share-based compensation expense |
| $ | 9,916 |
|
| $ | 14,459 |
|
| $ | 7,814 |
|
|
| 2020 |
|
| 2019 |
|
| 2018 |
| |||
|
| (in thousands) |
| |||||||||
Cost of goods sold |
| $ | 1,979 |
|
| $ | 386 |
|
| $ | 1,281 |
|
General and administrative expenses |
|
| 8,373 |
|
|
| 5,295 |
|
|
| 6,514 |
|
Total share-based compensation expense |
| $ | 10,352 |
|
| $ | 5,681 |
|
| $ | 7,795 |
|
The share-based compensation expense recognized by award type for the years ended December 31 was as follows:
|
| 2020 |
|
| 2019 |
|
| 2018 |
| |||
|
| (in thousands) |
| |||||||||
RSUs |
| $ | 4,613 |
|
| $ | 3,658 |
|
| $ | 4,209 |
|
Stock options |
|
| 3,589 |
|
|
| 1,501 |
|
|
| 2,463 |
|
PSUs |
|
| 2,150 |
|
|
| 522 |
|
|
| 1,123 |
|
Total share-based compensation expense |
| $ | 10,352 |
|
| $ | 5,681 |
|
| $ | 7,795 |
|
F-25
TPI COMPOSITES, INC. AND SUBSIDIARIES
Notes to Consolidated Financial Statements
|
| 2023 |
|
| 2022 |
|
| 2021 |
| |||
|
| (in thousands) |
| |||||||||
RSUs |
| $ | 9,605 |
|
| $ | 11,030 |
|
| $ | 5,221 |
|
Stock options |
|
| 996 |
|
|
| 889 |
|
|
| 1,118 |
|
PSUs |
|
| (685 | ) |
|
| 2,540 |
|
|
| 1,475 |
|
Total share-based compensation expense |
| $ | 9,916 |
|
| $ | 14,459 |
|
| $ | 7,814 |
|
Included in total share-based compensation expense for the year ended December 31, 2020 is $1.7 million of compensation expense associated with the modification of certain employee and non-employee awards during the period. The modifications primarily provided for the extension of the post termination exercise period of outstanding stock options, resulting in a one-time charge in the year ended December 31, 2020.
The summary of activity for our incentive plans, including discontinued operations, is as follows:
|
|
|
|
| Stock Options |
|
| RSUs |
|
| PSUs |
| ||||||||||||||||||||
|
| Shares |
|
| Shares |
|
| Weighted- |
|
| Options |
|
| Units |
|
| Weighted- |
|
| Units |
|
| Weighted- |
| ||||||||
Balance as of December 31, 2020 |
|
| 6,162,713 |
|
|
| 1,499,586 |
|
| $ | 16.94 |
|
|
| 959,233 |
|
|
| 668,454 |
|
| $ | 23.60 |
|
|
| 650,523 |
|
| $ | 16.42 |
|
Granted |
|
| (312,173 | ) |
|
| 5,000 |
|
|
| 24.76 |
|
|
|
|
|
| 168,993 |
|
|
| 49.21 |
|
|
| 138,180 |
|
|
| 43.97 |
| |
Exercised/vested |
|
| — |
|
|
| (371,971 | ) |
|
| 14.01 |
|
|
|
|
|
| (135,621 | ) |
|
| 22.39 |
|
|
| (139,924 | ) |
|
| 15.19 |
| |
Forfeited/cancelled |
|
| 469,827 |
|
|
| (134,489 | ) |
|
| 26.12 |
|
|
|
|
|
| (65,220 | ) |
|
| 31.86 |
|
|
| (270,118 | ) |
|
| 23.99 |
| |
Balance as of December 31, 2021 |
|
| 6,320,367 |
|
|
| 998,126 |
|
|
| 16.84 |
|
|
| 779,149 |
|
|
| 636,606 |
|
|
| 29.81 |
|
|
| 378,661 |
|
|
| 21.53 |
|
Granted |
|
| (1,328,995 | ) |
|
| 254,465 |
|
|
| 17.05 |
|
|
|
|
|
| 876,492 |
|
|
| 16.40 |
|
|
| 198,038 |
|
|
| 12.13 |
| |
Exercised/vested |
|
| — |
|
|
| — |
|
|
| — |
|
|
|
|
|
| (137,695 | ) |
|
| 31.28 |
|
|
| (149,733 | ) |
|
| 7.43 |
| |
Forfeited/cancelled |
|
| 280,816 |
|
|
| (71,620 | ) |
|
| 25.54 |
|
|
|
|
|
| (82,324 | ) |
|
| 23.76 |
|
|
| (127,500 | ) |
|
| 18.47 |
| |
Balance as of December 31, 2022 |
|
| 5,272,188 |
|
|
| 1,180,971 |
|
|
| 16.36 |
|
|
| 804,473 |
|
|
| 1,293,079 |
|
|
| 20.95 |
|
|
| 299,466 |
|
|
| 23.67 |
|
Granted |
|
| (1,332,975 | ) |
|
| 75,487 |
|
|
| 6.78 |
|
|
|
|
|
| 1,044,440 |
|
|
| 9.58 |
|
|
| 213,048 |
|
|
| 14.71 |
| |
Exercised/vested |
|
| — |
|
|
| — |
|
|
| — |
|
|
|
|
|
| (675,752 | ) |
|
| 19.65 |
|
|
| (44,803 | ) |
|
| 13.49 |
| |
Forfeited/cancelled |
|
| 348,315 |
|
|
| (43,955 | ) |
|
| 25.81 |
|
|
|
|
|
| (145,390 | ) |
|
| 18.02 |
|
|
| (158,970 | ) |
|
| 34.23 |
| |
Balance as of December 31, 2023 |
|
| 4,287,528 |
|
|
| 1,212,503 |
|
| $ | 15.42 |
|
|
| 885,855 |
|
|
| 1,516,377 |
|
| $ | 13.98 |
|
|
| 308,741 |
|
| $ | 13.53 |
|
|
|
|
|
|
| Stock Options |
|
| RSUs |
|
| PSUs |
| |||||||||||||||||||
|
| Shares Available for Grant |
|
| Shares |
|
| Weighted- Average Exercise Price |
|
| Options Exercisable |
|
| Units |
|
| Weighted- Average Grant Date Fair Value |
|
| Units |
|
| Weighted- Average Grant Date Fair Value |
| ||||||||
Balance as of December 31, 2017 |
|
| 4,731,117 |
|
|
| 3,203,290 |
|
|
| 13.34 |
|
|
| 890,433 |
|
|
| 613,380 |
|
|
| 15.02 |
|
|
| 0 |
|
|
| 0 |
|
Increase in shares authorized |
|
| 1,360,826 |
|
|
| 0 |
|
|
| 0 |
|
|
|
|
|
|
| 0 |
|
|
| 0 |
|
|
| 0 |
|
|
| 0 |
|
Granted |
|
| (451,212 | ) |
|
| 9,652 |
|
|
| 22.67 |
|
|
|
|
|
|
| 149,012 |
|
|
| 23.37 |
|
|
| 292,548 |
|
|
| 22.67 |
|
Exercised/vested |
|
| 0 |
|
|
| (354,153 | ) |
|
| 12.10 |
|
|
|
|
|
|
| (298,036 | ) |
|
| 13.03 |
|
|
| 0 |
|
|
| 0 |
|
Forfeited/cancelled |
|
| 339,874 |
|
|
| (258,095 | ) |
|
| 14.72 |
|
|
|
|
|
|
| (38,480 | ) |
|
| 21.51 |
|
|
| (43,299 | ) |
|
| 22.67 |
|
Balance as of December 31, 2018 |
|
| 5,980,605 |
|
|
| 2,600,694 |
|
|
| 13.41 |
|
|
| 1,415,948 |
|
|
| 425,876 |
|
|
| 18.75 |
|
|
| 249,249 |
|
|
| 22.67 |
|
Increase in shares authorized |
|
| 1,387,123 |
|
|
| 0 |
|
|
| 0 |
|
|
|
|
|
|
| 0 |
|
|
| 0 |
|
|
| 0 |
|
|
| 0 |
|
Granted |
|
| (875,557 | ) |
|
| 397,170 |
|
|
| 20.94 |
|
|
|
|
|
|
| 196,418 |
|
|
| 26.99 |
|
|
| 281,969 |
|
|
| 29.25 |
|
Exercised/vested |
|
| 0 |
|
|
| (345,475 | ) |
|
| 15.14 |
|
|
|
|
|
|
| (236,187 | ) |
|
| 15.42 |
|
|
| 0 |
|
|
| 0 |
|
Forfeited/cancelled |
|
| 129,341 |
|
|
| (58,161 | ) |
|
| 15.23 |
|
|
|
|
|
|
| (31,680 | ) |
|
| 24.91 |
|
|
| (39,500 | ) |
|
| 25.60 |
|
Balance as of December 31, 2019 |
|
| 6,621,512 |
|
|
| 2,594,228 |
|
|
| 14.29 |
|
|
| 1,697,272 |
|
|
| 354,427 |
|
|
| 24.99 |
|
|
| 491,718 |
|
|
| 26.20 |
|
Increase in shares authorized |
|
| 1,407,228 |
|
|
| 0 |
|
|
| 0 |
|
|
|
|
|
|
| 0 |
|
|
| 0 |
|
|
| 0 |
|
|
| 0 |
|
Granted |
|
| (1,044,491 | ) |
|
| 261,181 |
|
|
| 28.49 |
|
|
|
|
|
|
| 461,732 |
|
|
| 22.43 |
|
|
| 321,578 |
|
|
| 22.40 |
|
Exercised/vested |
|
| 0 |
|
|
| (1,195,405 | ) |
|
| 13.25 |
|
|
|
|
|
|
| (117,683 | ) |
|
| 22.81 |
|
|
| (131,924 | ) |
|
| 12.53 |
|
Forfeited/cancelled |
|
| 221,289 |
|
|
| (160,418 | ) |
|
| 20.40 |
|
|
|
|
|
|
| (30,022 | ) |
|
| 25.06 |
|
|
| (30,849 | ) |
|
| 26.89 |
|
Balance as of December 31, 2020 |
|
| 7,205,538 |
|
|
| 1,499,586 |
|
|
| 16.94 |
|
|
| 959,233 |
|
|
| 668,454 |
|
|
| 23.60 |
|
|
| 650,523 |
|
|
| 27.07 |
|
F-28
F-26
TPI COMPOSITES, INC. AND SUBSIDIARIES
Notes to Consolidated Financial Statements
The balance of PSUs outstanding as of December 31, 2023, includes 89,813 units with market conditions related to achieving certain stock price hurdles during the relevant performance periods 106,558 units with market conditions that vest upon achievement of certain cumulative total shareholder return targets during the relevant performance periods, and 112,370 units with other non-market performance conditions related to the achievement of annual financial performance targets during the relevant performance periods. Additionally, the balance of RSUs outstanding as of December 31, 2023, includes 330,556 units of time-based awards with a guaranteed award value that vest over a two-year period with 50% on the first and second anniversary of the grant date, respectively, and additional shares may be issued on the second anniversary of the grant date to maintain the guaranteed award value. The fair value of RSUs and PSUs, based on the share price on the date of vesting, which vested during the years ended December 31, 2020, 20192023, 2022 and 20182021 was $10.4$9.8 million, $6.2$3.3 million and $8.4$9.0 million, respectively. In addition, during 2020, 20192023, 2022 and 2018,2021, we repurchased 61,920193,938 shares, 79,04086,976 shares and 100,89131,310 shares for $2.2$2.6 million, $2.1$1.0 million and $2.9$0.5 million, respectively, related to tax withholding requirements on vested RSU and PSU awards.
The following table summarizes the outstanding and exercisable stock option awards, including discontinued operations, as of December 31, 2020:2023:
|
| Options Outstanding |
|
| Options Exercisable |
| ||||||||||||||
Range of Exercise Prices: |
| Shares |
|
| Weighted- |
|
| Weighted- |
|
| Shares |
|
| Weighted- |
| |||||
$10.87 |
|
| 554,921 |
|
|
| 2.3 |
|
| $ | 10.23 |
|
|
| 495,460 |
|
| $ | 10.87 |
|
$11.00 to $17.06 |
|
| 119,487 |
|
|
| 5.7 |
|
|
| 15.06 |
|
|
| 74,575 |
|
|
| 15.70 |
|
$18.00 to $18.70 |
|
| 205,671 |
|
|
| 5.6 |
|
|
| 18.02 |
|
|
| 5,671 |
|
|
| 18.70 |
|
$18.77 to $29.56 |
|
| 332,424 |
|
|
| 6.0 |
|
|
| 22.61 |
|
|
| 310,149 |
|
|
| 22.23 |
|
$10.87 to $29.56 |
|
| 1,212,503 |
|
|
| 4.2 |
|
| $ | 15.42 |
|
|
| 885,855 |
|
| $ | 15.31 |
|
|
| Options Outstanding |
|
| Options Exercisable |
| ||||||||||||||
Range of Exercise Prices: |
| Shares |
|
| Weighted- Average Remaining Contractual Life (in years) |
|
| Weighted- Average Exercise Price |
|
| Shares |
|
| Weighted- Average Exercise Price |
| |||||
$10.87 |
|
| 720,590 |
|
|
| 4.4 |
|
|
| 10.87 |
|
|
| 720,590 |
|
|
| 10.87 |
|
$11.00 to $17.06 |
|
| 137,822 |
|
|
| 5.2 |
|
|
| 16.40 |
|
|
| 130,740 |
|
|
| 16.36 |
|
$18.70 |
|
| 8,797 |
|
|
| 5.5 |
|
|
| 18.70 |
|
|
| 8,797 |
|
|
| 18.70 |
|
$18.77 to $29.56 |
|
| 632,377 |
|
|
| 8.9 |
|
|
| 23.95 |
|
|
| 99,106 |
|
|
| 21.42 |
|
$10.87 to $29.56 |
|
| 1,499,586 |
|
|
| 6.4 |
|
|
| 16.94 |
|
|
| 959,233 |
|
|
| 12.78 |
|
The following table contains additional information pertaining to stock options, including discontinued operations, for the years ended December 31:
|
| 2020 |
|
| 2019 |
|
| 2018 |
|
| 2023 |
|
| 2022 |
|
| 2021 |
| ||||||
|
| (in thousands) |
|
| (in thousands) |
| ||||||||||||||||||
Total intrinsic value of stock options outstanding |
| $ | 53,741 |
|
| $ | 12,219 |
|
| $ | 29,045 |
|
| $ | — |
|
| $ | — |
|
| $ | 2,032 |
|
Total intrinsic value of stock options exercisable |
|
| 38,367 |
|
|
| 9,718 |
|
|
| 15,949 |
|
|
| — |
|
|
| — |
|
|
| 2,032 |
|
Cash received from the exercise of stock options |
|
| 15,839 |
|
|
| 5,223 |
|
|
| 4,284 |
|
|
| — |
|
|
| — |
|
|
| 5,211 |
|
Fair value of stock options vested |
|
| 4,669 |
|
|
| 8,796 |
|
|
| 4,566 |
|
|
| 5,332 |
|
|
| 4,761 |
|
|
| 4,641 |
|
As of December 31, 2020,2023, the unamortized cost of the outstanding RSUs and PSUs was $7.0$7.1 million and $2.9$1.8 million, respectively, which we expect to recognize in the consolidated financial statements over weighted-average periods of approximately 1.9 1.5 years and 1.9 years, respectively. Additionally, the total unrecognized cost related to non-vested stock option awards was $3.3$1.0 million, which we expect to recognize in the consolidated financial statements over a weighted-average period of approximately 1.9 1.6 years.
The fair value of the stock options granted during the years ended December 31 were calculated using the Black-Scholes option pricing model with the following assumptions:
|
| 2023 |
|
| 2022 |
|
| 2021 |
| |||
Weighted-average fair value |
| $ | 4.41 |
|
| $ | 8.05 |
|
| $ | 13.27 |
|
Expected volatility |
|
| 69.3 | % |
|
| 66.4 | % |
|
| 55.9 | % |
Expected life |
| 6.3 years |
|
| 5.0 years |
|
| 6.3 years |
| |||
Risk-free interest rate |
|
| 4.1 | % |
|
| 3.5 | % |
|
| 1.4 | % |
Dividend yield |
|
| 0.0 | % |
|
| 0.0 | % |
|
| 0.0 | % |
|
| 2020 |
|
| 2019 |
|
| 2018 |
| |||
Weighted-average fair value |
| $ | 13.11 |
|
| $ | 6.80 |
|
| $ | 10.36 |
|
Expected volatility |
|
| 48.5 | % |
|
| 28.0 | % |
|
| 42.8 | % |
Expected life |
| 6.1 years |
|
| 6.3 years |
|
| 6.3 years |
| |||
Risk-free interest rate |
|
| 0.4 | % |
|
| 1.9 | % |
|
| 2.7 | % |
Dividend yield |
|
| 0.0 | % |
|
| 0.0 | % |
|
| 0.0 | % |
F-29
F-27
TPI COMPOSITES, INC. AND SUBSIDIARIES
Notes to Consolidated Financial Statements
Note 11. Long-Term12. Debt Net of Debt Issuance Costs and Current Maturities
Long-term debt, net of debt issuance costs and current maturities, as of December 31 consisted of the following:
|
| 2023 |
|
| 2022 |
| ||
|
| (in thousands) |
| |||||
11% Senior secured term loan—U.S. (1) |
| $ | 395,041 |
|
| $ | — |
|
5.25% Convertible senior unsecured notes—U.S. |
|
| 132,500 |
|
|
| — |
|
Unsecured financing—EMEA |
|
| 62,891 |
|
|
| 43,556 |
|
Secured and unsecured working capital—India |
|
| 13,902 |
|
|
| 15,246 |
|
Equipment finance leases—Mexico |
|
| 1,098 |
|
|
| 1,909 |
|
Equipment finance leases—EMEA |
|
| 623 |
|
|
| 443 |
|
Other equipment finance leases |
|
| 85 |
|
|
| 19 |
|
Total debt—principal |
|
| 606,140 |
|
|
| 61,173 |
|
Less: Debt issuance costs |
|
| (4,023 | ) |
|
| — |
|
Less: Debt discount (2) |
|
| (116,924 | ) |
|
| — |
|
Total debt, net of debt issuance costs |
|
| 485,193 |
|
|
| 61,173 |
|
Less: Current maturities of long-term debt |
|
| (70,465 | ) |
|
| (59,975 | ) |
Long-term debt, net of current maturities |
| $ | 414,728 |
|
| $ | 1,198 |
|
|
| 2020 |
|
| 2019 |
| ||
|
| (in thousands) |
| |||||
Senior revolving loan—US |
| $ | 171,154 |
|
| $ | 112,414 |
|
Accounts receivable financing—EMEA |
|
| — |
|
|
| 3,805 |
|
Unsecured financing—EMEA |
|
| 30,040 |
|
|
| — |
|
Equipment financing—EMEA |
|
| 4,335 |
|
|
| 7,903 |
|
Equipment finance lease—Mexico |
|
| 8,038 |
|
|
| 11,919 |
|
Equipment finance lease—EMEA |
|
| 4,119 |
|
|
| 5,637 |
|
Equipment finance lease—U.S. |
|
| 132 |
|
|
| 288 |
|
Equipment finance lease—India |
| 100 |
|
| 95 |
| ||
Total debt - principal |
|
| 217,918 |
|
|
| 142,061 |
|
Less: Debt issuance costs |
|
| (1,051 | ) |
|
| (672 | ) |
Total debt, net of debt issuance costs |
|
| 216,867 |
|
|
| 141,389 |
|
Less: Current maturities of long-term debt |
|
| (32,551 | ) |
|
| (13,501 | ) |
Long-term debt, net of debt issuance costs and current maturities |
| $ | 184,316 |
|
| $ | 127,888 |
|
The following table summarizes borrowings under these facilities as of December 31:
|
|
|
| 2023 |
|
| 2022 |
| ||||||||||
Credit facilities |
| Interest Rates |
| Total Borrowing Capacity |
|
| Outstanding Balance |
|
| Total Borrowing Capacity |
|
| Outstanding Balance |
| ||||
|
|
|
| (in thousands) |
| |||||||||||||
Unsecured financing—EMEA |
| 8.29-10.38% |
| $ | 111,271 |
|
| $ | 62,891 |
|
| $ | 108,558 |
|
| $ | 43,556 |
|
Secured and unsecured working capital—India |
| 6.51-8.47% |
|
| 29,037 |
|
|
| 13,902 |
|
|
| 15,261 |
|
|
| 15,246 |
|
Total credit facilities |
|
|
| $ | 140,308 |
|
| $ | 76,793 |
|
| $ | 123,819 |
|
| $ | 58,802 |
|
|
|
|
|
|
|
|
|
|
|
|
|
|
|
| ||||
Term debt and equipment financing |
| Interest Rates |
| Total Facility |
|
| Outstanding Balance |
|
| Total Facility |
|
| Outstanding Balance |
| ||||
11% Senior secured term loan—U.S. |
| 11.00% |
| $ | 395,041 |
|
| $ | 395,041 |
|
| $ | — |
|
| $ | — |
|
5.25% Convertible senior unsecured notes—U.S. |
| 5.25% |
|
| 132,500 |
|
|
| 132,500 |
|
|
| — |
|
|
| — |
|
Equipment finance leases—Mexico |
| 4.00-5.36% |
|
| 1,098 |
|
|
| 1,098 |
|
|
| 12,205 |
|
|
| 1,909 |
|
Equipment finance leases—EMEA |
| 5.50-6.00% |
|
| 10,000 |
|
|
| 623 |
|
|
| 10,000 |
|
|
| 443 |
|
Other equipment finance leases |
| 9.38% |
|
| 85 |
|
|
| 85 |
|
|
| 65 |
|
|
| 19 |
|
Total term debt and equipment financing |
|
|
|
| 538,724 |
|
|
| 529,347 |
|
|
| 22,270 |
|
|
| 2,371 |
|
Total debt—principal |
|
|
| $ | 679,032 |
|
| $ | 606,140 |
|
| $ | 146,089 |
|
| $ | 61,173 |
|
U.S.:
11% Senior Revolving Loan (U.S.):secured term loan
In April 2018, weOn December 14, 2023, the Company entered into the Credit Agreement with Oaktree Power Opportunities Fund V Holdings L.P., Opps TPIC Holdings, LLC, and Oaktree Phoenix Investment Fund, L.P., which are funds
F-30
TPI COMPOSITES, INC. AND SUBSIDIARIES
Notes to Consolidated Financial Statements
managed by Oaktree Capital Management, L.P. (collectively, the "Purchasers"). The Credit Agreement exchanged $350.0 million of the Company’s Series A Preferred Stock, along with $86.0 million of accrued paid-in-kind dividends, for the $393.0 million Term Loan and the issuance of 3,899,903 shares of Common Stock (the "Exchange").
Borrowings under the Term Loan will bear interest at a new credit agreement (therate per annum of 11.0%, provided that the interest rate shall be automatically increased to 15.0% per annum from and after the funding of any additional term loans. The Company has the ability to pay in kind all interest payments through December 31, 2025, subject to certain exceptions set forth in the Credit Agreement) with 4 lenders consistingAgreement. In addition, the Company can pay in kind 50% of the interest payments from January 1, 2026, through the maturity date of the Term Loan on March 31, 2027, subject to certain exceptions set forth in the Credit Agreement. If the Company elects to pay in cash any interest payments that could have been paid in kind, such interest payments can be reduced by 2.0%, resulting in a multi-currency, revolving credit facility in anstated interest rate of 9.0% for such portion of interest. Interest payments will be paid quarterly on January 15, April 15, July 15, and October 15 of each year.
In addition, up to $50.0 million aggregate principal amount of $150.0 million, including a $25.0 million letter of credit sub-facility. Oncommitments for additional term loans to be extended at any time up to approximately one year from the closingexecution date, we drew down $75.4 million onsubject to the revolving credit facilityterms and conditions set forth in connection with the closing of the transactions contemplated byCredit Agreement.
Obligations under the Credit Agreement and used the proceedsother Loan Documents (as defined in the Credit Agreement) are guaranteed by all of the Company's U.S. wholly owned subsidiaries, and certain foreign subsidiaries (together with the Company, the "Loan parties"), and are secured by first priority security interests in substantially all assets of the Loan parties, including intellectual property. The affirmative and negative covenants are customary for credit agreements of this nature. The Credit Agreement limits the amount of indebtedness, a cash on hand balance requirement of $40.0 million through September 30, 2024 and $50.0 million thereafter in the U.S., an individual limit of $10.0 million for any single capital expenditure project, an annual total capital expenditure limit of $30.0 million, and a limit of $37.5 million on acquisitions and $25.0 million on investments. We are in compliance with all requirements as of December 31, 2023.
The Credit Agreement contains certain events of default, the occurrence and continuation of which would entitle the purchasers of the Term Loan to pay all outstanding amounts due and payable under our previous credit agreement, various fees and expenses and accrued interest. All borrowings and amounts outstandingcause the Company’s indebtedness under the Credit Agreement to become immediately due and payable, and to exercise remedies against the Loan Parties and the collateral securing the Term Loan, including cash. Under the Credit Agreement, an event of default will occur if, among other things, the Company fails to make payments under the Credit Agreement as and when due (subject in certain cases to specified grace periods), the Company or its subsidiaries breach any of the covenants under the Credit Agreement (subject to specified cure periods with respect to certain breaches), a Change of Control (as defined in the Credit Agreement) occurs, the Company, its subsidiaries or their respective assets become subject to certain legal proceedings, such as bankruptcy proceedings, the Company and/or its subsidiaries are scheduledunable to maturepay their debts as they become due or default on contracts with third parties which would permit the holder of indebtedness in April 2023.excess of a certain threshold to accelerate the maturity of such indebtedness or that could cause a material adverse change. We had determined the event of default redemption features were embedded derivatives that required bifurcation and recognition as a derivative liability (“Event of Default Derivative”). The Event of Default Derivative instrument is recorded at fair value and marked-to-market each reporting period with changes in fair value being reflected in earnings. As of both the issuance date and December 31, 2023, the Event of Default Derivative was valued at zero. For the year ended December 31, 2023, there were no mark-to-market adjustments recorded through earnings.
In 2018, interest accruedWe accounted for the issuance of the Notes as a single liability measured at its fair value, as the only embedded feature requiring bifurcation and recognition as a variable rate equalderivative (the Event of Default Derivative) had no value at issuance. The Term Loan is required to LIBOR plusbe recorded at fair value as a marginresult of 1.5% (4.0%the Exchange. As of the date of the Exchange, the fair value of the Term Loan was $274.7 million and is included in long-term debt, net of current maturities on the consolidated balance sheet as of December 31, 2018),2023, representing a $118.3 million discount on the Term Loan.
The consideration transferred associated with the Exchange is made up of (i) the fair value of the Term Loan, (ii) fair value of Common Stock issued and (iii) of costs incurred to execute the Exchange (the “Exchange Consideration Transferred”). At the time of the Exchange, the carrying value of the Series A Preferred Stock, net of issuance costs, was $368.3 million ("Extinguishment Carrying Value"). We incurred direct costs of $2.7 million ("Transaction Costs") in relation to the extinguishment which, may vary based on our total net leverage ratio as definedin accordance with ASC 260, Earnings Per Share,
F-31
TPI COMPOSITES, INC. AND SUBSIDIARIES
Notes to Consolidated Financial Statements
("Earnings Per Share") were included in the Credit Agreement. Interest is paid monthlymeasurement of consideration transferred. The difference between the Exchange Consideration Transferred and the Extinguishment Carrying Value resulted in a gain on extinguishment of $82.6 million as included in paid-in capital on the consolidated balance sheet as of December 31, 2023.
The components of the gain on extinguishment of Series A Preferred Stock for the year ended December 31, 2023 were as follows (in $ thousands):
Series A Preferred Stock par value |
| $ | 350,000 |
|
Series A Preferred Stock paid in kind dividends |
|
| 86,210 |
|
Series A Preferred Stock accreted redemption premium |
|
| 1,482 |
|
Series A Preferred Stock unamortized |
|
| (69,362 | ) |
Extinguishment Carrying Value |
|
| 368,330 |
|
|
|
|
| |
11% Senior secured term loan—U.S. |
|
| 393,000 |
|
Debt discount |
|
| (118,288 | ) |
Fair value of Common Stock |
|
| 8,346 |
|
Transaction costs |
|
| 2,652 |
|
Fair value of Exchange Consideration Transferred |
|
| 285,710 |
|
|
|
|
| |
Gain on extinguishment of Series A Preferred Stock |
| $ | 82,620 |
|
Convertible Senior Notes:
Convertible Notes and Indenture
In March 2023, we are not obligatedissued and sold an aggregate of $132.5 million principal amount of convertible senior unsecured notes due 2028 (the Notes) in a private offering to make any principal repayments priorpersons reasonably believed to the maturity date provided we are not in defaultbe qualified institutional buyers pursuant to Rule 144A under the Credit Agreement. We may prepay the borrowings under the Credit Agreement without penalty.
In April 2018, we also entered into an interest rate swap arrangement to fixSecurities Act of 1933, as amended (the Securities Act). The Notes consisted of a notional amount of $75.0$115.0 million of the Credit Agreement at an effective interest rate of 4.2% for a period of five years. See Note 13, Financial Instruments, for more details on this interest rate swap arrangement.
In May 2019, the Credit Agreement was amended to revise the definition of Consolidated EBITDA as utilized in certain of the financial covenants of the Credit Agreement. In February 2020, we entered into an Incremental Facility Agreement with the current lenders to our Credit Agreementinitial placement and an option to purchase an additional lender, pursuant to which the$17.5 million aggregate principal amount of our revolving credit facility under the Credit AgreementNotes, which was increasedfully exercised. The net proceeds from $150.0 million to $205.0 million. All other material terms and conditionsthe issuance of the Credit Agreement remained the same. In connection with this Incremental Facility Agreement, we incurred additionalNotes was $109.1 million, net of $4.8 million in debt issuance costs totaling $0.2and $18.6 million which will bein cash used to purchase the capped call transactions discussed below. The debt issuance costs are amortized to interest expense over the remaining term of the Credit Agreement usingNotes.
The Notes were issued pursuant to an Indenture, dated March 3, 2023 (the Indenture), between the effectiveCompany and U.S. Bank Trust Company, National Association, as trustee. The Indenture includes customary covenants and sets forth certain events of default after which the Notes may be declared immediately due and payable and sets forth certain types of bankruptcy or insolvency events of default involving the Company after which the Notes become automatically due and payable. The Notes do not contain any specific financial covenants.
The Notes bear interest method.at a rate of 5.25% per year, payable semiannually in arrears on March 15 and September 15 of each year, beginning on September 15, 2023. The Notes will mature on March 15, 2028, unless earlier converted, redeemed, or repurchased.
F-28The Notes are convertible into cash, shares of the Company’s common stock, par value $0.01 per share (the Common Stock) or a combination of cash and shares of Common Stock, at the Company’s election, at an initial conversion rate of 66.5425 shares of Common Stock per $1,000 principal amount of Notes, which is equivalent to an initial conversion price of approximately $15.03 per share of Common Stock. The conversion rate is subject to adjustment under certain circumstances in accordance with the terms of the Indenture.
Before September 15, 2027, noteholders will have the right to convert all or any portion of their Notes, in multiples of $1,000 principal amounts, only under the following circumstances:
F-32
TPI COMPOSITES, INC. AND SUBSIDIARIES
Notes to Consolidated Financial Statements
On or after September 15, 2027, the Notes or any portion of the Notes are convertible at the option of the noteholders at any time prior to the close of business on the second scheduled trading day immediately preceding the maturity date.
The Company may not redeem the Notes prior to March 20, 2026. The Company may redeem for cash all or any portion of the Notes, at its option, on or after March 20, 2026 and prior to the 51st scheduled trading day immediately preceding the maturity date, if the last reported sale price of the Common Stock has been at least 130% of the conversion price then in effect for at least 20 trading days (whether or not consecutive) during any 30 consecutive trading day period (including the last trading day of such period) ending on, and including, the trading day immediately preceding the date on which the Company provides notice of redemption at a redemption price equal to 100% of the principal amount of the Notes to be redeemed, plus any accrued and unpaid interest to, but excluding, the redemption date. No sinking fund is provided for the Notes, which means that the Company is not required to redeem or retire the Notes periodically.
We accounted for the issuance of the Notes as a single liability measured at its amortized cost, as no other embedded features require bifurcation and recognition as derivatives.
In June 2020, weconnection with the issuance and sale of the Notes, the Series A Preferred Stockholders agreed to waive compliance with all covenants under the Certificate of Designations which set forth the terms of the Series A Preferred Stock with respect to the Company’s sale and issuance of the Notes and the Company’s planned capital expenditures and incurrence of additional indebtedness of up to $17.0 million to acquire wind turbines that will provide renewable energy for our manufacturing facilities in Türkiye.
Capped Call Transactions
On February 28, 2023, in connection with the pricing of the Notes, the Company entered into an amendmentprivately negotiated capped call transactions (the Base Capped Call Transactions) with certain initial purchasers of the Notes or their respective affiliates and certain other financial institutions (the Option Counterparties). On March 1, 2023, in connection with the initial purchasers’ exercise of their option to purchase additional Notes, the Company entered into additional privately negotiated capped call transactions with the Option Counterparties (the Additional Capped Call Transactions, and with the Base Capped Call Transactions, the Capped Call Transactions). The Capped Call Transactions initially cover, subject to customary anti-dilution adjustments, the number of shares of the Common Stock that underlie the Notes. The Capped Call Transactions are expected generally to reduce or offset the potential dilution to the Common Stock upon conversion of any Notes and/or offset any potential cash payments the Company is required to make in excess of the principal amount of converted Notes, as the case may be, with such reduction and/or offset subject to a cap. The initial cap price of the Capped Call Transactions was $23.12 per share, which represents a premium of 100% over the reported sale price of the Common Stock on The Nasdaq Global Market of $11.56 per share on February 28, 2023, and is subject to certain adjustments under the terms of the capped call transactions.
The cost of the Capped Call Transactions was $18.6 million and was recorded as a reduction to our Credit Agreement which made certain adjustmentsadditional paid-in-capital in our consolidated balance sheets. The Capped Call Transactions will not be remeasured as long as they continue to one ofmeet the financial covenants, added new covenants related to minimum liquidity and mandatory repayment triggers, providedconditions for certain modifications to the affirmative and negative covenants and changed the interest rate during the Adjustment Period (as defined in the Credit Agreement) to a LIBOR floor of 0.75% plus a margin of 3.0% per annum (3.75% as of December 31, 2020). The interest rate following the end of the Adjustment Period would be equal to a LIBOR floor of 0.75% plus a margin ranging between 1.75% to 2.50% per annum. All other material terms and conditions of the Credit Agreement remained the same.
equity classification. As of December 31, 2020 and 2019, there was $171.2 million and $112.4 million outstanding under2023, the Credit Agreement, respectively. Additionally, as of December 31, 2020 and 2019, there was $7.9 million and $5.1 million of letters of credit outstanding under the letter of credit sub-facility of the Credit Agreement, respectively.Capped Call Transactions were out-of-the-money.
F-33
TPI COMPOSITES, INC. AND SUBSIDIARIES
DueNotes to the revolving credit facility’s variable interest rate of LIBOR plus a competitive spread, we estimate that fair-value approximates the face value of these notes.Consolidated Financial Statements
EMEA:
Accounts Receivable, Secured and Unsecured Financing:
EMEA: In general, all of the credit agreements which the EMEA segment enters into have provisions which allow them to borrow in either U.S. dollars, Turkish Lira or Euro, regardless of the currency in which the agreement is denominated. In addition, none of the credit agreements have an expiration date, however each credit agreements’ limits are reviewed annually to establish available capacity, and every time we draw under one of the credit agreements a term is set for itsthe respective draw's repayment.
During 2014, we renewed a general credit agreement, as amended, with a Turkish financial institution to provide up to $23.2 million of financing, which includes $21.0 million of unsecured financing and $2.2 million of letters of credit. Interest on the unsecured financing accrues at a fixed rate of 3.5% and is payable at the end of the term when the loan is repaid. Interest on the letters of credit accrues at fixed rates of between 0.45% and 6.95% and is payable quarterly until the letter of credit is closed. As of December 31, 2020 and 2019, there were 0 amounts outstanding under the unsecured financing facility. As of December 31, 2020, there was approximately 12.5 million Turkish Lira (approximately $1.7 million) and 0.4 million Euro (approximately $0.5 million) of letters of credit outstanding under the letter of credit facility. As of December 31, 2019, there were approximately 7.6 million Turkish Lira (approximately $1.0 million) of letters of credit outstanding under the letter of credit facility.
In 2016, we entered into a general credit agreement, as amended, with a Turkish financial institution to provide up to 31.0 million Euro (approximately $38.1 million as of December 31, 2020) of financing, of which 20.0 million Euro (approximately $24.6 million as of December 31, 2020) includes amounts related to our previous financing of capital expenditures facility and an unsecured revolving credit facility and 11.0 million Euro (approximately $13.5 million as of December 31, 2020) relates to unsecured financing, letters of credit and other non-cash items. Interest on the portion of the 20.0 million Euro facility related to financing of capital expenditures was determined based upon the term of the loan utilizing the one-month EURIBOR plus 6.75% (6.75% as of December 31, 2020 and is payable monthly. The maturity date for amounts currently outstanding under the 20.0 million Euro facility is December 2021. Interest on the portion of the 11.0 million Euro facility related to unsecured financing was determined based upon the term of the loan utilizing the one-month EURIBOR plus 1.5% (1.5% as of December 31, 2020) and was fully paid on the origination date. Interest on the portion of the 11.0 million Euro facility related to letters of credit accrues at fixed rates of between 0.5% and 2.0%, and is payable quarterly until the letter of credit is closed. The maturity date for amounts currently outstanding under the 11.0 million Euro facility is April 2021. As of December 31, 2020, there was approximately 9.1 million Euro (approximately $11.2 million) outstanding under the 11.0 million Euro facility, specifically related to unsecured financing, with 0 corresponding amount outstanding as of December 31, 2019. In addition, as of December 31, 2020 and 2019, there was approximately 3.5 million Euro (approximately $4.3 million) and approximately 7.1 million Euro (approximately $7.9 million), respectively, outstanding under the 20.0 million Euro facility, specifically related to financing of capital expenditures. Additionally, as of December 31, 2020, there was approximately 1.1 million Turkish Lira (approximately $0.2 million) and 0.25 million Euro (approximately $0.3 million) of letters of credit outstanding under the 11.0 million Euro facility. As of December 31, 2019, there was approximately 0.6 million Turkish Lira (approximately $0.1 million) and 0.25 million Euro (approximately $0.3 million) of letters of credit outstanding under the 11.0 million Euro facility. In 2020, the former facility related to the collateralized financing based on
F-29
TPI COMPOSITES, INC. AND SUBSIDIARIES
Notes to Consolidated Financial Statements
invoiced accounts receivables of one of our customers in Turkey was cancelled. The $3.8 million balance outstanding under this facility as of December 31, 2019 was repaid in 2020.
In the fourth quarter of 2018, we entered into a credit agreement, as amended, with a Turkish financial institution to provide up to 65.0 million Turkish Lira (approximately $8.9 million as of December 31, 2020) of financing, of which 50.0 million Turkish Lira (approximately $6.8 million as of December 31, 2020) relates to unsecured financing and 15.0 million Turkish Lira (approximately $2.1 million as of December 31, 2020) relates to letters of credit and other non-cash items. Interest on the unsecured financing accrues at a fixed rate of 2.0% and is payable at the end the end of the term when the loan is repaid. Interest on the letters of credit and other non-cash items accrues at a fixed rate of 1.5 % and is paid quarterly. As of December 31, 2020 and 2019, there were 0 amounts of unsecured financing outstanding under this agreement. As of December 31, 2020 and 2019, there was 0.35 million Euro (approximately $0.4 million) of letters of credit outstanding in both periods under this agreement.
In the fourth quarter of 2019, we entered into a credit agreement with a Turkish financial institution, as amended, to provide up to 125.0 million Turkish Lira (approximately $17.0 million as of December 31, 2020), of which up to 100.0 million Turkish Lira (approximately $13.6 million as of December 31, 2020) relates to unsecured financing and 25.0 million Turkish Lira (approximately $3.4 million as of December 31, 2020) relates to letters of credit and other non-cash items. Interest on the unsecured financing accrues at a fixedrate of 2.15% and is payable at the end of the term of the loan when the loan is repaid. Interest on the letters of credit and other non-cash items accrues at a fixed rate of 0.5%and is paid quarterly. As of December 31, 2020, there was approximately 4.0 million Euro (approximately $4.9 million) of unsecured financing outstanding under this agreement. In addition, as of December 31, 2020, there was approximately 1.6 million Turkish Lira (approximately $0.2 million) of letters of credit outstanding under this facility. As of December 31, 2019, there were 0 amounts outstanding under this agreement.
In the first quarter of 2020, we entered into a credit agreement, as amended, with a Turkish financial institution to provide up to $18.0 million of unsecured financing, letters of credit and other non-cash items. Interest on the unsecured financing accrues at a fixed rate of 2.4% and is payable quarterly. Interest on the letters of credit and other non-cash items accrues at a fixed rate of 0.35% and is paid quarterly.The maturity date for amounts currently outstanding is March 2023. As of December 31, 2020, there was $13.9 million of unsecured financing outstanding and $0.1 million of letters of credit outstanding under this credit agreement.
In the first quarter of 2020,2023, we entered into a credit agreement with a Turkish financial institution to provide up to 5.010.0 million Euro (approximately $6.1$11.0 million as of December 31, 2020)2023) of unsecured financing.financing, letters of credit and other non-cash items. As of December 31, 2023, we borrowed 10.6 million Euro against this credit facility. Interest on each borrowing accrues at a fixed rate in effect at the time of 7.0%each borrowing and is payable atmonthly until the end of the term when the loanborrowing is repaid. As of December 31, 2020,2023, there were 0 amountswas 9.9 million Euro (approximately $11.0 million) outstanding under this credit agreement. agreement, and a weighted average interest rate on outstanding borrowings of 9.0%.
As of December 31, 2023 and 2022, available capacity under the EMEA unsecured financing agreements was reduced by $5.3 million and $3.4 million, respectively, for outstanding letters of credit.
Due to the short-term nature of the unsecured financings in the EMEA segment, we estimate that fair-value approximates the face value of the notes.
Asia: In August 2019, we entered into a credit agreement, as amended, with a Chinese financial institution to provide an unsecured credit line of up to 90.0 million Renminbi (approximately $13.8 million as of December 31, 2020) related to two of our China facilities which can be used for the purpose of working capital, issuing customs letters of guarantee and covering the related deposits on such letters of guarantee, and certain other transactions approved by the lender. Interest on the credit line accrues at the Chinese central bank interest rate plus an applicable margin (4.4% as of December 31, 2020) and can be paid monthly, quarterly or at the time of the debt’s maturity (August 2021). As of December 31, 2020, there were no amounts outstanding under this credit agreement. As of December 31, 2019, there were 25.7 million Renminbi (approximately $3.7 million) of letters of guarantee and related deposits used for customs clearance outstanding under this credit agreement.
In March 2018, we entered into a credit agreement, as amended, with a Chinese financial institution to provide an unsecured credit line of up to 100.0 million Renminbi (approximately $15.3 million as of December 31, 2020) which can be used for the purpose of issuing customs letters of guarantee and working capital. Interest on the credit line accrues at the Chinese central bank interest rate plus an applicable margin (4.4% as of December 31, 2020) and can be paid monthly, quarterly or at the time of the debt’s maturity (in March 2023). As of December 31, 2020, there were 40.5 million Renminbi (approximately $6.2 million) of letters of guarantee used for customs clearance outstanding under this credit agreement. As of December 31, 2019, there were 71.9 million Renminbi (approximately $10.3 million) of letters of guarantee used for customs clearance outstanding under this credit agreement.
F-30
TPI COMPOSITES, INC. AND SUBSIDIARIES
Notes to Consolidated Financial Statements
Equipment Leases and Other Arrangements:
MexicoMexico::
In March 2018,September 2021, we entered into a sale-lease agreement with a leasing company for the initial lease of up to $15.0$7.5 million of machinery and equipment at our Matamoros, Mexico facility. The lease includes an implied effective interest rate of 6.7%4.1% annually and requires monthly payments during each 48 monththe 48-month term. The amount outstanding under this agreement as of December 31, 2020 and 20192023 was $7.1 million and $10.9 million, respectively.$0.8 million.
EMEAIndia::
In 2013,June 2023, we entered into a finance lease agreementworking capital facility with aan Indian financial institution in Turkey for the initial lease ofto provide up to $4.91.25 billion Indian rupee (approximately $15.0 million of machinery, equipment and building improvements at our first Turkey facility. The term of the lease was for four years at an effective interest rate of 6.0%. The loan was to be repaid in monthly installments through 2017. The financing agreement was subsequently amended in 2017 to include our second Turkey facility and increase the amount of machinery, equipment and building improvements available for lease to $10.0 million. As a result of the amendment, and subsequent amendments, the loan is to be repaid in monthly installments through 2023 at an effective interest rate of 8.0%. All other financing agreement terms remained the same. The balance outstanding as of December 31, 20202023) of unsecured financing. During the year ended December 31, 2023, we borrowed and 2019repaid 1.15 billion Indian rupee (approximately $14.2 million) against this credit facility, and subsequently borrowed 1.03 billion Indian rupee (approximately $12.4 million). Interest on the unsecured borrowing accrues at a fixed rate in effect at the time of each borrowing and is payable monthly until the borrowing is repaid. As of December 31, 2023, there was $3.5 million1.03 billion Indian rupee (approximately $12.4 million) outstanding under this credit facility, and $5.6 million, respectively.a weighted average interest rate on outstanding borrowings of 7.24%.
The future aggregate annual principal maturities of debt as of December 31, 2023 are as follows:
Year Ending December 31, |
| (in thousands) |
| |
2024 |
| $ | 70,465 |
|
2025 |
|
| 8,127 |
|
2026 |
|
| 7 |
|
2027 |
|
| 395,041 |
|
2028 |
|
| 132,500 |
|
Total debt—principal |
| $ | 606,140 |
|
The average interest rate on our short-term borrowings as of December 31, 20202023 and 20192022 was approximately 3.3%9.07% and 5.7%8.96%, respectively.
Note 13. Leases
The future aggregate annual principal maturities of debt as of December 31, 2020 are as follows:
F-34
TPI COMPOSITES, INC. AND SUBSIDIARIES
Notes to Consolidated Financial Statements
|
| (in thousands) |
| |
Year Ending December 31, |
|
|
|
|
2021 |
| $ | 32,551 |
|
2022 |
|
| 13,271 |
|
2023 |
|
| 171,879 |
|
2024 |
|
| 213 |
|
2025 |
|
| 4 |
|
Total debt - principal |
| $ | 217,918 |
|
Note 12. Leases
We have operating and finance leases for our manufacturing facilities, warehouses, offices, automobiles and certain of our machinery and equipment. Our leases have remaining lease terms of between one and 15ten years, some of which may include options to extend the leases up to five years. ten years.
The components of lease cost for the years ended December 31 were as follows:
|
| 2023 |
|
| 2022 |
| ||
|
| (in thousands) |
| |||||
Total operating lease cost |
| $ | 39,624 |
|
| $ | 39,680 |
|
|
|
|
|
|
|
| ||
Finance lease cost |
|
|
|
|
|
| ||
Amortization of assets under finance leases |
| $ | 4,037 |
|
| $ | 4,165 |
|
Interest on finance leases |
|
| 139 |
|
|
| 300 |
|
Total finance lease cost |
| $ | 4,176 |
|
| $ | 4,465 |
|
|
| 2020 |
|
| 2019 |
| ||
|
| (in thousands) |
| |||||
Total operating lease cost |
| $ | 36,958 |
|
| $ | 30,957 |
|
|
|
|
|
|
|
|
|
|
Finance lease cost |
|
|
|
|
|
|
|
|
Amortization of assets under finance leases |
| $ | 5,973 |
|
| $ | 6,351 |
|
Interest on finance leases |
|
| 985 |
|
|
| 1,414 |
|
Total finance lease cost |
| $ | 6,958 |
|
| $ | 7,765 |
|
F-31
TPI COMPOSITES, INC. AND SUBSIDIARIES
Notes to Consolidated Financial Statements
Total lease liabilities as of December 31 were as follows:
|
| 2020 |
|
| 2019 |
| ||||||||||||||||||
|
| Operating |
|
| Finance |
|
| Operating |
|
| Finance |
|
| 2023 |
|
| 2022 |
| ||||||
|
| Leases |
|
| Leases |
|
| Leases |
|
| Leases |
|
| (in thousands) |
| |||||||||
Operating Leases |
|
|
|
|
| |||||||||||||||||||
Operating lease right of use assets |
| $ | 136,124 |
|
| $ | 152,312 |
| ||||||||||||||||
|
| (in thousands) |
|
|
|
|
|
|
| |||||||||||||||
Current operating lease liabilities |
| $ | 26,099 |
|
| $ | — |
|
| $ | 16,629 |
|
| $ | — |
|
| $ | 22,017 |
|
| $ | 22,220 |
|
Noncurrent operating lease liabilities |
|
| 117,133 |
|
|
| 133,363 |
| ||||||||||||||||
Total operating lease liabilities |
| $ | 139,150 |
|
| $ | 155,583 |
| ||||||||||||||||
|
|
|
|
|
|
| ||||||||||||||||||
Finance Leases |
|
|
|
|
|
| ||||||||||||||||||
Property, plant and equipment, gross |
| $ | 37,044 |
|
| $ | 35,948 |
| ||||||||||||||||
Less: accumulated depreciation |
|
| (29,316 | ) |
|
| (24,272 | ) | ||||||||||||||||
Total property, plant and equipment, net |
| $ | 7,728 |
|
| $ | 11,676 |
| ||||||||||||||||
|
|
|
|
|
|
| ||||||||||||||||||
Current maturities of long-term debt |
|
| — |
|
|
| 6,018 |
|
|
| — |
|
|
| 5,744 |
|
| $ | 1,035 |
|
| $ | 1,174 |
|
Noncurrent operating lease liabilities |
|
| 155,925 |
|
|
| — |
|
|
| 113,883 |
|
|
| — |
| ||||||||
Long-term debt, net of debt issuance costs and current maturities |
|
| — |
|
|
| 6,371 |
|
|
| — |
|
|
| 12,194 |
|
|
| 771 |
|
|
| 1,197 |
|
Total lease liabilities |
| $ | 182,024 |
|
| $ | 12,389 |
|
| $ | 130,512 |
|
| $ | 17,938 |
| ||||||||
Total finance lease liabilities |
| $ | 1,806 |
|
| $ | 2,371 |
| ||||||||||||||||
The futureFuture minimum lease payments under noncancelable leases as of December 31, 20202023 were as follows:
|
| Operating |
|
| Finance |
| ||
|
| Leases |
|
| Leases |
| ||
|
| (in thousands) |
| |||||
Year Ending December 31, |
|
|
|
|
|
| ||
2024 |
| $ | 33,078 |
|
| $ | 1,222 |
|
2025 |
|
| 32,702 |
|
|
| 800 |
|
2026 |
|
| 31,149 |
|
|
| 35 |
|
2027 |
|
| 26,427 |
|
|
| 19 |
|
2028 |
|
| 19,399 |
|
|
| — |
|
Thereafter |
|
| 34,942 |
|
|
| — |
|
Total future minimum lease payments |
|
| 177,697 |
|
|
| 2,076 |
|
Less: interest |
|
| (38,547 | ) |
|
| (270 | ) |
Total lease liabilities |
| $ | 139,150 |
|
| $ | 1,806 |
|
|
| Operating |
|
| Finance |
| ||
|
| Leases |
|
| Leases |
| ||
|
| (in thousands) |
| |||||
Year Ending December 31, |
|
|
|
|
|
|
|
|
2021 |
| $ | 34,798 |
|
| $ | 6,319 |
|
2022 |
|
| 32,245 |
|
|
| 5,859 |
|
2023 |
|
| 30,399 |
|
|
| 891 |
|
2024 |
|
| 27,060 |
|
|
| 225 |
|
2025 |
|
| 26,944 |
|
|
| 7 |
|
Thereafter |
|
| 98,764 |
|
|
| — |
|
Total future minimum lease payments |
|
| 250,210 |
|
|
| 13,301 |
|
Less: interest |
|
| (68,186 | ) |
|
| (912 | ) |
Total lease liabilities |
| $ | 182,024 |
|
| $ | 12,389 |
|
F-35
TPI COMPOSITES, INC. AND SUBSIDIARIES
See Note 6, Property, Plant and Equipment, NetNotes to Consolidated Financial Statements for a discussion of the cost and accumulated depreciation of assets financed through finance leases.
Supplemental cash flow information related to leases for the years ended December 31 was as follows:
|
| 2023 |
|
| 2022 |
| ||
|
| (in thousands) |
| |||||
Cash paid for amounts included in the |
|
|
|
|
|
| ||
Operating cash flows from operating leases |
| $ | 38,155 |
|
| $ | 38,542 |
|
Operating cash flows from finance leases |
|
| 139 |
|
|
| 300 |
|
Financing cash flows from finance leases |
|
| 1,300 |
|
|
| 5,100 |
|
|
|
|
|
|
|
| ||
Right of use assets obtained in exchange |
|
|
|
|
|
| ||
Operating leases |
|
| 8,077 |
|
|
| 25,131 |
|
Finance leases |
|
| 796 |
|
|
| 215 |
|
|
| 2020 |
|
| 2019 |
| ||
|
| (in thousands) |
| |||||
Supplemental Cash Flow Information: |
|
|
|
|
|
|
|
|
Cash paid for amounts included in the measurement of lease liabilities: |
|
|
|
|
|
|
|
|
Operating cash flows from operating leases |
| $ | 31,478 |
|
| $ | 29,845 |
|
Operating cash flows from finance leases |
|
| 985 |
|
|
| 1,414 |
|
Financing cash flows from finance leases |
|
| 6,116 |
|
|
| 9,128 |
|
|
|
|
|
|
|
|
|
|
Right of use assets obtained in exchange for new lease obligations: |
|
|
|
|
|
|
|
|
Operating leases |
|
| 61,455 |
|
|
| 15,855 |
|
Finance leases |
|
| 163 |
|
|
| 5,811 |
|
F-32
TPI COMPOSITES, INC. AND SUBSIDIARIES
Notes to Consolidated Financial Statements
Other information related to leases as of December 31 was as follows:
|
| 2023 |
|
| 2022 |
| ||
Weighted-Average Remaining Lease Term |
|
|
|
|
|
| ||
Operating leases |
|
| 5.8 |
|
|
| 6.4 |
|
Finance leases |
|
| 1.7 |
|
|
| 2.1 |
|
|
|
|
|
|
|
| ||
Weighted-Average Discount Rate: |
|
|
|
|
|
| ||
Operating leases |
|
| 8.4 | % |
|
| 8.3 | % |
Finance leases |
|
| 17.3 | % |
|
| 6.4 | % |
|
| 2020 |
|
| 2019 |
| ||
Weighted-Average Remaining Lease Term (In Years): |
|
|
|
|
|
|
|
|
Operating leases |
|
| 7.7 |
|
|
| 7.6 |
|
Finance leases |
|
| 2.2 |
|
|
| 3.2 |
|
|
|
|
|
|
|
|
|
|
Weighted-Average Discount Rate: |
|
|
|
|
|
|
|
|
Operating leases |
|
| 7.9 | % |
|
| 7.5 | % |
Finance leases |
|
| 6.4 | % |
|
| 6.4 | % |
As of December 31, 2020, there were 0 additional leases related to our manufacturing facilities, warehouses, offices, automobiles or our machinery and equipment which have not yet commenced.
Note 13.14. Financial Instruments
Interest Rate Swap
We use interest rate swap contracts to mitigate our exposure to interest rate fluctuations associated with our Credit Agreement which we entered into in April 2018. We do not use such swap contracts for speculative or trading purposes.
To offset the variability of future interest payments on the Credit Agreement arising from changes in LIBOR, in April 2018, we entered into an interest rate swap agreement with a financial institution for a notional amount of $75.0 million with an expiration date of April 2023. This interest rate swap effectively hedges $75.0 million of the future variable rate LIBOR interest expense to a fixed rate interest expense. The derivative instrument qualified for accounting as a cash flow hedge in accordance with FASB ASC Topic 815, Derivatives and Hedging, and we designated it as such.
Foreign Exchange Forward Contracts
We use foreign exchange forward contracts to mitigate our exposure to fluctuations in exchange rates between the functional currencies of our subsidiaries and the other currencies in which they transact. We do not use such forward contracts for speculative or trading purposes.
Mexican Peso
In September 2019, we entered into the first of these foreign exchange forward contracts. We expect certain of our subsidiaries to have future cash flows that will be denominated in currencies other than the subsidiaries’ functional currencies. Changes in the exchange rates between the functional currencies of our subsidiaries and the other currencies in which they transact will cause fluctuations in the cash flows we expect to receive or pay when these cash flows are realized or settled. Accordingly, we enter into foreign exchange forward contracts to hedge a portion of these forecasted cash flows. As of December 31, 2020, these foreign exchange forward contracts hedged our forecasted cash flows for a three-month period. These foreign exchange forward contracts qualified for accounting as cash flow hedges in accordance with ASC Topic 815, and we designated them as such.
In October 2020,May 2023, we purchased a series of call option contracts to further mitigate cash flow variability associated with the forecasted expenses in the Mexican Peso against changes in the U.S. Dollar to Mexican Peso exchange rates.rate. A premium obligation of $0.7$3.2 million was paid in a single transactionincurred at hedge initiation, and recorded within other current assets on our consolidated balance sheet.with payment deferred until December 2023. The premium iswas amortized against our earnings on a straight-line basis over thea period of nineseven months, the period in which we had executedincluding the expiry dates of the purchased call option contracts, through cost of sales within our consolidated statements of operations. These foreign exchange call option contracts qualified for accounting as cash flow hedges in accordance with ASCAccounting Standards Codification Topic 815, Derivatives and Hedging, and we designated them as such.
F-33
TPI COMPOSITES, INC. AND SUBSIDIARIES
Notes to Consolidated Financial Statements
Chinese Renminbi
In October 2020, we entered intoWith regards to our first monthly forward contract to hedge our exposure toforeign exchange rate fluctuations on certain balance sheet amounts recorded on our Chinese entities that are notcall option contracts, for the entities’ functional currency. In executing this hedge strategy, as a result of our organizational structure, we also entered into certain foreign currency forward contracts to hedge the exposure to a portion of our net investments in certain non-U.S. subsidiaries against the effect of exchange rate fluctuations on the translation of foreign currency balances to the U.S. dollar. For the derivative instruments that are designated and qualify as net investment hedges, gains and losses are reported in other comprehensive income (loss) where they offset gains and losses recorded on our net investments in our non-U.S. subsidiaries. These contracts are entered into and settled monthly. These hedges are determined to be effective. Hedge accounting was not elected on the balance sheet hedge and as a result, all gains and losses on these contracts are recorded through foreign currency loss, net on our consolidated statement of operations. For the yearyears ended December 31, 2020, $1.82023, 2022 and 2021, $3.2 million, in gains on the balance sheet hedge were realized.$1.5 million and $2.9 million of premium amortization was recorded through cost of sales within our consolidated statements of operations, respectively.
Intercompany Debt
In August 2018, we provided a Turkish Lira denominated intercompany loan to an EMEA subsidiary of $15.0 million converted at the spot rate on the transaction date to 96.6 million Turkish Lira to fund their working capital requirements. We entered into a forward contract, with the same expiration as that of the intercompany loan’s maturity in October 2018, for a notional amount of 101.5 million Turkish Lira to reduce our exposure to currency fluctuations from the settlement of this Turkish Lira denominated intercompany loan. The derivative instrument qualifies for accounting as a cash flow hedge in accordance with ASC Topic 815, and we designated it as such. The forward contract was settled in October 2018.
All of our derivative assets and liabilities measured at fair value are classified as Level 2 within the fair value hierarchy. For a detailed discussion of the fair value hierarchy, refer to the discussion in Note 1, Summary of Operations and Summary of Significant Accounting Policies – Fair Value of Financial Instruments.
As of December 31, 2020, the notional values associated with our foreign exchange forward contracts qualifying as cash flow hedges were approximately 0.3 billion Mexican Peso (approximately $14.0 million). As of December 31, 2019, the notional values associated with our foreign exchange forward contracts qualifying as cash flow hedges were approximately 1.1 billion Mexican Peso (approximately $54.8 million). As of December 31, 2020, the notional values associated with our2023 and 2022, we had no outstanding foreign exchange call option contracts qualifying as cash flow hedges were approximately 0.4 billion Mexican Peso (approximately $17.3 million).
The fair values and location of financial instruments in our consolidated balance sheets as of December 31, were as follows:
contracts.
|
| Consolidated Balance |
|
|
|
|
|
|
|
|
Financial Instrument |
| Sheet Line Item |
| 2020 |
|
| 2019 |
| ||
|
|
|
| (in thousands) |
| |||||
Foreign exchange forward contracts |
| Other current assets |
| $ | 5,832 |
|
| $ | 820 |
|
Foreign exchange forward contracts |
| Accounts payable and accrued expenses |
|
| 2,096 |
|
|
| 124 |
|
Interest rate swap |
| Other noncurrent liabilities |
|
| 4,414 |
|
|
| 2,723 |
|
For cash flow hedges, the gain or loss is reported as a component of accumulated other comprehensive loss in our consolidated statements of changes in stockholders’ equity and reclassified into earnings in our consolidated statements of operations in the same period or periods during which the hedged transaction affects earnings. The net income (loss) recognized in accumulated other comprehensive loss in our consolidated statements of changes in stockholders’ equity for our foreign exchange forward contracts is expected to be recognized in cost of sales in our consolidated statements of operations during the next six months. The gain or loss on our interest rate swap is recorded in accumulated other comprehensive loss and subsequently reclassified into interest expense in our consolidated statements of operations in the period in which the hedged transaction affects earnings. As of
F-34
TPI COMPOSITES, INC. AND SUBSIDIARIES
Notes to Consolidated Financial Statements
December 31, 2020, 0 interest rate swaps originally designated for hedge accounting were de-designated or terminated. No ineffectiveness on our interest rate swaps was recognized as of December 31, 2020, and none is anticipated over the term of the agreement.
The following table presents the pretax amounts reclassified from accumulated other comprehensive loss into our consolidated statements of operations:
F-36
TPI COMPOSITES, INC. AND SUBSIDIARIES
Notes to Consolidated Financial Statements
Comprehensive Income |
| Consolidated Statement of |
|
|
|
|
|
|
|
|
| |||
(Loss) Component |
| Operations Line Item |
| 2023 |
|
| 2022 |
|
| 2021 |
| |||
|
|
|
| (in thousands) |
| |||||||||
Foreign exchange forward |
| Cost of sales |
| $ | (2,304 | ) |
| $ | (2,078 | ) |
| $ | (3,037 | ) |
Comprehensive Income |
| Consolidated Statement of |
|
|
|
|
|
|
|
|
|
|
|
|
(Loss) Component |
| Operations Line Item |
| 2020 |
|
| 2019 |
|
| 2018 |
| |||
|
|
|
| (in thousands) |
| |||||||||
Foreign exchange forward contracts |
| Cost of sales |
| $ | 996 |
|
| $ | — |
|
| $ | — |
|
Note 15. Mezzanine Equity
On November 22, 2021 (“Series A Preferred Stock Closing Date”), we issued 350,000 shares of our preferred stock, at a price of $1,000 per share, for aggregate gross proceeds of $350.0 million. We designated this preferred stock as Series A Preferred Stock (our "Series A Preferred Stock"). In connection with the transaction, we also issued warrants to purchase an aggregate of 4,666,667 share of our Common Stock (the “Warrants”) at an exercise price of $0.01 per share.
Our Series A Preferred Stock was classified as mezzanine equity in our consolidated financial statements as redemption has been deemed probable. We had determined there were embedded features that required recognition as a compound derivative liability (“Compound Derivative”). As of December 31, 2022, the Compound Derivative was valued at zero.
We allocated the gross proceeds of $350.0 million first to the standalone fair value of the Compound Derivative, which as of the Series A Preferred Stock Closing Date and December 31, 2021 was $0.0 million, with the remaining proceeds allocated to the Series A Preferred Stock and Warrants based on the relative fair value of each instrument, resulting in $252.7 million being allocated to the Series A Preferred Stock, and $97.3 million being allocated to the Warrants. We incurred $10.7 million in issuance costs associated with the Series A Preferred Stock. These costs are allocated to the Series A Preferred Stock, and the Warrants consistent with the allocation of proceeds.
On December 14, 2023, we extinguished all 350,000 shares of the outstanding Series A Preferred Stock and $86.0 million of accrued and unpaid dividends thereon in exchange for the issuance of the $393.0 million Term Loan and 3,899,903 shares of Common Stock as part of the Exchange. See Note 12, Debt and Note 20, Stockholders’ Equity.
Note 16. Restructuring charges, net
Restructuring charges, net for the years ended December 31 were as follows:
|
| Year Ended December 31, 2023 |
| |||||||||||||
|
| U.S. |
|
| Mexico |
|
| EMEA |
|
| Total |
| ||||
|
| (in thousands) |
| |||||||||||||
Severance |
| $ | 310 |
|
| $ | 675 |
|
| $ | 4,090 |
|
| $ | 5,075 |
|
Other restructuring costs |
|
| (25 | ) |
|
| — |
|
|
| — |
|
|
| (25 | ) |
Total restructuring charges, net |
| $ | 285 |
|
| $ | 675 |
|
| $ | 4,090 |
|
| $ | 5,050 |
|
|
| Year Ended December 31, 2022 |
| |||||||||||||
|
| U.S. |
|
| Mexico |
|
| EMEA |
|
| Total |
| ||||
|
| (in thousands) |
| |||||||||||||
Severance |
| $ | 113 |
|
| $ | (794 | ) |
| $ | 472 |
|
| $ | (209 | ) |
Other restructuring costs |
|
| 472 |
|
|
| — |
|
|
| — |
|
|
| 472 |
|
Total restructuring charges, net |
| $ | 585 |
|
| $ | (794 | ) |
| $ | 472 |
|
| $ | 263 |
|
|
| Year Ended December 31, 2021 |
| |||||||||||||
|
| U.S. |
|
| Mexico |
|
| EMEA |
|
| Total |
| ||||
|
| (in thousands) |
| |||||||||||||
Severance |
| $ | 4,780 |
|
| $ | 6,629 |
|
| $ | 1,131 |
|
| $ | 12,540 |
|
Other restructuring costs |
|
| 3 |
|
|
| — |
|
|
| — |
|
|
| 3 |
|
Total restructuring charges, net |
| $ | 4,783 |
|
| $ | 6,629 |
|
| $ | 1,131 |
|
| $ | 12,543 |
|
The following is a summary of our restructuring liability activity for the periods presented:
F-37
TPI COMPOSITES, INC. AND SUBSIDIARIES
Notes to Consolidated Financial Statements
|
| U.S. |
|
| Mexico |
|
| EMEA |
|
| Total |
| ||||
|
| (in thousands) |
| |||||||||||||
Balance at December 31, 2020 |
| $ | — |
|
| $ | — |
|
| $ | — |
|
| $ | — |
|
Restructuring charges, net |
|
| 4,783 |
|
|
| 6,629 |
|
|
| 1,131 |
|
|
| 12,543 |
|
Payments |
|
| (2,145 | ) |
|
| (4,468 | ) |
|
| (1,131 | ) |
|
| (7,744 | ) |
Balance at December 31, 2021 |
|
| 2,638 |
|
|
| 2,161 |
|
|
| — |
|
|
| 4,799 |
|
Restructuring charges, net |
|
| 585 |
|
|
| (794 | ) |
|
| 472 |
|
|
| 263 |
|
Payments |
|
| (2,766 | ) |
|
| (1,367 | ) |
|
| (442 | ) |
|
| (4,575 | ) |
Balance at December 31, 2022 |
|
| 457 |
|
|
| — |
|
|
| 30 |
|
|
| 487 |
|
Restructuring charges, net |
|
| 285 |
|
|
| 675 |
|
|
| 4,090 |
|
|
| 5,050 |
|
Payments |
|
| (742 | ) |
|
| (675 | ) |
|
| (3,932 | ) |
|
| (5,349 | ) |
Balance at December 31, 2023 |
| $ | — |
|
| $ | — |
|
| $ | 188 |
|
| $ | 188 |
|
Note 14.17. Commitments and Contingencies
(a) Operating Leases
We lease various facilities and equipment under noncancelable operating leases with terms ranging from 12 months to 120 months. Scheduled rent increases are recorded on a straight-line basis over the entire term of the lease.
Rental expense charged under all operating leases (including leases with terms of less than one year) was $37.0 million, $31.0 million and $25.5 million for the years ended December 31, 2020, 2019 and 2018, respectively. See Note 12, Leases for a listing of the future minimum lease payments under noncancelable operating leases with terms of one year or more as of December 31, 2020.
(b) Legal Proceedings
From time to time, we may be involved in disputes or litigation relating to claims arising out of its operations.
In January 2021, we received a complaint that was filed by the administrator for the Senvion Gmbh (Senvion) insolvency estate in German insolvency court. The complaint asserts voidance against us in the aggregate amount of $13.3$13.3 million. The alleged voidance claims relate to payments that Senvion made to us for wind blades that we produced prior to Senvion filing for insolvency protection. We plan to filefiled a response to these alleged voidance claims in the coming monthsAugust 2021 and wefiled a supplemental response in April 2022. We believe we have meritorious defenses to the alleged voidance claims. Due to the earlycurrent stage of this claim, we have determined that the ultimate outcome cannot be estimated at this time.
From time to time, we are party to various lawsuits, claims, and other legal proceedings that arise in the ordinary course of business, some of which are covered by insurance. Upon resolution of any pending legal matters, we may incur charges in excess of presently established reserves. Our management does not believe that any such charges would, individually or in the aggregate, have a material adverse effect on our financial condition, results of operations or cash flows.
(c) Insurance/Self-Insurance
We use a combination of insurance and self-insurance for a number of risks, including claims related to our employeeassociate health care, workers’ compensation and general liability. Liabilities associated with these risks are estimated based on, among other things, historical claims experience, severity factors, and other actuarial assumptions. Our loss exposure related to self-insurance is limited by stop loss coverage on a per occurrence and aggregate basis. We regularly analyze our reserves for incurred but not reported claims, and for reported but not paid claims related to our self-funded insurance programs. While we believe our reserves are adequate, significant judgment is involved in assessing these reserves such as assessing historical paid claims, average lags between the claims’ incurred date, reported dates and paid dates, and the frequency and severity of claims. There may be differences between actual settlement amounts and recorded reserves and any resulting adjustments are included in expense once a probable amount is known.
F-35
TPI COMPOSITES, INC. AND SUBSIDIARIES
Notes to Consolidated Financial Statements
Collective Bargaining Agreements
(d) Dividend Restrictions
Certain of our subsidiaries are limitedassociates in their ability to declare dividends without first meeting statutory restrictions of China, including retained earnings as determined under Chinese-statutory accounting requirements. Until 50% ($26.6 million) of registered capital is contributed to a surplus reserve, our China operations can only pay dividends equal to 90% of after-tax profits (10% must be contributed to the surplus reserve). Once the surplus reserve fund requirement is met, our China operations can pay dividends equal to 100% of after-tax profit assuming other conditions are met. As of December 31, 2020, the amount of the surplus reserve fund was $7.0 million.
(e) Collective Bargaining Agreements
In 2016, we entered into a three-year collective bargaining agreement with certain of our employees at our first Turkey facility. The agreement resulted in an average increase in pay of approximately 20% for employees covered by the agreement. In addition, beginning in July 2017, this collective bargaining arrangement also covered similarly situated employees at our second Turkey facility. In 2019, the collective bargaining agreement with the Turkey facilities was renewed through 2020Türkiye and we are in the process of negotiating an amendment for calendar year 2021. In March 2018, we entered into a collective bargaining agreement with a labor union for certain of our employees at the Matamoros, Mexico facility. We recently amended our Matamoros collective bargaining agreement to adjust the salaries and bonuses payable to our associates for calendar year 2021 that are covered by this agreement. Currently, there are 0 other employees covered by collective bargaining agreements. Our collective bargaining agreement with our associates in Türkiye is in effect through December 2024. We believehave separate collective bargaining agreements for each of our Matamoros, Mexico manufacturing facilities. Our collective bargaining agreement at one of our Matamoros, Mexico manufacturing facilities is in effect through March 2025 and our collective bargaining agreement for our other facility in Matamoros, Mexico that our relations with employees are generally good. we took over from Nordex is in effect through April 2025.
F-38
TPI COMPOSITES, INC. AND SUBSIDIARIES
Notes to Consolidated Financial Statements
(f) Escheat Audit
In November 2020, we were notified by the state of Delaware that they intend to examine our books and records to determine compliance with Delaware escheat laws. Since that date, additional states have joined with Delaware in the audit process and additional states may join in the audit process. The audit is conducted by an outside firm on behalf of the states and covers the period from 2005 to 2019. We believe that the audits may take several years to complete. Due to the preliminary stage of this audit, we have determined that the ultimate outcome cannot be reasonably estimated at this time. Any claims or liabilities resulting from these audits could have a material impact on our financial condition, results of operations and cash flows.
Note 15.18. Income Taxes
Total income taxes for the years ended December 31, 2023, 2022 and 2021 were allocated as follows:
|
| 2023 |
|
| 2022 |
|
| 2021 |
| |||
|
| (in thousands) |
| |||||||||
Income tax provision from continuing operations |
| $ | (17,562 | ) |
| $ | (29,613 | ) |
| $ | (29,826 | ) |
Income tax (provision) benefit from |
|
| 204 |
|
|
| (6,194 | ) |
|
| 3,066 |
|
Total income tax provision |
| $ | (17,358 | ) |
| $ | (35,807 | ) |
| $ | (26,760 | ) |
Geographic sources of income (loss) before income taxes from continuing operations are as follows for the years ended December 31:
|
| 2020 |
|
| 2019 |
|
| 2018 |
| |||
|
| (in thousands) |
| |||||||||
United States |
| $ | 4,913 |
|
| $ | (41,255 | ) |
| $ | (33,034 | ) |
China |
|
| 16,232 |
|
|
| (3,777 | ) |
|
| (4 | ) |
Turkey |
|
| (26,566 | ) |
|
| 47,579 |
|
|
| 31,955 |
|
Mexico |
|
| 8,509 |
|
|
| 8,434 |
|
|
| 3,329 |
|
India |
|
| (13,810 | ) |
|
| (3,970 | ) |
|
| — |
|
Other |
|
| 2,979 |
|
|
| 396 |
|
|
| — |
|
Total income (loss) before income taxes |
| $ | (7,743 | ) |
| $ | 7,407 |
|
| $ | 2,246 |
|
|
| 2023 |
|
| 2022 |
|
| 2021 |
| |||
|
| (in thousands) |
| |||||||||
U.S. |
| $ | (224,458 | ) |
| $ | (123,795 | ) |
| $ | (153,273 | ) |
Türkiye |
|
| 3,887 |
|
|
| 60,301 |
|
|
| (8,551 | ) |
Mexico |
|
| 21,614 |
|
|
| 14,034 |
|
|
| 10,297 |
|
India |
|
| 11,496 |
|
|
| 24,639 |
|
|
| 26,453 |
|
Other |
|
| 8,570 |
|
|
| (1,116 | ) |
|
| (994 | ) |
Total loss before income taxes |
| $ | (178,891 | ) |
| $ | (25,937 | ) |
| $ | (126,068 | ) |
Tax Legislation
Tax Reform
AsIn August 2022, the U.S. enacted the Inflation Reduction Act of December 31, 2018, we completed the accounting for the enactment-date income tax effects of the Tax Cuts and Jobs Act (Tax Reform)2022 (IRA), which, resulted in an immaterial impact to ouramong other things, introduced a 15% minimum tax based on adjusted financial statements. Upon further analysesstatement income of certain aspects of Tax Reform, and refinement of calculations during 2018, we increased our provisional amount of previously untaxed foreign earnings by $13.8 million, to $88.1 million. This resulted in no change to our U.S. federallarge corporations with a three-year average adjusted financial statement income tax expense due to the impact of foreign tax credits.
F-36
TPI COMPOSITES, INC. AND SUBSIDIARIES
Notes to Consolidated Financial Statements
Tax Reform enacted a new minimum tax on U.S. companies’ foreign operations called global intangible low tax income (GILTI). Beginning in 2018, the GILTI provisions require us to include in our U.S. income tax return foreign subsidiary earnings in excess of an allowable return$1 billion, a 1% excise tax on the foreign subsidiary’s tangible assets. We have made a policy electionfair market value of stock repurchases by covered corporations and several tax incentives to account for any ongoing impacts of GILTI tax in the period in which it is incurred.
promote clean energy. The Internal Revenue Service published final regulations in July 2020 to address the applicationprovisions of the high-tax exclusion from GILTI underIRA will be effective for periods beginning after December 31, 2022. The Company does not expect the Tax Reform allowing us to make an annual election to exclude GILTI of our foreign subsidiaries with an effectiveminimum tax rate greater than 90%or excise tax provisions of the U.S. corporate rate. We recognized $10.6 million of tax benefits relatedIRA to current and prior years ashave a result of this change in legislation. material impact on its consolidated financial statements.
We do not provide deferred taxes related to U.S. GAAP basis in excess of outside tax basis in the investment in our foreign subsidiaries to the extent such amounts relate to indefinitely reinvested earnings and profits of such foreign subsidiaries. As of December 31, 2020,2023, our undistributed earnings from continuing operations of certain of our foreign subsidiaries amounted to approximately $95.2$163.9 million, and we consider those earnings reinvested indefinitely.
F-39
TPI COMPOSITES, INC. AND SUBSIDIARIES
Notes to Consolidated Financial Statements
The income tax provision includes U.S. federal, state, and local taxes, Turkey, China,Türkiye, Mexico and India taxes currently payable and those deferred because of temporary differences between the financial statement and the tax bases of assets and liabilities.
The components of the income tax provision (benefit) for the years ended December 31 are as follows:
|
| 2023 |
|
| 2022 |
|
| 2021 |
| |||
|
| (in thousands) |
| |||||||||
Current: |
|
|
|
|
|
|
|
|
| |||
U.S. federal |
| $ | — |
|
| $ | — |
|
| $ | (630 | ) |
U.S. state and local taxes |
|
| 692 |
|
|
| (1,316 | ) |
|
| (23 | ) |
Foreign |
|
| 28,676 |
|
|
| 26,800 |
|
|
| 22,048 |
|
Total current |
|
| 29,368 |
|
|
| 25,484 |
|
|
| 21,395 |
|
Deferred: |
|
|
|
|
|
|
|
|
| |||
U.S. federal |
|
| — |
|
|
| — |
|
|
| 3,869 |
|
U.S. state and local taxes |
|
| — |
|
|
| — |
|
|
| 2,374 |
|
Foreign |
|
| (11,806 | ) |
|
| 4,129 |
|
|
| 2,188 |
|
Total deferred |
|
| (11,806 | ) |
|
| 4,129 |
|
|
| 8,431 |
|
Total income tax provision |
| $ | 17,562 |
|
| $ | 29,613 |
|
| $ | 29,826 |
|
|
| 2020 |
|
| 2019 |
|
| 2018 |
| |||
|
| (in thousands) |
| |||||||||
Current: |
|
|
|
|
|
|
|
|
|
|
|
|
U.S. federal |
| $ | — |
|
| $ | — |
|
| $ | — |
|
U.S. state and local taxes |
|
| 32 |
|
|
| (7 | ) |
|
| 4 |
|
Foreign |
|
| 19,234 |
|
|
| 18,171 |
|
|
| 11,875 |
|
Total current |
|
| 19,266 |
|
|
| 18,164 |
|
|
| 11,879 |
|
Deferred: |
|
|
|
|
|
|
|
|
|
|
|
|
U.S. federal |
|
| (1,909 | ) |
|
| 6,277 |
|
|
| (7,596 | ) |
U.S. state and local taxes |
|
| (1,385 | ) |
|
| (950 | ) |
|
| (36 | ) |
Foreign |
|
| (4,688 | ) |
|
| (376 | ) |
|
| (7,280 | ) |
Total deferred |
|
| (7,982 | ) |
|
| 4,951 |
|
|
| (14,912 | ) |
Total income tax provision (benefit) |
| $ | 11,284 |
|
| $ | 23,115 |
|
| $ | (3,033 | ) |
The following is a reconciliation from the U.S. statutory income tax rate to our effective income tax rate for the years ended December 31:
|
| 2023 |
|
| 2022 |
|
| 2021 |
| |||
U.S. statutory income tax rate |
|
| 21.0 | % |
|
| 21.0 | % |
|
| 21.0 | % |
Foreign rate differential |
|
| (0.9 | ) |
|
| 22.3 |
|
|
| (13.5 | ) |
Foreign permanent differences |
|
| 0.7 |
|
|
| (31.2 | ) |
|
| — |
|
Tax rate change |
|
| — |
|
|
| (0.6 | ) |
|
| 0.1 |
|
Withholding taxes |
|
| (3.8 | ) |
|
| (25.8 | ) |
|
| (4.6 | ) |
GILTI income |
|
| (0.2 | ) |
|
| (3.2 | ) |
|
| (6.6 | ) |
Unrecognized tax benefits |
|
| — |
|
|
| (15.5 | ) |
|
| (1.7 | ) |
Share-based compensation |
|
| (0.4 | ) |
|
| (5.9 | ) |
|
| (0.5 | ) |
Valuation allowance |
|
| (24.5 | ) |
|
| (104.2 | ) |
|
| (22.8 | ) |
State taxes |
|
| 0.8 |
|
|
| 9.5 |
|
|
| 1.0 |
|
Deferred tax adjustments |
|
| (2.4 | ) |
|
| 7.7 |
|
|
| (0.9 | ) |
State incentive credits |
|
| (0.4 | ) |
|
| 5.1 |
|
|
| — |
|
Foreign currency / inflationary adjustments |
|
| 0.3 |
|
|
| 10.2 |
|
|
| 3.8 |
|
Other |
|
| — |
|
|
| (3.6 | ) |
|
| 1.0 |
|
Effective income tax rate |
|
| (9.8 | )% |
|
| (114.2 | )% |
|
| (23.7 | )% |
|
| 2020 |
|
| 2019 |
|
| 2018 |
| |||
United States statutory income tax rate |
|
| 21.0 | % |
|
| 21.0 | % |
|
| 21.0 | % |
Foreign rate differential |
|
| (189.1 | ) |
|
| (40.8 | ) |
|
| (14.4 | ) |
Foreign permanent differences |
|
| (19.4 | ) |
|
| 2.9 |
|
|
| 31.7 |
|
Tax rate change |
|
| (6.9 | ) |
|
| (0.3 | ) |
|
| — |
|
Withholding taxes |
|
| (20.1 | ) |
|
| 24.5 |
|
|
| 27.3 |
|
Subpart F / GILTI income |
|
| 137.6 |
|
|
| 212.3 |
|
|
| 539.8 |
|
Unrecognized tax benefits |
|
| (91.6 | ) |
|
| — |
|
|
| — |
|
Share-based compensation |
|
| 3.5 |
|
|
| (9.1 | ) |
|
| (89.0 | ) |
Valuation allowance |
|
| 0.7 |
|
|
| 115.5 |
|
|
| (483.1 | ) |
State taxes |
|
| 13.7 |
|
|
| (10.2 | ) |
|
| (1.7 | ) |
Deferred tax adjustments |
|
| 11.8 |
|
|
| 2.1 |
|
|
| 4.6 |
|
Research and development |
|
| 11.2 |
|
|
| (13.4 | ) |
|
| (59.8 | ) |
Foreign currency / inflationary adjustments |
|
| 5.6 |
|
|
| (0.5 | ) |
|
| (90.6 | ) |
Other |
|
| (23.7 | ) |
|
| 8.1 |
|
|
| (20.8 | ) |
Effective income tax rate |
|
| (145.7 | )% |
|
| 312.1 | % |
|
| (135.0 | )% |
F-40
F-37
TPI COMPOSITES, INC. AND SUBSIDIARIES
Notes to Consolidated Financial Statements
The following is a summary of the components of deferred tax assets and liabilities, included in other noncurrent assets and other noncurrent liabilities, respectively, in the consolidated balance sheets as of December 31:
|
| 2023 |
|
| 2022 |
|
| 2021 |
| |||
|
| (in thousands) |
| |||||||||
Deferred tax assets: |
|
|
|
|
|
|
|
|
| |||
Net operating loss and credit carry forwards |
| $ | 86,460 |
|
| $ | 51,180 |
|
| $ | 40,028 |
|
Deferred revenue |
|
| — |
|
|
| — |
|
|
| 1,504 |
|
Non-deductible accruals |
|
| 8,079 |
|
|
| (520 | ) |
|
| 3,572 |
|
Equity compensation |
|
| 3,845 |
|
|
| 4,468 |
|
|
| 2,892 |
|
Lease liabilities |
|
| 23,949 |
|
|
| 26,244 |
|
|
| 24,043 |
|
Non-deductible interest |
|
| 7,823 |
|
|
| 5,976 |
|
|
| 5,618 |
|
Tax credits |
|
| 1,931 |
|
|
| 1,931 |
|
|
| 1,931 |
|
Other |
|
| 26,752 |
|
|
| 18,325 |
|
|
| 9,472 |
|
Gross deferred tax assets |
|
| 158,839 |
|
|
| 107,604 |
|
|
| 89,060 |
|
Valuation allowance |
|
| (105,914 | ) |
|
| (58,908 | ) |
|
| (38,262 | ) |
Total deferred tax assets |
|
| 52,925 |
|
|
| 48,696 |
|
|
| 50,798 |
|
|
|
|
|
|
|
|
|
|
| |||
Deferred tax liabilities: |
|
|
|
|
|
|
|
|
| |||
Deferred revenue |
|
| (3,602 | ) |
|
| (3,848 | ) |
|
| (2,155 | ) |
Depreciation |
|
| (9,458 | ) |
|
| (12,779 | ) |
|
| (16,453 | ) |
Lease assets |
|
| (22,264 | ) |
|
| (25,398 | ) |
|
| (23,357 | ) |
Other |
|
| 249 |
|
|
| (2,385 | ) |
|
| (3,326 | ) |
Total deferred tax liabilities |
|
| (35,075 | ) |
|
| (44,410 | ) |
|
| (45,291 | ) |
Net deferred tax assets |
| $ | 17,850 |
|
| $ | 4,286 |
|
| $ | 5,507 |
|
|
| 2020 |
|
| 2019 |
|
| 2018 |
| |||
|
| (in thousands) |
| |||||||||
Deferred tax assets: |
|
|
|
|
|
|
|
|
|
|
|
|
Net operating loss and credit carry forwards |
| $ | 36,754 |
|
| $ | 23,065 |
|
| $ | 17,360 |
|
Deferred revenue |
|
| 180 |
|
|
| 1,792 |
|
|
| 149 |
|
Non-deductible accruals |
|
| 12,360 |
|
|
| 16,111 |
|
|
| 10,850 |
|
Equity compensation |
|
| 3,298 |
|
|
| 3,274 |
|
|
| 3,607 |
|
Lease liabilities |
|
| 23,271 |
|
|
| 1,062 |
|
|
| — |
|
Non-deductible interest |
|
| 3,302 |
|
|
| — |
|
|
| 1,452 |
|
Tax credits |
|
| 1,931 |
|
|
| 1,931 |
|
|
| 2,212 |
|
Other |
|
| 6,760 |
|
|
| 4,480 |
|
|
| 4,548 |
|
Gross deferred tax assets |
|
| 87,856 |
|
|
| 51,715 |
|
|
| 40,178 |
|
Valuation allowance |
|
| (18,903 | ) |
|
| (18,505 | ) |
|
| (8,520 | ) |
Total deferred tax assets |
|
| 68,953 |
|
|
| 33,210 |
|
|
| 31,658 |
|
|
|
|
|
|
|
|
|
|
|
|
|
|
Deferred tax liabilities: |
|
|
|
|
|
|
|
|
|
|
|
|
Deferred revenue |
|
| (24,294 | ) |
|
| (17,081 | ) |
|
| (13,781 | ) |
Depreciation |
|
| (3,446 | ) |
|
| (4,196 | ) |
|
| (2,636 | ) |
Lease assets |
|
| (22,453 | ) |
|
| (32 | ) |
|
| — |
|
Other |
|
| 33 |
|
|
| (827 | ) |
|
| (406 | ) |
Total deferred tax liabilities |
|
| (50,160 | ) |
|
| (22,136 | ) |
|
| (16,823 | ) |
Net deferred tax assets |
| $ | 18,793 |
|
| $ | 11,074 |
|
| $ | 14,835 |
|
The deferred tax valuation allowance as of December 31 consisted of the following:
|
| 2020 |
|
| 2019 |
|
| 2018 |
|
| 2023 |
|
| 2022 |
|
| 2021 |
| ||||||
|
| (in thousands) |
|
| (in thousands) |
| ||||||||||||||||||
Valuation allowance at beginning of year |
| $ | (18,505 | ) |
| $ | (8,520 | ) |
| $ | (18,680 | ) |
| $ | (58,908 | ) |
| $ | (38,262 | ) |
| $ | (11,616 | ) |
Benefits obtained (costs accumulated) |
|
| (398 | ) |
|
| (9,985 | ) |
|
| 10,160 |
|
|
| (47,006 | ) |
|
| (20,646 | ) |
|
| (26,646 | ) |
Valuation allowance at end of year |
| $ | (18,903 | ) |
| $ | (18,505 | ) |
| $ | (8,520 | ) |
| $ | (105,914 | ) |
| $ | (58,908 | ) |
| $ | (38,262 | ) |
The valuation allowance as ofat December 31, 20202023 primarily relates to certainthe U.S. federal and state deferred tax assets and certain foreign net operating losses (NOLs) that we believe do not meet the more-likely-than-not criteria for recording the related benefits.
During 2018,the years ended December 31, 2023, 2022, and 2021, we released the valuation allowance recorded against deferredrecognized tax assets reported in the United States. The releaseexpense of this valuation allowance resulted in the recognition of a non-cash tax benefit of $10.8$47.0 million, for the year. Additionally, during 2018, there was an increase$20.6 million, and $26.6 million, respectively, due to changes in the valuation allowance in Switzerland, Spain and the U.S.. During the years ended December 31, 2023, 2022, and 2021, we recognized tax (benefit) expense of $0.6$(13.1) million, primarily related to state NOLs. During 2019, we increased$12.6 million, and $1.9 million, respectively, for the establishment of a valuation allowance recorded against deferred tax assetson our discontinued operations in Taicang, China and India. The increase of this valuation allowance resulted in tax expense of $8.5 million for the year. During 2020, we recognized $0.6 million tax benefits from the release of valuation allowance against deferred tax assets in India and changes to realizability of certain attributes in the U.S.China.
As of December 31, 2020,2023, we have U.S. federal and state NOL carryforwards of $103.0$392.7 million and $253.2$317.0 million, respectively, with foreign NOL carryforwards of approximately $41.0$4.7 million and foreign tax credits of approximately $1.9$1.9 million available to offset future U.S., China and India taxable income. TheA portion of the U.S. federal and all state NOL carryforwards expire in varying amounts through 20392043 with most of the U.S. federal and some of the state NOLs having indefinite lives. We also have foreign tax credits that expire in 2026. We also have2026 and foreign NOL carryforwards that expire in varying amounts through 2028 and some U.S. federal and foreign NOL carryforwards with indefinite lives.2031. The utilization of our NOLs is also subject to an annual limitation under Section 382 of the Internal Revenue Code due to changes in ownership. Based on our analysis, we do not believe such limitation will impact our realization of the NOL carryforwards as we anticipate utilizing them prior to expiration. carryforwards.
F-38
TPI COMPOSITES, INC. AND SUBSIDIARIES
Notes to Consolidated Financial Statements
We recognize the impact of a tax position in the financial statements if that position is more-likely-than-not to be sustained on audit, based on the technical merits of the position. We disclose all unrecognized tax benefits, which include the reserves recorded for uncertain tax positions on filed tax returns and the unrecognized portion of affirmative claims. Included in the balance of unrecognized tax benefits from continuing operations as of December
F-41
TPI COMPOSITES, INC. AND SUBSIDIARIES
Notes to Consolidated Financial Statements
31, 20202023 are $7.0$13.4 million, of tax benefits that, if recognized, would reduce our annual effective rate. We do 0tnot anticipate any decreases to unrecognized tax benefits in the coming year. Our policy is to recognize any interest and penalties that we may incur related to our tax positions as a component of our income tax provision or benefit. We did 0tThere was no material estimated interest or penalties to accrue any penaltiesin 2023, 2022, or interest during 20202021 related to the unrecognized tax benefit noted above. We did not record any uncertain tax positions in 2019 or 2018.benefits.
The following is a reconciliation of the beginning and ending amount of total unrecognized tax benefits for the years ended December 31:
|
| 2020 |
|
| 2019 |
|
| 2018 |
|
| 2023 |
|
| 2022 |
|
| 2021 |
| ||||||
|
| (in thousands) |
|
| (in thousands) |
| ||||||||||||||||||
Unrecognized tax benefits at beginning of year |
| $ | — |
|
| $ | — |
|
| $ | — |
|
| $ | 13,438 |
|
| $ | 9,020 |
|
| $ | 6,629 |
|
Increases related to prior year tax positions |
|
| 5,220 |
|
|
| — |
|
|
| — |
|
|
| — |
|
|
| — |
|
|
| — |
|
Decreases related to prior year tax positions |
|
| — |
|
|
| — |
|
|
| — |
| ||||||||||||
Increases related to current year tax positions |
|
| 2,268 |
|
|
| — |
|
|
| — |
|
|
| — |
|
|
| 4,418 |
|
|
| 2,391 |
|
Increases (decreases) due to currency translation |
|
| — |
|
|
| — |
|
|
| — |
| ||||||||||||
Decreases relating to settlements with authorities |
|
| (496 | ) |
|
| — |
|
|
| — |
| ||||||||||||
Decreases from laps in statute of limitations |
|
| — |
|
|
| — |
|
|
| — |
| ||||||||||||
Unrecognized tax benefits at end of year |
| $ | 6,992 |
|
| $ | — |
|
| $ | — |
|
| $ | 13,438 |
|
| $ | 13,438 |
|
| $ | 9,020 |
|
We operate in and file income tax returns in various jurisdictions in China,where we have continuing operations including Mexico, Turkey,Türkiye, India, U.S., Denmark, Germany, Spain, United Kingdom, France and Switzerland, which are subject to examination by tax authorities. In the U.S., the federal tax returns for 20172020 through 20192022 remain open to examination. For U.S. state and local taxes as well as in non-U.S. jurisdictions, the statute of limitations generally varies between three and ten years.years. However, to the extent allowable by law, the tax authorities may have a right to examine and make adjustment to prior periods when amended returns have been filed, or when NOLs or tax credits were generated and carried forward for subsequent utilization.
Pillar Two legislation, commonly referred to as the global minimum tax, has been enacted or substantively enacted in certain jurisdictions where the Company operates. The legislation will be effective for the financial year beginning January 1, 2024. The Company is in scope of the enacted or substantively enacted legislation and has performed an assessment of the potential exposure to Pillar Two income taxes under the safe harbor. The assessment of the potential exposure to Pillar Two income taxes is based on the most recent tax filings, country-by-country reporting and financial statements for the constituent entities.
Based on the assessment, the Pillar Two effective tax rates in most of the jurisdictions in which the Company operates are above 15%. However, there are a limited number of jurisdictions where the transitional safe harbor relief does not apply and the Pillar Two effective tax rate is close to 15%. We do not expect a material exposure to Pillar Two income taxes in those jurisdictions.
F-42
TPI COMPOSITES, INC. AND SUBSIDIARIES
Notes to Consolidated Financial Statements
Note 16.19. Net Income (Loss)Loss Per Common Share
Basic net income (loss) per common share is computed by dividingThe following table sets forth the net income (loss) by the weighted-average numbercomputation of common shares outstanding during a period. Diluted net income per common share is computed by giving effect to all potentially dilutive securities, unless there is a net loss for the period and/or performance-based awards which are not included until performance conditions are met. In computing diluted net income per common share, we use the treasury stock method.
The table below reflects the calculation of the weighted-average number of common shares outstanding, using the treasury stock method, used in computing basic and diluted net income (loss)loss per common share for the years ended December 31: share:
|
| 2020 |
|
| 2019 |
|
| 2018 |
| |||
|
| (in thousands) |
| |||||||||
Basic weighted-average shares outstanding |
|
| 35,532 |
|
|
| 35,062 |
|
|
| 34,311 |
|
Effect of dilutive awards |
|
| — |
|
|
| — |
|
|
| 1,691 |
|
Diluted weighted-average shares outstanding |
|
| 35,532 |
|
|
| 35,062 |
|
|
| 36,002 |
|
Since there were net losses for the years ended December 31, 2020 and 2019, approximately 1,674,000 and 1,176,000 potentially dilutive shares, respectively, were excluded from the calculation. In addition, the table below summarizes the approximate number of share-based compensation awards which were excluded from the computation of net income (loss) per common share because their effect would be anti-dilutive:
|
| 2023 |
|
| 2022 |
|
| 2021 |
| |||
|
| (in thousands, except per share data) |
| |||||||||
Numerator: |
|
|
|
|
|
|
|
|
| |||
Net loss from continuing operations |
| $ | (196,453 | ) |
| $ | (55,550 | ) |
| $ | (155,894 | ) |
Preferred stock dividends and accretion |
|
| (58,453 | ) |
|
| (58,903 | ) |
|
| (6,040 | ) |
Gain on extinguishment |
|
| 82,620 |
|
|
| — |
|
|
| — |
|
Net loss from continuing operations |
|
| (172,286 | ) |
|
| (114,453 | ) |
|
| (161,934 | ) |
Net loss from discontinued operations |
| $ | (5,326 | ) |
| $ | (9,755 | ) |
| $ | (3,654 | ) |
Net loss attributable to common stockholders |
| $ | (177,612 | ) |
| $ | (124,208 | ) |
| $ | (165,588 | ) |
|
|
|
|
|
|
|
|
|
| |||
Denominator: |
|
|
|
|
|
|
|
|
| |||
Basic weighted-average shares outstanding |
|
| 42,671 |
|
|
| 41,959 |
|
|
| 37,415 |
|
Effect of dilutive awards |
|
| — |
|
|
| — |
|
|
| — |
|
Diluted weighted-average shares outstanding |
|
| 42,671 |
|
|
| 41,959 |
|
|
| 37,415 |
|
|
|
|
|
|
|
|
|
|
| |||
Loss from continuing operations per common share: |
|
|
|
|
|
|
|
|
| |||
Basic |
| $ | (4.04 | ) |
| $ | (2.73 | ) |
| $ | (4.33 | ) |
Diluted |
| $ | (4.04 | ) |
| $ | (2.73 | ) |
| $ | (4.33 | ) |
|
|
|
|
|
|
|
|
|
| |||
Loss from discontinued operations per common share: |
|
|
|
|
|
|
|
|
| |||
Basic |
| $ | (0.12 | ) |
| $ | (0.23 | ) |
| $ | (0.10 | ) |
Diluted |
| $ | (0.12 | ) |
| $ | (0.23 | ) |
| $ | (0.10 | ) |
|
|
|
|
|
|
|
|
|
| |||
Loss per common share: |
|
|
|
|
|
|
|
|
| |||
Basic |
| $ | (4.16 | ) |
| $ | (2.96 | ) |
| $ | (4.43 | ) |
Diluted |
| $ | (4.16 | ) |
| $ | (2.96 | ) |
| $ | (4.43 | ) |
|
|
|
|
|
|
|
|
|
| |||
Dilutive shares excluded from the calculation |
|
| 169 |
|
|
| 606 |
|
|
| 1,569 |
|
Anti-dilutive share-based compensation awards |
|
| 264 |
|
|
| 199 |
|
|
| 1 |
|
F-39
TPI COMPOSITES, INC. AND SUBSIDIARIES
Notes to Consolidated Financial Statements
|
| 2020 |
|
| 2019 |
|
| 2018 |
| |||
|
| (in thousands) |
| |||||||||
Anti-dilutive shares |
|
| 17 |
|
|
| 28 |
|
|
| 30 |
|
In addition, since 2018, certain performance-based restricted stock units have been excluded from the computation of diluted shares outstanding for the 2020, 2019 and 2018 periods presented as the performance conditions had not yet been met.
Note 17.20. Stockholders’ Equity
Common Stock Purchase Agreement
On December 14, 2023, we entered into a Common Stock Purchase Agreement with the Purchasers as part of the Exchange (see Note 12, Debt). Pursuant to the agreement, an aggregate of $43.0 million of accrued and unpaid dividends on the shares of Series A Preferred Stock was extinguished in exchange for the issuance 3,899,903 shares of Common Stock.
F-43
TPI COMPOSITES, INC. AND SUBSIDIARIES
Notes to Consolidated Financial Statements
Accumulated Other Comprehensive Loss
The following table presents the changes in accumulated other comprehensive loss (AOCL) by component for the years ended December 31, 2020, 20192023, 2022 and 2018:2021:
|
| Foreign |
|
|
|
|
| Foreign |
|
|
|
| ||||
|
| currency |
|
|
|
|
| exchange |
|
|
|
| ||||
|
| translation |
|
| Interest rate |
|
| forward |
|
| Total |
| ||||
|
| adjustments |
|
| swap |
|
| contracts |
|
| AOCL |
| ||||
|
| (in thousands) |
| |||||||||||||
Balance at December 31, 2020 |
| $ | (30,111 | ) |
| $ | (3,443 | ) |
| $ | 564 |
|
| $ | (32,990 | ) |
Other comprehensive income (loss) |
|
| (18,419 | ) |
|
| 4,414 |
|
|
| (3,341 | ) |
|
| (17,346 | ) |
Amounts reclassified from AOCL |
|
| — |
|
|
| — |
|
|
| (3,037 | ) |
|
| (3,037 | ) |
Net tax effect |
|
| — |
|
|
| (971 | ) |
|
| 338 |
|
|
| (633 | ) |
Net current period other |
|
| (18,419 | ) |
|
| 3,443 |
|
|
| (6,040 | ) |
|
| (21,016 | ) |
Balance at December 31, 2021 |
|
| (48,530 | ) |
|
| — |
|
|
| (5,476 | ) |
|
| (54,006 | ) |
Other comprehensive income |
|
| 37,685 |
|
|
| — |
|
|
| 3,012 |
|
|
| 40,697 |
|
Amounts reclassified from AOCL |
|
| — |
|
|
| — |
|
|
| (2,078 | ) |
|
| (2,078 | ) |
Net tax effect |
|
| — |
|
|
| — |
|
|
| — |
|
|
| — |
|
Net current period other comprehensive income |
|
| 37,685 |
|
|
| — |
|
|
| 934 |
|
|
| 38,619 |
|
Balance at December 31, 2022 |
|
| (10,845 | ) |
|
| — |
|
|
| (4,542 | ) |
|
| (15,387 | ) |
Other comprehensive income |
|
| 2,317 |
|
|
| — |
|
|
| 2,304 |
|
|
| 4,621 |
|
Amounts reclassified from AOCL |
|
| 901 |
|
|
| — |
|
|
| 2,238 |
|
|
| 3,139 |
|
Net tax effect |
|
| — |
|
|
| — |
|
|
| — |
|
|
| — |
|
Net current period other comprehensive income |
|
| 3,218 |
|
|
| — |
|
|
| 4,542 |
|
|
| 7,760 |
|
Balance at December 31, 2023 |
| $ | (7,627 | ) |
| $ | — |
|
| $ | — |
|
| $ | (7,627 | ) |
|
| Foreign |
|
|
|
|
|
| Foreign |
|
|
|
|
| ||
|
| currency |
|
|
|
|
|
| exchange |
|
|
|
|
| ||
|
| translation |
|
| Interest rate |
|
| forward |
|
| Total |
| ||||
|
| adjustments |
|
| swap |
|
| contracts |
|
| AOCL |
| ||||
|
| (in thousands) |
| |||||||||||||
Balance at December 31, 2017 |
| $ | (558 | ) |
| $ | — |
|
| $ | — |
|
| $ | (558 | ) |
Other comprehensive income (loss) before reclassifications |
|
| (14,428 | ) |
|
| 752 |
|
|
| — |
|
|
| (13,676 | ) |
Amounts reclassified from AOCL |
|
| — |
|
|
| — |
|
|
| — |
|
|
| — |
|
Net tax effect |
|
| — |
|
|
| (158 | ) |
|
| — |
|
|
| (158 | ) |
Net current period other comprehensive income (loss) |
|
| (14,428 | ) |
|
| 594 |
|
|
| — |
|
|
| (13,834 | ) |
Balance at December 31, 2018 |
|
| (14,986 | ) |
|
| 594 |
|
|
| — |
|
|
| (14,392 | ) |
Other comprehensive income (loss) before reclassifications |
|
| (7,026 | ) |
|
| (3,469 | ) |
|
| 518 |
|
|
| (9,977 | ) |
Amounts reclassified from AOCL |
|
| — |
|
|
| — |
|
|
| 172 |
|
|
| 172 |
|
Net tax effect |
|
| — |
|
|
| 730 |
|
|
| (145 | ) |
|
| 585 |
|
Net current period other comprehensive income (loss) |
|
| (7,026 | ) |
|
| (2,739 | ) |
|
| 545 |
|
|
| (9,220 | ) |
Balance at December 31, 2019 |
|
| (22,012 | ) |
|
| (2,145 | ) |
|
| 545 |
|
|
| (23,612 | ) |
Other comprehensive income (loss) before reclassifications |
|
| (8,099 | ) |
|
| (1,698 | ) |
|
| (777 | ) |
|
| (10,574 | ) |
Amounts reclassified from AOCL |
|
| — |
|
|
| — |
|
|
| 996 |
|
|
| 996 |
|
Net tax effect |
|
| — |
|
|
| 400 |
|
|
| (200 | ) |
|
| 200 |
|
Net current period other comprehensive income (loss) |
|
| (8,099 | ) |
|
| (1,298 | ) |
|
| 19 |
|
|
| (9,378 | ) |
Balance at December 31, 2020 |
| $ | (30,111 | ) |
| $ | (3,443 | ) |
| $ | 564 |
|
| $ | (32,990 | ) |
Note 18.21. Concentration of Customers
Revenues from certain customers (in thousands) in excess of 10 percent of total consolidated Company revenues for the years ended December 31 are as follows:
|
| 2023 |
|
| 2022 |
|
| 2021 |
| |||||||||||||||
Customer |
| Revenues |
|
| % of Total |
|
| Revenues |
|
| % of Total |
|
| Revenues |
|
| % of Total |
| ||||||
|
| (in thousands) |
|
|
|
|
| (in thousands) |
|
|
|
|
| (in thousands) |
|
|
|
| ||||||
Vestas |
| $ | 520,353 |
|
|
| 35.8 | % |
| $ | 551,306 |
|
|
| 36.2 | % |
| $ | 455,217 |
|
|
| 30.9 | % |
Nordex |
|
| 440,833 |
|
|
| 30.3 |
|
|
| 496,999 |
|
|
| 32.6 |
|
|
| 374,076 |
|
|
| 25.4 |
|
GE |
|
| 357,750 |
|
|
| 24.6 |
|
|
| 316,788 |
|
|
| 20.8 |
|
|
| 427,053 |
|
|
| 29.0 |
|
|
| 2020 |
|
| 2019 |
|
| 2018 |
| |||||||||||||||
Customer |
| Revenues |
|
| % of Total |
|
| Revenues |
|
| % of Total |
|
| Revenues |
|
| % of Total |
| ||||||
Customer 1 - Vestas |
| $ | 830,302 |
|
|
| 49.7 | % |
| $ | 662,302 |
|
|
| 46.1 | % |
| $ | 329,472 |
|
|
| 32.0 | % |
Customer 2 - GE |
|
| 391,533 |
|
|
| 23.4 | % |
|
| 369,067 |
|
|
| 25.7 | % |
|
| 325,962 |
|
|
| 31.7 | % |
Customer 3 - Nordex |
|
| 255,912 |
|
|
| 15.3 | % |
|
| 230,563 |
|
|
| 16.1 | % |
|
| 195,156 |
|
|
| 19.0 | % |
Customer 4 - Siemens Gamesa |
|
| 78,137 |
|
|
| 4.7 | % |
|
| 73,426 |
|
|
| 5.1 | % |
|
| 115,779 |
|
|
| 11.2 | % |
F-40
TPI COMPOSITES, INC. AND SUBSIDIARIES
Notes to Consolidated Financial Statements
Trade accounts receivable from certain customers in excess of 10 percent of total consolidated Company trade accounts receivable as of December 31 are as follows:
|
| 2023 |
|
| 2022 |
| ||
Customer |
| % of Total |
|
| % of Total |
| ||
Nordex |
|
| 61.4 | % |
|
| 65.2 | % |
ENERCON |
|
| 17.6 | % |
|
| 10.9 | % |
GE |
|
| 11.5 | % |
|
| 9.1 | % |
|
| 2020 |
|
| 2019 |
| ||
Customer |
| % of Total |
|
| % of Total |
| ||
Customer 1 - Vestas |
|
| 35.0 | % |
|
| 41.9 | % |
Customer 3 - Nordex |
|
| 40.8 | % |
|
| 31.3 | % |
F-44
TPI COMPOSITES, INC. AND SUBSIDIARIES
Notes to Consolidated Financial Statements
Note 19.22. Segment Reporting
FASB ASC Topic 280, Segment Reporting, establishes standards for the manner in which companies report financial information about operating segments, products, services, geographic areas and major customers. In managing our business, management focuses on growing our revenues and earnings in select geographic areas serving primarily the wind energy market. We have continuing operations in the United States, China, Mexico, TurkeyTürkiye and India.
During the fourth quarter of 2020, the Company modified its system of reporting, resulting from changes to its internal management and organizational structure, which changed itsThe Company’s reportable segments fromare (1) the United States (U.S.), (2) Asia,Mexico, (3) Mexico and (4) Europe, the Middle East, Africa and India (EMEAI) to (1) the United States, (2) Asia, (3) Mexico, (4) Europe, the Middle East and Africa (EMEA) and (5)(4) India. As of December 31, 2020, theseThese reportable segments are reflective of how the Company’s chief operating decision maker reviews operating results for the purposes of allocating resources and assessing performance. Disclosures for the years ended December 31, 2019 and 2018 have been adjusted to reflect the change in reportable segments.
As further described below, our operating segments are defined geographically as the U.S., Asia, Mexico, EMEA and India. All of our segments operate in their local currency except for the Mexico and Asia segments, which both include aOur U.S. parent company, and India whichsegments operate in the U.S. dollar. Our Mexico segment operates in its local currency and includes a U.S. parent company that operates in the U.S. dollar. Our EMEA segment operates in the Euro, effective January 1, 2022. Prior to this, our EMEA segment operated in the Turkish Lira.
We divide our business operations into 5four geographic operating segments as follows:
Our U.S. segment includes (1) the manufacturing of wind blades at our Newton, Iowa facility, in which production was temporarily shutdown at the end of the fourth quarter of 2021, (2) the manufacturing of precision molding and assembly systems used for our transportationautomotive business at our Warren, Rhode Island facility, (3) the manufacturing of composite solutions for the transportationautomotive industry, which we also conduct at our Warren, Rhode Island facility, (4) wind blade inspection and repair services, (5) our advanced engineering center in Kolding, Denmark, which provides technical and engineering resources to our manufacturing facilities, (6) our engineering center in Berlin, Germany and (7)(7) our corporate headquarters, the costs of which are included in general and administrative expenses.
Our Asia segment includes (1) the manufacturing of wind blades at our facilities in Dafeng, China and Yangzhou, China, (2) the manufacturing of precision molding and assembly systems at our Taicang Port, China facility and (3) wind blade inspection and repair services.
Our Mexico segment includes (1) the manufacturing of wind blades at our three facilities in Juárez, Mexico and a facilitytwo facilities in Matamoros, Mexico, (2) the manufacturing of precision molding and assembly systems and composite solutions for the transportationautomotive industry at our fourth Juárez, Mexico facility and (3) wind blade inspection and repair services.
Our EMEA segment includes (1) the manufacturing of wind blades at our two facilities in Izmir, Türkiye, and wind blade inspection and repair services in Türkiye, (2) our wind blade inspection and repair service facility in Madrid, Spain, (3) wind blade inspection and repair services.
Our EMEA segment manufactures wind blades from our 2 facilitiesservices in Izmir, Turkeythe United Kingdom, and also performs(4) wind blade inspection and repair services.services in France.
Our India segment manufactures wind blades from our new manufacturing facility in Chennai, India which commenced operations in the first quarter of 2020..
F-41F-45
TPI COMPOSITES, INC. AND SUBSIDIARIES
Notes to Consolidated Financial Statements
The following tables set forth certain information regarding each of our segments as of or for the years ended December 31:
|
| 2023 |
|
| 2022 |
|
| 2021 |
| |||
|
| (in thousands) |
| |||||||||
Net sales by segment: |
|
|
|
|
|
|
|
|
| |||
U.S. |
| $ | 51,100 |
|
| $ | 89,170 |
|
| $ | 192,339 |
|
Mexico |
|
| 589,539 |
|
|
| 646,615 |
|
|
| 597,598 |
|
EMEA |
|
| 573,483 |
|
|
| 568,992 |
|
|
| 482,220 |
|
India |
|
| 241,061 |
|
|
| 217,964 |
|
|
| 200,229 |
|
Total net sales |
| $ | 1,455,183 |
|
| $ | 1,522,741 |
|
| $ | 1,472,386 |
|
Net sales by geographic location: |
|
|
|
|
|
|
|
|
| |||
United States |
| $ | 51,100 |
|
| $ | 89,170 |
|
| $ | 192,339 |
|
Mexico |
|
| 589,539 |
|
|
| 646,615 |
|
|
| 597,598 |
|
Türkiye |
|
| 566,617 |
|
|
| 566,155 |
|
|
| 480,992 |
|
Spain |
|
| 6,866 |
|
|
| 2,837 |
|
|
| 1,228 |
|
India |
|
| 241,061 |
|
|
| 217,964 |
|
|
| 200,229 |
|
Total net sales |
| $ | 1,455,183 |
|
| $ | 1,522,741 |
|
| $ | 1,472,386 |
|
Depreciation and amortization: |
|
|
|
|
|
|
|
|
| |||
U.S. |
| $ | 6,347 |
|
| $ | 7,002 |
|
| $ | 8,269 |
|
Mexico |
|
| 17,353 |
|
|
| 17,161 |
|
|
| 17,047 |
|
EMEA |
|
| 9,305 |
|
|
| 8,919 |
|
|
| 5,814 |
|
India |
|
| 5,864 |
|
|
| 5,690 |
|
|
| 6,476 |
|
Total depreciation and amortization |
| $ | 38,869 |
|
| $ | 38,772 |
|
| $ | 37,606 |
|
Income (loss) from continuing operations: |
|
|
|
|
|
|
|
|
| |||
U.S. |
| $ | (47,909 | ) |
| $ | (46,387 | ) |
| $ | (45,899 | ) |
Mexico |
|
| (174,009 | ) |
|
| (76,096 | ) |
|
| (84,691 | ) |
EMEA |
|
| 33,571 |
|
|
| 77,195 |
|
|
| 39,609 |
|
India |
|
| 24,754 |
|
|
| 17,479 |
|
|
| (845 | ) |
Total loss from continuing operations |
| $ | (163,593 | ) |
| $ | (27,809 | ) |
| $ | (91,826 | ) |
Capital expenditures: |
|
|
|
|
|
|
|
|
| |||
U.S. |
| $ | 6,928 |
|
| $ | 6,233 |
|
| $ | 9,422 |
|
Mexico |
|
| 6,698 |
|
|
| 2,084 |
|
|
| 10,659 |
|
EMEA |
|
| 21,570 |
|
|
| 4,110 |
|
|
| 2,103 |
|
India |
|
| 756 |
|
|
| 4,304 |
|
|
| 12,352 |
|
Total capital expenditures |
| $ | 35,952 |
|
| $ | 16,731 |
|
| $ | 34,536 |
|
Tangible long-lived assets: |
|
|
|
|
|
|
|
|
| |||
U.S. |
| $ | 10,660 |
|
| $ | 23,076 |
|
|
|
| |
Mexico |
|
| 49,921 |
|
|
| 56,495 |
|
|
|
| |
EMEA (Türkiye) |
|
| 40,435 |
|
|
| 27,005 |
|
|
|
| |
India |
|
| 27,792 |
|
|
| 30,265 |
|
|
|
| |
Total tangible long-lived assets |
| $ | 128,808 |
|
| $ | 136,841 |
|
|
|
| |
Total assets: |
|
|
|
|
|
|
|
|
| |||
U.S. |
| $ | 130,545 |
|
| $ | 187,014 |
|
|
|
| |
Mexico |
|
| 258,268 |
|
|
| 325,614 |
|
|
|
| |
EMEA (Türkiye) |
|
| 236,859 |
|
|
| 231,337 |
|
|
|
| |
India |
|
| 176,888 |
|
|
| 183,029 |
|
|
|
| |
Total assets from continuing operations |
| $ | 802,560 |
|
| $ | 926,994 |
|
|
|
| |
|
| 2020 |
|
| 2019 |
|
| 2018 |
| |||
|
| (in thousands) |
| |||||||||
Net sales by segment: |
|
|
|
|
|
|
|
|
|
|
|
|
U.S. |
| $ | 181,941 |
|
| $ | 169,317 |
|
| $ | 163,716 |
|
Asia |
|
| 527,083 |
|
|
| 393,809 |
|
|
| 306,255 |
|
Mexico |
|
| 495,839 |
|
|
| 435,606 |
|
|
| 268,756 |
|
EMEA |
|
| 373,545 |
|
|
| 437,081 |
|
|
| 290,897 |
|
India |
|
| 91,729 |
|
|
| 687 |
|
|
| — |
|
Total net sales |
| $ | 1,670,137 |
|
| $ | 1,436,500 |
|
| $ | 1,029,624 |
|
Net sales by geographic location(1): |
|
|
|
|
|
|
|
|
|
|
|
|
United States |
| $ | 181,941 |
|
| $ | 169,317 |
|
| $ | 163,716 |
|
China |
|
| 527,083 |
|
|
| 393,809 |
|
|
| 306,255 |
|
Mexico |
|
| 495,839 |
|
|
| 435,606 |
|
|
| 268,756 |
|
Turkey |
|
| 373,545 |
|
|
| 437,081 |
|
|
| 290,897 |
|
India |
|
| 91,729 |
|
|
| 687 |
|
|
| — |
|
Total net sales |
| $ | 1,670,137 |
|
| $ | 1,436,500 |
|
| $ | 1,029,624 |
|
Depreciation and amortization: |
|
|
|
|
|
|
|
|
|
|
|
|
U.S. |
| $ | 7,193 |
|
| $ | 9,223 |
|
| $ | 6,795 |
|
Asia |
|
| 15,692 |
|
|
| 10,699 |
|
|
| 6,765 |
|
Mexico |
|
| 18,587 |
|
|
| 12,577 |
|
|
| 7,891 |
|
EMEA |
|
| 6,217 |
|
|
| 6,081 |
|
|
| 4,978 |
|
India |
|
| 1,978 |
|
|
| — |
|
|
| — |
|
Total depreciation and amortization |
| $ | 49,667 |
|
| $ | 38,580 |
|
| $ | 26,429 |
|
Income (loss) from operations: |
|
|
|
|
|
|
|
|
|
|
|
|
U.S. |
| $ | (40,991 | ) |
| $ | (78,278 | ) |
| $ | (67,357 | ) |
Asia |
|
| 62,869 |
|
|
| 24,132 |
|
|
| 28,147 |
|
Mexico |
|
| (9,611 | ) |
|
| 3,533 |
|
|
| 12,154 |
|
EMEA |
|
| 23,331 |
|
|
| 70,449 |
|
|
| 51,774 |
|
India |
|
| (16,832 | ) |
|
| (3,948 | ) |
|
| — |
|
Total income from operations |
| $ | 18,766 |
|
| $ | 15,888 |
|
| $ | 24,718 |
|
Capital expenditures: |
|
|
|
|
|
|
|
|
|
|
|
|
U.S. |
| $ | 6,949 |
|
| $ | 8,321 |
|
| $ | 21,305 |
|
Asia |
|
| 13,135 |
|
|
| 22,471 |
|
|
| 11,218 |
|
Mexico |
|
| 15,624 |
|
|
| 25,842 |
|
|
| 18,928 |
|
EMEA |
|
| 10,887 |
|
|
| 11,023 |
|
|
| 1,237 |
|
India |
|
| 19,071 |
|
|
| 6,751 |
|
|
| — |
|
Total capital expenditures |
| $ | 65,666 |
|
| $ | 74,408 |
|
| $ | 52,688 |
|
Tangible long-lived assets: |
|
|
|
|
|
|
|
|
|
|
|
|
U.S. |
| $ | 31,811 |
|
| $ | 36,410 |
|
|
|
|
|
Asia (China) |
|
| 46,075 |
|
|
| 50,603 |
|
|
|
|
|
Mexico |
|
| 78,813 |
|
|
| 81,654 |
|
|
|
|
|
EMEA (Turkey) |
|
| 28,312 |
|
|
| 29,589 |
|
|
|
|
|
India |
|
| 23,990 |
|
|
| 6,751 |
|
|
|
|
|
Total tangible long-lived assets |
| $ | 209,001 |
|
| $ | 205,007 |
|
|
|
|
|
Total assets: |
|
|
|
|
|
|
|
|
|
|
|
|
U.S. |
| $ | 118,456 |
|
| $ | 107,918 |
|
|
|
|
|
Asia (China) |
|
| 250,582 |
|
|
| 210,438 |
|
|
|
|
|
Mexico |
|
| 251,764 |
|
|
| 275,646 |
|
|
|
|
|
F-46
F-42
TPI COMPOSITES, INC. AND SUBSIDIARIESExhibit Index
Notes to Consolidated Financial Statements
EMEA (Turkey) |
|
| 201,691 |
|
|
| 218,244 |
|
|
|
|
|
India |
|
| 133,764 |
|
|
| 14,431 |
|
|
|
|
|
Total assets |
| $ | 956,257 |
|
| $ | 826,677 |
|
|
|
|
|
|
|
Note 20. Selected Quarterly Financial Data (Unaudited)
The following tables set forth certain unaudited financial information for each quarter of 2020 and 2019. The unaudited quarterly information includes all normal recurring adjustments that, in the opinion of management, are necessary for the fair presentation of the information for the periods presented. The operating results for any quarter are not necessarily indicative of the results for any future period. The unaudited quarterly results are as follows:
|
| 2020 |
| |||||||||||||
|
| First Quarter |
|
| Second Quarter |
|
| Third Quarter |
|
| Fourth Quarter |
| ||||
|
| (in thousands, except per share data) |
| |||||||||||||
Net sales |
| $ | 356,636 |
|
| $ | 373,817 |
|
| $ | 474,113 |
|
| $ | 465,571 |
|
Gross profit (loss) |
|
| (3,873 | ) |
|
| (4,747 | ) |
|
| 40,473 |
|
|
| 32,246 |
|
Net income (loss) |
|
| (492 | ) |
|
| (66,101 | ) |
|
| 42,382 |
|
|
| 5,184 |
|
Net income (loss) per common share: |
|
|
|
|
|
|
|
|
|
|
|
|
|
|
|
|
Basic(1) |
| $ | (0.01 | ) |
| $ | (1.87 | ) |
| $ | 1.19 |
|
| $ | 0.14 |
|
Diluted(1) |
| $ | (0.01 | ) |
| $ | (1.87 | ) |
| $ | 1.13 |
|
| $ | 0.14 |
|
|
| 2019 |
| |||||||||||||
|
| First Quarter |
|
| Second Quarter |
|
| Third Quarter |
|
| Fourth Quarter |
| ||||
|
| (in thousands, except per share data) |
| |||||||||||||
Net sales |
| $ | 299,780 |
|
| $ | 330,771 |
|
| $ | 383,836 |
|
| $ | 422,113 |
|
Gross profit (loss) |
|
| (1,436 | ) |
|
| 22,551 |
|
|
| 25,931 |
|
|
| 30,802 |
|
Net income (loss) |
|
| (12,104 | ) |
|
| 1,828 |
|
|
| (4,571 | ) |
|
| (861 | ) |
Net income (loss) per common share: |
|
|
|
|
|
|
|
|
|
|
|
|
|
|
|
|
Basic(1) |
| $ | (0.35 | ) |
| $ | 0.05 |
|
| $ | (0.13 | ) |
| $ | (0.02 | ) |
Diluted(1) |
| $ | (0.35 | ) |
| $ | 0.05 |
|
| $ | (0.13 | ) |
| $ | (0.02 | ) |
|
|
Exhibit Index
| Description | |
3.1 | ||
3.2 | ||
4.1 | ||
4.2 | ||
4.3 | ||
4.4 | ||
4.5 | ||
| Indenture, dated as of March 3, 2023, between TPI Composites, Inc. and U.S. Bank Trust Company, Report on Form 8-K (File No. 001-37839) filed on March 3, 2023) | |
4.7 | ||
10.1‡ | ||
10.2‡ | ||
10.3† | ||
| ||
| ||
| ||
|
| |
| ||
| ||
| ||
10.8 | ||
| ||
| ||
| ||
| ||
| ||
| ||
| ||
| ||
| ||
| ||
| ||
|
| |
| ||
| ||
| ||
| ||
| ||
| ||
| ||
| ||
| ||
10.24 | ||
| ||
| ||
| ||
| ||
| Second Amended and Restated Non-Employee Director Compensation Policy(incorporated by reference to Exhibit 10.34 to the Registrant's Annual Report on Form 10-K (File No. 001-37839) filed on February 25, 2021) | |
| ||
|
| |
| ||
| ||
10.31 | ||
| ||
| ||
| ||
| ||
| ||
| ||
| ||
| ||
10.40 | ||
| ||
10.42 | ||
10.43 | ||
10.44 | Form of Capped Call Transaction Confirmation (incorporated by reference to Exhibit 10.1 to the Registrant’s Current Report on Form 8-K (File No. 001-37839) filed on March 3, 2023) | |
21.1* | ||
|
| |
32.2** | ||
| Certification of Chief Financial Officer pursuant to Section 906 of the Sarbanes-Oxley Act of 2002 | |
| Compensation Recovery Policy | |
101.INS* | Inline XBRL Instance Document – the instance document does not appear in the Interactive Data file because its XBRL tags are embedded within the Inline XBRL document | |
101.SCH* | Inline XBRL Taxonomy Extension Schema Document | |
101.CAL* | Inline XBRL Taxonomy Extension Calculation Linkbase Document | |
101.DEF* | Inline XBRL Taxonomy Extension Definition Linkbase Document | |
101.LAB* | Inline XBRL Taxonomy Extension Label Linkbase Document | |
101.PRE* | Inline XBRL Taxonomy Extension Presentation Linkbase Document | |
104 * | Cover Page Interactive Data File (formatted as Inline XBRL with applicable taxonomy extension information contained in Exhibits 101.*) |
|
|
|
|
* Filed herewith.
** The certifications furnished in Exhibits 32.1 and 32.2 hereto are deemed to accompany this Annual Report on Form 10-K and will not be deemed “filed” for purposes of Section 18 of the Securities Exchange Act of 1934, as amended, except to the extent that the Registrant specifically incorporates it by reference.
† Confidential treatment has been granted for certain provisions of this Exhibit pursuant to Rule 406 promulgated under the Securities Act of 1933.
‡ Indicates compensatory plan or arrangement
SIGNATURES
|
|
|
|
SIGNATURES
Pursuant to the requirements of Section 13 or 15(d) of the Securities Exchange Act of 1934, the Registrant has duly caused this Report to be signed on its behalf by the undersigned, thereunto duly authorized.
TPI COMPOSITES, INC. | ||||
|
|
| ||
| ||||
Date: February 22, 2024 | By: | /s/ Ryan Miller | ||
Ryan Miller | ||||
Chief Financial Officer (Principal Financial Officer) | ||||
We, the undersigned officers and directors of TPI Composites, Inc., hereby severally constitute and appoint William E. Siwek and Bryan R. SchumakerRyan Miller and each of them singly (with full power to each of them to act alone), our true and lawful attorneys-in-fact and agents, with full power of substitution and resubstitution in each of them for him or her and, place and stead, and in any and all capacities, to sign conformed for us and in our names in the capacities indicated below any and all signatures and amendments to this report, and to file the same, with all exhibits thereto, filing date and other documents in connection therewith, with the Securities and Exchange Commission, granting unto said attorneys-in-fact and agents, and each of them, full power and authority to do and perform each and every act and thing requisite or necessary to be done in and about the premises, as full to all intents and purposes as he or she might or could do in person, hereby ratifying and confirming all that said attorneys-in-fact and agents or any of them, or their or his substitute or substitutes, may lawfully do or cause to be done by virtue hereof.
Pursuant to the requirements of the Securities Exchange Act of 1934, as amended, this Report has been signed below by the following persons on behalf of the Registrant in the capacities and on the dates indicated.
Name | Title | Date | ||
/s/ William E. Siwek | President, Chief Executive Officer and Director | February | ||
William E. Siwek | (Principal Executive Officer) | |||
/s/ | Chief Financial Officer | February | ||
| (Principal Financial and Accounting Officer) | |||
|
|
| ||
|
| |||
/s/ Jayshree S. Desai | Director | February | ||
Jayshree S. Desai | ||||
/s/ Philip J. Deutch | Director | February 22, 2024 | ||
Philip J. Deutch |
|
| ||
| ||||
/s/ Paul G. Giovacchini | Lead Independent Director | February 22, 2024 | ||
|
|
| ||
| ||||
|
|
| ||
| ||||
/s/ Bavan M. Holloway | Director | February | ||
Bavan M. Holloway | ||||
/s/ Linda P. Hudson | Director | February | ||
Linda P. Hudson | ||||
/s/ James A. Hughes | Director | February 22, 2024 | ||
James A. Hughes |
|
| ||
| ||||
/s/ Tyrone M. Jordan | Director | February | ||
Tyrone M. Jordan | ||||
/s/ Steven C. Lockard | Director and Chairman of the Board | February | ||
Steven C. Lockard | ||||
|
|
| ||
|