
UNITED STATES
SECURITIES AND EXCHANGE COMMISSION
Washington, D.C. 20549
Form 10-K
(Mark One)
☒ | ANNUAL REPORT PURSUANT TO SECTION 13 OR 15(d) OF THE SECURITIES EXCHANGE ACT OF 1934 |
For the fiscal year ended December 31 |
OR
☐ | TRANSITION REPORT PURSUANT TO SECTION 13 OR 15(d) OF THE SECURITIES EXCHANGE ACT OF 1934 |
For the Transition Period From to |
For the Transition Period From to
Commission File Number: 001-33045
ICF INTERNATIONAL, INC.
(Exact name of Registrant as specified in its charter)
Delaware | 22-3661438 | |
(State or other jurisdiction of incorporation or organization) | (IRS Employer Identification Number) | |
|
| |
(Address of principal executive offices) | (Zip Code) |
Registrant’s telephone number, including area code:
(703) (703) 934-3000
Securities registered pursuant to Section 12(b) of the Act:
Title of each class |
| Trading Symbols(s) | Name of each exchange on which registered | |
Common Stock, $0.001 par value |
| ICFI | The NASDAQ |
Indicate by check mark if the registrant is a well-known seasoned issuer, as defined in Rule 405 of the Securities Act. Yes ☐No☒
Indicate by check mark if the registrant is not required to file reports pursuant to Section 13 or Section 15(d) of the Act. Yes ☐No☒
Indicate by check mark whether the registrant: (1) has filed all reports required to be filed by Section 13 or 15(d) of the Securities Exchange Act of 1934 during the preceding 12 months (or for such shorter period that the Registrantregistrant was required to file such reports), and (2) has been subject to such filing requirements for the past 90 days. Yes☒ No ☐
Indicate by check mark whether the registrant has submitted electronically every Interactive Data File required to be submitted pursuant to Rule 405 of Regulation S-T (§232.405 of this chapter) during the preceding 12 months (or for such shorter period that the registrant was required to submit such files). Yes☒ No ☐
Indicate by check mark whether the registrant is a large accelerated filer, an accelerated filer, a non-accelerated filer, a smaller reporting company, or emerging growth company. See the definitions of “large accelerated filer,” “accelerated filer,” “smaller reporting company,” and “emerging growth company” in Rule 12b-2 of the Exchange Act.
Large accelerated filer | ☒ | Accelerated filer | ☐ | |
Non-accelerated filer | ☐ | Smaller reporting company | ☐ | |
Emerging growth company | ☐ |
If an emerging growth company, indicate by check mark if the registrant has elected not to use the extended transition period for complying with any new or revised financial accounting standards provided pursuant to Section 13(a) of the Ex-changeExchange Act. ☐
Indicate by check mark whether the registrant has filed a report on and attestation to its management’s assessment of the effectiveness of its internal control over financial reporting under Section 404(b) of the Sarbanes-Oxley Act (15 U.S.C. 7262(b)) by the registered public accounting firm that prepared or issued its audit report. ☒
If securities are registered pursuant to Section 12(b) of the Act, indicate by check mark whether the financial statements of the registrant included in the filing reflect the correction of an error to previously issued financial statements. ☐
Indicate by check mark whether any of those error corrections are restatements that required a recovery analysis of incentive-based compensation received by any of the registrant’s executive officers during the relevant recovery period pursuant to Section 240.10D-1(b). ☐
Indicate by check mark whether the registrant is a shell company (as defined in Rule 12b-2 of the Exchange Act). Yes ☐ No ☒
The aggregate market value of the voting and non-voting common equity held by non-affiliates of the Registrantregistrant as of the last business day of the Registrant’sregistrant’s most recently completed second fiscal quarter was approximately $1,170$2,309 million based upon the closing price per share of $64.83,$124.39, as quoted on the NASDAQ Global Select Market on June 30, 2020.2023. Shares of the outstanding common stock held by each executive officer and director have been excluded in that such persons may be deemed to be affiliates. This determination of affiliate status is not necessarily a conclusive determination for other purposes.
As of February 19, 2021, 18,874,88323, 2024, 18,715,376 shares of the Registrant’sregistrant’s common stock, $0.001 par value, were outstanding.
DOCUMENTS INCORPORATED BY REFERENCE
List hereunder the following documents if incorporated by reference and the Part of the Form 10-K (e.g., Part I, Part II, etc.) into which the document is incorporated: (1) Any annual report to security holders; (2) Any proxy or information statement; and (3) Any prospectus filed pursuant to Rule 424(b) or (c) under the Securities Act of 1933. The listed documents should be clearly described for identification purposes (e.g., annual report to security holders for fiscal year ended December 24, 1980).
Part III incorporates information by reference from the Proxy Statement for the 20212024 Annual Meeting of Stockholders expected to be held in May 2021.June 2024.
TABLE OF CONTENTS
4 | ||||
ITEM 1. | 4 | |||
ITEM 1A. |
| |||
ITEM 1B. |
| |||
ITEM | 32 | |||
ITEM 2. |
| |||
ITEM 3. |
| |||
ITEM 4. |
| |||
| ||||
ITEM 5. |
| |||
ITEM 6. |
| |||
ITEM 7. | Management’s Discussion and Analysis of Financial Condition and Results of Operations |
| ||
ITEM 7A. |
| |||
ITEM 8. |
| |||
ITEM 9. | Changes in and Disagreements with Accountants on Accounting and Financial Disclosure |
| ||
ITEM 9A. |
| |||
ITEM 9B. | 53 | |||
ITEM 9C. | Disclosure Regarding Foreign Jurisdictions That Prevent Inspections | 53 | ||
54 | ||||
ITEM 10. | 54 | |||
ITEM 11. | 54 | |||
ITEM 12. | Security Ownership of Certain Beneficial Owners and Management and Related Stockholder Matters | 54 | ||
ITEM 13. | Certain Relationships and Related Transactions, and Director Independence | 54 | ||
ITEM 14. | 54 | |||
55 | ||||
ITEM 15. | 55 | |||
ITEM 16. | 57 | |||
2
2
FORWARD-LOOKING STATEMENTS
Some of the statements in this Annual Report on Form 10-K constitute forward-looking statements as defined in the Private Securities Litigation Reform Act of 1995, as amended. These statements involve known and unknown risks, uncertainties, and other factors that may cause our actual results, levels of activity, performance, or achievements to be materially different from any future results, levels of activity, performance, or achievements expressed or implied by such forward-looking statements. In some cases, you can identify these statements by forward-looking words such as “anticipate,” “believe,” “could,” “estimate,” “expect,” “intend,” “may,” “plan,” “potential,” “should,” “will,” “would,” or similar words. You should read statements that contain these words carefully. The risk factors described in Item 1A of Part I of this Annual Report on Form 10-K captioned “Risk Factors,” or otherwise described in our filings with the Securities and Exchange Commission (“SEC”), as well as any cautionary language in this Annual Report on Form 10-K, provide examples of risks, uncertainties, and events that may cause our actual results to differ materially from the expectations we describe in our forward-looking statements, including, but not limited to:
| • Our dependence on contracts with United States (“U.S.”) federal, state and local, and international governments, agencies, and departments for the majority of our revenue; • Changes in federal government budgeting and spending priorities; • Failure by Congress or other governmental bodies to approve budgets and debt ceiling increases in a timely fashion and related reductions in government spending; • Failure of the presidential administration (the “Administration”) and Congress to agree on spending priorities, which may result in temporary shutdowns of non-essential federal functions, including our work to support such functions; • Results of routine and non-routine government audits and investigations; • Dependence of our commercial work on certain sectors of the global economy that are highly cyclical; • Failure to realize the full amount of our backlog; • Risks inherent in being engaged in significant and complex disaster relief efforts and grant management programs involving multiple tiers of government in very stressful environments; • Risks resulting from expanding our service offerings and client base; • Difficulties in identifying attractive acquisitions available at acceptable prices; • Acquisitions we undertake presenting integration challenges, failing to perform as expected, increasing our liabilities, and/or reducing our earnings; and • Additional risks as a result of having international operations.
|
|
|
|
|
|
|
|
|
|
|
|
|
|
|
|
|
|
|
|
|
|
|
|
|
|
|
|
Our forward-looking statements are based on the beliefs and assumptions of our management and the information available to our management at the time these disclosuresstatements were prepared. Although we believe the expectations reflected in these statements are reasonable, we cannot guarantee future results, levels of activity, performance, or achievements. You should not place undue reliance on these forward-looking statements, which apply only as of the date of this Annual Report on Form 10-K. We undertake no obligation to update these forward-looking statements, even if our situation changes in the future.
The terms “we,” “our,” “us,” and “the Company,” as used throughout this Annual Report on Form 10-K, refer to ICF International, Inc. and its consolidated subsidiaries, unless otherwise indicated. The term “federal” or “federal government” refers to the U.S. federal government, and “state and local” or “state and local government” refers to U.S. state (including U.S. territories) and local governments, unless otherwise indicated.
3
3
PART I
ITEM 1. BUSINESS
|
|
COMPANY OVERVIEW
ICF International, Inc. was formed in 1999 as a Delaware limited liability company under the name ICF Consulting Group Holdings, LLC. It was formed to purchase our principal operating subsidiary, which was founded in 1969, from a larger services organization. We converted to a Delaware corporation in 2003 and changed our name to ICF International, Inc. in 2006. We completed our initial public offering in September 2006.
We provide professional services and technology-based solutions, to government and commercial clients, including management, marketing, technology, and policy consulting and implementation services. We help our clients conceive, develop, implement, and improve solutions that address complex business, natural resource, social, technological, and public safety issues. Our services primarily support clients that operate in fourthree key markets:
| • Energy, Environment, Infrastructure, and Disaster Recovery; • Health and Social Programs; and • Security and Other Civilian & Commercial.
|
|
|
|
|
|
|
|
We provide services across these four marketsto our diverse client base that deliver value throughout the entire life cycle of a policy, program, project,, or initiative. Our primary services include:
| • Advisory Services. We research critical policy, industry, and stakeholder issues, trends, and behavior. We measure and evaluate results and their impact and, based on those assessments, provide strategic planning and advice to our clients on how to navigate societal, market, business, communication, and technology challenges. • Program Implementation Services. We identify, define, and implement policies, plans, programs, and business tools that make our clients’ organizations more effective and efficient. Our comprehensive, end-to-end solutions are implemented through a wide range of standard and customized methodologies designed to match our clients’ business context. • Analytics Services. We conduct survey research and collect and analyze wide varieties and large volumes of data to understand critical issues and options for our clients and provide actionable business intelligence. We provide information and data management solutions that allow for integrated, purpose-driven data usage. • Digital Services. We design, develop, and implement cutting-edge technology systems and business tools that are key to our clients’ mission or business performance, and include solutions to optimize the customer and citizen experience for our clients. We provide cybersecurity solutions that support the full range of cybersecurity missions and protect evolving IT infrastructures in the face of relentless threats and modernize IT systems core to our clients’ operations. • Engagement Services. We inform and engage our clients’ constituents, customers, and employees to drive behavior and outcomes through public relations, branding and marketing, multichannel and strategic communications, and reputation issues management. Our engagement services frequently rely on our digital design and implementation skills, such as web and app development.
|
|
|
|
|
|
|
|
|
|
We perform work for both government and commercial clients. Our government clients include U.S. federal agencies, state and local governments, as well as governments outside the U.S. Our commercial clients include both U.S. and international clients. Our clients utilize our services because we offer a combination of deep subject matter expertise, technical solutions, and institutional experience which ensures thatcontribute to our solutions arebeing beneficial. We believe that our domain expertise and the program knowledge developed from our advisory engagements further position us to provide our full suite of services.
4
We report operating results and financial data in one operating and reportable segment. We generated revenue of $1,506.9$1,963.2 million, $1,478.5$1,780.0 million, and $1,338.0$1,553.0 million in 2020, 2019,during the years ended December 31, 2023, 2022, and 2018,2021, respectively. Our total backlog was approximately $2,897.6$3,777.8 million, $2,402.7$3,856.2 million, and$2,377.7 $3,198.9 million as ofat December 31, 2020, 2019,2023, 2022, and 2018,2021, respectively.
As of December 31, 2020,2023, we had nearly 7,500 fullapproximately 9,000 full-time and part-time employees around the globe, including many recognized as thought leaders in their respective fields. We serve clients globally from our headquarters in the Washington, D.C. metropolitan area, our 5655 regional offices throughout the U.S., and 2215 offices outside the U.S., including offices in the United Kingdom (“U.K.”), Belgium, China, India, and Canada.
4
OUR COMPANY INFORMATION
ICF International, Inc. is a Delaware limited liability company formed in 1999 under the name ICF Consulting Group Holdings, LLC. It was formed to purchase our principal operating subsidiary, which was founded in 1969, from a larger services organization. A number of our current senior managers participated in this transaction, along with private equity investors. We converted to a Delaware corporation in 2003 and changed our name to ICF International, Inc. in 2006. We completed our initial public offering in September 2006.
Our principal executive office is currently located at 9300 Lee Highway, Fairfax,1902 Reston Metro Plaza, Reston, Virginia 22031,20190, and our telephone number is (703)(703) 934-3000. We maintain an internet website at www.icf.com. We make available our Annual Reports on Form 10-K, Quarterly Reports on Form 10-Q, Current Reports on Form 8-K, and amendments to such reports filed or furnished pursuant to Section 13(a) or 15(d) of the Securities Exchange Act of 1934, as amended (the “Exchange Act”), Code of Business and Ethics, and other information related to us, free of charge, on this site as soon as reasonably practicable after we electronically file those documents with, or otherwise furnish them to, the SEC. Our internet website and the information contained therein or connected thereto are not intended to be incorporated into this Annual Report on Form 10-K. The SEC also maintains an internet website that contains reports, proxy and information statements, and other information regarding issuers that file electronically with the SEC at http://www.sec.gov.
MARKET OPPORTUNITY, SERVICES, AND SOLUTIONS
Complex, long-term market factors, which include geopolitical, technological, environmental, and demographic trends, are changing the way people live and their priorities, and the way government and industry operate and interact. We are all affected not only by the increasing breadth and invasiveness of change, but also by its velocity. These factors have significant impacts on the markets in which our clients operate.
In addition to these market-based factors, developments across all of our markets are increasing the demand for advisory services that drive our business. These trends include increased government focus on environmental initiatives; efficiency and mission performance management; generational changes; the emphasis on transparency and accountability; and an increased demand for combining domain knowledge of client missionmissions and programs with innovative technology-enabled solutions. We see growth opportunities for technology-based solutions involving analytics, digital services, and strategic communications across all of our markets.
5
We believe that demand for our services will continue as government, industry, and other stakeholders seek to understand and respond to these and other factors. We expect that our government clients will continue to utilize professional services firms with relevant domain expertise to assist with designing new programs, enhancing existing ones, offering transformational solutions, and deploying innovative information and communications technology. In addition, commercial organizations affected by these programs will need to understand such changes, as well as their implications, in order for them to plan appropriately. More broadly, we believe our commercial clients will demand innovative services and solutions that can help them connect with customers and stakeholders in an increasingly connected and crowded marketplace. We also see opportunityopportunities to further leverage our digital and client engagement capabilities across our commercial and government client base. We believe that our institutional knowledge and subject matter expertise are a distinct competitive advantage in providing our clients with practical, innovative solutions, which are directly applicable to their mission or business, and deploying them quickly with the right resources. Moreover, we believe we will be able to leverage the domain expertise and program knowledge we have developed through advisory assignments and our experience with program management, technology-based solutions, and engagement projects to win larger engagements, which generally lead to increasing returns on business development investment and promote higher employee utilization. Rapid changes in technology, including the omnipresent influence of mobile, social, and cloud technologies, also demand new ways of communicating, evaluating, and implementing programs, and we are focused on leveraging our expertise in technology to capitalize on those changes.
Our future results will depend on the success of our strategy to capitalize on our competitive strengths, including our success in maintaining our long-standing client relationships, to seek larger engagements across the program life cycle and to complete and successfully integrate strategic acquisitions. We will continue to focus on: building scale in vertical and horizontal domain expertise; developing business with both our government and commercial clients; and replicating our business model geographically in selected regions of the world. In doing so, we will continue to evaluate strategic acquisition opportunities that enhance our subject matter knowledge, broaden our service offerings, and/or provide scale in specific markets and/or geographies.
5
Although we continue to see favorable long-term market opportunities, there are certain near-term challenges facing all government service providers. Administrative and legislative actions by governments to address changing priorities could have a negative impact on our business, which may result in a reduction to our revenue and profit and adversely affect cash flow. However,Geopolitical factors could result in changing government priorities; however, we believe we are well positioned to provide a broad range of services in support of initiatives that will continue to be priorities to the U.S. federal government as well as to state and local and international governments and commercial clients.
Our portfolio includes a sizable amount of federal client work and we take active measures to minimize the impact of any federal government shutdown on our performance and our people. Past government shutdowns have not had a material impact on our performance, and federal government funding overall is relatively secure for the remainder of 2021. However, a federal government shutdown of any length is highly unpredictable for our impacted employees, for our clients, and for us as a company and, in the event of any future shutdowns, we cannot predict the impact on us or our operations.
6
Energy, Environment, Infrastructure, and InfrastructureDisaster Recovery
For decades, we have advised our clients on energy and environmental issues, including the impact of human activity on natural resources, and have helped develop solutions for infrastructure-related challenges. In addition to addressing government policy and regulation in these areas, our work focuses on industries that are affected by these policies and regulations, particularly in those industries most heavily involved in the use and delivery of energy. Significant factors affecting suppliers, users, and regulators of energy are driving private and public sector demand for professional services firms, including:
| • Changing power markets, increasingly diverse sources of supply including distributed energy resources and an increased demand for more carbon-free sources of energy and/or energy storage; • The changing role of the U.S. in the world’s energy markets; • Ongoing efforts to upgrade energy infrastructure to meet new power, transmission, environmental, and cybersecurity requirements and to enable more distributed forms of generation and greater reliance on more distant electricity generation; • Changing public policy, regulations, and incentives, including those established by the Inflation Reduction Act (the “IRA”), surrounding the modernization of and investment in an upgraded energy infrastructure, including new business models that may accompany those changes; • The need to manage energy demand and increase efficient energy use in an era of environmental concerns, especially regarding carbon and other emissions; and • The disruption of global energy markets and supplies, involving natural gas in particular, that have emerged as a result of the invasion of Ukraine by Russia.
|
|
|
|
|
|
|
|
|
|
We assist energy enterprises worldwide in their efforts to analyze, develop, and implement strategies related to their business operations and the interrelationships of those operations with the environment and applicable government regulations. We utilize our policy expertise, deep industry knowledge, and proprietary modeling tools to advise government and commercial clients on key topics related to electric power, traditional fuels, and renewable sources of energy. Our areas of expertise include power market analysis and modeling, transmissions analysis, power engineering and substation design, flexible load and distribution system management, electric system reliability standards, energy asset valuation and due diligence, regulatory and litigation support, fuels market analysis, air regulatory strategy, and renewable energy and green power.power project implementation. Our acquisition of CMY Solutions, LLC (“CMY”), a power engineering firm, in 2023 has brought consulting, engineering, and power systems design skills that add value to our existing mix of capabilities.
We also assist commercial and government clients in designing, implementing, and evaluating demand side management programs, both for residential and for commercial and industrial sectors.Utility companies must balance the changing demand for energy with a price-sensitive, environmentally consciousenvironmentally-conscious consumer base. We help utilities meet these needs, guiding them through the entire life cycle of energy efficiency and related demand sidedemand-side management and electrification programs, including policy and planning, determining technical requirements, and program implementation and improvement.
7
Carbon emissions have been an important focus of federal government regulation, international governments, many state and local governments, and multinational corporations around the world. Reducing or offsetting greenhouse gas (“GHG”) emissions continues to be the subject of both public and private sector interest, and the regulatory landscape in this area is still evolving. The need to address carbon and other harmful emissions has significantly changed the way the world’s governments and industries interact and continues to be one of the drivers of interest in energy efficiency. Moreover, how government and business adapt to the effects of climate change continues to be of global importance. We support governments at the federal and state and local level,levels, including providing comprehensive support to NASA’sthe National Science and Technology Council’s Global Change Research Program. Additionally, we support ministries and agencies of the government of the U.K. and the European Commission (the “E.C.”), as well as commercial clients, on these and related issues.
6We believe that demand for our services will continue to grow as government, industry, and other stakeholders seek to provide natural disaster recovery and rebuilding. In the wake of the major hurricanes (Ian, Harvey, Ida, Idalia, Irma, Maria, Laura, and Michael) that devastated communities in Texas, Florida, North Carolina, Louisiana, the U.S. Virgin Islands, and Puerto Rico, the affected areas remain in various stages of relief and recovery efforts. Our prior experience with disaster relief and rebuild efforts, including after hurricanes Katrina and Rita and Superstorm Sandy, puts us in a favorable position to provide recovery and housing assistance, and environmental and infrastructure solutions, including disaster mitigation, on behalf of federal departments and agencies, state, territorial, and local jurisdictions, and regional agencies. We support ongoing disaster recovery and mitigation efforts in a variety of U.S. states, territories, and local jurisdictions that have been affected by natural disasters including, but not limited to, hurricanes.
We also have decades of experience in designing, evaluating, and implementing environmental policies and environmental compliance programs for energy, transportation (including aviation), and other infrastructure projects. A number of key issues are driving increased demand for the services we provide in these areas, including:
| • Increased focus on the proper stewardship of natural resources; • Changing precipitation patterns and drought that is affecting water infrastructure and availability; • Aging water, energy, and transportation infrastructure, particularly in the U.S.; • The increasing exposure of infrastructure to damage and interference by severe weather events influenced by a changing climate, and therefore the need to become more resilient to those effects; • Past under-investment in transportation infrastructure that was the center of the Infrastructure Investment and Jobs Act passed by Congress and signed by the President on November 15, 2021; • Economic and policy incentives for the implementation of carbon-free energy sources that were the centerpiece of the IRA passed by Congress and signed into law by the President on August 16, 2022; • The increasing demand for businesses to respond to climate change and similar environmental, social, and governance priorities being championed not only by the public sector, but also by investors, financing sources, business organizations, ratings agencies, and proxy advisory firms; and • Changing patterns of economic development that require transportation systems and energy infrastructure to adapt to new patterns of demand. 8
|
|
|
|
|
|
|
|
|
|
|
|
By leveraging our interdisciplinarymulti-disciplinary skills, which range from finance and economics to earth and life sciences, information technology, and program management, we are able to provide a wide range of services that include complex environmental impact assessments, environmental management information systems, air quality assessments, program evaluation, transportation and aviation planning and operational improvement, strategic communications, and regulatory reinvention. Our acquisition of Blanton & Associates (“Blanton”) in September 2022 added to these skills and expanded our geographic reach. We help clients deal specifically with the interrelated environmental, business, and social implications of issues surrounding all transportation modes and infrastructure. From the environmental management of complex infrastructure engagements to strategic and operational concerns of airlines and airports, our solutions draw upon our expertise and institutional knowledge in transportation, urban and land use planning, industry management practices, financial analysis, environmental sciences, and economics.
Health Education, and Social Programs
We also apply our expertise across our full suite of services in the areas of health education, and social programs. We believe that a confluence of factors will drive an increased need for public and private focus on these areas, including, among others:
| • Weaknesses in our public health and healthcare delivery systems exposed by the SARS-CoV-2 virus and the Coronavirus Disease 2019 (“COVID-19”); • Expanded healthcare services to underserved portions of the population; • Rising healthcare expenditures, which require the evaluation of the effectiveness and efficiency of current and new programs; • Rampant substance abuse and widespread social and health impacts of the opioid abuse epidemic; • The emphasis on improving the effectiveness of the U.S. and other countries’ educational systems; • The perceived declining performance of the U.S. educational system compared to other countries; • The need to digitally transform and modernize the technology infrastructure underpinning government operations; • Increased arrival of refugees to the U.S. requiring social and other support; • The need for greater transparency and accountability of public sector programs; • A continued high need for social support systems, in part due to an aging population, and the interrelated nature of health, housing, transportation, employment, and other social issues; • A changing regulatory environment; and • Military personnel returning home from active duty with health and social service needs.
|
|
|
|
|
|
|
|
|
|
|
|
|
|
|
|
|
|
|
|
|
|
|
|
We believe we are well positioned to provide our services to help our clients develop and manage effective programs in the areas of health, education, and social programs at the international, regional, national, and local levels. Our subject matter expertise includes public health, biomedical research, healthcare quality, mental health, international health and development, health communications and associated interactive technologies, education, child and family welfare needs, housing and communities, and substance abuse. Our combination of domain knowledge and our experience in information technology-based applications provides us with strong capabilities in health and social programs informatics and analytics, which we believe will be of increasing importance as the need to manage information grows. We partner with our clients in the government and commercial sectors to increase their knowledge base, support program development, enhance program operations, evaluate program results, and improve program effectiveness.
79
In the area of publicfederal health, we support many agencies and programs within the U.S. Department of Health and Human Services (“HHS”), including the National Institutes of Health (the “NIH”) and, the Centers for Disease Control and Prevention (the “CDC”), and the Centers for Medicare and Medicaid Services (“CMS”) by conducting primary data collection and analyses, assisting in designing, delivering, and evaluating programs, managing technical assistance centers, providing instructional systems, developing information technology applications, and managing information clearinghouse operations. Our 2022 acquisition of SemanticBits, LLC (“SemanticBits”) brought substantial expertise in technology applications used in CMS to oversee healthcare quality. Increasingly, we provide multichannel communications and messaging for public health programs using capabilities similar to those used to provide marketing services to our commercial clients.programs. We also provide training and technical assistance for early care and educational programs (such as Head Start), and health and demographic surveys in developing countries for the U.S. Department of State (the “DOS”“DoS”). In the area of social programs, we provide extensive training, technical assistance, and program analysis and support services for a number of the housing and disaster recovery programs of the U.S. Department of Housing and Urban Development (“HUD”) and state, territorial, and local governments. In addition, we provide research, program design, evaluation, and training for educational initiatives at the federal and state level. We provide similar services to a variety of U.K. ministries, as well as several Directorates-General of the European Commission.E.C.
SafetySecurity and SecurityOther Civilian & Commercial
SafetyWe serve a number of other important government missions and securitycommercial markets. These government missions range from Security (e.g., the U.S. Departments of Defense (“DoD”), Homeland Security (“DHS”), and Justice (“DoJ”)) to a variety of other civilian government departments and agencies.
Security programs continue to be a critical priority of the federal government, state and local governments, international governments (especially in Europe), and in the commercial sector. We believe we are positioned to meet the following key safety concerns:
| • Vulnerability of critical infrastructure to cyber and terrorist threats; • Increasing risks to enterprises’ reputations in the wake of a cyberattack; • Broadened homeland security concerns that include areas such as health, food, energy, water, and transportation; • Reassessment of the emergency management functions of homeland security in the face of natural disasters; • Safety issues around crime and at-risk behavior; • Increased dependence on private sector personnel and organizations in emergency response; • The need to ensure that critical functions and sectors are resilient and able to recover quickly after attacks or disasters in either the physical or cyber realms; and • The challenges resulting from migrations and changing global demographics.
|
|
|
|
|
|
|
|
|
|
|
|
|
|
These security concerns create demand for government programs that can identify, prevent, and mitigate key cybersecurity issues and the societal issues they cause.
We believe that demand for our services will continue to grow as government, industry, and other stakeholders seek to address critical long-term societal and natural resource issues due to heightened concerns about: clean energy and energy efficiency; health promotion, treatment, and cost control; the means by which healthcare can be delivered effectively of a cross-jurisdictional basis; natural disaster relief and rebuild efforts; and ongoing homeland security threats. In the wake of the major hurricanes (Harvey, Irma, Maria, Laura and Michael), that devastated communities in Texas, Florida, North Carolina, Louisiana, the U.S. Virgin Islands, and Puerto Rico, the affected areas remain in various stages of relief and recovery efforts. We believe our prior experience with disaster relief and rebuild efforts, including those from Hurricanes Katrina and Rita and Superstorm Sandy, puts us in a favorable position to provide recovery and housing assistance, and environmental and infrastructure solutions, including disaster mitigation, on behalf of federal departments and agencies, state, territorial and local jurisdictions, and regional agencies.
In addition, the U.S. Department of Defense (“DoD”)DoD is undergoing major transformations in its approach to strategies, processes, organizational structures, and business practices due to several complex, long-term factors, including:
|
|
|
|
|
|
| • The increasing need for real-time information sharing |
810
We provide key services to the DoD, the U.S. Department of Homeland Security (“DHS”), the U.S. Department of Justice (“DOJ”),DHS, DoJ, and analogous Directorates-General at the European Commission.E.C. We support DoD by providing high-end strategic planning, analysis, and technology-based solutions in the areas of logistics management, operational support, command and control, andaround cybersecurity. We also provide the defense sector with critical infrastructure protection, environmental management, human capital assessment, military community research, and technology-enabled solutionssolutions.. We strengthened our offerings in these areas as a result of our Incentive Technology Group, LLC (“ITG”) acquisition in January 2020.
At the DHS, we assist in shaping and managing critical programs to ensure the safety of communities, developing critical infrastructure protection plans and processes, and establishing goals and capabilities for national preparedness at all levels of government in the U.S., and managing At the national program to test radiological emergency preparedness at the state and local government levels in communities adjacent to nuclear power facilities. At DOJ,DoJ, we provide technical and communications assistance to programs that help victims of crime and at-risk youths. At the European Commission,E.C., we provide support and analytical services related to justice and home affairs issues within the European context.
ConsumerOther large federal departments and Financial Markets
Inagencies, such as the areaU.S. Department of consumerAgriculture and financial markets, somethe U.S. Department of the long-term market factorsTreasury, also face important challenges that motivate them to transform their business processes and to modernize the associated technology systems. We support these organizations with a variety of technology and program support services.
Across all of the areas described above we believe will have an impact onassist our clients include:in their growing efforts to ensure equity in their program operations, whether it is with an environmental justice or a health equity focus, or some other perspective depending on the program being delivered.
|
|
|
|
|
|
|
|
We combine our expertise in strategic communications, marketing and creative services and public relations with our strengths in interactive and mobile technologies to help companies develop stronger relationships and engage with their customers and stakeholders across all channels, whether via traditional or digital media, to drive better operating results. We continue to strengthen our services in the fields of content and customer relationship management, loyalty marketing, and end-to-end e-commerce. In an effort to enhance our positioning and build awareness outside of our traditional client set, we have combined capabilities from strategic acquisitions to create a full-service, technology-rooted advertising agency that guides brands digitally through informed strategy, inspired creative design, and technical know-how. We have the capability to complete projects big or small across all channels (including web, social, mobile, intranet and emerging platforms) through end-to-end technology-based implementations for local and global clients. Target customer areas include airlines, airports, electric and gas utilities, health care companies, banks and other financial services companies, transportation, travel and hospitality firms, non-profits/associations, manufacturing firms, retail chains, and distribution companies.
COMPETITIVE STRENGTHS
We possess the following key business strengths:
We have a highly educatedhighly-educated professional staff with deep subject matter knowledge
We possess strong intellectual capital that provides us with a deep understanding of policies, processes, and programs across our clients’ markets. Our thought leadership is based on years of training, experience, and education. We are able to apply our in-depth knowledge of our subject matter experts and our experience developed over 4045 years of providing advisory services to address the problems and issues our clients are facing. As of December 31, 2020,2023, approximately 35%45% of our benefits-eligible staff held post-graduate degrees in diverse fields such as the social sciences, business and management, physical sciences, public policy, human capital, information technology, mathematics, engineering, planning, economics, life sciences, and law. These qualifications, and the complementary nature of our markets, enable us to deploy multi-disciplinary teams to identify, develop, and implement solutions that are creative, pragmatic, and tailored to our clients’ specific needs.
9
We believe our diverse range of client markets, services, and projects provides a stimulating work environment for our employees that enhances their professional development. The use of multi-disciplinary teams provides our staff with the opportunity to develop and refine common skills required in many types of engagements. Our approach to managing people fosters collaboration and significant cross-utilization of the skills and experience of both industry experts and other personnel who can develop creative solutions by drawing on their different experiences. The types of services we provide, and the manner in which we do so, enable us to attract and retain talented professionals from a variety of backgrounds while maintaining a culture that fosters teamwork and excellence.
11
We have strong, long-standing relationships with clients across a diverse set of markets
The long-term relationships we maintain with many of our clients reflect our successful track record of fulfilling our clients’ needs. We have advised both the U.S. Environmental Protection Agency (“EPA”), the United States Agency for International Development (“USAID”), and HHS for more than 30 years, the U.S. Department of Energy (“DOE”DoE”) for more than 25 years, DoD for more than 20 years, certain commercial clients in our energy markets for more than 20 years, and the European CommissionE.C. for more than 15 years, and we have multi-year relationships with many of our other clients in both our government and commercial client base. We have numerous contacts at various levels within our clients’ organizations, ranging from key decision-makers to functional managers. The long-standing nature and breadth of our client relationships adds greatly to our institutional knowledge, which, in turn, helps us carry out our client engagements more effectively and maintain and expand such relationships. Our extensive experience working alongside our clients and client contacts, together with our prime-contractorprime contractor position on a substantial majority of our contracts, gives us clearer visibility into future opportunities and emerging requirements. We believe our balance between government civilian and defense agencies, our commercial presence, and the diversity of markets in which our clients operate help mitigate the impact of policy or political shifts, as well as annual shifts in our clients’ budgets and priorities.
Our advisory services position us to capture a full range of engagements
We believe our advisory approach, which is based on our subject matter expertise combined with an understanding of our clients’ requirements and objectives, is a significant competitive differentiator that helps us gain access to key client decision-makers during the initial phases of a policy, program, project, or initiative. We use our expertise and understanding to formulate customized recommendations for our clients. We believe this domain expertise and the program knowledge, developed from our advisory engagements, further positionpositions us to provide a full suite of services across the entire life cycle of a particular policy, program, project, or initiative. As a result, we are able to understand our clients’ requirements and objectives as they evolve over time. We then use this knowledge to provide continuous improvement across our entire range of services, which maintains the relevance of our recommendations.
Our technology-enabled solutions are driven by our subject matter expertise and creativity
Government and commercial decision-makers have become increasingly aware that, to be effective, technology-based solutions need to be seamlessly integrated with people and processes. We possess a strong knowledge in information technology and a thorough understanding of organizational behavior and human decision processes. In addition, as a result of our acquisitionacquisitions of ITGIncentive Technology Group, LLC (“ITG”) in January 2020, Creative Systems and Consulting (“Creative Systems”) in December 2021, SemanticBits in July 2022, and ESAC in November 2022, we have strong partnerships and experience in cloud-based technology platforms and open-source ecosystems that are central to our federal government clients’ technology modernization agendas. This combination of skills, along with our domain knowledge, allows us to deliver technology-enabled solutions tailored to our clients’ business and organizational needs with less start-up time required to understand client issues. In addition, many of our clients seek to deploy cutting-edge solutions to communicate and transact with citizens, stakeholders, and customers in a multichannel environment, and doing so takes both our constantly refreshedconstantly-refreshed technical know-how and world-class creativity.
Our proprietary tools, analytics, and methods allow us to deliver superior solutions to our clients
We believe our innovative, and often proprietary, analytics and methods are key competitive differentiators because they enhance our ability to deliver customized solutions to our clients and enable us to deliver services in a more cost-effective manner than our competitors. For example, we have developed industry-standard energy and environmental models that are used by governments and commercial entities around the world for energy planning and air quality analyses and have also developed a suite of proprietary climate change tools to help the private sector develop strategies for complying with GHG emission reduction requirements. Our loyalty marketing services are often provided via our proprietary Tally software, software as a service. We maintain proprietary databases that we continually refine and that are available to be incorporated quickly into our analyses on client engagements. In addition, we also have proprietary program management methodologies and services that we believe can help clients improve performance measurement, support chief information officer and science and engineering program activities, and reduce security risks.
1012
We are led by an experienced management team
Our management team, consisting of 274 officers277 senior leaders with the title of vice president or higher, possesses extensive industry experience and had an average tenure of 14.216.4 years with us as of December 31, 20202023 (including prior service with companies we have acquired). This low turnover allows us to retain institutional knowledge. Our managers are experienced both in marketing efforts and in successfully managing and executing our key services. Our management team also has experience in acquiring other businesses and integrating those operations with our own. A number of our managers are industry-recognized thought leaders. We believe that our management’s successful past performance and deep understanding of our clients’ needs have been and will continue to be differentiating factors in competitive situations.
We have a broad global presence
We serve our clients with a global network of 5655 regional offices throughout the U.S., and 2215 offices in key markets outside the U.S., including offices in the U.K., Belgium, China, India, and Canada. Our global presence also gives us access to many of the leading experts on a variety of issues from around the world, allowing us to expand our knowledge base and areas of functional expertise. Over the past year,years, we worked in dozens of countries, helping government and commercial clients with energy, environment, infrastructure, healthcare, marketing, interactive technology/e-commerce, and air transport matters. Although international operations present challenges in the form of inconsistent legal systems, differing levels of intellectual property protection, and trade regulation issues, we believe our international operations will continue to play a significant role in our clients’ operations and in our platform.
STRATEGY
Our strategy to increase our revenue and shareholder value involves the following key elements:
Expand our commercial businesses
We plan to continue to pursue profitable commercial projects and we believe we have strong, global client relationships in both the commercial energy and air transport markets. We continue to see growth opportunities in our current commercial business in the utility sector as well as significant potential for us to expand our business in other commercial areas such as aviation and digital marketing services and strategic communications services, both domestically and internationally.tourism.
We view the energy industry as a particularly attractive sector for us over the next decade due to concerns over controlling energy costs and limiting climate and environmental impacts, increased state and federal regulation, the need for cleaner and more diverse sources of energy, and the concomitant need for infrastructure to transport/transmit, store, and/or convert those new energy sources. We also believe that the combination of our vertical domain expertise with our digital marketing expertise makes us a provider of choice for high value-added assignments in that arena. Although we believe the utility industry will continue to be a strong market for advisory services, particularly in light of the changing focus on regulatory actions and alternative energy sources, we intend to leverage our existing relationships and institutional expertise to pursue and capture additional, and typically higher-margin, opportunities. For example, we believe we can continue to expand our programprogram- and technology-based services in areas such as assisting with the implementation of energy efficiency programs, electrification and decarbonization initiatives, information technology applications, and environmental management services for larger utilities. In addition, theThe growth of interest in sustainability and energy efficiency issues has created opportunities to offer these types of services to new clients beyond our traditional sectors. We believe these factors, coupled with our expansive national and global footprint, will result in a greater number of engagements that will also be larger in size and scope.
We expect that interest in energy advisory services will continue to expand as clients in a number of industries, including information service providers and companies engaged in travel and tourism, seek to better understand their energy consumption options and the positive benefits of demonstrating environmental stewardship. Our broad range of services to the aviation industry makes us well positioned to capitalize on significant industry changes, including recovery from COVID-19-induced demand shocks;changes; substantial airline equipment upgrades to newer, more efficient aircraft models in a cost-constrained environment; testing and adoption of Sustainable Aviation Fuels (“SAF”); and changes to airport business models and strategy as they place increasing importance on passenger experience.
11
Our engagement services, including marketing, interactive technology, and strategic communications offerings, are well-positioned to support the continuing growth of multichannel engagement and e-commerce. We have broadened our client offerings, particularly in the areas of content management, marketing and digital services. We can now offer complete end-to-end solutions for chief marketing officers, chief communications officers, and chief technology officers as they invest in digital marketing platforms and solutions. We deliver cutting-edge digital strategy support, as well as the creative services that help brands, products and services, succeed in a crowded marketplace. As a means of more comprehensively communicating and delivering our engagement services to customers in both the private and public sectors, we created ICF Next, an umbrella under which all of our engagement capabilities can be integrated, communicated, and delivered to clients.13
Replicate our business model across government and industry in selected geographies
We believe the services we provide to our energy, environment, and infrastructure market have strong growth potential in selected geographies. Our domain expertise is well suited in Europe to meet the need for cutting-edge climate change, energy, and environmental solutions, particularly with our offerings to the U.K. government and European Commission. the E.C. We have also focused our geographic footprint, when prudent, by selectively closing or reducing the size of offices which appear to be unlikely to generate profitable growth in the near to medium term, generally in nations or regions undergoing either economic or political challenges.
Strengthen our technology-based offerings
We continue to strengthen our services in the fields of content and customer relationship management, loyalty marketing, and end-to-end e-commerce. In early 2020 we acquired ITG, which materially increased our skills and market presence in IT modernization, including the use of popular cloud-based platforms to modernize legacy IT systems. In December 2021, we followed with the acquisition of Creative Systems, further extending our cloud platform and open-source technology implementation skills. In 2022, we acquired SemanticBits, a leading provider of cloud-native open-source technology systems with a strong client position in CMS. We are positioned to increase these services by expanding the technological underpinnings of our business, while bringing these cloud, marketing and e-commerce solutions, as well as expandedbusiness process automation, data management, and analytics offerings to our clients to better link them with citizens, consumers, and other stakeholders.
Leverage advisory work into full life cyclelife-cycle solutions
We plan to continue to leverage our advisory services and strong client relationships to increase our revenue by winning longer termlonger-term engagements. These engagements could include: information services and technology-based solutions; project and program management; business process solutions; marketing and communications delivery; strategic communications; and technical assistance and training. Our advisory services provide us with insight and understanding of our clients’ missions and goals. We believe the domain expertise and program knowledge we develop from these advisory assignments position us to capture a greater portion of the resulting larger engagements. However,engagements; however, we will need to undertake such expansion carefully to avoid actual, potential, and perceived conflicts of interest.
Defend, expand, and deepen our presence in core U.S. federal and state and local government markets
Changing and somewhat unpredictable political priorities at the U.S. federal, state, and local government levels have created challenging market conditions for all competitors in the government services sector,sector; however, we believe that the newBiden administration provides renewed opportunities for growth in many of the government mission areas, such as efforts to address infrastructure issues with the passing of the Infrastructure Investment and Jobs Act in 2021, where we have expertise and long-standing relationships. We will focus not only on defending our current market footprint, but also on innovating to continue expanding across key growth markets, such as U.S. federal government energy-energy and climate-related programs, reengineering of U.S. public health and research efforts, and cybersecurity initiatives, digital services, and disaster recovery work for state and local governments. We will continue to provide innovative solutions that help our public sector clients do more with less. We will specifically target deeper penetration of those agencies that currently procure services only from one or two of our service areas, and our recent acquisitionacquisitions of ITG, Creative Systems, and SemanticBits, which providesprovide us with strong skills and market presence in technology modernization, will provide additional capabilities in this effort. We believe we can leverage many of our long-term client relationships by introducing these existing clients, where appropriate, to our other services in order to better meet their needs. For example, we introduce many of our advisory clients to our capabilities to provide associated information technology, cybersecurity, large-scale program management, and strategic communications and digital services. We can also offer clients our extensive performance measurement, program evaluation, and performance management services. Finally, having 5655 offices across the U.SU.S. allows us to focus more of our business development efforts on addressing the needs of U.S. federal and state and local government agencies with operations outside of the Washington, D.C. metropolitan area.
1214
Pursue larger prime contract opportunities
We believe that continuing to expand our client engagements into services we offer as part of our end-to-end client solutions enables us to pursue larger prime contract opportunities, which should provide a greater return on our business development efforts and allow for increased employee utilization. We plan to continue to target larger and longer-term opportunities through greater emphasis on early identification of opportunities, strategic capture and positioning, and enhanced brand recognition. We believe that the resulting increase in the scale, scope, and duration of our contracts will help us continue to grow our business.
Pursue strategic acquisitions
We plan to augment our organic growth with selective, strategic acquisitions when the target company will enable us to obtain new clients, increase our presence in attractive markets, and/or obtain capabilities that complement our existing portfolio of services, and/or gain access to customer contracts; provided, that the target company has a cultural compatibility and we expect that the acquisition will have a positive financial impact. TheOur acquisition of ITGCMY in 2023 is an example of this approach, both in the capabilities it brings and in the alignment of its client footprint to ours.approach.
These elements of our strategy permeate all of the Company and influence our day-to-day decisions. We believe that, collectively, they support the overall long-term growth of the organization.
CLIENT AND CONTRACT MIX
Government clients (including U.S. federal, state and local, as well as international, governments) accounted for approximately 65%76%, 65%76%, and 64%71% of our 2020, 2019,2023, 2022, and 20182021 revenue, respectively. Commercial clients (including U.S. and international clients) accounted for approximately 35%24%, 35%24%, and 36%29% of our 2020, 2019,2023, 2022, and 20182021 revenue, respectively.
Our clients span a broad range of civilian and defense agencies and commercial enterprises. Commercial clients include non-profit organizations and universities, while government clients include the World Bank and the United Nations. In general, a client is considered to be a government client if its primary funding is from a government agency or institution. If we are a subcontractor, we classify the revenue based on the nature of the ultimate client receiving the services.
In fiscal years 20182023, 2022, and 2020,2021, our largest three government clients by revenue were HHS, DOS,DoS, and DoD. In fiscal year 2019, as result of the addition of a large disaster recovery assignment in Puerto Rico our four largest government clients were HHS, DoD, DHS, and Commonwealth of Puerto Rico.
The following table summarizes the percentagepercentages of our total revenue for each of the top four largestfrom these government clients:clients are as follows:
|
| Year ended December 31, |
|
| Year ended December 31, |
| ||||||||||||||||||
|
| 2020 |
|
| 2019 |
|
| 2018 |
|
| 2023 |
|
| 2022 |
|
| 2021 |
| ||||||
Department of Health and Human Services |
|
| 17 | % |
|
| 16 | % |
|
| 17 | % |
|
| 26 | % |
|
| 23 | % |
|
| 20 | % |
Department of State |
|
| 5 | % |
|
| 6 | % |
|
| 5 | % | ||||||||||||
Department of Defense |
|
| 6 | % |
|
| 6 | % |
|
| 5 | % |
|
| 3 | % |
|
| 4 | % |
|
| 5 | % |
Department of State |
|
| 5 | % |
|
| 4 | % |
|
| 6 | % | ||||||||||||
Commonwealth of Puerto Rico |
|
| 4 | % |
|
| 8 | % |
|
| — |
| ||||||||||||
Total |
|
| 32 | % |
|
| 34 | % |
|
| 28 | % |
|
| 34 | % |
|
| 33 | % |
|
| 30 | % |
There was no single commercial client with revenue equal to or greater than seven percent2% of our total revenue for the 2023, 2022, and 2021 fiscal years, 2020, 2019, or 2018.respectively.
Most of our revenue is derived from prime contracts inunder which we work directly for the end customer, whichcustomer. These accounted for approximately 92%89%, 92%91%, and 92%91% of our revenue for 2020, 2019,the 2023, 2022, and 2018,2021 fiscal years, respectively.
Our contract periods typically extend from one month to five years, including option periods. Many of our government contracts provide for option periods that may be exercised by the client. In 2020, 2019,2023, 2022, and 2018,2021, no single contract accounted for more than 5%2%, 9%3%, and 4%2% of our revenue for those fiscal years, respectively. Our 10 largest contracts by revenue collectively accounted for approximately 19%14%, 20%15%, and 18%14% of our revenue in 2020, 2019,the 2023, 2022, and 2018,2021 fiscal years, respectively.
13
International revenues decreased by $41.0 million to $153.5 million for the year ended December 31, 2020 compared to $194.5 million for the year ended December 31, 2019. This decline was primarily the result of COVID-19-driven impacts on programs for clients in Europe and the U.K.15
CONTRACT BACKLOG
CONTRACT BACKLOG
We define total backlog as the future revenue we expect to receive from our contracts and other engagements. We generally include in our total backlog the estimated revenue represented by contract options that have been priced, but not exercised. We do not include any estimate of revenue relating to potential future delivery orders that might be awarded under our U.S. General Services Administration Multiple Award Schedule (“GSA Schedule”) contracts, other Indefinite Delivery/Indefinite Quantity (“IDIQ”) contracts, Master Service Agreements (“MSAs”), or other contract vehicles that are also held by a large number of firms and under which potential future delivery orders or task orders might be issued by any of a large number of different agencies, and are likely to be subject to a competitive bidding process. We do, however, include potential future work expected to be awarded under IDIQ contracts that are available to be utilized by a limited number of potential clients and are held either by us alone or by a limited number of firms.
We include expected revenue in funded backlog when we have been authorized by the client to proceed under a contract up to the dollar amount specified by our client, and this amount will be owed to us under the contract after we provide the services pursuant to the authorization. If we do not provide services authorized by a client prior to the expiration of the authorization, we remove amounts corresponding to the expired authorization from funded backlog. We do include expected revenue under an engagement in funded backlog when we do not have a signed contract, but only in situations when we have received client authorization to begin or continue work and we expect to sign a contract for the engagement. In this case, the amount of funded backlog is limited to the amount authorized. Our funded backlog does not represent the full revenue potential of our contracts because many government clients, and sometimes other clients, authorize work under a particular contract on a yearly or more frequent basis, even though the contract may extend over several years. Most of the services we provide to commercial clients are provided under fully funded contracts and task orders under MSAs. As a consequence, our backlog attributable to these clients is typically reflected in funded backlog and not in unfunded backlog.
We define unfunded backlog as the difference between total backlog and funded backlog. Our estimate of unfunded backlog for a particular contract is based, to a large extent, on the amount of revenue we have recently recognized on the particular contract under the assumption that future utilization will be similar, our past experience in utilizing contract capacity on similar types of contracts, and our professional judgment. Accordingly, if contract utilization is different from our expectations, the revenue eventually earned on a contract may be lower or higher than that implied by our estimate at a point in time or during the life of a contract, of total backlog, including unfunded backlog. Although we expect our total backlog to result in revenue, the timing of revenue associated with both funded and unfunded backlog will vary based on a number of factors, and we may not recognize revenue associated with a particular component of backlog when anticipated, or at all. Our government clients generally have the right to cancel any contract, or ongoing or planned work under any contract, at any time. In addition, there can be no assurance that revenue from funded or unfunded backlog will have similar profitability to previous work or will be profitable at all. Generally speaking, we believe the risk that a particular component of backlog will not result in future revenue is higher for unfunded backlog than for funded backlog.
Our funded and estimates of unfunded and total backlog were as follows at December 31:
|
| 2020 |
|
| 2019 |
|
| 2018 |
| |||||||||||||||
|
| (in millions) |
| |||||||||||||||||||||
(in millions) |
| 2023 |
|
| 2022 |
|
| 2021 |
| |||||||||||||||
Funded |
| $ | 1,522.3 |
|
| $ | 1,268.4 |
|
| $ | 1,140.1 |
|
| $ | 1,775.1 |
|
| $ | 1,786.9 |
| $ | 1,593.5 |
| |
Unfunded |
|
| 1,375.3 |
|
|
| 1,134.3 |
|
|
| 1,237.6 |
|
|
| 2,002.7 |
|
|
| 2,069.3 |
|
| 1,605.4 |
| |
Total backlog |
| $ | 2,897.6 |
|
| $ | 2,402.7 |
|
| $ | 2,377.7 |
|
| $ | 3,777.8 |
|
| $ | 3,856.2 |
| $ | 3,198.9 |
| |
There were no awards included in our 2020, 20192023, 2022, or 20182021 backlog amounts that were under protest.
1416
BUSINESS DEVELOPMENT
Our business development efforts are critical to our organic growth. Our business development processes and systems are designed to enable agility and speed-to-market over the business development life cycle, especially given the distinctions between commercial and government clients. Business development efforts in priority market areas, which include some of our largest federal agency accounts (HHS, DOS, DOE,DoS, DoE, U.S. Department of Transportation, and EPA), are executed through account teams. Each team participates in regular executive reviews of marketing plans and proposal development process.processes. Our non-federal government clients are served by account leaders from operating units and coordinated by senior executivesleaders with industry experience where such coordination is deemed appropriate to enhance our business development success. This account-based approach allows deep insight into the needs of current and future clients. It also helps us anticipate our clients’ evolving requirements over the coming 12 to 18 months and position ourselves to meet those requirements. Each administrative group is responsible for maximizing sales in our existing accounts and finding opportunities in closely relatedclosely-related accounts.
The corporate business development function also includes a market research and competitive intelligence group, a proposal group, and a strategic capture unit. The marketing function engages in brand marketing and strategic marketing program development and execution to raise awareness of our services and solutions across our markets, and to generate leads for further pursuit by sales personnel. The marketing function also executes corporate communications campaigns to support specific lines of business. Our contracts and administration function supports bid price development in partnership with the business development account teams.
COMPETITION
We operate in a highly competitive and fragmented marketplace and compete against a number of firms in each of our clients’ key markets. Some of our principal competitors include: Abt Associates Inc.;Associates; Accenture; AECOM Technology Corporation; Booz Allen Hamilton Holding Corporation; CACI International Inc.; Cambridge Systematics, Inc.; CRA International,CLEAResult Consulting, Inc.; Deloitte LLP; Eastern Research Group, Inc.; Cardno ENTRIX,General Dynamics, Inc.; Guidehouse; L-3 Harris Technologies, Inc.;HORNE; Leidos Holdings, Inc.; Lockheed Martin Corporation; ManTech International Corporation; Northrop Grumman Corporation; Omnicom Group Inc.; PA Consulting Group; Publicis Group; Science Applications International Corp;Corporation; Research Triangle Institute; Tetra Tech Inc.; and Westat, Inc., and WPP Plc. In addition, we have numerous smaller competitors, many of which have narrower service offerings and serve niche markets. Some of our competitors are significantly larger than we are and have greater access to resources and stronger brand recognition than we do.
We consider our principal competitive discriminatorsadvantages to be long-standing client relationships, the good reputation and past performance of the firm, client references, the technical knowledge and industry expertise of our employees, the quality of our services and solutions, the scope and scale of our service offerings, and pricing.
INTELLECTUAL PROPERTY
We own a number of trademarks and copyrights, and internally-developed software that helphelps maintain our business and competitive position. Sales and licenses of our intellectual property do not currently comprise a substantial portion of our revenue or profit. We rely on the technology and models, proprietary processes, and other intellectual property we own or have the rights to use in our analyses and other work we perform for our clients. We use these innovative, and often proprietary, software, analytical models, and tools throughout our service offerings. Our staff regularly maintains, updates, and improves these software, models, and tools based on our corporate experience. In addition, we sometimes retain limited rights in software applications we develop for clients. We use a variety of means to protect our intellectual property.
17
HUMAN CAPITAL
As a professionalglobal advisory and technology services and solutions company,provider, our successhuman capital strategy is vital to our business. Our business depends substantially on attracting, developing, and retaining a highly qualified workforce that is bothprovides excellent, effective, and reflective ofefficient performance reflecting the vast communities we serve. To support these objectives,We have designed our human resources programs are designed to attract, develop and retain talent that representsenable a high-performing, diverse workforce;workforce to reach its full potential. We then develop those personsour employees to prepare them for critical roles; reward and support employees through pay, benefit, and perquisite programs that we believe are competitive; and evolve and invest in technology, tools, and resources to enableempower employees to belong, grow, and thrive at work.ICF.
15
We employ approximately 7,5009,000 employees, 84%86% of whom are employed full-time. These employees hold among them more than 2,300 advanced post-bachelor’s degrees in a wide range of fields that confer the expertise needed to deliver services and solutions to our clients. WeHistorically, we experience employee voluntary turnover that is consistently below industry benchmarks; for 2020 thatbenchmarks. In 2023, our overall company turnover was 11.7%, 14.7% and 11.4% when excluding our on-call staff.compared to a benchmark of 19.2% representing the mix of ICF’s businesses.
Our learningThe results of our employee engagement survey reflect a strong culture that encourages our employees to stay and development program continues togrow a career with ICF. We are proud that 86% of respondents believe their values align with our values, and 87% feel they have a positive business impactflexible schedule that meets their personal needs. Both results were 16% above the industry average for professional services organizations.
Successful talent attraction and support career growth, despite COVID-19, dueretention hinges on a healthy and recognizable employer brand. We leverage digital and social media with an employee-first lens to distinguish us as a named employer of choice. Employee voices and perspectives are at the heart of all we share. In 2023, these efforts delivered 7.7 million brand views of employer brand content and 5.3 million nurture emails to opt-in prospects in our innovative virtualcandidate relationship management system (“CRM” ), ultimately attracting more than 370,000 applicants. In the past year, we have been named on the best place to work lists of both Forbes and Newsweek and a best place to work in Washington, D.C., by Built In, a community for startups and tech companies. We were also named a best place to work for parents by Newsweek.
Once a new hire joins us, we set them up for long-term success with a robust onboarding program, design & delivery. It attainedincluding sessions focused on our purpose and values and required compliance training. To further enhance this experience, new employees may participate in an overall satisfaction rating of 93.1% for 2020. We delivered 17 offerings of our core programsoptional peer coaching program to build people management, project management, client relationship and innovation skills for over 1,000 employees. An additional 2,400connect with other employees throughout their first year. Over 750 employees participated in online learning in a self-paced program. The mentorship program grew in 2020, supporting over 400 mentor/mentee relationships. Wherever possible we promote from within, and in 2020 we promoted 11.2% of our employees.peer coaching throughout 2023, with 98% rating the experience as “Very Helpful”.
Making our company a welcoming and professionally rewarding workplace for all is a fundamental goal of our approach toOur diversity, equity, and inclusion objectives include attracting engaged, diverse talent and perspectives to build a workplace culture that fosters inclusivity and reflects our communities. This year, we continued to grow our eight Employee Community Networks (“DE&I”ECNs”). to enable internal and external community-building, networking, mentoring, professional development, and business impact. Our approachAsian, Black, Diverse Abilities, First Nations Indigenous People, Hispanic/Latinx, LGBTQIA+, Women, and Veterans ECNs provide forums for employees and allies with similar characteristics, interests, and goals to DE&I becomes more formalized every year, andconnect. We are proud that about 25% of our employees participate in 2020 we hired our first full-time leader for DE&I across the company. In 2020, weat least one ECN. We also continued our history of gender equity, with 56% of our employees identifying as female. Within55% of our people managers and 40% of our executives are female. 36% of our U.S. employees 21% classify themselvesself-identify as non-white, with the largest classifications being 11% Asian, 11% Black, and 7%9% Hispanic.
This commitment is garnering attention externally. We made Forbes’ “America's Top 500 Best Employers for Diversity” list again in 2023, our third year in a row, ranking #14 (from #16 in 2022 and #127 in 2021).
Another pillar of culture and retention is helping our employees to achieve personal and career success. In 2023, we delivered digital and instructor-led programs to build skills in various areas, including leadership inclusion, people management, project management, business development, finance, technology, and innovation skills. To increase enterprise-wide access to industry-leading content, we also partner with LinkedIn Learning, Udemy, and Microsoft for digital learning in self-paced programs. More than 164,000 hours of learning were consumed across these platforms in 2023.
18
Our annual mentoring program, Mentor Connect, had its largest cohort in 2023, with nearly 650 mentoring pairs. This year’s key focus area was to continue building our pipeline of tomorrow’s leaders. We expanded our leadership development curriculum and were able to triple our reach to emerging leaders. In 2023, we had 410 seats allocated for leadership development programs at various career stages.
Another area of employee development is our intentional culture of continuous coaching and feedback through our Impact Conversations program. In addition, our anytime feedback initiative and appreciation programs empower employees to receive (and give) feedback or kudos from peers, managers, and leaders at any point during the year. In 2023, 99% of eligible employees received a performance appraisal with feedback from their manager on their 2022 performance.
Lastly, we enable employees to thrive personally and professionally, encouraging and empowering them to adopt mentally and physically healthy lifestyles. When our employees are at their best, it impacts how they engage at work, their families, and their communities. In 2023, we continued to encourage the importance of holistic wellbeing through our Be Well platform, with 41% of eligible employees enrolled. We conducted ten company-wide challenges and led eleven global wellbeing-focused webinars with topics including “Creating a Healthier Lifestyle,” “Eating for Heart Health,” “Beyond Worry – Supporting Yourself and Others,” “Suicide Prevention,” “Financial Freedom,” and more.
REGULATION
We provide our services to U.S. federal, and state and local governments, as Black. Of ICF’s managers, 50%well as international government clients, and we are female,therefore subject to certain laws and regulations. Our failure to comply with the complex laws, rules, and regulations applicable to us could cause us to lose business and subject us to a variety of penalties and sanctions. Additionally, we are subject to various routine and non-routine governmental and other reviews, audits, and investigations, the results of which could affect our operating results and also subject us to penalties and sanctions. See “Item 1A. Risk Factors - Compliance Risks” for a more detailed description of the Executive Leadership Team, 39% are female or minority.regulatory and compliance risks we face.
19
ITEM 1A. RISK FACTORS
|
|
The following discussion of “risk factors” sets forth some of the most materialsignificant factors that may adversely affect our business, operations, financial position or future financial performance, reputation, and/or value of our stock. This information should be read in conjunction with the description of our business, Management’s Discussion and Analysis, and the consolidated financial statements and related notes contained in this Annual Report on Form 10-K. Because of the following factors, as well as other factors, whether known or unknown, affecting our business, operations, financial position or future financial performance, reputation, and/or value of our stock, past financial performance should not be considered to be a reliable indicator of future performance, and investors should not use historical trends to anticipate results or trends in future periods.
GOVERNMENT BUDGETING AND SPENDING PRIORITIES RISKS
The failure of Congress to approve appropriations bills in a timely manner for the federal government agencies and departments we support, or the failure of the Administration and Congress to reach an agreement on fiscal issues, could delay and reduce spending, cause us to lose revenue and profit, and affect our cash flow.
On an annual basis, Congress is required to approve appropriations bills that govern spending by each of the federal government agencies and departments we support. When Congress is, or Congress and the current presidential administration (the “Administration”)Administration are, unable to agree on budget priorities or specifics, and thus unable to pass annual appropriations bills on a timely basis, Congress typically enacts a continuing resolution. Continuing resolutions generally allow federal government agencies and departments to operate at spending levels based on the previous fiscal year. When agencies and departments operate on the basis of a continuing resolution, funding we expect to receive from clients for work we are already performing and for new initiatives may be delayed or cancelled.canceled. Congress and the Administration have from time to time failed to agree on a continuing resolution, resulting in temporary shutdowns of non-essential federal government functions and our work on such functions. Thus, the failure by Congress and the Administration to enact appropriations bills in a timely manner can result in the loss of revenue and profit when federal government agencies and departments are required to cancel or change existing or new initiatives or the deferral of revenue and profit to later periods due to shutdowns or delays in implementing existing or new initiatives. There is also the possibility that Congress will fail to raise the U.S. debt ceiling when necessary. This can also resultnecessary which, in addition to resulting in federal government shutdowns.shutdowns, could significantly impact the U.S. and global economy, affecting the discretionary spending decisions of our non-governmental clients and affecting the capital markets and our access to sources of liquidity on terms that are acceptable to us. The delayed funding or shutdown of many parts of the federal government, including agencies, departments, programs, and projects we support, could have a substantial negative affect on our revenue, profit, and cash flows.
Budget compromises that may be needed for future fiscal years may continue to be extraordinarily difficult given the complicated grassroots political environment, a closely divided Congress, a new Administration, an increasing federal deficit and debt load, the continuing COVID-19 pandemic, and a challenged economy.
16
The budgets of many of our state and local government clients are also subject to similar divisions, and similar risks, and uncertainties as are inherent in the federal budget process.
20
Government spending priorities may change in a manner adverse to our business.
We derived approximately 44%55%, 38%55%, and 41%47% of our revenue in 2020, 2019,2023, 2022, and 2018,2021, respectively, from contracts with federal government clients, and approximately 21%, 27%21%, and 23%24% of our revenue from contracts with state and local governments and international governments in 2020, 2019,2023, 2022, and 2018,2021, respectively. Expenditures by our federal government clients may be restricted or reduced by Administration or Congressional actions, by action of the Office of Management and Budget, by action of individual agencies or departments, or by other actions. In addition, many state and local governments are not permitted to operate with budget deficits, and nearly all state and local governments are now facing face considerable challenges in balancing their budgets. Accordingly, we expect that, due to changing government budgeting and spending priorities, including necessary balancing of defense spending with civilian agency spending, and related disputes among Congress and the Administration, some of our government clients in the future may delay payments due to us, may eventually fail to pay what they owe us, and/or may delay certain programs and projects. For some government clients, we may face a difficult choice: turn down (or stop) work due to budget uncertainty with the risk of damaging a valuable client relationship or perform work with the risk of not being paid in a timely fashion or perhaps at all. Federal, state and local government, and /orand/or international government elections could also affect spending priorities and budgets at all levels of government. In addition, increased government deficits and debt, both domestic and international, may lead to reduced spending by agencies and departments on projects or programs we support.
Risks Related to THE Changing Business ENVIRONMENT IN WHICH WE OPERATE
We face various risks related to health epidemics, pandemics and similar outbreaks, which may have material adverse effects on our business, financial position, results of operations and/or cash flows.
We face various risks and uncertainties related to health epidemics, pandemics and similar outbreaks, including the global pandemic resulting from the outbreak of COVID-19. These risks relate to, among other things, the demand for our services, the availability of our staffing and business partners, a possible slowdown of client decision-making as to our services, a significant deterioration of global supply chain and other business conditions, and a possible reprioritization of spending by our clients.
We serve both government and commercial clients around the globe, with our services concentrated in the U.S. and Europe, both of which have experienced severe levels of COVID-19 illness. The effects of the pandemic on client needs, priorities, spending patterns and decision-making can have a material effect on our activity levels and revenues.
The pandemic may also affect significant portions of our workforce, and that of our subcontractors and other suppliers and business partners, who may be unable to work effectively due to illness, lockdowns and quarantines, facility closures, travel restrictions or other government actions and reasons in connection with the COVID-19 pandemic. As a result, our operations and operating results could be adversely affected by factors such as an inability to perform fully or efficiently on our contracts, and some of our costs may not be fully recoverable or be adequately covered by insurance.
It is possible that the spread of COVID-19 may also cause delays in the willingness or ability of clients to perform, including making timely payments to us, and other unpredictable events.
In addition, volatility in the global capital markets that may result from the pandemic and related business conditions could restrict our access to capital and/or increase our cost of capital.
We continue to work with our stakeholders (including customers, employees, subcontractors and other suppliers and business partners) to assess, address and mitigate the impact this global pandemic. While efforts have been made to curtail the pandemic, at this time given potential new strains and challenges with vaccination rollouts, we cannot predict the continuing impact of the COVID-19 pandemic, but it could have a material adverse effect on our business, financial position, results of operations and/or cash flows.
17
As we develop new services, clients and practices, enter new lines of business, and focus more of our business on providing a full range of client solutions, our operating risks increase.
As part of our corporate strategy, we are attempting to leverage our advisory services to sell our full suite of services across the life cycle of a policy, program, project, or initiative and we are regularly searching for ways to provide new services to clients. In addition, we plan to extend our services to new clients, lines of business, and selected geographic locations, including outside the U.S., and to seek out cross-border opportunities. As we focus more on our delivery of a full range of consulting services from advisory through implementation and attempt to develop new services, clients, practice areas, and lines of business, these efforts could be unsuccessful and adversely affect our results of operations.
Such growth efforts place substantial additional demands on our management and staff, as well as on our information, financial, cash flow, and administrative and operational systems. We may not be able to manage these demands successfully. Growth may require increased recruiting efforts, business development, and selling, marketing and other actions that are expensive and increase risk. We may need to invest more in our people and systems, controls, compliance efforts, policies, and procedures than we anticipate. Further, we may need to enhance or modify our systems or processes, or transition to more efficient or effective ones, and these changes and how we handle them may impact the business. Therefore, even if we do grow, the demands on our people and systems, controls, compliance efforts, policies, and procedures may adversely affect the quality of our work, our operating margins, and our operating results, at least in the short-term, and perhaps in the long-term.
Efforts involving a different focus, new services, new clients, new practice areas, new lines of business, and increasing internationalization include risks associated with our inexperience and competition from mature participants in those areas. Our expansion of services may result in decisions that could harm our profit and operating results. In particular, implementation and improvement services often relate to the development, implementation, and improvement of critical infrastructure or operating systems that our clients may view as “mission critical.”critical”. If we fail to satisfy the needs of our clients in providing these services, we could incur reputational damage and clients could claim significant costs and losses for which they could seek compensation from us.
21
RISKS RELATED TO THE GOVERNMENT CONTRACTS BUSINESS
Maintaining our client relationships and professional reputation areis critical to our ability to successfully win new contracts and renew expired contracts.
Our client relationships and professional reputation are key factors in maintaining and growing our business, revenue, and profit levels under contracts with our clients. We continually bid for and execute new contracts, and our existing contracts regularly become subject to re-competition and expiration. If we are not able to replace the revenue from these contracts, either through follow-on contracts or new contracts for those requirements or for other requirements, our revenue and operating results may be adversely affected. On the expiration of a contract, we typically seek a new contract or subcontractor role relating to that client to replace the revenue generated by the expired contract. There can be no assurance that those expiring contracts we are servicing will continue after their expiration, that the client will re-procure those requirements, that any such re-procurement will not be restricted in a way that would eliminate us from the competition (e.g., set asides for small businesses), or that we will be successful in any such re-procurements or in obtaining subcontractor roles. Any factor that diminishes client relationships and/or professional reputation with federal, state and local, and international government clients, as well as commercial clients, could make it substantially more difficult for us to compete successfully for new engagements and qualified employees. To the extent our client relationships and/or professional reputation deteriorate, our revenue and operating results could be adversely affected.
The diversity of the services we provide, and the clients we serve, may create actual, potential, and perceived conflicts of interest and business conflicts that limit our growth and could lead to potential liabilities for us.
Because we provide services to a wide array of both government and commercial clients, occasions arise where, due to actual, potential, or perceived conflicts of interest or business conflicts, we cannot perform work for which we are qualified. A number of our contracts contain limitations on the work we can perform for others, for example, when we are assisting a government agency or department in developing regulations or enforcement strategies. Actual, potential, and perceived conflicts limit the work we can do and, consequently, can limit our opportunity for growth and adversely affect our operating results. In addition, if we fail to address actual or potential conflicts properly, or even if we simply fail to recognize a perceived conflict, we may be in violation of our existing
18
contracts, may otherwise incur liability, may lose future business for not preventing the conflict from arising, and our reputation may suffer. Particularly as we continue to grow our commercial business, we anticipate that conflicts of interest and business conflicts will pose a greater risk.
We derive significant revenue and profit from contracts awarded through a competitive bidding process, which can impose substantial costs on us, and we will lose revenue and profit if we fail to compete effectively.
We derive significant revenue and profit from contracts that are awarded through a competitive bidding process.processes. Competitive bidding imposes substantial costs and presents a number of risks, including the:
| • Substantial cost and managerial time and effort that we spend to prepare bids and proposals; • Need to estimate accurately the resources and costs that will be required to service any contracts we are awarded, sometimes in advance of the final determination of their full scope; • Expense and delay that may arise if our competitors protest or challenge awards made to us pursuant to competitive bidding, as discussed elsewhere; and • Opportunity cost of not bidding on and winning other contracts we may have otherwise pursued.
|
|
|
|
|
|
|
|
To the extent we engage in competitive bidding and are unable to win particular contracts, we not only incur substantial costs in the bidding process that negatively affect our operating results, but we may lose the opportunity to operate in the market for the services provided under those contracts for a number of years. Even if we win a particular contract through competitive bidding, our profit margins may be depressed, or we may even suffer losses as a result of the costs incurred through the bidding process and the need to lower our prices to overcome competition.
22
Our reliance on GSA Schedule and other IDIQ contracts creates the risk of volatility in our revenue and profit levels.
We believe that one of the elements of our success is our position as a prime contractor under GSA Schedule contracts and other IDIQ contracts, and we believe this position is important to our ability to sell our services to federal government clients. However, these contract vehicles require us to compete for each delivery order and task order, rather than having a more predictable stream of activity during the term of a multi-year contract. In addition, we may spend considerable cost and managerial time and effort to prepare bids and proposals for contracts, delivery orders or task orders that we may not win. There can be no assurance that we will continue to obtain revenue from such contracts at current levels, or in any amount, in the future. To the extent that federal government agencies and departments choose to employ GSA Schedule contracts and other IDIQ contracts encompassing activities for which we are not able to compete or provide services, we could lose business, which would negatively affect our revenue and profitability.
We may not receive revenue corresponding to the full amount of our backlog, or may receive it later than we expect, which could adversely affect our revenue and operating results.
The calculation of backlog is highly subjective and conditioned on numerous uncertainties and estimates, and there can be no assurance that we will in fact receive the amounts we have included in our backlog. Our assessment of a contract’s potential value is based on factors such as the amount of revenue we have recently recognized on that contract under the assumption that future utilization will be similar, historical trends and our experience in utilizing contract capacity on similar types of contracts, and our professional judgment. In the case of contracts that may be renewed at the option of the client, we generally calculate backlog by assuming that the client will exercise all of its renewal options; however, the client may elect not to do so. In addition, federal government contracts rely on Congressional appropriation of funding, which is typically provided only partially at any point during the term of federal government contracts, and all or some of the work to be performed under a contract may require future appropriations by Congress and the subsequent allocation of funding by the procuring agency or department to the contract.
Protests of contracts continue to be common in our industry. We do not include contract awards that are subject to a pending protest in our calculation of backlog. If a contract previously included in backlog becomes the subject of a protest, we would adjust backlog to remove that amount and reassess following resolution of the protest.
Our estimate of the portion of backlog that we expect to recognize as revenue in any future period may differ from actual results because the receipt and timing of this revenue often depends on subsequent appropriation and allocation of funding and is subject to various contingencies, such as timing of task orders and delivery orders, many of which are beyond our control. In addition, we may never receive revenue from some of the engagements that are included in our backlog, and this risk is greater with respect to unfunded backlog. Although we adjust our backlog to
19
reflect modifications to or renewals of existing contracts, awards of new contracts, or approvals of expenditures, if we subsequently fail to realize revenue corresponding to our backlog, our revenue and operating results could be adversely affected.
Our contracts may contain provisions that are unfavorable to us and permit our clients to, among other things, terminate our contracts partially or completely at any time prior to completion.
Our contracts may contain provisions that allow our clients to terminate or modify these contracts at their convenience on short notice. If a client terminates one of our contracts for convenience, we shouldwould only bill the client for work completed prior to the termination, plus any commitments and settlement expenses that we may claim and the client agrees to pay, but not for any work not yet performed. In addition, many of our government contracts and task and delivery orders are incrementally funded as appropriated funds become available. The reduction or elimination of such funding can result in contract options not being exercised and further work on existing contracts and orders being curtailed. In any such event, we likely would have no right to seek lost fees or other damages. In addition, certain contracts with international government clients may have more severe and/or different contract clauses than what we are accustomed to with federal and state and local government clients, such as penalties for any delay in performance. If a client were to terminate, decline to exercise options under, or curtail further performance under one or more of our major contracts, our revenue and operating results could be adversely affected.
23
Our relationships with other contractors are important to our business and, if disrupted, could cause us damage.
We derive a portion of our revenue from contracts under which we act as a subcontractor or from “teaming” arrangements in which we and other contractors jointly bid on particular contracts, projects, or programs. As a subcontractor or team member, we often lack control over fulfillment of a contract. Poor performance on the contract, whether resulting from our performance or the performance of another contractor, could tarnish our reputation, result in a reduction of the amount of our work under, or termination of, that contract or other contracts, and cause us to not obtain future work, even when we perform as required. Moreover, our revenue, profit and operating results could be adversely affected if any prime contractor or teammate does not pay our invoices in a timely fashion, chooses to offer products or services of the type that we provide, teams with other companies to provide such products or services, or otherwise reduces its reliance upon us for such products or services.
PROFITABILITY RISKS
If we are unableOur inability to accurately estimate andor control our contract costs then we may incur losses on our fixed price contracts which couldmay result in a decrease of our operating margins, and reduce our profits. In particular, the unpredictability of our earnings could increase on our fixed-price contracts if we cannot accurately estimate and control ourin some cases result in contract costs.losses.
It is important for us to accurately estimate and control our contract costs and maintain positive operating margins and profitability. As described elsewhere in this Form 10-K, we generally enter intohave three principal types of contracts with our clients: fixed-price, time-and-materials and cost-based.
We derived 35%45%, 38%45%, and 39%41% of our total revenue from fixed-price contracts 2020, 2019,in 2023, 2022, and 2018,2021, respectively. Under fixed-price contracts, we receive a fixed price irrespective of the actual costs we incur and, consequently, we are exposed to a number of risks. We realize a profit on fixed-price contracts only if we can control our costs and prevent cost overruns while also meeting contract requirements. Fixed-priceour contractual obligations.
Revenue recognition on fixed-price contracts requirerequires us to make cost and scheduling estimates that are based on a number of assumptions, including thoseassumptions about future economic conditions, costs, and availability of labor, equipment, materials, change in contractual scope, and materials,future economic conditions, among others. While estimates are inherently subjective and other exigencies. We couldoften change, we may experience contract cost overruns if these estimates are inaccurate as a result of errors or ambiguities in the contract specifications, or become inaccurate as a result of a change in circumstances following the submission of the estimate dueour inability to among other things,meet service-level agreements, inflationary pressures, high demand for skilled labor, unanticipated technical problems, difficulties in obtaining permits or approvals, changes in local laws or labor conditions, weather delays, or the inability of our vendors or subcontractors to perform. Ifperform, or for other reasons. Contract cost overruns occur, we could experience reduced profits or,that are not reimbursed by our customers, would result in some cases, a loss for that project. If aproject and, if the project is significant or if there are one or more common issues that impact multiple projects costsare impacted, such aggregate overruns could increase the unpredictability of our earnings, as well asmay have ana material adverse impact on our business and earnings.
Certain lines of business of our commercial work depend on certain sectors of the global economy that are highly cyclical, which can lead to substantial variations in our revenue and profit from period to period.
In recent years, we have expanded our work with commercial clients. Our commercial clients, which include clients outside the U.S., generated approximately 35%24%, 35%24%, and 36%29% of our revenue in 2020, 2019,2023, 2022, and 2018,2021, respectively. This reliance on commercial clients presents certain risks and challenges. For example, our commercial work is heavily concentrated in industries which can be cyclical, such as: energy, air transportation, environmental, retail and financialenvironmental services. Demand for our services from our commercial clients has historically declined when their industries have experienced downturns, and we expect a decline in demand for our services when these industries or their customer bases experience downturns in the future.
24
Our efforts to become involved in engagements that are greater in terms of size, scope and performance demands may result in increased performance and credit risk.
As we expand our national and global footprint, we may become involved in a greater number of engagements that will be larger in size, and scope and more international.complexity. The increase in size, scope, and scopecomplexity of the engagements in which we become involved in subjects us to the potential for a larger impact of performance risk associated with larger and more challenging engagements and the credit risk associated with certain larger customers, particularly among our commercial non-U.S. government and non-federal U.S. government clients.Our customers may face unexpected circumstances that adversely impact their ability to pay their trade payables to us and we may face
20
unexpected borrowing needs or losses as a result. Such circumstances could lead to our commercial customers filing for bankruptcy. This can ultimately lead to variations in our profit from period to period. We regularly monitor the aging of receivables regularly and make assessments of the ability of customers to pay amounts due.
Our business could be adversely affected by delays caused by our competitors protesting contract awards received by us, which could stop our work. Likewise, we may protest the contracts awarded to some of our competitors, a process that takes the time and energy of our management and we may incurresult in additional legal and consultant costs.
Due in part to the competitive bidding process under which government contracts are awarded, we are at risk of incurring expenses and delays if one or more of our competitors protest contracts awarded to us. Contract protests remain common in our industry and may result in a requirement to resubmit offers for the protested contract or in the termination, reduction, or modification of the awarded contract. It can take many months to resolve contract protests and, in the interim, the contracting government agency or department may suspend our performance under the contract pending the outcome of the protest. Even if we prevail in defending the contract award, the resulting delay in the startup and funding of the work under these contracts may adversely affect our operating results.
Moreover, in order to protect our competitive position, we may protest the contract awards of our competitors. This process takes the time and energy of our executives and employees, is likely to divert management’s attention from other important matters and could cause us to incur additional legal and consultant costs.
Changes to U.S. tax laws may adversely affect our financial condition or results of operation and create the risk that we may need to adjust our accounting for these changes.
The Tax Cuts and Jobs Act (the “Tax Act”), enacted in late 2017, made significant changes to U.S. tax laws and included numerous provisions that affect businesses, including ours. For instance, as a result of lower corporate tax rates, the Tax Act tends to reduce both the value of deferred tax assets and the amount of deferred tax liabilities. It also limits interest rate deductions and the amount of net operating losses that can be used each year and alters the expensing of capital expenditures. Other provisions have international tax consequences for businesses like ours that operate internationally.
The new Administration in the U.S. is widely expected to propose changes to federal taxation, particularly of businesses and high net worth individuals. These potential changes and their impact have not yet been proposed and will likely generate considerable debate, and the timing of any changes is uncertain.
COMPLIANCE RISKS
Our failure to comply with complex laws, rules, and regulations could cause us to lose business and subject us to a variety of penalties and sanctions.
We must comply with laws, rules, and regulations that affect how we do business with our government clients and impose added costs on our business. Each government client has its own laws, rules, and regulations that affect its contracts. Some of the more significant laws and regulations affecting the formation, administration, and performance of U.S. government contracts include:
|
|
|
|
|
|
|
|
|
|
|
|
Any failure to comply with applicable federal, and/or state and local government laws, rules and regulations could subject us to civil and criminal penalties and administrative sanctions, including termination of contracts, repayment of amounts already received under contracts, forfeiture of profits, suspension of payments, fines, and suspension or debarment from doing business with federal and/or state and local government agencies and departments, any of which could adversely affect our reputation, our revenue, our operating results, and/or the value of our stock.
21
In addition, the federal government and other governments with which we do business may change their procurement practices or adopt new contracting laws, rules, or regulations that could be costly to satisfy or that could impair our ability to obtain new contracts and reduce our revenue and profit, such as curtailing the use of services firms or increasing the use of firms with a “preferred status,” such as small businesses.
In addition to our U.S. operations, we also have a significant presence in key markets outside the U.S., including offices in the U.K., Belgium, China, India, and Canada. Failure to abide by laws, rules and regulations applicable to us because of our work outside the U.S., such as the U.K. Bribery Act and European Union’s General Data Protection Regulation, could have similar effects to those described above.
We are subject to various routine and non-routine governmental and other reviews, audits and investigations, and unfavorable results could force us to adjust previously reported operating results, could affect future operating results, and could subject us to a variety of penalties and sanctions.
Government departments and agencies we work for, including non-U.S., U.S. federal, and many state and local government clients, review, audit and investigate our contract performance, pricing practices, cost structure, financial capability, and compliance with applicable laws, rules, and regulations. We have experienced growth in services related to disaster recovery in recent years, and those activities, by their nature, may become politicized and involve interaction with multiple tiers of national, state, territorial and local governments, subcontractors, and citizens that increase the risk of claims, audits, investigations, reviews, monitoring and litigation. Any of these reviews, audits and investigations could raise issues that have significant adverse effects, including, but not limited to, delayed payments, substantial adjustments to our previously reported operating results and substantial effects on future operating results. If a government review, audit, or investigation uncovers improper or illegal activities, we may be subject to civil and criminal penalties and administrative sanctions, including termination of contracts, repayment of amounts already received under contracts, forfeiture of profits, suspension of payments, fines, and suspension or debarment from doing business with government agencies and departments, any of which could adversely affect our reputation, our revenue, our operating results, and/or the value of our stock. In addition, we could suffer serious harm to our reputation and our stock price could decline if allegations of impropriety are made against us, whether true or not.
Federal government audits have been completed on our incurred contract costs only through 20112019 for our NIH-cognizant indirect rates and 2014through 2015 for our United States Agency for International Development (“USAID”) cognizantUSAID-cognizant indirect rates, and auditsrates. Audits for costs incurred on work performed since then have not yet been completed. In addition, non-audit reviews may still be conducted on all of our government contracts, even for periods before 2011.2015.
Litigation, claims, disputes, audits, reviews, and investigations in connection with the completed Road Home contract expose us to many different types of liability, may divert management attention, and could increase our costs.
In June 2006, our subsidiary, ICF Emergency Management Services, LLC (“ICF Emergency”), was awarded the Road Home contract by the State of Louisiana, Office of Community Development (the “OCD”), to manage a program designed primarily to help homeowners and landlords of small rental properties affected by Hurricanes Rita and Katrina by providing them compensation for the uninsured, uncompensated damages they suffered from the hurricanes (the “Program”). With an aggregate value of $912 million, the Road Home contract was our largest contract throughout its three-year duration, which ended on June 11, 2009.
The Road Home contract provided us with significant opportunities, but also created substantial risks. A number of these risks continued beyond the term of the contract. We still have lawsuits pending, and other claims have been made against us in connection with this contract. New lawsuits may be filed, and new claims may be made against us in the future including, but not limited to, claims by subcontractors and others who are dissatisfied with the amount of money they have received from, or their treatment under, the Program. We have defended such lawsuits and claims vigorously and plan to continue to do so, but we may not prevail in future cases. Although the contract provides that, with several exceptions, we are allowed to charge, as an expense under the contract, reasonable costs and fees incurred in defending and paying claims brought by third parties arising out of our performance, there can be no assurance that our legal costs and fees will be reimbursed. The State of Louisiana has not reimbursed us for the majority of such costs or fees and has not reimbursed any such costs or fees since 2008. The outstanding contract receivables related to defending and paying claims were fully reserved as of December 31, 2020.
22
In addition, as discussed in “Note 2025
– Commitment andContingencies – Road Home Contract” in our financial statements, on June 10, 2016, the OCD filed a written administrative demand (the “Administrative Demand”) with the Louisiana Commissioner of Administration against ICF Emergency in connection with the administration of the Program. In its administrative demand, the OCD sought approximately $200.8 million in alleged overpayments to Program grant recipients. The OCD separately supplemented the amount of recovery it is seeking in total approximately $220.2 million. The State of Louisiana, through the Division of Administration, also filed suit (the “Proceeding”) in Louisiana state court on June 10, 2016 broadly alleging and seeking recoupment for the same claim made in the Administrative Demand. On September 21, 2016, the Commissioner of the Division of Administration notified the OCD and the Company of his decision to defer jurisdiction of the Administrative Demand. In so doing, the Commissioner declined to reach a decision on the merits, stated that his deferral would not be deemed to grant or deny any portion of the OCD’s claim, and authorized the parties to proceed on the matter in the Proceeding. The Company continues to believe that neither the Administrative Demand nor the Proceeding has any merit, intends to vigorously defend its position, and has therefore not recorded a liability as of December 31, 2020.
The Road Home contract may continue to be the subject of audit, investigations, and reviews by federal and state government authorities and their representatives. These activities may consume significant management time and effort. Further, the contract provides that we are subject to audits for a period after the date of the last payment made under the contract. Findings from any audit, investigation, review, monitoring, or similar activity could subject us to civil and criminal penalties and administrative sanctions from federal and state government authorities, which could substantially adversely affect our reputation, our revenue, our operating results, and the value of our stock.
INTERNATIONAL OPERATIONS RISKS
Our international operations pose additional risks to our profitability and operating results.
We have offices in the U.K., Belgium, China, India, and Canada, among others, and expect to continue to have international operations and offices, some of which are in underdeveloped countries that do not have a well-established business infrastructure. We also perform work in some countries where we do not have a physical office. Some of the countries in which we work have a history of political instability or may expose our employees and subcontractors to physical danger over and above pandemic-related risk. Expansion into selective new geographic regions requires considerable management and financial resources, the expenditure of which may negatively impact our results, and we may never see any return on our investment.
Our international operations are subject to risks associated with operating in, and selling to and in, countries other than the U.S., that could, directly or indirectly, adversely affect our international and domestic operations and our overall revenue, profit, and operating results including, but not limited to:
|
|
|
|
|
|
|
|
|
|
In addition, because of our work with international clients, certain of our revenues and costs are denominated in other currencies, then translated to U.S. dollars for financial reporting purposes. Our revenues and profits may decrease as a result of currency fluctuations and devaluations and limitations on the conversion of foreign currencies into U.S. dollars and in the conversion between foreign currencies. We currently have forward contract agreements (“hedges”) related to our operations in the U.K., hedging the remeasurement between the Euro and the pound sterling. We recognize changes in the fair-value of the economic hedges in our results of operations. We may increase the number, size and scope of our hedges as we analyze options for mitigating our foreign exchange risk. We cannot be sure that our hedges will be successful in reducing the risks to us of our exposure to foreign currency fluctuations and, in fact, the hedges may adversely affect our operating results.
23
Our business in the U.K. and the European Union could be negatively affected by the terms of, and uncertainties related to, the U.K.’s exit from the European Union and other potential developments in the European Union.
Our U.K. and Belgian operations have traditionally serviced most of our European clients, including the European Commission, and there has been, and remains, a risk that these operations could be disrupted by the withdrawal of the U.K. from the European Union (“E.U.”), often referred to as “Brexit.”
The U.K.’s withdrawal from the E.U. became effective on January 31, 2020 but was subject to a transition period that lasted until December 31, 2020, when a new U.K./E.U. trade agreement became effective. Consistent with the political declaration that accompanied the withdrawal treaty, the new trade deal preserves significant elements of “free trade” between the U.K. and the EU. However, such an exit from the E.U. is unprecedented. It remains uncertain how the commercial, legal, regulatory and tax environment in which we, our customers and our counterparties operate will be affected by Brexit. Among the many necessary changes, the U.K. will have its own customs territory and set its own tariffs. The new trade deal is relatively undeveloped in terms of trade in services, which could affect our ability to provide services into the E.U. from the U.K.
The challenges that continue to surround the terms of the U.K.’s exit from the E.U. and its consequences could adversely impact customer and investor confidence and relationships, result in additional market volatility and adversely affect our businesses and results of operations. These effects have and could continue to derive from delays or reductions in contract awards, canceled contracts, increased costs, fluctuations in exchange rates, difficulty in recruiting or in gaining permission to employ existing staff, difficulty in supply services across the E.U.-U.K. border, or less favorable payment terms.
There also remains the possibility of further political and constitutional changes within the U.K., specifically in relation to Scotland or Northern Ireland (which is accorded a special status with enhanced access to the E.U. Single Market under the withdrawal Treaty), with different but significant consequences. Further changes to the functioning model of the E.U. could result in a reduction in the financial resources of the European Commission that could lead to a decrease in the funding and scope of our work for that client. In addition, security and sovereignty and financial system stability issues resulting from Brexit or other geopolitical events, or the E.U. actions driven by those events, could change the current balance of responsibility established between the European Commission and member states, or affect the results of the E.U. budget-setting process, either of which could also reduce the funding and scope of our work for that client.
PRIVACY, CYBERSECURITY, TECHNOLOGY, AND TECHNOLOGYDATA PROTECTION RISKS
Our operations face continuous and evolving cybersecurity risksrisks.
The continued occurrence of high-profile data breaches of other companies provides evidence of an external environment hostile to information security. In particular, cybersecurity attacks are evolving,increasing in number and wesophistication for the Company.
We face thea constant risk of cybersecurity threats, whether from deliberate attacks or unintentional events, including computer viruses, attacks by computer hackers, malicious code, cyber and phishing attacks, and other electronic security breaches includingsuch as unauthorized access to our and our clients’ systems, thatsystems. Any of these could lead to disruptions in critical systems, unauthorized releasereleases of confidential or otherwise protected information, and/or corruption of data. The so-called “insider threat,” the introduction of unauthorized data and changes being introduced into systems by employees and contractors, is an increasingly present risk to be managed.
As a federal government contractor, we face a heightened risk of a security breach or disruption with respect to personally identifiable, controlled unclassified information, classified, or otherwise protected data resulting from an attack by computer hackers, foreign governments, and/or cyber terrorists. Improper disclosure of this information could harm our reputation and affect our relationships with business partners, lead to legal exposure, or subject us to liability under laws, rules, and regulations that protect personal or other confidential data, resulting in increased costs or loss of revenue.
Although we devote significant resources to our cybersecurity programs and have implemented security measures to protect our systems and to prevent, detect, and respond to cybersecurity incidents, we have been the target of these types of attacks in the past. We have not identified a material adverse impact on our business or our financial results, individually or in the aggregate, due to being the target of prior cyber attacks. While we are committed to threat detection and mitigation efforts to reduce such impact, there can be no assurance that our efforts will prevent these threats. such attacks or their impact in the future.
As these security threats continue to evolve, we may be required to devote additional resources to protect, prevent, detect, and respond against cybersecurity attacks, system disruptions, and security breaches. Moreover, we also rely in part on third-party software and information technology vendors to run our information systems. Any failure of these third-party systems, which are outside of our control but still impact us, could have similar adverse effects.
2426
Impermissible use, misuse or an improper disclosure of personal data or confidential information and breaches of, or disruptions to, our information technology systems or those of our third-party providers, could adversely affect our business and could result in liability and harm to our reputation.
We and our vendors process increasingly large amounts of personal and sensitive personal data (collectively, “Personal Data”) concerning our existing and potential employees, clients, client customers, vendors, or other third parties (collectively, “Data Subjects”), as well as handle confidential information on our clients’ behalf. Therefore, we must ensure that we, as well as our vendors, can comply and demonstrate compliance with the various countries’ and U.S. states’ privacy and data protection laws, rules, and regulations (collectively, “Privacy and Data Protection Law(s)”) in any geolocationlocation where we or our vendors process Data Subjects’ Personal Data. Privacy and Data Protection Laws often vary significantly, and the changes to existing laws and adoption of new, more rigorous laws occurs on an increasing basis. For example, the European Union’s 2018(“E.U.”) General Data Protection Regulation (“GDPR”) requires us to meet stringent requirements regarding (i) our access, use, disclosure, transfer, protection, or otherwiseother processing of Personal Data; and (ii) the ability of Data Subjects’Subjects to exercise their related various rights such as to access, correct, or delete their Personal Data. The 2018 California Consumer Privacy Act (“CCPA”), which went into effect January 2020, now imposes similar requirements,requirements. New privacy laws in California, Colorado, Virginia, and other U.S. states willtook effect in 2023, with others likely to follow. Several privacy bills have also been introduced in Congress. Key markets in the Asia-Pacific region have also recently adopted GDPR-like legislation, including China’s new Personal Information Protection Law. Failure to meet Privacy and Data Protection Law requirements could result in significant civil penalties (including under GDPR) fines up to 4% of annual worldwide revenue under the GDPR) as well as criminal penalties).penalties. Privacy and Data Protection Law requirements also confer a private right of action.action in some countries, including under the GDPR. We may incur substantialsubstantial costs associated with protecting Personal Data and maintaining compliance with the various Privacy and Data Protection Laws.Laws, including restrictions on international data transfers, particularly in light of the increasing scrutiny by supervisory authorities. These costs could adversely affect our results of operations. In addition, any inability, real or perceived, to adequately address privacy and data protection concerns, or to comply with applicable Privacy and Data Protection Laws, policies, industry standards, or contractual obligations could result in additional cost and liability to us, damage our reputation, negatively impact our ability to win new contracts or process Personal Data in certain geolocations, and otherwise adversely affect our business.
Systems and/or service failures could interrupt our operations, leading to reduced revenue and profit.
Any interruption in our operations or any systems failures, including, but not limited to: (i) the inability of our staff to perform their work in a timely fashion, whether caused by limited access to and/or closure of our and/or our clients’ offices or otherwise; (ii) the failure of network, software, and/or hardware systems; and (iii) other interruptions and failures, whether caused by us, a third-party service provider, unauthorized intruders and/orintruders/ hackers, computer viruses, natural disasters, power shortages, terrorist attacks, or otherwise, could cause loss of data and interruptions or delays in our business or that of our clients, or both. In addition, the failure or disruption of mail, communications and/or utilities could cause an interruption or suspension of our operations or otherwise harm our reputation or business. Our property and business interruption insurance may be inadequate to compensate us for all losses that may occur as a result of any system or operational failure or disruption and, as a result, revenue, profits, and operating results could be adversely affected.
We provide digital marketing services in highly competitive and constantly evolving markets. Our success in these markets depends on our ability to develop and integrate new technologies into our business and enhance our existing products and services, as well as our ability to respond to rapid changes in technology in order to remain competitive.27
In our consumer and financial market, we provide digital marketing services in highly competitive markets. We compete principally with large systems consulting and implementation firms, traditional and digital advertising and marketing agencies, offshore consulting and outsourcing companies, and clients’ internal information systems departments. To a lesser extent, other competitors include boutique consulting firms that maintain specialized skills and/or are geographically focused. We expect these competitors to devote significant effort to maintaining and growing their respective market shares. If we cannot respond effectively to advances by our competitors in this market, or grow our own business efficiently, our overall business and operating results could be adversely affected.
Our success in this competitive market depends in part on our ability to adapt to rapid technological advances and evolving standards in computer and mobile device hardware and software development and media infrastructure, changing and increasingly sophisticated customer needs, newly developed digital marketing services and platform introductions and enhancements. If, within this market, we are unable to develop new or sufficiently differentiated products and services, to enhance and improve our products and support services in a timely manner or to position and/or price our products and services to meet demand, our overall business and operating results could be adversely affected.
25
We depend on our intellectual property and our failure to protect it could harm our competitive position.
Our success depends in part upon our internally developed technology and models, proprietary processes, and other intellectual property that we incorporate in our products and utilize to provide our services. If we fail to protect our intellectual property, our competitors could market services or products similar to our services and products, which could reduce demand for our offerings. Government clients typically retain a perpetual, worldwide, royalty-free right to use the intellectual property we develop for them in a manner defined within government regulations, including providing it to other government agencies or departments, as well as to our competitors in connection with their performance of government contracts. When necessary, we seek authorization to use intellectual property developed for the government or to secure export authorization. Government clients may grant us the right to commercialize software developed with government funding, but they are not required to do so. If we improperly use intellectual property that was even partially funded by government clients, these clients could seek damages and royalties from us, sanction us, and prevent us from working on future government contracts. Actions could also be taken against us if we improperly use intellectual property belonging to others besides our government clients. In addition, there can be substantial costs associated with protecting our intellectual property, which can also have an adverse effect on our results of operations.
RISKS RELATED TO ACQUISITIONS
When we undertake acquisitions, they may present integration challenges, fail to perform as expected, increase our liabilities, and/or reduce our earnings.
One of our growth strategies is to make strategic acquisitions. When we complete acquisitions, it may be challenging and costly to integrate the acquired businesses due to operating and integrating new accounting systems, differences in the locations of personnel and facilities, differences in corporate cultures, disparate business models, or other reasons. If we are unable to successfully integrate acquired companies, our revenue and operating results could suffer. In addition, we may not successfully achieve the anticipated cost efficiencies and synergies from these acquisitions. Also, our costs for managerial, operational, financial, and administrative systems may increase and be higher than anticipated. During and following the integration of an acquired business, we may experience attrition, including losing key employees and/or clients of the acquired business, which could adversely affect our future revenue and operating results and prevent us from achieving the anticipated benefits of the acquisition.
BusinessesThe businesses we acquire may have liabilities or adverse operating issues, or both, that we either fail to discover through due diligence or underestimate prior to the consummation of the acquisition. These liabilities and/or issues may include the acquired business’ failure to comply with, or other violations of, applicable laws, rules, or regulations or contractual or other obligations or liabilities. As the successor owner, we may be financially responsible for, and may suffer harm to our reputation or otherwise be adversely affected by, such liabilities and/or issues. An acquired business also may have problems with internal controls over financial reporting, which could in turn cause us to have material deficiencies or material weaknesses in our own internal controls over financial reporting. These and any other costs, liabilities, issues, and/or disruptions associated with any past or future acquisitions, and the related integration, could harm our operating results.
As a result of our acquisitions, we have substantial amounts of goodwill and intangible assets, and changes in business conditions could cause these assets to become impaired, requiring write-downs that would adversely affect our operating results.
All of our acquisitions have involved purchase prices in excess of tangible asset values net of liabilities assumed, resulting in the creation of an increased amount of goodwill and other intangible assets. As of December 31, 2020,2023, goodwill and purchased intangibles accounted for approximately 55%61% and 4%5%, respectively, of our total assets. Under U.S. generally accepted accounting principles, we do not amortize goodwill acquired in a purchase business combination. We evaluate the recoverability of recorded goodwill annually, as well as when events or circumstances indicate there may be an impairment or if we have a material change in reporting units. Although we have to date determined that goodwill has not been impaired, future events or changes in circumstances that result in an impairment of goodwill or intangible assets would have a negative impact on our profitability and operating results. In the second quarter of 2019, we impaired an intangible asset associated with a historical business acquisition for $1.7 million.
2628
RISKS RELATED TO OUR CORPORATE AND CAPITAL STRUCTURE
Provisions of our charter documents and Delaware law may prevent or deter potential acquisition bids to acquire us and other actions that stockholders may consider favorable, and the market price of our common stock may be lower as a result.
Our charter documents contain the following provisions that could have an anti-takeover effect:
| • Our board of directors (the “Board”) is divided into three classes, making it more difficult for stockholders to change the composition of the Board; • Directors may be removed only for cause; • Our stockholders are not permitted to call a special meeting of the stockholders; • All stockholder actions are required to be taken by a vote of the stockholders at an annual or special meeting or by a written consent signed by all of our stockholders; • Our stockholders are required to comply with advance notice procedures to nominate candidates for election to our Board or to place stockholders’ proposals on the agenda for consideration at stockholder meetings; and • The approval of the holders of capital stock representing at least two-thirds of our voting power is required to amend our indemnification obligations, director classifications, stockholder proposal requirements, and director candidate nomination requirements set forth in our amended and restated certificate of incorporation and amended and restated bylaws.
|
|
|
|
|
|
|
|
|
|
|
|
In addition, we are subject to the anti-takeover provisions of Section 203 of the Delaware General Corporation Law, which regulates corporate acquisitions. These provisions could discourage potential acquisition proposals; delay or prevent a change-in-control transaction; discourage others from making tender offers for our common stock; and/or prevent changes in our management.
There are risks associated with our outstanding and future indebtedness which could reduce our profitability, limit our ability to pursue certain business opportunities, and reduce the value of our stock.
At our discretion, we borrow funds from our various credit facilities (the “Credit Facility”) under a credit agreement with a group of lenders. As of December 31, 2020,2023, we had an aggregate of $313.2$430.4 million of outstanding indebtedness under a credit facility(net of unamortized debt issuance costs) that will mature on March 3, 2025. The debt level increased as a result of the January 2020 acquisition of ITG. May 6, 2027. Subject to the limits contained in the agreements governing our outstanding debt,Credit Facility, we may incur additional debt in the future.future to fund our ongoing operations as well as acquisitions. Our ability to pay interest and repay the principal for our indebtedness from time to time, as well as meet our financial and operating covenant requirements, is dependent upon our ability to, among other things, manage our business operations, and generate sufficient cash flows to service such debt. If we are unable to comply with the terms of our financing agreements or obtain additional required financing, this could ultimately result in a material adverse effect on our financial results and the value of our stock. Among other things, our debt could:
| • Make it difficult to obtain additional financing for working capital, capital expenditures, acquisitions, or other general corporate purposes; • Result in a substantial portion of our cash flows from operations being dedicated to the payment of the principal and interest on our debt, as well as used to make debt service payments; • Limit our flexibility in planning for, and reacting to, changes in our business and the marketplace; • Place us at a competitive disadvantage relative to other less leveraged firms; and • Increase our vulnerability to economic downturns and rises in interest rates. 29
|
|
|
|
|
|
|
|
|
|
Should any of these or other unforeseen consequences arise, they could have an adverse effect on our business, financial condition, results of operations, future business opportunities and/or ability to satisfy our obligations under our debt.
27
Changes affecting the availability of the London Interbank Offered Rate (“LIBOR”) may have consequences for us that cannot yet reasonably be predicted.
We have outstanding debt that matures in March 2025 and derivatives with variable interest rates based on LIBOR which extend out to February 2025. The LIBOR benchmark has been the subject of national, international, and other regulatory guidance and proposals for reform. In July 2017, the U.K. Financial Conduct Authority announced that it intends to stop persuading or compelling banks to submit rates for calculation of LIBOR after 2021. Regulators in various jurisdictions have been working to replace LIBOR and other interbank offered rates with reference interest rates that are more firmly based on actual transactions and it is expected that a transition away from the widespread use of LIBOR to alternative rates will occur over the course of the next few years. While the U.S Federal Reserve has identified replacements for LIBOR and the Financial Accounting Standards Board has issued proposals for the transition from existing reference interest rates to alternative rates, there has been no agreed-upon alternative rate. These reforms may cause LIBOR to perform differently than in the past and LIBOR may ultimately cease to exist after 2021.
At this time, it is not possible to accurately predict the effect of any changes to LIBOR, any phase out of LIBOR or any establishment of alternative benchmark rates. Any new benchmark rate will likely not replicate LIBOR exactly, which could impact our financial instruments, may result in expenses, difficulties, complications or delays in connection with future financing efforts, may not be as favorable to us as those based on LIBOR, as well as other unforeseen effects, all of which could impact our results of operations and cash flows. There is uncertainty about how applicable law, the courts or the Company will address the replacement of LIBOR with alternative rates. Uncertainty as to the nature of such potential changes may also adversely affect the trading market for our securities. Management continues to monitor the status and discussions regarding LIBOR. We are not yet able to reasonably estimate the expected impact.
We cannot assure you that we will pay special or regular dividends on our stock in the future.
The board of directorsBoard has authorized, declared and paid regular dividends each quarter since 2018. The declaration of any future dividends and the establishment of the per share amount, record dates and payment dates for any such future dividends are subject to the discretion of the board of directorsBoard taking into account future earnings, cash flows, net income, dividend yield and other factors. Authorization of dividends by the Board is subject to adherence/compliance with our credit facility.Credit Facility. There can be no assurance that the board of directors will declare any dividends in the future. To the extent that expectations by market participants regarding the potential payment, or amount, of any special or regular dividend prove to be incorrect, the price of our common stock may be materially and negatively affected and investors that bought shares of our common stock based on those expectations may suffer a loss on their investment.
28GENERAL RISK FACTORS
Failure to identify, hire, train, and retain talented employees who are committed to our mission and vision could have a negative effect on our reputation and our business.
Our business, which entails the provision of professional services to government and commercial clients, largely depends on our ability to attract and retain qualified employees who are often in demand. Additionally, as our business continues to evolve, as we acquire new businesses, and as we provide a wider range of services, we become increasingly dependent on the capabilities of our employees in order to meet the needs of our diverse client base. If we are unable to recruit and retain a sufficient number of qualified employees that are committed to our mission and vision, we may incur higher costs related to an increase in subcontractors, hiring, training, and retention.
We also rely on key senior members of management. As a result, effective succession planning is important to our long-term success. Failure to ensure effective transfer of knowledge and smooth transitions involving these key employees could hinder our strategic planning and execution as well as impair our ability to effectively serve our clients and maintain and grow our business. Such developments could adversely affect our future revenue and operating results.
Changes to U.S. tax laws may adversely affect our financial condition or results of operation and create the risk that we may need to adjust our accounting for these changes.
We are subject to taxation in the U.S. and in certain foreign jurisdictions in which we operate, and any changes to income tax laws and rules and regulations could adversely affect our business and our results of operations.
Our failure to comply with complex laws, rules, and regulations could cause us to lose business and subject us to a variety of penalties and sanctions.
We must comply with laws, rules, and regulations that affect how we do business with our government clients and impose added costs on our business. Each government client has its own laws, rules, and regulations that affect its contracts. Some of the more significant laws and regulations affecting the formation, administration, and performance of U.S. government contracts include:
30
Any failure to comply with applicable federal, and/or state and local government laws, rules, and regulations could subject us to civil and criminal penalties and administrative sanctions, including termination of contracts, repayment of amounts already received under contracts, forfeiture of profits, suspension of payments, fines, and suspension or debarment from doing business with federal and/or state and local government agencies and departments, any of which could adversely affect our reputation, our revenue, our operating results, and/or the value of our stock.
In addition, the federal government and other governments with which we do business may change their procurement practices or adopt new contracting laws, rules, or regulations that could be costly to satisfy or that could impair our ability to obtain new contracts and reduce our revenue and profit, such as curtailing the use of services firms or increasing the use of firms with a “preferred status,” such as small businesses.
In addition to our U.S. operations, we also have a significant presence in key markets outside the U.S., including offices in the U.K., Belgium, India, and Canada. Failure to abide by laws, rules, and regulations applicable to us because of our work outside the U.S., such as the U.K. Bribery Act 2010 and the GDPR, could have similar effects to those described above.
Our international operations pose additional risks to our profitability and operating results.
We have offices in the U.K., Belgium, India, and Canada, among others, and expect to continue to have international operations and offices, some of which are in economically developing countries that do not have a well-established business infrastructure. We also perform work in some countries where we do not have a physical office. Some of the countries in which we work have a history of political instability or may expose our employees and subcontractors to physical danger over and above pandemic-related risk. Expansion into selective new geographic regions requires considerable management and financial resources, the expenditure of which may negatively impact our results, and we may never see any return on our investment.
Our international operations are subject to risks associated with operating in, and selling to and in, countries other than the U.S., that could, directly or indirectly, adversely affect our international and domestic operations and our overall revenue, profit, and operating results including, but not limited to:
In addition, because of our work with international clients, certain of our revenues and costs are denominated in other currencies, then translated to U.S. dollars for financial reporting purposes. Our revenues and profits may decrease as a result of currency fluctuations and devaluations and limitations on the conversion of foreign currencies into U.S. dollars and in the conversion between foreign currencies. We may, from time to time, have forward contract agreements (“hedges”) related to our operations in the U.K. to hedge the remeasurement between the Euro and the pound sterling. We recognize the changes in the fair value of the economic hedges in our results of operations. We cannot be sure that our hedges will be successful in reducing the risks to us of our exposure to foreign currency fluctuations and, in fact, the hedges may adversely affect our operating results.
31
Presently, there is active armed conflict across the territory of Ukraine as a result of a Russian invasion. The war has impacted member states of the E.U. in a variety of ways, including through their provision of weapons, humanitarian supplies, and substantial financial support to Ukraine, and their absorption of millions of Ukrainian refugees. While no E.U. member states have become active participants in the conflict, a number of them have greatly increased their defense preparations and investments, reflecting a wholesale shift in the security environment on the continent. It is not currently foreseen that an immediate diplomatic resolution to the conflict is likely. In such an environment, it is possible that E.U. spending priorities may shift suddenly, that our current programs could be disrupted, and that our future opportunities could be diminished.
Health epidemics, pandemics, and similar outbreaks may have material adverse effects on our business, financial position, results of operations, and/or cash flows.
We face various risks and uncertainties related to health epidemics, pandemics, and similar outbreaks. These risks relate to, among other things, the demand for our services, the availability of our staffing and business partners, a possible slowdown of client decision-making as to our services, a significant deterioration of global supply chains and other business conditions, and a possible reprioritization of spending by our clients.
ITEM 1B. UNRESOLVED STAFF COMMENTS None. ITEM 1C. CYBERSECURITY As discussed in the “Item 1A. Risk Factors – Privacy, Cybersecurity, Technology, and Data Protection Risks”, we face certain ongoing risks from cybersecurity threats and recognize the critical importance of effective cybersecurity risk management in today's interconnected digital landscape. As part of our commitment to safeguarding our operations, sensitive data, and stakeholder trust, we have implemented robust cybersecurity practices and governance. Cybersecurity Risk Management Program We regularly assess and identify potential cybersecurity risks that could impact our business, financial condition, or reputation. Our risk assessment process includes: • Enterprise Risk Management: We maintain an enterprise risk management process that embeds cybersecurity within the risk assessment strategy. • Threat Landscape Analysis: We monitor emerging threats, vulnerabilities, and attack vectors relevant to our industry and business operations. • Risk Scenarios: We evaluate potential scenarios, with considerations to both internal and external threats, to understand their potential impact. • Risk Quantification: We assess the likelihood and potential financial, operational, and reputational impact of identified risks. Our risk mitigation strategy focuses on measures to prevent, detect, and respond to cybersecurity incidents. The primary components of our risk mitigation strategy include: • Security Controls: We maintain a comprehensive set of controls aligned with industry standards such as the National Institute of Standards and Technology (“NIST”) and the International Organization of Standards (“ISO”) 27001 to protect our systems, networks, and data. • Incident Response Plan: We have a well-defined incident response plan that outline roles, responsibilities, and procedures for handling cybersecurity incidents. • Employee Training and Awareness: We have training programs to ensure that our employees understand their role in maintaining a secure environment and recognize potential threats. • Third-party Risk Assessment and Management: We assess and manage cybersecurity risks associated with our vendors, partners, and service providers. 32 Our approach to information security follows a defense-in-depth methodology in which security is embedded throughout the system architecture. Technical controls rely on proven technologies, such as network-based intrusion detection systems, next generation firewalls with advanced threat detection, secure server networks, demilitarized zones, and endpoint detection and response capabilities. Security techniques, such as encryption at rest and encryption in transit, are used to incorporate relevant practices. We undergo annual third-party security assessments such as security control compliance reviews, incident response exercises, penetration testing, and red team drills to maintain the effectiveness of the security program. Our critical corporate information systems are maintained in a commercial grade data center with climate controls, fire suppression, redundant power, and several telecommunication options. The data center is designed to host mission-critical computer systems with fully redundant subsystems and compartmentalized security zones. Our primary data center also undergoes independent assessment on an annual basis. Our computing infrastructures are protected by multiple independent layers of security measures managed by the corporate information security department. Our approach to accessing protected networks is based on the principle of least privilege. Notwithstanding the vigorous approach we take to cybersecurity, we may not always be successful in preventing or mitigating a cybersecurity incident that could have a material adverse effect on us. To date, we have not identified cybersecurity risks, threats, or incidents that have materially affected us, including our operations, business strategy, results of operations, or financial conditions. Cybersecurity Governance and Oversight Our Board, directly or through its committees, is responsible for the oversight of the Company's overall enterprise risk management program that includes cybersecurity risks. Our Audit Committee regularly reviews and evaluates cybersecurity risks and the procedures and policies implemented by management to identify, manage, and mitigate such risks. Management is responsible for day-to-day assessment and management of cybersecurity risks. Our Chief Information Officer (the “CIO”) has primary oversight of material risks from cybersecurity threats. He has over 40 years of professional experience across various engineering, business and management roles. Directly reporting to our CIO is our Deputy Chief Information Officer (“the Deputy CIO”), with over 30 years of experience leading implementation of various IT infrastructure and systems, and our Chief Information Security Officer (the “CISO”), with over 20 years of specific cyber security experience and is responsible for maintaining compliance with applicable security requirements. The CIO and the CISO have a combined tenure of over 33 years with the Company in various progressive management roles in information systems and technology and information security. The CIO and the CISO conducts regular meetings with the Audit Committee and the Board to communicate updates on cybersecurity risks, incidents, and mitigation efforts. The CISO and our security staff provides ongoing support to internal operations and oversight to our systems that offer services to our clients within our enterprise network. Our security staff is also augmented through an industry-recognized security operations center where systems are continuously monitored. |
|
None.
ITEM 2. PROPERTIES
|
|
We lease our offices and do not own any real estate. As of December 31, 2020,2023, we leased approximately 326,983208,274 square feet of office space at our corporate headquarters at 9300/9302 Lee Highway, Fairfax,1902 Reston Metro Plaza, Reston, Virginia (in the Washington, D.C. metropolitan area) through December 2022May 2039 (the “Fairfax Offices”“Reston Office”). The Fairfax Offices houseReston Office houses a portion of our operations and almost all of our corporate functions, including most of our staff within executive management, treasury, accounting, legal, human resources, business and corporate development, facilities management, information services, and contracts, which will eventually move to the Reston location discussed below.contracts.
On October 24, 2019, we entered into a new commercial lease agreement for our corporate headquarters in Reston, Virginia. The new lease commences on March 1, 2022, the anticipated date we will take control of the property and commence buildout and extends through April 30, 2039 and provides for the lease by us of approximately 208,000 square feet of space. Total base rent payable over the extended lease period is approximately $154.9 million. We have two options to extend the term of the lease for an additional consecutive ten-year period under each option, or four options to extend the lease for an additional consecutive five-year period under each option with respect to the entire premises.
As of December 31, 2020,2023, we had leases in place for approximately 1.3 million970,843 square feet of office space in more than 7570 office locations throughout the U.S. and around the world, with various lease terms expiring over the next fourteenfifteen years. As of December 31, 2020, approximately 15,380 square feet of the space we leased was subleased to other parties. We continually review our need for office space, and we believe that our current office space, as well as other future office space we expect to be able to obtain in the lease marketplace, will be sufficient to meet our office space needs.
33
ITEM 3. LEGAL PROCEEDINGS
|
|
We are involved in various legal matters and proceedings arising in the ordinary course of business. While these matters and proceedings cause us to incur costs, including, but not limited to, attorneys’ fees, we currently believe that any ultimate liability arising out of these matters and proceedings will not have a material adverse effect on our financial position, results of operations, or cash flows.
An update on litigation related to our Road Home contract is discussed in “Note 20— Commitment and Contingencies — Road Home Contract” in our financial statements.
ITEM 4. MINE SAFETY DISCLOSURES
|
|
Not applicable.
34
29
PART II
ITEM 5. MARKET FOR REGISTRANT’S COMMON EQUITY, RELATED STOCKHOLDER MATTERS AND ISSUER PURCHASES OF EQUITY SECURITIES
|
|
Market Information
Our common stock trades on the NASDAQ Global Select Market under the symbol “ICFI.”
Holders
As of February 19, 2021,23, 2024, there were 3226 registered holders of record of our common stock. This number is not representative of the number of beneficial holders because many of the shares are held by depositories, brokers, or nominees.
Dividends
We currently expect to continue paying dividends comparable with our historic dividend payments. The declaration and payment of any dividends is at the sole discretion of the board of directorsour Board and is not guaranteed. Our amended credit facilityCredit Facility contains certain restrictions related to the payment of cash dividends, requiring us to meet certain covenants prior to and after the declaration of any dividend.
3035
Stock Performance Graph
The following graph compares the cumulative total stockholder return on our common stock from December 31, 20152018 through December 31, 2020,2023, with the cumulative total return on (i) the NASDAQ Composite, (ii) the Russell 2000 stock index, and (iii) the Company’sS&P 1500 companies having GICS Code 2020 peer group composed of other governmental and commercial service providers: Booz Allen Hamilton Holding Corporation; CACI International Inc.; CBIZ, Inc.; CRA International, Inc.; Exponent Inc.; FTI Consulting, Inc.; GP Strategies Corporation; Huron Consulting Group Inc.; ManTech International Corporation; Maximus, Inc.; Resources Connection, Inc.; Science Applications International Corporation; Tetra Tech, Inc.; Unisys Corporation; and VSE Corporation (the “2020 Peer Group”). As part of the annual process of reviewing the peer group, management ensures that the selected companies remain aligned with the Company’s evolving business strategy. There were no changes between the 2020 Peer Group and our peer group in 2019. Commercial & Professional Services.
The comparison below assumes an initial investment of $100.00 on December 31, 20152018 in which all dividends (if any) are reinvested and all returns are market-cap weighted. The historical information set forth below is not necessarily indicative of future performance.
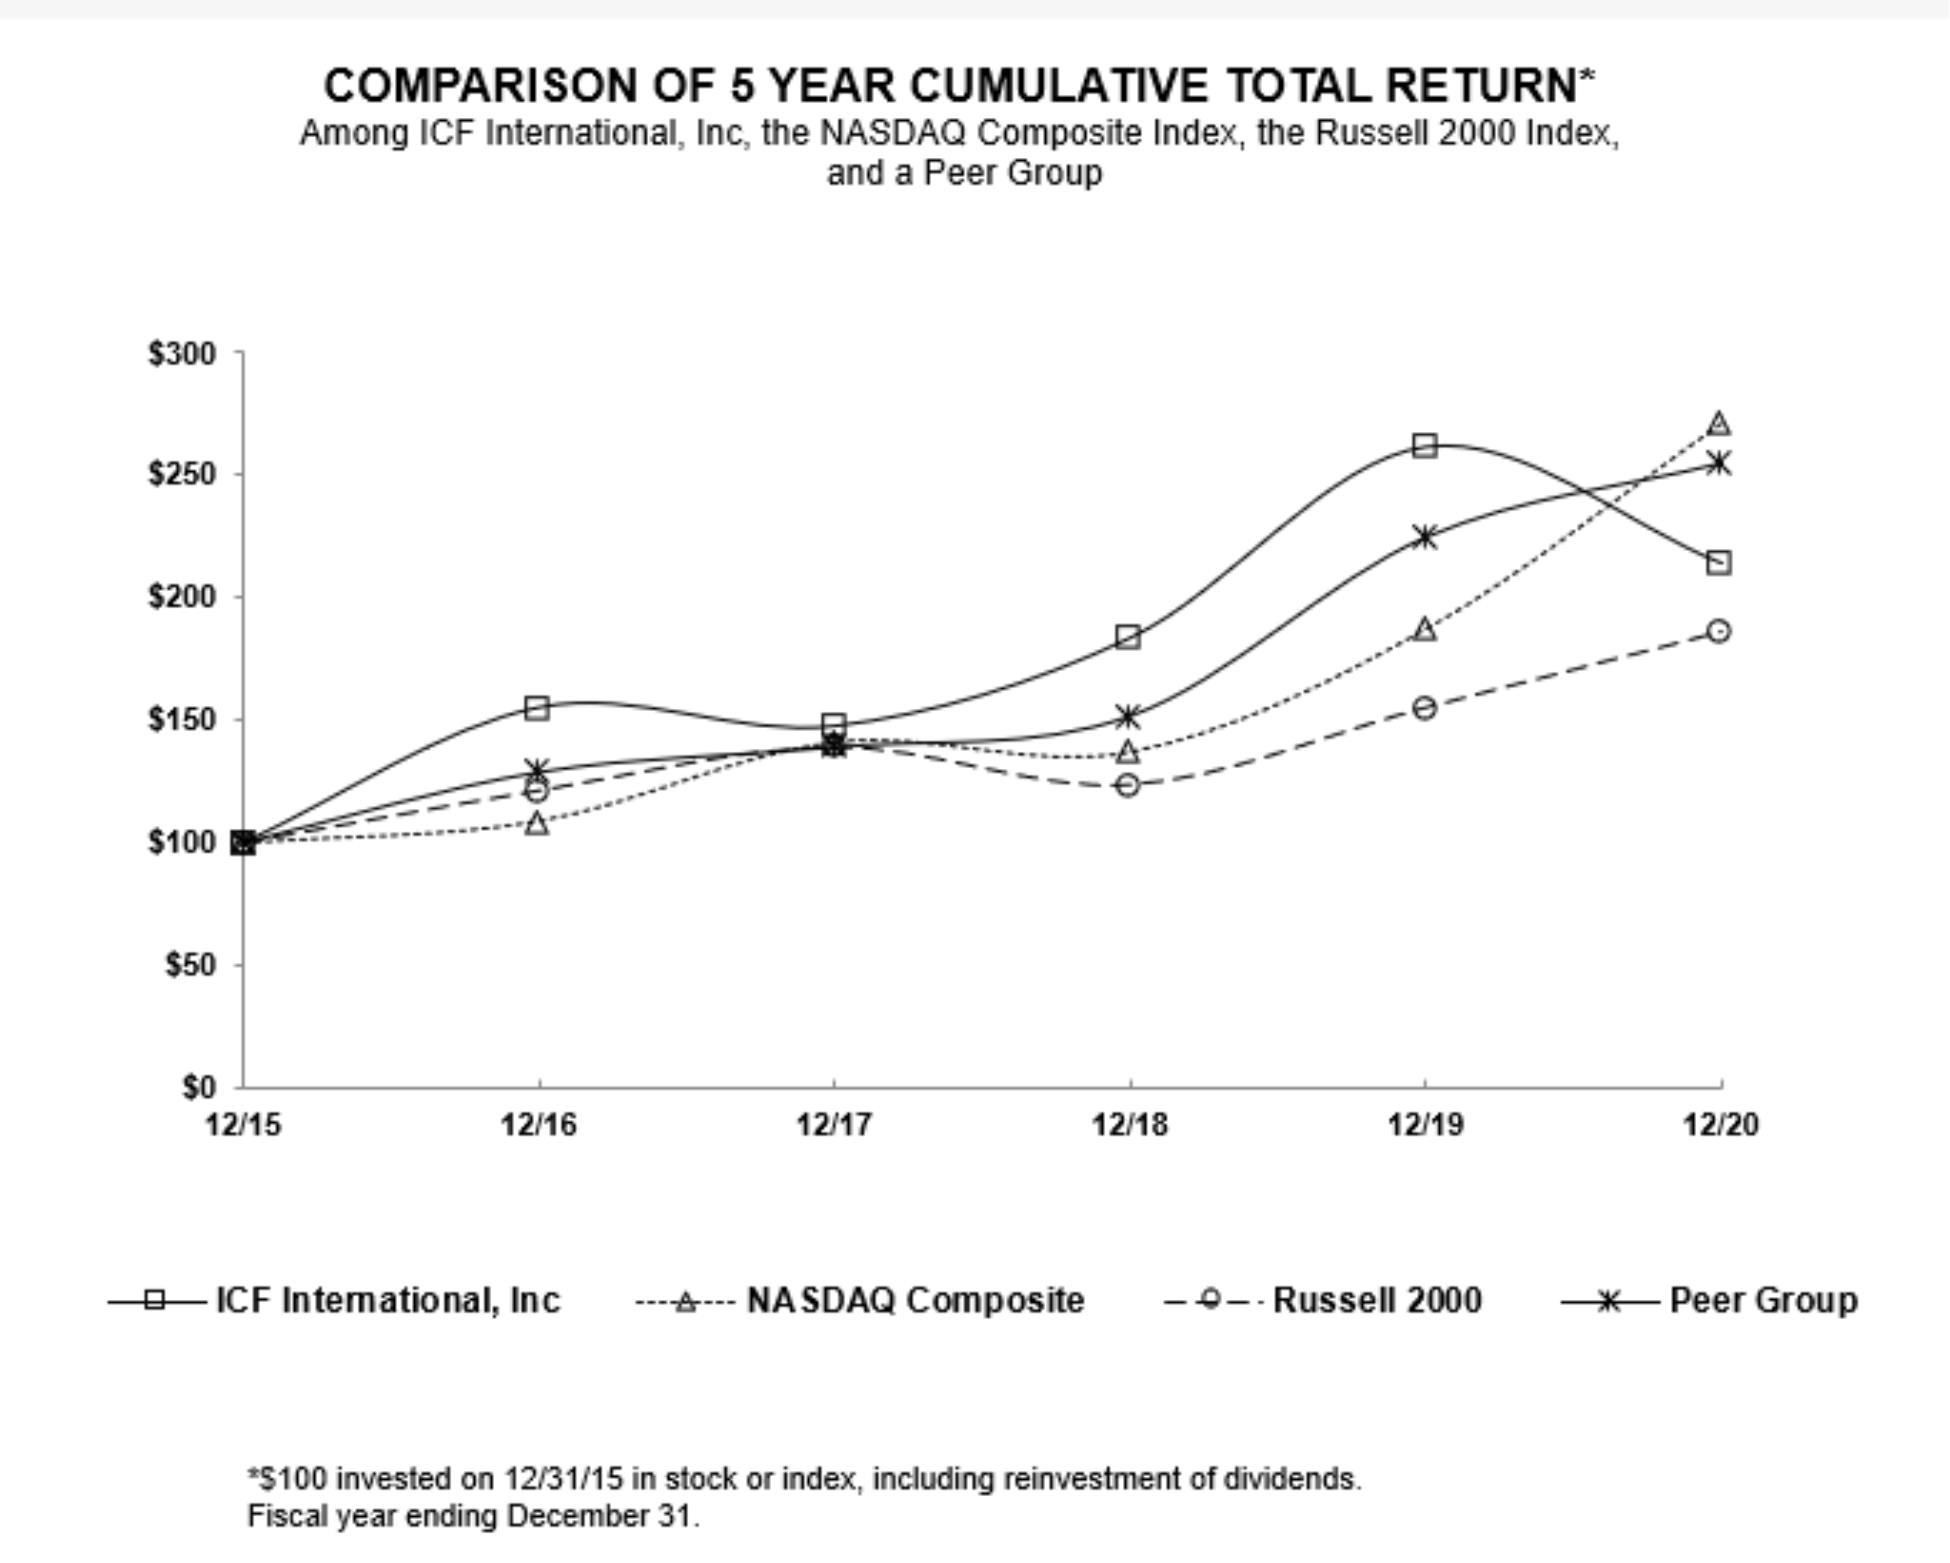
36
|
| Year Ended December 31, |
| |||||||||||||||||||||
|
| 2018 |
|
| 2019 |
|
| 2020 |
|
| 2021 |
|
| 2022 |
|
| 2023 |
| ||||||
ICF International, Inc. |
| $ | 100.00 |
|
| $ | 177.20 |
|
| $ | 144.95 |
|
| $ | 201.18 |
|
| $ | 195.41 |
|
| $ | 265.74 |
|
NASDAQ Composite |
|
| 100.00 |
|
|
| 136.69 |
|
|
| 198.10 |
|
|
| 242.03 |
|
|
| 163.28 |
|
|
| 236.17 |
|
Russell 2000 Index |
|
| 100.00 |
|
|
| 125.52 |
|
|
| 150.58 |
|
|
| 172.90 |
|
|
| 137.56 |
|
|
| 160.85 |
|
S&P Composite 1500 Commercial & Professional Services |
|
| 100.00 |
|
|
| 135.88 |
|
|
| 160.43 |
|
|
| 202.40 |
|
|
| 182.94 |
|
|
| 215.78 |
|
31
|
| Year Ended December 31, |
| |||||||||||||||||||||
|
| 2015 |
|
| 2016 |
|
| 2017 |
|
| 2018 |
|
| 2019 |
|
| 2020 |
| ||||||
ICF International, Inc. |
| $ | 100.00 |
|
| $ | 155.23 |
|
| $ | 147.64 |
|
| $ | 183.67 |
|
| $ | 261.62 |
|
| $ | 214.00 |
|
NASDAQ Composite |
|
| 100.00 |
|
|
| 108.87 |
|
|
| 141.13 |
|
|
| 137.12 |
|
|
| 187.44 |
|
|
| 271.64 |
|
Russell 2000 Index |
|
| 100.00 |
|
|
| 121.31 |
|
|
| 139.08 |
|
|
| 123.76 |
|
|
| 155.35 |
|
|
| 186.36 |
|
Peer Group |
|
| 100.00 |
|
|
| 128.84 |
|
|
| 139.04 |
|
|
| 151.85 |
|
|
| 225.06 |
|
|
| 255.41 |
|
Recent Sales of Unregistered Securities
None.
RepurchasesShare Repurchase Program
In September 2017, the Board approved a share repurchase program that authorizes share repurchases in the aggregate up to $100.0 million. In November 2021, the Board approved an increase to the share repurchase program to a new limit of $200.0 million, inclusive of the prior limit. During the year ended December 31, 2023, we repurchased 180,000 shares under this program at an average price of $100.70 per share. As of December 31, 2023, $93.7 million of authority remained available for share repurchases.
The objective of our share repurchase program is to offset dilution resulting from employee stock compensation. Under the program, purchases can be made from time to time at prevailing market prices in open market purchases or in privately negotiated transactions pursuant to Rules 10b5-1 and 10b-18 under the Exchange Act, and in accordance with applicable insider trading and other securities laws and regulations. The timing and extent to which we repurchase our shares will depend upon market conditions and other corporate considerations, as may be considered in our sole discretion. The purchases will be funded from existing cash balances and/or borrowings and the repurchased shares will be held in treasury. Our Credit Facility permits annual share repurchases of at least $25 million provided that the Company is not in default of its covenants, and higher amounts provided that our Consolidated Leverage Ratio, prior to and after giving effect to such repurchases, is 0.50 to 1.00 less than the then-applicable maximum Consolidated Leverage Ratio and subject to a net liquidity of $100.0 million after giving effect to such purchases.
37
Repurchases of Equity Securities
The following table summarizes the share repurchase activity for the three months ended December 31, 20202023 for our share repurchase plan and shares purchased in satisfaction of employee tax withholding obligations.obligations related to the settlement of restricted stock units.
Period |
| Total |
|
| Average |
|
| Total Number |
|
| Approximate Dollar |
| ||||
October 1 – October 31 |
|
| — |
|
| $ | — |
|
|
| — |
|
| $ | 93,743,956 |
|
November 1 – November 30 |
|
| 4,935 |
|
| $ | 126.64 |
|
|
| — |
|
| $ | 93,743,956 |
|
December 1 – December 31 |
|
| — |
|
| $ | — |
|
|
| — |
|
| $ | 93,743,956 |
|
Total |
|
| 4,935 |
|
| $ | 126.64 |
|
|
| — |
|
|
|
| |
ITEM 6. [RESERVED]
Period |
| Total Number of Shares Purchased (a) |
|
| Average Price Paid per Share (a) |
|
| Total Number of Shares Purchased as Part of Publicly Announced Plans or Programs (b) |
|
| Approximate Dollar Value of Shares that May Yet Be Purchased Under the Plans or Programs (b) |
| ||||
October 1 – October 31 |
|
| 4,388 |
|
| $ | 62.92 |
|
|
| — |
|
| $ | 51,379,133 |
|
November 1 – November 30 |
|
| 23,496 |
|
| $ | 75.82 |
|
|
| 21,762 |
|
| $ | 49,726,369 |
|
December 1 – December 31 |
|
| 74,553 |
|
| $ | 73.16 |
|
|
| 50,000 |
|
| $ | 46,097,458 |
|
Total |
|
| 102,437 |
|
| $ | 73.33 |
|
|
| 71,762 |
|
|
|
|
|
38
|
|
|
|
32
|
|
The following table presents selected historical financial data derived from our audited consolidated financial statements and other information for each of the five years presented. This information should be read in conjunction with “Management’s Discussion and Analysis of Financial Condition and Results of Operations” and our audited financial statements and the related notes included elsewhere in this Annual Report. The financial information below reflects the results or impact of our acquisitions since the date the entities were purchased.
|
| Year Ended December 31, |
| |||||||||||||||||
|
| 2020 |
|
| 2019 |
|
| 2018 |
|
| 2017 |
|
| 2016 |
| |||||
|
| (in thousands, except per share amounts) |
| |||||||||||||||||
Statement of Earnings Data: |
|
|
|
|
|
|
|
|
|
|
|
|
|
|
|
|
|
|
|
|
Revenue |
| $ | 1,506,875 |
|
| $ | 1,478,525 |
|
| $ | 1,337,973 |
|
| $ | 1,229,162 |
|
| $ | 1,185,097 |
|
Direct costs |
|
| 972,406 |
|
|
| 953,187 |
|
|
| 857,508 |
|
|
| 771,725 |
|
|
| 745,137 |
|
Operating costs and expenses: |
|
|
|
|
|
|
|
|
|
|
|
|
|
|
|
|
|
|
|
|
Indirect and selling expenses |
|
| 411,612 |
|
|
| 395,763 |
|
|
| 360,987 |
|
|
| 346,440 |
|
|
| 328,048 |
|
Depreciation and amortization |
|
| 20,399 |
|
|
| 20,099 |
|
|
| 17,163 |
|
|
| 17,691 |
|
|
| 16,638 |
|
Amortization of intangible assets |
|
| 13,349 |
|
|
| 8,083 |
|
|
| 10,043 |
|
|
| 10,888 |
|
|
| 12,481 |
|
Total operating costs and expenses |
|
| 445,360 |
|
|
| 423,945 |
|
|
| 388,193 |
|
|
| 375,019 |
|
|
| 357,167 |
|
Operating income |
|
| 89,109 |
|
|
| 101,393 |
|
|
| 92,272 |
|
|
| 82,418 |
|
|
| 82,793 |
|
Interest expense |
|
| (13,892 | ) |
|
| (10,719 | ) |
|
| (8,710 | ) |
|
| (8,553 | ) |
|
| (9,470 | ) |
Other expense |
|
| (544 | ) |
|
| (501 | ) |
|
| (735 | ) |
|
| 121 |
|
|
| 1,184 |
|
Income before income taxes |
|
| 74,673 |
|
|
| 90,173 |
|
|
| 82,827 |
|
|
| 73,986 |
|
|
| 74,507 |
|
Provision for income taxes |
|
| 19,714 |
|
|
| 21,235 |
|
|
| 21,427 |
|
|
| 11,110 |
|
|
| 27,923 |
|
Net income |
| $ | 54,959 |
|
| $ | 68,938 |
|
| $ | 61,400 |
|
| $ | 62,876 |
|
| $ | 46,584 |
|
|
|
|
|
|
|
|
|
|
|
|
|
|
|
|
|
|
|
|
|
|
Earnings per share (“EPS”): |
|
|
|
|
|
|
|
|
|
|
|
|
|
|
|
|
|
|
|
|
Basic |
| $ | 2.92 |
|
| $ | 3.66 |
|
| $ | 3.27 |
|
| $ | 3.35 |
|
| $ | 2.45 |
|
Diluted |
| $ | 2.87 |
|
| $ | 3.59 |
|
| $ | 3.18 |
|
| $ | 3.27 |
|
| $ | 2.40 |
|
|
|
|
|
|
|
|
|
|
|
|
|
|
|
|
|
|
|
|
|
|
Weighted-average common shares outstanding: |
|
|
|
|
|
|
|
|
|
|
|
|
|
|
|
|
|
|
|
|
Basic |
|
| 18,841 |
|
|
| 18,816 |
|
|
| 18,797 |
|
|
| 18,766 |
|
|
| 18,989 |
|
Diluted |
|
| 19,135 |
|
|
| 19,224 |
|
|
| 19,335 |
|
|
| 19,244 |
|
|
| 19,416 |
|
|
|
|
|
|
|
|
|
|
|
|
|
|
|
|
|
|
|
|
|
|
Cash dividends declared per common share(1) |
| $ | 0.56 |
|
| $ | 0.56 |
|
| $ | 0.56 |
|
| $ | — |
|
| $ | — |
|
|
|
|
|
|
|
|
|
|
|
|
|
|
|
|
|
|
|
|
|
|
|
|
|
|
|
|
|
|
|
|
|
|
|
|
|
|
|
|
|
|
|
|
| As of December 31, |
| |||||||||||||||||
|
| 2020 |
|
| 2019 |
|
| 2018 |
|
| 2017 |
|
| 2016 |
| |||||
Consolidated Balance Sheet Data: |
| (in thousands) |
| |||||||||||||||||
Cash and cash equivalents |
| $ | 13,841 |
|
| $ | 6,482 |
|
| $ | 11,694 |
|
| $ | 11,809 |
|
| $ | 6,042 |
|
Total assets |
|
| 1,667,290 |
|
|
| 1,396,034 |
|
|
| 1,213,862 |
|
|
| 1,110,255 |
|
|
| 1,085,571 |
|
Long-term debt |
|
| 303,214 |
|
|
| 164,261 |
|
|
| 200,424 |
|
|
| 206,250 |
|
|
| 259,389 |
|
Total stockholders’ equity |
|
| 746,961 |
|
|
| 714,551 |
|
|
| 660,417 |
|
|
| 616,030 |
|
|
| 566,004 |
|
|
|
33
ITEM 7. MANAGEMENT’S DISCUSSION AND ANALYSIS OF FINANCIAL CONDITION AND RESULTS OF OPERATIONS
|
|
The following discussion and analysis should be read in conjunction with the “Selected Financial Data” and theour consolidated financial statements and related notes included elsewherein Item 8.“Financial Statements and Supplementary Data” in this Annual Report on Form 10-K. This discussion and analysis contains forward-looking statements that involve risks, uncertainties, and assumptions, such as statements of our plans, objectives, expectations, and intentions. The cautionary statements made in this Annual Report on Form 10-K should be read as applying to all related forward-looking statements wherever they appear in this Annual Report on Form 10-K. Our actual results could differ materially from those anticipated in the forward-looking statements. Factors that could cause or contribute to our actual results differing materially from those anticipated include those discussed in “Risk Factors” and elsewhere in this Annual Report on Form 10-K. This section of this Form 10-K generally discusses 20202023 and 20192022 items and year-to-year comparisons between 20202023 and 2019.2022. Discussions of 20192022 items and year-to-year comparisons between 20192022 and 20182021 that are not included in this Form 10-K can be found in “Management’s Discussion and Analysis of Financial Condition and Results of Operations” in Part II, Item 7 of our Annual Report on Form 10-K for the fiscal year ended December 31, 2019,2022, which was filed with the SEC on February 28, 2020,March 1, 2023, and is incorporated by reference into this Management’s Discussion and Analysis of Financial Condition and Results of Operations.
OVERVIEW AND OUTLOOK
We provide professional services and technology-based solutions, to government and commercial clients. Our services includeincluding management, marketing, technology, and policy consulting and implementation services. We help our clients conceive, develop, implement, and improve solutions that address complex business, natural resource, social, technological, and public safety issues. Our services primarily support clients that operate in four key markets:
Disaster Recovery;
• Safety and Security; and
• Consumer and Financial.
Drawing from our domain knowledge and staff experience in working in multi-disciplinary teams for clients in a variety of markets, weWe provide services to our diverse client base that deliver value throughout the entire life cycle of a policy, program, project, or initiative. Our primary services include:
Our clients utilize our services because we combine diverse institutional knowledge and experience with the deep subject matter expertise of our highly educated staff, which we deploy in multi-disciplinary teams. We have successfully worked with many of our clients for decades, with the result that we have a thorough and nuanced perspective of their objectives and needs. We serve both governmental and commercial clients. Our government clients include those from departments and agencies of the federal government, state (including territories) and local governments, and international governments. Our government efforts include work performed under subcontract agreements to commercial clients whose ultimate customer iscustomers are government agencies and departments.
Our largest clients are U.S. federal government departments and agencies. In fact, ourOur federal government clients have included every cabinet-level department, most significantly HHS, DOS,DoD, and DoD.DoS. Federal government clients generated approximately 44%55%, 38%55%, and 41%47% of our revenue in 2020, 2019,2023, 2022, and 2018,2021, respectively. State and local government clients generated approximately 15%16%, 19%15%, and 14%15% of our revenue in 2020, 2019,each of 2023, 2022, and 2018,2021, respectively. International government clients generated approximately 6%5%, 8%6%, and 9% of our revenue in 2020, 2019,2023, 2022, and 2018,2021, respectively.
3439
We also serve a variety of commercial clients worldwide, including: airlines, airports, electric and gas utilities, health care companies, banks and other financial services companies, transportation, travel and hospitality firms, non-profits/associations, manufacturing firms, retail chains, and distribution companies. Our commercial clients, which include clients outside the U.S., generated approximately 35%24%, 35%24%, and 36%29% of our revenue in 2020, 2019,2023, 2022, and 2018,2021, respectively. We believe that our domain expertise and the program knowledge developed from our research and analytics, and assessment and advisory engagements further position us to provide a full suite of services.
We report operating results and financial data as a single segment based on the consolidated information used by our chief operating decision-maker in evaluating the financial performance of our business and allocating resources. Our single segment represents our core business: professional services for government and commercialto our broad array of clients. Although we describe our multiple service offerings to clients that operate in fourthree markets to provide a better understanding of the scope and scale of our business, we do not manage our business or allocate our resources based on those service offerings or client markets. Rather, on a project-by-project basis, we assemble the best team from throughout the enterprise to deliver highly customized solutions that are tailored to meet the needs of each client.
Notwithstanding the impact of COVID-19, weWe believe that, in the long-term, demand for our services will continue to grow as government, industry, and other stakeholders seek to address critical long-term societal and natural resource issues due to heightened concerns about the environment and use of clean energy and energy efficiency; health promotion, treatment, and cost control; the means by which healthcare can be delivered effectively on a cross-jurisdiction basis; natural disaster relief and rebuild efforts; and ongoing homeland security threats. In the wake of the major hurricanes (Harvey,(Ian, Harvey, Ida, Idalia, Irma, Maria, Laura and Michael) that devastated communities in Texas, Florida, North Carolina, Louisiana, the U.S. Virgin Islands, and Puerto Rico, the affected areas remain in various stages of relief and recovery efforts. We believe our prior and current experience with disaster relief and rebuild efforts, including those from Hurricanesafter hurricanes Katrina and Rita and Superstorm Sandy, put us in a favorable position to continue to provide recovery and housing assistance, and environmental and infrastructure solutions, including disaster mitigation, on behalf of federal departments and agencies, state, territorial, and local jurisdictions, and regional agencies.
We also see significant opportunity to further leverage our digital and client engagement capabilities across our commercial and government client base. Our future results will depend on the success of our strategy to enhance our client relationships and seek larger engagements that span the entire program life cycle, and to complete and successfully integrate additional strategic acquisitions. We will continue to focus on building scale in our vertical and horizontal domain expertise, developing business with both our government and commercialexisting clients as well as new customers, and replicating our business model in selective geographies. In doing so, we will continue to evaluate strategic acquisition opportunities, such as our recent acquisitionacquisitions of ITG,ESAC and Creative Systems in 2021, SemanticBits and Blanton in 2022, and CMY in 2023 that enhance our subject matter knowledge, broaden our service offerings, gain access to or expand customer relationships, and/or provide scale in specific geographies. Although we continue to see favorable long-term market opportunities, there are certain business challenges facing all government service providers. Administrative and legislative actions by the federal government to address changing priorities or in response to the budget deficit could have a negative impact on our business, which may result in a reduction to our revenue and profit and adversely affect cash flow. Similarly, the very nature of opportunities arising out of disaster recovery meanmeans they can involve unusual challenges. Factors such as the overall stress on communities and people affected by disaster recovery situations, political complexities and challenges among involved government agencies, and a higher-than-normal risk of audits and investigations may result in a reduction to our revenue and profit and adversely affect cash flow. However,flow; however, we believe we are well positioned to provide a broad range of services in support of initiatives that will continue to be priorities to the federal government, as well as to state and local and international governments and commercial clients. We believe that the combination of internally generated funds, available bank borrowings, and cash and cash equivalents on hand will provide the required liquidity and capital resources necessary to fund on-goingongoing operations, potential acquisitions, customary capital expenditures, and other working capital requirements.
40
Our results of operations and cash flows may vary significantly from quarter to quarter depending on a number of factors, including, but not limited to:
| • Progress of contract performance; • Extraordinary economic events and natural disasters; • Number of billable days in a quarter; • Timing of client orders; • Timing of award fee notices; • Changes in the scope of contracts; • Variations in purchasing patterns under our contracts; • Federal and state and local governments’ and other clients’ spending levels; • Federal government shutdowns; • Timing of billings to, and collection of payments from, clients; • Timing of receipt of invoices from, and payments to, employees and vendors; • Commencement, completion, and termination of contracts; • Strategic decisions, such as acquisitions, consolidations, divestments, spin-offs, joint ventures, strategic investments, and changes in business strategy; • Timing of significant costs and investments (such as bid and proposal costs and the costs involved in planning or making acquisitions); • Timing of events related to discrete tax items; • Our contract mix and use of subcontractors or the timing of other direct costs for which we may earn lower contract margin; • Changes in contract margin performance due to performance risks; • Additions to, and departures of, staff; • Changes in staff utilization; • Paid time off taken by our employees; • Level and cost of our debt; • Changes in accounting principles and policies; and/or • General market and economic conditions.
|
|
|
|
|
|
|
|
|
|
|
|
|
|
35
|
|
|
|
|
|
|
|
|
|
|
|
|
|
|
|
|
|
|
|
|
|
|
|
|
|
|
|
|
|
|
|
Because a significant portion of our expenses (such as personnel, facilities, and related costs) are fixed in the short-term, contract performance and variation in the volume of activity, as well as in the number and volume of contracts commenced or completed during any year, may cause significant variations in operating results from year to year. We generally have been able to price our contracts in a manner that accommodates the rates of inflation experienced in recent years, although we cannot ensure that we will be able to do so in the future.
IMPACT OF THE COVID-19 PANDEMIC
On March 11, 2020, the World Health Organization characterized the novel strain of coronavirus disease COVID-19 as a global pandemic. There continues to be significant uncertainty as to the effects of this pandemic on the global economy, which may impact, among other things, our operations, balance sheet, results of operations or cash flows. Adverse events such as health-related concerns about working in our offices, the inability to travel, the potential impact on our employees, clients, subcontractors and other suppliers and business partners, a slow-down in customer decision-making that affects procurement cycles, a reprioritization of client spending, and other matters affecting the general work and business environment have harmed, and could continue to harm, our business and delay the implementation of our business strategy. We cannot fully anticipate all the ways in which the current global health crisis, economic slowdown and financial market conditions will adversely impact our business in the future. The longer the duration of the pandemic, the advent of new strains of the virus and challenges faced in the rollout of vaccines, the more likely it is that it could have an adverse effect on our business, financial position, results of operations and/or cash flows.
We are primarily a service business, and our staffing, and that of our subcontractors, has been maintained, substantially on a work from home basis, fortunately with little COVID-19 illness among our staff. To date we have experienced continuity in the majority of our work for our government clients, which accounted for approximately 65% of our revenues for the twelve months ended December 31, 2020. There have been postponements of events and challenges around some project work requiring travel, but overall, our government clients have continued to require our services. We are unable to predict whether, and to what extent, this trend will continue. It would be reasonable to expect that some deterioration of certain client activities has occurred and will continue to occur due to COVID-19, but there is also the possibility of additional demand from federal agencies such as the CDC, HHS, and the Federal Emergency Management Agency, as well as state and local and international government agencies.
36
Of the remaining 35% of our total revenue for the twelve months ended December 31, 2020, the majority was generated from commercial energy markets and commercial marketing services, each of which represented roughly half of that total. In commercial energy, where we work primarily for utility clients, we have experienced trends similar to those with our government clients, although some aspects of energy efficiency programs have been put on hold as they involve direct interaction with consumers. In our commercial marketing services, a key component of our business is our industry-leading loyalty platform, where we have long-term implementation contracts, and we believe our clients, many of which are in the hospitality space, will continue to stay engaged with their most loyal customers. The other parts of commercial marketing services, which include public event management and marketing technology, were impacted based on the restriction upon travel worldwide and the deferral or cancellation of marketing events. Some of these commercial clients perform work in travel-related markets and have been severely impacted by the COVID-19 pandemic. As a result, we are monitoring that business area closely. These elements of commercial marketing services represented less than 16% of our total Company-wide revenues for the twelve months ended December 31, 2020.41
BUSINESS COMBINATIONS
We are monitoring the evolving situation related to the COVID-19 pandemic and we continue to work with our stakeholders to assess further possible implications to our business and to take actions in an effort to mitigate adverse consequences. To protect employee health and safety while COVID-19 remains a threat, we plan to continue to deliver a majority of our services to clients remotely for the foreseeable future and continue to evaluate our return to office plans. While the Coronavirus Aid, Relief and Economic Security (“CARES”) Act contains a provision that allows federal contractors to seek specified reimbursement for certain employees who are unable to perform their contract requirements due to government restrictions, we believe we have limited claims under the CARES Act, and reimbursements are also subject to limitations and do not extend past December 31, 2020. Additionally, we exercised the option to defer payment of the employer portion of the Social Security tax, with 50% to be repaid by December 31, 2021 and the remainder by December 31, 2022. We deferred payment of approximately $20.9 million of employer Social Security taxes during the twelve months ended December 31, 2020.
As part of management actions to counter the impact of COVID-19, we continue to align our costs with anticipated revenues. In the U.S. and in our international operations, we have used staff reductions, furloughs, and other temporary wage reduction programs in response to the pandemic. We incurred $2.1 million in severance costs related to unanticipated terminations associated with COVID-19. We are currently participating in several international government subsidy programs, providing approximately $3.0 million as of December 31, 2020, whose objective is to encourage eligible companies to keep employees on the payroll during the COVID-19 pandemic. A requirement of these subsidies is that we continue to employ the identified employees who might otherwise have been impacted by a reaction to COVID-19. The subsidies are limited in the amount and time in which payroll costs are covered.
BUSINESS COMBINATIONS
A key element of our growth strategy is to pursue acquisitions. During the previous three fiscal years, we completed five acquisitions summarized as follows:
ESAC – In 2018,November 2021, we acquired The Future Customer (“TFC”), DMS Disaster Consultants (“DMS”), and We Are Vista Limited (“Vista”). In January 2020 and December 2020, we completed the acquisitions of ITG and Eco-Tech Consultants, Inc. (“Eco-Tech”). While providing capabilities and access to new clients in support of our growth strategy, these acquisitions were not significant to our financial statements taken as a whole.
The Future Customer – In January 2018, we acquired TFC, a leading boutique loyalty strategy and marketing company based in London, U.K. The acquisition of TFC enhanced and extended our customer loyalty business to Europe.
DMS Disaster Consultants – In August 2018, we acquired DMS, a disaster management and recovery firm based in Florida, to broaden our capabilities in support of assisting communities, businesses and individuals recover from man-made and nature disasters. DMS assists public sector clients with man-made and natural disaster planning and preparedness, and post-disaster response and recovery efforts by assisting clients in obtaining federal funding from Federal the Emergency Management Agency (FEMA), insurance companies, and other sources.
We Are Vista Limited – In October 2018, we acquired Vista, a communications company headquartered in Leeds, U.K., with an additional presence in London. Vista provides advisory services and solutions to clients in the financial, retail, automobile, and energy industries and broadens our capabilities in the region.
37
Incentive Technology Group, LLC – In January 2020, we completed the acquisition of ITG,ESAC, one of the leading specialized providers of cloud-based platform servicesadvanced health analytics, research data management, and bioinformatics solutions to theU.S. federal government. ITG provides solutions through the adoption of next generation technologies for federal government agencies, many of which are among our long-standing clients.health agencies.
Eco-Tech Consultants, Inc.Creative Systems and Consulting – In December 2020,2021, we completed the acquisitionacquired Creative Systems, a premier provider of Eco-Tech,IT modernization and digital transformation solutions to U.S. federal agencies.
SemanticBits, LLC – In July 2022, we acquired SemanticBits, a premier partner to U.S. federal health agencies for mission-critical digital modernization solutions.
Blanton & Associates – In September 2022, we acquired Blanton & Associates, an ecologicalenvironmental consulting, firm located in Louisville, Kentucky. The firm provides a range of ecological services across the Eastern United Statesplanning, and will greatly increase our capacityproject management firm.
CMY Solutions, LLC – In May 2023, we acquired CMY, an engineering and automation solutions provider to support a growing portfolio of transportation agency clients in the Eastern United States.utilities and organizations.
CRITICAL ACCOUNTING ESTIMATES AND POLICIES
Our discussion of our financial condition and results of operations is based on our consolidated financial statements prepared in accordance with U.S. GAAP.generally accepted accounting principles (“U.S. GAAP”). The preparation of these consolidated financial statements requires us to make certain estimates, assumptions, and judgments that affect the reported amounts of assets, liabilities, revenue, and expenses during the reporting period and our application of critical accounting policies, including: revenue recognition, impairment of goodwill and other intangible assets, income taxes, and stock-based compensation.expenses. If any of these estimates, assumptions or judgments prove to be incorrect, our reported results could be materially affected. Actual results may differ significantly from our estimates under different assumptions or conditions.
We believe that the estimates, assumptions, and judgments involved in the accounting practices described below have the greatest potential impact on our financial statements and, therefore, consider them to be critical accounting policies. Significant accounting policies, including the critical accounting policies listed below,estimates are more fully described and discussed in “Note 2—2 - Summary of Significant Accounting Policies” in the “Notes to Consolidated Financial Statements.”Statements”.
Revenue Recognition
We generate our revenue by primarily provideproviding services and technology-based solutions for clients that operate in a variety of markets and the solutions may span the entire program life cycle, from initial research and analysis to the design and implementation of solutions.clients. We enter into agreements with clients that create enforceable rights and obligations and for which it is probable that we will collect the consideration to which we will be entitled as services and solutions are transferredprovided to the client. Except
Our contracts may be partially funded, often incrementally in certain narrowly defined situations, our agreements with our clients are written and revenue is generally not recognized on oral or implied arrangements.annual amounts. We recognize revenuedetermine the transaction price based on the consideration specified inhistory of funding, the applicable agreementclient's need for the program, the length of time before funding is available, and exclude from revenue amounts collectedthe client's intent and ability to fund and include the unfunded portion of the contract if it is probable that it will be funded based on behalf of third parties. Accordingly, sales and similar taxes which are collected for third parties are excluded from the transaction price.these criteria.
We also evaluate whether two or more agreements should be accounted for as one single contract and whether combined or single agreements should be accounted for as more than one performance obligation. For most contracts the client requires that we perform a number of tasks in providing an integrated output and, hence, each of these contracts is tracked as having only one performance obligation. When contracts are separated intowith multiple performance obligations we allocate the total transaction price to each performance obligation based on the estimated relative standalone selling prices of the promised services underlying each performance obligation. We generally provideand for customized solutions in which the pricing is based on specific negotiations with each client, and, in these cases, we use a cost-plus margin approach to estimate the standalone selling price of each performance obligation. It is common for our long-term contracts to contain award fees, incentive fees or other provisions that can either increase or decrease the transaction price. These variable amounts are generally awarded at the completion of a prescribed performance assessment period based on the achievement of performance metrics, program milestones or cost targets, and the amount awarded may be subject to client discretion. Variable consideration is estimated based on the most likely amount. Estimates of variable consideration will be constrained only to the extent that it is probable that significant reversal in the amount of cumulative revenue recognized will not occur.
38
We evaluate contractual arrangements to determine whether revenue should be recognized on a gross versus net basis. Our assessment is based on the nature of the promise to the client. In most cases, we agree to provide specified services to the client as a principal and revenue is recognized on a gross basis. In certain instances, we act as an agent and merely arrange for another party to provide services to the client and revenue is recognized on a net basis in reflection of the fact that we do not control the goods or services provided to the client by the other party.
Long-term contracts typically contain billing terms that provide for invoicing monthly or upon completion of milestones and payment on a net 30-day basis. Exceptions to monthly billing terms are to ensure that we perform satisfactorily rather than representing a significant financing component. For cost-based contracts, our performance is evaluated during a contractually stipulated performance period and, while contract costs may be billed on a monthly basis, we are generally permitted to bill for incentive or award fees only after the completion of the performance assessment period, which may occur quarterly, semi-annually or annually, and after the client completes the performance assessment. Fixed-price contracts may provide for milestone billings based on the attainment of specific project objectives and, since they are tied to our project performance, these type of billing terms do not represent a significant financing component. Moreover, contracts may require retentions or hold backs that are paid at the end of the contract to ensure that we perform in accordance with requirements which do not represent our providing financing to our clients but rather are a means to ensure that we meet contract requirements. We do not assess whether a contract contains a significant financing component if we expect, at contract inception, that the period between payment by the client and the transfer of promised services to the client will be one year or less.
As a service provider, we generally recognize revenue over time as control isservices and performance obligations are transferred to athe client, based on the extent of progress towards satisfaction of the performance obligation. The selection of the method used to measure progress requires judgment and, among other things, is dependent on the contract type selected by the client during contract negotiation and the nature of the services and solutions to be provided.
When a performance obligation is billed using a time-and-materials contract type, we use the right to invoice practical expedient output progress measures to estimate revenue earned based on hours worked in contract performance at negotiated billing rates. Fixed-price level-of-effort contracts are substantially similar to time-and-materials contracts except that we are required to deliver a specified level of effort over a stated period of time. For these contracts, we estimate revenue earned using contract hours worked at negotiated bill rates as we deliver the contractually required workforce.
For cost-based contracts, we recognize revenue as a single performance obligation based on contract costs incurred, as we become contractually entitled to reimbursement of the contract costs, plus a most likely estimate of award or incentive fees earned on those costs even though final determination of fees earned occurs after the contractually stipulated performance assessment period ends. For the years ended December 31, 2023, 2022, and 2021, revenue from cost-based contracts totaled $265.3 million, $263.7 million, and $274.1 million, respectively.
42
For performance obligations requiring the delivery of a service for a fixed price, we use the ratio of actual costs incurred to total estimated costs at completion (“EAC”) provided that costs incurred (an input method) represents a reasonable measure of progress towards the satisfaction of a performance obligation, in order to estimate the portion of total revenue earned. This method provides a faithful depiction of the transfer of value to the client when we are satisfying a performance obligation that entails integration of tasks for a combined output, which requires us to coordinate the work of employees, subcontractors and delivery of other contract costs. Contract costs that are not reflective of our progress toward satisfying a performance obligation are not included in the calculation of the measure of progress. When this methodWe estimate the EAC by making certain assumptions and judgments such as the level of efforts from internal staff and/or subcontractors and cost of materials needed to complete the tasks. Our cost estimate is used, changesbased on our prior experience and expertise in estimateddelivery of similar services, which allow us to make reasonable assumptions and estimates that are close to actual costs to complete these obligations result in adjustments to revenue on a cumulative catch-up basis, which causes the effect of revised estimates for prior periods to be recognizedobligations; however, changes in the current period. Changesscope or complexity of work, availability of materials needed, or performance could cause a change in these estimates canthe EAC. We routinely occur overreview EACs for changes that could materially impact our measurement of progress toward completion of the performance obligations and adjust our revenue in the period that the changes occur. When a contract performance for a varietyEAC exceeds the contract value, we recognize the loss in the same period of reasons,determination. For the years ended December 31, 2023, 2022, and 2021, our revenue from contracts in which include: changes in contract scope; changes in contract cost estimates due to unanticipated cost growthwe use EACs totaled $310.1 million, $287.4 million, and $253.6 million, respectively.
Our contracts may include variable considerations such as award fees and incentives that may increase or reassessments of risks impacting costs; changes in estimated incentive or award fees; or performing better or worse than previously estimated.
In some fixed price service contracts, we perform servicesdecrease the transaction price. The actual amounts are typically determined and awarded at the end of a recurring nature, such as maintenance and other services of a “stand ready” nature. For these contracts, we have the right to consideration in an amount that corresponds directly with the value that the client has received. Therefore, we record revenue on a time-elapsed basis to reflect the transfer of control to the client throughout the contract.
39
Our operating cycle for long-term contracts may be greater than one year and is measured by the average time intervening between the inceptionperformance period and the completion of those contracts. Contract-related assets and liabilities, as highlighted below, are classified as current assets and current liabilities. Significant balance sheet accounts related tofinal awarded amount is based on achieving certain performance metrics, program milestones, or cost targets at the revenue recognition cycle are as follows:
Contract receivables, net – This account includes amounts billed or billable under contract terms. The amounts due are stated at their net realizable value.customer’s discretion. We maintain an allowance for doubtful accounts to provide for the estimated amount of receivables that will not be collected. We consider a number of factors in our estimate of the allowance, including knowledge of a client’s financial condition, its historical collection experience, and other factors relevant to assessing the collectability of the receivables.
Contract assets – This account includes unbilled amounts typically resulting from revenue recognized on contracts when the amount of revenue recognized exceeds the amounts billed. It also includes contract retainages until we have met the contract-stipulated requirements for payment. Contract assets are reported in a net position on a contract-by-contract basis each period even though individual contracts may contain multiple performance obligations. On a contract-by-contract basis, amounts do not exceed their net realizable value.
Contract liabilities – This account consists of advance payments received and billings in excess of revenue recognized on contracts. Contract liabilities are reported in a net position on a contract-by-contract basis each period even though individual contracts may contain multiple performance obligations.
Revenue recognition entails the use of significant judgment, including, but not limited to, the following: evaluating agreements in terms of the number and nature of performance obligations; determining the appropriate method for measuring progress of the satisfaction of obligations; and preparing estimates in terms of the amount of progress that we have made. Most of our revenue is recognized over time and for many fixed-price contracts, in particular, we estimate the proportion of total revenue earned using the ratio of contract costs incurred to total estimated contract costs, which requires us to prepare estimates as work progresses of contract cost left to be incurred. Moreover, some of our contracts include variable consideration, which requires us to estimate the most likely amounts that will be earned overamount expected to achieve based on our prior history in providing the respective contractually stipulated performance assessment periods. For these obligations, changes in estimates result in cumulative catch-up adjustments and may have a significant impact on earnings during a given period. services to the customer or, if no history exists, we constrain the variable consideration until the initial determination by the customer.
Payments on cost-based contracts with the U.S. Federal government are provisional payments subject to audit and adjustment. Fair Value of Acquired Assets from Business Combinations
Our USAID-cognizant indirect cost rates have been finalized throughconsolidated balance sheets as of December 31, 2014,2023 and its NIH-cognizant cost rates have been finalized2022 include $94.9 million and $126.5 million, respectively, of net intangible assets that were created through December 31, 2011. Contract revenue have been recorded in amounts that are expected to be realized upon final audit and cost settlement and we do not believe any additional, material revenue adjustments will result from finalizingbusiness acquisitions.
We allocate the indirect rates and closing open audit years.
We prepare client invoices in accordance with the terms of the applicable contract, and billing terms may not be directly related to the performance of services. Contract assets are invoiced based on the achievement of specific events as defined by each contract, including deliverables, timetables, and incurrence of certain costs. Contract assets are classified as a current asset. Advanced billings to clients in excess of revenue earned are recorded as contract liabilities until the revenue recognition criteria are met. Reimbursements of out-of-pocket expenses are included in revenue with corresponding costs incurred by us included in the cost of revenue. We record revenue net of taxes collected from clients when the taxes are collected on behalf of the governmental authorities.
We may proceed with work based on client direction prior to the completion and signing of formal contract documents. We have a review process for approving any such work. Revenue associated with such work is recognized only when it can be reliably estimated, and realization is probable. We base our estimates on a variety of factors, including previous experiences with the client, communications with the client regarding funding status, and our knowledge of available funding for the contract.
Goodwill and Other Intangible Assets
The purchase price of an acquired business is allocated to the tangible assets and separately identifiable intangible assets acquired, less liabilities assumed, based on their respective fair values (except for contract assets and contract liabilities after the adoption of Accounting Standards Update 2021-08, Business Combinations: Accounting for Contract Assets and Contract Liabilities from Contracts with the excess recorded as goodwill. Goodwill represents the excess of costs over theCustomers). Such fair value of net assets of businesses acquired. Goodwillassessment requires us to make assumptions, judgments, and intangible assets acquired in a purchase business combinationestimates such as, but not limited to, future cash flows, revenue growth, customer retention rates, and determined to have an indefinite useful life are not amortized, but instead are reviewed annually for impairment, or more frequently if impairment indicators arise. Intangible assets with estimable useful lives are amortized over such lives and reviewed for impairment if impairment indicators arise. As of December 31, 2020, goodwill and intangibles assets were $909.9 million and $59.9 million, respectively.
40
For the purpose of performing the annual goodwill impairment review as of October 1, 2020, as our business is highly integrated and all of our components have similar economic characteristics, we have concluded we have one aggregated reporting unit at a consolidated entity level. We assess goodwilldiscount rates based on information that exists at the reporting level. For the goodwill impairment test, we opted to perform a qualitative assessment of whether it is more likely than not that the reporting unit's fair value is less than its carrying amount. If, after completing the qualitative assessment, we determine that it is more likely than not that the estimated fair valuedate of the reporting unit exceededacquisition which may subsequently change. We recognize any adjustments to the carrying amount, we may concludepreliminary amounts that no impairment exists. If we conclude otherwise, a goodwill impairment test must be performed,are identified during the measurement period which includes a comparisonis twelve months or less from the date of the fair value of the reporting unit to its carrying amount and recognizing, as an impairment loss, the difference of the estimated fair value of the reporting unit over its carrying amount.acquisition.
Our qualitative analysis as of October 1, 2020 included macroeconomic and industry and market-specific considerations, financial performance indicators and measurements, and other factors. Based on this qualitative assessment, we determined that it is more likely than not that the fair value of our one reporting unit exceeded its carrying amount, and thus the impairment test was not required to be performed. Historically, we have not recorded any impairment charges for goodwill.
We are required to review other intangible assets and long-lived assets for impairment whenever events or changes in circumstances indicate that the carrying amount of an asset might not be recoverable. In the fourth quarter of 2020 management evaluated its existing operating lease facilities and elected to discontinue the use of 16 leased facilities in advance of the lease termination date resulting in a $4.9 million charge for early contract termination. The $4.9 million charge included $3.1 million of impairment, $1.5 million of termination fees and $0.3 million of a loss on the disposition of related fixed assets and other costs.
Accounting for Income Taxes
Our provisions for federal, state, and foreign income taxes are calculated from consolidated income based on current tax laws and any changes in tax rates from the rates used previously in determining the deferred tax assets and liabilities from temporary differences between financial statement carrying amounts and amounts on our tax returns.
We recognize deferred tax assets and liabilities for the expected future tax consequences of temporary differences between the financial statement carrying amounts of existing assets and liabilities and their respective tax bases. Deferred tax assets and liabilities are measured using enacted tax rates in effect for the year in which those temporary differences are expected to be recovered or settled. We evaluate our ability to benefit from all deferred tax assets and establish valuation allowances for amounts we believe are not more likely than not to be realized.
We use a more-likely-than-not recognition threshold based on the technical merits of the income tax position taken to evaluate uncertain tax positions. Uncertain tax positions that meet the more-likely-than-not recognition threshold are measured in order to determine the tax benefit recognized in the financial statements. Penalties, if probable and reasonably estimable, and interest expense related to uncertain tax positions are not recognized as a component of income tax expense but recorded separately in indirect expenses or interest expense, respectively.
Stock-based Compensation
The ICF International, Inc. 2018 Omnibus Incentive Plan, as amended, (the “2018 Omnibus Plan”) provides for the granting of stock options, stock appreciation rights, restricted stock, restricted stock units (“RSUs”), performance shares, performance units, cash-based awards, and other stock-based awards to all officers, key employees, and non-employee directors. The 2018 Omnibus Plan replaced the previous 2010 Omnibus Incentive Plan (the “Prior Plan”). As of December 31, 2020, there were approximately 1,107,968 shares available for grant under the 2018 Omnibus Plan.
We utilize cash settled RSUs (“CSRSUs”) which are settled only in cash payments. The cash payment is calculated by multiplying the number of CSRSUs vested by our closing stock price on the vesting date, subject to a maximum payment cap and a minimum payment floor. CSRSUs have no impact on the shares available for grant under the 2018 Omnibus Plan and have no impact on the calculated shares used in EPS calculations.
We began granting awards of registered shares to our non-employee directors on an annual basis under the 2018 Omnibus Plan in the third quarter of 2018. Previously, under the Prior Plan, we granted awards of unregistered shares to the directors under the Annual Equity Election program. Those awards were issued from treasury stock and had no impact on the shares available for grant under the Prior Plan.
41
We recognized total compensation expense relating to stock-based compensation of $24.6 million, $26.0 million, and $19.6 million for the years ended December 31, 2020, 2019, and 2018, respectively. We recognize stock-based compensation expense for stock options, restricted stock awards, and RSUs on a straight-line basis over the requisite service period, which is generally the vesting period. We treat CSRSUs as liability-classified awards, and account for them at fair value based on the closing price of our stock at the balance sheet date. We recognize expense for performance-based share awards (“PSAs”), which are subject to a performance condition and a market condition, on a straight-line basis over the performance period. Non-employee director awards are expensed over the performance period.
Stock-based compensation expense is based on the estimated fair value of these instruments and the estimated number of shares ultimately expected to vest. The calculation of the fair value of the awards requires certain inputs that are subjective and changes to the estimates used will cause the fair value of stock awards and related stock-based compensation expense to vary. The fair value of stock options, restricted stock awards, RSUs, PSAs and non-employee director awards is estimated based on the fair value of a share of common stock at the grant date. We have elected to use the Black-Scholes-Merton option pricing model to determine the fair value of stock options. The fair value of a stock option award is affected by the price of our stock on the date of grant, as well as other assumptions used as inputs in the valuation model. These assumptions include the estimated volatility of the price of our stock over the term of the awards, the estimated period of time that we expect employees will hold stock options, and the risk-free interest rate. The fair value of PSAs is estimated using a Monte Carlo simulation model.
We are required to adjust stock-based compensation expense for the effects of estimated forfeitures of awards over the expense recognition period. We estimate the rate of future forfeitures based on factors which include our historical experience, but the amount of actual forfeitures may differ from current estimates particularly if the rate of future forfeitures is different from previous experience. In addition, the estimation of PSAs that will ultimately vest requires judgment in terms of estimates of future performance. To the extent actual forfeitures differ from estimated forfeitures and actual performance or updated performance estimates differ from current estimates, such expense amounts are recorded as a cumulative adjustment in the period the estimates are revised. See “Note 15—Accounting for Stock-based Compensation” in the “Notes to Consolidated Financial Statements” for further discussion.
Recent Accounting Pronouncements
New accounting standards are discussed in “Note 2���2 - Summary of Significant Accounting Policies” in the “Notes to Consolidated Financial Statements.”Statements”.
43
SELECTED KEY METRICS
In order to evaluate operations, we track revenue by key metrics that provide useful information about the nature of our operations. Client markets provide insight into the breadth of our expertise. Client type is an indicator of the diversity of our client base. Revenue by contract mix provides insight in terms of the degree of performance risk that we have assumed. Significant variances in the key metrics tables that are provided below are discussed under the revenue section of the results of operations.
Client markets
The following table shows revenue generated from client markets as a percentpercentage of total revenue for the periods indicated. For each client, we have attributed all revenue from that client to the market we consider to be the client’s primary market, even if a portion of that revenue relates to a different market. market. Certain minor revenue amounts reported in the prior years have been reclassified within key market categories based on our current view of the client’s primary market in order to increase the comparability of the current year to prior years.
| Year ended December 31, 2020 |
|
| Year ended December 31, 2019 |
|
| Year ended December 31, 2018 |
| ||||||||||||
| Dollars |
| Percent |
|
| Dollars |
| Percent |
|
| Dollars |
| Percent |
| ||||||
Energy, environment, and infrastructure | $ | 616,296 |
|
| 41 | % |
| $ | 663,799 |
|
| 45 | % |
| $ | 564,736 |
|
| 42 | % |
Health, education, and social programs |
| 670,618 |
|
| 44 | % |
|
| 567,351 |
|
| 38 | % |
|
| 535,578 |
|
| 40 | % |
Safety and security |
| 117,979 |
|
| 8 | % |
|
| 118,279 |
|
| 8 | % |
|
| 111,660 |
|
| 8 | % |
Consumer and financial |
| 101,982 |
|
| 7 | % |
|
| 129,096 |
|
| 9 | % |
|
| 125,999 |
|
| 10 | % |
Total | $ | 1,506,875 |
|
| 100 | % |
| $ | 1,478,525 |
|
| 100 | % |
| $ | 1,337,973 |
|
| 100 | % |
| Year ended |
|
| Year ended |
|
| Year ended |
| |||||||||||||||
(dollars in thousands) | Dollars |
|
| Percent |
|
| Dollars |
|
| Percent |
|
| Dollars |
|
| Percent |
| ||||||
Client Markets: |
|
|
|
|
|
|
|
|
|
|
|
|
|
|
|
|
| ||||||
Energy, environment, infrastructure, and disaster recovery | $ | 806,482 |
|
|
| 41 | % |
| $ | 714,628 |
|
|
| 40 | % |
| $ | 693,572 |
|
|
| 45 | % |
Health and social programs |
| 814,454 |
|
|
| 42 | % |
|
| 704,465 |
|
|
| 40 | % |
|
| 563,590 |
|
|
| 36 | % |
Security and other civilian & commercial |
| 342,302 |
|
|
| 17 | % |
|
| 360,871 |
|
|
| 20 | % |
|
| 295,886 |
|
|
| 19 | % |
Total | $ | 1,963,238 |
|
|
| 100 | % |
| $ | 1,779,964 |
|
|
| 100 | % |
| $ | 1,553,048 |
|
|
| 100 | % |
42
Our primary clients within the client markets are the agencies and departments of the federal government and commercial clients. Most of our revenue is from contracts on which we are the prime contractor, which we believe provides us with strong client relationships. In 2020, 2019,2023, 2022, and 2018,2021, approximately 92%89%, 92%91%, and 92%91% of our revenue, respectively, was from prime contracts.
Client type
The table below shows our revenue by type of client as a percentage of total revenue for the periods indicated. Certain immaterial revenue amounts in the prior years have been reclassified due to minor adjustments and reclassification within client type.
| Year ended December 31, 2020 |
|
| Year ended December 31, 2019 |
|
| Year ended December 31, 2018 |
| |||||||||||||||||||||||||||||||||||
| Dollars |
| Percent |
|
| Dollars |
| Percent |
|
| Dollars |
| Percent |
| Year ended |
|
| Year ended |
|
| Year ended |
| |||||||||||||||||||||
(dollars in thousands) | Dollars |
|
| Percent |
|
| Dollars |
|
| Percent |
|
| Dollars |
|
| Percent |
| ||||||||||||||||||||||||||
Client Type: |
|
|
|
|
|
|
|
|
|
|
|
| |||||||||||||||||||||||||||||||
U.S. federal government | $ | 666,961 |
|
| 44 | % |
| $ | 560,953 |
|
| 38 | % |
| $ | 546,050 |
|
| 41 | % | $ | 1,084,043 |
|
|
| 55 | % |
| $ | 980,746 |
|
|
| 55 | % |
| $ | 735,032 |
|
|
| 47 | % |
U.S. state and local government |
| 222,730 |
| 15 | % |
|
| 279,833 |
| 19 | % |
|
| 183,900 |
| 14 | % |
| 308,134 |
|
|
| 16 | % |
|
| 259,764 |
|
|
| 15 | % |
|
| 235,416 |
|
|
| 15 | % | |||
International government |
| 95,734 |
|
| 6 | % |
|
| 122,125 |
|
| 8 | % |
|
| 122,186 |
|
| 9 | % |
| 103,399 |
|
|
| 5 | % |
|
| 103,609 |
|
|
| 6 | % |
|
| 139,229 |
|
|
| 9 | % |
Government |
| 985,425 |
|
| 65 | % |
|
| 962,911 |
|
| 65 | % |
|
| 852,136 |
|
| 64 | % |
| 1,495,576 |
|
|
| 76 | % |
|
| 1,344,119 |
|
|
| 76 | % |
|
| 1,109,677 |
|
|
| 71 | % |
Commercial |
| 521,450 |
|
| 35 | % |
|
| 515,614 |
|
| 35 | % |
|
| 485,837 |
|
| 36 | % |
| 467,662 |
|
|
| 24 | % |
|
| 435,845 |
|
|
| 24 | % |
|
| 443,371 |
|
|
| 29 | % |
Total | $ | 1,506,875 |
|
| 100 | % |
| $ | 1,478,525 |
|
| 100 | % |
| $ | 1,337,973 |
|
| 100 | % | $ | 1,963,238 |
|
|
| 100 | % |
| $ | 1,779,964 |
|
|
| 100 | % |
| $ | 1,553,048 |
|
|
| 100 | % |
Contract mix
Contract mix varies from year to year due to numerous factors, including our business strategies and the procurement activities of our clients. Unless the context requires otherwise, we use the term “contracts” to refer to contracts and any task orders or delivery orders issued under a contract. There are three main types of contracts: time-and-materials contracts, fixed-price contracts, and cost-based contracts. For a detailed discussion of contract types, see “Critical Accounting Policies - Revenue Recognition” above.
44
The following table shows the approximate percentage of our revenue for each of these types of contracts for the periods indicated. Certain immaterial revenue amounts in the prior years have been reclassified due to minor adjustments and reclassification within contract type.mix.
| Year ended December 31, 2020 |
|
| Year ended December 31, 2019 |
|
| Year ended December 31, 2018 |
| |||||||||||||||||||||||||||||||||||
| Dollars |
| Percent |
|
| Dollars |
| Percent |
|
| Dollars |
| Percent |
| Year ended |
|
| Year ended |
|
| Year ended |
| |||||||||||||||||||||
(dollars in thousands) | Dollars |
|
| Percent |
|
| Dollars |
|
| Percent |
|
| Dollars |
|
| Percent |
| ||||||||||||||||||||||||||
Contract Mix: |
|
|
|
|
|
|
|
|
|
|
|
| |||||||||||||||||||||||||||||||
Time-and-materials | $ | 749,844 |
|
| 50 | % |
| $ | 700,980 |
|
| 48 | % |
| $ | 581,446 |
|
| 44 | % | $ | 812,430 |
|
|
| 41 | % |
| $ | 713,693 |
|
|
| 40 | % |
| $ | 633,135 |
|
|
| 41 | % |
Fixed-price |
| 529,157 |
| 35 | % |
|
| 566,299 |
| 38 | % |
|
| 526,751 |
| 39 | % |
| 885,465 |
|
|
| 45 | % |
|
| 802,568 |
|
|
| 45 | % |
|
| 645,809 |
|
|
| 41 | % | |||
Cost-based |
| 227,874 |
|
| 15 | % |
|
| 211,246 |
|
| 14 | % |
|
| 229,776 |
|
| 17 | % |
| 265,343 |
|
|
| 14 | % |
|
| 263,703 |
|
|
| 15 | % |
|
| 274,104 |
|
|
| 18 | % |
Total | $ | 1,506,875 |
|
| 100 | % |
| $ | 1,478,525 |
|
| 100 | % |
| $ | 1,337,973 |
|
| 100 | % | $ | 1,963,238 |
|
|
| 100 | % |
| $ | 1,779,964 |
|
|
| 100 | % |
| $ | 1,553,048 |
|
|
| 100 | % |
Payments to uswe received on cost-based contracts with the federal government are provisional payments subject to adjustment upon audit by the government. Such audits have been finalized through 2011 for NIH-cognizant indirect rates and through 2014 for USAID-cognizant indirect rates, and any adjustments have been immaterial. Contract revenue for subsequent periods has been recorded in amounts that are expected to be realized on final audit and settlement of costs in those years. costs.
43
RESULTS OF OPERATIONS
The following table sets forth certain items from our consolidated statements of comprehensive income for the years ended December 31, 2023 and 2022 and expresses these items as a percentage of revenue for the periods indicated and the period-over-period rate of change in each of them. Our discussion of the items for the years ended December 31, 2022 and 2021 can be found in our Annual Report on Form 10-K for the year ended December 31, 2022, which was filed with the SEC on March 1, 2023.
Years Ended December 31, 2020, 2019,2023 and 20182022
(dollars in thousands)
|
| Year Ended December 31, |
|
| Year to Year Change |
| |||||||||||||||||||
|
| 2023 |
|
| 2022 |
|
|
| 2023 |
|
| 2022 |
|
| 2022 to 2023 |
| |||||||||
|
| Dollars |
| Percentages |
|
| Dollars |
|
| Percent |
| ||||||||||||||
Revenue |
| $ | 1,963,238 |
|
| $ | 1,779,964 |
|
|
|
| 100.0 | % |
|
| 100.0 | % |
| $ | 183,274 |
|
|
| 10.3 | % |
Direct Costs: |
|
|
|
|
|
|
|
|
|
|
|
|
|
|
|
|
|
|
| ||||||
Direct labor & related fringe |
|
| 730,322 |
|
|
| 639,861 |
|
|
|
| 37.2 | % |
|
| 35.9 | % |
|
| 90,461 |
|
|
| 14.1 | % |
Subcontractors & other direct costs |
|
| 534,696 |
|
|
| 494,561 |
|
|
|
| 27.2 | % |
|
| 27.8 | % |
|
| 40,135 |
|
|
| 8.1 | % |
Total Direct Costs |
|
| 1,265,018 |
|
|
| 1,134,422 |
|
|
|
| 64.4 | % |
|
| 63.7 | % |
|
| 130,596 |
|
|
| 11.5 | % |
Operating Costs and Expenses |
|
|
|
|
|
|
|
|
|
|
|
|
|
|
|
|
|
|
| ||||||
Indirect and selling expenses |
|
| 505,162 |
|
|
| 486,863 |
|
|
|
| 25.7 | % |
|
| 27.4 | % |
|
| 18,299 |
|
|
| 3.8 | % |
Depreciation and amortization |
|
| 25,277 |
|
|
| 21,482 |
|
|
|
| 1.3 | % |
|
| 1.2 | % |
|
| 3,795 |
|
|
| 17.7 | % |
Amortization of intangible assets |
|
| 35,461 |
|
|
| 28,435 |
|
|
|
| 1.8 | % |
|
| 1.6 | % |
|
| 7,026 |
|
|
| 24.7 | % |
Total Operating Costs and Expenses |
|
| 565,900 |
|
|
| 536,780 |
|
|
|
| 28.8 | % |
|
| 30.2 | % |
|
| 29,120 |
|
|
| 5.4 | % |
Operating Income |
|
| 132,320 |
|
|
| 108,762 |
|
|
|
| 6.7 | % |
|
| 6.1 | % |
|
| 23,558 |
|
|
| 21.7 | % |
Interest, net |
|
| (39,681 | ) |
|
| (23,281 | ) |
|
|
| (2.0 | )% |
|
| (1.3 | )% |
|
| (16,400 | ) |
|
| 70.4 | % |
Other income (expense) |
|
| 3,908 |
|
|
| (1,501 | ) |
|
|
| 0.2 | % |
|
| (0.1 | )% |
|
| 5,409 |
|
|
| (360.4 | )% |
Income Before Income Taxes |
|
| 96,547 |
|
|
| 83,980 |
|
|
|
| 4.9 | % |
|
| 4.7 | % |
|
| 12,567 |
|
|
| 15.0 | % |
Provision for Income Taxes |
|
| 13,935 |
|
|
| 19,737 |
|
|
|
| 0.7 | % |
|
| 1.1 | % |
|
| (5,802 | ) |
|
| (29.4 | )% |
Net Income |
| $ | 82,612 |
|
| $ | 64,243 |
|
|
|
| 4.2 | % |
|
| 3.6 | % |
| $ | 18,369 |
|
|
| 28.6 | % |
45
|
| Year Ended December 31, |
|
|
| Year to Year Change |
| ||||||||||||||||||||||||||||||||||||
|
| 2020 |
|
| 2019 |
|
| 2018 |
|
|
| 2020 |
|
| 2019 |
|
| 2018 |
|
|
| 2019 to 2020 |
|
|
| 2018 to 2019 |
| ||||||||||||||||
|
| Dollars |
|
|
| Percentages |
|
|
| Dollars |
|
| Percent |
|
|
| Dollars |
|
| Percent |
| ||||||||||||||||||||||
Revenue |
| $ | 1,506,875 |
|
| $ | 1,478,525 |
|
| $ | 1,337,973 |
|
|
|
| 100.0 | % |
|
| 100.0 | % |
|
| 100.0 | % |
|
| $ | 28,350 |
|
|
| 1.9 | % |
|
| $ | 140,552 |
|
|
| 10.5 | % |
Direct Costs |
|
| 972,406 |
|
|
| 953,187 |
|
|
| 857,508 |
|
|
|
| 64.5 | % |
|
| 64.5 | % |
|
| 64.1 | % |
|
|
| 19,219 |
|
|
| 2.0 | % |
|
|
| 95,679 |
|
|
| 11.2 | % |
Operating Costs and Expenses |
|
|
|
|
|
|
|
|
|
|
|
|
|
|
|
|
|
|
|
|
|
|
|
|
|
|
|
|
|
|
|
|
|
|
|
|
|
|
|
|
|
|
|
Indirect and selling expenses |
|
| 411,612 |
|
|
| 395,763 |
|
|
| 360,987 |
|
|
|
| 27.3 | % |
|
| 26.8 | % |
|
| 27.0 | % |
|
|
| 15,849 |
|
|
| 4.0 | % |
|
|
| 34,776 |
|
|
| 9.6 | % |
Depreciation and amortization |
|
| 20,399 |
|
|
| 20,099 |
|
|
| 17,163 |
|
|
|
| 1.4 | % |
|
| 1.4 | % |
|
| 1.3 | % |
|
|
| 300 |
|
|
| 1.5 | % |
|
|
| 2,936 |
|
|
| 17.1 | % |
Amortization of intangible assets |
|
| 13,349 |
|
|
| 8,083 |
|
|
| 10,043 |
|
|
|
| 0.9 | % |
|
| 0.5 | % |
|
| 0.8 | % |
|
|
| 5,266 |
|
|
| 65.1 | % |
|
|
| (1,960 | ) |
|
| (19.5 | )% |
Total Operating Costs and Expenses |
|
| 445,360 |
|
|
| 423,945 |
|
|
| 388,193 |
|
|
|
| 29.6 | % |
|
| 28.7 | % |
|
| 29.1 | % |
|
|
| 21,415 |
|
|
| 5.1 | % |
|
|
| 35,752 |
|
|
| 9.2 | % |
Operating Income |
|
| 89,109 |
|
|
| 101,393 |
|
|
| 92,272 |
|
|
|
| 5.9 | % |
|
| 6.9 | % |
|
| 6.9 | % |
|
|
| (12,284 | ) |
|
| (12.1 | )% |
|
|
| 9,121 |
|
|
| 9.9 | % |
Interest expense |
|
| (13,892 | ) |
|
| (10,719 | ) |
|
| (8,710 | ) |
|
|
| (0.9 | )% |
|
| (0.7 | )% |
|
| (0.7 | )% |
|
|
| (3,173 | ) |
|
| 29.6 | % |
|
|
| (2,009 | ) |
|
| 23.1 | % |
Other expense |
|
| (544 | ) |
|
| (501 | ) |
|
| (735 | ) |
|
|
| — |
|
|
| — |
|
|
| (0.1 | )% |
|
|
| (43 | ) |
|
| 8.6 | % |
|
|
| 234 |
|
|
| (31.8 | )% |
Income Before Income Taxes |
|
| 74,673 |
|
|
| 90,173 |
|
|
| 82,827 |
|
|
|
| 5.0 | % |
|
| 6.2 | % |
|
| 6.1 | % |
|
|
| (15,500 | ) |
|
| (17.2 | )% |
|
|
| 7,346 |
|
|
| 8.9 | % |
Provision for Income Taxes |
|
| 19,714 |
|
|
| 21,235 |
|
|
| 21,427 |
|
|
|
| 1.3 | % |
|
| 1.4 | % |
|
| 1.6 | % |
|
|
| (1,521 | ) |
|
| (7.2 | )% |
|
|
| (192 | ) |
|
| (0.9 | )% |
Net Income |
| $ | 54,959 |
|
| $ | 68,938 |
|
| $ | 61,400 |
|
|
|
| 3.6 | % |
|
| 4.7 | % |
|
| 4.6 | % |
|
| $ | (13,979 | ) |
|
| (20.3 | )% |
|
| $ | 7,538 |
|
|
| 12.3 | % |
Year ended December 31, 20202023 compared to year ended December 31, 20192022
Revenue. The growth in revenue of $183.3 million was driven by increases of $103.3 million from U.S. federal government clients, $48.4 million from U.S. state and local government clients, and $31.8 million from commercial clients, respectively, offset by a decrease of $0.2 million from international government clients.
Revenue from Health and Social Programs client market increased by $110.0 million, or 15.6%, driven by:
Revenue from Energy, Environment & Infrastructure and Disaster Recovery client market increased by $91.8 million, or 12.9%, due to:
Revenue from Security and Other Civilian & Commercial client market saw a decrease of $18.6 million, or 5.1%, as a result of:
Direct costs. Theincrease in direct costs of $130.6 million was driven by additional direct labor and related fringe benefit costs of $90.5 million and subcontractors and other direct costs of $40.1 million to support new and existing revenue-generating contracts. For the years ended December 31, 2023 and 2022, direct labor and related fringe benefit costs were 57.7% and 56.4% of total direct costs, respectively, and subcontractors and other direct costs were 42.3% and 43.6% of total direct costs, respectively. The total direct costs as a percentage of revenue remained steady at 64.4% for the year ended December 31, 2020, was $1,506.9 million,2023 compared to $1,478.563.7% for 2022.
Indirect and selling expenses. The increase in indirect and selling expenses of $18.3 million for the year ended December 31, 2019, representing an increase of $28.4 million or 1.9%. The increase in revenue2023 compared to 2022 was attributabledue to an increaseadditional $31.7 million in governmental revenue of $22.5 million, or 2.3%,indirect labor and an increase in commercial revenue of $5.8 million, or 1.1%, compared to the prior year. The changes in government revenue by client type were driven by the increase in federal government revenue, including clients from the ITG acquisition,related fringe benefit costs offset by a decrease of $13.4 million in stategeneral and local government revenue, from our disaster recovery clients,administrative costs. As a percentage of total indirect and a decrease in international government revenue.selling expenses, indirect labor and associated fringe costs were 71.1% and 67.2%, respectively, and general and administrative costs were 28.9% and 32.8%, respectively, for the years ended December 31, 2023 and 2022. The increase in our commercial revenue by client marketindirect labor and associated fringe costs was driven by increases in revenue from energy, environment and infrastructure clients and health, education, and social program clients, including clientsa result of additional headcount from our ITG acquisition, partially offset by arecent acquisitions in 2022 and 2023 as well as additional labor resources to support our growth. The decrease in marketing services providedour general and administrative costs was primarily from lower facilities expense that was, in part, attributed to our consumerFairfax lease ending at the end of the 2022 fiscal year. As a percentage of revenue, indirect and financial clients, which have been impacted by COVID-19, comparedselling expenses decreased to the prior year. The governmental and commercial revenues as a percent of total revenue remained consistent at 65% and 35%25.7% for the year ended December 31, 20202023 compared with 65% and 35% for the prior year.
Direct costs. Direct coststo 27.4% for the year ended December 31, 2020, were $972.4 million compared to $953.2 million for the year ended December 31, 2019, an increase of $19.2 million or 2.0%. Theincrease in direct costs and associated fringe costs was attributable to an increase of $31.6 million in direct labor and associated fringe benefits costs offset by a $12.4 million decrease in subcontractor and other direct costs. The direct labor and associated fringe costs increase is the result of an increase in our federal government revenues, as discussed above, partially offset by the decline in direct labor in our international government clients and our commercial clients. The decrease in subcontractor and other direct costs is due to the decline in other direct costs of $12.0 million, primarily travel related costs offset by an increase in media buys, and a $0.4 million decline in subcontractor costs. The decline in subcontractor costs is due to the decline in revenue from contracts that are reliant upon subcontractors, such as the hurricane relief and recovery efforts and marketing services, offset by subcontractor costs from the ITG acquisition. Direct costs as a percent of revenue remained constant at 64.5% for the year ended December 31, 2020 and 2019.2022.
Indirect and selling expenses. Indirect and selling expenses generally include our management, facilities, and infrastructure costs for all employees and the salaries and wages related to indirect activities, including stock-based and cash-based incentive compensation provided to employees whose compensation and other benefit costs are included in indirect and selling expenses, plus associated fringe benefits not directly related to client engagements.
44
Indirect and selling expenses for the year ended December 31, 2020, were $411.6 million compared to $395.8 million for the prior year, an increase of $15.8 million or 4.0%. The increase in indirect and selling expenses was primarily due to an increase in indirect labor, associated fringe costs, and other compensation costs of $25.6 million, and a decrease in general and administrative costs of $9.8 million. The increase in indirect labor, associated fringe costs, and other compensation costs is due to the general increase in labor year over year and additional severance costs from our internal restructuring and $8.8 million expense related to obligations under the Executive Chair’s employment agreement. The decrease in general and administrative costs was due to a reduction of travel-related expenses of $10.3 million, a decrease related to the $1.7 million impairment of intangible assets in the prior year, a decrease in our use of contract labor in the current year, and the decline in non-labor related administrative costs in the current year, offset by increases in the current year of $4.4 million of expenses related to the termination, abandonment, or impairment of several operating leases, a $3.4 million increase in bad debt expenses, and other increased costs due to our investments in our internal infrastructure and processes, and professional fees and insurance costs associated with our acquisition activities. Indirect and selling expenses as a percent of revenue increased to 27.3% for the year ended December 31, 2020, compared to 26.8% for the year ended December 31, 2019. The increase in indirect and selling expenses as a percent of revenue is due to expenses in 2020 related to termination of operating leases and expenses related to the departing officer’s employment in our indirect and selling expenses for the year ending December 31, 2020.
Depreciation and amortization. Depreciation and amortization was $20.4 million for the year ended December 31, 2020, compared to $20.1 million for the prior year, an increase of $0.3 million or 1.5%. The increase in depreciation and amortization is the result of $3.8 million was driven by additional leasehold improvements acquired as partcapital expenditure during 2023 and acceleration of the ITG acquisition which was offset by a decrease in depreciation and amortization as a result of accelerated depreciation of leasehold improvements on leases that terminated duringcertain fixed assets associated with the prior year.exit of an office facility. The transition is expected to be completed in 2024.
Amortization of intangible assets. Amortization of intangible assets for the year ended December 31, 2020 was $13.3 million compared to $8.1 million for the prior year. The $5.3 million increase was primarily due to an increase in the amortization of additional intangible assets related to the ITG acquisition totaling $47.3 million, partially offset by reduced levels of amortization of intangible assets associated with prior acquisitions.
Operating income. For the year ended December 31, 2020, operating income was $89.1 million compared to $101.4 million for the prior year, a decrease of $12.3 million or 12.1%. Operating income as a percent of revenue was 5.9% for the year ended December 31, 2020 compared to 6.9% for the prior year. The changes were largely due to an increase in indirect and selling expenses, associated with expense related to obligations under the Executive Chair’s employment agreement, and an increase in amortization of intangible assets partially offset by higher revenues.was due to amortization of additional intangible assets acquired from our acquisitions in the third and fourth quarter of 2022 and the second quarter of 2023.
46
Interest, expensenet. For the year ended December 31, 2020,The increase in interest, expensenet was $13.9 million, compared to $10.7 million for the prior year, an increase of $3.2 million or 29.6%. The higher interest expense for the twelve months ended December 31, 2020 wasprimarily due to higher average debt balances,balance of $613.5 million in 2023 compared to $575.0 million in 2022, and higher average interest rate of 6.7% in 2023 compared to 3.3% in 2022. We utilize floating-to-fixed interest rate swap agreements to hedge the variable interest portion of our debt. Our 2023 interest expense from our debt was reduced by $6.9 million from the swap agreements, compared to $0.5 million in additional interest expense added to 2022. Our average interest rate inclusive of the impact of the swap agreements was 5.6% for 2023 compared to 3.7% for 2022.
Other income (expense). The increase in other income (expense) was primarily due to pre-tax gains of $2.5 million and $3.2 million from the financingdivestiture of the ITG acquisition, partially offset by lower average interest rates for the period ended December 31, 2020 compared to the period ended December 31, 2019.our U.S. commercial marketing and Canadian mobile aggregation businesses in 2023.
Other expense. For the year ended December 31, 2020, other expense was flat at $0.5 million compared to other expense of $0.5 million for the prior year.
Provision for income taxes. The effective income tax rate for the years ended December 31, 20202023 and December 31, 2019,2022 was 26.4%14.4% and 23.6%23.5%, respectively. Our effective tax rate, including state and foreignThe decrease in provision for income taxes net of federal benefit for the year ended December 31, 2020,in 2023 was higher than the statutory tax rate for the year primarily due to tax benefits for stock-based compensation, permanently non-taxablecredits, restructuring of the ownership of a Canadian subsidiary, the wind-down of our U.K. commercial marketing business, and U.S. return-to-provision adjustments in connection with our federal income and state tax credits, andreturn filing, partially offset by the establishment of aprovisions for uncertain tax positions, and additional valuation allowance on certain deferred tax assets, permanent differences related to compensation costs, and other expenses not deductible for tax purposes.attributes generated during the period.
NON-GAAP MEASURES
TheseThe following tables provide reconciliations of financial measures that are not calculated in accordance with generally accepted accounting principles in the U.S. to their most comparable U.S. GAAP measures (“non-GAAP”) to the most applicable U.S. GAAP measures.. While we believe that these non-GAAP financial measures provide additional information to investors and may be useful in evaluating our financial information, they should be considered supplemental in nature and not as a substitute for financial information prepared in accordance with U.S. GAAP. Other companies may define similarly titled non-GAAP measures differently and, accordingly, care should be exercised in understanding how we define these measures.
45
Service Revenue
Service revenue represents revenue less subcontractor and other direct costs (which include third-party materials and travel expenses). Service revenue is not a recognized term under U.S. GAAP and should not be considered an alternativemeasures as similarly named measures are unlikely to revenue as a measure of operating performance. This presentation of service revenue may not be comparable to other similarly titled measures used by other companies because other companies may useacross different methods to prepare similarly titled measures. We believe service revenue is a useful measure to investors since, as a consulting firm, a key metric is revenue generated from the services our employees provide to our clients. For the year ended December 31, 2020, service revenue grew $40.7 million or 4.1% compared to the year ended December 31, 2019. For the year ended December 31, 2020, service revenue represented 69.3% of total revenue compared to 67.8% for the year ended December 31, 2019. The table below presents a reconciliation of revenue to service revenue for the periods indicated:companies.
|
| Year ended December 31, |
| |||||||||
|
| 2020 |
|
| 2019 |
|
| 2018 |
| |||
Revenue |
| $ | 1,506,875 |
|
| $ | 1,478,525 |
|
| $ | 1,337,973 |
|
Subcontractor and other direct costs |
|
| (463,364 | ) |
|
| (475,717 | ) |
|
| (412,216 | ) |
Service revenue |
| $ | 1,043,511 |
|
| $ | 1,002,808 |
|
| $ | 925,757 |
|
EBITDA and Adjusted EBITDA
Earnings before interest, and other income and/or expense, tax, and depreciation and amortization (“EBITDA”) is a measure we use to evaluate operating performance. We believe EBITDA is useful in assessing ongoing trends and, as a result, may provide greateradditional visibility in understanding our operations.
Adjusted EBITDA is EBITDA further adjusted to eliminate the impact of certain items that we do not consider to be indicative of the performance of our ongoing operations. We evaluate these adjustments on an individual basis based on both the quantitative and qualitative aspects of the item, including their size and nature, as well as whether or not we expect them to occur as part of our normal business on a regular basis. We believe that the adjustments applied in calculating adjusted EBITDA are reasonable and appropriate to provide additional information to investors.
EBITDA and Adjusted EBITDA are not recognized terms under U.S. GAAP and should not be used as alternatives to net income as a measure of operating performance. This presentation of EBITDA and Adjusted EBITDA may not be comparable to other similarly titled measures used by other companies because other companies may use different methods to prepare similarly titled measures. EBITDA and Adjusted EBITDA are not intended to be measures of free cash flow for management’s discretionary use as these measures do not include certain cash requirements such as interest payments, tax payments, capital expenditures, and debt service.
A47
The following table presents a reconciliation of net income to EBITDA and adjustedAdjusted EBITDA follows:for the periods indicated.
|
| Year ended December 31, |
| |||||||||
|
| 2023 |
|
| 2022 |
|
| 2021 |
| |||
Net income |
| $ | 82,612 |
| $ | 64,243 |
| $ | 71,132 |
| ||
Interest, net |
|
| 39,681 |
|
|
| 23,281 |
|
|
| 9,984 |
|
Provision for income taxes |
|
| 13,935 |
|
| 19,737 |
|
| 28,958 |
| ||
Depreciation and amortization |
|
| 60,738 |
|
| 49,917 |
|
| 31,970 |
| ||
EBITDA |
|
| 196,966 |
|
| 157,178 |
|
|
| 142,044 |
| |
Impairment of long-lived assets (1) |
|
| 7,666 |
|
|
| 8,354 |
|
|
| 8,215 |
|
Acquisition and divestiture-related expenses (2) |
|
| 4,759 |
|
| 6,441 |
|
| 4,798 |
| ||
Severance and other costs related to staff realignment (3) |
|
| 6,366 |
|
|
| 6,302 |
|
|
| 1,242 |
|
Charges for facility consolidations and office closures (4) |
|
| 3,187 |
|
|
| 5,034 |
|
|
| 1,434 |
|
Expenses related to the transfer to our new corporate headquarters (5) |
|
| — |
|
|
| 8,287 |
|
|
| 899 |
|
Expenses related to retirement of Executive Chair (6) |
|
| — |
|
|
| — |
|
|
| 397 |
|
Expenses related to our agreement for the sale of receivables (7) |
|
| — |
|
|
| 240 |
|
|
| — |
|
Pre-tax gain from divestiture of a business (8) |
|
| (5,712 | ) |
|
| — |
|
|
| — |
|
Total adjustments |
|
| 16,266 |
|
|
| 34,658 |
|
|
| 16,985 |
|
Adjusted EBITDA |
| $ | 213,232 |
|
| $ | 191,836 |
|
| $ | 159,029 |
|
|
| Year ended December 31, |
| |||||||||
|
| 2020 |
|
| 2019 |
|
| 2018 |
| |||
Net income |
| $ | 54,959 |
|
| $ | 68,938 |
|
| $ | 61,400 |
|
Other expense |
|
| 544 |
|
|
| 501 |
|
|
| 735 |
|
Interest expense |
|
| 13,892 |
|
|
| 10,719 |
|
|
| 8,710 |
|
Provision for income taxes |
|
| 19,714 |
|
|
| 21,235 |
|
|
| 21,427 |
|
Depreciation and amortization |
|
| 33,748 |
|
|
| 28,182 |
|
|
| 27,206 |
|
EBITDA |
|
| 122,857 |
|
|
| 129,575 |
|
|
| 119,478 |
|
Adjustment related to impairment of long-lived assets (1) |
|
| 3,090 |
|
|
| 1,728 |
|
|
| — |
|
Special charges related to acquisitions (2) |
|
| 1,983 |
|
|
| 1,771 |
|
|
| 1,361 |
|
Special charges related to severance for staff realignment (3) |
|
| 4,764 |
|
|
| 1,774 |
|
|
| 1,554 |
|
Special charges related to facilities consolidations and office closures, and our future corporate headquarters (4) |
|
| 1,643 |
|
|
| 717 |
|
|
| 115 |
|
Special charges related to retirement of Executive Chair (5) |
|
| 8,825 |
|
|
| — |
|
|
| — |
|
Adjustments related to bad debt reserve (6) |
|
| — |
|
|
| (782 | ) |
|
| 1,240 |
|
Total special charges and adjustments |
|
| 20,305 |
|
|
| 5,208 |
|
|
| 4,270 |
|
Adjusted EBITDA |
| $ | 143,162 |
|
| $ | 134,783 |
|
| $ | 123,748 |
|
|
|
46
|
|
|
|
|
|
|
|
|
|
Non-GAAP Diluted Earnings per Share
Non-GAAP diluted EPSearnings per share (“Non-GAAP Diluted EPS”) represents diluted EPSU.S. GAAP earnings per share (“U.S. GAAP Diluted EPS”) excluding the impact of certain items such as impairment of intangible assets, acquisition expenses, severance for staff realignment, facility consolidationsnoted above, and office closures, certain adjustments to the bad debt reserve and certain charges related to the retirement of our Executive Chair (which are also excluded from Adjusted EBITDA, as described further above), as well as the impact of amortization of intangible assets and the related to our acquisitions and income tax effects. While these adjustments may be recurring and not infrequent or unusual, we do not consider these adjustments to be indicative of the performance of our ongoing operations. Non-GAAP diluted EPS is not a recognized term under U.S. GAAP and is not an alternative to basic or diluted EPS as a measure of performance. This presentation of non-GAAP diluted EPS may not be comparable to other similarly titled measures used by other companies because other companies may use different methods to prepare similarly titled measures. We believe that the supplemental adjustments applied in calculating non-GAAP diluted EPS are reasonable and appropriate to provide additional information to investors.
48
The following table presents a reconciliation of dilutedU.S. GAAP Diluted EPS to non-GAAP dilutedNon-GAAP Diluted EPS for the periods indicated:
|
| Year ended December 31, |
| |||||||||
|
| 2023 |
|
| 2022 |
|
| 2021 |
| |||
U.S. GAAP Diluted EPS |
| $ | 4.35 |
|
| $ | 3.38 |
|
| $ | 3.72 |
|
Impairment of long-lived assets |
|
| 0.40 |
|
|
| 0.44 |
|
|
| 0.43 |
|
Acquisition and divestiture-related expenses |
|
| 0.25 |
|
|
| 0.34 |
|
|
| 0.25 |
|
Severance and other costs related to staff realignment |
|
| 0.33 |
|
|
| 0.33 |
|
|
| 0.06 |
|
Expenses related to facility consolidations and office closures (1) |
|
| 0.24 |
|
|
| 0.26 |
|
|
| 0.08 |
|
Expenses related to the transfer to our new corporate headquarters |
|
| — |
|
|
| 0.44 |
|
|
| 0.05 |
|
Expenses related to retirement of Executive Chair |
|
| — |
|
|
| — |
|
|
| 0.02 |
|
Expenses related to our agreement for the sale of receivables |
|
| — |
|
|
| 0.01 |
|
|
| — |
|
Pre-tax gain from divestiture of a business |
|
| (0.30 | ) |
|
| — |
|
|
| — |
|
Amortization of intangibles |
|
| 1.87 |
|
|
| 1.49 |
|
|
| 0.65 |
|
Income tax effects of the adjustments (2) |
|
| (0.64 | ) |
|
| (0.92 | ) |
|
| (0.44 | ) |
Non-GAAP Diluted EPS |
| $ | 6.50 |
|
| $ | 5.77 |
|
| $ | 4.82 |
|
|
| Year ended December 31, |
| |||||||||
|
| 2020 |
|
| 2019 |
|
| 2018 |
| |||
Diluted EPS |
| $ | 2.87 |
|
| $ | 3.59 |
|
| $ | 3.18 |
|
Adjustment related to impairment of long-lived assets |
|
| 0.16 |
|
|
| 0.09 |
|
|
| — |
|
Special charges related to acquisitions |
|
| 0.10 |
|
|
| 0.10 |
|
|
| 0.07 |
|
Special charges related to severance for staff realignment |
|
| 0.25 |
|
|
| 0.09 |
|
|
| 0.08 |
|
Special charges related to facilities consolidations and office closures, and our future corporate headquarters |
|
| 0.10 |
|
|
| 0.08 |
|
|
| 0.01 |
|
Special charges related to retirement of Executive Chair |
|
| 0.46 |
|
|
| — |
|
|
| — |
|
Adjustments related to bad debt reserve |
|
| — |
|
|
| (0.04 | ) |
|
| 0.06 |
|
Amortization of intangibles |
|
| 0.70 |
|
|
| 0.42 |
|
|
| 0.52 |
|
Income tax effects on amortization, special charges, and adjustments |
|
| (0.47 | ) |
|
| (0.18 | ) |
|
| (0.19 | ) |
Non-GAAP EPS |
| $ | 4.17 |
|
| $ | 4.15 |
|
| $ | 3.73 |
|
|
|
47
LIQUIDITY AND CAPITAL RESOURCES
Liquidity and Borrowing Capacity. On March 3, 2020, we entered into the First Amendment (the “First Amendment”) to the Fifth Amended and Restated Business Loan and Security Agreement with a group of 10 lenders (the “Credit Facility”). The First Amendment amended the Fifth Amended and Restated Business Loan and Security Agreement, entered on May 17, 2017. As a result of the First Amendment, we increased our borrowing capacity by $200.0 million through the addition of a $200.0 million term loan to the Credit Facility. The First Amendment also made certain other changes to the Credit Facility as described in “Note 10—Long-Term Debt” in the “Notes to Consolidated Financial Statements”. Additionally, we incurred additional loan fees of $2.1 million.
We drew upon our Credit Facility to fund the ITG acquisition and subsequently had a net payment on our credit facility of $104.7 million from operating cash flows. The improvement in cash flow from operations was primarily driven by the timing of client billings and collections of our disaster relief and rebuild contracts as well as the unexpected acceleration of billing and collections for media buys. However, the timing of cash flow from disaster relief and rebuild efforts is more uncertain than from other clients due to factors such as political complexities and challenges among involved government agencies. Moreover, the billing processes have complex reporting requirements and the funding processes have been slow to distribute funds once billed.
Short-term liquidity requirements are created by our use of funds for working capital, capital expenditures, debt service, dividends, and share repurchases. We expect to meet these requirements through a combination of our cash and cash equivalents at hand, cash flow from operations and borrowings. Our primary source of borrowings is from our Credit Facility, as described in “Note 10—10 - Long-Term Debt” in the “Notes to Consolidated Financial Statements.”Statements” in this Annual Report on Form 10-K. As of December 31, 2023, we had $591.9 million of unused borrowing capacity, or $575.5 million after taking into account the financial and performance-based limitations, available under the Credit Facility to fund our ongoing operations, future acquisitions, dividend payments, and share repurchase program. Should the need arise, we intend to further increase our borrowing capacity in the future to provide us with adequate working capital to continue our ongoing operations.
In March 2020,There are certain geo-political and macro-economic conditions, such as the World Health Organization characterizedongoing wars in Ukraine and the novel COVID-19 virus as a global pandemic. There is significantthe Middle East and the recent increase in inflation, both in the U.S. and globally, that create uncertainty as to effects of this pandemic onin the global economy, which in turn may impact, among other things, our ability to generate historical levels of positive cash flows from operations and our ability to successfully execute and fund key initiatives. However,initiatives in the near future; however, our current belief is that the combination of internally generated funds, available bank borrowings, and cash and cash equivalents on hand will provide the required liquidity and capital resources necessary to fund on-goingongoing operations, customary capital expenditures and acquisitions, quarterly cash dividends, share repurchases and organic growth. Additionally, we continuously analyze our capital structure to ensure we have capital to fund future strategic acquisitions. We continue to monitor the state of the financial markets on a regular basis to assess the availability and cost of additional capital resources from both debt and equity sources. We believe that we will be able to access these markets at commercially reasonable terms and conditions if, in the future, we need additional borrowings or capital.
Financial Condition.49
There were several changes in our balance sheet during the year ended December 31, 2020 compared to the balance sheet as of December 31, 2019. The more significant changes are discussed below.
Material Cash and cash equivalents increased to $13.8 million on December 31, 2020,Requirements from $6.5 million on December 31, 2019.Contractual Obligations. As of December 31, 2020, we had restricted2023, contractual obligations that require a material use of cash include repayments of $68.1our Credit Facility and operating lease obligations for facilities and equipment.
At December 31, 2023, our outstanding Credit Facility balance was $430.4 million, allnet of unamortized debt issuance costs, of which was classified as a current asset. These balancesthe principal amounts of $26.0 million is due in 2024, $35.8 million in 2025, $39.0 million in 2026, and the changes toremaining $333.3 million due upon maturity in 2027. We borrow funds under the balances of cashCredit Facility at interest rates based on both the SOFR (i.e., 1-, 3-, or 6-month rates) and cash equivalents and restricted cash are further discussed in “Cash Flow” below and discussed ina fluctuating Base Rate (see “Note 3—Restricted Cash”10 - Long-Term Debt” in the “Notes to Consolidated Financial Statements.”
Contract receivables, net of allowance for doubtful accounts, decreased to $222.9 million on December 31, 2020 compared to $261.2 million on December 31, 2019, primarily due to significant collection of outstanding receivables and an increaseStatements” in this Annual Report). Assuming that our allowance for doubtful accounts, primarily related to two clients filing for bankruptcy. Contract receivables are a significant component of our working capital and generally increase due to revenue growth and may be favorably or unfavorably impacted by our collection efforts, including timing from new contract startups, and other short-term fluctuations related to the payment practices of our clients. Contract assets and contract liabilities represent revenue in excess of billings and billings in excess of revenue, respectively, both of which generally arise from revenue recognition timing and contractually stipulated billing schedules or billing complexity. As of December 31, 2020, contract assets and contract liabilities were $143.4 million and $42.1 million, respectively, compared to $142.3 million and $37.4 million, respectively, as of December 31, 2019.
We evaluate our collections efforts using the days-sales-outstanding ratio (“DSO”), which we calculate by dividing total accounts receivable (contract receivables, net and contract assets, less contract liabilities) by revenue per day for the trailing three months period. Days-sales-outstanding decreased to 67 days compared to 83 days during the prior year primarily due to significant collection efforts of our disaster relief and rebuilding contracts as well as accelerated collections related to media buys. The DSO, excluding disaster relief and rebuilding efforts, was 60 days for the quarter ended December 31, 2020, compared to 71 days for the quarter ended December 31, 2019.
48
Goodwill and other intangible assets, as discussed in “Note 6—Goodwill and Other Intangible Assets” and “Note 16 – Business Combinations” in the “Notes to Consolidated Financial Statements”, increased due to the acquisition of ITG and the impact of foreign currency translation. On January 31, 2020, we acquired ITG, for the purchase price of $255.0 million. The acquisition resulted in the recording of $188.3 million in goodwill and $47.3 million in intangible assets.
Operating lease - right-of-use assets decreased from $134.0 million as of December 31, 2019 to $127.1 million as of December 31, 2020 and the operating lease liability, both current and long-term, decreased from $151.8 million at December 31, 2019 to $139.0 million at December 31, 2020. The decrease in the right-of-use assets is due to $32.3 of amortization, $3.1 million of impairment, and $2.0 million reduction resulting from modification/contractual termination of leases, offset by $29.8 million of right-of-use assets under new leases and foreign currency impact of $0.7 million. The decrease in the operating lease liability is due to principal payments of $41.0 million, $12.5 million of additional pre-payment of lease commitments in December 2020, and a $1.6 million reduction resulting from modification/contractual termination of leases, offset by additional lease liabilities under new leases.
The increase in right-of-use assets and lease liabilities are primarily due to the lease acquired as part of the ITG acquisition and new facilities in Chicago. In the fourth quarter of 2020, management reviewed our operating lease facilities and, as a result of the review, we took a $4.9 million charge for both the contractual termination of 13 leases and the impairment of 3 leases for our discontinued use of the properties. The $4.9 million charge included $3.1 million in impairment, $1.5 million in termination fees, and $0.3 million in losses on the disposition of related fixed assets and other costs. The 13 terminated leases had lease end dates ranging from December 2020 to September 2024.
Long-term debt increased to $313.2 million at December 31, 2020 from $164.3 million at December 31, 2019, primarily due to financing of our $255 million acquisition of ITG partially offset by the net payments on our Credit Facility of $104.7 million. The average debt balance on the Credit Facility for the years ended December 31, 2020 and 2019 was $428.0 million and $268.6 million, respectively. The average interest rate on the Credit Facility excluding any fees and unamortized debt issuance costs, foris the year endedsame as on December 31, 20202023, we anticipate our interest payments on the debt to be approximately $29.5 million in 2024, $27.5 million in 2025, $24.9 million in 2026, and 2019 was 2.4% and 3.6%, respectively. We generally utilize cash flow from operations as our primary source of funding and turn to$8.1 million in 2027 when our Credit Facility to fund any temporary fluctuations, such as increasesexpires. The estimates do not take into account future drawdowns and repayments on the debt or changes in contract receivables, reductions in accounts payable and accrued expenses, purchase of treasury stock, payment of declared dividends, additional capital expenditures, and to meet funding requirements for new acquisitions.
On February 20, 2020, we entered into a floating-to-fixedthe variable interest rate, swap agreement (the “Swap”) for a notional amount of $100.0 million in order to hedge a portion of the Company’s floating rate Credit Facility. Similar to the previous swap agreements that the Company has entered into, this Swap is intended to mitigate the risk of risingand actual interest rates. may be different.
As of December 31, 2020, the aggregate notional amount hedged totaled $200.02023, we have operating leases for facilities and equipment with remaining terms ranging from 1 to 15 years. Our current and long-term operating lease liabilities of $195.9 million excluding the hedge sold on December 1, 2016, and were valued at an unrealized loss of $10.9 million, before tax, and are included in other liabilities and accumulated other comprehensive loss. See “Note 12—Derivative Instruments and Hedging Activities” in the “Notes to Consolidated Financial Statements.”
Other long-term liabilities as of December 31, 2020 consists primarily of $17.3 million of deferred compensation plan liabilities, $10.0 million of2023 represent the long-term portion of the deferred Company social security taxes under the CARES Act, $7.2 million of liabilities related to the long-term portion of fair value of outstanding hedges, and outstanding commitments under an acquisition agreement of $1.2 million.
The increase in accumulated other comprehensive loss of $2.0 million, net of taxes, was driven by a change of $5.2 million in the fairpresent value of the interest rate hedging instruments, $0.5 million in gains reclassified to income related to hedging instruments previously soldminimum payments required under the non-cancellable leases, and offsetthe actual cash payments total $241.1 million. The operating lease payment obligations by a $3.7 million change in the value of certain foreign currencies relative to the U.S. dollar (primarily the British Pound, Euro and Canadian dollar. See “Note 14—Accumulated Other Comprehensive Loss” in the “Notes to Consolidated Financial Statements.”
We have explored various options of mitigating the risk associated with potential fluctuations in the foreign currencies in which we conduct transactions. We currently have hedges in an amount proportionate to work anticipated to be performed under certain contracts in Europe. We recognize changes in the fair-value of the hedges in our results of operations. We may increase the number, size and scope of our hedges as we analyze options for mitigating our foreign exchange and interest rate risk. The current impact of the foreign currency hedges to the consolidated financial statements is immaterial.
49
Share Repurchase Program.The objective of the share repurchase program has been to offset dilution resulting from employee stock compensation. The Company meets its objective to offset dilution via its 10b5-1 and 10b-18 trading plans. In September 2017 the board of directors approved a share repurchase program that authorizes share repurchases in the aggregate up to $100.0 million. Our total repurchases year are also limited by the Credit Facility as describedfurther discussed in “Note 18—Share Repurchase Program”7 - Leases” in the “Notes to Consolidated Financial Statements”. Our overall repurchase limit is the lower of the amount imposed by our board of directors and by the Credit Facility. Previously, purchases under the repurchase program could be made from time to time at prevailing market prices in open market purchases or in privately negotiated transactions pursuant to Rules 10b5-1 and 10b-18 under the Securities Exchange Act of 1934, as amended (the “Exchange Act”), and in accordance with applicable insider trading and other securities laws and regulations. On March 13, 2020, we terminated the Rule 105b-1 element of the share repurchase program.
We subsequently approved an updated Rule 10b5-1 plan element of the share repurchase program, as part of its normal process, that is scheduled to commence January 2021. The purchases will be funded from existing cash balances and/or borrowings, and the repurchased shares will be held in treasury and used for general corporate purposes. The timing and extent to which we repurchase our shares will depend upon market conditions and other corporate considerations, as may be considered in our sole discretion. During the year ended December 31, 2020, we repurchased 278,582 shares under this program at an average price of $78.66 per share. As of December 31, 2020, $46.12023, we also have finance leases for equipment and furniture with lease payment obligations through 2029 as discussed in “Note 7 - Leases” in the “Notes to Consolidated Financial Statements”. The current and long-term finance lease liabilities at December 31, 2023 of $16.4 million remained available for share repurchases underrepresent the share repurchase program.present value of the minimum payments totaling $18.1 million.
Inflation. Our business and results of operations have not been materially affected by inflation and changing prices during the period presented and we do not expect to be materially affected in the future due to the nature of our business as a provider of professional services with contracts that can be negotiated with new prices.
Dividends. Cash dividends declared in 20202023 were as follows:
Dividend Declaration Date |
| Dividend Per Share |
|
|
| Record Date |
| Payment Date | |
February 27, 2020 |
| $ | 0.14 |
|
|
| March 27, 2020 |
| April 13, 2020 |
May 5, 2020 |
| $ | 0.14 |
|
|
| June 12, 2020 |
| July 14, 2020 |
August 4, 2020 |
| $ | 0.14 |
|
|
| September 11, 2020 |
| October 13, 2020 |
November 5, 2020 |
| $ | 0.14 |
|
|
| December 11, 2020 |
| January 12, 2021 |
Declaration Date | Dividend Per Share |
| Record Date | Payment Date | |
February 28, 2023 | $ | 0.14 |
| March 24, 2023 | April 13, 2023 |
May 9, 2023 | $ | 0.14 |
| June 9, 2023 | July 14, 2023 |
August 3, 2023 | $ | 0.14 |
| September 8, 2023 | October 13, 2023 |
November 2, 2023 | $ | 0.14 |
| December 8, 2023 | January 12, 2024 |
Cash Flows. We consider cash on deposit and all highly liquid investments with original maturities of three months or less when purchased to be cash and cash equivalents. The following table sets forthsummarizes our sources and uses of cash for the following years.
|
| Year ended December 31, |
| |||||||||
(in thousands) |
| 2020 |
|
| 2019 |
|
| 2018 |
| |||
Net cash provided by operating activities |
| $ | 173,145 |
|
| $ | 91,440 |
|
| $ | 74,670 |
|
Net cash used in investing activities |
|
| (270,948 | ) |
|
| (30,470 | ) |
|
| (56,387 | ) |
Net cash provided by (used in) financing activities |
|
| 169,955 |
|
|
| (67,640 | ) |
|
| (28,771 | ) |
Effect of exchange rate changes on cash, cash equivalents and restricted cash |
|
| 3,353 |
|
|
| 166 |
|
|
| (792 | ) |
Increase (decrease) in cash, cash equivalents and restricted cash |
| $ | 75,505 |
|
| $ | (6,504 | ) |
| $ | (11,280 | ) |
Our operating cash flows are primarily affectedfrom the years ended December 31, 2023, 2022, and 2021.
|
| Year ended December 31, |
| |||||||||
(in thousands) |
| 2023 |
|
| 2022 |
|
| 2021 |
| |||
Net cash provided by operating activities |
| $ | 152,383 |
|
| $ | 162,206 |
|
| $ | 110,205 |
|
Net cash used in investing activities |
|
| (3,673 | ) |
|
| (258,844 | ) |
|
| (194,481 | ) |
Net cash (used in) provided by financing activities |
|
| (152,588 | ) |
|
| 90,371 |
|
|
| 23,233 |
|
Effect of exchange rate changes on cash, cash equivalents, and restricted cash |
|
| 359 |
|
|
| (1,198 | ) |
|
| (511 | ) |
Decrease in cash, cash equivalents, and restricted cash |
| $ | (3,519 | ) |
| $ | (7,465 | ) |
| $ | (61,554 | ) |
Cash provided by the overall profitability of our contracts, our ability to invoice and collect from our clients in a timely manner, and the timing of vendor and subcontractor payments in accordance with negotiated payment terms. We bill most of our clients on a monthly basis after services are rendered.
Operatingoperating activities provided $173.1 million in cash for the year ended December 31, 20202023 decreased by $9.8 million compared to cash provided by operating activities of $91.4 million for the year ended December 31, 2019. The increase in cash flows provided by operations for the year ended December 31, 2020 compared to the prior year was2022 primarily due to stronghigher interest and tax payments and the timing of collections of contractour billed receivables related to disaster relief and rebuilding efforts as well as accelerated collections related topayments of our media placements work for which the associated media spend will occur in early 2021. Additionally, we were able to defer employer social security tax liabilities, under the CARES Act, until 2021 and 2022. The increases in cash flows were partially offset by the reduction in net income and the use of cash to settle outstanding operating liabilities. The improved collections of contract receivables is evidenced by the reduction in our DSO from 83 days for the quarter ended December 31, 2019 to 67 days for the quarter ended December 31, 2020. The reduction in our DSO was primarily the result of an 11 day decrease due to the accelerated collection related to media placements.
Investing activities used cash of $270.9 million for the year ended December 31, 2020, compared to $30.5 million for the year ended December 31, 2019. Our cash flows used in investing activities consists primarily of
50
capital expenditures and acquisitions. The cash50
Cash used in investing activities for the year ended December 31, 2020 included acquisitions, net2023 decreased by $255.2 million compared to 2022 primarily due to higher usage of cash acquired,to fund the acquisitions of $253.3SemanticBits and Blanton in 2022; 2023 was favorably impacted by the proceeds received from the divestiture of our U.S. commercial marketing and Canadian mobile text aggregation businesses.
We used $152.6 million of which $253.1 million was for ITG and $0.2 million was for Eco-Tech, and $17.7 million for capital expenditures. The cash used in investingfinancing activities forduring the year ended December 31, 2019 included $26.92023 compared to $90.4 million for capital expenditures and acquisitions of $3.6 million.
Our cash flows used inprovided by financing activities consists primarilyduring 2022, a change of debt and equity transactions. For the year ended 2020, cash flows used in financing activities were$243.0 million. The change was primarily due to thehigher net advanceborrowings from our Credit Facility to fund the acquisitions of $150.3SemanticBits and Blanton during 2022, and repayments of our term loan debt of $81.0 million net receipt and payments of restricted contract funds of $65.6during 2023 which includes $66.0 million dividend payments of $10.6 million, and share repurchases under our share repurchase plan and shares purchased from employees to pay required withholding taxes related to settlement of restricted stock units of $29.7 million. Forin early payment on the year ended 2019, cash flows used in financing activities were primarily due to net payments on our Credit Facility of $35.0 million, dividend payments of $10.5 million, and share repurchases under our share repurchase plan and shares purchased from employees to pay required withholding taxes related to settlement of restricted stock units of $23.4 million.
Under a contract with a customer commencing in the final quarter of fiscal year 2020, the Company receives advance payments to be used to pay providers of services to the customer, a separate third-party. The advanced payments are treated as restricted cash as the Company is required under the contract to distribute the advanced funds to the third-party providers or return the advanced funds to the customer. Because the Company receives the advance payments from a customer, which must be refunded to the customer or remitted to a third party, the cash receipts are treated as borrowings rather than receipts for the provision of goods or services. Therefore, these cash receipts are presented as financing cash inflows, “Receipt of restricted contract funds”, with the subsequent payments classified as financing cash outflows, “Payment of restricted cash contract funds.”
OFF-BALANCE SHEET ARRANGEMENTS
We had ten outstanding letters of credit provided for under our Credit Facility with a total value of $2.7 million, primarily related to deposits to support our facility leases.
CONTRACTUAL OBLIGATIONS
The following table summarizes our contractual obligations as of December 31, 2020 that require us to make future cash payments. Our summary of contractual obligations includes payments that we have an unconditional obligation to make.
|
|
|
|
|
| Payments due by Period |
| |||||||||||||
|
|
|
|
|
| Less than |
|
| 1 to 3 |
|
| 3 to 5 |
|
| More than |
| ||||
(in thousands) |
| Total |
|
| 1 year |
|
| years |
|
| years |
|
| 5 years |
| |||||
Long-term debt obligation (1) |
| $ | 345,490 |
|
| $ | 17,463 |
|
| $ | 38,089 |
|
| $ | 289,938 |
|
| $ | — |
|
Operating lease obligations (2) |
|
| 310,014 |
|
|
| 27,417 |
|
|
| 59,526 |
|
|
| 44,863 |
|
|
| 178,208 |
|
Other obligations related to acquisitions |
|
| 1,915 |
|
|
| 683 |
|
|
| 1,232 |
|
|
| — |
|
|
| — |
|
Total |
| $ | 657,419 |
|
| $ | 45,563 |
|
| $ | 98,847 |
|
| $ | 334,801 |
|
| $ | 178,208 |
|
|
|
|
|
51
ITEM 7A. QUANTITATIVE AND QUALITATIVE DISCLOSURES ABOUT MARKET RISK
|
|
We are exposed to certain financial market risks, the most predominant being fluctuations in interest rates for borrowings under the Credit Facility and foreign exchange rate risk.
Borrowings under the Credit Facility accrue interest at variable rates. We monitor interest rate fluctuations and outlookoutlooks as an integral part of our overall risk management program, which recognizes the unpredictability of financial markets and seeks to reduce potentially adverse effects of higher interest rates on our results of operations. As part of this strategy, we may use interest rate swap arrangements to hedge all or a portion of our interest rate risk by securing hedges that effectively convertconverts our variable rate debt to fixed rate debt. We do not use such instruments for speculative or trading purposes. Our exposure to market risk includes changes in interest rates for borrowings under the Credit Facility. These borrowings accrue interest at variable rates. Based on our borrowings under this facility and amount of hedging in 2020,the Credit Facility, a 1% increase in interest rates would have increased interest expense by approximately $4.3$6.1 million and would have decreased our annual net income and operating cash flows by a comparable amount. OnAt December 31, 2020,2023, we have fourhad seven interest rate swap agreements with a total aggregate notional amount of $200.0$275.0 million to hedge against changes in interest rates and offset potential increases in interest expense. See “Note 12—12 - Derivative Instruments and Hedging Activities” in the “Notes to Consolidated Financial Statements.”Statements”.
As a result of conducting business in currencies other than the U.S. dollar, we are subject to market risk with respect to adverse fluctuations in currency exchange rates. In general, our currency risk is mitigated largely by matching costs with revenues in a given currency. However, our exposure to fluctuations in other currencies against the U.S. dollar increases as a greater portion of our revenue is generated in currencies other than the U.S. dollar. We currentlymay have hedges in place to mitigate our foreign exchange risk related to our operations in Europe; however, given the amount of business conducted in Europe,outside of the U.S, there is some risk that revenue and profits will be affected by foreign currency exchange rate fluctuations.
We use a sensitivity analysis to assess the impact of movement in foreign currency exchange rates on revenue. During the year ended December 31, 2020, 12.9%2023, 7% of our revenue was generated from our international operations based on the location to which a contract was awarded. As a result, a 10% increase or decrease in the value of the U.S. dollar against all currencies would have an estimated impact on revenue of approximately 0.8%1%, or $11.7$13.1 million. Actual gains and losses in the future could differ materially from this analysis based on the timing and amount of both foreign currency exchange rate movements and our actual exposure. As of December 31, 2020, we held approximately $81.5 million in cash and restricted cash in foreign bank accounts to be utilized on behalf of our foreign subsidiaries and to be used to pay providers of service to a customer (see “Note 3—Restricted Cash” in the “Notes to the Consolidated Financial Statements”), thereby partially mitigating foreign currency conversion risks.
ITEM 8. FINANCIAL STATEMENTS AND SUPPLEMENTARY DATA
|
|
The consolidated financial statements of ICF International, Inc. and subsidiaries are provided in Part IV in this Annual Report on Form 10-K.
ITEM 9. CHANGES IN AND DISAGREEMENTS WITH ACCOUNTANTS ON ACCOUNTING AND FINANCIAL DISCLOSURE |
|
Not applicable.
52None.
51
ITEM 9A. CONTROLS AND PROCEDURES
|
|
Evaluation of Disclosure Controls and Procedures. Based on an evaluation under the supervision and with the participation of the Company’s management, the principal executive officer and principal financial officer have concluded that the Company’s disclosure controls and procedures, as defined in Rules 13a-15(e) and 15d-15(e) under the Exchange Act, were effective as of December 31, 20202023 to provide reasonable assurance that information required to be disclosed in reports that it files or submits under the Exchange Act is (i) recorded, processed, summarized and reported within the time periods specified in the SEC rules and forms and (ii) accumulated and communicated to the Company’s management, including its principal executive officer and principal financial officer, as appropriate to allow timely decisions regarding required disclosure.
Management’s Annual Report on Internal Control Over Financial Reporting. The Company’s management is responsible for establishing and maintaining adequate internal control over financial reporting (as such term is defined as of December 31, 2023 in Exchange Act Rules 13a-15(f) and 15d-15(f)). Management conducted an assessment of the effectiveness of the Company’s internal control over financial reporting based on the criteria set forth in the 2013 Internal Control—Integrated Framework issued by the Committee of Sponsoring Organizations of the Treadway Commission (COSO). Based on the assessment, management has concluded that its internal control over financial reporting was effective as of December 31, 2020. 2023.
The Company’s independent registered public accounting firm, Grant Thornton LLP, has issued an audit report on the Company’s internal control over financial reporting, which appears on page F-3 of this Form 10-K.herein.
The Company’s internal control over financial reporting is designed to provide reasonable assurance regarding the reliability of financial reporting, and the preparation of financial statements for external purposes in accordance with U.S. GAAP. The Company’s internal control over financial reporting includes those policies and procedures that: (i) pertain to the maintenance of records that, in reasonable detail, accurately and fairly reflect the transactions and dispositions of the Company’s assets; (ii) provide reasonable assurance that transactions are recorded as necessary to permit preparation of financial statements in accordance with U.S. GAAP; (iii) that the Company’s receipts and expenditures are being made only in accordance with authorizations of the Company’s management and directors; and (iv) provide reasonable assurance regarding prevention or timely detection of unauthorized acquisition, use, or disposition of the Company’s assets that could have a material effect on the financial statements.
Changes in Internal Control Over Financial Reporting. There were no material changes in our internal control over financial reporting during the last quarter of 2020,2023 which were identified in connection with management’s evaluation required by paragraph (d) of Rules 13a-15 and 15d-15 under the Exchange Act, that have materially affected, or are reasonably likely to materially affect, the Company’s internal control over financial reporting.
Inherent Limitations Over Internal Controls. A control system, no matter how well designed and operated, can provide only reasonable (not absolute) assurance that the objectives of the control system are met. Further, the design of a control system must reflect the fact that there are resource constraints, and the benefits of controls must be considered relative to their costs. Because of the inherent limitations in all control systems, no evaluation of internal controls can provide absolute assurance that all control issues and instances of fraud, if any, have been detected. Because of the inherent limitations in any control system, misstatements due to error or fraud may occur and may not be detected. Also, any evaluations of the effectiveness of controls in future periods are subject to the risk that those internal controls may become inadequate because of changes in business conditions, or that the degree of compliance with the policies or procedures may deteriorate.
52
ITEM 9B. OTHER INFORMATION None. ITEM 9C. DISCLOSURE REGARDING FOREIGN JURISDICTIONS THAT PREVENT INSPECTIONS None. 53
|
|
Not applicable.
53
PART III
ITEM 10. DIRECTORS, EXECUTIVE OFFICERS AND CORPORATE GOVERNANCE
|
|
The information required by this item will be included in our Proxy Statement for the 20212024 Annual Meeting of Stockholders (the “2021“2024 Proxy Statement”) and is incorporated herein by reference.
ITEM 11. EXECUTIVE COMPENSATION
|
|
The information required by this item will be included in the 20212024 Proxy Statement and is incorporated herein by reference.
ITEM 12. SECURITY OWNERSHIP OF CERTAIN BENEFICIAL OWNERS AND MANAGEMENT AND RELATED STOCKHOLDER MATTERS
|
|
The information required by this item will be included in the 20212024 Proxy Statement and is incorporated herein by reference.
|
|
The information required by this item will be included in the 20212024 Proxy Statement and is incorporated herein by reference.
ITEM 14. PRINCIPAL ACCOUNTANT FEES AND SERVICES
|
|
The information required by this item will be included in the 20212024 Proxy Statement and is incorporated herein by reference.
54
PART IV
ITEM 15. EXHIBITS AND FINANCIAL STATEMENT SCHEDULES (1) Financial Statements
(2) Financial Statement Schedules The financial statement schedules have been omitted since the required information is not applicable or included in the consolidated financial statements and accompanying notes included in this Form 10-K. (3) Exhibits
The following exhibits are included with this report or incorporated herein by reference:
55
56
* Submitted electronically herewith. + Indicates a management contract or compensatory plan or arrangement required to be filed as an exhibit. ITEM 16. FORM 10-K SUMMARY None. 57
Pursuant to the requirements of Section 13 or 15(d) of the Securities Exchange Act of 1934, the registrant has duly caused this report to be signed on its behalf by the undersigned, thereunto duly authorized.
Pursuant to the requirements of the Securities Exchange Act of 1934, this report has been signed below by the following persons on behalf of the registrant and in the capacities and on the dates indicated.
58 REPORT OF INDEPENDENT REGISTERED PUBLIC ACCOUNTING FIRM Board of Directors and Stockholders ICF International, Inc. Opinion on the financial statements We have audited the accompanying consolidated balance sheets of ICF International, Inc. (a Delaware corporation) and subsidiaries (the “Company”) as of December 31, We also have audited, in accordance with the standards of the Public Company Accounting Oversight Board (United States) (“PCAOB”), the Company’s internal control over financial reporting as of December 31, Basis for opinion These financial statements are the responsibility of the Company’s management. Our responsibility is to express an opinion on the Company’s financial statements based on our audits. We are a public accounting firm registered with the PCAOB and are required to be independent with respect to the Company in accordance with the U.S. federal securities laws and the applicable rules and regulations of the Securities and Exchange Commission and the PCAOB. We conducted our audits in accordance with the standards of the PCAOB. Those standards require that we plan and perform the audit to obtain reasonable assurance about whether the financial statements are free of material misstatement, whether due to error or fraud. Our audits included performing procedures to assess the risks of material misstatement of the financial statements, whether due to error or fraud, and performing procedures that respond to those risks. Such procedures included examining, on a test basis, evidence regarding the amounts and disclosures in the financial statements. Our audits also included evaluating the accounting principles used and significant estimates made by management, as well as evaluating the overall presentation of the financial statements. We believe that our audits provide a reasonable basis for our opinion. Critical audit matter The critical audit matter communicated below is a matter arising from the current period audit of the financial statements that was communicated or required to be communicated to the audit committee and that: (1) relates to accounts or disclosures that are material to the financial statements and (2) involved our especially challenging, subjective, or complex judgments. The communication of Revenue As described further in Note 2 to the consolidated financial statements, the Company
F-1 The principal considerations for our determination that the use of estimates-at-completion in recognizing revenue is a critical audit matter are the significant management judgments involved in the initial creation and subsequent updates to the Company’s Our audit procedures in response to this matter included the following, among complete costs /s/ GRANT THORNTON LLP We have served as the Company’s auditor since 2000. Arlington, Virginia February F-2 REPORT OF INDEPENDENT REGISTERED PUBLIC ACCOUNTING FIRM Board of Directors and Stockholders ICF International, Inc. Opinion on internal control over financial reporting We have audited the internal control over financial reporting of ICF International, Inc. (a Delaware corporation) and subsidiaries (the “Company”) as of December 31, We also have audited, in accordance with the standards of the Public Company Accounting Oversight Board (United States) (“PCAOB”), the consolidated financial statements of the Company as of and for the year ended December 31, Basis for opinion The Company’s management is responsible for maintaining effective internal control over financial reporting and for its assessment of the effectiveness of internal control over financial reporting, included in the accompanying We conducted our audit in accordance with the standards of the PCAOB. Those standards require that we plan and perform the audit to obtain reasonable assurance about whether effective internal control over financial reporting was maintained in all material respects. Our audit included obtaining an understanding of internal control over financial reporting, assessing the risk that a material weakness exists, testing and evaluating the design and operating effectiveness of internal control based on the assessed risk, and performing such other procedures as we considered necessary in the circumstances. We believe that our audit provides a reasonable basis for our opinion. Definition and limitations of internal control over financial reporting A company’s internal control over financial reporting is a process designed to provide reasonable assurance regarding the reliability of financial reporting and the preparation of financial statements for external purposes in accordance with generally accepted accounting principles. A company’s internal control over financial reporting includes those policies and procedures that (1) pertain to the maintenance of records that, in reasonable detail, accurately and fairly reflect the transactions and dispositions of the assets of the company; (2) provide reasonable assurance that transactions are recorded as necessary to permit preparation of financial statements in accordance with generally accepted accounting principles, and that receipts and expenditures of the company are being made only in accordance with authorizations of management and directors of the company; and (3) provide reasonable assurance regarding prevention or timely detection of unauthorized acquisition, use, or disposition of the company’s assets that could have a material effect on the financial statements. Because of its inherent limitations, internal control over financial reporting may not prevent or detect misstatements. Also, projections of any evaluation of effectiveness to future periods are subject to the risk that controls may become inadequate because of changes in conditions, or that the degree of compliance with the policies or procedures may deteriorate. /s/ GRANT THORNTON LLP Arlington, February F-3 ICF INTERNATIONAL, INC. AND SUBSIDIARIES CONSOLIDATED BALANCE SHEETS (in thousands, except share and per share amounts) December 31, 2020 December 31, 2019 December 31, 2023 December 31, 2022 ASSETS Current Assets: Cash and cash equivalents $ 13,841 $ 6,482 $ 6,361 $ 11,257 Restricted cash - current 68,146 — Restricted cash 3,088 1,711 Contract receivables, net 222,850 261,176 205,484 232,337 Contract assets 143,369 142,337 201,832 169,088 Prepaid expenses and other assets 25,492 17,402 28,055 40,709 Income tax receivable 1,977 7,320 2,337 11,616 Total Current Assets 475,675 434,717 447,157 466,718 Total Property and Equipment, net 62,434 58,237 Property and Equipment, net 75,948 85,402 Other Assets: Goodwill 909,913 719,934 1,219,476 1,212,898 Other intangible assets, net 59,887 25,829 94,904 126,537 Operating lease - right-of-use assets 127,132 133,965 132,807 149,066 Other assets 32,249 23,352 41,480 51,637 Total Assets $ 1,667,290 $ 1,396,034 $ 2,011,772 $ 2,092,258 LIABILITIES AND STOCKHOLDERS' EQUITY Current Liabilities: Current portion of long-term debt $ 10,000 $ — $ 26,000 $ 23,250 Accounts payable 91,365 134,578 134,503 135,778 Contract liabilities 42,050 37,413 21,997 25,773 Operating lease liabilities - current 23,350 32,500 Operating lease liabilities 20,409 19,305 Finance lease liabilities 2,522 2,381 Accrued salaries and benefits 80,512 52,130 88,021 85,991 Accrued subcontractors and other direct costs 78,842 45,619 45,645 45,478 Accrued expenses and other current liabilities 100,908 36,811 79,129 78,036 Total Current Liabilities 427,027 339,051 418,226 415,992 Long-term Liabilities: Long-term debt 303,214 164,261 404,407 533,084 Operating lease liabilities - non-current 115,614 119,250 175,460 182,251 Finance lease liabilities - non-current 13,874 16,116 Deferred income taxes 34,330 37,621 26,175 68,038 Other long-term liabilities 40,144 21,300 56,045 23,566 Total Liabilities 920,329 681,483 1,094,187 1,239,047 Commitments and Contingencies (Note 20) Stockholders’ Equity: Preferred stock, par value $.001 per share; 5,000,000 shares authorized; NaN issued — — Common stock, $.001 par value; 70,000,000 shares authorized; 23,305,255 and 22,846,374 shares issued; and 18,909,983 and 18,867,555 shares outstanding at December 31, 2020 and December 31, 2019, respectively 23 23 Preferred stock, par value $.001 per share; 5,000,000 shares — — Common stock, $.001 par value; 70,000,000 shares authorized; 23,982,132 and 23,771,596 shares issued; and 18,845,521 and 18,883,050 shares outstanding at December 31, 2023 and 2022, respectively 24 23 Additional paid-in capital 369,058 346,795 421,502 401,957 Retained earnings 588,731 544,840 775,099 703,030 Treasury stock, 4,395,272 and 3,978,819 shares at December 31, 2020 and 2019, respectively (196,745 ) (164,963 ) Treasury stock, 5,136,611 and 4,906,209 shares at December 31, 2023 and 2022, respectively (267,155 ) (243,666 ) Accumulated other comprehensive loss (14,106 ) (12,144 ) (11,885 ) (8,133 ) Total Stockholders’ Equity 746,961 714,551 917,585 853,211 Total Liabilities and Stockholders’ Equity $ 1,667,290 $ 1,396,034 $ 2,011,772 $ 2,092,258 The accompanying notes are an integral part of these statements. F-4 ICF International, Inc. and Subsidiaries Consolidated Statements of Comprehensive Income Years ended December 31, Years ended December 31, (in thousands, except per share amounts) 2020 2019 2018 2023 2022 2021 Revenue $ 1,506,875 $ 1,478,525 $ 1,337,973 $ 1,963,238 $ 1,779,964 $ 1,553,048 Direct costs 972,406 953,187 857,508 1,265,018 1,134,422 979,570 Operating costs and expenses Operating costs and expenses: Indirect and selling expenses 411,612 395,763 360,987 505,162 486,863 430,572 Depreciation and amortization 20,399 20,099 17,163 25,277 21,482 19,478 Amortization of intangible assets 13,349 8,083 10,043 35,461 28,435 12,492 Total operating costs and expenses 445,360 423,945 388,193 565,900 536,780 462,542 Operating income 89,109 101,393 92,272 132,320 108,762 110,936 Interest expense (13,892 ) (10,719 ) (8,710 ) Other expense (544 ) (501 ) (735 ) Interest, net (39,681 ) (23,281 ) (9,984 ) Other income (expense) 3,908 (1,501 ) (862 ) Income before income taxes 74,673 90,173 82,827 96,547 83,980 100,090 Provision for income taxes 19,714 21,235 21,427 13,935 19,737 28,958 Net income $ 54,959 $ 68,938 $ 61,400 $ 82,612 $ 64,243 $ 71,132 Earnings per share: Basic $ 2.92 $ 3.66 $ 3.27 $ 4.39 $ 3.41 $ 3.77 Diluted $ 2.87 $ 3.59 $ 3.18 $ 4.35 $ 3.38 $ 3.72 Weighted-average common shares outstanding: Basic 18,841 18,816 18,797 18,802 18,818 18,868 Diluted 19,135 19,224 19,335 18,994 19,033 19,124 Cash dividends declared per common share 0.56 0.56 0.56 0.56 0.56 0.56 Other comprehensive (loss) income, net of tax (1,962 ) 407 (6,683 ) (3,752 ) 2,902 3,071 Comprehensive income, net of tax $ 52,997 $ 69,345 $ 54,717 $ 78,860 $ 67,145 $ 74,203 The accompanying notes are an integral part of these statements. F-5 ICF International, Inc. and Subsidiaries Consolidated Statements of Stockholders’ Equity Common Stock Additional Paid-in Retained Treasury Stock Accumulated Other Comprehensive Common Stock Additional Retained Treasury Stock Accumulated (in thousands) Shares Amount Capital Earnings Shares Amount Loss Total Shares Amount Capital Earnings Shares Amount Loss Total Balance at January 1, 2018 18,662 $ 22 $ 307,821 $ 434,766 3,357 $ (121,540 ) $ (5,039 ) $ 616,030 Balance at January 1, 2021 18,910 $ 23 $ 369,058 $ 588,731 4,395 $ (196,745 ) $ (14,106 ) $ 746,961 Net income — — — 71,132 — — — 71,132 Other comprehensive income — — — — — — 3,071 3,071 Equity compensation — — 13,230 — — — — 13,230 Exercise of stock options 8 — 233 — — — — 233 Issuance of shares pursuant to employee stock purchase plan and vesting of restricted stock units 222 — 2,463 — — — — 2,463 Net payments for stock buybacks (264 ) — — — 264 (23,055 ) — (23,055 ) Dividends declared — — — (10,565 ) — — — (10,565 ) Balance at December 31, 2021 18,876 $ 23 $ 384,984 $ 649,298 $ 4,659 $ (219,800 ) $ (11,035 ) $ 803,470 Net income — — — 64,243 — — — 64,243 Other comprehensive income — — — — — — 2,902 2,902 Equity compensation — — 13,171 — — — — 13,171 Exercise of stock options 19 — 602 — — — — 602 Issuance of shares pursuant to employee stock purchase plan and vesting of restricted stock units 235 — 3,200 — — — — 3,200 Net payments for stock buybacks (247 ) — — — 247 (23,866 ) — (23,866 ) Dividends declared — — — (10,511 ) — — — (10,511 ) Balance at December 31, 2022 18,883 $ 23 $ 401,957 $ 703,030 4,906 $ (243,666 ) $ (8,133 ) $ 853,211 Net income — — — 61,400 — — — 61,400 — — — 82,612 — — — 82,612 Other comprehensive loss — — — — — — (6,683 ) (6,683 ) — — — — — — (3,752 ) (3,752 ) Equity compensation — — 11,328 — — 178 — 11,506 — — 14,861 — — — — 14,861 Exercise of stock options 209 — 5,842 — — — — 5,842 8 — 279 — — — — 279 Issuance of shares pursuant to vesting of restricted stock units 226 — — — (8 ) — — — Net payments for stock issuances and buybacks (280 ) — 1,217 — 280 (18,342 ) — (17,125 ) Reclassification of stranded tax effects due to adoption of accounting principle — — — 829 — — (829 ) — Issuance of shares pursuant to employee stock purchase plan and vesting of restricted stock units 185 1 4,405 — — — — 4,406 Net payments for stock buybacks (230 ) — — — 230 (23,489 ) — (23,489 ) Dividends declared — — — (10,553 ) — — — (10,553 ) — — — (10,543 ) — — — (10,543 ) Balance at December 31, 2018 18,817 22 326,208 486,442 3,629 (139,704 ) (12,551 ) 660,417 Net income — — — 68,938 — — — 68,938 Other comprehensive income — — — — — — 407 407 Equity compensation — — 15,818 — — — — 15,818 Exercise of stock options 94 — 2,924 — — — — 2,924 Issuance of shares pursuant to vesting of restricted stock units 306 1 — — — — — 1 Net payments for stock issuances and buybacks (349 ) — 1,845 — 349 (25,259 ) — (23,414 ) Dividends declared — — — (10,540 ) — — — (10,540 ) Balance at December 31, 2019 18,868 23 346,795 544,840 3,978 (164,963 ) (12,144 ) 714,551 Net income — — — 54,959 — — — 54,959 Other comprehensive income — — — — — — (1,962 ) (1,962 ) Equity compensation — — 17,555 — — — — 17,555 Exercise of stock options 70 — 2,652 — — — — 2,652 Issuance of shares pursuant to vesting of restricted stock units 389 — — — — — — — Net payments for stock issuances and buybacks (417 ) — 2,056 — 417 (31,782 ) — (29,726 ) Cumulative-effect adjustments for adoption of accounting principle — — — (513 ) — — — (513 ) Dividends declared — — — (10,555 ) — — — (10,555 ) Balance at December 31, 2020 18,910 $ 23 $ 369,058 $ 588,731 4,395 $ (196,745 ) $ (14,106 ) $ 746,961 Balance at December 31, 2023 18,846 $ 24 $ 421,502 $ 775,099 5,136 $ (267,155 ) $ (11,885 ) $ 917,585 The accompanying notes are an integral part of these statements. F-6 ICF International, Inc. and Subsidiaries Consolidated Statements of Cash Flows Years ended December 31, Years ended December 31, (in thousands) 2020 2019 2018 2023 2022 2021 Cash Flows from Operating Activities Net income $ 54,959 $ 68,938 $ 61,400 $ 82,612 $ 64,243 $ 71,132 Adjustments to reconcile net income to net cash provided by operating activities: Bad debt expense 4,062 624 2,480 Deferred income taxes (1,865 ) (123 ) 5,100 Provision for credit losses 1,164 248 10,912 Deferred income taxes and unrecognized income tax benefits (17,634 ) 7,428 8,816 Non-cash equity compensation 17,555 15,818 11,506 14,861 13,171 13,230 Depreciation and amortization 33,748 28,182 27,206 60,738 49,917 31,970 Non-cash lease expense (2,307 ) (1,247 ) 523 Facilities consolidation reserve (288 ) (274 ) (260 ) — (317 ) (302 ) Remeasurement of contingent acquisition liability — — 505 Amortization of debt issuance costs 710 507 510 1,996 1,305 617 Impairment of long-lived assets 3,090 1,728 — 7,666 8,412 7,901 Gain on divestiture of a business (7,590 ) — — Other adjustments, net 964 181 449 (1,368 ) 1,283 1,099 Changes in operating assets and liabilities, net of the effect of acquisitions: Net contract assets and liabilities 6,064 (11,963 ) (14,148 ) (38,422 ) (41,634 ) 3,069 Contract receivables 54,384 (31,300 ) (60,096 ) 20,939 19,732 (19,021 ) Prepaid expenses and other assets (5,410 ) 1,997 (6,650 ) 18,579 (20,737 ) 4,529 Operating lease assets and liabilities, net 3,544 (1,466 ) (5,481 ) Accounts payable (51,177 ) 31,949 28,309 (1,489 ) 30,003 13,479 Accrued salaries and benefits 26,810 8,012 (2,159 ) 2,175 (3,337 ) (5,616 ) Accrued subcontractors and other direct costs 32,544 (12,293 ) 10,762 (269 ) 6,965 (38,575 ) Accrued expenses and other current liabilities (18,198 ) (4,951 ) 11,120 (4,757 ) 24,742 26,697 Income tax receivable and payable 5,375 (4,489 ) (2,063 ) 9,277 (1,526 ) (12,802 ) Other liabilities 12,125 144 176 361 3,774 (1,449 ) Net Cash Provided by Operating Activities 173,145 91,440 74,670 152,383 162,206 110,205 Cash Flows from Investing Activities Capital expenditures for property and equipment and capitalized software (17,683 ) (26,901 ) (21,812 ) (22,337 ) (24,475 ) (19,932 ) Payments for business acquisitions, net of cash acquired (253,265 ) (3,569 ) (34,575 ) (32,664 ) (237,280 ) (174,549 ) Proceeds from working capital adjustments related to prior business acquisition — 2,911 — Proceeds from divestiture of a business 51,328 — — Net Cash Used in Investing Activities (270,948 ) (30,470 ) (56,387 ) (3,673 ) (258,844 ) (194,481 ) Cash Flows from Financing Activities Advances from working capital facilities 1,020,451 686,830 573,991 1,245,198 1,583,936 881,037 Payments on working capital facilities (870,114 ) (721,809 ) (579,817 ) (1,372,474 ) (1,446,125 ) (773,264 ) Payments on capital expenditure obligations (1,712 ) (1,621 ) (3,726 ) Proceeds from other short-term borrowings 48,532 — — Repayments of other short-term borrowings (41,653 ) — — Receipt of restricted contract funds 65,694 — — 7,672 15,721 264,214 Payment of restricted contract funds (106 ) — — (8,084 ) (25,959 ) (319,990 ) Debt issue costs (2,094 ) — (21 ) Debt issuance costs — (4,907 ) — Payments of principal portion of finance leases (2,438 ) — — Proceeds from exercise of options 37 2,914 5,842 279 602 2,848 Dividends paid (10,551 ) (10,540 ) (7,915 ) (10,537 ) (10,547 ) (10,565 ) Net payments for stockholder issuances and buybacks (29,726 ) (23,414 ) (17,125 ) (19,083 ) (21,218 ) (20,040 ) Payments on business acquisition liabilities (1,924 ) — — — (1,132 ) (1,007 ) Net Cash Provided by (Used in) Financing Activities 169,955 (67,640 ) (28,771 ) Net Cash (Used in) Provided by Financing Activities (152,588 ) 90,371 23,233 Effect of Exchange Rate Changes on Cash, Cash Equivalents, and Restricted Cash 3,353 166 (792 ) 359 (1,198 ) (511 ) Increase (Decrease) in Cash, Cash Equivalents, and Restricted Cash 75,505 (6,504 ) (11,280 ) Decrease in Cash, Cash Equivalents, and Restricted Cash (3,519 ) (7,465 ) (61,554 ) Cash, Cash Equivalents, and Restricted Cash, Beginning of Period 6,482 12,986 24,266 12,968 20,433 81,987 Cash, Cash Equivalents, and Restricted Cash, End of Period $ 81,987 $ 6,482 $ 12,986 $ 9,449 $ 12,968 $ 20,433 Supplemental disclosure of cash flow information: Cash paid during the period for: Interest $ 14,337 $ 10,424 $ 9,893 $ 34,093 $ 22,782 $ 10,331 Income taxes $ 15,954 $ 26,595 $ 14,870 $ 26,190 $ 16,476 $ 34,132 Non-cash investing and financing transactions: Deferred and contingent consideration arising from businesses acquired $ — $ — $ 8,391 Capital expenditure obligations $ — $ — $ 6,121 Share repurchases transacted but not settled and paid $ — $ — $ 552 Tenant improvements funded by lessor $ 3,124 $ — $ — $ 568 $ 20,253 $ — Exercise of options receivable from shareholders $ 2,615 $ — $ — Acquisition of property and equipment through finance lease $ 337 $ 18,319 $ — The accompanying notes are an integral part of these statements. F-7 ICF International, Inc. and Subsidiaries Notes to Consolidated Financial Statements (dollar amounts in tables in thousands, except share and per share data) NOTE 1 - BASIS OF PRESENTATION AND NATURE OF OPERATIONS Basis of Presentation The accompanying consolidated financial statements include the accounts of ICF International, Inc. (“ICFI”) and its principal subsidiary, ICF Consulting Group, Inc. (“Consulting,” and together with ICFI, Nature of Operations The Company provides professional services and technology-based solutions, The Company’s major The Company, incorporated in Delaware, is headquartered in NOTE 2 - SUMMARY OF SIGNIFICANT ACCOUNTING POLICIES Use of Estimates The preparation of consolidated financial statements in conformity with U.S. GAAP requires management to make estimates and assumptions that affect the reported amounts of assets and liabilities and disclosure of contingent liabilities at the date of the consolidated financial statements, and the reported amounts of revenue and expenses during the reporting periods. Areas of the consolidated financial statements where estimates may have the most significant effect include contractual and regulatory reserves, valuation and lives of tangible and intangible assets, contingent consideration related to business acquisitions and divestitures, impairment of goodwill and long-lived assets, accrued liabilities, revenue recognition (including estimates of variable considerations in determining the total contract price and allocation of performance obligations), the remaining costs to complete fixed-price contracts, bonus and other incentive compensation, stock-based compensation, reserves for tax benefits and valuation allowances on deferred tax assets, provisions for income taxes, collectability of receivables, and loss accruals for litigation. Actual results experienced by the Company may differ from Revenue Recognition The Company primarily provides services and technology-based solutions for clients that operate in a variety of markets and the solutions may span the entire program life cycle, from initial research and analysis to the design and implementation of solutions. The Company enters into agreements with clients that create enforceable rights and obligations and for which it is probable that the Company will collect the consideration to which it will be entitled as services and solutions are transferred to the client. Except in certain narrowly defined situations, the Company’s agreements with its clients are written and revenue is generally not recognized on oral or implied arrangements. The Company recognizes revenue based on the consideration specified in the applicable agreement and excludes from revenue amounts collected on behalf of third parties. Accordingly, sales and similar taxes which are collected on behalf of third parties are excluded from the transaction price. The Company evaluates whether two or more agreements should be accounted for as one single contract and whether combined or single agreements should be accounted for as more than one performance obligation. For most contracts, the client requires the Company to perform a number of tasks in providing an integrated output for which the client has contracted, and, hence, contracts of this type are tracked as having only one performance obligation since a substantial part of the Company’s promise is to ensure the individual tasks are incorporated into a combined output in accordance with contract requirements. When contracts The Company evaluates contractual arrangements to determine whether revenue should be recognized on a gross versus net basis. The Company’s assessment is based on the nature of the Long-term contracts typically contain billing terms that provide for invoicing monthly or upon completion of milestones, and payment on a net For cost-based contracts, the Company F-9 For In some Contracts For performance obligations that are satisfied over time, the Company recognizes the cost to fulfill contracts Unfulfilled performance obligations represent amounts expected to be earned on non-cancellable contracts or those that the are cancellable but the Company has determined to have substantive termination penalties, and do not include the value of negotiated, unexercised contract options, which are classified as marketing offers. Indefinite delivery/indefinite quantity and similar arrangements provide a framework for the client to issue specific tasks, delivery or purchase orders in the future and these arrangements are considered marketing offers until a specific order is executed. The Company’s operating cycle for long-term contracts may be greater than one year and is measured by the average time Cash and Cash Equivalents The Company considers cash on deposit and any highly liquid investments with original maturities of three months or less when purchased to be cash and cash equivalents. F-10 Restricted Cash The Company has restricted cash representing amounts held in escrow accounts Contract receivables, net Contract receivables represent amounts billed Property and Equipment Property and equipment are carried at cost and are depreciated using the straight-line method over their estimated useful lives, which range from two to seven Goodwill and The Company performs its annual goodwill impairment test as of October 1 of each year. As its business is highly integrated and all of its components have similar economic characteristics, the Company has concluded it has Long-Lived Assets The Company reviews its long-lived assets, including property and equipment, operating lease right-of-use (“ROU”) assets, and During the years ended December 31, 2023, 2022, and 2021, the Company recognized impairment F-11 Leases The Company leases facilities and property and equipment. The Company determines if an arrangement is a lease at Lease terms, for the The Operating leases are included in operating lease right-of-use assets and operating lease liabilities (current and non-current) and finance leases are included in property and equipment, net and finance lease liabilities (current and non-current) on the consolidated balance sheets. The Company capitalizes certain costs to develop enhancements and upgrades to internal-use software that are incurred subsequent to the preliminary project stage. Amortization expense is recorded on a straight-line basis over the expected economic life of the software, Stock-based Compensation The Company recognizes stock-based compensation expense Stock-based compensation expense is based on the estimated fair value of the instruments on The fair value of stock options, restricted stock awards, RSUs, PSAs, and non-employee director awards is estimated based on the fair value of a share of common stock at the grant date. The CSRSUs are settled only in cash payments. The cash payment is based on the fair value of the Company’s stock price at the vesting date, calculated by multiplying the number of CSRSUs vested by the Company’s closing stock price on the vesting date, subject to a maximum payment cap and a minimum payment floor. The Company treats these awards as liability-classified awards, and, therefore, accounts for them at fair value estimated based on the closing price of the Company’s stock at the reporting date. Derivative Instruments Derivative instruments include interest rate swaps, foreign currency hedges, and forward contracts. Derivative instruments designated as cash flow hedges are recorded on the consolidated balance sheets at fair value as of the reporting date and reclassified to earnings in the period that the hedged instruments affect earnings, and the effective portion of the hedge is recorded in other comprehensive income (loss) (“AOCI”), net of tax, on the consolidated statements of comprehensive Income Taxes The Company recognizes deferred tax assets and liabilities for the expected future tax consequences of temporary differences between the financial statement carrying amounts of existing assets and liabilities and their respective tax bases. Deferred tax assets and liabilities are measured using enacted tax rates in effect for the year in which those temporary differences are expected to be recovered or settled. The Company evaluates its ability to benefit from all deferred tax assets and establishes valuation allowances for amounts it believes will more likely than not be unrealizable. For uncertain tax positions, the Company uses a more-likely-than-not recognition threshold based on the technical merits of the income tax position taken. Income tax positions that meet the more-likely-than-not recognition threshold are measured in order to determine the tax benefit recognized in the financial statements.Penalties, if probable and reasonably estimable, and interest expense related to uncertain tax positions are not recognized as a component of income tax expense but recorded separately in indirect expenses and interest expense, respectively. F-12 Treasury Shares Treasury shares are accounted for under the cost method. Other Comprehensive Income (Loss) Other comprehensive income (loss) Acquisition-Related Costs Costs related to acquisitions include professional fees for legal, financial, and other advisory services and are expensed in the period that they are incurred. Segment, Customer, and Geographic Information The Company operates in The At December 31, Foreign currency expense, net of impact of hedges, was $1.2 million, $0.2 million, and $0.6 million, for the years ended December 31, 2023, 2022 and 2021, respectively. Fair Value The Company measures and reports certain financial assets and liabilities at fair value in accordance with ASC 820, Fair Value Measurements and Disclosures. Fair value is defined as the price that would be received to sell an asset or paid to transfer a liability in an orderly transaction between market participants on the measurement date. Generally, fair value is based on observable quoted market prices or derived from observable market data when such market prices or data are available. ASC 820 establishes a three-level hierarchy used to estimate fair value by which each level is categorized based on the priority of the inputs used to measure fair value: Certain financial instruments, including cash and cash equivalents, contract receivables, and accounts payable are carried at cost, which, due to their short maturities, approximates their fair values. The carrying value of the Company's long-term debt approximates the estimated fair value for debt with similar terms, interest rates, and remaining maturities currently available to companies with similar credit ratings (Level 2). Risks and Uncertainties Financial instruments that potentially subject the Company to concentrations of credit risk consist principally of cash and cash equivalents, derivative financial instruments, and contract receivables. F-13 The Company’s domestic bank accounts are insured up to As of December 31, The Company enters into derivative financial instruments with financial institutions that meet certain credit guidelines and The Company’s receivables consist principally of amounts due from agencies and departments of the federal government, state and local governments, and international governments, as well as from commercial organizations. The Recent Accounting Pronouncements In The Company completed its adoption of the provisions of ASU 2020-04 during the second quarter of 2023 upon amendment of its last interest rate swap from LIBOR-based to SOFR-based pricing. The adoption did not have a material impact on the Company's consolidated financial statements. Accounting Pronouncements Not Yet Adopted Segment Reporting In November 2023, the FASB issued ASU 2023-07: Improvements to Reportable Segment Disclosures, that required additional segment disclosures for public entities currently required under the Segment Reporting (Topic 280) of the Accounting Standards Codification (“ASC”). ASU 2023-07 enhances the current segment reporting disclosures of Topic 280 by requiring significant segment expenses that are regularly provided to the Chief Operating Decision Maker (the “CODM”), the amount and description of other segment items, and interim disclosures of reportable segment's profit or loss and assets. ASU 2023-07 also requires public entities that have a single reportable segment to provide all the disclosures required in Topic 280, as amended. The ASU is effective for the Company for the 2024 fiscal year and interim periods within the 2025 fiscal year on a retrospective basis, with early adoption permitted. The Company is currently evaluating the impact of the F-14 Income Taxes In December 2023, the FASB issued ASU 2023-09, Income Taxes: Improvements to NOTE 3 - RESTRICTED CASH The following table provides a reconciliation of cash and cash equivalents, and restricted cash reported within the consolidated balance sheets at December 31, 2020 2019 2018 2023 2022 2021 Beginning Ending Beginning Ending Beginning Ending Beginning Ending Beginning Ending Beginning Ending Cash and cash equivalents $ 6,482 $ 13,841 $ 11,694 $ 6,482 $ 11,809 $ 11,694 $ 11,257 $ 6,361 $ 8,254 $ 11,257 $ 13,841 $ 8,254 Restricted cash - current (1) — 68,146 — — 11,191 — Restricted cash - non-current — — 1,292 — 1,266 1,292 Restricted cash (1) 1,711 3,088 12,179 1,711 68,146 12,179 Total cash, cash equivalents, and restricted cash shown in the consolidated statement of cash flows $ 6,482 $ 81,987 $ 12,986 $ 6,482 $ 24,266 $ 12,986 $ 12,968 $ 9,449 $ 20,433 $ 12,968 $ 81,987 $ 20,433 Under a contract with a customer NOTE 4 - CONTRACT RECEIVABLES, NET Contract receivables, net consisted of the 2023 2022 Billed and billable $ 210,919 $ 238,449 Allowance for expected credit losses (5,435 ) (6,112 ) Contract receivables, net $ 205,484 $ 232,337 On December 23, 2022, the Company entered into a Master Receivables Purchase Agreement (the “MRPA”) with MUFG Bank, Ltd. (“MUFG”) for the sale from time to time of certain eligible billed receivables. The receivables are sold without recourse and the Company does not retain any ongoing financial interest in the transferred receivables other than providing servicing activities. The Company accounts for the transfers as sales under ASC 860, Transfers and Servicing, derecognizes the receivables from its consolidated balance sheets at the date of the sale, and includes the cash received from MUFG as part of cash flows from operating activities on its consolidated statement of cash flows. During the years ended December 31, 2023 and 2022, the Company received $309.4 million and $10.0 million under the MRPA, of which $28.7 million and $6.2 million, respectively, was collected but not remitted to MUFG. For the years ended December 31, 2023 and 2022, the discount on the sale of receivables under the MRPA totaled $1.1 million and less than $0.1 million, respectively, and is included as part of “indirect and selling expenses” on the consolidated statements of comprehensive income. December 31, 2020 December 31, 2019 Billed receivables $ 230,466 $ 264,682 Allowance for doubtful accounts (7,616 ) (3,506 ) Contract receivables, net $ 222,850 $ 261,176 F-15 NOTE 5 - PROPERTY AND EQUIPMENT Property and equipment consisted of the following at December 31: 2020 2019 2023 2022 Leasehold improvements $ 35,683 $ 25,882 $ 54,398 $ 58,131 Software 53,001 52,343 16,897 17,926 Furniture and equipment 28,772 29,437 Computers 40,158 38,014 Furniture and office equipment 29,773 28,800 Computer equipment 44,661 45,541 157,614 145,676 145,729 150,398 Accumulated depreciation and amortization (95,180 ) (87,439 ) (69,781 ) (64,996 ) Total property and equipment, net $ 62,434 $ 58,237 $ 75,948 $ 85,402 Depreciation and amortization expense for the years ended December 31, NOTE 6 - GOODWILL AND OTHER INTANGIBLE ASSETS Goodwill The changes in the carrying amount of goodwill for the fiscal years ended December 31 were as follows: 2020 2019 Balance as of January 1 $ 719,934 $ 715,644 Goodwill resulting from business combination - ITG 188,253 — Goodwill resulting from business combination - DMS Disaster Consultants — (50 ) Goodwill resulting from business combination - We Are Vista — (370 ) Goodwill resulting from business combination - Olson (1) — 3,047 Effect of foreign currency translation 1,726 1,663 Balance as of December 31 $ 909,913 $ 719,934 2023 2022 Balance as of January 1, 2023 $ 1,212,898 $ 1,046,760 Add: Goodwill resulting from business combinations 21,133 171,415 Less: Goodwill resulting from business divestitures (16,921 ) — Effect of foreign currency translation 2,366 (5,277 ) Balance as of December 31, 2023 $ 1,219,476 $ 1,212,898 See “Note 16 – Acquisitions and Divestitures” for the details of the business combination and divestiture resulting in the changes in goodwill. Other Intangible Assets Intangible assets with definite lives are primarily amortized over periods ranging from approximately 1 to Other intangibles consisted of the following at December 31: 2023 Gross Accumulated Net Carrying Customer-related $ 185,723 $ (93,911 ) $ 91,812 Developed technology 3,902 (904 ) 2,998 Trade name 1,280 (1,280 ) — Total amortizable intangible assets 190,905 (96,095 ) 94,810 Intangible with indefinite life 94 — 94 Total other intangible assets $ 190,999 $ (96,095 ) $ 94,904 2020 Gross Carrying Value Accumulated Amortization Net Carrying Value Customer-related $ 142,849 $ (83,137 ) $ 59,712 Developed technology 733 (653 ) 80 Total amortizable intangible assets 143,582 (83,790 ) 59,792 Intangible with indefinite life 95 — 95 Total other intangible assets $ 143,677 $ (83,790 ) $ 59,887 F-16 2019 2022 Gross Carrying Value Accumulated Amortization Net Carrying Value Gross Accumulated Net Carrying Customer-related $ 95,038 $ (69,425 ) $ 25,613 $ 240,591 $ (118,412 ) $ 122,179 Developed technology 733 (612 ) 121 4,480 (512 ) 3,968 Trade name 1,180 (884 ) 296 Total amortizable intangible assets 95,771 (70,037 ) 25,734 246,251 (119,808 ) 126,443 Intangible with indefinite life 95 — 95 94 — 94 Total other intangible assets $ 95,866 $ (70,037 ) $ 25,829 $ 246,345 $ (119,808 ) $ 126,537 Aggregate amortization expense for the years ended December 31, Year ending December 31, 2021 $ 12,049 2022 11,727 2023 11,339 2024 10,856 2025 6,904 Thereafter 6,917 Total $ 59,792 Year ending December 31, 2024 $ 32,992 2025 32,074 2026 18,533 2027 3,407 2028 2,047 Thereafter 5,757 Total $ 94,810 NOTE 7 – LEASES The Company has operating and finance leases for facilities and equipment which have remaining terms ranging from 1 to December 31, 2020 Real estate facilities $ 157,010 Office equipment 1,864 Other 580 159,454 Amortization of right-of-use assets (32,322 ) Total operating lease right-of-use assets $ 127,132 Year Ended December 31, 2020 2019 Operating lease costs $ 37,874 $ 36,210 Short-term lease costs 1,421 2,153 Variable lease costs 53 77 Total rent expense $ 39,348 $ 38,440 December 31, 2020 December 31, 2021 $ 27,417 December 31, 2022 38,691 December 31, 2023 20,835 December 31, 2024 17,208 December 31, 2025 13,603 Thereafter 37,314 Total future minimum lease payments 155,068 Less: Interest (16,104 ) Total operating lease liabilities $ 138,964 December 31, 2020 December 31, 2019 Operating lease liabilities - current $ 23,350 $ 32,500 Operating lease liabilities - non-current 115,614 119,250 Total operating lease liabilities $ 138,964 $ 151,750 Year Ended December 31, 2020 2019 Cash paid for amounts included in the measurement of lease liabilities: Operating cash flows from operating leases $ 41,025 $ 36,907 Right-of-use assets obtained in exchange for new operating lease liabilities $ 29,790 $ 31,123 Weighted-average remaining lease term - operating leases 5.9 5.1 Weighted-average discount rate - operating leases 3.4 % 3.7 % Year Ended December 31, 2023 2022 2021 Operating lease cost $ 25,037 $ 37,889 $ 35,469 Finance lease cost - amortization of right-of-use assets 2,040 598 — Finance lease cost - interest 602 179 — Short-term lease cost 669 509 453 Variable lease cost 222 146 43 Sublease income (28 ) (92 ) — Total lease cost $ 28,542 $ 39,229 $ 35,965 Future minimum lease payments under non-cancellable operating and finance leases as of December 31, 2023 were as follows: Operating Finance December 31, 2024 $ 25,419 $ 3,041 December 31, 2025 26,621 3,041 December 31, 2026 22,899 3,041 December 31, 2027 18,578 3,041 December 31, 2028 15,926 2,985 Thereafter 131,690 2,966 Total future minimum lease payments 241,133 18,115 Less: Interest (45,264 ) (1,719 ) Total $ 195,869 $ 16,396 F-17 Other information related to operating and finance leases is as follows: Year Ended December 31, 2023 2022 Cash paid for amounts included in the measurement of lease liabilities: Operating cash flows from operating leases $ 20,368 $ 40,123 Right-of-use assets obtained in exchange for new operating lease liabilities $ 18,590 $ 13,906 Property and equipment obtained in exchange for finance lease liabilities $ 338 18,319 Weighted-average remaining lease term - operating leases Operating leases 11.6 11.7 Finance leases 6.0 7.0 Weighted-average discount rate - operating leases Operating leases 3.6 % 3.3 % Finance leases 3.4 % 3.4 % The change in operating lease right-of-use assets and lease liabilities are presented within cash flows from operating activities on the During the years ended December 2018 Rent $ 34,924 Sublease income (45 ) Total rent expense $ 34,879 NOTE 8 - ACCRUED SALARIES AND BENEFITS Accrued salaries and benefits consisted of the following at December 31: 2023 2022 Bonuses, liability-classified awards, and commissions $ 27,371 $ 26,930 Salaries 32,604 31,142 Paid time off and leave 16,415 16,144 Medical 5,685 5,833 Payroll taxes and withholdings 976 1,363 Other 4,970 4,579 Total accrued salaries and benefits $ 88,021 $ 85,991
NOTE 9 - ACCRUED EXPENSES AND OTHER CURRENT LIABILITIES Accrued expenses and other current liabilities consisted of the following at December 31:
F-18 NOTE 10 - LONG-TERM DEBT On Under the Restated Credit
The Credit Facility is collateralized by substantially all As of December 31, 2023, the Company had $430.4 million (net of unamortized debt issuance costs) of long-term debt outstanding from the Credit Facility, unused delayed draw term loan facility of $180.0 million (available through January 5, 2024), and unused borrowing capacity of $591.9 million from the available $600.0 million revolving line of credit under the Credit Facility. The
As of December 31,
F-19 Future scheduled repayments of
Debt Issuance Cost The Company’s debt issuance costs are amortized over the term of indebtedness. The balance of net debt issuance costs at December 31,
2022 were $3.7 million and $5.0 million, respectively. Amortization of debt issuance costs totaling
NOTE 11 – REVENUE RECOGNITION Disaggregation of Revenue The Company disaggregates revenue from clients Client markets provide insight into the breadth of the Company’s expertise. In classifying revenue by client market, the Company attributes revenue from a client to the market that the Company believes is the client’s primary market. The Company also classifies revenue by the type of
The Company's revenue by client markets, type, and contract mix are in the following tables. Certain immaterial revenue amounts in the prior years have been reclassified due to minor adjustments and reclassification.
F-20
Contract Assets and Liabilities:
Contract assets consist The
The net contract assets
Unfulfilled Performance Obligations: The Company had NOTE 12 - DERIVATIVE INSTRUMENTS AND HEDGING ACTIVITIES The Company uses interest rate swap
hedges.
For the years ended December 31,
As of December 31, F-21 NOTE 13 - INCOME TAXES The domestic and foreign components of income before provision for income taxes are as follows for the years ended December 31:
Income tax expense consisted of the following for the years ended December 31:
Deferred income taxes reflect the net tax effects of temporary differences between the carrying amounts of assets and liabilities for financial reporting purposes and income tax purposes. F-22 Deferred tax assets (liabilities) consisted of the following at December 31:
On December 20, 2017, the U.S. Congress passed the Tax Cuts and Job Act of 2017 (the “TCJA”) which was signed into law on December 22, 2017, and was generally As of December 31, F-23 As of December 31,
As of December 31, The need to establish valuation allowances for deferred assets is based on a more-likely-than-not threshold that the benefit of such assets will be realized in future periods. Appropriate consideration has been given to all available evidence, including historical operating results, projections of taxable income, and tax planning alternatives. The Company concluded that a valuation allowance of The total amount of unrecognized tax benefits as of December 31, The components of unrecognized tax benefits, excluding penalty and interest, are as
The unrecognized tax benefit reconciliation, excluding penalty and interest, is as follows:
The Company’s
Although the Company believes it has adequately provided for all uncertain tax positions, amounts asserted by taxing authorities could be greater than the Company’s accrued position. Accordingly, additional provisions on federal, state, and foreign income tax related matters could be recorded in the future as revised estimates are made or the underlying matters are effectively settled or otherwise resolved. Conversely, the Company could settle positions with the tax authorities for amounts lower than have been accrued. The Company believes it is reasonably possible that, during the next 12 months, the Company’s liability for uncertain tax positions may not change. F-24 The Company’s provision for income taxes differs from the federal statutory rate. The differences between the statutory rate and the Company’s provision are as
During 2023, the Company
During 2023, the F-25 NOTE 14 - ACCUMULATED OTHER COMPREHENSIVE Accumulated other comprehensive
Represents the fair value of an interest rate hedge agreement, designated as a cash flow hedge, which was sold on December 1, 2016. The fair value of the interest rate hedge agreement was recorded in other comprehensive income, net of tax, and will be reclassified to earnings when earnings are impacted by the hedged items, as interest payments are made on the Credit Facility from January 31, 2018 to January 31, 2023.
Represents the change in fair value of interest rate hedge agreements designated as a cash flow hedges. The fair value of the interest rate hedge agreements was recorded in other comprehensive income, net of tax, and will be reclassified to earnings when earnings are impacted by the hedged items, as interest payments are made on the Credit Facility from through June 27, 2028. See additional details of the hedge agreements in Note 12 - Derivative Instruments and Hedging Activities.
The Company’s effective tax rate for the years ended December 31, 2023, 2022, and 2021 was 14.4%, 23.5%, and 28.9%, respectively.
The Company expects to reclassify $4.8 million in unrealized gains related to the Change in Fair Value of Interest Rate Hedge Agreement from accumulated other comprehensive loss into earnings during the next 12 months.
The fair value of the interest rate hedge agreements is included in other current and other long-term assets and liabilities on the consolidated balance sheets. See “Note 19 - Fair Value” for additional details.
NOTE 15 - ACCOUNTING FOR STOCK-BASED COMPENSATION Stock Incentive Plans On April 4, 2018, the
The A&R 2018 Omnibus Plan, as amended, allows the Company to grant up to 2,050,000 Stock-based compensation expense is included as part of direct costs and indirect and selling expenses on the consolidated statements of comprehensive income. The total stock-based compensation expense for the years ended December 31,
The assumptions of employment termination forfeiture rates used in the determination of fair value of stock awards during the F-27 Stock Options
The following table summarizes the changes in outstanding stock options:
The aggregate intrinsic value Information regarding stock options outstanding as of December 31,
Restricted Stock Units RSUs generally have a vesting term of three F-28 A summary of the Company’s RSUs is presented below.
The aggregate intrinsic value in the preceding table is based on the Company’s closing stock price of
Cash-Settled Restricted Stock Units CSRSUs generally have a vesting term of three
The aggregate intrinsic value in the preceding table is based on the Company’s closing stock price of F-29 Non-Employee Director Awards
The aggregate intrinsic value in the preceding table is based on the Company’s closing stock price of Performance Share Awards In 2015, the F-30 A summary of the Company’s PSAs is presented below.
The aggregate intrinsic value in the preceding table is based on the Company’s closing stock price of The fair value of the awards is estimated on the grant date using a Monte Carlo simulation model due to the market condition for the rTSR component. The fair value assumptions using the Monte Carlo simulation model for awards granted in
F-31 NOTE 16 –
Acquisitions CMY Solutions, LLC On May 1, 2023, the Company acquired
On September 1, 2022, the Company completed the acquisition of
SemanticBits, LLC On July 13, 2022, the Company completed the acquisition of SemanticBits, LLC (“SemanticBits”), a 450-person Virginia limited liability company. SemanticBits is a partner to U.S. federal health agencies for mission-critical digital modernization solutions and The purchase price was $216.0 million in cash and was funded by the existing Credit Facility. The final purchase price allocation is summarized as follows:
Goodwill is reflective of the existing workforce of SemanticBits and the expected synergies created with the Company as part of the acquisition. The useful lives associated with the customer-related intangible asset and trade names and trademarks are 4.0 years and 0.7 years, respectively. The goodwill and intangible assets are not deductible for income tax purposes.
For the F-32 The following unaudited condensed pro forma information presents combined financial information as if the acquisition of SemanticBits had been effective at January 1, 2021, the beginning of the 2021 fiscal year. As a result, fiscal year 2022 represents the pro forma results for year two of the acquisition. The pro forma information includes alignment of SemanticBits’ revenue recognition policy, corrections of employee-related expenses, and adjustments reflecting changes in the amortization of intangibles, acquisition-related costs, interest expense, and records income tax effects as if SemanticBits had been included in the Company’s results of operations. The pro forma information is not intended to reflect the actual combined results of operations that would have occurred if the acquisition was completed on January 1, 2021, nor is it indicative of future operating results after the acquisition date of July 13, 2022.
Creative Systems and Consulting On December 31, 2021, the Company acquired Creative Systems, a provider of IT modernization and digital transformation solutions to federal agencies, for cash purchase price of $156.6 million. The Company recognized fair value of the assets acquired and liabilities assumed, and allocated $128.1 million and $28.9 million of the purchase price to intangible assets and goodwill. The goodwill is deductible for income tax purposes. Intangible assets consisted of $24.5 million in customer relationships, $3.7 million related to developed technology, $0.6 million related to trade names and trademarks, and $0.1 million related to non-compete agreements. The customer-related and technology-related intangibles are being amortized on a straight-line basis over 4 years and 10 years, respectively, while trade names and trademarks and non-compete agreements will be amortized in less than one year from the acquisition date. Goodwill is reflective of the existing workforce at Creative Systems and the expected synergies created with the Company as a result of the acquisition. The pro-forma impact of the acquisition is not material to the Company’s results of operations. ESAC On November 1, 2021, the Company completed the acquisition of ESAC, which specializes in providing advanced health analytics, research data management and bioinformatics solutions to U.S. federal health agencies, for a cash purchase price of $17.3 million. In addition to working capital acquired of $2.6 million, the Company recognized fair value of the assets acquired and liabilities assumed and allocated $11.3 million to goodwill and $3.4 million to intangible assets. The goodwill is deductible for income tax purposes. Intangible assets included $3.1 million related to customer relationships and $0.3 million related to technology and other intangibles, which are amortized over 3 years and less than 1 year, respectively. The pro-forma impact of the acquisition is not material to the Company’s results of operations. Divestitures Commercial Marketing On July 21, 2023, the Company entered into an Asset Purchase Agreement to sell its U.S. commercial marketing business, including certain assets of the business, for initial cash considerations of $49.5 million before final net working capital adjustments. On September 12, 2023, the Company completed the divesture and received $47.1 million in cash, net of working capital adjustments and certain amounts held in escrow. The disposal of the commercial marketing business was not a major strategic shift that was, or will be, significant to the Company’s operations and financial results. In connection with the sale, the Company recorded a gross gain of $4.4 million and transactions fees of $1.9 million, for a total pre-tax gain of $2.5 million, that is included as part of other income on the Company’s consolidated statements Mobile and SMS Messaging Aggregator Business On July 24, 2023, the Company entered into an Asset Purchase Agreement to sell its mobile and Short Message Service (“SMS”) messaging aggregator business, including certain assets of the business, for the equivalent of $5.4 million in cash. The sale was completed on November 1, 2023. The disposal of the mobile aggregation and SMS messaging aggregator business was not a major strategic shift that was, or will be, significant to the Company’s operations and financial results. In connection with the sale, the Company recorded a pre-tax gain of $3.2 million that is included as F-33 NOTE 17 - EARNINGS PER SHARE The Company’s EPS is computed by dividing reported net income by the weighted-average number of shares outstanding. Diluted EPS considers the potential dilution that could occur if common stock equivalents of stock options, RSUs, and PSAs were exercised or converted into stock. PSAs are included in the computation of diluted shares only to the extent that the underlying performance As of December 31, 2023, the The dilutive effect of stock options, RSUs, and performance shares for each period reported is summarized below:
NOTE 18 - SHARE REPURCHASE PROGRAM
Purchases under this program may be made from time to time at prevailing market prices in open market purchases or in privately negotiated transactions pursuant to Rule 10b-18 under the Exchange Act and in accordance with applicable insider trading and other securities laws and regulations. The purchases are funded from existing cash balances and/or borrowings, and the repurchased shares are held in
F-34 NOTE 19 - FAIR VALUE
Financial instruments measured at fair value on a recurring basis and their location within the accompanying consolidated financial statements are as follows:
NOTE 20 Letters of Credit and Guarantees At December 31, 2023 and 2022, the Company had open standby letters of credit totaling $1.8 million and $2.0 million, respectively, and guarantees of $7.9 million and $9.2 million issued by its banks. The letters of credit and guarantees were primarily for the Company’s facility leases and contract performance obligations. The open standby letters of credit reduce the Company’s unused borrowing capacity under its Credit Facility. Litigation and Claims The Company is involved in various legal matters and proceedings arising in the ordinary course of business. While these matters and proceedings cause it to incur costs, including, but not limited to, attorneys’ fees, the Company currently believes it is not reasonably possible that any ultimate liability arising out of these matters and proceedings will
NOTE 21 - EMPLOYEE BENEFIT PLANS
Effective June 30, 1999, the Company established the ICF Consulting Group Retirement Savings Plan (the “Retirement Savings Plan”). The Retirement Savings Plan is a defined contribution profit sharing plan with a cash or deferred arrangement under Section 401(k) of the Internal Revenue Code. Participants Deferred Compensation Plan Certain key employees of the Company are eligible to defer a specified percentage of their cash compensation by having it contributed to a nonqualified deferred compensation plan. Eligible employees may elect to defer up to Employee Stock Purchase Plan The Company has a NOTE 22 - EXIT ACTIVITIES During the year ended December 31, 2022, the Company incurred charges related to: (i) the reduction and wind-down of certain non-core commercial marketing businesses, and (ii) the reduction of facilities utilized by the remaining elements of the commercial marketing group. Specifically, these charges included the impairment of certain right-of-use operating leases and related assets associated with exited facilities of $8.2 million, $4.8 million in other facility costs recorded within indirect and selling expenses, and retention and severance of $2.3 million primarily recorded within direct costs. Of the $2.3 million in retention and severance, $1.3 million was paid during the 2022 fiscal year and the remaining liability was paid during the 2023 fiscal year.
During the year ended December 31, 2023, the Company completed the divestitures of its non-core U.S. commercial marketing and Canadian mobile and SMS messaging aggregator businesses. As a result of the divestitures, the Company incurred retention and severance of $1.9 million and $1.7 million for the years ended December 31, 2023 and 2022, respectively, which was primarily recorded within direct costs. As part of the sale of the businesses, the Company incurred $0.6 million in related compensation expense which was recorded within indirect and selling expenses. The retention and severance and compensation expenses were paid during the 2023 fiscal year. As a result of these wind-down and divestitures that were completed during the year ended December 31, 2023, the Company recognized impairment losses of $0.9 million related to a prior acquisition, $3.0 million related to right-of-use operating leases, and $2.4 million in other facility costs. NOTE
On F-36 NOTE Valuation and Qualifying Accounts Allowance for
Income Tax Valuation Allowance
F-37
| |||||||||||||||||||||||||||||||||||||||||||||||||||||||||||||||||||||||||||||||||||||||||||||||||||||||||||||||||||||||||||||||||||||||||||||||||||||||||||||||||||||||||||||||||||||||||||||||||||||||||||||||||||||||||||||||||||||||||||||||||||||||||||||||||||||||||||||||||||||||||||||||||||||||||||||||||||||||||||||||||||||||||||||||||||||||||||||||||||||||||||||||||||||||||||||||||||||||||||||||||||||||||||||||||||||||||||||||||||||||||||||||||||||||||||||||||||||||||||||||||||||||||||||||||||||||||||||||||||||||||||||||||||||||||||||||||||||||||||||||||||||||||||||||||||||||||||||||||||||||||||||||||||||||||||||||||||||||||||||||||||||||||||||||||||||||||||||||||||||||||||||||||||||||||||||||||||||||||||||||||||||||||||||||||||||||||||||||||||||||||||||||||||||||||||||||||||||||||||||||||||||||||||||||||||||||||||||||||||||||||||||||||||||||||||||||||||||||||||||||||||||||||||||||||||||||||||||||||||||||||||||||||||||||||||||||||||||||||||||||||||||||||||||||||||||||||||||||||||||||