Item 1 | 2 | |||
| Item 1A |
| ||
| Item 1B |
| ||
| Item 1C |
| ||
| Item 2 |
| ||
| Item 3 |
| ||
| Item 4 |
| ||
Item 5 | 19 | |||
| Item 6 |
| ||
| Item 7 |
| ||
| Item 7A |
| ||
| Item 8 |
| ||
| Item 9 |
| ||
| Item 9A |
| ||
| Item 9B |
| ||
| Item 9C |
|
| |
Item 10 | 51 | |||
| Item 11 |
|
| |
| Item 12 |
| ||
| Item 13 |
| ||
| Item 14 |
| ||
|
| |||
Item 15 | 52 | |||
| Item 16 |
| ||
|
| |||
| ||||
i
i
SPECIAL NOTE ON SForward-lookingpecial Note on Forward-Looking Statements
This annual report on Form 10-K contains forward-looking statements that are made pursuant to the safe harbor provisions of the Section 27A of thePrivate Securities Litigation Reform Act of 1933, as amended (the “Securities Act”), and Section 21E of the Securities Exchange Act of 1934, as amended (the “Exchange Act”),1995, including statements with regards to future revenue, projected operating results, earnings, spending, margins, cash flow, orders, expected timing of shipment of products, inventory levels, future growth or success in specific countries, categories or market sectors, continued or expected distribution to specific retailers, liquidity, capital resources and market risk, strategies and objectives. Forward-looking statements include, without limitation, any statement that may predict, forecast, indicate or simply state future results, performance or achievements, and can be identified by the use of forward-looking language such as “believe,” “anticipate,” “expect,” “estimate,” “intend,” “plan,” “project,” “will, be,” “will continue,” “will result,” “could,” “may,” “might,” or any variations of such words with similar meanings. These forward-looking statements involve risks and uncertainties that could cause actual results to differ materially from those projected in forward-looking statements, and reported results shall not be considered an indication of our future performance. Factors that might cause or contribute to such differences include:
• our ability to maintain our brand image and to anticipate, forecast, identify, and respond to changes in fashion trends, consumer demand for the products and other market factors; • our ability to sustain, manage and forecast our costs and proper inventory levels; • our ability to remain competitive among sellers of footwear for consumers, including in the highly competitive performance footwear market; • global economic, political and market conditions including the effects of inflation and foreign currency exchange rate fluctuations around the world, the challenging consumer retail market in the United States (“U.S.”) and the impact of war and other conflicts around the world; • the loss of any significant customers, decreased demand by industry retailers and the cancellation of order commitments; • our ability to continue to manufacture and ship our products that are sourced in China and Vietnam, which could be adversely affected by various economic, political, health or trade conditions, or a natural disaster in China or Vietnam; and • our ability to manage the impact from delays and disruptions in our supply chain. |
|
|
|
|
|
|
|
|
|
|
|
|
|
|
|
|
|
|
The risks included here are not exhaustive. Other sections of this report may include additional factors that could adversely impact our business, financial condition and results of operations. Moreover, we operate in a very competitive and rapidly changing environment, and new risk factors emerge from time to time. We cannot predict all such risk factors, nor can we assess the impact of all such risk factors on our business or the extent to which any factor or combination of factors may cause actual results to differ materially from those contained in any forward-looking statements. Given these inherent and changing risks and uncertainties, investors should not place undue reliance on forward-looking statements, which reflect our opinions only as of the date of this annual report, as a prediction of actual results. We undertake no obligation to publicly release any revisions to the forward-looking statements after the date of this document, except as otherwise required by reporting requirements of applicable federal and state securities laws.
1
PART I
Item 1. Business DESCRIPTION OF BUSINESS
|
|
Skechers U.S.A., Inc., designs, develops and markets a diverse range of footwear, apparel, and accessories. Our company was incorporated in California in 1992 and reincorporated in Delaware in 1999. For over 30 years, we have expanded our product offering and grown our sales while substantially increasing the breadth of our consumer and customer base. Our objective is to profitably grow our operations worldwide by delivering stylish, comfortable, innovative and high-quality products at a reasonable price.
Skechers is the third largest athletic footwear company in the world due to our innovative comfort technology products, supported by impactful marketing, a diverse distribution strategy, and a dedicated global employee base and loyal network of partners.
In this annual report on Form 10-K for the fiscal year ended December 31, 2023, Skechers U.S.A., Inc., its consolidated subsidiaries and certain variable interest entities (“VIEs”) of which it is the primary beneficiary, isare referred to throughout this annual report as “Skechers,” “the Company,” “we,” “us,” “our,or “our.” “the Company” and “Skechers” unless otherwise indicated. Reference in this annual report to “sales” refers to Skechers’Skechers net sales reported under U.S. generally accepted accounting principlesprinciples.
SEGMENTS
We have two reportable segments: Wholesale and Direct-to-Consumer.
Wholesale. Our Wholesale segment is comprised of sales to a network of partners including:
Growth in the United States (“U.S.”)Wholesale segment is expected to derive from adding new partners, more Skechers-branded stores, as well as expanding our existing shelf-space with current partners from the introduction of new products.
Direct-to-Consumer. Our internet address is www.skechers.com. Our annual report on Form 10-K, quarterly reports on Form 10-Q, current reports on Form 8-K, Form 3’s, 4’s and 5’s filed on behalf of directors, officers and 10% stockholders, and any amendmentsDirect-to-Consumer segment comprises sales by us directly to those reports filed or furnished pursuant to Section 13(a) or 15(d) of the Exchange Act are available free of charge on our corporate website, www.investors.skechers.com, as soon as reasonably practicable after we electronically file such material with, or furnish it to, the U.S. Securities and Exchange Commission (“SEC”). You can learn more about us by reviewing such filings at www.investors.skechers.com or at the SEC’s website at www.sec.gov.
GENERAL
We design and market Skechers-branded lifestyle footwear for men, women and children, and performance footwear for men and women under the Skechers Performance brand name. We also design and market men’s and women’s Skechers branded lifestyle apparel, and license the Skechers brand to others for accessories, pet accessories, leather goods, eyewear and scrub manufacturers, among others. Skechers footwear reflectsconsumers through a combination of channels including:
Growth in the Direct-to-Consumer segment is expected to derive from expanding our footprint, leveraging third-party digital marketplaces and platforms and introducing new products.
PRODUCTS
Skechers is a product-driven company and innovation style, comfort, quality and value that appeals to a broad range of consumers. Our product offering is sold through department and specialty stores, athletic and independent retailers, boutiques and online retailers. In addition to wholesale distribution, our footwear is available on our direct-to-consumer websites and in our own retail stores. Our objective is to profitably grow our operations worldwide while leveraging our recognizable Skechers brand through our diversified product lines, innovative advertising and diversified distribution channels.
We seek to offer consumers a vast array of footwear that satisfies their active, casual, dress casual and athletic footwear needs. Ourat the core consumers are attracted to our relevant brand image, fashion-forward designs, affordable and comfortable product, as well as athletes and fitness enthusiasts attracted to our performance footwear. Many of our best-selling and core styles are also developed for children with colors and materials that reflect a playful image appropriate for this demographic. Further, we offer children a unique collection of footwear designed just for them, including those with innovative light technology.
We believe that brand recognition is an important element for success in the footwear business. We have aggressively marketed our brands through comprehensive marketing campaigns for men, women and children. During 2020, the Skechers brand was supported by print, television, digital, radio and outdoor campaigns as well as donation events for BOBS from Skechers. To further drive recognition, we have enlisted numerous celebrities, former and current athletes, and influencers to appear in our campaigns. In 2020, our brand ambassadors included Sugar Ray Leonard, Tony Romo, Howie Long, and Brooke Burke, along with athletes Edward Cheserek, Meb Keflezighi, Matt Kuchar and Brooke Henderson.
Since 1992, when we introduced our first line, Skechers USA Sport Utility Footwear, we have expanded our product offering and grown our sales while substantially increasing the breadth and penetration of our account base. Our men’s, women’s and children’s product lines benefit from the Skechers reputation for style, quality, comfort, innovation and affordability. Our Performance lines benefit from our marketing, product development, technology, and feedback from athletes and wear testers. To promote innovation and brand relevance, we manage our product lines through separate dedicated sales and design teams.
SKECHERS LINES
process. We offer a wide array of Skechers-branded footwear, lines for men, womenapparel, and children, many of which have categories that have developed into well-known names. Most of these categories are marketed and packaged with unique shoe boxes, hangtags and in-store support.
Lifestyle Brands. Our lifestyle offering includes multiple categories such as Skechers USA, Skechers Sport, Skechers Active, Modern Comfort, Skechers Street, Mark Nason, the charity-minded BOBS from Skechers collection, among others. Comfort, style and value are at the cornerstone of our vast lifestyle collections. Types of footwear sold under this division include casual, casual athletic, sport athletic, trail, sandals, boots, and retro fashion. Innovation is also important within our lifestyle offering and select styles across many lines include a patented Arch Fit insole design for podiatrist-certified arch support and Goodyear Performance Outsoles for enhanced traction, stability and durability. Also within our lifestyle collections are collaborations with known brands and properties—including street artists, influential boutiques and manga characters.
Performance Brands. Skechers Performance encompasses several technical footwear lines, each designed with a focus on specific activities to maximize performance and promote comfort. The Skechers Performance division designs footwear to utilize the latest advancements in materials and innovative design, including lightweight ULTRA GO and HYPER BURST midsole compounds for comfort and responsive feedback. Skechers Performance includes the lines of Skechers GOrun, Skechers GOwalk, Skechers GOtrain, Skechers GOtrail, and Skechers GO Golf. Additional features found in select styles across multiple categories include Arch Fit insoles, Goodyear Performance Outsoles, and Max Cushioning designs.
Skechers Kids. Skechers Kids is comprised of a wide range of sneakers, casuals, boots, and sandals for boys and girls of all ages – pairing the latest trends with innovative comfort technology. The Skechers Kids offering includes its namesake collection; Skechers Mega-Craft; S-Lights; SKECH-AIR; Foamies, Twinkle Toes; Z-Strap; Skechers Stretch Fit; and Skechers Street. Skechers Kids also includes shoes that are designed as “takedowns” of their adult counterparts, allowing younger consumers the opportunity to wear the same popular styles as their older siblings and schoolmates. This “takedown” strategy maintains the product’s integrity by offering premium leathers, hardware and outsoles without the costs involved in designing and developing new products. In addition, we adapt current fashions from our men’s and women’s lines by modifying designs and choosing colors and materials that are more suitable for the playful image that we have established in the children’s footwear market.
Skechers Work. Skechers Work offers a complete line of men’s and women’s slip-resistant and safety-toe casuals, boots, hikers and athletic shoes for professionals who use protective footwear across a wide range of work environments. Skechers Work styles include safety features such as steel, composite and lightweight safety toes; puncture resistance; waterproofing and electrostatic-dissipative technology, as well as Skechers’ comfort technologies such as Relaxed Fit construction; Max Cushioning; Skechers Memory Foam insoles and Arch Fit insoles. Designed for men and women working in jobs with certain safety requirements, these durable styles are constructed on high-abrasion, long-wearing soles for prolonged durability.
In addition, Skechers designs and markets a collection of lifestyle apparelaccessories for men, women, and kids. The collection features the same Skechers characteristicsWe market our products at multiple price points and provide consumers with products that consumers around the world have come to expect from the brand. The activewear garments are designed to directly coordinate with the brand’s footwear initiatives. The Skechers apparel collectionwe believe offer superior in comfort technology.
Product design and development is sold at Skechers retail stores,essential to our domestic wholesale accountssuccess and select international partners.
PRODUCT DESIGN AND DEVELOPMENT
Our principal goal in product design is to develop innovative, comfortable, stylish, quality footwear at a reasonable price for the entire family. Our footwear is designed for active lifestyles and consumers needing comfort in their footwear from fashionable 18- to 34-year-olds, to a broader base of 5- to 50-year-olds, and even an exclusive selection for infants and toddlers. Designeddriven by the Skechers Performance Division, our performance products are for professional and recreational athletes who want a technical shoe that performs under the demands of competition.
We believe that our products’ success is related to our ability to recognize trends in the footwear markets and to design products that anticipate and accommodate consumers’ ever-evolvingevolving preferences. Lifestyle trend information is compiled and analyzed by our designers in various ways, including reviewing and analyzing pop culture, clothing, and trend-setting media; traveling to domestic and international fashion markets to identify and confirm current trends; consultingmedia. We also consult with our customers for information on current retail selling trends; participating in major footwear trade showstrends and collaborate with partners and ambassadors to stay abreast of popular brands, fashionsensure that our products are designed to address the intended market opportunity and styles;convey the distinctive perspective and subscribing to various fashion and color information services. In addition, alifestyle associated with our brand. A key component of our design philosophy is to continually reinterpret and improve our most successful styles.
Footwear. We offer a comprehensive line of Skechers-branded performance and lifestyle footwear for men, women, and kids – with the Company’s signature comfort features and innovations. We develop footwear for all walks of life: athletes at all levels, everyday comfort needs, as well as occupational requirements. Our footwear categories include the following:
2
Apparel. We offer the latest trends in athletic lifestyle apparel. Our collections are designed to complement our footwear products, by offering apparel that is stylish, high-quality and comfortable all at a reasonable price.
Accessories. Skechers licenses a variety of Skechers-branded products including socks, eyewear; medical scrubs; undergarments, fitness and yoga accessories, and cold weather products.
TRADEMARKS, PATENTS AND LICENSING
We own and utilize a variety of trademarks, including the Skechers trademark. We consider our Skechers trademark a significant factor in building our brand image and in distinguishing our products from those of others. We vigorously protect our trademarks against infringement, including through the use of cease-and-desist letters, administrative proceedings and lawsuits. We have a significant number of both registrations and pending applications for our U.S. trademarks. In addition, we have trademark registrations and trademark applications in 164 foreign countries. Further, we have design patents and pending design and utility patent applications in both the U.S. and a myriad of foreign countries. We continuously look to increase the number of our patents and trademarks both domestically and internationally.
We believe that selective licensing of the Skechers brand name to manufacturers broadens and enhances the brand without requiring incremental capital investments or operating expenses. As of December 31, 2023, we had 28 active licensing agreements in which we are the licensor. We license a variety of Skechers-branded products including apparel and accessories.
MARKETING
Brand recognition is an important element for success in the footwear business. Senior management is directly involved in shaping our image and the conception, development and implementation of our advertising and marketing activities. We aggressively market our brands through comprehensive marketing campaigns. The Skechers brand is supported by television, digital, print, radio, outdoor, and press campaigns. To further drive recognition, we enlist numerous celebrities, athletes, and influencers to appear in our brands’ images.campaigns. We strategically select our ambassadors who we believe work well with the Company to promote the brand and support the product.
In 2023, our brand ambassadors included television personalities and entertainers Martha Stewart, Snoop Dogg, Amanda Kloots, Brooke Burke, and Chesca, and former athletes Sugar Ray Leonard, Tony Romo, Howie Long, Cris Carter, Meb Keflezighi, and Rusty Wallace. Additionally, athletes supporting our performance footwear included runner Edward Cheserek, elite golfers Matt Fitzpatrick and Brooke Henderson, pro pickleball players Tyson McGuffin and Catherine Parenteau, and Los Angeles Dodgers pitcher Clayton Kershaw. During the year, we partnered with NBA pros Julius Randle and Terance Mann, and Bayern Munich's Harry Kane, as well as a team of premier league players to support our new basketball and football divisions. We identify athletes who benefit from the comfort and technologies that our brand has to offer, and whose performance on the field, court, or course is augmented through the product.
3
SOURCING AND MANUFACTURING
Factories.Our suppliers are integral partners in delivering stylish, high-quality footwear and apparel to our consumers worldwide. Our products are produced by independent contract manufacturers located primarily in Asia. We do not own or operate any manufacturing facilities. We believe that the use of independent manufacturers substantially increases our production flexibility and capacity, while reducing capital expenditures and avoiding the costs of managing a large production work force.
When possible, we seek to use manufacturers that have previously produced our footwear, which we believe enhances continuity and quality while controlling production costs. To help avoidminimize disruption of our product supply due to potential political instability, civil unrest, economic instability, changes in government policies or regulations, natural and manmade disasters, and other risks, we source product from multiple facilities across multiple countries. We believe that the existing production capacity at our third-party manufacturers’ facilities is sufficient to handle expected volume in the foreseeable future.
We finance our production activities in part through the use of interest-bearing open purchase arrangements with certain of our contract manufacturers. These facilities currently bear interest at a rate between 0.0% and 0.4% for 30- to 60-day financing, depending on the factory. We believe that the use of these arrangements affords us additional liquidity and flexibility. We do not have any long-term contracts with any of our manufacturers. However, we have long-standing relationships with many of our contract manufacturers and believe our relationships to be good.
Production Oversight.To safeguard product quality and consistency, we overseemonitor the key aspects of production from initial prototype manufacture,manufacturing, through initial production runs, to final manufacture.manufacturing. Monitoring of all production is performed in the U.S. by our in-house production department and in Asia throughby staff working from our offices in China and Vietnam. We believe that our Asia presence allows us to negotiate supplier and manufacturer arrangements more effectively, decrease product turnaround time, and ensure timely delivery of finished footwear. In addition, we require our manufacturers to operate in a manner consistent with the Skechers Supplier Code of Conduct posted on our corporate website. We partner with factories that ensure humane conditions for their employees and we engage in routine auditing and monitoring procedures to ensure that those who contribute to our product are treated with the civility and respect they deserve.
Quality Control.We believe that quality control is an important and effective means of maintaining the quality and reputation of our products.products and brand. Our quality control program is designed to ensure that not only finished goods meet our established design specifications but also that alland goods bearing our trademarks meet our standards for quality. Our quality control personnel located in China and Vietnam perform an array of inspection procedures at various stages of the production process, including examination and testing of prototypes of key raw materials prior to manufacture, samples and materials at various stages of production and final products prior to shipment. Our employees are on-site at each of our major manufacturers to oversee production. For some of our lower volumeproduction and ensure that leading manufacturers our staff is on-site during significant production runs, or we will perform unannounced visits to their manufacturing sites to further monitor compliancecomply with our manufacturing specifications.Supplier Code of Conduct.
Sustainability. We believe that sustainability is an important responsibilityOUR MARKET
Our collections are available in managing our business. We have worked to make our packaging more sustainable for the more-than-150 million pairs of Skechers that consumers purchase every year. Since 2016, we’ve reduced our products’ packaging plastics by 85% down to 10% of our foot forms,approximately 180 countries and have made remaining plastics completely recyclable. Many facilitiesterritories and can now recycle 93% of Skechers-branded shoeboxes, and all of our foot forms and tissue paper packaging is also recyclable and printed with soy-or water-based ink.be accessed in digital or physical stores. We are proudcontinually expanding and enhancing our distribution and logistics facilities and systems to have 99% ofsupport our shoes packagedomni-channel capabilities and provide greater access to merchandise selection and faster delivery. Our company-owned e-commerce business enables consumers to shop, browse, find store locations, socially interact, post reviews, and immerse themselves in shoeboxes that meetour brands. Additionally, the FSC® standard for responsible resources,e-commerce business provides an efficient and we are continually looking out for new wayseffective retail distribution channel, which continues to improve with green materials, regular assessments,our customer service and assurance that our items are FSC-certified, recycled or ethically harvested.
Our shipping methods reflect our green-minded approach to sustainability: master cartons are printed with soy-or-water-based ink and are 100% recyclable, and at the distribution centers managing more than 90% of our business, our outbound shipping cartons are made with 96%-100% recyclable materials and are 100% recyclable.
Many of our facilities are designed and operated with sustainability in mind, including America’s largest LEED Gold certified distribution facility in Rancho Belago, California. Our new corporate headquarters in Manhattan Beach, California are also being designed and developed to qualify for LEED certification.
Product Styles. brand experience. We closely monitor sales activity after initial introduction of a product in our concept stores and on-line to determine whether there is substantial demand for a style, thereby aiding us in our sourcing decisions. Styles that have substantial consumer appeal are highlighted in upcoming collections or offered as part of our periodic style offerings, while less popular styles can be discontinued after a limited production run. We believe that sales in our concept stores can also help forecast sales in national retail stores, and we share this sales information with our wholesale customers. Sales, merchandising, production and allocations management analyze historical and current sales along with market data from our wholesale account base and our own retail stores to develop an internal product quantity forecast that allows us to manage our future production and inventory levels. For those styles with high sell-through percentages, we maintain an in-stock position to minimize the time necessary to fill customer orders by placing orders with our manufacturers prior to the time we receive customers’ orders for such footwear.
ADVERTISING AND MARKETING
With a marketing philosophy of “Unseen, Untold, Unsold,” we take a targeted approach to marketing to drive traffic, build brand recognition and properly position our diverse lines within the marketplace. Senior management is directly involved in shaping our image and the conception, development and implementation of our advertising and marketing activities. Our marketing plan has an omni-channel approach, and we utilize print, outdoor, television, radio, and digital, along with public relations, influencers and social media, promotions, and in-store events. In addition, we utilize celebrity endorsers in some of our advertisements. We also believe our websites are effective marketing tools to consumers. We have historically budgeted advertising as a percentage of projected sales.
PRODUCT DISTRIBUTION CHANNELS
We have three reportable segments: Domestic Wholesale, International Wholesale, and Direct-to-Consumer. In the U.S., our products are availableinternational business through a network of wholesale customers comprised of department, athletic and specialty stores and online retailers. Internationally, our products are available through wholesale customers in more than 170 countries and territories via our global network of distributors as well as through ourwholly-owned subsidiaries, in Asia, Europe, Canada, Central America and South America. Skechers owns and operates retail stores both domestically and internationally through three integrated retail formats—concept, factory outlet and warehouse outlet stores. Each of these channels serves an integral function in the global distribution of our products.
In addition, 18 distributors and 51 licensees have opened and operate 799 distributor-owned or -licensed Skechers retail stores and 1,771 licensee-owned Skechers retail stores, respectively, as of December 31, 2020.
Domestic Wholesale. We distribute our footwear through the following domestic wholesale distribution channels: big-box footwear stores, department stores, wholesale clubs, specialty stores, athletic specialty shoe stores, independent retailers, and internet retailers. Skechers footwear is available in a variety of wholesale customers, many of whom may operate stores within the same retail location due to our distinct product lines, variety of styles and the price criteria of their specific customers. Management has a clearly defined growth strategy for each of our channels of distribution. An integral component of our strategy is to offer our accounts the highest level of customer service so that our products will be fully represented in existing and new customer retail locations.
In an effort to provide knowledgeable and personalized service to our wholesale customers, the sales force is segregated by product line, each of which is headed by a vice president or national sales manager. Reporting to each sales manager are knowledgeable account executives and territory managers. The vice presidents and national sales managers report to our senior vice president of sales. All of our vice presidents and national sales managers are compensated on a salary basis, while our account executives and territory managers are compensated on a commission basis. None of our domestic sales personnel sells competing products.
InternationalWholesale. Our products are sold in more than 170 countries and territories throughout the world. We generate revenues from outside the U.S. from three principal sources: (i) sales to department stores and specialty retail stores through our joint ventures in Mexico, Asia and the Middle East, as well as through our subsidiaries in the Americas, Europe, and Asia; (ii) sales to international distributors who deliver our footwear to department stores, specialty retail stores and third-party-owned Skechers stores in select countries and territories across Asia, South America, Africa, the Middle East and Australia; and (iii) to a lesser extent, royalties from licensees who manufacture and distribute our non-footwear products abroad.
We believe that international distribution of our products represents a significant opportunity to increase sales and profits. We intend to further increase our share of the international footwear market by heightening our marketing in those countries in which we currently have a presence through our international advertising campaigns, which are designed to establish Skechers as a global lifestyle and performance brand.
The following subsidiaries and joint ventures merchandise, market and distribute product to generate sales in their named countries, and we consolidate their results in our financial statements:
|
|
Canada – We currently operate through Skechers USA Canada, Inc. with its offices and showrooms outside Toronto in Mississauga, Ontario. Product sold in Canada is primarily sourced from our U.S. distribution center in California. We have company-owned retail stores in key locations across Canada.
Europe – We currently operate in Europe through the following subsidiaries: Skechers USA Ltd., with its offices and showrooms in London, England; Skechers S.a.r.l., with its offices in Lausanne, Switzerland; Skechers USA France S.A.S., with its offices and showrooms in Paris, France; Skechers USA Deutschland GmbH, with its offices and showrooms in Dietzenbach, Germany; Skechers USA Iberia, S.L., with its offices and showrooms in Madrid, Spain; Skechers USA Benelux B.V., with its offices and showrooms in Waalwijk, the Netherlands; Skechers USA Italia S.r.l., with its offices and showrooms in Milan, Italy; and Skechers CEE, Kft. with its offices and showrooms in Budapest, Hungary as well as regional showrooms in Albania, Bosnia-Herzegovina, Bulgaria, Croatia, the Czech Republic, Kosovo, Macedonia, Moldova, Montenegro, Romania, Serbia, Slovakia and Slovenia. To accommodate our European subsidiaries’ operations, we operate a 1.8 million square-foot distribution center in Liege, Belgium.
India – We currently operate through Skechers South Asia Private Limited and Skechers Retail India Private Limited.
Japan ��� We currently operate through our subsidiary, Skechers Japan GK, with its offices and showrooms located in Tokyo, Japan. Product sold in Japan is primarily shipped directly from our contract manufacturers’ factories in China.
South America and Central America – We currently operate in South America and Central America through the following subsidiaries: Skechers Do Brasil Calcados LTDA, with its offices and showrooms located in Sao Paulo, Brazil; Comercializadora Skechers Chile Limitada, with its offices and showrooms located in Santiago, Chile; and Skechers Latin America LLC, with its offices and showrooms in Panama City, Panama as well as regional showrooms in Panama, Peru, Colombia and Costa Rica. Our Latin America subsidiary also distributes products in the Caribbean, Ecuador, Guatemala, El Salvador, Honduras and Nicaragua. Product sold in South America and Central America is primarily shipped directly from our contract manufacturers’ factories in China and Vietnam.
|
|
China and Hong Kong – We have a 50% interest in a joint venture in China and a minority interest in a joint venture in Hong Kong. Under the joint venture agreements, the joint venture partners, contribute capital in proportion to their respective ownership interests.
Israel – We have a 51% interest in Skechers Ltd. (Israel). Under theand distributors. Our joint venture agreement, the joint venture partners contribute capital in proportion to their respective ownership interests.
Mexico – We have a 60% interest in Manhattan SKMX, S. de R.L. de C.V. (“Skechers Mexico”). Under the joint venture agreement, the joint venture partners contribute capital in proportion to their respective ownership interests.
South Korea – We have a 65% interest in Skechers Korea Co., Ltd. Under the joint venture agreement, the joint venture partners contribute capital in proportion to their respective ownership interests.
Malaysia, Singapore and Thailand – We have a 50% interest in a joint venture ininterests include China, Malaysia and Singapore (50%), Thailand (51%), Mexico (60%), and a 51% interest in a joint venture in Thailand. Under the joint venture agreements, the joint venture partners contribute capital in proportion to their respective ownership interests.
|
|
South Korea (65%), and Israel (75%). Where we do not sell directly through our international subsidiaries and joint ventures, our footwear is distributed through a network of more than 23 distributors and licensees who sell our products to department, athletic and specialty stores. As of December 31, 2020, we also had agreements with 18 of these distributors and 51 licensees regarding 799 distributor-owned or licensed Skechersstores, as well as in Skechers-branded retail stores and 1,771 licensee-owned Skechers retail stores. Our distributors, licensees and franchisees own and operate the following retail stores in more than 170 countries around the world:
|
| Number of Store Locations at December 31, 2019 |
|
| Opened during 2020 |
|
| Closed during 2020 |
|
| Number of Store Locations at December 31, 2020 |
| ||||
Distributor, licensee and franchise stores |
|
|
|
|
|
|
|
|
|
|
|
|
|
|
|
|
Africa |
|
| 60 |
|
|
| 8 |
|
|
| (1 | ) |
|
| 67 |
|
Asia |
|
| 1,694 |
|
|
| 350 |
|
|
| (247 | ) |
|
| 1,797 |
|
Australasia |
|
| 109 |
|
|
| 12 |
|
|
| — |
|
|
| 121 |
|
Central America |
|
| 16 |
|
|
| 3 |
|
|
| — |
|
|
| 19 |
|
Europe |
|
| 303 |
|
|
| 53 |
|
|
| (4 | ) |
|
| 352 |
|
Middle East |
|
| 164 |
|
|
| 2 |
|
|
| (1 | ) |
|
| 165 |
|
North America |
|
| 12 |
|
|
| — |
|
|
| — |
|
|
| 12 |
|
South America |
|
| 35 |
|
|
| 2 |
|
|
| — |
|
|
| 37 |
|
Total distributor, licensee and franchise stores |
|
| 2,393 |
|
|
| 430 |
|
|
| (253 | ) |
|
| 2,570 |
|
Distributors and licensees are responsible for their respective stores’ operations, have ownership of their respective stores’ assets, and select the broad collection of our products to sell to consumers in their regions. In order to maintain a globally consistent image, we provide architectural, graphic and visual guidance and materials for the design of the stores, and we train the local staff on our products and corporate culture. We intend to expand our international presence and global recognition of the Skechers brand name by continuing to sell our footwear to foreign distributors and by opening retail stores with distributors that have local market expertise.
Direct-to-Consumer. We pursue our direct-to-consumer strategy through our integrated retail formats: e-commerce, concept stores, factory outlet and warehouse outlet stores. Our formats enable us to promote the full Skechers product offering in an attractive environment that appeals to a broad group of consumers.
|
|
|
|
|
The typical Skechers concept store is approximately 3,000 square feet, although in certain markets we have concept stores ranging from 600 square feet to 14,300 square feet. When deciding where to open concept stores, we identify top geographic markets in larger metropolitan cities around the world.
|
|
|
|
Store count, openings and closings for our domestic, international and consolidated joint venture stores are as follows:
|
| Number of Store Locations at December 31, 2019 |
|
| Opened during 2020 |
|
| Closed during 2020 |
|
| Number of Store Locations at December 31, 2020 |
| ||||
Domestic stores |
|
|
|
|
|
|
|
|
|
|
|
|
|
|
|
|
Concept |
|
| 109 |
|
|
| 3 |
|
|
| (7 | ) |
|
| 105 |
|
Factory Outlet |
|
| 171 |
|
|
| 2 |
|
|
| (1 | ) |
|
| 172 |
|
Warehouse Outlet |
|
| 217 |
|
|
| 31 |
|
|
| (2 | ) |
|
| 246 |
|
Domestic stores total |
|
| 497 |
|
|
| 36 |
|
|
| (10 | ) |
|
| 523 |
|
International stores |
|
|
|
|
|
|
|
|
|
|
|
|
|
|
|
|
Concept |
|
| 200 |
|
|
| 21 |
|
|
| (1 | ) |
|
| 220 |
|
Factory Outlet |
|
| 93 |
|
|
| 9 |
|
|
| (2 | ) |
|
| 100 |
|
Warehouse Outlet |
|
| 10 |
|
|
| 1 |
|
|
| — |
|
|
| 11 |
|
International stores total |
|
| 303 |
|
|
| 31 |
|
|
| (3 | ) |
|
| 331 |
|
Joint venture stores |
|
|
|
|
|
|
|
|
|
|
|
|
|
|
|
|
China |
|
| 157 |
|
|
| 111 |
|
|
| (23 | ) |
|
| 245 |
|
Hong Kong |
|
| 47 |
|
|
| 2 |
|
|
| (3 | ) |
|
| 46 |
|
Israel |
|
| 15 |
|
|
| 2 |
|
|
| — |
|
|
| 17 |
|
Mexico |
|
| 81 |
|
|
| 4 |
|
|
| (1 | ) |
|
| 84 |
|
South Korea |
|
| 17 |
|
|
| — |
|
|
| (2 | ) |
|
| 15 |
|
South East Asia |
|
| 37 |
|
|
| 23 |
|
|
| — |
|
|
| 60 |
|
Joint venture stores total |
|
| 354 |
|
|
| 142 |
|
|
| (29 | ) |
|
| 467 |
|
Total domestic, international and joint venture stores |
|
| 1,154 |
|
|
| 209 |
|
|
| (42 | ) |
|
| 1,321 |
|
LICENSING
We believe that selective licensing of the Skechers brand name and our product line names to manufacturers may broaden and enhance the individual brands without requiring significant capital investments or additional incremental operating expenses. Our multiple product lines plus additional subcategories present many potential licensing opportunities on terms with licensees that we believe will provide more effective manufacturing, distribution or marketing of non-footwear products. We believe that the reputation of Skechers and its history in launching brands has also enabled us to partner with reputable non-footwear brands to design and market their footwear.
As of December 31, 2020, we had 23 active domestic and international licensing agreements in which we are the licensor. These include Skechers-branded kids’ apparel; bags, backpacks and lunch boxes; belts, wallets and travel accessories, and watches for adults and kids; headwear, socks and shoe care; prescription and sunglass eyewear; outerwear, swimwear, underwear, sleepwear and medical scrubs; fitness and yoga accessories; headwear; and cold weather products. Additional category-specific collections include Skechers Sport apparel, bags, backpacks and headwear; Twinkle Toes backpacks and lunchboxes; Skechers Work socks and Skechers Go Golf apparel for men and women. We also have BOBS from Skechers pet accessories in Petco. We have international licensing agreements for the design and distribution of prescription and sunglass eyewear globally; men’s, women’s and kids’ apparel in the United Kingdom; kids’ apparel in Europe; socks and watches throughout Europe; bags and backpacks in the Philippines, Taiwan, Australia, New Zealand, Europe Russia, Scandinavia and the Middle East; medical scrubs in the Middle East, United Kingdom, Australia, and New Zealand; apparel, socks, headwear, bags, and backpacks in Indonesia; apparel, socks, and bags in Mexico; bags, backpacks, luggage, wallets, watches, medical scrubs and accessories in Latin America; apparel, bags, and backpacks, headwear, socks, and shoe care Turkey; socks in Japan and watches in the Philippines.
DISTRIBUTION FACILITIES AND OPERATIONSCOMPETITION
We believe that strong distribution support is a critical factor in our operations. Once manufactured, our products are packaged in shoe boxes bearing bar codes that are shipped either: (i) to our approximate 2.8 million square-foot North American distribution center located in California, (ii) to our approximate 1.8 million square-foot European Distribution Center located in Belgium, (iii) to our company-operated distribution centers or third-party distribution centers in Central America, South America and Asia, or (vi) directly from third-party manufacturers to our other international customers and other international third-party distribution centers. Upon receipt at either of the distribution centers, merchandise is inspected and recorded in our management information system and packaged according to customers’ orders for delivery. Merchandise is shipped to customers by whatever means each customer requests, which is usually by common carrier. The distribution centers have multi-access docks, enabling us to receive and ship simultaneously, and to pack separate trailers for shipments to different customers at the same time. We have an electronic data interchange system which is linked to some of our larger customers. This system allows these customers to automatically place orders with us, thereby eliminating the time involved in transmitting and inputting orders, and it includes direct billing and shipping information.
INTELLECTUAL PROPERTY RIGHTS
We own and utilize a variety of trademarks, including the Skechers trademark. We have a significant number of both registrations and pending applications for our U.S. trademarks. In addition, we have trademark registrations and trademark applications in approximately 155 foreign countries. We also have design patents and pending design and utility patent applications in both the U.S. and approximately 39 foreign countries. We continuously look to increase the number of our patents and trademarks both domestically and internationally, where necessary to protect valuable intellectual property. We regard our trademarks and other intellectual property as valuable assets, and believe that they have significant value in marketing our products. We vigorously protect our trademarks against infringement, including through the use of cease and desist letters, administrative proceedings and lawsuits.
COMPETITION
The global footwear industry is a competitive business. Although we believe that we do not compete directly with any single company with respect to itsour entire range of products, our products compete with other branded products within their product category as well as with private label products sold by retailers, including some of our customers. Our footwear competes with footwear offered by companies such as Columbia Sportswear Company, Nike, Inc., Crocs, Inc., Deckers Outdoor Corporation, Kenneth Cole Productions Inc., Steven Madden, Ltd., V.F. Corporation, Adidas AG, Reebok International, Puma SE, ASICS America Corporation, New Balance Athletic Shoe, Inc., Under Armor Inc. and Wolverine World Wide, Inc. These and other competitors pose challenges to our market share in domestic and international markets. We also compete with numerous manufacturers, importers, and distributors of footwear for the limited shelf space available for displaying such products to the consumer. Moreover, the general availability of contract manufacturing capacity allows ease of access by new market entrants. Some of our competitors are larger, have been in existence for a longer period of time, have strong brand recognition, have captured greater market share and/or have substantially greater financial, distribution, marketing and other resources than we do. We believe, however, that we have competitive advantages because of our brand recognition, our quality comfort technology products, and our application of pricing and distribution strategies, among other factors.
EMPLOYEESHUMAN CAPITAL
Skechers employees are central to our success. We are a family brand at the core, and our commitment to family extends to our diverse team of global employees. We believe our unique backgrounds and experiences have made us stronger, inspired new ideas, and driven our innovative spirit. From our corporate offices to our retail stores and our distribution centers, we aim to build a workplace that supports each employee’s well-being and encourages everyone to grow in their careers and give back to their community. We are focused on creating a positive, supportive work environment where our team can work and feel their best every day.
Employees. As of December 31, 2020,2023, we employed approximately 11,70017,900 persons worldwide, of whom approximately 5,9009,200 were employed on a full-time basis and approximately 5,8008,700 were employed on a part-time basis, primarily in our retail stores. As
Compensation and Benefits. We seek to provide market-competitive compensation and benefits that not only attract the best talent, but also retain our current employees. We offer a family-focused brand, broad range of benefits including medical, prescription, dental and vision plans, flexible spending accounts, company-provided disability insurance, pet insurance, paid sick and vacation time, employee assistance program, childcare subsidies, parental leave and tuition reimbursement. Additional benefits for certain employees include a 401K plan, 529 college savings plan, pensions and pet insurance.
4
Diversity,Equity, and Inclusion. Skechers was founded on inclusivity, diversity, respect, and entrepreneurial spirit with the philosophy of putting people first – offering comfortfirst. In conjunction with our corporate policy against discrimination, Skechers emphasizes that every employee, applicant, contractor, and carecustomer is entitled to its employees and customers, and supporting bothbe treated with dignity and respect. Human rights isare a core value at the heart of how we conduct our business, at every level of our companythe Company – fromincluding our factories and suppliers. Our Code of Ethics, Corporate Code of Conduct and Supplier Code of Conduct codify our commitment to these values. These codes are in the Corporate Governance section of the Investor Relations page of our corporate information website located at investors.skechers.com/corporate-governance/governance-documents. We intend to post any amendment to, or waivers of, these codes on our website.
CORPORATE RESPONSIBILITY
Despite the dynamic growth we have seen over the years, we remain firmly rooted in the same community where we began while dedicated to serving the people of the world. In so doing, we take seriously our position as a steward of the many communities and stakeholders we impact in our daily business activities. This increasingly involves considering the multiple ways we can evolve our business practices and processes to improve the health of our planet, the lives of our people and our communities. Corporate responsibility is a top priority for our leadership, who are investing in plans to further our environmental, social and governance ("ESG") efforts.
Sustainability. We believe it is our responsibility as a family-focused footwear and apparel brand to create and implement sustainable strategies across our operations to minimize our impact on the environment and support our customers, employees, and partners. Environmental advancements are a top priority in the development of our corporate offices as well as logistic centers. Many of our facilities are designed and operated with sustainability in mind, including one of America’s largest LEED Gold certified facilities at our North America distribution center in Southern California. Our European Distribution Center in Liege, Belgium, has both a BREEAM Very Good rating and a Lean and Green certification. Additionally, our China Distribution Center in Taicang incorporates sustainable features such as natural lighting, LED motion detectors and temperature controllers; and our newly opened India Distribution Center outside Mumbai is designed as a LEED building with certification pending.
In 2021, we introduced Our Planet Matters, a collection for men, women and kids that utilizes recycled materials. We partnered with a global conservation organization to help fund its organization’s global efforts which align with our interests and commitment to reduce tree harvesting and emissions through packaging. These efforts represent our growing focus on more environmentally sustainable manufacturing, packaging, distribution, product development, corporate processes, and activities.
Human Rights. We require our manufacturers to operate in a manner consistent with the Skechers Supplier Code of Conduct posted on our corporate website. We partner with factories that ensure humane conditions for their employees and we engage in routine auditing and monitoring procedures to ensure that those who contribute to our suppliers.product are treated with civility and respect. This code outlines our policies and expectations on topics including discrimination, harassment and abuse, forced labor, freedom of association, compensation and benefits, and health and safety, among others.
Community. Skechers encourages active participation in the greater community, with annual charity walks for children in the U.S. and around the world. We promote charitable giving and volunteering by sponsoring community service days along with blood drives, food drives, and shoe drives. Additionally, we regularly donate product to not-for-profit organizations. In 2023, we donated more than $1.1 million to Petco Love Foundation to help save the lives of animals in need in the U.S. and Canada.
For additional information on how Skechers value creation and global impact, refer to our Impact Report which can be found on our website at about.skechers.com/social-responsibility.
AVAILABLE INFORMATION
We file annual, quarterly, and current reports, proxy statements and other documents with the Securities and Exchange Commission (“SEC”). The SEC maintains an internet site at sec.gov that contains reports, proxy and information statements, and other information regarding issuers that file electronically. Our internet address is www.skechers.com. Our annual report on Form 10-K, quarterly reports on Form 10-Q, current reports on Form 8-K, proxy statements and other information are also made available, free of charge, on our investor relations website at investors.skechers.com as soon as reasonably practicable after we file or furnish with the SEC. The information found on, or otherwise accessible through our website, is not incorporated into, and does not form a part of this annual report on Form 10-K or our other filings with the SEC.
5
Item 1A. Risk Factors
|
|
In addition to the other information in this annual report, the following factors should be considered in evaluating us and our business.
Risks Related to COVID-19
The COVID-19 Pandemic Has Had, And May Continue To Have, A Material Adverse Effect On Our Business And Results Of Operations.
Impact on Global Economy and on Our Business and Financial Performance
The COVID-19 pandemic has negatively impacted the global economy, disrupted consumer spending and global supply chains, and created significant volatility and disruption of financial markets. The COVID-19 pandemic has had, and may continue to have, a material adverse impact on our business and financial performance. The extent of this impact on our business and financial performance, including our ability to execute our near-term and long-term business strategies and initiatives in the expected time frame, is highly uncertain and cannot be predicted, as information is rapidly evolving with respect to the duration and severity of the pandemic. It will depend on future developments, including the duration and severity of the pandemic, related restrictions on travel, temporary store closure requirements and the related impact on consumer confidence and spending, and the extent of any recession resulting from the pandemic. At this time, we cannot reasonably estimate the duration and severity of the COVID-19 pandemic, or its overall impact on our business and financial performance.
Closures and Operational Restrictions of Our Retail Stores and Our Wholesale Customers’ Stores
As a result of the COVID-19 pandemic, and in response to government mandates or recommendations, as well as decisions we have made to protect the health and safety of our employees, consumers and communities, beginning in March 2020, we (including our joint ventures), and our distributors, licensees and franchisees, temporarily closed a significant number of our company- and joint venture-owned retail stores, and our distributor-, licensee- and franchisee-owned retail stores, respectively, around the world. While over 90% of our company- and joint venture-owned retail stores and over 90% of our third party-owned retail stores around the world have reopened (although many with temporarily reduced operating hours) as of the filing date of this report, collectively, we may face recurring store closure requirements and other operational restrictions with respect to some or all of our physical locations for prolonged periods of time due to, among other factors, evolving or new increasingly stringent governmental restrictions including public health directives, quarantine policies or social distancing measures. In addition, many of our significant wholesale customers have closed many of their stores, which will adversely impact our revenues from these customers. As a result, our business and results of operations have been, and will continue to be, materially adversely impacted by store closures and operational restrictions.
Even as we and our wholesales customers reopen our stores, as the number of people affected by the COVID-19 pandemic continues to grow, consumer fear about becoming ill with the disease and recommendations and/or mandates from federal, state and local authorities to avoid large gatherings of people or self-quarantine may continue to increase, which has, and will continue to, adversely affect traffic to stores. Any significant reduction in consumer visits to, or spending at, our wholesale customers’ stores and our retail stores, caused by the COVID-19 pandemic, and any decreased spending at stores caused by decreased consumer confidence and spending during and following this pandemic, has resulted in, and will continue to result in, a loss of sales and profits and other material adverse effects on our business and results of operations.
Disruptions or Delays in Our Supply Chain
Although not a material issue as of the filing date of this report, the COVID-19 pandemic has also caused delays in shipments of our products and could once again have the potential to significantly impact our supply chain if the factories that manufacture our products, the distribution centers where we manage our inventory, or the operations of our logistics and other service providers are disrupted, temporarily closed or experience worker shortages. More specifically, the majority of our manufacturers are located primarily in China and Vietnam. To date, the Chinese and Vietnamese governments have imposed certain restrictions on business operations and the movement of people and goods, including the temporary closure of some factories and businesses in China and restrictions on others in Vietnam, to limit the spread of COVID-19. As a result, we have seen and may yet again see disruptions or delays in shipments, and we may experience negative impacts to pricing of our products due to changes in availability of inventory, which could materially adversely impact our business and results of operations.
Office Closures, Focus of Key Personnel and Productivity of Employees
As a result of the COVID-19 pandemic, including related governmental guidance or requirements, beginning in March 2020, we also temporarily closed many of our corporate offices and other facilities, including our corporate headquarters in Manhattan Beach, California, and implemented a policy for many of our corporate employees to work remotely. While we began to allow a limited number of personnel back to our corporate offices with added safety measures and staggered work schedules in June, these evolving work place arrangements may negatively impact productivity and cause other disruptions to our business.
In addition, our management team is focused on mitigating the adverse effects of the COVID-19 pandemic, which has required and will continue to require a large investment of time and resources across the entire company, thereby diverting their attention from other priorities that existed prior to the outbreak of the pandemic. If these conditions worsen, or last for an extended period of time, our ability to manage our business may be impaired, and operational risks and other risks facing us even prior to the COVID-19 pandemic may be elevated.
The COVID-19 Pandemic Has Had A Negative Impact On The Global Economy, And Our Sales Are Influenced By Economic Conditions That Impact Consumer Spending And Consumer Confidence.RISKS RELATED TO OUR BUSINESS AND INDUSTRY
Footwear is a cyclical industry that is dependent upon the overall level of consumer spending and consumer confidence. Consumer purchases of discretionary items, including our products, generally decline during periods when disposable income is adversely affected, there is economic uncertainty or volatility or during recessionary periods. Our wholesale customers anticipate and respond to adverse changes in economic conditions and uncertainty by closing doors, reducing inventories, canceling orders or increasing promotional activity. Our retail stores are also affected by these conditions, which may lead to a decline in consumer traffic and spending in these stores as they reopen. As a result, factors that diminish consumer spending and confidence in any of the markets in which we compete, particularly deterioration in general economic conditions, consumer credit availability, consumer debt levels, inflation, the impact of foreign exchange fluctuations on tourism and tourist spending, volatility in investment returns, fear of unemployment, increases in energy costs or tax or interest rates, housing market downturns, fear about and impact of pandemic illness (such as the impact of the COVID-19 pandemic, including reduced store traffic and widespread temporary store closures), and other factors such as acts of war, natural disasters or terrorist or political events that impact consumer confidence, have reduced, and may continue to reduce (with respect to the COVID-19 pandemic), our sales and may continue to have a material adverse effect on our operations and financial condition through their negative impact on our wholesale customers as well as decreased spending in our retail stores and potentially via our e-commerce business.
Risks Related to Customers, Competition and Retail Operations
Our Future Success Depends On Our Ability To Maintain Our Brand Name And Image With Consumers.
Our success to date has in large partlargely been due to the strength of the Skechers brand. Maintaining, promoting, and growing our brand name and image depends on sustained effort and commitmentour ability to and significant investment in, both the successful development ofdevelop high-quality, innovative, and fashion forward products, andas well as our ability to create fresh and relevant marketing and advertising campaigns. Even if we are ableThe inability to timely and appropriately respond to changing consumer preferences and trends with new high-quality products,execute or adverse developments in these areas could negatively impact our marketing and advertising campaigns may not resonate with consumers, or consumers may consider our brand to be outdated or associated with footwear styles that are no longer popular or relevant.brand. Our brand name and image with consumers could also be negatively impacted if we or any of our products were to receive negative publicity, whether related to our products or otherwise.publicity. If we are unable to maintain, promote and grow our brand, image, then our business, financial condition, results of operations, and cash flows could be materially and adversely affected.
Our Future Success Also Depends On Our Ability To Respond To Changing Consumer Preferences, Identify And Interpret Consumer Trends, And Successfully Market New Products.
The footwear industry is subject to rapidly changing consumer preferences. The continued popularity of our footwear and the development of new lines and styles of footwear with widespread consumer appeal, including consumer acceptance of our performance footwear, requires us to accurately identify and interpret changing consumer trends and preferences and to effectively respond in a timely manner. Continuing demandDemand for and market acceptance for bothof existing and new products are uncertain and depend on the following factors:
|
|
| We are often required to |
|
|
In assessing our response to anticipated changing consumer preferences and trends, we frequently must make decisions about product designs and marketing expenditures several months in advance of the time when actual consumer acceptance can be determined. As a result, we may not be successful in responding to shifting consumer preferences and trends with new products that achieve market acceptance. Because of the ever-changing nature of consumer preferences and market trends, a number of companies in the footwear industry, including ours, experience periods of both rapid growth, followed by declines, in revenue and earnings. If we fail to identify and interpreteffectively respond to changing consumer preferences, and trends, or are not successful in responding to these changes with the timely development of products that achieve market acceptance, we could experience excess inventories, higher than normal markdowns, returns, order cancellations or an inability to profitably sell our products, and our business, financial condition, results of operations, and cash flows could be materially and adversely affected.
We Face Intense Competition, Including Competition From Companies In The Performance Footwear MarketIndustry and Those With Significantly Greater Resources Than Ours, And If We Are Unable To Compete Effectively With These Companies, Our Market Share May Decline And Our Business Could Be Harmed.Ours.
We face intense competition from other established companies in the footwear industry. Our competitors’industry in the areas of product offerings, pricing, costs of production, and advertising and marketing expenditures are highly competitive areas inexpenditures. Consumer demand for our business. Ifproducts may decline significantly if we do not adequately and timely anticipate and respond to our competitors, consumer demand for our products may decline significantly. A numbercompetitors. Some of our competitors have significantly greater financial, technological, engineering, manufacturing, marketing and distribution resources than we do. Their greater capabilities in these areas may enable them to better withstand periodic downturns in the footwear industry, compete more effectively on the basis of price and production, more effectively keep up with rapid changes in footwear technology, and more quickly develop new products. New companies may also enter the markets in which we compete, further increasing competition in the footwear industry. In addition, negative consumer perceptions of our performance features due to our historical reputation as a fashion and lifestyle footwear company may place us at a competitive disadvantage in the performance footwear market.competition. We may not be able to compete successfully in the future, and increased competition may result in price reductions, cost increases, reduced profit margins, loss of market share and an inability to generate cash flows that are sufficient to maintain or expand our development and marketing of new products, which would materially and adversely impactaffect our business, financial condition, results of operations, and financial condition.cash flows.
We Depend Upon A Relatively Small Group Of Customers For A Large Portion Of Our Sales.
During the year ended December 31, 2020, our net sales to our five largest customers accounted for approximately 8.8% of total net sales, respectively. No one customer accounted for more than 10.0% of outstanding accounts receivable balance at December 31, 2020. Although we have long-term relationships with many of our customers, our customers do not have a contractual obligation to purchase our products and we cannot be certain that we will be able to retain our existing major customers. Store closures or re-closures, decreased foot traffic and economic recession resulting from the COVID-19 pandemic has, and will likely continue to, adversely affect our performance and could continue to adversely affect the financial condition of many of our customers. If any major existing customer ceases or decreases its purchases from us, cancels its orders, delays or defaults on its payment obligations to us, reduces the floor space, assortments, fixtures or advertising for our products or changes its manner of doing business with us for any reason, such as due to store closures, decreased foot traffic or recession resulting from the COVID-19 pandemic, such actions may adversely affect our business and financial condition. Furthermore, the retail industry regularly experiences consolidation, contractions and closings, which may result in our loss of customers or our inability to collect accounts receivable of major customers, and we have recently experienced delays in payments from some of our customers and others have gone bankrupt. If we lose a major customer, experience a significant decrease in sales to a major customer or are unable to collect the accounts receivable of a major customer due to any of the foregoing reasons, our business and financial condition could be harmed.
Our Strategies Involve A Number Of Risks That Could Prevent Or Delay The Successful Opening Of New Stores As Well As Negatively Impact The Performance Of Our Existing Stores.
Our ability to successfully open and operate new stores depends on many factors, including among others, our ability to identify suitable store locations, the availability of which is outside of our control; negotiate acceptable lease terms, including desired tenant improvement allowances; source sufficient levels of inventory to meet the needs of new stores; hire, train and retain store personnel; successfully integrate new stores into our existing operations; and satisfy the fashion preferences in new geographic areas.
In addition, some or a substantial number of new stores could be opened in regions of the U.S. in which we currently have few or no stores. Any expansion into new markets may present competitive, merchandising and distribution challenges that are different from those currently encounteredwe encounter in our existing markets. Any of these challenges could adversely affect our business and results of operations. In addition, to the extent that any new store openings are in existing markets we may experiencecould result in reduced sales volumes in existing stores in those markets. If sales decline at our retail stores, whether through competition from online sites or other companies, weWe may decide to close stores that experience sales declines, which could result in additional costs, expenses, asset impairments or asset write-downs.
6
Our Global Retail Business Has Required, And Will Continue To Require, A Substantial Investment And Commitment Of Resources And Is Subject To Numerous Risks And Uncertainties.
Our global retail business has required substantial investments in leasehold improvements, inventory, and personnel. We have also made substantialsignificant operating lease commitments for retail space worldwide. Due to the high fixed-cost structure associated with our global retail business, a decline in sales or the closure or poor performance of individual or multipleclosure of stores could result in significant lease termination costs, write-offs or impairments of leasehold improvements, and employee-related termination costs. The success of our global retail operations also depends on our ability to identify and adapt to changes in consumer spending patterns and retail shopping preferences globally, including the shift from brick and mortar to direct-to-consumer and mobile channels, and our ability to effectively develop our direct-to-consumerdigital and mobile channels. Our failure to successfully respond to these factors could adversely affect our retail business, as well as damage our brand and reputation, and could materially and adversely affect our business, financial condition, results of operations, financial position and cash flows.
Many Of Our Retail Stores Depend Heavily On The Customer Traffic Generated By Shopping And Factory Outlet Malls Or By Tourism.
Many of ourWe have concept stores are located in shopping malls and some of our factory outlet stores are located in manufacturers’ outlet malls where wemalls. We depend on obtaining prominent locations and the overall success of the malls to generate customer traffic. We cannot control theThe overall success of individualthe malls and an increase incan be negatively impacted by factors outside of our control, such as store closures by other retailers may lead to mall vacancies and reduced foot traffic.retailers. Some of our concept stores occupy street locations that are heavily dependent on customer traffic generated by tourism. Tourism can be adversely affected by external factors such as an economic slowdown or social or political events. Any substantial decrease in tourism resulting from an economic slowdown, political, socialcustomer traffic generated by malls or military events or otherwise,tourism has, and is likely tomay continue to adversely affecthave, an adverse effect on sales in our existing stores, particularly those with street locations. The effects of these factors could continue to reduce sales of particular existing stores or hinder our ability to open retail stores in new markets, which could negativelymaterially and adversely affect our operating results.business, financial condition, results of operations, and cash flows.
We Depend On Key Personnel To Manage Our Business Effectively In A RapidlyChanging Market, And If We Are Unable To Retain Key Personnel, OurBusiness Could Be Harmed.
We depend upon the continued services of key personnel, including Robert Greenberg, Chairman of the Board and Chief Executive Officer; Michael Greenberg, President and a member of our Board of Directors; and David Weinberg, Executive Vice President, Chief Operating Officer and a member of our Board of Directors. We also depend on our ability to identify, attract and retain additional qualified personnel. Competition for employees in our industry is intense, and we may not be successful in attracting and retaining such personnel. The loss of the services of senior management and other key personnel or the failure to attract additional personnel and execute a succession plan could materially and adversely affect our business, financial condition, results of operations, and cash flows.
We Have A Significant Work Force And Are Subject To Risks Related To Human Capital Management.
We employ approximately 17,900 employees worldwide and a significant portion of our operating expenses relate to Inventory, Manufacturingcompensation and Distributionbenefits. Although we spend a significant amount of time and expense on human capital management, we cannot ensure that we will be able to maintain a happy and productive workforce. If we are unable to offer competitive compensation and benefits, appropriate training and development, and a compelling work environment or sustain employee satisfaction, our culture may be adversely affected, our reputation may be damaged, and we may incur costs related to turnover.
RISKS RELATED TO SUPPLY CHAIN
Our Business Could Be Harmed If We Fail To Maintain ProperAppropriate Inventory Levels.
We place orders with our manufacturers for some of our products prior to the time we receive all of our customers’customer orders. We do this to minimize purchasing costs, the time necessary to fill customer orders, and the risk of non-delivery. We also maintain an inventory of certain products that we anticipate will be in greater demand. Any unanticipated declineUnanticipated declines in the popularity of Skechers footwear or other unforeseen circumstances may make it difficult for us and our customers to accurately forecast product demand, trends, and we may be unable to sell the products we have ordered in advance from manufacturers or that we have in our inventory. Inventory levels in excess ofexceeding customer demand may result in inventory write-downs and the sale of excess inventory at discounted prices, which could significantly impair our brand image and have a material adverse effect on our operating results, financial condition and cash flows. Conversely, if we underestimate consumer demand for our products or if our manufacturers fail to supply the quality products that we require at the timewhen we need them, we may experience inventory shortages. Inventory shortages might delay shipments to customers, negatively impact retailer and distributor relationships, and diminish brand loyalty.
7
Our International Sales And Manufacturing Operations Are Subject To The Risks Of Doing Business Abroad, Particularly In China and Vietnam, Which Could Affect Our Ability To SellManufacture Or ManufactureSell Our Products, In International Markets, Obtain Products From Foreign Suppliers Or Control The Costs Of Our Products.
Substantially all of our sales during the year ended December 31, 2020,2023 were derived from sales of footwear manufactured in foreign countries, with most manufactured in China and Vietnam. We also sell our footwear in several foreign countries and plan to increase our international sales efforts as part of our growth strategy. Foreign manufacturing and sales are subject to a number of risks, including the following: political and social unrest, including terrorism; changing economic conditions, including higher labor costs; increased costs of raw materials; currency exchange rate fluctuations; labor shortages and work stoppages, including those due to the outbreak of a disease leading to an epidemic or pandemic spread; electrical shortages; transportation delays; loss or damage to products in transit; expropriation; nationalization; the adjustment, elimination or imposition of domestic and international duties, tariffs, quotas, import and export controls and other non-tariff barriers; exposure to different legal standards (particularly with respect to intellectual property); compliance with foreign laws; changes in domestic and foreign governmental policies; and there may bethe potential for circumstances in the future where we may have to incur premium freight charges to expedite the delivery of product to our customers. If we incur a significant amount of premium charges to airfreight product for our customers, our gross profit will be negatively affected if we are unable to collect those charges. Apart from the aforementioned impacts of the COVID-19 pandemic, including supply chain constraints, we have not, to date, been materially affected by any such risks, but we cannot predict the likelihood of such developments occurring or the resulting long-term adverse impact on our business, financial condition, results of operations, financial condition and cash flows.
In particular, because most of our products are manufactured in China and Vietnam, the possibility of adverse changes in trade or political relations with China or Vietnam, political instability in China or Vietnam, increases in labor costs, the occurrence of prolonged adverse weather conditions or a natural disaster such as an earthquake or typhoon in China or Vietnam, or the outbreak of a pandemic disease in China or Vietnam could severely interfere with the manufacturing and/or shipment of our products and would have a material adverse effect on our operations. Our business operations may be adversely affected by the current and future political environment in the Communist Party of China (“PRC”).China. The government of the PRCChina has exercised and continues to exercise substantial control over virtually every sector of the Chinese economy through regulation and state ownership. Our ability to operate under the PRCChina may be adversely affected by changes in Chinese laws and regulations, including those relating to taxation, import and export tariffs, raw materials, environmental regulations, land use rights, property and other matters. Under its current leadership, the government of the PRCChina has been pursuing economic reform policies that encourage private economic activity and greater economic decentralization. There is no assurance, however, that the government of the PRCChina will continue to pursue these policies, or that it will not significantly alter these policies from time to time without notice. A change in policies by the PRC government of China could adversely affect our interests by, among other factors: changes in laws, regulations or the interpretation thereof, confiscatory taxation, restrictions on currency conversion, imports or sources of supplies, or the expropriation or nationalization of private enterprises.
We Rely On Independent Contract Manufacturers And, As A Result, Are Exposed To Potential Disruptions In Product Supply.
Our footwear products are currently manufactured by independent contract manufacturers. During the year ended December 31, 2020,2023, the top five manufacturers of our products produced approximately 42.1%45.7% of our total purchases. One manufacturer accounted for 21.0%21.4% of total purchases for the year ended December 31, 2020.2023.
We compete with other footwear companies for production facilities, and we do not have long-term contracts with any of our contract manufacturers. Under our current arrangements with them, these manufacturers generally may unilaterally terminate their relationship with us at any time. If our current manufacturers cease doing business with us, we could experience an interruption in the manufacture of our products. Although we believe that we could find alternative manufacturers, we may be unable to establish relationships with alternative manufacturers that will be as favorable as the relationships we have now. For example, new manufacturers may have higher prices, less favorable payment terms, lower manufacturing capacity, lower quality standards or higher lead times for delivery. If we are unable to provide products consistent with our standards or the manufacture of our footwear is delayed or becomes more expensive, our business, and financial condition, would be harmed.
While not a material issue as of the filing date of this report, the COVID-19 pandemic previously led to the Chinese and Vietnamese governments imposing temporary closures of some of our factories in China and restrictions on others in Vietnam that caused delays in shipment of our products. We may encounter similar challenges yet again with these manufacturers, or new difficulties could arise with our manufacturers or any raw material suppliers on which our manufacturers rely, including prolonged manufacturing or transportation disruptions due to public health conditions, such as the recent COVID-19 pandemic, reductions in the availability of production capacity due to government imposed restrictions, failure to meet our quality control standards, failure to meet production deadlines or increased manufacturing costs. This could result in our customers canceling orders, refusing to accept deliveries or demanding reductions in purchase prices, any of which could have a negative impact on our cash flow and harm our business and results of operations.operations, and cash flows could be materially and adversely affected.
Our Ability To Deliver Our Products To The Market Could Be Disrupted If We Encounter Problems Affecting Our Logistics And Distribution Systems.
We rely on owned or independently operated distribution facilities to transport, warehouse and ship products to our customers. Our logistics and distribution systems include computer-controlled and automated equipment, which may be subject to a number of risks related to security or computer viruses, the proper operation of software and hardware, power interruptions or other system failures. Substantially all of our products are distributed from a few key locations. Therefore, our operations could be interrupted by travel restrictions, earthquakes, floods, fires or other natural disasters near our distribution centers. Our business interruption insurance may not adequately protect us from the potential adverse effects that could be caused byof significant disruptions affectingto our distribution facilities,system, such as the long-term loss of customers or an erosion of brand image. In addition, our distribution capacity is dependent on the timely performance of services by third parties, including the transportation of product to and from our distribution facilities. If we encounter problems affecting our distribution system, our ability to meet customer expectations, manage inventory, complete sales, and achieve operating efficiencies could be materially adversely affected.
8
RISKS RELATED TO ECONOMIC AND POLITICAL CONDITIONS, AND OTHER EXTERNAL FACTORS
Risks Related to Economic and External Factors
The Uncertainty Of Global Market Conditions May Continue To Have A Negative Impact On Our Business, Results Of Operations Or Financial Condition.Conditions.
WhileThe uncertain state of global economic and political conditions, have recently improved slightly, their uncertain state, including the impact of inflation and challenging consumer retail market, in the U.S., may negatively impact our business, which depends on the general economic environment and levels of consumers’ discretionary spending that affect not only the ultimate consumer, but also retailers, who are our primary direct customers.spending. If the current economic situation does not improve or if it weakens, we may not be able to maintain or increase our sales to existing customers, make sales to new customers, open and operate new retail stores, maintain sales levels at our existing stores, maintain or increase our international operations on a profitable basis, or maintain or improve our earnings from operations as a percentage of sales. Additionally, if there is an unexpected decline in sales, our results of operations will depend on our ability to implement a corresponding and timely reduction in our costs and manage other aspects of our operations. These challenges include (i) managing our infrastructure, (ii) hiring and maintaining, as required, the appropriate number of qualified employees, (iii) managing inventory levels and (iv) controlling other expenses.
The impact of wars, acts of war and other conflicts around the world may result in subsequent economic sanctions imposed by the U.S., NATO and other countries. Conflicts may impact global economic conditions or our ability to sell products to customers in the affected regions. Conflicts could also have broader implications on economics outside the directly impacted regions, such as the global inflationary impact of a potential boycott of Russian oil and gas by other countries. Furthermore, any unfavorable developments in global political, social and regulatory conditions, including geopolitical conflicts, political unrest, civil strife, terrorist activity, acts of war, public corruption, expropriation, nationalism and other economic or political uncertainties in the U.S. or internationally, could also impact our business. Any negative sentiment toward the U.S. as a result of any such developments could also adversely affect our business and reputation. If the uncertain global market conditions continue for a significant period of time or worsen, our business, financial condition, results of operations, financial condition, and cash flows could be materially and adversely affected.
Our Business Could Be Adversely Affected By Changes In The Business Or Financial Condition Of SignificantOur Customers Due To Global Economic Conditions.
TheA global financial crisis affectedcould affect the banking system and financial markets and resultedresult in a tightening in the credit markets, more stringent lending standards and terms, higher inflation, and higher volatility in fixed income, credit, currency and equity markets. In addition, our business could be adversely affected by other economic conditions, such as the insolvency of certain of our key distributors, which could impair our distribution channels, or the diminished liquidity or an inability to obtain credit to finance purchases of our product by our significant customers. Our customers may also experience weak demand for our products or other difficulties in their businesses. If economic, financial or political conditions in global markets deteriorate in the future, demand may be lower than forecasted and insufficient to achieve our anticipated financial results. Any of these events would likely harmmaterially and adversely affect our business, financial condition, results of operations, and cash flows.
Our Sales Are Influenced By Economic Conditions And Uncertainty That Impact Consumer Spending And Consumer Confidence.
Consumer confidence and spending on discretionary items generally declines during periods of economic uncertainty or recession. Our wholesale customers anticipate and respond to adverse changes in economic conditions and uncertainty by reducing inventories and/or increasing promotional activity. Our retail stores are also affected by these conditions and may experience declines in consumer traffic and spending. As a result, factors that diminish consumer confidence and spending, particularly deterioration in general economic conditions, consumer credit availability, consumer debt levels, inflation, the impact of foreign exchange fluctuations on tourism and tourist spending, volatility in investment returns, fear of unemployment, increases in energy costs or taxes or interest rates, housing market downturns, fear about and impact of pandemic illness, and other factors such as acts of war, natural disasters or terrorist or political events that impact consumer confidence, have had, and may continue to have a material adverse effect on our operations and financial condition through their negative impact on our wholesale customers as well as decreased spending in our retail stores and potentially via our e-commerce business.
Natural Disasters, The Effects Of Climate Change, Pandemics, And Other Events Beyond Our Control.
Natural disasters or other catastrophic events may cause damage or disruption to our operations, international commerce, and the global economy, and thus could have a negative effect on us. Our business operations are subject to interruption from earthquakes, hurricanes, tornadoes, floods, fires, extreme weather events, power shortages, pandemics, telecommunications failure, vandalism, cyber-attacks, the effects of climate change, and other events beyond our control. Although we maintain disaster recovery plans, such events could disrupt our operations or those of our customers and suppliers, including through the inability of employees and contract professionals to work, destruction of facilities, loss of life, and adverse effects on supply chains, power, infrastructure and the integrity of information technology ("IT") systems, all of which could materially increase our costs and expenses, delay or decrease revenue from our customers and disrupt our ability to maintain business continuity. We could incur significant costs to improve the climate-related resiliency of our infrastructure and otherwise prepare for, respond to, and mitigate the effects of climate changes. Our insurance may not be sufficient or cover losses or additional expenses that we may sustain. A significant natural disaster or other event that disrupts our operations or those of our customers or suppliers could have a material adverse effect on our business, results of operations, financial condition and cash flows.condition.
Natural Disasters9
Adverse Conditions Or A Decline In Economic ConditionsChanges In California Could Increase Our Operating Expenses Or Adversely Affect Our Sales Revenue.Sales.
As of December 31, 2020, aA substantial portion of our operations are located in California, including 110100 of our retail stores, our headquarters in Manhattan Beach, and our U.S.North America distribution center in Rancho Belago. Because a significant portion of our sales is derived from sales in California, aA decline in the economic conditions, or increase in regulations or the cost of doing business in California whether or not such decline spreads beyond California, could materially adversely affecthave a material adverse impact on our business. Furthermore, a natural disaster or other catastrophic event in California, such as an earthquake or wildfire, affecting California, could significantly disrupt our business including the operation of our only domestic distribution center. We may be more susceptible to these issues than our competitors whose operations are not as concentrated in California.
Risks Related to Currency and Debt
Foreign Currency Exchange Rate Fluctuations Could Have A Material Adverse Effect On Our Business And Results Of Operations.Fluctuations.
Foreign currency fluctuations affect our revenuesales and profitability. Changes in currency exchange rates may impact our financial results positively or negatively in one period and not another, which may make it difficult to compare our operating results from different periods. Currency exchange rate fluctuations may also adversely impact third parties that manufacture our products by making their costs of raw materials or other production costs more expensive and more difficult to finance, thereby raising prices for us, our distributors and/or our licensees. We do not currently engage in hedging activities with respect to these currency exchange rate risks. For a more detailed discussion of the risks related to foreign currency fluctuation, see Item 7A: “Quantitative and Qualitative Disclosures About Market Risk.”
In addition, our foreign subsidiaries purchase products in U.S. dollars, in which causes the cost of those products willto vary depending on the foreign currency exchange rates and will impactimpacts the price charged to customers. Our foreign distributors also purchase products in U.S. dollars and sell in local currencies, which impacts the price to foreign consumers. As the U.S. dollar strengthens relative to foreign currencies, our revenuessales and profits are reduced when translated into U.S. dollars and our margins may be negatively impacted by the increase in product costs due to foreign currency exchange rates. Although we typically work to mitigate the impact of exchange rate fluctuations through price increases and further actions to reduce costs, we may not be able to fully offset the impact, if at all. Our success depends, in part, on our ability to manage or mitigate these foreign currency impacts, as changes in the value of the U.S. dollar relative to other currencies could have a material adverse effect onmaterially and adversely affect our business, financial condition, results of operations, financial position and cash flows.
We Have Debt And Interest Payment Requirements At Levels That May Restrict Our Future Operations.
As of December 31, 2020RISKS RELATED TO ENVIRONMENT, SOCIAL, AND GOVERNANCE, we had $735.0 million of debt
Our Environmental, Social And Governance Commitments and $250.0 million of additional borrowings available underDisclosures May Expose Us To Reputational Risks And Legal Liability.
Our brand and reputation are associated with our unsecured revolving credit facility. In March 2020, as a precautionary measurepublic commitments to maximize liquidityvarious corporate ESG initiatives, including our goals relating to sustainability and diversity and inclusion. Our disclosures on these matters and any failure or perceived failure to increase available cash on hand, we drew downachieve or accurately report on our unsecured revolving credit facility. Our debt requirescommitments, could harm our reputation and adversely affect our client relationships or our recruitment and retention efforts, as well as expose us to dedicate cash flowpotential legal liability. Increasing focus on ESG matters has resulted in, and is expected to continue to result in, the adoption of legal and regulatory requirements designed to mitigate the effects of climate change on the environmental, as well as legal and regulatory requirements requiring climate-related disclosures. If new laws or regulations are more stringent than current legal or regulatory requirements, we may experience increased compliance burdens and costs to meet such obligations. Our selection of voluntary disclosure frameworks and standards, and the interpretation or application of those frameworks and standards, may change from time to time or may not meet the expectations of investors or other stakeholders. Our processes and controls for reporting ESG matters across our operations and supply chain are evolving along with multiple disparate standards for identifying, measuring, and reporting ESG metrics, including ESG-related disclosures that may be required by the SEC, European and other regulators, and such standards may change over time, which could result in significant revisions to the payment of interest and principal due under our debt. This dedicated use of cash could impact ourcurrent goals, reported progress in achieving such goals, or ability to successfully compete by, for example:
• increasing our vulnerability to general adverse economic and industry conditions;
• limiting our flexibilityachieve such goals in planning for or reacting to changes in our business and the general retail environment; and
• limiting our ability to obtain additional financing required to fund working capital and capital expenditures and for other general corporate purposes.
Risks Related to Legal and Regulatory Mattersfuture.
RISKS RELATED TO LEGAL AND REGULATORY MATTERS
Changes In Tax Laws Or The Potential Imposition Of Additional Duties, Quotas, Tariffs And Other Trade Restrictions Could Have An Adverse Impact On Our Sales And Profitability.Restrictions.
All of ourOur products manufactured overseas and imported into the U.S., the European Union and other countries are subject to customs duties collected by customs authorities. Customs information submitted by us is routinely subject to review by customs authorities.duties. We are unable to predict whether there may be unfavorable changes in tax laws in the U.S. or overseas, additional customs duties, quotas, tariffs, anti-dumping duties, safeguard measures, cargo restrictions to prevent terrorism or other trade restrictions imposed on the importation of our products in the future. Such actions could adversely affect our ability to produce and market footwear at competitive prices and might have an adverse impact on theour sales and profitabilityresults of Skechers.operations.
ChangesIn addition, changes in the tax laws of foreign jurisdictions could arise as a result of the base erosion and profit shifting project that was undertaken by the Organization for Economic Cooperation and Development (“OECD”). The OECD, which represents a coalition of member countries, recommended changes to Trade Policy,long-standing tax principles related to transfer pricing and has developed model rules including New Tariffs Imposed By The U.S. Government, Could Have A Material Adverse Effect On Our Results Of Operations.
establishing a global minimum corporate income tax tested on a jurisdictional basis (the “Pillar Two”). Many jurisdictions have adopted or announced an intention to adopt Pillar Two for tax years beginning in 2024. There can be no assurance that our effective tax rate, tax payments or conditional reduced tax rates will not be adversely affected as countries independently amend their tax laws to adopt Pillar Two. Changes in social, political, regulatoryU.S. or foreign tax laws, including new or modified guidance with respect to existing tax laws, could materially and economic conditions oradversely affect our business, financial condition, results of operations, and cash flows.
10
Changes To U.S. Or Other Countries’ Trade Policies And Import/Export Regulations Or Our Failure To Comply With Such Regulations.
Changes in laws and policies governing foreign trade, manufacturing, development and investment in the territories or countries from whichwhere we importcurrently sell our products or conduct our business as well as any negative sentiment toward the U.S. as a result of such changes, could adversely affect our business. The U.S. government has placedpresidential administrations have instituted or proposed additionalchanges in trade policies that include the negotiation or termination of trade agreements, the imposition of higher tariffs on certain goods imported from China and may enact new tariffsimports into the U.S., economic sanctions on additional goods imported from China, including footwearindividuals, corporations or countries, and other products that we import. China had imposed tariffs on a wide range of American products in retaliation and responded to the new proposed tariff by, among other things, adjusting the value of its currency. China andgovernment regulations affecting trade between the U.S. and other countries where we conduct our business. It may be time-consuming and expensive for us to alter our business operations in order to adapt to or comply with any such changes.
In addition, changes or proposed changes in U.S. or other countries' trade policies may result in restrictions and economic disincentives on international trade. Tariffs and other changes in U.S. trade policy have made progressin the past and could in the future trigger retaliatory actions by affected countries, and certain foreign governments have instituted or are in discussions to finalize a trade agreement, however there is no guarantee thatconsidering imposing retaliatory measures on certain U.S. goods. Further, any agreement between the countries will be reached. China could impose additional tariffsemerging protectionist or take other actions if the countries are unable to come to an agreement. The majority of our products that we sellnationalist trends either in the U.S. are manufacturedor in China.other countries could affect the trade environment. The U.S. government has also negotiatedCompany, similar to many other multinational corporations, does a replacementsignificant amount of business that would be impacted by changes to the trade deal for NAFTA with Mexico and Canada, the U.S.-Mexico-Canada Agreement (the “USMCA”), which still needs to be ratified. There is also a concern that the impositionpolicies of additional tariffs by the U.S. could result inand foreign countries (including governmental action related to tariffs, international trade agreements, or economic sanctions). Such changes have the adoption of additional tariffs by other countries as well. Ifpotential to adversely impact the U.S. government does not reach a trade agreement with Chinaeconomy or replaces NAFTA with USMCA,certain sectors thereof or if additional tariffs or trade restrictions are implemented by the U.S. or other countrieseconomy of another country in connection with a global trade war, the resulting escalation of trade tensions could have a significant, adverse effect on world tradewhich we conduct operations, our industry and the world economy. While it is too early to predict whether or how the recent policy changes will impactglobal demand for our products, and as a result, our business, the imposition of tariffs on footwear, apparel or other items imported by us from China could require us to increase prices to our customers or, if unable to do so, result in lowering our gross margin on products sold. Tariffs on footwear imported from China could have a material adverse effect on our business andfinancial condition, results of operations.operations, and cash flows could be materially and adversely affected.
Our Business Could Be Harmed If Our Contract Manufacturers, Suppliers Or Licensees Violate Labor, Trade Or Other Laws.
We require our independent contract manufacturers, suppliers and licensees to operate in compliance with applicable laws and regulations. Manufacturers are required to certify that neither convicted, forced or indentured labor (as defined under U.S. law) nor child labor (as defined by law in the manufacturer’s country) is used in the production process, that compensation is paid in accordance with local law and that their factories are in compliance with local safety regulations. Although we promote ethical business practices and our sourcing personnel periodically visit and monitor the operations of our independent contract manufacturers, suppliers and licensees, we do not control them or their labor practices. If one of our independent contract manufacturers, suppliers or licensees violates labor or other laws or diverges from those labor practices generally accepted as ethical in the U.S., it could result in adverse publicity for us, damage our reputation in the U.S., or render our conduct of business in a particular foreign country undesirable or impractical, any of which could harm our business.
In addition, if we, or our foreign manufacturers, violate U.S. or foreign trade laws or regulations, we may be subject to extra duties, significant monetary penalties, the seizure and the forfeiture of the products we are attempting to import, or the loss of our import privileges. Possible violations of U.S. or foreign laws or regulations could include inadequate record-keeping of our imported products, misstatements or errors as to the origin, quota category, classification, marketing or valuation of our imported products, fraudulent visas, or labor violations. The effects of these factors could render our conduct of business in a particular country undesirable or impractical, and have a negative impact on our operating results.business, financial condition, results of operations, and cash flows could be materially and adversely affected.
The Disruption, Expense And Potential Liability Associated With Existing And Unanticipated Future Litigation Against Us Could Have A Material Adverse EffectUs.On Our Business, Results Of Operations, Financial Condition And Cash Flows.
In addition to the legal matters included in our reserve for loss contingencies, we occasionally become involved in litigation arising from the normal course of business,and investigations, and we are unable to determine the extent of any liability that may arise from any such unanticipated future litigation.matters. We have no reason to believe that there is a reasonable possibility or a probability that we may incur a material loss, or a material loss in excess of a recorded accrual, with respect to any other such loss contingencies. However, the
outcome of litigation and investigation is inherently uncertain and assessments and decisions on defense and settlement can change significantly in a short period of time. Therefore, although we consider the likelihood of such an outcome to be remote with respect to those matters for which we have not reserved an amount for loss contingencies, if one or more of these legal matters were resolved against us in the same reporting period for amounts in excess of our expectations, our consolidated financial statements of a particular reporting period could be materially adversely affected. Further, any unanticipated litigation or investigation in the future, regardless of its merits, could also significantly divert management’s attention from our operations and result in substantial legal fees being incurred. Such disruptions, legal fees and any losses resulting from these unanticipated future claimsmatters could have a material adverse effect onmaterially and adversely affect our business, or financial condition.condition, results of operations, and cash flows.
Risks Related to Management and Employees11
We Depend On Key Personnel To Manage Our Business Effectively In A Rapidly Changing Market, And If We Are Unable To Retain Existing Personnel, Our
Business Could Be Harmed.
Our future success depends upon the continued services of Robert Greenberg, Chairman of the Board and Chief Executive Officer; Michael Greenberg, President and a member of our Board of Directors; and David Weinberg, Executive Vice President, Chief Operating Officer and a member of our Board of Directors. The loss of the services of any of these individuals or any other key employee could harm us. Our future success also depends on our ability to identify, attract and retain additional qualified personnel. Competition for employees in our industry is intense, and we may not be successful in attracting and retaining such personnel.
We Have A Significant Work Force And Are Subject To Risks Related To Human Capital Management.
As of December 31, 2020, we employee over 11,500 employees worldwide. A significant portion of our operating expenses relate to compensation and benefits, and we spend significant time and effort managing these employees. We cannot ensure that we will be able to maintain a happy and productive workforce. Some of our employees may take actions that harm our business or we may face other issues with our employees, such as retention. Although we spend a significant amount of time and expense on human capital management, we cannot ensure that these efforts will be successful.
Risks Related to Intellectual Property and Information Technology
Our Ability To Compete Could Be Jeopardized If We Are Unable To Protect Our Intellectual Property Rights Or If We Are Sued For Intellectual Property Infringement.
We believe that our trademarks, design patents and other proprietary rights are important to our success and our competitive position. We use trademarks on nearly all of our products and believe that having distinctive marks that are readily identifiable is an important factor in creating a market for our goods, in identifying us and in distinguishing our goods from the goods of others. We consider our  ®,
®,  ®,
®,  ®,
®,  ®,
®,  ®, Skechers®, Skechers Slip-ins®, Skechers Hands Free Slip-ins®, Skechers Performance™, Skechers GOrun®, Skechers GOwalk®,Skechers GOgolf®, Skechers
 GOtrainViper Court Pro™, Ultra GO®, Skechers on-the-GO®, 
®, 
®, 
®, 
,Skechers Cali®, Skecher Street®, Skechers Street™, Skechers USA®, Skechers Active™, Skechers Sport Active™, Skechers Work™, Skechers Outdoor™, Max Cushioning™Cushioning®, Massage Fit®, Mark Nason®, Skechers Modern Comfort®, D’Lites®, DLT-ABOBS®,BOBS®, Energy LightsBOBS Sport™, Our Planet Matters®, Glide Step™Step®, Skech-Air®, Skechers Kids™, Twinkle Toes®, Z-StrapS Lights®, Mega-Flex®, Luminators®, Heart Lights™, Relaxed Fit®, Arch Fit™, Ultra GO®, Hyper Burst®, Skechersand Air-Cooled Memory Foam™, and Air-cooled Memory Foam®trademarks to be among our most valuable assets, and we have registered these trademarks in many countries. In addition, we own many other trademarks that we utilize in marketing our products. We also have a number of design patents and a limited number of utility patents covering components and features used in various shoes. We believe that our patents and trademarks are generally sufficient to permit us to carry on our business as presently conducted. While we vigorously protect our trademarks against infringement, we cannot guarantee that we will be able to secure patents or trademark protection for our intellectual property in the future or that protection will be adequate for future products. Further, we have been suedinvolved with litigation in the past for patent and trademark infringement and cannot be sure that our activities do not and will not infringe on the intellectual property rights of others. If we are compelled to prosecute infringing parties, defend our intellectual property or defend ourselves from intellectual property claims made by others, we may face significant expenses and liability as well as the diversion of management’s attention from our business, each of which could negatively impact our business or financial condition.
In addition, the laws of foreign countries where we source and distribute our products may not protect intellectual property rights to the same extent as do the laws of the U.S. We cannot be assured that the actions we have taken to establish and protect our trademarks and other intellectual property rights outside the U.S. will be adequate to prevent imitation of our products by others or, if necessary, successfully challenge another party’s counterfeit products or products that otherwise infringe on our intellectual property rights on the basis of trademark or patent infringement. Continued sales of counterfeit products could adversely affect our sales and our brand and result in the shift of consumer preference away from our products. We may face significant expenses and liability in connection with the protection of our intellectual property rights outside the U.S., and if we are unable to successfully protect our rights or resolve intellectual property conflicts with others, our business, or financial condition, results of operations, and cash flows could be materially and adversely affected.
RISKS RELATED TO INFORMATION SYSTEMS AND DATA SECUITY
Breaches Or Compromises Of Our Information Security Systems, Information Technology Systems And Our Infrastructure To Support Our Business Could Result In Exposure Of Private Information, Disruption Of Our Business And Damage To Our Reputation Which Could Harm Our Business, Results Of Operation And Financial Condition.
As a routine part of our business, we utilize information security and information technologyIT systems and websites that allow for the secure storage and transmission of proprietary or private information regarding our customers, employees, vendors and others. A security breach of our network, hosted service providers, or vendor systems, may expose us to a risk of loss or misuse of this information, litigation and potential liability. Hackers and data thieves are increasingly sophisticated and operate large-scale and complex automated attacks, and the retail industry, in particular, has been the target of many recent cyber-attacks. Although we take measures to safeguard this sensitive information, we may not have the resources or technical sophistication to anticipate or prevent rapidly evolving types of cyber-attacks targeted at us, our customers, or others who have entrusted us with information. Actual or anticipated attacks may cause us to incur costs, including costs to deploy additional personnel and protection technologies, train employees, and engage third-party experts and consultants.
We invest in industry standard security technology to protect personal information. Advances in computer capabilities, new technological discoveries, or other developments may result in the technology used by us to protect against transaction or other data being breached or compromised. In addition, data and security breaches can also occur as a result of non-technical issues, including breach by us or by persons with whom we have commercial relationships that result in the unauthorized release of personal or confidential information. Although we maintain insurance designed to provide coverage for cyber risks related to what we believe to be adequate and collectible insurance in the event of theft, loss, fraudulent or unlawful use of customer, employee or company data, any compromise or breach of our cyber security systems could result in private information exposure and a violation of applicable privacy and other laws, significant potential liability including legal and financial costs, and loss of confidence in our security measures by customers, which could result in damage to our brand and have an adverse effect on our business, financial condition and reputation. In addition, we must comply with increasingly complex and rigorous regulatory standards enacted to protect business and personal data. Compliance with existing and proposed laws and regulations can be costly, and any failure to comply with these regulatory standards could subject us to legal and reputational risks. Misuse
12
Privacy Breaches And Other Cyber Security Risks Related To Our Business Could Negatively Affect Our Reputation, Credibility And Business.
We are dependent on IT systems and networks for a significant portion of our direct-to-consumer sales, including our e-commerce sites and retail business credit card transaction authorization and processing. We are responsible for storing data relating to our customers and employees and also rely on third-party vendors for the storage, processing and transmission of personal and Company information. Consumers, lawmakers and consumer advocates alike are increasingly concerned over the security of personal information transmitted over the Internet, consumer identity theft and privacy and the retail industry, in particular, has been the target of many recent cyber-attacks. We generally require that third-party service providers implement reasonable security measures to protect our employees’ and customers’ identity and privacy, but we do not control these third-party service providers and cannot guarantee the elimination of electronic or physical computer break-ins or security breaches in the future. Cybersecurity breaches, including physical or electronic break-ins, security breaches due to employee error or misconduct, attacks by “hackers,” phishing scams, malicious software programs such as viruses and malware, and other breaches outside of our control, could result in unauthorized access or damage to our IT systems and the IT systems of our third-party service providers. Despite our efforts and the efforts of our third-party service providers to secure our and their IT systems, attacks on these systems do occur from time to time. As the techniques used to obtain unauthorized access to IT systems become more varied and sophisticated (as cyber criminals are finding new ways to launch their attacks) and if the occurrence of such security breaches becomes more frequent, we and our third-party service providers may be unable to adequately anticipate these techniques and implement appropriate preventative measures. There can be no assurance that our cybersecurity risk management program and processes, including our policies, controls or procedures, will be fully implemented, complied with or effective in protecting our systems and information. While we maintain cyber risk insurance to provide some coverage for certain risks associated with cybersecurity incidents, there is no assurance that such insurance would cover all or a significant portion of the costs or consequences associated with a cybersecurity incident. A significant breach of customer, employee or Company data could damage our reputation, our relationship with customers and our brands, and could result in lost sales, sizable fines, significant breach-notifications and other costs and lawsuits, as well as adversely affect our results of operations.
Additionally, we may incur increased costs and experience a significant strain on our resources to account for implementation of additional required security measures and technologies to protect personal data and confidential information or to comply with current and new state, federal and international laws governing the unauthorized disclosure of confidential information which are continuously being enacted and proposed, such as the General Data Protection Regulation in the EU, various consumer privacy and data privacy and protection acts in the United States, including, but not limited to, the American Data Privacy and Protection Act, the California Consumer Privacy Act and the California Privacy Rights Act, the Virginia Consumer Data Protection Act, the Colorado Privacy Act, the Utah Consumer Privacy Act, the Connecticut Data Privacy Act and the Iowa Consumer Data Protection Act, and the Personal Information Protection Law in China.
Increased scrutiny by federal regulators, such as the Federal Trade Commission, and state attorney generals focused on the retail industry may lead to increased privacy and cybersecurity costs such as organizational changes, deploying additional personnel, acquiring and implementing enhanced privacy and security technologies on e-commerce sites, mandatory employee training for those handling customer and employee personal data, and engaging third-party experts and consultants, and the unauthorized use of proprietary information may materially and adversely affect our business, financial condition, results of operations, and cash flows.
A Material Delay Or Disruption In Our Information Technology Systems Or E-Commerce Websites Or Our Failure Or Inability To Upgrade Our Information Technology Systems Precisely And Efficiently Could Negatively Affect Our Business.
We rely extensively on our IT systems to track inventory, manage our supply chain, record and process transactions, manage customer communications, summarize results and manage our business. The failure of our IT systems to operate properly or effectively, problems with transitioning to upgraded or replacement systems, or difficulty in or failure to secure personal informationimplement new systems, could adversely affect our business. We also resultoperate a number of e-commerce websites throughout the world. Our IT systems and e-commerce websites may be subject to damage and/or interruption from power outages, computer, network and telecommunications failures, malicious software, such as viruses and malware, attacks by “hackers”, security breaches, usage errors or misconduct by our employees and bad acts by our customers and website visitors which could materially adversely affect our business.
We are undergoing a multi-year Enterprise Resource Planning (“ERP”) implementation. The implementation of the ERP will require a significant investment in violationhuman and financial resources. Implementing new systems also carries substantial risk, including failure to operate as designed, failure to properly integrate with other systems, potential loss of data privacy lawsor information, cost overruns, implementation delays and regulations, proceedings against us by governmental entitiesdisruption of operations. Third-party vendors are also relied upon to design, program, maintain and service our ERP implementation program. Any failures of these vendors to properly deliver their services could similarly have a material adverse effect on our business. In addition, any disruptions or others, damagemalfunctions affecting our ERP implementation plan could cause critical information upon which we rely to be delayed, defective, corrupted, inadequate, inaccessible or lost or otherwise cause delays or disruptions to our reputationoperations, and credibility and couldwe may have a negative impact on revenues and profits.to make significant investments to fix or replace impacted systems.
13
RISKS RELATED TO OUR STOCK AND STOCK PRICE
Risks Related to Our Stock and Stock Price
Our Quarterly RevenuesSales And Operating Results Fluctuate As A Result Of A Variety Of Factors, Including Seasonal Fluctuations In Demand For Footwear, Delivery Date Delays And Potential Fluctuations In Our Estimated Annualized Tax Rate, Which May Result In Volatility Of Our Stock Price.
Our quarterly revenuessales and operating results have varied significantly in the past and can be expected to fluctuate in the future due to a number of factors, many of which are beyond our control. Our major customers have no obligation to purchase forecasted amounts may and have canceledfrom time to time cancel orders, in the past, and may change delivery schedules, or change the mix of products ordered with minimal notice and without penalty. As a result, we may not be able to accurately predict our quarterly sales. In addition, sales of footwear products have historically been somewhat seasonal in nature, with the strongest domestic sales generally occurring inFurthermore, our second and third quarters for the back-to-school selling season. Domestic back-to-school sales typically ship in June, July and August, and delays in the timing, cancellation, or rescheduling of these customer orders and shipments by our wholesale customers could negatively impact our sales and results of operations for our second or third quarters. More specifically, the timing of when product ships is determined by the delivery schedules set by our wholesale customers, which could cause sales to shift between our second and third quarters. Because our expense levelsexpenses are partially based on our expectations of future sales, our expenses may be disproportionately large relative to our revenues, and we may be unable to adjust spending in a timely manner to compensate for any unexpected revenue shifts,sales shifts. As a result, our expenses may be disproportionately large relative to our sales, which could have a material adverse effect on our operating results.
Our annualized tax rate is based on projections of our domestic and international operating results for the year, which we review and revise as necessary at the end of each quarter, and it is highly sensitive to fluctuations in projected international earnings.quarter. Any quarterly fluctuations in our annualized tax rate that may occur could have a material impact on our quarterly operating results. As a result of these specific and other general factors, our operating results will likely vary from quarter to quarter, and the results for any particularone quarter may not be necessarily indicative of results for the full year. Any shortfall in revenuessales or net earnings from levels expected by securities analysts and investors could cause a decrease in the trading price of our Class A Common Stock.
One Principal Stockholder Is Able To Control Substantially Control All Matters Requiring Approval By Our Stockholders And Another Stockholder Is Able To Exert Significant Influence Over All Matters Requiring A Vote Of Our Stockholders, And TheirHis Interests May Differ From The Interests Of Our Other Stockholders.
As of December 31, 2020, our2023, Chairman of the Board and Chief Executive Officer, Robert Greenberg, beneficially owned 86.5%89.0% of our outstanding Class B Common Stock, and members of Mr. Greenberg’s immediate family beneficially owned an additional
7.9% of our outstanding Class B Common Stock, and Gil Schwartzberg, trustee of several trusts formed by Mr. Greenberg and his wife for estate planning purposes, beneficially owned 29.8% 10.2% of our outstanding Class B Common Stock. The holders of Class A Common Stock and Class B Common Stock have identical rights except that holders of Class A Common Stock are entitled to one vote per share while holders of Class B Common Stock are entitled to ten votes per share on all matters submitted to a vote of our stockholders. As a result, as of December 31, 2020, 2023, Mr. Greenberg beneficially owned 37.6%53.3% of the aggregate number of votes eligible to be cast by our stockholders, and together with shares beneficially owned by other members of his immediate family, Mr. Greenberg and his immediate family beneficially owned 43.4% of the aggregate number of votes eligible to be cast by our stockholders, and Mr. Schwartzberg beneficially owned 18.0%59.9% of the aggregate number of votes eligible to be cast by our stockholders. Therefore, Messrs.Mr. Greenberg and Schwartzberg are eachis able to exert significant influencecontrol over all matters requiring approval by our stockholders. Matters that require the approval of our stockholders include the election of directors and the approval of mergers or other business combination transactions. Mr. Greenberg also has significant influence over our management and operations. As a result of such influence, certain transactions are not likely without the approval of Messrs.Mr. Greenberg, and Schwartzberg, including proxy contests, tender offers, open market purchase programs or other transactions that can give our stockholders the opportunity to realize a premium over the then-prevailing market prices for their shares of our Class A Common Stock. Because Messrs.Mr. Greenberg’s and Schwartzberg’s interests may differ from the interests of the other stockholders, theirhis ability to substantially control, or significantly influence, respectively, actions requiring stockholder approval, may result in theour Company taking action that is not in the interests of all stockholders. The differential in the voting rights may also adversely affect the value of our Class A Common Stock to the extent that investors or any potential future purchaser view the superior voting rights of our Class B Common Stock to have superior value.
Our Charter Documents And Delaware Law May Inhibit A Takeover, Which May Adversely Affect The Value Of Our Stock.
Provisions of Delaware law, our certificate of incorporation or our bylaws could make it more difficult for a third party to acquire us, even if closing such a transaction would be beneficial to our stockholders. Mr. Greenberg’s substantial beneficial ownership position, together with the authorization of Preferred Stock, the disparate voting rights between our Class A Common Stock and Class B Common Stock, the classification of our Board of Directors and the lack of cumulative voting in our certificate of incorporation and bylaws, may have the effect of delaying, deferring or preventing a change in control, may discourage bids for our Class A Common Stock at a premium over the market price of the Class A Common Stock and may adversely affect the market price of our Class A Common Stock.
Item 1B. Unresolved Staff Comments
None.
Item 1C. Cybersecurity
CYBERSECURITY RISK MANAGEMENT AND STRATEGY
We recognize the critical importance of maintaining the safety and security of our systems and data and have a holistic process for overseeing and managing cybersecurity and related risks. This process is supported by both management and our Board of Directors.
We have developed and implemented a Cybersecurity Risk Management Program intended to protect the confidentiality, integrity, and availability of our critical systems and information. Our cybersecurity risk management program includes a cybersecurity incident response plan.
14 |
|
None.We leverage industry standard frameworks such as the National Institute of Standards and Technology Cybersecurity Framework (“NIST CSF”) and Center for Internet Security (“CIS”) to inform how we identify, assess, and manage cybersecurity risks relevant to our business.
Our Cybersecurity Risk Management Program includes:
|
|
We have not identified risks from known cybersecurity threats, including as a result of any prior cybersecurity incidents, that have materially affected or are reasonably likely to materially affect us, including our operations, business strategy, results of operations, or financial condition.
Cybersecurity Governance
Our corporate headquartersBoard of Directors is responsible for overseeing our enterprise risk management activities in general, and each of our Board committees assists the Board in the role of risk oversight. Our Senior Vice President (“SVP”) of Information Technology and the Senior Director of Information Security have overall responsibility for assessing and managing our material risks from cybersecurity threats. To help ensure effective oversight, the Audit Committee receives reports on information security and cybersecurity at least annually, and receives an update quarterly on information security and cybersecurity from materials provided by the Senior Director of Information Security.
The Senior Director of Information Security oversees the Information Security Steering Committee (“Steering Committee”), which provides education on the Company’s cybersecurity programs and controls to key members of the Company. The Steering Committee meets quarterly and is comprised of members from the Executive Leadership Team, including the Chief Financial Officer and Executive Vice President of Business Affairs, as well as the SVP of Information Technology, Senior Director of Information Security, VP of Corporate Communications, SVP of Digital Innovation, and Head of Global Human Resources.
Cybersecurity risk management is led by our SVP of Information Technology, who reports to our Chief Operating Officer, and generally is responsible for management of cybersecurity risk and the protection and defense of our networks and systems. The SVP of Information Technology manages a team of cybersecurity professionals with broad experience, including in cybersecurity threat assessments and detection, mitigation technologies, cybersecurity training, incident response, cyber forensics, insider threats and regulatory compliance.
We continue to invest in cybersecurity and resiliency of our networks and adapt our internal controls and processes, which are designed to help protect our systems and infrastructure, and the information they contain. For more information regarding the risks we face from cybersecurity threats, please see Item 1A Risk Factors.
Item 2. Properties
CORPORATE HEADQUARTERS
Skechers Corporate Headquarters are located at several properties in or near Manhattan Beach,Los Angeles, California, which consist of an aggregate of approximately 204,0000.2 million square feet. We own and lease portions of our corporate headquarters.
We lease most of our international administrative offices and showrooms located in the Americas, Europe and Asia Pacific. The property leases expire on various dates through February 2033. Corporate offices, administrative offices, and showrooms are included within our Wholesale segment.
15
DISTRIBUTION FACILITIES
We believe that strong distribution is critical to our operations. Our distribution facilities include highly automated solutions to support our future growth in our Company. We regularly evaluate our distribution infrastructure and consolidate or expand our capacity as we believe appropriate for our operations. Our distribution facilities are included within our Wholesale segment. Our principal distribution facilities are as follows:
Americas.Our North American distribution centerAmerica Distribution Center occupies approximately 2.82.6 million square feet on its main campus in southern California. The majority of this distribution centerSouthern California, which is leased from a joint venture, HF Logistics-SKX (the “JV”), that we formed with HF Logistics I, LLC (“HF”) in January 2010. An additional 2.4 million square feet of distribution center space is leased from third parties. The main campus leases expire at various dates through August 2036, and the leases for the purpose of buildingremaining space expire at various dates through May 2028. Additionally, our newly opened Canada Distribution Center occupies approximately 0.4 million square feet in British Colombia and operating the facility. The leases provide for terms expiring in November 2031 with a small portionlease is set to expire in early 2026. The JV is consolidated in our financial statements.December 2032.
Europe, Middle East and Africa.Our European distribution centerDistribution Center occupies approximately 1.82.2 million square feet in Liege, Belgium under operating leases. TheseBelgium. The leases comprising this Distribution Center provide for original terms of 108 to 15 years, commencing between January 2016years. The property leases expire on various dates through April 2031.
Asia Pacific. Our China Distribution Center occupies approximately 1.6 million square feet in Taicang, China. We plan to further expand in this key market with the constructing of a second distribution center in China, which is expected to be an approximately 2.3 million square foot facility. Our Japan Distribution Center is approximately 0.9 million square feet. The lease is set to expire in October 2031. Additionally, we recently opened the first phase of our India Distribution Center which occupies approximately 0.8 million square feet outside of Mumbai and June 2016, subject to automatic extensions for recurring periods of five years unless we or the landlord terminates the lease is set to expire in writing 12 months priorOctober 2043.
We have additional Company-operated distribution centers as well as third-party distribution centers serving regional markets in the Americas, Europe and Asia Pacific.
COMPANY OWNED AND THIRD-PARTY STORES
In 2023, we surpassed 5,000 Skechers-branded retail store and now have 5,168 stores in 122 countries. The network of stores includes 1,648 Company-owned and 3,520 third-party locations. These third-party stores are distributor, licensed and franchise owned through our Wholesale segment.
Store count, openings and closings for our domestic, international, and third-party stores are as follows:
|
| Number of locations |
| |||||||||||||
|
| December 31, 2022 |
|
| Opened(1) |
|
| Closed(1) |
|
| December 31, 2023 |
| ||||
Domestic stores |
|
| 539 |
|
|
| 35 |
|
|
| (11 | ) |
|
| 563 |
|
International stores |
|
| 905 |
|
|
| 268 |
|
|
| (88 | ) |
|
| 1,085 |
|
Distributor, licensee and franchise stores |
|
| 3,093 |
|
|
| 841 |
|
|
| (414 | ) |
|
| 3,520 |
|
Total Skechers stores |
|
| 4,537 |
|
|
| 1,144 |
|
|
| (513 | ) |
|
| 5,168 |
|
(1) Includes the conversion of 58 third-party stores to the expirationInternational stores previously included in Distributor stores as a result of the original lease term or 12 months prior to the end of the then applicable five-year extension.
Allacquisition of our domesticScandinavian distributor.
We pursue our direct-to-consumer strategy through our integrated retail formats, which enable us to promote the full Skechers product offering in an attractive environment that appeals to a broad group of consumers. Our retail stores are included in our Direct-to-Consumer segment. Our physical retail formats are as follows:
Concept Stores. Our concept stores serve as a showcase for a wide range of our product offering. Retail locations are generally chosen to generate maximum marketing value for the Skechers brand name through signage, store front presentation and showroomsinterior design. These stores also serve as product testing venues.
Factory Outlet Stores. Our factory outlet stores provide opportunities for us to sell discontinued and excess merchandise as well as feature key inline product.
Big Box Stores. Our free-standing and attached big box stores, enable us to liquidate excess merchandise, discontinued lines and odd-size inventory.
Substantially all of our retail stores are leased with terms expiring through January 2033.March 2038. The leases provide for rent escalations tied to either increases in the lessor’s operating expenses, fluctuations in the consumer price index in the relevant geographical area, or a percentage of the store’s gross sales in excess of the base annual rent.
16
Item 3. Legal Proceedings
We lease mostMichael Conte v. Robert Greenberg, et al. – On July 21, 2022, Skechers and certain past and present members of the Board of Directors were sued by a stockholder on behalf of our international administrative offices, retail stores, showroomscompany in a derivative action in the Chancery Court of the State of Delaware, Case No. 2022-0633, alleging breach of fiduciary duty, waste of corporate assets, breach of duty of candor and distribution facilities locatedbreach of contract in Asia, Central America, Europe, North Americaconnection with certain executive officers’ personal use of two company-owned aircraft. The complaint seeks actual damages in favor of Skechers sustained as the alleged result of defendants’ alleged breaches of fiduciary duties, judgment directing our company to take all necessary actions to reform and South America.improve its corporate governance practices, termination of certain executive officers for allegedly violating their employment agreements, judgment directing the sale of one of the company-owned aircraft and attorneys’, accountants’ and experts’ fees, costs and expenses. The property leases expire at various dates through October 2033.
|
|
Converse,Nike, Inc., v. Skechers U.S.A.,USA, Inc. – On October 14, 2014, ConverseNovember 6, 2023, Nike filed an action against the Companyour company in the United States District Court for the EasternCentral District of New York, Brooklyn Division,California, Case 1:14-cv-05977-DLI-MDG,No. 2:23-CV-09346, alleging trademark infringement, false designationthat certain Skechers shoe designs infringe the claims of origin, unfair competition, trademark dilution and deceptive practices arising out of our alleged use of certain design elements on footwear. The complaintsix Nike utility patents that purportedly cover Nike’s Flyknit technologies. Nike seeks among other things, injunctive relief, profits, actual damages enhanced damages, punitive damages, costs(including treble damages), pre-judgment and attorneys’ fees.post-judgment interest, and costs. On October 14, 2014, Converse also filed a complaint naming 27 respondents including the Company with the U.S. International Trade Commission (the “ITC” or “Commission”), Federal Register Doc. 2014‑24890, alleging violations of federal law in the importation into and the sale within the United States of certain footwear. Converse has requested that the Commission issue a general exclusion order, or in the alternative a limited exclusion order, and cease and desist orders. On December 8, 2014, the District Court stayed the proceedings before it. On December 19, 2014, Skechers responded to the ITCJanuary 12, 2024, we answered Nike’s complaint, denying the material allegations, and asserting affirmative defenses. A trial before an administrative law judgefiled counterclaims seeking declarations of invalidity of the ITC was held in August 2015. On November 15, 2015, the ITC judge issued his Initial Determination finding that certain discontinued products (Daddy’$ Moneyasserted patents, and HyDee HyTops) infringed on Converse’s intellectual property, but that other, still active product lines (Twinkle Toes and Bobs Utopia) did not. On February 3, 2016, the ITC decided that it would review in part certain matters that were decided by the ITC judge. On June 28, 2016, the full ITC issued its Final Determination affirming that Skechers Twinkle Toes and Bobs Utopia shoes do not infringe Converse’s Chuck Taylor Midsole Trademark and affirming that Converse’s common law trademark was invalid. The full ITC also invalidated Converse’s registered trademark. Converse appealed this decision to the United States Court of Appeals for the Federal Circuit. On January 27, 2017, Converse filed its appellate brief but did not contest the portion of the decision that held that Skechers Twinkle Toes and Bobs Utopia shoes do not infringe. On June 26, 2017 we filed our responsive brief, on February 8, 2018 the court heard oral argument, and on June 7, 2018 the court requested supplemental briefing on certain issues. On October 30, 2018, the United States Court of Appeals for the Federal Circuit vacated portions of the ITC’s ruling and remanded the matter back to the ITC for further proceedings. Although Converse did not appeal the Commission’s non-infringement findings for Skechers Twinkle Toes and Bobs Utopia shoes to the Federal Circuit, Converse asked the Commission to reconsider its previous non-infringement findings on remand. On October 9, 2019, the ITC judge issued his Remand Initial Determination (the “RID”) finding that Converse did not have any rights in the subject intellectual property as to Skechers, and that Skechers Twinkle Toes, Bobs Utopia, and Hydee Hytop did not infringe Converse’s intellectual property but the discontinued Daddy’$ Money would infringe, but only if Converse had rights in the subject intellectual property as to Skechers (which the ITC judge found that Converse did not). On October 22, 2019, the parties filed petitions seeking review of the RID. Converse did not, however, seek review of the finding in the RID that Skechers Twinkle Toes and Bobs Utopia do not infringe. On February 7, 2020, the full Commission decided to review the RID and outlined the issues it wanted briefed. The parties subsequently filed briefs on those issues and, on September 9, 2020, the full Commission issued its decision. In that decision, the Commission found that, although Converse had demonstrated enforceable rights in its Chuck Taylor Midsole Trademark, it had not proven that the Skechers Twinkle Toes, Bobs Utopia or Hydee Hytops infringe those rights, or otherwise established a violation of the applicable federal statutes by Skechers. The time for Nike to appeal the Commission’s decision to the United States Court of Appeal for the Federal Circuit has expired and the ITC matter in now concluded. The federal court action that Nike filed in New York, which was stayed pending the outcome of the ITC proceedings, remains pending.non-infringement. While it is too early to predict the outcome of these legal proceedings or whether an adverse result in either or both of them would have a material adverse impact on our operations or financial position, we believe we have meritorious defenses and intend to defend these legal matters vigorously.
Nike, Inc. v. Skechers USA, Inc. – On January 4, 2016, Nike filed an action against the Company in the United States District Court for the District of Oregon, Case No. 3:16-cv-0007, alleging that certain Skechers shoe designs (Men’s Burst, Women’s Burst, Women’s Flex Appeal, Men’s Flex Advantage, Girls’ Skech Appeal, and Boys’ Flex Advantage) infringe the claims of eight design patents. Nike seeks injunctive relief, disgorgement of Skechers’ profits, damages (including treble damages), pre-judgment and post-judgment interest, attorneys’ fees, and costs. In April and May 2016, we filed petitions with the United States Patent and Trademark Office’s Patent Trial and Appeal Board (the “PTAB”) for inter partes review of all eight design patents, seeking to invalidate those patents. In September and November 2016, the PTAB denied each of our petitions. On January 6, 2017, we filed several additional petitions for inter partes review with the PTAB, seeking to invalidate seven of the eight designs patents that Nike is asserting. In July 2017, we were notified that the PTAB granted our petitions and instituted inter partes review proceedings with respect to two of the seven design patents but denied our petitions as to the others. In June 2017, we filed a motion to transfer venue from the District of Oregon to the Central District of California based on a recent United States Supreme Court decision and the motion was granted on November 17, 2017. On June 28, 2018, the PTAB issued final decisions in the two inter partes review proceedings, rejecting the invalidity challenges made by the Company in those proceedings. On June 4, 2018, the court, over Nike’s opposition, granted our request for a claim construction hearing. On March 28, 2019, the court issued an order declining to issue a claim construction at this stage of the proceedings, but it did not foreclose the issue, instead observing that it might be appropriate to address claim construction at a later stage. The parties have now completed discovery and have filed summary judgement motions. Nike has also withdrawn its claim for treble or enhanced damages. The summary judgment motions were heard on February 18, 2020, and on October 27, 2020, the Court issued its ruling. The court granted Skechers’ motion for summary judgment of non-infringement as to three of the eight design patents at issue. The court, however, concluded that whether Skechers had infringed any of the five remaining design patents presented issues for a jury to resolve. The court also denied Nike’s motion for summary judgment of validity as to the five remaining design patents, holding that Skechers’ invalidity challenges had to be resolved by the jury. While it is too early to predict the outcome
of the case or whether an adverse result would have a material adverse impact on our operations or financial position, we believe we have meritorious defenses and intend to defend this legal matter vigorously.
Nike, Inc. v. Skechers USA, Inc. – On September 30, 2019, Nike filed an action against our company in the United States District Court for the Central District of California, Case No. 2:19-cv-08418, alleging that certain Skechers’ shoe designs (Skech-Air Atlas, Skech-Air 92, Skech-Air Stratus and Skech-Air Blast) infringe the claims of twelve design patents. Nike seeks injunctive relief, disgorgement of Skechers’ profits, damages (including treble damages), pre-judgment and post-judgment interest, attorneys’ fees, and costs. Skechers has filed its answer and the case is in the early stages. While it is too early to predict the outcome of the case or whether an adverse result would have a material adverse impact on our operations or financial position, we believe we have meritorious defenses and intend to defend this legal matter vigorously.
Nike, Inc. v. Skechers USA, Inc. – On October 28, 2019, Nike filed an action against the Company in the United States District Court for the Central District of California, Case No. 2:19-cv-09230, alleging that certain Skechers’ shoe designs (Skech-Air Jumpin’ Dots and Skech-Air Mega) infringe the claims of two utility patents. Nike seeks injunctive relief, disgorgement of Skechers’ profits, damages (including treble damages), pre-judgment and post-judgment interest, attorneys’ fees, and costs. Skechers has answered the complaint and the case is in the early stages. While it is too early to predict the outcome of the case or whether an adverse result would have a material adverse impact on our operations or financial position, we believe we have meritorious defenses and intend to defend this legal matter vigorously.
Ealeen Wilk v. Skechers U.S.A., Inc. – On September 10, 2018, Ealeen Wilk filed a putative class action lawsuit against the Company in the United States District Court for the Central District of California, Case No. 5:18-cv-01921, alleging violations of the California Labor Code, including unpaid overtime, unpaid wages due upon termination and unfair business practices. The complaint seeks actual, compensatory, special and general damages; penalties and liquidated damages; restitutionary and injunctive relief; attorneys’ fees and costs; and interest as permitted by law. On July 5, 2019, the court granted, in part, plaintiff’s motion for conditional certification of a Fair Labor Standards Act (FLSA) collective action. On July 22, 2019, the parties submitted to the court an agreed upon notice to be sent to members of the collective. The parties are delaying the mailing of the Belaire-West privacy opt out notice until after mediation. The parties have agreed to an informal stay of discovery and have stipulated to continue all relevant discovery and motion deadlines accordingly. The parties reached a settlement in principle as a result of a January 27, 2020 mediation but the details of the settlement still need to be worked out and the settlement has to be documented. In the event the settlement is not concluded successfully, it is too early to predict the outcome of the litigation or a reasonable range of potential losses and whether an adverse result would have a material adverse impact on our results of operations or financial position, we believe that we have meritorious defenses, vehemently deny the allegations, and intend to defend the case vigorously.
In addition to the matters included in our reserve for loss contingencies, we occasionally become involved in litigation arising from the normal course of business,and investigations, and we are unable to determine the extent of any liability that may arise from any such unanticipated future litigation.matters. We have no reason to believe that there is a reasonable possibility or a probability that we may incur a material loss, or a material loss in excess of a recorded accrual, with respect to any other such loss contingencies. However, the outcome of litigation and investigations is inherently uncertain and assessments and decisions on defense and settlement can change significantly in a short period of time. Therefore, although we consider the likelihood of such an outcome to be remote with respect to those matters for which we have not reserved an amount for loss contingencies, if one or more of these legal matters were resolved against the Company in the same reporting period for amounts in excess of our expectations, our consolidated financial statements of a particular reporting period could be materially adversely affected.
Item4. Mine Safety Disclosures
|
|
Not applicable.
17
PART II
Item5. Market for Registrant’s Common Equity, Related Stockholder Matters and Issuer Purchases of Equity Securities
|
|
Our Class A Common Stock trades under the symbol “SKX” on the New York Stock Exchange.
HOLDERS
As of February 15, 2021,21, 2024, there were 8672 holders of record of our Class A Common Stock (including holders who are nominees for an undetermined number of beneficial owners) and 2733 holders of record of our Class B Common Stock. These figures do not include beneficial owners who hold shares in nominee name. The Class B Common Stock is not publicly traded, but each share is convertible upon request of the holder into one share of Class A Common Stock.
ISSUERDIVIDEND INFORMATION
Since inception, we have not declared or paid cash dividends on our common stock, and we have no present intention of paying dividends on our common stock in the foreseeable future.
COMPANY PURCHASES OF EQUITY SECURITIES
NoOn January 31, 2022, the Company's Board of Directors authorized a share repurchase program (the “Share Repurchase Program”), pursuant to which the Company may, from time to time, purchase shares of its Class A Common Stock, par value $0.001 per share, for an aggregate repurchase price not to exceed $500 million. The Share Repurchase Program expires on January 31, 2025 and does not obligate the Company to acquire any particular amount of shares.
The table below summarizes the number of shares of our Class A Common Stock that were repurchased during the three months ended December 31, 2020. Our $150.0 million share repurchase program expired on February 6, 2021.2023.
Month Ended |
| Total Number of Shares Purchased |
|
| Average Price Paid Per Share |
|
| Total Number of Shares Purchased under the Share Repurchase Program |
|
| Maximum Dollar Value of Shares that May Yet Be Purchased under the Program |
| ||||
October 31, 2023 |
|
| — |
|
| $ | — |
|
|
| — |
|
| $ | 325,714 |
|
November 30, 2023 |
|
| 900,300 |
|
|
| 51.11 |
|
|
| 900,300 |
|
|
| 279,696 |
|
December 31, 2023 |
|
| 235,894 |
|
|
| 59.37 |
|
|
| 235,894 |
|
|
| 265,692 |
|
Total |
|
| 1,136,194 |
|
| $ | 52.83 |
|
|
| 1,136,194 |
|
| $ | 265,692 |
|
EQUITY COMPENSATION PLAN INFORMATION
Our equity compensation plan information required by this item is provided as set forthhereby incorporated by reference to the information in Part III, Item 12 of this annual report on Form 10-K.
18
PERFORMANCE GRAPH
The following graph demonstrates the total return to stockholders of our Class A Common Stock from December 31, 20152018 to December 31, 2020,2023, relative to the performance of the Russell 2000 Index, which includes our Class A Common Stock, and the peer group index, which is believed to include companies engaged in businesses similar to ours. The peer group index consists of six companies: Nike, Inc., adidas AG, Steven Madden, Ltd., Wolverine World Wide, Inc., Crocs, Inc., and Deckers Outdoor Corporation.
The graph assumes an investment of $100 on December 31, 2015 in each of our Class A Common Stock, the Russell 20001000 Index and the customized peer group index. EachS&P Retail Select Industry Index.
Comparison of the indices assumes that all dividends were reinvested. The stock performance5 Year Cumulative Total Returns

(in dollars) |
| 2018 |
|
| 2019 |
|
| 2020 |
|
| 2021 |
|
| 2022 |
|
| 2023 |
| ||||||
Skechers U.S.A., Inc. |
|
| 100.00 |
|
|
| 188.69 |
|
|
| 157.01 |
|
|
| 189.60 |
|
|
| 183.27 |
|
|
| 272.35 |
|
Russell 1000 |
|
| 100.00 |
|
|
| 131.43 |
|
|
| 158.98 |
|
|
| 201.03 |
|
|
| 162.58 |
|
|
| 205.72 |
|
S&P Retail Select Industry |
|
| 100.00 |
|
|
| 113.97 |
|
|
| 161.41 |
|
|
| 230.77 |
|
|
| 157.58 |
|
|
| 191.51 |
|
Item 6. [Reserved]
19
Item 7. Management’s Discussion and Analysis of our Class A Common Stock shown on the graph is not necessarily indicativeFinancial Condition and Results of future performance. We will neither make nor endorse any predictions as to our future stock performance.Operations
COMPARISON OF 5 YEAR CUMULATIVE TOTAL RETURNS
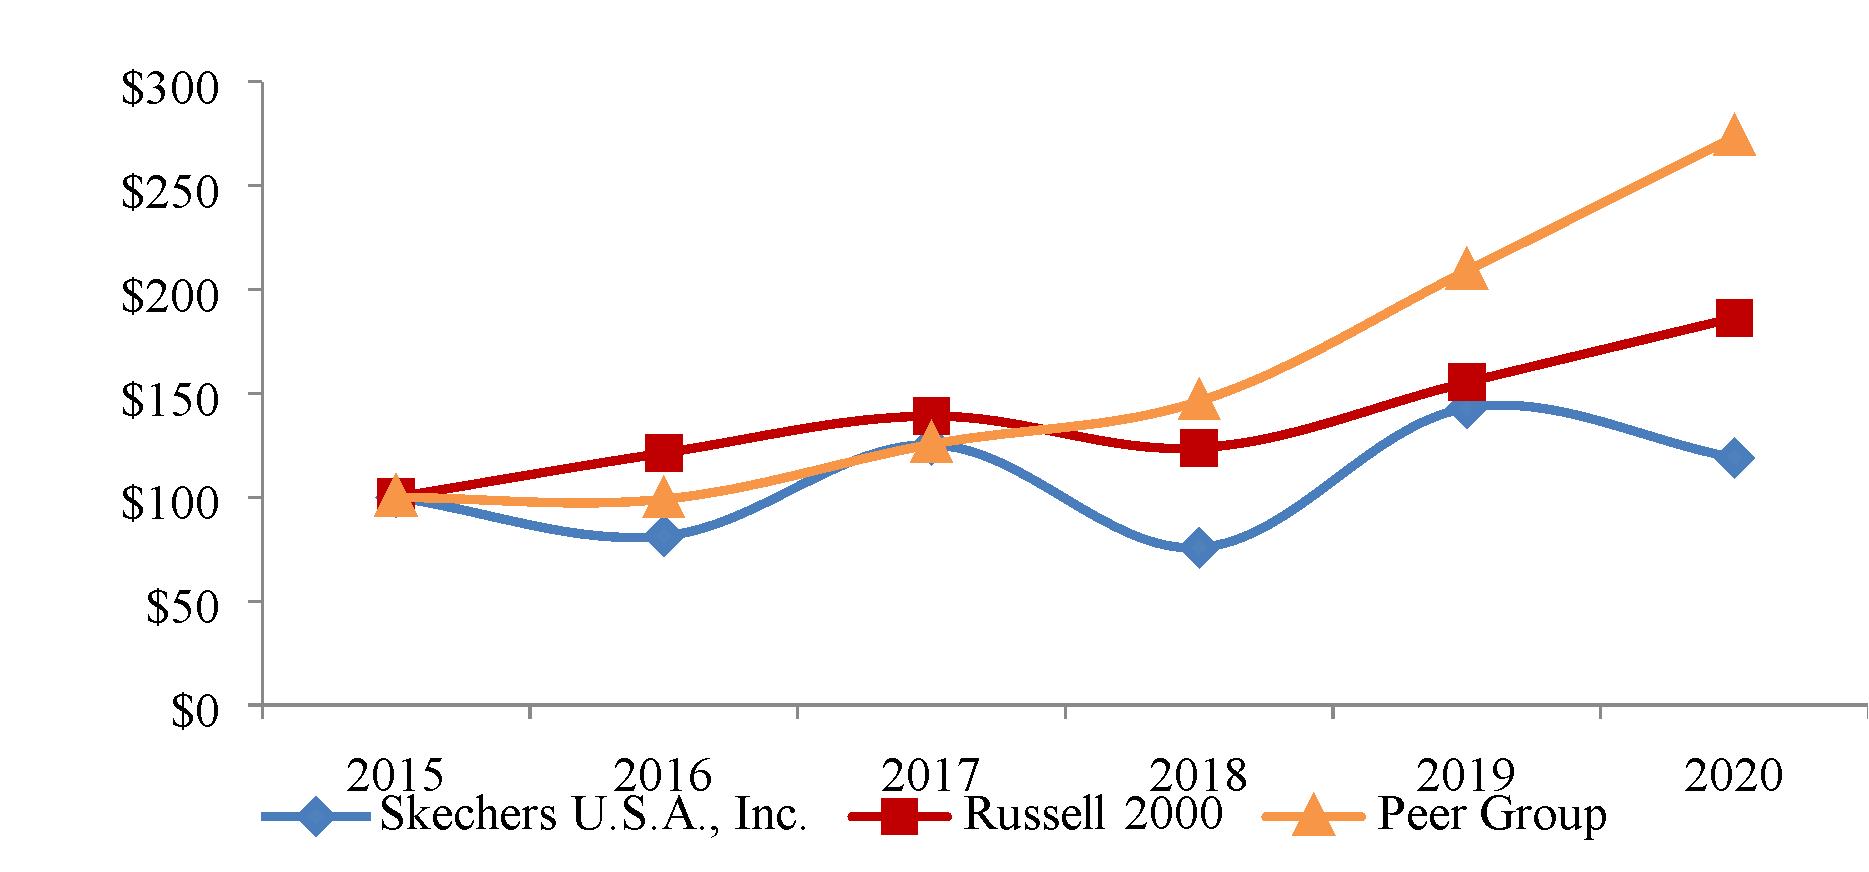
(in dollars) |
| 2015 |
|
| 2016 |
|
| 2017 |
|
| 2018 |
|
| 2019 |
|
| 2020 |
| ||||||
Skechers U.S.A., Inc. |
|
| 100.00 |
|
|
| 81.36 |
|
|
| 125.26 |
|
|
| 75.77 |
|
|
| 142.97 |
|
|
| 118.97 |
|
Russell 2000 |
|
| 100.00 |
|
|
| 121.31 |
|
|
| 139.08 |
|
|
| 123.76 |
|
|
| 155.35 |
|
|
| 186.36 |
|
Peer Group |
|
| 100.00 |
|
|
| 99.06 |
|
|
| 125.55 |
|
|
| 146.21 |
|
|
| 209.01 |
|
|
| 273.39 |
|
|
|
The following tables set forth the Company’s selected consolidated financial data as of and for each of the years in the five-year period ended December 31, 2020 and should be read in conjunction with our audited consolidated financial statements and notes thereto included under Part II, Item 8 of this annual report.
|
| For the Year Ended December 31, |
| |||||||||||||||||
(in thousands, except per share data) |
| 2020 |
|
| 2019 |
|
| 2018 |
|
| 2017 |
|
| 2016 |
| |||||
Sales (1) |
| $ | 4,597,414 |
|
| $ | 5,220,051 |
|
| $ | 4,642,068 |
|
| $ | 4,164,160 |
|
| $ | 3,563,311 |
|
Gross profit |
|
| 2,189,781 |
|
|
| 2,491,157 |
|
|
| 2,223,605 |
|
|
| 1,938,889 |
|
|
| 1,634,596 |
|
Earnings from operations |
|
| 133,684 |
|
|
| 518,443 |
|
|
| 437,765 |
|
|
| 382,880 |
|
|
| 370,518 |
|
Earnings before income taxes |
|
| 154,729 |
|
|
| 516,005 |
|
|
| 431,884 |
|
|
| 384,260 |
|
|
| 359,484 |
|
Net earnings attributable to Skechers U.S.A., Inc. |
|
| 98,564 |
|
|
| 346,560 |
|
|
| 301,041 |
|
|
| 179,190 |
|
|
| 243,493 |
|
Net earnings per share: |
|
|
|
|
|
|
|
|
|
|
|
|
|
|
|
|
|
|
|
|
Basic |
| $ | 0.64 |
|
| $ | 2.26 |
|
| $ | 1.93 |
|
| $ | 1.15 |
|
| $ | 1.58 |
|
Diluted |
| $ | 0.64 |
|
| $ | 2.25 |
|
| $ | 1.92 |
|
| $ | 1.14 |
|
| $ | 1.57 |
|
Weighted-average shares: |
|
|
|
|
|
|
|
|
|
|
|
|
|
|
|
|
|
|
|
|
Basic |
|
| 154,184 |
|
|
| 153,392 |
|
|
| 155,815 |
|
|
| 155,651 |
|
|
| 154,169 |
|
Diluted |
|
| 154,894 |
|
|
| 154,151 |
|
|
| 156,450 |
|
|
| 156,523 |
|
|
| 155,084 |
|
|
|
|
| As of December 31, |
| |||||||||||||||||
(in thousands) |
| 2020 |
|
| 2019 |
|
| 2018 |
|
| 2017 |
|
| 2016 |
| |||||
Working capital |
| $ | 2,131,645 |
|
| $ | 1,581,360 |
|
| $ | 1,621,918 |
|
| $ | 1,507,676 |
|
| $ | 1,206,036 |
|
Total assets |
|
| 5,812,369 |
|
|
| 4,892,943 |
|
|
| 3,228,255 |
|
|
| 2,735,082 |
|
|
| 2,393,670 |
|
Long-term borrowings, excluding current installments |
|
| 679,415 |
|
|
| 49,183 |
|
|
| 88,119 |
|
|
| 71,103 |
|
|
| 67,159 |
|
Skechers U.S.A., Inc. equity |
|
| 2,481,435 |
|
|
| 2,314,665 |
|
|
| 2,034,958 |
|
|
| 1,829,064 |
|
|
| 1,603,633 |
|
|
|
The following discussion and analysis of our financial condition and results of operations should be read in conjunction with our consolidated financial statements and related notes included elsewhere in this annual report on Form 10-K. We intend for this discussion to provide the reader with information that will assist in understanding our consolidated financial statements, the changes in certain key items in those financial statements from period to period, and the primary factors that accounted for those changes, as well as how certain accounting principles affect our consolidated financial statements. The discussion also provides information about the financial results of the various segments of our business to provide a better understanding of how those segments and their results affect the financial condition and results of operations of our company as a whole.
This section of this Form 10-K generally discusses 20202023 and 20192022 items and year-to-year comparisons between 20202023 and 2019.2022. Discussions of 20182021 items and year-to-year comparisons that are not included in this Form 10-K can be found in “Part II—Item 7. Management’s Discussion and Analysis of Financial Condition and Results of Operations—Results of Operations” and “—Liquidity and Capital Resources” in our annual report on Form 10-K for the fiscal year ended December 31, 20192022 filed with the SEC on February 28, 2020.2023.
OVERVIEW
The COVID-19 pandemicWhen Skechers was founded in 1992, our focus was on creating a lifestyle brand centered on delivering products with comfort, style, innovation and quality at a reasonable price. Thirty years later, now with a diverse product assortment that includes award-winning Performance Division, we can meet most of the footwear needs of men, women and kids, we remain committed to our design principles. Our objective is to profitably grow our operations worldwide by delivering stylish, comfortable, innovative and high-quality products at a reasonable price. Through the efforts of our dedicated teams globally, our strong partner relationships and loyal consumers, we believe we will continue to achieve well-managed growth and ensure the longevity of both the company and the Skechers brand.
For the year ended December 31, 2023, compared to the year ended December 31, 2022, sales increased 7.5% to $8.0 billion, a new annual record, and four consecutive quarterly sales records. Gross margins improved to 51.9% and inventory was reduced by 16.1%. Our financial results reflect the significant market demand for our product offerings and the value that we provide.
Key highlights for 2023 include:
We believe brand recognition is paramount to continued success. We drive awareness and demand through comprehensive marketing campaigns. During the year, we introduced partnerships and a capsule collection with Martha Stewart and Snoop Dogg. Skechers Performance signed Harry Kane, Europe’s top goal scorer for 2023, as well as other premier players for the launch of Skechers Football, and New York Knicks all-star Julius Randle and Los Angeles Clippers Terance Mann, who both compete in Skechers Basketball.
Our core product philosophy of comfort, style, innovation, and quality at the right price continues to impact various marketsresonate with consumers, and business channels. After we temporarily closed our stores around the world and temporarily furloughed a meaningful portion of our hourly workforce in March 2020, we saw meaningful improvements during the second half of 2020 including a return to growth in many markets. Although the recovery has progressed at a different pace across countries, we remain confident in our actions and strength of the brand. Consumers have gravitated towards comfort in their lives as people are predominately working from home and increasingly focused on their well-being.delivering our comfort technology footwear as quickly as possible to meet consumer demand. We believeare committed to the actions we have takenfollowing investments to execute our long-term global growth strategy:
We continuedistribution infrastructure to invest for growth, with a focus onsupport growth;
20
|
|
|
|
|
|
|
|
|
|
RESULTS OF OPERATIONS
We have three reportable segments – Domestic Wholesale, International Wholesale, and Direct-to-Consumer, which includes results from both our retail store and e-commerce channels. We evaluate segment performance based primarily on sales and gross margin.
The following table sets forth, for the periods indicated, selectedSelected information from our results of operations:operations follows:
| Year Ended December 31, |
|
| Change |
| |||||||||||
(in thousands) |
| 2023 |
|
| 2022 |
|
| $ | % |
| ||||||
Sales |
| $ | 8,000,342 |
|
| $ | 7,444,550 |
|
|
| 555,792 |
|
|
| 7.5 |
|
Cost of sales |
|
| 3,847,938 |
|
|
| 3,929,193 |
|
|
| (81,255 | ) |
|
| (2.1 | ) |
Gross profit |
|
| 4,152,404 |
|
|
| 3,515,357 |
|
|
| 637,047 |
|
|
| 18.1 |
|
Gross margin |
|
| 51.9 |
| % |
| 47.2 |
| % |
|
|
| 470 bps |
| ||
Operating expenses |
|
|
|
|
|
|
|
|
|
|
|
| ||||
Selling |
|
| 676,890 |
|
|
| 583,626 |
|
|
| 93,264 |
|
|
| 16.0 |
|
General and administrative |
|
| 2,690,728 |
|
|
| 2,385,061 |
|
|
| 305,667 |
|
|
| 12.8 |
|
Total operating expenses |
|
| 3,367,618 |
|
|
| 2,968,687 |
|
|
| 398,931 |
|
|
| 13.4 |
|
As a % of sales |
|
| 42.1 |
| % |
| 39.9 |
| % |
|
|
| 220 bps |
| ||
Earnings from operations |
|
| 784,786 |
|
|
| 546,670 |
|
|
| 238,116 |
|
|
| 43.6 |
|
Operating margin |
|
| 9.8 |
| % |
| 7.3 |
| % |
|
|
| 250 bps |
| ||
Other income (expense) |
|
| 16,086 |
|
|
| (24,413 | ) |
|
| 40,499 |
|
| n/m |
| |
Earnings before income taxes |
|
| 800,872 |
|
|
| 522,257 |
|
|
| 278,615 |
|
|
| 53.3 |
|
Income tax expense |
|
| 150,949 |
|
|
| 93,095 |
|
|
| 57,854 |
|
|
| 62.1 |
|
Net earnings |
|
| 649,923 |
|
|
| 429,162 |
|
|
| 220,761 |
|
|
| 51.4 |
|
Less: Net earnings attributable to noncontrolling interests |
|
| 104,124 |
|
|
| 56,134 |
|
|
| 47,990 |
|
|
| 85.5 |
|
Net earnings attributable to Skechers U.S.A., Inc. |
| $ | 545,799 |
|
| $ | 373,028 |
|
|
| 172,771 |
|
|
| 46.3 |
|
Sales
|
| Year Ended December 31, |
|
| ||||||||||||||
(in thousands) |
| 2020 |
|
|
| 2019 |
|
| ||||||||||
Sales |
| $ | 4,597,414 |
|
|
|
|
|
|
| $ | 5,220,051 |
|
|
|
|
|
|
Cost of sales |
|
| 2,407,633 |
|
|
|
|
|
|
|
| 2,728,894 |
|
|
|
|
|
|
Gross profit |
|
| 2,189,781 |
|
|
| 47.6 |
| % |
|
| 2,491,157 |
|
|
| 47.7 |
| % |
Royalty income |
|
| 16,017 |
|
|
|
|
|
|
|
| 22,493 |
|
|
|
|
|
|
|
|
| 2,205,798 |
|
|
|
|
|
|
|
| 2,513,650 |
|
|
|
|
|
|
Operating expenses: |
|
|
|
|
|
|
|
|
|
|
|
|
|
|
|
|
|
|
Selling |
|
| 318,097 |
|
|
|
|
|
|
|
| 369,901 |
|
|
|
|
|
|
General and administrative |
|
| 1,754,017 |
|
|
|
|
|
|
|
| 1,625,306 |
|
|
|
|
|
|
|
|
| 2,072,114 |
|
|
|
|
|
|
|
| 1,995,207 |
|
|
|
|
|
|
Earnings from operations |
|
| 133,684 |
|
|
|
|
|
|
|
| 518,443 |
|
|
|
|
|
|
Interest income |
|
| 5,912 |
|
|
|
|
|
|
|
| 11,782 |
|
|
|
|
|
|
Interest expense |
|
| (16,327 | ) |
|
|
|
|
|
|
| (7,509 | ) |
|
|
|
|
|
Other, net |
|
| 31,460 |
|
|
|
|
|
|
|
| (6,711 | ) |
|
|
|
|
|
Earnings before income tax expense |
|
| 154,729 |
|
|
|
|
|
|
|
| 516,005 |
|
|
|
|
|
|
Income tax expense |
|
| 8,502 |
|
|
|
|
|
|
|
| 88,753 |
|
|
|
|
|
|
Net earnings |
|
| 146,227 |
|
|
|
|
|
|
|
| 427,252 |
|
|
|
|
|
|
Less: Net earnings attributable to noncontrolling interests |
|
| 47,663 |
|
|
|
|
|
|
|
| 80,692 |
|
|
|
|
|
|
Net earnings attributable to Skechers U.S.A., Inc. |
| $ | 98,564 |
|
|
|
|
|
|
| $ | 346,560 |
|
|
|
|
|
|
Sales
Sales for 2020 were $4.6 billion, a decrease ofincreased $0.6 billion, or 11.9%7.5%, compared to sales of $5.2$8.0 billion for 2019 reflecting the impact of the global pandemic on our businesses worldwide. The decrease isas a result of a 12.9%13.3% increase internationally and a 0.8% decrease in our domestic businessdomestically. Direct-to-Consumer sales increased 24.3% and an 11.2% decrease internationally. Our Domestic Wholesale segment sales decreased 9.7%, International Wholesale segment sales decreased 8.3% and Direct-to-Consumer segment sales decreased 19.7%2.8%.
Gross profit
Gross profit for 2020 decreased $0.3 billion to $2.2 billion as compared to $2.5 billion for 2019 Sales increased overall due to the declinehigher sales volume in sales. Direct-to-Consumer and higher average selling prices.
Gross margin
Gross margin remained relatively flat with the prior year at 47.6% with increases of 160increased 470 basis points in Domestic Wholesaleto 51.9% primarily due to higher average selling prices and 101a higher proportion of Direct-to-Consumer sales.
Operating expenses
Operating expenses increased $398.9 million, or 13.4%, to $3.4 billion, and as a percentage of sales increased 220 basis points to 42.1%. Selling expenses increased $93.3 million, or 16.0%, to $676.9 million, primarily due to higher demand creation expenditures in Direct-to-Consumer,global marketing and digital advertising. General and administrative expenses increased $305.7 million, or 12.8%, to $2.7 billion, due to an increase in labor costs of $104.6 million, facility related costs of $83.7 million, including rent and depreciation, and warehouse and distribution costs of $16.6 million. These increases were partially offset by a decrease of 71 basis points$33.7 million in International Wholesale.
Selling expenses
Selling expenses decreased by $51.8 million, or 14.0%, to $318.1 million for 2020 from $369.9 million for 2019. As a percentage of sales, selling expenses were 6.9%volume-driven labor and 7.1% for 2020 and 2019, respectively. The decrease in selling expenses was primarily due to lower worldwide spending on advertising and marketing, and trade shows of $48.4 million.
General and administrative expenses
General and administrative expenses increased by $128.7 million, or 7.9%, primarily driven by increased domestic and international warehouse and distribution expenses of $64.3from the supply chain and logistical challenges in the prior year.
Other income (expense)
Other income (expense), improved $40.5 million increased depreciation and amortizationto $16.1 million, compared to other expense of $31.7$24.4 million from fixed asset additions andin the Skechers Mexico acquisition, and increased stock compensation of $24.2 million which included a one-time $18.2 million non-cash, equity compensation charge associated with a legal settlement.
Other income (expense)
Interest income decreased $5.9 million to $5.9 million for 2020 as compared to $11.8 million for 2019. The decrease in interest income was dueprior year, primarily due to lower averagefavorable foreign currency exchange rates in Europe, Middle East & Africa and Asia Pacific, and increased interest rates. Interest expense increased $8.8 million due to additional borrowings under our credit facility. Other income increased $38.2 million primarily due to purchase price adjustments from the acquisition of Skechers Mexico and foreign exchange gains.income.
Income taxes
Income tax expense and the effective tax rate were as follows:
|
| Year Ended December 31, |
|
| Year Ended December 31, |
| ||||||||||
(in thousands) |
| 2020 |
|
| 2019 |
|
| 2023 |
|
| 2022 |
| ||||
Income tax expense |
| $ | 8,502 |
|
| $ | 88,753 |
|
| $ | 150,949 |
|
| $ | 93,095 |
|
Effective tax rate |
|
| 5.5 | % |
|
| 17.2 | % |
|
| 18.8 | % |
|
| 17.8 | % |
Income tax expense was $150.9 million as compared to $93.1 million in 2022. Our provision foreffective tax rate was 18.8% as compared to 17.8% in the prior year. The increase in tax rate is due to the impact of tax reserves and the non-recurrence of favorable deferred tax adjustments in the prior year.
Our income tax expense and effective income tax rate are significantly impacted by the mix of our domestic and foreign earnings (losses) before income taxes. In the foreign jurisdictions in which we have operations, the applicable statutory rates range from 0.0%0% to 34.0%35%, which on average are generally significantly lower than the U.S. federal and state combined statutory rate of approximately 25%25.1%.
21
The decreaseOECD has issued various proposals that would change long-standing global tax principles, namely, its Pillar Two framework, which imposes a global minimum corporate tax rate of 15% for large companies. The European Union (“EU”) member states formally adopted the EU’s Pillar Two Directive, which generally provides for a 15% minimum effective tax rate for multinational enterprises, in every jurisdiction in which they operate. This did not have an impact to the tax provision and effective tax rate for the year ended December 31, 2023 and we do not anticipate that this will have a material impact on our tax provision or effective tax rate in 2020 was primarily due2024. We will continue to changes inevaluate the ownership structurepotential impact of our international operations and related benefits providedthe Pillar Two framework on future periods, pending legislative adoption by the Coronavirus Aid, Relief, and Economic Security (“CARES”) Act.individual countries.
See Note 10 – Income Taxes of the Consolidated Financial Statements for additional information.
Noncontrolling interest in net income and lossearnings of consolidated subsidiaries
Net earnings attributable to noncontrolling interest for 2020 decreased $33.0 million to $47.7 million as compared to $80.7 million for 2019 attributable to decreased profitability by our joint ventures due to the impacts of the COVID-19 pandemic. Noncontrolling interest represents the share of net earnings or loss that is attributable to our joint venture partners. Net earnings attributable to noncontrolling interest increased $48.0 million to $104.1 million as compared to $56.1 million in the prior year, primarily due to higher earnings by our joint ventures, predominantly in China.
RESULTS OF SEGMENT OPERATIONS
Domestic Wholesale
|
| Year Ended December 31, |
| Year Ended December 31, | Change |
|
| ||||||||||||||||||
(in thousands) |
| 2020 |
|
| 2019 |
|
| 2023 |
|
| 2022 |
|
| $ |
|
| % |
|
| ||||||
Sales |
| $ | 1,126,564 |
|
| $ | 1,247,550 |
|
| $ | 4,504,776 |
|
| $ | 4,632,429 |
|
|
| (127,653 | ) |
|
| (2.8 | ) |
|
Gross profit |
|
| 431,603 |
|
|
| 457,944 |
|
|
| 1,846,819 |
|
|
| 1,669,276 |
|
|
| 177,543 |
|
|
| 10.6 |
|
|
Gross margin |
|
| 38.3 | % |
|
| 36.7 | % |
|
| 41.0 | % |
|
| 36.0 | % |
|
|
|
| 500 bps |
|
| ||
Domestic Wholesale sales decreased $0.1 billion,$127.7 million, or 9.7%2.8%, to $1.1$4.5 billion, for 2020 from $1.2 billion for 2019. Sales volumedue to a decrease was driven by a 12.4% reduction in the numberAmericas of pairs sold,10.6%, partially offset by a 1.0%an increase in average price per pair. Sales volume decreased to 50.0 million pairs sold from 57.0 million. The average price per pair increased to $21.88 from $21.67.
Domestic Wholesale gross profit decreased $26.3 million, or 5.8%, to $431.6 million for 2020 compared to $457.9 million for 2019. Domestic Wholesale gross margin increased 160 basis points to 38.3% primarily driven by lower product costsAsia Pacific of 12.6% and the aforementioned increase in average price per pair.
International Wholesale
|
| Year Ended December 31, |
| |||||
(in thousands) |
| 2020 |
|
| 2019 |
| ||
Sales |
| $ | 2,257,846 |
|
| $ | 2,462,632 |
|
Gross profit |
|
| 1,023,183 |
|
|
| 1,133,573 |
|
Gross margin |
|
| 45.3 | % |
|
| 46.0 | % |
International Wholesale sales decreased $0.2 billion, or 8.3%, to $2.3 billion for 2020 compared to salesEurope, Middle East & Africa of $2.5 billion for 2019. Our distributor sales decreased to $239.1 million, a decrease of $176.3 million or 42.4% and direct sales by our foreign subsidiaries and joint ventures, were $2.0 billion, flat to the prior year. The number of units sold decreased 6.7% and the average selling price decreased by 1.8%0.1%.
International Wholesale gross profit decreased $0.1 billion, or 9.7%, to $1.0 billion for 2020 as compared to $1.1 billion for 2019. International Wholesale gross margin decreased 71 basis points to 45.3% as a result of higher promotional activity for our joint ventures as well as a non-cash, cost of goods purchase price adjustment related to the acquisition of Skechers Mexico.
Direct-to-Consumer
|
| Year Ended December 31, |
| |||||
(in thousands) |
| 2020 |
|
| 2019 |
| ||
Sales |
| $ | 1,213,004 |
|
| $ | 1,509,869 |
|
Gross profit |
|
| 734,995 |
|
|
| 899,640 |
|
Gross margin |
|
| 60.6 | % |
|
| 59.6 | % |
Direct-to-Consumer sales decreased $0.3 billion, or 19.7%, to $1.2 billion for 2020 as compared to sales of $1.5 billion for 2019. Declines were driven by lower domestic and international retail sales during temporary store closures and reduced operating hours as a result of the COVID-19 pandemic, partially offset by a 211.9% increase in domestic e-commerce sales. Direct-to-Consumer comparable same store sales decreased 24.0% for 2020, including decreases of 20.3% domestically and 32.2% internationally. Volume decreased due to a 21.5% reduction8.7% in the number of units sold partially offsetand average selling price per unit increased 6.3%.
Wholesale gross margin increased 500 basis points to 41.0% due to higher average selling prices and lower costs per unit.
Direct-to-Consumer
| Year Ended December 31, | Change |
|
| |||||||||||||
(in thousands) | 2023 |
|
| 2022 |
|
| $ |
|
| % |
|
| |||||
Sales |
| $ | 3,495,566 |
|
| $ | 2,812,121 |
|
|
| 683,445 |
|
|
| 24.3 |
|
|
Gross profit |
|
| 2,305,585 |
|
|
| 1,846,081 |
|
|
| 459,504 |
|
|
| 24.9 |
|
|
Gross margin |
|
| 66.0 | % |
|
| 65.6 | % |
|
|
|
| 30 bps |
|
| ||
Direct-to-Consumer sales increased $683.4 million, or 24.3%, to $3.5 billion, led by a 2.3% increaseincreases in the Americas of 21.5%, Asia Pacific of 22.0% and Europe, Middle East & Africa of 49.2%. Volume increased 19.6% in the number of units sold and average selling price.price per unit increased 4.0%.
Direct-to-Consumer gross profit decreased $164.6 million, or 18.3%, to $735.0 million for 2020 as compared to $899.6 million for 2019. Direct-to-Consumer gross margin increased 10130 basis points to 60.6%66.0%, due to a favorablehigher average selling prices and channel mix, of e-commerce sales which have higher overall margins.partially offset by increased costs per unit.
Comparable store sales mentioned above includes stores that have been opened for at least thirteen calendar months as well as sales on our company-owned websites. We did not make any adjustments for the effects of the COVID-19 pandemic and the related impacts of store closures and reduced operating hours. Definitions and calculations of comparable store sales differ among companies in the retail industry, and therefore comparable store sales disclosed by us may not be comparable to the metrics disclosed by other companies.
LIQUIDITY AND CAPITAL RESOURCES
Liquidity outlook
Our liquidity remains ample and we believe we are well-positioned to endure the environment associated with the COVID-19 pandemic. We have taken actionscash and cash equivalents of $1,189.9 million at December 31, 2023. Amounts held outside the U.S. were $954.7 million, or 80.2%, and approximately $424.8 million was available for repatriation to preservethe U.S. as of December 31, 2023 without incurring additional U.S. federal income taxes and applicable non-U.S. income and withholding taxes.
We finance our production activities in part through the use of interest-bearing open purchase arrangements with certain of our contract manufacturers. These facilities currently bear interest at a rate between 0.0% and 0.4% for 30- to 60-day financing, depending on the factory. We believe that the use of these arrangements affords us additional liquidity and manageflexibility. We do not have any long-term contracts with any of our cash flow. As a precautionary measure, in March 2020,manufacturers, however, we borrowed againsthave long-standing relationships with many and believe our unsecured revolving credit facility. relationships to be positive.
At December 31, 2020,2023, we have unused credit capacity of $8.8$746.9 million alongon our revolving credit facility, with an additional $250.0 million available through an accordion feature on the unsecured revolving credit facility. We continue to partner with our vendors, landlords, and lenders to maximize our liquidity and mitigate cash flow risk.feature. We believe that anticipated cash flows from operations, existing cash and investments balances, available borrowings under our revolving credit agreement,facility, and current financing arrangements will be sufficient to provide us with the liquidity necessary to fund our anticipated working capital and capital requirements for the next twelve months.
As of December 31, 2020, we had approximately $1.37 billion in cash and cash equivalents, of which $735.1 million, or 53.6%, was held outside the U.S. Of the $735.1 million held by its non-U.S. subsidiaries, approximately $405.2 million is available for repatriation to the U.S. without incurring U.S. income taxes and applicable non-U.S. income and withholding taxes in excess of the amounts accrued in the Company’s consolidated financial statements as of December 31, 2020.
22
Cash Flows
Our working capital at December 31, 20202023 was $2.1$2.3 billion, an increase of $0.5$0.3 billion from working capital of $1.6$2.0 billion at December 31, 2019.2022. Our cash and cash equivalents at December 31, 20202023 were $1.4 billion,$1,189.9 million, compared to $824.9$615.7 million at December 31, 2019.2022. Our primary sourcessource of operating cash areis collections from customers on wholesale and direct-to-consumer sales.customers. Our primary uses of cash are inventory purchases, selling, general and administrative expenses and capital expenditures.
Operating Activities
Net cash provided by operating activities was $331.5$1,231.2 million for 20202023 and $426.6$238.3 million for 2019. On a comparative year‑to‑year basis, the $95.12022. The $992.8 million decreaseincrease in cash flows from operating activities in 2020 primarily2023 resulted from reduced net earnings of $281.0 million.favorable changes in working capital, primarily inventory, and increased earnings.
Investing Activities
Net cash used in investing activities was $312.5$418.0 million for 20202023 as compared to $344.1$287.5 million for 2019.2022. The $31.6$130.5 million decreaseincrease was primarily due to increased net investment activity of $95.4 million and the 2019 acquisition of Skechers Mexicoour Scandinavian distributor of $100.7$70.4 million, partially offset by an increase indecreased capital expenditures of $73.8 million$35.3 million..
Our capital investments remain focused on supporting our strategic growth priorities, growing our Direct-to-Consumer business, as well as expanding the presence of our brand internationally. Capital expenditures for 2020the year ended December 31, 2023 were approximately $309.9$323.7 million, which consisted of $122.0included $104.3 million to support our worldwide distribution capabilities, $67.9 million was related to the acquisition of a corporate office building and new retail stores in China, and $59.8 million for retail stores and e-commerce investments worldwide, excluding China. Capital expenditures for 2019 were approximately $236.1 million, of which $72.6 million supported our worldwide distribution capabilities, $51.9 million related to retail stores worldwide, and $33.8 million to support our international wholesale operations.We expect our ongoing capital expenditures for 2021 to be approximately $275.0 million to $325.0 million, which is primarily related to the expansion of our worldwideglobal distribution capabilities, continuedinfrastructure, $99.0 million for investments in our retail stores and e-commercedirect-to-consumer technologies, and stores, and$64.3 million of investments in our new corporate offices and transportation. We expect our capital expenditures for 2024 to be approximately $350.0 to $400.0 million, as we continue to invest in California.our strategic priorities, including new stores, added omnichannel capabilities and incremental distribution capacity in key markets. We expect to fund ongoing capital expensesexpenditures through a combination of borrowingsavailable cash and available cash.borrowings.
Financing Activities
Net cash provided byused in financing activities was $533.3$234.7 million during 20202023 compared to $132.0$118.1 million net cash used during 2019.in 2022. The change of $665.3 millionincrease is primarily the result of higher repurchases of common stock of $85.8 million and decreased net long-term borrowingsproceeds from short-term borrowing of $616.6 million, which includes $452.5 million on our unsecured revolving credit facility.$26.2 million.
Capital Resources and Prospective Capital Requirements
Financing ArrangementsShare Repurchase Program
On January 31, 2022, the Company's Board of Directors authorized a share repurchase program (the “Share Repurchase Program”), pursuant to which the Company may, from time to time, purchase shares of its Class A Common Stock, par value $0.001 per share, for an aggregate repurchase price not to exceed $500 million. The Share Repurchase Program expires on January 31, 2025 and does not obligate the Company to acquire any particular amount of shares. As of December 31, 2020,2023, $265.7 million remains available under the Share Repurchase Program.
Financing Arrangements
As of December 31, 2023, outstanding short-term and long-term borrowings were $735.0$301.4 million, of which, $452.5 million relates to our unsecured revolving credit facility, $229.2$242.9 million relates to loans for our domestic and China distribution centers, $48.7$46.2 million relates to our operations in China and the remainder relates to our international operations. Our long-term debt obligations contain both financial and non-financial covenants, including cross-default provisions. We were in compliance with all debt covenants related to our short-term and long-term borrowings as of the date of this annual report. See Note 6 – Financial Commitments of the Consolidated Financial Statements for additional information.
Disclosure about Contractual Obligations and Commercial Commitments
The following table summarizes ourOur material contractual obligations and commercial commitmentscash requirements as of December 31, 2020:2023 which are not reflected as liabilities in the consolidated balance sheets include open purchase commitments with our foreign manufacturers of approximately $1.4 billion.
(in thousands) |
| Total |
|
| Less than One Year |
|
| One to Three Years |
|
| Three to Five Years |
|
| More Than Five Years |
| |||||
Borrowings (1) |
| $ | 737,680 |
|
| $ | 56,638 |
|
| $ | 64,615 |
|
| $ | 616,427 |
|
| $ | — |
|
Operating leases |
|
| 1,437,927 |
|
|
| 254,674 |
|
|
| 429,356 |
|
|
| 353,636 |
|
|
| 400,261 |
|
Purchase obligations (2) |
|
| 1,359,414 |
|
|
| 1,359,414 |
|
|
| — |
|
|
| — |
|
|
| — |
|
Warehouse and equipment and corporate construction (3) |
|
| 583,206 |
|
|
| 239,000 |
|
|
| 344,206 |
|
|
| — |
|
|
| — |
|
Minimum payments related to other arrangements |
|
| 43,180 |
|
|
| 26,065 |
|
|
| 17,115 |
|
|
| — |
|
|
| — |
|
Total (4) |
| $ | 4,161,407 |
|
| $ | 1,935,791 |
|
| $ | 855,292 |
|
| $ | 970,063 |
|
| $ | 400,261 |
|
|
|
|
|
|
|
|
|
OFF-BALANCE SHEET ARRANGEMENTS
We are required to provide standby letters of credit to support certain obligations that arise in the ordinary course of business and may choose to provide letters of credit in place of posting cash collateral. Although the letters of credit are off-balance sheet, the majority of the obligations to which they relate are reflected as liabilities in the consolidated balance sheets. Outstanding letters of credit totaled approximately $38.7 million as of December 31, 2020.
CRITICAL ACCOUNTING POLICIES AND USE OF ESTIMATES
The preparation of our consolidated financial statements requires us to make estimates that affect the reported amounts of assets, liabilities, sales and expenses, and related disclosure of contingent assets and liabilities. We base our estimates and judgments on historical experience and on various other assumptions that are believed to be reasonable under the circumstances. Actual results may differ from these estimates.
23
We believe the following critical accounting estimates are affected by significant judgments used in the preparation of our consolidated financial statements.
Revenue Recognition.Reserves for returns and chargebacks. We derive income primarilyRevenue is recorded net of estimates for returns from the sale of footwearour customers and royalties earned from licensing the Skechers brand. We recognize revenue when control of the promised goodspotential disputed amounts or services is transferred to its customers in an amount that reflects the consideration we expect to be entitled to in exchange for those goods or services. We recognize revenue on wholesale sales upon shipment. We generate direct-to-consumer revenues primarily from the sale of footwear to customers at retail locations or through our websites. For our in-store sales, we recognize revenue at the point of sale. For sales made through our websites, we recognize revenue upon shipment to the customer. Sales and value added taxes collected from direct-to-consumer customers are excluded from reported revenues.
chargebacks. We accrue a liability for product returns at the time of sale based on our historical experience. We also accrue amounts for goods expected to be returned in salable condition.
We earn royalty income from symbolic licensing arrangements based on third-party sales of Skechers-branded product. Upon signing a new licensing agreement, we receive up-front fees, which are generally characterized as prepaid royalties. These fees are initially deferred and recognized as revenue is earned (i.e., as licensed sales are reported to us or on a straight-line basis over the term of the agreement). The first calculated royalty paymentOur chargeback reserve is based on actual salesa collectability percentage based on factors such as historical trends, current economic conditions, and nature of the licensed product or, in some cases, minimum royalty payments. We calculate and accrue estimated royalties based on the agreement terms and correspondence with the licensees regarding actual sales.chargeback receivables.
Allowance for bad debts returns, sales allowances and customer chargebacks. We provide a reserve against our receivables for. Accounts receivable is recorded net of estimated losses that may result from our customers’ inability to pay. To minimize the likelihood of uncollectibility, customers’ credit-worthiness is reviewed and adjusted periodically in accordance with external credit reporting services, financial statements issued by the customer and our experience with the account. We determine the amount of the reserve by analyzing known uncollectible accounts, aged receivables, economic conditions in the customers’ countries or industries, historical losses and our customers’ credit-worthiness. Amounts later determined and specifically identified to be uncollectible are charged or written off against this reserve. Allowances for returns, sales allowances and customer chargebacks are recorded against revenue. Allowances for bad debts are recorded to general and administrative expenses. Retail and direct-to-consumer receivables represent amounts due from credit card companies and are generally collected within a few days of the purchase.
We reserve for potential disputed amounts or chargebacks from our customers. Our chargeback reserve is based on a collectability percentage based on factors such as historical trends, current economic conditions, and nature of the chargeback receivables.
The likelihood of a material loss on an uncollectible account would be mainly dependent on deterioration in the overall economic conditions in a particular country or region. Reserves are fully provided for all probable losses of this nature. For receivables that are not specifically identified as high risk, we provide a reserve based upon our historical loss rate as a percentage of sales.
Inventory write-downsreserves. Inventory is stated at the lower of cost or market (netnet realizable value). We review our inventoryvalue. Inventory reserves are recorded for excess and slow-moving inventory. Our analysis includes a review of inventory quantities on hand at period-end in relation to year-to-date sales, existing orders from customers and projections for sales in the foreseeable future. The net realizable value is determined based on historical sales experience on a style-by-style basis.
Impairment The valuation of long-lived assets. When circumstances warrant, we test for recoverability of the asset groups’ carrying value using estimates of undiscounted future cash flows based on the existing service potential of the applicable asset group in determining the fair value of each asset group.
If the assets are considered toinventory could be impaired, the impairment we recognize is the amountimpacted by which the carrying value of the assets exceeds the fair value of the assets. We base the useful lives and related amortization or depreciation expense on our estimate of the
period that the assets will generate revenues or otherwise be used by us. We review all of our stores for impairment annually or more frequently if events or changes in circumstances require it. We prepare a summary of cash flowspublic and consumer preferences, demand for each of our retail stores, to assess potential impairment of the fixed assets and leasehold improvements. Stores with negative cash flows which have been open in excess of twenty-four months are then reviewed in detail to determine whether impairment exists. Management reviews both quantitative and qualitative factors to assess whether a triggering event occurred. We did not record a material impairment charge for the years ended December 31, 2020, 2019 and 2018.
Goodwill. The Company tests goodwill for impairment annually for each reporting unitproduct, changes in the fourth quarterbuying patterns of the fiscal year,both retailers and between annual tests if events occur or circumstances change which suggest that goodwill should be reevaluated. Such events or circumstances include significant changes in historical financial performance, macroeconomicconsumers and industry conditions and the legal and regulatory environment. The Domestic Wholesale, International Wholesale and Direct-to-Consumer segments each represent a reporting unit. The Company performed its annual impairment test inventory management of customers.using a qualitative approach to determine whether conditions existed to indicate that it was more likely than not that the fair value of goodwill was less than its carrying value. Based on this assessment, the Company concluded that it was more likely than not that the fair value of goodwill was greater than its carrying values, and therefore a quantitative analysis, involving the calculation of an estimated fair value of each reporting unit based on projected future cash flows and comparing the estimated fair values of the reporting units to their carrying amounts, was not required.
Litigation reserves. Estimated amounts for claims that are probable and can be reasonably estimated are recorded as liabilities in our consolidated financial statements. The likelihood of a material change in these estimated reserves would depend on additional information or new claims as they may arise as well as the favorable or unfavorable outcome of particular litigation. Both the likelihood and amount (or range of loss) on a large portion of our remaining pending litigation is uncertain. As such, we are unable to make a reasonable estimate of the liability that could result from unfavorable outcomes in our remaining pending litigation. As additional information becomes available, we will assess the potential liability related to our pending litigation and revise our estimates. Such revisions in our estimates of potential liability could materially impact our results of operations and financial position.
Tax estimates.The establishment of deferred tax assets from intra-entity transfers of certain intellectual property rights and other transactions requires management to make significant estimates and assumptions to determine the fair value of such intellectual property rights. The valuation of deferred income taxes. tax assets requires significant estimates and assumptions including, but not limited to, future sales growth, discount rates and the expected life of the assets, which by their nature are inherently uncertain and may ultimately differ materially from our actual results. We record a valuation allowance when necessary to reduce our deferred tax assets to the amount that is more likely than not to be realized. The likelihood of a material change in our expected realization of our deferred tax assets depends on future taxable income and the effectiveness of our tax planning strategies amongst the various domestic and international tax jurisdictions in which we operate. We evaluate our projections of taxable income to determine the recoverability of our deferred tax assets and the need for a valuation allowance.
Business Combinations. Weuse the acquisition method of accounting for business combinations and recognize assets acquired and liabilities assumed measured at their fair values on the date acquired. Goodwill is measured as of the acquisition date as the excess of consideration transferred over the net acquisition date fair value of the assets acquired and the liabilities assumed. The valuation of identifiable intangible assets reflects management's estimates based on, among other factors, use of established valuation methods, including, but not limited to, the multi-period excess earnings method income approach. Further estimates within these models include, but are not limited to, future expected cash flows, including revenues and expenses, and applicable discount rates. These estimates are inherently uncertain and subject to refinement. During the measurement period, which may be up to one year from the acquisition date, adjustments to the fair value of these tangible and intangible assets acquired and liabilities assumed may be recorded, with the corresponding offset to goodwill. Upon the conclusion of the measurement period or final determination of the fair value of assets acquired and liabilities assumed, whichever comes first, any subsequent adjustments are recorded to our consolidated statements of operations and comprehensive income (loss).
EXCHANGE RATES
We receive U.S. dollars for substantially all of our domestic and a portion of our international product sales, as well as our royalty income.sales. Inventory purchases from offshore contract manufacturers are primarily denominated in U.S. dollars. However, purchase prices for our products may be impacted by fluctuations in the exchange rate between the U.S. dollar and the local currencies of the contract manufacturers, which may impact our cost of goods in the future. During 20202023 and 2019,2022, exchange rate fluctuations did not have a material impact on our inventory costs. We do not engage in hedging activities with respect to such exchange rate risk.
24
RECENT ACCOUNTING PRONOUNCEMENTS
Refer to Note 1 — Summary of Significant Accounting Policies in the accompanying Notes to the Consolidated Financial Statements for recently adopted and recently issued accounting standards.
Item 7A. Quantitative and Qualitative Disclosure About Market Risk
|
|
Market risk is the potential loss arising from the adverse changes in market rates and prices, such as interest rates and foreign currency exchange rates. Changes in interest rates and changes in foreign currency exchange rates have and will have an impact on our results of operations.
Interest rate fluctuations. As of December 31, 2020,2023, we have $55.5$58.5 million and $679.4$242.9 million of outstanding short-termcurrent and long-term borrowings, subject to changes in interest rates. A 200-basis point increase in interest rates would have increased interest expense by approximately $12.1$6.0 million for the year ended December 31, 2020.2023. We do not expect changes in interest rates to have a material impact on our financial condition or results of operations or cash flows during the remainder of 2021.2024. The interest rate charged on our unsecured revolving credit facility is based on LIBOR,SOFR, our domesticNorth America distribution center construction loan is based on the one month LIBOR, and ourone-month Bloomberg Short-Term Bank Yield Index (“BSBY”). Our China distribution center and China operational loans are based on a reference rate provided by the People’s Bank of China. Our loan with the Company’s joint venture with HF Logistics I, LLC (“HF”), HF Logistics-SKX, LLC (the “JV”), through a wholly-owned subsidiary of the JV (“HF-T1”), was based on the SOFR Daily Floating Rate plus a margin of 1.75%. During the second quarter of 2023, the Company amended certain terms of our loan agreement with Bank of America and the related interest rate swap to replace the LIBOR with SOFR as part of our planned reference rate reform activities, as discussed in Note 4 - Financial Commitments. Prior to the effective date of the amended swap agreement, our loan was based on the LIBOR Daily Floating Rate plus a margin of 1.75%. Changes in these interest rates will have an effect on the interest charged on outstanding balances.
We may enter into derivative financial instruments such as interest rate swaps in order to limit our interest rate risk on our long-term debt. We had one derivative instrument in place as of December 31, 20202023 to hedge the cash flows on our $129.5 million variable rate debt on our domesticNorth America distribution center.center, which was entered into by the JV. This instrument was a variable to fixed derivative with a notional amount of $129.5 million at December 31, 2020.2023. Our receive rate was one-month LIBOR and the average pay rate was 0.795% through the effective date of the interest swap amendment. Since the effective date of the amended swap agreement, our receive rate was 30-day SOFR rate and the average pay rate was 0.778%. The rate swap agreement utilized by us effectively modifies our exposure to interest rate risk by converting our floating-rate debt to a fixed rate basis over the life of the loan, thus reducing the impact of interest-rate changes on future interest payments.
Foreign exchange rate fluctuations. We face market risk to the extent that changes in foreign currency exchange rates affect our non-U.S. dollar functional currency foreign subsidiaries’ revenues,sales, expenses, assets and liabilities. In addition, changes in foreign exchange rates may affect the value of our inventory commitments. Also, inventory purchases of our products may be impacted by fluctuations in the exchange rates between the U.S. dollar and the local currencies of the contract manufacturers, which could have an impact on the cost of goods sold in the future. We manage these risks by primarily denominating these purchases and commitments in U.S. dollars.
Assets and liabilities outside the U.S. are located in regions where we have subsidiaries or joint ventures: Asia, Central America,the Americas, Europe, Middle East North America,& Africa, and South America.Asia-Pacific. Our investments in foreign subsidiaries and joint ventures with a functional currency other than the U.S. dollar are generally considered long-term. The fluctuation of foreign currencies resulted in a cumulative foreign currency translation gain of $2.7$11.5 million and $1.5loss of $36.6 million, for the years ended December 31, 20202023 and 2019,2022, that are deferred and recorded as a component of accumulated other comprehensive incomeloss in stockholders’ equity. A 200 basis200-basis point reduction in each of these exchange rates at December 31, 20202023 would have reduced the values of our net investments by approximately $61.5$102.4 million.
25
Item 8. Financial Statements and Supplementary Data
Index to Consolidated Financial Statements
|
|