REPURCHASE AGREEMENTS
Repurchase agreements are contracts for the sale of securities owned or borrowed by the Bank with an agreement to repurchase those securities at an agreed-upon price and date. The Bank’s repurchase agreements are primarily collateralized by GSE obligations and other mortgage-related securities, and are entered into with either the FHLBs or various brokerage firms.
SYSTEMICALLY IMPORTANT FINANCIAL INSTITUTION (“SIFI”)
A bank holding company with total consolidated assets that average more than $250 billion over the four most recent quarters is designated a “Systemically Important Financial Institution” under the Dodd-Frank Wall Street Reform and Consumer Protection Act (the “Dodd-Frank Act”) of 2010, as amended by the Economic Growth, Regulatory Relief, and Consumer Protection Act of 2018.
MODIFICATION
| Item 1. | ||||||
|
| |||||
|
| |||||
|
| |||||
|
| |||||
|
| |||||
|
| |||||
|
| |||||
|
| |||||
|
| |||||
|
| |||||
|
| |||||
|
| |||||
|
| |||||
|
| |||||
|
| |||||
|
| |||||
|
| |||||
|
| |||||
|
| |||||
|
| |||||
|
| |||||
|
| |||||
|
| |||||
|
| |||||
|
| |||||
|
| |||||
|
| |||||
|
| |||||
|
| |||||
|
| |||||
|
| |||||
|
| |||||
| ||||||
PART I
|
|
(ii) New York Community Bank
Established in 1859, was merged with and into Flagstar Bank N.A., with Flagstar Bank N.A. continuing as the Bank is a surviving entity.
We are a leading producer of multi-family loans inthe New York City market area, where it specializes in rent-regulated, non-luxury apartment buildings. Flagstar Mortgage is the 7th largest bank originator of residential mortgages for the 12-months ended December 31, 2023, while we are the industry’s 5th largest sub-servicer of mortgage loans nationwide, servicing 1.4 million accounts with an emphasis$382.2 billion in unpaid principal balances as of December 31, 2023. Additionally, the Company is the 2nd largest mortgage warehouse lender nationally based on non-luxury residential apartment buildings with rent-regulated units that feature below-market rents. In addition to multi-family loans, which are our principal asset, we originate CRE loans (primarily in New York City), specialty finance loans and leases, and, to a much lesser extent, ADC loans, and C&I loans (typically made to small and mid-size business in Metro New York).
total commitments.
website, which can be found at www.ir.myNYCB.com.
Our current market for deposits consists of the 26 counties
their businesses.
insurance agency. and Servicing paid on deposits. The effect of government policies on the earnings of the Company and the Bank cannot be predicted. The N.A). NYB Realty Holding Company, LLC, a subsidiary of the Bank, owns interests in in good standing. Policies Federal Reserve. The Bank is Regulatory Agencies or Congress, could have a materially adverse impact on our operations. capital buffer requirement in that year. documentation; credit underwriting; the monitoring of interest rate risk; asset growth; compensation; fees and benefits; and such other operational and managerial standards as the agency deems appropriate. The federal banking agencies adopted final regulations and Interagency Guidelines Establishing Standards for Safety and Soundness (the “Guidelines”) to implement these safety and soundness standards. The Guidelines set forth the safety and soundness standards that the federal banking agencies use to identify and address problems at insured depository institutions before capital becomes impaired. If the appropriate federal banking agency determines that an institution fails to meet any standard prescribed by the Guidelines, the agency may require the institution to provide it with an acceptable plan to achieve compliance with the standard, as required by the Federal Deposit Insurance Act, as amended, (the “FDI Act”). January 1, 2015, and before April 1, 2020. Banking organizations also will have the option to reevaluate any or all of their ADC loans originated on or after January 1, 2015, using the revised HVCRE exposure definition. No institution may pay a dividend if in default of the federal deposit insurance assessment. Deposit insurance assessments are based on total average assets, excluding PPP loans, less average tangible common equity. The FDIC has authority to increase insurance assessments. Management cannot predict what insurance assessments rates will be in the future. Regulation. dividend. developed with NCRC and its members in conjunction with the Company's merger with Flagstar Bancorp, Inc. The agreement includes $22.0 billion in community lending and affordable housing commitments and $6.0 billion of residential mortgage originations to underserved and LMI borrowers, and in LMI and majority-minority neighborhoods over a five-year period. The Company will also provide $542 million in loans to small businesses with less than $1 million in revenues and in LMI and majority-minority communities; $16.5 million in philanthropic support to nonprofit organizations that meet the needs of LMI and majority-minority communities and individuals; greater access to banking products and services; and the continuation of the Company's responsible multi-family lending practices. regulatory requirements and to assist in managing risk associated with money laundering and terrorist financing. affiliates and non-affiliates for marketing and/or non-marketing purposes, or to contact customers with marketing offers. The GLBA also requires financial institutions to implement a comprehensive information security program that includes administrative, technical, and physical safeguards to ensure the security and confidentiality of customer records and Real Estate Settlement Procedures Act (Regulation X), Telephone Consumer Protection Act, CAN-SPAM Act, Children’s Online Privacy Protection Act, the Military Lending Act, and the Homeownership Counseling Act. Additionally, we are subject to Section 5 of the Federal Trade Commission Act, which prohibits unfair and deceptive acts or practices in or affecting commerce, and Section 1031 of the Dodd-Frank Act, which prohibits unfair, deceptive, or abusive acts or practices (“UDAAP”) in connection with any consumer financial product or service. Many states have consumer protection laws analogous to, or in addition to, the federal laws listed above, such as usury laws, state debt collection practices laws, and requirements regarding loan disclosures and terms, credit discrimination, credit reporting, money transmission, recordkeeping, and unfair or deceptive business practices. interests of the consumer. CFPA authority even if the CFPB is pursuing a concurrent action against the same entity. we currently believe to be immaterial, also may have a material effect on our financial condition and results of operations. This grow our loan portfolios could adversely affect our ability to generate interest income. timely manner. In addition, such changes in interest rates could affect our ability to originate loans and attract and retain deposits; the fair values of our securities and other financial assets; the fair values of our liabilities; and the average lives of our loan and securities portfolios. Changes in interest rates also could have an effect on loan refinancing activity, which, in turn, would impact the amount of prepayment income we receive on our multi-family and CRE loans. Because prepayment income is recorded as interest income, the extent to which it increases or decreases during any given period could have a significant impact on the level of net interest income and net income we generate during that time. Also, changes in interest rates could have an effect on the slope of the yield curve. If the yield curve were to invert or become flat, our net interest income and net interest margin could contract, adversely affecting our net income and cash flows, and the value of our assets. Moreover, higher inflation could lead to fluctuations in the value of our assets and liabilities and off-balance sheet exposures, and could result in lower equity market valuations of financial services companies. Our allowance for credit losses might not be sufficient to cover our actual losses, which would adversely impact our financial condition and results of operations. If the judgments and assumptions we make with regard to the allowance are incorrect, our allowance for losses on such loans might not be sufficient, and an additional provision for credit losses might need to be made. Depending on the amount of such loan loss provisions, the adverse impact on our earnings could be material. In addition, related borrowers compared to one-to-four family residential loans. Also, many of our borrowers have more than one of these types of loans outstanding. Accordingly, the ability of our borrowers to repay their loans, and the value of the collateral securing such loans, may be significantly affected by economic conditions in this region, including changes in the local real estate market. A significant decline in general economic conditions caused by inflation, recession, unemployment, acts of terrorism, extreme weather, or other factors beyond our control, could therefore have an adverse effect on our financial condition and results of operations. In addition, because multi-family and CRE loans represent the majority of the loans in our portfolio, a decline in tenant occupancy or rents, due to such factors, or for other reasons, such as new legislation, could adversely impact the ability of our borrowers to repay their loans on a timely basis, which could have a negative impact on our net income. Furthermore, economic or market turmoil could occur in the near or long term. This could negatively affect our business, our financial condition, and our results of operations, as well as our ability to maintain we use to measure the fair value of financial instruments are inadequate, the fair value of such financial instruments may fluctuate unexpectedly or may not accurately reflect what we could realize upon sale or settlement of such financial instruments. Any such failure in our analytical or forecasting models could have a material adverse effect on our business, financial condition and results of operations. Deposit flows, calls of investment securities and wholesale borrowings, and the prepayment of loans and mortgage-related securities are strongly influenced by such external factors as the direction of interest rates, whether actual or perceived; local and national economic conditions; and competition for deposits and loans in the markets we serve. Deposit outflows can occur for a number of reasons, including clients seeking higher yields, clients with uninsured deposits may seek greater financial security or clients may simply prefer to do business with our competitors, or for other reasons. The withdrawal of more deposits than we anticipate could have an adverse impact on our profitability as this source of funding, if not replaced by similar deposit funding, would need to be As of December 31, 2023, approximately 35.9 percent of our total deposits of $81.5 billion were not FDIC-insured. or making a liquidation payment on such stock, under the following circumstances: (a) if an event of default has occurred and is continuing under the applicable indenture; (b) if we are in default with respect to a payment under the guarantee of the related trust preferred securities; or (c) if we have given notice of our election to defer interest payments but the related deferral period has not yet If the non-payment of dividends on Series A Preferred Stock, Series B Preferred Stock and Series C Preferred Stock for any dividend period would cause the Company to fail to comply with any applicable law or regulation, or any agreement we may enter into with our regulators from time to time, then we would not be able to declare or pay a dividend for such dividend period. Series C Preferred Stock could limit our ability to obtain additional financing, which could have an adverse effect on our financial condition. The preferential rights could also result in divergent interests between the holders of our common stock, Series A Preferred Stock, Series B Preferred Stock, Series C Preferred Stock and other classes of securities. Furthermore, it is possible that future regulatory changes could result in more stringent capital or liquidity requirements, including increases in the levels of regulatory capital we are required to maintain and changes in the way capital or liquidity is measured for regulatory purposes, either of which could adversely affect our business and our ability to expand. For example, federal banking regulations adopted under Basel III standards require bank holding companies and banks to undertake significant activities to demonstrate compliance with higher capital requirements. Any additional requirements to increase our capital ratios or liquidity could necessitate our liquidating certain assets, perhaps on terms that are unfavorable to us or that are contrary to our business plans. In addition, such requirements could also compel us to issue additional securities, thus diluting the value of our common stock. In addition, failure to meet established capital requirements could result in the FRB and/or OCC placing limitations or regulatory authorities, including limiting our ability to pay dividends; issuing a directive to increase our capital; and terminating our FDIC deposit insurance. Such regulation and supervision govern the activities in which a bank holding company and its banking subsidiaries may engage, and are intended primarily for the protection of the DIF, the banking system in general, and bank customers, rather than for the benefit of a company’s stockholders. These regulatory authorities have extensive discretion in connection with their supervisory and enforcement activities, including with respect to the imposition of restrictions on the operation of a bank or a bank holding company, the imposition of significant fines, the ability to delay or deny merger or other regulatory applications, the payment of dividends, the classification of assets by a bank, and the adequacy of a bank’s allowance for loan losses, among other matters. Failure to comply (or to ensure that our agents and third-party service providers comply) with laws, regulations, or policies, including our failure to obtain any necessary state or local licenses, could result in enforcement actions or sanctions by regulatory agencies, civil money penalties, and/or reputational damage, which could have a material adverse effect on our business, financial condition, or results of operations. Penalties for such violations may also include: revocation of licenses; fines and other monetary penalties; civil and criminal liability; substantially reduced payments by borrowers; modification of the original terms of loans, permanent forgiveness of debt, or inability to, directly or indirectly, collect all or a part of the principal of or interest on loans provided by the Bank. Changes in such regulation and supervision, or changes in regulation or enforcement by such authorities, whether in the form of policy, regulations, legislation, rules, orders, enforcement actions, ratings, or decisions, could have a material impact on the Company, our subsidiary bank and other affiliates, and our operations. In addition, failure of the Company or the Bank to comply with such regulations could have a material adverse effect on our earnings and capital. See “Regulation and Supervision” in Part I, Item 1, “Business” earlier in this filing for a detailed description of the federal, state, and local regulations to which the Company and the Bank are subject. For example, economic and market conditions, heightened legislative and regulatory scrutiny of the financial services industry, and increases in the overall complexity of our operations, among other developments, have resulted in the creation of a variety of risks that were previously unknown and unanticipated, highlighting the intrinsic limitations of our risk monitoring and mitigation techniques. As a result, the further development of previously unknown or unanticipated risks may result in our incurring losses in the future that could adversely impact our financial condition and results of operations. Furthermore, an ineffective ERM framework, as well as other risk factors, could result in a material increase in our FDIC insurance premiums. assessment that denies previously recognized tax benefits, could result in our recording tax expenses that materially reduce our net income. Furthermore, declines in the value of our investment securities could result in our having to record losses based on the other-than-temporary impairment of securities, which would reduce our earnings and also could reduce our capital. In addition, continued economic weakness could reduce the demand for our products and services, which would adversely impact our liquidity and the revenues we produce. Additionally, if the Company is not able to obtain certain approvals from our stockholders on or before September 9, 2024, then the Company will be required to issue to the investors in the March 2024 capital raise cash-settled warrants, which would become exercisable 60 days after their issuance if the such stockholder approvals still have not been obtained at such time, that provide the holder thereof the right, until the ten-year anniversary of the issuance of such warrant, to receive from the Company cash in an amount equal to (i) from issuance thereof until (and including) November 5, 2024, 160 percent of such holder’s investment in the Company in the March 2024 capital raise; (ii) on (and including) November 6, 2024 until (and including) January 4, 2025, 180 percent of such holder’s investment in the Company in the March 2024 capital raise; (iii) on (and including) January 5, 2025 until (and including) March 5, 2025, 200 percent of such holder’s investment in the Company in the March 2024 capital raise; and (iv) from and after March 6, 2025, 220 percent of such holder’s investment in the Company in the March 2024 capital raise, in each case, net of the exercise price (which is the amount of such holder’s investment in the Company in the March 2024 capital raise). interest rates and service fees that compare favorably with those of our competitors; and skilled and knowledgeable personnel to assist our customers by addressing their financial needs. External factors that may impact our ability to compete include, among others, the entry of new lenders and depository institutions in our current markets and, with regard to lending, an increased focus on multi-family and CRE lending by existing competitors. If we are unable to engage in or complete a desired acquisition or merger transaction, our financial condition and results of operations could be adversely impacted. As acquisitions have been a significant source of deposits, the inability to complete a business combination could require that we increase the interest rates we pay on deposits in order to attract such funding through our current branch network, or that we increase our use of wholesale funds. Increasing our cost of funds could adversely impact our net interest income and our net income. Furthermore, the absence of acquisitions could impact our ability to fulfill our loan demand. In addition, mergers and acquisitions can lead to uncertainties about the future on the part of customers and employees. Such uncertainties could cause customers and others to consider changing their existing business relationships with the company to be acquired, and could cause its employees to accept positions with other companies before the merger occurs. As a result, the ability of a company to attract and retain customers, and to attract, retain, and motivate key personnel, prior to a merger’s completion could be impaired. Furthermore, no assurance can be given that acquired operations would not adversely affect our existing profitability; that we would be able to achieve results in the future similar to those achieved by our existing banking business; that we would be able to compete effectively in the market areas served by acquired branches; or that we would be able to manage any growth resulting from a transaction effectively. In particular, our ability to compete effectively in new markets would be dependent on our ability to understand those markets and their competitive dynamics, and our ability to retain certain key employees from the acquired institution who know those markets better than we do. prospects. In addition, breaches of security have in the past and may in the future occur through intentional or unintentional acts by those having authorized or unauthorized access to our confidential or other information, or that of our customers, clients, or counterparties. maintain or any third-party indemnification or insurance. We believe that the impact of any previously identified cyber incidents, including those subject to ongoing investigation and remediation, will not have a material financial impact. While we have established information security policies, procedures and Our third-party providers may be vulnerable to unauthorized access, computer viruses, phishing schemes, and other security breaches. Threats to information security also exist in the processing of customer information through various other third-party providers and their personnel. We may be required to expend significant additional resources to protect against the threat of such security breaches and computer viruses, or to alleviate problems caused by such security breaches or viruses. To the extent that the activities of our third-party providers or the activities of our customers involve the storage and transmission of confidential information, security breaches and viruses could expose us to claims, regulatory scrutiny, litigation, and other possible liabilities. These types of third-party relationships are subject to increasingly demanding regulatory requirements and oversight by federal bank regulators (such as the Federal Reserve Board, the Office of the Comptroller of the Currency, and the Federal Deposit Insurance Corporation) and the CFPB. As a result, if our regulators conclude that we have not exercised adequate oversight and control over vendors and subcontractors or other ongoing third-party business relationships or that such third-parties have not performed appropriately, we could be subject to enforcement actions, including civil money penalties or other administrative or judicial penalties or fines, as well as requirements for consumer remediation. In addition, the Company may not be adequately insured against all types of losses resulting from third-party failures, and our insurance coverage may be inadequate to cover all losses resulting from systems failures or other disruptions to our banking services. in turn, on our financial condition and results of operations. Claims asserted against us can be highly complicated and slow to develop, making the outcome of such proceedings difficult to predict or estimate early in the process. As a Our actual or perceived failure to identify and address various issues also could give rise to reputational risk that could significantly harm us and our business prospects, including failure to properly address operational risks. These issues include legal and regulatory requirements; consumer protection, fair lending, and privacy issues; properly maintaining customer and associated personal information; record keeping; protecting against money laundering; sales and trading practices; and ethical issues. review and discuss overall state, current developments, management and performance metrics, risk identification and mitigation status, and new initiatives associated with both the Enterprise Risk Management and Information/Cybersecurity Programs. The 12/31/2015 12/31/2016 12/31/2017 12/31/2018 12/31/2019 12/31/2020 New York Community Bancorp, Inc. $100.00 $102.16 $87.98 $67.54 $91.43 $86.11 S&P Mid-Cap 400 Index $100.00 $120.74 $140.35 $124.80 $157.49 $179.00 SNL U.S. Bank and Thrift Index $100.00 $126.25 $148.45 $123.32 $166.67 $144.61 be used for various corporate purposes, including, but not limited to, merger transactions and the vesting of restricted stock awards. (dollars in thousands, except per share data) Period Total Shares of Common Stock Repurchased Average Price Paid per Common Share Total Allocation First Quarter 2020 3,307,183 $ 11.24 $ 37,159 Second Quarter 2020 2,426,872 8.88 21,554 Third Quarter 2020 29,747 9.73 289 Fourth Quarter 2020: October 524 8.51 5 November 1,752 8.69 15 December — — — Total Fourth Quarter 2020 2,276 8.65 20 2020 Total 5,766,078 10.24 $ 59,022 Reserved At or For the Years Ended December 31, (dollars in thousands, except share data) 2020 2019 2018 2017 2016 EARNINGS SUMMARY: Net interest income $ 1,100,142 $ 957,400 $ 1,030,995 $ 1,130,003 $ 1,287,382 Provision for (recovery of) losses on non-covered loans 62,228 7,105 18,256 60,943 (11,874 ) Recovery of losses on covered loans — — — (23,701 ) (7,694 ) Non-interest income 61,080 84,230 91,558 216,880 145,572 Non-interest expense: Operating expenses 511,190 511,218 546,628 641,218 638,109 Amortization of core deposit intangibles — — — 208 2,391 Merger-related expenses — — — — 11,146 Total non-interest expense 511,190 511,218 546,628 641,426 651,646 Income tax expense 76,695 128,264 135,252 202,014 281,727 Net income 511,109 395,043 422,417 466,201 495,401 Basic earnings per common share $ 1.02 $ 0.77 $ 0.79 $ 0.90 $ 1.01 Diluted earnings per common share 1.02 0.77 0.79 0.90 1.01 Dividends paid per common share 0.68 0.68 0.68 0.68 0.68 SELECTED RATIOS: Return on average assets 0.94 % 0.76 % 0.84 % 0.96 % 1.00% Return on average common stockholders’ equity 7.71 5.88 6.20 7.12 8.19 Average common stockholders’ equity to average assets 11.47 11.82 12.51 12.76 12.28 Operating expenses to average assets 0.94 0.98 1.09 1.32 1.29 Efficiency ratio 44.02 49.08 48.70 47.61 44.53 Net interest rate spread 2.09 1.79 2.06 2.47 2.85 Net interest margin 2.24 2.02 2.25 2.59 2.93 Dividend payout ratio 66.67 88.31 86.08 75.56 67.33 BALANCE SHEET SUMMARY: Total assets $ 56,306,120 $ 53,640,821 $ 51,899,376 $ 49,124,195 $ 48,926,555 Loans, net of allowance for credit losses on loans and leases 42,806,691 41,746,517 40,006,088 38,265,183 39,308,016 Allowance for losses on non-covered loans 194,043 147,638 159,820 158,046 158,290 Allowance for losses on covered loans — — — — 23,701 Securities 5,844,909 5,885,887 5,644,071 3,531,427 3,817,057 Deposits 32,436,813 31,657,132 30,764,430 29,102,163 28,887,903 Borrowed funds 16,083,544 14,557,593 14,207,866 12,913,679 13,673,379 Common stockholders’ equity 6,338,804 6,208,854 6,152,395 6,292,536 6,123,991 Common shares outstanding 463,901,808 467,346,781 473,536,604 488,490,352 487,056,676 Book value per common share $ 13.66 $ 13.29 $ 12.99 $ 12.88 $ 12.57 Common stockholders’ equity to total assets 11.26 % 11.57 % 11.85 % 12.81 % 12.52 % ASSET QUALITY RATIOS (2016 amounts exclude covered assets and non-covered purchased credit-impaired loans): Non-performing loans to total loans 0.09 % 0.15 % 0.11 % 0.19 % 0.15 % Non-performing assets to total assets 0.08 0.14 0.11 0.18 0.14 Allowance for credit losses on loans to non- performing loans 513.55 241.07 351.21 214.50 277.19 Allowance for credit losses on loans to total loans 0.45 0.35 0.40 0.41 0.42 Net charge-offs to average loans (1) 0.04 0.05 0.04 0.16 0.00 Management's Discussion and Analysis of Financial Condition and Results of Operations $1.26 for the year ended December 31, 2022. December 31, Constant Maturity Treasury Rates Five-Year Seven-Year 2020 2019 2020 2019 High 1.67 % 2.62 % 1.79 % 2.70 % Low 0.19 1.32 0.36 1.40 Average 0.53 1.95 0.72 2.05 Repricing Analysis December 2020 2019 Unemployment rate: United States 6.5 % 3.4 % New York City 11.0 3.1 Arizona 7.3 4.2 Florida 5.8 2.4 New Jersey 7.4 3.6 New York 8.1 3.7 Ohio 5.2 3.8 For the Twelve Months Ended December 2020 2019 Change in prices: 1.4 % 2.3 % Year New York City Rental Vacancy Rate All Rental Units New York City Rental Vacancy Rate Rent Stabilized Units New York City Annual Average Unemployment Rate 2017 3.63 % 2.06 % 4.50 % 2014 3.45 % 2.12 % 7.20 % 2011 3.12 % 2.55 % 9.10 % 2008 2.88 % 2.14 % 5.60 % 2005 3.09 % 2.68 % 5.80 % 2002 2.94 % 2.52 % 8.00 % 1999 3.19 % 2.46 % 6.80 % 1996 4.01 % 3.57 % 8.80 % 1993 3.44 % 3.10 % 10.40 % 1991 3.78 % 3.54 % 8.70 % interest: investment: Signature Transaction. year ended December 31, 2022. to one percentage point of the then-current loan balance. 2022. At December 31, first mortgages. At December 31, 2020 Multi-Family Loans Commercial Real Estate Loans (dollars in thousands) Amount Percent of Total Amount Percent of Total New York City: Manhattan $ 7,773,567 24.12 % $ 3,150,097 46.08 % Brooklyn 5,996,421 18.60 545,413 7.98 Bronx 3,938,340 12.22 156,690 2.29 Queens 2,852,269 8.85 623,342 9.12 Staten Island 138,886 0.43 52,141 0.76 Total New York City $ 20,699,483 64.22 % $ 4,527,683 66.23 % New Jersey 4,239,851 13.15 567,194 8.30 Long Island 554,451 1.72 738,304 10.80 Total Metro New York $ 25,493,785 79.09 % $ 5,833,181 85.33 % Other New York State 964,536 2.99 154,915 2.27 All other states 5,778,064 17.92 847,667 12.40 Total $ 32,236,385 100.00 % $ 6,835,763 100.00 % home improvement purposes throug (in thousands) Multi- Family Commercial Real Estate One-to- Four Family Acquisition, Development, and Construction Other Total Loans Amount due: Within one year $ 8,899,559 $ 1,964,141 $ 182,495 $ 80,952 $ 1,801,400 $ 12,928,547 After one year: One to five years 20,999,897 4,132,378 50,963 4,628 1,490,930 26,678,796 Over five years 2,336,929 739,244 2,531 4,210 131,533 3,214,447 Total due or repricing after one year 23,336,826 4,871,622 53,494 8,838 1,622,463 29,893,243 Total amounts due or repricing, gross $ 32,236,385 $ 6,835,763 $ 235,989 $ 89,790 $ 3,423,863 $ 42,821,790 Due after December 31, 2021 (in thousands) Fixed Adjustable Total Mortgage Loans: Multi-family $ 4,839,645 $ 18,497,181 $ 23,336,826 Commercial real estate 1,160,769 3,710,853 4,871,622 One-to-four family 6,456 47,038 53,494 Acquisition, development, and construction 8,440 398 8,838 Total mortgage loans 6,015,310 22,255,470 28,270,780 Other loans 1,273,855 348,608 1,622,463 Total loans $ 7,289,165 $ 22,604,078 $ 29,893,243 For the Years Ended December 31, 2020 2019 (dollars in thousands) Amount Percent of Total Amount Percent of Total Mortgage Loan Originated for Investment: Multi-family $ 8,711,586 67.78 % $ 5,981,700 56.44 % Commercial real estate 958,193 7.45 1,226,272 11.57 One-to-four family residential 58,258 0.45 102,829 0.97 Acquisition, development, and construction 35,099 0.27 91,400 0.86 Total mortgage loans originated for investment 9,763,136 75.95 7,402,201 69.84 Other Loans Originated for Investment: Specialty finance 2,694,459 20.95 2,799,962 26.42 Other commercial and industrial 393,035 3.10 391,702 3.70 Other 3,998 0.00 4,200 0.04 Total other loans originated for investment 3,091,492 24.05 3,195,864 30.16 Total loans originated for investment $ 12,854,628 100.00 % $ 10,598,065 100.00 % At December 31, 2020 2019 2018 2017 2016 (dollars in thousands) Amount Percent of Total Loans Amount Percent of Total Loans Amount Percent of Total Loans Amount Percent of Non- Covered Loans Amount Percent of Total Loans Percent of Non- Covered Loans Mortgage Loans: Multi-family $ 32,236,385 75.07 % $ 31,158,672 74.46 % $ 29,883,919 74.46 % $ 28,074,709 73.12 % $ 26,945,052 68.28 % 71.35 % Commercial real estate 6,835,763 15.92 % 7,081,910 16.93 6,998,834 17.44 7,322,226 19.07 7,724,362 19.57 20.45 One-to-four family 235,989 0.55 % 380,361 0.91 446,094 1.11 477,228 1.24 381,081 0.97 1.01 Acquisition, development, and construction 89,790 0.21 % 200,596 0.48 407,870 1.02 435,825 1.14 381,194 0.97 1.01 Total mortgage loans 39,397,927 91.75 % 38,821,539 92.78 37,736,717 94.03 36,309,988 94.57 35,431,689 89.79 93.82 Other Loans: Specialty finance 3,024,043 7.04 % 2,594,326 6.20 1,918,545 4.78 1,539,733 4.01 1,267,530 3.21 3.36 Other commercial and industrial 393,300 0.92 % 420,052 1.00 469,875 1.17 500,841 1.31 632,915 1.60 1.68 Other loans 6,520 0.02 % 8,102 0.02 8,724 0.02 8,460 0.02 24,067 0.06 0.06 Total other loans 3,423,863 7.98 % 3,022,480 7.22 2,397,144 5.97 2,049,034 5.34 1,924,512 4.87 5.10 Total loans held for investment (non-covered) $ 42,821,790 99.73 % $ 41,844,019 100.00 $ 40,133,861 100.00 $ 38,359,022 99.91 $ 37,356,201 94.66 98.92 Loans held for sale 117,136 0.27 % — — — — 35,258 0.09 409,152 1.04 1.08 Total loans (non-covered) $ 42,938,926 100.00 % $ 41,844,019 100.00 % $ 40,133,861 100.00 % $ 38,394,280 100.00 $ 37,765,353 95.70 100.00 % Covered loans — — — — — — 1,698,133 4.30 Total loans $ 42,938,926 $ 41,844,019 $ 40,133,861 100.00 % $ 38,394,280 100.00 % $ 39,463,486 100.00 % Net deferred loan origination costs 61,808 50,136 32,047 28,949 26,521 Allowance for losses on non-covered loans (194,043 ) (147,638 ) (159,820 ) (158,046 ) (158,290 ) Allowance for losses on covered loans — — — — (23,701 ) Total loans and leases, net $ 42,806,691 $ 41,746,517 $ 40,006,088 $ 38,265,183 $ 38,308,016 Change from December 31, 2019 to December 31, 2020 (dollars in thousands) December 31, 2020 December 31, 2019 Amount Percent Non-Performing Loans: Non-accrual mortgage loans: Multi-family $ 4,068 $ 5,407 $ (1,339 ) (25 ) % Commercial real estate 12,142 14,830 (2,688 ) (18 ) One-to-four family 1,696 1,730 (34 ) (2 ) Acquisition, development, and construction — — — — Total non-accrual mortgage loans 17,906 21,967 (4,061 ) (18 ) Non-accrual other loans (1) 19,879 39,276 (19,397 ) (49 ) Total non-performing loans $ 37,785 $ 61,243 $ (23,458 ) (38 ) A loan generally is classified as a “non-accrual” loan when it is 90 days or more past due or when it is deemed to be impaired because we no longer expect to collect all amounts due according to the contractual terms of the loan agreement. When a loan is placed on non-accrual status, we cease the accrual of interest owed, and previously accrued interest is reversed and charged against interest income. At December 31, Board. Change from December 31, 2019 to December 31, 2020 (dollars in thousands) December 31, 2020 December 31, 2019 Amount Percent Loans 30-89 Days Past Due: Multi-family $ 4,091 $ 1,131 $ 2,960 262 % Commercial real estate 9,989 2,545 7,444 292 One-to-four family 1,575 — 1,575 NM Acquisition, development, and construction — — - NM Other loans 3 44 (41 ) -93 Total loans 30-89 days past due $ 15,658 $ 3,720 $ 11,938 321 % (Dollars in thousands) Loan No. 1 Loan No. 2 (2) Loan No. 3 (2) Loan No. 4 (2) Loan No. 5 Type of Loan CRE Multi-Family C&I CRE CRE Origination date 06/20/14 1/17/12 4/29/14 6/16/03 06/01/16 Origination balance $ 9,750 $ 2,850 $ 13,325 $ 1,800 $ 1,275 Full commitment balance (1) $ 9,750 $ 2,850 $ 13,325 $ 1,800 $ 1,275 Balance at December 31, 2020 $ 8,235 $ 1,830 $ 1,764 $ 1,256 $ 1,215 Associated allowance $ 3 $ 264 None None $ 177 Non-accrual date October 2019 August 2019 June 2017 October 2015 August 2020 Origination LTV 65% 21% N/A 68% 55% Current LTV 90% 12% N/A 40% 70% Last appraisal September 2020 December 2019 N/A August 2020 August 2020 The following table sets forth the changes in (in thousands) Accruing Non- Accrual Total Balance at December 31, 2019 $ 1,254 $ 39,245 $ 40,499 New TDRs 15,119 5,910 21,029 Charge-offs — (17,344 ) (17,344 ) Transferred to performing — (481 ) (481 ) Loan payoffs, including dispositions and principal pay-downs (1,406 ) (8,012 ) (9,418 ) Balance at December 31, 2020 $ 14,967 $ 19,318 $ 34,285 Total Deferred Total Portfolio Deferred as a% of Total Portfolio (in millions) Multi-family $ 74.3 $ 32,156.5 0.2 % CRE 6.1 6,836.1 0.1 % Total $ 80.4 $ 38,992.6 0.2 % Amount in Deferral Outstanding Balance Deferred as a% of Outstanding Balance Weighted- Average LTV (in millions) Multi-family $ 74.3 $ 32,156.5 0.2 % 60.1 % CRE: Office $ - $ 3,322.2 NA NA Retail 1.3 1,803.4 0.1 % 45.2 % Mixed use 0.8 684.3 0.1 % 57.2 % Condo/ Co-op 2.7 262.8 1.0 % 42.2 % Industrial 1.3 289.8 0.4 % 42.6 % Other - 473.6 NA NA Sub-total CRE $ 6.1 $ 6,836.1 0.1 % 44.9 % Total multi-family and CRE $ 80.4 $ 38,992.6 0.2 % 59.0 % At or for the Years Ended December 31, (dollars in thousands) 2020 2019 2018 2017 2016 Allowance for Credit Losses on Loans and Leases: Balance at beginning of year $ 147,638 $ 159,820 $ 158,046 $ 156,524 $ 145,196 CECL day 1 transition adjustment 1,911 - - - - Adjusted allowance for credit losses at January 1 149,549 159,820 158,046 156,524 145,196 Provision for losses on non-covered loans 63,279 7,105 18,256 60,943 12,036 Recovery from allowance on PCI loans — — — 1,766 — Charge-offs: Multi-family — (659 ) (34 ) (279 ) — Commercial real estate (1,870 ) — (3,191 ) — — One-to-four family residential (2 ) (954 ) — (96 ) (170 ) Acquisition, development, and construction — — (2,220 ) — — Other loans (20,306 ) (18,694 ) (12,897 ) (62,975 ) (3,413 ) Total charge-offs (22,178 ) (20,307 ) (18,342 ) (63,350 ) (3,583 ) Recoveries: Multi family 755 — — 28 78 Commercial real estate 354 — 137 408 799 One-to-four family residential — — — — 228 Acquisition, development and construction 63 61 127 169 167 Other loans 2,221 959 1,596 1,558 1,603 Total recoveries $ 3,393 $ 1,020 $ 1,860 $ 2,163 $ 2,875 Net (charge-offs) recoveries (18,785 ) (19,287 ) (16,482 ) (61,187 ) (708 ) Balance at end of year $ 194,043 $ 147,638 $ 159,820 $ 158,046 $ 156,524 Non-Performing Assets: Non-accrual mortgage loans: Multi-family $ 4,068 $ 5,407 $ 4,220 $ 11,078 $ 13,558 Commercial real estate 12,142 14,830 3,021 6,659 9,297 One-to-four family residential 1,696 1,730 1,651 1,966 9,679 Acquisition, development, and construction — — — 6,200 6,200 Total non-accrual mortgage loans 17,906 21,967 8,892 25,903 38,734 Non-accrual other loans 19,879 39,276 36,614 47,779 17,735 Loans 90 days or more past due and still accruing interest — — — — — Total non-performing loans (1) $ 37,785 $ 61,243 $ 45,506 $ 73,682 $ 56,469 Repossessed assets (2) 8,318 12,268 10,794 16,400 11,607 Total non-performing assets $ 46,103 $ 73,511 $ 56,300 $ 90,082 $ 68,076 Asset Quality Measures: Non-performing loans to total loans 0.09 % 0.15 % 0.11 % 0.19 % 0.15 % Non-performing assets to total assets 0.08 % 0.14 0.11 0.18 0.14 Allowance for credit losses on loans to non-performing loans 513.55 241.07 351.21 214.50 277.19 Allowance for credit losses on loans to total loans 0.45 0.35 0.40 0.41 0.42 Net charge-offs (recoveries) during the period to average loans outstanding during the period (3) 0.04 0.05 0.04 0.16 0.0 Loans 30-89 Days Past Due: Multi-family $ 4,091 $ 1,131 $ — $ 1,258 $ 28 Commercial real estate 9,989 2,545 — 13,227 — One-to-four family residential 1,575 — 9 585 2,844 Acquisition, development, and construction — — — — — Other loans 3 44 555 2,719 7,511 Total loans 30-89 days past due (4) $ 15,658 $ 3,720 $ 564 $ 17,789 $ 10,383 The following table sets forth the allocation of the consolidated allowance for losses on loans, 2020 2019 2018 2017 2016 (dollars in thousands) Amount Percent of Loans in Each Category to Total Loans Held for Investment Amount Percent of Loans in Each Category to Total Loans Held for Investment Amount Percent of Loans in Each Category to Total Loans Held for Investment Amount Percent of Loans in Each Category to Total Non- Covered Loans Held for Investment Amount Percent of Loans in Each Category to Total Non- Covered Loans Held for Investment Multi-family loans $ 150,345 75.28 % $ 96,751 74.46 % $ 98,972 74.46 % $ 93,651 73.19 % $ 91,590 72.13 % Commercial real estate loans 23,525 15.96 20,744 16.93 19,934 17.44 20,572 19.09 20,943 20.68 One-to-four family residential loans 1,440 0.55 1,051 0.91 1,333 1.11 1,360 1.24 1,484 1.02 Acquisition, development, and construction loans 1,229 0.21 4,148 0.48 10,744 1.02 12,692 1.14 9,908 1.02 Other loans 17,504 8.00 24,944 7.22 28,837 5.97 29,771 5.34 32,599 5.15 Total loans $ 194,043 100.00 % $ 147,638 100.00 % $ 159,820 100.00 % $ 158,046 100.00 % $ 156,524 100.00 % were designated as “Available-for-Sale”. At December 31, Federal Home Loan Bank Stock surrender value of the underlying policies, our investment in BOLI $19 million to$1.6 billion compared to December 31, 2022. case there is no surplus, from net profits for the fiscal year in which the dividend is declared and/or the preceding fiscal year. (ii) it will not declare or pay dividends on the amount of retained earnings that represents any net bargain purchase gain that is subject to a conditional period that may be imposed by the OCC. CDs due to mature or reprice in one year or less from December 31, federal funds outstanding at December 31, 2023 and December 31, 2022. (in thousands) Certificates of Deposit Long-Term Debt (1) Operating Leases(2) Total One year or less $ 9,120,243 $ 1,022,661 $ 26,961 $ 10,169,865 One to three years 1,022,024 3,075,000 51,539 4,148,563 Three to five years 188,098 800,000 48,997 1,037,095 More than five years 315 8,935,883 223,503 9,159,701 Total $ 10,330,680 $ 13,833,544 $ 351,000 $ 24,515,224 financial condition, results of operations or cash flows. securities. At December 31, 2020 Actual Minimum (dollars in thousands) Amount Ratio Required Ratio Common equity tier 1 capital $ 3,962,399 9.72 % 4.50 % Tier 1 risk-based capital 4,465,239 10.95 6.00 Total risk-based capital 5,289,611 12.97 8.00 Leverage capital 4,465,239 8.52 4.00 At December 31, 2019 Actual Minimum (dollars in thousands) Amount Ratio Required Ratio Common equity tier 1 capital $ 3,818,311 9.91 % 4.50 % Tier 1 risk-based capital 4,321,151 11.22 6.00 Total risk-based capital 5,111,990 13.27 8.00 Leverage capital 4,321,151 8.66 4.00 " For the Twelve Months Ended (dollars in thousands) December 31, 2020 December 31, 2019 Change (%) Total Interest Income $ 1,707,993 $ 1,805,160 -5 % Prepayment Income: Loans $ 52,096 $ 48,884 7 % Securities 2,354 5,304 -56 % Total prepayment income $ 54,450 $ 54,188 0 % GAAP Net Interest Margin 2.24 % 2.02 % 22 bp Less: Prepayment income from loans 11 bp 11 bp 0 bp Prepayment income from securities — 1 -1 bp Total prepayment income contribution to net interest margin 11 bp 12 bp -1 bp Adjusted Net Interest Margin (non-GAAP) 2.13 % 1.90 % 23 bp For the Years Ended December 31, 2020 2019 2018 Average Average Average Average Yield/ Average Yield/ Average Yield/ (dollars in thousands) Balance Interest Cost Balance Interest Cost Balance Interest Cost ASSETS: Interest-earning assets: Mortgage and other loans and leases, net (1) $ 42,027,435 $ 1,542,215 3.67 % $ 40,384,573 $ 1,553,004 3.85 % $ 39,122,724 $ 1,467,944 3.75 % Securities (2)(3) 5,964,896 162,729 2.73 6,329,898 235,596 3.72 4,819,789 184,136 3.82 Interest-earning cash and cash equivalents 1,108,446 3,049 0.28 744,204 16,560 2.23 1,955,837 37,593 1.92 Total interest-earning assets 49,100,777 1,707,993 3.48 47,458,675 1,805,160 3.80 45,898,350 1,689,673 3.68 Non-interest-earning assets 5,008,260 4,650,420 4,314,990 Total assets $ 54,109,037 $ 52,109,095 $ 50,213,340 LIABILITIES AND STOCKHOLDERS’ EQUITY: Interest-bearing deposits: Interest-bearing checking and money market accounts $ 10,965,099 $ 56,939 0.52 % $ 10,597,285 $ 174,347 1.65 % $ 12,033,213 $ 167,972 1.40 % Savings accounts 5,519,963 31,650 0.57 4,737,423 35,705 0.75 4,902,728 28,994 0.59 Certificates of deposit 12,412,183 217,413 1.75 13,532,036 320,234 2.37 10,236,599 182,383 1.78 Total interest-bearing deposits 28,897,245 306,002 1.06 28,866,744 530,286 1.84 27,172,540 379,349 1.40 Borrowed funds 14,833,142 301,849 2.03 13,393,837 317,474 2.37 13,454,912 279,329 2.08 Total interest-bearing liabilities 43,730,387 607,851 1.39 42,260,581 847,760 2.01 40,627,452 658,678 1.62 Non-interest-bearing deposits 2,956,563 2,588,040 2,550,163 Other liabilities 713,961 596,488 252,804 Total liabilities 47,400,911 45,445,109 43,430,419 Stockholders’ equity 6,708,126 6,663,986 6,782,921 Total liabilities and stockholders’ equity $ 54,109,037 $ 52,109,095 $ 50,213,340 Net interest income/interest rate spread $ 1,100,142 2.09 % $ 957,400 1.79 % $ 1,030,995 2.06 % Net interest margin 2.24 % 2.02 % 2.25 % Ratio of interest-earning assets to interest-bearing liabilities 1.12 1.12x 1.13x Year Ended Year Ended December 31, 2020 December 31, 2019 Compared to Year Ended Compared to Year Ended December 31, 2019 December 31, 2018 Increase/(Decrease) Increase/(Decrease) Due to Due to (in thousands) Volume Rate Net Volume Rate Net INTEREST-EARNING ASSETS: Mortgage and other loans and leases, net $ 86,306 $ (97,095 ) $ (10,789 ) $ 48,012 $ 37,048 $ 85,060 Securities and interest-earning cash and cash equivalents (27 ) (86,351 ) (86,378 ) 10,056 20,371 30,427 Total 86,279 (183,446 ) (97,167 ) 58,068 57,419 115,487 INTEREST-BEARING LIABILITIES: Interest-bearing checking and money market accounts $ 6,273 $ (123,681 ) $ (117,408 ) $ (12,836 ) $ 19,211 $ 6,375 Savings accounts 9,045 (13,100 ) (4,055 ) (940 ) 7,651 6,711 Certificates of deposit (24,838 ) (77,983 ) (102,821 ) 68,257 69,594 137,851 Borrowed funds 49,364 (64,989 ) (15,625 ) (1,262 ) 39,407 38,145 Totals 39,844 (279,753 ) (239,909 ) 53,219 135,863 189,082 Change in net interest income $ 46,435 $ 96,307 $ 142,742 $ 4,849 $ (78,444 ) $ (73,595 ) For the Years Ended December 31, (in thousands) 2020 2019 2018 Fee income $ 22,026 $ 29,297 $ 29,765 BOLI income 31,750 28,363 28,252 Net gain (loss) on securities 1,265 7,725 (1,994 ) Other income: Third-party investment product sales 4,351 6,468 12,474 Other 1,688 12,377 23,061 Total other income 6,039 18,845 35,535 Total non-interest income $ 61,080 $ 84,230 $ 91,558 2020 2019 (in thousands, except per share data) 4th 3rd 2nd 1st 4th 3rd 2nd 1st Net interest income $ 307,917 $ 281,886 $ 265,872 $ 244,467 $ 242,470 $ 235,915 $ 237,690 $ 241,325 Provision for (recovery of) loan losses 11,036 13,016 17,574 20,602 1,702 4,781 1,844 (1,222) Non-interest income 15,033 13,768 15,380 16,899 17,462 24,386 17,597 24,785 Non-interest expense 133,568 128,508 123,593 125,521 126,097 123,302 123,052 138,767 Income before income taxes 178,346 154,130 140,085 115,243 132,133 132,218 130,391 128,565 Income tax (benefit) expense (11,318 ) 38,360 34,738 14,915 30,959 33,172 33,145 30,988 Net income 189,664 115,770 105,347 100,328 101,174 99,046 97,246 97,577 Preferred stock dividends 8,207 8,207 8,207 8,207 8,207 8,207 8,207 8,207 Net income available to common shareholders $ 181,457 $ 107,563 $ 97,140 $ 92,121 $ 92,967 $ 90,839 $ 89,039 $ 89,370 Basic earnings per common share $ 0.39 $ 0.23 $ 0.21 $ 0.20 $ 0.20 $ 0.19 $ 0.19 $ 0.19 Diluted earnings per common share $ 0.39 $ 0.23 $ 0.21 $ 0.20 $ 0.20 $ 0.19 $ 0.19 $ 0.19 At or for the Twelve Months Ended December 31, (dollars in thousands) 2020 2019 Stockholders’ Equity $ 6,841,644 $ 6,711,694 Less: Goodwill (2,426,379 ) (2,426,379 ) Preferred stock (502,840 ) (502,840 ) Tangible common stockholders’ equity $ 3,912,425 $ 3,782,475 Total Assets $ 56,306,120 $ 53,640,821 Less: Goodwill (2,426,379 ) (2,426,379 ) Tangible assets $ 53,879,741 $ 51,214,442 Common stockholders’ equity to total assets 11.26 % 11.57 % Tangible common stockholders’ equity to tangible assets 7.26 7.39 Book value per common share $ 13.66 $ 13.29 Tangible book value per common share 8.43 8.09 We manage our assets and liabilities to reduce our exposure to changes in market interest rates. The asset and liability management process has three primary objectives: to evaluate the interest rate risk inherent in certain balance sheet accounts; to determine the appropriate level of risk, given our business strategy, operating environment, capital and liquidity requirements, and performance objectives; and to manage that risk in a manner consistent with guidelines approved by the Boards of Directors of the Company and the Bank. branch deposits base. At December 31, 2020 (dollars in thousands) Three Months or Less Four to Twelve Months More Than One Year to Three Years More Than Three Years to Five Years More Than Five Years to 10 Years More Than 10 Years Total INTEREST-EARNING ASSETS: Mortgage and other loans (1) $ 6,520,686 $ 8,407,968 $ 15,009,998 $ 9,668,798 $ 3,110,910 $ 127,453 $ 42,845,813 Mortgage-related securities (2)(3) 367,911 451,525 880,988 478,446 599,285 260,170 3,038,325 Other securities (2) 1,932,993 287,878 53,716 103,846 1,094,060 16,520 3,489,013 Interest-earning cash and cash equivalents 1,790,684 — — — — — 1,790,684 Total interest-earning assets 10,612,274 9,147,371 15,944,702 10,251,090 4,804,255 404,143 51,163,835 INTEREST-BEARING LIABILITIES: Interest-bearing checking and money market accounts 7,474,907 916,477 1,660,309 945,532 1,612,848 — 12,610,073 Savings accounts 2,044,047 1,495,181 714,257 531,147 1,630,976 — 6,415,608 Certificates of deposit 3,689,590 5,435,058 1,017,840 187,907 285 — 10,330,680 Borrowed funds 788,926 697,661 5,375,000 800,000 8,280,000 141,957 16,083,544 Total interest-bearing liabilities 13,997,470 8,544,377 8,767,406 2,464,586 11,524,109 141,957 45,439,905 Interest rate sensitivity gap per period (4) $ (3,385,196 ) $ 602,994 $ 7,177,296 $ 7,786,504 $ (6,719,854 ) $ 262,186 $ 5,723,930 Cumulative interest rate sensitivity gap $ (3,385,196 ) $ (2,782,202 ) $ 4,395,094 $ 12,181,598 $ 5,461,744 $ 5,723,930 Cumulative interest rate sensitivity gap as a percentage of total assets (6.01 ) % (4.94 ) % 7.81 % 21.63 % 9.70 % 10.17 % Cumulative net interest-earning assets as a percentage of net interest-bearing liabilities 75.82 % 87.66 % 114.04 % 136.07 % 112.06 % 112.60 % Interest rate sensitivity is and betas. (dollars in thousands) Change in Interest Rates (in basis points) (1) Market Value of Assets Market Value of Liabilities Economic Value of Equity Net Change Estimated Percentage Change in Economic Value of Equity + 200 $ 53,316,881 $ 47,963,413 $ 5,353,468 $ (607,154 ) (10.19 ) % + 100 54,639,624 48,758,180 5,881,444 (79,178 ) (1.33 ) — 55,875,174 49,914,552 5,960,622 — — may or may not reflect the manner in which actual yields and costs respond to changes in market interest rates. In this regard, the Estimated Percentage Change in Future Net Interest Income -100 shock NII simulations. •Asset restructuring, involving sales of assets having higher risk profiles, or a gradual restructuring of the asset mix over time to affect the maturity or repricing schedule of assets; December 31, (in thousands, except share data) 2020 2019 ASSETS: Cash and cash equivalents $ 1,947,931 $ 741,870 Securities: Debt securities available-for-sale ($1,278,177 and $1,372,238 pledged at December 31, 2020 and 2019, respectively) 5,813,333 5,853,057 Equity investments with readily determinable fair values, at fair value 31,576 32,830 Total securities 5,844,909 5,885,887 Loans held for sale 117,136 — Loans and leases held for investment, net of deferred loan fees and costs 42,883,598 41,894,155 Less: Allowance for credit losses on loans and leases (194,043 ) (147,638 ) Total loans and leases, net 42,806,691 41,746,517 Federal Home Loan Bank stock, at cost 714,005 647,562 Premises and equipment, net 287,447 312,626 Operating lease right-of-use assets 266,864 286,194 Goodwill 2,426,379 2,426,379 Bank-owned life insurance 1,164,196 1,145,058 Other real estate owned and other repossessed assets 8,318 12,268 Other assets 839,380 436,460 Total assets $ 56,306,120 $ 53,640,821 LIABILITIES AND STOCKHOLDERS’ EQUITY: Deposits: Interest-bearing checking and money market accounts $ 12,610,073 $ 10,230,144 Savings accounts 6,415,608 4,780,007 Certificates of deposit 10,330,680 14,214,858 Non-interest-bearing accounts 3,080,452 2,432,123 Total deposits 32,436,813 31,657,132 Borrowed funds: Wholesale borrowings: Federal Home Loan Bank advances 14,627,661 13,102,661 Repurchase agreements 800,000 800,000 Total wholesale borrowings 15,427,661 13,902,661 Junior subordinated debentures 360,259 359,866 Subordinated notes 295,624 295,066 Total borrowed funds 16,083,544 14,557,593 Operating lease liabilities 266,846 285,991 Other liabilities 677,273 428,411 Total liabilities 49,464,476 46,929,127 Stockholders’ equity: Preferred stock at par $0.01 (5,000,000 shares authorized): Series A (515,000 shares issued and outstanding) 502,840 502,840 Common stock at par $0.01 (900,000,000 shares authorized; 490,439,070 and 490,439,070 shares issued; and 463,901,808 and 467,346,781 shares outstanding, respectively) 4,904 4,904 Paid-in capital in excess of par 6,122,690 6,115,487 Retained earnings 494,229 342,023 Treasury stock, at cost (26,537,262 and 23,092,289 shares, respectively) (257,541 ) (220,717 ) Accumulated other comprehensive loss, net of tax: Net unrealized gain (loss) on securities available for sale, net of tax of $(25,072) and $(9,424), respectively 66,880 25,440 Net unrealized loss on pension and post-retirement obligations, net of tax of $21,898 and $22,191, respectively (59,345 ) (59,136 ) Net unrealized (loss) gain on cash flow hedges, net of tax of $12,519 and $(333), respectively (33,013 ) 853 Total accumulated other comprehensive loss, net of tax (25,478 ) (32,843 ) Total stockholders’ equity 6,841,644 6,711,694 Total liabilities and stockholders’ equity $ 56,306,120 $ 53,640,821 Years Ended December 31, (in thousands, except per share data) 2020 2019 2018 INTEREST INCOME: Loans and leases $ 1,542,215 $ 1,553,004 $ 1,467,944 Securities and money market investments 165,778 252,156 221,729 Total interest income 1,707,993 1,805,160 1,689,673 INTEREST EXPENSE: Interest-bearing checking and money market accounts 56,939 174,347 167,972 Savings accounts 31,650 35,705 28,994 Certificates of deposit 217,413 320,234 182,383 Borrowed funds 301,849 317,474 279,329 Total interest expense 607,851 847,760 658,678 Net interest income 1,100,142 957,400 1,030,995 Provision for credit losses 62,228 7,105 18,256 Net interest income after provision for credit loan losses 1,037,914 950,295 1,012,739 NON-INTEREST INCOME: Fee income 22,026 29,297 29,765 Bank-owned life insurance 31,750 28,363 28,252 Net gain (loss) on securities 1,265 7,725 (1,994 ) Other 6,039 18,845 35,535 Total non-interest income 61,080 84,230 91,558 NON-INTEREST EXPENSE: Operating expenses: Compensation and benefits 300,914 301,697 317,496 Occupancy and equipment 85,887 89,174 100,107 General and administrative 124,389 120,347 129,025 Total non-interest expense 511,190 511,218 546,628 Income before income taxes 587,804 523,307 557,669 Income tax expense 76,695 128,264 135,252 Net income $ 511,109 $ 395,043 $ 422,417 Preferred stock dividends 32,828 32,828 32,828 Net income available to common shareholders $ 478,281 $ 362,215 $ 389,589 Basic earnings per common share $ 1.02 $ 0.77 $ 0.79 Diluted earnings per common share $ 1.02 $ 0.77 $ 0.79 Net income $ 511,109 $ 395,043 $ 422,417 Other comprehensive income (loss), net of tax: Change in net unrealized gain (loss) on securities available for sale, net of tax of $(15,836); $(17,669); and $31,345, respectively 41,935 45,934 (50,553 ) Change in pension and post-retirement obligations, net of tax of $1,660; $(2,307) and $(2,829) (5,359 ) 4,756 (27,113 ) Change in net unrealized (loss) gain on cash flow hedges, net of tax of $16,088 and $(376), respectively (42,397 ) 964 — Less: Reclassification adjustment for sales of available-for-sale securities, net of tax of $188; $1,527; and $(4), respectively (495 ) (3,918 ) 10 Reclassification adjustment for defined benefit pension plan, net of tax of $(1,953); $(2,726) and $(2,068), respectively 5,150 7,185 5,170 Reclassification adjustment for net gain on cash flow hedges included in net income, net of tax $(3,236) and $43, respectively 8,531 (111 ) — Total other comprehensive income (loss), net of tax 7,365 54,810 (72,486 ) Total comprehensive income, net of tax $ 518,474 $ 449,853 $ 349,931 (in thousands, except share data) Shares Outstanding Preferred Stock (Par Value: $0.01) Common Stock (Par Value: $0.01) Paid-in Capital in excess of Par Retained Earnings Treasury Stock, at Cost Accumulated Other Comprehensive Loss, Net of Tax Total Stockholders’ Equity Twelve Months Ended December 31, 2020 Balance at December 31, 2019 467,346,781 $ 502,840 $ 4,904 $ 6,115,487 $ 342,023 $ (220,717 ) $ (32,843 ) $ 6,711,694 Opening retained earnings adjustment (1) — — — — (10,468 ) — — (10,468 ) Adjusted balance, beginning of period 331,555 6,701,226 Shares issued for restricted stock, net of forfeitures 2,321,105 — — (22,198 ) — 22,198 — — Compensation expense related to restricted stock awards — — — 29,401 — — — 29,401 Net income — — — — 511,109 — — 511,109 Dividends paid on common stock ($0.68) — — — — (315,607 ) — — (315,607 ) Dividends paid on preferred stock ($63.76) — — — — (32,828 ) — — (32,828 ) Purchase of common stock (5,766,078 ) — — — — (59,022 ) — (59,022 ) Other comprehensive income, net of tax — — — — — -- 7,365 7,365 Balance at December 31, 2020 463,901,808 $ 502,840 $ 4,904 $ 6,122,690 $ 494,229 $ (257,541 ) $ (25,478 ) $ 6,841,644 Twelve Months Ended December 31, 2019 Balance at December 31, 2018 473,536,604 $ 502,840 $ 4,904 $ 6,099,940 $ 297,202 $ (161,998 ) $ (87,653 ) $ 6,655,235 Shares issued for restricted stock, net of forfeitures 1,665,028 — — (16,501 ) — 16,501 — — Compensation expense related to restricted stock awards — — — 32,048 — — — 32,048 Net income — — — — 395,043 — — 395,043 Dividends paid on common stock ($0.68) — — — — (317,394 ) — — (317,394 ) Dividends paid on preferred stock ($63.76) — — — — (32,828 ) — — (32,828 ) Purchase of common stock (7,854,851 ) — — — — (75,220 ) — (75,220 ) Other comprehensive loss, net of tax — — — — — — 54,810 54,810 Balance at December 31, 2019 467,346,781 $ 502,840 $ 4,904 $ 6,115,487 $ 342,023 $ (220,717 ) $ (32,843 ) $ 6,711,694 Twelve Months Ended December 31, 2018 Balance at December 31, 2017 488,490,352 $ 502,840 $ 4,891 $ 6,072,559 $ 237,868 $ (7,615 ) $ (15,167 ) $ 6,795,376 Shares issued for restricted stock, net of forfeitures 2,039,603 — 13 (8,879 ) — 8,866 — — Compensation expense related to restricted stock awards — — — 36,260 — — — 36,260 Net income — — — — 422,417 — — 422,417 Dividends paid on common stock ($0.68) — — — — (333,061 ) — — (333,061 ) Dividends paid on preferred stock ($63.76) — — — — (32,828 ) — — (32,828 ) Effect of adopting ASU No. 2016-01 — — — — 260 — — 260 Effect of adopting ASU No. 2018-02 — — — — 2,546 — (2,546 ) — Purchase of common stock (16,993,351 ) — — — — (163,249 ) — (163,249 ) Other comprehensive loss, net of tax — — — — — — (69,940 ) (69,940 ) Balance at December 31, 2018 473,536,604 $ 502,840 $ 4,904 $ 6,099,940 $ 297,202 $ (161,998 ) $ (87,653 ) $ 6,655,235 Years Ended December 31, (in thousands) 2020 2019 2018 CASH FLOWS FROM OPERATING ACTIVITIES: Net income $ 511,109 $ 395,043 $ 422,417 Adjustments to reconcile net income to net cash provided by operating activities: Provision for loan losses 62,228 7,105 18,256 Depreciation 23,871 27,096 32,323 Amortization of discounts and premiums, net 11,123 7,951 (3,891 ) Net (gain) loss on securities (1,265 ) (7,725 ) 14 Gain on trading activity (23 ) (66 ) (222 ) Net loss (gain) on sales of loans — 75 (111 ) Net gain on sales of fixed assets — (7,402 ) — Stock-based compensation 29,401 32,048 36,260 Deferred tax expense 219,342 100,813 23,197 Changes in operating assets and liabilities: (Increase) decrease in other assets(1) (411,074 ) (55,825 ) 29,952 Increase (decrease) in other liabilities(2) 8,619 10,571 (53,320 ) Purchases of securities held for trading (15,000 ) (42,500 ) (141,615 ) Proceeds from sales of securities held for trading 15,023 42,566 141,837 Origination of loans held for sale (119,158 ) — — Proceeds from sales of loans originated for sale — — 35,258 Net cash provided by operating activities 334,196 509,750 540,355 CASH FLOWS FROM INVESTING ACTIVITIES: Proceeds from repayment of securities available for sale 2,061,756 1,962,433 817,822 Proceeds from sales of securities available for sale 483,872 361,311 278,539 Purchase of securities available for sale (2,513,853 ) (2,503,248 ) (3,288,204 ) Redemption of Federal Home Loan Bank stock 172,544 135,906 120,220 Purchases of Federal Home Loan Bank stock (238,987 ) (138,878 ) (160,991 ) Proceeds from (purchases of) bank-owned life insurance, net 12,296 (138,119 ) 16,303 Proceeds from sales of loans 3,128 115,205 195,760 Purchases of loans (95,618 ) (864,299 ) — Other changes in loans, net (911,805 ) (998,515 ) (1,990,068 ) Dispositions (purchases) of premises and equipment, net 1,308 9,297 (9,847 ) Net cash used in investing activities (1,025,359 ) (2,058,907 ) (4,020,466 ) CASH FLOWS FROM FINANCING ACTIVITIES: Net increase in deposits 779,681 892,702 1,662,267 Net increase in short-term borrowed funds 1,150,000 1,100,000 — Proceeds from long-term borrowed funds 6,925,000 4,785,812 5,667,268 Repayments of long-term borrowed funds (6,550,000 ) (5,537,000 ) (4,373,500 ) Cash dividends paid on common stock (315,607 ) (317,394 ) (333,061 ) Cash dividends paid on preferred stock (32,828 ) (32,828 ) (32,828 ) Treasury stock repurchased (50,190 ) (67,125 ) (160,767 ) Payments relating to treasury shares received for restricted stock award tax payments (8,832 ) (8,095 ) (2,482 ) Net cash provided by financing activities 1,897,224 816,072 2,426,897 Net increase (decrease) in cash, cash equivalents, and restricted cash 1,206,061 (733,085 ) (1,053,214 ) Cash, cash equivalents, and restricted cash at beginning of year 741,870 1,474,955 2,528,169 Cash, cash equivalents, and restricted cash at end of year $ 1,947,931 $ 741,870 $ 1,474,955 Supplemental information: Cash paid for interest $ 632,660 $ 813,161 $ 645,588 Cash paid for income taxes 117,873 75,680 44,123 Non-cash investing and financing activities: Transfers to repossessed assets from loans $ 578 $ 4,689 $ 5,631 Operating lease liabilities arising from obtaining right-of-use assets as of January 1, 2019 — 324,360 — Securitization of residential mortgage loans to mortgage-backed securities available for sale 53,199 93,531 — Transfer of loans from held for investment to held for sale — 115,280 195,649 Disposition of premises and equipment — 1,245 — Shares issued for restricted stock awards 22,198 16,501 8,879 The Company has grown organically and through a series of accretive mergers and acquisitions, culminating in its acquisition of Flagstar Bancorp, Inc., which closed on December 1, 2022 and the Signature Transaction which closed on March 20, 2023. Signature Transaction. 2023 or December 31, 2022. Restricted cash totaled $134 million and $50 million at December 31, 2023 and December 31, 2022, respectively and includes cash that the Bank pledges as maintenance margin on centrally cleared derivatives and is included in other assets on the Consolidated Statements of Condition. FHLB-NY and FHLB-Indianapolis. loans and leases. and amortizes the net fee or cost as an adjustment to the loan yield over the term of the related loan. When a loan is sold or repaid, the remaining net unamortized fee or cost is recognized in interest income. Note 18 - Fair Value Measures. 2021. Income and Comprehensive Income, are based on a contractual monthly amount per loan including late fees and other ancillary income. rates. Years Ended December 31, (in thousands, except share and per share amounts) 2020 2019 2018 Net income available to common shareholders $ 478,281 $ 362,215 $ 389,589 Less: Dividends paid on and earnings allocated to participating securities (5,798 ) (4,333 ) (4,871 ) Earnings applicable to common stock $ 472,483 $ 357,882 $ 384,718 Weighted average common shares outstanding 462,605,341 465,380,010 487,287,872 Basic earnings per common share $ 1.02 $ 0.77 $ 0.79 Earnings applicable to common stock $ 472,483 $ 357,882 $ 384,718 Weighted average common shares outstanding 462,605,341 465,380,010 487,287,872 Potential dilutive common shares 676,061 283,322 — Total shares for diluted earnings per common share computation 463,281,402 465,663,332 487,287,872 Diluted earnings per common share and common share equivalents $ 1.02 $ 0.77 $ 0.79 Details about Accumulated Other Comprehensive Loss Reclassified out of Accumulated Other Comprehensive Loss Affected Line Item in the Consolidated Statements of Income and Comprehensive Income Unrealized gains on available-for-sale securities: Net gain on securities Income tax expense Net gain on securities, net of tax Unrealized gains on cash flow hedges: Interest expense Income tax benefit Net gain on cash flow hedges, net of tax Amortization of defined benefit pension plan items: Past service liability Actuarial losses Total before tax Income tax benefit Amortization of defined benefit pension plan items, net of tax Total reclassifications for the period (1)Amounts in parentheses indicate expense items. (2)See Note 20 - Employee Benefits for additional information. December 31, 2020 (in thousands) Amortized Cost Gross Unrealized Gain Gross Unrealized Loss Fair Value Debt securities available-for-sale Mortgage-Related Debt Securities: GSE certificates $ 1,155,436 $ 54,310 $ 136 $ 1,209,610 GSE CMOs 1,786,896 44,691 2,872 1,828,715 Total mortgage-related debt securities $ 2,942,332 $ 99,001 $ 3,008 $ 3,038,325 Other Debt Securities: U. S. Treasury obligations $ 64,984 $ 1 $ — $ 64,985 GSE debentures 1,158,253 3,998 3,949 1,158,302 Asset-backed securities (1) 530,226 2,576 5,703 527,099 Municipal bonds 25,776 625 90 26,311 Corporate bonds 870,745 17,928 6,447 882,226 Foreign notes 25,000 538 — 25,538 Capital trust notes 95,507 5,540 10,500 90,547 Total other debt securities $ 2,770,491 $ 31,206 $ 26,689 $ 2,775,008 Total debt securities available for sale $ 5,712,823 $ 130,207 $ 29,697 $ 5,813,333 Equity securities: Preferred stock 15,292 201 — 15,493 Mutual funds 15,814 269 — 16,083 Total equity securities $ 31,106 $ 470 $ — $ 31,576 Total securities (2) $ 5,743,929 $ 130,677 $ 29,697 $ 5,844,909 December 31, 2019 (in thousands) Amortized Cost Gross Unrealized Gain Gross Unrealized Loss Fair Value Debt securities available-for-sale Mortgage-Related Debt Securities: GSE certificates $ 1,530,317 $ 26,069 $ 3,763 $ 1,552,623 GSE CMOs 1,783,440 21,213 3,541 1,801,112 Total mortgage-related debt securities $ 3,313,757 $ 47,282 $ 7,304 $ 3,353,735 Other Debt Securities: U. S. Treasury obligations $ 41,820 $ 19 $ — $ 41,839 GSE debentures 1,093,845 5,707 5,312 1,094,240 Asset-backed securities (1) 384,108 — 10,854 373,254 Municipal bonds 26,808 559 475 26,892 Corporate bonds 854,195 15,970 2,983 867,182 Capital trust notes 95,100 7,121 6,306 95,915 Total other debt securities $ 2,495,876 $ 29,376 $ 25,930 $ 2,499,322 Total other securities available for sale $ 5,809,633 $ 76,658 $ 33,234 $ 5,853,057 Equity securities: Preferred stock 15,292 122 — 15,414 Mutual funds and common stock (2) 16,871 718 173 17,416 Total equity securities $ 32,163 $ 840 $ 173 $ 32,830 Total securities (3) $ 5,841,796 $ 77,498 $ 33,407 $ 5,885,887 (1)The underlying assets of the asset-backed securities are substantially guaranteed by the U.S. Government. (2)Excludes accrued interest receivable of $38 million included in other assets in the Consolidated Statements of Condition. At December 31, In addition, at December 31, 2023 and December 31, 2022, the Company had $203 million and $176 million of Federal Reserve Bank stock, respectively. December 31, (in thousands) 2020 2019 2018 Gross proceeds $ 483,872 $ 361,311 $ 278,539 Gross realized gains 1,945 5,445 967 Gross realized losses 1,262 — 981 Mortgage- Related Securities Average Yield U.S. Government and GSE Obligations Average Yield State, County, and Municipal Average Yield (1) Other Debt Securities (2) Average Yield Fair Value (dollars in thousands) Available-for-Sale Debt Securities: Due within one year $ 49,797 3.03 % $ 75,934 0.56 % $ — — % $ 49,704 3.02 $ 176,720 Due from one to five years 405,157 3.16 21,924 3.52 — — 151,873 2.22 615,048 Due from five to ten years 175,689 2.48 138,053 2.37 19,898 3.51 779,401 1.88 1,130,037 Due after ten years 2,311,689 2.15 987,326 1.60 5,878 3.33 540,500 1.29 3,891,528 Total debt securities available for sale $ 2,942,332 2.32 $ 1,223,237 1.66 $ 25,776 3.47 $ 1,521,478 1.74 $ 5,813,333 Less than Twelve Months Twelve Months or Longer Total (in thousands) Fair Value Unrealized Loss Fair Value Unrealized Loss Fair Value Unrealized Loss Temporarily Impaired Securities: U. S. Treasury obligations $ — $ — $ — $ — $ — $ — GSE certificates 58,876 136 — — 58,876 136 GSE CMOs 442,207 2,807 73,568 65 515,775 2,872 GSE debenture 522,441 3,949 — — 522,441 3,949 Asset-backed securities — — 363,618 5,703 363,618 5,703 Municipal bonds — — 8,891 90 8,891 90 Corporate bonds 72,024 2,976 246,528 3,471 318,552 6,447 Foreign notes — — — — — — Capital trust notes — — 33,393 10,500 33,393 10,500 Equity securities — — — — — — Total temporarily impaired securities $ 1,095,548 $ 9,868 $ 725,998 $ 19,829 $ 1,821,546 $ 29,697 Less than Twelve Months Twelve Months or Longer Total (in thousands) Fair Value Unrealized Loss Fair Value Unrealized Loss Fair Value Unrealized Loss Temporarily Impaired Securities: U. S. Treasury Obligations $ 11,917 $ - $ - $ - $ 11,917 $ - GSE debentures 297,179 3,916 138,189 1,396 435,368 5,312 GSE certificates 396,930 3,718 7,542 45 404,472 3,763 GSE CMOs 609,502 2,582 133,955 959 743,457 3,541 Asset-backed securities 256,619 7,701 116,635 3,154 373,254 10,855 Municipal bonds — — 9,349 475 9,349 475 Corporate bonds 99,300 700 172,717 2,282 272,017 2,982 Capital trust notes — — 37,525 6,306 37,525 6,306 Equity securities — — 11,633 173 11,633 173 Total temporarily impaired securities $ 1,671,447 $ 18,617 $ 627,545 $ 14,790 $ 2,298,992 $ 33,407 bond. We December 31, 2020 December 31, 2019 (dollars in thousands) Amount Percent of Loans Held for Investment Amount Percent of Loans Held for Investment Loans and Leases Held for Investment: Mortgage Loans: Multi-family $ 32,236,385 75.28 % $ 31,158,672 74.46 % Commercial real estate 6,835,763 15.96 7,081,910 16.93 One-to-four family 235,989 0.55 380,361 0.91 Acquisition, development, and construction 89,790 0.21 200,596 0.48 Total mortgage loans held for investment (1) 39,397,927 92.00 38,821,539 92.78 Other Loans: Commercial and industrial 1,682,519 3.93 1,742,380 4.16 Lease financing, net of unearned income of $116,366 and $104,826, respectively 1,734,824 4.05 1,271,998 3.04 Total commercial and industrial loans (2) 3,417,343 7.98 3,014,378 7.20 Other 6,520 0.02 8,102 0.02 Total other loans held for investment 3,423,863 8.00 3,022,480 7.22 Total loans and leases held for investment (1) $ 42,821,790 100.00 % $ 41,844,019 100.00 % Net deferred loan origination costs 61,808 50,136 Allowance for loan and lease losses (194,043 ) (147,638 ) Total loans and leases held for investment, net $ 42,689,555 $ 41,746,517 Loans held for sale (3) 117,136 — Total loans and leases, net $ 42,806,691 $ 41,746,517 (2) Includes we intend to sell. We have elected the fair value option for nearly all of this portfolio, except the SBA loans. We estimate the fair value of mortgage loans based on quoted market prices for securities backed by similar types of loans, where available, or by discounting estimated cash flows using observable inputs inclusive of interest rates, prepayment speeds and loss assumptions for similar collateral. (in thousands) Loans 30-89 Days Past Due Non- Accrual Loans Loans 90 Days or More Delinquent and Still Accruing Interest Total Past Due Loans Current Loans Total Loans Receivable Multi-family $ 4,091 $ 4,068 $ — $ 8,159 $ 32,228,226 $ 32,236,385 Commercial real estate 9,989 12,142 — 22,131 6,813,632 6,835,763 One-to-four family 1,575 1,696 — 3,271 232,718 235,989 Acquisition, development, and construction — — — — 89,790 89,790 Commercial and industrial(1) (2) — 19,866 — 19,866 3,397,477 3,417,343 Other 3 13 — 16 6,504 6,520 Total $ 15,658 $ 37,785 $ — $ 53,443 $ 42,768,347 $ 42,821,790 (in thousands) Loans 30-89 Days Past Due Non- Accrual Loans Loans 90 Days or More Delinquent and Still Accruing Interest Total Past Due Loans Current Loans Total Loans Receivable Multi-family $ 1,131 $ 5,407 $ — $ 6,538 $ 31,152,134 $ 31,158,672 Commercial real estate 2,545 14,830 — 17,375 7,064,535 7,081,910 One-to-four family — 1,730 — 1,730 378,631 380,361 Acquisition, development, and construction — — — — 200,596 200,596 Commercial and industrial(1) (2) — 39,024 — 39,024 2,975,354 3,014,378 Other 44 252 — 296 7,806 8,102 Total $ 3,720 $ 61,243 $ — $ 64,963 $ 41,779,056 $ 41,844,019 Mortgage Loans Other Loans (in thousands) Multi- Family Commercial Real Estate One-to- Four Family Acquisition, Development, and Construction Total Mortgage Loans Commercial and Industrial(1) Other Total Other Loans Credit Quality Indicator: Pass $ 31,220,071 $ 5,884,244 $ 221,861 $ 68,233 $ 37,394,409 $ 3,388,293 $ 6,507 $ 3,394,800 Special mention 566,756 637,101 12,436 21,557 1,237,850 2,842 — 2,842 Substandard 449,558 314,418 1,692 — 765,668 26,208 13 26,221 Doubtful — — — — — — — — Total $ 32,236,385 $ 6,835,763 $ 235,989 $ 89,790 $ 39,397,927 $ 3,417,343 $ 6,520 $ 3,423,863 Mortgage Loans Other Loans (in thousands) Multi- Family Commercial Real Estate One-to- Four Family Acquisition, Development, and Construction Total Mortgage Loans Commercial and Industrial(1) Other Total Other Loans Credit Quality Indicator: Pass $ 30,903,657 $ 6,902,218 $ 377,883 $ 158,751 $ 38,342,509 $ 2,960,557 $ 7,850 $ 2,968,407 Special mention 239,664 104,648 748 41,456 386,516 1,588 — 1,588 Substandard 15,351 75,044 1,730 389 92,514 52,233 252 52,485 Doubtful — — — — — — — Total $ 31,158,672 $ 7,081,910 $ 380,361 $ 200,596 $ 38,821,539 $ 3,014,378 $ 8,102 $ 3,022,480 (in thousands) Vintage Year Risk Rating Group 2020 2019 2018 2017 2016 Prior To 2016 Revolving Loans Total Pass $ 9,819,431 $ 6,719,587 $ 5,986,476 $ 4,260,433 $ 3,062,012 $ 7,571,266 $ 24,608 $ 37,443,813 Special Mention 13,067 116,400 176,428 164,635 332,176 425,632 - 1,228,338 Substandard - 121,861 177,123 60,924 221,835 172,293 - 754,036 Total mortgage loans $ 9,832,498 $ 6,957,848 $ 6,340,027 $ 4,485,992 $ 3,616,023 $ 8,169,191 $ 24,608 $ 39,426,187 Pass 962,956 757,220 180,133 209,963 126,680 144,999 1,046,400 3,428,351 Special Mention - 42 - - - - 2,800 2,842 Substandard 2,987 5,284 3,103 12,558 1,252 1,034 - 26,218 Total other loans 965,943 762,546 183,236 222,521 127,932 146,033 1,049,200 3,457,411 Total $ 10,798,441 $ 7,720,394 $ 6,523,263 $ 4,708,513 $ 3,743,955 $ 8,315,224 $ 1,073,808 $ 42,883,598 Collateral Type (in thousands) Real Property Other Multi-family $ 7,525 $ — Commercial real estate 25,462 — One-to-four family 557 — Acquisition, development, and construction — — Commercial and industrial — 26,487 Other — — Total collateral-dependent loans held for investment $ 33,544 26,487 2023. December 31, (in thousands) 2020 2019 2018 Interest income that would have been recorded $ 4,491 $ 5,599 $ 4,145 Interest income actually recorded (939 ) (3,409 ) (3,480 ) Interest income foregone $ 3,552 $ 2,190 $ 665 In determining the Company’s allowance for credit losses on loans and leases, reasonably expected TDRs were individually evaluated and consist of criticized, classified, or maturing loans that will have a modification processed within the next three months. December 31, 2020 December 31, 2019 (in thousands) Accruing Non- Accrual Total Accruing Non- Accrual Total Loan Category: Multi-family $ - $ - $ - - 3,577 3,577 Commercial real estate 14,967 - 14,967 - - - One-to-four family - 557 557 - 584 584 Acquisition, development, and construction - - - 389 - 389 Commercial and industrial (1) - 18,761 18,761 865 35,084 35,949 Total $ 14,967 $ 19,318 $ 34,285 1,254 39,245 40,499 For the Twelve Months Ended December 31, 2020 Weighted Average Interest Rate (dollars in thousands) Number of Loans Pre- Modification Recorded Investment Post- Modification Recorded Investment Pre- Modification Post- Modification Charge- off Amount Capitalized Interest Loan Category: Commercial real estate 1 $ 15,119 $ 15,119 8.00 % 3.50 % $ - $ - Commercial and industrial 42 8,912 7,471 2.36 2.23 1,441 - Total 43 $ 24,031 $ 22,590 $ 1,441 $ - For the Twelve Months Ended December 31, 2019 Weighted Average Interest Rate (dollars in thousands) Number of Loans Pre- Modification Recorded Investment Post- Modification Recorded Investment Pre- Modification Post- Modification Charge- off Amount Capitalized Interest Loan Category: One-to-four family 1 131 131 5.50 5.50 — 3 Commercial and industrial 72 35,156 30,685 4.31 4.37 4,471 — Total 73 $ 35,287 $ 30,816 $ 4,471 $ 3 For the Twelve Months Ended December 31, 2018 Weighted Average Interest Rate (dollars in thousands) Number of Loans Pre- Modification Recorded Investment Post- Modification Recorded Investment Pre- Modification Post- Modification Charge- off Amount Capitalized Interest Loan Category: Acquisition, development, and construction 1 $ 900 $ 900 4.50 % 4.50 % $ — $ — Commercial and industrial 21 7,763 5,455 3.25 3.13 2,308 — Total 22 $ 8,663 $ 6,355 $ 2,308 $ — Twelve Months Ended December 31, 2020 2019 (in thousands) Mortgage Other Total Mortgage Other Total Balance, beginning of period $ 122,694 $ 24,944 $ 147,638 $ 130,983 $ 28,837 $ 159,820 Impact of CECL adoption 99 1,812 1,911 — — — Adjusted balance, beginning of period 122,793 26,756 149,549 130,983 28,837 159,820 Charge-offs (1,872 ) (20,306 ) (22,178 ) (1,613 ) (18,694 ) (20,307 ) Recoveries 1,172 2,221 3,393 61 959 1,020 Provision for (recovery of) credit losses on loans and leases 54,445 8,834 63,279 (6,737 ) 13,842 7,105 Balance, end of period $ 176,538 $ 17,505 $ 194,043 $ 122,694 $ 24,944 $ 147,638 $23 million, respectively. (in thousands) Recorded Investment Related Allowance Interest Income Recognized Nonaccrual loans with no related allowance: Multi-family $ — $ — $ — Commercial real estate 2,256 — — One-to-four family 557 — 21 Acquisition, development, and construction — — — Other 19,821 — 820 Total nonaccrual loans with no related allowance $ 22,634 $ — $ 841 Nonaccrual loans with an allowance recorded: Multi-family $ 4,068 $ 589 $ 28 Commercial real estate 9,886 133 52 One-to-four family 1,139 370 14 Acquisition, development, and construction — — — Other 58 18 5 Total nonaccrual loans with an allowance recorded $ 15,151 $ 1,110 $ 99 Total nonaccrual loans: Multi-family $ 4,068 $ 589 $ 28 Commercial real estate 12,142 133 52 One-to-four family 1,696 370 35 Acquisition, development, and construction — — — Other 19,879 18 825 Total nonaccrual loans $ 37,785 $ 1,110 $ 940 (in thousands) Recorded Investment Unpaid Principal Balance Related Allowance Average Recorded Investment Interest Income Recognized Impaired loans with no related allowance: Multi-family $ 3,577 $ 6,790 $ — $ 4,336 $ 266 Commercial real estate 14,717 19,832 — 6,140 371 One-to-four family 584 602 — 811 21 Acquisition, development, and construction 389 1,289 — 3,508 364 Other 37,669 114,636 — 39,598 2,494 Total impaired loans with no related allowance $ 56,936 $ 143,149 $ — $ 54,393 $ 3,516 Impaired loans with an allowance recorded: Multi-family $ — $ — $ — $ — $ — Commercial real estate — — — — — One-to-four family — — — — — Acquisition, development, and construction — — — — — Other 1,445 4,173 116 4,111 13 Total impaired loans with an allowance recorded $ 1,445 $ 4,173 $ 116 $ 4,111 $ 13 Total impaired loans: Multi-family $ 3,577 $ 6,790 $ — $ 4,336 $ 266 Commercial real estate 14,717 19,832 — 6,140 371 One-to-four family 584 602 — 811 21 Acquisition, development, and construction 389 1,289 — 3,508 364 Other 39,114 118,809 116 43,709 2,507 Total impaired loans $ 58,381 $ 147,322 $ 116 $ 58,504 $ 3,529 another party. Impairment of residual values arises if the expected fair value is less than the carrying amount. The Company assesses its net investment in lease financing receivables (including residual values) for impairment on an annual basis with any impairment losses recognized in accordance with the impairment guidance for financial instruments. As such, net investment in lease financing receivables may be reduced by an allowance for credit losses with changes recognized as provision expense. On certain lease financings, the Company obtains residual value insurance from third parties to manage and reduce the risk associated with the residual value of the leased assets. At December 31, (in thousands) For the Twelve Months ended December 31, 2020 For the Twelve Months Ended December 31, 2019 Interest income on lease financing (1) $ 52,279 $ 38,087 (1)Included in Interest Income – Loans and leases in the Consolidated Statements of Income and Comprehensive Income. (in thousands) December 31, 2020 December 31, 2019 Net investment in the lease - lease payments receivable $ 1,771,097 $ 1,302,760 Net investment in the lease - unguaranteed residual assets 80,093 74,064 Total lease payments $ 1,851,190 $ 1,376,824 (in thousands) December 31, 2020 2021 $ 37,373 2022 171,549 2023 277,468 2024 111,378 2025 430,585 Thereafter 822,837 Total lease payments 1,851,190 Plus: deferred origination costs 32,008 Less: unearned income (116,366 ) Total lease finance receivables, net $ 1,766,832 (in thousands) For the Twelve Months Ended December 31, 2020 For the Twelve Months Ended December 31, 2019 Operating lease cost $ 22,721 $ 28,695 Sublease income (68 ) (105 ) Total lease cost $ 22,653 $ 28,590 (in thousands) For the Twelve Months Ended December 31, 2020 For the Twelve Months Ended December 31, 2019 Cash paid for amounts included in the measurement of lease liabilities: Operating cash flows from operating leases $ 22,721 $ 28,695 (in thousands, except lease term and discount rate) December 31, 2020 December 31, 2019 Operating Leases: Operating lease right-of-use assets 266,864 $ 286,194 Operating lease liabilities 266,846 285,991 Weighted average remaining lease term 16 years 17 years Weighted average discount rate% 3.12 % 3.23 % (in thousands) Maturities of lease liabilities: December 31, 2020 2021 $ 26,961 2022 25,994 2023 25,545 2024 24,884 2025 24,113 Thereafter 223,503 Total lease payments 351,000 Less: imputed interest (84,154 ) Total present value of lease liabilities $ 266,846 December 31, 2020 2019 (dollars in thousands) Amount Percent of Total Weighted Average Interest Rate Amount Percent of Total Weighted Average Interest Rate Interest-bearing checking and money market accounts $ 12,610,073 38.87 % 0.28 % $ 10,230,144 32.32 % 1.30 % Savings accounts 6,415,608 19.78 0.41 4,780,007 15.10 0.75 Certificates of deposit 10,330,680 31.85 0.83 14,214,858 44.90 2.30 Non-interest-bearing accounts 3,080,452 9.50 — 2,432,123 7.68 — Total deposits $ 32,436,813 100.00 % 0.45 % $ 31,657,132 100.00 % 1.57 % 1 year or less More than 1 year through 2 years More than 2 years through 3 years More than 3 years through 4 years More than 4 years through 5 years Over 5 years CDs of $100,000 or More Maturing Within (in thousands) 3 Months or Less Over 3 to 6 Months Over 6 to 12 Months Over 12 Months Total Total $ 2,548,901 $ 3,094,530 $ 717,291 $ 384,860 $ 6,745,582 December 31, (in thousands) 2020 2019 Wholesale borrowings: FHLB advances $ 14,627,661 $ 13,102,661 Repurchase agreements 800,000 800,000 Total wholesale borrowings $ 15,427,661 $ 13,902,661 Junior subordinated debentures 360,259 359,866 Subordinated notes 295,624 295,066 Total borrowed funds $ 16,083,544 $ 14,557,593 Contractual Maturity Earlier of Contractual Maturity or Next Call Date (dollars in thousands) Year Amount Weighted Average Interest Rate (1) Amount Weighted Average Interest Rate (1) 2021 $ 3,272,661 0.87 % $ 8,952,661 1.73 % 2022 550,000 1.31 2,150,000 1.43 2023 2,525,000 0.85 2,725,000 0.91 2024 800,000 0.53 800,000 0.53 2028 4,350,000 2.40 — — 2029 3,130,000 1.55 — — Total FHLB advances $ 14,627,661 1.47 $ 14,627,661 1.47 3.48 percent. Contractual Maturity Earlier of Contractual Maturity or Next Call Date (dollars in thousands) Year Amount Weighted Average Interest Rate Amount Weighted Average Interest Rate 2021 $ — — % $ 400,000 2.31 % 2022 — — 400,000 2.16 2028 300,000 2.37 — — 2029 500,000 2.16 — — $ 800,000 2.24 $ 800,000 2.24 Mortgage-Related and Other Securities GSE Debentures and U.S. Treasury Obligations (dollars in thousands) Period of Maturity Amount Weighted Average Interest Rate Amortized Cost Fair Value Amortized Cost Fair Value Greater than 90 days $ 800,000 2.24 % $ 286,198 $ 304,261 $ 571,182 $ 573,344 2023 and December 31, 2022. securities, excluding purchase accounting adjustments. Issuer Interest Rate of Capital Securities and Debentures Junior Subordinated Debentures Amount Outstanding Capital Securities Amount Outstanding Date of Original Issue Stated Maturity First Optional Redemption Date (dollars in thousands) New York Community Capital Trust V (BONUSESSM Units) 6.00 % $ 146,333 $ 139,982 Nov. 4, 2002 Nov. 1, 2051 Nov. 4, 2007 (1) New York Community Capital Trust X 1.82 123,712 120,000 Dec. 14, 2006 Dec. 15, 2036 Dec. 15, 2011 (2) PennFed Capital Trust III 3.47 30,928 30,000 June 2, 2003 June 15, 2033 June 15, 2008 (2) New York Community Capital Trust XI 1.89 59,286 57,500 April 16, 2007 June 30, 2037 June 30, 2012 (2) Total junior subordinated debentures $ 360,259 $ 347,482 The Bifurcated Option Note Unit SecuritiESSM (“BONUSES units”) included in the preceding table were issued by the Company on November 4, 2002 at a public offering price of $50.00 per share. Each of the 5,500,000 BONUSES units offered consisted of a capital security issued by New York Community Capital Trust V, a trust formed by the Company, and a warrant to purchase 2.4953 shares of the common stock of the Company (for a total of approximately Date of Original Issue Stated Maturity Interest Rate(1) Original Issue Amount (dollars in thousands) Nov. 6, 2018 Nov. 6, 2028 5.90 % $ 300,000 (1)From and including the date of original issuance to, but excluding November 6, 2023, the Notes will bear interest at an initial rate of 5.90 percent per annum payable semi-annually. Unless redeemed, from and including November 6, 2023 to but excluding the maturity date, the interest rate will reset quarterly to an annual interest rate equal to the then-current three-month SOFR rate plus 304.16 basis points payable quarterly. Local Taxes December 31, (in thousands) 2020 2019 Deferred Tax Assets: Allowance for credit losses on loans and leases $ 53,260 $ 40,584 Compensation and related benefit obligations 20,760 19,401 Non-accrual interest 672 624 Net operating loss carryforwards 5,682 19,750 Other 17,240 12,169 Gross deferred tax assets 97,614 92,528 Valuation allowance — — Deferred tax asset after valuation allowance $ 97,614 $ 92,528 Deferred Tax Liabilities: Amortizable intangibles $ (2,775 ) $ (2,480 ) Acquisition accounting and fair value adjustments on securities (including OTTI) (12,407 ) (9,742 ) Premises and equipment (6,385 ) (7,578 ) Prepaid pension cost (24,412 ) (22,739 ) Fair value adjustments on loans (92,340 ) (3,209 ) Leases (370,305 ) (237,429 ) Other (8,880 ) (10,782 ) Gross deferred tax liabilities $ (517,504 ) $ (293,959 ) Net deferred tax liability $ (419,890 ) $ (201,431 ) December 31, (in thousands) 2020 2019 2018 Federal – current $ (147,691 ) $ 4,069 $ 89,187 State and local – current 5,044 23,382 22,868 Total current (142,647 ) 27,451 112,055 Federal – deferred 189,826 100,971 13,058 State and local – deferred 29,516 (158 ) 10,139 Total deferred 219,342 100,813 23,197 Income tax expense reported in net income 76,695 128,264 135,252 Income tax expense reported in stockholders’ equity related to: Securities available-for-sale 15,648 16,142 (32,162 ) Pension liability adjustments 293 5,033 4,897 Cash flow hedge (12,852 ) 333 — Non-credit portion of OTTI losses — 0 821 Adoption of ASU 2016-13 (3,972 ) — — Total income taxes $ 75,812 149,772 108,808 December 31, (in thousands) 2020 2019 2018 Statutory federal income tax at 21%, 21% and 21%, respectively $ 123,439 $ 109,894 $ 117,111 State and local income taxes, net of federal income tax effect 27,303 18,346 24,451 Effect of tax law changes (73,103 ) — 1,625 Non-deductible FDIC deposit insurance premiums 7,857 6,938 8,852 Effect of tax deductibility of ESOP (3,208 ) (3,163 ) (3,116 ) Non-taxable income and expense of BOLI (6,726 ) (5,981 ) (5,957 ) Federal tax credits (1,290 ) (750 ) (531 ) Adjustments relating to prior tax years 634 373 (7,246 ) Other, net 1,789 2,607 63 Total income tax expense $ 76,695 $ 128,264 $ 135,252 The Company invests in affordable housing projects through limited partnerships that generate federal Low Income Housing Tax Credits. The balances of these investments, which are included in “Other assets” in the Consolidated Statements of Condition, were 2021. 2022. December 31, (in thousands) 2020 2019 2018 Uncertain tax positions at beginning of year $ 35,749 $ 33,357 $ 33,681 Additions for tax positions relating to current-year operations 830 925 — Additions for tax positions relating to prior tax years 1,547 2,036 1,660 Subtractions for tax positions relating to prior tax years (306 ) (569 ) (1,984 ) Reductions in balance due to settlements — — — Uncertain tax positions at end of year $ 37,820 $ 35,749 $ 33,357 •Federal tax filings for tax years 2019 through the present; •New York State tax filings for tax years 2010 through the present; •New York City tax filings for tax years 2011 through the present; and •Federal 2019-2020 It is reasonably possible that there will be developments within the next twelve months that would necessitate an adjustment to the balance of unrecognized tax benefits, including decreases of up to 2023. (in thousands) December 31, 2020 December 31, 2019 Line Item in the Consolidated Statements of Condition in which the Hedge Item is Included Carrying Amount of the Hedged Assets Cumulative Amount of Fair Value Hedging Adjustments Included in the Carrying Amount of the Hedged Assets Carrying Amount of the Hedged Assets Cumulative Amount of Fair Value Hedging Adjustments Included in the Carrying Amount of the Hedged Assets Total loans and leases, net (1) $ 2,073,214 $ 73,214 $ 2,053,483 $ 53,483 (in thousands) For the Twelve Months Ended December 31, 2020 For the Twelve Months Ended December 31, 2019 Derivative – interest rate swap: Interest income $ (19,731 ) $ (53,483 ) Hedged item – loans: Interest income $ 19,731 $ 53,483 earnings. (dollars in thousands) December 31, 2020 December 31, 2019 Notional amounts $ 2,250,000 $ 800,000 Cash collateral posted 45,532 1,185 Weighted average pay rates 1.27% 1.62 % Weighted average receive rates 0.23% 1.90 % Weighted average maturity 1.9 years 2.5 years The following table presents the effect of the Company’s cash flow derivative instruments on (in thousands) For the Twelve Months Ended December 31, 2020 For the Twelve Months Ended December 31, 2019 Amount of (loss) gain recognized in AOCL $ (58,484 ) $ 1,340 Amount of reclassified from AOCL to interest expense 11,768 (154 ) out of AOCL. Hedging Instruments The following table (in thousands) Expires Within One Year Expires After One Year Total Outstanding Amount Maximum Potential Amount of Future Payments Financial stand-by letters of credit $ 164,498 $ 50,724 $ 215,222 $ 354,225 Performance stand-by letters of credit 3,351 - 3,351 3,351 Commercial letters of credit 3,860 1,038 4,898 18,300 Total letters of credit $ 171,709 $ 51,762 $ 223,471 $ 375,876 December 31, (in thousands) 2020 2019 Change in Benefit Obligation: Benefit obligation at beginning of year $ 159,896 $ 143,235 Interest cost 4,692 5,660 Actuarial loss (gain) 14,629 18,806 Annuity payments (6,510 ) (6,473 ) Settlements (575 ) (1,332 ) Benefit obligation at end of year $ 172,132 $ 159,896 Change in Plan Assets: Fair value of assets at beginning of year $ 242,558 $ 210,246 Actual return (loss) on plan assets 25,557 40,117 Contributions -- -- Annuity payments (6,510 ) (6,473 ) Settlements (575 ) (1,332 ) Fair value of assets at end of year $ 261,030 $ 242,558 Funded status (included in “Other assets”) $ 88,898 $ 82,662 Changes recognized in other comprehensive income for the year ended December 31: Amortization of prior service cost $ - $ — Amortization of actuarial loss (7,327 ) (10,035 ) Net actuarial (gain) loss arising during the year 4,577 (7,378 ) Total recognized in other comprehensive income for the year (pre-tax) $ (2,750 ) $ (17,413 ) Accumulated other comprehensive loss (pre-tax) not yet recognized in net periodic benefit cost at December 31: Prior service cost $ - $ — Actuarial loss, net 73,017 75,767 Total accumulated other comprehensive loss (pre-tax) $ 73,017 $ 75,767 Years Ended December 31, (in thousands) 2020 2019 2018 Components of net periodic pension expense (credit): Interest cost $ 4,692 $ 5,660 $ 5,085 Expected return on plan assets (15,505 ) (13,933 ) (16,139 ) Amortization of net actuarial loss 7,327 10,035 7,179 Net periodic pension (credit) expense $ (3,486 ) $ 1,762 $ (3,875 ) Years Ended December 31, 2020 2019 2018 Discount rate 3.0 % 4.1 % 3.4 % Expected rate of return on plan assets 6.5 6.8 7.0 (in thousands) Total Quoted Prices in Active Markets for Identical Assets (Level 1) Significant Other Observable Inputs (Level 2) Significant Unobservable Inputs (Level 3) Equity: Large-cap value (1) $ 23,206 $ — $ 23,206 $ — Large-cap growth (2) 22,997 — 22,997 — Large-cap core (3) 15,146 — 15,146 — Mid-cap value (4) 4,509 — 4,509 — Mid-cap growth (5) 6,316 — 6,316 — Mid-cap core (6) 5,113 — 5,113 — Small-cap value (7) 3,307 — 3,307 — Small-cap growth (8) 8,674 — 8,674 — Small-cap core (9) 3,400 — 3,400 — International equity (10) 32,248 — 32,248 — Fixed Income Funds: Fixed Income – U.S. Core (11) 74,523 — 74,523 — Intermediate duration (12) 24,953 — 24,953 — Equity Securities: Company common stock 31,401 31,401 — — Cash Equivalents: Money market * 5,237 2,321 2,916 — $ 261,030 $ 33,722 $ 227,308 $ — At December 31, 2020 2019 Equity securities 60 % 58 % Debt securities 38 40 Cash equivalents 2 2 Total 100 % 100 % (in thousands) 2021 $ 7,995 2022 8,073 2023 8,060 2024 8,302 2025 8,567 2026 and thereafter 43,728 Total $ 84,725 December 31, (in thousands) 2020 2019 Change in benefit obligation: Benefit obligation at beginning of year $ 11,898 $ 13,583 Interest cost 327 512 Actuarial gain 238 (1,233 ) Premiums and claims paid (614 ) (964 ) Benefit obligation at end of year $ 11,849 11,898 Change in plan assets: Fair value of assets at beginning of year $ - $ — Employer contribution 614 964 Premiums and claims paid (614 ) (964 ) Fair value of assets at end of year $ - $ — Funded status (included in “Other liabilities”) $ (11,849 ) (11,898 ) Changes recognized in other comprehensive income for the year ended December 31: Amortization of prior service cost $ 249 $ 249 Amortization of actuarial gain (25 ) (124 ) Net actuarial (gain) loss arising during the year 238 (1,234 ) Total recognized in other comprehensive income for the year (pre-tax) $ 462 $ (1,109 ) Accumulated other comprehensive loss (pre-tax) not yet recognized in net periodic benefit cost at December 31: Prior service cost $ (287 ) $ (536 ) Actuarial loss, net 1,679 1,466 Total accumulated other comprehensive income (pre-tax) $ 1,392 $ 930 Years Ended December 31, (in thousands) 2020 2019 2018 Components of Net Periodic Benefit Cost: Service cost $ — $ — $ — Interest cost 327 512 513 Amortization of past-service liability (249 ) (249 ) (249 ) Amortization of net actuarial loss 25 124 309 Net periodic benefit cost $ 103 $ 387 $ 573 Years Ended December 31, 2020 2019 2018 Discount rate 2.9 % 3.9 % 3.3 % Current medical trend rate 6.5 6.5 6.5 Ultimate trend rate 5.0 5.0 5.0 Year when ultimate trend rate will be reached 2026 2025 2024 (in thousands) 2021 $ 915 2022 881 2023 851 2024 820 2025 789 2026 and thereafter 3,451 Total $ 7,707 For the Year Ended December 31, 2020 Number of Shares Weighted Average Grant Date Fair Value Unvested at beginning of year 6,516,101 $ 13.31 Granted 2,421,345 11.61 Vested (2,180,891 ) 14.06 Canceled (528,507 ) 12.88 Unvested at end of year 6,228,048 12.43 GAAP sets forth a definition of fair value, establishes a consistent framework for measuring fair value, and requires disclosure for each major asset and liability category measured at fair value on either a recurring or non-recurring basis. GAAP also clarifies that fair value is an “exit” price, representing the amount that would be received when selling an asset, or paid when transferring a liability, in an orderly transaction between market participants. Fair value is thus a market-based measurement that should be determined based on assumptions that market participants would use in pricing an asset or liability. As a basis for considering such assumptions, GAAP establishes a three-tier fair value hierarchy, which prioritizes the inputs used in measuring fair value as follows: •Level 1 – Inputs to the valuation methodology are quoted prices (unadjusted) for identical assets or liabilities in active markets. Fair Value Measurements at December 31, 2020 (in thousands) Quoted Prices in Active Markets for Identical Assets (Level 1) Significant Other Observable Inputs (Level 2) Significant Unobservable Inputs (Level 3) Netting Adjustments Total Fair Value Assets: Mortgage-related Debt Securities Available for Sale: GSE certificates $ — $ 1,209,610 $ — $ — $ 1,209,610 GSE CMOs — 1,828,715 — — 1,828,715 Total mortgage-related debt securities $ — $ 3,038,325 $ — $ — $ 3,038,325 Other Debt Securities Available for Sale: U. S. Treasury obligations $ 64,985 $ — $ — $ — $ 64,985 GSE debentures — 1,158,302 — — 1,158,302 Asset-backed securities — 527,099 — — 527,099 Municipal bonds — 26,311 — — 26,311 Corporate bonds — 882,226 — — 882,226 Foreign notes — 25,538 — — 25,538 Capital trust notes — 90,547 — — 90,547 Total other debt securities $ 64,985 $ 2,710,023 $ — $ — $ 2,775,008 Total debt securities available for sale $ 64,985 $ 5,748,348 $ — $ — $ 5,813,333 Equity securities: — — Preferred stock $ 15,493 $ — $ — $ — $ 15,493 Mutual funds — 16,083 — — 16,083 Total equity securities $ 15,493 $ 16,083 $ — $ — $ 31,576 Total securities $ 80,478 $ 5,764,431 $ — $ — $ 5,844,909 Fair Value Measurements at December 31, 2019 (in thousands) Quoted Prices in Active Markets for Identical Assets (Level 1) Significant Other Observable Inputs (Level 2) Significant Unobservable Inputs (Level 3) Netting Adjustments Total Fair Value Assets: Mortgage-Related Debt Securities Available for Sale: GSE certificates $ — $ 1,552,623 $ — $ — $ 1,552,623 GSE CMOs — 1,801,112 — — 1,801,112 Total mortgage-related debt securities $ — $ 3,353,735 $ — $ — $ 3,353,735 Other Debt Securities Available for Sale: U.S. Treasury obligations $ 41,839 $ — $ — $ — $ 41,839 GSE debentures — 1,094,240 — — 1,094,240 Asset-backed securities — 373,254 — — 373,254 Municipal bonds — 26,892 — — 26,892 Corporate bonds — 867,182 — — 867,182 Capital trust notes — 95,915 — — 95,915 Total other debt securities $ 41,839 $ 2,457,483 $ — $ — $ 2,499,322 Total debt securities available for sale $ 41,839 $ 5,811,218 $ — $ — $ 5,853,057 Equity securities: — — Preferred stock $ 15,414 $ — $ — $ — $ 15,414 Mutual funds and common stock — 17,416 — — 17,416 Total equity securities $ 15,414 $ 17,416 $ — $ — $ 32,830 Total securities $ 57,253 $ 5,828,634 $ — $ — $ 5,885,887 Measurements Using Significant Unobservable Inputs effect of our risk management activities related to such Level 3 instruments. (Loss) Gain Included in Mortgage Banking Income from Changes in Fair Value (1) For the Twelve Months Ended December 31, (in thousands) 2020 2019 2018 Loans held for sale $ — $ — $ — Mortgage servicing rights — — (224 ) Total loss $ — $ — $ (224 ) Fair Value Measurements at December 31, 2020 Using (in thousands) Quoted Prices in Active Markets for Identical Assets (Level 1) Significant Other Observable Inputs (Level 2) Significant Unobservable Inputs (Level 3) Total Fair Value Certain loans (1) $ — $ — $ 41,066 $ 41,066 Other assets(2) — — 5,655 5,655 Total $ — $ — $ 46,721 $ 46,721 Fair Value Measurements at December 31, 2019 Using (in thousands) Quoted Prices in Active Markets for Identical Assets (Level 1) Significant Other Observable Inputs (Level 2) Significant Unobservable Inputs (Level 3) Total Fair Value Certain impaired loans (1) $ — $ — $ 42,767 $ 42,767 Other assets (2) — — 1,481 1,481 Total $ — $ — $ 44,248 $ 44,248 December 31, 2020 Fair Value Measurement Using (in thousands) Carrying Value Estimated Fair Value Quoted Prices in Active Markets for Identical Assets (Level 1) Significant Other Observable Inputs (Level 2) Significant Unobservable Inputs (Level 3) Financial Assets: Cash and cash equivalents $ 1,947,931 $ 1,947,931 $ 1,947,931 $ — $ — FHLB stock (1) 714,005 714,005 — 714,005 — Loans and leases, net 42,806,691 42,376,214 — — 42,376,214 Financial Liabilities: Deposits $ 32,436,813 $ 32,466,013 $ 22,106,133 (2 ) $ 10,359,880 (3 ) $ — Borrowed funds 16,083,544 16,794,338 — 16,794,338 — December 31, 2019 Fair Value Measurement Using (in thousands) Carrying Value Estimated Fair Value Quoted Prices in Active Markets for Identical Assets (Level 1) Significant Other Observable Inputs (Level 2) Significant Unobservable Inputs (Level 3) Financial Assets: Cash and cash equivalents $ 741,870 $ 741,870 $ 741,870 $ — $ — FHLB stock (1) 647,562 647,562 — 647,562 — Loans and leases, net 41,746,517 41,699,929 — — 41,699,929 Financial Liabilities: Deposits $ 31,657,132 $ 31,713,945 $ 17,442,274 (2 ) $ 14,271,671 (3 ) $ — Borrowed funds 14,557,593 14,882,776 — 14,882,776 — (1)Carrying value and estimated fair value are at cost. (2)Interest-bearing checking and money market accounts, savings accounts, and non-interest-bearing accounts. (3)Certificates of deposit. and leases with similar characteristics and remaining maturities. These estimated fair values do not include the intangible value of core deposit relationships, which comprise a portion of the Company’s deposit base. accordingly, the Company matches a portion of employee 401(k) plan contributions. Such expense totaled $21 million and $7 million for the year ended December 31, (in thousands) 2020 2019 ASSETS: Cash and cash equivalents $ 151,205 $ 183,063 Investments in subsidiaries 7,333,764 7,169,066 Receivables from subsidiaries — 2,249 Other assets 23,342 23,338 Total assets $ 7,508,311 $ 7,377,716 LIABILITIES AND STOCKHOLDERS’ EQUITY: Junior subordinated debentures $ 360,259 $ 359,866 Subordinated notes 295,624 295,066 Other liabilities 10,784 11,090 Total liabilities 666,667 666,022 Stockholders’ equity 6,841,644 6,711,694 Total liabilities and stockholders’ equity $ 7,508,311 $ 7,377,716 Years Ended December 31, (in thousands) 2020 2019 2018 Interest income $ 293 $ 668 $ 500 Dividends received from subsidiaries 380,000 380,000 380,000 Other income 582 716 793 Gross income 380,875 381,384 381,293 Operating expenses 51,730 49,926 59,372 Income before income tax benefit and equity in underdistributed earnings of subsidiaries 329,145 331,458 321,921 Income tax benefit 14,163 13,669 16,616 Income before equity in underdistributed earnings of subsidiaries 343,308 345,127 338,537 Equity in underdistributed earnings of subsidiaries 167,801 49,916 83,880 Net income $ 511,109 $ 395,043 $ 422,417 Years Ended December 31, (in thousands) 2020 2019 2018 CASH FLOWS FROM OPERATING ACTIVITIES: Net income $ 511,109 $ 395,043 $ 422,417 Change in other assets (4 ) 386 256 Change in other liabilities (306 ) (2,608 ) (1,152 ) Other, net 30,352 32,776 36,677 Equity in underdistributed earnings of subsidiaries (167,801 ) (49,916 ) (83,880 ) Net cash provided by operating activities 373,350 375,681 374,318 CASH FLOWS FROM INVESTING ACTIVITIES: Change in receivable from subsidiaries, net 2,249 4,206 (1,705 ) Net cash provided by (used in) investing activities 2,249 4,206 (1,705 ) CASH FLOWS FROM FINANCING ACTIVITIES: Treasury stock repurchased (59,022 ) (75,220 ) (163,249 ) Cash dividends paid on common and preferred stock (348,435 ) (350,222 ) (365,889 ) Proceeds from issuance of subordinated notes — — 294,607 Net cash used in financing activities (407,457 ) (425,442 ) (234,531 ) Net (decrease) increase in cash and cash equivalents (31,858 ) (45,555 ) 138,082 Cash and cash equivalents at beginning of year 183,063 228,618 90,536 Cash and cash equivalents at end of year $ 151,205 $ 183,063 $ 228,618 Risk-Based Capital At December 31, 2020 Common Equity Tier 1 Tier 1 Total Leverage Capital (dollars in thousands) Amount Ratio Amount Ratio Amount Ratio Amount Ratio Total capital $ 3,962,399 9.72 % $ 4,465,239 10.95 % $ 5,289,611 12.97 % $ 4,465,239 8.52 % Minimum for capital adequacy purposes 1,834,858 4.50 2,446,478 6.00 3,261,970 8.00 2,095,846 4.00 Excess $ 2,127,541 5.22 % $ 2,018,761 4.95 % $ 2,027,641 4.97 % $ 2,369,393 4.52 % Risk-Based Capital At December 31, 2019 Common Equity Tier 1 Tier 1 Total Leverage Capital (dollars in thousands) Amount Ratio Amount Ratio Amount Ratio Amount Ratio Total capital $ 3,818,311 9.91 % $ 4,321,151 11.22 % $ 5,111,990 13.27 % $ 4,321,151 8.66 % Minimum for capital adequacy purposes 1,733,826 4.50 2,311,768 6.00 3,082,358 8.00 1,996,966 4.00 Excess $ 2,084,485 5.41 % $ 2,009,383 5.22 % $ 2,029,632 5.27 % $ 2,324,185 4.66 % Risk-Based Capital At December 31, 2020 Common Equity Tier 1 Tier 1 Total Leverage Capital (dollars in thousands) Amount Ratio Amount Ratio Amount Ratio Amount Ratio Total capital $ 4,964,055 12.18 % $ 4,964,055 12.18 % $ 5,145,321 12.62 % $ 4,964,055 9.48 % Minimum for capital adequacy purposes 1,834,112 4.50 2,445,483 6.00 3,260,643 8.00 2,095,175 4.00 Excess $ 3,129,943 7.68 % $ 2,518,572 6.18 % $ 1,884,678 4.62 % $ 2,868,880 5.48 % Risk-Based Capital At December 31, 2019 Common Equity Tier 1 Tier 1 Total Leverage Capital (dollars in thousands) Amount Ratio Amount Ratio Amount Ratio Amount Ratio Total capital $ 4,785,217 12.42 % $ 4,785,217 12.42 % $ 4,933,900 12.81 % $ 4,785,217 9.59 % Minimum for capital adequacy purposes 1,733,085 4.50 2,310,780 6.00 3,081,040 8.00 1,996,288 4.00 Excess $ 3,052,132 7.92 % $ 2,474,437 6.42 % $ 1,852,860 4.81 % $ 2,788,929 5.59 % 11, 2024. principles used and significant estimates made by management, as well as evaluating the overall presentation of the consolidated financial statements. We believe that our audits provide a reasonable basis for our opinion. Matters they relate. basis •development of the collective ACL methodology •continued use and appropriateness of the PD, LGD, and prepayment models •evaluating the Company’s collective ACL methodology for compliance with U.S. generally accepted accounting principles •evaluating judgments made by the Company relative to the assessment and performance testing of the PD, LGD, and prepayment models by comparing them to relevant Company-specific metrics and trends and the applicable industry and regulatory practices •assessing the conceptual soundness and performance of the PD, LGD, and prepayment models by inspecting the model documentation to determine whether the models are suitable for their intended use New York, New York Weighted Average Securities Equity compensation plans approved by security holders Equity compensation plans not approved by security holders Total — Certain Relationship and Related Transactions, and Director Independence •Reports of Independent Registered Public Accounting Firm; •Consolidated Statements of Condition at December 31, 2023 and 2022; •Consolidated Statements of Income and Comprehensive Income for each of the years in the three-year period ended December 31, 2023; •Consolidated Statements of Changes in Stockholders’ Equity for each of the years in the three-year period ended December 31, 2023; 4.5 Registrant will furnish, upon request, copies of all instruments defining the rights of holders of long-term debt instruments of the registrant and its consolidated subsidiaries. 10.1 (1)Incorporated by reference to Exhibits to the Company's Form 8-K filed with the Securities and Exchange Commission on April 27, 2021 (File No. 1-31565) President and Chief Executive Officer /s/ John J. Pinto John J. Pinto President Senior Executive Vice President and Chief Financial Officer (Principal Financial Officer) Director /s/ Lawrence J. Savarese Lawrence J. Savarese DirectorThe combined population of the 26 counties where our branches are located is approximately 31.2 million, and the number of banks and thrifts we compete with currently exceeds 300. With total deposits of $32.4 billion at December 31, 2020, we ranked thirteenth among all bank and thrift depositories serving these 26 counties. We also ranked fourth among all banks and thrifts in Union County, New Jersey, third among all banks and thrifts in Richmond County in New York, fifth among all banks and thrifts in Queens County in New York, and second among all banks and thrifts in Nassau County in New York (market share information was provided by S&P Global Market Intelligence).highly competitive rates. In addition to our 237420 branches, we have 340 385 ATM locations including 232 that operate 24 hours a day and 68 that are off-site ATMs.. Our customers also have 24-hour access to their accounts through our mobile banking app, online through our website, www.myNYCB.com,www.flagstar.com, or through our bank-by-phone service. We also offer certain money market accounts, certificates of deposit (“CDs”), and checking accounts through a dedicated website: www.myBankingDirect.com.Individual Retirement Accounts,retirement accounts, and CDs for both businesses and consumers, we offer a suite of cash management products to address the needs of small and mid-size businesses and professional associations. We also compete by complementing our broad selection of traditional banking products with an extensive menu of alternative financial services, including annuities, lifenon-deposit investment products and long-term care insurance through a relationship with a third-party broker dealer and mutual funds of various third-party service providers.on-lineonline banks, and brokerage firms. Additionally, financial technology companies, also referred to as FinTechs, are providing nontraditional, but increasingly strong competition for deposits and customers.Another competitive advantage is our strong community presence, with April 14, 2020 having marked the 161st year of service of our forebear, Queens County Savings Bank. We have found that our longevity, as well as our strong capital position, are especially appealing to customers seeking a strong, stable, and service-oriented bank.Whilecontinuecompete with many institutions including commercial banks, national mortgage lenders, local savings banks, financial technology companies, credit unions and commercial lenders offering mortgage loans and other consumer loans.originate ADCsubservicing pricing and C&Iservice delivery. We compete by offering quality servicing, a robust risk and compliance infrastructure and a model where our mortgage business allows for recapture services to replenish loans for investment, suchsubservicing clients.represent a small portion of our loan portfolio as compared to multi-family, CREinvestments, and deposits. Their use may also affect interest rates charged on loans and specialty finance loans.1939 active subsidiary corporations.subsidiaries. Of these, 1126 are direct subsidiaries of the Bank and eight13 are subsidiaries of Bank-owned entities.11Parent Company also has four direct subsidiaries of the(including Flagstar Bank, are:NameJurisdiction of OrganizationPurpose100 Duffy Realty, LLCNew YorkOwns a branch building.Beta Investments, Inc.DelawareHolding company for Omega Commercial Mortgage Corp. and Long Island Commercial Capital Corp.BSR 1400 Corp.New YorkOrganized to own interests in real estate.Ferry Development Holding CompanyDelawareFormed to hold and manage investment portfolios for the Company.NYCB Specialty Finance Company, LLCDelawareOriginates asset-based, equipment financing, and dealer-floor plan loans.NYB Realty Holding Company, LLCNew YorkHolding company for subsidiaries owning an interest in real estate.NYCB Insurance Agency, Inc.New YorkSells non-deposit investment products.Pacific Urban Renewal, Inc.New JerseyOwns a branch building.Synergy Capital Investments, Inc.New JerseyFormed to hold and manage investment portfolios for the Company.NYCB Mortgage Company, LLCDelawareHolding company for Walnut Realty Holding Company, LLC.Woodhaven Investments, LLCDelawareHolding company for Ironbound Investment Company, LLC. and 1400 Corp.The eight subsidiaries of Bank-owned entities are:NameJurisdiction of OrganizationPurpose1400 Corp.New YorkHolding company for Roslyn Real Estate Asset Corp.Ironbound Investment Company, LLC.FloridaOrganized for the purpose of investing in mortgage-related assets.Long Island Commercial Capital CorporationNew YorkA REIT organized for the purpose of investing in mortgage-related assets.Omega Commercial Mortgage Corp.DelawareA REIT organized for the purpose of investing in mortgage-related assets.Prospect Realty Holding Company, LLCNew YorkOwns a back-office building.Rational Real Estate II, LLCNew YorkOwns a back-office building.Roslyn Real Estate Asset Corp.DelawareA REIT organized for the purpose of investing in mortgage-related assets.Walnut Realty Holding Company, LLCDelawareEstablished to own Bank-owned properties.six10 additional active entities organized as indirect wholly-owned subsidiaries to own interests in various real estate properties.9, “Borrowed12 - Borrowed Funds,” in Item 8, “Financial Statements and Supplementary Data,” for a further discussion of the Company’s special business trusts. The Parent Company also has one non-banking subsidiary that was established in connection with the acquisition of Atlantic Bank of New York.York and two non-banking insurance subsidiaries that were acquired in connection with the Flagstar acquisition.2020,2023, our workforce included 2,948 employees, including 1,635 retail employees and 1,313 back office8,766 employees. None of our employees are represented by a collective bargaining agreement. Weagreement and we believe our employee relations to be good.an employee stock ownership plan, healthcare and other insurance benefits, flexible spending accounts and paid time off. Many of our employees are also eligible to participate in the Company’s equity award program and the Company's annual incentive program.create a moresupport an innovative and productive workplace. OurApproximately two-thirds of our workforce is 33% male and 67% female and women represent 51% of the Company’s leadership (defined to include employees at the level of vice president and above). In addition, for those employees identifying as such, approximately 48%nearly half of our workforce have diverse ethnic backgrounds. We engage in significant outreach to veterans, women and minorities in our recruiting efforts, and ourOur policies and practices reflect our commitment to diversity and inclusion in the workplace.The health and safety of our employees is also of critical importance. In response to the COVID-19 pandemic, we implemented a response plan that included the transitioning of a significant percentage of our back office workforce to a remote work model, while implementing additional safety protocols for employees who, due to the nature of their positions, continued on-site work. We took steps to ensure compliance with federal, state and local requirements that enhanced workplace safety, such as masking and social distancing, and we provided employees who either contracted or were exposed to COVID-19 with appropriate leave. “Income Taxes”"Income Taxes" in “CriticalNote 2 - Summary of Significant Accounting Policies” in Item 7, “Management’s Discussion and Analysis of Financial Condition and Results of Operations,” later in this annual report.New York State-chartered savings banknational banking association, subject to federal regulation and its deposit accountsoversight by the OCC. The activities of the Bank are insuredlimited to those specifically authorized under the DIFNational Bank Act and related interpretations of the FDIC upOCC. The OCC has authority to applicable legal limits. For the fiscal year ended December 31, 2020,bring an enforcement action against the Bank wasfor unsafe or unsound banking practices, which could include limiting the Bank’s ability to conduct otherwise permissible activities, or imposing corrective capital or managerial requirements on the bank. We are also subject to regulation and supervision by the NYSDFS, as its chartering agency;examination by the FDIC, as primary federal supervisor for all state-chartered banks and savings institutions that are not memberswhich insures the deposits of the Federal Reserve SystemBank to the extent permitted by law and the requirements established by the CFPB.requiredalso subject to file reports with the NYSDFS,supervision of the CFPB, which regulates the offering and provision of consumer financial products or services under federal consumer financial laws. The OCC, FDIC and the CFPB concerning itsmay take regulatory enforcement actions if we do not operate in accordance with applicable regulations, policies and directives. Proceedings may be instituted against us, or any "institution-affiliated party", such as a director, officer, employee, agent or controlling person, who engages in unsafe and unsound practices, including violations of applicable laws and regulations. The FDIC has additional authority to terminate insurance of accounts, if after notice and hearing, we are found to have engaged in unsafe and unsound practices, including violations of applicable laws and regulations. The federal system of regulation and supervision establishes a comprehensive framework of activities and financial condition,in which to operate and is periodically examined byprimarily intended for the NYSDFS, the FDIC,protection of depositors and the CFPB to assess compliance with various regulatory requirements, including with respect to safety and soundness and consumerfinancial protection regulations. The regulatory structure gives the regulatory authorities extensive discretion in connection with their supervisory and enforcement activities and examination policies, including policies with respect to the classification of assets and the establishment of an adequate allowance for credit losses on loans and leases for regulatory purposes. Changes in such regulations or in banking legislation could havematerial impact on the Company, the Bank, and their operations, as well as the Company’s shareholders.The Company is subject to examination, regulation, and periodic reporting under the Bank Holding Company Act of 1956, as amended (the “BHCA”) by the FRB. Furthermore, the Company would bebank holding company, we are required to obtain the prior approval of the FRB to acquire all, or substantially all, of the assets of any bank or bank holding company.In addition, the Company is periodically examined by the FRB-NY, and is required to file certain reports under, and otherwise comply with the rules and regulations of the SEC underFederal Reserve. We are required to file certain reports, and we are subject to examination by, and the enforcement authority of, the Federal Reserve. Under the federal securities laws. Certainlaws, we are also subject to the rules and regulations of the regulatory requirements applicableSEC. the Bank and the Company are referred to below or elsewhere herein. However, such discussion is not meant to be a complete explanation of all laws and regulations, and is qualified in its entiretywhether by reference to the actual laws and regulations.The Economic Growth, Regulatory Relief, and Consumer Protection ActOn May 24, 2018, the Economic Growth, Regulatory Relief, and Consumer Protection Act (the “EGRRCPA”) was signed into law. As enacted, EGRRCPA modified major provisions of the DFA and other laws governing regulation of the financial industry. Among other things, EGRRCPA re-defined the manner by which banks are designated as a SIFI, by increasing the asset threshold to $250 billion from $50 billion; modified and provided exemptions to certain mortgage lending rules; provided an exemption for certain banks with less than $10 billion in assets from leverage and risk-based capital requirements; created an exemption from prohibitions on proprietary trading (the “Volcker Rule”); and included various provisions to address consumer protection; as well as several provisions regarding securities exchanges and capital formation.On June 14,20%20 percent vacancy bonus. While it will take several years for its full impact to be known, the legislation generally limits a landlord’s ability to increase rents on rent-regulated apartments and makes it more difficult to convert rent regulated apartments to market rent apartments. early July 2013, the FRB and the FDIC approved revisions to their capital adequacy guidelines and prompt corrective action rules to implement the revised standards of the Basel Committee on Banking Supervision, commonly called Basel III, and to address relevant provisions of the DFA. Basel III generally refers to two consultative documents released by the Basel Committee on Banking Supervision in December 2009. The Basel III rules generally refer to the rules adopted by U.S. banking regulators in December 2010 to align U.S. bank capital requirements with Basel III and with the related loss absorbency rules they issued in January 2011, which include significant changes to bank capital, leverage, and liquidity requirements.4.5%;4.5 percent; (ii) a tier 1 capital ratio of 6%6 percent (increased from 4%)4 percent); (iii) a total capital ratio of 8%8 percent (unchanged from the prior rules); and (iv) a tier 1 leverage ratio of 4%.4 percent.150%150 percent risk weighting assigned to exposures that are more than 90 days past due or are on non-accrual status, and to certain CRE facilities that finance the acquisition, development, or construction of real property. Basel III also eliminate the inclusion of certain instruments, such as trust preferred securities, from tier 1 capital. In addition, tier 2 capital is no longer limited to the amount of tier 1 capital included in total capital. Mortgage servicing rights, certain deferred tax assets, and investments in unconsolidated subsidiaries over designated percentages of common stock are required, subject to limitation, to be deducted from capital. Finally, tier 1 capital includes accumulated other comprehensive income, which includes all unrealized gains and losses on available-for-sale securities.2.5%2.5 percent above the new regulatory minimum capital requirements. This resulted in an increase in the minimum common equity tier 1, tier 1, and total capital ratios to 7.0%, 8.5%,7.0 percent, 8.5 percent, and 10.5%,10.5 percent, respectively. The phase-in of the new capital conservation buffer requirement was fully implemented in January 2019. The capital conservation buffer is now at its fully phased-in level of 2.5%.2.5 percent. An institution can be subject to limitations on paying dividends, engaging in share repurchases, and paying discretionary bonuses if its capital levels fall below these amounts. Basel III also establish a maximum percentage of eligible retained income that can be utilized for such capital distributions.$250$250.0 billion in total consolidated assets and less than $10$10.0 billion in total foreign exposure. The rule simplifies and clarifies a number of the more complex aspects of the existing capital rule. Specifically, the rule simplifies the capital treatment for certain mortgage servicing assets, certain deferred tax assets, investments in the capital instruments of unconsolidated financial institutions, and minority interests.10%10 percent or greater, a tier 1 risk-based capital ratio of 8%8 percent or greater, a common equity tier 1 risk-based capital ratio of 6.5%6.5 percent or greater, and a tier 1 leverage ratio of 5%5 percent or greater, and is not subject to a regulatory order, agreement, or directive to meet and maintain a specific capital level for any capital measure.8%8 percent or greater, a tier 1 risk-based capital ratio of 6%6 percent or greater, a common equity tier 1 risk-based capital ratio of 4.5%4.5 percent or greater, and a tier 1 leverage ratio of 4%4 percent or greater.8%,8 percent, a tier 1 risk-based capital ratio of less than 6%,6 percent, a common equity tier 1 risk-based capital ratio of less than 4.5%,4.5 percent, or a tier 1 leverage ratio of less than 4%.4 percent. An institution is deemed to be “significantly undercapitalized” if it has a total risk-based capital ratio of less than 6%,6 percent, a tier 1 risk-based capital ratio of less than 4%,4 percent, a common equity tier 1 risk-based capital ratio of less than 3%,3 percent, or a tier 1 leverage ratio of less than 3%.3 percent. An institution is deemed to be “critically undercapitalized” if it has a ratio of tangible equity (as defined in the regulations) to total assets that is equal to or less than 2%.2 percent.5%5 percent of the bank’s total assets when deemed undercapitalized or the amount necessary to achieve the status of adequately capitalized. If an undercapitalized institution fails to submit an acceptable plan, it is treated as if it is “significantly undercapitalized.” Significantly undercapitalized institutions are subject to one or more additional restrictions including, but not limited to, an order by the FDIC to sell sufficient voting stock to become adequately capitalized; requirements to reduce total assets, cease receipt of deposits from correspondent banks, or dismiss directors or officers; and restrictions on interest rates paid on deposits, compensation of executive officers, and capital distributions by the parent holding company.2020,2023, each of the Bank’s capital ratios exceeded those required for an institution to be considered “well capitalized” under these regulations.Stress Testingfor Systemically Important Financial InstitutionsShouldand Prudential Standardsfour-quarter average ofSignature transaction, our total consolidated assets exceed $250exceeded $100 billion and therefore we would become subjectbecame classified as a Category IV banking organization under the rules issued by the federal banking agencies that tailor the application of enhanced prudential standards to the FRB’s stress testing regulations administered under its CCAR capital planninglarge bank holding companies and supervisory process. Under this regime, in addition to reporting the results of a SIFI’s own capital stress testing, the FRB uses its own models to evaluate whether each SIFI has the capital on a total consolidated basis, necessaryand liquidity rules to continue operatinglarge bank holding companies and depository institutions under the economicDodd-Frank Act and financial market conditions of stressed macroeconomic scenarios identified by the FRB. The FRB’s analysis includes an assessment of the projected losses, net income, and pro forma capital levels, and the regulatory capital ratio, tier 1 common ratio, and other capital ratios, for the SIFI, and uses such analytical techniques that the FRB determines to be appropriate to identify, measure, and monitor any risks of the SIFI that may affect the financial stability of the United States.Boards of directors of SIFIs are required to review and approve capital plans before they are submitted to the FRB.In October 2019, the FDIC issued a final rule, which became effective on November 25, 2019, that revised the FDIC’s requirement for stress testing by FDIC-insured institutions, consistent with changes made by the Economic Growth, Regulatory Relief, and Consumer Protection Act. As a Category IV banking organization, we are subject to enhanced liquidity risk management requirements which includeamendedremoves the FDIC’s existingcompany-run stress testing regulationstest requirement for banking organizations subject to changeCategory IV standards. Therefore, banking organizations subject to Category IV standards are not required to calculate forward-looking projections of capital under scenarios provided by the minimum threshold for applicability from $10 billion to $250 billion, revisedBoard.requiredthe calculation of the stress tests by FDIC-supervised institutions from annualcapital buffer requirement with the frequency of the supervisory stress test (with both occurring every other year for banking organizations subject to periodic,Category IV standards). The rule allows a banking organization subject to Category IV standards to elect to participate in the supervisory stress test in a year in which the banking organization would not otherwise be subject to the supervisory stress test, and reduced the number of requiredto receive an updated stress testing scenarios from three to two.“Agencies”“Federal Banking Agencies”) also have issued joint guidance entitled “Concentrations in Commercial Real Estate Lending, Sound Risk Management Practices” (the “CRE Guidance”). The CRE Guidance, which addresses land development, construction, and certain multi-family loans, as well as CRE loans, does not establish specific lending limits but, rather, reinforces and enhances the Federal Banking Agencies’ existing regulations and guidelines for such lending and portfolio management. Specifically, the CRE Guidance provides that a bank has a concentration in CRE lending if (1) total reported loans for construction, land development, and other land represent 100%100 percent or more of total risk-based capital; or (2) total reported loans secured by multi-family properties, non-farm non-residential properties (excluding those that are owner-occupied), and loans for construction, land development, and other land represent 300%300 percent or more of total risk-based capital and the bank’s CRE loan portfolio has increased 50% or more during the prior 36 months.capital. If a concentration is present, management must employ heightened risk management practices that address key elements, including board and management oversight and strategic planning, portfolio management, development of underwriting standards, risk assessment and monitoring through market analysis and stress testing, and maintenance of increased capital levels as needed to support the level of CRE lending.will provideprovides banking organizations with the option to maintain their current capital treatment for ADC loans originated on or afterFDIC has authorityParent Company is a separate legal entity from the Bank and must provide for its own liquidity. In addition to useoperating expenses and any share repurchases, the Parent Company is responsible for paying any dividends declared to the Company’s shareholders. As a Delaware corporation, the Parent Company is able to pay dividends either from surplus or, in case there is no surplus, from net profits for the fiscal year in which the dividend is declared and/or the preceding fiscal year.enforcement powersnon-bank subsidiaries. The Bank would require the approval of the OCC if the dividends it declares in any calendar year were to prohibitexceed the total of its respective net profits for that year combined with its respective retained net profits for the preceding two calendar years, less any required transfer to paid-in capital. The term “net profits” is defined as net income for a savings bank or commercial bankgiven period less any dividends paid during that period. As a result of our acquisition of Flagstar, we are also required to seek regulatory approval from paying dividends if, in its opinion,the OCC for the payment of any dividend to the Parent Company through at least the period ending November 1, 2024. In 2023, dividends would constitute an unsafe or unsound practice. Federal law prohibitsof $580 million were paid by the paymentBank to the Parent Company.dividendsinvestment activities that will resultare permissible for national banks, and the calculation of limits for investments in such covered securities, are set forth in regulations promulgated by the OCC (12 CFR Part 1), as further described in the institution failingOCC’s Investment Securities Policy Statement (OCC Bulletin 1998-20). A national bank must adhere to meet applicable capitalsafe and sound banking practices and the specific requirements on a pro forma basis. The Bank is also subject to dividend declaration restrictions imposed by, and as later discussed under, “New York State Law.”Investment ActivitiesSince the enactment of the FDICIA, all state-chartered financial institutions, including savings banks, commercial banks,OCC's regulations in conducting such investment activities. A bank must consider, as appropriate, the interest rate, credit, liquidity, price, foreign exchange, transaction, compliance, strategic, and their subsidiaries, have generally been limitedreputation risks presented by a proposed activity, and the particular activities undertaken by the bank must be appropriate for that bank. If the OCC determines for safety and soundness reasons that a bank should calculate its investment limits more frequently than required by the OCC's Investment Securities regulations, the OCC may provide written notice to such activities as principalthe bankequity investments of the type, and inbank must thereafter calculate its investment limits at that interval until further notice from the amount, authorized for national banks. OCC.In 1993,received grandfathering authority fromfor unsafe or unsound banking practices, which could include limiting the FDIC, which it continuesBank’s ability to use, to invest in listed stocks and/conduct otherwise permissible activities, or registered sharesimposing corrective capital or managerial requirements on the bank. In addition, the Parent Company is subject to the maximum permissible investments of 100% of tier 1 capital, as specified by the FDIC’s regulations, or the maximum amount permitted by New York State Banking Law, whichever is less. Such grandfathering authority is subject to termination upon the FDIC’s determination that such investments pose a safety and soundness risk to the Bank, or in the event that the Bank converts its charter or undergoes a change in control.EnforcementThe FDIC has extensive enforcement authority over insured banks, includingof the Bank. ThisFederal Reserve. The enforcement authority of these regulatory agencies includes, among other things, the ability to assess civil money penalties, to issue cease and desist orders, and to remove directors and officers. In general, these enforcement actions may be initiated in response to violations of laws and regulations and unsafe or unsound practices.Regulationismay only conduct, or acquire control of companies engaged in activities permissible for a bank holding company pursuant to the BHCA. Further, we generally are required to obtain the priorFederal Reserve approval of the FRB to acquire all, or substantially all, of the assets of any bank or bank holding company. Prior FRB approval would be required for the Company to acquirebefore acquiring direct or indirect ownership or control of any voting securitiesshares of anyanother bank, or bank holding company, savings associations or savings and loan holding company if after giving effect to such acquisition, itwe would directly or indirectly, own or control more than 5%5 percent of the outstanding shares of any class of voting sharessecurities of such bankthat entity. Additionally, we are prohibited from acquiring control of a depository institution that is not federally insured or bank holding company.retaining control for more than one year after the date that institution becomes uninsured.before any bank acquisition can be completed, prior approval thereof may also be required to be obtainedthe GLBA generally restricts a company from other agencies having supervisory jurisdiction over the bank to be acquired, including the NYSDFS.FRB regulations generally prohibitacquiring us if that company is engaged directly or indirectly in activities that are not permissible for a bank holding company from engaging in, or acquiring, direct or indirect controlfinancial holding company.more than 5%loan commitments, letters of credit and recourse arrangements. Failure to meet minimum capital requirements can initiate certain mandatory, and possibly additional discretionary, actions by regulators that could have a material effect on the Consolidated Financial Statements. For additional information, see the Capital section of the voting securities ofMD&A and Note 17 -Capital.company engaged in non-banking activities. One of the principal exceptionscapital distributions to this prohibition is for activities found by the FRB to be so closely related to banking or managing or controlling banks as to be a proper incident thereto. Some of the principal activities that the FRB has determined by regulation to be so closely related to banking are: (i) making or servicing loans; (ii) performing certain data processing services; (iii) providing discount brokerage services; (iv) acting as fiduciary, investment, or financial advisor; (v) leasing personal or real property; (vi) making investments in corporations or projects designed primarily to promote community welfare;our stockholders, including dividends and (vii) acquiring a savings and loan association.The FRB has issued a policy statement regarding the payment of dividends by bank holding companies. In general, the FRB’s policies provide that dividends should be paid only out of current earnings, and only if the prospective rate of earnings retention by the bank holding company appears consistent with the organization’s capital needs, asset quality, and overall financial condition. The FRB’s policies also require that a bank holding company serve as a source of financial strength to its subsidiary bank by standing ready to use available resources to provide adequate capital funds to the bank during periods of financial stress or adversity, and by maintaining the financial flexibility and capital-raising capacity to obtain additional resources for assisting its subsidiary bank where necessary.The DFA codified the source of financial strength policy and required regulations to facilitate its application. Under the prompt corrective action laws, the ability of a bank holding company to pay dividends may be restricted if a subsidiary bank becomes undercapitalized. These regulatory policies could affect the ability of the Company to pay dividends or otherwise engage in capital distributions.The status of the Company as a registered bank holding company under the BHCA does not exempt it from certain federal and state laws and regulations applicable to corporations generally, including, without limitation, certain provisions of the federal securities laws.New York State RegulationThe Companyshare repurchases, is subject to regulation as a “multi-bank holding company” under New York State law. Among other requirements, this means that the Company must receive the approvaloversight of the Superintendent priorFederal Reserve and contingent upon their non-objection to such planned distributions which typically considers our capital adequacy, comprehensiveness and effectiveness of capital planning and the prudence of the proposed capital action.acquisition of 10%FRB if any person (including a company), or group acting in concert, seeks to acquire 10 percent or more of the Company’s shares of outstanding common stock, unless the FRB has found that the acquisition will not result in a change in control of the Company. Under the CIBCA, the FRB generally has 60 days within which to act on such notices, taking into consideration certain factors, including the financial and managerial resources of the acquirer; the convenience and needs of the communities served by the Company, the Bank; and the anti-trust effects of the acquisition. Under the BHCA, any company would be required to obtain approval from the FRB before it may obtain “control” of the Company within the meaning of the BHCA. Control generally is defined to mean the ownership or power to vote 25 percent or more of any class of voting securities of the Company, the ability to control in any manner the election of a majority of the Company’s directors, or the power to exercise a controlling influence over the management or policies of the Company. Under the BHCA, an existing bank holding company would be required to obtain the FRB’s approval before acquiring more than 5 percent of the Company’s voting stock. See “Holding Company Regulation” earlier in this report.of another banking institution, or to otherwise acquire a banking institution by merger or purchase.10%10 percent of the institution’s capital stock and surplus, and contains an aggregate limit on all such transactions with all affiliates to an amount equal to 20%20 percent of such capital stock and surplus. Section 23A also establishes specific collateral requirements for loans or extensions of credit to, or guarantees or acceptances on letters of credit issued on behalf of, an affiliate. Section 23B requires that covered transactions and a broad list of other specified transactions be on terms substantially the same as, or at least as favorable to, the institution or its subsidiaries as similar transactions with non-affiliates.savings bank or commercial bank to directors, executive officers, and principal shareholders.stockholders.FDICOCC regulations, an institution has a continuing and affirmative obligation consistent with its safe and sound operation to help meet the credit needs of its entire community, including low and moderate income neighborhoods. The CRA generally does not establish specific lending requirements or programs for financial institutions, nor does it limit an institution’s discretion to develop the types of products and services that it believes are best suited to its particular community, consistent with the CRA. InHowever, institutions are rated on their performance in meeting the needs of their communities. Performance is tested in three areas: (1) lending, to evaluate the institution’s record of making loans in its most recent FDICassessment areas; (2) investment, to evaluate the institution’s record of investing in community development projects, affordable housing, and programs benefiting low- or moderate-income individuals and businesses; and (3) service, to evaluate the institution’s delivery of services through its branches, ATMs and other offices. The CRA performance evaluation,requires each federal banking agency, in connection with its examination of a financial institution, to assess and assign one of four ratings to the Bank received overall state ratingsinstitution’s record of “Satisfactory” for Ohio, Florida, Arizona, and New Jersey, as well as for the New York/New Jersey multi-state region. Furthermore, the most recent overall FDIC CRA ratings for the Bank was “Satisfactory.”New York State RegulationThe Bank is also subject to provisions of the New York State Banking Law that impose continuing and affirmative obligations upon a banking institution organized in New York State to servemeeting the credit needs of the community and to take such record into account in its local community. Such obligations are substantially similar to those imposedevaluation of certain applications by the CRA.institution, including applications for charters, branches and other deposit facilities, relocations, mergers, consolidations, acquisitions of assets or assumptions of liabilities, and bank holding company and savings and loan holding company acquisitions. The latest New York State CRA rating receivedalso requires that all institutions make public disclosure of their CRA ratings.Bankgrowth of non-branch delivery systems, such as online and mobile banking, branchless banking, and hybrid models. In addition, the final rule implements a new metrics-based approach to evaluating bank retail lending and community development financing, using benchmarks based on peer and demographic data.Most of the final rule’s requirements will become effective beginning on January 1, 2026 and the remaining requirements, including the final rule’s data reporting requirements, will become effective on January 1, 2027.“Outstanding.”Federalimpose obligations on U.S.including the Uniting and Strengthening America by Providing Appropriate Tools Required to Intercept and Obstruct Terrorism Act, commonly referred to as the “USA PATRIOT Act” or the “Patriot Act”. The BSA requires all financial institutions including banks and broker/dealer subsidiaries, to, implement and maintain appropriate policies, procedures, andamong other things, establish a risk-based system of internal controls that are reasonably designed to prevent detect, and report instances of money laundering and the financing of terrorism,terrorism. The BSA includes various record keeping and reporting requirements such as cash transaction and suspicious activity reporting as well as due diligence requirements. The Bank is also required to verifycomply with the identityU.S. Treasury’s Office of their customers. In addition, these provisions requireForeign Assets Control imposed economic sanctions that affect transactions with designated foreign countries, nationals, individuals, entities and others. The USA PATRIOT Act contains prohibitions against specified financial transactions and account relationships, as well as enhanced due diligence standards intended to prevent the federaluse of the United States financial institution regulatory agencies to consider the effectiveness of a financial institution’s anti-money laundering activities when reviewing bank mergers and bank holding company acquisitions. Failure of a financial institution to maintain and implement adequate programs to combatsystem for money laundering and terrorist financing couldactivities. The Patriot Act requires banks and other depository institutions, brokers, dealers and certain other businesses involved in the transfer of money to establish anti-money laundering programs, including employee training and independent audit requirements meeting minimum standards specified by the Patriot Act, to follow standards for customer identification and maintenance of customer identification records, and to compare customer lists against lists of suspected terrorists, terrorist organizations and money launderers. The Patriot Act also requires federal bank regulators to evaluate the effectiveness of an applicant in combating money laundering in determining whether to approve a proposed bank acquisition.seriousdeveloped and operate an enterprise-wide anti-money laundering program designed to enable us to comply with all applicable anti-money laundering and anti-terrorism financing laws and regulations. Our anti-money laundering program is also designed to prevent our products from being used to facilitate business in certain countries or territories, or with certain individuals or entities, including those on designated lists promulgated by the U.S. Department of the Treasury’s Office of Foreign Assets Controls and other U.S. and non-U.S. sanctions authorities. Our anti-money laundering and sanctions compliance programs include policies, procedures, reporting protocols, and internal controls designed to identify, monitor, manage, and mitigate the risk of money laundering and terrorist financing. These controls include procedures and processes to detect and report potentially suspicious transactions, perform consumer due diligence, respond to requests from law enforcement, and meet all recordkeeping and reporting requirements related to particular transactions involving currency or monetary instruments. Our programs are designed to address these legal and reputational consequences for the institution.information.information, and imposes certain limitations on the ability to share consumers’ nonpublic personal information with non-affiliated third-parties. Privacy requirements, including notice and opt out requirements, under the GLBA and the FCRA are enforced by the FTC and by the CFPB through UDAAP laws and regulations, and are a standard component of CFPB examinations. State entities also may initiate actions for alleged violations of privacy or security requirements under state law.FHLB-NY.FHLB-NY and FHLB-Indianapolis. As a member of the FHLB-NY, the Bank is required to acquire and hold shares of FHLB-NY capital stock. At December 31, 20202023 the Bank held $714.0$861 million of FHLB-NY stock.New York State LawThe Bank derives its lending, investment,stock and other authority primarily from the applicable provisions$329 million of New York State Banking Law and the regulations of the NYSDFS, as limited by FDIC regulations. Under these laws and regulations, banks, including the Bank, may invest in real estate mortgages, consumer and commercial loans, certain types of debt securities (including certain corporate debt securities, and obligations of federal, state, and local governments and agencies), certain types of corporate equity securities, and certain other assets.Under New York State Banking Law, New York State-chartered stock-form savings banks may declare and pay dividends out of their net profits, unless there is an impairment of capital. Approval of the Superintendent is required if the total of all dividends declared by the bank in a calendar year would exceed the total of its net profits for that year combined with its retained net profits for the preceding two years, less prior dividends paid.New York State Banking Law gives the Superintendent authority to issue an order to a New York State-chartered banking institution to appear and explain an apparent violation of law, to discontinue unauthorized or unsafe practices, and to keep prescribed books and accounts. Upon a finding by the NYSDFS that any director, trustee, or officer of any banking organization has violated any law, or has continued unauthorized or unsafe practices in conducting the business of the banking organization after having been notified by the Superintendent to discontinue such practices, such director, trustee, or officer may be removed from office after notice and an opportunity to be heard. The Superintendent also has authority to appoint a conservator or a receiver for a savings or commercial bank under certain circumstances.Interstate BranchingFederal law allows the FDIC, and New York State Banking Law allows the Superintendent, to approve an application by a state banking institution to acquire interstate branches by merger, unless, in the case of the FDIC, the state of the target institution has opted out of interstate branching. New York State Banking Law authorizes savings banks and commercial banks to open and occupy de novo branches outside the state of New York. Pursuant to the DFA, the FDIC is authorized to approve a state bank’s establishment of a de novo interstate branch if the intended host state allows de novo branching by banks chartered by that state. The Bank currently maintains 40 branches in New Jersey, 26 branches in Florida, 28 branches in Ohio, and 14 branches in Arizona, in addition to its 129 branches in New York State.Acquisition of the Holding CompanyFederal RestrictionsUnder the Federal Change in Bank Control Act (“CIBCA”), a notice must be submitted to the FRB if any person (including a company), or group acting in concert, seeks to acquire 10% or more of the Company’s shares of outstanding common stock, unless the FRB has found that the acquisition will not result in a change in control of the Company. Under the CIBCA, the FRB generally has 60 days within which to act on such notices, taking into consideration certain factors, including the financial and managerial resources of the acquirer; the convenience and needs of the communities served by the Company, the Bank; and the anti-trust effects of the acquisition. Under the BHCA, any company would be required to obtain approval from the FRB before it may obtain “control” of the Company within the meaning of the BHCA. Control generally is defined to mean the ownership or power to vote 25% or more of any class of voting securities of the Company, the ability to control in any manner the election of a majority of the Company’s directors, or the power to exercise a controlling influence over the management or policies of the Company. Under the BHCA, an existing bank holding company would be required to obtain the FRB’s approval before acquiring more than 5% of the Company’s voting stock. See “Holding Company Regulation” earlier in this report.New York State Change in Control RestrictionsNew York State Banking Law generally requires prior approval of the New York State Banking Board before any action is taken that causes any company to acquire direct or indirect control of a banking institution which is organized in New York.Service membersServicemembers Civil Relief Act,financial savvy,understanding on the part of the consumer of the material risks, costs, or conditions of the product or service; (b) the inability of the consumer to protect himselfhis/her own interest in the selectionselecting or use of consumerusing a financial productsproduct or services,service; or (c) the reasonable reliance by the consumer on a covered entityfinancial institution to act in the consumer’s interests.has examinationis also authorized to collect fines and enforcement authority over all banks with more than $10 billionprovide consumer restitution in assets,the event of violations, engage in consumer financial education, track consumer complaints, request data and promote the availability of financial services to underserved consumers and communities. The CFPB is authorized to pursue administrative proceedings or litigation for violations of federal consumer financial laws. In these proceedings, the CFPB can obtain cease and desist orders (which can include orders for restitution or rescission of contracts, as well as other kinds of affirmative relief) and monetary penalties which, for 2023, range from $6,813 per day for minor violations of federal consumer financial laws (including the CFPB’s own rules) to $34,065 per day for reckless violations and $1,362,567 per day for knowing violations. The CFPB monetary penalty amounts are adjusted annually for inflation. Also, where a company has violated Title X of the Dodd-Frank Act or CFPB regulations under Title X, the Dodd-Frank Act empowers state attorneys general and state regulators to bring civil actions for the kind of cease and desist orders available to the CFPB (but not for civil penalties).affiliates. (“ERM”) department to identify, measure, monitor, mitigate, and report risk. The Company has established an ERM program that reinforces a strong risk culture to support sound risk management practices. The Board is responsible for the approval and oversight of the ERM program and framework.Current Operating EnvironmentCOVID-19 PandemicThe most significant factor impactingcurrent operating environment has beencommon stock $0.05 per share, which represented a reduction from the COVID-19 pandemic. Beginningprior quarterly cash dividend of $0.17 per share. The dividend was paid on February 28, 2024 to common stockholders of record as of February 14, 2024. On March 7, 2024, the Company announced that future quarterly cash dividends on shares of the Company’s common stock would be further reduced to $0.01 per share.first occurrenceLiberty Agreement, the Hudson Bay Agreements and the Original Investment Agreements of the virusOther Investors, the “Investment Agreements”).United StatesCompany in 2020, it spread quickly throughoutexchange for the country duringsale and issuance by the first quarter. Due to its high rateCompany of contagion(a) 76,630,965 shares of our common stock, at a purchase price per share of $2.00, (b) 192,062 shares of a new series of our preferred stock, par value $0.01 per share, designated as Series B Noncumulative Convertible Preferred Stock (the “Series B Preferred Stock”), at a price per share of $2,000, each share of which is convertible into 1,000 shares of common stock (or, in certain limited circumstances, one share of Series C Preferred Stock (as defined below)), (c) 256,307 shares of a new series of our preferred stock, par value $0.01 per share, designated as Series C Noncumulative Convertible Preferred Stock (the “Series C Preferred Stock”, together with the Series B Preferred Stock, the “Preferred Stock”), at a price per share of $2,000, each share of which is convertible into 1,000 shares of common stock, and mortality, state and local governments enacted numerous safeguards to contain(d) warrants (the “Issued Warrants”), which may not be exercised until 180 days after issuance thereof, affording the spreadholder thereof the right, until the seven-year anniversary of the virus. These includedissuance of such Issued Warrant, to purchase for $2,500 per share, shares of a new class of non-voting, common-equivalent preferred stock of the shut-downCompany (the “Series D NVCE Stock”), each share of Series D NVCE Stock is convertible into 1,000 shares of common stock (or, in certain limited circumstances, one share of Series C Preferred Stock), and all businesses consideredof which shares of Series D NVCE Stock, upon issuance, will represent the right (on an as converted basis) to be “non-essential,receive 315,000,000 million shares of common stock. restrictions on gatherings, social distancing requirements being put in place,), pursuant to which we will provide customary registration rights to the Investors and numerous other restrictions that have impacted daily behavior. In our market area, the governor of New York issued orders that,their affiliates and certain permitted transferees with respect to, among other things, required residents(a) the shares of our common stock purchased under the Investment Agreements, (b) shares of our common stock issued upon the conversion of shares of the Preferred Stock and exercise of the Issued Warrants purchased under the Investment Agreements, (c) in certain circumstances, the shares of Preferred Stock and (d) the Warrants. Under the Registration Rights Agreement, the Investors are entitled to staycustomary shelf registration rights (which will initially be on a Form S-1) and customary piggyback registration rights, in each case, subject to certain limitations as set forth in the Registration Rights Agreement. Liberty and Reverence will additionally be entitled to request a certain number of marketed and unmarketed underwritten shelf takedowns and shall have the right to select the managing underwriter to administer any underwritten shelf takedowns provided the selection is reasonably acceptable to us.homes and permitted them to leave only to conduct certain essential business activities or to travel to work, and closed all non-essential businessesentirety by reference to the general public. These stay-at-home ordersfull text of the Investment Agreements, which are filed as Exhibits 10.18–20 to this Annual Report on Form 10-K, the Registration Rights Agreement, which is filed as Exhibit 10.21 to this Annual Report on Form 10-K, and travel restrictions have resultedthe IssuedWarrant, which is filed as Exhibit 4.5 to this Annual Report on Form 10-K, and in significant businesseach case incorporated by reference herein.operational disruptions, including business closures, supply chain disruptions,Chief Executive Officer of the Company, effective as of April 1, 2024, (ii) Alessandro DiNello was named Non-Executive Chairman of the Company, effective as of April 1, 2024, (iii) the Board of Directors of the Company was reduced to ten members, and mass layoffs(iv) four new directors (Steven Mnuchin, Joseph Otting, Allen Puwalski and furloughs. Capacity restrictions on movement and health and safety recommendations that encourage continuedphysical distancing and working remotely have limited the ability of businesses to return to pre-pandemic levels of activity.In addition, dueMilton Berlinski) were appointed to the concentrationBoard.severityapproval of COVID-19 infectionat least a 1-3 reverse stock split of our common stock and to increase the number of authorized sharesNew York City metro region, was initially considered the epicenterevent of approval of the pandemic in the country. This region is the Company’s largest service area, having over 100 branches and 73% of the loan portfolio.The Company was proactive during the very early stages of the pandemic. As an essential business, the Company implemented business continuity plans and continued to provide its financial services to customers, while taking health and safety measures into account.By mid-March, close to 100% of our back office employees were working remotely. In addition, at that time, we temporarily closed all 18 of our in-store branches, along with several other locations, converted some branches to drive-up only, adjusted the hours at our remaining locations, and instituted a banking by appointment program. Currently, 15 of our 18 in-store branches and 37 of our 219 traditional branches remain closed, with no adverse impact on our customer base or deposit trends.On the consumer side, we enhanced our online banking and mobile app capabilities, temporarily waived certain retail banking fees for those customers experiencing financial difficulties, and offered 90 day payment forbearances to residential mortgage customers. We also put in place several risk mitigation strategies, including enhanced monitoring of certain credits. On the commercial side, we instituted a six-month deferral program for those borrowers experiencing hardships, in line with regulatory guidance. Additionally, under the CARES Act, we provided some of our borrowers with small business loans under the Payment Protection Program.In addition, extensive precautions were taken to protect employees returning to their offices and in their branches. As of this writing, 25% of back-office employees are back in their offices and a majority of our branches have reopened. We also provide daily communications via email to all of our employees to ensure that they have ongoing access to critical information and have set up a 24-hour help line for employees and their family members to speak with qualified clinicians.In response to the pandemic and to ensure that the Company’s operations during the term of the pandemic, run smoothly, senior management formed two committees: the COVID-19 Resiliency Committee and the COVID-19 Lending Committee. The COVID-19 Resiliency Committee meets daily and is primarily focused on operational issues including employee safety and well-being, branch closings, PPE procurement, IT sustainability, and continuous monitoring of the COVID-19 pandemic. The COVID-19 Lending Committee meets weekly and focuses on our credit quality trends and our loan deferral program.ITEM 1A.RISK FACTORSlosses;losses, and related risks regarding our ability to pay dividends; (5) legal/compliance risk, which arises from violations of, or non-conformance with, laws, rules, regulations, prescribed practices, or ethical standards; (6) financial and market risk, which arises from changes in the value of portfolios of financial instruments;instruments, as well as other matters that may dilute the value of our securities; (7) strategic risk, which is the risk of loss arising from inadequate or failed internal processes, people,the execution of our strategic initiatives and systems;business strategies, including our acquisition and integration of other companies we acquire; (8) operational risk, which arises from problems with service or product delivery; and (9) reputational risk, which arises from negative public opinion resulting in a significant decline in shareholderstockholder value.reportAnnual Report on Form 10-K is qualified in its entirety by those risk factors.COVID-19 Related Riskwidespread outbreakinability to receive dividends from our subsidiary bank could have a material adverse effect on our financial condition or results of COVID-19 hasoperations, and our ability to maintain or increase the current level of cash dividends we pay to our stockholders.affected,affect the values of loans we originate and will likely continuesecurities in which we invest. Moreover,longerissuance of securities pursuant to the pandemic persists,exercise of warrants issued by us may dilute existing holders of our common stock and other securities, decrease the more materialvalue of our common stock and other securities and adversely affect the ultimate effects are likelymarket price of our common stock and other securities.be.COVID-19 pandemic is negatively impacting economic activity, the financial markets, and commerce, both globally and within the United States. In our market area, the governor of New York has issued an order that, among other things, required residentsinability to stayengage in their homes and permitted them to leave only to conduct certain essential activitiesmerger transactions, or to travelrealize the anticipated benefits of acquisitions in which we might engage, could adversely affect our ability to workcompete with other financial institutions and close all non-essentialweaken our financial performance.general public. These stay-at-home orderseffectiveness of our strategic planning and travel restrictions –our ability to pursue certain corporate goals.similar orders imposed across the United Statescertain of our service providers have experienced information technology security breaches and may be vulnerable to restrict the spread of COVID-19 –future security breaches, which have resulted in, significant business and operational disruptions, including business closures, supply chain disruptions, and mass layoffs and furloughs. Although stay-at-home orders have been easedcould result in, additional expenses, exposure to phased-in reopening of businesses, although capacity restrictions on movement and health and safety recommendations that encourage continued physical distancing and teleworking have limited the ability of businesses to return to pre-pandemic levels of activity. The COVID-19 pandemic has negatively affected the Company’s business and is likely to continue to do so and the Company’s results of operations may be materially impacted if businesses remain closed for an extended period of time or unemployment remains at elevated levels for an extended period of time.As an essential business, we have implemented business continuity plans and continue to provide financial services to clients, while taking health and safety measures such as transitioning most in-person customer transactions to our drive-thru facilities and limiting access to the interior of our facilities, frequent cleaning of our facilities, and using a remote workforce where possible. Despite these safeguards, we may nonetheless experience business disruptions, and the rapid pace at which these issues are developing could overwhelm our ability to deal with them in a timely manner.The continued spread of COVID-19 and the efforts to contain the virus could:•cause changes in consumer and business spending, borrowing and saving habits, which may affect the demand for loans and other products and services we offer, as well as the credit worthiness of potential and current borrowers;•cause our borrowers to be unable to meet existing payment obligations, particularly those borrowers that may be disproportionately affected by business shut downs and travel restrictions resulting in increases in loan delinquencies, problem assets, and foreclosures;•result in the lack of property transactions and asset sales;•cause the value of collateral for loans, especially real estate, to decline in value;•reduce the availability and productivity of our employees;•require us to increase our allowance for credit losses;•cause our vendors and counterparties to be unable to meet existing obligations to us;•negatively impact the business and operations of third party service providers that perform critical services for our business;•cause us to recognize impairment of our goodwill;•result in a downgrade in our credit ratings;•prevent us from satisfying our minimum capital and other regulatory requirements;•impede our ability to close mortgage loans, if appraisers and title companies are unable to perform their functions; and•cause the value of our securities portfolio to decline.Any one or a combination of the above events could have a material, adverse effect on our business, financial condition, and results of operations.Moreover, our success and profitability is substantially dependent upon the management skills of our executive officers, many of whom have held officer positions with us for many years. The unanticipated loss or unavailability of key employees due to COVID-19 could harm our ability to operate our business or execute our business strategy.COVID-19 has caused a significant global economic downturn which has adversely effected and is expected to continue to adversely affect many business.Our business is dependent upon the ability and willingness of our customers to conduct banking and other financial transactions, including the payment of their loan obligations. Specifically, our multi-family and CRE loans are dependent on the profitable operation and management of the property securing the loan. If the impact of the pandemic is prolonged, COVID-19 could have a significant adverse impact by reducing the revenue and cash flows of our borrowers, impacting the borrowers’ ability to repay their loan, increasing the risk of delinquencies and defaults, and reducing the collateral value underlying the loans.The COVID-19 pandemic has also led to an increase in the allowance for loancivil litigation, increased regulatory scrutiny, losses, and in the allowance for unfunded commitments, duea loss of customers.a change in forecasting potential losses and model assumptions under COVID-19. At December 31, 2020, payment deferral programs totaled $2.6 billion or 6.1% of the total loan portfolio comparedperform certain key business functions, which may expose us to $7.4 billion or 17.5% of the total loan portfolio at June 30, 2020. Despite the significant improvement between the second and fourth quarter of 2020, the pandemic may continuefurther operational risk.loan portfolio, particularly as businesses remain closed. Moreover, the New York City metropolitan region has been disproportionately impacted by COVID-19 relativeability to other regionscompete for loans and deposits, and therefore on our financial condition and results of the stateoperations.country. Accordingly, theretain key personnel could adversely impact from COVID-19 on the Companyour operations.borrowersbusiness may be greater than on similar banks thatadversely impacted if we do not havesuccessfully manage the transition process in a similar geographic concentration.Changes to and replacement of the LIBOR Benchmark Interest Rate may adversely affect our business, financial condition, and results of operations.We have certain loans and leases, securities, wholesale borrowings, derivative financial instruments, and long-term debt whose interest rate is indexed to LIBOR. The “FCA”, which is responsible for regulating LIBOR, has announced that the publication of LIBOR is not guaranteed beyond 2021. However, during the fourth quarter of 2020, the FCA has extended the timeline for the elimination of LIBOR to June 30, 2023, in order to avoid disruptions to the financial system.Uncertainty as to the adoption, market acceptance, or availability of SOFR or other alternative reference rates, may adversely affect the value of LIBOR-based loans and securities in our portfolio and may impact the availability and cost of hedging instruments and borrowings. The language in our LIBOR-based contracts and financial instruments has developed over time and may have various events that trigger when a successor index to LIBOR would be selected. If a trigger is satisfied, contracts and financial instruments may give us or the calculation agent, as applicable, discretion over the selection of the substitute index for the calculation of interest rates. The implementation of a substitute index for the calculation of interest rates under our loan agreements may result in our incurring significant expenses in effecting the transition and may result in disputes or litigation with customers over the appropriateness or comparability to LIBOR of the substitute index, any of which could have an adverse effect on our results of operations. We continue to develop and implement plans to mitigate the risks associated with the expected discontinuation of LIBOR. In particular, we have implemented or are in the process of implementing fallback language for LIBOR-linked loans.RisksRiskA decline in the quality of our assets could result in higher losses and the need to set aside higher loan loss provisions, thus reducing our earnings and our stockholders’ equity.The inability of our borrowers to repay their loans in accordance with their terms would likely necessitate an increase in our provision for credit losses, and therefore reduce our earnings.The loans we originate for investment are primarily multi-family loans, CRE loans, and specialty finance loans and leases. Such loans are generally larger, and have higher risk-adjusted returns and shorter maturities, than the other loans we produce for investment. Our credit risk would ordinarily be expected to increase with the growth of our multi-family and CRE loan portfolios.Payments on multi-family and CRE loans generally depend on the income generated by the underlying properties which, in turn, depends on their successful operation and management. The ability of our borrowers to repay these loans may be impacted by adverse conditions in the local real estate market and the local economy. While we seek to minimize these risks through our underwriting policies, which generally require that such loans be qualified on the basis of the collateral property’s cash flows, appraised value, and debt service coverage ratio, among other factors, there can be no assurance that our underwriting policies will protect us from credit-related losses or delinquencies.To minimize the risks involved in our specialty finance lending and leasing, we participate in syndicated loans that are brought to us, and equipment loans and leases that are assigned to us, by a select group of nationally recognized sources, and generally are made to large corporate obligors, many of which are publicly traded, carry investment grade or near-investment grade ratings, and participate in stable industries nationwide. Each of our credits is secured with a perfected first security interest in the underlying collateral and structured as senior debt or as a non-cancelable lease.We seek to minimize the risks involved in our other C&I lending by underwriting such loans on the basis of the cash flows produced by the business; by requiring that such loans be collateralized by various business assets, including inventory, equipment, and accounts receivable, among others; and by requiring personalguarantees. However, the capacity of a borrower to repay such a C&I loan is substantially dependent on the degree to which his or her business is successful. In addition, the collateral underlying other C&I loans may depreciate over time, may not be conducive to appraisal, or may fluctuate in value, based upon the results of operations of the business.We also originate ADC loans, although to a far lesser degree than we originate multi-family and CRE loans. ADC financing typically involves a greater degree of credit risk than longer-term financing on multi-family and CRE properties. Risk of loss on an ADC loan largely depends upon the accuracy of the initial estimate of the property’s value at completion of construction or development, compared to the estimated costs (including interest) of construction. If the estimate of value proves to be inaccurate, the loan may be under-secured. While we seek to minimize these risks by maintaining consistent lending policies and procedures, and rigorous underwriting standards, an error in such estimates, among other factors, could have a material adverse effect on the quality of our ADC loan portfolio, thereby resulting in losses or delinquencies.The ability of our borrowers to repay their loans could be adversely impacted by a decline in real estate values and/or an increase in unemployment, which not only could result in our experiencing losses, but also could necessitate our recording a provision for credit losses. Either of these events would have an adverse impact on our net income. Although losses on the loans we produce have been comparatively limited, even during periods of economic weakness in our markets, we cannot guarantee that this will be our experience in future periods.In addition to loan losses due to borrowers’ inability to repay their loans, downgrades in our internal loan classifications may result in a higher provision for credit losses and the ACL, a higher level of net charge-offs, and/or higher non-interest expenses.Policies”Estimates” in Item 7, “Management’s Discussion and Analysis of Financial Condition and Results of Operations” in this report. CECL may result in greater volatility in the level of the ACL, depending on various assumptions and factors used in this model.Our current business strategy is to continue to originate multi-family loans and to a lesser extent CRE loans. 2020, $32.22023, $37.3 billion or 75.3%44.0 percent of our total loans and leases, held for investment portfolio consisted of multi-family loans and $6.8$10.5 billion or 16.0%12.4 percent consisted of CRE loans. These types of loans generally expose a lender to greater risk of non-payment and loss than one-to-four family residential mortgage loans because repayment of the loans often depends on the successful operation of the properties and the sale of such properties securing the loans. Such loans typically involve larger loan balances to single borrowers or groups ofConsequentially,Consequently, an adverse development with respect to one loan or one credit relationship can expose us to a significantly greater risk of loss compared to an adverse development with respect to a one-to-four family residential real estate loan. In addition, if loans that are collateralized by real estate become troubled and the value of the real estate has been significantly impaired, then we may not be able to recover the full contractual amount of principal and interest that we anticipated at the time we originated the loan, which could cause us to increase our provision for loan losses and adversely affect our operating results and financial condition.or increase the level of cash dividends we currently pay to our shareholders.The Company has granted payment deferrals to borrowers that have experienced financial hardship due to COVID-19, and if those borrowers are unable to resume making payments, the Company will experience an increase in non-accrual loans, which could adversely affect the Company’s earnings and financial condition.Consistent with the public encouragement provided generally by federal and state financial institution regulators after the spread of COVID-19 in the United States, the Company has attempted to work constructively with borrowers who have experienced financial hardship as a result of the pandemic to negotiate accommodations or forbearance arrangements that temporarily reduce or defer the monthly payments due to the Company. Generally, these accommodations are for six months and allow customers to temporarily cease making principal and/or interest payments. In some cases, customers have received a second accommodation. Through December 31, 2020, the Company had granted accommodations with a total value of $7.4 billion, and as of December 31, 2020, $2.6 billion of loans remained subject to a payment accommodation. Upon the expirationof the deferral period in which case their loans will be classified as non-accrual and the Company will begin collection activities, NPLs and related charge-offs may increase significantly in 2021 as payment wanes. An increase in NPLs and charge-offs would cause the Company to increase its allowance for credit losses, which would adversely affect the Company’s earnings and financial condition.Customary means to collect non-performing assets may be prohibited or impractical during the COVID-19 pandemic, and there is a risk that collateral securing a non-performing asset may deteriorate if the Company chooses not to, or is unable to, foreclose on a timely basis.Governments in the areas in which the Company conducts its lending services have adopted or may adopt in the future regulations or promulgate executive orders that restrict or limit our ability to take certain actions with respect to delinquent borrowers that we would otherwise take in the ordinary course of business, such as customary collection and foreclosure procedures. Executive orders that have been imposed restrict the ability of financial institutions to undertake residential and commercial foreclosures and evictions. There is a risk that the value of the collateral securing a non-accrual loan may deteriorate if the Company chooses not to, or is unable to foreclose on the collateral on a timely basis.Risks Related to our Changes in accounting standards or interpretation of new or existing standards may affect how we report our financial condition and results of operations.From time to time the FASB and the SEC change accounting regulations and reporting standards that govern the preparation of our financial statements. In addition, the FASB, SEC, bank regulators, and the outside independent auditors may revise their previous interpretations regarding existing accounting regulations and the application of these accounting standards. These changes can be difficult to predict and can materially impact how to record and report our financial condition and results of operations. In some cases, there could be a requirement to apply a new or revised accounting standard retroactively, resulting in the restatement of prior period financial statements.The implementation of a new accounting standard could require us to increase our allowance for credit losses and may have a material adverse effect on our financial condition and results of operations.In June 2016, the FASB issued ASU No. 2016-13, Financial Instruments—Credit Losses (Topic 326): Measurement of Credit Losses on Financial Instruments. ASU No. 2016-13 replaces the incurred loss model with an expected loss model, which is referred to as the current expected credit loss model, or CECL. ASU No. 2016-13 became effective for us on January 1, 2020. This standard required earlier recognition of expected credit losses on loans and certain other instruments, compared to the incurred loss model. The change to the CECL framework requires us to greatly increase the data we must collect and review to determine the appropriate level of the allowance for credit losses. The adoption of CECL may result in greater volatility in the level of the allowance for credit losses, depending on various factors and assumptions applied in the model, such as the forecasted economic conditions in the foreseeable future and loan payment behaviors. Any increase in the allowance for credit losses, or expenses incurred to determine the appropriate level of the allowance for credit losses, may have an adverse effect on our financial condition and results of operations. goodwill and other intangible assets could negatively impact our financial condition and results of operations.2020, goodwill and2023, other intangible assets, primarily core deposit intangibles, totaled $2.4 billion. Goodwill is reviewed$625 million. We review our other intangible assets for impairment at least annually or more frequently if events or changes in circumstances indicate that the carrying value may not be recoverable. A significant decline in expected future cash flows, a material change in interest rates, a significant adverse change in the business climate, slower growth rates, or a significant or sustained decline in the price of our common stockdeposits may necessitate taking additional charges in the future related to the impairment of goodwill and other intangible assets. The amount of any impairment charge could be significant and could have a material adverse impact on our financial condition and results of operations.the two.them all. The replacement of deposit funding with wholesale funding could cause our overall cost of funds to increase, which would reduce our net interest income and results of operations. A decline in interest-earning assets would also lower our net interest income and results of operations.A downgrade Downgrades of the credit ratings of the Company and the Bank, such as those announced by certain credit rating agencies in both February and March 2024, could alsoresult in an acceleration in deposit outflows and additional collateral needs, which this far have been modest. They could adversely affect our access to liquidity and capital, and could significantly increase our cost of funds, trigger additional collateral or funding requirements, and decrease the number of investors and counterparties willing to lend to us or to purchase our securities. This could affect our growth, profitability, and financial condition, including our liquidity.theour Series A Preferred Stock, Series B Preferred Stock and Series C Preferred Stock are discretionary and noncumulative, and may not be paid if such payment will result in our failure to comply with all applicable laws and regulations.theour Series A Preferred Stock, Series B Preferred Stock and Series C Preferred Stock are discretionary and noncumulative. If our Board of Directors (or any duly authorized committee of the Board) does not authorize and declare a dividend on (a) the Series A Preferred Stock for any dividend period, holders of the depositarydepository shares will not be entitled to receive any dividend for that dividend period, and the unpaid dividend will cease to accrue and be payable. Wepayable, or (b)Series B Preferred Stock and Series C Preferred Stock, the holders thereof will not be entitled to receive any dividend for that dividend period. For our Series A Preferred Stock, we have no obligation to pay dividends accrued for a dividend period after the dividend payment date for that period if our Board of Directors (or any duly authorized committee thereof) has not declared a dividend before the related dividend payment date, whether or not dividends on the Series A Preferred Stock or any other series of our preferred stock or our common stock are declared for any future dividend period. Dividends on our Series B Preferred Stock and Series C Preferred Stock are payable at a rate of 13 percent per annum, payable quarterly and in arrears. Additionally, under the FRB’s capital rules, dividends on the Series A Preferred Stock, Series B Preferred Stock and Series C Preferred Stock may only be paid out of our net income, retained earnings, or surplus related to other additional tier 1 capital instruments. In such a case,depositary shares will not be entitledright to receive a payment on account of the distribution of assets on any dividend for that dividend period,voluntary or involuntary liquidation, dissolution or winding up of our business before any payment may be made to holders of our common stock. Following the satisfaction of the liquidation preference, the Series B Preferred Stock and Series C Preferred Stock participates with our common stock on an as-converted basis in a liquidation, dissolution or winding up of the unpaid dividend will ceaseCompany. Our obligations to accruethe holders of our Series A Preferred Stock, Series B Preferred Stock and be payable.FRB.FRB and the OCC. Such regulation includes, among other matters, the level of leverage and risk-based capital ratios we are required to maintain. Depending on general economic conditions, changes in our capital position could have a materially adverse impact on our financial condition and risk profile, and also could limit our ability to grow through acquisitions or otherwise. Compliance with regulatory capital requirements may limit our ability to engage in operations that require the intensive use of capital and therefore could adversely affect our ability to maintain our current level of business or expand.NYSDFS;OCC; (2) the FDIC; (3) the FRB-NY; and (4) the CFPB, which was established in 2011 under the Dodd-Frank Actas well as state licensing restrictions and given broad authority to regulate financial service providers and financiallimitations regarding certain consumer finance products. and home sales, and an increase in the financial stress on borrowers stemming from high unemployment or other adverse economic conditions, could negatively affect our borrowers and, in turn, the repayment of the loans in our portfolio. Deterioration in economic conditions also could subject us and our industry to increased regulatory scrutiny, and could result in an increase in loan delinquencies, an increase in problem assets and foreclosures, and a decline in the value of the collateral for our loans, which could reduce our customers’ borrowing power. Deterioration in local economic conditions could drive the level of loan losses beyond the level we have provided for in our loan loss allowance; this, in turn, could necessitate an increase in our provisions for loan losses, which would reduce our earnings and capital.priceincluding our loan origination volume and liquidityrefinancing activity. In addition to being affected by interest rates, the secondary mortgage markets are also subject to investor demand for residential mortgage loans and investor yield requirements for these loans. These conditions may fluctuate or worsen in the future. Adverse market conditions, including increased volatility, changes in interest rates and mortgage spreads and reduced market demand, could result in greater risk in retaining mortgage loans pending their sale to investors. A prolonged period of secondary market illiquidity may result in a reduction of our loan mortgage production volume and could have a materially adverse effect on our financial condition and results of operations.could be adversely affected if the economy were to weakenor other securities (including warrants) or the capital markets wereissuance of securities pursuant to experience volatility.Thethe exercise of warrants issued by us may dilute existing holders of our common stock and other securities, decrease the value of our common stock and other securities and adversely affect the market price of our common stock could beand other securities.significant fluctuations dueregulatory capital requirements and regulatory changes could result in more stringent capital or liquidity requirements, including increases in the levels of regulatory capital we are required to maintain and changes in investor sentiment regardingthe way capital or liquidity is measured for regulatory purposes. Accordingly, we may seek to raise additional capital, including by pursuing or effecting additional issuances of our operations or business prospects. Amongsecurities. Our ability tothese risks may be affected by:•Operating results that vary from the expectations of our management or of securities analysts and investors;•Developments in our business or in the financial services sector generally;•Regulatory or legislative changes affecting ourincluding investor perceptions regarding the financial services and banking industry, generally or our business and operations;•Operating and securities price performance of companies that investors consider to be comparable to us;•Changes in estimates or recommendations by securities analysts or rating agencies;•Announcements of strategic developments, acquisitions, dispositions, financings, and other material events by us or our competitors;•Changes or volatility in global financial markets and economies, general market conditions, interest or foreign exchange rates, stock, commodity, credit, or asset valuations; and•Significant fluctuations in the capital markets.Economic or market turmoil could occur in the near or long term, which could negatively affect our business,conditions and governmental activities, and on our financial condition and our results of operations, as well as volatilityperformance.priceCompany in connection with which we sold and trading volumeissued (a) 76,630,965 shares of our common stock, at a purchase price per share of $2.00, (b) 192,062 shares of a new series of our preferred stock, par value $0.01 per share, designated as Series B Noncumulative Convertible Preferred Stock, at a price per share of $2,000, each share of which is convertible into 1,000 shares of common stock, (c) 256,307 shares of a new series of our preferred stock, par value $0.01 per share, designated as Series C Noncumulative Convertible Preferred Stock, at a price per share of $2,000, each share of which is convertible into 1,000 shares of common stock, and (d) warrants, which may not be exercised until 180 days after issuance thereof, affording the holder thereof the right, until the seven-year anniversary of the issuance of such warrant, to purchase for $2,500 per share, shares of a new class of non-voting, common-equivalent preferred stock of the Company, each share of which is convertible into 1,000 shares of common stock, and all of which shares of Series D NVCE Stock, upon issuance, will represent the right (on an as converted basis) to receive 315 million shares of common stock. of multi-family and CRE loans could adversely affect our ability to generate interest income, as well our financial condition and results of operations, perhaps materially.Although we also originate C&I and ADC loans, and invest in securities, our(91.2%(56 percent of total loans held for investment as of December 31, 2020)2023). Our leadership position in these markets has been instrumental to our production of solid earnings and our consistent record of exceptional asset quality. We monitor the ratio of our multi-family, CRE, and ADC loans (as defined in the CRE Guidance) to our total risk-based capital to ensure that we are infor compliance with regulatory guidance. Any inability to grow our multi-family and CRE loan portfolios, could negatively impact our ability to grow our earnings per share.would dependdepends on our ability to identify suitable merger partners and acquisition opportunities, our ability to finance and complete negotiated transactions at acceptable prices and on acceptable terms, and our ability to obtain the necessary shareholderstockholder and regulatory approvals.The inabilityreceive dividendschallenges in combining the operations of acquired or merged businesses, including our recent Flagstar acquisition and Signature acquisition, into our operations, which may prevent us from achieving the expected benefits from our subsidiary bankmerger and acquisition activities.orand results of operations.as well as our ability to maintain or increaseand future prospects.current level of cash dividends we pay to our shareholders.The Parent Company (i.e., the company on an unconsolidated basis) is a separate and distinct legal entity from the Bank, and a substantial portionexpedited nature of the revenuesFDIC-assisted transaction did not allow bidders the Parent Company receives consiststime and access to information customarily associated with preparing for and evaluating a negotiated transaction. As a result, fair value estimates we have made in connection with the Signature transaction may be inaccurate and subject to change, which could adversely impact our financial condition, results of dividendsoperations and future prospects. In addition, we may obtain additional information and evidence during the period of one year from March 20, 2023, the Bank. These dividends aredate we completed the primary funding source forSignature transaction, that may result in changes to the dividends we pay on our common stock andthe interest and principal payments on our debt. Various federal and state laws and regulations limitestimated amounts recorded as of December 31, 2023, which could change the amount of dividends that a bank may paythe bargain purchase gain we have recorded. Adjustments to its parent company. In addition, our right to participate in a distribution of assets upon the liquidation or reorganization of a subsidiarythis gain may be subject torecorded based on additional information received after the prior claimsacquisition date that affect the measurement of the subsidiary’s creditors. Ifassets acquired and liabilities assumed and any decrease in the Bank is unable to pay dividends to the Parent Company, we might not be able to service our debt, pay our obligations, or pay dividends on our common stock.Reduction or eliminationamount of our quarterly cash dividend could have an adverse impact on the market price of our common stock.Holders of our common stock are only entitled to receive such dividends as our Board of Directors may declare out of funds available for such payments under applicable law and regulatory guidance, and althoughbargain purchase gain we have historically declared cash dividends onrecorded could also adversely impact our common stock, we are not required to do so. Furthermore, the paymentfinancial condition, results of dividends falls under federal regulations that have grown more stringent in recent years. While we pay our quarterly cash dividend in compliance with current regulations, such regulations could change in the future. Any reduction or elimination of our common stock dividend in theoperations and future could adversely affect the market price of our common stock.occurrence of any failure, breach, or interruption in service involving our systems or thoseCompany, entities that we have acquired, and certain of our service providers have experienced information technology security breaches and may be vulnerable to future security breaches. These incidents have resulted in, and could damage our reputation, cause losses, increase our expenses, and result in, additional expenses, exposure to civil litigation, increased regulatory scrutiny, losses, and a loss of customers, an increase in regulatory scrutiny, or expose us to civil litigation and possibly financial liability, any of which could adversely impact our financial condition, results of operations, and the market price of our stock.third partythird-party service providers, to manage our customer relationships, our general ledger, our deposits, and our loans. In addition, our operations rely on the secure processing, storage, and transmission of confidential and other information in our computer systems and networks. Although we, and entities we have acquired, take and have taken protective measures and endeavor to modify them as circumstances warrant, the security of our computer systems, software, and networks, as well as the security of the computer systems, software, and networks of certain of our service providers, have been, and may in the future be, vulnerable to breaches, unauthorized access, misuse, computer viruses, or other malicious code and cyber-attacks that have had and could have an impact on information security. With the rise and permeation of online and mobile banking, the financial services industry in particular faces substantial cybersecurity risk due to the type of sensitive information provided by customers. We, and our third-party service providers, have been and may in the future be subject to cybersecurity incidents, including those that involve the unauthorized access to customer information affecting other financial institutions and industry groups. Our systems and those of our third-party service providers and customers are under constant threat,regularly the subject of attempted attacks that are increasingly sophisticated, and it is possible that we or they could experience a significant event in the future that could adversely affect our business or operations.If one or more ofCertain previously identified cyber incidents have resulted, and future such events were to occur,could result, in the breach of confidential and other information processed and stored in and transmitted through, our computer systems and networksnetworks. These events could potentially be jeopardized, or could otherwise cause interruptions or malfunctions in our operations or the operations of our customers, clients, or counterparties. Further, we may not know that an attack occurred until well after the event. Even after discovering an attempt or breach occurred, we may not know the extent of the impact of the attack for some period of time. This could cause us significant reputational damage or result in our experiencing significant losses.Furthermore, we We may also be required to expend significant additional resources to modify our protective measures or investigate and remediate vulnerabilities or other exposures arising from operational and security risks. Additional expenditures may be requiredrisks, including expenses for third-party expert consultants or outside counsel. We are currently subject to litigation regarding cyber incidents, and we also may be subject to future litigation and financial losses that either are not insured against or not fully covered through any insurance we maintain.procedures,controls, including an Incident Response Plan, to prevent or limit the impact of systems failures and interruptions, we may not be able to anticipate all possible security breaches that could affect our systems or information and there can be no assurance that such events will not occur or will be adequately prevented or mitigated by our policies, procedures and controls if they do.To some degree, ourOur ability to meet the needs of our customers competitively, and in a cost-efficient manner, is dependent on our ability to keep pace with technological advances and to invest in new technology as it becomes available. Many of our competitors have greater resources to invest in technology than we do and may be better equipped to invest in and market new technology-driven products and services. would make them difficult to replace. Competition for skilled leaders in our industry can be intense, and we may not be able to hire or retain the people we would like to have working for us. The unexpected loss of services of one or more of our key personnel could have a material adverse impact on our business, given the specialized knowledge of such personnel and the difficulty of finding qualified replacements on a timely basis. Furthermore, our ability to attract and retain personnel with the skills and knowledge to support our business may require that we offer additional compensation and benefits that would reduce our earnings.NoncomplianceBank Secrecymortgage loans they own. Due to the limited number of relationships, discontinuation of existing agreements with those third parties or adverse changes in contractual terms could have a significant negative impact to our mortgage servicing revenue. The terms and conditions in which a master servicer may terminate subservicing contracts are broad and could be exercised at the discretion of the master servicer without requiring cause. Additionally, the master servicer directs the oversight of custodial deposits associated with serviced loans and, to the extent allowable, could choose to transfer the oversight of the Bank's custodial deposits to another depository institution. Further, as servicer or subservicer of loans, we have certain contractual obligations, including foreclosing on defaulted mortgage loans or, to the extent applicable, considering alternatives to foreclosure. If we commit a material breach of our obligations as servicer, we may be subject to termination if the breach is not cured within a specified period of time following notice, causing us to lose servicing income.anti-money laundering statuteslending practices by lenders, including financial institutions. Mortgage and consumer lending practices raise compliance risks resulting from the detailed and complex nature of mortgage and consumer lending laws and regulations imposed by federal Regulatory Agencies as well as the relatively independent and diverse operating channels in which loans are originated. As we originate loans through various channels, we, and our third-party originators, are especially impacted by these laws and regulations and are required to implement appropriate policies and procedures to help ensure compliance with fair lending laws and regulations and to avoid lending practices that result in the disparate treatment of, or disparate impact to, borrowers across our various locations under multiple channels. Failure to comply with these laws and regulations, by us, or our third-party originators, could result in materialthe Bank being liable for damages to individual borrowers, changes in business practices, or other imposed penalties.loss.The BSAliability and/or adversely affect the market perception of us and the USA Patriot Act contain anti-money launderingour products and financial transparency provisions intended to detectservices as well as impact customer demand for those products and prevent the useservices. Some of the U.S.laws and regulations to which we are subject may provide a private right of action that a consumer or class of consumers may pursue to enforce these laws and regulations. We are currently subject to stockholder class and derivative actions which seek significant damages and other relief, and may be subject to similar actions in the future. Any financial system for money laundering and terrorist financing activities. The BSA, as amended by the USA Patriot Act, requires depository institutions to undertake activities including monitoring an anti-money laundering program, verifying the identity of clients, monitoring for and reporting suspicious transactions, reporting on cash transactions above a certain threshold, and responding to requests for information by regulatory authorities and law enforcement agencies. FINCEN, a unit of the U.S. Treasury Department that administers the BSA, is authorized to impose significant civil monetary penalties for violations of these requirements. Failure to maintain and implement adequate programs to combat money laundering and terrorist financing activities could also result inliability or reputational risk for the Company.Failure to maintain effective internal control over financial reporting in accordance with Section 404 of the Sarbanes-Oxley Act of 2002damage could have a materialmaterially adverse effect on our business and, stock price.public company,participant in the financial services industry, it is likely that we arewill be exposed to a high level of litigation and regulatory scrutiny relating to our business and operations. Although we establish accruals for legal or regulatory proceedings when information related to the loss contingencies represented by those matters indicates both that a loss is probable and that the amount of loss can be reasonably estimated, we do not have accruals for all legal or regulatory proceedings where we face a risk of loss. Due to the inherent subjectivity of the assessments and unpredictability of the outcome of legal and regulatory proceedings, amounts accrued may not represent the ultimate loss to us from the legal and regulatory proceedings in question. As a result, our ultimate losses may be significantly higher than the amounts accrued for legal loss contingencies. For further information, see Note 19 - Commitments and Contingencies and Item 3 - Legal Proceedings.maintain effective internal control over financial reportingpay interest on certain mortgage escrow accounts in accordance with Section 404certain state laws despite the Federal preemption under the National Bank Act.Sarbanes-Oxley Actwestern United States. We are defending similar litigation in California, and are currently appealing a federal district court judgment against us in that case to the Ninth Circuit. We are arguing that the Lusnak case was wrongly decided; we believe our situation can be distinguished from Lusnak as a matter of 2002. Internal control over financial reportinglaw and California’s interest on escrow law should be preempted as a matter of fact. If the Ninth Circuit’s holding is complex and may be revised over time to adapt to changes in our business,more broadly adopted by other Federal Circuits, including those covering states that currently have enacted, or changes in applicable accounting rules. We cannot assure you that our internal control over financial reporting will be effective in the future may enact, statutes requiring the payment of interest on escrow balances or if we would be required to retroactively credit interest on escrow funds, the Company’s earnings could be adversely affected.material weakness will not be discovered with respectfailure to a prior period for which we had previously believed that our internal control over financial reporting was effective.If we are not able to maintaindetect or document effective internal control over financial reporting, our independent registered public accounting firm will not be able to certify as to the effectiveness of our internal control over financial reporting. Matters impacting our internal control over financial reporting may cause us to be unable to report our financial information onmitigate fraud risks in a timely basis, or may cause usmanner. We are committed to restate previously issued financial information,ongoing investments and thereby subject usattention to adverse regulatory consequences, including sanctions or investigations by the SEC, or violations of applicable stock exchange listing rules.There could also be a negative reaction in the financial markets duecombat fraud and enhance our security measures to a loss of investor confidence in us and the reliability of our financial statements. Confidence in the reliability of our financial statements is also likely to suffer if we or our independent registered public accounting firm reports a material weakness in the effectiveness of our internal control over financial reporting. This could materially adversely affect us by, for example, leading to a decline in our stock price and impairing our ability to raise capital.Societal responses to climate change could adversely affect the Company’s businessperformance, including, in directly through impacts on the Company’sevolving expectations from customers, regulators, investors, and customers.Concernsother stakeholders with respect to our environmental, social, and governance practices may impose additional costs on us or expose us to new or additional risks.Recent EventsDeclarationItem 1B. Unresolved Staff Comments Item 1C. Cybersecurity Dividend on Common SharesOn January 26, 2021,protecting against unauthorized access to or use of customer data that has been entrusted to us as part of the various services provided to our customers; as well as operational disruptions caused by cybersecurity events, is of paramount importance to us. The Bank relies upon a formalized Information/Cybersecurity Program (“ICP”) to ensure we are protecting the confidentiality, integrity and availability of confidential information. The ICP is approved by the Board of Directors declaredor a quarterly cash dividendCommittee thereof annually, and is designed to identify reasonably foreseeable internal and external threats, assess the likelihood and potential damage these threats could cause, and assess the appropriateness of policies, standards and procedures used to identify and mitigate risk levels to within the documented risk appetite. The ICP has been designed to align with industry best practices, as well as Regulatory guidelines and laws; and leverages both the Secure Control and the National Institute of Standards and Technology Cybersecurity frameworks as its baselines.Company’s common stockCompany, including business strategy, results of $0.17 per share. operations or financial condition.dividend is payable on February 16, 2021Board of Directors, through its Risk Assessment (“RAC”) and Technology (“TEC”) Committees, (together the “Committees”) provides direction and oversight of both the enterprise risk management and information/cybersecurity risk management programs. The Committees meet monthly to common shareholders of record as of February 6, 2021.CARES ActCommittees rely upon various management level committees (e.g.The CARES Act was passed by Congresssigned into law on March 27, 2020, after the President declared a national emergency on March 13, 2020. It provides, among other things, moneyTechnology Management) for unemployment benefits, financial aid checks to individualsoversight and forgivable SBA loans, known as the Paycheck Protection Program (the “PPP”). This program provides loans to small businesses to keep their employees on payroll. The original funding was fully allocated by mid-April, and additional funding was made available on April 24, 2020, under the Paycheck Protection Program and Health Care Enhancement Act. The Company is a participant in the PPP, which resumed in January 2021. As of December 31, 2020, the Company funded approximately 1,400 requests totaling $117.1 million under the PPP. These loans were designated as held for sale as of quarter end. Of the $117.1 million in PPP loans. During early 2021, $18.1 million of PPP loans have been forgiven.In December 2020, Congress amended the CARES Act through the Consolidated Appropriations Act of 2021, which provided additional COVID-19 relief to American families and businesses, including extendingTDR relief under the CARES Act until the earlier of December 31, 2021, or 60 days following the terminationdirect management of the national emergency.overarching risk management framework, which includes the information/cybersecurity risk management program and direct reporting by the Chief Information Security Officer (“CISO”).ITEM 1B.Item 2.UNRESOLVED STAFF COMMENTSNone.ITEM 2.PROPERTIESFlorida.Michigan. We also utilize other branch and back-office locations in those states, and in New Jersey, Arizona, California, Indiana, and Arizona,Wisconsin under various lease and license agreements that expire at various times. (See Note 7, “Leases”8 - Leases in Item 8, “Financial Statements and Supplementary Data.”) We believe that our facilities are adequate to meet our present and immediately foreseeable needs.ITEMItem 3.LEGAL PROCEEDINGSITEMItem 4.MINE SAFETY DISCLOSURESNot applicable.ITEMItem 5.MARKET FOR REGISTRANT’S COMMON EQUITY, RELATED STOCKHOLDER MATTERS, AND ISSUER PURCHASES OF EQUITY SECURITIES2020,2023, the number of outstanding shares was 463,901,808722,066,370 and the number of registered owners was approximately 10,797.11,746. The latter figure does not include those investors whose shares were held for them by a bank or broker at that date.20202023 with the cumulative total returns on a broad market index (the S&P Mid-Cap 400 Index) and a peer group index (the SNLS&P U.S. Bank and ThriftBMI Banks Index) during the same time. The S&P Mid-Cap 400 Index was chosen as the broad market index in connection with the Company’s trading activity on the NYSE; the SNLS&P U.S. Bank and ThriftBMI Banks Index currently is comprised of 375258 bank and thrift institutions, including the Company. S&P Global Market Intelligence provided us with the data for both indices.20152018 and that all dividends paid since that date were reinvested. Such returns are based on historical results and are not intended to suggest future performance.Comparison of 5-Year Cumulative Total ReturnAmong New York Community Bancorp, Inc.,S&P Mid-Cap 400 Index, and SNL U.S. Bank and Thrift Index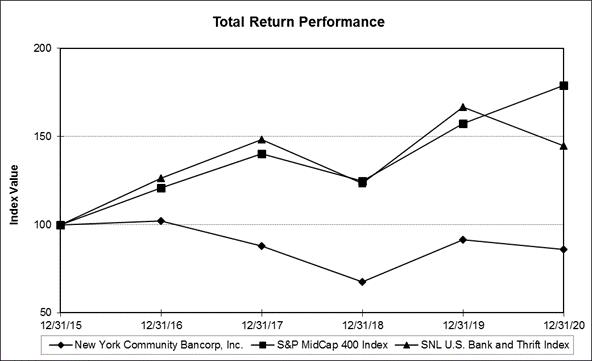
ASSUMES $100 INVESTED ON 2015 AND DIVIDEND REINVESTED2018 THROUGH DECEMBER 31, 2023
12/31/2018 12/31/2019 12/31/2020 12/31/2021 12/31/2022 12/31/2023 New York Community Bancorp, Inc. $ 100.00 $ 135.38 $ 127.51 $ 156.41 $ 118.03 $ 149.75 S&P Mid-Cap 400 Index $ 100.00 $ 126.20 $ 143.44 $ 178.95 $ 155.58 $ 181.15 S&P U.S. BMI Banks Index $ 100.00 $ 137.36 $ 119.83 $ 162.92 $ 135.13 $ 147.41 their exercise of stock options and the vesting of their stock awards. Shares that are withheld for this purpose are repurchased pursuant to the terms of the applicable stock-based incentive plan, rather than pursuant to the share repurchase program authorized by the Board of Directors, described below.2020,2023, the Company has approximately $16.9$9 million remaining under this repurchase authorization.2020,2023, the Company repurchased $59.0$12 million or 5.81 million shares of its common stock. Included in the above, the Company allocated 783,238 shares or $8.8 million toward the repurchase of shares tied to its stock-based incentive plans.stock:(dollars in millions, except share data) Period Total Shares of Common Stock Repurchased Average Price Paid per Common Share Total Allocation Total Shares of Common Stock Purchased as Part of Publicly Announced Plans or Programs First Quarter 2023 976,454 $ 9.33 $ 9 0 Second Quarter 2023 190,177 10.36 2 0 Third Quarter 2023 33,956 12.50 0 0 Fourth Quarter 2023 October 1 - 31, 2023 1,525 10.29 0 — November 1 - 30, 2023 4,897 9.34 — — December 1 - 31, 2023 50,526 9.92 1 — Total Fourth Quarter 2023 56,948 $ 16.57 1 — 2023 Total 1,257,535 $ 9.59 $ 12 — ITEMItem 6.SELECTED FINANCIAL DATA(1)Average loans for 2016 includes covered loans.ITEMItem 7.MANAGEMENT’S DISCUSSION AND ANALYSIS OF FINANCIAL CONDITION AND RESULTS OF OPERATIONSFor the purpose of this discussion and analysis, the words “we,” “us,” “our,” and the “Company” are used to refer to New York Community Bancorp, Inc. and our consolidated subsidiaries, including New York Community Bank (the “Bank”).Executive SummaryNew York Community Bancorp, Inc. is the holding company for New York Community Bank, with 237 branches in Metro New York, New Jersey, Ohio, Florida, and Arizona. 2020, we had2023, total assets were $114.1 billion, up $23.9 billion compared to December 31, 2022. Total deposits were $81.5 billion at December 31, 2023, up $22.8 billion from December 31, 2022. These year-to-date increases were primarily due to our March 20, 2023, assumption of $56.3 billion, including total loansa substantial amount of $43.0 billion, totalthe deposits and certain identified liabilities and the acquisition of $32.4 billion,certain assets and total stockholders’ equitylines of $6.8 billion.Chartered in the Statebusiness of New York, theSignature Bridge Bank, is subject to regulation byfrom the FDIC the CFPB, and the NYSDFS. In addition, the holding company is subject to regulation by the FRB, the SEC, andas receiver for Signature Bridge Bank (the “Signature Transaction”). See Note 3 - Business Combinations to the requirements ofConsolidated Financial Statements for further information regarding the NYSE, where shares of our common stock are traded under the symbol “NYCB” and shares of our preferred stock trade under the symbol “NYCB PA.”As a publicly traded company, our mission is to provide our shareholders with a solid return on their investment by producing a strong financial performance, maintaining a solid capital position, and engaging in corporate strategies that enhance the value of their shares. Signature Transaction.twelve monthsyear ended December 31, 2020,2023, net loss was $79 million as compared to net income totaled $511.1of $650 million up 29% compared to the $395.0 million we reported for the twelve monthsyear ended December 31, 2019. Full-year 2020 results were impacted by $68.4 million income tax benefit related2022. Net loss available to certain tax provisionscommon stockholders for corporations under the CARES ACT. Excluding this tax benefit, net income, on a non-GAAP basis, for full-year 2020 was $442.7 million up 12% compared to full-year 2019.For the twelve monthsyear ended December 31, 2020,2023 was $112 million, compared to net income available to common shareholders was $478.3$617 million up 32% compared to $362.2 million we reported for the twelve monthsyear ended December 31, 2019. On a non-GAAP, net income available to common shareholders2022. Diluted (loss) earnings per share totaled $(0.16) for full-year 2020 was $409.9 million, up 13%the year ended December 31, 2023 compared to full-year 2019.key trends during 2020 were:Double-Digit Expansionnet loss for 2023 primarily reflects a goodwill impairment of $2.4 billion recorded in the Net Interest MarginDuring full-year 2020, our NIM increased by double-digits compared to full-year 2019. This improvement was driven by a significant decline in our overall cost of funds largely fueled by lower deposit costs. During 2020, the Company benefited by the FRB’s near-zero interest rate policy as we proactively reduced our CDs. This wasfourth quarter partially offset by a decline in asset yields.For$2.1 billion bargain gain on the twelve months ended December 31, 2020, the NIM was 2.24%, up 22 bp compared to the twelve months ended December 31, 2019. Prepayment income contributed 11 bp to the NIM in 2020 compared to 12 bp in 2019. Excluding the impact from prepayment income, the NIM for full-year, on a non-GAAP basis, was 2.13%, up 23 bp compared to 2019.Signature Transaction. During the fourth quarter of 2020,2023, management also took decisive actions to build capital, reinforce our balance sheet, strengthen our risk management processes, and better align ourselves with the NIM increased 43 bprelevant bank peers. We significantly built our reserve levels by recording a $552 million provision for loan losses, bringing our allowance for credit losses to 2.47%$992 million at December 31, 2023, reflecting our actions to build reserves during the quarter to address weakness in the office sector, potential repricing risk in the multi-family portfolio and conditions leading to increases in classified assets, which better aligns the Company with its relevant bank peers, including Category IV banks. In addition, we added on-balance sheet liquidity as we prepare for the enhanced prudential standards that apply to banks with $100 billion or more in total assets.fourth quarterincrease is attributable to the $9.9 billion of 2019. ExcludingC&I loans acquired in the impact from prepayment income, the fourth-quarter 2020 NIM, on a non-GAAP basis,Signature Transaction along with continued growth through new originations.2.30%, up 40 bp$37.3 billion at December 31, 2023, down slightly compared to $38.1 billion at December 31, 2022. At December 31, 2023, multi-family loans represented 44 percent of total loans, compared to 55 percent at December 31, 2022, further demonstrating the year-ago fourth quarter.Strong Growthreduction of our concentration in this asset class.The double-digit improvement in the NIM was a key driver of the strong growth in net interest income we experienced during 2020. twelve monthsyear ended December 31, 20202023, net interest income totaled $1.1$3.1 billion, up $142.7 million$1.7 billion or 15%120 percent compared to $957.4 million for the twelve monthsyear ended December 31, 2019.2022. The year-over-year improvement was due to lower interest expense, owing to lower funding cost, whichincrease was primarily the result of lower CD rates. the Flagstar acquisition, which closed in late 2022, and the Signature transaction, which closed in late March of 2023.twelve monthsyear ended December 31, 2020, prepayment income totaled $54.4 million, relatively unchanged2023, net interest margin was 2.99 percent, up sixty-four basis points compared to prepayment income for the twelve monthsyear ended2019. Excluding2022. The year-over-year increase was primarily the result of a larger balance sheet driven by both the Flagstar acquisition and the Signature transaction, and due to organic loan growth, along with the impact from prepayment income, netof higher interest income, on a non-GAAP basis, increased $142.5 million or 16%rates.$1.0 billion for full-year 2020total assets equaled 0.39 percent compared to $903.2 million for full-year 2019.Our Asset Quality Metrics and Loan Deferrals ImprovedThe Company’s overall asset quality metrics remain very strong during 2020 as NPAs declined significantly compared to full year 2019. NPAs0.17 percent at December 31, 2020 totaled $46.1 million or eight bp of2022 while NPL to total assets, down $27.4 million or 37%loans equaled 0.51 percent compared to $73.5 million or 14 bp of total assets0.20 percent at December 31, 2019.To date, we have also been successful with2022. The increase in NPLs was primarily driven by a $125 million increase in multi-family loans and a $108 million in commercial real estate loans. Repossessed assets of $14 million were slightly higher compared to $12 million in the prior year.loan deferral to help those borrowersprimary source of income. Its level is a function of the average balance of our interest-earning assets, the average balance of our interest-bearing liabilities, and the spread between the yield on such assets and the cost of such liabilities. These factors are influenced by both the pricing and mix of our interest-earning assets and our interest-bearing liabilities which, in turn, are impacted by the COVID-19 pandemic. The majority of our full-payment loan deferrals were eligible to come off their six-month deferral period during fourth quarter 2020. Accordingly, at December 31, 2020, 99% or $6.0 billion of our full-payment loan deferrals have returned to payment status. As of that date, $83.6 million of full-payment deferrals currently remain on deferral and are eligible to come off their deferral period during the first two months of 2021.External FactorsThe following is a discussion of certainvarious external factors, that tend to influence our financial performanceincluding the local economy, competition for loans and deposits, the strategic actions we take.Interest RatesAmongmonetary policy of the external factors that tend to influence our performance, theFOMC, and market interest rate environment is key. Just as short-term interest rates affect therates.thatborrowed funds is largely based on short-term rates of interest, the level of which is partially impacted by the actions of the FOMC.we borrow,rate generally impacts the cost of our short-term borrowings and deposits, the yields on our held-for-investment loans and other interest-earning assets are not as sensitive to intermediate-term market interest rates.affectmay trigger an increase in refinancing and, therefore, prepayment income, so too may an increase in market interest rates. It is not unusual for borrowers to lock in lower interest rates when they expect, or see, that market interest rates are rising rather than risk refinancing later at a still higher interest rate. The impact of prepayments on the current quarter and year was minimal.For the Years Ended December 31, 2023 2022 2021 (dollars in millions) Average Balance Interest Average Yield/Cost Average Balance Interest Average Yield/Cost Average Balance Interest Average Yield/Cost ASSETS: Interest-earning assets: $ 81,855 $ 4,509 5.51 % $ 49,376 $ 1,848 3.74 % $ 43,200 $ 1,525 3.53 % 10,611 444 4.18 % 7,448 200 2.69 % 6,625 156 2.35 % Reverse repurchase agreements 388 22 5.77 % 460 15 3.24 % 430 4 1.05 % Interest-earning cash and cash equivalents 10,025 516 5.14 % 1,988 29 1.47 % 2,016 4 0.17 % Total interest-earning assets $ 102,879 $ 5,491 5.34 % $ 59,272 $ 2,092 3.53 % $ 52,271 $ 1,689 3.23 % Non-interest-earning assets 7,616 5,130 5,275 Total assets $ 110,495 $ 64,402 $ 57,546 LIABILITIES AND STOCKHOLDERS' EQUITY: Interest-bearing deposits: Interest-bearing checking and money market accounts $ 29,286 $ 943 3.22 % $ 17,910 $ 226 1.26 % $ 12,829 $ 31 0.24 % Savings accounts 9,941 169 1.70 % 9,336 60 0.64 % 7,612 28 0.36 % Certificates of deposit 17,097 646 3.78 % 8,772 97 1.11 % 9,094 55 0.60 % Total interest-bearing deposits $ 56,324 $ 1,758 3.12 % $ 36,018 $ 383 1.06 % $ 29,535 $ 114 0.38 % Short term borrowed funds 7,263 305 4.20 % 2,408 56 2.32 % 2,343 8 0.34 % Other borrowed funds 10,671 351 3.29 % 12,982 257 1.99 % 13,366 278 2.08 % Total borrowed funds $ 17,934 $ 656 3.66 % $ 15,390 $ 313 2.04 % $ 15,709 $ 286 1.82 % Total interest-bearing liabilities $ 74,258 $ 2,414 3.25 % $ 51,408 $ 696 1.35 % $ 45,244 $ 400 0.88 % Non-interest-bearing deposits 21,583 5,124 4,578 Other liabilities 4,073 787 790 Total liabilities $ 99,914 $ 57,319 $ 50,612 Stockholders’ equity 10,581 7,083 6,934 Total liabilities and stockholders’ equity $ 110,495 $ 64,402 $ 57,546 Net interest income/interest rate spread $ 3,077 2.09 % $ 1,396 2.17 % $ 1,289 2.35 % Net interest margin 2.99 % 2.35 % 2.47 % Ratio of interest-earning assets to interest-bearing liabilities 1.39 x 1.15 x 1.16 x we produceheld for sale and non-performing loans.For the Years Ended December 31, 2023 compared to Year Ended 2022
Increase/(Decrease) Due to:2022 compared to Year Ended 2021
Increase/(Decrease) Due to:(in millions) Volume Rate Net Volume Rate Net INTEREST-EARNING ASSETS: Mortgage and other loans and leases, net $ 1789 $ 872 $ 2661 $ 231 $ 92 $ 323 Securities 132 112 244 22 22 44 Reverse repurchase agreements (4) 11 7 1 10 11 Interest Earning cash and cash equivalents 413 74 487 — 25 25 Total interest-earnings assets 2,327 1,072 3,399 247 156 403 INTEREST-BEARING LIABILITIES: Interest-bearing checking and money market accounts 366 351 717 64 131 195 Savings accounts 10 99 109 11 21 32 Certificates of deposit 315 234 549 (4) 46 42 Short term borrowed funds 204 45 249 2 46 48 Other borrowed funds (76) 170 94 (8) (13) (21) Total interest-bearing liabilities 743 975 1,718 83 213 296 Change in net interest income $ 1,584 $ 97 $ 1,681 $ 164 $ (57) $ 107 For the Years Ended December 31, (in millions) 2023 2022 2021 Bargain purchase gain $ 2,131 $ 159 $ — Fee income 172 27 23 Net return on mortgage servicing rights 103 6 — Net gain on loan sales and securitizations 89 5 — Other 68 17 9 Bank-owned life insurance 43 32 29 Net loan administration income 82 3 — Net loss on securities (1) (2) — Total non-interest income $ 2,687 $ 247 $ 61 which we invest.As further discussed under “Loans Held for Investment” later onthe Signature Transaction. Included in this discussion, the interest rates on our multi-family loans and CRE credits generallyDecember 31, 2023 balance are based on$247 million in non-interest-bearing custodial deposits related to the five-year and seven-year CMT. Signature Transaction.high, low, and average five- and seven-year CMT rates in 2020 and 2019:Because the multi-family and CRE loans we produce generate income when they prepay (which is recorded as interest income), the impact of repayment activity can be especially meaningful. In 2020, prepayment income from loans contributed $52.1 million to interest income; in the prior year, the contribution was $48.9 million.Economic IndicatorsWhile we attribute our asset quality to the nature of the loans we produce and our conservative underwriting standards, the qualitycomposition of our assets can also be impacted by economic conditions in our local marketsloan portfolio:At December 31, 2023 2022 (in millions) Amount Percent of Loans Held for Investment Amount Percent of Loans Held for Investment Mortgage Loans: Multi-family $ 37,265 44.0 % $ 38,130 55.3 % Commercial real estate 10,470 12.4 % 8,526 12.4 % One-to-four family first mortgage 6,061 7.2 % 5,821 8.4 % Acquisition, development, and construction 2,912 3.4 % 1,996 2.8 % Total mortgage loans $ 56,708 67.0 % $ 54,473 78.9 % Other Loans: Commercial and industrial $ 25,254 29.9 % $ 12,276 17.8 % Other loans 2,657 3.1 % 2,252 3.3 % Total other loans held for investment $ 27,911 33.0 % $ 14,528 21.1 % Total loans and leases held for investment $ 84,619 100.0 % $ 69,001 100.0 % Allowance for credit losses on loans and leases (992) (393) Total loans and leases held for investment, net $ 83,627 $ 68,608 Loans held for sale 1,182 1,115 Total loans and leases, net $ 84,809 $ 69,723 throughout the United States. The information that follows consists of recent economic data that we consider to be germane to our performance and the markets we serve.presentssets forth the generally negative trend in unemploymentmaturity or period to repricing of our portfolio of loans held for investment at December 31, 2023. Loans that have adjustable rates are shown as reported by the U.S. Department of Labor, both nationally andbeing due in the various markets that comprise our footprint. The year-over-yearincrease in the unemploymentperiod during which their interest rates across our footprint is dueare next subject to the COVID-19 pandemic and resultant business shutdowns.change.(in millions) Multi- Family Commercial Real Estate One-to- Four Family Acquisition, Development, and Construction Other Total Loans Amount due: Within one year $ 3,530 $ 1,233 $ 14 $ 1,049 $ 8,323 $ 14,149 After one year: One to five years 28,419 7,946 54 1,775 14,973 53,167 Over five years to fifteen years 5,314 1,263 297 25 3,280 10,179 Over fifteen years 2 28 5,696 63 1,335 7,124 Total due or repricing after one year 33,735 9,237 6,047 1,863 19,588 70,470 Total amounts due or repricing, gross $ 37,265 $ 10,470 $ 6,061 $ 2,912 $ 27,911 $ 84,619 The CPI measures the average change over time in the prices paid by urban consumers for a market basket of consumer goods and services. indicates the change in the CPI for the twelve months ended at each of the indicated dates:Economic activity also is indicated by the Consumer Confidence Index®, which declined to 87.1 in December 2020 compared to 128.2 in December 2019. An index level of 90 or more is considered indicative of a strong economy.The following chart illustrates the relative stability of the rental vacancy rate in New York City for all rental units and for rent stabilized units, from 1991 through 2017, as compared to the changes in average unemployment rates in New York City during those years. As the New York City rental vacancy rate is only reported every three years, the annual average unemployment rate in New York City is provided for those years only. As you can see the vacancy rates for rent stabilized units are lower, in some years, meaningfully lower, then the vacancy rates for all rental units.New York City Rental Vacancy Rates to Unemployment Rates(1)Source: Selected Initial Findings of the New York City Housing and Vacancy Survey(2)Source: http://www.labor.ny.gov/stats/laus.aspCritical Accounting PoliciesWe consider certain accounting policies to be critically important to the portrayal of our financial condition and results of operations, since they require management to make complex or subjective judgments, some of which may relate to matters that are inherently uncertain. The inherent sensitivity of our consolidated financial statements to these critical accounting policies, and the judgments, estimates, and assumptions used therein, could have a material impact on our financial condition or results of operations.We have identified the following to be critical accounting policies: the determination of the allowance for loan losses and the determination of the amount, if any, of goodwill impairment.The judgments used by management in applying these critical accounting policies may be influenced by adverse changes in the economic environment, which may result in changes to future financial results.Allowance for Credit LossesThe Company’s January 1, 2020, adoption of ASU No. 2016-13, “Measurement of Credit Losses on Financial Instruments,” resulted in a significant change to our methodology for estimating the allowance since December 31, 2019. ASU No. 2016-13 replaced the incurred loss methodology with an expected loss methodology that is referred to as the CECL methodology. The measurement of expected credit losses under CECL is applicable to financial assets measured at amortized cost, including loan receivables. It also applies to off-balance sheet exposures not accounted for as insurance and net investments in leases accounted for under ASC Topic 842. At December 31, 2019, the allowance for credit losses on loans and leases totaled $147.6 million. On January 1, 2020, the Company adopted the CECL methodology under ASU Topic 326 and recognized an increase in the allowance for credit losses on loans and leases of $1.9 million as a “Day 1” transition adjustment from changes in methodology, with a corresponding decrease in retained earnings. Separately, at December 31, 2019, the Company had an allowance for unfunded commitments of $461,000. Upon adoption, the Company recognized an increase in the allowance for unfunded commitments of $12.5 million as a “Day 1” transition adjustment with a corresponding decrease in retained earnings.The allowance for credit losses on loans and leases is deducted from the amortized cost basis of a financial asset or a group of financial assets so that the balance sheet reflects the net amount the Company expects to collect. Amortized cost is the unpaid loan balance, net of deferred fees and expenses, and includes negative escrow. Subsequent changes (favorable and unfavorable) in expected credit losses are recognized immediately in net income as a credit loss expense or a reversal of credit loss expense. Management estimates the allowance by projecting and multiplying together the probability-of-default, loss-given-default and exposure-at-default depending on economic parameters for each month of the remaining contractual term. Economic parameters are developed using available information relating to past events, current conditions, and economic forecasts. The Company’s economic forecast period is 24 months, and afterwards reverts to a historical average loss rate on a straight line basis over a 12 month period. Historical credit experience provides the basis for the estimation of expected credit losses, with qualitative adjustments made for differences in current loan-specific risk characteristics such as differences in underwriting standards, portfolio mix, delinquency levels and terms, as well as for changes in environmental conditions, such as changes in legislation, regulation, policies, administrative practices or other relevant factors. Expected credit losses are estimated over the contractual term of the loans, adjusted for forecasted prepayments when appropriate. The contractual term excludes potential extensions or renewals. The methodology used in the estimation of the allowance for loan and lease losses, which is performed at least quarterly, is designed to be dynamic and responsive to changes in portfolio credit quality and forecasted economic conditions. Each quarter the Company reassesses the appropriateness of the economic forecasting period, the reversion period and historical mean at the portfolio segment level, considering any required adjustments for differences in underwriting standards, portfolio mix, and other relevant data shifts over time.The allowance for credit losses on loans and leases is measured on a collective (pool) basis when similar risk characteristics exist. The portfolio segment represents the level at which a systematic methodology is applied to estimate credit losses. Management believes the products within each of the entity’s portfolio segments exhibit similar risk characteristics. Smaller pools of homogenous financing receivables with homogeneous risk characteristics were modeled using the methodology selected for the portfolio segment. The macroeconomic data used in the quantitative models are based on a reasonable and supportable forecast period of 24 months. The Company leverages economic projections including property market and prepayment forecasts from established independent third parties to inform its loss drivers in the forecast. Beyond this forecast period, the Company reverts to a historical average loss rate. This reversion to the historical average loss rate is performed on a straight-line basis over 12 months.Loans that do not share risk characteristics are evaluated on an individual basis. These include loans that are in nonaccrual status with balances above management determined materiality thresholds depending on loan class and also loans that are designated as TDR or “reasonably expected TDR” (criticized, classified, or maturing loans that will have a modification processed within the next three months). In addition, all taxi medallion loans are individually evaluated. If a loan is determined to be collateral dependent, or meets the criteria to apply the collateral dependent practical expedient, expected credit losses are determined based on the fair value of the collateral at the reporting date, less costs to sell as appropriate.The Company maintains an allowance for credit losses on off-balance sheet credit exposures. The Company estimates expected credit losses over the contractual period in which the Company is exposed to credit risk via a contractual obligation to extend credit, unless that obligation is unconditionally cancellable by the Company. The allowance for credit losses on off-balance sheet credit exposures is adjusted as a provision for credit losses expense. The estimate includes consideration of the likelihood that funding will occur and an estimate of expected credit losses on commitments expected to be funded over their estimated life. The Company examined historical credit conversion factor (“CCF”) trends to estimate utilization rates, and chose an appropriate mean CCF based on both management judgment and quantitative analysis. Quantitative analysis involved examination of CCFs over a range of fund-up windows (between 12 and 36 months) and comparison of the mean CCF for each fund-up window with management judgment determining whether the highest mean CCF across fund-up windows made business sense. The Company applies the same standards and estimated loss rates to the credit exposures as to the related class of loans.Goodwill ImpairmentThe Company adopted, on a prospective basis, ASU No. 2017-04, Intangibles—Goodwill and Other (Topic 350): Simplifying the Test for Goodwill Impairment on January 1, 2020. We have significant intangible assets related to goodwill andsets forth, as of December 31, 2020, we had goodwill of $2.4 billion. In connection with our acquisitions,2023, the assets acquired and liabilities assumed are recorded at their estimated fair values. Goodwill represents the excess of the purchase price of our acquisitions over the fair value of identifiable net assets acquired, including other identified intangible assets. We test our goodwill for impairment at the reporting unit level. We have identified one reporting unit which is the same as our operating segment and reportable segment. If we change our strategy or if market conditions shift, our judgments may change, which may result in adjustments to the recorded goodwill balance.We perform our goodwill impairment test in the fourth quarter of each year, or more often if events or circumstances warrant. For annual goodwill impairment testing, we have the option to first perform a qualitative assessment to determine whether it is more likely than not that the fair value of a reporting unit is less than its carrying amount, including goodwill and other intangible assets. If we conclude that this is the case, we would compare the fair value the reporting unit with its carrying amount and recognize an impairment charge for the amount by which the carrying amount exceeds the reporting unit’s fair value. The loss recognized, however, would not exceed the totaldollar amount of goodwill allocated to that reporting unit. Additionally, we would consider income tax effects from any tax deductible goodwill on the carrying amount of the reporting unit when measuring the goodwill impairment loss, if applicable. As of December 31, 2020, the Company’s goodwill was not impaired.FINANCIAL CONDITIONBalance Sheet SummaryAt December 31, 2020, total assets were $56.3 billion, up $2.7 billion or 5.0% on a year-over-year basis. Our asset growth was largely the result of loan growth and, a $1.2 billion increase in the balance of cash and cash equivalents. This was funded through a combination of growth in deposits and in wholesale borrowings.Totalall loans held for investment rose $989.4 million or 2.4% on a year-over-year basis to $42.9 billion, as the multi-family loan portfolio increased $1.1 billion or 3.5% to $32.3 billion and the specialty finance portfolio rose $439.2 million or 16.8% to $3.1 billion.Total securities, consisting mainly of available-for-sale securities declined modestly to $5.8 billion compared to $5.9 billion on a year-over-year basis.On the liability side, total deposits rose $779.7 million or 2.5% to $32.4 billion compared to the balance at year-end 2019, while total borrowed funds increased $1.5 billion or 10.5% to $16.1 billion. Most of the growth in borrowings occurred in the fourth quarter of the year.Total stockholders’ equity atthat are due after December 31, 2020 was $6.8 billion, up $130.0 million compared to the balance at December 31, 2019. Common stockholders’ equity to total assets was 11.26% compared to 11.57% at December 31, 2019. Book value per common share was $13.66 at December 31, 2020 compared to $13.29 at December 31, 2019.On a non-GAAP basis2024, and excluding goodwillindicates whether such loans have fixed or adjustable rates of $2.4 billion at both December 31, 2020 and 2019, tangible common stockholders’ equity totaled $3.9 billion at year-end 2020, compared to $3.8 billion at year-end 2019. Tangible common stockholders’ equity to tangible assets was 7.26% at December 31, 2020 compared to 7.39% at December 31, 2019. Tangible book value per common share at December 31, 2020 was $8.43 compared to $8.09 at December 31, 2019.LoansLoans Held for Investment(in millions) Fixed Adjustable Total Mortgage Loans: Multi-family $ 8,758 $ 24,977 $ 33,735 Commercial real estate 3,381 5,856 9,237 One-to-four family first mortgage 2,201 3,846 6,047 Acquisition, development, and construction 121 1,742 1,863 Total mortgage loans 14,461 36,421 50,882 Other loans 9,836 9,752 19,588 Total loans $ 24,297 $ 46,173 $ 70,470 majority of the loans we produce are multi-family loans. Ourfollowing table summarizes our production of multi-family loans began several decades ago in the five boroughs of New York City, where the majority of the rental units currently consist of rent-regulated apartments featuring below-market rents. In addition to multi-family loans, our loan portfolio contains a large number of CRE credits, most of which are secured by income-producing properties located in New York City and on Long Island.In addition to multi-family loans and CRE loans, our specialty finance loans and leases have become an increasingly larger portion of our overall loan portfolio. The remainder of our portfolio includes smaller balances of C&I loan, one-to-four family loans, ADC loans, and other loans held for investment. The majority of our C&I loans consist of loans to small- and mid-size businesses.In 2020, we originated $12.9 billion of loans, a $2.3 billion or a 21.3% increase from the prior year. The higher level of originations was largely driven by a 46% increase in multi-family originations, offset by declines in each of the other loan segments.For the Years Ended December 31, 2023 2022 (in millions) Amount Percent of Total Amount Percent of Total Mortgage Loan Originated for Investment: Multi-family $ 839 4.0 % $ 8,387 49.2 % Commercial real estate 1,092 5.3 % 1,086 6.4 % One-to-four family first mortgage 3,739 18.1 % 328 1.9 % Acquisition, development, and construction 1,571 7.6 % 149 0.9 % Total mortgage loans originated for investment $ 7,241 35.0 % $ 9,950 58.4 % Other Loans Originated for Investment: Specialty finance $ 7,326 35.4 % $ 6,001 35.2 % Commercial and industrial 4,942 23.9 % 1,016 6.0 % Other 1,178 5.7 % 83 0.4 % Total other loans originated for investment $ 13,446 65.0 % $ 7,100 41.6 % Total loans originated for investment $ 20,687 100.0 % $ 17,050 100.0 % Multi-family loans are our principal asset. rents—a market we refer to as our “primary lending niche.” Consistent with our emphasis on multi-family lending,rents.originations represented $8.7portfolio was $37.3 billion or 67.8%, of the loans we produced for investment in 2020.At December 31, 2020, multi-family loans represented $32.2 billion, or 75.3%, of total loans held for investment, reflecting a year-over-year increase of $1.1 billion, or 3.5%. The multi-family portfolio has an average principal balance of $6.6 million and a weighted average life of 2.3 years at December 31, 20202023, down slightly compared to $6.4 million and 2.0 years, respectively,$38.1 billion at December 31, 2019.2022 due to a combination of higher interest rates and our loan diversification strategy.2020, $26.52023, $21.1 billion or 82.1%57 percent of the Company’s total multi-family loan portfolio is secured by properties in New York State, and, therefore,of which $18.3 billion are subject to the new rent regulation laws.Of the $18.3 billion properties subject to rent regulation, approximately 38 percent are currently in an interest only period.The weighted average LTV of the NYSNew York State rent regulated multi-family portfolioportfolio was 54.08% 58 percent as of December 31, 2020,2023 as compared to a weighted average LTV of 57.26% for the entire multi-family loan portfolio57 percent at that date.December 31, 2022.tiedindexed to the prime rate of interest,CME Term SOFR or Prime, plus a spread. Alternately, the borrower may opt for a fixed rate that is tied to the five-year fixed advance rate of the FHLB-NY, plus a spread. The fixed-rate option also requires the payment of one percentage point of the then-outstanding loan balance. In either case, the minimum rate at repricing is equivalent to the rate in the initial five-or seven-year term. As the rent roll increases, the typical property owner seeks to refinance the mortgage, and generally does so before the loan reprices in year six or eight.only recorded when the cash is received.duration and, because the multi-family market is largely broker-driven, the expense incurred in sourcing such loans is substantially reduced.Our emphasis on multi-family loans is driven by several factors, including their structure, which reduces our exposure to interest rate volatility to some degree. Another factor driving our focus on multi-family lending has been the comparative quality of the loans we produce. Reflecting the nature of the buildings securing our loans, our underwriting standards, and the generally conservative LTV ratios our multi-family loans feature atorigination, a relatively small percentage of the multi-family loans that have transitioned to non-performing status have actually resulted in losses, even when the credit cycle has taken a downward turn. The sales approach is subject to fluctuations in the real estate market, as well as general economic conditions, and is therefore likely to be more risky in the event of a downward credit cycle turn. We also consider a variety of other factors, including the physical condition of the underlying property; the net operating income of the mortgaged premises prior to debt service; the DSCR, which is the ratio of the property’s net operating income to its debt service; and the ratio of the loan amount to the appraised value (i.e., the LTV) of the property.120%120 percent on multi-family buildings at origination, we obtain a security interest in the personal property located on the premises, and an assignment of rents and leases. Our multi-family loans generally represent no more than 75%75 percent of the lower of the appraised value or the sales price of the underlying property, and typically feature an amortization period of 30 years. In addition, our multi-family loans may contain an initial interest-only period which typically does not exceed two years; however, these loans are underwritten on a fully amortizing basis.Accordingly, while Exceptions to these levels are made to borrowers on a case by case basis and approved by the joint authority of credit and lending officers and when necessary, the Board Credit Committee of the Board.lending niche has not been immune to downturns in the credit cycle, the limited number of losses we have recorded, even in adverse credit cycles, suggests that the multi-family loans we produce involve less credit risk than certain other types of loans.markets. In general, buildings that are subject to rent regulation have historically tended to be stable, with occupancy levels remaining more or less constant over time. Because the rents are typically below market and the buildings securing our loans are generally maintained in good condition, they have been more likely to retain their tenants in adverse economic times. In addition, we generally exclude any short-term property tax exemptions and abatement benefits the property owners receive when we underwrite our multi-family loans.At December 31, 2023 Multi-Family Loans (in millions) Amount Percent of Total New York City: Manhattan $ 6,893 18 % Brooklyn 5,840 16 % Bronx 3,619 10 % Queens 2,831 8 % Staten Island 133 — % Total New York City $ 19,316 52 % New Jersey 5,064 14 % Long Island 509 1 % Total Metro New York $ 24,889 67 % Other New York State 1,233 3 % Pennsylvania 3,682 10 % Florida 1,681 5 % Ohio 1,085 3 % Arizona 434 1 % All other states 4,261 11 % Total $ 37,265 100 % Loans2020,2023, CRE loans represented $6.8$10.5 billion, or 16.0%,12 percent, of total loans held for investment, reflecting a year-over-year decrease of $246.1 million or 3.5%$2.0 billion increase when compared to $8.5 billion at December 31, 2019. The average2022. Approximately $1.9 billion of CRE loan had a principal balance of $6.7 million atloans were acquired in the end of this December, as compared to $6.6 million at the prior year-end. In addition, the portfolio had an expected weighted average life of 2.4 years and 2.3 years at the corresponding dates.$958.2 million,$1.1 billion, or 7.5%,5 percent, of the loans we originated in 2020,for the year ended December 31, 2023 as compared to $1.2$1.1 billion, or 11.6%, in6 percent for the prior year.2020, 85.3%2023, the largest concentration of our CRE loans were secured by properties in the metro New York City area, whilearea. Refer to the Geographical Analysis table included below for additional details.other parts ofthe New York State accounted for 2.3%metro area. the properties securing our CRE credits, while all other states accounted for 12.4%, combined.The termsmore than half of our CRE loans are similar to the terms of our multi-family credits. While a small percentage of our CRE loans feature ten-year fixed-rate terms, they primarily feature a fixed rate of interest for the first five or seven years of the loan that is generally based on intermediate-term interest rates plus a spread. During years six through tenIn addition to customary fixed rate terms, we now also offer floating rates advances indexed to CME Term SOFR. These products are generally offered in combination with interest rate cap or eight through twelve,swaps that provide borrowers with additional optionality to manage their interest rate risk. Following the initial fixed rate period, the loan resets to an annually adjustable interest rate that is tiedindexed to the prime rate of interest,CME Term SOFR or Prime, plus a spread.spread. Alternately, the borrower may opt for a fixed rate that is tied to the five-year fixed advance rate of the FHLB-NY plus a spread. The fixed-rate option also requires the payment of an amount equal to one percentage point of the then-outstanding loan balance. In either case, the minimum rate at repricing is equivalent to the rate in the initial five- or seven-year term.loans, as they do our multi-family credits.loans. Depending on the remaining term of the loan at the time of prepayment, the penalties normally range from five percentage points Our CRE loans tend to refinance within two to three years of origination, as reflected in the expected weighted average life of the CRE portfolio noted above.The repayment of loans secured by commercial real estate is often dependent on the successful operation and management of the underlying properties. To minimize our credit risk, we conservative underwriting standards, and require that such loans qualify on the basis of the property’s current income stream and DSCR. The approval of a loan alsoprimarily depends on the borrower’s credit history, profitability, and expertise in property management, and generally requires a minimum DSCR of 130%130 percent and a maximum LTV of 65%.65 percent. In addition, the origination of CRE loans typically requires a security interest in the fixtures, equipment, and other personal property of the borrower and/or an assignment of the rents and/or leases. In addition, certain of our CRE loans may contain an interest-only period which typically does not exceed three years; however, these loans are underwritten on a fully amortizing basis.Specialty FinanceAt December 31, 2023 Commercial Real Estate Loans (in millions) Amount Percent of Total New York $ 5,319 51 % Michigan 1,000 10 % New Jersey 580 5 % Florida 457 4 % Texas 105 1 % Pennsylvania 374 4 % Ohio 132 1 % All other states 2,503 24 % Total $ 10,470 100 % and Leases2020,2023, our ADC loans represented $2.9 billion, or 3 percent, of total loans held for investment, reflecting an increase of $916 million compared to December 31, 2022.$3.0$5.2 billion or 7.1%6 percent of total loans held for investment, up $429.7$769 million or 16.6%17 percent compared to December 31, 2019.leaselease financing. Each of these credits is secured with a perfected first security interest in, or outright ownership of, the underlying collateral, and structured as senior debt or as a non-cancelable lease. Asset-based and dealer floor-plan loansAs of December 31, 2023, 84 percent of specialty finance loan commitments are priced atstructured as floating rates predominately tied to LIBOR, while our equipment financing credits are priced at fixed rates atrate obligations which will benefit in a spread over Treasuries.During 2020,rising rate environment.$2.7$7.3 billion of specialty finance loans and leases, representing 21.0%35 percent of total originations compared to $2.8$6.0 billion during 2019,for the same period in 2022, representing 26.4%35 percent of total originations.C&IIn the twelve months ended December 31, 2020, C&I loans declined $26.8 million or 6.3% to $393.3 million, or 0.9% of total loans, and represented $393.0 million or 3.1% of the held-for-investment loans we produced.In contrast to the loans produced by our specialty finance subsidiary, the C&I loans we produce are primarily made to small and mid-size businesses in the five boroughs of New York City and on Long Island. Such loans are tailored to meet the specific needs of our borrowers, and include term loans, demand loans, revolving lines of credit, and, to a much lesser extent, loans that are partly guaranteed by the Small Business Administration.A broad range of C&I loans, both collateralized and unsecured, are made available to businesses for working capital (including inventory and accounts receivable), business expansion, the purchase of machinery and equipment, and other general corporate needs. In determining the term and structure of C&I loans, several factors are considered, including the purpose, the collateral, and the anticipated sources of repayment. C&I loansare typically secured by business assets and personal guarantees of the borrower, and include financial covenants to monitor the borrower’s financial stability.The interest rates on our C&I loans can be fixed or floating, with floating-rate loans being tied to prime or some other market index, plus an applicable spread. Our floating-rate loans may or may not feature a floor rate of interest. The decision to require a floor on C&I loans depends on the level of competition we face for such loans from other institutions, the direction of market interest rates, and the profitability of our relationship with the borrower.Acquisition, Development, and Construction Loans2020, ADC2023, one-to-four family loans represented $89.8$6.1 billion, including $996 million of LGG, or 0.2%,7 percent, of total loans held for investment, as compared to $200.6 million, or 0.5%, atinvestment. As of December 31, 2023, the prior year-end. Originationsrepurchase liability on LGG loans was $456 million. As of ADCDecember 31, 2022 one-to-four family loans totaled $35.1 million$5.8 billion. These loans include various types of conforming and non-conforming fixed and adjustable rate loans underwritten using Fannie Mae and Freddie Mac guidelines for the purpose of purchasing or refinancing owner occupied and second home properties. We typically hold certain mortgage loans in 2020, down from $91.4 million at December 31, 2019.Because ADCLHFI that do not qualify for sale to the Agencies and that have an acceptable yield and risk profile. The LTV requirements on our residential first mortgage loans are generally considered to have a higher degree of credit risk, especially during a downturn in the credit cycle, borrowersvary depending on occupancy, property type, loan amount, and FICO scores. Loans with LTVs exceeding 80 percent are required to provide a guaranteeobtain mortgage insurance. As of repayment and completion. In the twelve months ended December 31, 20202023, non-government guaranteed loans in this portfolio had an average current FICO score of 741 and 2019, we did not recover any losses against guarantees. The riskan average LTV of loss on an ADC53.largely dependent uponconveyed to HUD (if foreclosure timelines are met), which is not paid by the accuracy ofFHA until claimed. The Bank has a unilateral option to repurchase loans sold to GNMA if the initial appraisal ofloan is due, but unpaid, for three consecutive months (typically referred to as 90 days past due) and can recover losses through a claims process from the property’s value upon completion of construction; the developer’s experience; the estimated cost of construction, including interest; and the estimated time to complete and/or sell or lease such property.When applicable, as a condition to closing an ADC loan, it is our practice to require that properties meet pre-sale or pre-lease requirements prior to funding.One-to-Four Family LoansAt December 31, 2020, one-to-four familyguarantor. These loans represented $236.0 million, or 0.6%, of totalare recorded in loans held for investment and the liability to repurchase the loans is recorded in other liabilities on the Consolidated Statements of Condition. Certain loans within our portfolio may be subject to indemnifications and insurance limits which expose us to limited credit risk. We have reserved for these risks within other assets and as compared to $380.4 million, or 0.91%, at the prior year-end. These loan balances include certain mixed-use CRE loans with less than fivea component of our ACL on residential units being classified as one-to-four family loans. Other than these types of loans, we do not currently expect to originate traditional one-to-four family loans.2020,2023, other loans totaled $6.5 million$2.7 billion and consisted primarily of home equity lines of credit, boat and recreational vehicle indirect lending, point of sale consumer loans most of which wereand other consumer loans, including overdraft loans.non-profit organizations.ensure credit quality and loan profitability. Our debt-to-income ratio on HELOANs and HELOCs is capped at 43 percent and 45 percent, respectively. We currently do not offer home equitylimit the maximum CLTV to 89.99 percent and FICO scores to a minimum of 700. Second mortgage loans or lines of credit.Lending AuthorityTheand HELOANs are fixed rate loans we originate for investment are subject to federal and state laws and regulations, and are underwritten in accordanceavailable with loan underwriting policies approvedterms up to 20 years. HELOC loans are primarily variable-rate loans that contain a 10-year interest only draw period followed by the Management Credit Committee, the Commercial Credit Committee and the Mortgage and Real Estate and Credit Committeesa 20-year amortizing period. As of the Board, and the Board of Directors of the Bank.All multifamily, CRE, ADC, and Specialty Finance loans regardless of amount and C&IDecember 31, 2023, loans in excessthis portfolio had an average current FICO score of $3.0 million are required to be presented to the Management Credit Committee for approval. Multifamily, CRE and C&I loans in excess751. $5.0 million in new dollars to NYCB and Specialty Finance in excess of $15.0 million are also required to be presented to the Commercial Credit Committee and the Mortgage and Real Estate Committee of the Board, as applicable. All C&I loans less than or equal to $3.0 million are approved by the joint authority of lending officers.All mortgage loans in excess of $50.0 million, Specialty Finance loans in excess of $15.0 million and all other C&I loans in excess of $5.0 million require approval by the Mortgage and Real Estate Committee or theCredit Committee of the Board, as applicable. In addition, all loans of $20.0 million or more originated by the Bank continue to be reported to the Board of Directors.The various Committees have authority to direct changes in lending practices as they deem necessary or appropriate in order to address individual or aggregate risks and credit exposures in accordance with the Bank’s strategic objectives and risk appetites.In 2020, 252 loans greater than $10.0 million were originated by the Bank, with an aggregate loan balance of $7.5 billion at origination. In 2019, by comparison, 146 loans greater than $10.0 million were originated, with an aggregate loan balance at origination of $4.1 billion.At December 31, 2020 and 2019, the largest mortgage loan in our portfolio was a $329.0 million multi-family loan, which is collateralized by six properties located in Brooklyn, New York. As of the date of this report, the loan has been current since origination.Geographical Analysis of the Portfolio of Loans Held for InvestmentThe following table presents a geographical analysis of the multi-family and CRE2023, loans in our held-for-investment loanindirect portfolio at December 31, 2020:At December 31, 2020, the majorityhad an average current FICO score of our other743. Point of sale loans heldconsist of unsecured consumer installment loans originated primarily for investment, excluding specialty finance loans and leases, were secured by properties and/or businesses located in Metro New York.Loan Maturity and Repricing Analysis: Loans Held for InvestmentThe following table sets forth the maturity or period to repricingh a third-party financial technology company who also provides us a level of our portfolio of loans held for investment at December 31, 2020. Loans that have adjustable rates are shown as being due in the period during which their interest rates are next subject to change.The following table sets forth, as of December 31, 2020, the dollar amount of all loans held for investment that are due after December 31, 2021, and indicates whether such loans have fixed or adjustable rates of interest:At2020, we had $117.12023 totaled $1.2 billion, up from $1.1 billion at December 31, 2022. The Signature Transaction contributed $360 million of loans held for sale. This balance consists entirely of Paycheck Protection Program (“PPP”) loans. The Company is a participant in the Small Business Administration Paycheck Protection Program, a loan program established("SBA") loans to help consumers and small businesses. The original funding was fully allocated by mid-April, and additional funding was made available on April 24, 2020, under the Paycheck Protection Program and Health Care Enhancement Act and an additional round of financing resumed in January 2021.this increase. We did not have anyclassify loans as held for sale aswhen we originate or purchase loans that we intend to sell. We have elected the fair value option for nearly all of December 31, 2019.Loan Origination AnalysisThe following table summarizes our productionthis portfolio, except the SBA loans. We estimate the fair value of mortgage loans based on quoted market prices for securities backed by similar types of loans, heldwhere available, or by discounting estimated cash flows using observable inputs inclusive of interest rates, prepayment speeds and loss assumptions for investment in the years ended December 31, 2020 and 2019:Loan Portfolio Analysissimilar collateral.The following table summarizes the composition of our loan portfolio at each year-end for the five years ended December 31, 2020:Outstanding Loan CommitmentsAt December 31, 2020 and 2019, we had outstanding loan commitments of $2.5 billion and $2.0 billion, respectively. We also had commitments to issue letters of credit totaling $375.9 million and $509.9 million at December 31, 2020 and 2019, respectively. The fees we collect in connection with the issuance of letters of credit are included in “Fee income” in the Consolidated Statements of Income and Comprehensive Income.The letters of credit we issue consist of performance stand-by, financial stand-by, and commercial letters of credit. Financial stand-by letters of credit primarily are issued for the benefit of other financial institutions, municipalities, or landlords on behalf of certain of our current borrowers, and obligate us to guarantee payment of a specified financial obligation. Performance stand-by letters of credit are primarily issued for the benefit of local municipalities on behalf of certain of our borrowers. Performance letters of credit obligate us to make payments in the event that a specified third party fails to perform under non-financial contractual obligations. Commercial letters of credit act as a means of ensuring payment to a seller upon shipment of goods to a buyer. Although commercial letters of credit are used to effect payment for domestic transactions, the majority are used to settle payments in international trade. Typically, such letters of credit require the presentation of documents that describe the commercial transaction, and provide evidence of shipment and the transfer of title.For more information about our outstanding loan commitments and commitments to issue letters of credit at the end of this December, see the discussion of “Liquidity” later in this discussion and analysis of our financial condition and results of operations.Asset QualityLoans Held for Investment and Repossessed AssetsTotal NPAs were $46.1 million or 0.08% of total assets at December 31, 2020, down 37.3% or $27.4 million compared to $73.5 million or 0.14% of total assets at December 31, 2019. Total non-accrual mortgage loans declined $4.1 million to $17.9 million, while other non-accrual loans, consisting mainly of taxi medallion-related loans, declined $19.4 million to $19.9 million compared to $39.3 million at December 31, 2019. Included in these amounts were non-accrual taxi medallion-related loans of $18.6 million and $30.4 million, respectively.Repossessed assets totaled $8.3 million, down $4.0 million or 32.2% compared to the balance at December 31, 2019. As is the case with other non-accrual loans, the majority of the Company’s repossessed assets consist of taxi medallions. Taxi medallions represented $6.5 million of total repossessed assets at December 31, 2020 compared to $10.3 million at December 31, 2019.The following table presents our non-performing loans by loan type and the changes in the respective balances from December 31, 2019 to December 31, 2020:(1)Includes $18.6 million and $30.4 million of non-accrual taxi medallion-related loans at December 31, 2020 and 2019, respectively.At the end of this December, taxi medallion-related loans totaled $25.1 million, representing 0.06% of our total held-for-investment loan portfolio. Last December, taxi medallion-related loans totaled $55.0 million, representing 0.18% of our total held-for-investment loan portfolioThe following table sets forth the changes in non-performing loans over the twelve months ended December 31, 2020:(in thousands)Balance at December 31, 2019$61,243New non-accrual13,328Charge-offs(21,861)Transferred to repossessed assets(165)Loan payoffs, including dispositions and principal pay-downs(12,459)Restored to performing status(2,301)Balance at December 31, 2020$37,78520202023 and 2019,December 31, 2022, all of our non-performing loans were non-accrual loans. A loan is generally returned to accrual status when the loan is current and we have reasonable assurance that the loan will be fully collectible.and/or retainedand retain legal counsel, as applicable; requesting financial, operating, and rent roll information; confirming that hazard insurance is in place or force-placing such insurance; monitoring tax payment status andstatus. advancing funds as needed; and appointingseeking approval from the courts to appoint a receiver, whenever possible,when necessary to protect the Bank’s interests, including to collect rents, manage theproperty operations, provide information, and maintainensure maintenance of the collateral properties.irrespective of loan type,90 days or more past due that are collateralized by multi-family buildings, CRE properties, or land, in the event that such a loan is 90 days or more past due, and if the most recent appraisal on file for the property is more than one year old. Appraisals are ordered annually until such time as the loan becomes performing and is returned to accrual status. It is not our policy to obtain updated appraisals for performing loans. However, appraisals may be ordered for performing loans when a borrower requests an increase in the loan amount, a modification in loan terms, or an extension of a maturing loan. We do not analyze current LTVs on a portfolio-wide basis.Mortgage Committee, theBoard Credit Committee, and the Board of Directors of the Bank, as applicable. In accordance with our charge-off policy, collateral-dependent non-performing loans are written down to their current appraised values, less certain transaction costs. Workout specialists from our Loan Workout Unit actively pursue borrowers who are delinquent in repaying their loans in an effort to collect payment. In addition, outside counsel with experience in foreclosure proceedings are retained to institute such action with regard to such borrowers.approval, with a member of the Mortgage or Credit Committee participating in inspections on multi-family loans to be originated in excess of $7.5 million, and a member of the Mortgage or Credit Committee participating in inspections on CRE loans to be originated in excess of $4.0 million.approval. Furthermore, independent appraisers, whose appraisals are carefully reviewed by our experienced in-house appraisal officers and staff, perform appraisals on collateral properties. In many cases, a second independent appraisal review is performed.Reflecting the strength of the underlying collateral for these loans and the collateral structure, a relatively small percentage of our non-performing multi-family loans have resulted in losses over time.120%120 percent for multi-family loans and 130%130 percent for CRE loans. AlthoughAt origination, we typically lend up to 75%75 percent of the appraised value on multi-family buildings and up to 65%65 percent on commercial properties, the average LTVs of such credits at origination were below those amounts at December 31, 2020. properties. Exceptions to these DSCR and LTV limitations are minimal and are reviewed on a case-by-case basis.The repaymentapproved by the joint authority of loans secured by commercial real estate is often dependent oncredit and lending officers and when necessary, the successful operation and managementBoard Credit Committee of the underlying properties. To minimize our credit risk, we originate CRE loans in adherence with conservative underwriting standards, and require that such loans qualify on the basis of the property’s current income stream and DSCR. The approval of a CRE loan also depends on the borrower’s credit history, profitability, and expertise in property management. Given that our CRE loans are underwritten in accordance with underwriting standards that are similar to those applicable to our multi-family credits, the percentage of our non-performing CRE loans that have resulted in losses has been comparatively small over time.Multi-family and CRE loans are generally originated at conservative LTVs and DSCRs, as previously stated. Low LTVs provide a greater likelihood of full recovery and reduce the possibility of incurring a severe loss on a credit; in many cases, they reduce the likelihood of the borrower “walking away” from the property. Although borrowers may default on loan payments, they have a greater incentive to protect their equity in the collateral property and to return their loans to performing status. Furthermore, in the case of multi-family loans, the cash flows generated by the properties are generally below-market and have significant value.75%75 percent of the estimated as-completed market value of multi-family and residential tract projects; however, in the case of home construction loans to individuals, the limit is 80%.80 percent. With respect to commercial construction loans, we typically lend up to 65%65 percent of the estimated as-completed market value of the property. Credit risk is also managed through the loan disbursement process. Loan proceeds are disbursed periodically in increments as construction progresses, and as warranted by inspection reports provided to us by our own lending officers and/or consulting engineers.typically underwrittenbased on the basisnumerous criteria, including historical and projected financial information, strength of the cash flows produced bymanagement, acceptable collateral, and market conditions and trends in the borrower’s business, andindustry.These loans are generally collateralized by various business assets, including, but not limited to, inventory, equipment, and accounts receivable. As a result, the capacity of the borrower to repay is substantially dependent on the degree tovariable rate loans in which the business is successful. Furthermore, the collateral underlying the loan may depreciate over time, may not be conducive to appraisal, and may fluctuate in value, based upon the operating results of the business. Accordingly, personal guarantees are alsointerest rate fluctuates with a normal requirement for other C&I loans.specified index rate.The following table presents our loans 30 to 89 days past due by loan type and the changes in the respective balances from December 31, 2020 to December 31, 2019:TDR,TDM, then an updated appraisal is required to determine fair value. Estimated disposition costs are deducted from the fair value of the property to determine estimated net realizable value. In the instance of an outdated appraisal on an impaired loan, we adjust the original appraisal by using a third-party index value to determine the extent of impairment until an updated appraisal is received.While we strive to originate loans that will perform fully, adverse economic and market conditions, among other factors, can negatively impact a borrower’s ability to repay. Historically, our level of charge-offs has been relatively low in downward credit cycles, even when the volume of non-performing loans has increased. In 2020, we recorded net charge-offs of $18.8 million, as compared to net charge-offs of $19.3 million in the prior year. Taxi medallion-related net charge-offs accounted for $11.9 million of this year’s amount and $10.2 million of last year’s amount.Partially reflecting the net charge-offs noted above, and the provision of $63.3 million for the allowance for loan losses, the allowance for losses on loans increased $46.4 million, equaling $194.0 million at the end of this December from $147.6 million at December 31, 2019. Reflecting the decrease in non-performing loans cited earlier in this discussion, the allowance for credit losses represented 513.55% of non-performing loans at December 31, 2020, as compared to 241.07% at the prior year-end.Based upon all relevant and available information at the end of this December, management believes that the allowance for losses on loans was appropriate at that date.information aboutthe Company's asset quality measures at the respective dates:December 31, 2023 December 31, 2022 Non-performing loans to total loans held for investment 0.51 % 0.20 % Non-performing assets to total assets 0.39 0.17 Allowance for credit losses on loans and leases to non-performing loans 231.51 278.87 Allowance for credit losses on loans and leases to total loans held for investment 1.17 0.57 five largest non-performing loans at December 31, 2020:(1)There are no funds available for further advances on the five largest non-performing loans.(2)Loan is a Troubled Debt Restructure.The following is a description ofheld for investment by loan type and the five loans identifiedchanges in the preceding table. It should be notedrespective balances:Change from December 31, 2022 to December 31, 2023 (in millions) December 31, 2023 December 31, 2022 Amount Non-accrual mortgage loans: Multi-family $ 138 $ 13 $ 125 Commercial real estate 128 20 108 One-to-four family first mortgage 95 92 3 Acquisition, development, and construction $ 2 $ — 2 Total non-accrual mortgage loans $ 363 $ 125 238 Commercial and industrial 43 3 40 22 13 9 Total non-performing loans $ 428 $ 141 287 Repossessed assets 14 12 2 Total non-performing assets $ 442 $ 153 289 allocations for the loan loss allowance was not required for any loan listed, as determinedare insured by using the present value of expected cash flows method in ASC 310-10-35.No. 1 -U.S government agencies.The borrower is an owner of real estate and is based in New York. The loan is collateralized by an 8,566 square foot, retail condo unit located in New York, New York.No. 2 -(2)Unpaid principal balance.The borrower is an owner of real estate and is based in New Jersey. The loan is collateralized by two contiguous multi-family buildings containing 44 residential units and 4 commercial units, located in Atlantic City, NJ. An updated appraisal has been ordered.No. 3 -(3)Includes home equity, consumer and other loans.The borrower is an owner of a finance company in New York. The loan is collateralized by various taxi medallions in New York, and Chicago, Illinois.No. 4 -The borrower is an owner of real estate and is based in New York. This loan is collateralized by a 19,508 square foot commercial building in Woodhaven, New York.No. 5 -The borrower is an owner of real estate and is based in New York. This loan is collateralized by a four story, multi-family building containing 8 residential units located in Brooklyn, NY.Troubled Debt RestructuringsIn an effort to proactively manage delinquent loans, we have selectively extended such concessions as rate reductions and extensions of maturity dates, as well as forbearance agreements, to certain borrowers who have experienced financial difficulty. In accordance with GAAP, we are required to account for such loan modifications or restructurings as TDRs.The eligibility of a borrower for work-out concessions of any nature depends upon the facts and circumstances of each transaction, which may change from period to period, and involve management’s judgment regarding the likelihood that the concession will result in the maximum recovery for the Company.Loans modified as TDRs are placed on non-accrual status until we determine that future collection of principal and interest is reasonably assured. This generally requires that the borrower demonstrate performance according to the restructured terms for at least six consecutive months.At December 31, 2020, loans modified as TDRs totaled $34.3 million, including accruing loans of $15.0 million and non-accrual loans of $19.3 million. At the prior year-end, loans modified as TDRs totaled $40.5 million, including accruing loans of $1.3 million and non-accrual loans of $39.2 million.Analysis of Troubled Debt Restructuringsour TDRs overnon-accrual loans for the twelve monthsyear ended December 31, 2020:Loans on which concessions were made with respect(in millions) Balance at December 31, 2022 $ 141 New non-accrual, including acquired from acquisition 466 Charge-offs (97) Transferred to repossessed assets (3) Loan payoffs, including dispositions and principal pay-downs (36) Restored to performing status (43) Balance at December 31, 2023 $ 428 rate reductions and/or extensions of maturity dates totaled $18.1$363 million, while commercial and industrial loans increased $40 million to $43 million and $32.7other non-accrual loans increased $9 million respectively,to $22 million compared to December 31, 2022.2020 and 2019;2022 while NPL to total loans in connection with which forbearance agreements were reached amountedequaled 0.51 percent compared to $16.2 million and $7.8 million at the respective dates.Based on the number of loans performing in accordance with their revised terms, our success rate for restructured CRE loans was 100%; for one-to-four loans it was 33% at the end of this December; our success rate for other loans was 18%, at that date.On a limited basis, we may provide additional credit to a borrower after the loan has been placed on non-accrual status or modified as a TDR if, in management’s judgment, the value of the property after the additional loan funding is greater than the initial value of the property plus the additional loan funding amount. In 2020, no such additional credit was provided. Furthermore, the terms of our restructured loans typically would not restrict us from cancelling outstanding commitments for other credit facilities to a borrower in the event of non-payment of a restructured loan.For additional information about our TDRs0.20 percent at December 31, 2020 and 2019, see the discussion of “Asset Quality”2022. The increase in Note 5, “Loans and Leases”NPLs was primarily driven by a $125 million increase in Item 8, “Financial Statements and Supplementary Data.”Except for the non-accrualmulti-family loans and TDRs discloseda $108 million in this filing, we did not have any potential problemcommercial real estate loans, at December 31, 2020 that would have caused managementprimarily office. Repossessed assets of $14 million were slightly higher compared to have serious doubts as to the ability of a borrower to comply with present loan repayment terms and that would have resulted in such disclosure if that were the case.Loan DeferralsUnder U.S. GAAP, banks are required to assess modifications to a loan’s terms for potential classification as a TDR. A loan to a borrower experiencing financial difficulty is classified as a TDR when a lender grants a concession that it would otherwise not consider, such as a payment deferral or interest concession. In order to encourage banks to work with impacted borrowers, the CARES Act and bank regulators have provided relief from TDR accounting. The main benefits of TDR relief include a capital benefit$12 million in the form of reduced risk-weighted assets, as TDRs are more heavily risk-weighted for capital purposes; aging of the loans is frozen, i.e., they will continue to be reported in the same delinquency bucket they were in at the time of modification; and the loans are generally not reported as non-accrual during the modification period.Under the CARES Act, the Company made the election to deem that loan modifications do not result in TDRs if they are (1) related to the novel coronavirus disease (“COVID-19”); (2) executed on a loan that was not more than 30 days past due as of December 31, 2019; and (3) executed between March 1, 2020, and the earlier of (A) 60 days after the date of termination of the COVID-19 national emergency declaration or (B) December 31, 2020. In December 2020, Congress amended the CARES Act through the Consolidated Appropriations Act of 2021, which provided additional COVID-19 relief to American families and businesses, including extending TDR relief under the CARES Act until the earlier of December 31, 2021, or 60 days following the termination of the national emergency.During the second quarter of 2020, the Company implemented various loan modification programs with some of its borrowers, in accordance with the CARES Act and interagency regulatory guidance. These modifications were primarily full payment deferrals for an initial six month period, with the ability to extend again at the end of the deferral period, at the Bank’s discretion. Most of these deferrals were entered into during April and May, and were therefore, they were eligible to come off of their deferral period beginning in the fourth quarter of 2020.As of December 31, 2020, multi-family and CRE full payment (interest and principal) deferrals totaled $80.4 million or 0.2% of their respective portfolios, compared to $5.9 billion, or 15.5% of their respective portfolios as of June 30, 2020. Additionally, the Bank entered into $2.5 billion of principal-only deferrals with borrowers, under essentially the same terms as the full-payment deferral program, except that these borrowers are paying the interest due each on their loans, while deferring the principal. Including these principal-only deferrals, total multi-family and CRE deferrals were $2.6 billion at December 31, 2020 or 6.5% of their respective portfolios, and 6.1% of the entire loan portfolio.As of December 31, 2020, 99.8% of these deferrals returned to payment status, while the remaining 0.2% or $14.1 million have come off deferral but are still due for their first payment. We continue to work with these borrowers on a case-by-case basis to provide additional assistance, if needed, in line with regulatory guidance and the CARES Act.The following tables reflect, as of December 31, 2020 the aggregate amount of full-payment multi-family and CRE deferred loans by various categories:Additionally, the allowance for credit losses on accrued interest receivable on loans, including loans in the deferral program, was $1.0 million, as of December 31, 2020.Asset Quality Analysis information regarding our consolidated allowance for losses on loans, our non-performing assets, and our loans, 30 to 89 days past due at each year-endby loan type and the changes in the five years ended December 31, 2020. The 2016 amounts exclude covered loans, covered OREO, and non-covered Purchased Credit-impaired (“PCI”) loans. respective balances:Change from December 31, 2023 to December 31, 2022 (in millions) December 31, 2023 December 31, 2022 Amount Percent Multi-family $ 121 $ 34 $ 87 256 % Commercial real estate 28 2 26 1300 % One-to-four family first mortgage 40 21 19 90 % Acquisition, development, and construction 2 — 2 NM Commercial and industrial 37 2 35 1750 % Other loans 22 11 11 100 % Total loans 30-89 days past due $ 250 $ 70 180 257 % Covered loans and non-covered PCI loans(1)Excludes LGG that are considered to be performing due to the application of the yield accretion method. Therefore, covered loans and non-covered PCI loans are not reflected in the amounts or ratios provided in this table.insured by U.S government agencies.(1)The December 31, 2016 amounts exclude loans 90 days or more past due of $131.5 million, that are covered by FDIC loss sharing agreements. The December 31, 2016 amount also excludes $869,000 of non-covered PCI loans.(2)The December 31, 2016 amount excludes OREO of $17.0 million that were covered by FDIC loss sharing agreements.(3)Average loans for 2016 includes covered loans.
Allowance for Credit Losses(4)The December 31, 2016 amount excludes loans 30 to 89 days past due of $22.6 million that are covered by FDIC loss sharing agreements. The December 31, 2016 amount also excludes $6,000 of non-covered PCI loans. There were no non-covered PCI loans 30 to 89 days past due at any of the prior year-ends.excludingat each year-end:At December 31, 2023 2022 2021 (dollars in millions) Amount Percent of Total Loans and Leases Amount Percent of Total Loans and Leases Amount Percent of Total Loans and Leases Multi-family loans $ 307 44 % $ 178 55 % $ 159 76 % Commercial real estate loans 366 12 46 12 17 15 One-to-four family first mortgage loans 48 7 46 8 1 — Acquisition, development, and construction loans 36 3 20 3 2 — Commercial and industrial 132 30 — — Other loans 103 3 103 21 20 9 Total loans $ 992 100 % $ 393 100 % $ 199 100 % non-covered PCI loans at each year-end for the five years endedand leases increased $599 million from December 31, 2020:Each2022 to December 31, 2023. The day 1 impact of the preceding allocations was based upon an estimateSignature Transaction that closed on March 20, 2023 added $127 million to the reserve. The remaining net increase of various factors, as discussed in “Critical Accounting Policies” earlier in this report, and a different allocation methodology may be deemedapproximately $472 million primarily reflects our actions to be more appropriatebuild reserves during the fourth quarter to address weakness in the future. In addition, it should be noted thatoffice sector, potential repricing risk in the portion ofmulti-family portfolio and conditions leading to increases in classified assets, which better aligns the Company with its relevant bank peers, including Category IV banks. The allowance for credit losses on non-covered loans allocated to each non-covered loan category does not represent the total amount available to absorb losses that may occur within that category, since the total loan loss allowance is available for the entire non-covered loan portfolio.The following table presents a geographical analysisand leases represented 232 percent of our non-performing loans at December 31, 2020:(in thousands)New York$34,703New Jersey2,218All other states864Total non-performing loans$37,785For the Years Ended December 31, 2023 2022 (in millions) Charge-offs: Multi-family $ 119 $ 1 Commercial real estate 56 4 One-to-four family residential 4 — Commercial and industrial 30 — Other 14 2 Total charge-offs $ 223 $ 7 Recoveries: Commercial real estate — (4) One-to-four family residential — — Commercial and industrial (11) (7) Other (4) — Total recoveries $ (15) $ (11) Net charge-offs (recoveries) $ 208 $ (4) For the Years Ended December 31, (in millions) 2023 2022 2021 Multi-family Net charge-offs during the period $ 119 $ 1 $ 1 Average amount outstanding $ 37,839 $ 36,292 $ 32,424 Net charge-offs as a percentage of average loans 0.31 % 0.00 % 0.00 % Commercial real estate Net charge-offs during the period $ 56 $ — $ 2 Average amount outstanding $ 9,905 $ 6,964 $ 5,489 Net charge-offs as a percentage of average loans 0.57 % 0.00 % 0.04 % One-to-Four Family first mortgage Net charge-offs during the period $ 4 $ — $ 1 Average amount outstanding $ 5,907 $ 516 $ 191 Net charge-offs as a percentage of average loans 0.06 % 0.00 % 0.52 % Acquisition, Development and Construction Net charge-offs during the period $ — $ — $ — Average amount outstanding $ 2,530 $ 203 $ 152 Net charge-offs as a percentage of average loans 0.00 % 0.00 % 0.00 % Commercial and Industrial Loans Net charge-offs during the period $ 19 $ (7) $ — Average amount outstanding $ 21,460 $ — $ — Net charge-offs as a percentage of average loans 0.09 % 0.00 % 0.00 % Other Loans Net charge-offs (recoveries) during the period $ 10 $ (5) $ (6) Average amount outstanding $ 2,552 $ 5,401 $ 4,944 Net charge-offs (recoveries) as a percentage of average loans 0.38 % (0.09) % (0.12) % Total loans Net charge-offs (recoveries) during the period $ 208 $ (4) $ (2) Average amount outstanding $ 80,193 $ 49,376 $ 43,200 Net charge-offs (recoveries) as a percentage of average loans 0.26 % (0.01) % 0.00 % $5.8$9.2 billion, or 10.4%, of total assets at the end of this December, as compared to $5.9 billion, or 11.0%,8 percent, of total assets at December 31, 2019. During the second quarter2023, compared to $9.1 billion, or 10 percent of 2017, we reclassified our entire securities portfolio as “Available-for-Sale”. Accordingly,total assets at December 31, 2020 and December 31, 2019, we had no securities designated as “Held-to-Maturity”2022. At December 31, 2020, 29%2023 and December 31, 2022, all of theour securities portfolio was tied to floating rates, 28% of which is currently at floating rates, mainly one and three month LIBOR and prime.2020,2023, 12 percent of our portfolio are floating rate securities.$5.8$9.1 billion, and had an estimated weighted average life of 4.9 years. Included in the year-end amount were mortgage-related securities of $3.0 billion and other debt securities of $2.8 billion.At the prior year-end, available-for-sale securities were $5.9 billion, and had an estimated weighted average life of 4.4six years. Mortgage-related securities accounted for $3.4$4.8 billion of the year-end balance, with other debt securities accounting for the remaining $2.5$4.3 billion.investment policiesfollowing table summarizes the weighted average yields of debt securities for the Companymaturities indicated at December 31, 2023:Mortgage-
Related
SecuritiesU.S.
Government
and GSE
ObligationsState,
County,
and
MunicipalDue within one year — % 4.65 % — % — % Due from one to five years 3.33 5.42 — 5.53 Due from five to ten years 2.73 1.61 3.16 5.05 Due after ten years 4.18 — — 5.74 Total debt securities available for sale 4.09 2.27 3.16 5.56 Bank are establishedsum of these results by the Board of Directorstotal carrying values and implemented by the ALCO. ALCO meets monthly orare not presented on an as-needed basis to review the portfolios and specific capital market transactions. In addition, the securities portfolios and investment activities are reviewed monthly by the Board of Directors. Furthermore, the policy governing the investment portfolio activities is reviewed at least annually by the ALCO and ratified by the Board of Directors.Our general investment strategy is to purchase liquid investments with various maturities to ensure that our overall interest rate risk position stays within the required limits of our investment policies. We generally limit our investments to GSE obligations and U.S. Treasury obligations. At December 31, 2020 and 2019, GSE obligations and U.S. Treasury obligations together represented 81.9% and 82.6% of total securities, respectively. The remainder of the portfolio at those dates was comprised ofa tax-equivalent basis. foreign notes, capital trust notes, foreign notes, and asset-backed securities,securities.municipal obligations.As a member of the FHLB-NY, the Bank is required to acquire and hold shares of its capital stock. 2020,2023 the Bank heldCompany had $861 million and $329 million of FHLB-NY stock, in the amount of $714.0 million.at cost, and FHLB-Indianapolis stock, at cost, respectively. At December 31, 2019,2022, the Bank heldCompany had $762 million and $329 million of FHLB-NY stock, at cost and FHLB-Indianapolis stock, at cost, respectively. The Company maintains an investment in FHLB-NY stock and, as a result of the Flagstar acquisition, FHLB-Indianapolis stock, partly in conjunction with its membership in the amount of $647.6 million. Dividends from the FHLB-NYFHLB and partly related to its access to the FHLB funding it utilizes. In addition, the Company had Federal Reserve Bank totaled $36.3stock, at cost, of $203 million and $39.5$176 million respectively, in 2020at December 31, 2023 and 2019.December 31, 2022, respectively.rose $19.1 million year-over-year to $1.2 billion at December 31, 2020.2023 rose For more information about As of December 31, 2023, the Company identified a triggering event and applied a market approach using the end of day stock price. We evaluated those conditions known and knowable by the Company and how a market participant would view the control premium as confirmed by the subsequent confirming market evidence. This adjusted market capitalization was then compared to the carrying value to determine the extent of the shortfall which was calculated to be in excess of the goodwill balance. The Company’s assessment concluded that goodwill seefrom historical transactions (2007 and prior) was fully impaired as of December 31, 2023. As a result, the discussionCompany recorded an impairment charge of “Critical Accounting Policies” earlierthe entire goodwill balance of $2.4 billion.this report.Sources of Fundsfourthree primary funding sources for the payment of dividends, share repurchases, and other corporate uses: dividends paid to the Parent Company by the Bank; capital raised through the issuance of securities;equity; and funding raised through the issuance of debt instruments;instruments.repaymentsits non-bank subsidiaries. The Bank would require the approval of the OCC if the dividends it declares in any calendar year were to exceed the total of its respective net profits for that year combined with its respective retained net profits for the preceding two calendar years, less any required transfer to paid-in capital. The term “net profits” is defined as net income for a given period less any dividends paid during that period. As a result of our acquisition of Flagstar, we are also required to seek regulatory approval from the OCC for the payment of any dividend to the Parent Company through at least the period ending November 1, 2024. In connection with receiving regulatory approval from the OCC for the Signature Transaction, the Bank has committed that (i) for a period of two years from the date of the Signature Transaction, it will not declare or pay any dividend without receiving a prior written determination of no supervisory objection from the OCC and income from, investment securities.(Dollars in millions) Cash and cash equivalents $ 11,475 Unencumbered investment securities 6,300 FHLB borrowing availability 8,400 Federal Reserve Bank borrowing availability through the discount window 1,700 Total Ready Liquidity $ 27,875 In 2020, loan repayments and sales generated cash flows of $11.9 billion, as compared to $8.9 billion in 2019. Cash flows from repayments accounted for $11.9 billion and $8.8 billion of the respective totals and cash flows from sales accounted for $3.1 million and $115.3 million, of the respective totals.In 2020, cash flows from the repayment and sale of securities respectively totaled $2.1 billion and $483.9 million, while the purchase of securities amounted to $2.5 billion for the year. By comparison, cash flows from the repayment and sale of securities totaled $2.0 billion and $361.3 million, respectively, in 2019, and were offset by the purchase of securities totaling $2.5 billion.In 2020, the cash flows from loans and securities were primarily deployed into the production of multi-family loans held for investment, as well as held-for-investment CRE loans and specialty finance loans and leases.DepositsTotal deposits increased $779.7 million or 2.5% on a year-over-year basis to $32.4 billion. Deposit growth was driven by growth in savings accounts and non-interest bearing accounts and offset by a decline in CDs. Compared to the fourth quarter of last year, CDs declined $3.9 billion or 27.3% to $10.3 billion, while savings accounts increased $1.6 billion or 34.2% to $6.4 billion and interest bearing checking and money market accounts increased over the same timeframe by $2.4 billion or 23.3% to $12.6 billion.While the vast majority of our deposits are retail in nature (i.e., they are deposits we have gathered through our branches or through business combinations), institutional deposits and municipal deposits are also part of our deposit mix. Retail deposits rose $429.4 million year-over-year to $24.8 billion, while institutional deposits rose $150.1 million to $1.3 billion at year-end. Municipal deposits represented $1.0 billion of total deposits at the end of this December, a $19.5 million increase from the balance at December 31, 2019.Depending on their availability and pricing relative to other funding sources, we also include brokered deposits in our deposit mix. Brokered deposits accounted for $5.3 billion of our deposits at the end of this December, compared to $5.2 billion at December 31, 2019. Brokered money market accounts represented $3.0 billion of total brokered deposits at December 31, 2020 and $1.5 billion at December 31, 2019; brokered interest-bearing checking accounts represented $1.3 billion and $1.2 billion, respectively, at the corresponding dates. At December 31, 2020, we had $1.0 billion of brokered CDs, compared to $2.5 billion at December 31, 2019.Borrowed FundsThe majority of our borrowed funds are wholesale borrowings and consist of FHLB-NY advances, repurchase agreements, and federal funds purchased, and, to a lesser extent, junior subordinated debentures and subordinated notes. At December 31, 2020, total borrowed funds increased $1.5 billion or 10.5% to $16.1 billion compared to the balance at December 31, 2019. The bulk of the year-over-year increase was driven by a $1.5 billion or 11.0% increase in the balance of wholesale borrowings.Wholesale BorrowingsWholesale borrowings totaled $15.4 billion and $13.9 billion, respectively, at December 31, 2020 and 2019, representing 27.4% and 25.9% of total assets at the respective dates. FHLB-NY advances accounted for $14.6 billion of the year-end 2020 balance, as compared to $13.1 billion at the prior year-end. Pursuant to blanket collateral agreements with the Bank, our FHLB-NY advances and overnight advances are secured by pledges of certain eligible collateral in the form of loans and securities. (For more information regarding our FHLB-NY advances, see the discussion that appears earlier in this report regarding our membership and our ownership of stock in the FHLB-NY.) At December 31, 2020 and 2019, $8.3 billion of our wholesale borrowings had callable features.Also included in wholesale borrowings were repurchase agreements of $800.0 million at December 31, 2020 and 2019. Repurchase agreements are contracts for the sale of securities owned or borrowed by the Bank with an agreement to repurchase those securities at agreed-upon prices and dates.Our repurchase agreements are primarily collateralized by GSE obligations, and may be entered into with the FHLB-NY or certain brokerage firms. The brokerage firms we utilize are subject to an ongoing internal financial review to ensure that we borrow funds only from those dealers whose financial strength will minimize the risk of loss due to default. In addition, a master repurchase agreement must be executed and on file for each of the brokerage firms we use.We had no federal funds purchased at both December 31, 2020 and 2019.Junior Subordinated DebenturesJunior subordinated debentures totaled $360.3 million at December 31, 2020, slightly higher than the balance at the prior year-end reflecting discount accretion.Subordinated NotesAt December 31, 2020, the balance of subordinated notes was $295.6 million, relatively unchanged from December 31, 2019.See Note 9, “Borrowed Funds,” in Item 8, “Financial Statements and Supplementary Data” for a further discussion of our wholesale borrowings, our junior subordinated debentures and subordinated debt.Liquidity, Contractual Obligations and Off-Balance Sheet Commitments, and Capital PositionLiquidityWe manage our liquidity to ensure that our cash flows are sufficient to support our operations, and to compensate for any temporary mismatches between sources and uses of funds caused by variable loan and deposit demand.We monitor our liquidity daily to ensure that sufficient funds are available to meet our financial obligations. Our most liquid assets are cash and cash equivalents, which totaled $1.9 billion and $741.9 million, respectively, at December 31, 2020 and 2019. As in the past, our loan and securities portfolios provided meaningful liquidity in 2020, with cash flows from the repayment and sale of loans totaling $8.1 billion and cash flows from the repayment and sale of securities totaling $2.5 billion.Additional liquidity stems from deposits and from our use of wholesale funding sources, including brokered deposits and wholesale borrowings. In addition, we have access to the Bank’s approved lines of credit with variouscounterparties, including the FHLB-NY. The availability of these wholesale funding sources is generally based on the amount of mortgage loan collateral available under a blanket lien we have pledged to the respective institutions and, to a lesser extent, the amount of available securities that may be pledged to collateralize our borrowings. At December 31, 2020, our available borrowing capacity with the FHLB-NY was $7.3 billion. In addition, the Bank had available-for-sale securities of $5.8 billion, of which, $4.6 billion is unpledged.Furthermore, the Bank has agreements with the FRB-NY that enable it to access the discount window as a further means of enhancing their liquidity. In connection with these agreements, the Bank has pledged certain loans and securities to collateralize any funds they may borrow. At December 31, 2020, the maximum amount the Bank could borrow from the FRB-NY was $1.1 billion. There were no borrowings against these lines of credit at December 31, 2020.Our primary investing activity is loan production, and the volume of loans we originated for investment totaled $12.9 billion in 2020. During this time, the net cash used in investing activities totaled $1.0 billion; the net cash provided by our operating activities totaled $334.2 million. Our financing activities provided net cash of $1.9 billion.20202023 totaled $9.1$17.3 billion, representing 88%80 percent of total CDs at that date. Our ability to attract and retain retail deposits, including CDs, depends on numerous factors, including, among others, the convenience of our branches and our other banking channels; our customers’ satisfaction with the service they receive; the rates of interest we offer; the types of products we feature; and the attractiveness of their terms.The Parent Company is a separate legal entity from the Bank and must provide for its own liquidity. In addition to operating expenses and any share repurchases, the Parent Company is responsible for paying any dividends declared to our shareholders. As a Delaware corporation, the Parent Company is able to pay dividends either from surplus or, in case there is no surplus, from net profits for the fiscal year in which the dividend is declared and/or the preceding fiscal year.The Parent Company’sdividends may also depend, in part, upon dividends it receives from the Bank. The abilitytypes of the Bank to pay dividends and other capital distributions to the Parent Company is generally limited by New York State Banking Law and regulations, and by certain regulations of the FDIC. In addition, the Superintendent of the New York State Department of Financial Services (the “Superintendent”), the FDIC,products we offer, and the FRB,attractiveness of their terms. The vast majority of our deposits are retail in nature (i.e., they are deposits we have gathered through our branches or through business combinations).reasons$9.5 billion of safety and soundness, may prohibit the payment of dividends that are otherwise permissible by regulations.Under New York State Banking Law, a New York State-chartered stock-form savings bank or commercial bank may declare and pay dividends out of its net profits, unless there is an impairment of capital. However, the approval of the Superintendent is required if the total of all dividends declared in a calendar year would exceed the total of a bank’s net profits for that year, combined with its retained net profits for the preceding two years. In 2020, the Bank paid dividends totaling $380.0 million to the Parent Company, leaving $301.6 million that it could dividend to the Parent Company without regulatory approval at year-end. Additional sources of liquidity available to the Parent Companyour deposits at December 31, 2020 included $151.2 million in cash2023, compared to $5.1 billioncash equivalents. If$2.8 billion at December 31, 2022; brokered interest-bearing checking accounts represented $1.6 billion and $1.0 billion, respectively. At December 31, 2023, we had $6.6 billion of brokered CDs, compared to $1.3 billion at December 31, 2022.Bank wasportion of deposit accounts that exceed the FDIC insurance limit (currently $250,000). These amounts were estimated based on the same methodologies and assumptions used for regulatory reporting purposes and excludes internal accounts. At December 31, 2023 our deposit base includes $29.3 billion of uninsured deposits, a net increase of $12.9 billion as compared to applyDecember 31, 2022 due to the Superintendent for approval to make a dividend or capital distributionSignature Transaction. This represents 36 percent of our total deposits.dividend amounts permitted underFDIC insurance limit (currently $250,000) by time remaining until maturity:(in millions) December 31, 2023 December 31, 2022 Portion of U.S. time deposits in excess of insurance limit $ 7,893 $ 3,749 Time deposits otherwise uninsured with a maturity of: 3 months or less 1,675 969 Over 3 months through 6 months 1,623 604 Over 6 months through 12 months 2,325 1,269 Over 12 months 2,271 907 Total time deposits otherwise uninsured $ 7,894 $ 3,749 regulations, there can beFRB of New York and, to a lesser extent, junior subordinated debentures and subordinated notes. At December 31, 2023, total borrowed funds decreased $65 million to $21.3 billion compared to the balance at December 31, 2022.assurance that such application would be approved. and Off-Balance Sheet CommitmentsFor example, we offer CDs with contractual terms to our customers, and borrow funds under contract from the FHLB-NY and various brokerage firms. These contractual obligations are reflected in the Consolidated Statements of Condition under “Deposits” and “Borrowed funds,” respectively. At December 31, 2020, we had CDs of $10.3 billion and long-term debt (defined as borrowed funds with an original maturity one year or more) of $13.8 billion.We also are obligated under certain non-cancelable operating leases on the buildings and land we use in operating our branch network and in performing our back-office responsibilities. These obligations are included in the Consolidated Statements of Condition and totaled $351.0 million at December 31, 2020.Contractual ObligationsThe following table sets forth the maturity profile of the aforementioned contractual obligations as of December 31, 2020:(1)Includes FHLB advances, repurchase agreements, junior subordinated debentures, and subordinated notes.(2)Excludes imputed interest of $84.2 million.At December 31, 2020, we also hadinclude commitments to extend credit in the form of mortgage and other loan originations, as well as commercial, performance stand-by, and financial stand-by letters of credit, totaling $2.9 billion. credit. off-balance sheet commitments consist of agreements to extend credit, as long as there is no violation of any condition established in the contract under which the loan is made. Commitments generally have fixed expiration dates or other termination clauses and may require the payment of a fee. following table summarizes our off-balance sheet commitments to extend credit in the form of loans and letters of credit atwe issue consist of performance stand-by, financial stand-by, and commercial letters of credit. Financial stand-by letters of credit primarily are issued for the benefit of other financial institutions, municipalities, or landlords on behalf of certain of our current borrowers, and obligate us to guarantee payment of a specified financial obligation.2020:(in thousands)Mortgage Loan Commitments:Multi-family and commercial real estate$310,261One-to-four family801Acquisition, development, and construction100,599Total mortgage loan commitments$411,661Other loan commitments (1)2,063,559Total loan commitments$2,475,220Commercial, performance stand-by, and financial stand-by letters of credit375,876Total commitments$2,851,096(1)Includes unadvanced lines of credit.Based upon our current liquidity position,2023, we did not engage in any off-balance sheet transactions that we expect thatto have a material effect on our funding will be sufficient to fulfill these obligations and commitments when they are due.2020,2023, we had no commitments to purchase securities totaling $19.8 million.PositionTotal stockholders’ equity rose $130.0 million, or 1.9%, year-over-yearamounts and classifications are also subject to $6.8 billion; common stockholders’ equity represented 11.26%the Regulators’ qualitative judgments about the components of totalcapital and risk weightings, among other factors.a book value perof common share of $13.66 atequity tier 1 capital, tier 1 capital, and total capital to risk-weighted2020. At the prior year-end, total stockholders’ equity totaled $6.7 billion, and common stockholders’ equity represented 11.57% of total assets and a book value per common share of $13.29.On a non-GAAP basis, tangible common stockholders’ equity increased $130.0 million year-over-year to $3.9 billion. The year-end 2020 balance represented 7.26% of tangible common assets and a tangible common book value per common share of $8.43. At the prior year-end, tangible common stockholders’ equity totaled $3.8 billion, representing 7.39% of tangible common assets and a tangible common book value per common share of $8.09.We calculate tangible common stockholders’ equity by subtracting the amount of goodwill and preferred stock recorded at the end of a period from the amount of stockholders’ equity recorded at the same date. Goodwill totaled $2.4 billion at December 31, 2020 and 2019 while preferred stock was $502.8 million at the end of 2020 and 2019. (See the discussion and reconciliations of stockholders’ equity and tangible common stockholders’ equity, total assets and tangible assets, and the related financial measures that appear on the last page of this discussion and analysis of our financial condition and results of operations.)Stockholders’ equity and tangible common stockholders’ equity both include AOCL, which is comprised of the net unrealized gain or loss on available-for-sale securities; the net unrealized gain on cash flow hedges; and the Company’s pension and post-retirement obligations at the end of a period. In the twelve months ended December 31, 2020 and 2019, AOCL totaled $25.5 million and $32.8 million, respectively. The decrease in AOCL was largely the net effect of a $33.9 million decrease in net loss on cash flow hedges to $33.0 million and a $41.4 million increase in the net unrealized gain on securities available for sale recorded at the end of this December compared to December 31, 2019.As reflected in the following table,2023, our capital measures continued to exceed the minimum federal requirements for a bank holding company and for a bank. The following table sets forth our common equity tier 1, tier 1 risk-based, total risk-based, and leverage capital amounts and ratios on a consolidated basis and for the Bank on a stand-alone basis, as well as the respective minimum regulatory capital requirements, at December 31, 2020that date:2019:ratios for the Company:Risk-Based Capital December 31, 2023 Common Equity Tier 1 Tier 1 Total Leverage Capital (in millions) Amount Ratio Amount Ratio Amount Ratio Amount Ratio Total capital $ 8,009 9.05 % $ 8,512 9.62 % $ 10,415 11.77 % $ 8,512 7.75 % Minimum for capital adequacy purposes 3,983 4.50 5,310 6.00 7,081 8.00 4,392 4.00 Excess $ 4,026 4.55 % $ 3,202 3.62 % $ 3,334 3.77 % $ 4,120 3.75 % December 31, 2022 Total capital $ 6,335 9.06 % $ 6,838 9.78 % $ 8,154 11.66 % $ 6,838 9.70 % Minimum for capital adequacy purposes 3,146 4.50 4,195 6.00 5,593 8.00 2,819 4.00 Excess $ 3,189 4.56 % $ 2,643 3.78 % $ 2,561 3.66 % $ 4,019 5.70 % Risk-Based Capital December 31, 2023 Common Equity Tier 1 Tier 1 Total Leverage Capital (dollars in millions) Amount Ratio Amount Ratio Amount Ratio Amount Ratio Total capital $ 9,305 10.52 % $ 9,305 10.52 % $ 10,271 11.61 % $ 9,305 8.48 % Minimum for capital adequacy purposes 3,980 4.50 5,307 6.00 7,076 8.00 4,389 4.00 Excess $ 5,325 6.02 % $ 3,998 4.52 % $ 3,195 3.61 % $ 4,916 4.48 % December 31, 2022 Total capital $ 7,653 10.96 % $ 7,653 10.96 % $ 7,982 11.43 % $ 7,653 10.87 % Minimum for capital adequacy purposes 3,142 4.50 4,189 6.00 5,585 8.00 2,817 4.00 Excess $ 4,511 6.46 % $ 3,464 4.96 % $ 2,397 3.43 % $ 4,836 6.87 % 2020,2023, our total risk-based capital ratio exceeded the minimum requirement for capital adequacy purposes by 377 basis points and the fully phased-in capital conservation buffer by 127 basis points.continuedif adopted as proposed.exceedeither or both in future reporting periods.classification as “well capitalized” institutions, as defined undercredit losses on commercial real estate.Federal Deposit Insurance Corporation Improvement Actsecondary market and often retain the right to service the loan at the time of 1991,sale upon which, a mortgage servicing right (MSR) is created. We have elected to report our MSR assets at fair value which is determined using an internal valuation model that utilizes an option-adjusted spread, constant prepayment rates, costs to service, and asother assumptions. The assumptions used in the MSR valuation are unobservable in nature, involve a higher degree of judgment and are estimated based on our judgment regarding the value that market participants would assign to the asset. To corroborate this estimate, we obtain third-party valuations of the MSR portfolio on a quarterly basis from independent valuation services to assess the reasonableness of the fair value calculated by the internal valuation model.discussed in Note 19, “Capital,information and sensitivity analysis regarding the valuation of the MSR asset, see "Note 9 - Mortgage Servicing Rights,” in Item 8. “Financial Statements and Supplementary Data.”RESULTS OF OPERATIONS: 2020 AS COMPARED TO 2019Net Interest IncomeNet interest income is our primary sourceincome. Its level isAccountingfunctionbusiness combination be recorded at their fair values as of the average balanceacquisition date. This method often involves estimates, all of which are inherently subjective. We have elected to hold the measurement period open to allow for potential adjustments for up to one year after the acquisition date, for new information that existed at the acquisition date but may not have been known or available at that time. For further information, refer to Note 3 - Business Combinations in Item 8, "Financial Statements and Supplementary Data".interest-earning assets,single reporting unit, which considers how a market participant would view a control premium, complemented by an income approach if deemed necessary. The resulting value is then compared to our book value and any shortfalls would be recorded as an impairment.average balanceCompany identified a triggering event and applied a market approach using the end of our interest-bearing liabilities,day stock price, control premium for completed bank acquisitions, and the spread between the yield on such assets and the cost of such liabilities. These factors are influenced by both the pricing and mix of our interest-earning assets and our interest-bearing liabilities which, in turn, are impacted by various external factors, including the local economy, competitionan adjustment for loans and deposits, the monetary policy of the FOMC, and market interest rates.The cost of our deposits and borrowed funds is largelyCompany-specific risk considerations based on short-term rates of interest, the level of which is partially impacted by the actions of the FOMC. The FOMC reduces, maintains, or increases the target federal fundsrate (the rate at which banks borrow funds overnight from one another) as it deems necessary. During 2019, the FRB increased its target for the federal funds rate by 100 bp to a range of 2.25% - 2.50%. However, during 2020, in response to the global COVID-19 pandemic, the FRB took a number of actions to support the flow of credit to businesses and households. The actions included a reduction in the target range for the federal funds rate to 0% - 0.25%.While the target federal funds rate generally impacts the cost of our short-term borrowings and deposits, the yields on our held-for-investment loans and other interest-earning assets are typically impacted by intermediate-termsubsequent confirming market interest rates.Another factor that impacts the yields on our interest-earning assets—and our net interest income—is the income generated by our multi-family and CRE loans and securities when they prepay. Since prepayment income is recorded as interest income, an increase or decrease in its level will also be reflected in the average yields (as applicable) on our loans, securities, and interest-earning assets, and therefore in our net interest income, our net interest rate spread, and our net interest margin.It should be noted that the level of prepayment income on loans recorded in any given period depends on the volume of loans that refinance or prepay during that time. Such activity is largely dependent on such external factors as currentevidence. This adjusted market conditions, including real estate values, and the perceived or actual direction of market interest rates. In addition, while a decline in market interest rates may trigger an increase in refinancing and, therefore, prepayment income, so too may an increase in market interest rates. It is not unusual for borrowers to lock in lower interest rates when they expect, or see, that market interest rates are rising rather than risk refinancing later at a still higher interest rate.For the twelve months ended December 31, 2020, net interest income increased $142.7 million or 14.9% to $1.1 billion. Total interest income declined $97.2 million or 5.4% for the twelve months ended December 31, 2020, while total interest expense dropped $239.9 million or 28.3% for the same time period.Year-Over-Year ComparisonThe following factors contributed to the year-over-year increase in net interest income:•Interest income on loans declined a modest $10.8 million or 0.7% due to an 18 bp decline in the average loan yield to 3.67% compared to 3.85%. However, this was largely offset by loan growth. Average loans during 2020 rose $1.6 billion or 4.1% to $42.0 billion in 2020 compared to $40.4 billion in 2019.•Interest income on the securities portfolio declined more than the interest income on loans driven by both a lower average balance and lower yields, given the low interest rate environment in place for most of the year. Interest income on securities decreased $72.9 million or 30.9%, while average securities declined $365.0 million or 5.8% to $6.0 billion and the average yield declined 99 bp to 2.73%.•Interest expense on average interest-bearing deposits declined significantly mainly the result of a lower average cost of deposits due to the low interest rate environment. The average cost of interest-bearing deposits decreased 78 bp to 1.06% while the average balance of $28.9 billion stayed relatively unchanged.•Interest expense on borrowed funds declined $15.6 million or 4.9% driven by a 34 bp decline in the average cost to 2.03%, offset by a $1.4 billion or 10.7% increase in the average balance to $14.8 billion.Net Interest MarginThe direction of the Company’s net interest margincapitalization was consistent with that of its net interest income, and generally was driven by the same factors as those described above. At 2.24%, the margin was 22 basis points widerthan the margin recorded for full-year 2019. Adjusted net interest margin is a non-GAAP financial measure, as more fully discussed below.RECONCILIATION OF NET INTEREST MARGIN AND ADJUSTED NET INTEREST MARGINWhile our net interest margin, including the contribution of prepayment income and the impact from our recent subordinated notes offering, is recorded in accordance with GAAP, adjusted net interest margin, which excludes the contribution of prepayment income, is not. Nevertheless, management uses this non-GAAP measure in its analysis of our performance, and believes that this non-GAAP measure should be disclosed in this report and other investor communications for the following reasons:1.Adjusted net interest margin gives investors a better understanding of the effect of prepayment income on our net interest margin. Prepayment income in any given period depends on the volume of loans that refinance or prepay, or securities that prepay, during that period. Such activity is largely dependent on external factors such as current market conditions, including real estate values, and the perceived or actual direction of market interest rates.2.Adjusted net interest margin is among the measures considered by current and prospective investors, both independent of, and in comparison with, our peers.Adjusted net interest margin should not be considered in isolation or as a substitute for net interest margin, which is calculated in accordance with GAAP. Moreover, the manner in which we calculate this non-GAAP measure may differ from that of other companies reporting a non-GAAP measure with a similar name.The following table sets forth certain information regarding our average balance sheet for the years indicated, including the average yields on our interest-earning assets and the average costs of our interest-bearing liabilities. Average yields are calculated by dividing the interest income produced by the average balance of interest-earning assets. Average costs are calculated by dividing the interest expense produced by the average balance of interest-bearing liabilities. The average balances for the year are derived from average balances that are calculated daily. The average yields and costs include fees, as well as premiums and discounts (including mark-to-market adjustments from acquisitions), that are considered adjustments to such average yields and costs.Net Interest Income Analysis(1)Amounts are net of net deferred loan origination costs/(fees) and the allowances for loan losses and include loans held for sale non-performing loans.(2)Amounts are at amortized cost.(3)Includes FHLB stock.The following table presents the extent to which changes in interest rates and changes in the volume of interest-earning assets and interest-bearing liabilities affected our interest income and interest expense during the periods indicated. Information is provided in each category with respect to (i) the changes attributable to changes in volume (changes in volume multiplied by prior rate); (ii) the changes attributable to changes in rate (changes in rate multiplied by prior volume); and (iii) the net change. The changes attributable to the combined impact of volume and rate have been allocated proportionately to the changes due to volume and the changes due to rate.Rate/Volume AnalysisProvision for Credit LossesThe provision for credit losses for 2020 was calculated using the CECL methodology, while the year-ago provision for credit losses was calculated using the “incurred loss” methodology. The CECL methodology reflects the impact of a deterioration in forecasted, future economic conditions due to the COVID-19 pandemic.During 2020, the provision for credit losses totaled $62.2 million, up $55.1 millionthen compared to the $7.1 million we reported during 2019. For additional information about our methodologies for recording recoveriescarrying value to determine the extent of and provisions for, loan losses, see the discussionany shortfall which was calculated to be in excess of the loan loss allowance under “Critical Accounting Policies”goodwill balance. The Company’s assessment concluded that goodwill from historical transactions (2007 and the discussionprior) was fully impaired as of “Asset Quality” that appear earlier in this report.Non-Interest IncomeWe generate non-interest income through a variety of sources, including—among others—fee income (in the form of retail deposit fees and charges on loans); income from our investment in BOLI; gains on sales of securities; and “other” sources, including the revenues produced through the sale of third-party investment products.For the twelve months ended December 31, 2020, non-interest income totaled $61.1 million, down $23.2 million or 27.5% compared to the $84.2 million for the twelve months ended December 31, 2019. This was largely due to a decrease in fee income,2023, as the Company waived certain retail banking fees during the year due to the COVID-19 pandemic. Included in the full-year 2020 period were net gains on securities of $1.3 million compared to a net gain on securities of $7.7 million in full-year 2019. Also during 2019, the Company recorded a branch sale-leaseback gain of $7.9 million, related to a property in Florida.Non-Interest Income AnalysisThe following table summarizes our sources of non-interest income in the twelve months ended December 31, 2020, 2019, and 2018:Non-Interest ExpenseFor the twelve months ended December 31, 2020 total non-interest expense was $511.2 million unchanged compared to the amount for the twelve months ended December 31, 2019. Included in the 2020 amount is a $4.4 million lease termination benefit, while, in 2019, non-interest expense included $10.4 million of certain items related to severance costs and branch rationalization costs.Income Tax ExpenseIncome tax expense includes federal, New York State, and New York City income taxes, as well as non-material income taxes from other jurisdictions where we operate our branches and/or conduct our mortgage banking business.For the twelve months ended December 31, 2020, income tax expense totaled $76.7 million compared to $128.3 million for the twelve months ended December 31, 2019. This translates into an effective tax rate of 13.05% in 2020 and 24.51% in 2019. Full-year 2020 results were impactedconfirmed by a $68.4 million income tax benefit related to certain tax provisions for corporations under the CARES Act. Excluding the impact of the tax benefits, the effective tax rate in 2020, on a non-GAAP basis, was 24.69% compared to 24.51% in 2019.RESULTS OF OPERATIONS: 2019 AS COMPARED TO 2018The results of operations comparison of 2019 compared to 2018 can be found in the Company’s previously filed Annual Report on Form 10-K for the year-ended December 31, 2019 under Item 7 “Management’s Discussion and Analysis of Financial Condition and Results of Operations”- Results of Operations: 2019 As Compared to 2018.”QUARTERLY FINANCIAL DATAThe following table sets forth selected unaudited quarterly financial data for the years ended December 31, 2020 and 2019:IMPACT OF INFLATIONThe consolidated financial statements and notes thereto presented in this report have been prepared in accordance with GAAP, which requires that we measure our financial condition and operating results in terms of historical dollars, without considering changes in the relative purchasing power of money over time due to inflation. The impact of inflation is reflected in the increased cost of our operations. Unlike industrial companies, nearly all of a bank’s assets and liabilities are monetary in nature.current market capitalization. As a result, the impactCompany recorded an impairment charge of interest rates on our performance is greater than the impactentire goodwill balance of general levels$2.4 billion. Refer to "Note 2 - Summary of inflation. Interest rates do not necessarily moveSignificant Accounting Policies" and "Note 16 - Intangible Assets" in Item 8, "Financial Statements and Supplementary Data" for the methodologies and assumptions used in the same direction, or to the same extent, as the prices of goods and services.IMPACT OF RECENT ACCOUNTING PRONOUNCEMENTSRecently Issued Accounting StandardsIn January 2021, the FASB issued ASU No. 2021-01, an update to ASU 2020-04, which clarifies the scope of the optional relief for reference rate reform provided by ASC Topic 848. The ASU permits entities to apply certain of the optional practical expedients and exceptions in ASC 848 to the accounting for derivative contracts and hedging activities that may be affected by changes in interest rates used for discounting cash flows, computing variation margin settlements and calculating price alignment interest (the “discounting transition”). These optional practical expedients and exceptions may be applied to derivative instruments impacted by the discounting transition even if such instruments do not reference a rate that is expected to be discontinued. The ASU was effective upon issuance and can generally be applied through December 31, 2022. The adoption of this ASU is not expected to have a material impact on the Company’s Consolidated Statements of Condition, results of operations, or cash flows.RECONCILIATIONS OF STOCKHOLDERS’ EQUITY, COMMON STOCKHOLDERS’ EQUITY, AND TANGIBLE COMMON STOCKHOLDERS’ EQUITY; TOTAL ASSETS AND TANGIBLE ASSETS; AND THE RELATED MEASURESWhile stockholders’ equity, common stockholders’ equity, total assets, and book value per common share are financial measures that are recorded in accordance with U.S. GAAP, tangible common stockholders’ equity, tangible assets, and tangible book value per common share are not. It is management’s belief that these non-GAAP measures should be disclosed in this report and others we issue for the following reasons:Item7A. 1.Tangible common stockholders’ equity is an important indication of the Company’s ability to grow organicallyQuantitative and through business combinations, as well as its ability to pay dividends and to engage in various capital management strategies.2.Tangible book value per common share and the ratio of tangible common stockholders’ equity to tangible assets are among the capital measures considered by current and prospective investors, both independent of, and in comparison with, the Company’s peers.Tangible common stockholders’ equity, tangible assets, and the related non-GAAP measures should not be considered in isolation or as a substitute for stockholders’ equity, common stockholders’ equity, total assets, or any other measure calculated in accordance with GAAP. Moreover, the manner in which we calculate these non-GAAP measures may differ from that of other companies reporting non-GAAP measures with similar names.Reconciliations of our stockholders’ equity, common stockholders’ equity, and tangible common stockholders’ equity; our total assets and tangible assets; and the related financial measures for the respective periods follow:ITEM 7A.QUANTITATIVE AND QUALITATIVE DISCLOSURES ABOUT MARKET RISKIn 2020, weWe have continuedContinue to emphasizeincrease the origination and retentioninvestments portfolio with an overall shorter duration profile; (2) The use of intermediate-term assets, primarily in the form of multi-family and CRE loans; (2) We have continued the origination of certain C&I loans that feature floating interest rates; (3) We replace maturing wholesale borrowings with longer term borrowings; and (4) In 2019, we entered into anderivatives to manage our interest rate swap with a notional amount of $2.0 billion to hedge certain real estate loans.LIBOR Transition ProcessOn July 27, 2017,position; (3) Increased the FCA, which regulates LIBOR, announced that it will no longer persuade or compel banks to submit rates for the calculation of LIBOR after 2021 which was recently extended to June 30, 2023. Accordingly, the FRB has recommended an alternative index dubbed the Secured Overnight Financing Rate or “SOFR”. The Bank has established a sub-committee of its ALCO to address issues related to the phase-outfocus on retaining and ultimate transition away from LIBOR to an alternate rate. This sub-committee is led byincreasing our Chief Financial Officer and consists of personnel from various departments throughout the Bank including lending, loan administration, credit risk management, finance/treasury, information technology, and operations. The Company has LIBOR-based contracts that extend beyond 2021 included in loans and leases, securities, wholesale borrowings, derivative financial instruments, and long-term debt. The sub-committee has reviewed contract fallback language and noted that certain contracts will need updated provisions for the transition and is coordinating with impacted business lines. To mitigate the risks associated with the expected discontinuation of LIBOR, the Company has ceased originating LIBOR-linked residential mortgage loans, implemented fallback language for LIBOR-linked commercial loans, adhered to the ISDA 2020 Fallbacks Protocol for interest rate swap agreements, and has updated or is in the process of updating its systems to accommodate SOFR-linked loans. In accordance with regulatory guidance, the Company intends to stop entering into LIBOR transactions by the end of 2021.The matching of assets and liabilities may be analyzed by examining the extent to which such assets and liabilities are “interest rate sensitive” and by monitoring a bank’s interest rate sensitivity “gap.” An asset or liability is said to be interest rate sensitive within a specific time frame if it will mature or reprice within that period of time. The interest rate sensitivity gap is defined as the difference between the amount of interest-earning assets maturing or repricing within a specific time frame and the amount of interest-bearing liabilities maturing or repricing within that same period of time.At December 31, 2020, our one-year gap was a negative 4.94%, as compared to a negative 12.31% at December 31, 2019. The change in our one-year gap from December 31, 2019, primarily reflects an increase in cash and cash equivalents and the addition of more term funding.In a rising interest rate environment, an institution with a negative gap would generally be expected, absent the effects of other factors, to experience a greater increase in the cost of its interest-bearing liabilities than it would in the yield on its interest-earning assets, thus producing a decline in its net interest income. Conversely, in a declining rate environment, an institution with a negative gap would generally be expected to experience a lesser reduction in the yield on its interest-earning assets than it would in the cost of its interest-bearing liabilities, thus producing an increase in its net interest income.In a rising interest rate environment, an institution with a positive gap would generally be expected to experience a greater increase in the yield on its interest-earning assets than it would in the cost of its interest-bearing liabilities, thus producing an increase in its net interest income. Conversely, in a declining rate environment, an institution with a positive gap would generally be expected to experience a lesser reduction in the cost of its interest-bearing liabilities than it would in the yield on its interest-earning assets, thus producing a decline in its net interest income.The table on the following page sets forth the amounts of interest-earning assets and interest-bearing liabilities outstanding at December 31, 2020 which, based on certain assumptions stemming from our historical experience, are expected to reprice or mature in each of the future time periods shown. Except as stated below, the amounts of assets and liabilities shown as repricing or maturing during a particular time period were determined in accordance with the earlier of (1) the term to repricing, or (2) the contractual terms of the asset or liability.The table provides an approximation of the projected repricing of assets and liabilities at December 31, 2020 on the basis of contractual maturities, anticipated prepayments, and scheduled rate adjustments within a three-month period and subsequent selected time intervals. For residential mortgage-related securities, prepayment rates are forecasted at a weighted average CPR of 25.83% per annum; for multi-family and CRE loans, prepayment rates are forecasted at weighted average CPRs of 17.12% and 12.08% per annum, respectively. Borrowed funds were not assumed to prepay.Savings, interest bearing checking and money market accounts were assumed to decay based on a comprehensive statistical analysis that incorporated our historical deposit experience. Based on the results of this analysis, savings accounts were assumed to decay at a rate of 75% for the first five years and 25% for years six through ten. Interest-bearing checking accounts were assumed to decay at a rate of 83% for the first five years and 17% for years six through ten. The decay assumptions reflect the prolonged low interest rate environment and the uncertainty regarding future depositor behavior. Including those accounts having specified repricing dates, money market accounts were assumed to decay at a rate of 91% for the first five years and 9% for years six through ten. Interest Rate Sensitivity Analysis(1)For the purpose of the gap analysis, loans held for sale, non-performing loans and the allowance for loan losses have been excluded.(2)Mortgage-related and other securities, including FHLB stock, are shown at their respective carrying amounts.(3)Expected amount based, in part, on historical experience.(4)The interest rate sensitivity gap per period represents the difference between interest-earning assets and interest-bearing liabilities.Prepayment and deposit decay rates can have a significant impact on our estimated gap. While we believe our assumptions to be reasonable, there can be no assurance that the assumed prepayment and decay rates noted above will approximate actual future loan and securities prepayments and deposit withdrawal activity.To validate our prepayment assumptions for our multi-family and CRE loan portfolios, we perform a monthly analysis, during which we review our historical prepayment rates and compare them to our projected prepayment rates. We continually review the actual prepayment rates to ensure that our projections are as accurate as possible, since prepayments on these types of loans are not as closely correlated to changes in interest rates as prepayments on one-to-four family loans tend to be. In addition, we review the call provisions in our borrowings and investment portfolios and, on a monthly basis, compare the actual calls to our projected calls to ensure that our projections are reasonable.As of December 31, 2020, the impact of a 100 bp decline in market interest rates for our loans would have had very little impact on prepayment speeds due to the current low interest rates and current coupons being floored at base rates. The impact of a 100 bp increase in market interest rates would have decreased our projected prepayment rates for multi-family and CRE loans by a constant prepayment rate of 2.92% per annumCertain shortcomings are inherent in the method of analysis presented in the preceding Interest Rate Sensitivity Analysis. For example, although certain assets and liabilities may have similar maturities or periods to repricing, they may react in different degrees to changes in market interest rates. The interest rates on certain types of assets and liabilities may fluctuate in advance of the market, while interest rates on other types may lag behind changes in market interest rates. Additionally, certain assets, such as adjustable-rate loans, have features that restrict changes in interest rates both on a short-term basis and over the life of the asset. Furthermore, in the event of a change in interest rates, prepayment and early withdrawal levels would likely deviate from those assumed in calculating the table. Also, the ability of some borrowers to repay their adjustable-rate loans may be adversely impacted by an increase in market interest rates. also monitored through the use of a model that generates estimates of the change in our Economic Value of Equity (“EVE”)(EVE) over a range of interest rate scenarios. EVE is defined as the net present value of expected cash flows from assets, liabilities, and off-balance sheet contracts. The EVE ratio, under any interest rate scenario, is defined as the EVE in that scenario divided by the market value of assets in the same scenario. The model assumes estimated loan and MBS prepayment rates, reinvestment rates,current market value spreads, and deposit decay rates similar to those utilized in formulating the preceding Interest Rate Sensitivity Analysis.2020,2023, the following table sets forth our EVE, assuming the changes in interest rates noted:(1)Change in Interest Rates (in basis points)The impactEstimated Percentage Change in Economic Value of a 100-bp and a 200-bp reduction in interest rates is not presented in view of the current level of the federal funds rate and other short-term interest rates.Equity-200 shock (2.39)% -100 shock (1.31)% +100 shock (0.28)% +200 shock (1.44)% As withInterest Rate Sensitivity Analysis, certain shortcomings are inherent in the methodology used in the precedingEVE analysis provides an indication of our interest rate risk measurements. exposure at a particular point in time, such measurements are not intended to, and do not, provide a precise forecast of the effect of changes in market interest rates on our net interest income, and may very well differ from actual results.EVENII requires that certain assumptions be made whichEVENII analysis presented abovebelow assumes that the composition of our interest rate sensitive assets and liabilities existing at the beginning of a period remains constant over the period being measured, and also assumes that a particular change in interest rates is reflected uniformly across the yield curve, regardless of the duration to maturity or repricing of specific assets and liabilities. Accordingly, while the EVE analysis provides an indication of our interest rate risk exposure at a particular point in time, such measurements are not intended to, and do not, provide a precise forecast of the effect of changes in market interest rates on our net interest income, and may very well differ from actual results.We also utilize an internal net interest income simulation to manage our sensitivity to interest rate risk. The simulation incorporates various market-based assumptions regarding the impact of changing interest rates on future levels of our financial assets and liabilities. The assumptions used in the net interest income simulation are inherently uncertain. Actual results may differ significantly from those presented in the following table, due to the frequency, timing, and magnitude of changes in interest rates; changes in spreads between maturity and repricing categories; and prepayments, among other factors, coupled with any actions taken to counter the effects of any such changes.2020,2023, the following table reflects the estimated percentage change in future net interest income for the next twelve months, assuming the changes in interest rates noted:(in (in basis points) (2)+100 over one year (1.02)(5.81)%(3.17)% +100 shock 3.24% +200 over one yearshock(2.68)(1)6.40%In general, short- and long-term rates are assumed to increase in parallel fashion across all four quarters and then remain unchanged.(2)The impact of a 100bp and a 200-bp reduction in interest rates is not presented in view of the current level of the federal funds rate and other short-term interest rates.gap, NPV,EVE, and/or net interest income simulation.•Our ALCO Committee would inform the Board of Directors of the variance, and present recommendations to the Board regarding proposed courses of action to restore conditions to within-policy tolerances.•In formulating appropriate strategies, the ALCO Committee would ascertain the primary causes of the variance from policy tolerances, the expected term of such conditions, and the projected effect on capital and earnings.synthetic hedging techniquesother balance sheet management activities including the potential use of derivatives to more immediately reduce the risk exposure. Where variance from policy tolerances is triggered by more fundamental imbalances in the risk profiles of core loan and deposit products, a remedial strategy may involve restoring balance through natural hedges to the extent possible before employing synthetic hedging techniques. Other strategies might include:•Asset restructuring, involving sales of assets having higher risk profiles, or a gradual restructuring of the asset mix over time to affect the maturity or repricing schedule of assets;•Liability restructuring, whereby product offerings and pricing are altered or wholesale borrowings are employed to affect the maturity structure or repricing of liabilities;Expansion or shrinkage of the balance sheet to correct imbalances in the repricing or maturity periods between assets and liabilities; and/or•Use or alteration of off-balance sheet positions, including interest rate swaps, caps, floors, options, and forward purchase or sales commitments.
•Liability restructuring, whereby product offerings and pricing are altered or wholesale borrowings are employed to affect the maturity structure or repricing of liabilities;2020,2023, our analysis indicated that an immediatea further inversion of the yield curve would be expected to result in a 6.57% decrease2.1 increase in net interest income; conversely, an immediate steepening of the yield curve would be expected to result in a 1.74% increase2.4 percent decrease in net interest income. It should be noted that the yield curveincome. Both scenarios are derived from immediate changes in these scenarios were updated, given the changing market rate environment, which resulted in an increase in the income sensitivity.to short-term rates.ITEM 8.FINANCIAL STATEMENTS AND SUPPLEMENTARY DATAOurITEM 8. FINANCIAL STATEMENTS AND SUPPLEMENTARY DATA and Notes thereto and other supplementary data begin on the following page.NEW YORK COMMUNITY BANCORP, INC.CONSOLIDATED STATEMENTS OF CONDITIONDecember 31, 2023 December 31, 2022 (in millions, except per share data) ASSETS: Cash and cash equivalents $ 11,475 $ 2,032 Securities: Debt Securities available-for-sale ($2,822 and $434 pledged at December 31, 2023 and December 31, 2022, respectively) 9,145 9,060 Equity investments with readily determinable fair values, at fair value 14 14 Total securities 9,159 9,074 Loans held for sale ($902 and $1,115 measured at fair value, respectively) 1,182 1,115 Loans and leases held for investment, net of deferred loan fees and costs 84,619 69,001 Less: Allowance for credit losses on loans and leases (992) (393) Total loans and leases held for investment, net 83,627 68,608 Federal Home Loan Bank stock and Federal Reserve Bank stock, at cost 1,392 1,267 Premises and equipment, net 652 491 Core deposit and other intangibles 625 287 Goodwill — 2,426 Mortgage servicing rights 1,111 1,033 Bank-owned life insurance 1,580 1,561 Other assets 3,254 2,250 Total assets $ 114,057 $ 90,144 LIABILITIES AND STOCKHOLDERS' EQUITY: Deposits: Interest-bearing checking and money market accounts $ 30,700 $ 22,511 Savings accounts 8,773 11,645 Certificates of deposit 21,554 12,510 Non-interest-bearing accounts 20,499 12,055 Total deposits 81,526 58,721 Borrowed funds: Federal Home Loan Bank and Federal Reserve Bank advances 20,250 20,325 Junior subordinated debentures 579 575 Subordinated notes 438 432 Total borrowed funds 21,267 21,332 Other liabilities 2,897 1,267 Total liabilities 105,690 81,320 Stockholders' equity: Preferred stock at par $0.01 (5,000,000 shares authorized): Series A (515,000 shares issued and outstanding) 503 503 7 7 Paid-in capital in excess of par 8,231 8,130 Retained earnings 443 1,041 Treasury stock, at cost ($22,089,421 and 24,212,052 shares, respectively) (218) (237) Accumulated other comprehensive loss, net of tax: Net unrealized loss on securities available for sale, net of tax of $225 and $240, respectively (581) (626) Net unrealized loss on pension and post-retirement obligations, net of tax of $12 and $18, respectively (28) (46) Net unrealized gain on cash flow hedges, net of tax of $(6) and $(20), respectively 10 52 Total accumulated other comprehensive loss, net of tax (599) (620) Total stockholders’ equity 8,367 8,824 Total liabilities and stockholders’ equity $ 114,057 $ 90,144 NEW YORK COMMUNITY BANCORP, INC.CONSOLIDATED STATEMENTS OF INCOME AND COMPREHENSIVE INCOMEFor the Years Ended December 31, (in millions, except per share data) 2023 2022 2021 INTEREST INCOME: Loans and leases $ 4,509 $ 1,848 $ 1,525 Securities and money market investments 982 244 164 Total interest income 5,491 2,092 1,689 INTEREST EXPENSE: Interest-bearing checking and money market accounts 943 226 31 Savings accounts 169 60 28 Certificates of deposit 646 97 55 Borrowed funds 656 313 286 Total interest expense 2,414 696 400 Net interest income 3,077 1,396 1,289 Provision for credit losses 833 133 3 Net interest income after provision for credit loan losses 2,244 1,263 1,286 NON-INTEREST INCOME: Fee income 172 27 23 Bank-owned life insurance 43 32 29 Net loss on securities (1) (2) — Net return on mortgage servicing rights 103 6 — Net gain on loan sales and securitizations 89 5 — Net loan administration income 82 3 — Bargain purchase gain 2,131 159 — Other 68 17 9 Total non-interest income 2,687 247 61 NON-INTEREST EXPENSE: Operating expenses: Compensation and benefits 1,149 354 303 Occupancy and equipment 200 92 88 General and administrative 750 158 127 Total operating expense 2,099 604 518 Intangible asset amortization 126 5 — Merger-related and restructuring expenses 330 75 23 Goodwill impairment 2,426 — — Total non-interest expense 4,981 684 541 (Loss) Income before income taxes (50) 826 806 Income tax expense 29 176 210 Net (loss) income $ (79) $ 650 $ 596 Preferred stock dividends 33 33 33 Net (loss) income available to common stockholders $ (112) $ 617 $ 563 Basic (loss) earnings per common share $ (0.16) $ 1.26 $ 1.20 Diluted (loss) earnings per common share $ (0.16) $ 1.26 $ 1.20 Net (loss) income $ (79) $ 650 $ 596 Other comprehensive gain (loss), net of tax: Change in net unrealized loss on securities available for sale, net of tax of $(15); $223 and $42, respectively 45 (581) (112) Change in pension and post-retirement obligations, net of tax of $(5); $6 and $(8), respectively 12 (17) 23 Change in net unrealized gain on cash flow hedges, net of tax of $(3); $(24) and $(2), respectively 6 64 6 Reclassification adjustment for defined benefit pension plan, net of tax of $(1); $— and $(2), respectively 6 2 5 Reclassification adjustment for net (loss) gain on cash flow hedges included in net income, net of tax $17; $1 and $(7), respectively (48) (3) 18 Total other comprehensive gain (loss), net of tax 21 (535) (60) Total comprehensive (loss) income, net of tax $ (58) $ 115 $ 536 NEW YORK COMMUNITY BANCORP, INC.CONSOLIDATED STATEMENTS OF CHANGES IN STOCKHOLDERS’ EQUITY(1)Amount represents a $10.5 million cumulative adjustment, net of tax, to retained earnings as of January 1, 2020, as a result of the adoption of ASU 2016-13, Financial Instruments - Credit Losses (Topic 326): Measurement of Credit Losses on Financial Instruments, which became effective January 1, 2020.(in millions, except share data) Shares Outstanding Preferred Stock (Par Value: $0.01) Common Stock (Par Value: 0.01) Paid-in Capital in excess of Par Retained Earnings Treasury Stock, at Cost Accumulated Other Comprehensive Loss, Net of Tax Total Stockholders’ Equity Year Ended December 31, 2023 Balance at December 31, 2022 681,217,334 $ 503 $ 7 $ 8,130 $ 1,041 $ (237) $ (620) $ 8,824 Issuance and exercise of FDIC Equity appreciation instrument 39,032,006 — — 85 — — — 85 Shares issued for restricted stock, net of forfeitures 3,074,565 — — (31) — 31 — — Compensation expense related to restricted stock awards — — — 47 — — — 47 Net income — — — — (79) — — (79) Dividends paid on common stock ($0.56) — — — — (486) — — (486) Dividends paid on preferred stock ($63.76) — — — — (33) — — (33) Purchase of common stock (1,257,535) — — — — (12) — (12) Other comprehensive income, net of tax — — — — — — 21 21 Balance at December 31, 2023 722,066,370 $ 503 $ 7 $ 8,231 $ 443 $ (218) $ (599) $ 8,367 Year Ended December 31, 2022 Balance at December 31, 2021 465,015,643 $ 503 $ 5 $ 6,126 $ 741 $ (246) $ (85) $ 7,044 Issuance and exercise of FDIC Equity appreciation instrument 214,990,316 — 2 2,008 — — — 2,010 Shares issued for restricted stock, net of forfeitures 3,548,310 — — (33) — 33 — — Compensation expense related to restricted stock awards — — — 29 — — — 29 Net income — — — — 650 — — 650 Dividends paid on common stock ($0.68) — — — — (317) — — (317) Dividends paid on preferred stock ($63.76) — — — — (33) — — (33) Purchase of common stock (2,336,935) — — — — (24) — (24) Other comprehensive loss, net of tax — — — — — — (535) (535) Balance at December 31, 2022 681,217,334 $ 503 $ 7 $ 8,130 $ 1,041 $ (237) $ (620) $ 8,824 Year Ended December 31, 2021 Balance at December 31, 2020 463,901,808 $ 503 $ 5 $ 6,123 $ 494 $ (258) $ (25) $ 6,842 Shares issued for restricted stock, net of forfeitures 2,515,942 — — (28) — 28 — — Compensation expense related to restricted stock awards — — — 31 — — — 31 Net income — — — — 596 — — 596 Dividends paid on common stock ($0.68) — — — — (316) — — (316) Dividends paid on preferred stock ($63.76) — — — — (33) — — (33) Purchase of common stock (1,402,107) — — — — (16) — (16) Other comprehensive loss, net of tax — — — — — — (60) (60) Balance at December 31, 2021 465,015,643 $ 503 $ 5 $ 6,126 $ 741 $ (246) $ (85) $ 7,044 NEW YORK COMMUNITY BANCORP, INC.CONSOLIDATED STATEMENTS OF CASH FLOWS(1)Includes $20.0 million and $38.4 million of net amortization of operating lease right-of-use assets for the twelve months ended December 31, 2020 and December 31, 2019, respectively.(2)Includes $20.0 million and $38.4 million of net amortization of operating lease liability for the twelve months ended December 31, 2020 and December 31, 2019, respectively.For the Years Ended December 31, (in millions) 2023 2022 2021 CASH FLOWS FROM OPERATING ACTIVITIES: Net (loss) income $ (79) $ 650 $ 596 Adjustments to reconcile net income to net cash provided by operating activities: Provision for loan losses 833 133 3 Amortization of intangibles 126 5 — Depreciation 39 18 21 Amortization of discounts and premiums, net 221 (37) (5) Net loss on securities 1 2 — Net gain on sales of loans (89) (5) (1) Net gain on sales of fixed assets — (2) — Gain on business acquisition (2,131) (159) — Goodwill Impairment 2,426 — — Stock-based compensation 47 29 31 Deferred tax expense (187) (3) (13) Changes in operating assets and liabilities: (Increase) decrease in other assets (721) 348 (284) Decrease in other liabilities (255) (100) (6) Purchases of securities held for trading (10) (75) (110) Proceeds from sales of securities held for trading 10 75 110 Change in loans held for sale, net 32 147 (52) Net cash provided by operating activities 263 1,026 290 CASH FLOWS FROM INVESTING ACTIVITIES: Proceeds from repayment of securities available for sale 1,402 732 1,728 Proceeds from sales of securities available for sale including loans that have been securitized 1,858 228 — Purchase of securities available for sale (3,046) (2,242) (1,796) Redemption of Federal Home Loan Bank stock 1,501 635 92 Purchases of Federal Home Loan Bank and Federal Reserve Bank stock (1,626) (839) (112) Proceeds from bank-owned life insurance, net 30 16 12 Proceeds from sales of loans — — 37 Purchases of loans — (162) (161) Net proceeds from sales of MSR's 50 — — Other changes in loans, net (4,331) (5,019) (2,558) Purchases of premises and equipment, net (66) (3) (4) Cash acquired in business acquisition 24,901 331 — Net cash provided by (used in) investing activities 20,673 (6,323) (2,762) CASH FLOWS FROM FINANCING ACTIVITIES: Net (decrease) increase in deposits (10,738) 7,662 2,622 Net (decrease) increase in short-term borrowed funds (550) 2,550 950 Proceeds from long-term borrowed funds 19,850 9,479 2,072 Repayments of long-term borrowed funds (19,374) (13,960) (2,544) Net disbursement of payments of loans serviced for others (66) (189) — Cash dividends paid on common stock (486) (317) (316) Cash dividends paid on preferred stock (33) (33) (33) Treasury stock repurchased — (7) — Payments relating to treasury shares received for restricted stock award tax payments (12) (17) (16) Net cash (used in) provided by financing activities (11,409) 5,168 2,735 9,527 (129) 263 2,082 2,211 1,948 $ 11,609 $ 2,082 $ 2,211 Supplemental information: Cash paid for interest $ 2,290 $ 657 $ 402 Cash paid for income taxes 54 17 471 Non-cash investing and financing activities: Transfers to repossessed assets from loans $ 9 $ — $ 1 Securitization of loans to mortgage-backed securities available for sale 222 162 161 Transfer of loans from held for investment to held for sale 163 — 52 Transfer of loans from held for sale to held for investment — — 94 MSRs resulting from sale or securitization of loans — 19 — Shares issued for restricted stock awards 31 33 28 Business Combinations: Fair value of tangible assets acquired 37,384 24,449 — Intangible assets 464 292 — Mortgage servicing rights — 1,012 — Liabilities assumed 35,632 23,584 — Common Stock issued in business combination — 2,010 — Issuance of FDIC Equity appreciation instrument 85 — — NOTE 1: ORGANIZATION AND BASIS OF PRESENTATIONNew York CommunityFlagstar Bank N.A. (hereinafter referred to as the “Bank”).Founded on April 14, 1859 The Company is headquartered in Hicksville, New York with regional headquarters in Troy, Michigan.formerly known as Queens County Savingssupervision by the Federal Reserve. The Bank is a National Association, subject to federal regulation and oversight by the Bank converted from a state-chartered mutual savings bank to the capital stock form of ownership onOCC. at which date the Company issued its initial offering of common stock (par value: $0.01 per share) at a price of $25.00 per share ($0.93 per share on a split-adjusted basis, reflecting the impact of nine stock splits between 1994 and 2004).237420 branches across twelve states, including strong footholds in the Northeast and Midwest and exposure to markets in the Southeast and West Coast. Flagstar Mortgage operates nationally through eighta wholesale network of approximately 3,600 third-party mortgage originators. Flagstar Bank N.A. also operates through nine local divisions, each with a history of service and strength: New York Community Bank, Queens County Savings Bank, Roslyn Savings Bank, Richmond County Savings Bank, Roosevelt Savings Bank, and Atlantic Bank in New York; Garden State Community Bank in New Jersey; Ohio Savings Bank in Ohio; and AmTrust Bank in Arizona and Florida. (“GAAP”) and to general practices within the banking industry. The preparation of financial statements in conformity with GAAP requires the Company to make estimates and judgments that affect the reported amounts of assets and liabilities and the disclosure of contingent assets and liabilities at the date of the consolidated financial statements, and the reported amounts of revenues and expenses during the reporting period. Estimates that are used in connection with the determination of the allowance for loan and leasecredit losses, mortgage servicing rights, the Flagstar acquisition and the evaluation of goodwill for impairment,9, “Borrowed12 - Borrowed Funds” for additional information regarding these trusts.NOTE 2: SUMMARY OF SIGNIFICANT ACCOUNTING POLICIESStandard Description Effective Date ASU 2022-02- Financial Instruments - Credit Losses (Topic 326): Troubled Debt Restructurings and Vintage Disclosures Issued March 2022 ASU 2022-02 eliminates prior accounting guidance for TDRs, while enhancing disclosure requirements for certain loan refinancings and restructurings by creditors when a borrower is experiencing financial difficulty. The standard also requires that an entity disclose current-period gross charge-offs by year of origination for financing receivables and net investments in leases. The Company adopted ASU 2022-02 effective January 1, 2023 using a modified retrospective transition approach for the amendments related to the recognition and measurement of TDRs. The impact of the adoption resulted in an immaterial change to the allowance for credit losses ("ACL"), thus no adjustment to retained earnings was recorded. Disclosures have been updated to reflect information on loan modifications given to borrowers experiencing financial difficulty as presented in Note 6. TDR disclosures are presented for comparative periods only and are not required to be updated in current periods. Additionally, the current year vintage disclosure included in Note 6 has been updated to reflect gross charge-offs by year of origination for the three months ended September 30, 2023. ASU 2023-02 Investments - Equity Method and Joint Ventures (Topic 323): Accounting for Investments in Tax Credit Structures Using the Proportional Amortization Method Issued: March 2023 ASU 2023-02 permits reporting entities to elect to account for their tax equity investments, regardless of the tax credit program from which the income tax credits are received, using the proportional amortization method if certain conditions are met. The Company adopted ASU 2023-02 effective January 1, 2023 and it did not have a significant impact on the Company's consolidated financial statements. agreements.agreements, if any. At December 31, 20202023 and 2019,2022, the Company’s cash and cash equivalents totaled $1.9$11.5 billion and $741.9 million,$2.0 billion, respectively. Included in cash and cash equivalents at those dates were $1.6$10.7 billion and $608.4$837 million, respectively, of interest-bearing deposits in other financial institutions, primarily consisting of balances due from the FRB-NY. There were 0 federal funds sold atno reverse repurchase agreements outstanding as of December 31, 2020. Included in cash2023 and cash equivalents at December 31, 2019 were federal funds sold of $1.7 million. There was $193.5$793 million of reverse repurchase agreements were outstanding at December 31, 2020.2022. There were 0 reverse repurchase agreementsno federal funds sold outstanding at December 31, 2019.assessassesses whether (i) it intends to sell, or (ii) it is more likely than not that the Company will be required to sell the security before recovery of its amortized cost basis. If either of these criteria is met, any previously recognized allowances are charged off and the security’s amortized cost basis is written down to fair value through income. If neither of the aforementioned criteria are met, the Company evaluates whether the decline in fair value has resulted from credit losses or other factors. If this assessment indicates that a credit loss exists, the present value of cash flows expected to be collected from the security are compared to the amortized cost basis of the security. If the present value of cash flows expected to be collected is less than the amortized cost basis, a credit loss exists and an allowance for credit losses is recorded for the credit loss, limited by the amount that the fair value is less than the amortized cost basis. Any impairment that has not been recorded through an allowance for credit losses is recognized in other comprehensive income. a method that approximates the interest method, and are adjusted for anticipated prepayments. Dividend and interest income are recognized when earned. The cost of securities sold is based on the specific identification method.FHLB-NY.loans.The Company’s January 1, 2020, adoption of ASU No. 2016-13, “Measurement of Credit Losses on Financial Instruments,” resulted in a significant change to our methodology for estimating the allowance since December 31, 2019. ASU No. 2016-13 replaces the incurred loss methodology with an expected loss methodology that is referred to as the CECL methodology. The measurement of expected credit losses under CECL is applicable to financial assets measured at amortized cost, including loan receivables. It also applies to off-balance sheet exposures not accounted for as insurance and net investments in leases accounted for under ASC Topic 842. At December 31, 2019, the allowance for loan and lease losses totaled $147.6 million. On January 1, 2020, the Company adopted the CECL methodology under ASU Topic 326 and recognized an increase in the ACL on loans and leases of $1.9 million as a “Day 1” transition adjustment from changes in methodology, with a corresponding decrease in retained earnings. Separately, at December 31, 2019, the Company had an allowance for unfunded commitments of $461,000. Upon adoption, the Company recognized an increase in the allowance for unfunded commitments of $12.5 million as a “Day 1” transition adjustment with a corresponding decrease in retained earnings.loss-given-defaultloss- given-default and exposure-at-default depending on economic parameters for each month of the remaining contractual term. Economicterm, as well as credit ratings for certain loans within the commercial and industrial portfolio. The Company loss drivers for certain loans in the commercial and industrial portfolio are derived using leverages economic projections including property market and prepayment forecasts from established independent third parties, as well as credit ratings for certain loans within the commercial and industrial portfolio, to inform its loss drivers in the forecast. The Company estimates the exposure-at-default using prepayment models which forecasts prepayments over the life of the loans and leases. The economic forecast and the related economic parameters are developed using available information relating to past events, current conditions, multiple economic forecasts scenarios, including related weightings, over the reasonable and supportable forecast period and macroeconomic assumptions. The Company’seconomic forecast scenarios and related economic parameters are sourced from independent third parties. The economic forecast over a reasonable and supportable period ofis 24 months, and afterwards the Company reverts to a historical average loss rate on a straight linestraight-line basis over a 12 month12-month period. Historical credit loss experience over the historical loss observation period provides the basis for the estimation of expected credit losses, with qualitative factor adjustments madeloansloan and leases, which is performed at least quarterly, is designed to be dynamic and responsive to changes in portfolio credit quality and forecasted economic conditions. Each quarter the Company reassesses the appropriateness of the reasonable and supportableeconomic forecasting period, the reversion period and historical mean at the portfolio segment level, considering any required adjustments for differences in underwriting standards, portfolio mix, and other relevant data shifts over time.Smaller pools of homogenous financing receivables with homogeneous risk characteristics were modeled using the methodology selected for the portfolio segment. The macroeconomic data used in the quantitative models are based on a reasonable and supportable forecast period of 24 months. The Company leverages economic projections including property market and prepayment forecasts from established independent third parties, as well as credit ratings for certain loans within the commercial and industrial portfolio, to inform its loss drivers in the forecast. Beyond this forecast period, the Company reverts to a historical average loss rate. This reversion to the historical average loss rate is performed on a straight-line basis over 12 months.In addition, all taxi medallion loans are individually evaluated. If a loan is determined to be collateral dependent, or meets the criteria to apply the collateral dependent practical expedient, expected credit losses are determined based on the fair value of the collateral at the reporting date, less costs to sell as appropriate.credit conversion factor (“CCF”)CCF trends to estimate utilization rates, and chose an appropriate mean CCF based on both management judgment and quantitative analysis. Quantitative analysis involved examination of CCFs over a range of fund-up windows (between 12 and 36 months) and comparison of the mean CCF for each fund-up window with management judgment determining whether the highest mean CCF across fund-up windows made business sense. The Company applies the same standards and estimated loss rates to the credit exposures as to the related class of loans.Allowance for LoanLease Losses - 2019At December 31, 2019, the methodology used for the allocation of the allowance for loan and lease losses the Bank segregated their loss factors (used for both criticized and non-criticized loans) into a component that was primarily based on historical loss rates and a component that was primarily based on other qualitative factors that are probable to affect loan collectability. In determining the allowance for loan and lease losses, management considers the Bank’s current business strategies and credit processes, including compliance with applicable regulatory guidelines and with guidelines approved by the Boards of Directors with regard to credit limitations, loan approvals, underwriting criteria, and loan workout procedures.The allowance for loan and lease losses is established based on management’s evaluation of incurred losses in the portfolio in accordance with GAAP, and is comprised of both specific valuation allowances and a general valuation allowance.Specific valuation allowances are established based on management’s analyses of individual loans that are considered impaired. If a loan is deemed to be impaired, management measures the extent of the impairment and establishes a specific valuation allowance for that amount. A loan is classified as impaired when, based on current information and/or events, it is probable that the Company will be unable to collect all amounts due under the contractual terms of the loan agreement. The Company applies this classification as necessary to loans individually evaluated for impairment in our portfolios. Smaller-balance homogenous loans and loans carried at the lower of cost or fair value are evaluated for impairment on a collective, rather than individual, basis. Loans to certain borrowers who have experienced financial difficulty and for which the terms have been modified, resulting in a concession, are considered TDRs and are classified as impaired.The Company primarily measures impairment on an individual loan and determine the extent to which a specific valuation allowance is necessary by comparing the loan’s outstanding balance to either the fair value of thecollateral, less the estimated cost to sell, or the present value of expected cash flows, discounted at the loan’s effective interest rate. Generally, when the fair value of the collateral, net of the estimated cost to sell, or the present value of the expected cash flows is less than the recorded investment in the loan, any shortfall is promptly charged off.The Company also follows a process to assign the general valuation allowance to loan categories. The general valuation allowance is established by applying our loan loss provisioning methodology, and reflect the inherent risk in outstanding held-for-investment loans. This loan loss provisioning methodology considers various factors in determining the appropriate quantified risk factors to use to determine the general valuation allowance. The factors assessed begin with the historical loan loss experience for each major loan category. The Company also takes into account an estimated historical loss emergence period (which is the period of time between the event that triggers a loss and the confirmation and/or charge-off of that loss) for each loan portfolio segment.The allocation methodology consists of the following components: First, the Company determines an allowance for loan and lease losses based on a quantitative loss factor for loans evaluated collectively for impairment. This quantitative loss factor is based primarily on historical loss rates, after considering loan type, historical loss and delinquency experience, and loss emergence periods. The quantitative loss factors applied in the methodology are periodically re-evaluated and adjusted to reflect changes in historical loss levels, loss emergence periods, or other risks. Lastly, the Company allocates an allowance for loan and lease losses based on qualitative loss factors. These qualitative loss factors are designed to account for lossesjudgments that may not be provided forinfluenced by the quantitative loss component duechanges period to other factors evaluated by management, whichperiod. These include, but are not limited to:•Changes in lending policies and procedures, includingto changes in underwriting standardsthe economic environment and collection,forecasts, changes in the credit profile and charge-offcharacteristics of the loan portfolio, and recovery practices;•Changeschanges in international, national, regional,prepayment assumptions which will result in provisions to or recoveries from the balance of the allowance for credit losses.local economicportfolio characteristics will change from period to period, portfolio prepayments are an integral assumption in estimating the allowance for credit losses on our commercial real estate (multi-family, CRE and business conditionsADC) portfolio which comprises 60 percent of the loan portfolio at December 31, 2023. Portfolio prepayments are subject to estimation uncertainty and developments that affectchanges in this assumption could have a material impact to our estimation process. Prepayment assumptions are sensitive to interest rates and existing loan terms and determine the collectabilityweighted average life of the commercial mortgage loan portfolio. Excluding other factors, as the weighted average life of the portfolio includingincreases or decreases, so will the conditionrequired amount of variousthe allowance for credit losses on commercial real estate.segments;approach to determine the fair value of our single reporting unit, which considers how a market participant would view a control premium, complemented by an income approach if deemed necessary. The resulting value is then compared to our book value and any shortfalls would be recorded as an impairment.•nature and volume of the portfolio and in the terms of loans;•Changes in the volume and severity of past-due loans, the volume of non-accrual loans, and the volume and severity of adversely classified or graded loans;•Changes in the qualityfair value of our loan review system;•Changes in the value of the underlying collateral for collateral-dependent loans;•The existence and effect of any concentrations of credit, and changes in the level of such concentrations;•Changes in the experience, ability, and depth of lending management and other relevant staff; and•The effect of other external factors, such as competition and legal and regulatory requirements,MSRs are reported on the level of estimated credit losses in the existing portfolio.By considering the factors discussed above, the Company determined an allowance for loan and lease losses that is applied to each significant loan portfolio segment to determine the total allowance for loan and lease losses.The historical loss period the Company uses to determine the allowance for loan and lease losses on loans is a rolling 36-quarter look-back period, as the Company believe this produces an appropriate reflection of our historical loss experience.The process of establishing the allowance for losses on loans also involves:•Periodic inspections of the loan collateral by qualified in-house and external property appraisers/inspectors;•Regular meetings of executive management with the pertinent Board committees, during which observable trends in the local economy and/or the real estate market are discussed;•Assessment of the aforementioned factors by the pertinent members of the Board of Directors and management when making a business judgment regarding the impact of anticipated changes on the future level of loan losses; and•Analysis of the portfolio in the aggregate, as well as on an individual loan basis, taking into consideration payment history, underwriting analyses, and internal risk ratings.In order to determine their overall adequacy, the loan loss allowance is reviewed quarterly by management Board Committees and the Board of Directors of the Bank, as applicable.An allowance for unfunded commitments is maintained separate from the allowance for loan and lease losses and is included in Other liabilities in the Consolidated Statements of Condition.GoodwillThe Company adopted,Income and Comprehensive Income in net return on a prospective basis, ASU No. 2017-04, Intangibles—Goodwillmortgage servicing. For further information, see Note 9 - Mortgage Servicing Rights and Other (Topic 350): Simplifying the Test for Goodwill Impairment on January 1, 2020. The Company has significant intangible assets related to goodwill and as of December 31, 2020, the Company had goodwill of $2.4 billion. In connection with its acquisitions, the assets acquired and liabilities assumed are recorded at their estimated fair values. Goodwill represents the excess of the purchase price of its acquisitions over the fair value of identifiable net assets acquired, including other identified intangible assets. The Company tests goodwill for impairment at the reporting unit level. The Company has identified 1 reporting unit which is the same as its operating segment and reportable segment. If the Company changes its strategy or if market conditions shift, its judgments may change, which may result in adjustments to the recorded goodwill balance.The Company performs its goodwill impairment test in the fourth quarter of each year, or more often if events or circumstances warrant. For annual goodwill impairment testing, the Company has the option to first perform a qualitative assessment to determine whether it is more likely than not that the fair value of a reporting unit is less than its carrying amount, including goodwill and other intangible assets. If the Company concludes that this is the case, it would compare the fair value the reporting unit with its carrying amount and recognize an impairment charge for the amount by which the carrying amount exceeds the reporting unit’s fair value. The loss recognized, however, would not exceed the total amount of goodwill allocated to that reporting unit. Additionally, the Company would consider income tax effects from any tax deductible goodwill on the carrying amount of the reporting unit when measuring the goodwill impairment loss, if applicable. As of December 31, 2020, the Company’s goodwill was 0t impaired.$23.9$39 million, $27.1$18 million, and $32.3$21 million, respectively, in the years ended December 31, 2020, 2019,2023, 2022, and 2018.2021. Accumulated depreciation as of December 31, 2023 and December 31, 2022 was $526 million and $434 million. The estimated useful lives for the principal classes of assets are as follows:Premises and Equipment Useful Lives Buildings 30 Furniture, fixtures and equipment, and building improvements 13.5 Leasehold improvements 10 ATMs 7 20202023 and 2019,2022, the Company’s investment in BOLI was $1.2 billion and $1.1 billion, respectively. The Company had additional purchases of $150.0 during the year ended December 31, 2019.$1.6 billion. The Company’s investment in BOLI generated income of $31.8$43 million, $28.4$32 million, and $28.3$29 million, respectively, during the years ended December 31, 2020, 2019,2023, 2022, and 2018.2020,2023, the Company had $1.8$5 million of OREO, $4 million of taxi medallions and $5 million of repossessed specialty equipment. At December 31, 2022, the Company had $8 million of OREO and $6.5$4 million of taxi medallions. At December 31, 2019,had $2.0 millionowns the MSR are included in net return on mortgage servicing rights on the Consolidated Statements of OREOIncome and $10.3 millionComprehensive Income. The fees are based on the outstanding principal and are recorded as income when earned. Subservicing fees, which are included in loan administration income on the Consolidated Statements of taxi medallions.2020,2023, the Company had 11,913,46116,143,893 shares available for grant under the 2020 Incentive Plan. Compensation cost related to restricted stock grants is recognized on a straight-line basis over the vesting period. For a more detailed discussion of the Company’s stock-based compensation, see Note 15, “Stock-Related Benefit14 - Stock-Related Benefits Plans.”rates, turnover, and the rate of compensation increase.For the Years Ended December 31, (in millions, except share and per share amounts) 2023 2022 2021 Net (loss) income available to common stockholders $ (112) $ 617 $ 563 Less: Dividends paid on and earnings allocated to participating securities (5) (8) (7) (Loss) earnings applicable to common stock $ (117) $ 609 $ 556 Weighted average common shares outstanding 713,643,550 483,603,395 463,865,661 (Loss) basic earnings per common share $ (0.16) $ 1.26 $ 1.20 (Loss) earnings applicable to common stock $ (117) $ 609 $ 556 Weighted average common shares outstanding 713,643,550 483,603,395 463,865,661 Potential dilutive common shares — 1,530,950 767,058 Total shares for diluted (loss) earnings per common share computation 713,643,550 485,134,345 464,632,719 Diluted (loss) earnings per common share and common share equivalents $ (0.16) $ 1.26 $ 1.20 (in millions) March 20, 2023 (preliminary) Net assets acquired before fair value adjustments $ 2,973 Fair value adjustments: Loans (727) Core deposit and other intangibles 464 Certificates of deposit 27 Other net assets and liabilities 39 FDIC Equity Appreciation Instrument (85) Deferred tax liability (690) Bargain purchase gain on Signature Transaction, as initially reported 2,001 Measurement period adjustments, excluding taxes 28 Change in deferred tax liability 102 Bargain purchase gain on Signature Transaction, as adjusted $ 2,131 (in millions) Preliminary as Initially Reported Measurement Period Adjustments Preliminary as Adjusted Purchase Price consideration $ 85 $ 85 Fair value of assets acquired: Cash & cash equivalents 25,043 (142) 24,901 Loans held for sale 232 232 Loans held for investment: Commercial and industrial 10,102 (214) 9,888 Commercial real estate 1,942 (262) 1,680 Consumer and other 174 (1) 173 Total loans held for investment 12,218 (477) 11,741 CDI and other intangible assets 464 — 464 Other assets 679 (169) 510 Total assets acquired 38,636 (788) 37,848 Fair value of liabilities assumed: Deposits 33,568 (61) 33,507 Other liabilities 2,982 (857) 2,125 Total liabilities assumed 36,550 (918) 35,632 Fair value of net identifiable assets 2,086 130 2,216 Bargain purchase gain $ 2,001 $ 130 $ 2,131 (in millions) Total Par value (UPB) $ 583 ACL at acquisition (13) Non-credit (discount) (76) Fair value $ 494 (in millions) December 1, 2022 Purchase Price consideration $ 2,010 Fair value of assets acquired: Cash & cash equivalents 331 Securities 2,695 Loans held for sale 1,257 Loans held for investment: One-to-four family first mortgage 5,438 Commercial and industrial 3,891 Commercial real estate 6,523 Consumer and other 2,156 Total loans held for investment 18,008 CDI and other intangible assets 292 Mortgage servicing rights 1,012 Other assets 2,158 Total assets acquired 25,753 Fair value of liabilities assumed: Deposits 15,995 Borrowings 6,700 Other liabilities 889 Total liabilities assumed 23,584 Fair value of net identifiable assets 2,169 Bargain purchase gain $ 159 (in millions) Total Par value (UPB) $ 1,950 ACL at acquisition (51) Non-credit (discount) (33) Fair value $ 1,866 2020, 2019,2022 and 2018:Impact of Recent Accounting PronouncementsRecently Adopted Accounting StandardsThe2021 do not reflect the anticipated cost savings that have not yet been realized. Acquisition costs incurred by the Company adopted ASU No. 2020-04during the years ended December 31, 2022 and 2021 are reflected in the first quarter of 2020 upon issuance.pro forma amounts. The amendments provide optional expedients and exceptions for certain contracts, hedging relationships, and other transactions that reference LIBOR or another reference rate expected to be discontinued because of rate reform. The guidance is effective frompro forma information does not necessarily reflect the date of issuance until December 31, 2022. If certain criteria are met, the amendments allow exceptions to the designation criteria of the hedging relationship and the assessment of hedge effectiveness during the transition period. To date, the guidance has not had a material impact on the Company’s Consolidated Statements of Condition, results of operations or cash flows. that would have occurred had the Flagstar Transaction occurred at the beginning of 2021.For the Years Ended December 31, (unaudited) (in millions) 2022 2021 Net interest income $ 2,278 $ 2,208 Non-interest income 650 1,105 Net income 804 1,207 Net income available to common stockholders $ 771 $ 1,174 Company will continue to assessfollowing table sets forth the impact as the reference rate transition occurs.The Company adopted ASU No. 2016-13, Financial Instruments—Credit Losses (Topic 326): Measurement of Credit Losses on Financial Instruments and its amendments, (“ASU No. 2016-13”) as of January 1, 2020. ASU No. 2016-13 amended guidance on reporting credit losses for assets held on an amortized cost basis and available-for-sale debt securities. For assets held at amortized cost, ASU No. 2016-13 eliminated the probable initial recognition threshold in current GAAP and, instead, requires an entity to reflect its current estimate of all expected credit losses. The amendments in ASU No. 2016-13 replaced the incurred loss impairment methodology with a methodology that reflects the measurement of expected credit losses based on relevant information about past events, including historical loss experience, current conditions, and reasonable and supportable forecasts that affect the collectability of the reported amounts. The allowance for credit losses is a valuation account that is deducted from the amortized cost basis of financial assets to present the net amount expected to be collected. For available-for-sale debt securities, credit losses will be presented as an allowance rather than as a write-down. The amendments affected loans, debt securities, trade receivables, off-balance sheet credit exposures, reinsurance receivables, and any other financial assets not excluded from the scope that have the contractual right to receive cash.The Company adopted ASU No. 2016-13 on a modified retrospective basis with a cumulative-effect adjustment to retained earnings as of the adoption date and, accordingly, the Company recorded a net of tax decrease of $10.5 million to retained earnings as of January 1, 2020. The results for prior period amounts continue to be reported in accordance with previously applicable GAAP. A prospective transition approach was required for debt securities for which an OTTI had been recognized before the effective date. The effect of the prospective transition approach was to maintain the same amortized cost basis before and after the effective date of ASU No. 2016-13. Amounts previously recognizedcomponents in accumulated other comprehensive income (loss) as of the date of adoption that relate to improvements in cash flows expected to be collected continue to be accreted into income over the remaining life of the asset. Recoveries of amounts previously written off relating to improvements in cash flows after the date of adoption are recorded in earnings when received.The Company adopted ASU No. 2018-13, Fair Value Measurement (Topic 820): Disclosure Framework – Changes to the Disclosure Requirements for Fair Value Measurement on January 1, 2020. The purpose of ASU No. 2018-13 is to improve the effectiveness of disclosures in the notes to financial statements by facilitating clear communication of the information required by GAAP that is most important to users of each entity’s financial statements. The amendments remove the disclosure requirements for transfers between Levels 1 and 2 of the fair value hierarchy, the disclosure of the policy for timing of transfers between levels of the fair value hierarchy, and the disclosure of the valuation processes for Level 3 fair value measurements. Additionally, the amendments modify the disclosure requirements for investments in certain entities that calculate net asset value and measurement uncertainty. Finally, the amendments added disclosure requirements for the changes in unrealized gains and losses included in other comprehensive income for recurring Level 3 fair value measurements and the range and weighted average of significant unobservable inputs used to develop Level 3 measurements. The amendments on changes in unrealized gains and losses, the range and weighted average of significant unobservable inputs used to develop Level 3 fair value measurements and the narrative description of measurement uncertainty are applied prospectively for only the most recent interim or annual period presented in the initial fiscal year of adoption. All other amendments are applied retrospectively to all periods presented upon their effective date. The adoption of ASU No. 2018-13 did not have a material effect on the Company’s Consolidated Statements of Condition, results of operations, or cash flows.The Company adopted, on a prospective basis, ASU No. 2017-04, Intangibles—Goodwill and Other (Topic 350): Simplifying the Test for Goodwill Impairment as of January 1, 2020. ASU No. 2017-04 eliminates the second step of the goodwill impairment test which requires an entity to determine the implied fair value of the reporting unit’s goodwill. Instead, an entity recognizes an impairment loss if the carrying value of the net assets assigned to the reporting unit exceeds the fair value of the reporting unit, with the impairment loss not to exceed the amount of goodwill recorded. ASU No. 2017-04 does not amend the optional qualitative assessment of goodwill impairment. The impact of this adoption on the Company’s Consolidated Statements of Condition, results of operations, or cash flows will be dependent upon goodwill impairment determinations made after January 1, 2020.The adoption of ASU No. 2017-04 did not have a material effect on the Company’s Consolidated Statements of Condition, results of operations, or cash flows. During the year ended December 31, 2020, the Company assessed the current environment, including the estimated impact of the COVID-19 pandemic on macroeconomic variables and economic forecasts and how those might impact the fair value of its reporting unit. After consideration of the items above and the year 2020 results, the Company determined it was not more-likely-than-not that the fair value of its reporting unit was below its book value as of December 31, 2020.NOTE 3: RECLASSIFICATIONS OUT OF ACCUMULATED OTHER COMPREHENSIVE LOSS(in thousands)millions)For the Twelve MonthsYear Ended December 31, 2020$ $683— (188)$ — $495$ $(11,767)(17) 3,236$ 48 $(8,531)$ $249(7) (7,352)(7) (7,103)1 1,953$ (6) $(5,150)$ $(13,186)Amounts in parentheses indicate expense items.See Note 14, “Employee Benefits,” for additional information.NOTE 4: SECURITIESvalues at December 31, 2020 and 2019:
values:(1)The underlying assets of the asset-backed securities are substantially guaranteed by the U.S. Government..(2)Excludes accrued interest receivable of $14.9 million included in other assets in the Consolidated Statements of Condition. December 31, 2023 (in millions) Amortized Cost Gross Unrealized Gain Gross Unrealized Loss Fair Value Debt securities available-for-sale Mortgage-Related Debt Securities: GSE certificates $ 1,366 $ 1 $ 146 $ 1,221 GSE CMOs 5,495 48 381 5,162 Private Label CMOs 174 7 1 180 Total mortgage-related debt securities $ 7,035 $ 56 $ 528 $ 6,563 Other Debt Securities: U. S. Treasury obligations $ 198 $ — $ — $ 198 GSE debentures 1,899 1 291 1,609 307 — 5 302 Municipal bonds 6 — — 6 Corporate bonds 365 — 22 343 Foreign notes 35 — 1 34 Capital trust notes 97 5 12 90 Total other debt securities $ 2,907 $ 6 $ 331 $ 2,582 Total debt securities available for sale $ 9,942 $ 62 $ 859 $ 9,145 Equity securities: Mutual funds $ 16 $ — $ 2 $ 14 Total equity securities $ 16 $ — $ 2 $ 14 $ 9,958 $ 62 $ 861 $ 9,159 The underlying assets of the asset-backed securities are substantially guaranteed by the U.S. Government.Primarily consists of mutual funds that are CRA-qualified investments.December 31, 2022 (in millions) Amortized Cost Gross Unrealized Gain Gross Unrealized Loss Fair Value Debt securities available-for-sale Mortgage-Related Debt Securities: GSE certificates $ 1,457 $ — $ 160 $ 1,297 GSE CMOs 3,600 1 300 3,301 Private Label CMOs 185 6 — 191 Total mortgage-related debt securities $ 5,242 $ 7 $ 460 $ 4,789 Other Debt Securities: U. S. Treasury obligations $ 1,491 $ — $ 4 $ 1,487 GSE debentures 1,749 — 351 1,398 375 — 14 361 Municipal bonds 30 — — 30 Corporate bonds 913 2 30 885 Foreign Notes 20 — — 20 Capital trust notes 97 5 12 90 Total other debt securities $ 4,675 $ 7 $ 411 $ 4,271 Total other securities available for sale $ 9,917 $ 14 $ 871 $ 9,060 Equity securities: Mutual funds $ 16 $ — $ 2 $ 14 Total equity securities $ 16 $ — $ 2 $ 14 $ 9,933 $ 14 $ 873 $ 9,074 (3)Excludes accrued interest receivable of $24.4 million included in other assets in the Consolidated Statements of Condition.20202023, the Company had $861 million and 2019, respectively,$329 million of FHLB-NY stock, at cost and FHLB-Indianapolis stock, at cost, respectively. At December 31, 2022, the Company had $714.0$762 million and $647.6$329 million of FHLB-NY stock, at cost.cost and FHLB-Indianapolis stock, at cost, respectively. The Company maintains an investment in FHLB-NY stock partly in conjunction with its membership in the FHLB and partly related to its access to the FHLB funding it utilizes.years ended December 31, 2020, 2019, and 2018:years-ended:NetDecember 31, ( in millions) 2023 2022 2021 Gross proceeds $ 1,637 $ 228 $ — Gross realized gains 2 — — Gross realized losses (3) — — gainslosses on equity securities recognized in earnings for the years ended December 31, 20202023. For the years ended December 31, 2022 and 2019,2021 there were $582,000 and $2.3 million, respectively. Net unrealized losses on equity securities of $2 million and zero recognized in earnings, for the year ended December 31, 2018 were $2.0 million.respectively.2020:
2023:(1)Not presented on a tax-equivalent basis.(2)Includes corporate bonds, capital trust notes, foreign notes, and asset-backed securities.Mortgage- Related Securities U.S. Government and GSE Obligations State, County, and Municipal Fair Value ( in millions) Available-for-Sale Debt Securities: Due within one year $ — $ 448 $ — $ — $ 446 Due from one to five years 178 50 — 353 560 Due from five to ten years 316 1,502 6 105 1,597 Due after ten years 6,541 96 — 345 6,542 Total debt securities available for sale $ 7,035 $ 2,096 $ 6 $ 803 $ 9,145 2020:2023:Less than Twelve Months Twelve Months or Longer Total (in millions) Fair Value Unrealized Loss Fair Value Unrealized Loss Fair Value Unrealized Loss Temporarily Impaired Securities: U. S. Treasury obligations $ — $ — $ — $ — $ — $ — U.S. Government agency and GSE obligations 181 1 1,362 290 1,543 291 GSE certificates 312 5 843 141 1,155 146 Private Label CMOs 29 1 — — 29 1 GSE CMOs 1,835 77 1,312 304 3,147 381 Asset-backed securities — — 228 5 228 5 Municipal bonds — — 6 — 6 — Corporate bonds — — 343 22 343 22 Foreign notes — — 9 1 9 1 Capital trust notes — — 81 12 81 12 Equity securities — — 14 2 14 2 Total temporarily impaired securities $ 2,357 $ 84 $ 4,198 $ 777 $ 6,555 $ 861 2019:Less than Twelve Months Twelve Months or Longer Total (in millions) Fair Value Unrealized Loss Fair Value Unrealized Loss Fair Value Unrealized Loss Temporarily Impaired Securities: U. S. Treasury obligations $ 1,487 $ 4 $ — $ — $ 1,487 $ 4 U.S. Government agency and GSE obligations 243 5 1,156 346 1,399 351 GSE certificates 871 46 420 114 1,291 160 GSE CMOs 2,219 36 925 264 3,144 300 Asset-backed securities 61 2 262 12 323 14 Municipal bonds 9 — 7 — 16 — Corporate bonds 698 27 97 3 795 30 Foreign notes 20 — — — 20 — Capital trust notes 46 2 34 10 80 12 Equity securities 4 — 10 2 14 2 Total temporarily impaired securities $ 5,658 $ 122 $ 2,911 $ 751 $ 8,569 $ 873 20202023 consisted of 4eighty-four agency collateralized mortgage obligations, 5six capital trusts notes, 7note, eight asset-backed securities, 3twelve corporate bonds, thirty-seven US government agency bonds, three hundred two mortgage-backed securities, one mutual fund, one foreign debt, and 1one municipal bond.bond . The investment securities designated as having a continuous loss position for twelve months or more at December 31, 20192022 consisted of 7 US Governmenttwenty three agency securities, 5collateralized mortgage obligations, five capital trusts notes, 3 agency mortgage-related securities, 3 agency CMOs, 3seven asset-backed securities, 2two corporate bonds, 1thirty three US government agency bonds, one hundred thirty three mortgage-backed securities, one mutual fund, and one municipal bond, and 1 mutual fund.Based on an evaluation of available information about past events, current conditions, and reasonable and supportable forecasts that are relevant to collectability, the Company has concluded that it expects to receive all contractual cash flows from each security held in its available-for-sale securities portfolio.firstalso assess whether (i) we intend to sell, or (ii) it is more likely than not that we will be required to sell the security before recovery of its amortized cost basis. If either of these criteria is met, any previously recognized allowances are charged off and the security’s amortized cost basis is written down to fair value through income. If neither of the aforementioned criteria are met, we evaluate whether the decline in fair value has resulted from credit losses or other factors. If this assessment indicates that a credit loss exists, the present value of cash flows expected to be collected from the security are compared to the amortized cost basis of the security. If the present value of cash flows expected to be collected is less than the amortized cost basis, a credit loss exists and an allowance for credit losses is recorded for the credit loss, limited by the amount that the fair value is less than the amortized cost basis. Any impairment that has not been recorded through an allowance for credit losses is recognized in other comprehensive income.20202023 or December 31, 20192022 relates to the marketability of the securities or the issuers’ ability to honor redemption obligations. Rather, the unrealized losses relate to changes in interest rates relative to when the investment securities were purchased, and do not indicate credit-related impairment. Management based this conclusion on an analysis of each issuer including a detailed credit assessment of each issuer. The Company does not intend to sell, and it is not more likely than not that the Company will be required to sell the positions before the recovery of their amortized cost basis, which may be at maturity. As such, no allowance for credit losses was recordedremains with respect to debt securities as of or during the nine months ended December 31, 2020.Management has made2023.accounting policy electionintent and ability to excludehold for the foreseeable future or until maturity as LHFI. We report LHFI loans at their amortized cost, which includes the outstanding principal balance adjusted for any unamortized premiums, discounts, deferred fees and unamortized fair value adjustments for acquired loans:December 31, 2023 December 31, 2022 (dollars in millions) Amount Percent of
Loans
Held for
InvestmentAmount Percent of
Loans
Held for
InvestmentLoans and Leases Held for Investment: Mortgage Loans: Multi-family $ 37,265 44.0 % $ 38,130 55.3 % Commercial real estate 10,470 12.4 % 8,526 12.4 % One-to-four family first mortgage 6,061 7.2 % 5,821 8.4 % Acquisition, development, and construction 2,912 3.4 % 1,996 2.8 % $ 56,708 67.0 % $ 54,473 78.9 % Other Loans: Commercial and industrial 22,065 26.1 % 10,597 15.4 % Lease financing, net of unearned income of $258 and $85, respectively 3,189 3.8 % 1,679 2.4 % 25,254 29.9 % 12,276 17.8 % Other 2,657 3.1 % 2,252 3.3 % Total other loans held for investment 27,911 33.0 % 14,528 21.1 % $ 84,619 100.0 % $ 69,001 100.0 % Allowance for credit losses on loans and leases (992) (393) Total loans and leases held for investment, net 83,627 68,608 Loans held for sale 1,182 1,115 Total loans and leases, net $ 84,809 $ 69,723 on available-for-sale securities from the estimate of credit losses. Available-for-sale debt securities are placed on non-accrual status when we no longer expect to receive all contractual amounts due,$423 million and $292 million at December 31, 2023 and December 31, 2022, respectively, which is generally at 90 days past due. Accrued interest receivable is reversed against interest income when a security is placed on non-accrual status.NOTE 5: LOANS AND LEASESThe following table sets forthincluded in other assets in the compositionConsolidated Statements of the loan and lease portfolio at the dates indicated:(1)Condition.Excludes accrued interest receivable of $219.1 million and $116.9 million at December 31, 2020 and December 31, 2019, respectively, which is included in other assets in the Consolidated Statements of Condition.(2) specialty finance loans and leases of $3.0 billion and $2.6 billion, respectively, at December 31, 2020 and December 31, 2019, and other C&I loans of $393.3 million and $420.1 million, respectively, at December 31, 2020 and December 31, 2019.(3)Includes deferred loan origination fees of $1.7 million.Loans and LeasesLoans and Leases Held for InvestmentThe majority of the loans the Company originates for investment are multi-family loans, most of which are collateralized by non-luxury apartment buildings in New York City with rent-regulated units and below-market rents. In addition, the Company originates CRE loans, most of which are collateralized by income-producing properties such as office buildings, retail centers, mixed-use buildings, and multi-tenanted light industrial properties that are located in New York City and on Long Island.To a lesser extent, the Company also originates ADC loans for investment. One-to-four family loans held for investment were originated through the Company’s former mortgage banking operation and primarily consisted of jumbo prime adjustable rate mortgages made to borrowers with a solid credit history.ADC loans are primarily originated for multi-family and residential tract projects in New York City and on Long Island. C&I loans consist of asset-based loans, equipment loans and leases, and dealer floor-plan loans (together, specialty finance loans and leases) that generallyleases of $5.2 billion and $4.4 billion at December 31, 2023 and December 31, 2022, respectively.made to large corporate obligors, many of which are publicly traded, carry investment gradeinsured or near-investment grade ratings, and participate in stable industries nationwide; andother C&I loans that primarily are made to small and mid-size businesses in Metro New York. Other C&I loans are typically made for working capital, business expansion, and the purchase of machinery and equipment.The repayment of multi-family and CRE loans generally depends on the income producedguaranteed by the underlying properties which, in turn, depends on their successful operation and management. To mitigateFHA or the potential for credit losses, the Company underwrites itsU.S. Department of Veterans Affairs. Nonperforming repurchased loans in accordance with credit standards it considers to be prudent, looking firstthis portfolio earn interest at the consistency of the cash flows being produced by the underlying property. In addition, multi-family buildings, CRE properties, and ADC projects are inspected as a prerequisite to approval, and independent appraisers, whose appraisals are carefully reviewed by the Company’s in-house appraisers, perform appraisals on the collateral properties. In many cases, a second independent appraisal review is performed.To further manage its credit risk, the Company’s lending policies limit the amount of credit granted to any one borrower and typically require conservative debt service coverage ratios and loan-to-value ratios. Nonetheless, the ability of the Company’s borrowers to repay these loans may be impacted by adverse conditions in the local real estate market, the local economy and changes in applicable laws and regulations. Accordingly, there can be no assurance that its underwriting policies will protect the Company from credit-related losses or delinquencies.ADC loans typically involve a higher degree of credit risk than loans secured by improved or owner-occupied real estate. Accordingly, borrowers are required to provide a guarantee of repayment and completion, and loan proceeds are disbursed as construction progresses, as certified by in-house inspectors or third-party engineers. The Company seeks to minimize the credit risk on ADC loans by maintaining conservative lending policies and rigorous underwriting standards. However, if the estimate of value proves to be inaccurate, the cost of completion is greater than expected, or the length of time to complete and/or sell or lease the collateral property is greater than anticipated, the property could have a value upon completion that is insufficient to assure full repayment of the loan. This could have a material adverse effect on the quality of the ADC loan portfolio, and could result in losses or delinquencies. In addition, the Company utilizes the same stringent appraisal process for ADC loans as it does for its multi-family and CRE loans.To minimize the risk involved in specialty finance lending and leasing, the Company participates in syndicated loans that are brought to it, and equipment loans and leases that are assigned to it, by a select group of nationally recognized sources who have had long-term relationships with its experienced lending officers. Each of these credits is secured with a perfected first security interest or outright ownership in the underlying collateral, and structured as senior debt or as a non-cancelable lease. To further minimize the risk involved in specialty finance lending and leasing, each transaction is re-underwritten. In addition, outside counsel is retained to conduct a further review of the underlying documentation.To minimize the risks involved in other C&I lending, the Company underwrites such loans on the basis of the cash flows produced by the business; requires that such loans be collateralized by various business assets, including inventory, equipment, and accounts receivable, among others; and typically requires personal guarantees. However, the capacity of a borrower to repay such a C&I loan is substantially dependent on the degree to which the business is successful. In addition, the collateral underlying such loans may depreciate over time, may not be conducive to appraisal, or may fluctuate in value,rate based upon the results of operations of10-year U.S. Treasury note rate from the business.Includedtime the underlying loan becomes 60 days delinquent until the loan is conveyed to HUD (if foreclosure timelines are met), which is not paid by the FHA until claimed. The Bank has a unilateral option to repurchase loans sold to GNMA if the loan is due, but unpaid, for three consecutive months (typically referred to as 90 days past due) and can recover losses through a claims process from the guarantor. These loans are recorded in loans held for investment and the liability to repurchase the loans is recorded in other liabilities on the Consolidated Statements of Condition. Certain loans within our portfolio may be subject to indemnifications and insurance limits which expose us to limited credit risk. As of December 31, 2023, LGG loans totaled $541 million and the repurchase liability was $456 million.2020 and2023.2019, were loans of $37.52023 totaled $1.2 billion, up from $1.1 billion at December 31, 2022. The Signature Transaction contributed $360 million and $38.2 million, respectively, to officers, directors, and their related interests and parties. There were noin Small Business Administration ("SBA") loans to principal shareholders atthis increase. We classify loans as held for sale when we originate or purchase loans that date.20202023 and December 31, 2019, all of our non-performing2022 we had no loans that were non-accrual loans.nonperforming and still accruing.2020:
2023:(1)Includes $18.6 million of taxi medallion-related loans that were 90 days or more past due. There were 0 taxi medallion-related loans that were 30 to 89 days past due.(2)Includes lease financing receivables, all of which were current.(in millions) Loans 30-89 Days Past Due Non- Accrual Loans Total Past Due Loans Total Loans Receivable Multi-family $ 121 $ 138 $ 259 $ 37,006 $ 37,265 Commercial real estate 28 128 156 10,314 10,470 One-to-four family first mortgage 40 95 135 5,926 6,061 Acquisition, development, and construction 2 2 4 2,908 2,912 37 43 80 25,174 25,254 Other 22 22 44 2,613 2,657 Total $ 250 $ 428 $ 678 $ 83,941 $ 84,619 2019:
2022:(1)Includes $30.4 million of taxi medallion-related loans that were 90 days or more past due. There were 0 taxi medallion-related loans that were 30 to 89 days past due.(2)Includes lease financing receivables, all of which were current.(in millions) Loans 30-89 Days Past Due Non- Accrual Loans Total Past Due Loans Current Loans Total Loans Receivable Multi-family $ 34 $ 13 $ 47 $ 38,083 $ 38,130 Commercial real estate 2 20 22 8,504 8,526 One-to-four family first mortgage 21 92 113 5,708 5,821 Acquisition, development, and construction — — — 1,996 1,996 2 3 5 12,271 12,276 Other 11 13 24 2,228 2,252 Total $ 70 $ 141 $ 211 $ 68,790 $ 69,001 2020:2023:(1)Includes lease financing receivables, all of which were classified as Pass.Mortgage Loans Other Loans (in millions) Multi- Family Commercial Real Estate One-to- Four Family Acquisition, Development, and Construction Total Mortgage Loans Commercial and Industrial Other Total Other Loans Credit Quality Indicator: Pass $ 34,170 $ 8,734 $ 5,328 $ 2,825 $ 51,057 $ 24,683 $ 2,634 $ 27,317 Special mention 768 367 — 57 1,192 335 — 335 Substandard 2,327 1,369 733 30 4,459 236 23 259 Doubtful — — — — — — — — Total $ 37,265 $ 10,470 $ 6,061 $ 2,912 $ 56,708 $ 25,254 $ 2,657 $ 27,911 2019:2022:(1)Includes lease financing receivables, all of which were classified as Pass.Mortgage Loans Other Loans (in millions) Multi- Family Commercial Real Estate One-to- Four Family Acquisition, Development, and Construction Total Mortgage Loans Commercial and Industrial Other Total Other Loans Credit Quality Indicator: Pass $ 36,622 $ 7,871 $ 5,710 $ 1,992 $ 52,195 $ 12,208 $ 2,238 $ 14,446 Special mention 864 230 8 4 1,106 18 — 18 Substandard 644 425 103 — 1,172 50 14 64 Total $ 38,130 $ 8,526 $ 5,821 $ 1,996 $ 54,473 $ 12,276 $ 2,252 $ 14,528 2020.2023:Vintage Year (in millions) 2023 2022 2021 2020 2019 Prior To 2019 Revolving Loans Revolving Loans Converted to Term Loans Total Pass $ 2,532 $ 13,295 $ 10,308 $ 8,438 $ 4,725 $ 9,670 $ 1,981 $ 108 $ 51,057 Special Mention — 217 69 407 144 341 14 — 1,192 Substandard 45 98 258 336 809 2,910 — 3 4,459 Doubtful — — — — — — — — — Total mortgage loans $ 2,577 $ 13,610 $ 10,635 $ 9,181 $ 5,678 $ 12,921 $ 1,995 $ 111 $ 56,708 Current-period gross write-offs — (112) — — (2) (64) — — (178) $ 9,709 $ 3,598 $ 1,936 $ 1,141 $ 911 $ 941 $ 8,757 $ 324 $ 27,317 Special Mention 1 182 17 9 6 18 102 — 335 Substandard 10 39 45 28 40 40 46 11 259 Doubtful — — — — — — — — — Total other loans $ 9,720 $ 3,819 $ 1,998 $ 1,178 $ 957 $ 999 $ 8,905 $ 335 $ 27,911 Current-period gross write-offs $ (2) $ (10) $ (5) $ (8) $ (2) $ (18) $ — $ — $ (45) Total $ 12,297 $ 17,429 $ — $ 12,633 $ 10,359 $ 6,635 $ 13,920 $ 10,900 $ 446 $ 84,619 2020: 2023:Collateral Type Collateral Type (in millions) (in millions) Real Property Other One-to-four family first mortgage Commercial and industrial Commercial and industrial Total collateral-dependent loans held for investment Total collateral-dependent loans held for investment primarilytype consists of taxi medallions, cash, accounts receivable and inventory.twelve monthsyear ended December 31, 2020.20202023 and December 31, 2019,2022, the Company had0 $81 million and $121 million of residential mortgage loans in the process of foreclosure. foreclosure, respectively.interest incomefollowing table summarizes the amortized cost basis of loans modified during the reporting period to borrowers experiencing financial difficulty, disaggregated by class of financing receivable and type of modification:Amortized Cost (dollars in millions) Interest Rate Reduction Term Extension Combination - Interest Rate Reduction & Term Extension Total Percent of Total Loan class Year Ended December 31, 2023 Multi-family $ 122 $ — $ — $ 122 1.17 % Commercial real estate 102 1 — 103 0.98 % One-to-four family first mortgage 3 5 6 14 0.23 % Commercial and Industrial — 19 2 21 0.08 % Other Consumer $ — $ — $ 2 2 0.08 % Total $ 227 $ 25 $ 10 $ 262 Interest Rate Reduction Term Extension Weighted-average contractual interest rate From To Weighted-average Term (in years) Year Ended December 31, 2023 Multi-family 7.45 % 6.02 % Commercial real estate 8.83 % 4.56 % One-to-four family first mortgage 6.08 % 4.79 % Commercial and industrial 8.44 % 8.08 % 0.58 Other Consumer 9.09 % 4.82 % wouldwere modified for borrowers experiencing financial difficulty that received term extension and subsequently defaulted during the period and $4 million one-to-four family first mortgages that were combination modifications and subsequently defaulted during the period.recorded undermodified during the original terms of non-accrual loans at the respective year-ends, and the interest income actually recorded on these loans in the respective years, is summarized below:reporting period:December 31, 2023 (dollars in millions) Current 30 - 89 Past Due 90+ Past Due Total Commercial real estate 1 — — 1 One-to-four family first mortgage 3 — 8 11 Commercial and industrial 3 9 1 13 Other Consumer 1 1 — 2 Total $ 8 $ 10 $ 9 $ 27 The Prior to Adoption of ASU 2022-02is required to accountaccounted for certain loan modifications and restructurings as TDRs. In general, a modification or restructuring of a loan constitutesconstituted a TDR if the Company grantsgranted a concession to a borrower experiencing financial difficulty. A loan modified as a TDR was generally is placed on non-accrual status until the Company determinesdetermined that future collection of principal and interest is reasonably assured, which requires, among other things, that the borrower demonstrate performance according to the restructured terms for a period of at least six consecutive months.2020,2022, loans on which concessions were made with respect to rate reductions and/or extension of maturity dates amounted to $18.1million; loans on which forbearance agreements were reached amounted to $16.2$44 million.The CARES Act was enacted on March 27, 2020. Under the CARES Act, the Company made the election to deem that loan modifications do not result in TDRs if they are (1) related to the novel coronavirus disease (“COVID-19”); (2) executed on a loan that was not more than 30 days past due as of December 31, 2019; and (3) executed between March 1, 2020, and the earlier of (A) 60 days after the date of termination of the National Emergency or (B) December 31, 2020. This includes short-term (e.g., up to six months) modifications such as payment deferrals, fee waivers, extensions of repayment terms, or delays in payment that are insignificant. Borrowers considered current are those that are less than 30 days past due on their contractual payments at the time a modification program is implemented. Company’sCompany's TDRs as of December 31, 2020 and 2019:2022:(1)Includes $17.5 million and $27.3 million of taxi medallion-related loans at December 31, 2020 and 2019, respectively.December 31, 2022 (dollars in millions) Accruing Non- Accrual Total Loan Category: Multi-family $ — $ 6 $ 6 Commercial real estate 16 19 35 The eligibility of a borrower for work-out concessions of any nature depends upon the facts and circumstances of each loan, which may change from period to period, and involves judgment by Company personnel regarding the likelihood that the concession will result in the maximum recovery for the Company.Commercial and industrial — 3 3 Total $ 16 $ 28 $ 44 2020, 2019 and 20182022 are summarized as follows:Weighted Average Interest Rate (dollars in millions) Number of Loans Pre- Modification Recorded Investment Post- Modification Recorded Investment Pre- Modification Post- Modification Charge- off Amount Capitalized Interest Loan Category: Commercial real estate 2 $ 22 $ 19 6.00 % 4.02 % $ 3 $ — At December 31, 2020, C&I loans totaling $3.2 million that had been modified as a TDR during the twelve months ended at that date were in payment default. At December 31, 2019, C&I and one-to-four family loans totaling $1.1 million that had been modified as a TDR during the twelve months ended at that date were in payment default. At December 31, 2018, one C&I loan in the amount of $194,000 that had been modified as a TDR during the twelve months ended at that date was in prepayment default.The Company does not consider a payment to be in default when the loan is in forbearance, or otherwise granted a delay of payment, when the agreement to forebear or allow a delay of payment is part of a modification.Subsequent to the modification, the loan is not considered to be in default until payment is contractually past due in accordance with the modified terms. However, the Company does consider a loan with multiple modifications or forbearance periods to be in default, and would also consider a loan to be in default if the borrower were in bankruptcy or if the loan were partially charged off subsequent to modification.NOTE 6: ALLOWANCE FOR CREDIT LOSSES ON LOANS AND LEASES loan and leasecredit losses for the periods indicated:AtFor the Years Ended December 31, 2023 2022 (in millions) Mortgage Other Total Mortgage Other Total Balance, beginning of period $ 290 $ 103 $ 393 $ 178 $ 21 $ 199 Adjustment for Purchased PCD Loans 13 13 21 30 51 Charge-offs (178) (45) (223) (5) (2) (7) Recoveries 15 15 4 7 11 Provision for (recovery of) credit losses on loans and leases 644 150 794 92 47 139 Balance, end of period $ 756 $ 236 $ 992 $ 290 $ 103 $ 393 2020,2023, the allowance for credit losses on loans and leases totaled $194.0$992 million, up $46.4$599 million compared to December 31, 2019, driven by a provision for credit losses of $63.3 million that exceeded net charge-offs by $44.5 million during the year 2020. Separately, at December 31, 2019, the Company had an allowance for unfunded commitments of $461,000. With the adoption of CECL on January 1, 2020,2022. The Company recognized a “Day 1” transition adjustment of $12.5 million. At December 31, 2020, the allowance for unfunded commitments totaled $11.9 million. For the year ended December 31, 2020increase in the allowance for credit losses on loans and leases increasedwas primarily duedriven by an increase in reserves to negative changesaddress weakness in the macroeconomic factors surroundingoffice sector, potential repricing risk in the COVID-19 pandemic, specificallymultifamily portfolio and an increase in classified assets. Also contributing to the resultant estimated decreasesincrease in property values. The forecast scenario includes low single digit growth of Gross Domestic Product (“GDP”), while unemployment remains elevated into the forecasted time horizon. In addition to these quantitative inputs, several qualitative factors were considered, including the risk that the economic decline proves to be more severe and/or prolonged than our baseline forecast which also increased our allowance for loancredit losses on loans and lease losses. Theleases was the day 1 impact of the unprecedented fiscal stimulusSignature Transaction that closed on March 20, 2023, which added $141 million to the reserve.changes to federalDecember 31, 2022, the allowance for unfunded commitments totaled $52 million and local laws and regulations, including changes to various government sponsored loan programs, was also considered.2020:2023:(in millions) Recorded Investment Related Allowance Interest Income Recognized Nonaccrual loans with no related allowance: Multi-family $ 134 $ — $ 5 Commercial real estate 53 — 2 One-to-four family first mortgage 85 — — Acquisition, development, and construction — — — Other (includes C&I) 22 — — Total nonaccrual loans with no related allowance $ 294 $ — $ 7 Nonaccrual loans with an allowance recorded: Multi-family $ 4 $ — $ — Commercial real estate 75 17 3 One-to-four family first mortgage 11 2 — Acquisition, development, and construction — — — Other (includes C&I) 44 28 — Total nonaccrual loans with an allowance recorded $ 134 $ 47 $ 3 Total nonaccrual loans: Multi-family $ 138 $ — $ 5 Commercial real estate 128 17 5 One-to-four family first mortgage 96 2 — Acquisition, development, and construction — — — Other (includes C&I) 66 28 — Total nonaccrual loans $ 428 $ 47 $ 10 impairednonaccrual loans at December 31, 2019:2022:NOTE 7. LEASES(in millions) Recorded Investment Related Allowance Interest Income Recognized Nonaccrual loans with no related allowance: Multi-family $ 13 $ — $ — Commercial real estate 19 — 1 One-to-four family first mortgage 90 — — Other (includes C&I) 3 — — Total nonaccrual loans with no related allowance $ 125 $ — $ 1 Nonaccrual loans with an allowance recorded: Commercial real estate $ 1 $ — $ — One-to-four family first mortgage 2 — — Other (includes C&I) 13 14 — Total nonaccrual loans with an allowance recorded $ 16 $ 14 $ — Total nonaccrual loans: Multi-family $ 13 $ — $ — Commercial real estate 20 — 1 One-to-four family first mortgage 92 — — Other (includes C&I) 16 14 — Total nonaccrual loans $ 141 $ 14 $ 1 20202023 and December 31, 2019,2022, the carrying value of residual assets with third-party residual value insurance for at least a portion of the asset value was $70.6$280 million and $70.1$32 million, respectively.For the Years Ended December 31, For the Years Ended December 31, (in millions) (in millions) 2023 2022 2021 Included in Interest Income – Loans and leases in the Consolidated Statements of Income and Comprehensive Income.20202023 and December 31, 2019,2022, the carrying value of net investment in leases, excluding purchase accounting adjustments was $1.9$3.5 billion and $1.4 billion.$1.7 billion, respectively. The components of net investment in direct financing leases, including the carrying amount of the lease receivables, as well as the unguaranteed residual asset were as follows:(in millions) December 31, 2023 December 31, 2022 Net investment in the lease - lease payments receivable $ 3,187 $ 1,685 Net investment in the lease - unguaranteed residual assets 321 60 Total lease payments $ 3,508 $ 1,745 as of December 31, 2020, as well as the reconciliation to the total amount of receivables recognized in the Consolidated Statements of Condition:(in millions) December 31, 2023 2024 549 2025 602 2026 874 2027 521 2028 293 Thereafter 669 Total lease payments $ 3,508 Plus: deferred origination costs 15 Less: unearned income (258) Less: purchase accounting adjustment $ (76) Total lease finance receivables, net $ 3,189 operating lease right-of-useother assets and operating leaseother liabilities in the Consolidated Statements of Condition.mostthe vast majority of the leases do not provide an implicit rate, the incremental borrowing rate (FHLB borrowing rate) is used based on the information available at adoptioncommencement date in determining the present value of lease payments. The implicit rate is used when readily determinable. The operating lease ROU asset is measured at cost, which includes the initial measurement of the lease liability, prepaid rent and initial direct costs incurred by the Company, less incentives received. The lease terms include options to extend the lease when it is reasonably certain that we will exercise that option. For the vast majority of the Company’s leases, we are reasonably certain we will exercise our options to renew to the end of all renewal option periods. As such, substantially all of our future options to extend the leases have been included in the lease liability and ROU assets. Amortization of the ROU assets was $20.0million and $38.4 million for the twelve months ended December 31, 2020 and 2019, respectively. Included in the twelve months ended December 31, 2019, was $11.7 million that was due to the closing of certain locations.The Company has operating leases for corporate offices, branch locations, and certain equipment. The Company’s leases have remaining lease terms of one year to approximately 25 years, the vast majority of which include one or more options to extend the leases for up to five years resulting in lease terms up to 40 years.During the twelve months ended December 31, 2019, the Company entered into a sale-lease back transaction with an unrelated third party with a lease term of 20 years (including renewal options). The sale of the branch property in Florida resulted in a gain of $7.9 million in 2019, which is included in “Other income” in the Consolidated Statements of Income and Comprehensive Income for the twelve months ended December 31, 2019.For the Years Ended December 31, (in millions) 2023 2022 2021 Operating lease cost $ 86 $ 28 $ 27 Total lease cost $ 86 $ 28 $ 27 (in millions) For the Years Ended December 31, 2023 2022 Cash paid for amounts included in the measurement of lease liabilities: Operating cash flows from operating leases $ 64 $ 28 (in millions, except lease term and discount rate) December 31, 2023 December 31, 2022 Operating Leases: $ 426 $ 119 $ 446 $ 122 Weighted average remaining lease term 11.2 years 6 years Weighted average discount rate percent 4.71 % 3.85 % NOTE 8: DEPOSITS
(in millions)December 31, 2023 Maturities of lease liabilities: 2024 71 2025 65 2026 58 2027 52 2028 45 Thereafter 296 Total lease payments $ 587 Less: imputed interest $ (141) Total present value of lease liabilities $ 446 (in millions) Year Ended December 31, 2023 Balance at beginning of period $ 1,033 Additions from loans sold with servicing retained 208 Reductions from sales (51) (80) 1 Fair value of MSRs at end of period $ 1,111 December 31, 2023 Fair Value (dollars in millions) Actual 10% adverse change 20% adverse change Option adjusted spread 5.4 % $ 1,091 $ 1,072 Constant prepayment rate 7.9 % 1,073 1,040 Weighted average cost to service per loan $ 69 $ 1,100 $ 1,090 December 31, 2022 Fair Value (dollars in millions) Actual 10% adverse change 20% adverse change Option adjusted spread 5.9 % $ 1,012 $ 992 Constant prepayment rate 7.9 % 1,000 970 Weighted average cost to service per loan $ 68 $ 1,023 $ 1,013 (in millions) Year Ended December 31, 2023 Month Ended December 31, 2022 Net return on mortgage servicing rights $ 227 $ 20 Decrease in MSR fair value due to pay-offs, pay-downs, run-off, model changes and other (80) (8) Changes in fair value due to interest rate risk 1 10 (47) (16) Net transaction costs 2 — Total return included in net return on mortgage servicing rights $ 103 $ 6 (in millions) Year Ended December 31, 2023 Year Ended December 31, 2022 Loan administration income on mortgage loans subserviced $ 154 $ 11 (168) (8) Other servicing charges (3) — Total (loss) income on mortgage loans subserviced, included in loan administration income $ (17) $ 3 20202023 and 2019:2022:December 31, 2023 2022 (dollars in millions) Amount Percent of Total Weighted Average Interest Rate Amount Percent of Total Weighted Average Interest Rate Interest-bearing checking and money market accounts $ 30,700 37.66 % 3.51 % $ 22,511 38.34 % 2.66 % Savings accounts 8,773 10.76 % 2.67 % 11,645 19.83 % 1.30 % Certificates of deposit 21,554 26.44 % 4.42 % 12,510 21.30 % 2.04 % Non-interest-bearing accounts 20,499 25.14 % — % 12,055 20.53 % — % Total deposits $ 81,526 100.00 % 2.79 % $ 58,721 100.00 % 1.71 % 20202023 and 2019,2022, the aggregate amount of time deposit accounts (including certificates of deposit) that meet or exceed the insured limit was $7.9 billion and $3.7 billion, respectively.$2.3$121 million and $2.4$4 million, respectively.(“CDs”) at December 31, 20202023 were as follows:(in thousands)millions)$ $9,120,2433,879 708,342229 313,682142 187,0897 1,0093 315$ $10,330,680The following table presents a summary of CDs in amounts of $100,000 or more by remaining term to maturity, at December 31, 2020:20202023 and 20192022 were brokered deposits of $5.3$9.5 billion and $5.2$5.1 billion with weighted average interest rates of 0.08%3.72 percent and 1.94%.49 percent at the respective year-ends. Brokered money market accounts represented $3.0$1.3 billion and $1.5$2.8 billion respectively, of the December 31, 20202023 and 20192022 totals, and brokered interest-bearing checking accounts represented $1.3$1.6 billion and $1.2$1.0 billion, respectively. Brokered CDs represented $1.0$6.6 billion and $2.5$1.3 billion of brokered deposits at December 31, 20202023 and 2019,2022, respectively.NOTE 9: BORROWED FUNDSfunds at December 31, 2020 and 2019:funds:(in millions) December 31, 2023 December 31, 2022 Wholesale borrowings: FHLB advances $ 19,250 $ 20,325 FRB term funding 1,000 — Total wholesale borrowings $ 20,250 $ 20,325 Junior subordinated debentures 579 575 Subordinated notes 438 432 Total borrowed funds $ 21,267 $ 21,332 $19.3 $50 million and $23.4$37 million, respectively, at December 31, 2020 and 2019.2023, December 31, 2022.20202023 were as follows:(1)Does not included the effect interest rate swap agreements.Contractual Maturity Earlier of Contractual Maturity or Next Call Date (dollars in millions) Year Amount Weighted Average Interest Rate (1) Amount Weighted Average Interest Rate (1) 2024 7,350 4.57 9,100 4.37 2025 1,500 5.38 1,750 5.11 2026 2,500 5.37 2,500 5.37 2027 4,000 4.62 3,500 4.75 2028 2,400 5.17 2,400 5.17 2032 1,500 3.43 — — Total FHLB advances $ 19,250 $ 19,250 The Company had $2.3 billion of short-term FHLB advances at December 31, 2020. During the twelve months ended December 31, 2020, the average balance of short-term FHLB advances were $2.1 billion, with a weighted average interest rate of .72%, generating interest expense of $15.3 million. The Company had $1.0 billion of short-term FHLB advances at December 31, 2019. During the twelve months ended December 31, 2019, the average balance of short-term FHLB advances were $52.4 million, with a weighted average interest rate of 1.9%, generating interest expense of $1.0 million. There were 0 short-term advances at December 31, 2018.20202023 and 2019,2022, respectively, the Bank had unused lines of available credit with the FHLBFHLB-NY of up to $7.3$8.4 billion and $7.9$11.3 billion. The Company had 0did not have any overnight advances at December 31, 2020,2023 and $100.0 million overnight FHLB advances$2.8 billion at December 31, 2019.2022. During the twelve monthsyear ended December 31, 2020,2023, the average balance of overnight advances amounted to $2.0$624 million, with a weighted average interest rate of 1.2%, generating interest expense of $24,000.5.08 percent. During the twelve monthsyear ended December 31, 2019,2022, the average balancesbalance of overnight advances amounted to $3.1$318 million, with a weighted average interest ratesrate of 2.1%, generating interest expense of $66,000.$245.7$564 million, $259.0$251 million and $248.0$233 million, in the years ended December 31, 2020, 2019,2023, 2022, and 2018,2021, respectively.following table presents an analysis of the contractual maturities and next call dates of the Company’sCompany had no outstanding repurchase agreements accounted for as secured borrowings atof December 31, 2020:The following table provides the contractual maturity2023 and weighted average interest rate of repurchase agreements, and the amortized cost and fair value of the securities collateralizing the repurchase agreements, at December 31, 2020:0no short-term repurchase agreements outstanding at December 31, 2020 or 2019.At December 31, 20202023 and 2019, the2022.to $1.7 million.at December 31, 2023. The interest expense on repurchase agreements was $18.2 million, $17.7$14 million and $6.8$18 million infor the years ended December 31, 2020, 2019,2022 and 2018,2021, respectively.0no federal funds purchased outstanding at December 31, 2020 or 2019.20202023 and 2019,2022, respectively, the average balances of federal funds purchased were $179.9$196 million and $6.8$466 million, with weighted average interest rates of 0.49%5.01 percent and 1.7%. In 2018, the average balance of federal funds purchased amounted to $620,000 with a weighted average interest rate of 2.2%.1.65 percent. The interest expense produced by federal funds purchased was $886,000, $118,000$10 million, $8 million and $14,000$0 million for the years ended December 31, 2020, 20192023, 2022 and 2018,2021, respectively.20202023 and 2019,December 31, 2022, the Company had $360.3$609 million and $359.9$608 million, respectively, of outstanding junior subordinated deferrable interest debentures (“junior subordinated debentures”) held by statutory business trusts (the “Trusts”) that issued guaranteed capital securities.Trusts are accounted for as unconsolidated subsidiaries, in accordance with GAAP. The proceedsfollowing table presents contractual terms of each issuance were invested in a series ofthe junior subordinated debentures of the Company and the underlying assets of eachstatutory business trust are the relevant debentures. The Company has fully and unconditionally guaranteed the obligations under each trust’s capital securities to the extent set forth in a guarantee by the Company to each trust. The Trusts’ capital securities are each subject to mandatory redemption, in whole or in part, upon repayment of the debentures at their stated maturity or earlier redemption.The following junior subordinated debentures were outstanding at December 31, 2020:
2023:(1)Callable subject to certain conditions as described in the prospectus filed with the SEC on November 4, 2002.Issuer Interest Rate of Capital Securities and Debentures Capital Securities Amount Outstanding Date of Original Issue Stated Maturity (dollars in millions) New York Community Capital Trust V (BONUSES Units) (1) 6.00 $ 147 $ 141 Nov. 4, 2002 Nov. 1, 2051 New York Community Capital Trust X (2) 7.25 124 120 Dec. 14, 2006 Dec. 15, 2036 PennFed Capital Trust III (2) 8.90 31 30 June 2, 2003 June 15, 2033 New York Community Capital Trust XI (2) 7.24 59 58 April 16, 2007 June 30, 2037 Flagstar Statutory Trust II (2) 8.87 26 25 Dec. 26, 2002 Dec. 26, 2032 Flagstar Statutory Trust III (2) 8.91 26 25 Feb. 19, 2003 April 7, 2033 Flagstar Statutory Trust IV (2) 8.84 26 25 Mar. 19, 2003 Mar 19, 2033 Flagstar Statutory Trust V (2) 7.66 26 25 Dec 29, 2004 Jan. 7, 2035 Flagstar Statutory Trust VI (2) 7.66 26 25 Mar. 30, 2005 April 7, 2035 Flagstar Statutory Trust VII (2) 7.40 51 50 Mar. 29, 2005 June 15, 2035 Flagstar Statutory Trust VIII (2) 7.16 26 25 Sept. 22, 2005 Oct. 7, 2035 Flagstar Statutory Trust IX (2) 7.10 26 25 June 28, 2007 Sept. 15, 2037 Flagstar Statutory Trust X (2) 8.15 15 15 Aug. 31, 2007 Sept 15, 2037 $ 609 $ 589 (2)Callable from this date forward.13.714 million common shares) at an effective exercise price of $20.04 per share. Each capital security has a maturity of 49 years, with a coupon, or distribution rate, of 6.00%6.00 percent on the $50.00 per share liquidation amount. The warrants and capital securities were non-callable for five years from the date of issuance and were not called by the Company when the five-year period passed on November 4, 2007.$275.0$275 million and were allocated between the capital security and the warrant comprising such units in proportion to their relative values at the time of issuance. The value assigned to the warrants, $92.4 million, was recorded as a component of additional “paid-in capital” in the Company’s Consolidated Statements of Condition. The value assigned to the capital security component was $182.6 million. The $92.4 million difference between the assigned value and the stated liquidation amount of the capital securities was treated as an original issue discount, and is being amortized to interest expense over the 49-year life of the capital securities on a level-yield basis. At December 31, 2020,2023, this discount totaled $65.4$64 million.threeremaining trust preferred securities noted in the preceding table were formed for the purpose of issuing Company Obligated Mandatorily Redeemable Capital Securities of Subsidiary Trusts Holding Solely Junior Subordinated Debentures (collectively, the “Capital Securities”). Dividends on the Capital Securities are payable either quarterly or semi-annually and are deferrable, at the Company’s option, for up to five years. As of December 31, 2020,2023, all dividends were current.$18.8$48 million, $22.4$22 million, and $21.7$18 million, respectively, for the years ended December 31, 2020, 2019,2023, 2022, and 2018.2021.20202023 and 2019,December 31, 2022, the Company had $295.6a total of $438 million and $295.1$432 million subordinated notes outstanding; respectively, of fixed-to-floating rate subordinated notes outstanding:Date of Original Issue Stated Maturity Interest Rate Original Issue Amount November 6, 2018 November 6, 2018 November 6, 2028 (1) 5.900% $ 300 October 28, 2020 October 28, 2020 November 1, 2030 (2) 4.125% $ 150 From and including the date of original issuance to, but excluding November 6, 2023, the Notes will bear interest at an initial rate of 5.90% per annum payable semi-annually. Unless redeemed, from and including November 6, 2023 to but excluding the maturity date, the interest rate will reset quarterly to an annual interest rate equal to the then-current three-month LIBOR rate plus 278 basis point payable quarterly.expense on subordinated notes amounted to $18.3 million for the years ended December 31, 2020payment date.2019. The interest expense on subordinated notes amounted to $2.8 million for the year ended December 31, 2018NOTE 10: FEDERAL, STATE, AND LOCAL TAXES20202023 and 2019:2022:December 31, December 31, December 31, (in millions) (in millions) (in millions) Deferred Tax Assets: Deferred Tax Assets: Allowance for credit losses on loans and leases Allowance for credit losses on loans and leases Acquisition accounting and fair value adjustments on securities (including OTTI) Acquisition accounting and fair value adjustments on securities (including OTTI) Acquisition accounting and fair value adjustments on securities (including OTTI) Acquisition accounting and fair value adjustments on loans Acquisition accounting and fair value adjustments on loans Acquisition accounting and fair value adjustments on loans Capitalized loan costs Capitalized loan costs Capitalized loan costs Right of Use Liability Right of Use Liability Right of Use Liability Compensation and related benefit obligations Compensation and related benefit obligations Capitalized research and development costs Capitalized research and development costs Capitalized research and development costs Accrued Expenses Accrued Expenses Accrued Expenses Net operating loss carryforwards Net operating loss carryforwards Other Other Gross deferred tax assets Gross deferred tax assets Valuation allowance Valuation allowance Net deferred tax asset after valuation allowance Net deferred tax asset after valuation allowance Net deferred tax asset after valuation allowance Deferred Tax Liabilities: Deferred Tax Liabilities: Leases Leases Leases Mortgage servicing rights Mortgage servicing rights Mortgage servicing rights Premises and equipment Premises and equipment Prepaid pension cost Prepaid pension cost Fair value adjustments on loans Fair value adjustments on loans Amortizable intangibles Amortizable intangibles Amortizable intangibles Acquisition accounting and fair value adjustments on deposits Acquisition accounting and fair value adjustments on deposits Acquisition accounting and fair value adjustments on deposits Right of Use Asset Right of Use Asset Right of Use Asset Deferred Loan fees Deferred Loan fees Deferred Loan fees Acquisition accounting and fair value adjustments on debt Acquisition accounting and fair value adjustments on debt Acquisition accounting and fair value adjustments on debt Other Other Gross deferred tax liabilities Gross deferred tax liabilities Net deferred tax liability Net deferred tax liability 20202023 and 2019.At December 31, 2020, the Company had a New York City net operating loss (“NOL”) carry forward of $83.9 million, which is available to offset future federal taxable income. The NOL may be carried forward for 20 years toany future calendar tax year after 2020. At December 31, 2019, the Company had a federal NOL carryforward that was fully utilized during 2020.has determined that all deductible temporary differences and net operating loss carryforwards areevaluates the need for a deferred tax asset valuation allowances based on a more likely than not to provide a benefit in reducing future federal, state, and local tax liabilities, as applicable.standard. The Company has reached this determinationCompany’s evaluation is based on its history of reporting positive taxable income in all relevant tax jurisdictions, the length of time available to utilize the net operating loss carryforwards, and the recognition of taxable income in future periods from taxable temporary differences.2020, 2019,2023, 2022, and 2018:2021:December 31, December 31, (in millions) (in millions) 2023 2022 2021 Securities available-for-sale Securities available-for-sale Total income taxes Total income taxes 2020, 2019,2023, 2022, and 2018:2021:GAAP requires that the impact of tax legislation be recognized in the period in which the law was enacted. December 31, (in millions) 2023 2022 2021 Statutory federal income tax at 21% $ (10) $ 174 $ 169 State and local income taxes, net of federal income tax effect 8 31 40 Tax Exempt income $ (6) $ — $ — Non-taxable bargain gain (447) (33) — Non-deductible goodwill impairment $ 509 $ — $ — Non-deductible FDIC deposit insurance premiums 16 10 9 Effect of tax deductibility of deferred compensation $ (3) $ (3) $ (3) Non-taxable income and expense of BOLI (9) (7) (6) Non-deductible merger expenses $ — $ 3 $ 3 Non-deductible compensation expense 1 4 — Federal tax credits $ (31) $ (1) $ — Adjustments relating to prior tax years 2 (1) (1) Other, net (1) (1) (1) Total income tax expense $ 29 $ 176 $ 210 The CARES Act was enacted on March 27, 2020 to provide relief related to the COVID-19 pandemic. The CARES Act includes many measures to assist companies including the allowance of net operating losses originating in 2018, 2019 or 2020 to be carried back five years. The Company recorded $68.4 million in tax benefits for the year ended December 31, 2020 relating to the enactment of the CARES Act. Due to changes to the New Jersey tax laws enacted in 2018, a tax expense of $2.1 million for the year-ended December 31, 2018 was recorded.$84.5$372 million and $57.1$304 million, respectively, at December 31, 20202023 and 2019,2022, and included commitments of $54.2$210 million and $29.1$183 million that are expected to be funded over the next three5 years. The Company elected to apply the proportional amortization method to these investments. Recognized in the determination of income tax (benefit) expense from operations for the years ended December 31, 2020, 2019,2023, 2022, and 20182021 were $7.5$34 million $5.9, $11 million, and $5.2$9 million, respectively,$6.2$30 million, $5.2$10 million, and $4.7$9 million, respectively, for the amortization of the related investments. NaNNo impairment losses were recognized in relation to these investments for the years ended December 31, 2020, 2019,2023, 2022, and 2018.2020,2023 and 2022, the Company had $37.8$42 million and $40 million of unrecognized gross tax benefits.benefits, respectively. Gross tax benefits do not reflect the federal tax effect associated with state tax amounts. The total amount of net unrecognized tax benefits at December 31, 20202023 and 2022 that would have affected the effective tax rate, if recognized, was $29.9 million.$34 million and $32 million, respectively.2020, 2019,2023, 2022, and 2018,2021, the Company recognized income tax expense attributed to interest and penalties of $2.8$8 million $2.5, $4 million, and $1.7$4 million, respectively. Accrued interest and penalties on tax liabilities were $18.4$34 million and $14.5$26 million, respectively, at December 31, 20202023 and 2019.2020, 2019,2023, 2022, and 2018:2021:December 31, (in millions) 2023 2022 2021 Uncertain tax positions at beginning of year $ 40 $ 39 $ 38 Additions for tax positions relating to current-year operations 1 1 2 Additions for tax positions relating to prior tax years 2 — 1 Subtractions for tax positions relating to prior tax years (1) — (2) Uncertain tax positions at end of year $ 42 $ 40 $ 39 •Federal tax filings for tax years 2017 through the present;New York State tax filings for tax years 2010 through the present;New York City tax filings for tax years 2011 through the present; andNew Jersey tax filings for tax years 2016 through the present.•New York State for the tax years 2010 through 2014; and•New York City for the tax years 2011 and 2014.$21$21 million due to completion of tax authorities’ exams and the expiration of statutes of limitations.As a savings institution, the2020,2023, the Bank’s federal tax bad debt base-year reserve was $61.5$62 million, with a related federal deferred tax liability of $12.9 $13 million, which has not been recognized since the Bank does not expect that this reserve will become taxable in the foreseeable future. Events that would result in taxation of this reserve include redemptions of the Bank’s stock or certain excess distributions by the Bank to the Company.NOTE 11. DERIVATIVE AND HEDGING ACTIVITIESCompany’s derivative financial instruments consistCompany granted 9,995,495 shares of interest rate swaps. restricted stock, with an average fair value of $10.24 per share on the date of grant, during the year ended December 31, 2023.Year Ended December 31, 2023 Number of Shares Weighted Average Grant Date Fair Value Unvested at beginning of year 9,576,602 $ 10.92 Granted 9,995,495 10.24 Vested (3,105,582) 10.99 Forfeited (1,292,574) 10.62 Unvested at end of period 15,173,941 $ 10.49 Number of
SharesWeighted
Average
Grant Date
Fair ValuePerformance
PeriodExpected
Vesting
DateOutstanding at beginning of year 794,984 $ 10.73 Granted 566,656 8.95 Released (143,352) 10.34 Forfeited — — Outstanding at end of period 1,218,288 9.95 January 1, 2022 - December 31, 2025 March 31, 2023 - 2026 from time to time, the use of derivative financial instruments. Specifically, the Company enters into derivative financial instruments to manage exposures that arise from business activities that result in the payment of future known and uncertain cash amounts, the value of which are determined by interest rates.Title VIIDodd-Frank Wall Street Reform and Consumer Protection Actderivative agreements. 2010 (the “Dodd-Frank Act”) requires all standardized derivatives, including most interest rate swaps, foreign currency swaps, futures, swaptions and forward commitments used to be submitted for clearingmanage exposure to central counterpartieschanges in interest rates and MSR asset values and to reduce counterparty risk. Twomeet the needs of customers. The Company also enters into interest rate lock commitments, which are commitments to originate mortgage loans whereby the central counterparties areinterest rate on the Chicago Mercantile Exchange (“CME”)loan is determined prior to funding and the London Clearing House (“LCH”). As of December 31, 2020, all of the Company’s $4.3billion notional derivative contracts were clearedcustomers have locked into that interest rate. Market risk on the LCH. Daily variation margin payments on derivatives cleared through the LCH are accounted for as legal settlement. For derivatives cleared through LCH, the net gain (loss) position includes the variation margin amounts as settlement of the derivativeinterest rate lock commitments and not collateral againstmortgage LHFS is managed using corresponding forward sale commitments and US Treasury futures. Changes in the fair value of derivatives not designated as hedging instruments are recognized on the derivative, which includes accrued interest; therefore, thoseConsolidated Statements of Income and Comprehensive Income.and derivative contractsswaps as cash flow hedges on overnight SOFR-based variable interest payments on federal home loan bank advances. Changes in the Company clears through the LCH are reported at a fair value of approximately zeroderivatives designated as cash flow hedges are recorded in other comprehensive income on the Consolidated Statements of Condition and reclassified into interest expense in the same period in which the hedged transaction is recognized in earnings. At December 31, 2023, the Company had $10 million (net-of-tax) of unrealized gains on derivatives classified as cash flow hedges recorded in accumulated other comprehensive loss. The Company had $52 million (net-of-tax) of unrealized gains on derivatives classified as cash flow hedges recorded in accumulated other comprehensive loss at December 31, 2020.The Company’s exposure2022.limited to the value of the derivative contracts in a gain position less any collateral helddeemed necessary. All designated hedge relationships were, and plus any collateral posted. When there is a net negative exposure, we consider our exposure to the counterpartyare expected to be, zero. Athighly effective as of December 31, 2020, the Company had a net negative exposure.entered into an interest rate swapswaps with a notional amountamounts of $2.0 billion to hedge certain real estate loans.multi-family loans using the portfolio layer method. For the twelve monthsyear ended December 31, 2020,2023, the floating rate received related to the net settlement of thisthese interest rate swapswaps was lessgreater than the fixed rate payments. As such, interest income from Loansloans and Leasesleases in the accompanying Consolidated Statements of Income and Comprehensive Income was decreasedincreased by $34.6$24 million for the twelve monthsyear ended December 31, 2020, respectively. For2023 and decreased by $6 million for the twelve monthsyear ended December 31, 2019, the floating rate received related to the net settlement of this interest rate swap was less than the fixed rate payments. As such, interest income from Loans2022, respectively.Leases in the accompanyingleases held for investment on our Consolidated Statements of Income and Comprehensive IncomeCondition. The carrying amount of our hedged loans was decreased by $3.4 million for the twelve months ended $6.1 billion at December 31, 2019, respectively.As20232020, the following amounts were recorded on the balance sheet related to cumulative basis adjustment for fair value hedges.2023.
123(1)These amounts include the amortized cost basis of closed portfolios used to designate hedging relationships in which the hedged item is the last layer expected to be remaining at the end of the hedging relationship. At December 31, 2020, the amortized cost basis of the closed portfolios used in these hedging relationships was $3.6 billion; the cumulative basis adjustments associated with these hedging relationships was $73.2 million; and the amount of the designated hedged items was $2.0 billion.table setstables set forth information regarding the Company’s derivative financial instruments at December 31, 2020.instruments:December 31, 2020Fair Value(in thousands)NotionalAmountOtherAssetsOtherLiabilitiesDerivatives designated as fair value hedging instruments:Interest rate swap$2,000,000$—$—Total derivatives designated as fair value hedging instruments$2,000,000$—$—December 31, 2023 Fair Value (in millions) Notional Amount Other Assets Other Liabilities Expiration Dates Derivatives designated as cash flow hedging instruments: Interest rate swaps on FHLB advances $ 5,500 $ — $ 2 2025-2028 Total 5,500 — 2 Derivatives designated as fair value hedging instruments: Interest rate swaps on multi-family loans held for investment $ 2,000 $ — $ 1 2025-2027 Derivatives not designated as hedging instruments: Assets Mortgage-backed securities forwards $ 1,012 $ 11 $ — 2024 Rate lock commitments 1,490 12 — 2024 Interest rate swaps and swaptions 5,431 115 — 2024-2041 Total $ 7,933 $ 138 $ — Liabilities Futures $ 2,235 $ — $ 1 2024 Mortgage-backed securities forwards 1,048 $ — 32 2024 Rate lock commitments 77 — 3 2024 Interest rate swaps and swaptions 2,720 — 59 2024-2054 Total derivatives not designated as hedging instruments $ 6,080 $ — $ 95 December 31, 2022 Fair Value (in millions) Notional Amount Other Assets Other Liabilities Expiration Date Derivatives designated as cash flow hedging instruments: Interest rate swaps $ 3,750 $ 5 $ — 2023-2027 Total 3,750 5 — Derivatives not designated as hedging instruments: Assets Futures $ 1,205 $ 2 $ — 2023 Mortgage-backed securities forwards 1,065 36 — 2023 Rate lock commitments 1,539 9 — 2023 Interest rate swaps and swaptions 7,594 182 — 2023-2032 Total $ 11,403 $ 229 $ — Liabilities Mortgage-backed securities forwards $ 739 $ — $ 61 2023 Rate lock commitments 527 — 10 2023 Interest rate swaps and swaptions 2,445 — 65 2023-2053 Total derivatives not designated as hedging instruments $ 3,711 $ — $ 136 sets forthpresents the effectderivatives subject to a master netting agreement, including the cash pledged as collateral:December 31, 2023 Gross Amounts Not Offset in the Statements of Condition (in millions) Gross Amount Gross Amounts Netted in the Statements of Condition Net Amount Presented in the Statements of Condition Financial Instruments Cash Collateral Pledged (Received) Derivatives designated hedging instruments: Interest rate swaps on FHLB advances $ 2 $ — $ 2 $ — $ 75 $ 1 $ — $ 1 $ — $ 27 Derivatives not designated as hedging instruments: Assets Mortgage-backed securities forwards $ 11 $ — $ 11 $ — $ (1) Interest rate swaptions 115 — 115 — (34) Total derivative assets $ 126 $ — $ 126 $ — $ (35) Liabilities Futures $ 1 $ — $ 1 $ — $ 3 Mortgage-backed securities forwards 32 — 32 — 57 59 — 59 — 42 Total derivative liabilities $ 92 $ — $ 92 $ — $ 102 instruments onposition for accounting purposes.Consolidated Statementsderivatives subject to a master netting agreement, including the cash pledged as collateral:December 31, 2022 Gross Amounts Not Offset in the Statements of Condition (in millions) Gross Amount Gross Amounts Netted in the Statements of Condition Net Amount Presented in the Statements of Condition Financial Instruments Cash Collateral Pledged (Received) Derivatives designated hedging instruments: Interest rate swaps on FHLB advances $ 5 $ — $ 5 $ 4 $ 27 Derivatives not designated as hedging instruments: Assets Mortgage-backed securities forwards $ 36 $ — $ 36 $ — $ (9) Interest rate swaptions 182 — 182 — (36) Futures 2 2 1 Total derivative assets $ 220 $ — $ 220 $ — $ (44) Liabilities Mortgage-backed securities forwards $ 61 $ — $ 61 $ — $ 54 65 — 65 — 29 Total derivative liabilities $ 126 $ — $ 126 $ — $ 83 Income and Comprehensive Incomeopen positions is considered settlement of the derivative position for the periods indicated.accounting purposes.$2.3$5.5 billion and $800.0 million$3.8 billion as of December 31, 20202023 and December 31, 2019, respectively,2022, were designated as cash flow hedges of certain FHLB borrowings.The following table summarizes information about the interest rate swaps designated as cash flow hedges at December 31, 2020 and December 31, 2019:AOCL for the year ending December 31, 2020: Gains (losses) included in the Consolidated Statements of Income related to interest rate derivatives designated as cash flow hedges during the twelve months ended December 31, 2020 was $11.8 million. For the Years Ended December 31, (in millions) 2023 2022 2021 Amount of gain (loss) recognized in AOCL $ 9 $ 88 $ 8 Amount of reclassified from AOCL to interest expense $ (65) $ (4) $ 25 the Company estimates that an additional $23.5interest expense reduction of $98 million willis expected to be reclassified to interest expense.NOTE 12: COMMITMENTS AND CONTINGENCIESPledged AssetsThe Company pledges securities to servecollateral for its repurchase agreements, among other purposes. At December 31, 2020, the Company had pledged available for sale mortgage-related securities and other debt securities with carrying values of $898.3 million and $379.8 million, respectively. At December 31, 2019, the Company had pledged available for sale mortgage-related securities and other debt securities with carrying values of $651.3 million and $721.0 million, respectively. In addition, the Company had $33.5 billion and $32.6 billion of loans pledged to the FHLB-NY to serve as collateral for its wholesale borrowings at the respective year-ends.Loan Commitments and Letters of CreditAt December 31, 2020 and 2019, the Company had commitments to originate loans, including unused lines of credit, of $2.5 billion and $2.0 billion, respectively. The majority of the outstanding loan commitments at those dates were expected to close within 90 days. In addition, the Company had commitments to originate letters of credit totaling $375.9 million and $509.9 million at December 31, 2020 and 2019.summarizespresents the Company’s off-balance sheet commitmentsnet gain (loss) recognized in income on derivatives not designated as hedging instruments, net of the impact of offsetting positions:For the Years Ended December 31, (dollars in millions) 2023 2022 Derivatives not designated as hedging instruments Location of Gain (Loss) Futures Net return on mortgage servicing rights $ 1 $ (1) Interest rate swaps and swaptions Net return on mortgage servicing rights (34) (11) Mortgage-backed securities forwards Net return on mortgage servicing rights (15) (4) Rate lock commitments and US Treasury futures Net gain on loan sales 2 28 Forward commitments Other noninterest income — (1) Other non-interest income (1) — Total derivative (loss) gain $ (47) $ 11 originate loansthe difference between the purchase price and letters of credit at December 31, 2020:(in thousands)Mortgage Loan Commitments:Multi-family and commercial real estate$310,261One-to-four family801Acquisition, development, and construction100,599Total mortgage loan commitments$411,661Other loan commitments2,063,559Total loan commitments$2,475,220Commercial, performance stand-by, and financial stand-by letters of credit375,876Total commitments$2,851,096Financial GuaranteesThe Company provides guarantees and indemnifications to its customers to enable them to complete a variety of business transactions and to enhance their credit standings. These guarantees are recorded at their respective fair values in “Other liabilities” in the Consolidated Statements of Condition. The Company deems the fair value of an acquired company’s assets, net of the guarantees to equal the consideration received.The following table summarizes the Company’s guarantees and indemnifications atliabilities assumed. As of December 31, 2020:The maximum potential amount2023, the Company identified a triggering event and applied a market approach using the end of future payments represents the notional amounts that could be funded under the guaranteesday stock price. We evaluated those conditions known and indemnifications if there were a total defaultknowable by the guaranteed parties or if indemnification provisions were triggered,company and how a market participant would view the control premium as applicable, without consideration of possible recoveries under recourse provisions or from collateral held or pledged.The Company collects fees upon the issuance of commercial and stand-by letters of credit. Fees for stand-by letters of credit fees are initially recordedconfirmed by the Companysubsequent confirming market evidence. This adjusted market capitalization was then compared to the carrying value to determine the extent of the shortfall which was calculated to be in excess of the goodwill balance. The Company’s assessment concluded that goodwill from historical transactions (2007 and prior) was fully impaired as of December 31, 2023. As a liability, and are recognized as income periodically through the respective expiration dates. Fees for commercial letters of credit are collected and recognized as income at the time that they are issued and upon payment of each set of documents presented. In addition,result, the Company requires adequate collateral, typicallyrecorded an impairment charge of the entire goodwill balance of $2.4 billion.form of cash, real property, and/or personal guarantees upon its issuance of irrevocable stand-by letters of credit. Commercial letters of credit are primarily secured by the goods being purchased in the underlying transaction and are also personally guaranteed by the owner(s) of the applicant company.At December 31, 2020, the Company had commitments to purchase securities totaling $19.8 million.Legal ProceedingsThe Company is involved in various legal actions arising in the ordinary course of its business. All such actions in the aggregate involve amounts that are believed by management to be immaterial to the financial condition and results of operations of the Company.NOTE 13: INTANGIBLE ASSETSGoodwillGoodwill is presumed to have an indefinite useful life and is tested for impairment, rather than amortized, at the reporting unit level, at least once a year. There was 0 change in goodwillcarrying amount during the year ended December 31, 2020.2023 are as follows:(in millions) Gross Carrying Amount Balance at December 31, 2022 $ 2,426 Impairment (2,426) Balance at December 31, 2023 $ — December 31, 2023 December 31, 2022 (in millions) Gross Carrying Amount Accumulated Amortization Net Carrying Value Gross Carrying Amount Accumulated Amortization Net Carrying Value Core deposit intangible $ 700 $ (113) $ 587 $ 250 $ (4) $ 246 Other intangible assets 56 (18) 38 42 (1) 41 Total other intangible assets $ 756 $ (131) $ 625 $ 292 $ (5) $ 287 (in millions) Amortization Expense 2024 $ 132 2025 107 2026 94 2027 81 2028 68 Total $ 482 Risk-Based Capital December 31, 2023 Common Equity Tier 1 Tier 1 Total Leverage Capital (dollars in millions) Amount Ratio Amount Ratio Amount Ratio Amount Ratio Total capital $ 8,009 9.05 % $ 8,512 9.62 % $ 10,415 11.77 % $ 8,512 7.75 % Minimum for capital adequacy purposes 3,983 4.50 5,310 6.00 7,081 8.00 4,392 4.00 Excess $ 4,026 4.55 % $ 3,202 3.62 % $ 3,334 3.77 % $ 4,120 3.75 % December 31, 2022 Total capital $ 6,335 9.06 % $ 6,838 9.78 % $ 8,154 11.66 % $ 6,838 9.70 % Minimum for capital adequacy purposes 3,146 4.50 4,195 6.00 5,593 8.00 2,819 4.00 Excess $ 3,189 4.56 % $ 2,643 3.78 % $ 2,561 3.66 % $ 4,019 5.70 % Risk-Based Capital December 31, 2023 Common Equity Tier 1 Tier 1 Total Leverage Capital (dollars in millions) Amount Ratio Amount Ratio Amount Ratio Amount Ratio Total capital $ 9,305 10.52 % $ 9,305 10.52 % $ 10,271 11.61 % $ 9,305 8.48 % Minimum for capital adequacy purposes 3,980 4.50 5,307 6.00 7,076 8.00 4,389 4.00 Excess $ 5,325 6.02 % $ 3,998 4.52 % $ 3,195 3.61 % $ 4,916 4.48 % December 31, 2022 Total capital $ 7,653 10.96 % $ 7,653 10.96 % $ 7,982 11.43 % $ 7,653 10.87 % Minimum for capital adequacy purposes 3,142 4.50 4,189 6.00 5,585 8.00 2,817 4.00 Excess $ 4,511 6.46 % $ 3,464 4.96 % $ 2,397 3.43 % $ 4,836 6.87 % 2019, goodwill was reduced by $9.8 million related to the sale of the Company’s wealth management business, Peter B. Cannell & Co. Goodwill totaled $2.4 billion at each of these dates.NOTE 14: EMPLOYEE BENEFITSRetirement PlanThe New York Community Bancorp, Inc. Retirement Plan (the “Retirement Plan”) covers substantially all employees who had attained minimum age, service, and employment status requirements prior to the date when the individual plans were frozen by the banks of origin. Once frozen, the individual plans ceased to accrue additional benefits, service, and compensation factors, and became closed to employees who would otherwise have met eligibility requirements after the “freeze” date.The following table sets forth certain information regarding the Retirement Plan as of the dates indicated:In 2021, an estimated $6.9 million of unrecognized net actuarial loss for the Retirement Plan will be amortized from AOCL into net periodic benefit cost. The comparable amount recognized as net periodic benefit cost in 2020 was $7.3 million. NaN prior service cost will be amortized in 2021 and NaN was amortized in 2020. The discount rates used to determine the benefit obligation at December 31, 2020 and 2019 were 2.2% and 3.0%, respectively.The discount rate reflects rates at which the benefit obligation could be effectively settled. To determine this rate,2022, the Company considers rates of return on high-quality fixed-income investments that are currently available and are expected to be available during the period until the pension benefits are paid. The expected future payments are discounted based on a portfolio of high-quality rated bonds (AA or better) for which the Company relies on the Financial Times Stock Exchange (“FTSE”) Pension Liability Index that is published as of the measurement date.The components of net periodic pension (credit) expense were as follows for the years indicated:The following table indicates the weighted average assumptions used in determining the net periodic benefit cost for the years indicated:As of December 31, 2020, Retirement Plan assets were invested in two diversified investment portfolios of the Pentegra Retirement Trust (the “Trust”), a private placement investment fund.The Company (in this context, the “Plan Sponsor”) chooses the specific asset allocation for the Retirement Plan within the parameters set forth in the Trust’s Investment Policy Statement. The long-term investment objectives are to maintain the Retirement Plan’s assetsrepurchased 871,710 shares, at a level that will sufficiently cover the Plan Sponsor’s long-term obligations, and to generate a return on those assets that will meet or exceed the rate at which the Plan Sponsor’s long-term obligations will grow.The Retirement Plan allocates its assets in accordance with the following targets:•To hold 55% of its assets in equity securities via investment in the Trust’s Long-Term Growth—Equity (“LTGE”) Portfolio, a diversified portfolio that invests in a number of actively and passively managed equity mutual funds and collective trusts in order to gain exposure to both U.S. and non-U.S. equity markets;•To hold 44% of its assets in intermediate-term investment-grade bonds via investment in the Long-Term Growth—Fixed Income (“LTGFI”) Portfolio, a diversified portfolio that invests in a number of fixed-income mutual funds and collective investment trusts, primarily including intermediate-term bond funds with a focus on U.S. investment grade securities and opportunistic allocations to below-investment grade and non-U.S. investments; and•To hold 1% in a cash equivalents portfolio for liquidity purposes.In addition, the Retirement Plan holds Company shares, the value of which is approximately equal to 12% of the assets that are held by the Trust.The LTGE and LTGFI portfolios are designed to provide long-term growth of equity and fixed-income assets with the objective of achieving an investment return in excess of the cost of funding the active life, deferred vesting, and all 30-year term and longer obligations of retired lives in the Trust. Risk and volatility are further managed in accordance with the distinct investment objectives of the Trust’s respective portfolios.The following table presents information about the fair value measurements of the investments held by the Retirement Plan as of December 31, 2020:
$8 million.*Includes cash equivalent investments in equity and fixed income strategies.(1)This category contains large-cap stocks with above-average yield. The portfolio typically holds between 60 and 70 stocks.(2)This category seeks long-term capital appreciation by investing primarily in large growth companies based in the U.S.
Note 18 - Fair Value Measures(3)This fund tracks the performance of the S&P 500 Index by purchasing the securities represented in the Index in approximately the same weightings as the Index.(4)This category employs an indexing investment approach designed to track the performance of the CRSP US Mid-Cap Value Index.(5)This category employs an indexing investment approach designed to track the performance of the CRSP US Mid-Cap Growth Index.(6)This category seeks to track the performance of the S&P Midcap 400 Index.(7)This category consists of a selection of investments based on the Russell 2000 Value Index.(8)This category consists of a mutual fund invested in small cap growth companies along with a fund invested in a selection of investments based on the Russell 2000 Growth Index.(9)This category consists of a mutual fund investing in readily marketable securities of U.S. companies with market capitalizations within the smallest 10% of the market universe, or smaller than the 1000th largest US company.(10)This category invests primarily in medium to large non-US companies in developed and emerging markets. Under normal circumstances, at least 80% of total assets will be invested in equity securities, including common stocks, preferred stocks, and convertible securities.(11)This category currently includes equal investments in 3 mutual funds, two of which usually hold at least 80% of fund assets in investment grade fixed income securities, seeking to outperform the Barclays US Aggregate Bond Index while maintaininga similar duration to that index. The third fund targets investments of 50% or more in mortgage-backed securities guaranteed by the US government and its agencies.(12)This category consists of a mutual fund which invest in a diversified portfolio of high-quality bonds and other fixed income securities, including U.S. Government obligations, mortgage-related and asset backed securities, corporate and municipal bonds, CMOs, and other securities mostly rated A or better.Current Asset AllocationThe asset allocations for the Retirement Plan as of December 31, 2020 and 2019 were as follows:Determination of Long-Term Rate of ReturnThe long-term rate of return on Retirement Plan assets assumption was based on historical returns earned by equities and fixed income securities, and adjusted to reflect expectations of future returns as applied to the Retirement Plan’s target allocation of asset classes. Equities and fixed income securities were assumed to earn long-term rates of return in the ranges of 6% to 8% and 3% to 5%, respectively, with an assumed long-term inflation rate of 2.5% reflected within these ranges. When these overall return expectations are applied to the Retirement Plan’s target allocations, the result is an expected rate of return of 5% to 7%.Expected ContributionsThe Company does not expect to contribute to the Retirement Plan in 2021.Expected Future Annuity PaymentsThe following annuity payments, which reflect expected future service, as appropriate, are expected to be paid by the Retirement Plan during the years indicated:Qualified Savings PlanThe Company maintains a defined contribution qualified savings plan in which all full-time employees are able to participate after three months of service and having attained age 21. The Company instituted a safe harbor matching contribution program during the year ended December 31, 2020. These Company contributions totaled $5.7 million in 2020. The Company did 0t make any contributions in 2019.Post-Retirement Health and Welfare BenefitsThe Company offers certain post-retirement benefits, including medical, dental, and life insurance (the “Health & Welfare Plan”) to retired employees, depending on age and years of service at the time of retirement. The costs of such benefits are accrued during the years that an employee renders the necessary service.The Health & Welfare Plan is an unfunded plan and is not expected to hold assets for investment at any time. Any contributions made to the Health & Welfare Plan are used to immediately pay plan premiums and claims as they come due.The following table sets forth certain information regarding the Health & Welfare Plan as of the dates indicated:The discount rates used in the preceding table were 2.0% and 2.9%, respectively, at December 31, 2020 and 2019.The estimated net actuarial loss and the prior service liability that will be amortized from AOCL into net periodic benefit cost in 2021 are $46,000 and $249,000, respectively.The following table presents the components of net periodic benefit cost for the years indicated:The following table presents the weighted average assumptions used in determining the net periodic benefit cost for the years indicated:Expected ContributionsThe Company expects to contribute $915,000 to the Health & Welfare Plan to pay premiums and claims in the fiscal year ending December 31, 2021.Expected Future Payments for Premiums and ClaimsThe following amounts are currently expected to be paid for premiums and claims during the years indicated under the Health & Welfare Plan:NOTE 15: STOCK-RELATED BENEFIT PLANSNew York Community Bank Employee Stock Ownership PlanAll full-time employees who have attained 21 years of age and have completed twelve consecutive months of credited service are eligible to participate in the ESOP, with benefits vesting on a six-year basis, starting with 20% in the second year of employment and continuing in 20% increments in each successive year. Benefits are payable upon death, retirement, disability, or separation from service, and may be paid in stock. However, in the event of a change in control, as defined in the ESOP, any unvested portion of benefits shall vest immediately.In 2020, 2019, and 2018, the Company allocated 405,167, 349,356, and 529,531 shares, respectively, to participants in the ESOP. For the years ended December 31, 2020, 2019, and 2018, the Company recorded ESOP-related compensation expense of $4.3 million, $4.2 million, and $5.0 million, respectively.Supplemental Executive Retirement PlanThe Bank has established a Supplemental Executive Retirement Plan (“SERP”), which provided additional unfunded, non-qualified benefits to certain participants in the ESOP in the form of Company common stock. The SERP was frozen in 1999. Trust-held assets, consisting entirely of Company common stock, amounted to 2,191,915 and 2,046,449 shares, respectively, at December 31, 2020 and 2019, including shares purchased through dividend reinvestment. The cost of these shares is reflected as a reduction of paid-in capital in excess of par in the Consolidated Statements of Condition.Stock Based CompensationAt December 31, 2020, the Company had a total of 11,913,461 shares available for grants as restricted stock, options, or other forms of related rights under the 2020 Incentive Plan, which was approved by the Company’s shareholders at its Annual Meeting on June 3, 2020. The Company granted 2,421,345 shares of restricted stock, with an average fair value of $11.61 per share on the date of grant, during the twelve months ended December 31, 2020.During 2019 and 2018, the Company granted 2,031,198 shares and 2,543,023 shares, respectively, of restricted stock, which had average fair values of $10.45 and $13.50 per share on the respective grant dates. The shares of restricted stock that were granted during the years ended December 31, 2020, 2019, and 2018 vest over a period of five years. Compensation and benefits expense related to the restricted stock grants is recognized on a straight-line basis over the vesting period and totaled $28.4 million, $30.9 million, and $36.3 million, respectively, for the years ended December 31, 2020, 2019, and 2018.The following table provides a summary of activity with regard to restricted stock awards in the year ended December 31, 2020:As of December 31, 2020, unrecognized compensation cost relating to unvested restricted stock totaled $52.5 million. This amount will be recognized over a remaining weighted average period of 2.8 years.In addition, the Company has granted a total of 477,872 Performance-Based Restricted Stock Units (“PSUs”). Included in this total are 446,181 shares granted during the twelve months ended December 31, 2020, which have a performance period of January 1, 2020 to December 31, 2022 and vest on April 1, 2023, subject to adjustment or forfeiture, based upon the achievement by the Company of certain performance standards. During the twelve months ended December 31, 2020, 386,983 shares were forfeited. The Company granted 418,674 PSUs during 2019, which have a performance period of January 1, 2019 to December 31, 2021 and vest on April 1, 2022, subject to adjustment or forfeiture, based upon the achievement by the Company of certain performance standards. Compensation and benefits expense related to PSUs is recognized using the fair value as of the date the units were approved, on a straight-line basis over the vesting period and totaled $1.0 million and $1.1 million for the twelve months ended December 31, 2020 and 2019, respectively. As of December 31, 2020, unrecognized compensation cost relating to unvested PSUs totaled $3.1 million. This amount will be recognized over a remaining weighted average period of 1.8 years. As of December 31, 2020, the Company believes it is probable that the performance conditions will be met.NOTE 16: FAIR VALUE MEASUREMENTS•Level 1 – Inputs to the valuation methodology are quoted prices (unadjusted) for identical assets or liabilities in active markets.•Level 2 – Inputs to the valuation methodology include quoted prices for similar assets and liabilities in active markets, and inputs that are observable for the asset or liability, either directly or indirectly, for substantially the full term of the financial instrument.Level 3 – Inputs to the valuation methodology are significant unobservable inputs that reflect a company’s own assumptions about the assumptions that market participants use in pricing an asset or liability.20202023 and 2019,December 31, 2022, and that were included in the Company’s Consolidated Statements of Condition at those dates:December 31, 2023 December 31, 2023 (in millions) (in millions) Quoted Prices in Active Markets for Identical Assets
(Level 1)Significant Other Observable Inputs
(Level 2)Significant Unobservable Inputs
(Level 3)Netting Adjustments Total Fair Value Mortgage-related Debt Securities Available for Sale: Mortgage-related Debt Securities Available for Sale: Mortgage-related Debt Securities Available for Sale: GSE certificates GSE certificates Private Label CMOs U. S. Treasury obligations U. S. Treasury obligations U. S. Treasury obligations Foreign notes Mutual funds and common stock Mutual funds and common stock Loans held-for-sale Residential first mortgage loans Residential first mortgage loans Residential first mortgage loans Acquisition, development, and construction Commercial and industrial loans Derivative assets Interest rate swaps and swaptions Interest rate swaps and swaptions Interest rate swaps and swaptions Futures Rate lock commitments (fallout-adjusted) Mortgage-backed securities forwards Mortgage servicing rights Total assets at fair value Derivative liabilities Mortgage-backed securities forwards Mortgage-backed securities forwards Mortgage-backed securities forwards Futures Interest rate swaps and swaptions Rate lock commitments (fallout-adjusted) Total liabilities at fair value December 31, 2022 (in millions) Quoted Prices in Active Markets for Identical Assets
(Level 1)Significant Other Observable Inputs
(Level 2)Significant Unobservable Inputs
(Level 3)Netting Adjustments Total Fair Value Assets: Mortgage-related Debt Securities Available for Sale: GSE certificates $ — $ 1,297 $ — $ — $ 1,297 GSE CMOs — 3,301 — — 3,301 Private Label CMOs — 191 — — 191 Total mortgage-related debt securities $ — $ 4,789 $ — $ — $ 4,789 Other Debt Securities Available for Sale: U. S. Treasury obligations $ 1,487 $ — $ — $ — $ 1,487 GSE debentures — 1,398 — — 1,398 Asset-backed securities — 361 — — 361 Municipal bonds — 30 — — 30 Corporate bonds — 885 — — 885 Foreign notes — 20 — — 20 Capital trust notes — 90 — — 90 Total other debt securities $ 1,487 $ 2,784 $ — $ — $ 4,271 Total debt securities available for sale $ 1,487 $ 7,573 $ — $ — $ 9,060 Equity securities: Mutual funds and common stock — 14 — — 14 Total equity securities — 14 — — 14 Total securities $ 1,487 $ 7,587 $ — $ — $ 9,074 Loans held-for-sale Residential first mortgage loans $ — $ 1,115 $ — $ — $ 1,115 Derivative assets Interest rate swaps and swaptions — 182 — — 182 Futures — 2 — — 2 Rate lock commitments (fallout-adjusted) — — 9 — 9 Mortgage-backed securities forwards — 36 — — 36 Mortgage servicing rights — — 1,033 — 1,033 Total assets at fair value $ 1,487 $ 8,922 $ 1,042 $ — $ 11,451 Derivative liabilities Mortgage-backed securities forwards — 61 — — 61 Interest rate swaps and swaptions — 65 — — 65 Rate lock commitments (fallout-adjusted) — — 10 — 10 Total liabilities at fair value $ — $ 126 $ 10 $ — $ 136 Option(dollars in millions) Balance at Beginning of Year Total Gains / (Losses) Recorded in Earnings (1) Purchases / Originations Sales Settlement Transfers In (Out) Balance at End of Year Year Ended December 31, 2023 Assets $ 1,033 $ (79) $ 208 $ (51) — — $ 1,111 Private Label CMOs — — — — — 32 32 (1) (49) 104 — — (45) 9 Totals $ 1,032 $ (128) $ 312 $ (51) $ — $ (13) $ 1,152 Losses Included in Incomelosses for Assets Whereindividual lines do not reflect the Fair Value Option Has Been Electedassets accounted for underfollowing tables present the quantitative information about recurring Level 3 fair value financial instruments and the fair value option are initially measured at fair value. Gains and losses from the initial measurement and subsequent changes inmeasurements as of December 31, 2023:Fair Value Valuation Technique Range
(Weighted Average)(dollars in millions) Assets Mortgage servicing rights $1,111 Discounted cash flows Option adjusted spread 5.0% - 21.7% 5.4% Constant prepayment rate —% - 10.0% 7.9% Weighted average cost to service per loan $65.0 - $90.0 $69.0 Private Label CMOs $32 Discounted cash flows Constant default rates 0.10% - 0.30% Weighted average life 8.2 - 11.8 Rate lock commitments (net) $9 Consensus pricing Origination pull-through rate 64.30% are recognized in earnings. The following table presentsof the changes in fair value related to initial measurement, and the subsequent changes in fair value included in earnings, for MSRs for the periods indicated:instruments.
131(1)Included in “Non-interest income.”20202023 and 2019,December 31, 2022, and that were included in the Company’s Consolidated Statements of Condition at those dates:(1)Represents the fair value of certain loans individually assessed for impairment, based on the value of the collateral.(2)Represents the fair value of repossessed assets, based on the appraised value of the collateral subsequent to its initial classification as repossessed assets and equity securities without readily determinable fair values. These equity securities are classified as Level 3 due to the infrequency of the observable prices and/or the restrictions on the shares.(1)Represents the fair value of impaired loans, based on the value of the collateral.Fair Value Measurements at December 31, 2023 Using (in millions) Quoted Prices in Active Markets for Identical Assets (Level 1) Significant Other Observable Inputs (Level 2) Significant Unobservable Inputs (Level 3) Total Fair Value $ — $ — $ 197 $ 197 — — 50 50 Total $ — $ — $ 247 $ 247 (2)(1)Represents the fair value of impaired loans, based on the value of the collateral.Represents the fair value of repossessed assets, based on the appraised value of the collateral subsequent to its initial classification as repossessed assets.Fair Value Measurements at December 31, 2022 Using (in millions) Quoted Prices in Active Markets for Identical Assets (Level 1) Significant Other Observable Inputs (Level 2) Significant Unobservable Inputs (Level 3) Total Fair Value $ — $ — $ 28 $ 28 — — 41 41 Total $ — $ — $ 69 $ 69 20202023 and 2019:
December 31, 2022:(1)Carrying value and estimated fair value are at cost.(2)Interest-bearing checking and money market accounts, savings accounts, and non-interest-bearing accounts.(3)Certificates of deposit.December 31, 2023 Fair Value Measurement Using (in millions) Carrying Value Estimated Fair Value Quoted Prices in Active Markets for Identical Assets (Level 1) Significant Other Observable Inputs (Level 2) Significant Unobservable Inputs (Level 3) Financial Assets: Cash and cash equivalents $ 11,475 $ 11,475 $ 11,475 $ — $ — $ 1,392 $ 1,392 $ — $ 1,392 $ — Loans and leases held for investment, net $ 83,627 $ 79,333 $ — $ — $ 79,333 Financial Liabilities: Deposits $ 81,526 $ 81,247 $ 59,972 (2) $ 21,275 (3) $ — Borrowed funds $ 21,267 $ 21,082 $ — $ 21,082 $ — Carrying value and estimated fair value are at cost.Interest-bearing checking and money market accounts, savings accounts, and non-interest-bearing accounts.Certificates of deposit.December 31, 2022 Fair Value Measurement Using (in millions) Carrying Value Estimated Fair Value Quoted Prices in Active Markets for Identical Assets (Level 1) Significant Other Observable Inputs (Level 2) Significant Unobservable Inputs (Level 3) Financial Assets: Cash and cash equivalents $ 2,032 $ 2,032 $ 2,032 $ — $ — $ 1,267 $ 1,267 $ — $ 1,267 $ — Loans and leases held for investment, net $ 68,608 $ 65,673 $ — $ — $ 65,673 Financial Liabilities: Deposits $ 58,721 $ 58,479 $ 46,211 (2) $ 12,268 (3) $ — Borrowed funds $ 21,332 $ 21,231 $ — $ 21,231 — The estimated fair values of non-performing mortgage and other loans are based on recent collateral appraisals. For those loans where a discounted cash flow technique was not considered reliable, the Company used a quoted market price for each individual loan.For the Years Ended December 31, (dollars in millions) 2023 2022 Assets Loans held-for-sale Net gain on loan sales $ 43 $ 8 December 31, 2023 (dollars in millions) Unpaid Principal Balance Fair Value Fair Value Over / (Under) UPB Assets: Nonaccrual loans: Loans held-for-sale $ 2 $ 2 $ — Total non-accrual loans $ 2 $ 2 $ — Other performing loans: Loans held-for-sale $ 869 $ 894 $ 25 Total other performing loans $ 869 $ 894 $ 25 Total loans: Loans held-for-sale $ 871 $ 896 $ 25 Total loans $ 871 $ 896 $ 25 December 31, 2022 (dollars in millions) Unpaid Principal Balance Fair Value Fair Value Over / (Under) UPB Assets: Other performing loans: Loans held-for-sale $ 1,095 $ 1,115 $ 20 Total other performing loans $ 1,095 $ 1,115 $ 20 Total loans: Loans held-for-sale $ 1,095 $ 1,115 $ 20 Total loans $ 1,095 $ 1,115 $ 20 December 31, (in millions) 2023 2022 Multi-family and commercial real estate $ 52 $ 216 One-to-four family including interest rate locks 1,694 2,066 Acquisition, development, and construction 3,926 3,539 Warehouse loan commitments 7,074 8,042 Other loan commitments 11,315 7,964 Total loan commitments $ 24,061 $ 21,827 Commercial, performance stand-by, and financial stand-by letters of credit 915 541 Total commitments $ 24,976 $ 22,368 (in millions) Expires Within One Year Expires After One Year Total Outstanding Amount Maximum Potential Amount of Future Payments Financial stand-by letters of credit $ 254 $ 288 $ 542 $ 639 Performance stand-by letters of credit 100 2 102 102 Commercial letters of credit 3 — 3 174 Total letters of credit $ 357 $ 290 $ 647 $ 915 December 31, (in millions) 2023 2022 Change in Benefit Obligation: Benefit obligation at beginning of year $ 116 $ 158 Interest cost 5 4 Actuarial gain 2 (38) Annuity payments (7) (7) Settlements (1) (1) Benefit obligation at end of year $ 115 $ 116 Change in Plan Assets: Fair value of assets at beginning of year $ 228 $ 283 Actual return (loss) on plan assets 33 (47) Annuity payments (7) (7) Settlements (1) (1) Fair value of assets at end of year $ 253 $ 228 Funded status (included in “Other assets”) $ 138 $ 112 Changes recognized in other comprehensive income for the year ended December 31: Amortization of actuarial loss $ (7) $ (2) Net actuarial (gain) loss arising during the year (18) 26 Total recognized in other comprehensive income for the year (pre-tax) $ (25) $ 24 Accumulated other comprehensive loss (pre-tax) not yet recognized in net periodic benefit cost at December 31: Actuarial loss, net $ 41 $ 66 Total accumulated other comprehensive loss (pre-tax) $ 41 $ 66 Years Ended December 31, (in millions) 2023 2022 2021 Components of net periodic pension expense (credit): Interest cost $ 5 $ 4 $ 4 Expected return on plan assets (14) (16) (16) Amortization of net actuarial loss 7 2 7 Net periodic pension credit $ (2) $ (10) $ (5) Years Ended December 31, 2023 2022 2021 Discount rate 4.9 % 2.6 % 2.2 % Expected rate of return on plan assets 6.3 6.0 6.3 Asset Allocation Parameters by Asset Class Equity Minimum Target Maximum U.S. Large-Cap 27% U.S. Mid-Cap 7% U.S. Small-Cap 7% Non-U.S. 14% Total - Equity 45% 55% 65% Total - Fixed Income/Cash Equivalents 35% 45% 55% (in millions) Total Quoted Prices in Active Markets for Identical Assets (Level 1) Significant Other Observable Inputs (Level 2) Significant Unobservable Inputs (Level 3) Equity: $ 12 $ 12 $ — $ — 22 22 — — 17 17 — — 15 15 — — 16 16 — — 18 18 — — 10 10 — — Fixed Income Funds: 98 98 — — Equity Securities: Company common stock 31 31 — — Common/Collective Trusts-Equity: 13 — 13 — Cash Equivalents: 1 1 — $ 253 $ 240 $ 13 $ — December 31, 2023 2022 Equity securities 61 % 60 % Debt securities 39 % 38 % Cash equivalents — % 2 % Total 100 % 100 % (in millions) 2024 $ 8 2025 8 2026 8 2027 8 2028 8 2029 and thereafter 43 Total $ 83 2019.NOTE 17: DIVIDEND RESTRICTIONSParent Company offers certain post-retirement benefits, including medical, dental, and life insurance (the “Health & Welfare Plan”) to retired employees, depending on age and years of service at the time of retirement. The costs of such benefits are accrued during the years that an employee renders the necessary service.a separate legal entity from the Bankan unfunded plan and must provideis not expected to hold assets for its own liquidity. In addition to operating expenses andinvestment at any share repurchases, the Parent Company is responsible for paying any dividends declaredtime. Any contributions made to the Company’s shareholders. As a Delaware corporation,Health & Welfare Plan are used to immediately pay plan premiums and claims as they come due.ParentHealth & Welfare Plan as of the dates indicated:December 31, (in millions) 2023 2022 Change in benefit obligation: Benefit obligation at beginning of year $ 7 $ 10 Interest cost 1 — Actuarial gain 1 (2) Premiums and claims paid (1) (1) Benefit obligation at end of year $ 8 $ 7 Change in plan assets: Fair value of assets at beginning of year $ — $ — Employer contribution 1 1 Premiums and claims paid (1) (1) Fair value of assets at end of year $ — $ — Funded status (included in “Other liabilities”) $ (8) $ (7) Changes recognized in other comprehensive income for the year ended December 31: Amortization of prior service cost — Amortization of actuarial gain — Net actuarial (gain) loss arising during the year 1 (2) Total recognized in other comprehensive income for the year (pre-tax) $ 1 $ (2) Accumulated other comprehensive (gain) loss (pre-tax) not yet recognized in net periodic benefit cost at December 31: Prior service cost — Actuarial (gain) loss, net (1) (2) Total accumulated other comprehensive income (pre-tax) $ (1) $ (2) Years Ended December 31, 2023 2022 2021 Discount rate 4.8% 2.3% 2.0% Current medical trend rate 6.5 6.5 6.5 Ultimate trend rate 5.0 5.0 5.0 Year when ultimate trend rate will be reached 2029 2028 2027 is ableexpects to contribute $1 million to the Health & Welfare Plan to pay dividends either from surplus or,premiums and claims in case there is no surplus, from net profits for the fiscal year in which the dividend is declared and/or the preceding fiscal year.Various legal restrictions limit the extent to which the Company’s subsidiary bank can supply funds to the Parent Company and its non-bank subsidiaries. The Company’s subsidiary bank would require the approval of the Superintendent of the NYSDFS if the dividends they declared in any calendar year were to exceed the total of their respective net profits for that year combined with their respective retained net profits for the preceding two calendar years, less any required transfer to paid-in capital. The term “net profits” is defined as the remainder of all earnings from current operations plus actual recoveries on loans, investments, and other assets, after deducting from the total thereof all current operating expenses, actual losses if any, and all federal, state, and local taxes. In 2020, dividends of $380.0 million were paid by the Bank to the Parent Company. At ending 2020,2023.Bank could have paid additional dividends of $301.6 million toyears indicated under the Health & Welfare Plan:(in millions) 2024 $ 1 2025 1 2026 1 2027 1 2028 1 2029 and thereafter 2 Total $ 7 Company without regulatory approval.Company-Only Financial InformationNOTE 18: PARENT COMPANY-ONLY FINANCIAL INFORMATIONDecember 31, (in millions) 2023 2022 ASSETS: Cash and cash equivalents $ 158 $ 121 Investments in subsidiaries 9,160 9,633 Other assets 80 85 Total assets $ 9,398 $ 9,839 LIABILITIES AND STOCKHOLDERS’ EQUITY: Junior subordinated debentures $ 579 $ 575 Subordinated notes 438 432 Other liabilities 14 8 Total liabilities $ 1,031 $ 1,015 Stockholders’ equity $ 8,367 $ 8,824 Total liabilities and stockholders’ equity $ 9,398 $ 9,839 Years Ended December 31, (in millions) 2023 2022 2021 Dividends received from subsidiaries $ 580 $ 335 $ 380 Other income 2 160 1 Gross income 582 495 381 Operating expenses 108 55 50 Income before income tax benefit and equity in undistributed
(loss) earnings of subsidiaries474 440 331 Income tax benefit 25 14 14 Income before equity in undistributed (loss) earnings of subsidiaries 499 454 345 Equity in undistributed (loss) earnings of subsidiaries (578) 196 251 Net (loss) income $ (79) $ 650 $ 596 Years Ended December 31, (in millions) 2023 2022 2021 CASH FLOWS FROM OPERATING ACTIVITIES: Net (loss) income $ (79) $ 650 $ 596 Change in other assets 30 (3) (22) Change in other liabilities 6 (4) 1 Other, net 65 (130) 32 Equity in undistributed (loss) earnings of subsidiaries 578 (196) (251) Net cash provided by operating activities $ 600 $ 317 $ 356 CASH FLOWS FROM INVESTING ACTIVITIES: Cash acquired in business acquisition — 34 — Change in receivable from subsidiaries, net (32) 5 (3) Net cash (used in) provided by investing activities $ (32) $ 39 $ (3) CASH FLOWS FROM FINANCING ACTIVITIES: Treasury stock repurchased (12) (24) (16) Cash dividends paid on common and preferred stock (519) (350) (349) Net cash used in financing activities (531) (374) (365) Net increase (decrease) in cash and cash equivalents 37 (18) (12) Cash and cash equivalents at beginning of year 121 139 151 Cash and cash equivalents at end of year $ 158 $ 121 $ 139 NOTE 19: CAPITALis subject to examination, regulation,in exchange for the sale and periodic reporting under the Bank Holding Company Act of 1956, as amended, which is administeredissuance by the FRB. The FRB has adopted capital adequacy guidelines for bank holding companies (onCompany of (a) 76,630,965 shares of our common stock, at a consolidated basis) that are substantially similar to those of the FDIC for the Bank.The following tables present the regulatory capital ratios for the Company at December 31, 2020 and 2019, in comparison with the minimum amounts and ratios required by the FRB for capital adequacy purposes:At December 31, 2020, our total risk-based capital ratio exceeded the minimum requirement for capital adequacy purposes by 497 basis points and the fully phased-in capital conservation buffer by 247 basis points.The Bank is subject to regulation, examination, and supervision by the NYSDFS and the FDIC (the “Regulators”). The Bank is also governed by numerous federal and state laws and regulations, including the FDIC Improvement Act of 1991, which established five categories of capital adequacy ranging from “well capitalized” to “critically undercapitalized.” Such classifications are used by the FDIC to determine various matters, including prompt corrective action and each institution’s FDIC deposit insurance premium assessments. Capital amounts and classifications are also subject to the Regulators’ qualitative judgments about the components of capital and risk weightings, among other factors.The quantitative measures established to ensure capital adequacy require that banks maintain minimum amounts and ratios of leverage capital to average assets and of common equity tier 1 capital, tier 1 capital, and total capital to risk-weighted assets (as such measures are defined in the regulations). At December 31, 2020, the Bank exceeded all the capital adequacy requirements to which they were subject.As of December 31, 2020, the Company and the Bank are categorized as “well capitalized” under the regulatory framework for prompt corrective action. To be categorized as well capitalized, a bank must maintain a minimum common equity tier 1 risk-based capital ratio of 6.50%; a minimum tier 1 risk-based capital ratio of 8.00%; a minimum total risk-based capital ratio of 10.00%; and a minimum leverage capital ratio of 5.00%. In the opinion of management, no conditions or events have transpired since December 31, 2020 to change these capital adequacy classifications.The following tables present the actual capital amounts and ratios for the Bank at December 31, 2020 and 2019 in comparison to the minimum amounts and ratios required for capital adequacy purposes.Preferred StockOn March 17, 2017, the Company issued 20,600,000 depositary shares, each representing a 1/40th interest in apurchase price per share of the Company’s Fixed-to-Floating Rate Series A Noncumulative Perpetual Preferred Stock,$2.00, (b) 192,062 shares of a new series of our preferred stock, par value $0.01 per share, withdesignated as Series B Preferred Stock, at a liquidation preference of $1,000price per share (equivalent to $25of $2,000, each share of which is convertible into 1,000 shares of common stock (or, in certain limited circumstances, one share of Series C Preferred Stock), (c) 256,307 shares of a new series of our preferred stock, par value $0.01 per depositary share). Dividends will accrue on the depositary sharesshare, designated as Series C Preferred Stock, at a fixed rate equalprice per share of $2,000, each share of which is convertible into 1,000 shares of common stock, and (d) warrants affording the holder thereof the right, until the seven-year anniversary of the issuance of such warrant, to 6.375%purchase for $2,500 per annum until March 17, 2027,share, shares of Series D NVCE Stock, each share of Series D NVCE Stock is convertible into 1,000 shares of common stock (or, in certain limited circumstances, one share of Series C Preferred Stock), and a floating rate equalall of which shares of Series D NVCE Stock, upon issuance, will represent the right (on an as converted basis) to Three-month LIBOR plus 382.1 basis points per annum beginningreceive 315,000,000 shares of common stock. The transaction closed on March 17, 2027. Dividends will be payable in arrears on March 17, June 17, September 17, and December 17 of each year, which commenced on June 17, 2017.Treasury Stock RepurchasesOn October 23, 2018, the Board of Directors approved the repurchase of up to $300 million of the Company’s outstanding common stock. As of December 31, 2020, the Company has repurchased a total of 28.9 million shares at an average price of $9.63 or an aggregate purchase of $278.1 million. During the years ended December 31, 2020 and 2019, the Company repurchased 5.0 million and 7.1 million shares, at a cost of $50.2 million and $67.1 million, respectively.Report of Independent Registered Public Accounting Firm
To the Stockholders and Board of DirectorsReport of Independent Registered Public Accounting Firm 20202023 and 2019,2022, the related consolidated statements of (loss) income and comprehensive (loss) income, changes in stockholders’ equity, and cash flows for each of the years in the three-year period ended December 31, 2020,2023, and the related notes (collectively, the consolidated financial statements). In our opinion, the consolidated financial statements present fairly, in all material respects, the financial position of the Company as of December 31, 20202023 and 2019,2022, and the results of its operations and its cash flows for each of the years in the three-year period ended December 31, 2020,2023, in conformity with U.S. generally accepted accounting principles.2020,2023, based on criteria established in Internal Control – Integrated Framework (2013) issued by the Committee of Sponsoring Organizations of the Treadway Commission, and our report dated February, 26, 2021March 14, 2024 expressed an unqualifiedadverse opinion on the effectiveness of the Company’s internal control over financial reporting.Change in Accounting PrincipleAs discussed in Note 2 to the consolidated financial statements, the Company has changed its method of accounting for the recognition and measurement of credit losses as of January 1, 2020 due to the adoption of ASC Topic 326, Financial Instruments – Credit Losses.Mattermattermatters communicated below is a matterare matters arising from the current period audit of the consolidated financial statements that waswere communicated or required to be communicated to the audit committee and that: (1) relatesrelate to accounts or disclosures that are material to the consolidated financial statements and (2) involved our especially challenging, subjective, or complex judgment.judgments. The communication of a critical audit mattermatters does not alter in any way our opinion on the consolidated financial statements, taken as a whole, and we are not, by communicating the critical audit mattermatters below, providing a separate opinionopinions on the critical audit mattermatters or on the accounts or disclosures to which it relates.related to the multi-family, commercial real estate and specialty finance portfolio segments that are evaluated on a collective basis.NoteNotes 2 and Note 67 to the consolidated financial statements, the Company’s total allowance for credit losses (ACL) on loans and leases was $194 million as of December 31, 2020,2023 was $992 million, a substantial portion of which is related to the one-to-four family first mortgage, multi-family, commercial and industrial, specialty finance, and commercial real estate and specialty finance portfolio segments. The allowance for credit losses on loans and leases issegments measured on a collective basis when similar risk characteristics exist (collective ACL). Management estimates the collective ACL by projecting and multiplying together the probability-of-default (PD), loss-given-default (LGD) and exposure-at-default depending on economic parameters for each month of the remaining contractual term. ForThe loss drivers for certain loans within the multi-familycommercial and commercial real estate portfolios, theindustrial portfolio are derived using credit ratings. The Company estimates the exposure-at-default using a prepayment modelmodels which projectsforecasts prepayments over the life of the loans. Economicloans and leases. The economic forecast and the related economic parameters are developed using available information relating to past events, current conditions,multiple economic forecasts, and macroeconomic assumptions. Economic parameters are forecast scenarios, including related weightings, over athe reasonable and supportable forecast period. After the reasonable and supportable forecast period, the Company reverts to a historical average loss rate on a straight line basis.straight-line basis over 12 months. Historical credit loss experience over the historical loss observation period provides the basis for the estimation of expected credit losses, with qualitative factor adjustments made for differences in current loan-specific risk characteristics as well as for changes in environmental conditions. on loans and leases related to the multi-family, commercial real estate and specialty finance portfolio segments as a critical audit matter. A high degree of audit effort, including specialized skills and knowledge, and subjective and complex auditor judgment was involved in the assessment due to significant measurement uncertainty. Specifically, the assessment encompassed the evaluation of the collective ACL methodology, including the methods and models used to estimate the PD, LGD, and prepayments and their significant assumptions. Such significant assumptions included portfolio segmentation, the selection of the multiple economic forecasts and macroeconomic assumptions,forecast scenarios including related weightings, economic parameters, credit ratings, the reasonable and supportable forecast period, the reversion period and the historical loss observation period. The assessment also included the evaluation of the qualitative factor adjustments and their significant assumptions for differences in loan-specific risk characteristics and changes in environmental factors.conditions. The assessment also included an evaluation of the conceptual soundness and performance of the PD, LGD, and prepaymentsprepayment models. In addition, auditor judgment was required to evaluate the sufficiency of audit evidence obtained.on loans and leases related to multi-family, commercial real estate and specialty finance portfolio segments,estimate, including controls over the:•Development of the collective ACL on loans and leases related to the multi-family, commercial real estate and specialty finance portfolio segments methodology•development of the PD, LGD, and prepayment modelsidentification and determination of the significant assumptions used in the PD, LGD, and prepayment models•development of the qualitative adjustments, including the significant assumptions used in the measurement of the qualitative factorsperformance monitoring of the PD, LGD, and prepayment models•analysis of the collective ACL on loans and leases related to the multi-family, commercial real estate and specialty finance portfolio segments results, trends, and ratios
•performance monitoring of the PD, LGD, and prepayment models on loans and leases related to the multi-family, commercial real estate and specialty finance portfolio segments estimate by testing certain sources of data, factors, and assumptions that the Company used, and considered the relevance and reliability of such data, factors, and assumptions. In addition, we involved credit risk and valuation professionals with specialized skills and knowledge, who assisted in:•evaluating the Company’s collective ACL methodology for compliance with U.S. generally accepted accounting principles•evaluating judgments made by the Company relative to the development and performance testing of the PD, LGD, and prepayment models by comparing them to relevant Company-specific metrics and trends and the applicable industry and regulatory practicesassessing the conceptual soundness and performance of the PD, LGD, and prepayment models by inspecting the model documentation to determine whether the models are suitable for their intended use•evaluating the selection of the economic forecasts and underlying macroeconomic assumptions by comparing it to the Company’s business environment and relevant industry practicesassessing the economic forecasts through comparison to publicly available forecasts•evaluating the length of the reasonable and supportable period, the reversion period and the historical observation period by comparing them to specific portfolio risk characteristics and trendsdetermining whether the loan portfolio is segmented by similar risk characteristics by comparing to the Company’s business environment and relevant industry practices•evaluating the methodology used to develop the qualitative factors and their significant assumptions and the effect of those factors on the allowance for credit losses on loans and leases compared with relevant credit risk factors and consistency with credit trends and identified limitations of the underlying quantitative models.onestimate by evaluating the:leasescore deposit intangible assetmulti-family, commercial real estateCompany’s fair value measurements of acquired loans and specialty finance portfolio segmentsthe CDI asset at the acquisition date. This included controls related to the (1) determination of certain significant assumptions used in the discounted cash flow methodologies for acquired loans and the CDI asset, and (2) assessment of the overall fair value measurement for acquired loans and the CDI asset. We evaluated the Company’s process to determine the estimated fair value of the CDI asset at the acquisition date by testing certain sources of data and subjective assumptions that the Company used and considered the relevance and reliability of such data and subjective assumptions. In addition, we involved valuation professionals with specialized skills and knowledge, who assisted in:the:the discount rates and customer attrition rates by comparing the information used to develop such assumptions to market data and deposit activity observed subsequent to the acquisition date.determination of cumulative results of the audit procedures/s/ KPMG LLP •qualitative aspects ofWe have served as the Company’s accounting practices•potential bias in the accounting estimate.
We have served as the Company’s auditor since 1993.February 26, 2021Report of Independent Registered Public Accounting FirmReport of Independent Registered Public Accounting Firm subsidiaries’subsidiaries' (the Company) internal control over financial reporting as of December 31, 2020,2023, based on criteria established in Internal Control – Integrated Framework (2013) issued by the Committee of Sponsoring Organizations of the Treadway Commission. In our opinion, because of the effect of the material weaknesses, described below, on the achievement of the objectives of the control criteria, the Company has not maintained in all material respects, effective internal control over financial reporting as of December 31, 2020,2023, based on criteria established in Internal Control – Integrated Framework (2013) issued by the Committee of Sponsoring Organizations of the Treadway Commission.20202023 and 2019,2022, the related consolidated statements of (loss) income and comprehensive (loss) income, changes in stockholders’ equity, and cash flows for each of the years in the three-year period ended December 31, 2020,2023, and the related notes (collectively, the consolidated financial statements), and our report dated February 26, 2021March 14, 2024 expressed an unqualified opinion on those consolidated financial statements.Management’sManagement's Report on Internal Control over Financial Reporting. Our responsibility is to express an opinion on the Company’s internal control over financial reporting based on our audit. We are a public accounting firm registered with the PCAOB and are required to be independent with respect to the Company in accordance with the U.S. federal securities laws and the applicable rules and regulations of the Securities and Exchange Commission and the PCAOB.
/s/ KPMG LLP New York, New York February 26, 2021ITEMItem 9.CHANGES IN AND DISAGREEMENTS WITH ACCOUNTANTS ON ACCOUNTING AND FINANCIAL DISCLOSUREITEMItem 9A.CONTROLS AND PROCEDURESreport.Disclosurereport because of the material weaknesses in internal control over financial reporting described below. Notwithstanding the material weaknesses, based on additional analyses and other procedures performed, management concluded that the financial statements included in this report fairly present in all material respects our financial position, results of operations, capital position, and cash flows for the periods presented in conformity with GAAP.reporting.reporting (as defined in Rules 13a-15(f) and 15d-15(f) of the Exchange Act). Our system of internal control is designed under the supervision of management, including our Chief Executive Officer and Chief Financial Officer, to provide reasonable assurance regarding the reliability of our financial reporting and the preparation of the Company’s financial statements for external reporting purposes in accordance with U.S. generally accepted accounting principles (“GAAP”).assets;assets of the Company; provide reasonable assurances that transactions are recorded as necessary to permit preparation of financial statements in accordance with GAAP, and that receipts and expenditures are made only in accordance with the authorization of management and the Boards of Directors of the Company and the Bank; and provide reasonable assurance regarding prevention or timely detection of unauthorized acquisition, use, or disposition of the Company’s assets that could have a material effect on our financial statements.ProjectionsAlso, projections of any evaluation of effectiveness to future periods are subject to the risk that the controls may become inadequate because of changes in conditions or that the degree of compliance with policies and procedures may deteriorate.2020,2023, management assessed the effectiveness of the Company’s internal control over financial reporting based upon the framework established in Internal Control—Integrated Framework (2013) issued by the Committee of Sponsoring Organizations of the Treadway Commission (“COSO”). A material weakness (as defined in Rule 12b-2 under the Exchange Act) is a deficiency or combination of deficiencies, in internal control over financial reporting such that there is a reasonable possibility that a material misstatement in our annual or interim financial statements will not be prevented or detected on a timely basis.upon itson this assessment, because of the following material weaknesses, management concluded that the Company’sCompany did not maintain effective internal control over financial reporting as of December 31, 2020 was2023.using this criteria.The effectivenessrisk assessment and monitoring activities.Company’sallowance for credit losses on loans and leases.2020 has been audited by KPMG LLP, an2023.thatKPMG LLP, which audited the Company’s2023 consolidated financial statements as of and for the year ended December 31, 2020, as stated in their report, included in Item 8 on the preceding page, which expressesthis Form 10-K, has expressed an unqualifiedadverse opinion on the effectiveness of the Company’s internal control over financial reporting. KPMG LLP’s report appears on page 144 of this Annual Report on Form 10-K.December 31, 2020.Directors with extensive experience as financial experts in our industry and backgrounds in risk management. Additionally, several members of the Board of Directors resigned.ThereITEMItem 9B.OTHER INFORMATIONNone.PART IIIITEM 10.Item 9C.DIRECTORS, EXECUTIVE OFFICERS, AND CORPORATE GOVERNANCEItem 10. Directors, Executive Officers of the Registrant and Corporate Governance on May 26, 2021for fiscal year 2024 (hereafter referred to as our “2021“2024 Proxy Statement”) under the captions “Information with Respect to Nominees, Continuing Directors, and Executive Officers,” “Section 16(a) Beneficial Ownership Reporting Compliance,” “Meetings and Committees of the Board of Directors,” and “Corporate Governance,” and is incorporated herein by this reference.615 Merrick102 Duffy Avenue, Westbury,Hicksville, NY 11590.11801.ITEMItem 11.EXECUTIVE COMPENSATION20212024 Proxy Statement under the captions “Compensation Committee Report,” “Compensation Committee Interlocks and Insider Participation,” “Compensation Discussion and Analysis,” “Executive Compensation and Related Information,” and “Director Compensation,” and is incorporated herein by this reference.ITEMItem 12.SECURITY OWNERSHIP OF CERTAIN BENEFICIAL OWNERS AND MANAGEMENT, AND RELATED STOCKHOLDER MATTERS2020:2023:Plan Category Number of
Securities to Be
Issued Upon
Exercise
Exercise Price (1)Number of securities to beissued upon exercise ofoutstanding options,warrants, and rightsWeighted-averageexercise price ofoutstanding options,warrants, and rightsNumber of securitiesremaining available
Remaining Available
for future issuanceunder equitycompensation plans(excluding securitiesreflectedin column (a))Future Issuance
Under Equity
Compensation PlansPlan category(a)(b)(c)$ 16,143,893 ——11,913,461— ———— $ 16,143,893 —11,913,46120212024 Proxy Statement under the captions “Security Ownership of Certain Beneficial Owners” and “Information with Respect to Nominees, Continuing Directors, and Executive Officers.”ITEMItem 13.CERTAIN RELATIONSHIPS AND RELATED TRANSACTIONS, AND DIRECTOR INDEPENDENCE20212024 Proxy Statement under the captions “Transactions with Certain Related Persons” and “Corporate Governance,” respectively, and is incorporated herein by this reference.ITEMItem 14.PRINCIPAL ACCOUNTING FEES AND SERVICES20212024 Proxy Statement under the caption “Audit and Non-Audit Fees,” and is incorporated herein by this reference.ITEMItem 15.EXHIBITS AND FINANCIAL STATEMENT SCHEDULESAsas Part of Thisthis Report•Reports of Independent Registered Public Accounting Firm;•Consolidated Statements of Condition at December 31, 2020 and 2019;Consolidated Statements of Income and Comprehensive Income for each of the years in the three-year period ended December 31, 2020;Consolidated Statements of Changes in Stockholders’ Equity for each of the years in the three-year period ended December 31, 2020;Consolidated Statements of Cash Flows for each of the years in the three-year period ended December 31, 2020; andNotes to the Consolidated Financial Statements.•Management’s Report on Internal Control over Financial Reporting; and•Changes in Internal Control over Financial Reporting.Exhibit No. 2.1 2.2 3.12.4 2.5 3.1 3.2 3.23.3 3.33.4 3.43.5 3.53.7 3.8 4.1 4.14.2 4.24.3 4.34.4 4.44.5 4.6 4.610.2(P) 10.2(P)Officers* (10)Officers (14)10.3(P) 10.3(P)Plan* (10)Plan (14)10.4(P) 10.4(P)Bank* (11)Bank (15)10.5(P) 10.5(P)Bank* (10)Bank (14)10.6(P) 10.6(P)Plan* (10)Plan (14)10.7 10.710.8 10.810.9 10.11 10.910.10ConsultingEmployment Agreement between New York Community Bancorp, Inc. and James J. Carpenter* (15)John T. Adams(19)10.12 10.1111.0Statement Re: Computation of Per Share Earnings (See Note 2 to the Consolidated Financial Statements)(22)10.15 21.0Subsidiaries information incorporated herein by reference to Part I, “Subsidiaries”(23)10.17 23.010.19 10.20 10.21 21 22 23 31.1 31.131.2 31.232 32.097 101The following materials fromXBRL Instance Document – the Company’s Annual Report on Form 10-K forinstance document does not appear in the year ended December 31, 2020, formatted inInteractive Data File because XBRL tags are embedded within the Inline XBRL (Extensible Business Reporting Language): (i) the Consolidated Statements of Condition, (ii) the Consolidated Statements of Income and Comprehensive Income, (iii) the Consolidated Statements of Changes in Stockholders’ Equity, (iv) the Consolidated Statements of Cash Flows, and (v) the Notes to the Consolidated Financial Statements.101.SCH Inline XBRL Taxonomy Extension Schema Document. 104Inline XBRL Taxonomy Extension Calculation Linkbase Document. 101.DEF Inline XBRL Taxonomy Extension Definition Linkbase Document. 101.LAB Inline XBRL Taxonomy Extension Label Linkbase Document. 101.PRE Inline XBRL Taxonomy Extension Presentation Linkbase Document. 104 Cover Page Interactive Date File (formatted in Inline XBRL and contained in Exhibit 101) *Management plan or compensation plan arrangement.(1)Incorporated by reference to Exhibits filed with the Company’s Form 10-Q for the quarterly period ended March 31, 2001 (File No. 0-22278)
*Pursuant to Item 601(b)(2) of Regulation S-K, certain schedules and similar attachments have been omitted. The registrant hereby agrees to furnish a copy of any omitted schedule or similar attachment to the SEC upon request.(2)Incorporated by reference to Exhibits filed with the Company’s Form 10-K for the year ended December 31, 2003 (File No. 1-31565)(3)Incorporated by reference to Exhibits to the Company’s Form 8-K filed with the Securities and Exchange Commission on April 27, 2016 (File No. 1-31565)
** Management plan or compensation plan arrangement.(4)Incorporated herein by reference to Exhibit 3.4 of the Registrant’s Registration Statement on Form 8-A (File No. 333-210919), as filed with the Securities and Exchange Commission on March 16, 2017(5)Incorporated by reference to Exhibits filed with the Company’s Form 10-K for the year ended December 31, 2016 (File No. 1-31565)(6)Incorporated by reference to Exhibits filed with the Company’s Form 10-Q for the quarterly period ended September 30, 2017 (File No. 1-31565)(7)Incorporated by reference to Exhibits filed with the Company’s Form 8-K filed with the Securities and Exchange Commission on March 17, 2017(8)Incorporated by reference to Exhibits filed with the Company’s Form 10-K for the year ended December 31, 2019 (File No. 1-31565)(9)Incorporated by reference to Exhibits filed with the Company’s Form 8-K filed with the Securities and Exchange Commission on March 9, 2006 (File No. 1-31565)(10)Incorporated by reference to Exhibits filed with the Company’s Registration Statement filed on Form S-1, Registration No. 33-66852(11)Incorporated by reference to Exhibits filed with the 1995 Proxy Statement for the Annual Meeting of Shareholders held on April 19, 1995(12)Incorporated by reference to Exhibits filed with the 2006 Proxy Statement for the Annual Meeting of Shareholders held on June 7, 2006 (File No. 1-31565)(13)Incorporated by reference to Exhibits filed with the 2012 Proxy Statement for the Annual Meeting of Shareholders held on June 7, 2012 (File No. 1-31565)(14)Incorporated by reference to Exhibits filed with the Company’s Form 8-K filed with the Securities and Exchange Commission on November 6, 2018 (File No. 1-31565)(15)Incorporated by reference to Exhibits filed with the Company’s Form 10-K/A for the year ended December 31, 2019 (File No. 1-31565)(16) Incorporated by reference to Exhibits filed with the Company’s Registration Statement filed on Form S-8 filed, on August 5, 2020. Registration No. 333-241023ITEMItem 16.FORMForm 10-K SUMMARYFebruary 26, 2021DATE: March 14, 2024 New York Community Bancorp, Inc. (Registrant) /s/ Alessandro P. DiNello /s/ Thomas R. CangemiAlessandro P. DiNello Thomas R. Cangemi(Principal Executive Officer) /s/ Thomas R. CangemiAlessandro P. DiNello2/26/212/26/21Thomas R. CangemiChiefand Executive Officer,and Director(Principal Executive Officer)/s/ Alessandro P. DiNello 3/14/24 /s/ Bryan L Marx 3/14/24 Alessandro P. DiNello Bryan L Marx Principal Accounting Officer /s/ Dominick CiampaMarshall Lux2/26/21/s/ Hanif W. Dahya2/26/21Dominick CiampaHanif W. DahyaDirectorDirector/s/ Leslie D. Dunn2/26/21/s/ Michael J. Levine2/26/21Leslie D. DunnMichael J. LevineDirectorChairman of the Board of Directors/s/ James J. O’Donovan2/26/21/s/ Lawrence Rosano, Jr.2/26/21James J. O’DonovanLawrence Rosano, Jr.DirectorDirector/s/ Ronald A. Rosenfeld2/26/212/26/21Ronald A. RosenfeldPresiding Director Director /s/ Peter Schoels 3/14/24 /s/ David L. Treadwell 3/14/24 DirectorDavid L. Treadwell DirectorDirector Director /s/ John M. TsimbinosJennifer R. Whip2/26/21/s/ Robert Wann2/26/21John M. TsimbinosRobert WannSenior Executive Vice President,Chief Operating Officer, and Director159